Attached files
| file | filename |
|---|---|
| EX-31.(D) - EX-31.(D) - WESTAR ENERGY INC /KS | d384736dex31d.htm |
| EX-31.(C) - EX-31.(C) - WESTAR ENERGY INC /KS | d384736dex31c.htm |
Table of Contents
UNITED STATES
SECURITIES AND EXCHANGE COMMISSION
Washington, D.C. 20549
FORM 10-K/A
| ☒ | ANNUAL REPORT PURSUANT TO SECTION 13 OR 15(d) OF THE SECURITIES EXCHANGE ACT OF 1934 |
For the fiscal year ended December 31, 2016
OR
| ☐ | TRANSITION REPORT PURSUANT TO SECTION 13 OR 15(d) OF THE SECURITIES EXCHANGE ACT OF 1934 |
For the transition period from to
Commission File Number 1-3523

WESTAR ENERGY, INC.
(Exact name of registrant as specified in its charter)
| Kansas | 48-0290150 | |
| (State or other jurisdiction of incorporation or organization) | (I.R.S. Employer Identification Number) | |
| 818 South Kansas Avenue, Topeka, Kansas 66612 | (785) 575-6300 | |
| (Address, including Zip code and telephone number, including area code, of registrant’s principal executive offices) | ||
Securities registered pursuant to section 12(b) of the Act:
| Common Stock, par value $5.00 per share | New York Stock Exchange | |
| (Title of each class) | (Name of each exchange on which registered) |
Securities registered pursuant to section 12(g) of the Act: None
Indicate by check mark whether the registrant is a well-known seasoned issuer (as defined in Rule 405 of the Act). Yes ☒ No ☐
Indicate by check mark whether the registrant is not required to file reports pursuant to Section 13 or Section 15(d) of the Act. Yes ☐ No ☒
Indicate by check mark whether the registrant (1) has filed all reports required to be filed by Section 13 or 15(d) of the Securities Exchange Act of 1934 during the preceding 12 months (or for such shorter period that the registrant was required to file such reports), and (2) has been subject to such filing requirements for the past 90 days. Yes ☒ No ☐
Indicate by check mark whether the registrant has submitted electronically and posted on its corporate Web site, if any, every Interactive Data File required to be submitted and posted pursuant to Rule 405 of Regulation S-T during the preceding 12 months (or for such shorter period that the registrant was required to submit and post such files). Yes ☒ No ☐
Indicate by check mark if disclosure of delinquent filers pursuant to Item 405 of Regulation S-K is not contained herein, and will not be contained, to the best of registrant’s knowledge, in definitive proxy or information statements incorporated by reference in Part III of this Form 10-K or any amendment to this Form 10-K. ☒
Indicate by check mark whether the registrant is a large accelerated filer, an accelerated filer, a non-accelerated filer, or a smaller reporting company (as defined in Rule 12b-2 of the Act). Check one:
| Large accelerated filer | ☒ | Accelerated filer | ☐ | |||
| Non-accelerated filer | ☐ | Smaller reporting company | ☐ | |||
Indicate by check mark whether the registrant is a shell company (as defined in Rule 12b-2 of the Act). Yes ☐ No ☒
Emerging growth company ☐
If an emerging growth company, indicate by check mark if the registrant has elected not to use the extended transition period for complying with any new or revised financial accounting standards provided pursuant to Section 13(a) of the Exchange Act. ☐
The aggregate market value of the voting common equity held by non-affiliates of the registrant was approximately $7,947,449,144 at June 30, 2016.
Indicate the number of shares outstanding of each of the registrant’s classes of common stock, as of the latest practicable date.
| Common Stock, par value $5.00 per share | 142,093,321 shares | |
| (Class) | (Outstanding at April 28, 2017) |
DOCUMENTS INCORPORATED BY REFERENCE:
None
Table of Contents
Westar Energy, Inc. (the “Company,” “we,” “our” or “us”) is filing this Amendment No. 1 on Form 10-K/A (this “Amendment No. 1”) to amend our Annual Report on Form 10-K for the year ended December 31, 2016, originally filed with the Securities and Exchange Commission (the “SEC”) on February 22, 2017 (the “Original Filing”), to include the information required by Items 10 through 14 of Part III of Form 10-K. This information was previously omitted from the Original Filing in reliance on General Instruction G(3) to Form 10-K. This Amendment No. 1 consists solely of the preceding cover page, this explanatory note, the information required by Part III, Items 10, 11, 12, 13, and 14 of Form 10-K, a signature page and certifications required to be filed as exhibits.
The reference on the cover of the Original Filing to the incorporation by reference of portions of our definitive proxy statement into Part III of the Original Filing is hereby deleted. In addition, in accordance with Rule 12b-15 under the Securities Exchange Act of 1934, as amended (the “Exchange Act”), Part III, including Items 10 through 14 of the Original Filing, is hereby amended and restated in its entirety.
This Amendment No. 1 does not reflect events occurring after the filing of the Original Filing, and, except as described above, does not modify or update any other disclosures.
The section of this Amendment No. 1 entitled “Report of the Compensation Committee” is not deemed to be “soliciting material” or to be “filed” with the SEC under or pursuant to Section 18 of the Exchange Act or subject to Regulation 14A thereunder, and shall not be incorporated by reference or deemed to be incorporated by reference into any filing by the Company under either the Securities Act of 1933, as amended, or the Exchange Act, unless otherwise specifically provided for in such filing.
i
Table of Contents
ii
Table of Contents
| ITEM 10. | DIRECTORS, EXECUTIVE OFFICERS AND CORPORATE GOVERNANCE |
The names, ages and backgrounds, including the business experience, principal occupations and employment, of all directors of the Company are set forth below. Directors are elected to serve for three-year staggered terms according to the class to which they were elected or until they resign or are removed, or until their successors are elected.
Class III – Term Expiring in 2017
Mollie H. Carter, age 55, has served as our director since June of 2003. Ms. Carter has thirty years of business experience, including twenty-one years as a chief executive of a Kansas based financial institution. Ms. Carter has been president and chief executive officer of Sunflower Bank, N.A. since 2005, and of its holding company, Sunflower Financial, Inc. (formerly Sunflower Banks, Inc.), since 1996. Ms. Carter is also a director of Sunflower Financial, Inc. and chairman of the board of Sunflower Bank, N.A. These entities are family owned financial institutions with headquarters in Salina, Kansas. Ms. Carter is also president of Star A, Inc., and has held officer positions with Star A., Inc. since 1997. Star A, Inc. is a family owned company with Kansas agricultural and other investment interests. Prior to holding these positions, Ms. Carter served ten years as a senior investment officer for John Hancock Mutual Life Insurance Company. In addition, Ms. Carter has served as a director of Archer-Daniels-Midland Company since 1996 and is a member of the compensation and nominating and corporate governance committees, and she previously served as a director of Premium Standard Farms, Inc., a large processor of pork products. Ms. Carter is also a member of the Kansas Governor’s Council of Economic Advisors, a director of the Kansas Health Foundation and she previously served as a director of Foley Equipment Company, a private company. Ms. Carter is also a member of the board of directors and serves on the membership/sponsorship committee of the Heartland Chapter of the National Association of Corporate Directors. Ms. Carter’s qualifications to serve as our director include her substantial leadership experience as a chief executive officer, her financial expertise and her significant experience serving as a director of a large public company.
Jerry B. Farley, age 70, has served as our director since October of 2004. Mr. Farley has forty-five years of experience in the administration of the academic, business and fiscal operations of universities. Since 1997, Mr. Farley has been president of Washburn University located in Topeka, Kansas. Prior to that position, Mr. Farley worked in executive positions for the University of Oklahoma and Oklahoma State University. Mr. Farley has also been a Certified Public Accountant since 1972 and, although he has not practiced public accounting, his business responsibilities have included all aspects of financial management and reporting at three large public universities. Mr. Farley is a director and member of the audit and trust committees of CoreFirst Bank and Trust in Topeka, Kansas, and a director and member of the audit and governance committees of Guggenheim Investors, formerly The Security Group of Mutual Funds, also located in Topeka, Kansas. Mr. Farley also serves as a director for various non-profit and charitable organizations. Mr. Farley’s qualifications to serve as our director include his substantial leadership experience as the president of a public university, his extensive knowledge of the administration, financial and operational management of large organizations and his significant experience serving as a director of institutions in the financial industry.
1
Table of Contents
Mark A. Ruelle, age 55, has served as our director and president since May of 2011 and as our chief executive officer since August of 2011. Mr. Ruelle brings thirty years of business leadership experience to the board of directors. From 2003 to 2011, Mr. Ruelle was our executive vice president and chief financial officer. In that role, he had responsibility for large construction projects, information technology and human resources in addition to accounting, finance and investor relations. Between 1997 and 2002, Mr. Ruelle served in various executive positions at Sierra Pacific Resources, Inc., the owner of the largest electric utilities in Nevada. While there, Mr. Ruelle served four years as senior vice president and chief financial officer and one year as president of its Nevada Power Company unit. From 1986 to 1997, Mr. Ruelle worked for us in various executive positions. Mr. Ruelle was also a director and member of the audit, compensation and nominating and corporate governance committees of US BioEnergy Corporation from 2006 to 2008. Mr. Ruelle currently serves as a director, chairman of the nominating and governance committee and member of the audit committee of Houston Wire & Cable Company, a distributor of electrical wire and cable products and services based in Houston, Texas. Mr. Ruelle also serves as vice chairman of the Electricity Information Sharing and Analysis Center, an information exchange for the electricity sector that was formed in collaboration with the Department of Energy and the Electricity Sector Coordinating Council, as a director the Edison Electric Institute, an association of shareholder owned electric companies, as a board member of GO Topeka Economic Partnership, a local civic organization, as a director for Stormont Vail Healthcare, an integrated health care system located in Topeka, Kansas, and was formerly an advisory board member for a privately-held sports apparel concern located in Kansas. Mr. Ruelle’s qualifications to serve as our director include his leadership experience, his financial expertise and his extensive utility industry experience.
Class I – Term Expiring in 2018
Charles Q. Chandler IV, age 63, has served as our director since December of 1999 and chairman of our board of directors since December of 2002. Mr. Chandler has forty years of leadership experience with large, regional financial institutions. Mr. Chandler has been chief executive officer of INTRUST Bank, N.A. since 1996 (as well as president from 1996 to 2013) and president and chief executive officer of INTRUST Financial Corporation since 1990 and 2009, respectively. Mr. Chandler is also chairman of the board of both INTRUST Bank, N.A. and INTRUST Financial Corporation. Both companies are large regional financial institutions headquartered in Wichita, Kansas. Prior to this time period, Mr. Chandler spent thirteen years in other officer positions within those institutions. Mr. Chandler is also a director of Fidelity State Bank and Trust Company in Topeka, Kansas, First Bank of Newton in Newton, Kansas, HCA Wesley Medical Center in Wichita, Kansas, as well as several non-profit organizations. Mr. Chandler also served previously as a director of the First National Bank of Pratt, Kansas and New Horizons Foundation. Mr. Chandler’s qualifications to serve as our chairman of the board include his extensive leadership experience as a chief executive officer, his financial expertise and his knowledge of the business community in Wichita, Kansas, the largest city we serve.
R. A. Edwards III, age 71, has served as our director since October of 2001. Mr. Edwards has forty-two years of leadership experience with locally-based financial institutions. Mr. Edwards is chairman of the board of First National Bank of Hutchinson and was its president and chief executive officer from 1981 to 2010. Mr. Edwards is also a director and president of First Kansas Bancshares of Hutchinson, the parent corporation of First National Bank of Hutchinson. Mr. Edwards served as vice president of First Kansas Bancshares from 1986 to 2011. Both companies are financial institutions located in Hutchinson, Kansas. Mr. Edwards spent six years in executive positions and thirty-eight years as a director, including nine years as chairman of the board, with Douglas County Bank, a financial institution located in Lawrence, Kansas. Mr. Edwards also serves as chairman of the board and a member of the governance committee of Data Center, Inc., a bank technology company located in Hutchinson, Kansas, a director and member of the audit committee of Kansas Natural Gas, a private company located in Hays, Kansas, a director of Mitchelhill Seed Company, a private company located in Missouri, and a director or trustee of several non-profit organizations and foundations. Mr. Edwards’ qualifications to serve as our director include his substantial leadership experience as a chief executive officer and his financial expertise.
2
Table of Contents
Sandra A.J. Lawrence, age 59, has served as our director since October of 2004. Ms. Lawrence brings thirty-eight years of varied business experience to her position as our director. Since 2016, Ms. Lawrence has been executive vice president and chief administrative officer of Children’s Mercy Hospital located in Kansas City, Missouri and, prior to that, she was executive vice president and chief financial officer from 2005 to 2016. From December of 2004 until March of 2005, Ms. Lawrence was senior vice president and treasurer, and from March of 2005 until December of 2005, she was senior vice president and chief financial officer, of MRI Global (formerly Midwest Research Institute), an independent, non-profit, contract research organization located in Kansas City, Missouri. Prior to that Ms. Lawrence spent twenty-six years in professional or management positions in the architecture, real estate, financial services, packaging, and medical research industries. Ms. Lawrence is a director of Turn the Page KC, a past director (and past Chairman of the Board) of the Greater Kansas City Community Foundation, a former director (and former Chairman of the Board) of the Kansas BioScience Authority, an organization dedicated to the advancement of Kansas’ leadership in bioscience, a director and chair of the audit committee and member of the investment committee of the Hall Family Foundation, a private charitable organization, and a director, chair of the audit committee and member of the investment committee of the Nelson-Atkins Museum, located in Kansas City, Missouri. Ms. Lawrence was an appointee to the Mayor’s Google Task Force in Kansas City, Missouri and she also served on The Kansas City Market Board of US Bank and as a director of Children’s Mercy Hospital, J.E. Dunn Construction Group, Inc., and numerous other private, non-profit and civic organizations. Ms. Lawrence is also a member of the board of directors and serves on the governance/nominating committee of the Heartland Chapter of the National Association of Corporate Directors. Ms. Lawrence’s qualifications to serve as our director include her substantial financial expertise and her extensive service as a director with public and private organizations.
Class II – Term Expiring in 2019
Richard L. Hawley, age 68, has served as our director since October of 2011. Mr. Hawley has over forty-one years of business experience, including twelve years as a chief financial officer within the electric and gas utility industries and fourteen years as a partner with an international accounting firm. From December of 2003 until December of 2011, Mr. Hawley was executive vice president and chief financial officer of Nicor, Inc. and its regulated natural gas distribution utility subsidiary, Northern Illinois Gas Company, each located in Naperville, Illinois. From 1998 until 2002, Mr. Hawley was vice president and chief financial officer of Puget Energy, Inc. and its regulated electric and natural gas distribution utility subsidiary, Puget Sound Energy, Inc., each located in Bellevue, Washington. Prior to that, Mr. Hawley was an audit partner with Coopers & Lybrand (now PricewaterhouseCoopers), an international accounting firm, from 1984 to 1998 and he also served in various other positions with that firm from 1973 to 1984. His audit experience included a significant emphasis on utility industry clients. From 2003 to 2013, Mr. Hawley was a director, chairman of the audit committee and member of the nominating and corporate governance committee of Fisher Communications, Inc., a media company located in Seattle, Washington. Mr. Hawley’s qualifications to serve as our director include his work experience as a chief financial officer and audit partner, his years of experience within the electric and gas utility industries and his experience as a director of a public company.
B. Anthony Isaac, age 64, has served as our director since December of 2003. Mr. Isaac has forty years of business experience, thirty-five of which were spent in leadership positions within the hotel industry. From 2011 until April of 2015, Mr. Isaac was Senior Vice President and Head of Select Service Strategy and Development of Hyatt Hotels Corporation, a global hotel management, franchising, ownership and development company based in Chicago, Illinois with properties worldwide. From 2000 until 2011, Mr. Isaac was president of LodgeWorks, L.P., a hotel management and development company based in Wichita, Kansas, which was acquired by Hyatt Hotels Corporation in 2011. Prior to 2000, Mr. Isaac held management positions with Wyndham International, Summerfield Hotel Corporation, Residence Inn Company and the Marriott Corporation. Mr. Isaac is currently chairman of the board of Via Christi Health System in Wichita, Kansas. Mr. Isaac was formerly chairman of the board and chairman of the compensation, finance and strategic planning committees of The Via Christi Wichita Regional Health Network, a subsidiary of Via Christi Health System, and a trustee of Wichita Collegiate School, located in Wichita, Kansas. Mr. Isaac’s qualifications to serve as our director include his extensive leadership experience both as the chief executive officer of a privately-held company and as an executive with other large companies in the hotel industry, and his substantial experience with strategic planning and financial matters.
3
Table of Contents
S. Carl Soderstrom, Jr., age 63, has served as our director since July of 2010. Mr. Soderstrom previously served as senior vice president and chief financial officer for ArvinMeritor, an automotive and commercial vehicle components manufacturer based in Troy, Michigan. Mr. Soderstrom brings over twenty-nine years of experience in operations, finance, engineering and product development in the automotive and manufacturing industries to our board of directors. Mr. Soderstrom’s experience includes executive and management positions at Rockwell International, General Electric Company and Emerson Electric. Mr. Soderstrom is a director, chairman of the audit committee and a member of the nominating and corporate governance committee of FreightCar America, Inc., a railcar manufacturing company located in Chicago, Illinois. Mr. Soderstrom is also a director, chairman of the corporate governance committee and member of the audit review committee of Lydall, Inc., a technology and manufacturing company headquartered in Manchester, Connecticut. Mr. Soderstrom’s qualifications to serve as our director include his substantial financial expertise, his operations and engineering knowledge from his experience at other large public companies and his substantial experience serving as a director of other public companies.
Section 16(a) Beneficial Ownership Reporting Compliance
The SEC’s rules require our directors and executive officers to file reports of their holdings and transactions in our common stock. Based solely on our review of the reports filed under Section 16(a) of the Exchange Act and written representations that no other reports were required, we believe that, during the fiscal year ended December 31, 2016, all required filings applicable to our executive officers, directors and owners of more than ten percent of our common stock were made and that such persons were in compliance with the applicable requirements.
We have adopted a code of ethics that applies to all of our directors, officers and employees, including our chief executive officer, chief financial officer and controller. Our Code of Business Conduct and Ethics is available, without charge, from our Corporate Secretary and made available on our Internet website at www.westarenergy.com. We intend to post on our Internet website any amendments to, or waivers from, our Code of Business Conduct and Ethics that apply to our chief executive officer, chief financial officer or controller within five business days of the date of the amendment or waiver. The information contained on our Internet website is not part of, or incorporated by reference into, this document.
The chairman of the Audit Committee is Mr. Hawley. The other members of the committee are Mr. Edwards, Mr. Farley and Mr. Soderstrom. The board of directors has determined that each of the members of the committee meets the experience and independence requirements of the rules of the New York Stock Exchange (“NYSE”). The board of directors has determined that one member of the committee possesses the qualifications of an audit committee financial expert as determined under Regulation S-K Item 407(d) of the Exchange Act and has designated Mr. Hawley as that expert.
4
Table of Contents
| ITEM 11. | EXECUTIVE COMPENSATION |
Compensation Discussion and Analysis
Introduction
This section provides a discussion and analysis of our philosophy and objectives for compensation of our named executive officers, the process we utilize when annually reviewing executive compensation and the elements of our executive compensation program. This discussion is generally applicable to all of our officers. Compensation data for each of our named executive officers appear in the Summary Compensation Table and the other tables appearing later in this Item 11.
Executive Summary
Philosophy. Our executive compensation philosophy is to provide a total compensation opportunity for our officers, as a group, approximating the market median for officers of peer utilities, to reward company and individual officer performance and to strongly align the interests of our officers with those of our shareholders.
Our executive compensation program consists of the following primary elements:
| • | base salary; |
| • | long-term incentive compensation in the form of time-based and performance-based restricted share units with three-year vesting and performance measurement periods; and |
| • | retirement and other benefits made available through our company-wide benefit plans and supplemented by retirement benefit and 401(k) restoration plans that result in officer benefits being calculated on the same basis as benefits for other covered employees. |
Though customary in our industry and among our peers, we do not pay our officers annual cash incentives. Rather, our compensation program focuses our officers on long-term performance.
Features. The Compensation Committee (the “Committee”), which administers our executive compensation program, believes the following features of our executive compensation program are especially important in supporting the program’s philosophy and objectives:
| • | market median compensation is based primarily on data obtained by Willis Towers Watson from its annual survey of energy services companies, with the data adjusted based on revenues; |
| • | the reasonableness of the survey data is corroborated by comparing it to compensation data for a peer group that is also used to determine relative total shareholder return; |
| • | individual officer compensation is set based on individual officer considerations such as performance and experience; |
| • | the program provides for a significantly higher proportion of long-term incentive compensation than market median due to the absence of an annual short-term incentive; |
| • | 50% of long-term incentive compensation is comprised of performance-based restricted share units with performance and vesting tied to our relative total shareholder return measured over a three-year period; |
| • | performance-based restricted share units pay out in a range from zero to 200% of the target level, depending upon whether our total shareholder return is above or below the targeted total shareholder return of a peer group measured over the applicable performance period; |
5
Table of Contents
| • | each officer is required to own shares of our common stock valued at one to five times his or her base salary depending on his or her position; |
| • | officers do not receive perquisites; |
| • | officers do not have employment agreements; |
| • | the change in control agreements with our officers have only “double-trigger” provisions (that is, benefits would be paid under the change in control agreements only if the officer’s employment terminates for qualifying reasons following the change in control) and payments under these agreements are capped to avoid excise taxes; and |
| • | the Committee relies on an independent compensation consultant engaged by and reporting directly to the Committee. |
Total Shareholder Return Performance. For compensation purposes, we calculated total shareholder return of approximately 39% in 2016 and approximately 92% for the three-year performance period ended in 2016. On a relative basis, this total shareholder return for the three-year performance period placed us at the 100th percentile of the total shareholder return of our peer group. As a result, performance-based restricted share units with performance tied to relative total shareholder return for this period paid out at 200% of the target level, as shown in the table below. Please see “Executive Officer Compensation Program Structure—Long-Term Incentive Compensation” for information on these calculations. We believe total shareholder return was driven in part by expectations regarding the Agreement and Plan of Merger we entered into with Great Plains Energy Incorporated in May 2016, and the price at which we agreed to be acquired. A more detailed description of our financial results is included in Part II of the Original Filing, and information regarding the merger can be found in Note 4 in our Notes to Consolidated Financial Statements, Pending Merger, in the Original Filing.
| Total Shareholder Return Relative to Peer Group |
Payout of Performance- Based Restricted Share Units | |||
| 2014-2016 Target |
50th percentile | 100% of target | ||
| 2014-2016 Actual |
100th percentile | 200% of target |
Compensation Actions Taken During 2016. In 2016, the Committee, as part of its annual executive compensation review processes:
| • | approved increases in base salaries for our named executive officers and other officers to more closely align compensation for our officer team with the market median; and |
| • | approved annual long-term incentive compensation grants for our named executive officers and other officers; |
| • | 50% time-based restricted share units with three-year vesting; and |
| • | 50% performance-based restricted share units with three-year vesting and performance measurement periods, and with performance measured by our total shareholder return relative to a peer group. |
Consideration of Results of the 2016 Shareholder Advisory Vote. In May 2016, we provided our shareholders with an advisory vote on the 2015 named executive officer compensation as disclosed in our 2016 annual meeting proxy statement (a “say-on-pay” vote). Approximately 96% of the votes cast, excluding abstentions and broker non-votes, were in favor of the 2015 compensation of our named executive officers. The Committee regarded this result as evidence of strong shareholder support of our executive compensation philosophy and considered the advisory vote as a factor in its decision to continue our current executive compensation program.
6
Table of Contents
Based on the preference indicated by our shareholders in May 2011, our Board of Directors adopted a policy to hold the “say-on-pay” vote each year at the annual meeting of the shareholders.
Executive Compensation Objectives
In furtherance of our philosophy described above, the principal objectives of our executive compensation program are to:
| • | provide a compensation package that is competitive among our peers and will attract and retain a talented executive team; |
| • | recognize and reward strong performers; |
| • | create long-term shareholder value; |
| • | align our officers’ interests with those of our shareholders; |
| • | encourage a stable management team; and |
| • | motivate executives with appropriate incentives. |
Overall, our intent is to provide a total compensation opportunity for our officers as a group that approximates the market median compensation opportunity at peer utilities, while also providing the Committee the flexibility to recognize relative individual performance. Because of its emphasis on stock-based compensation and the creation of long-term shareholder value, the Committee believes this compensation program is especially suited to our mission and business as a regulated electric utility where we believe a long-term perspective should guide most of our decisions and plans.
Executive Compensation Process
Compensation Program Review. To ensure that our compensation policies and practices are consistent with our compensation philosophies and objectives, each year the Committee assesses and analyzes our executive compensation program, including each named executive officer’s compensation. As part of this process, the Committee obtains market information about compensation at other utilities and energy companies and obtains independent analysis and recommendations on competitive market practices from Meridian Compensation Partners, LLC (“Meridian”), an independent compensation consultant engaged by and reporting to the Committee.
When making officer compensation decisions, we determine an aggregate pool of base salaries and target total compensation for the named executive officers and all of our other officers, but excluding the chief executive officer, after referencing the median level of target annual total compensation in the market data for the comparable positions held by our officers. (See below under “Benchmarking” for a more detailed discussion regarding the market data used and related methodology.) The aggregate pool of restricted share units comprising the long-term incentive is calculated based on the aggregate difference between target total compensation and base salary.
For the chief executive officer’s compensation, the Committee develops a range of compensation for the full board of directors to consider in light of the full board’s evaluation of the chief executive officer’s performance. Differences among officers in base salary and target annual total compensation reflect differences in median compensation levels for similar positions at comparably sized utilities, each officer’s experience, the scope of his or her responsibilities and the Committee’s or the chief executive officer’s subjective evaluation of an officer’s relative contribution, performance and consideration in our succession plans. Base salary and target annual total compensation may also take into account situations where we have assigned an officer to take on a cross-developmental assignment. The aggregate compensation pool is allocated among the officers other than our chief executive officer based primarily on the recommendations of our chief executive officer, but subject to review and approval by the Committee.
7
Table of Contents
We have a history of developing and promoting executives from within the company when possible. As a result, compensation levels for our officers often begin significantly below the market medians for their respective positions. Depending upon their performance, these officers may receive proportionately larger increases to move their salaries and target total compensation close to the market medians.
Benchmarking. To provide competitive total compensation, the Committee considers national market information about base salaries and other compensation from two sources described below. The Committee believes it is appropriate to look at national market data because we compete for executive talent on a national basis.
In 2016, the Committee relied principally on market information provided by Willis Towers Watson derived from Willis Towers Watson’s 2015 Energy Services Executive Compensation Database. We refer to this database as the “Willis Towers Watson Database.” The database is an annual compilation of compensation for executive officer positions at a broad group of energy and utility companies nationwide prepared by Willis Towers Watson. The companies included in the Willis Towers Watson Database are listed at the end of this section. After discussing each of our officer positions with management and Meridian, including the duties and responsibilities associated with each position, Willis Towers Watson obtained data from its database for positions that in its judgment most closely corresponded to the positions held by our officers. Willis Towers Watson then aggregated the data for the identified positions and adjusted it using recognized statistical methods to account for the different total revenues of the companies in its database as compared to our revenues. Meridian reviewed this market data to ensure that Willis Towers Watson’s methodology was consistent with our executive compensation philosophy. The reports provided to the Committee showed market information for base salary and target annual total compensation for each benchmark position at the market median.
As an additional point of reference, the Committee also reviewed data derived by Meridian from the 2015 proxy statements for companies in the same peer group used to measure total shareholder return for performance-based restricted share units. The proxy data was used to compare the compensation levels of our named executive officers against the compensation of corresponding named executive officers of companies in the peer group. This comparison allowed the Committee to evaluate the reasonableness of the survey data and of our compensation program. The Committee may make compensation adjustments based on this comparison.
8
Table of Contents
The companies included in the peer group for purposes of 2016 compensation decisions are listed below.
| Company |
2016 Revenues ($ billions) |
Company |
2016 Revenues ($ billions) | |||||||||
| ALLETE, Inc. | 1.3 | NiSource, Inc. | 4.5 | |||||||||
| Alliant Energy Corporation | 3.3 | Northwestern Corporation | 1.3 | |||||||||
| Ameren Corporation | 6.1 | OGE Energy Corporation | 2.3 | |||||||||
| Avista Corporation | 1.4 | Pinnacle West Capital Corporation | 3.5 | |||||||||
| Black Hills Corporation | 1.6 | PNM Resources, Inc. | 1.4 | |||||||||
| CMS Energy Corporation | 6.4 | Portland General Electric Company | 1.9 | |||||||||
| El Paso Electric Company | 0.9 | SCANA Corporation | 4.2 | |||||||||
| Great Plains Energy, Inc. | 2.7 | Vectren Corporation | 2.4 | |||||||||
| IDACORP, Inc. | 1.3 | |||||||||||
| Peer group median | 2.3 | |||||||||||
| Westar Energy, Inc. | 2.6 | |||||||||||
The Committee periodically reviews the peer group and may remove or add a company for various reasons, such as merger and acquisition activity. In February 2016, UIL Holdings Corporation was removed from the peer group due to a pending strategic transaction and El Paso Electric Company and NiSource, Inc. were added to the peer group. These changes were used for 2016 performance-based restricted share units and, subject to further changes, would be used in future compensation decisions.
9
Table of Contents
Executive Officer Compensation Program Structure
Components. Our 2016 officer compensation program contained the following principal elements.
| Program Element |
|
Element Objectives |
|
Element Features | ||||
| Base Salary | •
• |
Provide competitive level of fixed cash compensation Recognize strong performers |
•
• |
Evaluated in relation to market median reflecting factors unique to each officer’s role and responsibilities Adjustments based on subjective evaluation of performance and responsibilities, as well as internal equity No short-term incentive | ||||
| No Annual Cash Incentive | • |
Provide incentive through long-term incentive compensation | • |
Absence of an annual cash incentive supports focus on long-term performance | ||||
| Restricted Share Units | • •
• • |
Create long-term shareholder value Align compensation with shareholder interests Promote management team stability Provide appropriate incentives |
•
• |
50-50 allocation of time-based and performance-based restricted share units except for mid-year officer promotions Performance-based units pay out between zero and 200% of target based on relative total shareholder return compared to peer group | ||||
| Pension and Other Benefits | • |
Provide competitive total compensation package | • • • • |
401(k) Plan matching Group life insurance Pension plan Retirement benefit and 401(k) restoration plan | ||||
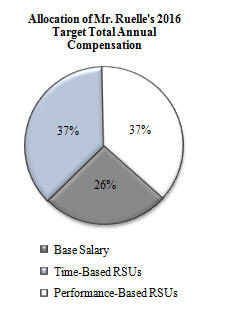
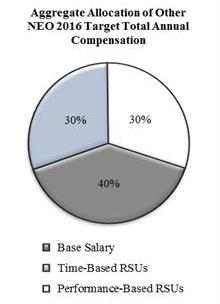
Consistent with our compensation philosophy and objectives, a significant portion of our officers’ annual total compensation is at risk or in the form of long-term incentives that align the interests of our officers with those of our shareholders. The following charts indicate the allocation of 2016 target annual total compensation approved in February 2016 between base salary and restricted share units for Mr. Ruelle and our other named executive officers.
10
Table of Contents
|
|
Base Salary. Base salary provides our officers competitive fixed cash compensation. While the aggregate amount of the base salaries for all of the officers (named executive officers and all other officers) is targeted at approximately the market median, base salaries for individual officers are set above or below the market median for the reasons discussed above.
The Committee reviews base salaries annually. In February 2016, the Committee considered an adjustment to the compensation of Mr. Ruelle. Mr. Ruelle made no recommendation regarding his own compensation, nor was he present in any discussions or presentations regarding his compensation. The Willis Towers Watson market information provided to the Committee showed that Mr. Ruelle’s 2015 base salary was below the market median base salary. The Committee decided to increase Mr. Ruelle’s base salary from $820,000 to $850,000. The market information that Willis Towers Watson provided to the Committee indicated that, after this adjustment, Mr. Ruelle’s new base salary would approximate the market median base salary.
In February 2016, the Committee also approved increases in base salaries for our other named executive officers. The approved increases, which were based in part on the Willis Towers Watson market information and the recommendation of Mr. Ruelle, raised the aggregate amount of the base salaries for these officers to a level that was slightly below the market median and reflected the Committee’s objective of providing a competitive executive compensation program in light of prevailing business and economic conditions.
Taking into account these adjustments, the following table shows prior base salaries and the new base salaries for the named executive officers as approved by the Committee in February 2016.
| Name |
Prior Base Salary ($) | March 2016 Base Salary ($) | ||||||||
| Mark A. Ruelle |
820,000 | 850,000 | ||||||||
| Greg A. Greenwood |
410,000 | 430,000 | ||||||||
| Anthony D. Somma |
395,000 | 425,000 | ||||||||
| Larry D. Irick |
345,000 | 365,000 | ||||||||
| Bruce A. Akin |
290,000 | 310,000 | ||||||||
11
Table of Contents
Annual Cash Incentive. Though unusual for the utility industry, our executive compensation program does not include an annual cash incentive component in order to focus our executives on long-term performance. The Committee believes the overall compensation program is appropriately performance-based without an annual cash incentive because of the potential for appreciation in the price of our common stock received when restricted share units vest, and the potential for above or below target payouts of performance-based restricted share units. The Committee has considered this issue from time to time and may revisit this issue again in the future. Because our executive compensation program does not include an annual cash incentive, total cash compensation for our officers is typically significantly less than the relevant market median of total cash compensation.
Long-Term Incentive Compensation.
Overview. The Committee approves long-term incentive compensation for our officers and other key employees who are in positions to make positive contributions to our long-term performance and to create shareholder value through the development and execution of our business strategies. For 2016, 50% of the named executive officers’ long-term incentive is in the form of time-based restricted share units and the other 50% is in the form of performance-based restricted share units. Because we do not provide an annual cash incentive, restricted share units make up a larger percentage of the target annual total compensation of our officers than does the long-term incentive compensation component of the target annual total compensation for officers of our peer group.
The Committee believes restricted share units accomplish our executive compensation program objectives because they:
| • | align the interests of management directly with those of our shareholders; |
| • | focus management’s efforts on performance that will create long-term shareholder value and sustain increases in the price of our common stock and our ability to pay dividends; |
| • | provide a competitive long-term incentive opportunity; and |
| • | provide a retention incentive for key employees because the restricted share units vest over time and will be forfeited in whole or in part if an officer’s employment terminates prior to vesting. |
Our time-based restricted share units are designed to provide total compensation below the target market median if our common stock price significantly decreases after approval, but above the target market median if our common stock price significantly increases. The Committee believes this design also provides an incentive to our officers to continue their employment with us for the duration of the vesting period, thus providing us with continuity and stability of management.
Performance-based restricted share units compensate an officer based on relative total shareholder return, which is a measure of our stock price appreciation and dividend payments relative to those of a peer group. The Committee settled on relative total shareholder return as an appropriate performance measure because this measure focuses our officers on creating long-term shareholder value when developing and implementing strategic plans. The Committee believes that the risk and reward inherent in performance-based restricted share units provides an appropriate incentive for officers to manage the Company in the long-term interests of shareholders without encouraging inappropriate risk taking. See “Other Matters – Risk Assessment” below.
12
Table of Contents
Process for Determining Long-Term Incentives. Annually, the Committee reviews base salaries and target annual total compensation of our officers. Target annual total compensation is determined in a similar way to base salaries, with reference to the market median. The dollar amount of long-term incentive compensation is target annual total compensation less base salary. To determine the number of restricted share units, we use the average closing price of our common stock for the twenty trading days preceding the first day of the performance period, which customarily has been the first day of the year. Decisions related to the approval of long-term incentives are made independently of announcements of material information or stock price as of any particular date.
Restricted Share Unit Terms. Each restricted share unit represents the right upon vesting to receive one share of our common stock. Prior to vesting, each time-based restricted share unit gives the holder the right to receive a cash payment equal to each dividend paid on one share of our common stock and which is paid at the same time as our common stock dividend. This right to receive a cash payment is referred to as a dividend equivalent. Dividend equivalents change when we change the dividend paid on our common stock. In the case of performance-based restricted share units, dividend equivalents are paid following vesting, but only to the extent vesting actually occurs.
Time-based restricted share units vest in three years, subject to the officer’s continued employment through the vesting date. Performance-based restricted share units vest in three years, subject to satisfaction of performance measures tied to our total shareholder return relative to the total shareholder return for a peer group over the three-year performance period. Total shareholder return is equal to the difference between the value of a share of common stock at the beginning and end of the three-year performance period using the average closing price of our common stock for the twenty trading days preceding such days, plus dividends paid as if reinvested in stock. For this measure, our total shareholder return is compared to total shareholder return of a peer group for the same three-year period. See “Benchmarking” above for a list of the companies included in our peer group for purposes of 2016 compensation.
The relative total shareholder return targets, and the corresponding payouts expressed as a percentage of the target number of performance-based restricted share units, are as follows:
| Relative TSR Performance |
Percentage Payout | |||
| 90th percentile or above |
200% | |||
| 50th percentile to 90th percentile |
100% to 200% | |||
| 25th percentile to 50th percentile |
25% to 100% | |||
| Below 25th percentile |
0% | |||
Interpolation is used to determine payouts if relative total shareholder return falls between the percentiles shown above.
Vesting of all restricted share units is subject to the officer’s employment with us continuing uninterrupted through the vesting date, except that a prorated portion of the restricted share units will vest on the scheduled vesting date if the officer’s employment terminates as a result of death, disability or retirement. Retirement means termination of an officer’s employment after reaching age 60 and ten years of service. Additionally, in the event of a change in control, all restricted share units will vest as of the date of the change in control. See “Potential Payments Upon Termination or Change In Control” below.
13
Table of Contents
2016 Approvals. In February 2016 the Committee approved long-term incentives for officers, including the named executive officers, as reflected in the following table:
| Name |
2016 Target Annual Long-Term Incentive Compensation ($)(1) |
2016 Time- Based Restricted Share Units (#)(2) |
2016 Performance- Based Restricted Share Units (Target) (#)(2) | ||||||||||||
| Mark A. Ruelle |
2,450,000 | 29,295 | 29,295 | ||||||||||||
| Greg A. Greenwood |
780,000 | 9,325 | 9,325 | ||||||||||||
| Anthony D. Somma |
755,000 | 9,025 | 9,025 | ||||||||||||
| Larry D. Irick |
500,000 | 5,980 | 5,980 | ||||||||||||
| Bruce A. Akin |
320,000 | 3,825 | 3,825 | ||||||||||||
| (1) | These amounts consist of target annual total compensation less base salary. |
| (2) | The number of units, which are divided equally between time-based and performance-based units, is calculated using the average closing price of our common stock for the twenty trading days immediately preceding January 1, 2016, or $41.819 per share. |
Pension and Other Benefits
Other Benefit Programs and Perquisites. Our officers have the opportunity to participate in employee benefit programs available to all of our non-union employees, including the employees’ 401(k) Plan, medical, dental and life insurance programs, a defined benefit pension plan and assistance with moving expenses in some instances. Additionally, as explained below, our officers are eligible to participate in retirement and 401(k) benefit restoration plans that replace benefits lost because of limitations on benefits imposed by the Internal Revenue Code. Officers, including the named executive officers, do not receive any “perquisites” or special benefits such as car allowances, discretionary allowances, personal expense reimbursements, personal use of aircraft or personal club memberships.
From time to time, in various circumstances, such as when an officer retires below age 60 or retires after age 60 but without ten years of service, the Committee considers one time payments or other arrangements, including the accelerated vesting of restricted share units, that it considers appropriate. No such payments or arrangements were made in 2016.
Pension and Retirement Plans. Our officers, including the named executive officers, participate in the same defined benefit pension plan that we make available to all of our employees.
Our named executive officers also participate in a retirement benefit restoration plan adopted in 2010. We adopted this plan because of limitations on benefits imposed by the Internal Revenue Code, and in order to increase the competitiveness of the retirement benefits provided by our executive compensation in comparison to the benefits provided to executive officers of most other utilities including all of the companies in our peer group. As a result of having this plan, the retirement benefits for named executive officers are calculated on the same basis as benefits for other covered employees.
14
Table of Contents
Officers who participate in our retirement plan as cash balance members also participate in a 401(k) benefit restoration plan that became effective on January 1, 2015. The plan was adopted after a review of the competitiveness of retirement and other benefits, such as a deferred compensation program, provided by our executive compensation program in comparison to the benefits provided to executive officers of other utilities, including companies in our peer group. The review included the impact on retirement benefits for our officers from not having an annual cash incentive in our executive compensation program. As a result of having this plan, we credit matching contributions to an account established for officers who participate in our retirement plan as a cash balance member in an amount determined irrespective of limitations on contributions to the 401(k) Plan imposed by the Internal Revenue Code.
In an earlier period of employment with the Company, Mr. Ruelle accrued vested benefits for his prior period of employment under an executive salary continuation plan. He is not accruing additional benefits under this plan in connection with his current employment, and none of the other named executive officers are accruing benefits under this plan. Please see “Pension Benefits” below for a more detailed discussion of the benefits provided to Mr. Ruelle under this plan. The Committee has not taken into account these benefits related to a prior period of employment in setting current compensation for Mr. Ruelle, although the Committee did consider these benefits in its evaluation of the adoption of the retirement benefit restoration plan discussed above.
Change in Control Agreements. The possibility of a change in control can create uncertainty and generate questions among management that may result in the departure or distraction of management personnel to the detriment of the Company and its shareholders. Accordingly, the Committee and the board of directors have taken steps to both minimize the risk that our officers will depart prior to a change in control, and to reinforce and encourage the continued attention and dedication of officers to their assigned duties without distraction in circumstances arising from the possibility of a change in control. The board of directors believes it important that our officers be able to continue their management responsibilities without being influenced by the uncertainties of their personal situations when faced with a potential transfer of control. The board of directors authorized change in control agreements for all of our officers.
The board of directors believes that the payments that could be made under the change in control agreements are reasonable because of the amounts involved and, among other things:
| • | no cash payments are made to executive officers unless there is both a change in control and subsequently a qualifying change in employment (this is commonly referred to as a “double-trigger” provision); |
| • | the agreements provide for a two times payment multiple related to annual compensation; |
| • | if necessary to avoid tax penalties, the payments are reduced to the maximum amount that can be paid without triggering tax penalties; |
| • | there are no “gross-up” payments to executive officers for taxes they would incur as a result of receiving the change in control payments; and |
| • | we have the right to terminate the agreements with 180 days’ notice at any time prior to an event that would lead to a change in control. |
Please see “Potential Payments Upon Termination or Change in Control” later in this Item 11 for a more detailed description of the terms of the change in control agreements and the amount of the benefits payable to each of our named executive officers in the event of the termination of his employment for various reasons following a change in control.
15
Table of Contents
Deferred Compensation. We do not currently have a deferred compensation plan for cash compensation paid to any of our officers. However, we have a plan that authorizes the Committee, at its discretion, to permit officers to defer the receipt of shares of common stock that would otherwise be issued upon the vesting of restricted share units, when we would not otherwise be able to take a related tax deduction.
Executive Compensation Administration
Compensation Committee. The Committee assists our board of directors in administering our executive compensation program. The Committee meets frequently, both in conjunction with regularly scheduled meetings of the board of directors and in special meetings.
Compensation Consultant. In order to fulfill its duties, the Committee seeks independent advice from a compensation consultant. The Committee has full, independent authority to retain its compensation consultant. The Committee generally looks to the consultant for market information rather than recommendations about the amount of compensation for individual officers. The Committee sometimes discusses a project directly with the consultant, and sometimes provides directions to members of management who then work with the consultant and report back to the Committee. In keeping with the Committee’s practice of continuing oversight of our executive compensation program, the compensation consultant is retained throughout the year and typically attends the Committee’s regular and special meetings in person or telephonically. The Committee also annually reviews the performance of the compensation consultant.
During 2016, the Committee was assisted by Meridian, its compensation consultant. Prior to its engagement by the Committee in 2010, Meridian had not provided services to the Committee or the Company. In connection with its assignments in 2016, Meridian provided information to the Committee about market compensation practices in the utility industry and made recommendations related to the executive compensation program. Meridian also worked with management to develop market information for the Committee’s review in connection with the Committee’s consideration in February 2016 of adjustments to officer compensation. During 2016, Meridian provided no services to us other than those described above. The Committee considered the independence of Meridian using NYSE independence rules and found Meridian to be independent.
Management also worked with Willis Towers Watson to develop market information for the Committee’s review in connection with the Committee’s annual consideration of adjustments to officer compensation. In 2016, management also retained Willis Towers Watson on the Company’s behalf to provide actuarial services for our benefit plans. The Willis Towers Watson data was reviewed by Meridian as the Committee’s independent consultant to ensure that Willis Towers Watson’s methodology was consistent with our executive compensation philosophy.
Participation of Executive Officers. Our officers and members of senior management are involved in various aspects of the Committee’s evaluation and determination of officer compensation. Our chief executive officer makes recommendations to the Committee for the compensation of officers other than himself. Some officers, including our chief executive officer, attend portions of Committee discussions about compensation for officers generally and individual compensation for officers other than themselves. As noted above, management may work with compensation consultants to provide information requested by consultants for their reports to the Committee.
Our officers do not work with the board of directors or the Committee in establishing measures or targets that affect their own compensation, although officers did participate in discussions about the performance measures for our performance-based restricted share units. Our officers do not participate in discussions of the Committee or the full board of directors about their own compensation. Further, our officers do not meet with the Committee’s compensation consultants on an individual basis regarding their own compensation.
16
Table of Contents
In the view of the Committee, the involvement by management does not hinder the ability of the Committee to make independent decisions about officer compensation.
Tally Sheets. The Committee annually reviews a tally sheet for each officer, including each named executive officer, to ensure that the Committee is fully informed about the total compensation and benefits of each officer, including the potential compensation in various scenarios should an officer’s employment be terminated. The tally sheets also help to ensure the Committee is considering all benefits and previously granted restricted share units when making compensation decisions. Each tally sheet is prepared by management with the assistance of our human resources staff and the Committee’s independent compensation consultant and includes a summary of an officer’s compensation including current salary, unvested restricted share units, pension and other benefits.
Other Matters
Risk Assessment. The Committee believes the design of the executive compensation program does not encourage excessive or unnecessary risk-taking, based on, among other factors, the following:
| • | Officers are not paid annual cash incentives that might encourage short-term risk taking. |
| • | Long-term incentive compensation awards vest in three years, encouraging a focus on long-term value creation. |
| • | Long-term compensation awards have a maximum payout of two times the target amount. |
| • | Our officers and directors have minimum stock ownership requirements that discourage excessive risk taking. |
Stock Ownership Requirements. Each officer is required to own an amount of our common stock having a value equal to a multiple of the officer’s base salary. The multiple ranges from one to five times base salary, depending upon the position of the officer, with a higher requirement for more senior officers. The Committee believes these requirements further align the interests of officers with the interests of our shareholders by ensuring our officers have a significant long-term stake in the Company and are subject to the risks of equity ownership. At the same time, the Committee believes these requirements balance the personal needs of officers to be able to diversify personal assets and investments. We determine whether the requirements have been met using our closing stock price on the last trading day of the immediately preceding calendar year. We expect officers to achieve the applicable ownership requirement, which includes unvested time-based restricted share units but excludes unvested performance-based restricted share units, within five years of their appointment to an officer position.
Each of the named executive officers has met the current requirements, which are set forth below.
| Executive Officer |
Requirement | ||||
| Mr. Ruelle |
5x | ||||
| Mr. Greenwood, Mr. Somma and Mr. Akin |
3x | ||||
| Mr. Irick |
1x | ||||
Tax Deductibility of Compensation. Under Section 162(m) of the Internal Revenue Code, we may not deduct certain forms of compensation in excess of $1 million paid to any named executive officer other than the chief financial officer. Certain performance-based compensation is specifically exempt from the deduction limit. The Committee considers deductibility of compensation for federal income tax purposes in structuring our executive compensation program; however, to maintain flexibility in compensating executive officers in a manner designed to promote our various goals, the Committee may, but does not necessarily, design compensation programs based upon tax consequences. For example, our time-based restricted share units, as currently designed, are not eligible for the performance-based exemption from the Section 162(m) deduction limit. Our performance-based restricted share unit awards are generally intended to be exempt from the deduction limit.
17
Table of Contents
Companies Included in the Willis Towers Watson 2015 Energy Services Executive Compensation Database
18
Table of Contents
The Compensation Committee has reviewed and discussed with the Company’s management the Compensation Discussion and Analysis included in this Item 11. Based on that review and discussion, the Compensation Committee has recommended to the board of directors that the Compensation Discussion and Analysis be included in this Amendment to the Annual Report on Form 10-K for the year ended December 31, 2016.
The Compensation Committee
Mollie H. Carter, Chairman
Richard L. Hawley
B. Anthony Isaac
Sandra A.J. Lawrence
The following tables, narrative and footnotes discuss the compensation for 2014, 2015 and 2016 of our named executive officers.
| Name & Principal Position |
Year | Salary ($)(1) |
Stock Awards ($)(2) |
Change in Pension Value and Nonqualified Deferred Compensation Earnings(3) |
All Other Compensation ($)(4) |
Total ($) | ||||||||||||||||||||||||
| Mark A. Ruelle |
2016 | 845,000 | 2,707,444 | 152,036 | 39,523 | 3,744,003 | ||||||||||||||||||||||||
| President and Chief Executive |
2015 | 812,500 | 2,263,051 | 60,955 | 37,985 | 3,174,491 | ||||||||||||||||||||||||
| Officer |
2014 | 767,292 | 2,227,878 | 216,495 | 13,038 | 3,224,703 | ||||||||||||||||||||||||
| Greg A. Greenwood |
2016 | 426,667 | 861,817 | 338,842 | 12,712 | 1,640,038 | ||||||||||||||||||||||||
| Senior Vice President, |
2015 | 405,833 | 714,795 | 112,714 | 12,664 | 1,246,006 | ||||||||||||||||||||||||
| Strategy |
2014 | 380,375 | 713,105 | 392,606 | 12,382 | 1,498,468 | ||||||||||||||||||||||||
| Anthony D. Somma |
2016 | 420,000 | 834,091 | 340,013 | 12,683 | 1,606,787 | ||||||||||||||||||||||||
| Executive Vice President, |
2015 | 391,667 | 699,612 | 134,032 | 12,645 | 1,237,956 | ||||||||||||||||||||||||
| Chief Financial Officer and |
2014 | 371,146 | 696,101 | 398,201 | 12,372 | 1,477,820 | ||||||||||||||||||||||||
| Treasurer |
||||||||||||||||||||||||||||||
| Larry D. Irick |
2016 | 361,667 | 552,672 | 258,340 | 12,823 | 1,185,502 | ||||||||||||||||||||||||
| Vice President, General |
2015 | 339,167 | 466,275 | 133,730 | 12,736 | 951,908 | ||||||||||||||||||||||||
| Counsel and Corporate |
2014 | 306,917 | 473,278 | 296,538 | 12,465 | 1,089,198 | ||||||||||||||||||||||||
| Secretary |
||||||||||||||||||||||||||||||
| Bruce A. Akin |
2016 | 306,667 | 353,507 | 227,558 | 12,482 | 900,214 | ||||||||||||||||||||||||
| Senior Vice President, Power |
2015 | 286,667 | 297,665 | 35,073 | 12,443 | 631,848 | ||||||||||||||||||||||||
| Delivery |
2014 | — | — | — | — | — | ||||||||||||||||||||||||
| (1) | See the Compensation Discussion and Analysis section earlier in this Item 11 for information about adjustments to base salaries in 2016. |
19
Table of Contents
| (2) | Amounts reflect the aggregate grant date fair value of time-based restricted share units and performance-based restricted share units approved in 2016, as determined pursuant to Financial Accounting Standards Board Codification Topic 718. For additional information about the assumptions we used in calculating these amounts, see Note 12 in our Notes to Consolidated Financial Statements, Employee Benefit Plans, Stock Based Compensation Plans, found in the Original Filing. |
Amounts relate to annual long-term incentives approved for all the named executive officers. See “Compensation Discussion and Analysis—Long-Term Incentive Compensation” for additional information about these long-term incentives and their terms, including vesting conditions that must be met for any compensation to be received and, for performance-based restricted share units, their performance measures, the target payout level and the payout range, which is between zero and 200% of the target level. These amounts do not reflect actual compensation realized by the named executive officers and are not a guarantee of the amount that the named executive officers will receive from the long-term incentives. The actual compensation will be based on our common stock price at vesting and the performance level achieved for the applicable performance period.
The grant date fair value for the time-based restricted share units is determined by multiplying the number of restricted share units granted by the closing stock price on the grant date of the underlying common stock. The grant date fair value for the performance-based restricted share units in 2016 is based on an accounting value of 99% of the target value for the annual long-term awards. Assuming achievement of the performance goals at the maximum level and the receipt of the maximum number of performance-based restricted share units, the aggregate grant date fair value of the restricted share unit awards in 2016 would be: Mr. Ruelle, $4,073,470; Mr. Greenwood $1,296,641; Mr. Somma, $1,254,926; Mr. Irick $831,519; and Mr. Akin, $531,866.
| (3) | Amounts reported reflect the aggregate change in the actuarial present value of each named executive officer’s accumulated pension benefits. These values do not represent cash received by the named executive officers in the indicated years. Year-over-year changes in pension value are driven in large part by changes in actuarial pension assumptions. The material terms of our pension plans and the assumptions and methods used to determine these amounts are described following the Pension Benefits section in Item 11. |
| (4) | The following table identifies the amount of each item included in the All Other Compensation column of the Summary Compensation Table with respect to 2016 compensation. |
| Name |
Company Matching 401(k) Plan Contributions ($) |
Company 401(k) Restoration Plan Contributions ($) |
Life Insurance ($)(a) |
Discount on Stock for Compensation Program ($)(b) |
Total ($) | ||||||||||||||||||||
| Mark A. Ruelle |
11,925 | 26,100 | 1,498 | — | 39,523 | ||||||||||||||||||||
| Greg A. Greenwood |
11,925 | — | 787 | — | 12,712 | ||||||||||||||||||||
| Anthony D. Somma |
11,925 | — | 758 | — | 12,683 | ||||||||||||||||||||
| Larry D. Irick |
11,925 | — | 662 | 236 | 12,823 | ||||||||||||||||||||
| Bruce A. Akin |
11,925 | — | 557 | — | 12,482 | ||||||||||||||||||||
| (a) | Amounts reflect premiums paid on term life insurance for the benefit of the named executive officers under our group term life insurance plan provided to all non-union employees. |
| (b) | Pursuant to a stock-for-compensation plan that was discontinued in 2001, executive officers could elect to receive restricted share units in lieu of cash compensation. Mr. Irick, a participant in this plan, previously made an irrevocable election to defer payout under the plan until his retirement. The amount in this column reflects the value of discounts received by Mr. Irick on share units acquired through reinvested dividends pursuant to the terms of the plan. |
20
Table of Contents
Annual long-term incentives were approved for each of the named executive officers in 2016 consisting of time-based restricted share units and performance-based restricted share units. See “Compensation Discussion and Analysis—Long-Term Incentive Compensation” for information about the terms of these restricted share units. The following table sets forth information about the grants.
| Name |
Grant Date | Estimated Future Payouts Under Equity Incentive Plan Awards |
All Other Stock Awards: Number of Shares of Stock or Units (#) |
Grant Date Fair Value of Stock and Option Awards ($)(1)(2)(3) |
||||||||||||||||||||
| Threshold (#) |
Target (#) |
Maximum (#) |
||||||||||||||||||||||
| Mark A. Ruelle |
2/24/2016 | — | 29,295 | 1,357,823 | ||||||||||||||||||||
| 2/24/2016 | — | 29,295 | 58,590 | 1,349,621 | ||||||||||||||||||||
| Greg A. Greenwood |
2/24/2016 | — | 9,325 | 432,214 | ||||||||||||||||||||
| 2/24/2016 | — | 9,325 | 18,650 | 429,603 | ||||||||||||||||||||
| Anthony D. Somma |
2/24/2016 | — | 9,025 | 418,309 | ||||||||||||||||||||
| 2/24/2016 | — | 9,025 | 18,050 | 415,782 | ||||||||||||||||||||
| Larry D. Irick |
2/24/2016 | — | 5,980 | 277,173 | ||||||||||||||||||||
| 2/24/2016 | — | 5,980 | 11,960 | 275,499 | ||||||||||||||||||||
| Bruce A. Akin |
2/24/2016 | — | 3,825 | 177,289 | ||||||||||||||||||||
| 2/24/2016 | — | 3,825 | 7,650 | 176,218 | ||||||||||||||||||||
| (1) | Represents the aggregate grant date fair value of time-based and performance-based restricted share units in 2016, as determined pursuant to Financial Accounting Standings Board Codification 718. |
| (2) | The grant date fair value of time-based restricted share units reported in the All Other Stock Awards column is determined by multiplying the number of restricted share units by our closing stock price on the grant date ($46.35 on February 24, 2016). The grant date fair value for the performance-based restricted share units in 2016 is based on an accounting value of 99% of the target value for the annual long-term awards. See footnote 2 to the Summary Compensation Table for assumptions used in the calculation of these amounts. |
| (3) | Restricted share units with a three-year vesting period for time-based restricted share units and a three-year performance period for performance-based restricted share units. |
21
Table of Contents
Outstanding Equity Awards at Fiscal Year-End
The following table sets forth information as of December 31, 2016, with regard to unvested restricted share units held by the named executive officers.
| Stock Awards | ||||||||||||||||
| Name |
Number of Shares or Units of Stock that Have Not Vested (#)(1) |
Market Value of Shares or Units of Stock that Have Not Vested ($)(2) |
Equity Incentive Plan Awards: Number of Unearned Shares, Units or Other Rights That Have Not Vested (#)(3) |
Equity Incentive Plan Awards: Market or Payout Value of Unearned Shares, Units or Other Rights That Have Not Vested ($)(2) |
||||||||||||
| Mark A. Ruelle |
89,060 | 5,018,531 | 89,060 | 5,018,531 | ||||||||||||
| Greg A. Greenwood |
28,335 | 1,596,677 | 28,335 | 1,596,677 | ||||||||||||
| Anthony D. Somma |
27,605 | 1,555,542 | 27,605 | 1,555,542 | ||||||||||||
| Larry D. Irick |
18,495 | 1,042,193 | 18,495 | 1,042,193 | ||||||||||||
| Bruce A. Akin |
11,715 | 660,140 | 11,715 | 660,140 | ||||||||||||
| (1) | Represents the number of unvested time-based restricted share units. The vesting schedules are shown in the table below. |
| (2) | Reported market value equals the total number of unvested restricted share units multiplied by our closing stock price on December 30, 2016 of $56.35 per share. |
| (3) | Represents the target number of performance-based restricted share units that could be earned assuming the target performance criteria are met. |
As of December 31, 2016, restricted share units that had not vested were subject to the vesting schedule indicated in the following table.
| Name |
Year of Award |
Unvested Share Units (#)(1) |
Unearned and Unvested Share Units (#)(2) |
Vesting Date | ||||||||||
| Mark A. Ruelle |
|
2014 2015 2016 |
|
|
31,445 28,320 29,295 |
|
|
31,445 28,320 29,295 |
|
January 1, 2017 January 1, 2018 January 1, 2019 | ||||
| Greg A. Greenwood |
|
2014 2015 2016 |
|
|
10,065 8,945 9,325 |
|
|
10,065 8,945 9,325 |
|
January 1, 2017 January 1, 2018 January 1, 2019 | ||||
| Anthony D. Somma |
|
2014 2015 2016 |
|
|
9,825 8,755 9,025 |
|
|
9,825 8,755 9,025 |
|
January 1, 2017 January 1, 2018 January 1, 2019 | ||||
| Larry D. Irick |
|
2014 2015 2016 |
|
|
6,680 5,835 5,980 |
|
|
6,680 5,835 5,980 |
|
January 1, 2017 January 1, 2018 January 1, 2019 | ||||
| Bruce A. Akin |
|
2014 2015 2016 |
|
|
4,165 3,725 3,825 |
|
|
4,165 3,725 3,825 |
|
January 1, 2017 January 1, 2018 January 1, 2019 | ||||
| (1) | Includes time-based restricted share units. |
| (2) | Includes the target number of performance-based restricted share units that may be earned by the named executive officers if the performance criteria are met. |
22
Table of Contents
Option Exercises and Stock Vested
The following table sets forth information about the value of shares of our common stock received by the named executive officers as a result of the vesting of restricted share units in 2016.
| Name |
Number of Shares Acquired on Vesting (#) |
Value Realized on Vesting ($) |
||||||
| Mark A. Ruelle |
87,555 | 3,713,208 | ||||||
| Greg A. Greenwood |
25,532 | 1,082,812 | ||||||
| Anthony D. Somma |
25,532 | 1,082,812 | ||||||
| Larry D. Irick |
18,968 | 804,433 | ||||||
| Bruce A. Akin |
12,154 | 515,451 | ||||||
The market value of the shares received by the named executive officers is based on our closing stock price on the date of vesting or the trading day immediately preceding the date of vesting in instances where the date of vesting was not a trading day.
The following table sets forth, at December 31, 2016, the present value of accumulated benefits payable to the named executive officers under our Retirement Plan, our Executive Salary Continuation Plan, and our Retirement Benefit Restoration Plan.
| Name |
Plan Name |
Number of Years of Credited Service (#) |
Present Value of Accumulated Benefit ($) |
Payments During Last Fiscal Year ($) |
||||||||||
| Mark A. Ruelle |
Retirement Plan (final average earnings) | 10.5 | 180,574 | |||||||||||
| Retirement Plan (cash balance) | 14.0 | 349,685 | ||||||||||||
| Executive Salary Continuation Plan | 10.5 | 173,858 | ||||||||||||
| Retirement Benefit Restoration Plan | n/a | 380,515 | ||||||||||||
| Greg A. Greenwood |
Retirement Plan (final average earnings) | 23.7 | 968,129 | |||||||||||
| Retirement Benefit Restoration Plan | n/a | 448,299 | ||||||||||||
| Anthony D. Somma |
Retirement Plan (final average earnings) | 21.8 | 1,006,705 | |||||||||||
| Retirement Benefit Restoration Plan | n/a | 435,471 | ||||||||||||
| Larry D. Irick |
Retirement Plan (final average earnings) | 17.6 | 1,133,362 | |||||||||||
| Retirement Benefit Restoration Plan | n/a | 252,729 | ||||||||||||
| Bruce A. Akin |
Retirement Plan (final average earnings) | 29.3 | 1,143,542 | |||||||||||
| Retirement Benefit Restoration Plan | n/a | 69,887 | ||||||||||||
23
Table of Contents
Retirement Plan
The Westar Energy, Inc. Retirement Plan (the “Retirement Plan”) is a broad-based tax-qualified defined benefit pension plan in which generally all of our employees, including the named executive officers, are eligible to participate. Participation is automatic and begins after an eligible employee completes one year of credited service. All of the named executive officers are fully vested in their plan benefits.
The Retirement Plan uses two formulas to calculate benefits, a final average earnings formula for union employees hired prior to January 1, 2012 and non-union employees hired prior to January 1, 2002, and a cash balance formula for union employees hired (or re-hired) after December 31, 2011 and non-union employees hired (or re-hired) after December 31, 2001. “Final average earnings” generally means the average annual earnings of an employee measured over the sixty consecutive months that produce the highest monthly average within one hundred twenty consecutive months immediately preceding the employee’s termination or retirement date. Earnings related to restricted share units and dividend equivalents are not included in the calculation of final average earnings. In 2016, the Internal Revenue Code limited annual compensation that could be used in calculating pension benefits to $265,000.
Mr. Ruelle accrued vested benefits calculated under the final average earnings formula during periods of employment with us prior to recommencing employment with us (Mr. Ruelle rejoined us in January of 2003) and also accrued a benefit in 2016 calculated under the cash balance formula as a result of his current employment. Mr. Greenwood, Mr. Somma, Mr. Irick and Mr. Akin are accruing benefits calculated under the final average earnings formula as a result of their current employment.
Under the final average earnings formula, the accrued benefit for each non-union plan participant equals:
| (1) | 1.5% times the participant’s final average earnings plus .4% times the final average earnings in excess of covered compensation (certain wages subject to Social Security taxes) multiplied by credited service up to twenty years; plus |
| (2) | .8% times the final average earnings plus .4% times the final average earnings in excess of covered compensation multiplied by credited service in excess of 20 years up to a maximum of 35 years. |
Pension benefits accrued under the final average earnings formula are calculated as a monthly annuity generally for the participant’s lifetime. The normal form of benefit for a married participant is a 50% joint and survivor annuity, which provides reduced monthly payments during the participant’s lifetime and lifetime payments to the spouse following the participant’s death in the amount of 50% of the reduced payments. Full benefits may be received when a participant reaches retirement age of 62 or age 60 with 35 years of service. Benefits are reduced if a participant elects to receive payments before attaining such age and years of service. Effective in December 2015, we amended the Retirement Plan to allow certain final average earning participants to elect a lump sum payment in lieu of a monthly annuity. In general, the lump sum payment is equivalent to the present value of the accrued benefit.
24
Table of Contents
Under the cash balance formula, a bookkeeping account is established for each plan participant and credited with interest and contribution credits. Participants may elect to receive benefits accrued under the cash balance formula either as an annuity or as a lump sum distribution. Interest is credited on a monthly basis during a plan year to each participant’s account using an annual rate of interest determined each December by a plan-specific formula. The formula uses the one-year Treasury Constant Maturities plus 1% and the 30-year Treasury Constant Maturities for the preceding November to determine the new annual rate of interest to be paid for the plan year. The annual interest rates applicable for 2014, 2015 and 2016 were 3.80%, 3.04% and 3.03%, respectively. Contribution credits are determined by multiplying the contribution rate applicable for each participant’s age (based upon the first day of the month) by the participant’s plan earnings for that particular month. The contribution rates are shown in the following table:
| Age |
||||
| Less than 30 |
4 | % | ||
| 30 and above but less than 35 |
5 | % | ||
| 35 and above but less than 40 |
6 | % | ||
| 40 and above but less than 45 |
7 | % | ||
| 45 and above but less than 50 |
8 | % | ||
| 50 and above but less than 55 |
9 | % | ||
| 55 and above but less than 60 |
10 | % | ||
| 60 or more |
12 | % | ||
We calculated the amounts in the Present Value of Accumulated Benefit column in the Pension Benefits table above based on the same assumptions used for financial reporting purposes with respect to the Retirement Plan in our 2016 consolidated financial statements. For each named executive officer, we calculated the present value of his accrued pension benefit as of December 31, 2016, using a discount rate of 4.30% and a modified R-2014 mortality table, projected generationally. Cash balance benefits were assumed to be paid in a lump sum at age 62. Benefits under the final average earnings formula were assumed to commence at the earliest unreduced retirement age (62) and be paid in a lump sum 90% of the time and a life annuity 10% of the time. The calculations assume that the named executive officers continue to live and will work until the earliest unreduced retirement age.
We caution that the values reported in the Present Value of Accumulated Benefit column in the table above are hypothetical and are calculated and presented pursuant to SEC regulations and are based on assumptions used in preparing our audited 2016 consolidated financial statements. The Retirement Plan uses a different method of calculating actuarial present value for the purpose of determining an actual lump sum payment, if any, under the plan. The change in pension value from year to year is subject to volatility in interest rates and may not represent the value that a named executive officer will actually accrue under the Retirement Plan during any given year when based on the Retirement Plan’s current definition of actuarial present value. As a result, the values in the table above do not represent the value that a named executive officer would receive from the Retirement Plan had he actually retired on December 31, 2016.
Executive Salary Continuation Plan
In addition to his benefits under our Retirement Plan, Mr. Ruelle accrued vested benefits for periods of employment prior to his rejoining us as an officer in early 2003 under an executive salary continuation plan. The estimated annual benefit payable to Mr. Ruelle under the plan upon retirement at or after age 62 is $16,072.
We calculated the present value of the benefits as of December 31, 2016 for the executive salary continuation plan in the Present Value of Accumulated Benefits column in the Pension Benefits table as a 15-year certain and life annuity using a discount rate of 4.30% and a modified R-2014 mortality table, projected generationally. Mr. Ruelle is not accruing additional benefits under the plan as a result of his current employment. Mr. Greenwood, Mr. Somma, Mr. Irick and Mr. Akin are not participants in this plan.
25
Table of Contents
Retirement Benefit Restoration Plan
In 2010, we adopted the Westar Energy, Inc. Retirement Benefit Restoration Plan (“Restoration Plan”) to replace benefits lost under our Retirement Plan because of limitations imposed by the Internal Revenue Code on annual compensation that can be used in calculating pension benefits. Each of the named executive officers is a participant in our Restoration Plan. As a result of having this plan, the retirement benefits for named executive officers are calculated on the same basis as benefits for other covered employees.
Under the terms of our Restoration Plan, the benefit payable will be a monthly amount that is equal to the difference between the monthly amount that is payable to the participant under our Retirement Plan and the monthly amount that would be payable if the Plan were not subject to such limitations. The amount payable under the Restoration Plan will be determined in the form of a straight life annuity over the lifetime of the participant and will commence on the participant’s normal retirement date. We calculated the present value of the benefits as of December 31, 2016 using a discount rate of 4.30% and a modified R-2014 mortality table, projected generationally. For this purpose, benefits were assumed to commence at the earliest unreduced retirement age (62).
401(k) Benefit Restoration Plan
In 2014, we adopted a 401(k) benefit restoration plan to become effective on January 1, 2015. The plan was adopted after a review of the competitiveness of retirement and other benefits, such as a deferred compensation program, provided by our executive compensation program in comparison to the benefits provided to executive officers of other utilities, including companies in our peer group. The review included the impact on retirement benefits for our officers from not having an annual cash incentive in our executive compensation program. As a result of having this plan, we credit matching contributions to an account established for officers who participate in our retirement plan as a cash balance member in an amount determined irrespective of limitations on contributions to the 401(k) Plan imposed by the Internal Revenue Code. In general, a participant’s account will be distributed in a lump sum in cash on the first business day of the month following a change in control, or on the first business day of the seventh month following a separation from service (with accrued interest at the prime rate in effect on the date of the separation from service). Mr. Ruelle is the only named executive officer who participates in this plan due to his participation as a cash balance member under our Retirement Plan.
The following table sets forth, at December 31, 2016, certain information about the 401(k) Benefit Restoration Plan.
| Name |
Registrant Contributions During Last Fiscal Year ($) (1) |
Aggregate Earnings During Last Fiscal Year ($) (2) |
Aggregate Balance at Last Fiscal Year End ($) |
|||||||||
| Mark A. Ruelle |
26,100 | 3,375 | 54,113 | |||||||||
| (1) | This amount is included in “All Other Compensation” in the Summary Compensation Table. |
| (2) | In future periods, plan balances will be credited with gains and losses from measuring investments that track the employee’s investment elections in the 401(k) Plan. We will not credit above-market earnings or preferential earnings to amounts in the plan. |
26
Table of Contents
Potential Payments Upon Termination or Change In Control
Potential Payments Upon Termination
If the employment of any named executive officer terminates for any reason, he will receive a lump-sum cash amount equal to the sum of his base salary and any accrued vacation pay through the date of termination, to the extent not previously paid. Additionally, the named executive officer’s restricted share units will vest on a prorated basis through the date of termination upon a termination due to death, disability or retirement. The term “retirement” means cessation of services as an employee after reaching age 60 with ten years of service.
Potential Payments Upon Change in Control
We have entered into change in control agreements with all of the named executive officers. Documents for restricted share units also contain provisions relating to benefits to be received by officers in the event of a change in control.
Under each officer’s change in control agreement, the officer is eligible to receive the following benefits if both a change in control occurs, and within three years thereafter, we terminate the officer’s employment without “Cause” or the officer terminates his or her employment for “Good Reason.”
| • | a severance payment equal to two times the sum of (1) the officer’s base salary on the date of the change in control or, if higher, the date of termination, (2) the annual amount of the dividend equivalents payable to the officer, based on our annual dividend and the “Annual RSU Grant” (defined as the number of restricted share units awarded under the officer’s most recent annual grant of restricted share units, which is equal to the sum of the number of time-based restricted share units and the target number of performance-based restricted share units) and (3) the value of the officer’s Annual RSU Grant (regardless of conditions for vesting) based on the higher of our stock price at the date of the change in control or the date of termination; |
| • | a cash payment for accrued vacation and up to thirty days of accumulated sick leave; |
| • | participation in our (or our successor’s) welfare benefit plans for two years following termination (or until the officer is receiving comparable benefits from a new employer) on the same terms as benefits are provided to the officer at the time of termination; |
| • | a cash payment equal to the actuarial present value of pension plan benefits for two additional years of service; and |
| • | we (or our successor) will cause directors and officers liability insurance to be provided to the officer for at least five years following termination. |
If necessary to avoid excise taxes, the severance payment will be reduced to the maximum amount that can be paid without triggering excise taxes. There are no gross-up payments to executive officers for taxes they incur as a result of receiving change in control payments. We have the right to terminate the change in control agreement with 180 days’ notice at any time prior to a change in control.
The term “Cause” generally means the officer’s conviction of a felony or crime involving moral turpitude, the officer’s commission of a willful act of fraud or dishonesty with respect to us, the officer’s willful and repeated failure to perform substantially his or her material duties to us, the officer’s engaging in significant activity that is materially harmful to our reputation or the officer’s breach of his or her fiduciary responsibilities to us or our shareholders.
27
Table of Contents
The term “Change in Control” generally means the sale of all or substantially all of our assets, a person becoming the beneficial owner of 20 percent or more of our outstanding voting securities, a merger or consolidation or our continuing directors ceasing for any reason to constitute a majority of the board of directors.
The term “Good Reason” generally means any change in an officer’s status as an officer, a reduction in total compensation, any requirement that the officer relocate more than 80 miles to a location outside our Kansas retail electric service territory or any action that materially and adversely affects the officer’s participation in or reduces the officer’s benefits under any benefit plan.
Under the documents for restricted share units, all outstanding time-based and performance-based restricted share units (with the target number of performance-based restricted share units subject to adjustment based on our total shareholder return relative to the total shareholder return for a peer group through the date of the change in control) vest upon a change in control.
In addition to the benefits described above under the change of control agreements, upon termination of employment following a change of control, the named executive officers will receive the amounts described in the preceding section titled “Potential Payments Upon Termination.”
Termination and Change in Control Tables
General
The tables below show the payments we would make to each of the named executive officers following termination of his employment in various circumstances, including termination following a change in control. We made the following assumptions in calculating the payments to the named executive officers:
| • | We assumed a termination date of December 31, 2016 as required by the applicable SEC regulations. |
| • | We made calculations consistent with the terms of his change in control agreement, if applicable, as described above. |
| • | We assumed each officer had been paid all base salary through the date of termination. |
| • | We used our closing common stock price on December 30, 2016 ($56.285) to value unvested time-based and performance-based restricted share units and used the target number of performance-based restricted share units (assumed total shareholder return on December 31, 2016 at the median of the peer group). |
| • | We used the average of the high and low stock price of our common stock on December 30, 2016 ($56.285) to determine the Annual RSU Grant (as defined above) value, as required by the terms of the change in control agreements. |
| • | We used our annual dividend of $1.52 per share on our common stock at December 31, 2016 to calculate dividend equivalents payable in the event of a qualifying termination following a change in control. |
| • | We omitted payments or benefits we provide to all salaried employees upon termination of employment in the applicable circumstances, including accrued unused vacation. |
| • | To calculate pension-related payments, we assumed, in the case of Mr. Ruelle, no change in pay or pay limits relating to the cash balance formula and we used two years of contribution credits as the present value. In the case of Mr. Greenwood, Mr. Somma, Mr. Irick and Mr. Akin, we assumed no change to the actual final average earnings used in the calculation and we used two additional years of pension service in calculating the pension value. |
28
Table of Contents
Great Plains Energy Merger
On May 29, 2016, we entered into an agreement and plan of merger with Great Plains Energy Incorporated, providing for the merger of a wholly-owned subsidiary of Great Plains Energy with and into Westar Energy, with Westar Energy surviving as a wholly-owned subsidiary of Great Plains Energy.
Our shareholders approved the agreement and plan of merger on September 26, 2016. Pages 112-114 of the definitive proxy statement filed in connection with the merger, which was dated August 25, 2016, identified potential change in control payments to our named executive officers in connection with the merger. The payments identified in the proxy statement relating to the merger differ from the information set forth below because the disclosure requirements, time periods and assumptions differ from those set forth in the definitive proxy statement relating to the merger. The payments named executive officers will receive, if any, will differ from the information set forth in the proxy statement relating to the merger and from what is set forth below.
Mark A. Ruelle, President and Chief Executive Officer
| Executive Benefits and Payments Upon Termination |
Voluntary Termination By Officer ($) |
Retirement, Death or Disability ($) |
Termination by Company without Cause or by Officer for Good Reason ($) |
Termination by Company for Cause ($) |
Change in Control ($) |
Qualifying Termination After Change in Control ($) |
||||||||||||||||||
| Base Salary |
1,700,000 | |||||||||||||||||||||||
| Unvested Restricted Share Units and Performance-Based Restricted Share Units |
6,595,361 | 10,037,062 | 10,037,062 | |||||||||||||||||||||
| Annual RSU Grant Value |
6,595,476 | |||||||||||||||||||||||
| Dividend Equivalents |
178,114 | |||||||||||||||||||||||
| Medical and Welfare Plan Benefits |
30,571 | |||||||||||||||||||||||
| Accrued Sick Leave |
98,077 | |||||||||||||||||||||||
| Pension Related Payment |
172,185 | |||||||||||||||||||||||
|
|
|
|
|
|
|
|
|
|
|
|
|
|||||||||||||
| Total Before Change in Control Reduction (1) |
6,595,361 | 10,037,062 | 18,811,485 | |||||||||||||||||||||
| Change in Control Reduction |
8,353,149 | |||||||||||||||||||||||
| Actual Payment |
6,595,361 | 10,037,062 | 10,458,336 | |||||||||||||||||||||
|
|
|
|
|
|
|
|
|
|
|
|
|
|||||||||||||
| (1) | Pursuant to the terms of our change in control agreements with the named executive officers, the change in control payments are reduced to avoid payment of excise taxes. |
29
Table of Contents
Greg A. Greenwood, Senior Vice President, Strategy
| Executive Benefits and Payments Upon Termination |
Voluntary Termination By Officer ($) |
Retirement, Death or Disability ($) |
Termination by Company without Cause or by Officer for Good Reason ($) |
Termination by Company for Cause ($) |
Change in Control ($) |
Qualifying Termination After Change in Control ($) |
||||||||||||||||||
| Base Salary |
860,000 | |||||||||||||||||||||||
| Unvested Restricted Share Units and Performance-Based Restricted Share Units |
2,100,567 | 3,193,355 | 3,193,355 | |||||||||||||||||||||
| Annual RSU Grant Value |
2,099,431 | |||||||||||||||||||||||
| Dividend Equivalents |
56,696 | |||||||||||||||||||||||
| Medical and Welfare Plan Benefits |
33,335 | |||||||||||||||||||||||
| Accrued Sick Leave |
49,615 | |||||||||||||||||||||||
| Pension Related Payment |
78,523 | |||||||||||||||||||||||
|
|
|
|
|
|
|
|
|
|
|
|
|
|||||||||||||
| Total Before Change in Control Reduction(1) |
2,100,567 | 3,193,355 | 6,370,955 | |||||||||||||||||||||
| Change in Control Reduction |
3,064,512 | |||||||||||||||||||||||
| Actual Payment |
2,100,567 | 3,193,355 | 3,306,443 | |||||||||||||||||||||
|
|
|
|
|
|
|
|
|
|
|
|
|
|||||||||||||
| (1) | Pursuant to the terms of our change in control agreements with the named executive officers, the change in control payments are reduced to avoid payment of excise taxes. |
Anthony D. Somma, Senior Vice President, Chief Financial Officer and Treasurer
| Executive Benefits and Payments Upon Termination |
Voluntary Termination By Officer ($) |
Retirement, Death or Disability ($) |
Termination by Company without Cause or by Officer for Good Reason ($) |
Termination by Company for Cause ($) |
Change in Control ($) |
Qualifying Termination After Change in Control ($) |
||||||||||||||||||
| Base Salary |
850,000 | |||||||||||||||||||||||
| Unvested Restricted Share Units and Performance-Based Restricted Share Units |
2,049,570 | 3,111,084 | 3,111,084 | |||||||||||||||||||||
| Annual RSU Grant Value |
2,031,889 | |||||||||||||||||||||||
| Dividend Equivalents |
54,872 | |||||||||||||||||||||||
| Medical and Welfare Plan Benefits |
27,872 | |||||||||||||||||||||||
| Accrued Sick Leave |
49,038 | |||||||||||||||||||||||
| Pension Related Payment |
84,481 | |||||||||||||||||||||||
|
|
|
|
|
|
|
|
|
|
|
|
|
|||||||||||||
| Total Before Change in Control Reduction(1) |
2,049,570 | 3,111,084 | 6,209,236 | |||||||||||||||||||||
| Change in Control Reduction |
2,944,394 | |||||||||||||||||||||||
| Actual Payment |
2,049,570 | 3,111,084 | 3,264,842 | |||||||||||||||||||||
|
|
|
|
|
|
|
|
|
|
|
|
|
|||||||||||||
| (1) | Pursuant to the terms of our change in control agreements with the named executive officers, the change in control payments are reduced to avoid payment of excise taxes. |
30
Table of Contents
Larry D. Irick, Vice President, General Counsel and Corporate Secretary
| Executive Benefits and Payments Upon Termination |
Voluntary Termination By Officer ($) |
Retirement, Death or Disability ($) |
Termination by Company without Cause or by Officer for Good Reason ($) |
Termination by Company for Cause ($) |
Change in Control ($) |
Qualifying Termination After Change in Control ($) |
||||||||||||||||||
| Base Salary |
730,000 | |||||||||||||||||||||||
| Unvested Restricted Share Units and Performance-Based Restricted Share Units |
1,379,662 | 2,084,387 | 2,084,387 | |||||||||||||||||||||
| Annual RSU Grant Value |
1,346,337 | |||||||||||||||||||||||
| Dividend Equivalents |
36,358 | |||||||||||||||||||||||
| Medical and Welfare Plan Benefits |
14,330 | |||||||||||||||||||||||
| Accrued Sick Leave |
42,115 | |||||||||||||||||||||||
| Pension Related Payment |
155,664 | |||||||||||||||||||||||
|
|
|
|
|
|
|
|
|
|
|
|
|
|||||||||||||
| Total Before Change in Control Reduction(1) |
1,379,662 | 2,084,387 | 4,409,191 | |||||||||||||||||||||
| Change in Control Reduction |
1,363,243 | |||||||||||||||||||||||
| Actual Payment |
1,379,662 | 2,084,387 | 3,045,948 | |||||||||||||||||||||
|
|
|
|
|
|
|
|
|
|
|
|
|
|||||||||||||
| (1) | Pursuant to the terms of our change in control agreements with the named executive officers, the change in control payments are reduced to avoid payment of excise taxes. |
Bruce A. Akin, Senior Vice President, Power Delivery
| Executive Benefits and Payments Upon Termination |
Voluntary Termination By Officer ($) |
Retirement, Death or Disability ($) |
Termination by Company without Cause or by Officer for Good Reason ($) |
Termination by Company for Cause ($) |
Change in Control ($) |
Qualifying Termination After Change in Control ($) |
||||||||||||||||||
| Base Salary |
620,000 | |||||||||||||||||||||||
| Unvested Restricted Share Units and Performance-Based Restricted Share Units |
869,815 | 1,320,281 | 1,320,281 | |||||||||||||||||||||
| Annual RSU Grant Value |
861,161 | |||||||||||||||||||||||
| Dividend Equivalents |
23,256 | |||||||||||||||||||||||
| Medical and Welfare Plan Benefits |
33,995 | |||||||||||||||||||||||
| Accrued Sick Leave |
35,769 | |||||||||||||||||||||||
| Pension Related Payment |
57,311 | |||||||||||||||||||||||
|
|
|
|
|
|
|
|
|
|
|
|
|
|||||||||||||
| Total Before Change in Control Reduction(1) |
869,815 | 1,320,281 | 2,951,773 | |||||||||||||||||||||
| Change in Control Reduction |
903,683 | |||||||||||||||||||||||
| Actual Payment |
869,815 | 1,320,281 | 2,048,090 | |||||||||||||||||||||
|
|
|
|
|
|
|
|
|
|
|
|
|
|||||||||||||
| (1) | Pursuant to the terms of our change in control agreements with the named executive officers, the change in control payments are reduced to avoid payment of excise taxes. |
31
Table of Contents
The following table describes the compensation paid in 2016 to our non-employee directors. Mr. Ruelle did not receive any compensation in his capacity as a director. Compensation paid to Mr. Ruelle in his capacity as an executive officer is presented above.
| Name |
Fees Earned Or Paid in Cash ($)(1) |
Stock Awards ($)(2) |
Change in Pension Value and Nonqualified Deferred Compensation Earnings ($)(3) |
All Other Compensation ($)(4) |
Total ($) |
|||||||||||||||
| Mollie H. Carter |
92,500 | 85,000 | 3,168 | 107,506 | 288,174 | |||||||||||||||
| Charles Q. Chandler IV |
116,000 | 145,000 | 26,422 | 144,598 | 432,020 | |||||||||||||||
| R.A. Edwards III |
86,000 | 85,000 | 625 | 124,987 | 296,612 | |||||||||||||||
| Jerry B. Farley |
86,000 | 85,000 | — | 41,214 | 212,241 | |||||||||||||||
| Richard L. Hawley |
98,000 | 85,000 | — | — | 183,000 | |||||||||||||||
| B. Anthony Isaac |
91,500 | 85,000 | — | — | 176,500 | |||||||||||||||
| Sandra A.J. Lawrence |
91,500 | 85,000 | 3,120 | 71,521 | 251,141 | |||||||||||||||
| S. Carl Soderstrom, Jr. |
86,000 | 85,000 | — | — | 171,000 | |||||||||||||||
| (1) | Amounts include annual retainers, paid quarterly. In 2016, we paid our non-employee directors an annual retainer of $70,000, except the chairman of the board who received an annual retainer of $110,000. Committee chairs received an additional annual retainer of $20,000 for the audit committee chair, $16,500 for the compensation committee chair and $13,500 for the chairs of the finance and nominating and corporate governance committees. Members of committees receive an additional retainer of $10,000 for audit committee members, $8,000 for compensation committee members and $6,000 for members of the finance and nominating and corporate governance committees. |
| (2) | On January 4, 2016, each outside director other than Mr. Chandler received 1,994 shares of our common stock with a grant date fair value of $84,989 and Mr. Chandler, as chairman of the board, received 3,402 shares with a grant date fair value of $145,001. Pursuant to Financial Accounting Standards Board Codification Topic 718, we determined the grant date fair values referred to above by multiplying the number of shares by the closing stock price of our common stock on the grant date. The number of shares received by Mr. Chandler and each of the other outside directors was based on stock award values of $145,000 and $85,000, respectively, and a methodology for determining the fair value per share that is slightly different from the methodology required for disclosure in the table above. |
| (3) | Amounts in this column reflect interest actually accrued on deferred cash compensation less the interest that would have accrued at 120% of the applicable long-term federal interest rate. Interest on deferred cash compensation accrues at a rate of 1% above the Prime Rate and compounds quarterly. “Prime Rate” is defined as the prime rate of interest in effect on the first business day of the applicable calendar year as such rate is reported by the Wall Street Journal. See “Election to Defer Compensation” below. |
| (4) | This column is comprised of the following components: |
| • | Dividends on deferred compensation paid in shares of our common stock and on deferred stock. |
| • | Interest on the aggregate of all compensation deferred in cash calculated at 120% of the applicable long-term federal interest rate. |
| • | Charitable contribution matching. |
32
Table of Contents
Dividends on deferred compensation paid in shares of stock and on deferred stock are credited to the director as if they had been reinvested in shares of our common stock at a share price equal to the average of the daily high and low prices of our common stock as reported on the New York Stock Exchange for the three trading days immediately preceding the day the dividend is credited. The directors credited with dividend equivalents were Ms. Carter ($49,111), Mr. Chandler ($106,429), Mr. Edwards ($56,688), Mr. Farley ($40,241) and Ms. Lawrence ($45,216). The directors credited with dividend equivalents on deferred compensation payable in stock were Ms. Carter ($53,793), Mr. Edwards ($67,392) and Ms. Lawrence ($21,771).
Interest on deferred cash compensation was accrued and credited in 2016 to Ms. Carter ($4,602), Mr. Chandler ($38,169), Mr. Edwards ($907) and Ms. Lawrence ($4,534).
Non-employee directors are eligible to participate in our matching gift program on the same terms as our employees. Under this program, we will match on a dollar-for-dollar basis charitable contributions to Kansas colleges and universities made by directors, employees and their spouses up to $1,000 per household each year. In 2016, Mr. Farley participated in our matching gift program.
Election to Be Paid in Stock
A non-employee director may elect to have all or a portion of any cash fees paid in stock rather than cash in accordance with our Long Term Incentive and Share Award Plan. If a director elects to receive retainers and attendance fees in shares of our common stock, the number of shares to be distributed to a director in lieu of cash compensation is determined by dividing the elected dollar amount of cash compensation by the average of our high and low common stock price on the last day of the immediately preceding quarter (or, if such day was not a trading day, on the next preceding day the shares were traded) as reported on the New York Stock Exchange Composite Listing.
Election to Defer Compensation
A non-employee director may elect to defer payment of cash fees or stock in accordance with the provisions of our Non-Employee Director Deferred Compensation Plan. If a director elects to receive retainers and attendance fees in shares of our common stock, and defers receipt of such shares, dividends earned on such deferred shares are reflected under the column “All Other Compensation.”
Limitation on Compensation
In 2016, our shareholders approved an amendment to our Long Term Incentive and Share Award Plan to add a limit to the value of equity that non-employee directors may be granted each year to five times the value of the current annual equity grant. Based on the value of grants commencing in 2016, the annual grant limits for our non-executive chairman of the board is $725,000 and for other non-executive directors is $425,000.
Reimbursements
We reimburse directors for travel and other out-of-pocket expenses incurred by them that are incidental to attending meetings. We also reimburse directors for reasonable expenses relating to ongoing director education. In addition, we provide liability insurance to our directors under our directors and officers insurance policies.
Compensation Committee Interlocks and Insider Participation
None of the Compensation Committee members has ever been an officer or employee of the Company, is or was a participant in a reportable “related person” transaction in 2016 or is an executive officer of another entity at which one of our executive officers serves on the board of directors. Please see Item 13 for a description of our policy on related person transactions.
33
Table of Contents
ITEM 12. SECURITY OWNERSHIP OF CERTAIN BENEFICIAL OWNERS AND MANAGEMENT AND RELATED STOCKHOLDER MATTERS.
Security Ownership of Certain Beneficial Owners
The following table sets forth certain information regarding beneficial ownership of our common stock on April 28, 2017 by each person who is known by us to own beneficially more than 5% of the outstanding shares of common stock.
| Title of Class |
Name and Address of Beneficial Owner |
Amount and Nature of Beneficial Ownership |
Percent of Class (1) | |||
| Common Stock | BlackRock, Inc. (2) 55 East 52nd Street New York, NY 10055 |
12,936,388 | 9.10% | |||
| Common Stock | The Vanguard Group (3) 100 Vanguard Blvd. Malvern, PA 19355 |
11,805,736 | 8.31% |
| (1) | Based on the number of shares of our common stock outstanding on April 28, 2017. |
| (2) | As reported in a Schedule 13G/A filed with the SEC on January 27, 2017 by BlackRock, Inc., BlackRock (Luxembourg) S.A., BlackRock (Netherlands) B.V., BlackRock (Singapore) Limited, BlackRock Advisors (UK) Limited, BlackRock Advisors, LLC, BlackRock Asset Management Canada Limited, BlackRock Asset Management Ireland Limited, BlackRock Asset Management Schweiz AG, BlackRock Financial Management, Inc., BlackRock Fund Advisors, BlackRock Institutional Trust Company, N.A., BlackRock International Limited, BlackRock Investment Management (Australia) Limited, BlackRock Investment Management (UK) Ltd, BlackRock Investment Management, LLC, BlackRock Japan Co. Ltd., and BlackRock Life Limited. |
| (3) | As reported in a Schedule 13G/A filed with the SEC on February 10, 2017 by The Vanguard Group, Vanguard Fiduciary Trust Company, and Vanguard Investments Australia, Ltd. |
34
Table of Contents
Security Ownership of Management
The following information relating to the ownership of shares of our common stock is furnished with respect to each of our current directors and named executive officers individually, and with respect to our current directors and executive officers as a group, as of April 28, 2017.
| Shares Beneficially Owned (1) |
Percent of Class |
Restricted Share Units (2) |
Total | |||||||||||||
| Outside Directors |
||||||||||||||||
| Mollie H. Carter |
76,571 | * | — | 76,571 | ||||||||||||
| Charles Q. Chandler IV |
90,835 | (3) | * | — | 90,835 | |||||||||||
| R.A. Edwards III |
108,032 | (4) | * | — | 108,032 | |||||||||||
| Jerry B. Farley |
33,488 | (5) | * | — | 33,488 | |||||||||||
| Richard L. Hawley |
15,516 | (6) | * | — | 15,516 | |||||||||||
| B. Anthony Isaac |
28,353 | * | — | 28,353 | ||||||||||||
| Sandra A.J. Lawrence |
49,351 | * | — | 49,351 | ||||||||||||
| S. Carl Soderstrom, Jr. |
13,863 | * | — | 13,863 | ||||||||||||
| Management |
||||||||||||||||
| Mark A. Ruelle |
159,936 | (7) | * | 80,975 | 240,911 | |||||||||||
| Greg A. Greenwood |
39,583 | * | 25,410 | 64,993 | ||||||||||||
| Anthony D. Somma |
43,744 | * | 24,830 | 68,574 | ||||||||||||
| Larry D. Irick |
72,122 | * | 16,575 | 88,697 | ||||||||||||
| Bruce A. Akin |
35,771 | (8) | * | 10,505 | 46,276 | |||||||||||
| All directors and executive officers as a group (16 individuals) |
838,581 | (9) | * | 184,820 | (10) | 1,023,401 | (9)(10) | |||||||||
| * | Represents less than 1% of our outstanding common stock. |
| (1) | Includes beneficially owned shares held in our 401(k) Plan, shares deferred under our Long Term Incentive and Share Award Plan in a stock-for-compensation program that was discontinued in 2001 and shares deferred under our Non-Employee Director Deferred Compensation Plan. |
| (2) | While not required to be reported, we include unvested time-based restricted share units held by executive officers because we believe this demonstrates how the interests of our executive officers and shareholders are aligned. |
| (3) | Includes 5,767 shares of our common stock that are held in a parental trust of which Mr. Chandler is a co-trustee. |
| (4) | Includes 3,467 shares of our common stock that are held by Mr. Edwards’ spouse. These shares are not subject to Mr. Edwards’ voting or investment power. |
| (5) | Includes 5,517 shares held in joint tenancy with Mr. Farley’s spouse. |
| (6) | Includes 4,223 shares held in joint tenancy with Mr. Hawley’s spouse. |
| (7) | Includes 18,317 shares held in a trust in the name of Mr. Ruelle’s spouse, of which Mr. Ruelle is the beneficiary. |
| (8) | Includes 25 shares held by Mr. Akin’s daughter. |
| (9) | Includes 71,416 shares of our common stock held by three other executive officers and shares referred to in items (3) through (8) above. |
| (10) | Includes 26,525 unvested time-based restricted share units held by three other executive officers. |
35
Table of Contents
Securities Authorized for Issuance Under Compensation Plans
The following table summarizes, as of December 31, 2016, the total shares of our common stock that may be received by holders of restricted share units and options upon the vesting of restricted share units and the exercise of currently outstanding options, the weighted average exercise price of those outstanding options and the number of shares of our common stock that are still available for future issuance under our equity compensation plans after considering the restricted share units and stock options currently outstanding.
| Plan Category |
Number of Shares To Be Issued Upon Exercise of Outstanding Options, Warrants And Rights (#)(1) |
Number of Shares Remaining and Available for Future Issuance (#) |
||||||
| Long Term Incentive and Share Award Plan (the only equity compensation plan approved by our shareholders) |
1,254,364 | 3,028,080 | ||||||
| Any equity compensation plans not approved by our shareholders |
— | — | ||||||
| Total |
1,254,364 | 3,028,080 | ||||||
| (1) | Includes shares issuable with respect to time-based and performance-based restricted share units, reinvested dividend equivalents, deferred restricted share unit grants, stock for compensation share units, director stock awards and deferred director retainer and meeting fees payable in stock. |
| ITEM 13. | CERTAIN RELATIONSHIPS AND RELATED TRANSACTIONS, AND DIRECTOR INDEPENDENCE |
Director Independence. The board of directors has adopted Corporate Governance Guidelines, which provide a framework for our corporate governance initiatives and cover topics including, but not limited to, board and committee composition, director compensation and director qualifications. The Nominating and Corporate Governance Committee is responsible for overseeing and reviewing the Corporate Governance Guidelines and reporting and recommending to the board of directors any changes to the Corporate Governance Guidelines. Our Corporate Governance Guidelines are available from our Corporate Secretary and on our Internet website at www.westarenergy.com. The information contained on our Internet website is not part of, or incorporated by reference into, this document.
Our Corporate Governance Guidelines require that a majority of the board of directors must meet the independence standards established by the NYSE. The board of directors has determined that each member of the board of directors, except Mr. Ruelle, is independent.
In making that determination, the board of directors applied the independence standards established by the NYSE and, if applicable, the following categorical standards. These categorical standards are included in our Corporate Governance Guidelines and are based on the independence standards established by the NYSE. In addition, the board of directors considered any other relevant facts and circumstances.
Any director who meets the following criteria is presumed to be independent (except for purposes of service on certain of the committees of the board of directors, as described below) absent an affirmative determination to the contrary by the Nominating and Corporate Governance Committee:
36
Table of Contents
| • | A director who serves as an executive officer or employee of, or beneficially owns more than a 10% equity interest in, any corporation, partnership or other business entity that during the most recently completed fiscal year made payments to us or received payments from us for goods and services that were less than the greater of 2% of the other entity’s gross consolidated revenues for the fiscal year and $1 million. |
| • | A director who serves as an executive officer or employee of, or beneficially owns more than a 10% equity interest in, any bank, corporation, partnership or other business entity to which we were indebted at the end of its most recently completed fiscal year in an amount less than the greater of 2% of the other entity’s total consolidated assets at the end of the fiscal year and $1 million. |
| • | A director who is a member or employee of a law firm that has provided services to us during the most recently completed fiscal year if the total billings for such services were less than the greater of 2% of the law firm’s gross revenues for the fiscal year and $1 million. |
| • | A director who is a partner, executive officer or employee of any investment banking firm that has performed services for us (other than as a participating underwriter in a syndicate) during the most recently completed fiscal year if the total compensation received for such services was less than the greater of 2% of the investment banking firm’s consolidated gross revenues for such fiscal year and $1 million. |
Certain Relationships with Directors. In determining that each of the members of our board of directors other than Mr. Ruelle is independent, the board considered and determined that the relationships described below are not material and do not cause the directors to fail to satisfy the standards for independence established by the NYSE. Mr. Chandler holds positions as a director and officer of INTRUST Bank, which has issued letters of credit related to the workers’ compensation program for the Wolf Creek nuclear power plant in which we have a 47% ownership interest. In addition, Dr. Farley and Mr. Ruelle serve on the Board of Directors of GO Topeka Economic Partnership, a civic organization that promotes economic growth in greater Topeka.
Policies and Procedures for Approval of Related Person Transactions. In February 2007, our board of directors formally adopted a policy with respect to related person transactions to document procedures where such transactions are reviewed, approved or ratified. The policy applies to any transaction in which the Company is a participant and any related person has a direct or indirect material interest and the amount involved exceeds $120,000. The Nominating and Corporate Governance Committee is responsible for reviewing, approving and ratifying any related person transaction. The Nominating and Corporate Governance Committee intends to approve only those related person transactions that are in, or are not inconsistent with, the best interests of the Company and its shareholders. There were no related person transactions in 2016.
37
Table of Contents
| ITEM 14. | PRINCIPAL ACCOUNTANT FEES AND SERVICES |
Deloitte & Touche LLP has acted as our independent registered public accounting firm since 2002. The aggregate fees, including expenses, of Deloitte & Touche LLP, the member firms of Deloitte Touche Tohmatsu, and their respective affiliates for the years ended December 31, 2016 and 2015 are as follows:
| 2016 | 2015 | |||||||
| Audit fees (1) |
$ | 2,215,000 | $ | 2,047,835 | ||||
| Audit-related fees (2) |
48,500 | 63,500 | ||||||
|
|
|
|
|
|||||
| Total fees (3) |
2,263,500 | 2,111,335 | ||||||
|
|
|
|
|
|||||
| (1) | Audit fees relate to audits of our annual consolidated financial statements, our subsidiary’s annual financial statements, our internal control over financial reporting and our statutory or regulatory filings or engagements. They also include reviews of our quarterly financial statements and services related to filings made with the SEC, including comfort letters and consents, and accounting research in support of the foregoing activities. |
| (2) | Audit-related fees relate to consultations associated with accounting and regulatory updates and the audit of the financial statements of employee benefit plans. |
| (3) | All audit and non-audit services were pre-approved by the Audit Committee or the Audit Committee’s chairman pursuant to authority delegated by the Audit Committee. Deloitte & Touche LLP did not provide any tax-related or other services to us in 2015 or 2016. |
Audit Committee Pre-Approval Policies and Procedures
The Audit Committee charter provides that the Audit Committee will pre-approve audit services and non-audit services to be provided by our independent registered public accounting firm before the firm is engaged to render these services. The Audit Committee may consult with management in making its decision, but may not delegate this authority to management. The Audit Committee may delegate its authority to pre-approve services to one or more committee members, provided that the persons designated present the pre-approvals to the full committee at the next committee meeting.
The Audit Committee maintains an Audit and Non-Audit Services Pre-Approval Policy (the “Pre-Approval Policy”). The Pre-Approval Policy authorizes the chairman of the Audit Committee to pre-approve the retention of the independent registered public accounting firm for audit-related and permitted non-audit services not contemplated by the engagement letter for the annual audit, provided that: (a) these services are approved no more than thirty days in advance of the independent registered public accounting firm commencing work; (b) the fees to be paid to the independent registered public accounting firm for services related to any single engagement do not exceed $50,000; and (c) the chairman advises the Audit Committee of the pre-approval of the services at the next meeting of the Audit Committee following the approval.
38
Table of Contents
| ITEM 15. | EXHIBITS AND FINANCIAL STATEMENT SCHEDULES |
EXHIBIT INDEX
All exhibits marked “I” are incorporated herein by reference. All exhibits marked with “*” are management contracts or compensatory plans or arrangements required to be identified by Item 15(a)(3) of Form 10-K. All exhibits marked “#” were filed on February 22, 2017 with the Form 10-K to which this Form 10-K/A relates. All exhibits market “##” are filed with this Form 10-K/A.
| Description | ||||||
| 2 | Agreement and Plan of Merger, dated as of May 29, 2016, by and among Westar Energy, Inc., Great Plains Energy Incorporated and a subsidiary of Great Plains Energy Incorporated (filed as Exhibit 2.1 to the Form 8-K filed on May 31, 2016) | I | ||||
| 3(a) | By-laws of Westar Energy, Inc., as amended April 28, 2004 (filed as Exhibit 3(a) to the Form 10-Q for the period ended June 30, 2004 filed on August 4, 2004) | I | ||||
| 3(b) | Restated Articles of Incorporation of Westar Energy, Inc., as amended through May 25, 1988 (filed as Exhibit 4 to the Form S-8 Registration Statement, SEC File No. 33-23022 filed on July 15, 1988) | I | ||||
| 3(c) | Certificate of Amendment to Restated Articles of Incorporation of Westar Energy, Inc. (filed as Exhibit 3 to the Form 10-K405 for the period ended December 31, 1998 filed on April 14, 1999) | I | ||||
| 3(d) | Certificate of Correction to Restated Articles of Incorporation of Westar Energy, Inc. (filed as Exhibit 3(b) to the Form 10-K for the period ended December 31, 1991 filed on March 30, 1992) | I | ||||
| 3(e) | Certificate of Amendment to Restated Articles of Incorporation of Westar Energy, Inc. (filed as Exhibit 3(c) to the Form 10-K for the period ended December 31, 1994 filed on March 30, 1995) | I | ||||
| 3(f) | Certificate of Amendment to Restated Articles of Incorporation of Westar Energy, Inc. (filed as Exhibit 3 to the Form 10-Q for the period ended June 30, 1994 filed on August 11, 1994) | I | ||||
| 3(g) | Certificate of Amendment to Restated Articles of Incorporation of Westar Energy, Inc. (filed as Exhibit 3(a) to the Form 10-Q for the period ended June 30, 1996 filed on August 14, 1996) | I | ||||
| 3(h) | Certificate of Amendment to Restated Articles of Incorporation of Westar Energy, Inc. (filed as Exhibit 3 to the Form 10-Q for the period ended March 31, 1998 filed on May 12, 1998) | I | ||||
| 3(i) | Certificate of Amendment to Restated Articles of Incorporation of Westar Energy, Inc. (filed as Exhibit 3(l) to the Form 10-K for the period ended December 31, 2002 filed on April 11, 2003) | I | ||||
| 3(j) | Certificate of Amendment to Restated Articles of Incorporation of Westar Energy, Inc. (filed as Exhibit 3(m) to the Form 10-K for the period ended December 31, 2002 filed on April 11, 2003) | I | ||||
| 3(k) | Certificate of Amendment to Restated Articles of Incorporation of Westar Energy, Inc. (filed as Exhibit 3(m) to the Form S-3 Registration Statement No. 333-125828 filed on June 15, 2005) | I | ||||
| 3(l) | Certificate of Amendment to Restated Articles of Incorporation of Westar Energy, Inc. (filed as Exhibit 3(m) to the Form 10-K for the period ended December 31, 2011 filed on February 23, 2012) | I | ||||
| 4(a) | Mortgage and Deed of Trust dated July 1, 1939 between Westar Energy, Inc. and Harris Trust and Savings Bank, Trustee (filed as Exhibit 4(a) to Registration Statement No. 33-21739) | I | ||||
39
Table of Contents
| Description | ||||||
| 4(b) | First and Second Supplemental Indentures dated July 1, 1939 and April 1, 1949, respectively (filed as Exhibit 4(b) to Registration Statement No. 33-21739) | I | ||||
| 4(c) | Sixth Supplemental Indenture dated October 4, 1951 (filed as Exhibit 4(b) to Registration Statement No. 33-21739) | I | ||||
| 4(d) | Fourteenth Supplemental Indenture dated May 1, 1976 (filed as Exhibit 4(b) to Registration Statement No. 33-21739) | I | ||||
| 4(e) | Twenty-Eighth Supplemental Indenture dated July 1, 1992 (filed as Exhibit 4(o) to the Form 10-K for the period ended December 31, 1992 filed on March 30, 1993) | I | ||||
| 4(f) | Thirty-Second Supplemental Indenture dated April 15, 1994 (filed as Exhibit 4(s) to the Form 10-K for the period ended December 31, 1994 filed on March 30, 1995) | I | ||||
| 4(g) | Senior Indenture dated August 1, 1998 (filed as Exhibit 4.1 to the Form 10-Q for the period ended June 30, 1998 filed on August 12, 1998) | I | ||||
| 4(h) | Form of Senior Note (included in Exhibit 4(g)) | I | ||||
| 4(i) | Thirty-Fourth Supplemental Indenture dated June 28, 2000 (filed as Exhibit 4(v) to the Form 10-K for the period ended December 31, 2000 filed on April 2, 2001) | I | ||||
| 4(j) | Thirty-Sixth Supplemental Indenture dated as of June 1, 2004, between Westar Energy, Inc. and BNY Midwest Trust Company (as successor to Harris Trust and Savings Bank), to its Mortgage and Deed of Trust dated July 1, 1939 (filed as Exhibit 4.1 to the Form 8-K filed on January 18, 2005) | I | ||||
| 4(k) | Thirty-Eighth Supplemental Indenture, dated as of January 18, 2005, between Westar Energy, Inc. and BNY Midwest Trust Company (as successor to Harris Trust and Savings Bank), to its Mortgage and Deed of Trust dated July 1, 1939 (filed as Exhibit 4.3 to the Form 8-K filed on January 18, 2005) | I | ||||
| 4(l) | Thirty-Ninth Supplemental Indenture dated June 30, 2005 between Westar Energy, Inc. and BNY Midwest Trust Company (as successor to Harris Trust and Savings Bank) to its Mortgage and Deed of Trust dated July 1, 1939 (filed as Exhibit 4.1 to the Form 8-K filed on July 1, 2005) | I | ||||
| 4(m) | Form of Forty-Second Supplemental Indenture, dated as of March 1, 2012 by and among Westar Energy, Inc., The Bank of New York Mellon Trust Company, N.A. and Judith L. Bartolini (filed as Exhibit 4.1 to the Form 8-K filed on February 29, 2012) | I | ||||
| 4(n) | Form of Forty-Second Supplemental (Reopening) Indenture, dated as of May 17, 2012 by and among Westar Energy, Inc., The Bank of New York Mellon Trust Company, N.A. and Judith L. Bartolini (filed as Exhibit 4.1 to the Form 8-K filed on May 16, 2012) | I | ||||
| 4(o) | Form of Forty-Third Supplemental Indenture, dated as of March 28, 2013, by and among Westar Energy, Inc. and The Bank of New York Mellon Trust Company, N.A., as successor trustee to Harr Trust and Savings Bank (filed as Exhibit 4.1 to the Form 8-K filed on March 22, 2013) | I | ||||
| 4(p) | Form of Forty-Fourth Supplemental Indenture, dated as of August 19, 2013, by and among Westar Energy, Inc. and The Bank of New York Mellon Trust Company, N.A., as successor trustee to Harris Trust and Savings Bank (filed as Exhibit 4.1 to the Form 8-K filed on August 14, 2013) | I | ||||
| 4(q) | Form of Forty-Fifth Supplemental Indenture, dated as of November 13, 2015, by and among Westar Energy, Inc. and The Bank of New York Mellon Trust Company, N.A., as successor to Harris Trust and Savings Bank (filed as Exhibit 4.1 to the Form 8-K filed on November 6, 2015) | I | ||||
40
Table of Contents
| Description | ||||||
| 4(r) | Form of Forty-Sixth Supplemental Indenture, dated as of June 20, 2016, by and among Westar Energy, Inc. and The Bank of New York Mellon Trust Company, N.A., as successor to Harris Trust and Savings Bank (filed as Exhibit 4.1 to the Form 8-K filed on June 17, 2016) | I | ||||
| Instruments defining the rights of holders of other long-term debt not required to be filed as Exhibits will be furnished to the Commission upon request. | ||||||
| 10(a) | Executive Salary Continuation Plan of Western Resources, Inc., as revised, effective September 22, 1995 (filed as Exhibit 10(j) to the Form 10-K for the period ended December 31, 1995 filed on March 27, 1996)* | I | ||||
| 10(b) | Amended and Restated Long-Term Incentive and Share Award Plan (filed as Exhibit 10 to the Form 8-K filed on May 6, 2011)* | I | ||||
| 10(c) | Amended and Restated Long-Term Incentive and Share Award Plan, effective January 1, 2016 (filed as Appendix B to the Proxy Statement filed on April 1, 2016)* | I | ||||
| 10(d) | Westar Energy, Inc. Form of Restricted Share Units Award (Grant Dates Prior to February 22, 2017) (filed as Exhibit 10(f) to the Form 10-K for the period ended December 31, 2014 filed on February 25, 2015)* | I | ||||
| 10(e) | Westar Energy, Inc. Form of Performance Based Restricted Share Units Award (Grant Dates Prior to February 22, 2017) (filed as Exhibit 10(g) to the Form 10-K for the period ended December 31, 2014 filed on February 25, 2015)* | I | ||||
| 10(f) | Westar Energy, Inc. Form of Restricted Share Units Award (Grant Dates February 22, 2017 Forward)* | # | ||||
| 10(g) | Westar Energy, Inc. Form of Performance Based Restricted Share Units Award (Grant Dates February 22, 2017 Forward)* | # | ||||
| 10(h) | Westar Energy, Inc. Non-Employee Director Deferred Compensation Plan, as amended and restated, dated as of October 20, 2004 (filed as Exhibit 10.1 to the Form 8-K filed on October 21, 2004)* | I | ||||
| 10(i) | Summary of Westar Energy, Inc. Non-Employee Director Compensation (filed as Exhibit 10(f) to the Form 10-K for the period ended December 31, 2015 filed on February 24, 2016)* | I | ||||
| 10(j) | Form of Amended and Restated Change in Control Agreement with Officers of Westar Energy, Inc. (filed as Exhibit 10(g) to the Form 10-K for the period ended December 31, 2015 filed on February 24, 2016)* | I | ||||
| 10(k) | Westar Energy, Inc. Retirement Benefit Restoration Plan (filed as Exhibit 10.1 to the Form 8-K filed on April 2, 2010)* | I | ||||
| 10(l) | Westar Energy, Inc. 401(k) Benefit Restoration Plan (filed as Exhibit 10(l) to the Form 10-K for the period ended December 31, 2014 filed on February 25, 2015)* | I | ||||
| 10(m) | Credit Agreement dated as of February 18, 2011, among Westar Energy, Inc. and several banks and other financial institutions or entities from time to time parties to the Agreement (filed as Exhibit 10.1 to the Form 8-K filed on February 22, 2011) | I | ||||
| 10(n) | First Extension Agreement dated as of February 12, 2013, among Westar Energy, Inc. and several banks and other financial institutions party thereto (filed as Exhibit 10.1 to the Form 8-K filed on February 15, 2013) | I | ||||
| 10(o) | Second Extension Agreement dated as of February 14, 2014, among Westar Energy, Inc. and several banks and other financial institutions or entities from time to time parties to the Agreement (filed as Exhibit 10(v) to the Form 10-K for the period ended December 31, 2013 filed on February 26, 2014) | I | ||||
| 10(p) | First Amendment to Credit Agreement and Lender Joinder Agreement, dated December 19, 2016, by and among Westar Energy, Inc. and the several banks and other financial institutions or entities from time to time parties thereto (filed as Exhibit 10.1 to the Form 8-K filed on December 20, 2016) | I | ||||
41
Table of Contents
| Description | ||||||
| 10(q) | Fourth Amended and Restated Credit Agreement dated as of September 29, 2011, among Westar Energy, Inc. and several banks and other financial institutions or entities from time to time parties to the Agreement (filed as Exhibit 10.1 to the Form 8-K filed on September 29, 2011) | I | ||||
| 10(r) | First Extension Agreement dated as of July 19, 2013, among Westar Energy, Inc. and several banks and other financial institutions or entities from time to time parties to the Agreement (filed as Exhibit 10(a) to the Form 10-Q for the period ended September 30, 2014 filed on November 5, 2014) | I | ||||
| 10(s) | Second Extension Agreement dated as of September 18, 2014, among Westar Energy, Inc. and several banks and other financial institutions or entities from time to time parties to the Agreement (filed as Exhibit 10(b) to the Form 10-Q for the period ended September 30, 2014 filed on November 5, 2014) | I | ||||
| 10(t) | Third Extension Agreement dated as of September 17, 2015, among Westar Energy, Inc. and several banks and other financial institutions or entities from time to time parties to the Agreement (filed as Exhibit 10 to the Form 10-Q for the period ended September 30, 2015 filed on November 3, 2015) | I | ||||
| 10(u) | Amendment Agreement, dated December 19, 2016, by and among Westar Energy, Inc. and the several banks and other financial institutions or entities from time to time parties thereto (filed as Exhibit 10.2 to the Form 8-K filed on December 20, 2016) | I | ||||
| 12 | Computations of Ratio of Consolidated Earnings to Fixed Charges | # | ||||
| 21 | Subsidiaries of the Registrant | # | ||||
| 23 | Consent of Independent Registered Public Accounting Firm, Deloitte & Touche LLP | # | ||||
| 31(a) | Certification of Principal Executive Officer pursuant to Section 302 of the Sarbanes-Oxley Act of 2002 | # | ||||
| 31(b) | Certification of Principal Financial Officer pursuant to Section 302 of the Sarbanes-Oxley Act of 2002 | # | ||||
| 31(c) | Certification of Principal Executive Officer pursuant to Section 302 of the Sarbanes-Oxley Act of 2002 | ## | ||||
| 31(d) | Certification of Principal Financial Officer pursuant to Section 302 of the Sarbanes-Oxley Act of 2002 | ## | ||||
| 32 | Certifications pursuant to Section 906 of the Sarbanes-Oxley Act of 2002 (furnished and not to be considered filed as part of the Form 10-K) | # | ||||
| 101.INS | XBRL Instance Document | # | ||||
| 101.SCH | XBRL Taxonomy Extension Schema Document | # | ||||
| 101.CAL | XBRL Taxonomy Extension Calculation Linkbase Document | # | ||||
| 101.DEF | XBRL Taxonomy Extension Definition Linkbase Document | # | ||||
| 101.LAB | XBRL Taxonomy Extension Label Linkbase Document | # | ||||
| 101.PRE | XBRL Taxonomy Extension Presentation Linkbase Document | # | ||||
42
Table of Contents
Pursuant to the requirements of Sections 13 or 15(d) of the Securities Exchange Act of 1934, the registrant has duly caused this report to be signed on its behalf by the undersigned, thereunto duly authorized.
| WESTAR ENERGY, INC. | ||||||
| Date: April 28, 2017 |
By: | /s/ ANTHONY D. SOMMA | ||||
|
| ||||||
| Anthony D. Somma | ||||||
| Senior Vice President, Chief Financial Officer and Treasurer | ||||||
43