Attached files
| file | filename |
|---|---|
| EX-99.2 - SUPPLEMENTAL FINANCIAL INFORMATION FOR THE QUARTER ENDED MAR 31, 2017 - FULTON FINANCIAL CORP | exhibit9923-31x17.htm |
| EX-99.1 - PRESS RELEASE DATED APRIL 18, 2017 - FULTON FINANCIAL CORP | exhibit9913-31x17.htm |
| 8-K - 8-K - FULTON FINANCIAL CORP | a8-k3x31x17.htm |
D A T A A S O F M A R C H 3 1 , 2 0 1 7
U N L E S S O T H E R W I S E N O T E D
2017 FIRST QUARTER RESULTS
NASDAQ: FULT
FORWARD-LOOKING STATEMENTS
This presentation may contain forward-looking statements with respect to Fulton Financial Corporation’s financial
condition, results of operations and business. Do not unduly rely on forward-looking statements. Forward-looking
statements can be identified by the use of words such as “may,” “should,” “will,” “could,” “estimates,” “predicts,”
“potential,” “continue,” “anticipates,” “believes,” “plans,” “expects,” “future,” “intends” and similar expressions which
are intended to identify forward-looking statements. Management’s “2017 Outlook” contained herein is comprised of
forward-looking statements.
Forward-looking statements are not guarantees of future performance and are subject to risks and uncertainties, some
of which are beyond the Corporation’s control and ability to predict, that could cause actual results to differ materially
from those expressed in the forward-looking statements. The Corporation undertakes no obligation, other than as
required by law, to update or revise any forward-looking statements, whether as a result of new information, future
events or otherwise.
A discussion of certain risks and uncertainties affecting the Corporation, and some of the factors that could cause the
Corporation’s actual results to differ materially from those described in the forward-looking statements, can be found
in the sections entitled “Risk Factors” and “Management’s Discussion and Analysis of Financial Condition and Results of
Operations” in the Corporation’s Annual Report on Form 10-K for the year ended December 31, 2016, which has been
filed with the Securities and Exchange Commission and is available in the Investor Relations section of the Corporation’s
website (www.fult.com) and on the Securities and Exchange Commission’s website (www.sec.gov).
The Corporation uses certain non-GAAP financial measures in this presentation. These non-GAAP financial measures
are reconciled to the most comparable GAAP measures at the end of this presentation.
2
FIRST QUARTER HIGHLIGHTS
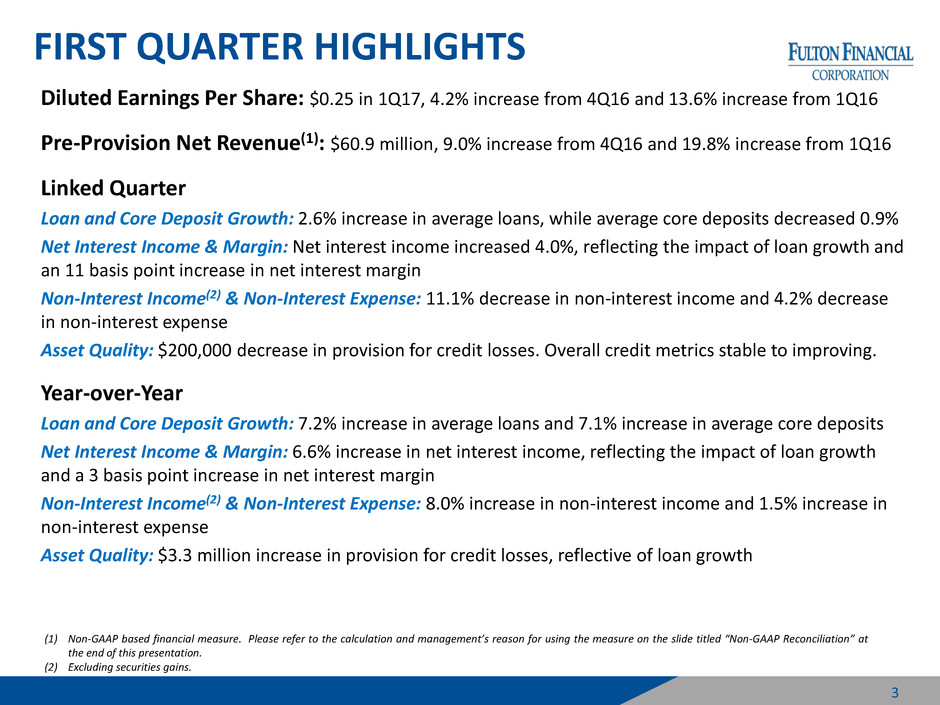
Diluted Earnings Per Share: $0.25 in 1Q17, 4.2% increase from 4Q16 and 13.6% increase from 1Q16
Pre-Provision Net Revenue(1): $60.9 million, 9.0% increase from 4Q16 and 19.8% increase from 1Q16
Linked Quarter
Loan and Core Deposit Growth: 2.6% increase in average loans, while average core deposits decreased 0.9%
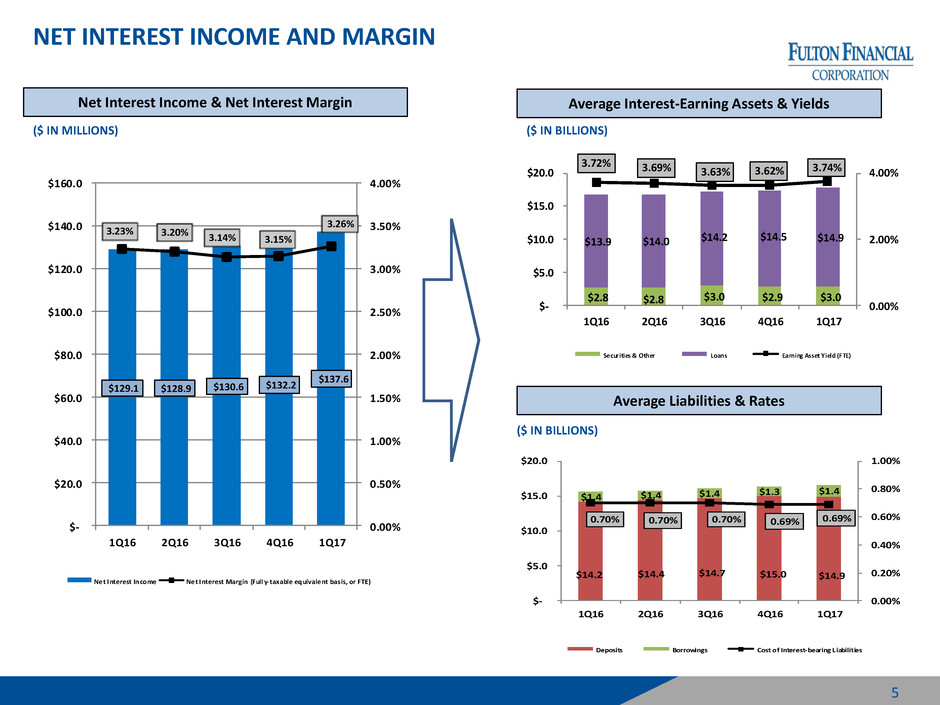
Net Interest Income & Margin: Net interest income increased 4.0%, reflecting the impact of loan growth and
an 11 basis point increase in net interest margin
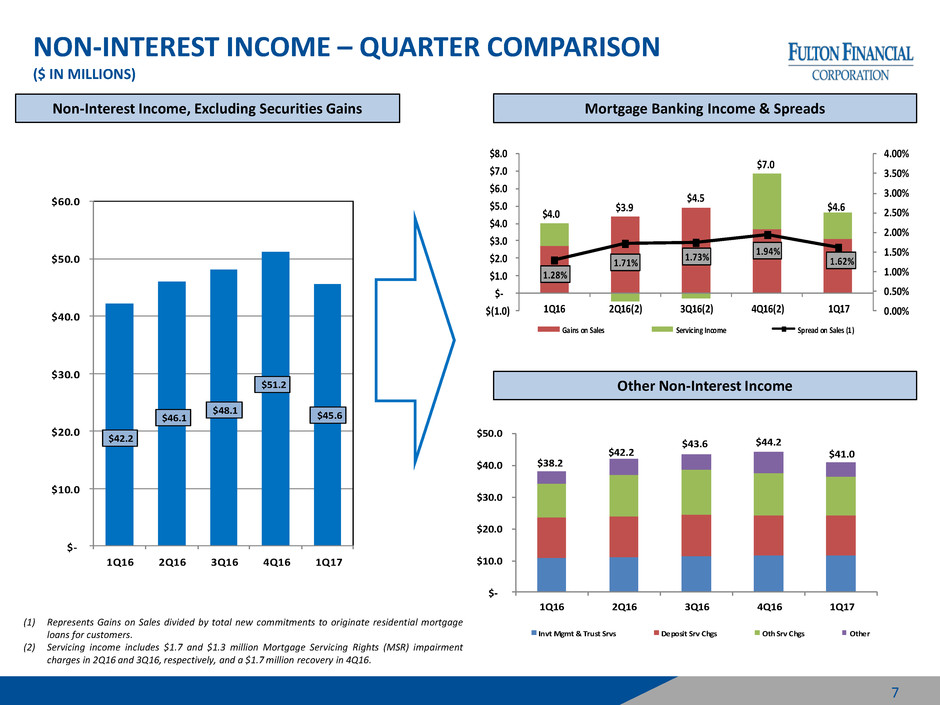
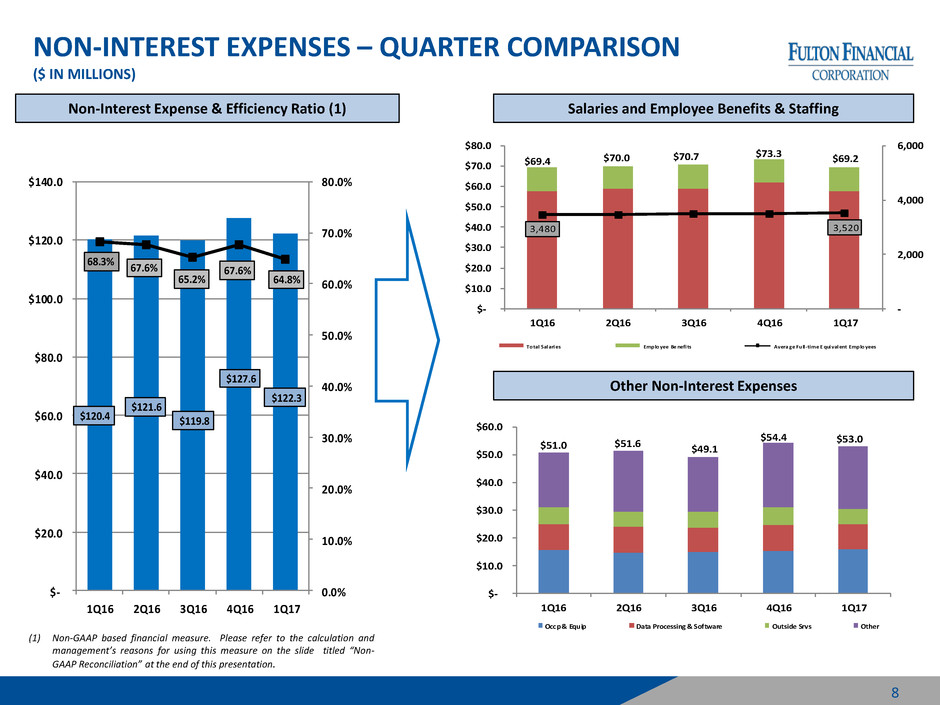
Non-Interest Income(2) & Non-Interest Expense: 11.1% decrease in non-interest income and 4.2% decrease
in non-interest expense
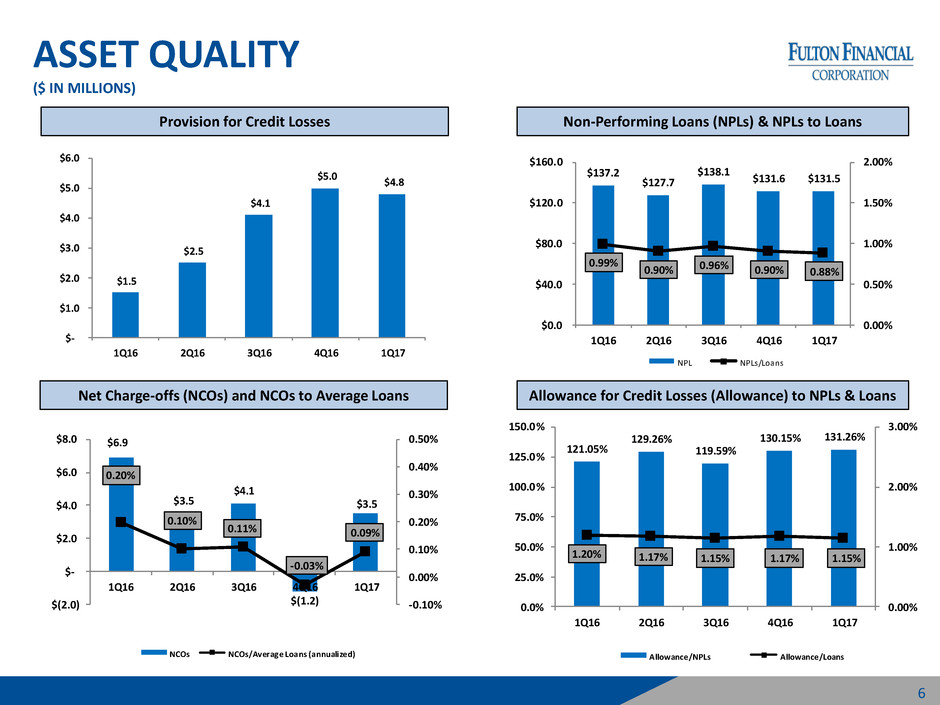
Asset Quality: $200,000 decrease in provision for credit losses. Overall credit metrics stable to improving.
Year-over-Year
Loan and Core Deposit Growth: 7.2% increase in average loans and 7.1% increase in average core deposits
Net Interest Income & Margin: 6.6% increase in net interest income, reflecting the impact of loan growth
and a 3 basis point increase in net interest margin
Non-Interest Income(2) & Non-Interest Expense: 8.0% increase in non-interest income and 1.5% increase in
non-interest expense
Asset Quality: $3.3 million increase in provision for credit losses, reflective of loan growth
3
(1) Non-GAAP based financial measure. Please refer to the calculation and management’s reason for using the measure on the slide titled “Non-GAAP Reconciliation” at
the end of this presentation.
(2) Excluding securities gains.
INCOME STATEMENT SUMMARY
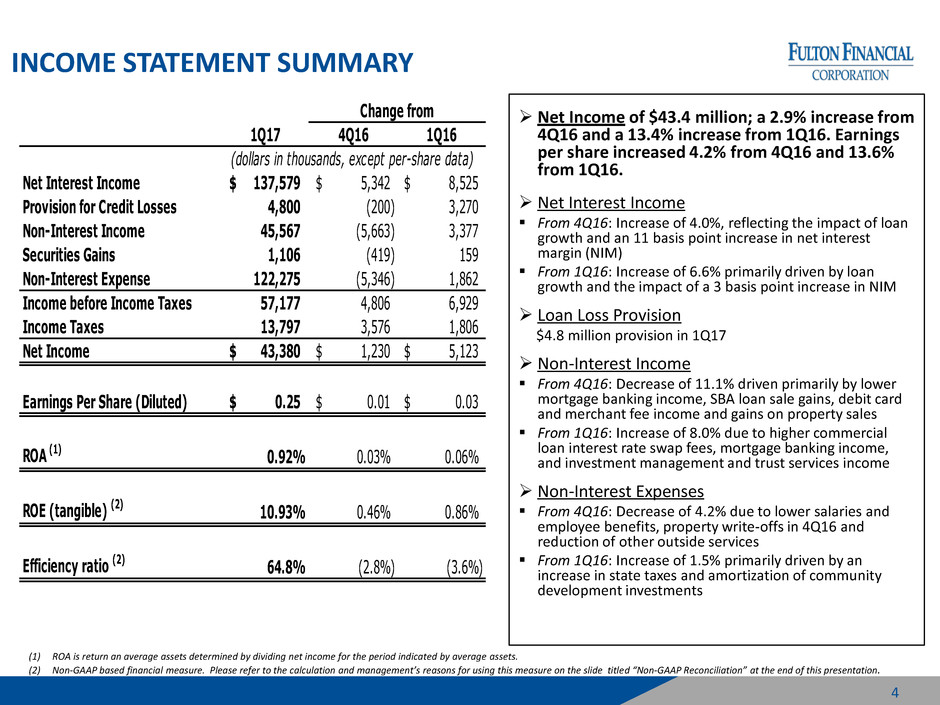
Net Income of $43.4 million; a 2.9% increase from
4Q16 and a 13.4% increase from 1Q16. Earnings
per share increased 4.2% from 4Q16 and 13.6%
from 1Q16.
Net Interest Income
From 4Q16: Increase of 4.0%, reflecting the impact of loan
growth and an 11 basis point increase in net interest
margin (NIM)
From 1Q16: Increase of 6.6% primarily driven by loan
growth and the impact of a 3 basis point increase in NIM
Loan Loss Provision
$4.8 million provision in 1Q17
Non-Interest Income
From 4Q16: Decrease of 11.1% driven primarily by lower
mortgage banking income, SBA loan sale gains, debit card
and merchant fee income and gains on property sales
From 1Q16: Increase of 8.0% due to higher commercial
loan interest rate swap fees, mortgage banking income,
and investment management and trust services income
Non-Interest Expenses
From 4Q16: Decrease of 4.2% due to lower salaries and
employee benefits, property write-offs in 4Q16 and
reduction of other outside services
From 1Q16: Increase of 1.5% primarily driven by an
increase in state taxes and amortization of community
development investments
4
(1) ROA is return an average assets determined by dividing net income for the period indicated by average assets.
(2) Non-GAAP based financial measure. Please refer to the calculation and management’s reasons for using this measure on the slide titled “Non-GAAP Reconciliation” at the end of this presentation.
1Q17 4Q16 1Q16
Net Interest Income 137,579$ 5,342$ 8,525$
Provision for Credit Losses 4,800 (200) 3,270
Non-Interest Income 45,567 (5,663) 3,377
Securities Gains 1,106 (419) 159
Non-Interest Expense 122,275 (5,346) 1,862
Income before Income Taxes 57,177 4,806 6,929
Income Taxes 13,797 3,576 1,806
Net Income 43,380$ 1,230$ 5,123$
Earnings Per Share (Diluted) 0.25$ 0.01$ 0.03$
ROA (1) 0.92% 0.03% 0.06%
ROE (tangible) (2) 10.93% 0.46% 0.86%
Efficiency ratio (2) 64.8% (2.8%) (3.6%)
(dollars in thousands, except per-share data)
Change from
NET INTEREST INCOME AND MARGIN
Net Interest Income & Net Interest Margin
~ $730
million
~ $610
million
$129.1 $128.9 $130.6 $132.2
$137.6
3.23% 3.20% 3.14% 3.15%
3.26%
0.00%
0.50%
1.00%
1.50%
2.00%
2.50%
3.00%
3.50%
4.00%
$-
$20.0
$40.0
$60.0
$80.0
$100.0
$120.0
$140.0
$160.0
1Q16 2Q16 3Q16 4Q16 1Q17
Ne t Interest Income Ne t Interest Margin (Full y-taxable equivale nt bas is, or FTE)
Average Interest-Earning Assets & Yields
Average Liabilities & Rates
$2.8 $2.8 $3.0 $2.9 $3.0
$13.9 $14.0 $14.2 $14.5 $14.9
3.72% 3.69% 3.63% 3.62% 3.74%
0.00%
2.00%
4.00%
$-
$5.0
$10.0
$15.0
$20.0
1Q16 2Q16 3Q16 4Q16 1Q17
Securities & Other Loans Earning Asset Yield (FTE)
$14.2 $14.4 $14.7 $15.0 $14.9
$1.4 $1.4 $1.4
$1.3 $1.4
0.70% 0.70% 0.70% 0.69% 0.69%
0.00%
0.20%
0.40%
0.60%
0.80%
1.00%
$-
$5.0
$10.0
$15.0
$20.0
1Q16 2Q16 3Q16 4Q16 1Q17
Deposits Borrowings Cost of Interest-bearing Liabilities
($ IN MILLIONS) ($ IN BILLIONS)
($ IN BILLIONS)
5
ASSET QUALITY
($ IN MILLIONS)
6
Provision for Credit Losses Non-Performing Loans (NPLs) & NPLs to Loans
121.05%
129.26%
119.59%
130.15% 131.26%
1.20% 1.17% 1.15% 1.17% 1.15%
0.00%
1.00%
2.00%
3.00%
0.0%
25.0%
50.0%
75.0%
100.0%
125.0%
150.0%
1Q16 2Q16 3Q16 4Q16 1Q17
Allowance/NPLs Allowance/Loans
Net Charge-offs (NCOs) and NCOs to Average Loans Allowance for Credit Losses (Allowance) to NPLs & Loans
$6.9
$3.5
$4.1
$(1.2)
$3.5
0.20%
0.10%
0.11%
-0.03%
0.09%
-0.10%
0.00%
0.10%
0.20%
0.30%
0.40%
0.50%
$(2.0)
$-
$2.0
$4.0
$6.0
$8.0
1Q16 2Q16 3Q16 4Q16 1Q17
NCOs NCOs/Average Loans (annualized)
$1.5
$2.5
$4.1
$5.0
$4.8
$-
$1.
$2.0
$3.0
$4.0
$5.0
$6.0
1Q16 2Q16 3Q16 4Q16 1Q17
$137.2
$127.7
$138.1
$131.6 $131.5
0.99%
0.90% 0.96% 0.90% 0.88%
0.00%
0.50%
1.00
1.50%
2.00%
$0.0
$40.0
$80.0
$120.0
$160.0
1Q 6 2Q16 3Q16 4Q16 1Q17
NPL NPLs/Loans
NON-INTEREST INCOME – QUARTER COMPARISON
($ IN MILLIONS)
Non-Interest Income, Excluding Securities Gains
~ $730
million
~ $610
million
$42.2
$46.1
$48.1
$51.2
$45.6
$-
$10.0
$20.0
$30.0
$40.0
$50.0
$60.0
1Q16 2Q16 3Q16 4Q16 1Q17
Mortgage Banking Income & Spreads
Other Non-Interest Income
1.28%
1.71%
1.73%
1.94%
1.62%
0.00%
0.50%
1.00%
1.50%
2.00%
2.50%
3.00%
3.50%
4.00%
$(1.0)
$-
$1.0
$2.0
$3.0
$4.0
$5.0
$6.0
$7.0
$8.0
1Q16 2Q16(2) 3Q16(2) 4Q16(2) 1Q17
Gains on Sales Servicing Income Spread on Sales (1)
$4.0
$3.9
$4.5
$7.0
$4.6
$-
$10.0
$20.0
$30.0
$40.0
$50.0
1Q16 2Q16 3Q16 4Q16 1Q17
Invt Mgmt & Trust Srvs Deposit Srv Chgs Oth Srv Chgs Other
$38.2
$42.2
$43.6 $44.2
$41.0
(1) Represents Gains on Sales divided by total new commitments to originate residential mortgage
loans for customers.
(2) Servicing income includes $1.7 and $1.3 million Mortgage Servicing Rights (MSR) impairment
charges in 2Q16 and 3Q16, respectively, and a $1.7 million recovery in 4Q16.
7
NON-INTEREST EXPENSES – QUARTER COMPARISON
($ IN MILLIONS)
Non-Interest Expense & Efficiency Ratio (1)
~ $730
million
~ $610
million
$120.4
$121.6
$119.8
$127.6
$122.3
68.3%
67.6%
65.2%
67.6%
64.8%
0.0%
10.0%
20.0%
30.0%
40.0%
50.0%
60.0%
70.0%
80.0%
$-
$20.0
$40.0
$60.0
$80.0
$100.0
$120.0
$140.0
1Q16 2Q16 3Q16 4Q16 1Q17
Salaries and Employee Benefits & Staffing
Other Non-Interest Expenses
3,480 3,520
-
2,000
4,000
6,000
$-
$10.0
$20.0
$30.0
$40.0
$50.0
$60.0
$70.0
$80.0
1Q16 2Q16 3Q16 4Q16 1Q17
To tal Salaries Emp lo yee Be nefits Avera ge Fu ll-time E quivalent Emp lo yees
$69.4 $70.0 $70.7
$73.3 $69.2
$-
$10.0
$20.0
$30.0
$40.0
$5 .0
$60.0
1Q16 2Q16 3Q16 4Q16 1Q17
Occp & Equip Data Processing & Software Outside Srvs Other
$51.0 $51.6 $49.1
$54.4 $53.0
(1) Non-GAAP based financial measure. Please refer to the calculation and
management’s reasons for using this measure on the slide titled “Non-
GAAP Reconciliation” at the end of this presentation.
8
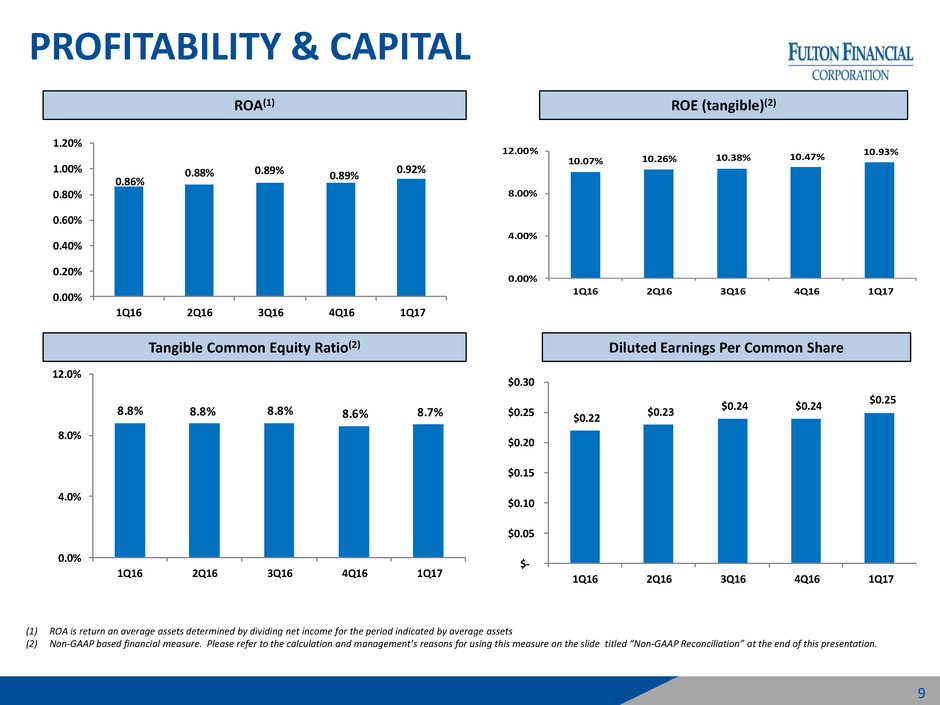
PROFITABILITY & CAPITAL
9
ROA(1) ROE (tangible)(2)
Tangible Common Equity Ratio(2) Diluted Earnings Per Common Share
10.07% 10.26% 10.38% 10.47%
10.93%
0.00%
4.00%
8.00%
12.00%
1Q16 2Q16 3Q16 4Q16 1Q17
0.86%
0.88% 0.89% 0.89%
0.92%
0.00%
0.20%
0.40%
0.60%
0.80%
1.00%
1.20%
1Q16 2Q16 3Q16 4Q16 1Q17
(1) ROA is return an average assets determined by dividing net income for the period indicated by average assets
(2) Non-GAAP based financial measure. Please refer to the calculation and management’s reasons for using this measure on the slide titled “Non-GAAP Reconciliation” at the end of this presentation.
8.8% 8.8% 8.8% 8.6% 8.7%
0.0%
4.
8.
12.0
1Q16 2Q16 3Q16 4Q16 1Q17
$0.22
$0.23
$0.24 $0.24
$0.25
$-
$0.05
$0.10
$ .15
$0.20
$0.25
$0.30
1Q16 2Q16 3Q16 4Q16 1Q17
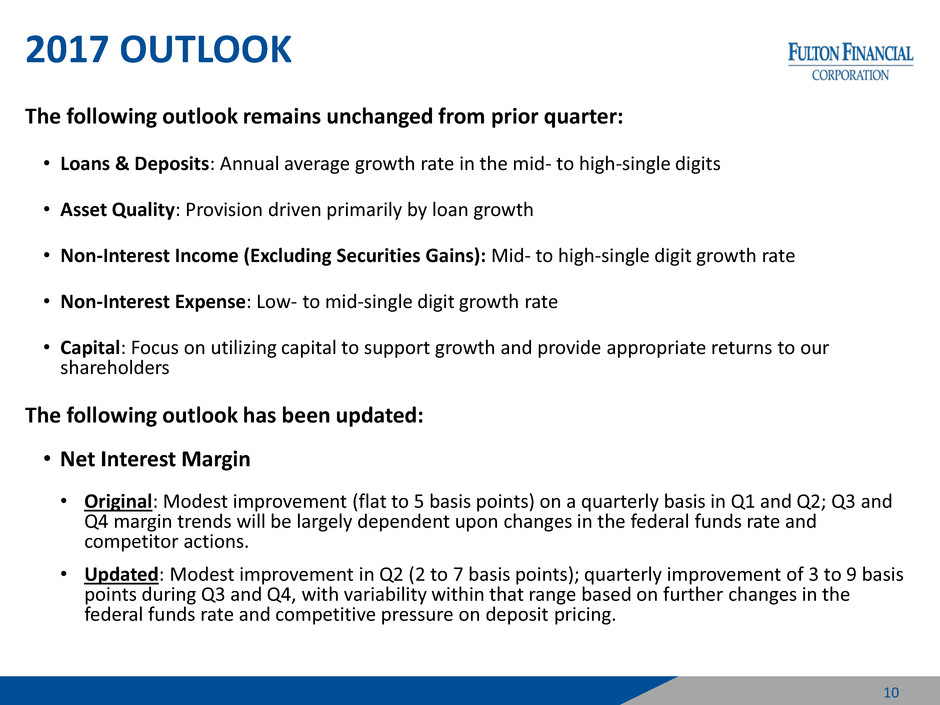
2017 OUTLOOK
The following outlook remains unchanged from prior quarter:
• Loans & Deposits: Annual average growth rate in the mid- to high-single digits
• Asset Quality: Provision driven primarily by loan growth
• Non-Interest Income (Excluding Securities Gains): Mid- to high-single digit growth rate
• Non-Interest Expense: Low- to mid-single digit growth rate
• Capital: Focus on utilizing capital to support growth and provide appropriate returns to our
shareholders
The following outlook has been updated:
• Net Interest Margin
• Original: Modest improvement (flat to 5 basis points) on a quarterly basis in Q1 and Q2; Q3 and
Q4 margin trends will be largely dependent upon changes in the federal funds rate and
competitor actions.
• Updated: Modest improvement in Q2 (2 to 7 basis points); quarterly improvement of 3 to 9 basis
points during Q3 and Q4, with variability within that range based on further changes in the
federal funds rate and competitive pressure on deposit pricing.
10
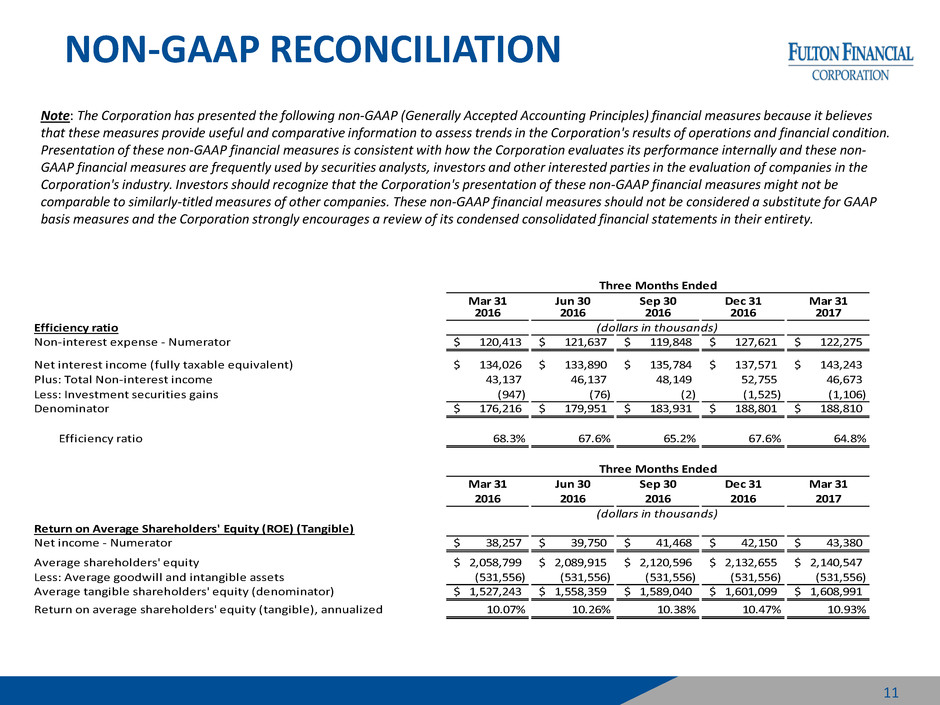
NON-GAAP RECONCILIATION
Note: The Corporation has presented the following non-GAAP (Generally Accepted Accounting Principles) financial measures because it believes
that these measures provide useful and comparative information to assess trends in the Corporation's results of operations and financial condition.
Presentation of these non-GAAP financial measures is consistent with how the Corporation evaluates its performance internally and these non-
GAAP financial measures are frequently used by securities analysts, investors and other interested parties in the evaluation of companies in the
Corporation's industry. Investors should recognize that the Corporation's presentation of these non-GAAP financial measures might not be
comparable to similarly-titled measures of other companies. These non-GAAP financial measures should not be considered a substitute for GAAP
basis measures and the Corporation strongly encourages a review of its condensed consolidated financial statements in their entirety.
11
Mar 31 Jun 30 Sep 30 Dec 31 Mar 31
2016 2016 2016 2016 2017
Efficiency ratio
Non-interest expense - Numerator 120,413$ 121,637$ 119,848$ 127,621$ 122,275$
Net interest income (fully taxable equivalent) 134,026$ 133,890$ 135,784$ 137,571$ 143,243$
Plus: Total Non-interest income 43,137 46,137 48,149 52,755 46,673
Less: Investment securities gains (947) (76) (2) (1,525) (1,106)
Denominator 176,216$ 179,951$ 183,931$ 188,801$ 188,810$
Efficiency ratio 68.3% 67.6% 65.2% 67.6% 64.8%
Mar 31 Jun 30 Sep 30 Dec 31 Mar 31
2016 2016 2016 2016 2017
Re r verage Shareholders' Equity (ROE) (Tangible)
Net inc me - Numerator 38,257$ 39,750$ 41,468$ 42,150$ 43,380$
Average shareholders' equity 2,058,799$ 2,089,915$ 2,120,596$ 2,132,655$ 2,140,547$
Less: Average goodwill and intangible assets (531,556) (531,556) (531,556) (531,556) (531,556)
Average tangible shareholders' equity (denominator) 1,527,243$ 1,558,359$ 1,589,040$ 1,601,099$ 1,608,991$
Return on average shareholders' equity (tangible), annualized 10.07% 10.26% 10.38% 10.47% 10.93%
Three Months Ended
Three Months Ended
(dollars in thousands)
(dollars in thousands)
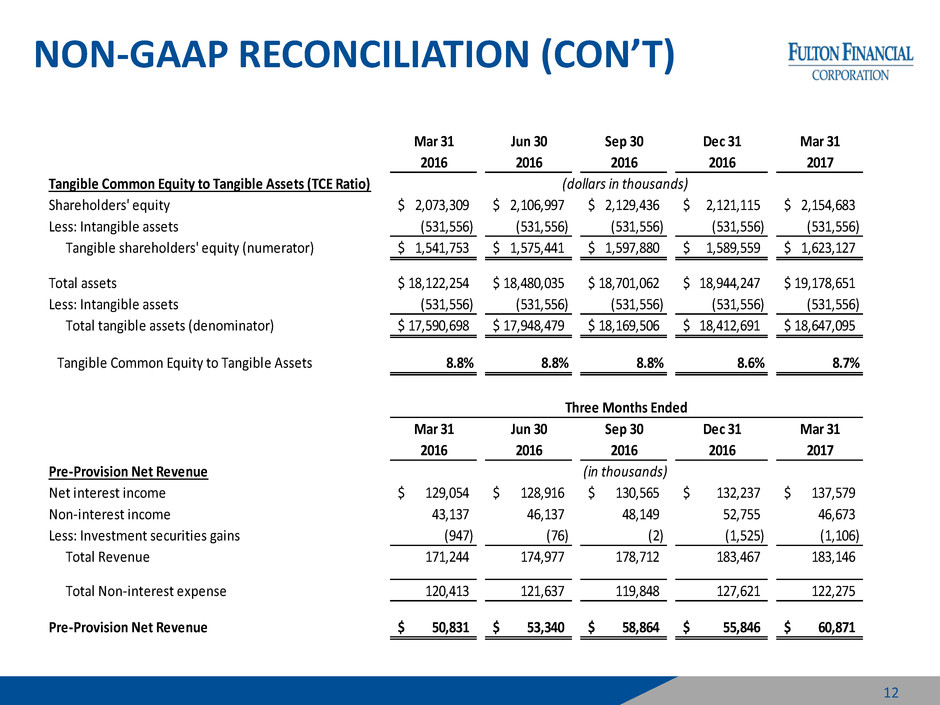
NON-GAAP RECONCILIATION (CON’T)
12
Mar 31 Jun 30 Sep 30 Dec 31 Mar 31
2016 2016 2016 2016 2017
Tangible Common Equity to Tangible Assets (TCE Ratio)
Shareholders' equity 2,073,309$ 2,106,997$ 2,129,436$ 2,121,115$ 2,154,683$
Less: Intangible assets (531,556) (531,556) (531,556) (531,556) (531,556)
Tangible shareholders' equity (numerator) 1,541,753$ 1,575,441$ 1,597,880$ 1,589,559$ 1,623,127$
Total assets 18,122,254$ 18,480,035$ 18,701,062$ 18,944,247$ 19,178,651$
Less: Intangible assets (531,556) (531,556) (531,556) (531,556) (531,556)
Total tangible assets (denominator) 17,590,698$ 17,948,479$ 18,169,506$ 18,412,691$ 18,647,095$
Tangible Common Equity to Tangible Assets 8.8% 8.8% 8.8% 8.6% 8.7%
Mar 31 Jun 30 Sep 30 Dec 31 Mar 31
2016 2016 2016 2016 2017
Pre-Provision Net Revenue
Net interest income 129,054$ 128,916$ 130,565$ 132,237$ 137,579$
Non-interest income 43,137 46,137 48,149 52,755 46,673
Less: Investment securities gains (947) (76) (2) (1,525) (1,106)
Total Revenue 171,244 174,977 178,712 183,467 183,146
Total Non-interest expense 120,413 121,637 119,848 127,621 122,275
Pre-Provision Net Revenue 50,831$ 53,340$ 58,864$ 55,846$ 60,871$
Three Months Ended
(dollars in thousands)
(in thousands)
www.fult.com
