Attached files
UNITED STATES
SECURITIES AND EXCHANGE COMMISSION
WASHINGTON, D.C. 20549
FORM 10-K | ||
ANNUAL REPORT PURSUANT TO SECTION 13 OR 15(d)
OF THE SECURITIES EXCHANGE ACT OF 1934
For the fiscal year ended January 28, 2017 | ||||
Commission file number 1-11609 | ||||
TOYS “R” US, INC.
(Exact name of registrant as specified in its charter) | ||||
Delaware | 22-3260693 | |
(State or other jurisdiction of incorporation or organization) | (IRS Employer Identification Number) | |
One Geoffrey Way Wayne, New Jersey | 07470 | |
(Address of principal executive offices) | (Zip code) | |
(973) 617-3500 | ||||
(Registrant’s telephone number, including area code)
Securities registered pursuant to Section 12(b) or 12(g) of the Act: | ||||
None | ||||
Indicate by check mark if the registrant is a well-known seasoned issuer, as defined in Rule 405 of the Securities Act. Yes ¨ No x
Indicate by check mark whether the registrant is not required to file reports pursuant to Section 13 or Section 15(d) of the Exchange Act. Yes x No ¨
Indicate by check mark whether the registrant (1) has filed all reports required to be filed by Section 13 or 15(d) of the Securities Exchange Act of 1934 during the preceding 12 months (or for such shorter period that the registrant was required to file such reports), and (2) has been subject to such filing requirements for the past 90 days. Yes ¨ No ¨
(Note: As a voluntary filer not subject to the filing requirements of Section 13(a) or 15(d) of the Exchange Act, the registrant has filed all reports pursuant to Section 13(a) or 15(d) of the Exchange Act during the preceding 12 months as if the registrant were subject to such filing requirements.)
Indicate by check mark whether the registrant has submitted electronically and posted on its corporate Web site, if any, every Interactive Data File required to be submitted and posted pursuant to Rule 405 of Regulation S-T (§232.405 of this chapter) during the preceding 12 months (or for such shorter period that the registrant was required to submit and post such files). Yes x No ¨
Indicate by check mark if disclosure of delinquent filers pursuant to Item 405 of Regulation S-K is not contained herein, and will not be contained, to the best of registrant’s knowledge, in definitive proxy or information statements incorporated by reference in Part III of this Form 10-K or any amendment to this Form 10-K. x
Indicate by checkmark whether the registrant is a large accelerated filer, an accelerated filer, a non-accelerated filer, smaller reporting company or an emerging growth company. See definition of “large accelerated filer,” “accelerated filer,” “smaller reporting company” and “emerging growth company” in Rule 12b-2 of the Exchange Act. (Check one)
Large accelerated filer | ¨ | Accelerated filer | ¨ | ||
Non-accelerated filer | x | (Do not check if a smaller reporting company) | Smaller reporting company | ¨ | |
Emerging growth company | ¨ | ||||
If an emerging growth company, indicate by check mark if the registrant has elected not to use the extended transition period for complying with any new or revised financial accounting standards provided pursuant to Section 13(a) of the Exchange Act. ¨
Indicate by check mark whether the registrant is a shell company (as defined in Rule 12b-2 of the Act). Yes ¨ No x
As of March 17, 2017, there were 49,353,943 outstanding shares of common stock, $0.001 par value per share, of Toys “R” Us, Inc., none of which were publicly traded.
DOCUMENTS INCORPORATED BY REFERENCE
None
Forward-Looking Statements
This Annual Report on Form 10-K, the other reports and documents that we have filed or may in the future file with the Securities and Exchange Commission and other publicly released materials and statements, both oral and written, that we have made or may make in the future, may contain “forward looking” statements within the meaning of Section 27A of the Securities Act of 1933, as amended, and Section 21E of the Securities Exchange Act of 1934, as amended, and such disclosures are intended to be covered by the safe harbors created thereby. These forward looking statements reflect our current views with respect to, among other things, our operations and financial performance. All statements herein or therein that are not historical facts, including statements about our beliefs or expectations, are forward-looking statements. We generally identify these statements by words or phrases, such as “anticipate,” “estimate,” “plan,” “project,” “expect,” “believe,” “intend,” “foresee,” “forecast,” “will,” “may,” “outlook” or the negative version of these words or other similar words or phrases. These statements discuss, among other things, our strategy, our “Strategic Pillars,” store openings, integration and remodeling, the development, implementation and integration of our e-commerce business, future financial or operational performance, projected sales for certain periods, same store sales from one period to another, cost savings, results of store closings and restructurings, outcome or impact of pending or threatened litigation, domestic or international developments, amount and allocation of future capital expenditures, growth initiatives, inventory levels, cost of goods, selection and type of merchandise, marketing positions, implementation of safety standards, access to trade credit, future financings, refinancings and debt repayments, estimates regarding future effective tax rates, future interest payments, and other goals and targets and statements of the assumptions underlying or relating to any such statements.
These statements are subject to risks, uncertainties and other factors, including, among others, the seasonality of our business, competition in the retail industry, changes in our product distribution mix and distribution channels, general economic factors in the United States and other countries in which we conduct our business, consumer spending patterns, birth rates, our ability to implement our strategy including implementing initiatives for season, our ability to recognize cost savings, implementation and operation of our new e-commerce platform, marketing strategies, the availability of adequate financing, ability to repatriate cash from our foreign operations, ability to distribute cash from our operating subsidiaries to their parent entities, access to trade credit, changes in consumer preferences, changes in employment legislation, our dependence on key vendors for our merchandise, political and other developments associated with our international operations, costs of goods that we sell, labor costs, transportation costs, domestic and international events affecting the delivery of toys and other products to our stores, product safety issues including product recalls, the existence of adverse litigation, changes in laws including tax that impact our business, our substantial level of indebtedness and related debt-service obligations, restrictions imposed by covenants in our debt agreements and other risks, uncertainties and factors set forth under Item 1A entitled “RISK FACTORS” of this Annual Report on Form 10-K and in our other reports and documents filed with the Securities and Exchange Commission. In addition, we earn a disproportionate part of our annual operating earnings in the fourth quarter as a result of seasonal buying patterns and these buying patterns are difficult to forecast with certainty. These factors should not be construed as exhaustive, and should be read in conjunction with the other cautionary statements that are included in this report. We believe that all forward-looking statements are based on reasonable assumptions when made; however, we caution that it is impossible to predict actual results or outcomes or the effects of risks, uncertainties or other factors on anticipated results or outcomes and that, accordingly, one should not place undue reliance on these statements. Forward-looking statements speak only as of the date they were made, and we undertake no obligation to update these statements in light of subsequent events or developments unless required by the Securities and Exchange Commission’s rules and regulations. Actual results and outcomes may differ materially from anticipated results or outcomes discussed in any forward-looking statement.
INDEX
PAGE | ||
PART I. | ||
Item 1. | ||
Item 1A. | ||
Item 1B. | ||
Item 2. | ||
Item 3. | ||
Item 4. | ||
PART II. | ||
Item 5. | ||
Item 6. | ||
Item 7. | ||
Item 7A. | ||
Item 8. | ||
Item 9. | ||
Item 9A. | ||
Item 9B. | ||
PART III. | ||
Item 10. | ||
Item 11. | ||
Item 12. | ||
Item 13. | ||
Item 14. | ||
PART IV. | ||
Item 15. | ||
Item 16. | ||
PART I
ITEM 1. | BUSINESS |
As used herein, the “Company,” “we,” “us,” or “our” means Toys “R” Us, Inc., and its consolidated subsidiaries, except as expressly indicated or unless the context otherwise requires. Our fiscal year ends on the Saturday nearest to January 31 of each calendar year. This Annual Report on Form 10-K focuses on our last three fiscal years ended as follows: fiscal 2016 ended January 28, 2017; fiscal 2015 ended January 30, 2016; and fiscal 2014 ended January 31, 2015. References to 2016, 2015 and 2014 are to our fiscal years unless otherwise specified.
Overview
We are relentlessly striving to be the best toy and baby products retail company for the world! Our purpose is to put huge smiles on the faces of children of all ages by being the world’s greatest toy store and to make it easier for parents to make the best possible choices as they care for their babies.
We are the leading global specialty retailer of toys and baby products as measured by Net sales. We believe our Toys “R” Us and Babies “R” Us brands are recognized as the toy and baby authority. We sell a variety of products in the baby, core toy, entertainment, learning and seasonal categories through our omnichannel offerings that leverage the synergies between our brick-and-mortar stores and e-commerce.
As of January 28, 2017, we operated 1,691 stores and licensed an additional 257 stores, which are located in 38 countries and jurisdictions around the world. We operate our stores under the Toys “R” Us and Babies “R” Us banners and also have smaller format Toys “R” Us Outlet stores (“Outlet”) and Toys “R” Us Express stores (“Express”). Our omnichannel presence includes our Toysrus.com and Babiesrus.com sites, as well as other e-commerce sites in our international markets. For fiscal 2016, we generated Net sales of $11,540 million, resulting in Net loss attributable to Toys “R” Us, Inc. of $36 million and Adjusted EBITDA of $792 million. For the definition of Adjusted EBITDA, an explanation of why we present it and a description of the limitations of this non-GAAP measure, as well as a reconciliation to Net loss attributable to Toys “R” Us, Inc., refer to Item 6 entitled “SELECTED FINANCIAL DATA” of this Annual Report on Form 10-K.
Our History
Our Company was founded in Washington D.C. in 1948 when Charles Lazarus opened a baby furniture store, Children’s Bargain Town. The Toys “R” Us name made its debut in 1957. In 1978, we completed an initial public offering of our common stock. When Charles Lazarus retired as our Chief Executive Officer (“CEO”) in 1994, we operated or licensed over 1,000 stores in 17 countries and jurisdictions. In 1996, we established the Babies “R” Us brand, further solidifying our reputation as a leading retail destination for children of all ages and their families.
On July 21, 2005, we were acquired by an investment group led by entities advised by or affiliated with Bain Capital Private Equity, L.P., Kohlberg Kravis Roberts & Co. L.P., and Vornado Realty Trust. We refer to this collective ownership group as our “Sponsors.” Upon the completion of this acquisition, we became a private company.
Leadership and Strategy
Since joining the Company in 2015, David A. Brandon, CEO and Chairman of the Board, has further strengthened our senior leadership team with a number of key hires across a broad range of disciplines, including communications, information technology, legal, marketing and operations. These hires, along with existing management, provide us with a fresh perspective on the business and bring with them a wealth of relevant experience and knowledge in leading key areas of our business.
Our Company has outlined the following key strategic growth initiatives, which we refer to as our “Strategic Pillars:”
• | Make Talent and Culture a Competitive Advantage. Create a culture of high performance, responsiveness and agility. |
• | Grow and Build the Toys “R” Us and Babies “R” Us Brands Throughout the World. Invest in our existing stores and e-commerce platforms and continue to grow our brands globally. |
• | Create a World Class Experience for Our Customers - Innovate and Lead. Develop empowered teams that strive for flawless execution in every aspect of the in-store and omnichannel experience. |
• | Create a Strong Financial Foundation. Continue to drive cost savings while we transition to our growth phase. |
1
Our Strengths
Strong Brand Equity
Our brand names are highly recognized in North America, Europe and Asia, and our expertise in the toy and baby products retail space, substantial scale and geographic footprint and strong vendor relationships account for our market-leading position and distinguish us from the competition. We believe we offer our customers the most comprehensive year-round selection of merchandise in the retail toy and baby categories through our “R” Us branded brick-and-mortar stores and e-commerce business. We seek to further differentiate ourselves from our competitors in several key areas, including our omnichannel presence, broad product assortment, private label and exclusively licensed product offerings and expert service which enables us to command a reputation as the shopping destination for toys and baby products.
Customer Experience
Every day we strive to improve the customer experience in our stores and online. This enables us to bring joy into the lives of our customers by being the toy and baby authority and definitive destination for kid fun, gift-giving solutions and parenting services. Compared with multi-line mass merchandisers, we believe we are able to provide more knowledgeable service to our customers through our highly trained sales force. We train our store team members to deepen their product knowledge and enhance their targeted selling skills in order to improve customer service.
To better leverage our physical presence, we are improving the shopping experience by bringing our stores to life. We have added feature shops in our stores that highlight several of our beacon brands, hot trends and featured movie properties, with larger than life graphic displays. Additionally, we are making our toy stores more interactive to engage kids and families. We are inviting customers to in-store events that offer free build-and-take toys, collect-and-trade days and toy demonstrations. Our Geoffrey’s Birthday Club was re-launched with in-store birthday celebrations for families to enjoy story time and meet Geoffrey himself. During the 2016 holidays, Babies “R” Us stores held a “Baby’s First Christmas” event and we offered professional Santa photo packages in select U.S. Toys “R” Us stores.
To improve shop-ability, our feature shops at the front of our toy stores are designed to help customers easily find what they’re looking for - a “Here’s What’s Hot Shop” with the hottest and trending toys in one convenient location and our “Gift Express” shop featuring grab-and-go gifts for $30 or less. Select U.S. stores are equipped with navigation, including digital store-specific maps to help customers pinpoint the location of the items they are looking for by using their smartphone on a navigational sign at the entrance to our stores. In addition, some of our Babies “R” Us store employees are equipped with tablets to help customers choose the perfect item from our webstore and order right on the spot. We are continuing to invest in our store appearance as part of our “Clean and Bright” initiative and enhance the customer experience by maintaining stronger in-stock positions in our stores and online for the hottest toys at competitive prices.
For the added convenience of our customers, we offer a layaway program and provide a home delivery service. Our “Price Match Guarantee” program matches competitors’ in-store and selected online retailer pricing on identical items.
2
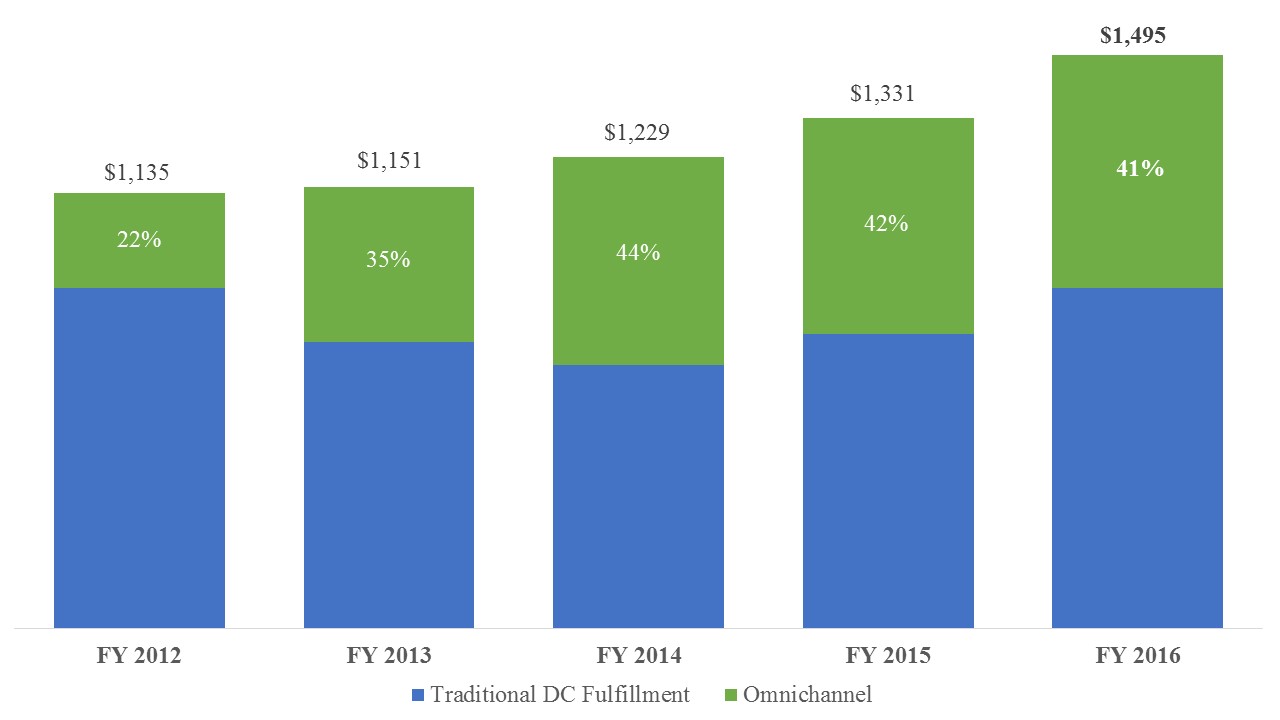
E-Commerce and Omnichannel
Over the past several years, we have driven growth in our e-commerce business, particularly within our omnichannel programs. For fiscal 2016, our consolidated e-commerce business generated net sales of $1,495 million, 41% of which was contributed by our omnichannel programs. The chart below shows our e-commerce net sales growth with the percentage of omnichannel fulfillment for the past five fiscal years:
($ In millions)
Our omnichannel capabilities through which we integrate our e-commerce and brick-and-mortar stores include the following:
• | Buy Online, Pick Up In Store. Available within all stores in the United States, United Kingdom, Canada and Germany. Offers customers the ability to browse and shop online and pick up their purchases in-store in as little as one hour. |
• | Ship to Store. Allows customers in the United States to purchase items online that may not be currently available in their local store, and have their order delivered to the local store of their choice, free of shipping charges. |
• | Ship from Store. Leverages inventory from our U.S. stores to improve the speed with which customers receive their online orders, as well as provide an additional option to fulfill these orders. This feature is also available in several of our international markets. |
• | Pay In Store. Provides customers the flexibility to shop online and pay for their items in any store across the United States. |
We are currently working towards the launch of our new Domestic e-commerce platform later in 2017 to transform and modernize our digital space. We aim to significantly improve the customer experience online and better integrate our omnichannel presence. We believe that this will provide us the flexibility needed to grow and allow us to respond to changing customer dynamics in an ever competitive marketplace. Over the past year, we have made improvements to our omnichannel fulfillment capacity, particularly through Ship from Store and improved staffing and training programs at our distribution centers, to meet peak demand during the holidays. In addition, our low everyday free shipping purchase minimum in the U.S. at Toysrus.com and Babiesrus.com is competitive in the marketplace.
Internationally, we have an online presence in 19 countries and jurisdictions, which includes Australia, Austria, Belgium, Canada, China, France, Germany, Hong Kong, Japan, Malaysia, Netherlands, Poland, Portugal, Singapore, Spain, Switzerland, Taiwan, Thailand and the United Kingdom, as well as in several of our licensed markets.
3
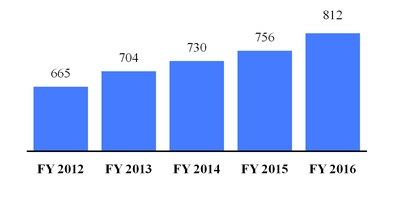
International Store Portfolio Expansion
We believe that we have the potential to continue to grow the number of stores internationally, particularly those in the emerging markets which are seeing overall GDP growth. Our first licensed store in China opened in 2006 through our partnership with Fung Retailing. In fiscal 2011, the Company acquired a 70% ownership interest in Toys (Labuan) Holding Limited (“Asia JV”) from Fung Retailing, which included locations in Brunei, China, Hong Kong, Malaysia, Singapore, Taiwan and Thailand, consisting of 90 operating stores. Since the acquisition of Asia JV, we have more than doubled our store count and now operate 226 Toys “R” Us retail stores as of January 28, 2017. Our International segment operating store portfolio has grown by 22% since fiscal 2012:
Our licensed store base has also continued to expand as we identify opportunities in markets where we do not already have a physical store presence. As of January 28, 2017, we licensed 257 stores in 19 countries and jurisdictions, generating $18 million in licensing revenue.
Customer Loyalty Programs and Marketing
Domestically, we provide several programs that benefit customers throughout the year including:
Rewards “R” Us. With 19 million current active members, we believe this loyalty program results in an improved customer shopping experience and more frequent visits to our stores and online sites. In fiscal 2016, our valued loyalty members contributed approximately two-thirds of our Domestic Net sales and benefited from the program’s rewards and promotions. Members earn $5 for every $125 spent, with “R” Us credit cardholders earning double the rewards for every $1 spent. Through this program we offer a variety of exclusive one-time and ongoing benefits, deals and promotions to our customers, and allow them to earn and redeem points at our stores and online. This includes Bonus Points days, Black Friday previews, credit card promotions and eligibility to our Endless Earnings and Geoffrey’s Birthday Club programs.
Babies “R” Us Registry. Our baby business offers a broad range of baby products and delivers a high level of customer service and product knowledge to our customers. We provide a baby product assortment that draws new and repeat customers to our Baby Registry Program, with over 23 million registrants since inception. Our Baby Registry program is important to building our baby business. Establishing first contact with new parents enables us to develop long-lasting customer relationships as their children grow and they transition to our full portfolio of products. We have made several enhancements to our Baby Registry program to improve the shopping experience for expectant and new parents including:
• | A Registry mobile app that allows customers to manage their baby registry anytime, from anywhere. |
• | The Endless Earnings program where domestically, expectant parents receive 5% rewards on the first $300 in purchases and 10% on every purchase thereafter with no limits, encouraging parents to use their registry as their ultimate shopping list that pays them back. |
• | Innovative programs, classes and expert services for expectant and new parents, which include monthly in store events and exclusive offers for registrants. |
Much like our Rewards “R” Us program in the U.S., we have over 12 million active members in similar loyalty programs around the world. In addition, we offer the following to our customers:
• | Wish List. Allows parents and kids to create a tailored list of desired toys that gift-givers can utilize to make their purchases. |
• | Geoffrey’s Birthday Club. Parents receive exciting offers to help prepare for their child’s birthday and kids are invited to our stores to receive special gifts and meet Geoffrey the Giraffe. |
• | “R” Us Credit Card. We offer co-branded and private label credit cards which allows customers to finance purchases at our stores, online and at other businesses, and receive loyalty benefits, deals and promotions in exchange. |
4
We believe that we have achieved our leading market position largely as a result of, building highly recognized brand names, year-round breadth of product offerings, knowledgeable employees and strong loyalty programs. We use a variety of broad-based and targeted marketing and advertising strategies to reach consumers and to try to connect with our customers on a personal level. These strategies include targeted advertisements and mass marketing programs such as e-mail marketing, digital and social media, direct mail, national television and radio spots, catalogs inserts in national and local newspapers, direct mailings to loyalty program members and in-store marketing. We continue to transition a significant portion of our marketing reach in an effort to optimize our digital versus traditional media mix. Our most significant single piece of advertising in the U.S. is “The Great Big Toys “R” Us Book of Awesome” promotional catalog release, which is distributed through direct mail, newspapers and our stores in advance of the holiday selling season.
Inventory Management
We continue to focus on enhancing the customer experience by improving our in-stock position to ensure we have the hot products that customers are looking for, while at the same time maintaining healthy inventory levels. Additionally, our product life cycle management process continues to help reduce clearance margin risk by instituting greater discipline around product exit dates.
Vendor Relationships
We view our well-established vendor relationships as a core strength of the organization and continue to build these partnerships in the hopes of growing together. We provide our vendors with a year-round platform to showcase their brands and test their new products in our stores. In return, we obtain greater access to products in demand, exclusive products and support for advertising and marketing efforts to drive category leadership and differentiation. We additionally have strategic partnerships with American Girl® and Claire’s which are featured as branded shops within select Toys “R” Us stores.
Our Stores
As of January 28, 2017, we operated and licensed retail stores worldwide in the following formats:
Store Type | Store Count | Typical Square Footage | |||
Operated: | |||||
Traditional Toy (1) | 932 | 20,000 - 50,000 | |||
Side-By-Side (“SBS”) (2) | 420 | 30,000 - 70,000 | |||
Baby (3) | 237 | 30,000 - 55,000 | |||
Long-Term Express | 64 | 3,000 - 7,000 | |||
Outlet | 38 | 3,000 - 5,000 | |||
Total Operated Stores | 1,691 | ||||
Licensed (4) | 257 | Various | |||
(1) | Devote on average 5,000 square feet to boutique areas for baby products. |
(2) | Devote 20,000 to 40,000 square feet to traditional toy products and 10,000 to 30,000 square feet to baby products. |
(3) | Devote 3,000 square feet to traditional toy products and includes our Babies “R” Us flagship store in Union Square, New York City. |
(4) | “R” Us branded retail stores. Licensing revenue did not have a material impact on Net sales. |
Globally, our store portfolio includes smaller format Express stores located in malls and shopping centers. During the 2016 holiday season, we operated 126 Express stores, of which 103 were still open as of January 28, 2017. Of the 103 Express stores that remained open, 64 have been included in our overall store count as they each have a cumulative lease term of at least two years (“Long-Term Express”). The remaining 39 Express stores are considered temporary stores (“Temporary Express”). These locations typically range in size from 3,000 to 7,000 square feet each, have a cumulative lease term of less than two years and are not included in our overall store count.
Additionally, we operated 38 Outlets within our Domestic segment, 12 of which opened in fiscal 2016. These permanent stores are located in high traffic shopping and lifestyle centers, have traditional toy product assortments as well as unique discount items and typically have lease terms of at least five years.
5
Our extensive experience in retail site selection has resulted in a portfolio of stores that includes attractive locations in many of our chosen markets. Markets for new stores and formats are selected on the basis of proximity to other “R” Us branded stores, demographic factors, population growth potential, competitive environment, availability of real estate and cost. Once a potential market is identified, we select a suitable location based upon several criteria, including size of the property, access to major commercial thoroughfares, proximity of other strong anchor stores, visibility and parking capacity.
Our Business Segments
Our business has two reportable segments: Toys “R” Us – Domestic (“Domestic”) and Toys “R” Us – International (“International”). Refer to Note 11 to our Consolidated Financial Statements entitled “SEGMENTS” for our segments’ financial results. The following is a brief description of our segments:
• | Domestic — Our Domestic segment sells a variety of products through 879 stores that operate in 49 states in the United States, Puerto Rico and Guam and through e-commerce. As of January 28, 2017, our Domestic stores consisted of 358 traditional toy stores, 223 baby stores, 212 SBS stores, 48 Long-Term Express stores and 38 Outlets, as well as Temporary Express locations. Domestic Net sales were $7,131 million for fiscal 2016, which accounted for 62% of our consolidated Net sales. |
• | International — Our International segment sells a variety of products through 812 operated and 257 licensed stores in 37 countries and jurisdictions and through e-commerce. As of January 28, 2017, our International stores consisted of 574 traditional toy stores, 208 SBS stores, 16 Long-Term Express stores and 14 baby stores, as well as Temporary Express locations. International Net sales were $4,409 million for fiscal 2016, which accounted for 38% of our consolidated Net sales. |
Product Selection and Merchandise
Our product offerings are focused on serving the needs of parents, grandparents and other gift-givers interested in purchasing merchandise in our primary product categories:
• | Baby — focused on serving newborns and children up to four years of age by offering a broad array of products, such as baby gear, consumables, infant care products, apparel, furniture, bedding and room décor; many of these items are available in toy and baby stores; |
• | Core Toy — boys and girls toys, such as action figures, dolls and doll accessories, drones, role play toys and vehicles; |
• | Entertainment — video game software, systems and accessories, tablets, portable electronics and other related products; |
• | Learning — educational electronics and developmental toys, such as our Imaginarium products in the United States and World of Imagination products at our International locations, construction toys, games, creative activities and pre-school merchandise which includes learning products, activities and toys; and |
• | Seasonal — toys and other products geared toward holidays (including Christmas, Hanukkah, Three Kings, Chinese New Year, Carnival, Easter, Children’s Day, Golden Week and Halloween) and summer activities, as well as bikes, sports toys, play sets and other outdoor products. |
We offer a wide selection of popular national toy and baby brands including many products that are exclusively offered at, or launched at, our stores. Over the past few years, we have worked with key vendors to obtain exclusive products and expand our private label brands enabling us to earn higher margins and offer products that our customers will not find elsewhere. We offer a broad selection of private label merchandise under names such as BABIES “R” US, IMAGINARIUM, KOALA BABY, AVIGO, FAST LANE, YOU & ME, JUST LIKE HOME, BRUIN, STATS, JOURNEY GIRLS, ANIMAL PLANET, TRUE HEROES, SIZZLIN’ COOL, EDU-SCIENCE, PAVILION, DREAM DAZZLERS and TOTALLY ME! in our stores. We believe these private label brands provide a platform on which we can expand our product offerings in the future and will further differentiate our products and allow us to enhance profitability. Our private label penetration rate was 12% of Net sales in fiscal 2016. We utilize our sourcing office in China to work with our vendors and differentiate our product offerings.
Safety Focus
We believe that we have put in place product safety standards that meet or exceed United States federally mandated and/or global regulatory requirements in the countries in which we operate. In addition, through our dedicated safety website, safety boards in stores, social media and e-mail communications and partnerships with safety organizations including the Consumer Products Safety Commission, we provide resources for customers, parents and others to help ensure they have the most up-to-date information on product safety and recalls.
6
Corporate Philanthropy and Community Service
We are proud to have a long tradition at Toys “R” Us of supporting numerous children’s charities. Over the past three decades, the Company has given more than $100 million in product donations to children’s charities. In addition, the Toys “R” Us Children’s Fund Inc., a public charity affiliated with the Company, has donated more than $130 million in grants to children’s charities that keep children safe and help them in times of need. We actively support charities such as the Marine Toys for Tots Foundation, Make-A-Wish America, Special Olympics, St. Jude Children’s Research Hospital and Save the Children, among others. We encourage our employees to become active in charitable endeavors by matching contributions they make to qualified charities of their choice, and through Volunteer Match, a program that helps them identify charities to assist in their communities. We also manage the Geoffrey Fund, Inc., a non-profit organization that provides assistance to employees affected by natural and personal disasters. The Geoffrey Fund relies on donations from employees to carry out its mission.
Market and Competition
In the domestic market, we compete with mass merchandisers, such as Walmart, Target and Kmart; consumer electronics retailers, such as Best Buy and GameStop; Internet and catalog businesses, such as Amazon.com; national and regional specialty, department and discount store chains; as well as local retailers in the geographic areas we serve. Our baby registry competes with baby registries of mass merchandisers, other specialty retail formats, such as buybuy BABY, and regional retailers. In the International toy and electronics markets, we compete with mass merchandisers, discounters and specialty retailers. The domestic and international mass merchandisers and discounters aggressively price items in the traditional toy and electronic product categories with larger dedicated selling space during the holiday season in order to build traffic for other store departments.
We believe the principal competitive factors in the toy, including video game products, and baby products markets are product variety, price, quality, availability, advertising and promotion, convenience or store location, shipping offers, safety and customer support and service. We believe we are able to effectively compete by providing a broader range of merchandise, strong in-stock positions, convenient locations, knowledgeable customer service and competitive pricing and shipping offers.
Seasonality
Our global business is highly seasonal with sales and earnings highest in the fourth quarter due to the fourth quarter holiday selling season. During fiscals 2016, 2015 and 2014, 40%, 41% and 40%, respectively, of our total Net sales were generated in the fourth quarter. We typically incur net losses in each of the first three quarters of the year, with a substantial portion of our operating earnings generated in the fourth quarter. We seek to continuously improve our ability to manage the numerous demands of a highly seasonal business, from the areas of product sourcing and distribution, to the challenges of delivering high sales volumes and excellent customer service during peak business periods. For more than 65 years, we have developed substantial experience and expertise in managing the increased demand during the holiday season which we believe favorably differentiates us from our competition.
License Agreements
We have license agreements with unaffiliated third party operators located outside the United States. The agreements are largely structured with royalty income paid as a percentage of sales for the use of our trademarks, trade name and branding. Licensing revenue was $18 million for fiscal 2016 and $17 million for fiscals 2015 and 2014, respectively. While this business format remains a small piece of our overall International business operations, we continue to look for opportunities for market expansion. Our preferred approach is to open stores in our Company-operated format, but we may choose partnerships or licensed arrangements where we believe it is appropriate due to business climate and risks.
7
Geographic Distribution of Domestic Stores
The following table sets forth the location of our Domestic stores as of January 28, 2017:
Location | Number of Stores | ||
Alabama | 9 | ||
Alaska | 1 | ||
Arizona | 17 | ||
Arkansas | 5 | ||
California | 113 | ||
Colorado | 10 | ||
Connecticut | 14 | ||
Delaware | 3 | ||
Florida | 60 | ||
Georgia | 28 | ||
Hawaii | 5 | ||
Idaho | 2 | ||
Illinois | 38 | ||
Indiana | 19 | ||
Iowa | 7 | ||
Kansas | 6 | ||
Kentucky | 10 | ||
Louisiana | 9 | ||
Maine | 3 | ||
Maryland | 17 | ||
Massachusetts | 23 | ||
Michigan | 32 | ||
Minnesota | 8 | ||
Mississippi | 6 | ||
Missouri | 15 | ||
Montana | 1 | ||
Nebraska | 3 | ||
Nevada | 10 | ||
New Hampshire | 7 | ||
New Jersey | 45 | ||
New Mexico | 3 | ||
New York | 60 | ||
North Carolina | 22 | ||
North Dakota | 1 | ||
Ohio | 37 | ||
Oklahoma | 7 | ||
Oregon | 10 | ||
Pennsylvania | 45 | ||
Rhode Island | 2 | ||
South Carolina | 9 | ||
South Dakota | 2 | ||
Tennessee | 16 | ||
Texas | 66 | ||
Utah | 7 | ||
Vermont | 1 | ||
Virginia | 27 | ||
Washington | 16 | ||
West Virginia | 4 | ||
Wisconsin | 12 | ||
Guam | 1 | ||
Puerto Rico | 5 | ||
Total | 879 | ||
8
Geographic Distribution of International Stores
The following table sets forth the location of our International operated stores as of January 28, 2017:
Location | Number of Stores Operated | ||
Australia | 38 | ||
Austria | 15 | ||
Brunei | 1 | ||
Canada | 82 | ||
China | 131 | ||
France | 47 | ||
Germany | 67 | ||
Hong Kong | 15 | ||
Japan | 163 | ||
Malaysia | 36 | ||
Poland | 15 | ||
Portugal | 10 | ||
Singapore | 9 | ||
Spain | 49 | ||
Switzerland | 10 | ||
Taiwan | 22 | ||
Thailand | 12 | ||
United Kingdom | 90 | ||
Total | 812 | ||
The following table sets forth the location of our International licensed stores as of January 28, 2017:
Location | Number of Stores Licensed | ||
Bahrain | 1 | ||
Denmark | 16 | ||
Egypt | 3 | ||
Finland | 7 | ||
Iceland | 3 | ||
Israel | 27 | ||
Kuwait | 2 | ||
Macau | 2 | ||
Namibia | 1 | ||
Norway | 16 | ||
Oman | 1 | ||
Philippines | 32 | ||
Qatar | 1 | ||
Saudi Arabia | 14 | ||
South Africa | 61 | ||
South Korea | 39 | ||
Sweden | 22 | ||
United Arab Emirates | 8 | ||
Zambia | 1 | ||
Total | 257 | ||
Employees
As of January 28, 2017, we employed 64,000 full-time and part-time individuals worldwide, with 36,000 domestically and 28,000 internationally. These numbers do not include the individuals employed by licensees of our stores. Due to the
9
seasonality of our business, we employed 107,000 full-time and part-time employees worldwide during the 2016 holiday season.
Distribution
We operate 18 distribution centers including 8 that support our Domestic operations and 10 that support our International operations (excluding licensed operations). These distribution centers employ warehouse management systems and material handling equipment that help to manage overall inventory levels and distribution costs. In fiscal 2015, we opened a state-of-the-art distribution center in France which integrates our three previous fulfillment centers and serves as the headquarters office for Toys “R” Us, France. We believe that this facility creates greater operational efficiencies for our business, while allowing us to better serve our customers through our growing omnichannel capabilities in Europe.
We have agreements with third party logistics providers JB Hunt Transport, Inc. and Performance Team Freight Systems, Inc. to manage all services related to the delivery of inventory from our distribution centers to our U.S. stores. We believe the flexibility afforded by our warehouse/distribution system and the utilization of third party providers to distribute merchandise provides us with operating efficiencies and the ability to maintain a superior in-stock inventory position at our stores.
We also have an agreement with DHL Supply Chain (formerly Exel, Inc.), a leading North American contract logistics provider, who provides additional warehousing and fulfillment services for our e-commerce operations in the United States. We utilize various third party providers who furnish similar services in our international markets.
We continuously seek to improve our global supply chain management, optimize our inventory assortment and upgrade our automated replenishment system to improve inventory turnover. In line with this strategy, we have a service entity in Rotterdam, Netherlands referred to as the European Import Center (“EIC”) in order to improve supply chain management in the European markets in which we operate. The EIC manages a portion of the purchasing of inventory from third party vendors located in Asia on behalf of our wholly-owned subsidiaries within Europe.
Our Vendors
We procure our merchandise from a wide variety of domestic and international vendors. In fiscal 2016, we had 3,600 active vendor relationships. For fiscal 2016, our top 20 vendors worldwide, based on our purchase volume in U.S. Dollar (“USD”), represented 43% of the total products we purchased.
Financial Information About Our Segments
Financial information about our segments and our operations in different geographical areas for the last three fiscal years is set forth in Note 11 to the Consolidated Financial Statements entitled “SEGMENTS.”
Trademarks and Licensing
“TOYS “R” US®,” “BABIES “R” US®,” “GEOFFREY®,” “KOALA BABY®,” “IMAGINARIUM®,” “YOU & ME®,” “FAST LANE®,” “AVIGO®,” “JOURNEY GIRLS®,” “DREAM DAZZLERS®,” the reverse “R” monogram logo and the Geoffrey character logo, as well as variations of our family of “R” Us marks, among others either have been registered, or have trademark applications pending, with the United States Patent and Trademark Office and with the trademark registries of many other countries. These trademarks are material to our business operations. We believe that our rights to these properties are adequately protected. In addition, we own the United States trademarks (along with certain trademark rights in other countries) associated with eToys.com and KB Toys.
Available Information
Our investor relations website is Toysrusinc.com. On this website under “INVESTORS, FINANCIAL REPORTS,” we make available, free of charge, our Annual Reports on Form 10-K, Quarterly Reports on Form 10-Q, and Current Reports on Form 8-K, as well as amendments to those reports as soon as reasonably practicable after we electronically file with the Securities and Exchange Commission (“SEC”).
We are not incorporating by reference in this Annual Report on Form 10-K any information from our websites. The public may read and copy any materials the Company files with the SEC at the SEC’s Public Reference Room at 100 F Street, NE, Washington, DC 20549. The public may obtain information on the operation of the Public Reference Room by calling the SEC at 1-800-SEC-0330. The SEC maintains an Internet site, www.sec.gov, that contains reports, proxy and information statements, and other information regarding issuers that file electronically with the SEC.
10
ITEM 1A. | RISK FACTORS |
Investors should carefully consider the risks described below together with all of the other information in this Annual Report on Form 10-K. The risks and uncertainties described below are not the only ones that we face. Additional risks and uncertainties not presently known to us, or that we currently believe to be less significant than the following risk factors, may also adversely affect our business and operations. If any of the following risks actually occur, our business, financial condition, cash flows or results of operations could be materially adversely affected.
Risks Relating to Our Business
Our business is highly seasonal, and our financial performance depends significantly on the results of the fourth quarter of each fiscal year and, as a result, our operating results could be materially adversely affected if we achieve less than satisfactory sales prior to or during the holiday season.
Our business is highly seasonal. During fiscals 2016, 2015 and 2014, 40%, 41% and 40%, respectively, of our total Net sales were generated in the fourth quarter. We typically incur net losses in each of the first three quarters of the year, with a substantial portion of our operating earnings generated in the fourth quarter. As a result, we depend significantly upon the fourth quarter holiday selling season. If we achieve less than satisfactory sales, operating earnings or cash flows from operating activities during the fourth quarter, we may not be able to compensate sufficiently for the lower sales, operating earnings or cash flows from operating activities during the first three quarters of the fiscal year. Our results in any given period may be affected by dates on which important holidays fall and the shopping patterns relating to those holidays. Additionally, the concentrated nature of our seasonal sales means that our operating results could be materially adversely affected if we achieve less than satisfactory sales prior to or during the holiday season, including as a result of natural disasters, labor strikes, work stoppages, terrorist acts or disruptive global political events, prior to or during the holiday season, as described below.
Our industry is highly competitive and competitive conditions may materially adversely affect our revenues and overall profitability.
The retail industry is highly and increasingly competitive and our results of operations are sensitive to, and may be materially adversely affected by competitive pricing, promotional pressures, competitor credit programs, additional competitor store openings, growth of e-commerce competitors and other factors. As a specialty retailer that primarily focuses on toys and baby products, we compete with discount and mass merchandisers, such as Walmart and Target, as well as Internet and catalog businesses, such as Amazon.com, national and regional chains and department stores and local retailers in the markets we serve. We also compete with national and local discount stores, consumer electronics retailers, supermarkets and warehouse clubs. Competition is principally based on product variety, price, quality, availability, advertising and promotion, convenience or store location, safety and customer support and service. We believe that some of our competitors in the toy and baby products markets, as well as in the other markets in which we compete, have a larger market share than our market share. In addition, some of our competitors have greater financial resources, lower merchandise acquisition costs and lower operating expenses than we do.
Much of the merchandise we sell is also available from various retailers at competitive prices. Discount and mass merchandisers use aggressive pricing policies and enlarged toy-selling areas during the holiday season to increase sales and build traffic for other store departments. Our business is vulnerable to shifts in demand and pricing, as well as consumer preferences.
We are vulnerable to competitive pressures from e-commerce activity in the market, both as they impact our own e-commerce business and our stores. The Internet provides greater price transparency of our merchandise that is widely available to customers. Our “Price Match Guarantee” may lead to reduced margins as a result of intense price competition, especially during the holiday selling season. In addition, sales of video games have been impacted by a shift to sales in channels other than traditional retail stores, including direct online distribution to customers through download, subscription or cloud play, which eliminates the need for a retailer. Furthermore, competitors’ subscription models for diapers, formula, and other consumables may eliminate the need for customers to visit our stores or e-commerce websites. We believe that this e-commerce activity has adversely affected our sales and profitability, and any increase in the proportion of our customers’ purchases via the Internet could materially adversely affect our sales and profitability from physical stores.
The baby registry market is highly competitive, based on convenience, quality and selection of merchandise offerings and functionality. Our baby registry primarily competes with the baby registries of mass merchandisers, Internet retailers and other specialty format and regional retailers. Some of our competitors have been aggressively advertising and marketing their baby registries through national television, magazine and Internet campaigns. These trends present consumers with more choices for their baby registry needs, and as a result, increase competition for our baby registry.
11
If we fail to compete successfully, we could face lower sales and may decide or be compelled to offer greater discounts to our customers, which could result in decreased profitability.
Our sales may be adversely affected by changes in economic factors and changes in consumer spending patterns.
Many economic and other factors outside our control, including consumer confidence, consumer spending levels, employment levels, consumer debt levels, individual income tax and sales tax rates, inflation and deflation, as well as the availability of consumer credit, affect consumer spending habits. A significant deterioration in the global financial markets and economic environment, recessions or an uncertain economic outlook adversely affects consumer spending habits and results in lower levels of economic activity. The domestic and international political situation, including the economic health of various political jurisdictions, also affects economic conditions and consumer confidence. In addition, changing economic and regulatory conditions and increasing consumer credit delinquencies may cause banks to re-evaluate their lending practices and terms which could have an adverse effect on our credit card program and consequently, an adverse effect on our sales. Any of these events and factors could cause consumers to curtail spending and could have a negative impact on our financial performance and position in future fiscal periods.
Our operations have significant liquidity and capital requirements and depend on the availability of adequate financing on reasonable terms. If our lenders are unable to fund borrowings under their credit commitments or we are unable to borrow, it could have a significant negative effect on our business.
We have significant liquidity and capital requirements. Among other things, the seasonality of our businesses requires us to purchase merchandise well in advance of the fourth quarter holiday selling season. We depend on our ability to generate cash flows from operating activities, as well as on borrowings under our revolving credit facilities and our credit lines, to finance the carrying costs of this inventory and to pay for capital expenditures and operating expenses. As of January 28, 2017, we had total outstanding borrowings of $465 million under our revolving credit facilities and credit lines. As of January 28, 2017, we had unused availability under committed lines of credit of $905 million. For fiscal 2016, peak borrowings under all of our revolving credit facilities and credit lines were $1,331 million, as we purchased merchandise for the fourth quarter holiday selling season. If our lenders are unable to fund borrowings under their credit commitments or we are unable to borrow, it could have a significant negative effect on our business. In addition, any adverse change to our credit ratings or our business could negatively impact our ability to refinance our debt on satisfactory terms and could have the effect of increasing our financing costs. While we believe we currently have adequate sources of funds to provide for our ongoing operations and capital requirements for at least the next 12 months, any inability on our part to have future access to financing, when needed, would have a negative effect on our business.
A loss of, or reduction in, trade credit from our vendors could reduce our liquidity, increase our working capital needs and/or limit our ability to purchase products.
Trade credit from our vendors is an important source of financing for the purchase of the inventory we sell in our stores. Accordingly, the loss of, or reduction in, trade credit could have a significant adverse impact on our inventory levels and operating cash flow and negatively impact our liquidity. Our vendors may seek credit insurance to protect against non-payment of amounts due to them. If credit insurance is not available to vendors at reasonable terms or at all, vendors may demand accelerated payment of amounts due to them or require advance payments or letters of credit before goods are shipped to us. A negative change in our credit ratings or our vendors’ perception of our creditworthiness, including due to pending debt maturities, may impact their willingness to provide trade credit to us. Any adverse changes in our trade credit for these or other reasons could increase our costs of financing our inventory or negatively impact our ability to deliver products to our customers, which could in turn negatively affect our financial performance.
We may not retain or attract customers if we fail to successfully implement our strategic initiatives, which could result in lower sales and a failure to realize the benefit of the expenditures incurred for these initiatives.
We continue to implement a series of customer-oriented strategic programs designed to differentiate and strengthen our core merchandise content and service levels and to expand and enhance our merchandise offerings. As part of our omnichannel strategy to integrate our e-commerce and brick-and-mortar businesses, we aim to satisfy our customers’ evolving shopping preferences by utilizing fulfillment channels such as “In-Store Pick Up,” “Ship from Store” and “Ship to Store.” In an effort to optimize our e-commerce operations and improve the customer experience online, we are currently developing an e-commerce platform which will allow us to manage certain aspects of our e-commerce operations internally rather than through a third-party provider.
We continue to evaluate the effectiveness of our marketing and advertising programs for our “R” Us stores and e-commerce business. The success of these and other initiatives will depend on various factors, including the implementation of our strategy, the appeal of our store and website formats, our ability to offer new products to customers, our financial condition, our ability to respond to changing consumer preferences and competitive and economic conditions. We continuously endeavor to
12
minimize our operating expenses, without adversely affecting the customer experience or the profitability of the business. If we fail to implement successfully some or all of our strategic initiatives, we may be unable to retain or attract customers, which could result in lower sales and a failure to realize the benefit of the expenditures incurred for these initiatives.
If we cannot increase profitability within existing stores or open new stores, our performance may be materially adversely affected.
Our performance is dependent on maintaining and increasing sales in existing stores and the ability to successfully open profitable new stores. Increases in sales in existing stores are dependent on factors such as competition, merchandise selection, store operations (including maintaining and remodeling these stores) and other factors discussed in these Risk Factors. The success of any store depends in substantial part on its location. There can be no assurance that current locations will continue to be attractive as demographic patterns change. Neighborhood or economic conditions where stores are located could decline in the future, potentially resulting in reduced sales in these locations.
Our ability to successfully relocate or open new stores and expand into additional market areas depends in part on the following factors, which are in part beyond our control:
• | the availability of sufficient funds for the expansion; |
• | the availability of attractive store locations and the ability to accurately assess the demographic or retail environment and customer demand at a given location; |
• | the ability to negotiate favorable lease terms and obtain the necessary permits and zoning approvals; |
• | the absence of occupancy delays; |
• | the ability to construct, furnish and supply a store in a timely and cost effective manner; |
• | the ability to hire and train new personnel, especially store managers, in a cost effective manner; and |
• | general economic conditions. |
Delays or failures in successfully opening new stores, or achieving lower than expected sales in existing or new stores, could materially adversely affect our profitability. In addition, we may not be able to anticipate all of the challenges imposed by the expansion of our operations and, as a result, may not meet our targets for opening new stores or relocating stores or expanding profitably.
Some of our new stores may be located in areas where we have little or no meaningful experience. Those markets may have different market conditions, consumer preferences and discretionary spending patterns than our existing markets, which may cause our new stores to be less successful than stores in our existing markets. Other new stores may be located in areas where we have existing stores. Although we have experience in these markets, increasing the number of locations may result in unanticipated over-saturation of markets and temporarily or permanently divert customers and sales from our existing stores, thereby adversely affecting our overall financial performance.
The success and expansion of our e-commerce business depends on our ability to successfully transition to an internally developed Domestic e-commerce platform and to provide quality service to our customers and if we are not able to provide such services, our operating results may be materially adversely affected.
We are currently in the process of developing a new internal e-commerce platform for our Domestic website, which we now expect to launch in fiscal 2017. We may be faced with significant unforeseen transition challenges including additional implementation delays, cost overruns, technology interruptions and disruption of our distribution channels which could adversely affect our e-commerce platform. Any inability to successfully transition to, operate or maintain our internal platform or unforeseen transition operation challenges or disruptions may materially impact our sales, results of operations and financial condition and may materially adversely affect our ability to achieve future sales and profitability growth.
Additionally, our Internet operations are subject to a number of risks and uncertainties which are in part beyond our control, including the following:
• | failure of our Internet service providers to perform their services properly and in a timely and efficient manner; |
• | changes in consumer willingness to purchase goods via the Internet; |
• | increases in software filters that may inhibit our ability to market our products through e-mail messages to our customers and increases in consumer privacy concerns relating to the Internet; |
• | changes in applicable federal and state regulation, such as the Federal Trade Commission Act, the Children’s Online Privacy Act, the Fair Credit Reporting Act and the Gramm-Leach-Bliley Act and similar types of international laws; |
• | breaches of Internet security including our new internal e-commerce platform; |
13
• | failures in our Internet infrastructure or the failure of systems or third parties, such as telephone or electric power service, resulting in website downtime or other problems; |
• | failure by us to process online customer orders properly and on time, which may negatively impact future online and in-store purchases by such customers; |
• | failure by our service provider to provide warehousing and fulfillment services, which may negatively impact future online and in-store purchases by customers; and |
• | failure to keep up with changes in technology. |
As technology continues to advance, customers are increasingly using a variety of devices, such as computers, tablets and smartphones to shop online with us and our competitors. We continue to enhance our customers’ shopping experience on each of these devices as well as incorporate social media as another means of communicating with our customers. If we fail to provide attractive, user-friendly online shopping platforms or fail to continually meet the evolving expectations of customers with developments in online merchandising technology and competitor offerings, we could be at a competitive disadvantage and our business and results of operations may be materially adversely affected.
Our sales may be adversely affected if we fail to respond to changes in consumer preferences in a timely manner.
Our financial performance depends on our ability to identify, originate and define product trends, as well as to anticipate, gauge and react to changing consumer preferences in a timely manner. Our products must appeal to a broad range of consumers whose preferences cannot be predicted with certainty and are subject to change. Our business fluctuates according to changes in consumer preferences dictated in part by fashion trends, perceived value and season. These fluctuations affect the merchandise in stock since purchase orders are written well in advance of the holiday season and, at times, before fashion trends and high-demand brands are evidenced by consumer purchases. If we overestimate the market for our products, we may be faced with significant excess inventories, which could result in increased expenses and reduced margins associated with having to liquidate obsolete inventory at lower prices or write it off. Conversely, if we underestimate the market for our products, we will miss opportunities for increased sales and profits, which would place us at a competitive disadvantage.
Sales of video games and video game systems are adversely affected by changing trends in the interactive entertainment industry including the rise in popularity of browser, mobile, tablet and social games distributed through alternative channels.
Sales of video games and video game systems, which have accounted for 4%, 4% and 6% of our annual Net sales for fiscals 2016, 2015 and 2014, respectively, have been impacted by trends in the interactive entertainment industry. Video games are now played on a wide variety of products, including mobile phones, tablets, social networking websites and other devices. The popularity of such non-traditional gaming has increased greatly and this popularity is expected to continue to grow. Browser, mobile, tablet and social gaming is accessed through hardware other than the consoles and traditional hand-held video game devices we sell and its games are available through websites or proprietary app stores via direct online distribution at a fraction of the cost of console games. While we continue to develop and implement various strategies to incorporate these new trends into our offerings, including selling third party tablets and other devices, we can provide no assurances that these strategies will be successful or contribute to profitability. Similarly, a continued rise in the popularity of mobile and tablet gaming could negatively impact sales and profitability of traditional toys.
The decrease of birth rates in countries where we operate could negatively affect our business.
Most of our end-customers are newborns and children and, as a result, our revenues are dependent on the birth rates in countries where we operate. In recent years, many countries’ birth rates have dropped or stagnated as their population ages, and education and income levels increase. A continued and significant decline in the number of newborns and children in these countries could have a material adverse effect on our operating results.
Potential changes to trade laws, regulations and policies, related to or restricting global trade, may negatively affect our business.
The result of the November 2016 presidential election in the United States has introduced the potential of a tax reform package which may include tariffs and regulations affecting trade between the United States and other countries. We source a significant portion of our merchandise from manufacturers located outside the United States, primarily in Asia. Major developments in tax policy or trade relations, such as the disallowance of tax deductions for imported merchandise or the imposition of tariffs on imported products, could have a material adverse effect on our business, results of operations and liquidity.
14
We depend on key vendors to supply the merchandise that we sell to our customers and our vendors’ failure to supply quality merchandise in a timely manner may damage our reputation and brands and harm our business.
Our performance depends, in part, on our ability to purchase our merchandise in sufficient quantities at competitive prices. We purchase our merchandise from numerous international and domestic manufacturers and importers. We have no contractual assurances of continued supply, pricing or access to new products, and any vendor could change the terms under which they sell to us or discontinue selling to us at any time. We may not be able to purchase desired merchandise in sufficient quantities on terms acceptable to us in the future. Better than expected sales demand may also lead to customer backorders and lower in-stock positions of our merchandise.
In fiscal 2016, we had 3,600 active vendor relationships through which we procure the merchandise that we offer to our customers. For fiscal 2016, our top 20 vendors worldwide, based on our purchase volume in USD, represented 43% of the total products we purchased. An inability to purchase suitable merchandise on acceptable terms or the loss of one or more key vendors could have a negative effect on our business and operating results and could cause us to miss products that we feel are important to our assortment. We may not be able to develop relationships with new vendors, and products from alternative sources, if any, may be of a lesser quality and/or more expensive than those from existing vendors.
In addition, our vendors are subject to various risks, including raw material costs, inflation, labor disputes, union organizing activities, financial liquidity, product merchantability, inclement weather, natural disasters and general economic and political conditions that could limit our vendors’ ability to provide us with quality merchandise on a timely basis and at prices and payment terms that are commercially acceptable. For these or other reasons, one or more of our vendors might not adhere to our quality control standards, and we might not identify the deficiency before merchandise ships to our stores or customers. In addition, our vendors may have difficulty adjusting to our changing demands and growing business. Our vendors’ failure to manufacture or import quality merchandise in a timely and effective manner could damage our reputation and brands, and could lead to an increase in customer litigation against us and an increase in our routine and non-routine litigation costs. Further, any merchandise that does not meet our quality standards could become subject to a recall, which could damage our brand reputation and harm our business.
If our vendors fail to provide promotional support consistent with past levels, our sales, earnings and cash flow could be materially adversely affected.
Our vendors typically provide us with promotional support for the sale of their products in our stores and on our websites, including allowances for volume-related purchases. As part of this support, we receive allowances, payments and credits from the vendors which reduce our cost of goods sold, support the promotion and merchandising of the products we sell and drive sales at our stores and on our websites. We cannot provide assurance that vendors will continue to provide this support consistent with past levels. If our vendors fail to do so, our sales, earnings and cash flow could be materially adversely affected.
Our business operations could be disrupted if we are unable to protect the integrity and security of our customers’ information, or if our information technology systems, including our new internal e-commerce platform, fail to perform adequately.
A compromise of our security systems (or a design flaw in our system environment) could result in unauthorized access to certain personal information about our employees or customers (including credit card and gift registry information) which could materially adversely affect our reputation with our customers and others, and thus affect our sales and profitability. Other sophisticated retailers have recently suffered serious security breaches. A serious breach could negatively impact our operations, and could result in litigation against us or the imposition of penalties. In addition, a security breach could require that we expend significant additional resources related to our information security systems. Such risks may be difficult to adequately insure against or insurance may be costly.
We depend largely upon our information technology systems in the conduct of all aspects of our operations. If our information technology systems, including our new internal e-commerce platform, fail to perform as anticipated, or should we experience any delays or difficulties in transitioning to these or other new systems, or integrating these systems with our current systems, we could experience difficulties in virtually any area of our operations, including but not limited to replenishing inventories or in delivering our products to store locations and customers. Any of these or other systems-related problems could, in turn, materially adversely affect our sales and profitability.
We have substantial obligations under long-term leases that could materially adversely affect our financial condition and prevent us from fulfilling our obligations.
As of January 28, 2017, we leased 1,383 of our properties from third-parties pursuant to long-term space and ground leases. Total rent expense, net of sublease income, was $524 million, $546 million and $601 million for fiscals 2016, 2015 and 2014, respectively, and is expected to be approximately $495 million for fiscal 2017. Many of our leases provide for scheduled
15
increases in rent. The substantial obligations under our leases could further exacerbate the risks described below under “Our substantial indebtedness could adversely affect our ability to raise additional capital to fund our operations or refinance our maturing debt, limit our ability to react to changes in the economy or our industries, expose us to interest rate risk to the extent of our variable rate debt and prevent us from meeting our obligations under our various debt instruments.”
If we are unable to renew or replace our current store leases or if we are unable to enter into leases for additional stores on favorable terms, or if one or more of our current leases are terminated prior to expiration of their stated term and we cannot find suitable alternate locations, our growth and profitability could be negatively impacted.
We currently have ground leasehold interests in 14% and long-term space leasehold interests in 65% of our domestic and international store locations. Most of our current leases provide for our unilateral option to renew for several additional periods at specific rental rates. Our ability to re-negotiate favorable terms on an expiring lease or to negotiate favorable terms for a suitable alternate location or for additional store locations could depend on conditions in the real estate market, competition for desirable properties and our relationships with current and prospective landlords or may depend on other factors that are not within our control. Any or all of these factors and conditions could negatively impact our growth and profitability.
Our business, financial condition and results of operations are subject to risks arising from the international scope of our operations which could negatively impact our financial condition and results of operations.
We conduct a significant portion of our business outside the United States. For fiscals 2016, 2015 and 2014, 38%, 38% and 39% of our Net sales, respectively, were generated outside the United States. In addition, as of January 28, 2017 and January 30, 2016, 33% and 32% of our long-lived assets, respectively, were located outside of the United States. Weakened global economic conditions, particularly the weakened and unstable environment in parts of Europe and Asia, could continue to affect us through lower sales as a result of reduced demand and the effects of foreign currency translation. All of our foreign operations are subject to risks inherent in conducting business abroad, including the challenges of different economic conditions in each of the countries, possible nationalization or expropriation, price and currency exchange controls, fluctuations in the relative values of currencies as described below, limited protection of intellectual property in certain jurisdictions, political instability and restrictive governmental actions.
The products we sell are sourced from a variety of international suppliers, with China being a significant source. Additionally, a growing portion of our stores are located in China and as a consequence, our financial results are expected to become increasingly affected by our results in China, and our business is increasingly exposed to risks there. Political or financial instability, trade restrictions, labor unrest, transport capacity and costs, port security or other events that could slow port activities and affect foreign trade are beyond our control and could disrupt our supply of merchandise and/or materially adversely affect our results of operations. In addition, changes in the costs of procuring raw materials used in our merchandise or the costs related to our supply chain, including labor, fuel, tariffs, and currency exchange rates could have a material adverse effect on gross margin, expenses and results of operations.
In addition, any significant or prolonged deterioration in US - China relations could adversely affect our China business. Certain risks and uncertainties of doing business in China are solely within the control of the Chinese government, and Chinese law regulates the scope of our foreign investments and business conducted within China. There are also uncertainties regarding the interpretation and application of laws and regulations and the enforceability of intellectual property and contract rights in China.
Our business is subject to fluctuations in foreign currency exchange rates and such fluctuations may have a material adverse effect on our business, financial condition and results of operations.
Exchange rate fluctuations may affect the translated value of our earnings and cash flow associated with our international operations, as well as the translation of net asset or liability positions that are denominated in foreign currencies. In countries outside of the United States where we operate stores, we generate revenues and incur operating expenses and selling, general and administrative expenses denominated in local currencies. In many countries where we do not operate stores, our licensees pay royalties in USD. However, as the royalties are calculated based on local currency sales, our revenues are still impacted by fluctuations in exchange rates. In fiscal years 2016, 2015 and 2014, 38%, 38% and 39% of our Net sales, respectively, were transacted in a currency other than the USD, the majority of which were denominated in yen, Euros, Canadian dollars and pounds. In fiscal 2016, our reported operating earnings would have decreased or increased $32 million if all foreign currencies uniformly weakened or strengthened by an incremental 10% relative to the USD.
We enter into foreign exchange agreements from time to time with financial institutions to reduce our exposure to fluctuations in currency exchange rates referred to as hedging activities. However, these hedging activities may not eliminate foreign currency risk entirely and involve costs and risks of their own. Although we hedge some exposures to changes in foreign currency exchange rates arising in the ordinary course of business, foreign currency fluctuations may have a material adverse effect on our business, financial condition and results of operations.
16
Because of our extensive international operations, we could be adversely affected by violations of the United States Foreign Corrupt Practices Act and similar worldwide anti-bribery laws.
The United States Foreign Corrupt Practices Act and similar worldwide anti-bribery laws generally prohibit companies and their intermediaries from making improper payments to non-U.S. officials for the purpose of obtaining or retaining business. Our policies mandate compliance with these anti-bribery laws. We cannot provide assurance that our internal control policies and procedures always will protect us from reckless or criminal acts committed by our employees or agents. Violations of these laws, or allegations of such violations, could disrupt our business, damage our reputation and result in a material adverse effect on our financial condition, results of operations and cash flows.
International events could delay or prevent the delivery of products to our stores, which could negatively affect our sales and profitability.
A significant portion of products we sell are manufactured outside of the United States, primarily in Asia. As a result, any event causing a disruption of imports, including labor strikes, work stoppages, boycotts, safety issues on materials, the imposition of trade restrictions in the form of tariffs, embargoes or export controls, “anti-dumping” duties, port security or other events that could slow port activities, could increase the cost and reduce the supply of products available to us. In addition, port-labor issues, rail congestion and trucking shortages can have an impact on all direct importers. Although we attempt to anticipate and manage such situations, both our sales and profitability could be materially adversely impacted by any such developments in the future.
Our results may be materially adversely affected by fluctuations in raw material and energy costs.
Our results may be affected by the prices of the components and raw materials used in the manufacture of our toys and baby products. These prices may fluctuate based on a number of factors beyond our control, including: oil prices, changes in supply and demand, general economic conditions, labor costs, competition, import duties, tariffs, currency exchange rates and government regulation. In addition, energy costs have fluctuated dramatically in the past. These fluctuations may result in an increase in our transportation costs for distribution, utility costs for our retail stores and overall costs to purchase products from our vendors.
We may not be able to adjust the prices of our products, especially in the short-term, to recover these cost increases in raw materials and energy. A continual rise in raw material and energy costs could adversely affect consumer spending and demand for our products and increase our operating costs, both of which could have a material adverse effect on our financial condition and results of operations.
Labor shortages and increases in hourly wage rates could restrict our ability to operate our stores, grow our business or result in increased labor costs that could reduce our profits.
Our success depends in large part on our ability to attract, retain, train, manage and engage skilled employees. If we are unable to do so, our ability to adequately manage and staff our stores could be impaired, which could reduce customer satisfaction and sales. Staffing shortages also could hinder our ability to grow and expand our businesses. Payroll costs are a major component of the operating expenses at our stores. A shortage of skilled labor could require higher wages that would increase labor costs, which could adversely affect our profits. In addition, our hourly wage may increase as a result of market pressure and the minimum wage has increased or is scheduled to increase in multiple states and local jurisdictions and there is a possibility that Congress will increase the federal minimum wage. Increases in hourly wage rates could have a material adverse effect on our costs and profitability.
A significant disruption to our distribution network or to the timely receipt of inventory could adversely impact sales or increase our transportation costs, which would decrease our profits.
We rely on our ability to replenish depleted inventory in our stores through deliveries to our distribution centers from vendors and then from our distribution centers or direct ship vendors to our stores by various means of transportation, including shipments by sea, rail, air and truck. We rely on various third-party vendors to manage services related to the delivery of inventory from distribution centers to our stores. Unexpected delays in deliveries or increases in transportation costs (including from increased fuel costs) could significantly decrease our ability to generate sales and earn profits. In addition, labor shortages or labor disagreements in the transportation industry or long-term disruptions to the national and international transportation infrastructure that lead to delays or interruptions of deliveries could negatively affect our business.
Product safety issues, including product recalls, could harm our reputation, divert resources, reduce sales and increase costs.
The products we sell in our stores are subject to regulation by the Federal Consumer Product Safety Commission and similar state and international regulatory authorities. As a result, such products have been and could be in the future subject to recalls and other remedial actions. Product safety concerns may require us to voluntarily remove selected products from our stores.
17
Such recalls and voluntary removal of products can result in, among other things, lost sales, diverted resources, potential harm to our reputation and increased customer service costs, which could have a material adverse effect on our business, financial condition and results of operations.
Our business exposes us to personal injury and product liability claims which could result in adverse publicity and harm to our brands and our results of operations.
We are from time to time subject to claims due to the injury of an individual in our stores or on our property. In addition, we have in the past been subject to product liability claims for the products that we sell. Subject to certain exceptions, our purchase orders generally require the manufacturer to indemnify us against any product liability claims; however, if the manufacturer does not have insurance or becomes insolvent, there is a risk we would not be indemnified. Any personal injury or product liability claim made against us, whether or not it has merit, could be time consuming and costly to defend, resulting in adverse publicity, or damage to our reputation, and have an adverse effect on our results of operations.
Adverse litigation judgments or settlements resulting from legal proceedings in which we may be involved could expose us to monetary damages or limit our ability to operate our business.
We are involved in private actions, investigations and various other legal proceedings by employees, suppliers, competitors, government agencies or others. The results of such litigation, investigations and other legal proceedings are inherently unpredictable. Any claims against us, whether meritorious or not, could be time consuming, result in costly litigation, require significant amounts of management time and divert significant resources. If any of these legal proceedings were to be determined adversely to us, we could be exposed to monetary damages or limits on our ability to operate our business, which could have a material adverse effect on our business, financial condition and results of operations.
There is great uncertainty regarding the cost of healthcare which could have an impact on our business, financial condition and results of operations.
U.S. healthcare legislation has impacted our healthcare cost structure and it may, over time, increase our employee healthcare related expenses. Further regulatory action is expected as a result of the recent presidential election. Such action could result in changes to healthcare eligibility, design and cost structure that could have an impact on our business and results of operations.
We are subject to certain regulatory and legal requirements. If we fail to comply with regulatory or legal requirements, our business and results of operations may be materially adversely affected.
We are subject to numerous regulatory and legal requirements. Our policies, procedures and internal controls are designed to comply with all applicable laws and regulations, including those imposed by the Federal Trade Commission, the Sarbanes-Oxley Act of 2002 and the SEC. In addition, our business activities require us to comply with complex regulatory and legal issues on a local, national and worldwide basis (including, in some cases, more stringent local labor laws or regulations). Future legislative and regulatory actions relating to credit cards could also have an adverse impact on our credit card program and our sales. Additionally, we may be subject to new disclosure and reporting requirements, established under existing or new state or federal laws. Failure to comply with such laws and regulations could adversely affect our operations, involve significant expense, and divert management’s attention and resources from other matters, which in turn could materially harm our business and results of operations.
Natural disasters, inclement weather, pandemic outbreaks, terrorist acts or disruptive global political events could cause permanent or temporary distribution center or store closures, impair our ability to purchase, receive or replenish inventory, or decrease customer traffic, all of which could result in lost sales and otherwise materially adversely affect our financial performance.
The occurrence of one or more natural disasters, such as hurricanes, fires, floods, earthquakes, tornadoes and volcano eruptions, or inclement weather such as frequent or unusually heavy snow, ice or rain storms, or extended periods of unseasonable temperatures, or the occurrence of pandemic outbreaks, labor strikes, work stoppages, terrorist acts or disruptive global political events, such as civil unrest in countries in which we operate stores or our suppliers are located, or similar disruptions could materially adversely affect our operations and financial performance. To the extent these events impact one or more of our key vendors or result in the closure of one or more of our distribution centers or a significant number of stores, our operations and financial performance could be materially adversely affected through an inability to make deliveries to our stores and through lost sales. In addition, these events could result in increases in fuel (or other energy) prices or a fuel shortage, delays in opening new stores, the temporary lack of an adequate work force in a market, the temporary or long-term disruption in the supply of products from some local and overseas vendors, the temporary disruption in the transport of goods from overseas, delay in the delivery of goods to our distribution centers or stores, the temporary reduction in the availability of
18
products in our stores and disruption to our information systems. These events also can have indirect consequences such as increases in the costs of insurance if they result in significant loss of property or other insurable damage.
Our results of operations could suffer if we lose key management or are unable to attract and retain experienced senior management for our business.
Our future success depends to a significant degree on the skills, experience and efforts of our senior management team. The loss of services of any of these individuals, or the inability to attract and retain qualified individuals for key management positions, could harm our business and financial performance.
We utilize outsourcing arrangements for certain financial and other functions. By relying on third-party service providers we may come across unexpected obstacles that can disrupt our business operations.
We have outsourced certain financial and other functions to third-party service providers to achieve further operating efficiencies. Inadequate management or training of these providers can lead to lack of proper skill sets to effectively manage and execute the applicable processes. In addition, we are at risk of data security, losing visibility and control of the applicable processes and potential language barriers. If we do not effectively manage outsourcing relationships, if third-party providers do not perform efficiently or in a timely manner, or if we experience problems with transitioning the work to a third party, we may experience disruptions in transaction processing or information technology services all of which can negatively impact our business processes, reputation and customers.
We may experience fluctuations in our tax obligations and effective tax rate, which could materially adversely affect our results of operations.
We are subject to taxes in the United States and numerous international jurisdictions. We record tax expense based on current tax payments and our estimates of future tax payments, which include reserves for estimates of probable settlements of international and domestic tax audits. At any one time, many tax years are subject to audit by various taxing jurisdictions. The results of these audits and negotiations with taxing authorities may affect the ultimate settlement of these issues. As a result, we expect that throughout the year there could be ongoing variability in our quarterly tax rates as taxable events occur and exposures are re-evaluated. Further, our effective tax rate in a given financial statement period may be materially impacted by changes in tax laws, changes in the mix and level of earnings by taxing jurisdiction, changes to existing accounting rules or regulations, or by changes to our ownership or capital structures. Fluctuations in our tax obligations and effective tax rate could materially adversely affect our results of operations.
Changes to accounting rules or regulations may materially adversely affect our results of operations.
Changes to existing accounting rules or regulations may impact our future results of operations. New accounting rules or regulations and varying interpretations of existing accounting rules or regulations have occurred and may occur in the future. In February 2016, the Financial Accounting Standards Board (“FASB”) released new accounting rules, effective fiscal 2019, requiring companies to capitalize substantially all leases, including operating leases, in their financial statements. This change will require us to record a significant amount of lease related assets and liabilities on our balance sheet. These and other future changes to accounting rules or regulations may materially adversely affect our reported results of operations and financial position.
Our total assets include a substantial amount of property and equipment. Changes to estimates or projections related to such assets, or operating results that are lower than our current estimates at certain store locations, may cause us to incur impairment charges that could materially adversely affect our results of operations.
Our total assets include a substantial amount of property and equipment, in addition to goodwill. We make certain estimates and projections in connection with impairment analyses for these assets, in accordance with FASB Accounting Standards Codification (“ASC”) Topic 360, “Property, Plant and Equipment” (“ASC 360”), and ASC Topic 350, “Intangibles-Goodwill and Other” (“ASC 350”). We review the carrying value of these assets for impairment whenever events or changes in circumstances indicate that the carrying value of the asset may not be recoverable in accordance with ASC 360 or ASC 350. We will record an impairment loss when the carrying value of the underlying asset, asset group or reporting unit exceeds its fair value. These calculations require us to make a number of estimates and projections of future results. If these estimates or projections change, we may be required to record additional impairment charges on certain of these assets. If these impairment charges are significant, our results of operations could be materially adversely affected.
We may from time to time pursue acquisitions, which could have an adverse impact on our business, as could the integration of the businesses following acquisition.
We may from time to time acquire complementary companies or businesses. Acquisitions may result in unanticipated costs, delays or other operational or financial problems related to integrating the acquired company and business with our Company,
19
which may result in the diversion of our capital and our management’s attention from other business issues and opportunities. We may not be able to successfully integrate operations that we acquire, including their personnel, technology, financial systems, distribution and general business operations and procedures. We cannot provide assurance that any acquisition we make will be successful and our operating results may be adversely impacted by the integration of a new business and its financial results.
The Sponsors control us and may have conflicts of interest with us.
Investment funds or groups advised by or affiliated with the Sponsors currently control us through their ownership of 98% of our voting common stock. As a result, the Sponsors have control over our decisions to enter into any corporate transaction and have the ability to prevent any transaction that requires the approval of stockholders. In addition, the Sponsors may have an interest in pursuing dispositions, acquisitions, financings or other transactions that, in their judgment, could enhance their equity investments, even though such transactions might involve risks to us as a company.
The Sponsors may direct us to make significant changes to our business operations and strategy, including with respect to, among other things, store openings and closings, new product and service offerings, sales of real estate and other assets, employee headcount levels and initiatives to reduce costs and expenses. We cannot provide assurance that our future business operations will remain broadly in line with our existing operations or that significant real estate and other assets will not be sold.
The Sponsors are also in the business of making investments for their own accounts in companies, and may from time to time acquire and hold interests in businesses that compete directly or indirectly with us. One or more of the Sponsors may also pursue acquisition opportunities that may be complementary to our business and, as a result, those acquisition opportunities may not be available to us. So long as investment funds associated with or designated by the Sponsors continue to indirectly own a significant amount of the outstanding shares of our common stock, the Sponsors will continue to be able to strongly influence or effectively control our decisions.
Risks Related to Our Substantial Indebtedness
Our substantial indebtedness could adversely affect our ability to raise additional capital to fund our operations or refinance our maturing debt, limit our ability to react to changes in the economy or our industry, expose us to interest rate risk to the extent of our variable rate debt and prevent us from meeting our obligations under our various debt instruments.
We are, and we expect to continue to be, highly leveraged. As of January 28, 2017, our total indebtedness was $4.8 billion, of which $3.4 billion was secured indebtedness. Our substantial indebtedness could have significant consequences, including, among others, the following:
• | increasing our vulnerability to general economic and industry conditions; |
• | requiring a substantial portion of cash flows from operating activities to be dedicated to the payment of principal and interest on our indebtedness, and as a result, reducing our ability to use our cash flows to fund our operations and capital expenditures, capitalize on future business opportunities, expand our business and execute our strategy; |
• | increasing the difficulty for us to make scheduled payments on our outstanding debt and other obligations, as our business may not be able to generate sufficient cash flows from operating activities to meet our debt service obligations; |
• | exposing us to the risk of increased interest expense due to changes in borrowing spreads and short-term interest rates; |
• | causing us to make non-strategic divestitures; |
• | limiting our ability to obtain additional financing for working capital, capital expenditures, debt service requirements and general, corporate or other purposes; and |
• | limiting our ability to adjust to changing market conditions and reacting to competitive pressure, placing us at a competitive disadvantage compared to our competitors who are less leveraged. |
Despite our current level of indebtedness, we may still be able to incur substantially more debt. This could further exacerbate the risks to our financial condition described above.
We may be able to incur additional indebtedness in the future, including under our current outstanding credit facilities. Although our indentures, credit agreements and documents governing our other indebtedness contain restrictions on the incurrence of additional indebtedness, these restrictions are subject to a number of qualifications and exceptions, and the additional indebtedness incurred in compliance with these restrictions could be substantial. These restrictions also will not prevent us from incurring obligations that do not constitute indebtedness. If new indebtedness is added to our current debt levels, the related risks that we now face could intensify.
20
If our cash flows and capital resources are insufficient to fund our debt service obligations or we are unable to refinance our indebtedness, we may be forced to take other actions to satisfy our obligations under our indebtedness, which may not be successful.
Our ability to make scheduled payments on or to refinance our debt obligations depends on our financial condition and operating performance, which are subject to prevailing global economic and market conditions and to certain financial, business and other factors beyond our control. In addition, we and our subsidiaries may from time to time prepay, repurchase, refinance or otherwise acquire debt or debt securities issued by us or our subsidiaries in open market transactions, tender offers, exchange offers, privately negotiated transactions or otherwise. Such exchanges or refinancings may include the issuance or guarantee of debt by certain of our subsidiaries, and may be accompanied by transactions or asset transfers among certain of our subsidiaries. Any debt issued in such transactions may be issued or guaranteed by entities that are not obligors on the debt being refinanced, and may have liens on assets that are not pledged to secure the debt being refinanced. Any such transactions, and the amounts involved, will depend on prevailing market conditions, liquidity requirements, contractual restrictions and other factors. The amounts involved may be material. Even if we were able to refinance or obtain additional financing, the costs of new indebtedness could be substantially higher than the costs of our existing indebtedness.
As of January 28, 2017, we had approximately $446 million of final debt maturities within two years. We believe we will have the ability to refinance, or repay a portion and refinance the balance of, this debt prior to their respective maturity dates; however, a number of factors including factors beyond our control could reduce or restrict our ability to refinance these debt obligations on favorable terms.
If our cash flows and capital resources are insufficient to fund our debt service obligations or we are unable to refinance our indebtedness, we could face substantial liquidity problems, and we may be forced to reduce or delay investments and capital expenditures, or to sell assets, seek additional capital or restructure our indebtedness. These alternative measures may not be successful and may not permit us to meet our debt obligations. If we were unable to repay amounts when due, the holders of our debt could proceed against the issuers or guarantors of that debt, and the collateral granted to them to secure that debt, if any. Additionally, a failure to repay amounts when due under certain debt will likely constitute an event of default and entitle the holders of other debt to accelerate or otherwise proceed against the issuers or guarantors of such debt.
Our debt agreements contain covenants that limit our flexibility in operating our business.
Toys “R” Us, Inc. is a holding company and conducts its operations through its subsidiaries, certain of which have incurred their own indebtedness. As specified in certain of our subsidiaries’ debt agreements, there are restrictions on our ability to obtain funds from our subsidiaries through dividends, loans or advances. The agreements governing our indebtedness contain various covenants that limit our ability to engage in specified types of transactions, and may materially adversely affect our ability to operate our business and refinance our indebtedness. Among other things, these covenants limit our ability to:
• | incur certain additional indebtedness; |
• | transfer assets between and among Toys “R” Us, Inc. and our various subsidiaries; |
• | pay dividends on, repurchase or make distributions with respect to our or our subsidiaries’ capital stock or make other restricted payments; |
• | issue stock of subsidiaries; |
• | make certain investments, loans or advances; |
• | transfer and sell certain assets; |
• | create or permit liens on assets; |
• | consolidate, merge, sell or otherwise dispose of all or substantially all of our assets; |
• | enter into certain transactions with our affiliates; and |
• | amend certain documents. |
A breach of any of these covenants could result in default under one or more of our debt agreements, which could prompt the lenders to declare all amounts outstanding under one or more of our debt agreements to be immediately due and payable and terminate all commitments to extend further credit. If we were unable to repay those amounts, our secured lenders could proceed against the collateral granted to them to secure that indebtedness. If the lenders under the debt agreements accelerate the repayment of borrowings, we cannot ensure that we will have sufficient assets and funds to repay the borrowings under our debt agreements.
ITEM 1B. | UNRESOLVED STAFF COMMENTS |
None.
21
ITEM 2. | PROPERTIES |
The following summarizes our worldwide operating stores and distribution centers as of January 28, 2017 (excluding licensed operations in our International segment):
Owned | Ground Leased (1) | Leased (2) | Total | Total Gross Square Feet (3) (In millions) | |||||||||||
Stores: | |||||||||||||||
Domestic | 274 | 212 | 393 | 879 | 35 | ||||||||||
International | 78 | 26 | 708 | 812 | 21 | ||||||||||
352 | 238 | 1,101 | 1,691 | 56 | |||||||||||
Distribution Centers: | |||||||||||||||
Domestic | 7 | — | 1 | 8 | 7 | ||||||||||
International | 5 | — | 5 | 10 | 4 | ||||||||||
12 | — | 6 | 18 | 11 | |||||||||||
Total Operating Stores and Distribution Centers | 364 | 238 | 1,107 | 1,709 | 67 | ||||||||||
(1) | Owned buildings on leased land. |
(2) | This includes 48 and 16 Long-Term Express stores within our Domestic and International segments, respectively, and excludes the remaining 10 and 29 Temporary Express store locations within our Domestic and International segments, respectively, which remained open as of January 28, 2017. During the fiscal 2016 holiday selling season, we operated 74 Domestic and 52 International Express stores. |
(3) | Represents total square footage occupied, excluding any space dedicated to catwalks, parking lots and decks. |
Refer to Item 1 “Business—Geographic Distribution of Domestic Stores” and “Business—Geographic Distribution of International Stores” of this Annual Report on Form 10-K.
As described above, a significant part of our properties are ground leased (i.e. properties where we own the building but we do not retain fee ownership in the underlying land) or space leased (i.e. we lease a store from a property owner). We lease substantially all of our properties from unrelated third parties, pursuant to leases that vary as to their terms, rental provisions and expiration dates. Substantially all of our leases are considered triple-net leases, which require us to pay all costs and expenses arising in connection with the ownership, operation, leasing, use, maintenance and repair of these properties. These costs include real estate taxes and assessments, utility charges, license and permit fees and insurance premiums, among other things. Virtually all of our leases include options that allow us to renew or extend the lease term beyond the initial lease period, subject to terms and conditions. In addition, some of our leases include early termination options, which we may exercise under specified conditions, including, upon damage, destruction or condemnation of a specified percentage of the value or land area of the property. A portion of our leased stores have contingent rentals, where the lease payments depend on factors that are not measurable at the inception of the lease, such as future sales volume. Contingent rent expense was $12 million, $12 million and $10 million for fiscals 2016, 2015 and 2014, respectively.
We own our Global Resource Center, comprising 585,000 square feet of space, in Wayne, New Jersey.
As of January 28, 2017, we maintained 71 former stores that are no longer part of our operations. Approximately half of these surplus facilities are owned and the remaining locations are leased. We have tenants in the majority of these facilities, and we continue to market those facilities without tenants for disposition or leasing opportunities. The net costs associated with these facilities are reflected in our Consolidated Financial Statements, but the number of surplus facilities is not included above.
Portions of our debt are secured by direct and indirect interests in certain of our properties. Refer to Note 2 to the Consolidated Financial Statements entitled “SHORT-TERM BORROWINGS AND LONG-TERM DEBT” for further details.
ITEM 3. | LEGAL PROCEEDINGS |
We are, and in the future may be, involved in various lawsuits, claims and proceedings incident to the ordinary course of business. The results of litigation are inherently unpredictable. Any claims against us, whether meritorious or not, could be time consuming, result in costly litigation, require significant amounts of management time and result in diversion of significant resources. We are not able to estimate an aggregate amount or range of reasonably possible losses for those legal matters for which losses are not probable and estimable, primarily for the following reasons: (i) many of the relevant legal proceedings are in preliminary stages, and until such proceedings develop further, there is often uncertainty regarding the
22
relevant facts and circumstances at issue and potential liability; and (ii) many of these proceedings involve matters of which the outcomes are inherently difficult to predict. However, based upon our historical experience with similar matters, we do not expect that any such additional losses would be material to our consolidated financial position, results of operations or cash flows.
ITEM 4. | MINE SAFETY DISCLOSURES |
None.
23
PART II
ITEM 5. | MARKET FOR THE REGISTRANT’S COMMON EQUITY, RELATED STOCKHOLDER MATTERS AND ISSUER PURCHASES OF EQUITY SECURITIES |
Our shares of common stock, $0.001 par value (“Common Stock”) are privately held by our Sponsors, our officers, certain current and former employees and a private investor and there is no established public trading market for our Common Stock. As of March 17, 2017, there were approximately 300 holders of our Common Stock. During fiscals 2016, 2015 and 2014, no dividends were paid out to shareholders. Refer to Note 2 to our Consolidated Financial Statements entitled “SHORT-TERM BORROWINGS AND LONG-TERM DEBT” for a discussion of our debt agreements which restrict our ability to pay dividends and obtain funds from certain of our subsidiaries through dividends, loans or advances.
ITEM 6. | SELECTED FINANCIAL DATA |
Fiscal Years Ended (1) | ||||||||||||||||||||
(In millions, except number of stores) | January 28, 2017 | January 30, 2016 | January 31, 2015 | February 1, 2014 | February 2, 2013 | |||||||||||||||
Statement of Operations Data: | ||||||||||||||||||||
Net sales | $ | 11,540 | $ | 11,802 | $ | 12,361 | $ | 12,543 | $ | 13,543 | ||||||||||
Net (loss) earnings (2) | (29 | ) | (124 | ) | (288 | ) | (1,036 | ) | 39 | |||||||||||
Net (loss) earnings attributable to Toys “R” Us, Inc. (2) | (36 | ) | (130 | ) | (292 | ) | (1,039 | ) | 38 | |||||||||||
Balance Sheet Data (end of period): | ||||||||||||||||||||
Working capital | $ | 651 | $ | 490 | $ | 355 | $ | 704 | $ | 1,171 | ||||||||||
Property and equipment, net | 3,067 | 3,163 | 3,335 | 3,638 | 3,891 | |||||||||||||||
Total assets (3) | 6,908 | 6,910 | 7,017 | 7,447 | 8,842 | |||||||||||||||
Total debt (3)(4) | 4,761 | 4,685 | 4,690 | 4,917 | 5,264 | |||||||||||||||
Total (deficit) equity | (1,292 | ) | (1,265 | ) | (1,095 | ) | (656 | ) | 485 | |||||||||||
Store Count Data (end of period): | ||||||||||||||||||||
Domestic | 879 | 866 | 872 | 873 | 875 | |||||||||||||||
International - Operated | 812 | 756 | 730 | 704 | 665 | |||||||||||||||
Total Operated | 1,691 | 1,622 | 1,602 | 1,577 | 1,540 | |||||||||||||||
International - Licensed | 257 | 252 | 212 | 185 | 163 | |||||||||||||||
Non-GAAP Financial Measure: | ||||||||||||||||||||
Adjusted EBITDA (5) | $ | 792 | $ | 800 | $ | 642 | $ | 583 | $ | 1,019 | ||||||||||
(1) | Our fiscal year ends on the Saturday nearest to January 31 of each calendar year. With the exception of fiscal 2012, which included 53 weeks, all other fiscal years presented include 52 weeks. |
(2) | Refer to the Adjusted EBITDA table within this section for certain income and expense items that management believes make it more difficult to assess the Company’s actual operating performance. |
(3) | In accordance with the retrospective adoption of Accounting Standards Update (“ASU”) 2015-03 and ASU 2015-15, we revised the balance sheet presentation of debt issuance costs from Other assets to a deduction from the carrying amount of Long-term debt on the Consolidated Balance Sheet as of January 30, 2016. For further details, refer to Note 1 to our Consolidated Financial Statements entitled “SUMMARY OF SIGNIFICANT ACCOUNTING POLICIES.” |
(4) | Includes current portion of long-term debt and short-term borrowings. For further details, refer to Note 2 to our Consolidated Financial Statements entitled “SHORT-TERM BORROWINGS AND LONG-TERM DEBT.” |
(5) | Adjusted EBITDA is defined as EBITDA (earnings (loss) before net interest expense (income), income tax expense (benefit), depreciation and amortization), as further adjusted to exclude the effects of certain income and expense items that management believes make it more difficult to assess the Company’s actual operating performance including certain items which are generally non-recurring. We have excluded the impact of such items from internal performance assessments. We believe that excluding items such as Sponsors’ management and advisory fees, goodwill and asset impairment charges, severance, restructuring charges, impact of litigation, store closure costs, noncontrolling |
24
interest, gains on sales of assets and other charges, helps investors compare our operating performance with our results in prior periods. We believe it is appropriate to exclude these items as they are not related to ongoing operating performance and, therefore, limit comparability between periods and between us and similar companies.
We believe Adjusted EBITDA is useful to investors because it is frequently used by securities analysts, investors and other interested parties in the evaluation of companies in our industry. Investors in the Company regularly request Adjusted EBITDA as a supplemental analytical measure to, and in conjunction with, the Company’s financial data prepared in accordance with accounting principles generally accepted in the United States (“GAAP”). We understand that investors use Adjusted EBITDA, among other things, to assess our period-to-period operating performance and to gain insight into the manner in which management analyzes operating performance.
In addition, we believe that Adjusted EBITDA is useful in evaluating our operating performance compared to that of other companies in our industry because the calculation of EBITDA and Adjusted EBITDA generally eliminates the effects of financing and income taxes and the accounting effects of capital spending and acquisitions, which items may vary for different companies for reasons unrelated to overall operating performance. We use the non-GAAP financial measures for planning and forecasting and measuring results against the forecast and in certain cases we use similar measures for bonus targets for certain of our employees. Using several measures to evaluate the business allows us and investors to assess our relative performance against our competitors.
Although we believe that Adjusted EBITDA can make an evaluation of our operating performance more consistent because it removes items that do not reflect our core operations, other companies, even in the same industry, may define Adjusted EBITDA differently than we do. As a result, it may be difficult to use Adjusted EBITDA or similarly named non-GAAP measures that other companies may use to compare the performance of those companies to our performance. The Company does not, and investors should not, place undue reliance on EBITDA or Adjusted EBITDA as measures of operating performance.
A reconciliation of Net (loss) earnings attributable to Toys “R” Us, Inc. to EBITDA and Adjusted EBITDA is as follows:
Fiscal Years Ended | ||||||||||||||||||||
(In millions) | January 28, 2017 | January 30, 2016 | January 31, 2015 | February 1, 2014 | February 2, 2013 | |||||||||||||||
Net (loss) earnings attributable to Toys “R” Us, Inc. | $ | (36 | ) | $ | (130 | ) | $ | (292 | ) | $ | (1,039 | ) | $ | 38 | ||||||
Add: | ||||||||||||||||||||
Income tax expense | 34 | 76 | 32 | 169 | 53 | |||||||||||||||
Interest expense, net | 455 | 426 | 447 | 517 | 464 | |||||||||||||||
Depreciation and amortization | 317 | 343 | 377 | 388 | 407 | |||||||||||||||
EBITDA | 770 | 715 | 564 | 35 | 962 | |||||||||||||||
Adjustments: | ||||||||||||||||||||
Certain transaction costs (a) | 24 | 13 | (2 | ) | 1 | 5 | ||||||||||||||
Compensation expense (b) | 21 | 24 | 22 | 3 | 2 | |||||||||||||||
Severance | 9 | 24 | 17 | 13 | 3 | |||||||||||||||
Net earnings attributable to noncontrolling interest (c) | 7 | 6 | 4 | 3 | 1 | |||||||||||||||
Sponsors’ management and advisory fees (d) | 6 | 6 | 18 | 22 | 21 | |||||||||||||||
Litigation (e) | 5 | (1 | ) | (8 | ) | 23 | 1 | |||||||||||||
Impairment of long-lived assets (f) | 4 | 16 | 13 | 44 | 11 | |||||||||||||||
Gains on sales of assets (g) | (46 | ) | (20 | ) | (5 | ) | (8 | ) | (4 | ) | ||||||||||
Foreign currency re-measurement (h) | (7 | ) | 11 | 15 | — | — | ||||||||||||||
Store closure costs (i) | (1 | ) | 7 | 4 | 2 | 7 | ||||||||||||||
Property losses, net of insurance recoveries (j) | — | (1 | ) | (9 | ) | — | 8 | |||||||||||||
Obsolete inventory clearance (k) | — | — | 9 | 51 | — | |||||||||||||||
Goodwill impairment (l) | — | — | — | 378 | — | |||||||||||||||
Prior period adjustments (m) | — | — | — | 16 | — | |||||||||||||||
Restructuring (n) | — | — | — | — | 2 | |||||||||||||||
Adjusted EBITDA | $ | 792 | $ | 800 | $ | 642 | $ | 583 | $ | 1,019 | ||||||||||
25
(a) | Fiscals 2016 and 2015 primarily represent expenses associated with the transition of our U.S. e-commerce operations and other transaction costs. |
(b) | Primarily represents the incremental compensation expense related to certain one-time awards and modifications, net of forfeitures of certain officers’ awards. |
(c) | Represents noncontrolling interests in Asia JV. |
(d) | Represents fees expensed to the Sponsors in accordance with the advisory agreement. In June 2015, the advisory agreement was amended in order to reduce the advisory fees payable in fiscal 2015 and thereafter from $17 million to $6 million annually. Refer to Note 16 to our Consolidated Financial Statements entitled “RELATED PARTY TRANSACTIONS” for further details. |
(e) | Represents certain litigation expenses and settlements recorded for legal matters. Refer to Note 14 to our Consolidated Financial Statements entitled “LITIGATION AND LEGAL PROCEEDINGS” for further details. |
(f) | Asset impairments primarily due to the identification of underperforming stores, the relocation of certain stores and property sales. Refer to Note 1 to our Consolidated Financial Statements entitled “SUMMARY OF SIGNIFICANT ACCOUNTING POLICIES” and Note 4 to our Consolidated Financial Statements entitled “FAIR VALUE MEASUREMENTS” for further details. |
(g) | Represents sales of properties and intellectual property. Refer to Note 1 to our Consolidated Financial Statements entitled “SUMMARY OF SIGNIFICANT ACCOUNTING POLICIES” and Note 5 to our Consolidated Financial Statements entitled “PROPERTY AND EQUIPMENT” for further details. |
(h) | Represents the unrealized (gain) loss on foreign exchange related to the re-measurement of the portion of the tranche of loans in an aggregate principal amount of $280 million due fiscal 2019 (the “Tranche A-1 Loan”) attributed to Toys “R” Us (Canada) Ltd. Toys “R” Us (Canada) Ltee (“Toys-Canada”), an indirect wholly-owned subsidiary. Refer to Note 1 to our Consolidated Financial Statements entitled “SUMMARY OF SIGNIFICANT ACCOUNTING POLICIES” for further details. |
(i) | Represents store closure costs, net of lease surrender income. |
(j) | Represents property losses, the write-off of damaged assets and repairs from a hurricane that hit the east coast of the United States, store fires in Australia, and an earthquake and resulting tsunami that hit the Northeast coast of Japan, net of insurance claims recognized. |
(k) | Represents the incremental expense related to the clearance of excess and obsolete inventory, as well as, third party fees associated with these efforts. |
(l) | Represents the impairment of goodwill associated with our Toys-Domestic and Toys-Japan reporting units. Refer to “CRITICAL ACCOUNTING POLICIES” within Item 7 entitled “MANAGEMENT’S DISCUSSION AND ANALYSIS OF FINANCIAL CONDITION AND RESULTS OF OPERATIONS” for further details. |
(m) | Represents a non-cash cumulative correction of prior period accrued vacation accounting in fiscal 2013, partially offset by the non-cash cumulative correction of accounting for e-commerce prior period sales. |
(n) | Represents additional charges related to our 2003 and 2005 restructuring activities primarily due to changes in management’s estimates for events such as lease terminations, assignments and sublease income adjustments. |
ITEM 7. | MANAGEMENT’S DISCUSSION AND ANALYSIS OF FINANCIAL CONDITION AND RESULTS OF OPERATIONS |
The following Management’s Discussion and Analysis of Financial Condition and Results of Operations (“MD&A”) is intended to help facilitate an understanding of our historical results of operations during the periods presented and our financial condition. Throughout this MD&A when discussing our results of operations, we refer to the impact of foreign currency translation on our International results. Transactions in our International segment are recorded in each market’s functional currency, then converted to U.S. Dollar for financial reporting. We calculate the effect of changes in foreign currency exchange rates by measuring the difference between current period activity translated at the current period’s foreign exchange rates and current period activity translated at last period’s rates. This MD&A should be read in conjunction with our Consolidated Financial Statements and the accompanying notes, and contains forward-looking statements that involve risks and uncertainties. Refer to “Forward-Looking Statements” and Item 1A entitled “RISK FACTORS” of this Annual Report on Form 10-K. Our MD&A includes the following sections:
EXECUTIVE OVERVIEW provides an overview of our business.
RESULTS OF OPERATIONS provides an analysis of our financial performance and of our consolidated and segment results of operations for fiscal 2016 compared to fiscal 2015 and fiscal 2015 compared to fiscal 2014.
26
LIQUIDITY AND CAPITAL RESOURCES provides an overview of our financing, capital expenditures, cash flows and contractual obligations.
CRITICAL ACCOUNTING POLICIES provides a discussion of our accounting policies that require critical judgment, assumptions and estimates.
RECENTLY ADOPTED ACCOUNTING PRONOUNCEMENTS provides a brief description of significant accounting standards which were adopted during fiscal 2016. This section also refers to Note 18 to our Consolidated Financial Statements entitled “RECENT ACCOUNTING PRONOUNCEMENTS” for accounting standards which we have not yet been required to implement and may be applicable to our future operations.
EXECUTIVE OVERVIEW
Our Business
We are the leading global specialty retailer of toys and baby products as measured by Net sales. We believe our Toys “R” Us and Babies “R” Us brands are recognized as the toy and baby authority. We sell a variety of products in the baby, core toy, entertainment, learning and seasonal categories through our omnichannel offerings that leverage the synergies between our brick-and-mortar stores and e-commerce.
As of January 28, 2017, we operated 1,691 stores and licensed an additional 257 stores, which are located in 38 countries and jurisdictions around the world. We operate our stores under the Toys “R” Us and Babies “R” Us banners and also have smaller format Outlet stores and Express stores. Our omnichannel presence includes our Toysrus.com and Babiesrus.com sites, as well as other e-commerce sites in our international markets. For fiscal 2016, we generated Net sales of $11,540 million, resulting in Net loss attributable to Toys “R” Us, Inc. of $36 million and Adjusted EBITDA of $792 million. For the definition of Adjusted EBITDA, an explanation of why we present it and a description of the limitations of this non-GAAP measure, as well as a reconciliation to Net loss attributable to Toys “R” Us, Inc., refer to Item 6 entitled “SELECTED FINANCIAL DATA” of this Annual Report on Form 10-K.
Our brand names are highly recognized in North America, Europe and Asia, and our expertise in the toy and baby products retail space, substantial scale and geographic footprint and strong vendor relationships account for our market-leading position and distinguish us from the competition.
Every day we strive to improve the customer experience in our stores and online. This enables us to bring joy into the lives of our customers by being the toy and baby authority and definitive destination for kid fun, gift-giving solutions and parenting services. Compared with multi-line mass merchandisers, we believe we are able to provide more knowledgeable service to our customers through our highly trained sales force. We train our store team members to deepen their product knowledge and enhance their targeted selling skills in order to improve customer service.
Our Business Segments
Our business has two reportable segments: Domestic and International. Refer to Note 11 to our Consolidated Financial Statements entitled “SEGMENTS” for our segments’ financial results. The following is a brief description of our segments:
• | Domestic — Our Domestic segment sells a variety of products through 879 stores that operate in 49 states in the United States, Puerto Rico and Guam and through e-commerce. As of January 28, 2017, our Domestic stores consisted of 358 traditional toy stores, 223 baby stores, 212 SBS stores, 48 Long-Term Express stores and 38 Outlets, as well as Temporary Express locations. Domestic Net sales were $7,131 million for fiscal 2016, which accounted for 62% of our consolidated Net sales. |
• | International — Our International segment sells a variety of products through 812 operated and 257 licensed stores in 37 countries and jurisdictions and through e-commerce. As of January 28, 2017, our International stores consisted of 574 traditional toy stores, 208 SBS stores, 16 Long-Term Express stores and 14 baby stores, as well as Temporary Express locations. International Net sales were $4,409 million for fiscal 2016, which accounted for 38% of our consolidated Net sales. |
In order to properly judge our business performance, it is necessary to be aware of the challenges and risks we face. Refer to the “Forward-Looking Statements” and Item 1A entitled “RISK FACTORS” of this Annual Report on Form 10-K for further details. The risks and uncertainties described are not the only ones that we face. Additional risks and uncertainties not presently known to us, or that we currently believe to be less significant, may also adversely affect our business and operations. If any of the risks actually occur, our business, financial condition, cash flows or results of operations could be materially adversely affected.
27
RESULTS OF OPERATIONS
Financial Performance
As discussed in more detail in this MD&A, the following financial data represents an overview of our financial performance for fiscals 2016, 2015 and 2014:
Fiscal Years Ended | ||||||||||||
($ In millions) | January 28, 2017 | January 30, 2016 | January 31, 2015 | |||||||||
Net sales | $ | 11,540 | $ | 11,802 | $ | 12,361 | ||||||
Same store sales | (1.4 | )% | 0.9 | % | 0.0 | % | ||||||
Gross margin | $ | 4,108 | $ | 4,226 | $ | 4,430 | ||||||
Gross margin as a percentage of Net sales | 35.6 | % | 35.8 | % | 35.8 | % | ||||||
Selling, general and administrative expenses (“SG&A”) | $ | 3,480 | $ | 3,593 | $ | 3,915 | ||||||
SG&A as a percentage of Net sales | 30.2 | % | 30.4 | % | 31.7 | % | ||||||
Net loss attributable to Toys “R” Us, Inc. | $ | (36 | ) | $ | (130 | ) | $ | (292 | ) | |||
Non-GAAP Financial Measure: | ||||||||||||
Adjusted EBITDA (1) | $ | 792 | $ | 800 | $ | 642 | ||||||
(1) | For an explanation of Adjusted EBITDA as a measure of the Company’s operating performance and a reconciliation to Net loss attributable to Toys “R” Us, Inc., refer to Item 6 entitled “SELECTED FINANCIAL DATA” of this Annual Report on Form 10-K. |
Fiscal 2016 financial highlights:
• | Net sales decreased by $262 million compared to the prior year, predominantly due to a decrease in same store sales and Domestic store closures. |
• | Consolidated same store sales decreased by 1.4 percentage points due to a decline in both our International and Domestic segments. |
• | Gross margin, as a percentage of Net sales, (“Gross margin rate”) decreased in our Domestic segment due to higher shipping costs associated with increased e-commerce sales, partially offset by an increase in our International segment. |
• | SG&A decreased by $113 million primarily due to reductions in annual bonus expense and flagship store operating costs. |
• | Net loss attributable to Toys “R” Us, Inc. decreased by $94 million. |
Fiscal 2015 financial highlights:
• | Net sales decreased by $559 million compared to the prior year. Excluding a $571 million negative impact of foreign currency translation, Net sales increased by $12 million. |
• | Consolidated same store sales increased by 0.9 percentage points driven by growth in our International segment. |
• | Gross margin, as a percentage of Net sales, (“Gross margin rate”) remained consistent with the prior year. |
• | SG&A decreased by $322 million primarily due to a favorable impact from foreign currency translation and reductions in payroll, advertising and occupancy expenses. |
• | Net loss attributable to Toys “R” Us, Inc. decreased by $162 million. |
Same Store Sales
In computing same store sales, we include stores that have been open for at least 56 weeks from their “soft” opening date. A soft opening is typically two weeks prior to the grand opening. Long-Term Express stores that have been open for at least 56 weeks from their soft opening date are also included in the computation of same store sales.
Our same store sales computation includes the following:
• | stores that have been remodeled while remaining open; |
• | stores that have been relocated and/or expanded to new buildings within the same trade area, in which the new store opens at about the same time as the old store closes; |
• | stores that have expanded or contracted within their current locations; and |
28
• | sales from our e-commerce businesses. |
By measuring the year-over-year sales of merchandise in the stores that have been open for 56 weeks or more and online, we can better gauge how the core store base and e-commerce business is performing since same store sales excludes the impact of store openings and closings. We calculate International same store sales by applying prior year foreign exchange rates to both current year and prior year sales to provide a consistent basis for comparison.
Various factors affect same store sales, including the number of and timing of stores we open, close, convert, relocate, expand or contract, the number of transactions, the average transaction amount, the general retail sales environment, current local and global economic conditions, consumer preferences and buying trends, changes in sales mix among distribution channels, our ability to efficiently source and distribute products, changes in our merchandise mix, competition, the timing of the release of new merchandise and our promotional events, the success of marketing programs and the cannibalization of existing store net sales by new stores. Among other things, weather conditions, terrorism and catastrophic events can affect same store sales because they may discourage travel or require temporary store closures, thereby reducing customer traffic. These factors have caused our same store sales to fluctuate significantly in the past on a monthly, quarterly and annual basis and, as a result, we expect that same store sales will continue to fluctuate in the future.
The changes in our same store sales by segment for fiscals 2016, 2015 and 2014 are as follows:
Fiscal Years Ended | |||||||||
January 28, 2017 | January 30, 2016 | January 31, 2015 | |||||||
Domestic | (1.3 | )% | (0.6 | )% | (1.0 | )% | |||
International | (1.6 | )% | 3.2 | % | 1.8 | % | |||
Toys “R” Us - Consolidated | (1.4 | )% | 0.9 | % | 0.0 | % | |||
Percentage of Net Sales by Product Category
Fiscal Years Ended | |||||||||
Domestic: | January 28, 2017 | January 30, 2016 | January 31, 2015 | ||||||
Baby | 35.9 | % | 36.0 | % | 36.9 | % | |||
Core Toy | 19.1 | % | 18.3 | % | 17.1 | % | |||
Entertainment | 7.2 | % | 9.0 | % | 10.2 | % | |||
Learning | 24.1 | % | 23.4 | % | 22.6 | % | |||
Seasonal | 13.1 | % | 12.4 | % | 12.2 | % | |||
Other (1) | 0.6 | % | 0.9 | % | 1.0 | % | |||
Total | 100 | % | 100 | % | 100 | % | |||
(1) | Consists primarily of non-product related revenues. |
Fiscal Years Ended | |||||||||
International: | January 28, 2017 | January 30, 2016 | January 31, 2015 | ||||||
Baby | 21.3 | % | 20.5 | % | 20.2 | % | |||
Core Toy | 23.5 | % | 23.2 | % | 23.5 | % | |||
Entertainment | 6.0 | % | 7.1 | % | 8.5 | % | |||
Learning | 33.0 | % | 32.8 | % | 31.1 | % | |||
Seasonal | 15.4 | % | 15.7 | % | 15.9 | % | |||
Other (1) | 0.8 | % | 0.7 | % | 0.8 | % | |||
Total | 100 | % | 100 | % | 100 | % | |||
(1) | Consists primarily of non-product related revenues, including licensing revenue from unaffiliated third parties. |
From time to time, we may make revisions to our prior period Net sales by product category to conform to the current period allocation. These revisions did not have a significant impact to our prior year disclosure.
29
Store Count by Segment
Domestic | International | Total Operated | |||||||
January 31, 2015 | 872 | 730 | 1,602 | ||||||
Opened | 15 | 49 | 64 | ||||||
Closed | (21 | ) | (23 | ) | (44 | ) | |||
January 30, 2016 | 866 | 756 | 1,622 | ||||||
Opened | 29 | 73 | 102 | ||||||
Closed | (16 | ) | (17 | ) | (33 | ) | |||
January 28, 2017 | 879 | 812 | 1,691 | ||||||
Store Type | Domestic | International | Toys “R” Us - Consolidated | |||||||||||||||
January 28, 2017 | January 30, 2016 | January 28, 2017 (1) | January 30, 2016 | January 28, 2017 | January 30, 2016 | |||||||||||||
Traditional Toy | 358 | 361 | 574 | 534 | 932 | 895 | ||||||||||||
SBS | 212 | 213 | 208 | 202 | 420 | 415 | ||||||||||||
Baby | 223 | 224 | 14 | 15 | 237 | 239 | ||||||||||||
Long-Term Express | 48 | 42 | 16 | 5 | 64 | 47 | ||||||||||||
Outlet | 38 | 26 | — | — | 38 | 26 | ||||||||||||
Total Operated | 879 | 866 | 812 | 756 | 1,691 | 1,622 | ||||||||||||
Excluded from store count: | ||||||||||||||||||
Licensed | — | — | 257 | 252 | 257 | 252 | ||||||||||||
Temporary Express | 10 | 31 | 29 | 25 | 39 | 56 | ||||||||||||
(1) | The net increase in International stores compared to the prior year is primarily due to 38 stores in China and Southeast Asia. |
Fiscal 2016 Compared to Fiscal 2015
Net Loss Attributable to Toys “R” Us, Inc.
(In millions) | Fiscal 2016 | Fiscal 2015 | Change | |||||||||
Toys “R” Us - Consolidated | $ | (36 | ) | $ | (130 | ) | $ | 94 | ||||
Net loss attributable to Toys “R” Us, Inc. decreased by $94 million to $36 million in fiscal 2016, compared to $130 million in fiscal 2015. The improvement was primarily due to a $113 million reduction in SG&A, an increase in Other income, net of $61 million and a $42 million decrease in Income tax expense, partially offset by a $118 million decline in Gross margin.
Net Sales
Percentage of Net sales | |||||||||||||||||||||
($ In millions) | Fiscal 2016 | Fiscal 2015 | $ Change | % Change | Fiscal 2016 | Fiscal 2015 | |||||||||||||||
Domestic | $ | 7,131 | $ | 7,356 | $ | (225 | ) | (3.1 | )% | 61.8 | % | 62.3 | % | ||||||||
International | 4,409 | 4,446 | (37 | ) | (0.8 | )% | 38.2 | % | 37.7 | % | |||||||||||
Toys “R” Us - Consolidated | $ | 11,540 | $ | 11,802 | $ | (262 | ) | (2.2 | )% | 100.0 | % | 100.0 | % | ||||||||
Net sales decreased by $262 million or 2.2%, to $11,540 million in fiscal 2016, compared to $11,802 million in fiscal 2015. The impact of foreign currency translation increased Net sales by $12 million in fiscal 2016.
Excluding the impact of foreign currency translation, the decrease in Net sales for fiscal 2016 was primarily due to Domestic store closures, including our Times Square and FAO Schwarz flagship stores. Additionally contributing to the decrease was a decline in Domestic and International same store sales driven by a decrease in the number of transactions. Excluding the impact of foreign currency translation, consolidated e-commerce sales increased 11% in fiscal 2016 compared to fiscal 2015.
30
Domestic
Net sales for our Domestic segment decreased by $225 million or 3.1%, to $7,131 million in fiscal 2016. The decrease in Net sales was primarily a result of store closures and a decrease in same store sales of 1.3%.
The decrease in same store sales resulted primarily from declines in our entertainment and baby categories. The decrease in our entertainment category was predominantly due to “toys to life” products and video game systems and software. The decline in our baby category was mainly due to consumables and infant care products. Partially offsetting these decreases were increases in our seasonal, core toy and learning categories. The increase in our seasonal category was primarily due to sports toys. The increase in our core toy category was predominantly due to dolls. The increase in our learning category was mainly due to preschool toys.
International
Net sales for our International segment decreased by $37 million or 0.8%, to $4,409 million in fiscal 2016. This included a $12 million increase from foreign currency translation. The decrease in International Net sales was primarily due to a 1.6% decline in same store sales, driven by our Europe and Asia Pacific markets, partially offset by growth in Canada.
The decrease in same store sales resulted primarily from decreases in our entertainment, seasonal and core toy categories. The decrease in our entertainment category was mainly due to video game software and systems and “toys to life” products. The decrease in our seasonal category was primarily due to outdoor products. The decline in our core toy category was predominantly due to action figures. Partially offsetting these decreases was an increase in our baby category, driven by baby gear.
Gross Margin
The following are reflected in “Cost of sales”:
• | the cost of merchandise acquired from vendors; |
• | freight in; |
• | provision for excess and obsolete inventory; |
• | shipping costs to consumers; |
• | provision for inventory shortages; and |
• | credits and allowances from our merchandise vendors. |
We record the costs associated with operating our distribution networks as a part of SG&A, including those costs that primarily relate to transporting merchandise from distribution centers to stores. Therefore, our consolidated Gross margin may not be comparable to the gross margins of other retailers that include similar costs in their cost of sales.
Percentage of Net sales | |||||||||||||||||||||
($ In millions) | Fiscal 2016 | Fiscal 2015 | $ Change | Fiscal 2016 | Fiscal 2015 | Change | |||||||||||||||
Domestic | $ | 2,393 | $ | 2,521 | $ | (128 | ) | 33.6 | % | 34.3 | % | (0.7 | )% | ||||||||
International | 1,715 | 1,705 | 10 | 38.9 | % | 38.3 | % | 0.6 | % | ||||||||||||
Toys “R” Us - Consolidated | $ | 4,108 | $ | 4,226 | $ | (118 | ) | 35.6 | % | 35.8 | % | (0.2 | )% | ||||||||
Gross margin decreased by $118 million to $4,108 million in fiscal 2016, compared to $4,226 million in fiscal 2015. Foreign currency translation decreased Gross margin by $1 million.
Gross margin rate decreased by 0.2 percentage points in fiscal 2016 compared to fiscal 2015. The decrease in Gross margin rate was primarily due to an increase in shipping costs from higher e-commerce sales coupled with a reduction in our free shipping purchase minimum, as well as an increase in inventory reserves recorded within our Domestic segment. Partially offsetting the decrease were margin improvements within certain categories in our International segment.
Domestic
Gross margin decreased by $128 million to $2,393 million in fiscal 2016. Gross margin rate decreased by 0.7 percentage points in fiscal 2016 compared to fiscal 2015.
The decrease in Gross margin rate resulted from higher shipping costs due to an increase in e-commerce sales coupled with a reduction in our free shipping purchase minimum. Additionally contributing to the decrease was an increase in the inventory obsolescence reserve.
31
International
Gross margin increased by $10 million to $1,715 million in fiscal 2016. Foreign currency translation decreased Gross margin by $1 million. Gross margin rate increased 0.6 percentage points in fiscal 2016 compared to fiscal 2015.
The increase in Gross margin rate resulted from a margin rate improvement in our core toy category. Additionally contributing to the improvement was sales mix away from lower margin entertainment products, which also experienced a rate improvement on remaining product sales.
Selling, General and Administrative Expenses
The following table presents expenses as a percentage of consolidated SG&A:
Fiscal 2016 | Fiscal 2015 | |||||
Payroll and related benefits | 43.8 | % | 44.4 | % | ||
Occupancy costs | 30.0 | % | 30.4 | % | ||
Advertising and promotional expenses | 9.5 | % | 9.1 | % | ||
Transaction fees (1) | 3.9 | % | 3.8 | % | ||
Professional fees | 3.3 | % | 3.2 | % | ||
Other (2) | 9.5 | % | 9.1 | % | ||
Total | 100 | % | 100 | % | ||
(1) | Primarily consists of credit card fees. |
(2) | Includes costs related to transporting merchandise from distribution centers to stores, store related supplies and signage, website hosting and other corporate-related expenses. |
Percentage of Net sales | |||||||||||||||||||||
($ In millions) | Fiscal 2016 | Fiscal 2015 | $ Change | Fiscal 2016 | Fiscal 2015 | Change | |||||||||||||||
Toys “R” Us - Consolidated | $ | 3,480 | $ | 3,593 | $ | (113 | ) | 30.2 | % | 30.4 | % | (0.2 | )% | ||||||||
SG&A decreased by $113 million to $3,480 million in fiscal 2016, compared to $3,593 million in fiscal 2015. Foreign currency translation increased SG&A by $4 million. As a percentage of Net sales, SG&A decreased by 0.2 percentage points.
Excluding the impact of foreign currency translation, SG&A decreased by $117 million primarily due to a $62 million decrease in annual bonus expense and the elimination of $52 million of store operating costs from the closure of our Times Square and FAO Schwarz flagship stores.
Depreciation and Amortization
(In millions) | Fiscal 2016 | Fiscal 2015 | Change | |||||||||
Toys “R” Us - Consolidated | $ | 317 | $ | 343 | $ | (26 | ) | |||||
Depreciation and amortization decreased by $26 million to $317 million in fiscal 2016, compared to $343 million in fiscal 2015. The decrease was primarily due to fully depreciated assets and closed stores.
Other Income, Net
Other income, net includes the following:
• | credit card program income; |
• | net gains on sales of assets; |
• | gift card breakage income; |
• | impairment of long-lived assets; |
• | foreign exchange gains and losses; and |
• | other operating income and expenses. |
32
(In millions) | Fiscal 2016 | Fiscal 2015 | Change | |||||||||
Toys “R” Us - Consolidated | $ | 149 | $ | 88 | $ | 61 | ||||||
Other income, net increased by $61 million to $149 million in fiscal 2016, compared to $88 million in fiscal 2015. The increase was primarily due to a $45 million gain on the sale of the FAO Schwarz brand, an $18 million benefit from foreign exchange related to the re-measurement of the Tranche A-1 loan facility attributed to Toys-Canada and a $12 million decrease in impairment of long-lived assets. These increases were partially offset by a $19 million decrease in net gains on sales of properties.
Refer to Note 1 to the Consolidated Financial Statements entitled “SUMMARY OF SIGNIFICANT ACCOUNTING POLICIES” for further details.
Interest Expense
(In millions) | Fiscal 2016 | Fiscal 2015 | Change | |||||||||
Toys “R” Us - Consolidated | $ | 457 | $ | 429 | $ | 28 | ||||||
Interest expense increased by $28 million to $457 million in fiscal 2016, compared to $429 million in fiscal 2015. The increase in Interest expense was primarily due to incremental expense related to the debt refinancings in fiscal 2016, which included $20 million for debt issuance costs related to the Exchange Offers (as defined below in Liquidity and Capital Resources - Debt).
As a result of the Taj Notes and CMBS and mezzanine debt refinancings in fiscal 2016 (each as discussed and defined below in Liquidity and Capital Resources - Debt), we expect our annual net cash interest payments to decrease by approximately $11 million, based on the LIBOR rate as of January 28, 2017, primarily due to a lower rate of interest on the Propco II Mortgage Loan.
Interest Income
(In millions) | Fiscal 2016 | Fiscal 2015 | Change | |||||||||
Toys “R” Us - Consolidated | $ | 2 | $ | 3 | $ | (1 | ) | |||||
Interest income decreased by $1 million to $2 million in fiscal 2016, compared to $3 million in fiscal 2015.
Income Tax Expense
($ In millions) | Fiscal 2016 | Fiscal 2015 | Change | |||||||||
Toys “R” Us - Consolidated | $ | 34 | $ | 76 | $ | (42 | ) | |||||
Consolidated effective tax rate | 680.0 | % | (158.3 | )% | 838.3 | % | ||||||
The net decrease in income tax expense of $42 million in fiscal 2016 compared to fiscal 2015 was primarily due to a benefit from a deemed repatriation of earnings from a high tax international jurisdiction, an increase in valuation allowance and a change in the mix and level of earnings between jurisdictions.
Our income tax expense in fiscal 2016 was unfavorably impacted by certain non-routine, discrete items, including an increase of valuation allowance for U.S. Federal and state jurisdictions, as well as in certain foreign jurisdictions. We have evaluated the available positive and negative evidence and have concluded that, for some of our deferred tax assets, it is more likely than not that these assets will not be realized in the foreseeable future. A valuation allowance is a non-cash charge, which does not eliminate the tax loss carryforwards and other deferred tax assets. It reflects a reduction in the benefit we expect is more likely than not to be realized from these items. Favorably impacting the fiscal 2016 income tax expense are benefits associated with a deemed repatriation of earnings from a high tax international jurisdiction.
Our income tax expense in fiscal 2015 was unfavorably impacted by certain non-routine, discrete items, including a valuation allowance established in a foreign jurisdiction. We evaluated the available positive and negative evidence and concluded that, for some of our deferred tax assets, it was more likely than not that these assets would not be realized in the foreseeable future. Favorably impacting the fiscal 2015 income tax expense was a benefit associated with the release of a valuation allowance in another foreign jurisdiction. Refer to Note 10 to the Consolidated Financial Statements entitled “INCOME TAXES” for further details.
33
Fiscal 2015 Compared to Fiscal 2014
Net Loss Attributable to Toys “R” Us, Inc.
(In millions) | Fiscal 2015 | Fiscal 2014 | Change | |||||||||
Toys “R” Us - Consolidated | $ | (130 | ) | $ | (292 | ) | $ | 162 | ||||
Net loss attributable to Toys “R” Us, Inc. decreased by $162 million to $130 million in fiscal 2015, compared to $292 million in fiscal 2014. The decrease was primarily due to a $322 million reduction in SG&A, partially offset by a $204 million decline in Gross margin, in each case due in large part to the impact from foreign currency translation.
Net Sales
Percentage of Net sales | |||||||||||||||||||||
($ In millions) | Fiscal 2015 | Fiscal 2014 | $ Change | % Change | Fiscal 2015 | Fiscal 2014 | |||||||||||||||
Domestic | $ | 7,356 | $ | 7,524 | $ | (168 | ) | (2.2 | )% | 62.3 | % | 60.9 | % | ||||||||
International | 4,446 | 4,837 | (391 | ) | (8.1 | )% | 37.7 | % | 39.1 | % | |||||||||||
Toys “R” Us - Consolidated | $ | 11,802 | $ | 12,361 | $ | (559 | ) | (4.5 | )% | 100.0 | % | 100.0 | % | ||||||||
Net sales decreased by $559 million or 4.5%, to $11,802 million in fiscal 2015, compared to $12,361 million in fiscal 2014. The impact of foreign currency translation decreased Net sales by $571 million in fiscal 2015.
Excluding the impact of foreign currency translation, the increase in Net sales for fiscal 2015 was predominantly due to an increase in International same store sales primarily driven by higher average transaction amounts and new locations within our International segment. Partially offsetting the increase was a decline in Net sales from Domestic store closures and a reduction in same store sales domestically, driven by a decrease in the number of transactions.
Domestic
Net sales for our Domestic segment decreased by $168 million or 2.2%, to $7,356 million in fiscal 2015. The decrease in Net sales was primarily a result of store closures and a decrease in same store sales of 0.6%.
The decrease in same store sales resulted primarily from declines in our entertainment and baby categories. The decrease in our entertainment category was predominantly due to portable electronics and video game software. The decline in our baby category was predominantly in consumables and infant care products. Partially offsetting these decreases were increases in our core toy and learning categories. The increase in our core toy category was primarily due to collectibles. The increase in our learning category was mainly due to preschool toys.
International
Net sales for our International segment decreased by $391 million or 8.1%, to $4,446 million in fiscal 2015. Excluding a $571 million decrease due to foreign currency translation, International Net sales improved primarily as a result of an increase in same store sales of 3.2% and net sales from new locations.
The increase in same store sales resulted primarily from increases in our learning and baby categories. The increase in our learning category was mainly due to construction toys. The increase in our baby category was primarily due to baby gear and apparel. Partially offsetting these increases was a decline in our entertainment category primarily due to video game software and systems.
Gross Margin
Percentage of Net sales | |||||||||||||||||||||
($ In millions) | Fiscal 2015 | Fiscal 2014 | $ Change | Fiscal 2015 | Fiscal 2014 | Change | |||||||||||||||
Domestic | $ | 2,521 | $ | 2,563 | $ | (42 | ) | 34.3 | % | 34.1 | % | 0.2 | % | ||||||||
International | 1,705 | 1,867 | (162 | ) | 38.3 | % | 38.6 | % | (0.3 | )% | |||||||||||
Toys “R” Us - Consolidated | $ | 4,226 | $ | 4,430 | $ | (204 | ) | 35.8 | % | 35.8 | % | — | % | ||||||||
Gross margin decreased by $204 million to $4,226 million in fiscal 2015, compared to $4,430 million in fiscal 2014. Foreign currency translation decreased Gross margin by $215 million.
34
Gross margin rate remained consistent in fiscal 2015 compared to fiscal 2014, with an increase in our Domestic segment offset by a decrease in our International segment.
Domestic
Gross margin decreased by $42 million to $2,521 million in fiscal 2015. Gross margin rate increased by 0.2 percentage points in fiscal 2015 compared to fiscal 2014.
The increase in Gross margin rate resulted from sales mix away from lower margin products in our entertainment and baby categories, partially offset by an increase in shipping costs due to higher e-commerce sales volume.
International
Gross margin decreased by $162 million to $1,705 million in fiscal 2015. Foreign currency translation decreased Gross margin by $215 million. Gross margin rate decreased 0.3 percentage points in fiscal 2015 compared to fiscal 2014.
The decrease in Gross margin rate resulted primarily from increased cost of USD denominated inventory purchases, most notably in our core toy category. Partially offsetting the decrease were margin rate improvements predominantly in our baby category and sales mix away from lower margin products in our entertainment category.
Selling, General and Administrative Expenses
The following table presents expenses as a percentage of consolidated SG&A:
Fiscal 2015 | Fiscal 2014 | |||||
Payroll and related benefits | 44.4 | % | 44.7 | % | ||
Occupancy costs | 30.4 | % | 30.0 | % | ||
Advertising and promotional expenses | 9.1 | % | 9.7 | % | ||
Transaction fees (1) | 3.8 | % | 3.1 | % | ||
Professional fees | 3.2 | % | 3.4 | % | ||
Other (2) | 9.1 | % | 9.1 | % | ||
Total | 100 | % | 100 | % | ||
(1) | Primarily consists of credit card fees, which includes income from the Visa and MasterCard settlement in fiscal 2014. |
(2) | Includes costs related to website hosting, transporting merchandise from distribution centers to stores, store related supplies and signage and other corporate-related expenses. |
Percentage of Net sales | |||||||||||||||||||||
($ In millions) | Fiscal 2015 | Fiscal 2014 | $ Change | Fiscal 2015 | Fiscal 2014 | Change | |||||||||||||||
Toys “R” Us - Consolidated | $ | 3,593 | $ | 3,915 | $ | (322 | ) | 30.4 | % | 31.7 | % | (1.3 | )% | ||||||||
SG&A decreased by $322 million to $3,593 million in fiscal 2015, compared to $3,915 million in fiscal 2014. Foreign currency translation decreased SG&A by $174 million. As a percentage of Net sales, SG&A decreased by 1.3 percentage points.
Excluding the impact of foreign currency translation, SG&A decreased by $148 million primarily due to an $81 million decrease in payroll expenses, which includes a $57 million decline in store payroll expenses, and a $40 million decrease in advertising and promotional expenses. Additionally contributing to the decrease in SG&A was a $16 million decrease in occupancy costs, predominantly as a result of Domestic store closures.
Depreciation and Amortization
(In millions) | Fiscal 2015 | Fiscal 2014 | Change | |||||||||
Toys “R” Us - Consolidated | $ | 343 | $ | 377 | $ | (34 | ) | |||||
Depreciation and amortization decreased by $34 million to $343 million in fiscal 2015, compared to $377 million in fiscal 2014. Foreign currency translation decreased Depreciation and amortization by $14 million. Excluding the impact of foreign currency translation, the decrease in Depreciation and amortization was primarily due to fully depreciated assets.
35
Other Income, Net
(In millions) | Fiscal 2015 | Fiscal 2014 | Change | |||||||||
Toys “R” Us - Consolidated | $ | 88 | $ | 53 | $ | 35 | ||||||
Other income, net increased by $35 million to $88 million in fiscal 2015, compared to $53 million in fiscal 2014. Foreign currency translation increased Other income, net by $4 million. Excluding the impact of foreign currency translation, the increase in Other income, net was primarily due to a $15 million increase in net gains on sales of assets and a $12 million increase in credit card program income.
Interest Expense
(In millions) | Fiscal 2015 | Fiscal 2014 | Change | |||||||||
Toys “R” Us - Consolidated | $ | 429 | $ | 451 | $ | (22 | ) | |||||
Interest expense decreased by $22 million to $429 million in fiscal 2015, compared to $451 million in fiscal 2014. The decrease in Interest expense was primarily due to $35 million of incremental expense recorded in fiscal 2014, mainly composed of the write-off of unamortized deferred debt issuance costs and original issue discount related to the extinguishment of debt. Additionally contributing to the decrease was a $17 million reversal of deferred debt issuance costs as a result of a fiscal 2015 amendment to the advisory agreement which waived any previously accrued and unpaid transaction fees payable to our Sponsors in connection with prior refinancings. Refer to Note 16 within our Consolidated Financial Statements entitled “RELATED PARTY TRANSACTIONS” for further details. Partially offsetting these decreases were higher rates of interest on the Secured term B-4 loan facility due fiscal 2020 and the Tranche A-1 loan facility due fiscal 2019 as a result of the fiscal 2014 refinancing.
Interest Income
(In millions) | Fiscal 2015 | Fiscal 2014 | Change | |||||||||
Toys “R” Us - Consolidated | $ | 3 | $ | 4 | $ | (1 | ) | |||||
Interest income decreased by $1 million to $3 million in fiscal 2015, compared to $4 million in fiscal 2014.
Income Tax Expense
($ In millions) | Fiscal 2015 | Fiscal 2014 | Change | |||||||||
Toys “R” Us - Consolidated | $ | 76 | $ | 32 | $ | 44 | ||||||
Consolidated effective tax rate | (158.3 | )% | (12.5 | )% | (145.8 | )% | ||||||
The net increase in income tax expense of $44 million in fiscal 2015 compared to fiscal 2014 was principally due to a change in the mix and level of earnings between jurisdictions.
Our income tax expense in fiscal 2015 was unfavorably impacted by certain non-routine, discrete items, including a valuation allowance established in a foreign jurisdiction. We evaluated the available positive and negative evidence and concluded that, for some of our deferred tax assets, it was more likely than not that these assets would not be realized in the foreseeable future. A valuation allowance is a non-cash charge, which does not eliminate the tax loss carryforwards and other deferred tax assets. It reflects a reduction in the benefit we expect is more likely than not to be realized from these items. Favorably impacting the fiscal 2015 income tax expense was a benefit associated with the release of a valuation allowance in another foreign jurisdiction.
Our income tax expense in fiscal 2014 was unfavorably impacted by certain non-routine, discrete items, including a valuation allowance for U.S. Federal and state jurisdictions, as well as in certain foreign jurisdictions. We evaluated the available positive and negative evidence and concluded that, for some of our deferred tax assets, it was more likely than not that these assets would not be realized in the foreseeable future. Favorably impacting the fiscal 2014 income tax expense was a benefit associated with the reduction of uncertain tax benefits.
36
LIQUIDITY AND CAPITAL RESOURCES
Overview
As of January 28, 2017, we were in compliance with all of the covenants related to our outstanding debt. Under the $1.85 billion secured revolving credit facility (“ABL Facility”), we had outstanding borrowings of $465 million, a total of $95 million of outstanding letters of credit and excess availability of $789 million as of January 28, 2017. We are subject to a minimum excess availability covenant of $125 million, with remaining availability of $664 million in excess of the covenant at January 28, 2017. Availability is determined pursuant to a borrowing base, consisting of specified percentages of eligible inventory among other assets, and generally peaks in the third quarter of our fiscal year. As of January 28, 2017, Toys “R” Us - Delaware, Inc. and its subsidiaries had total liquidity of $704 million, which included cash and cash equivalents of $40 million.
Toys “R” Us - Japan, Ltd. (“Toys-Japan”) has an agreement with a syndicate of financial institutions, which includes two unsecured loan commitment lines of credit (“Tranche 1A,” and “Tranche 2”). Tranche 1A is available in amounts of up to ¥9.45 billion ($82 million at January 28, 2017). As of January 28, 2017, we had no outstanding borrowings under Tranche 1A, with $82 million of remaining availability. Tranche 2 is available in amounts of up to ¥9.45 billion ($82 million at January 28, 2017). As of January 28, 2017, we had no outstanding borrowings under Tranche 2, with $82 million of remaining availability. As of January 28, 2017, Toys-Japan had total liquidity of $335 million under committed facilities, which included cash and cash equivalents of $171 million.
Additionally, Toys-Japan has two uncommitted lines of credit with ¥1.0 billion and ¥0.5 billion of total availability, respectively. At January 28, 2017, we had no outstanding borrowings under these uncommitted lines of credit with a total of ¥1.5 billion ($13 million at January 28, 2017) of incremental availability.
Our European and Australian asset-based revolving credit facility as amended (the “European ABL Facility”) provides for a five-year £138 million ($173 million at January 28, 2017) asset-based senior secured revolving credit facility. At January 28, 2017, we had no outstanding borrowings, with $77 million of remaining availability under the European ABL Facility. As of January 28, 2017, Europe and Australia had total liquidity of $250 million, which included cash and cash equivalents of $173 million.
Toys (Labuan) Holding Limited (“Asia JV”) has several uncommitted unsecured lines of credit with various financial institutions with total availability of HK$269 million ($35 million at January 28, 2017). As of January 28, 2017, we had no outstanding borrowings and $6 million of bank guarantees issued under these facilities. The remaining availability under these facilities was $29 million.
We are dependent on the borrowings provided by lenders to support our working capital needs, capital expenditures and to service debt. As of January 28, 2017, we have funds available to finance our operations under our ABL Facility through March 2019, subject to an earlier springing maturity, our Toys-Japan unsecured credit lines with a tranche expiring June 2017 and a tranche expiring June 2018, and our European ABL Facility through December 2020. In addition, Asia JV and Toys-Japan have uncommitted lines of credit due on demand. If our cash flow and capital resources do not provide the necessary liquidity, it could have a significant negative effect on our results of operations.
In general, our primary uses of cash are providing for working capital purposes (which principally represents the purchase of inventory), servicing debt, enhancing information technology, remodeling existing stores, financing construction of new stores and paying expenses, such as payroll costs and rental expense, to operate our stores. Our working capital needs follow a seasonal pattern, peaking in the third quarter of the year when inventory is purchased for the fourth quarter holiday selling season. For fiscal 2016, peak borrowings under our revolving credit facilities and credit lines amounted to $1,331 million, with total remaining availability of $619 million in excess of the ABL Facility covenant.
Our largest source of operating cash flows is cash collections from our customers. We have been able to meet our cash needs principally by using cash on hand, cash flows from operations and borrowings under our revolving credit facilities and credit lines. Although we believe that cash generated from operations, along with our existing cash, revolving credit facilities and credit lines will be sufficient to fund our expected cash flow requirements and planned capital expenditures for at least the next 12 months, a financial market disruption could have a negative impact on our ability to refinance our maturing debt and available resources in the future. Refer to Item 1A “Risk Factors—Our operations have significant liquidity and capital requirements and depend on the availability of adequate financing on reasonable terms. If our lenders are unable to fund borrowings under their credit commitments or we are unable to borrow, it could have a significant negative effect on our business.” and “—If our cash flows and capital resources are insufficient to fund our debt service obligations or we are unable to refinance our indebtedness, we may be forced to take other actions to satisfy our obligations under our indebtedness, which may not be successful.”
37
Capital Expenditures
A component of our long-term strategy is our capital expenditure program. Our capital expenditures are primarily for enhancing our e-commerce and other information technology and logistics systems, as well as improving existing stores and construction of new stores. Capital expenditures are funded primarily through cash provided by operating activities, as well as available cash.
The following table presents our capital expenditures for each of the past three fiscal years:
(In millions) | Fiscal 2016 | Fiscal 2015 | Fiscal 2014 | |||||||||
Information technology | $ | 86 | $ | 83 | $ | 79 | ||||||
Store improvements (1) | 53 | 64 | 58 | |||||||||
New stores | 33 | 17 | 32 | |||||||||
Distribution centers | 23 | 28 | 31 | |||||||||
Other store-related projects (2) | 57 | 27 | 7 | |||||||||
Total capital expenditures | $ | 252 | $ | 219 | $ | 207 | ||||||
(1) | Includes expenditures related to the “Clean and Bright” initiative. |
(2) | Includes remodels and other store updates. |
Cash Flows
(In millions) | Fiscal 2016 | Fiscal 2015 | Fiscal 2014 | |||||||||
Net cash (used in) provided by operating activities | $ | (1 | ) | $ | 238 | $ | 476 | |||||
Net cash used in investing activities | (210 | ) | (210 | ) | (193 | ) | ||||||
Net cash provided by (used in) financing activities | 81 | (27 | ) | (191 | ) | |||||||
Effect of exchange rate changes on Cash and cash equivalents | 16 | (19 | ) | (38 | ) | |||||||
Net (decrease) increase during period in Cash and cash equivalents | $ | (114 | ) | $ | (18 | ) | $ | 54 | ||||
Cash Flows (Used in) Provided by Operating Activities
Net cash used in operating activities was $1 million in fiscal 2016, compared to $238 million of net cash provided by operating activities in fiscal 2015. The net cash used in operating activities was primarily due to higher Domestic vendor payments in fiscal 2016 for merchandise purchased in fiscal 2015.
Net cash provided by operating activities decreased to $238 million in fiscal 2015, compared to $476 million in fiscal 2014. The decrease was primarily due to an increase in vendor payments within our International segment in the first quarter of fiscal 2015 due to the timing of payments at the end of fiscal 2014. Additionally contributing to the decrease were increases in annual bonus payout and merchandise purchases in order to maintain stronger in-stock positions. These were partially offset by improved operating earnings.
Cash Flows Used in Investing Activities
Net cash used in investing activities remained consistent at $210 million in fiscal 2016 compared to fiscal 2015, with a $35 million increase in proceeds received from sales of assets, partially offset by a $33 million increase in capital expenditures.
Net cash used in investing activities increased by $17 million to $210 million in fiscal 2015, compared to $193 million in fiscal 2014, primarily due to a $12 million increase in capital expenditures and a $5 million decrease in proceeds received from sales of assets.
Cash Flows Provided by (Used in) Financing Activities
Net cash provided by financing activities was $81 million in fiscal 2016, compared to $27 million of net cash used in financing activities in fiscal 2015. The net cash provided by financing activities was primarily due to a $152 million increase in net long-term debt borrowings to finance our increased purchases of merchandise inventories and to fund a portion of our fiscal 2016 refinancing activities, partially offset by a $31 million increase in capitalized debt issuance costs as a result of our debt refinancings in fiscal 2016.
38
Net cash used in financing activities decreased by $164 million to $27 million in fiscal 2015, compared to $191 million in fiscal 2014. The decrease was due to a $135 million decline in net debt repayments and a $29 million reduction in capitalized debt issuance costs predominantly as a result of a reduction in refinancing activity in fiscal 2015.
Debt
Our credit facilities, loan agreements and indentures contain customary covenants that, among other things restrict our ability to incur certain additional indebtedness, pay dividends, make restricted payments or certain investments, create or permit liens on assets, sell assets, engage in mergers or consolidations, and place restrictions on the ability of certain of our subsidiaries to provide funds to us through dividends, loans or advances. We conduct our operations through our subsidiaries, most of which are subject to restrictions on their ability to provide funds to us. The amount of total net assets that were subject to these restrictions was $59 million as of January 28, 2017.
Certain of our agreements also contain various and customary events of default with respect to the indebtedness, including, without limitation, the failure to pay interest or principal when the same is due under the agreements, cross default provisions, the failure of representations and warranties contained in the agreements to be true and certain insolvency events. If an event of default occurs and is continuing under these agreements, the principal amounts outstanding thereunder, together with all accrued and unpaid interest and other amounts owed thereunder, may be declared immediately due and payable by the lenders. Additionally, a failure to repay amounts when due under certain debt will likely constitute an event of default and entitle the holders of other debt to accelerate or otherwise proceed against the issuers or guarantors of such debt. Were such an event to occur, we would be forced to seek new financing that may not be on as favorable terms as our current facilities or be available at all. We are currently in compliance with the covenants relating to our outstanding debt.
As of January 28, 2017, we had total indebtedness of $4.8 billion, of which $3.4 billion was secured indebtedness. Our ability to refinance our indebtedness on favorable terms, or at all, is directly affected by global economic and financial conditions and other economic factors that may be outside our control. Such refinancings may include the issuance or guarantee of debt by certain of our subsidiaries, and may be accompanied by transactions or asset transfers among certain of our subsidiaries. Any debt issued in such transactions may be issued or guaranteed by entities that are not obligors on the debt being refinanced, and may have liens on assets that are not pledged to secure the debt being refinanced.
In addition, our ability to incur secured indebtedness (which may enable us to achieve better pricing than the incurrence of unsecured indebtedness) depends in part on the covenants in our credit facilities and indentures and the value of our assets, which depends, in turn, on the strength of our cash flows, results of operations, economic and market conditions and other factors. Refer to Item 1A “Risk Factors—Risks Related to Our Substantial Indebtedness.” Refer to Note 2 to the Consolidated Financial Statements entitled “SHORT-TERM BORROWINGS AND LONG-TERM DEBT” for further details regarding our debt and any of the transactions described below.
During fiscal 2016, the following events occurred with respect to our debt structure:
• | On November 3, 2016, we completed $512 million of Commercial Mortgage-Backed Securities (“CMBS”) financing and $88 million of mezzanine financing. The proceeds and a $51 million rent prepayment from Toys-Delaware to Toys “R” Us Property Company II, LLC (“TRU Propco II”) in conjunction with an amendment to the master lease agreement, along with cash on hand were used to redeem the aggregate principal amount of $725 million of 8.500% senior secured notes due 2017 of TRU Propco II (the “Propco II Notes”). TRU Propco II entered into a mortgage loan agreement (the “Mortgage Loan Agreement”), providing for a floating-rate loan (the “Propco II Mortgage Loan”) in the initial principal amount of $512 million. The Propco II Mortgage Loan has a three-year initial term expiring on November 9, 2019, and may be extended for two one-year terms at the option of TRU Propco II, subject to certain conditions, including meeting certain ratios at the time of the extension and, in the case of the second extension option, payment of an extension fee. If the Giraffe Junior Mezzanine Loan described below is outstanding, TRU Propco II may only exercise the extension options on the Propco II Mortgage Loan if the term of the Giraffe Junior Mezzanine Loan is also extended. |
Additionally, as noted above, on November 3, 2016, Giraffe Junior Holdings, LLC (“Giraffe Junior”), an indirect wholly-owned subsidiary of Toys “R” Us, Inc. (the “Parent Company”) and the owner of 100% of the equity interest in TRU Propco II, entered into a mezzanine loan agreement (the “Mezzanine Loan Agreement”) providing for a fixed-rate loan (the “Giraffe Junior Mezzanine Loan”) in the initial principal amount of $88 million. The Giraffe Junior Mezzanine Loan has a three-year initial term expiring on November 9, 2019, and may be extended for two one-year terms at the option of Giraffe Junior, subject to certain conditions substantially similar to the conditions to extending the Propco II Mortgage Loan under the Mortgage Loan Agreement. If the Propco II Mortgage Loan is outstanding, Giraffe Junior may only exercise the extension options if the Propco II Mortgage Loan is also extended.
39
• | On August 16, 2016, we, along with our indirect wholly-owned subsidiary TRU Taj LLC (“TRU Taj”) and TRU Taj Finance, Inc. (together with TRU Taj, the “Taj Note Issuers”) completed the offers to exchange the Parent Company’s outstanding 10.375% senior notes due 2017 (the “2017 Notes”) and 7.375% senior notes due 2018 (the “2018 Notes” and, together with the 2017 Notes, the “Senior Notes”) for newly issued 12.000% senior secured notes due fiscal 2021 (the “Taj Notes”) of the Taj Note Issuers and, in the case of the 2017 Notes, $110 million in cash (the “Exchange Offers”). An additional $34 million of Taj Notes were issued in concurrent private placements, of which $26 million were issued for cash, with the remainder issued as payment to certain noteholders in connection with the Exchange Offers. Additionally, on August 26, 2016, the Taj Note Issuers issued an additional $142 million of Taj Notes in a private placement, of which a portion of the proceeds was used to redeem the remaining 2017 Notes. As a result of these transactions, all of the 2017 Notes, in an aggregate principal amount of $450 million, and $192 million of the 2018 Notes were exchanged or redeemed, with $208 million in principal of the 2018 Notes still outstanding. The aggregate principal amount of Taj Notes issued was $583 million. |
• | On June 30, 2016, Toys-Japan entered into an agreement to refinance and combine its Tranche 1B and Tranche 2 committed credit lines into a new Tranche 2 committed credit line. Tranche 2 is now available in amounts up to ¥9.45 billion ($82 million at January 28, 2017) and expires on June 29, 2018. |
We and our subsidiaries, as well as the Sponsors or their affiliates, may from time to time prepay, repurchase, refinance or otherwise acquire debt or debt securities issued by us or our subsidiaries in open market transactions, tender offers, exchange offers, privately negotiated transactions or otherwise. Any such transactions, and the amounts involved, will depend on prevailing market conditions, liquidity requirements, contractual restrictions and other factors. The amounts involved may be material. Refer to Note 16 to the Consolidated Financial Statements entitled “RELATED PARTY TRANSACTIONS.”
Contractual Obligations
Our contractual obligations consist mainly of payments for operating leases related to real estate used in the operation of our business, Long-term debt and related interest and product purchase obligations. The following table summarizes our contractual obligations as of January 28, 2017, except as noted below:
Payments Due By Period | ||||||||||||||||||||
(In millions) | Fiscal 2017 | Fiscals 2018 & 2019 | Fiscals 2020 & 2021 | Fiscals 2022 and thereafter | Total | |||||||||||||||
Operating leases (1) | $ | 507 | $ | 842 | $ | 598 | $ | 793 | $ | 2,740 | ||||||||||
Less: sub-leases to third parties | 12 | 21 | 14 | 15 | 62 | |||||||||||||||
Net operating lease obligations | 495 | 821 | 584 | 778 | 2,678 | |||||||||||||||
Capital lease and financing obligations | 31 | 49 | 34 | 46 | 160 | |||||||||||||||
Long-term debt (2) | 109 | 2,148 | 2,402 | — | 4,659 | |||||||||||||||
Interest payments (2)(3)(4) | 366 | 627 | 248 | — | 1,241 | |||||||||||||||
Purchase obligations (5) | 1,282 | — | — | — | 1,282 | |||||||||||||||
Other (6) | 211 | 249 | 76 | 39 | 575 | |||||||||||||||
Total contractual obligations (7) | $ | 2,494 | $ | 3,894 | $ | 3,344 | $ | 863 | $ | 10,595 | ||||||||||
(1) | Excluded from the minimum rental commitments displayed above are $1.5 billion related to options to extend ground lease terms that are reasonably assured of being exercised, the balance of which is predominantly related to fiscals 2022 and thereafter. |
(2) | Excludes finance obligations associated with capital projects and capital lease obligations, which are included in “Capital lease and financing obligations.” |
(3) | In an effort to manage interest rate exposure, we periodically enter into interest rate swaps and interest rate caps. Interest payments presented are net of interest rate caps, when applicable. |
(4) | Interest payments for our ABL Facility, European ABL Facility and our Toys-Japan unsecured credit lines were estimated based on the average borrowings under each of the facilities in fiscal 2016. |
(5) | Purchase obligations consist primarily of open purchase orders for merchandise as well as agreements to purchase fixed or minimum quantities of goods that are not included in our Consolidated Balance Sheet as of January 28, 2017. |
(6) | Includes service contract obligations, risk management liabilities, pension obligations, and other contractual commitments. |
(7) | The above table does not reflect liabilities for uncertain tax positions of $33 million, which are included in other non-current liabilities. The amount and timing of payments with respect to these items are subject to a number of |
40
uncertainties such that we are unable to make sufficiently reliable estimates of the timing and amount of future payments.
Obligations under our operating leases and capital leases in the above table do not include real estate taxes, maintenance and insurance, or contingent rent. The following table presents these amounts which were recorded in SG&A in our Consolidated Statements of Operations for fiscals 2016, 2015 and 2014:
(In millions) | Fiscal 2016 | Fiscal 2015 | Fiscal 2014 | |||||||||
Real estate taxes | $ | 74 | $ | 82 | $ | 82 | ||||||
Maintenance and insurance | 69 | 73 | 74 | |||||||||
Contingent rent | 12 | 12 | 10 | |||||||||
Total | $ | 155 | $ | 167 | $ | 166 | ||||||
Off-balance Sheet Arrangements
We have an off-balance sheet arrangement as a result of the March 25, 2013 facility agreement (the “UK Propco Facility Agreement”) between Toys “R” Us Properties (UK) Limited and Debussy DTC Plc (“Debussy”). Debussy is a special purpose entity established with the limited purpose of making loans and issuing £263 million of multiple classes of commercial mortgage backed fixed rate notes (the “Debussy Notes”) to third party investors and the Company. We purchased £13 million principal amount of the various classes of the Debussy Notes, which are included in Other assets within the Consolidated Balance Sheets, classified as held-to-maturity and reported at amortized cost. The proceeds from the Debussy Notes were used to fund the loan under the UK Propco Facility Agreement.
In accordance with ASC Topic 810, “Consolidation,” we identified Debussy as a VIE because Debussy, by design, has insufficient equity investment at risk and its equity investment holders at risk lack the ability through voting or similar rights, to direct the activities that most significantly impact Debussy’s economic performance. Additionally, we evaluated our variable interests in Debussy and third party investors’ involvement and concluded that we are not the primary beneficiary and therefore should not consolidate Debussy as we do not hold the power to direct the activities that most significantly impact Debussy’s economic performance.
Effects of Inflation
Our results of operations and financial condition are presented based on historical cost. While it is difficult to accurately measure the impact of inflation due to the imprecise nature of the estimates required, we believe the effects of inflation, if any, on our results of operations and financial condition have been immaterial.
CRITICAL ACCOUNTING POLICIES
Our Consolidated Financial Statements have been prepared in accordance with GAAP. The preparation of these financial statements requires us to make certain estimates and assumptions that affect the reported amounts of assets, liabilities, revenues and expenses, and the related disclosures of contingent assets and liabilities as of the date of the Consolidated Financial Statements and during the applicable periods. We base these estimates on historical experience and on other factors that we believe are reasonable under the circumstances. Actual results may differ materially from these estimates under different assumptions or conditions and could have a material impact on our Consolidated Financial Statements.
We believe the following are our most critical accounting policies that include significant judgments and estimates used in the preparation of our Consolidated Financial Statements. We consider an accounting policy to be critical if it requires assumptions to be made that were uncertain at the time they were made, and if changes in these assumptions could have a material impact on our consolidated financial condition or results of operations.
Merchandise Inventories
We value our merchandise inventories at the lower of cost or net realizable value, as determined by the weighted average cost method. Cost of sales under the weighted average cost method represents the weighted average cost of the individual items sold. Cost of sales under the weighted average cost method is also affected by adjustments to reflect current market conditions, merchandise allowances from vendors, expected inventory shortages and estimated losses from obsolete and slow-moving inventory.
Merchandise inventories and related reserves are reviewed on an interim basis and adjusted, as appropriate, to reflect management’s current estimates. These estimates are derived using available data, our historical experience, estimated inventory turnover and current purchase forecasts. Various types of negotiated allowances received from our vendors are
41
generally treated as adjustments to the purchase price of our merchandise inventories. We adjust our estimates for vendor allowances and our provision for expected inventory shortage to actual amounts at the completion of our physical inventory counts and finalization of all vendor allowance agreements. In addition, we perform an inventory-aging analysis for identifying obsolete and slow-moving inventory. We establish a reserve to reduce the cost of our inventory to its estimated net realizable value based on certain loss indicators which include aged inventory and excess supply on hand, as well as specific identification methods.
Our estimates may be impacted by changes in certain underlying assumptions and may not be indicative of future activity. For example, factors such as slower inventory turnover due to changes in competitors’ tactics, consumer preferences, consumer spending and inclement weather could cause excess inventory requiring greater than estimated markdowns to entice consumer purchases. Such factors could also cause sales shortfalls resulting in reduced purchases from vendors and an associated reduction in vendor allowances. Our reserve for merchandise inventories was $101 million and $68 million as of January 28, 2017 and January 30, 2016, respectively. Based on our inventory aging analysis for identifying obsolete and slow-moving inventory, a 10% change in our reserve, excluding the impact of our specific item reserves, would have impacted pre-tax earnings by $6 million for fiscal 2016.
Long-lived Asset Impairment
We evaluate the carrying value of all long-lived assets, such as property and equipment, for impairment whenever events or changes in circumstances indicate that the carrying value of an asset may not be recoverable, in accordance with ASC 360. Events or circumstances that might warrant an impairment review include, among other things, material declines in operational performance, other than temporary significant adverse market conditions and significant changes or planned changes in our use of assets, including store relocation, store closure and property sales. When evaluating operating stores for impairment, our asset group is at an individual store level, as that is the lowest level for which cash flows are identifiable. Cash flows for individual operating stores include an allocation of applicable overhead. We will record an impairment loss when the carrying value of the underlying asset group exceeds its estimated fair value.
In determining whether long-lived assets are recoverable, our estimate of undiscounted future cash flows over the estimated life or lease term of a store is based upon our experience, historical operations of the store, an estimate of future store profitability and economic conditions. The future estimates of store profitability require estimating such factors as sales growth, inflation and the overall economic conditions. Since we forecast our future undiscounted cash flows for up to 25 years, our estimates are subject to variability as future results can be difficult to predict. If a long-lived asset is found to be non-recoverable, we record an impairment charge equal to the difference between the asset’s carrying value and fair value. We estimate the fair value of the asset using a valuation method such as discounted cash flow or a relative, market-based approach.
In fiscals 2016, 2015 and 2014, we recorded $4 million, $16 million and $13 million, respectively, of impairment charges related to non-recoverable long-lived assets. These impairments were primarily due to the identification of underperforming stores, the relocation of certain stores, property sales, and a decrease in real estate market values.
Goodwill Impairment
Goodwill is evaluated for impairment annually as of the last day of the eleventh fiscal month or whenever we identify certain events or circumstances that would more likely than not reduce the fair value of a reporting unit below its carrying amount. Events or circumstances that might warrant an interim evaluation include, among other things, a significant adverse change in the business climate, an adverse action or assessment by a regulator, unanticipated competition, loss of key personnel, an adverse change in legal factors and a more-likely-than-not expectation that a reporting unit or a significant portion of a reporting unit will be sold or otherwise disposed of.
In preparing a qualitative analysis, we assess events and circumstances that may impact the fair value and the carrying amount of the reporting unit. The identification of relevant events and circumstances and how these may impact a reporting unit’s fair value or carrying amount involve significant judgments and assumptions. We compare the reporting unit’s current carrying value as of the testing date to its most recent fair value. Based upon the differential noted, we may decide to perform the first step of the quantitative impairment test or to continue with the qualitative assessment by analyzing whether changes in the business and/or operating environment have occurred since the most recent fair value obtained that may impact this relationship. This assessment includes, but is not limited to, the identification of macroeconomic conditions, industry and market considerations that currently impact the reporting unit’s operating environment, as well as cost factors, overall financial performance including actual and projected operating results, and peer group share price trends. We examine the positive and negative influences of each relevant factor on the reporting unit’s fair value and qualitatively assess the impact that such factors (when considered both individually and in the aggregate) would have on a reporting unit’s fair value since the last full valuation was performed. If, after assessing the totality of events or circumstances, we determine that the potential impact of the positive and negative factors do not indicate that it is more likely than not that the fair value of a reporting unit is less than its carrying
42
amount, we will conclude that goodwill is not impaired and performance of the two-step quantitative impairment test is not required.
For the two-step quantitative goodwill impairment test, we compare the current carrying value of the reporting unit to its current fair value to determine whether there is an indication of impairment. First, we determine the current fair value of the reporting unit by blending results from the market and income approaches. These valuation approaches consider a number of factors that include, but are not limited to, expected future cash flows, growth rates, discount rates, and comparable multiples from publicly-traded companies in our industry, and require us to make certain assumptions and estimates regarding industry economic factors and future profitability of our business. It is our policy to conduct impairment testing (both from a qualitative and quantitative perspective) based on our most current business plans, projected future revenues and cash flows, which reflect changes we anticipate in the economy and the industry. The cash flows are based on five-year financial forecasts developed internally by management and are discounted to a present value using discount rates that properly account for the risk and nature of the respective reporting unit’s cash flows and the rates of return market participants would require to invest their capital in our reporting unit. The outcome of the market and income approaches are heavily dependent upon the aforementioned projections. If the carrying value exceeds the fair value, we would then calculate the implied fair value of our reporting unit’s goodwill as compared to its carrying value to determine the appropriate impairment charge, if any. To calculate the implied fair value of goodwill the Company would allocate the reporting unit’s fair value to all of the assets and liabilities of the reporting unit, including any unrecognized intangible assets, in a hypothetical scenario that faithfully represents an acquisition of the reporting unit in a business combination. If the implied fair value of the reporting unit’s goodwill is less than its carrying value, the difference is recorded as an impairment charge, not to exceed the balance of goodwill.
In the fourth quarter of fiscal 2016, we performed a quantitative assessment for our Toys-China and Southeast Asia reporting unit and it was determined that the goodwill of $64 million as of January 28, 2017, was not impaired. Refer to Note 1 to our Consolidated Financial Statements entitled, “SUMMARY OF SIGNIFICANT ACCOUNTING POLICIES” for further details.
Self-Insured Liabilities
We self-insure a substantial portion of our workers’ compensation, general liability, auto liability, property, medical, prescription drug and dental insurance risks, in addition to maintaining third party insurance coverage. We estimate our provisions for losses related to self-insured risks using actuarial techniques and estimates for incurred but not reported claims. We record the liability for workers’ compensation on a discounted basis. We also maintain insurance coverage to limit the exposure related to certain risks. The assumptions underlying the ultimate costs of existing claim losses can vary, which can affect the liability recorded for such claims.
Although we feel our reserves are adequate to cover our estimated liabilities, changes in the underlying assumptions and future economic conditions could have a considerable effect upon future claim costs, which could have a material impact on our Consolidated Financial Statements. Our reserve for self-insurance was $97 million and $100 million as of January 28, 2017 and January 30, 2016, respectively. A 10% change in the value of our self-insured liabilities would have impacted pre-tax earnings by $10 million for the fiscal year ended January 28, 2017.
Revenue Recognition
We recognize revenue in accordance with ASC Topic 605, “Revenue Recognition.” Revenue related to merchandise sales, which is 99.6% of total revenues, is generally recognized for retail sales at the point of sale in the store and when the customer receives the merchandise purchased from our websites. Discounts provided to customers are accounted for as a reduction of sales. We record a reserve for estimated product returns in each reporting period based on historical return experience and changes in customer demand. Actual returns may differ from historical product return patterns, which could impact our financial results in future periods.
Income Taxes
We account for income taxes in accordance with ASC Topic 740, “Income Taxes” (“ASC 740”). Our provision for income taxes and effective tax rates are calculated by legal entity and jurisdiction and are based on a number of factors, including our level of pre-tax earnings, income tax planning strategies, differences between tax laws and accounting rules, statutory tax rates and credits, uncertain tax positions, and valuation allowances. We use significant judgment and estimates in evaluating our tax positions. Our effective tax rate in a given financial statement period may be materially impacted by changes in the mix and level of earnings by taxing jurisdiction.
Tax law and accounting rules often differ as to the timing and treatment of certain items of income and expense. As a result, the tax rate reflected in our tax return (our current or cash tax rate) is different from the tax rate reflected in our Consolidated Financial Statements. Some of the differences are permanent, while other differences are temporary as they will reverse over time. We record deferred tax assets and liabilities for any temporary differences between the assets and liabilities in our
43
Consolidated Financial Statements and their respective tax bases. We establish valuation allowances when we believe it is more likely than not that our deferred tax assets will not be realized. In assessing the need for a valuation allowance, management weighs the available positive and negative evidence, including limitations on the use of tax loss and other carryforwards due to changes in ownership, historic information, projections of future sources of taxable income, including future reversals of taxable temporary differences and future taxable income exclusive of reversing temporary differences and carryforwards, and tax planning strategies. For example, we would establish a valuation allowance for the tax benefit associated with a tax loss carry forward in a tax jurisdiction if we did not expect to generate sufficient taxable income of the appropriate character to utilize the tax loss carry forward prior to its expiration. Changes in future taxable income, tax liabilities and our tax planning strategies may impact our effective tax rate, valuation allowances and the associated carrying value of our deferred tax assets and liabilities.
At any one time our tax returns for numerous tax years are subject to examination by U.S. Federal, state and foreign taxing jurisdictions. ASC 740 clarifies the accounting for uncertainty in income taxes recognized in an enterprise’s financial statements and prescribes a recognition threshold and measurement attributes for income tax positions taken or expected to be taken on a tax return. Under ASC 740, the impact of an uncertain tax position taken or expected to be taken on an income tax return must be recognized in the financial statements at the largest amount that is more-likely-than-not to be sustained. An uncertain income tax position will not be recognized in the financial statements unless it is more-likely-than-not to be sustained. We adjust these tax liabilities, as well as the related interest and penalties, based on the latest facts and circumstances, including recently enacted tax law changes, published rulings, court cases, and outcomes of tax audits. While we do not expect material changes, it is possible that our actual tax liability will differ from our established tax liabilities for unrecognized tax benefits, and our effective tax rate may be materially impacted. While it is often difficult to predict the final outcome of, the timing of, or the tax treatment of any particular tax position or deduction, we believe that our tax balances reflect the more-likely-than-not outcome of known tax contingencies. We report tax-related interest and penalties as a component of Income tax expense (benefit).
Stock-Based Compensation
The fair value of the common stock shares utilized in valuing stock-based payment awards was determined by the Executive Committee of the Board based on management’s recommendations. We engage an independent valuation specialist to assist management and the Executive Committee of the Board in determining the fair value of our common stock for these purposes. Management and the Executive Committee of the Board rely on the valuations provided by the independent valuation specialist as well as their review of the Company’s historical financial results, business milestones, financial forecast and business outlook as of each award date. The same Company data is reviewed by management, on a periodic basis, to monitor the performance metrics associated with certain stock-based payment awards as the achievement of established thresholds directly impact the amount of target shares ultimately earned.
The fair value of common stock shares is based on total enterprise value ranges and the total equity value ranges estimated on a non-marketable and minority basis utilizing both the income approach and the market approach guidelines. A range of the two methods was utilized to determine the fair value of the shares. The income approach is a valuation technique that provides an estimation of the fair value of a business based upon the cash flows that it can be expected to generate over time. The market approach is a valuation technique that provides an estimation of fair value based on market prices of publicly traded companies and the relationship to financial results.
The income approach utilized begins with an estimation of the annual cash flows that a business is expected to generate over a discrete projection period. The estimated cash flows for each of the years in the period are then converted to their present value equivalent using a discount rate considered appropriate given the risk of achieving the projected cash flows. The present value of the estimated cash flows is then added to the present value equivalent of the terminal value of the business at the end of the projection period to arrive at an estimate of fair value. Such an approach necessarily relies on estimations of future cash flows that are inherently uncertain, as well as a determination of an appropriate discount rate in order to derive present value equivalents of both the projected cash flows and the terminal value of the business at the end of the period. The use of different estimations of future cash flows or a different discount rate could result in a different indication of fair value.
The market approach utilizes in part a comparison to publicly traded companies deemed to be in similar lines of business. Such companies were then analyzed to determine which were most comparable based on various factors, including industry similarity, financial risk, company size, geographic diversification, growth opportunities, similarity of reaction to macroeconomic factors, profitability, financial data availability and active trading volume. Nine companies were included as comparable companies in the market comparable approach. Alternate determinations of which publicly traded entities constituted comparable companies could result in a different indication of fair value.
44
RECENTLY ADOPTED ACCOUNTING PRONOUNCEMENTS
In September 2015, the Financial Accounting Standards Board (“FASB”) issued Accounting Standard Update (“ASU”) No. 2015-16 “Business Combinations (Topic 805), Simplifying the Accounting for Measurement-Period Adjustments” (“ASU 2015-16”). ASU 2015-16 eliminates the requirement that an acquirer in a business combination account for measurement-period adjustments retrospectively. Under the previous guidance, an acquirer must recognize adjustments to provisional amounts during the measurement period retrospectively (i.e. as if the accounting for the business combination had been completed at the acquisition date). That is, the acquirer must revise comparative information on the income statement and balance sheet for any prior periods affected. Under ASU 2015-16, acquirers must recognize measurement-period adjustments in the period in which they determine the amounts, including the effect on earnings of any amounts they would have recorded in previous periods if the accounting had been completed at the acquisition date. The amendments in ASU 2015-16 require an entity to present separately on the face of the income statement or disclose in the notes the portion of the amount recorded in current-period earning by line item that would have been in previous reporting periods if the adjustment to the provisional amounts had been recognized as of the acquisition date. ASU 2015-16 did not change the criteria for determining whether an adjustment qualifies as a measurement-period adjustment and does not change the length of the measurement period. The Company has adopted the amendments of ASU 2015-16, effective January 31, 2016. The adoption did not have an impact on our Consolidated Financial Statements.
In April 2015, the FASB issued ASU No. 2015-05, “Intangibles - Goodwill and Other - Internal-Use Software (Subtopic 350-40): Customer’s Accounting for Fees Paid in a Cloud Computing Arrangement” (“ASU 2015-05”). Existing GAAP does not include explicit guidance about a customer’s accounting for fees paid in a cloud computing arrangement. The amendments in this ASU provide guidance to customers about whether a cloud computing arrangement includes a software license. If a cloud computing arrangement includes a software license, then the customer should account for the software licenses element of the arrangement consistent with the acquisition of other software licenses. If a cloud computing arrangement does not include a software license, the customer should account for the arrangement as a service contract. As a result of the amendments, all software licenses within the scope of Subtopic 350-40 will be accounted for consistent with other licenses of intangible assets. An entity can elect to adopt the amendments either (1) prospectively to all arrangements entered into or materially modified after the effective date; or (2) retrospectively. The Company adopted the amendments of ASU 2015-05 as of January 31, 2016 on a prospective basis. The adoption did not have an impact on our Consolidated Financial Statements.
In April 2015, the FASB issued No. ASU 2015-04, “Compensation - Retirement Benefits (Topic 715): Practical Expedient for the Measurement Date of an Employer’s Defined Benefit Obligation and Plan Assets” (“ASU 2015-04”). For entities with a fiscal year-end that does not coincide with a month-end, ASU 2015-04 provides a practical expedient that permits the entity to measure defined benefit plan assets and obligations using the month-end that is closest to the entity’s fiscal year-end and apply that practical expedient consistently from year-to-year. Under the previous practice, entities with fiscal year-ends that did not coincide with a month-end, had to adjust the fair value of the plan assets reported by the third-party service provider to reflect the fair value of plan assets as of their fiscal year. The practical expedient should be applied consistently to all plans if an entity has more than one plan. An entity is required to disclose the accounting policy election and the date used to measure defined benefit plan assets and obligations in accordance with the amendments in this ASU. Additional disclosures are required if a contribution or significant event caused by the entity occurs between the month-end date used to measure the defined benefit plan assets and obligations and an entity’s fiscal year-end. Entities should apply the amendments in this update prospectively. The Company adopted the amendments of ASU 2015-04, effective January 31, 2016. The adoption did not have an impact on our Consolidated Financial Statements.
In April 2015, the FASB issued ASU No. 2015-03, “Interest - Imputation of Interest (Subtopic 835-30): Simplifying the Presentation of Debt Issuance Costs” (“ASU 2015-03”). ASU 2015-03 simplifies the presentation of debt issuance costs by requiring that debt issuance costs related to a recognized debt liability be presented in the balance sheet as a direct deduction from the carrying amount of that debt liability, consistent with debt discounts. Under the previous practice, debt issuance costs were recognized as a deferred charge (that is, an asset). This ASU will create consistencies with the guidance in International Financial Reporting Standards as well as the guidance in FASB Concepts Statement No. 6, “Elements of Financial Statements”, which states that debt issuance costs are similar to debt discounts and in effect reduce the proceeds of borrowing, thereby increasing the effective interest rate. The recognition and measurement guidance for debt issuance costs are not affected by the amendments in this ASU. In August 2015, the FASB issued ASU No. 2015-15 “Interest - Imputed Interest (Subtopic 835-30): Presentation and Subsequent Measurement of Debt Issuance Costs Associated with Line-of-Credit Arrangements” (“ASU 2015-15”), which clarifies that the guidance in ASU 2015-03 does not apply to line-of-credit arrangements. According to ASU 2015-15, line-of-credit arrangements will continue to defer and present debt issuance costs as an asset and subsequently amortize the deferred debt costs ratably over the term of the arrangement. Upon transition, an entity is required to comply with the applicable disclosures for a change in an accounting principle. The Company has adopted the amendments of ASU 2015-03 and ASU 2015-15, effective January 31, 2016. Other than the revised balance sheet presentation of debt issuance costs from an
45
asset to a deduction from the carrying amount of the debt liability and related disclosures, the adoption of ASU 2015-03 and ASU 2015-15 did not have an impact on our Consolidated Financial Statements.
In February 2015, the FASB issued ASU No. 2015-02, “Consolidation (Topic 810): Amendments to the Consolidation Analysis” (“ASU 2015-02”). ASU 2015-02 is intended to improve targeted areas of consolidation guidance for reporting organizations that are required to evaluate whether they should consolidate certain legal entities. This ASU simplifies consolidation accounting by reducing the number of consolidation models and improves current GAAP by (1) placing more emphasis on risk of loss when determining a controlling financial interest; (2) reducing the frequency of the application of related-party guidance when determining a controlling financial interest in a VIE; and (3) changing consolidation conclusions for public and private companies in several industries that typically make use of limited partnerships or VIEs. Entities can transition to the standard either retrospectively or as a cumulative effect adjustment as of the date of adoption. The Company adopted the amendments of ASU 2015-02, effective January 31, 2016. The adoption did not have an impact on our Consolidated Financial Statements.
In January 2015, the FASB issued ASU No. 2015-01, “Income Statement - Extraordinary and Unusual Items (Subtopic 225-20): Simplifying Income Statement Presentation by Eliminating the Concept of Extraordinary Items” (“ASU 2015-01”). ASU 2015-01 eliminates from U.S. GAAP the concept of extraordinary items. Under the previous practice, an entity was required to separately classify, present, and disclose extraordinary events and transactions. The FASB issued this ASU as part of its initiative to reduce complexity in accounting standards. This ASU will also align more closely U.S. GAAP income statement presentation guidance with IAS 1, “Presentation of Financial Statements,” which prohibits the presentation and disclosure of extraordinary items. The Company adopted the amendments of ASU 2015-01, effective January 31, 2016. The adoption did not have an impact on our Consolidated Financial Statements.
In August 2014, the FASB issued ASU No. 2014-15, “Presentation of Financial Statements-Going Concern (Subtopic 205-40): Disclosure of Uncertainties about an Entity’s Ability to Continue as a Going Concern” (“ASU 2014-15”). ASU 2014-15 is intended to define management’s responsibility to evaluate whether there is substantial doubt about an organization’s ability to continue as a going concern and to provide related footnote disclosures, if substantial doubt exists. The amendments in this ASU are effective for reporting periods ending after December 15, 2016, with early adoption permitted. The Company adopted the amendments of ASU 2014-15 as of January 28, 2017. The adoption did not have an impact on our Consolidated Financial Statements.
In June 2014, the FASB issued ASU No. 2014-12, “Compensation-Stock Compensation (Topic 718): Accounting for Share-Based Payments When the Terms of an Award Provide That a Performance Target Could Be Achieved after the Requisite Service Period” (“ASU 2014-12”). ASU 2014-12 provides specific guidance on this Topic, requiring that performance targets that affect vesting and that could be achieved after the requisite service period be treated as a performance condition. A reporting entity should apply existing guidance in ASC Topic 718 as it relates to awards with performance conditions that affect vesting to account for such awards. This varies from the previous practice, as such provisions were also accounted for as non-vesting restrictions which affect the determination of grant-date fair value and required expense recognition over the requisite service period regardless of whether the performance condition is met. The Company adopted the amendments of ASU 2014-12 as of January 31, 2016 on a prospective basis. The adoption did not have an impact on our Consolidated Financial Statements.
Refer to Note 18 to our Consolidated Financial Statements entitled “RECENT ACCOUNTING PRONOUNCEMENTS” for a discussion of accounting standards which we have not yet been required to implement and our assessment of their impact to our Consolidated Financial Statements.
ITEM 7A. | QUANTITATIVE AND QUALITATIVE DISCLOSURES ABOUT MARKET RISK |
We are exposed to market risk from potential changes in interest rates and foreign currency exchange rates. We regularly evaluate our exposure to these risks and take measures to mitigate these risks on our consolidated financial results. We enter into derivative financial instruments to economically manage our interest rate and foreign currency exchange risks. We do not participate in speculative derivative trading. The analysis below presents our sensitivity to selected hypothetical, instantaneous changes in foreign currency exchange rates and market interest rates as of January 28, 2017.
Foreign Exchange Exposure
Our foreign currency exposure is primarily concentrated in the United Kingdom, Continental Europe, Asia, Canada and Australia. We face foreign currency translation exposures related to translating the results of our worldwide operations into USD because of exchange rate fluctuations during the reporting period.
46
We face foreign currency transaction exposures related to short-term, cross-currency intercompany loans and merchandise purchases:
• | We enter into short-term, cross-currency intercompany loans with our foreign subsidiaries. The majority of this exposure is economically hedged through the use of foreign currency forward contracts. Therefore, a 10% change in foreign currency exchange rates against the USD would not have a material impact on our pre-tax earnings related to our short-term, cross-currency intercompany loans that were outstanding as of January 28, 2017 and January 30, 2016. |
• | Our foreign subsidiaries make USD denominated merchandise purchases through the normal course of business. From time to time, we enter into foreign exchange forward contracts to manage this exposure. As of January 28, 2017 and January 30, 2016, we estimate that a 10% change in foreign currency exchange rates against the USD would impact our pre-tax earnings by $24 million and $2 million, respectively, with respect to our merchandise foreign exchange forward contracts. |
• | Our Toys-Canada subsidiary borrowed a portion of the Tranche A-1 Loan denominated in USD, which is subject to foreign exchange re-measurement. As of January 28, 2017, we estimate that a 10% change in the Canadian Dollar against the USD would impact our pre-tax earnings by $12 million. |
The above sensitivity analysis on our foreign currency exchange transaction exposures related to our short-term, cross-currency intercompany loans assumes our mix of foreign currency-denominated debt instruments and derivatives and all other variables will remain constant in future periods. These assumptions are made in order to facilitate the analysis and are not necessarily indicative of our future intentions.
Changes in foreign exchange rates affect interest expense recorded in relation to our foreign currency-denominated derivative instruments and debt instruments. For the fiscal years ended January 28, 2017 and January 30, 2016, we estimate that a 10% hypothetical change in foreign exchange rates would impact our pre-tax earnings due to the effect of foreign currency translation on interest expense related to our foreign currency-denominated derivative instruments and debt instruments by $5 million, respectively.
Interest Rate Exposure
We have a variety of fixed and variable rate debt instruments and are exposed to market risks resulting from interest rate fluctuations. Certain of our variable rate debt instruments include interest rate floors, which limit the impact of potential market interest rate declines. In an effort to manage interest rate exposures, we periodically enter into interest rate swaps and interest rate caps. A change in interest rates on variable rate debt impacts our pre-tax earnings, whereas a change in interest rates on fixed rate debt impacts the fair value of debt. As of January 28, 2017, we had two interest rate cap contracts which were designated for hedge accounting as cash flow hedges. For designated cash flow hedges, the effective portion of the changes in the fair value of derivatives are recorded in Accumulated other comprehensive loss and subsequently recorded in the Consolidated Statements of Operations at the time the hedged item affects earnings.
The following table illustrates the estimated sensitivity of a 1% change in interest rates to our future pre-tax earnings on our derivative instruments and variable rate debt instruments at January 28, 2017:
(In millions) | Impact of 1% Increase | Impact of 1% Decrease | ||||||
Interest rate caps | $ | — | $ | — | ||||
Variable rate debt | (33 | ) | 8 | |||||
Total pre-tax income exposure to interest rate risk | $ | (33 | ) | $ | 8 | |||
The above sensitivity analysis assumes our mix of financial instruments and all other variables will remain constant in future periods. These assumptions are made in order to facilitate the analysis and are not necessarily indicative of our future intentions. As of January 30, 2016, we estimated that a 1% hypothetical increase in interest rates could potentially have caused a $15 million decrease on our pre-tax earnings. A 1% hypothetical decrease in interest rates was estimated to have a $1 million increase on our pre-tax earnings. Refer to the Consolidated Financial Statements for further discussion in Note 3 entitled “DERIVATIVE INSTRUMENTS AND HEDGING ACTIVITIES.” At this time, we do not anticipate material changes to our interest rate risk exposure or to our risk management policies. We believe that we could mitigate potential losses on pre-tax earnings through our risk management objectives, if material changes occur in future periods.
47
ITEM 8. | FINANCIAL STATEMENTS AND SUPPLEMENTARY DATA |
PAGE | |
48
REPORT OF INDEPENDENT REGISTERED PUBLIC ACCOUNTING FIRM
To the Board of Directors and Stockholders of
Toys “R” Us, Inc.:
We have audited the accompanying consolidated balance sheets of Toys “R” Us, Inc. and subsidiaries as of January 28, 2017 and January 30, 2016, and the related consolidated statements of operations, comprehensive loss, stockholders' deficit and cash flows for each of the two years in the period ended January 28, 2017. Our audit also included the financial statement schedule included in the Index at Item 15. These financial statements and schedule are the responsibility of the Company's management. Our responsibility is to express an opinion on these financial statements and schedule based on our audits.
We conducted our audits in accordance with the standards of the Public Company Accounting Oversight Board (United States). Those standards require that we plan and perform the audit to obtain reasonable assurance about whether the financial statements are free of material misstatement. We were not engaged to perform an audit of the Company’s internal control over financial reporting. Our audits included consideration of internal control over financial reporting as a basis for designing audit procedures that are appropriate in the circumstances, but not for the purpose of expressing an opinion on the effectiveness of the Company’s internal control over financial reporting. Accordingly, we express no such opinion. An audit also includes examining, on a test basis, evidence supporting the amounts and disclosures in the financial statements, assessing the accounting principles used and significant estimates made by management, and evaluating the overall financial statement presentation. We believe that our audits provide a reasonable basis for our opinion.
In our opinion, the financial statements referred to above present fairly, in all material respects, the consolidated financial position of Toys “R” Us, Inc. and subsidiaries at January 28, 2017 and January 30, 2016, and the consolidated results of their operations and their cash flows for each of the two years in the period ended January 28, 2017, in conformity with U.S. generally accepted accounting principles. Also, in our opinion, the related financial statement schedule, when considered in relation to the basic financial statements taken as a whole, presents fairly in all material respects the information set forth therein.
/s/ Ernst & Young LLP
New York, New York
April 12, 2017
49
REPORT OF INDEPENDENT REGISTERED PUBLIC ACCOUNTING FIRM
To the Board of Directors and Stockholders of
Toys “R” Us, Inc.:
We have audited the accompanying consolidated statements of operations, comprehensive loss, stockholders' (deficit) equity, and cash flows of Toys “R” Us, Inc. and subsidiaries (the “Company”) for the fiscal year ended January 31, 2015. Our audit also included the financial statement schedule listed in the Index at Item 15. These financial statements and financial statement schedule are the responsibility of the Company's management. Our responsibility is to express an opinion on the financial statements and financial statement schedule based on our audit.
We conducted our audit in accordance with the standards of the Public Company Accounting Oversight Board (United States). Those standards require that we plan and perform the audit to obtain reasonable assurance about whether the financial statements are free of material misstatement. An audit includes examining, on a test basis, evidence supporting the amounts and disclosures in the financial statements. An audit also includes assessing the accounting principles used and significant estimates made by management, as well as evaluating the overall financial statement presentation. We believe that our audit provides a reasonable basis for our opinion.
In our opinion, such consolidated financial statements present fairly, in all material respects, the results of operations and cash flows of Toys “R” Us, Inc. and subsidiaries for the fiscal year ended January 31, 2015, in conformity with accounting principles generally accepted in the United States of America. Also, in our opinion, such financial statement schedule, when considered in relation to the basic consolidated financial statements taken as a whole, presents fairly, in all material respects, the information set forth therein.
/s/ Deloitte & Touche LLP
New York, New York
March 26, 2015
50
Toys “R” Us, Inc. and Subsidiaries
Consolidated Statements of Operations
Fiscal Years Ended | ||||||||||||
(In millions) | January 28, 2017 | January 30, 2016 | January 31, 2015 | |||||||||
Net sales | $ | 11,540 | $ | 11,802 | $ | 12,361 | ||||||
Cost of sales | 7,432 | 7,576 | 7,931 | |||||||||
Gross margin | 4,108 | 4,226 | 4,430 | |||||||||
Selling, general and administrative expenses | 3,480 | 3,593 | 3,915 | |||||||||
Depreciation and amortization | 317 | 343 | 377 | |||||||||
Other income, net | (149 | ) | (88 | ) | (53 | ) | ||||||
Total operating expenses | 3,648 | 3,848 | 4,239 | |||||||||
Operating earnings | 460 | 378 | 191 | |||||||||
Interest expense | (457 | ) | (429 | ) | (451 | ) | ||||||
Interest income | 2 | 3 | 4 | |||||||||
Earnings (loss) before income taxes | 5 | (48 | ) | (256 | ) | |||||||
Income tax expense | 34 | 76 | 32 | |||||||||
Net loss | (29 | ) | (124 | ) | (288 | ) | ||||||
Less: Net earnings attributable to noncontrolling interest | 7 | 6 | 4 | |||||||||
Net loss attributable to Toys “R” Us, Inc. | $ | (36 | ) | $ | (130 | ) | $ | (292 | ) | |||
See Notes to the Consolidated Financial Statements.
51
Toys “R” Us, Inc. and Subsidiaries
Consolidated Statements of Comprehensive Loss
Fiscal Years Ended | ||||||||||||
(In millions) | January 28, 2017 | January 30, 2016 | January 31, 2015 | |||||||||
Net loss | $ | (29 | ) | $ | (124 | ) | $ | (288 | ) | |||
Other comprehensive income (loss), net of tax | ||||||||||||
Foreign currency translation adjustments | 39 | (47 | ) | (128 | ) | |||||||
Unrealized gain on hedged transactions | 1 | 1 | 1 | |||||||||
Unrecognized actuarial (losses) gains | (10 | ) | 20 | (33 | ) | |||||||
Total other comprehensive income (loss), net of tax | 30 | (26 | ) | (160 | ) | |||||||
Comprehensive income (loss), net of tax | 1 | (150 | ) | (448 | ) | |||||||
Less: Comprehensive income attributable to noncontrolling interest | 7 | 6 | 4 | |||||||||
Comprehensive loss attributable to Toys “R” Us, Inc. | $ | (6 | ) | $ | (156 | ) | $ | (452 | ) | |||
See Notes to the Consolidated Financial Statements.
52
Toys “R” Us, Inc. and Subsidiaries
Consolidated Balance Sheets
(In millions - except share amounts) | January 28, 2017 | January 30, 2016 | ||||||
ASSETS | ||||||||
Current Assets: | ||||||||
Cash and cash equivalents | $ | 566 | $ | 680 | ||||
Accounts and other receivables | 255 | 225 | ||||||
Merchandise inventories | 2,476 | 2,270 | ||||||
Prepaid expenses and other current assets | 92 | 113 | ||||||
Total current assets | 3,389 | 3,288 | ||||||
Property and equipment, net | 3,067 | 3,163 | ||||||
Goodwill | 64 | 64 | ||||||
Deferred tax assets | 129 | 96 | ||||||
Restricted cash | 54 | 52 | ||||||
Other assets | 205 | 247 | ||||||
Total Assets | $ | 6,908 | $ | 6,910 | ||||
LIABILITIES, TEMPORARY EQUITY AND STOCKHOLDERS’ DEFICIT | ||||||||
Current Liabilities: | ||||||||
Accounts payable | $ | 1,695 | $ | 1,699 | ||||
Accrued expenses and other current liabilities | 897 | 994 | ||||||
Income taxes payable | 27 | 32 | ||||||
Current portion of long-term debt | 119 | 73 | ||||||
Total current liabilities | 2,738 | 2,798 | ||||||
Long-term debt | 4,642 | 4,612 | ||||||
Deferred tax liabilities | 75 | 64 | ||||||
Deferred rent liabilities | 342 | 345 | ||||||
Other non-current liabilities | 271 | 245 | ||||||
Temporary Equity | 132 | 111 | ||||||
Stockholders’ Deficit: | ||||||||
Common stock (par value $0.001 and $0.001; shares authorized 65,000,000 and 60,000,000; shares outstanding 49,353,943 and 49,347,672 at January 28, 2017 and January 30, 2016, respectively) | — | — | ||||||
Treasury stock | — | — | ||||||
Additional paid-in capital | 72 | 67 | ||||||
Accumulated deficit | (1,124 | ) | (1,062 | ) | ||||
Accumulated other comprehensive loss | (240 | ) | (270 | ) | ||||
Total Stockholders’ Deficit | (1,292 | ) | (1,265 | ) | ||||
Total Liabilities, Temporary Equity and Stockholders’ Deficit | $ | 6,908 | $ | 6,910 | ||||
See Notes to the Consolidated Financial Statements.
53
Toys “R” Us, Inc. and Subsidiaries
Consolidated Statements of Cash Flows
Fiscal Years Ended | ||||||||||||
(In millions) | January 28, 2017 | January 30, 2016 | January 31, 2015 | |||||||||
Cash Flows from Operating Activities: | ||||||||||||
Net loss | $ | (29 | ) | $ | (124 | ) | $ | (288 | ) | |||
Adjustments to reconcile Net loss to Net cash (used in) provided by operating activities: | ||||||||||||
Depreciation and amortization | 317 | 343 | 377 | |||||||||
Amortization and write-off of debt issuance costs and debt discount | 40 | 28 | 59 | |||||||||
Gains on sales of assets | (46 | ) | (20 | ) | (5 | ) | ||||||
Deferred income taxes | (24 | ) | 17 | (1 | ) | |||||||
Non-cash portion of asset impairments and other charges | 5 | 20 | 20 | |||||||||
Proceeds from settlement of derivatives | — | — | 9 | |||||||||
Unrealized (gains) losses on foreign exchange | (8 | ) | 10 | 15 | ||||||||
Other | 9 | (1 | ) | 23 | ||||||||
Changes in operating assets and liabilities: | ||||||||||||
Accounts and other receivables | (27 | ) | (2 | ) | (6 | ) | ||||||
Merchandise inventories | (221 | ) | (256 | ) | (16 | ) | ||||||
Prepaid expenses and other operating assets | 41 | 18 | 14 | |||||||||
Accounts payable, Accrued expenses and other liabilities | (66 | ) | 190 | 283 | ||||||||
Income taxes payable, net | 8 | 15 | (8 | ) | ||||||||
Net cash (used in) provided by operating activities | (1 | ) | 238 | 476 | ||||||||
Cash Flows from Investing Activities: | ||||||||||||
Capital expenditures | (252 | ) | (219 | ) | (207 | ) | ||||||
Increase in restricted cash | (6 | ) | (2 | ) | (5 | ) | ||||||
Proceeds from sales of assets | 48 | 13 | 18 | |||||||||
Acquisitions | — | (2 | ) | (1 | ) | |||||||
Property insurance recovery | — | — | 2 | |||||||||
Net cash used in investing activities | (210 | ) | (210 | ) | (193 | ) | ||||||
Cash Flows from Financing Activities: | ||||||||||||
Long-term debt borrowings | 2,540 | 1,451 | 2,866 | |||||||||
Long-term debt repayments | (2,409 | ) | (1,472 | ) | (3,010 | ) | ||||||
Short-term debt borrowings, net | — | — | (12 | ) | ||||||||
Capitalized debt issuance costs | (37 | ) | (6 | ) | (35 | ) | ||||||
Distribution to noncontrolling interest | (12 | ) | — | — | ||||||||
Other | (1 | ) | — | — | ||||||||
Net cash provided by (used in) financing activities | 81 | (27 | ) | (191 | ) | |||||||
Effect of exchange rate changes on Cash and cash equivalents | 16 | (19 | ) | (38 | ) | |||||||
Cash and cash equivalents: | ||||||||||||
Net (decrease) increase during period | (114 | ) | (18 | ) | 54 | |||||||
Cash and cash equivalents at beginning of period | 680 | 698 | 644 | |||||||||
Cash and cash equivalents at end of period | $ | 566 | $ | 680 | $ | 698 | ||||||
Supplemental Disclosures of Cash Flow Information: | ||||||||||||
Interest paid | $ | 385 | $ | 393 | $ | 380 | ||||||
Net income tax payments | $ | 40 | $ | 39 | $ | 43 | ||||||
Non-Cash Operating Information: | ||||||||||||
Purchases of property and equipment included in Accounts payable, Accrued expenses and other current liabilities | $ | 34 | $ | 56 | $ | 42 | ||||||
Non-Cash Financing Activities: | ||||||||||||
Long-term debt exchange | $ | 407 | $ | — | $ | — | ||||||
See Notes to the Consolidated Financial Statements.
54
Toys “R” Us, Inc. and Subsidiaries
Consolidated Statements of Stockholders’ Deficit
Toys “R” Us, Inc. Stockholders | |||||||||||||||||||||||
Common Stock | Additional Paid-in Capital | Total Accumulated Deficit | Accumulated Other Comprehensive Loss | Total Stockholders’ Deficit | |||||||||||||||||||
(In millions) | Issued Shares | Treasury Amount | |||||||||||||||||||||
Balance, February 1, 2014 | 49 | $ | (9 | ) | $ | 49 | $ | (612 | ) | $ | (84 | ) | $ | (656 | ) | ||||||||
Net loss attributable to Toys “R” Us, Inc. | — | — | — | (292 | ) | — | (292 | ) | |||||||||||||||
Total other comprehensive loss, net of tax | — | — | — | — | (160 | ) | (160 | ) | |||||||||||||||
Issuance of restricted stock | — | 4 | (4 | ) | — | — | — | ||||||||||||||||
Stock compensation expense | — | — | 15 | — | — | 15 | |||||||||||||||||
Value of formerly redeemable shares from temporary equity | — | — | 8 | — | — | 8 | |||||||||||||||||
Adjustment of noncontrolling interest to redemption value | — | — | — | (10 | ) | — | (10 | ) | |||||||||||||||
Balance, January 31, 2015 | 49 | $ | (5 | ) | $ | 68 | $ | (914 | ) | $ | (244 | ) | $ | (1,095 | ) | ||||||||
Net loss attributable to Toys “R” Us, Inc. | — | $ | — | $ | — | $ | (130 | ) | $ | — | $ | (130 | ) | ||||||||||
Total other comprehensive loss, net of tax | — | — | — | — | (26 | ) | (26 | ) | |||||||||||||||
Issuance of restricted stock | — | 5 | (5 | ) | — | — | — | ||||||||||||||||
Stock compensation expense | — | — | 4 | — | — | 4 | |||||||||||||||||
Adjustment of noncontrolling interest to redemption value | — | — | — | (18 | ) | — | (18 | ) | |||||||||||||||
Balance, January 30, 2016 | 49 | $ | — | $ | 67 | $ | (1,062 | ) | $ | (270 | ) | $ | (1,265 | ) | |||||||||
Net loss attributable to Toys “R” Us, Inc. | — | $ | — | $ | — | $ | (36 | ) | $ | — | $ | (36 | ) | ||||||||||
Total other comprehensive income, net of tax | — | — | — | — | 30 | 30 | |||||||||||||||||
Stock compensation expense | — | — | 5 | — | — | 5 | |||||||||||||||||
Adjustment of noncontrolling interest to redemption value | — | — | — | (26 | ) | — | (26 | ) | |||||||||||||||
Balance, January 28, 2017 | 49 | $ | — | $ | 72 | $ | (1,124 | ) | $ | (240 | ) | $ | (1,292 | ) | |||||||||
See Notes to the Consolidated Financial Statements.
55
Toys “R” Us, Inc. and Subsidiaries
Notes to the Consolidated Financial Statements
NOTE 1 — SUMMARY OF SIGNIFICANT ACCOUNTING POLICIES
Organization
As used herein, the “Company,” “we,” “us,” or “our” means Toys “R” Us, Inc., and its consolidated subsidiaries, except as expressly indicated or unless the context otherwise requires. We sell a variety of products in the baby, core toy, entertainment, learning and seasonal categories through our omnichannel offerings that leverage our brick-and-mortar stores and e-commerce websites. As of January 28, 2017, we operated 1,691 stores and licensed an additional 257 stores, which are located in 38 countries and jurisdictions around the world. We operate our stores under the Toys “R” Us and Babies “R” Us banners and also have smaller format Toys “R” Us Outlet stores (“Outlet”) and Toys “R” Us Express stores (“Express”). Our omnichannel presence includes our Toysrus.com and Babiesrus.com sites, as well as other e-commerce sites in our international markets.
Our Company was founded in Washington D.C. in 1948 when Charles Lazarus opened a baby furniture store, Children’s Bargain Town. The Toys “R” Us name made its debut in 1957. In 1978, we completed an initial public offering of our common stock. When Charles Lazarus retired as our Chief Executive Officer (“CEO”) in 1994, we operated or licensed over 1,000 stores in 17 countries and jurisdictions. In 1996, we established the Babies “R” Us brand, further solidifying our reputation as a leading retail destination for children of all ages and their families.
On July 21, 2005, we were acquired through a $6.6 billion merger (the “Merger”) by an investment group led by entities advised by or affiliated with Bain Capital Private Equity, L.P., Kohlberg Kravis Roberts & Co. L.P. and Vornado Realty Trust (collectively, the “Sponsors”). Upon the completion of this acquisition, we became a private company.
Fiscal Year
Our fiscal year ends on the Saturday nearest to January 31 of each calendar year. Unless otherwise stated, references to years in this report relate to the fiscal years below:
Fiscal Year | Number of Weeks | Ended | ||
2016 | 52 | January 28, 2017 | ||
2015 | 52 | January 30, 2016 | ||
2014 | 52 | January 31, 2015 | ||
Basis of Presentation
The accompanying consolidated financial statements as of January 28, 2017 and January 30, 2016 and for each of the three year periods ended January 28, 2017, January 30, 2016 and January 31, 2015, have been prepared in accordance with accounting principles generally accepted in the United States (“GAAP”). In April 2015, the Financial Accounting Standards Board (“FASB”) issued Accounting Standard Update (“ASU”) No. 2015-03, “Interest - Imputation of Interest (Subtopic 835-30): Simplifying the Presentation of Debt Issuance Costs” (“ASU 2015-03”). ASU 2015-03 simplifies the presentation of debt issuance costs by requiring that debt issuance costs related to a recognized debt liability be presented in the balance sheet as a direct deduction from the carrying amount of that debt liability, consistent with debt discounts. Under the previous practice, debt issuance costs were recognized as an asset. In August 2015, the FASB issued ASU 2015-15 “Interest - Imputed Interest (Subtopic 835-30): Presentation and Subsequent Measurement of Debt Issuance Costs Associated with Line-of-Credit Arrangements” (“ASU 2015-15”), which clarifies that the guidance in ASU 2015-03 does not apply to line-of-credit arrangements. The Company has retrospectively adopted the amendments of ASU 2015-03 and ASU 2015-15, effective January 31, 2016. We revised the balance sheet presentation of debt issuance costs from Other assets to a deduction from the carrying amount of Long-term debt on the Consolidated Balance Sheets and revised the presentation of the carrying amounts of individual debt liabilities in Note 2 entitled “SHORT-TERM BORROWINGS AND LONG-TERM DEBT.” The amounts of debt issuance costs that were reclassified as of January 28, 2017 and January 30, 2016 totaled $63 million and $58 million, respectively.
Principles of Consolidation
The Consolidated Financial Statements include the accounts of the Company. We eliminate all intercompany balances and transactions.
56
Variable Interest Entities
FASB Accounting Standards Codification (“ASC”) Topic 810, “Consolidation” (“ASC 810”), requires the consolidation of entities that are controlled by a company through interests other than voting interests. We evaluate our lending vehicles, including our commercial mortgage-backed securities, structured loans and any joint venture interests to determine whether we are the primary beneficiary of a variable interest entity (“VIE”). The primary beneficiary will have a controlling financial interest in a VIE if it has (1) the power to direct the activities of the VIE that most significantly impact the entity’s economic performance and (2) the obligation to absorb losses of the entity that could potentially be significant to the VIE or the right to receive benefits from the entity that could potentially be significant to the VIE.
On March 25, 2013, our indirect wholly-owned subsidiary, Toys “R” Us Properties (UK) Limited (“UK Propco”) entered into a facility agreement (the “UK Propco Facility Agreement”) with Debussy DTC Plc (“Debussy”), pursuant to which Debussy made loans (collectively, the “UK Propco Loan”) to UK Propco on March 28, 2013 in the aggregate principal amount of £263 million. Debussy is a special purpose entity established with the limited purpose of making loans and issuing the £263 million of multiple classes of commercial mortgage backed fixed rate notes (the “Debussy Notes”) to third party investors and the Company. Refer to Note 2 entitled “SHORT-TERM BORROWINGS AND LONG-TERM DEBT” for further details.
In accordance with ASC 810, we identified Debussy as a VIE because Debussy, by design, has insufficient equity investment at risk and its equity investment holders at risk lack the ability, through voting or similar rights, to direct the activities that most significantly impact Debussy’s economic performance. Additionally, we evaluated our variable interests in Debussy and third party investors’ involvement in Debussy and concluded that the Company is not the primary beneficiary and therefore should not consolidate Debussy as we do not hold the power to direct the activities that most significantly impact Debussy’s economic performance. The Company has not identified any subsequent changes to Debussy’s governing documents or contractual arrangements that would change the characteristics or adequacy of the entity’s equity investment at risk in accordance with ASC 810.
Use of Estimates
The preparation of our Consolidated Financial Statements requires us to make certain estimates and assumptions that affect the reported amounts of assets, liabilities, revenues, expenses and the related disclosures of contingent assets and liabilities as of the date of the Consolidated Financial Statements and during the applicable periods. We base these estimates on historical experience and other factors that we believe are reasonable under the circumstances. Actual results may differ materially from these estimates and such differences could have a material impact on our Consolidated Financial Statements.
Cash and Cash Equivalents
We consider our highly liquid investments with original maturities of three months or less at acquisition to be cash equivalents. These investments primarily consist of money market funds, bank deposits, term deposits or certificates of deposit. Cash equivalents are stated at cost, which approximates fair value. Book cash overdrafts are reclassified to Accounts payable.
Restricted Cash
Restricted cash represents collateral and other cash that is restricted from withdrawal. As of January 28, 2017 and January 30, 2016, we had restricted cash of $54 million and $52 million, respectively.
Accounts and Other Receivables
Accounts and other receivables consist primarily of receivables from vendors and consumer credit card and debit card transactions.
Merchandise Inventories
We value our merchandise inventories at the lower of cost or net realizable value, as determined by the weighted average cost method. Cost of sales represents the weighted average cost of the individual items sold and is affected by adjustments to reflect current market conditions, merchandise allowances from vendors, estimated inventory shortages and estimated losses from excess, obsolete and slow-moving inventory.
Property and Equipment, Net
We record property and equipment at cost. Property and leasehold improvements represent capital improvements made to our owned and leased properties. We record depreciation and amortization using the straight-line method over the shorter of the estimated useful lives of the assets or the terms of the respective leases, if applicable.
57
We capitalize interest for new store construction-in-progress in accordance with ASC Topic 835, “Interest.” Capitalized interest amounts are immaterial.
Asset Retirement Obligations
We account for asset retirement obligations (“ARO”) in accordance with ASC Topic 410, “Asset Retirement and Environmental Obligations,” which requires us to recognize a liability for the fair value of obligations to retire tangible long-lived assets when there is a legal obligation to incur such costs. As a result of certain leasehold improvements we have undertaken in our stores, we may be obligated to restore the retail space to its original configuration as per the terms of the lease. We recognize a liability for ARO, capitalize asset retirement costs and amortize these costs over the life of the assets. As of January 28, 2017 and January 30, 2016, we had $72 million and $67 million, respectively, recorded for ARO in Other non-current liabilities on the Consolidated Balance Sheets.
Goodwill
At January 28, 2017 and January 30, 2016 our Toys-China and Southeast Asia reporting unit (included in our International segment) had $64 million of Goodwill, respectively. Goodwill is evaluated for impairment annually as of the last day of the eleventh fiscal month or whenever we identify certain events or circumstances that would more likely than not reduce the fair value of a reporting unit below its carrying amount, in accordance with the provisions of ASC Topic 350, “Intangibles - Goodwill and Other” (“ASC 350”). Events or circumstances that might warrant an interim evaluation include, among other things, a significant adverse change in the business climate, an adverse action or assessment by a regulator, unanticipated competition, loss of key personnel, an adverse change in legal factors and a more-likely-than-not expectation that a reporting unit or a significant portion of a reporting unit will be sold or otherwise disposed of. ASC 350 provides an entity with the option to first assess qualitative factors for each reporting unit to determine whether it is more likely than not that the fair value of a reporting unit is less than its carrying amount prior to performing the two-step quantitative impairment test. The optional qualitative assessment can be performed at the discretion of management for any or all of the reporting units in any given period.
In the fourth quarter of fiscal 2016, we performed a quantitative assessment for our Toys-China and Southeast Asia reporting unit and it was determined that the goodwill was not impaired. Refer to “CRITICAL ACCOUNTING POLICIES” within Item 7 entitled “MANAGEMENT’S DISCUSSION AND ANALYSIS OF FINANCIAL CONDITION AND RESULTS OF OPERATIONS” for further details regarding the fiscal 2016 annual impairment tests.
Debt Issuance Costs
We present debt issuance costs on the balance sheet as a direct deduction from the carrying amount of the respective debt liability, consistent with debt discounts. For line-of-credit arrangements, we classify these amounts as non-current Other assets. We defer all debt issuance costs and amortize into Interest expense over the term of the related debt facility. Unamortized amounts at January 28, 2017 and January 30, 2016 were $80 million and $82 million, respectively. Deferred financing fees amortized to Interest expense for fiscals 2016, 2015 and 2014 were $25 million, $20 million and $48 million, respectively, which is inclusive of accelerated amortization due to certain debt repayments and refinancings prior to maturity. Refer to Note 2 entitled “SHORT-TERM BORROWINGS AND LONG-TERM DEBT” for further details. During fiscal 2015, there was a reversal of $30 million of unamortized deferred debt issuance costs as a result of an amendment to the advisory agreement which waived any previously incurred transaction fees payable to our Sponsors in connection with prior refinancings. Refer to Note 16 entitled “RELATED PARTY TRANSACTIONS” for further details.
Insurance Risks
We self-insure a substantial portion of our workers’ compensation, general liability, auto liability, property, medical, prescription drug and dental insurance risks, in addition to maintaining third party insurance coverage. Provisions for losses related to self-insured risks are based upon actuarial techniques and estimates for incurred but not reported claims. We record the liability for workers’ compensation on a discounted basis. We also maintain insurance coverage above retention amounts of $15 million for employment practices liability, $8 million for catastrophic events, $5 million for property and business interruption, $5 million for general liability, $4 million for auto liability and a minimum of $1 million for workers’ compensation to limit the exposure related to such risks. The assumptions underlying the ultimate costs of existing claim losses are subject to a high degree of unpredictability, which can affect the liability recorded for such claims. As of January 28, 2017 and January 30, 2016, we had $97 million and $100 million, respectively, of reserves for self-insurance risk which have been included in Accrued expenses and other current liabilities and Other non-current liabilities on the Consolidated Balance Sheets.
Commitments and Contingencies
We are subject to various claims and contingencies related to lawsuits and commitments under contractual and other commercial obligations. We recognize liabilities for contingencies and commitments when a loss is probable and estimable.
58
For additional information on our commitments and contingencies, refer to Note 15 entitled “COMMITMENTS AND CONTINGENCIES.”
Leases
We lease store locations, distribution centers, equipment and land used in our operations. Our leased store locations consist of locations which have buildings that are owned by us and land which is controlled through a ground lease with third parties (“Ground Lease Locations”) and locations that are controlled through straight leases for land and building which we lease from third parties (“Straight Lease Locations”). We account for our leases under the provisions of ASC Topic 840, “Leases” (“ASC 840”), which require that leases be evaluated and classified as operating or capital leases for financial reporting purposes. Assets held under capital lease are included in Property and equipment, net. As of January 28, 2017 and January 30, 2016, accumulated depreciation related to capital leases for property and equipment was $13 million and $25 million, respectively.
We record operating leases on a straight-line basis over the lease term, which includes renewal options only if those options are specified in the lease agreement and if failure to exercise the renewal option imposes a significant economic penalty on us. For Ground Lease Locations, we include renewal options in the lease term through the estimated useful life of the owned building located on the property as failure to renew a ground lease during the estimated useful life of the building would result in forgoing an economic benefit given our significant capital investment at the inception of the lease to construct a new building. For Straight Lease Locations, we do not include renewal options in the lease term as the failure to renew a straight lease does not typically result in a significant economic penalty for us, and therefore renewal cannot be reasonably assured at the inception of the lease. Renewal options are exercised at our sole discretion. The expected lease term is used to determine whether a lease is capital or operating and is used to calculate straight-line rent expense. Additionally, the useful life of buildings and leasehold improvements are limited by the expected lease term. Refer to Note 9 entitled “LEASES” for further details.
Substantially all of our leases include options that allow us to renew or extend the lease term beyond the initial lease period, subject to terms and conditions agreed upon at the inception of the lease. Such terms and conditions include rental rates agreed upon at the inception of the lease that could represent below or above market rental rates later in the life of the lease, depending upon market conditions at the time of such renewal or extension. In addition, many leases include early termination options, which can be exercised under specified conditions, including upon damage, destruction or condemnation of a specified percentage of the value or land area of the property.
Deferred Rent
We recognize fixed minimum rent expense on non-cancelable leases on a straight-line basis over the term of each individual lease starting at the date of possession, including the build-out period, and record the difference between the recognized rental expense and amounts payable under the leases as a deferred rent liability or asset. Deferred rent liabilities on the Consolidated Balance Sheets totaled $352 million and $354 million at January 28, 2017 and January 30, 2016, respectively, of which $10 million and $9 million was included in Accrued expenses and other current liabilities at each date, respectively. Landlord incentives and abatements are recorded in Deferred rent liabilities and amortized over the term of the lease.
Financial Instruments
We enter into foreign exchange forward contracts to minimize the risk associated with currency fluctuations relating to our foreign subsidiaries. We also enter into derivative financial arrangements such as interest rate swaps and interest rate caps to hedge interest rate risk associated with our long-term debt. We account for derivative financial instruments in accordance with ASC Topic 815, “Derivatives and Hedging” (“ASC 815”) and record all derivatives as either assets or liabilities on the Consolidated Balance Sheets measured at estimated fair value and recognize the changes in fair value as unrealized gains and losses. The recognition of these gains and losses depends on our intended use of the derivatives and resulting designation. We record the changes in fair value of derivative instruments, which do not qualify and therefore are not designated for hedge accounting, in the Consolidated Statements of Operations. If we determine that we do qualify for hedge accounting treatment, the following is a summary of the impact on the Consolidated Financial Statements:
• | For designated cash flow hedges, the effective portion of the changes in the fair value of derivatives is recorded in Accumulated other comprehensive loss and subsequently recorded in Interest expense in the Consolidated Statements of Operations at the time the hedged item affects earnings. |
• | For designated cash flow hedges, the ineffective portion of a hedged derivative instrument’s change in fair value is immediately recognized in Interest expense in the Consolidated Statements of Operations. |
• | For designated fair value hedges, the change in the fair value of the derivative as well as the offsetting change in the fair value of the hedged item attributable to the hedged risk are recorded in Interest expense in the Consolidated Statements of Operations. |
59
Refer to Note 3 entitled “DERIVATIVE INSTRUMENTS AND HEDGING ACTIVITIES” for more information related to our accounting for derivative financial instruments. We did not have significant credit risk related to our financial instruments at January 28, 2017 and January 30, 2016.
Revenue Recognition
We recognize sales, net of customer coupons and other sales incentives, at the time the customer takes possession of merchandise, either at the point of sale in our stores or at the time the customer receives shipment of products purchased from our websites. We recognize the sale from layaway transactions when our customer satisfies all payment obligations and takes possession of the merchandise. Sales are recorded net of sales, use and value added taxes.
Other revenues of $42 million, $45 million and $43 million for fiscals 2016, 2015 and 2014, respectively, are included in Net sales. Other revenues consist of warranty income, licensing revenue and non-core product related revenue.
We have license agreements with unaffiliated third party operators located outside the United States. The agreements are largely structured with royalty income paid as a percentage of sales for the use of our trademarks, trade name and branding. Licensing revenue was $18 million for fiscal 2016 and $17 million for fiscals 2015 and 2014, respectively.
Reserve for Sales Returns
We establish reserves for sales returns for estimated product returns by our customers based on historical return experience, changes in customer demand, known returns we have not received, and other assumptions. The balance of our reserve for sales returns was $8 million and $9 million at January 28, 2017 and January 30, 2016, respectively.
Cost of Sales and Selling, General & Administrative Expenses
The following table illustrates what is reflected in each expense category:
“Cost of sales” | “SG&A” | |
• the cost of merchandise acquired from vendors; • freight in; • provision for excess and obsolete inventory; • shipping costs to customers; • provision for inventory shortages; and • credits and allowances from our merchandise vendors. | • store payroll and related payroll benefits; • rent and other store operating expenses; • advertising and promotional expenses; • costs associated with operating our distribution network, including costs related to transporting merchandise from distribution centers to stores; • restructuring charges; and • other corporate-related expenses. | |
Credits and Allowances Received from Vendors
We receive credits and allowances that are related to formal agreements negotiated with our vendors. These credits and allowances are predominantly for product markdowns, cooperative advertising, promotions and volume related purchases. We generally treat credits and allowances, including cooperative advertising allowances, as a reduction of product cost in accordance with the provisions of ASC Topic 605, “Revenue Recognition” (“ASC 605”) since such funds are not a reimbursement of specific, incremental, identifiable SG&A costs incurred by us in selling the vendors’ products.
Advertising Costs
Gross advertising costs are recognized in SG&A at the point of first broadcast or distribution and were $330 million, $326 million and $379 million in fiscals 2016, 2015 and 2014, respectively.
Pre-Opening Costs
The cost of start-up activities, including organization costs, related to new store openings are expensed as incurred.
Costs of Computer Software
We capitalize certain costs associated with computer software developed or obtained for internal use in accordance with the provisions of ASC 350. We capitalize those costs from the acquisition of external materials and services associated with developing or obtaining internal use computer software. We capitalize certain payroll costs for employees that are directly associated with internal use computer software projects once specific criteria of ASC 350 are met. We expense those costs that are associated with preliminary stage activities, training, maintenance, and all other post-implementation stage activities as they
60
are incurred. We amortize all costs capitalized in connection with internal use computer software projects on a straight-line basis over a useful life of five years, beginning when the software is ready for its intended use. We amortized computer software costs of $36 million, $37 million and $34 million for fiscals 2016, 2015 and 2014, respectively.
Other Income, Net
Other income, net includes the following:
Fiscal Years Ended | ||||||||||||
(In millions) | January 28, 2017 | January 30, 2016 | January 31, 2015 | |||||||||
Credit card program income | $ | 51 | $ | 48 | $ | 36 | ||||||
Gains on sales of assets | 46 | 20 | 5 | |||||||||
Gift card breakage income | 36 | 30 | 27 | |||||||||
Foreign currency transactions | 5 | (14 | ) | (19 | ) | |||||||
Impairment of long-lived assets | (4 | ) | (16 | ) | (13 | ) | ||||||
Other (1) | 15 | 20 | 17 | |||||||||
Total | $ | 149 | $ | 88 | $ | 53 | ||||||
(1) | Includes advertising income from our websites, layaway income and other miscellaneous income and expense charges. |
Credit Card Program
We operate under a Credit Card Program agreement (the “Agreement”) with a third-party credit lender Synchrony Financial (formerly GE Retail Bank) to offer co-branded and private label credit cards to our customers. The credit lender provides financing for our customers to purchase merchandise at our stores for all cardholders and other businesses for co-branded cardholders. We received an up-front incentive payment in fiscal 2012 for entering into the seven-year Agreement with Synchrony Financial, which was deferred and is being amortized ratably over the life of the Agreement. In addition, we receive bounty fees for credit card activations and royalties on the co-branded and private label credit cards. We also receive profit sharing revenue based on a percentage of outstanding customer credit card indebtedness. Bounty fees, royalties and profit sharing revenue are recognized when earned and realizable. In fiscals 2016 and 2015, we received $9 million and $8 million, respectively, in profit sharing revenue after reaching the contractual milestone. We did not earn any profit sharing revenue in fiscal 2014. During fiscals 2016, 2015 and 2014, we recognized credit card program income of $51 million, $48 million and $36 million, respectively.
Net Gains on Sales of Assets
During fiscal 2016, we sold properties and certain assets resulting in net gains of $46 million, which included a gain of $45 million for the intellectual property rights to the FAO Schwarz brand. Net gains on sales of assets were $20 million and $5 million for fiscals 2015 and 2014, respectively. Refer to Note 5 entitled “PROPERTY AND EQUIPMENT” for further details of property sales.
Gift Card Breakage
We sell gift cards to customers in our retail stores, through our websites and through third parties and, in certain cases, provide gift cards for returned merchandise and in connection with promotions. We recognize income from gift card sales when the customer redeems the gift card, as well as an estimated amount of unredeemed liabilities (“breakage”). Gift card breakage is recognized proportionately, utilizing management estimates and assumptions based on actual redemptions, the estimated useful life of the gift card and an estimated breakage rate of unredeemed liabilities. Our estimated gift card breakage represents the remaining unused portion of the gift card liability for which the likelihood of redemption is remote and for which we have determined that we do not have a legal obligation to remit the value to the relevant jurisdictions. Income related to customer gift card redemption is included in Net sales, whereas income related to gift card breakage is recorded in Other income, net in the Consolidated Financial Statements. We recognize breakage income and derecognize the gift card liability for unredeemed gift cards in proportion to actual redemptions of gift cards. We recognized $36 million, $30 million and $27 million of gift card breakage income in fiscals 2016, 2015 and 2014, respectively.
Impairment of Long-Lived Assets and Costs Associated with Exit Activities
We evaluate the carrying value of all long-lived assets, which include property, equipment and finite-lived intangibles, for impairment whenever events or changes in circumstances indicate that the carrying value of an asset may not be recoverable, in accordance with ASC Topic 360, “Property, Plant and Equipment.” Events or circumstances that might warrant an impairment review include, among other things, material declines in operational performance, significant adverse market conditions and
61
significant changes or planned changes in our use of assets, including store relocation, store closure and property sales. If the carrying value of a long-lived asset is found to be non-recoverable, we record an impairment charge equal to the difference between the asset’s carrying value and fair value. This evaluation requires management to make judgments relating to future cash flows, growth rates and economic and market conditions. These evaluations are based on determining the fair value of an asset using a valuation method such as discounted cash flow or a relative, market-based approach.
During fiscals 2016, 2015 and 2014, we recorded total impairment losses of $4 million, $16 million and $13 million, respectively. These impairments were primarily due to the identification of underperforming stores, the relocation of certain stores and property sales.
For any store closing where a lease obligation still exists, we record the estimated future liability associated with the rental obligation less any estimated sublease income on the date the store is closed in accordance with ASC Topic 420, “Exit or Disposal Cost Obligations.”
Foreign Currency Transactions
Unrealized and realized gains and losses resulting from foreign currency transactions related to operations are included in Other income, net. In fiscal 2016, we recorded foreign currency gains of $5 million, which included an unrealized gain on foreign exchange of $7 million related to the re-measurement of the tranche of loans in an aggregate principal amount of $280 million due fiscal 2019 (the “Tranche A-1 Loan”) attributed to Toys “R” Us (Canada) Ltd. Toys “R” Us (Canada) Ltee (“Toys-Canada”), an indirect wholly-owned subsidiary. For fiscals 2015 and 2014, we recorded foreign currency losses of $14 million and $19 million, respectively, which included unrealized losses on foreign exchange of $11 million and $15 million related to the Tranche A-1 Loan. Refer to Note 2 entitled “SHORT-TERM BORROWINGS AND LONG-TERM DEBT” for further details regarding the Tranche A-1 Loan.
Foreign Currency Translation - Foreign Subsidiaries
The functional currencies of our foreign operating subsidiaries are as follows:
• | Australian dollar for our subsidiary in Australia; |
• | British pound sterling for our subsidiary in the United Kingdom; |
• | Brunei dollar for our subsidiary in Brunei; |
• | Canadian dollar for our subsidiary in Canada; |
• | Chinese yuan for our subsidiary in China; |
• | Euro for our subsidiaries in Austria, France, Germany, Spain and Portugal; |
• | Hong Kong dollar for our subsidiaries in Hong Kong; |
• | Japanese yen for our subsidiary in Japan; |
• | Malaysian ringgit for our subsidiary in Malaysia; |
• | Polish zloty for our subsidiary in Poland; |
• | Singapore dollar for our subsidiary in Singapore; |
• | Swiss franc for our subsidiary in Switzerland; |
• | Taiwan dollar for our subsidiary in Taiwan; and |
• | Thailand baht for our subsidiary in Thailand. |
Assets and liabilities are translated into U.S. Dollar (“USD”) using the current exchange rates in effect at the balance sheet date, while revenues and expenses are translated using the average exchange rates during the applicable reporting period. The resulting translation adjustments are recorded in Accumulated other comprehensive loss within the Consolidated Statements of Stockholders’ Deficit.
Foreign Currency Transactions - Short-Term Intercompany Loans
Foreign currency transactions related to short-term, cross-currency intercompany loans, which we economically hedge, were included in Interest Expense. For fiscals 2016, 2015 and 2014, we recorded gains of less than $1 million, $5 million and $9 million, respectively. The related foreign currency forward derivative contracts are not designated as hedges and are recorded on the Consolidated Balance Sheets at fair value with a gain or loss recorded in the Consolidated Statements of Operations in Interest expense. For fiscals 2016, 2015 and 2014, we recorded losses of less than $1 million, $5 million and $9 million, respectively. Refer to Note 3 entitled “DERIVATIVE INSTRUMENTS AND HEDGING ACTIVITIES” for further details.
62
Income Taxes
We account for income taxes in accordance with ASC Topic 740, “Income Taxes” (“ASC 740”). Our provision for income taxes and effective tax rates are calculated by legal entity and jurisdiction and are based on a number of factors, including our level of pre-tax earnings, income tax planning strategies, differences between tax laws and accounting rules, statutory tax rates and credits, uncertain tax positions and valuation allowances. We use significant judgment and estimates in evaluating our tax positions. Our effective tax rate in a given financial statement period may be materially impacted by changes in the mix and level of earnings by taxing jurisdiction.
Under ASC 740, deferred income taxes arise from temporary differences between the tax basis of assets and liabilities and their reported amounts in the Consolidated Financial Statements. Valuation allowances are established when, in management’s judgment, it is more likely than not that our deferred tax assets will not be realized. In assessing the need for a valuation allowance, management weighs the available positive and negative evidence, including limitations on the use of tax loss and other carryforwards due to changes in ownership, historic information, projections of future sources of taxable income, including future reversals of taxable temporary differences and future taxable income exclusive of reversing temporary differences and carryforwards and tax planning strategies.
At any one time, our tax returns for numerous tax years are subject to examination by U.S. Federal, state and foreign taxing jurisdictions. ASC 740 clarifies the accounting for uncertainty in income taxes recognized in an enterprise’s financial statements and prescribes a recognition threshold and measurement attributes for income tax positions taken or expected to be taken on a tax return. Under ASC 740, the impact of an uncertain tax position taken or expected to be taken on an income tax return must be recognized in the financial statements at the largest amount that is more-likely-than-not to be sustained. An uncertain income tax position will not be recognized in the financial statements unless it is more-likely-than-not to be sustained. We adjust these tax liabilities, as well as the related interest and penalties, based on the latest facts and circumstances, including recently enacted tax law changes, published rulings, court cases and outcomes of tax audits. While we do not expect material changes, it is possible that our actual tax liability will differ from our established tax liabilities for unrecognized tax benefits, and our effective tax rate may be materially impacted. While it is often difficult to predict the final outcome of, the timing of or the tax treatment of any particular tax position or deduction, we believe that our tax balances reflect the more-likely-than-not outcome of known tax contingencies. We report tax-related interest and penalties as a component of Income tax expense.
At January 28, 2017 and January 30, 2016, we reported unrecognized tax benefits in Other non-current liabilities on the Consolidated Balance Sheets. These tax liabilities do not include a portion of our unrecognized tax benefits, which have been recorded as either a reduction of Deferred tax assets related to tax loss carryforwards or a reduction of taxes receivable. Refer to Note 10 entitled “INCOME TAXES” for further details.
Temporary Equity
On October 31, 2011, in connection with the acquisition of a 70% ownership interest in Toys (Labuan) Holding Limited (“Asia JV”), the Company recognized Noncontrolling interest which was measured at fair value at the acquisition date. Refer to Note 17 entitled “ACQUISITIONS” for further details. In accordance with the terms of the agreement, the Noncontrolling interest is redeemable for cash or common stock of the Company at the option of the holder. As such, the Noncontrolling interest has been recorded in Temporary Equity on the Consolidated Balance Sheets at its redemption value.
63
The reconciliation of the changes in Temporary Equity is as follows:
(In millions) | ||||
Balance, February 1, 2014 | $ | 78 | ||
Net earnings attributable to noncontrolling interest | 4 | |||
Adjustment of noncontrolling interest to redemption value | 10 | |||
Value of formerly redeemable shares to equity | (8 | ) | ||
Capital contribution | 1 | |||
Balance, January 31, 2015 | 85 | |||
Net earnings attributable to noncontrolling interest | 6 | |||
Adjustment of noncontrolling interest to redemption value | 18 | |||
Capital contribution | 2 | |||
Balance, January 30, 2016 | 111 | |||
Net earnings attributable to noncontrolling interest | 7 | |||
Adjustment of noncontrolling interest to redemption value | 26 | |||
Distribution to noncontrolling interest | (12 | ) | ||
Balance, January 28, 2017 | $ | 132 | ||
Distribution to Noncontrolling Interest
During fiscal 2016, Asia JV made a $40 million distribution, of which $12 million was paid to Asia JV’s minority interest partner.
Stock-Based Compensation
Under the provisions of FASB ASC Topic 718, “Compensation - Stock Compensation” (“ASC 718”), stock-based compensation cost is measured at the grant date based on the fair value of the award and is recognized as expense over the requisite service period. Refer to Note 7 entitled “STOCK-BASED COMPENSATION” for further details.
64
NOTE 2 — SHORT-TERM BORROWINGS AND LONG-TERM DEBT
A summary of the Company’s consolidated Short-term borrowings and Long-term debt as well as the effective interest rates on our outstanding variable rate debt as of January 28, 2017 and January 30, 2016 is outlined in the table below:
(In millions) | January 28, 2017 | January 30, 2016 (1) | ||||||
Short-term borrowings | ||||||||
Asia JV uncommitted lines of credit | $ | — | $ | — | ||||
Long-term debt | ||||||||
10.375% senior notes, due fiscal 2017 (2)(3) | — | 444 | ||||||
Toys-Japan unsecured credit lines, expire fiscals 2017-2018 (4) | — | — | ||||||
8.500% senior secured notes, due fiscal 2017 (5)(6) | — | 715 | ||||||
French real estate credit facility, due fiscal 2018 (EURIBOR+4.50%) | 48 | 49 | ||||||
Incremental secured term loan facility, due fiscal 2018 (LIBOR+3.75%) (7) | 125 | 129 | ||||||
Second incremental secured term loan facility, due fiscal 2018 (LIBOR+3.75%) (7) | 62 | 64 | ||||||
7.375% senior notes, due fiscal 2018 (2)(3) | 209 | 401 | ||||||
$1.85 billion secured revolving credit facility, expires fiscal 2019 (7) | 465 | 80 | ||||||
Senior unsecured term loan facility, due fiscal 2019 (LIBOR+5.00%) (8) | 874 | 911 | ||||||
Tranche A-1 loan facility, due fiscal 2019 (LIBOR+7.25%) (7) | 272 | 269 | ||||||
Propco II Mortgage Loan, due fiscal 2019 (LIBOR+4.88%) (5)(6) | 489 | — | ||||||
Giraffe Junior Mezzanine Loan, due fiscal 2019 (12.50%) (6)(9) | 78 | — | ||||||
Secured term B-4 loan facility, due fiscal 2020 (LIBOR+8.75%) (7) | 982 | 987 | ||||||
UK real estate credit facility, due fiscal 2020 (6.85%) | 323 | 364 | ||||||
European and Australian asset-based revolving credit facility, expires fiscal 2020 | — | — | ||||||
Toys-Japan 1.85%-2.18% loans, due fiscals 2019-2021 | 44 | 48 | ||||||
12.000% Taj senior secured notes, due fiscal 2021 (3) | 577 | — | ||||||
8.750% debentures, due fiscal 2021 (10) | 22 | 22 | ||||||
Finance obligations associated with capital projects | 179 | 183 | ||||||
Capital lease and other obligations | 12 | 19 | ||||||
4,761 | 4,685 | |||||||
Less: current portion | 119 | 73 | ||||||
Total Long-term debt (11) | $ | 4,642 | $ | 4,612 | ||||
(1) | In accordance with the retrospective adoption of ASU 2015-03 and ASU 2015-15, we have revised the presentation of the carrying amounts of individual debt liabilities as of January 30, 2016. For further details, refer to Note 1 entitled “SUMMARY OF SIGNIFICANT ACCOUNTING POLICIES.” |
(2) | Represents obligations of Toys “R” Us, Inc. (the “Parent Company”) legal entity. |
(3) | On August 16, 2016, we completed the offering to exchange the outstanding 10.375% senior notes due 2017 (the “2017 Notes”) and 7.375% senior notes due 2018 (the “2018 Notes” and, together with the 2017 Notes, the “Senior Notes”) for new 12.000% senior secured notes due 2021 (the “Taj Notes”) issued by the Taj Note Issuers (as defined below) and, in the case of the 2017 Notes, $110 million in cash. An additional $34 million of Taj Notes were issued in concurrent private placements, of which $26 million were issued for cash, with the remainder issued as payment to certain noteholders in connection with the Exchange Offers (as defined below). On August 26, 2016, the Taj Note Issuers issued $142 million in additional Taj Notes in a private placement, of which a portion of the proceeds was used to redeem the remaining 2017 Notes. As a result of these transactions, all of the 2017 Notes, in an aggregate principal amount of $450 million, and $192 million of the 2018 Notes were exchanged or redeemed, with $208 million in principal of the 2018 Notes still outstanding. The aggregate principal amount of Taj Notes issued was $583 million. |
(4) | On June 30, 2016, Toys “R” Us – Japan, Ltd. (“Toys-Japan”) entered into an agreement to refinance and combine two of its existing unsecured loan commitment lines of credit (“Tranche 1B” due fiscal 2016 and “Tranche 2” due fiscal 2016) into a new Tranche 2 committed credit line, expiring on June 29, 2018. |
65
(5) | Represents obligations of Toys “R” Us Property Company II, LLC (“TRU Propco II”). TRU Propco II is a single-purpose entity and is a separate entity from the Company. The assets and credit of TRU Propco II and its direct parent Giraffe Junior Holdings, LLC (“Giraffe Junior”) are not available to satisfy the debts or other obligations of the Company or any affiliate. |
(6) | On November 3, 2016, we completed $512 million of CMBS financing and $88 million of mezzanine financing. The proceeds and a $51 million rent prepayment from Toys “R” Us – Delaware, Inc. (“Toys-Delaware”) to TRU Propco II in conjunction with an amendment to the master lease agreement, along with cash on hand were used to redeem the aggregate principal amount of $725 million of 8.500% senior secured notes due 2017 of TRU Propco II (the “Propco II Notes”). TRU Propco II entered into a mortgage loan agreement (the “Mortgage Loan Agreement”), providing for a floating-rate loan (the “Propco II Mortgage Loan”) in the initial principal amount of $512 million. Additionally, Giraffe Junior, our indirect wholly-owned subsidiary that owns 100% of the equity interest in TRU Propco II, entered into a mezzanine loan agreement (the “Mezzanine Loan Agreement”) providing for a fixed-rate loan (the “Giraffe Junior Mezzanine Loan”) in the initial principal amount of $88 million. |
(7) | Represents obligations of Toys-Delaware. |
(8) | Represents obligations of Toys “R” Us Property Company I, LLC and its subsidiaries (“TRU Propco I”). |
(9) | Represents obligations of Giraffe Junior. |
(10) | Represents obligations of the Parent Company and Toys-Delaware. |
(11) | We maintain derivative instruments on certain of our long-term debt, which impact our effective interest rates. Refer to Note 3 entitled “DERIVATIVE INSTRUMENTS AND HEDGING ACTIVITIES” for further details. |
As of January 28, 2017, we had total indebtedness of $4.8 billion, of which $3.4 billion was secured indebtedness. Toys “R” Us, Inc. is a holding company and conducts its operations through its subsidiaries, certain of which have incurred their own indebtedness. Our credit facilities, loan agreements and indentures contain customary covenants that, among other things restrict our ability to:
• | incur certain additional indebtedness; |
• | transfer money between the Parent Company and our various subsidiaries; |
• | pay dividends on, repurchase or make distributions with respect to our or our subsidiaries’ capital stock or make other restricted payments; |
• | issue stock of subsidiaries; |
• | make certain investments, loans or advances; |
• | transfer and sell certain assets; |
• | create or permit liens on assets; |
• | consolidate, merge, sell or otherwise dispose of all or substantially all of our assets; |
• | enter into certain transactions with our affiliates; and |
• | amend certain documents. |
The amount of total net assets that were subject to such restrictions was $59 million as of January 28, 2017. Our agreements also contain various and customary events of default with respect to the indebtedness, including, without limitation, the failure to pay interest or principal when the same is due under the agreements, cross default and cross acceleration provisions, the failure of representations and warranties contained in the agreements to be true and certain insolvency events. If an event of default occurs and is continuing, the principal amounts outstanding thereunder, together with all accrued and unpaid interest and other amounts owed thereunder, may be declared immediately due and payable by the lenders.
We are dependent on the borrowings provided by the lenders to support our working capital needs, capital expenditures and to service debt. As of January 28, 2017, we have funds available to finance our operations under our $1.85 billion secured revolving credit facility (“ABL Facility”) through March 2019, subject to an earlier springing maturity, our two Toys-Japan unsecured credit lines through June 2017 and June 2018, and our European ABL Facility through December 2020. In addition, Asia JV and Toys-Japan have uncommitted lines of credit due on demand.
66
The annual maturities of our Long-term debt, including current portion, at January 28, 2017 are as follows:
(In millions) | Annual Maturities (at face value) | ||
2017 | $ | 119 | |
2018 | 496 | ||
2019 | 1,668 | ||
2020 | 1,316 | ||
2021 | 1,095 | ||
2022 and subsequent | 156 | ||
Total | $ | 4,850 | |
Asia JV uncommitted lines of credit, due on demand ($0 million at January 28, 2017)
Asia JV has several uncommitted unsecured lines of credit with various financial institutions with total availability of HK$269 million ($35 million at January 28, 2017). As of January 28, 2017, we had no borrowings and $6 million of bank guarantees issued under these facilities. The remaining availability under these facilities was $29 million.
Toys-Japan unsecured credit lines, expire fiscals 2017-2018 ($0 million at January 28, 2017)
Toys-Japan currently has an agreement with a syndicate of financial institutions, which includes two unsecured loan commitment lines of credit, “Tranche 1A” due fiscal 2017 and Tranche 2. On June 30, 2016, Toys-Japan entered into an agreement to refinance and combine its former Tranche 1B and Tranche 2 committed credit lines due fiscal 2016 into a new Tranche 2 committed credit line, expiring on June 29, 2018. Tranche 2 is available in amounts of up to ¥9.45 billion ($82 million at January 28, 2017) and bears an interest rate of Tokyo Interbank Offered Rate (“TIBOR”) plus 0.80% per annum. As of January 28, 2017, we had no outstanding borrowings under Tranche 2, with $82 million of remaining availability. We paid fees of $2 million to refinance Tranche 2, which are capitalized as deferred debt issuance costs in Other assets on our Consolidated Balance Sheets and amortized over the term of the agreement. Tranche 1A is available in amounts of up to ¥9.45 billion ($82 million at January 28, 2017) and expires on June 30, 2017. As of January 28, 2017 we had no outstanding borrowings under Tranche 1A, with $82 million of remaining availability. We had deferred debt issuance costs of $1 million for Tranche 1A as of January 28, 2017 and January 30, 2016, respectively, which have been included in Other assets on our Consolidated Balance Sheets.
These agreements contain covenants that require, among other things, Toys-Japan to maintain a certain level of net assets and profitability during the agreement terms, including provisions that require Toys-Japan to not incur two consecutive years of ordinary loss in accordance with accounting principles generally accepted in Japan (“JGAAP”), as defined in the credit agreements. The agreements also restrict Toys-Japan from paying dividends or making loans to affiliates without lender consent.
Additionally, Toys-Japan has two uncommitted lines of credit with ¥1.0 billion and ¥0.5 billion of total availability, respectively. At January 28, 2017, we had no outstanding borrowings under these uncommitted lines of credit with a total of ¥1.5 billion ($13 million at January 28, 2017) of incremental availability.
$1.85 billion secured revolving credit facility, expires fiscal 2019 ($465 million at January 28, 2017)
On March 21, 2014, Toys-Delaware and certain of its subsidiaries amended and restated the credit agreement for the ABL Facility in order to extend the maturity date of the facility and amend certain other provisions. The ABL Facility, as amended, provides for $1.85 billion of revolving commitments, and permits Toys-Delaware to request an increase in commitments by up to $1.15 billion, subject to certain conditions, including obtaining new or increased commitments from new or existing lenders. The ABL Facility has a final maturity date of March 21, 2019, with a springing maturity date if the Toys-Delaware term loans due fiscal 2018 are not repaid 30 days prior to maturity. The ABL Facility as amended bears a tiered floating interest rate of London Interbank Offered Rate (“LIBOR”) plus a margin of between 1.50% and 1.75% depending on usage (or, at the election of the borrower, a tiered floating interest rate based on the agent’s prime rate plus a margin of between 0.50% and 0.75% depending on usage). A commitment fee is payable on the undrawn portion of the ABL Facility in an amount equal to 0.25% per annum of the average daily balance of unused commitments during each calendar quarter.
At January 28, 2017, under our ABL Facility, we had $465 million of outstanding borrowings, a total of $95 million of outstanding letters of credit and excess availability of $789 million. We are also subject to a minimum excess availability covenant of $125 million, with remaining availability of $664 million in excess of the covenant at January 28, 2017. We had
67
deferred debt issuance costs of $13 million and $19 million for this credit facility as of January 28, 2017 and January 30, 2016, respectively, which have been included in Other assets on our Consolidated Balance Sheets.
The ABL facility is available for general corporate purposes and the issuance of letters of credit. Borrowings under this credit facility are secured by tangible and intangible assets of Toys-Delaware and certain of its subsidiaries, subject to specific exclusions stated in the credit agreement. The credit agreement contains covenants that, among other things, restrict Toys-Delaware’s ability to incur certain additional indebtedness, create or permit liens on assets, engage in mergers or consolidations, make investments, loans or advances, sell or transfer assets, pay dividends or distributions, repurchase capital stock or make other restricted payments, repay or prepay certain debt, engage in transactions with affiliates, amend material documents and change fiscal year. The ABL Facility, as amended pursuant to the amended and restated credit agreement, requires Toys-Delaware to maintain excess availability at all times of no less than $125 million and to sweep cash toward prepayment of the loans if excess availability falls below $150 million for any three days in a 30-day period (or if certain specified defaults are continuing or if excess availability falls below $130 million at any time). Availability is determined pursuant to a borrowing base, consisting of specified percentages of eligible inventory and eligible credit card receivables and certain Canadian real estate less any applicable availability reserves, and generally peaks in the third quarter of our fiscal year.
On October 24, 2014, Toys-Delaware and certain of its subsidiaries amended the credit agreement for the ABL Facility and the Intercreditor Agreement (as defined below) in connection with the issuance of the $1,026 million secured term B-4 loan due fiscal 2020 (“Secured Term B-4 Loan”) and $280 million tranche A-1 loan due fiscal 2019 (“Tranche A-1 Loan”). Refer to the Tranche A-1 loan facility below for further details on the amendment to the credit agreement for the ABL Facility. The Intercreditor amendment amended the Amended and Restated Intercreditor Agreement, dated as of August 24, 2010 (the “Intercreditor Agreement”), to provide for, among other things, modifications to the priority among the lenders under the Secured Term B-4 Loan and the Tranche A-1 Loan with respect to the Canadian Pledge Collateral (as defined in the Intercreditor Agreement).
European and Australian asset-based revolving credit facility, expires fiscal 2020 ($0 million at January 28, 2017)
The European ABL Facility, as amended, provides for a five-year £138 million ($173 million at January 28, 2017) asset-based senior secured revolving credit facility which will expire on December 18, 2020. Loans under the European ABL Facility as amended bears interest at a rate of LIBOR or Euro Interbank Offered Rate (“EURIBOR”) plus a margin of 2.50% through the first fiscal quarter of 2016 and thereafter 2.25%, 2.50% or 2.75% depending on historical excess availability. In addition, a commitment fee accrues on any unused portion of the commitments at a rate per annum of 0.375% or 0.50% based on usage.
At January 28, 2017, under our European ABL Facility, we had no outstanding borrowings, with $77 million of remaining availability. We had deferred debt issuance costs of $4 million for this credit facility as of January 28, 2017 and January 30, 2016, respectively, which have been included in Other assets on our Consolidated Balance Sheets.
Borrowings under the European ABL Facility are subject to, among other things, the terms of a borrowing base derived from the value of eligible inventory and/or eligible credit card receivables of certain of our foreign subsidiaries organized in Australia, England, Wales and France. The terms of the European ABL Facility include a customary cash dominion trigger requiring the cash of certain of our foreign subsidiaries to be applied to pay down outstanding loans if availability falls below certain thresholds. Borrowings under the European ABL Facility are guaranteed by TRU Europe Limited, TRU Iberia Holdings 1, S.L.U., TRU Australia Holdings, LLC (collectively, the “Parent Guarantors”) and certain of their material subsidiaries, with certain customary local law limitations and to the extent such guarantees do not result in adverse tax consequences. The European ABL Facility also contains a springing fixed charge coverage ratio of 1.00 to 1.00 based on earnings before interest, taxes, depreciation and amortization (“EBITDA”) (as defined in the agreement governing the European ABL Facility) and fixed charges of the Parent Guarantors and their subsidiaries. Borrowings are secured by substantially all of the assets of the Parent Guarantors and the UK, Wales and Australian obligors, as well as by share pledges over the shares of certain other material subsidiaries and pledges over certain of their assets (including bank accounts and certain receivables). The European ABL Facility contains covenants that, among other things, restrict the ability of the Parent Guarantors and their respective subsidiaries to incur certain additional indebtedness, create or permit liens on assets, repurchase or pay dividends or make certain other restricted payments on capital stock, make acquisitions or investments or engage in mergers or consolidations.
€46 million French real estate credit facility, due fiscal 2018 ($48 million at January 28, 2017)
On February 27, 2013, Toys “R” Us France Real Estate SAS (“TRU France Real Estate”) entered into a five-year senior secured term loan facility agreement (the “France Propco Facility Agreement”) for an aggregate principal amount of €48 million. TRU France Real Estate owns freehold and leasehold interests in properties in various retail markets throughout France. Under an operating company/property company structure, TRU France Real Estate leases these properties on a triple-net basis to Toys “R” Us SARL (“France Opco”). Substantially all of TRU France Real Estate’s revenues and cash flows are
68
derived from payments from France Opco under a series of amended lease agreements. The loan is secured by nine properties located in France. The France Propco Facility Agreement will mature on February 27, 2018 and bears interest equal to EURIBOR plus 4.50%. We have entered into an interest rate cap as required under the France Propco Facility Agreement capping EURIBOR at 2.50% per annum. Additionally, TRU France Real Estate is required to make principal payments equal to 1.25% per year of the original loan amount. As such, $1 million has been classified as Current portion of long-term debt on our Consolidated Balance Sheets as of January 28, 2017 and January 30, 2016, respectively. Deferred debt issuance costs for this credit facility were $1 million as of January 28, 2017 and January 30, 2016, respectively, and have been included as a deduction from the carrying amounts of long-term debt on our Consolidated Balance Sheets.
The France Propco Facility Agreement contains covenants that, among other things, restrict the ability of TRU France Real Estate to incur additional indebtedness, pay dividends or make other distributions, make restricted payments or certain investments, create or permit liens on assets, sell assets or engage in mergers or consolidations. The agreement also contains financial covenants including a loan to value covenant and an interest coverage ratio covenant relating to France Propco.
7.375% senior notes, due fiscal 2018 ($209 million at January 28, 2017)
On September 22, 2003, the Parent Company issued $400 million in notes bearing interest at a coupon rate of 7.375%, which will mature on October 15, 2018. The notes were issued at a discount of $2 million which resulted in proceeds of $398 million. As part of the 2016 Exchange Offers (as defined below), $192 million of the 2018 Notes were exchanged or redeemed, with $208 million in principal still outstanding. Simultaneously with the sale of the notes, we entered into interest rate swap agreements. We subsequently terminated the swaps and received a payment of $10 million which is being amortized over the remaining term of the notes. Interest is payable semi-annually on April 15 and October 15 of each year. These notes carry a limitation on creating liens on domestic real property or improvements or the stock or indebtedness of domestic subsidiaries (subject to certain exceptions) that exceed the greater of 10% of the consolidated net tangible assets or 15% of the consolidated capitalization. The covenants also restrict sale and leaseback transactions (subject to certain exceptions) unless net proceeds are at least equal to the sum of all costs incurred in connection with the acquisition of the principal property and a lien would be permitted on such principal property. Deferred debt issuance costs for these notes were less than $1 million and $1 million as of January 28, 2017 and January 30, 2016, respectively, and have been included as a deduction from the carrying amounts of Long-term debt on our Consolidated Balance Sheets.
Senior unsecured term loan facility, due fiscal 2019 ($874 million at January 28, 2017)
On August 21, 2013, TRU Propco I entered into the Propco I Term Loan Facility for an aggregate principal amount of $985 million. The Propco I Term Loan Facility was issued at a discount of $10 million, which resulted in proceeds of $975 million. KKR did not own any of the Propco I Term Loan Facility as of January 28, 2017. KKR owned an aggregate of $16 million of the Propco I Term Loan Facility as of January 30, 2016. Deferred debt issuance costs for this loan were $9 million and $12 million as of January 28, 2017 and January 30, 2016, respectively, and have been included as a deduction from the carrying amounts of Long-term debt on our Consolidated Balance Sheets.
TRU Propco I owns fee and leasehold interests in properties in the United States, which it leases on a long-term basis to Toys-Delaware, pursuant to a master lease agreement.
The Propco I Term Loan Facility matures on August 21, 2019 and bears interest equal to, at the option of TRU Propco I, (i) LIBOR plus a margin of 5.00% per annum or (ii) the Base Rate (defined as the highest of (x) the Federal Funds Rate plus 0.50%, (y) the rate of interest in effect for such day as publicly announced from time to time by the Administrative Agent as its “prime rate,” and (z) one-month LIBOR plus 1.00%) plus a margin of 4.00% per annum, each of (i) and (ii)(z) subject to a LIBOR floor of 1.00%. The Propco I Term Loan Facility currently bears interest equal to LIBOR plus a margin of 5.00% per annum. The Propco I Term Loan Facility is guaranteed by all of TRU Propco I’s subsidiaries (the “Guarantors”). The Propco I Term Loan Facility is solely the obligation of TRU Propco I and the Guarantors and is not guaranteed by the Parent Company or Toys-Delaware.
The Propco I Term Loan Facility also requires TRU Propco I to prepay outstanding term loans with 25% of TRU Propco I’s annual excess cash flow (as defined in the Propco I Term Loan Facility), subject to the right of the lenders to decline such prepayment (the “Declined Proceeds”). As a result, TRU Propco I made prepayments of $28 million and $25 million in fiscals 2016 and 2015, respectively. Additionally, the Propco I Term Loan Facility requires TRU Propco I to prepay outstanding term loans at specified times, subject to certain exceptions and reinvestment rights, in connection with certain asset sales in an amount generally equal to 65% of the appraised value (as defined in the Propco I Term Loan Facility) of the real property disposed of in such sale. As a result, during fiscals 2016 and 2015, TRU Propco I made prepayments of $13 million and $16 million, respectively. As of January 28, 2017, an aggregate amount of $29 million has been classified as Current portion of long-term debt on our Consolidated Balance Sheet. Propco I may optionally prepay the outstanding principal balance of the loan at any time.
69
The Propco I Term Loan Facility contains certain covenants, including, among other things, covenants that, subject to certain exceptions, restrict the ability of TRU Propco I and its subsidiaries to incur certain additional indebtedness, make distributions, create or permit liens on assets, sell or otherwise dispose of assets, or engage in mergers or consolidations. The exceptions include the right of TRU Propco I to make distributions from 75% of excess cash flow plus certain other amounts, including Declined Proceeds, subject to the satisfaction of certain conditions, including satisfaction of a fixed charge ratio (as defined in the Propco I Term Loan Facility) of at least 2.0 to 1.0 for 50% of such distributions.
Tranche A-1 loan facility, due fiscal 2019 ($272 million at January 28, 2017)
On October 24, 2014, Toys-Delaware and certain of its subsidiaries amended the credit agreement for the ABL Facility to provide for, among other things, the Tranche A-1 Loan in an aggregate principal amount of $280 million. Toys-Canada borrowed $125 million principal amount of the Tranche A-1 Loan, which is subject to foreign exchange re-measurement. The Tranche A-1 Loan was issued at a discount of $8 million, which resulted in the receipt of gross proceeds of $272 million. Deferred debt issuance costs for this loan were $2 million as of January 28, 2017 and January 30, 2016, respectively, and have been included as a deduction from the carrying amounts of Long-term debt on our Consolidated Balance Sheets.
The Tranche A-1 Loan will mature on October 24, 2019, subject to a springing maturity in 2018 if the remaining Incremental secured term loan and Second incremental secured term loan have not been refinanced, extended or otherwise replaced or repaid prior to such time. The Tranche A-1 Loan bears interest equal to, at the option of Toys-Delaware or Toys-Canada, as applicable, (i) LIBOR plus a margin of 7.25% per annum (subject to a LIBOR floor of 1.00%) or (ii) the Prime Rate (defined as the highest of (x) the rate of interest in effect for such day as publicly announced from time to time by the ABL Agent as its “prime rate”, (y) the Federal Funds Rate plus 0.50%, and (z) one-month LIBOR plus 1.00%), plus a margin of 6.25% per annum. The Tranche A-1 Loan currently bears interest equal to LIBOR plus a margin of 7.25% per annum (subject to a LIBOR floor of 1.00%).
The Tranche A-1 Loan is guaranteed by Toys-Delaware’s subsidiaries (other than certain excluded subsidiaries) that guarantee the existing loans and commitments under the credit agreement for the ABL Facility. The Tranche A-1 Loan is secured by the same collateral that secures the existing loans and commitments under the credit agreement for the ABL Facility.
The Tranche A-1 Loan is subject to a borrowing base consisting of specified percentages of eligible inventory, eligible credit card receivables and certain Canadian real estate which does not reduce the availability under the borrowing base for the ABL Facility (provided that the Tranche A-1 Loan borrowing base includes (i) $125 million of the required availability amount for the ABL Facility and (ii) an availability reserve with respect to the borrowing base for the ABL Facility if the amount of outstanding Tranche A-1 Loan otherwise exceeds the borrowing base with respect to the Tranche A-1 Loan).
Propco II Mortgage Loan and Giraffe Junior Mezzanine Loan
Propco II Mortgage Loan, due fiscal 2019 ($489 million at January 28, 2017)
Giraffe Junior Mezzanine Loan, due fiscal 2019 ($78 million at January 28, 2017)
On November 3, 2016, we completed $512 million of CMBS financing and $88 million of mezzanine financing. The proceeds along with a $51 million rent prepayment from Toys-Delaware to TRU Propco II in conjunction with an amendment to the master lease agreement, and cash on hand, were used to redeem the aggregate principal amount of $725 million of Propco II Notes. As a result of the refinancing, we expensed $6 million, composed of the write-off of unamortized deferred debt issuance costs and original issue discount related to the extinguishment of the Propco II Notes. TRU Propco II entered into the Mortgage Loan Agreement, providing for the Propco II Mortgage Loan in the initial principal amount of $512 million. The Propco II Mortgage Loan has a three-year initial term expiring on November 9, 2019, and may be extended for two one-year terms at the option of TRU Propco II, subject to certain conditions, including meeting certain ratios at the time of the extension and, in the case of the second extension option, payment of an extension fee. If the Giraffe Junior Mezzanine Loan described below is outstanding, TRU Propco II may only exercise the extension options on the Propco II Mortgage Loan if the term of the Giraffe Junior Mezzanine Loan is also extended. We paid fees of $23 million, of which $22 million are capitalized as deferred debt issuance costs and included as a deduction from the carrying amounts of Long-term debt and amortized over the term of the agreement.
The Propco II Mortgage Loan has been divided into six separate components, designated as “Loan Component A” through “Loan Component F,” having payment priority in the order of their alphabetical designation, such that amortization payments, voluntary prepayments and other payments of principal will first be applied to the outstanding principal amount of Loan Component A before being applied to the other loan components. TRU Propco II will pay interest on each loan component monthly at a per annum rate equal to the sum of the spread applicable to such loan component, plus one-month LIBOR (subject to a 0% LIBOR floor). The initial weighted average spread of the loan components as of November 3, 2016, was approximately 4.88% assuming no principal prepayments or other reduction of the principal balances.
70
TRU Propco II is also required to make monthly repayments according to the amortization schedule in the Mortgage Loan Agreement in amounts between $6 million and $7 million per year. The Propco II Mortgage Loan may be prepaid at any time, subject during the first eighteen months of the term to a yield maintenance premium if the aggregate principal balance of the Propco II Mortgage Loan that has been prepaid exceeds a threshold amount. Any voluntary prepayment must be accompanied by a simultaneous and pro-rata prepayment of the Giraffe Junior Mezzanine Loan.
TRU Propco II owns fee and ground leasehold interests in properties in various retail markets throughout the United States (the “Propco II Properties”). Under an operating company/property company structure, TRU Propco II leases these properties on a triple-net basis to Toys-Delaware. Substantially all of TRU Propco II’s revenues and cash flows are derived from payments from Toys-Delaware under the amended and restated master lease agreement between TRU Propco II as landlord and Toys-Delaware as tenant (the “TRU Propco II Master Lease”). The current annual rent of $67 million under the TRU Propco II Master Lease will increase by 10% every five years during its revised 15-year term which commenced on November 3, 2016 and will expire on November 2, 2031. Propco II has the option to extend the TRU Propco II Master Lease for five additional 5-year terms, each subject to rent increases. The Propco II Mortgage Loan is secured by the first priority security interests in all of the existing and future real estate properties of TRU Propco II and its interest in the TRU Propco II Master Lease. Those real estate properties and interests in the TRU Propco II Master Lease are not available to satisfy or secure the obligations of the Company or its affiliates, other than the obligations of TRU Propco II under the Propco II Mortgage Loan.
The Mortgage Loan Agreement requires TRU Propco II to enter into, and maintain in effect, an interest rate cap agreement through the initial term of the Propco II Mortgage Loan and any extension. TRU Propco II has entered into an interest rate cap agreement with an initial notional amount of $512 million, capping LIBOR at 2.50%. For additional information on the interest rate cap, refer to Note 3 entitled “DERIVATIVE INSTRUMENTS AND HEDGING ACTIVITIES.”
The Mortgage Loan Agreement contains representations, warranties, covenants and events of default customary for mortgage loans funded in connection with a CMBS financing.
Substantially concurrent with the closing of the Propco II Mortgage Loan, the Propco II Mortgage Loan was assigned to TRU Trust 2016-TOYS (the “Trust”), which is currently the sole lender of record. The Trust is a New York common law trust, which issued the commercial mortgage pass-through certificates sold to investors under the CMBS facility (the “Certificates”). The Trust is not an affiliate of the Parent Company or any of its affiliates. The Certificates, which represent beneficial interests in the Trust, are not securities issued by, or obligations of, the Parent Company or any of its affiliates.
Additionally, as noted above, on November 3, 2016, Giraffe Junior, an indirect wholly-owned subsidiary of the Parent Company that owns 100% of the equity interest in TRU Propco II, entered into the Mezzanine Loan Agreement providing for the Giraffe Junior Mezzanine Loan in the initial principal amount of $88 million, which was issued at a discount of $4 million. The Giraffe Junior Mezzanine Loan has a three-year initial term expiring on November 9, 2019, and may be extended for two one-year terms at the option of Giraffe Junior, subject to certain conditions substantially similar to the conditions to extending the Propco II Mortgage Loan under the Mortgage Loan Agreement. If the Propco II Mortgage Loan is outstanding, Giraffe Junior may only exercise the extension options if the Propco II Mortgage Loan is also extended. We paid fees of $3 million which are capitalized as deferred debt issuance cost, included as a deduction from the carrying amounts of Long-term debt and amortized over the term of the agreement.
The Giraffe Junior Mezzanine Loan accrues interest at a fixed rate of 12.50% per annum. The Giraffe Junior Mezzanine Loan is secured by a first priority pledge of all of Giraffe Junior’s ownership interests in TRU Propco II, together with certain accounts and other related collateral of Giraffe Junior, pursuant to a pledge and security agreement.
The Giraffe Junior Mezzanine Loan may be voluntarily prepaid at any time, subject during the first eighteen months of the term to a yield maintenance premium if the aggregate principal balance of the Giraffe Junior Mezzanine Loan that has been prepaid exceeds a threshold amount. Any voluntary prepayment must be accompanied by a simultaneous and pro-rata prepayment of the TRU Propco II Mortgage Loan. The Mezzanine Loan Agreement requires Propco II to make principal repayments of (i) available excess cash, (ii) escrow refunds and (iii) from excess release proceeds, each as defined in the Mezzanine Loan Agreement, following payment of monthly debt service and required reserves under the Propco II Mortgage Loan and Giraffe Junior Mezzanine Loan. As such, $23 million has been classified as Current portion of long-term debt on our Consolidated Balance Sheet as of January 28, 2017.
The Mezzanine Loan Agreement contains representations, warranties, covenants and events of default customary for mezzanine loans of its type.
The Parent Company has guaranteed the payment and performance of liabilities of Giraffe Junior under the Mezzanine Loan Agreement and of TRU Propco II under the Mortgage Loan Agreement for damages resulting from certain breaches or actions, including, but not limited to, certain intentional abuses or destruction of the Propco II Properties, fraud, intentional
71
misrepresentation, willful misconduct, misappropriation or intentional misapplication of funds, the failure of TRU Propco II to remain a single-purpose entity and certain other violations of the Mortgage Loan Agreement and related loan documents. The terms of the guaranty for the Giraffe Junior Mezzanine Loan are substantially similar to the terms of the guaranty for the TRU Propco II Mortgage Loan. In addition, the Parent Company, TRU Propco II and Giraffe Junior have indemnified the lenders under the Mortgage Loan and Mezzanine Loan Agreements and certain other indemnified parties from and against certain environmental losses, liabilities and remediation and other costs with respect to the Propco II Properties.
Secured Term Loan Credit Agreement
Incremental secured term loan, due fiscal 2018 ($125 million at January 28, 2017)
Second incremental secured term loan, due fiscal 2018 ($62 million at January 28, 2017)
Secured term B-4 loan facility, due fiscal 2020 ($982 million at January 28, 2017)
On October 24, 2014, Toys-Delaware amended the credit agreement for our secured term loan facilities (“Secured Term Loan Credit Agreement”) to provide for, among other things, the Secured Term B-4 Loan tranche in an aggregate principal amount of $1,026 million. The Secured Term B-4 Loan was issued at a discount of $19 million. KKR did not own any of the Secured Term B-4 Loan as of January 28, 2017. KKR owned an aggregate of $2 million of the Secured B-4 Loan as of January 30, 2016. Deferred debt issuance costs for this loan were $13 million and $16 million as of January 28, 2017 and January 30, 2016, respectively, and have been included as a deduction from the carrying amounts of Long-term debt on our Consolidated Balance Sheets.
The Secured Term B-4 Loan and the Tranche A-1 Loan, together with other sources and funds available to Toys-Delaware, were used to (i) refinance in full the Secured term loan facility due fiscal 2016, (ii) extend $380 million of the term loans due fiscal 2018 under the Incremental secured term loan facility and the Second incremental secured term loan facility into the Secured Term B-4 Loan and (iii) redeem all of the 7.375% senior secured notes due fiscal 2018 (“Toys-Delaware Secured Notes”) at a redemption price of 101.844% of the principal amount thereof, plus accrued and unpaid interest to the redemption date. As a result of the refinancing, we expensed $35 million in fiscal 2014, composed of the write-off of unamortized deferred debt issuance costs and original issue discount related to the extinguishment of the Secured term loan facility, and a portion of the Incremental secured term loan facility and the Second incremental secured term loan facility and the Toys-Delaware Secured Notes, as well as a redemption premium of $6 million on the Toys-Delaware Secured Notes.
The Secured Term B-4 Loan will mature on April 24, 2020 and currently bears interest equal to LIBOR plus a margin of 8.75% per annum (subject to a LIBOR floor of 1.00%).
The Secured Term B-4 Loan is required to be repaid in equal quarterly installments in aggregate annual amounts equal to 1.00% of the original principal amount, with the balance payable on the final maturity date. As such, $10 million has been classified as Current portion of long-term debt on our Consolidated Balance Sheets as of January 28, 2017 and January 30, 2016. Voluntary prepayments and certain mandatory prepayments of the Secured Term B-4 Loan will be subject to a prepayment premium of (i) after the one and one-half year anniversary of the refinancing closing date, but prior to the two and one-half year anniversary of the refinancing closing date, 2.00% of the principal amount prepaid and (ii) after the two and one-half year anniversary of the refinancing closing date, but prior to the three and one-half year anniversary of the refinancing closing date, 1.00% of the principal amount prepaid.
On May 25, 2011, Toys-Delaware and certain of its subsidiaries entered into a Joinder Agreement (the “Joinder Agreement”) to the Secured Term Loan Credit Agreement. The Joinder Agreement added a tranche of term loans in an aggregate principal amount of $400 million due fiscal 2018 (“Incremental Secured Term Loan”). The Incremental Secured Term Loan was issued at a discount of $4 million which resulted in proceeds of $396 million. On October 24, 2014, Toys-Delaware refinanced $237 million of the Incremental Secured Term Loan outstanding in conjunction with the issuance of the Secured Term B-4 Loan described above. The Incremental Secured Term Loan will mature on May 25, 2018, and bears interest at LIBOR (with a floor of 1.50%) plus 3.75%, which is subject to a step down of 0.25% based on total leverage.
KKR did not own any of the Incremental Secured Term Loan as of January 28, 2017. KKR owned an aggregate of $12 million of the Incremental Secured Term Loan as of January 30, 2016. Deferred debt issuance costs for this loan were less than $1 million and $1 million as of January 28, 2017 and January 30, 2016, respectively, and have been included as a deduction from the carrying amounts of Long-term debt on our Consolidated Balance Sheets.
Pursuant to the terms of the Joinder Agreement, Toys-Delaware is required to make quarterly principal payments equal to 0.25% ($4 million per year) of the original principal amount of the Incremental Secured Term Loan. As such, this amount has been classified as Current portion of long-term debt on our Consolidated Balance Sheets as of January 28, 2017 and January 30, 2016.
On April 10, 2012, Toys-Delaware and certain of its subsidiaries entered into a Second Joinder Agreement (the “Second Joinder
72
Agreement”) to the Secured Term Loan Credit Agreement. The Second Joinder Agreement added a tranche of term loans in an aggregate principal amount of $225 million due fiscal 2018 (“Second Incremental Secured Term Loan”). The Second Incremental Secured Term Loan was issued at a discount of $5 million, which resulted in proceeds of $220 million. On October 24, 2014, Toys-Delaware refinanced $143 million of the Second Incremental Secured Term Loan outstanding in conjunction with the issuance of the Secured Term B-4 Loan described above. The Second Incremental Secured Term Loan will mature on May 25, 2018, and bears interest at LIBOR (with a floor of 1.50%) plus 3.75%, subject to a 0.25% step-down based on our total leverage ratio.
KKR did not own any of the Second Incremental Secured Term Loan as of January 28, 2017. KKR owned an aggregate of $2 million of the Second Incremental Secured Term Loan as of January 30, 2016. Deferred debt issuance costs for this loan were less than $1 million and $1 million as of January 28, 2017 and January 30, 2016, respectively, and have been included as a deduction from the carrying amounts of Long-term debt on our Consolidated Balance Sheets.
Toys-Delaware is required to make quarterly principal payments equal to 0.25% ($2 million per year) of the original principal amount of the Second Incremental Secured Term Loan. As such, this amount has been classified as Current portion of long-term debt on our Consolidated Balance Sheets as of January 28, 2017 and January 30, 2016.
The Secured Term Loan Credit Agreement contains customary covenants applicable to Toys-Delaware and certain of its subsidiaries, including, among other things, covenants that restrict the ability of Toys-Delaware and certain of its subsidiaries to incur certain additional indebtedness, create or permit liens on assets, or engage in mergers or consolidations, pay dividends, repurchase capital stock, make other restricted payments, make loans or advances, engage in transactions with affiliates, or amend material documents. These covenants are subject to certain exceptions, including among other things to allow for certain other additional debt incurrences including unsecured, later-maturing debt subject to a fixed charge coverage test and the provision of a cumulative credit exception allowing for Toys-Delaware and certain of its subsidiaries to make investments, pay dividends and make certain other restricted payments subject to Toys-Delaware meeting a fixed charge coverage test. If an event of default under the Secured Term Loan Credit Agreement occurs and is continuing, the principal amount outstanding, together with all accrued and unpaid interest and other amounts owed may be declared by the lenders or become immediately due and payable. Toys-Delaware may optionally prepay the outstanding principal balance of the loans at any time.
The Secured Term Loan Credit Agreement contains a provision that requires us to repay a specified percentage of excess cash flow generated in the previous fiscal year, as defined in the agreement. No repayment was required during fiscals 2016 and 2015. We do not believe we will need to make a payment for fiscal 2016 excess cash flows in fiscal 2017.
Further, the loans under the Secured Term Loan Credit Agreement are secured by the trademarks and certain other intellectual property of Geoffrey, LLC, Toys-Delaware’s wholly owned subsidiary, and the assets securing the ABL Facility including inventory, accounts receivable, equipment and certain other personal property owned or acquired by Toys-Delaware and certain of its subsidiaries. The Secured Term Loan Credit Agreement requires Toys-Delaware to prepay outstanding term loans in connection with sales of certain assets, subject to exceptions and reinvestment rights, within specified times. As a result of the sale of the intellectual property rights to the FAO Schwarz brand in fiscal 2016, we are required to make a principal prepayment consisting of the sales proceeds less the amounts reinvested in similar business assets. As such, an additional $20 million has been classified as Current portion of long-term debt on our Consolidated Balance Sheet as of January 28, 2017. This amount may be further reduced by subsequent investments in 2017.
The loans under the Secured Term Loan Credit Agreement are guaranteed by certain of Toys-Delaware’s subsidiaries. In addition, the Secured Term B-4 Loan is guaranteed by Wayne Real Estate Parent Company, LLC (the “Additional Guarantor”) pursuant to an unsecured guarantee (the “Unsecured Guarantee”) for the benefit of the lenders of the Secured Term B-4 Loan. The Additional Guarantor is a wholly-owned subsidiary of the Company and is an indirect parent of TRU Propco I which, along with its wholly-owned subsidiaries, leases its properties to Toys-Delaware pursuant to a master lease agreement. Additionally, Toys-Delaware has agreed to provide, in the future, for the benefit of the lenders of the Secured Term B-4 Loan, a first priority security interest in certain specified real property, subject to certain exceptions.
The Unsecured Guarantee contains certain provisions triggering mandatory prepayments by Toys-Delaware of the Secured Term B-4 Loan, including, among other things, in connection with the incurrence of certain additional indebtedness and the making of certain restricted payments, in each case, by the Additional Guarantor and its subsidiaries, subject to certain exceptions, including exceptions for indebtedness and restricted payments permitted under the current Propco I Term Loan Facility. The Unsecured Guarantee also contains certain covenants applicable to the Additional Guarantor and its subsidiaries, including, among other things, limitations on the sale or disposition of assets and the conduct of business, subject to certain exceptions. In addition, if the Additional Guarantor fails to comply with certain covenants in the Unsecured Guarantee, additional interest of 2.00% per annum with respect to the aggregate outstanding principal amount of Secured Term B-4 Loan will be payable by Toys-Delaware.
73
£263 million UK real estate credit facility, due fiscal 2020 ($323 million at January 28, 2017)
On March 25, 2013, UK Propco entered into the UK Propco Facility Agreement with Debussy, pursuant to which Debussy made the UK Propco Loan to UK Propco on March 28, 2013 in the aggregate principal amount of £263 million. UK Propco owns freehold and leasehold interests in properties in various retail markets throughout the United Kingdom. Under an operating company/property company structure, UK Propco leases these properties on a triple-net basis to Toys “R” Us Limited (“UK Opco”). Substantially all of UK Propco’s revenues and cash flows are derived from payments from UK Opco under a series of amended lease agreements. The UK Propco Loan is secured by, among other things, 31 owned and leased properties held by UK Propco, certain cash reserve accounts, which are classified as Restricted cash on the Consolidated Balance Sheets, and the stock of UK Propco. The UK Propco Loan bears interest on a weighted average basis of 6.85% per annum plus mandatory costs and matures on July 7, 2020.
The UK Propco Facility Agreement contains covenants that restrict the ability of UK Propco to incur certain additional indebtedness, make restricted payments or certain investments, create or permit liens on assets, dispose of properties, acquire further property, vary or terminate the lease agreements referred to above, conclude further leases or engage in mergers or consolidations. If an event of default, including an event resulting from the failure to comply with a rent to interest coverage ratio applicable to UK Propco, under the UK Propco Loan occurs and is continuing, the principal amount outstanding, together with all accrued and unpaid interest and other amounts owed may be declared immediately due and payable by the lenders. The loans are subject to mandatory prepayments in certain cases, including from the proceeds of certain permitted property disposals, and UK Propco may optionally prepay the loans at any time. Any prepayment occurring during the second and third year after July 7, 2015 are subject to a prepayment fee equal to 2% and 1%, respectively, of the amount of the loan prepaid.
Debussy is a special purpose entity established with the limited purpose of making loans and issuing £263 million of the Debussy Notes to third party investors and the Company. On July 24, 2013, Debussy completed the securitization of the UK Propco Loan, the notes of which are now publicly traded on the Irish Stock Exchange. In connection with the securitization, UK Propco entered into an amendment and restatement agreement relating to the UK Propco Facility Agreement. The Company owns and holds £13 million ($16 million and $19 million as of January 28, 2017 and January 30, 2016, respectively) principal amount of the various classes of the Debussy Notes, which are included in Other assets on our Consolidated Balance Sheets, classified as held-to-maturity and reported at amortized cost. The fair value of the Company’s investment in these notes at January 28, 2017 and January 30, 2016 was $17 million and $19 million, respectively. For further details regarding the consolidation of Debussy, refer to Note 1 entitled “SUMMARY OF SIGNIFICANT ACCOUNTING POLICIES.” Deferred debt issuance costs for this credit facility were $7 million and $11 million as of January 28, 2017 and January 30, 2016, respectively, and have been included as a deduction from the carrying amount of Long-term debt on our Consolidated Balance Sheets.
Toys-Japan bank loans (1.85% to 2.18%), due fiscals 2019-2021 ($44 million at January 28, 2017)
Toys-Japan had three bank loans with various financial institutions totaling $44 million at January 28, 2017. On October 31, 2014, Toys-Japan entered into a bank loan with a financial institution for ¥0.5 billion. The loan will mature on October 25, 2019 and bears an interest rate of 1.85% per annum. Toys-Japan is required to make semi-annual principal payments in the aggregate annual amount of ¥100 million ($1 million at January 28, 2017). As of January 28, 2017, the outstanding balance of this loan was ¥0.3 billion or $3 million. On January 29, 2016, Toys-Japan entered into a bank loan with a syndicate of financial institutions for ¥4.1 billion. The loan will mature on January 29, 2021 and bears an interest rate of TIBOR plus 1% per annum. Toys-Japan is required to make semi-annual principal payments in the aggregate annual amount of ¥820 million ($7 million at January 28, 2017). As of January 28, 2017 the outstanding balance of this loan was ¥3.7 billion or $31 million. On February 28, 2013, Toys-Japan entered into a bank loan with a financial institution for ¥2.0 billion. The loan will mature on February 26, 2021 and bears an interest rate of 2.18% per annum. Toys-Japan is required to make semi-annual principal payments in the aggregate annual of ¥250 million ($2 million at January 28, 2017). As of January 28, 2017, the outstanding balance of this loan was ¥1.1 billion or $10 million. For these loans, the semi-annual principal payments due within one year totaling $14 million are classified as Current portion of long-term debt on our Consolidated Balance Sheet as of January 28, 2017. Deferred debt issuance costs for these loans were $1 million as of January 28, 2017 and January 30, 2016, respectively, and have been included as a deduction from the carrying amounts of Long-term debt on our Consolidated Balance Sheets.
These agreements contain covenants that require, among other things, Toys-Japan to maintain a certain level of net assets and profitability during the agreement terms, including provisions that require Toys-Japan to not incur two consecutive years of ordinary loss in accordance with JGAAP, as defined in the credit agreement. The agreement also restricts Toys-Japan from paying dividends or making loans to affiliates without lender consent.
74
12.000% Taj senior secured notes, due fiscal 2021 ($577 million at January 28, 2017)
On August 16, 2016, the Parent Company, along with its indirect wholly-owned subsidiaries TRU Taj LLC (“TRU Taj”) and TRU Taj Finance, Inc. (together with TRU Taj, the “Taj Note Issuers”) completed the offers to exchange the Parent Company’s 2017 Notes and 2018 Notes for newly issued Taj Notes and, in the case of the 2017 Notes, $110 million in cash (the “Exchange Offers”).
Pursuant to the Exchange Offers, aggregate principal amounts of $345 million and $192 million of the 2017 Notes and 2018 Notes, respectively, were accepted for payment and subsequently canceled. The Taj Note Issuers issued $407 million in aggregate principal amount of Taj Notes and paid $110 million in cash consideration, a majority of which was funded by borrowings from the ABL Facility that Toys-Delaware used to settle certain intercompany payables with the Parent Company. An additional $34 million of Taj Notes were issued in concurrent private placements, of which $26 million were issued for cash, with the remainder issued as payment to certain noteholders in connection with the Exchange Offers. Altogether, $441 million of Taj Notes were issued and aggregate principal amounts of $105 million and $208 million of 2017 Notes and 2018 Notes, respectively, remained outstanding, as of such date. The Taj Notes bear an interest rate of 12% per annum and will mature on August 15, 2021. Interest is payable semiannually on February 15 and August 15 of each year, beginning on February 15, 2017.
Additionally, on August 26, 2016, the Taj Note Issuers issued an additional $142 million of Taj Notes in a private placement, resulting in $583 million of aggregate principal for the Taj Notes. A portion of the net cash proceeds of $136 million from the private placement was used to redeem the remaining outstanding balance of $105 million of 2017 Notes, at a redemption price of 102.594%, plus accrued and unpaid interest. The remaining net cash proceeds are available for general corporate purposes, which may include repayment of other indebtedness of the Company or TRU Taj. As a result of the Exchange Offers, we expensed $20 million of debt issuance costs which was recorded in Interest expense. In addition, we capitalized $6 million of net transaction fees and discounts which are being amortized over the term of the Taj Notes into interest expense.
Prior to the consummation of the Exchange Offers, the Company and its subsidiaries effected certain internal corporate reorganization transactions, including the formation of the following entities as wholly-owned direct or indirect subsidiaries of Toys “R” Us Europe LLC (“Toys Europe”): TRU Taj Holdings 1, LLC, TRU Taj Holdings 2 Limited, TRU Taj Holdings 3, LLC, TRU Taj, TRU (Japan) Holdings Parent Ltd and TRU Taj (Spain) Holdings, LLC. Prior to, or substantially concurrently with the consummation of the Exchange Offers, the Company and Toys Europe transfered equity interests in certain foreign and domestic subsidiaries to TRU Taj or to subsidiaries of TRU Taj. Such transferred subsidiaries comprised (i) the Japan, Europe and Australia operations of the Company, (ii) TRU Asia, LLC, which is the indirect parent company of the Company’s ownership interest in the Asia JV, and (iii) Wayne Real Estate Parent Company LLC and its subsidiaries.
The obligations under the Taj Notes are guaranteed by the Parent Company, certain parent companies of TRU Taj and certain direct and indirect subsidiaries of TRU Taj, including certain obligors of the European ABL Facility. The direct and guaranteed obligations under the Taj Notes (other than the guarantee by the Parent Company) are secured by the pledge of equity interests of certain foreign subsidiaries of the Company, including (i) a first priority pledge by an indirect parent company of TRU Taj, (ii) certain first-priority pledges by intermediate holding companies of equity interests of the subsidiaries comprising the Company’s Europe operations and (iii) certain second-priority pledges of certain of the equity interests currently pledged in favor of the collateral agent under the European ABL Facility.
At any time prior to February 15, 2018, the Taj Note Issuers may redeem during each twelve-month period up to 10% of the aggregate principal outstanding amount of the Taj Notes at their option, from time to time, at a redemption price equal to 103% of the principal amount of the Taj Notes to be redeemed, plus accrued and unpaid interest; provided that if less than 10% of the aggregate principal amount of the Taj Notes are redeemed during the first twelve-month period after the issue date, unused amounts may be carried over, but in no event will more than 15% of the aggregate principal amount of the Taj Notes issued on or after the issue date be redeemed as described in this paragraph.
On and after February 15, 2018, the Taj Note Issuers may redeem the Taj Notes, in whole or in part, at a redemption price equal to 100% of the principal amount of the Taj Notes to be redeemed, plus accrued and unpaid interest.
If certain change of control events occur, the Taj Note Issuers must offer to purchase the Taj Notes at 101% of their principal amount, plus accrued and unpaid interest thereon, if any, to, but excluding the purchase date. In addition, if the Company or its restricted subsidiaries (including TRU Taj and its restricted subsidiaries) sells assets or incurs certain types of indebtedness, under certain circumstances the Taj Note Issuers must offer to repurchase the Taj Notes at a price equal to 100% of the principal amount plus accrued and unpaid interest thereon, if any, to, but excluding the repurchase date on the terms set forth in the indenture.
The Taj Notes were issued under an indenture containing covenants that, among other things, limit the Company’s and the Taj
75
Notes Issuers’ ability and the ability of their respective restricted subsidiaries to incur or assume additional debt or provide guarantees in respect of obligations of other persons, issue redeemable stock and preferred stock, prepay, redeem or repurchase subordinated debt, make loans and investments, incur certain liens, impose limitations on dividends, loans or asset transfers from subsidiaries, sell or otherwise dispose of assets, including capital stock of subsidiaries, consolidate or merge with or into, or sell substantially all of its assets to another person and enter into transactions with affiliates (including Toys-Delaware). These covenants are subject to a number of limitations and exceptions.
The indenture also contains certain events of default (with certain grace periods, as applicable) and provides that, upon the occurrence of an event of default arising from certain events of bankruptcy or insolvency with respect to TRU Taj or any guarantor, all outstanding Taj Notes will become due and payable immediately without further action or notice. If any other type of event of default occurs and is continuing, then the trustee or the holders of at least 30% in principal amount of the then outstanding Taj Notes may declare all such Taj Notes to be due and payable immediately.
8.750% debentures, due fiscal 2021 ($22 million at January 28, 2017)
On August 29, 1991, the Parent Company issued $200 million in debentures bearing interest at a coupon rate of 8.750% (the “Debentures”), maturing on September 1, 2021. Interest is payable semi-annually on March 1 and September 1 of each year. On December 1, 2006, Toys-Delaware consummated a cash tender offer and purchased $178 million or 89% of the outstanding Debentures. Deferred debt issuance costs for these Debentures were nominal as of January 28, 2017 and January 30, 2016, respectively.
NOTE 3 — DERIVATIVE INSTRUMENTS AND HEDGING ACTIVITIES
We are exposed to market risk from potential changes in interest rates and foreign currency exchange rates. We regularly evaluate our exposure and enter into derivative financial instruments to economically manage these risks. We record all derivatives as either assets or liabilities on the Consolidated Balance Sheets measured at estimated fair value and we do not offset assets and liabilities with the same counterparty. We recognize the changes in fair value as unrealized gains and losses. The recognition of these gains or losses depends on our intended use of the derivatives and the resulting designation. In certain defined conditions, we may designate a derivative as a hedge for a particular exposure.
Interest Rate Contracts
We and our subsidiaries have a variety of fixed and variable rate debt instruments and are exposed to market risks resulting from interest rate fluctuations. We enter into interest rate swaps and/or caps to reduce our exposure to variability in expected future cash outflows and changes in the fair value of certain Long-term debt, attributable to the changes in LIBOR, EURIBOR and TIBOR. As of January 28, 2017, we had two interest rate caps which are designated as cash flow hedges in accordance with ASC 815.
The hedge accounting for a designated cash flow hedge requires that the effective portion be recorded to Accumulated other comprehensive loss; the ineffective portion of a cash flow hedge is recorded to Interest expense. We evaluate the effectiveness of our cash flow hedging relationships on an ongoing basis. For our derivatives that are designated as cash flow hedges, no material ineffectiveness was recorded for fiscals 2016, 2015 and 2014, respectively. Reclassifications from Accumulated other comprehensive loss to Interest expense primarily relate to realized Interest expense on interest rate swaps and caps and the amortization of gains recorded on de-designated caps. We expect to reclassify a net loss of less than $1 million in fiscal 2017 to Interest expense from Accumulated other comprehensive loss.
The hedge accounting for a designated fair value hedge requires that the gain or loss on the derivative as well as the offsetting loss or gain on the hedged item attributable to the hedged risk be recognized in Interest expense. We evaluate the effectiveness of our fair value hedging relationship on an ongoing basis and recalculate the change in the fair value of the derivative and the underlying hedged item separately. During fiscals 2016 and 2015, we held no interest rate contracts which were designated for fair value hedging. During fiscal 2014, the $350 million notional amount interest rate swap that we designated as a fair value hedge failed to meet the effectiveness assessment thresholds required to qualify for hedge accounting. In conjunction with the de-designation of the fair value hedge, we no longer adjusted the hedged debt for changes in fair value attributable to changes in the benchmark interest rate. We extinguished the previously hedged debt and recognized a $4 million gain in Interest expense. The associated interest rate swap, which was originally scheduled to expire in September 2016, was terminated on November 26, 2014. As a result, we received cash proceeds of $10 million, which included $1 million of accrued interest receivable.
76
The following table presents our outstanding interest rate contracts as of January 28, 2017 and January 30, 2016:
January 28, 2017 | January 30, 2016 | |||||||||||
(In millions) | Effective Date | Maturity Date | Notional Amount | Notional Amount | ||||||||
Interest Rate Caps | ||||||||||||
3 Month EURIBOR Interest Rate Cap (1) | February 2013 | February 2018 | $ | 49 | $ | 50 | ||||||
1 Month USD LIBOR Interest Rate Cap (1)(2) | November 2016 | November 2019 | 511 | — | ||||||||
(1) | These derivatives were designated for hedge accounting. |
(2) | On October 31, 2016, in connection with the Propco II Mortgage Loan, TRU Propco II entered into an interest rate cap agreement maturing on November 15, 2019, capping LIBOR at 2.50%, with an initial notional amount of $512 million which amortizes in conjunction with the principal of the Propco II Mortgage Loan. |
Foreign Exchange Contracts
We enter into foreign currency forward contracts to economically hedge the USD merchandise purchases of our foreign subsidiaries and our short-term, cross-currency intercompany loans with and between our foreign subsidiaries. We enter into these contracts in order to reduce our exposure to the variability in expected cash outflows attributable to changes in foreign currency rates. These derivative contracts are not designated as hedges and are recorded on our Consolidated Balance Sheets at fair value with a gain or loss recorded on the Consolidated Statements of Operations in Interest expense.
Our foreign exchange contracts typically mature within 12 months. Some of these contracts contain credit-risk related contingent features and are subject to master netting arrangements. Some of these agreements contain provisions which provide that we could be declared in default on our derivative obligations if we default on certain specified indebtedness. As of January 28, 2017, derivative liabilities related to agreements that contain credit-risk related contingent features had fair values of $1 million. As of January 30, 2016, there were no foreign exchange derivative liabilities related to agreements that contain credit-risk related contingent features. We were not required to post collateral for any of these derivative contracts.
The following table presents our outstanding foreign exchange contracts as of January 28, 2017 and January 30, 2016:
January 28, 2017 | January 30, 2016 | |||||||||||
(In millions) | Effective Date | Maturity Date | Notional Amount | Notional Amount | ||||||||
Foreign-Exchange Forwards | ||||||||||||
Intercompany loans | Varies | Varies | $ | 210 | $ | 128 | ||||||
Merchandise purchases | Varies | Varies | 245 | 18 | ||||||||
The following table sets forth the net impact of the effective portion of derivatives designated as cash flow hedges on Accumulated other comprehensive loss on our Consolidated Statements of Stockholders’ Deficit for the fiscal years ended January 28, 2017, January 30, 2016 and January 31, 2015:
Fiscal Years Ended | ||||||||||||
(In millions) | January 28, 2017 | January 30, 2016 | January 31, 2015 | |||||||||
Derivatives designated as cash flow hedges: | ||||||||||||
Beginning balance | $ | 1 | $ | — | $ | (1 | ) | |||||
Change in fair value recognized in Accumulated other comprehensive loss - Interest Rate Contracts | 1 | — | — | |||||||||
Reclassifications from Accumulated other comprehensive loss - Interest Rate Contracts | — | 1 | 1 | |||||||||
Ending balance | $ | 2 | $ | 1 | $ | — | ||||||
77
The following table sets forth the impact of derivatives on Interest expense on our Consolidated Statements of Operations for the fiscal years ended January 28, 2017, January 30, 2016 and January 31, 2015:
Fiscal Years Ended | ||||||||||||
(In millions) | January 28, 2017 | January 30, 2016 | January 31, 2015 | |||||||||
Derivatives not designated for hedge accounting: | ||||||||||||
Loss on the change in fair value - Interest Rate Contracts | $ | — | $ | — | $ | (2 | ) | |||||
Loss on the change in fair value - Intercompany Loan Foreign Exchange Contracts (1) | — | (5 | ) | (9 | ) | |||||||
Gain on the change in fair value - Merchandise Purchases Program Foreign Exchange Contracts | 2 | 9 | 9 | |||||||||
2 | 4 | (2 | ) | |||||||||
Derivatives designated as cash flow hedges: | ||||||||||||
Amortization of hedged Interest Rate Contracts | — | (1 | ) | (2 | ) | |||||||
— | (1 | ) | (2 | ) | ||||||||
Derivative designated as a fair value hedge: | ||||||||||||
Loss on the change in fair value - Interest Rate Contract | — | — | (2 | ) | ||||||||
Gain recognized in Interest expense on hedged item | — | — | 2 | |||||||||
— | — | — | ||||||||||
Total Interest expense | $ | 2 | $ | 3 | $ | (4 | ) | |||||
(1) | Losses related to our short-term, intercompany loan foreign exchange contracts are recorded in Interest expense, in addition to the corresponding foreign exchange gains and losses related to our short-term, cross-currency intercompany loans. For further details related to gains and losses resulting from foreign currency transactions, refer to Note 1 entitled “SUMMARY OF SIGNIFICANT ACCOUNTING POLICIES.” |
The following table contains the notional amounts and related fair values of our derivatives included within our Consolidated Balance Sheets as of January 28, 2017 and January 30, 2016:
January 28, 2017 | January 30, 2016 | |||||||||||||||
(In millions) | Notional Amount | Fair Value Assets/ (Liabilities) | Notional Amount | Fair Value Assets/ (Liabilities) | ||||||||||||
Interest Rate Contracts designated as cash flow hedges: | ||||||||||||||||
Other assets | $ | 560 | $ | 1 | $ | 50 | $ | — | ||||||||
Foreign Currency Contracts not designated for hedge accounting: | ||||||||||||||||
Prepaid expenses and other current assets | 229 | 7 | 53 | 1 | ||||||||||||
Accrued expenses and other current liabilities | 226 | (2 | ) | 93 | — | |||||||||||
Total derivative contracts outstanding: | ||||||||||||||||
Prepaid expenses and other current assets | 229 | 7 | 53 | 1 | ||||||||||||
Other assets | 560 | 1 | 50 | — | ||||||||||||
Total derivative assets (1) | $ | 789 | $ | 8 | $ | 103 | $ | 1 | ||||||||
Accrued expenses and other current liabilities | 226 | (2 | ) | 93 | — | |||||||||||
Total derivative liabilities (1) | $ | 226 | $ | (2 | ) | $ | 93 | $ | — | |||||||
(1) | Refer to Note 4 entitled “FAIR VALUE MEASUREMENTS” for the classification of our derivative instruments within the fair value hierarchy. |
NOTE 4 — FAIR VALUE MEASUREMENTS
To determine the fair value of our assets and liabilities, we utilize the established fair value hierarchy that distinguishes between market participant assumptions based on market data obtained from sources independent of the reporting entity (observable inputs that are classified within Levels 1 and 2 of the hierarchy) and the reporting entity’s own assumptions about market participant assumptions (unobservable inputs classified within Level 3 of the hierarchy).
78
Assets and Liabilities Measured at Fair Value on a Recurring Basis
Derivative Financial Instruments
Currently, we use derivative financial arrangements to manage a variety of risk exposures, including interest rate risk associated with our Long-term debt and foreign currency risk relating to cross-currency intercompany lending and merchandise purchases. The valuation of our foreign currency contracts is determined using market-based foreign exchange rates, which are classified as Level 2 inputs.
The valuation of our interest rate contracts is determined using widely accepted valuation techniques including discounted cash flow analysis on the expected cash flows of each derivative. This analysis reflects the contractual terms of the derivatives, including the period to maturity, and uses observable market-based inputs, including interest rate curves, foreign exchange rates and implied volatilities. We evaluate the inputs used to value our derivatives at the end of each reporting period.
For our interest rate contracts, we primarily use Level 2 inputs mentioned above to arrive at fair value. Additionally, for interest rate contracts we incorporate credit valuation adjustments to appropriately reflect both our own nonperformance risk and the respective counterparty’s nonperformance risk in the fair value measurements taking into account the impact of any applicable credit enhancements, such as collateral postings, thresholds, mutual puts and guarantees. We measure the credit risk of our derivative financial instruments that are subject to master netting agreements on a net basis by counterparty portfolio. The portfolio-level adjustments are then allocated each period to the individual assets or liabilities within the portfolio.
The credit valuation adjustments are calculated by determining the total expected exposure of the derivatives (which incorporates both the current and potential future exposure) and then applying each counterparty’s credit spread to the applicable exposure. The total expected exposure of a derivative is derived using market-observable inputs, such as yield curves and volatilities. The inputs utilized for our own credit spread are based on implied spreads from our debt, which are considered unobservable inputs. These credit valuation adjustments fall within Level 3 of the fair value hierarchy and include estimates of current credit spreads to evaluate the likelihood of default. For counterparties with publicly available credit information, the credit spreads over the LIBOR used in the calculations represent implied credit default swap spreads obtained from a third party credit data provider. Generally, significant increases (decreases) in our own credit spread in isolation would result in significantly lower (higher) fair value measurement for these derivatives. Based on the mixed input valuation, we classify these derivatives based on the lowest level in the fair value hierarchy that is significant to the overall fair value of the instrument.
Any transfer into or out of a level of the fair value hierarchy is recognized based on the value of the instruments at the end of the reporting period.
The tables below present our assets and liabilities measured at fair value on a recurring basis as of January 28, 2017 and January 30, 2016, aggregated by level in the fair value hierarchy within which those measurements fall.
Fiscal 2016
(In millions) | Quoted Prices in Active Markets for Identical Assets and Liabilities (Level 1) | Significant Other Observable Inputs (Level 2) | Significant Unobservable Inputs (Level 3) | Balance at January 28, 2017 | ||||||||||||
Assets | ||||||||||||||||
Derivative financial instruments: | ||||||||||||||||
Interest rate contracts | $ | — | $ | 1 | $ | — | $ | 1 | ||||||||
Foreign exchange contracts | — | 7 | — | 7 | ||||||||||||
Total assets | $ | — | $ | 8 | $ | — | $ | 8 | ||||||||
Liabilities | ||||||||||||||||
Derivative financial instruments: | ||||||||||||||||
Foreign exchange contracts | $ | — | $ | 2 | $ | — | $ | 2 | ||||||||
Total liabilities | $ | — | $ | 2 | $ | — | $ | 2 | ||||||||
79
Fiscal 2015
(In millions) | Quoted Prices in Active Markets for Identical Assets and Liabilities (Level 1) | Significant Other Observable Inputs (Level 2) | Significant Unobservable Inputs (Level 3) | Balance at January 30, 2016 | ||||||||||||
Assets | ||||||||||||||||
Derivative financial instruments: | ||||||||||||||||
Interest rate contracts | $ | — | $ | — | $ | — | $ | — | ||||||||
Foreign exchange contracts | — | 1 | — | 1 | ||||||||||||
Total assets | $ | — | $ | 1 | $ | — | $ | 1 | ||||||||
For the fiscal years ended January 28, 2017 and January 30, 2016, we had no derivative financial instruments within Level 3 of the fair value hierarchy.
Assets and Liabilities Measured at Fair Value on a Nonrecurring Basis
Certain of our assets and liabilities are measured at fair value on a nonrecurring basis. We evaluate the carrying value of all long-lived assets for impairment whenever events or changes in circumstances indicate that the carrying value of an asset may not be recoverable. Impairment of long-lived assets is included in Other income, net on our Consolidated Statements of Operations.
The fair value measurements related to long-lived assets held and used classified as Level 3 were determined using a discounted cash flow valuation method or a relative, market-based approach based on purchase offers or appraisals we have received from third parties. The inputs we use to calculate discounted cash flows include the projected cash flows for the asset group (generally by store location) and, when significant, a risk-adjusted rate of return we estimate would be used by a market participant in valuing the assets. The projected cash flows are based on the Company’s sales, gross margin and expense forecasts for each asset group, taking into consideration historical cash flows, as well as anticipated costs and/or proceeds from disposal. For our market-based valuations, we use purchase offers we receive from third parties, predominantly for our properties, which are classified as Level 3 because they are not received in an organized market or observable to market participants. Alternatively, when management commits to sell properties and no third party offers exist, we use asset appraisals conducted by external specialists with experience in real estate valuations. These require a significant amount of judgment regarding appropriate comparable properties and their assessment of current market conditions.
There have been no changes in valuation technique or related inputs for long-lived assets for the fiscal years ended January 28, 2017 and January 30, 2016. The table below presents our long-lived assets evaluated for impairment and measured at fair value on a nonrecurring basis for the fiscal years ended January 28, 2017 and January 30, 2016, aggregated by level in the fair value hierarchy within which those measurements fall. Because these assets are not measured at fair value on a recurring basis, certain carrying amounts and fair value measurements presented in the table may reflect values at earlier measurement dates and may no longer represent their fair values at January 28, 2017 and January 30, 2016. As of January 28, 2017 and January 30, 2016, we did not have any long-lived assets classified as Level 1 or 2 within the fair value hierarchy, respectively.
Fiscal 2016
(In millions) | Carrying Value Prior to Impairment | Significant Unobservable Inputs (Level 3) | Impairment Losses (1) | |||||||||
Long-lived assets held and used | $ | 6 | $ | 2 | $ | 4 | ||||||
Total | $ | 6 | $ | 2 | $ | 4 | ||||||
80
Fiscal 2015
(In millions) | Carrying Value Prior to Impairment | Significant Unobservable Inputs (Level 3) | Impairment Losses (1) | |||||||||
Long-lived assets held and used | $ | 11 | $ | 4 | $ | 7 | ||||||
Long-lived assets held for sale | 25 | 16 | 9 | |||||||||
Total | $ | 36 | $ | 20 | $ | 16 | ||||||
(1) | Refer to Note 1 entitled “SUMMARY OF SIGNIFICANT ACCOUNTING POLICIES” for further details. |
Other Financial Instruments
The fair values of our Long-term debt including current portion are estimated using quoted market prices for the same or similar issues and other pertinent information available to management as of the end of the respective periods. The fair values of debt instruments classified as Level 1 are based on quoted prices in reasonably active markets and Level 2 instruments are valued using market prices we obtain from external third parties. Debt instruments classified as Level 3 are not publicly traded, and therefore we are unable to obtain quoted market prices, and are generally valued using estimated spreads, a present value calculation or a cash flow analysis, as appropriate. There have been no significant changes in valuation technique or related inputs for Long-term debt for the fiscal years ended January 28, 2017 and January 30, 2016. The table below presents the carrying values and fair values of our Long-term debt including current portion as of January 28, 2017 and January 30, 2016, aggregated by level in the fair value hierarchy within which those measurements fall.
Long-term Debt | ||||||||||||||||||||
(In millions) | Carrying Value | Fair Value | Quoted Prices in Active Markets for Identical Assets and Liabilities (Level 1) | Significant Other Observable Inputs (Level 2) | Significant Unobservable Inputs (Level 3) | |||||||||||||||
January 28, 2017 | $ | 4,761 | $ | 4,560 | $ | 204 | $ | 2,679 | $ | 1,677 | ||||||||||
January 30, 2016 | 4,685 | 4,107 | 1,309 | 2,037 | 761 | |||||||||||||||
Other financial instruments that are not measured at fair value on our Consolidated Balance Sheets include cash and cash equivalents, accounts receivable, accounts payable, accrued expenses and short-term borrowings. Due to the short-term nature of these assets and liabilities, their carrying amounts approximate fair value.
NOTE 5 — PROPERTY AND EQUIPMENT
The following detail of property and equipment includes estimated useful lives which are generally used to depreciate the assets on a straight-line basis:
($ In millions) | Useful life (in years) | January 28, 2017 | January 30, 2016 | ||||||||
Land | $ | 664 | $ | 676 | |||||||
Buildings | 45-50 | 1,911 | 1,932 | ||||||||
Furniture and equipment | 3-20 | 1,409 | 1,472 | ||||||||
Property and leasehold improvements | 5-25 | 2,439 | 2,493 | ||||||||
Costs of computer software | 5 | 214 | 224 | ||||||||
Construction in progress | 96 | 71 | |||||||||
Leased equipment under capital lease | 3-5 | 17 | 32 | ||||||||
6,750 | 6,900 | ||||||||||
Less: accumulated depreciation and amortization | 3,667 | 3,721 | |||||||||
3,083 | 3,179 | ||||||||||
Less: net assets held for sale | 16 | 16 | |||||||||
Total | $ | 3,067 | $ | 3,163 | |||||||
81
Assets held for sale
Assets held for sale represent assets owned by us that we have committed to sell. In fiscal 2015, we entered into a contract to sell surplus land. The sale is contingent upon the buyer obtaining municipal approval to re-zone the property and as a result, the period required to complete the sale has been extended beyond one year. The asset has been classified as non-current and included in Other assets on our Consolidated Balance Sheets. Therefore, as of January 28, 2017 and January 30, 2016, we had $16 million of net assets classified as held for sale.
Net gains on sales of properties
During fiscals 2016, 2015 and 2014, we sold certain properties and assets for cash proceeds of $3 million, $13 million and $18 million, respectively, resulting in net gains of $1 million, $20 million and $5 million, respectively, which were recorded in Other income, net on our Consolidated Statements of Operations. Fiscal 2016 cash proceeds and net gains exclude the sale of intellectual property. Refer to Note 1 entitled “SUMMARY OF SIGNIFICANT ACCOUNTING POLICIES” for further details.
NOTE 6 — ACCOUNTS PAYABLE, ACCRUED EXPENSES AND OTHER CURRENT LIABILITIES
A summary of our Accounts payable, Accrued expenses and other current liabilities as of January 28, 2017 and January 30, 2016 is outlined in the table below:
(In millions) | January 28, 2017 | January 30, 2016 | ||||||
Merchandise accounts payable (1) | $ | 1,489 | $ | 1,488 | ||||
Non-merchandise accounts payable (2) | 206 | 211 | ||||||
Accounts payable | $ | 1,695 | $ | 1,699 | ||||
Gift card liability | $ | 233 | $ | 222 | ||||
Sales and use tax and value added tax payable | 85 | 87 | ||||||
Accrued interest | 74 | 63 | ||||||
Accrued property taxes | 47 | 48 | ||||||
Accrued payroll | 41 | 41 | ||||||
Accrued vacation | 30 | 29 | ||||||
Accrued bonus | 20 | 109 | ||||||
Other (3) | 367 | 395 | ||||||
Accrued expenses and other current liabilities | $ | 897 | $ | 994 | ||||
(1) | Includes $32 million and $44 million of book overdraft cash as of January 28, 2017 and January 30, 2016, respectively. |
(2) | Includes $53 million and $90 million of book overdraft cash as of January 28, 2017 and January 30, 2016, respectively. |
(3) | Includes, among other items, employee benefits, accrued lease liabilities and other accruals. No individual amount included exceeds 5% of Total current liabilities. |
NOTE 7 — STOCK-BASED COMPENSATION
2010 Incentive Plan
In fiscal 2010, we adopted the Toys “R” Us, Inc. 2010 Incentive Plan (the “2010 Incentive Plan”). The 2010 Incentive Plan provides that the total number of shares of our common stock that may be issued is 3,750,000 and the maximum number of such shares of common stock for which incentive stock options may be granted is 500,000. The 2010 Incentive Plan was amended in order to eliminate the prohibition on repricing stock options and stock appreciation rights without the prior approval of the stockholders of the Company. In connection with Amendment No. 2, the number of shares available for issuance under the 2010 Incentive Plan were increased by the number of shares available for issuance under the Management Equity Plan as of July 17, 2014 and any shares that after July 17, 2014 would have otherwise been available for issuance thereunder. The Board of Directors of the Company has discretion over the amount of shares available for future issuances of stock awards.
On May 31, 2015, the Board of Directors adopted amendments to the 2010 Incentive Plan and Amended and Restated Certificate of Incorporation, which were adopted by the stockholders of the Company on June 1, 2015. Amendment No. 3 to the 2010 Incentive Plan increased the number of shares available thereunder by 3,000,000 shares and Amendment No. 1 to the
82
Amended and Restated Certificate of Incorporation increased the number of authorized shares of Common Stock by 5,000,000 shares.
On March 9, 2016, the Board of Directors of the Company adopted amendments to the 2010 Incentive Plan and the Amended and Restated Certificate of Incorporation, as amended, which were adopted by the stockholders of the Company on March 22, 2016. The amendment to the Company’s 2010 Incentive Plan increased the number of shares of the Company’s common stock available thereunder by 1,000,000 shares and the amendment to the Amended and Restated Certificate of Incorporation increased the number of authorized shares of the Company’s common stock by 5,000,000 shares.
All outstanding options issued under the 2010 Incentive Plan are scheduled to expire on dates ranging from August 6, 2017 to January 8, 2027. We expect to satisfy future option exercises by issuing shares held in treasury or authorized but unissued new shares.
Stock options
In fiscals 2016, 2015 and 2014, we granted options under the 2010 Incentive Plan. The options were granted at an exercise price equal to grant date fair market value. Options granted in fiscal 2016 generally follow a graded vesting schedule of 50% on the second anniversary of the awards with the remaining portion vesting in equal annual installments over the subsequent two years. Options granted in fiscal 2015, except for those granted to David A. Brandon, Chairman of the Board and Chief Executive Officer, and those granted under the 2015 Award Exchange described below, generally follow a graded vesting schedule of 50% on the second anniversary of the awards with the remaining portion vesting in equal annual installments over the subsequent two years. Options granted in fiscal 2014, except for the options granted under the 2014 Option Exchange described below, generally follow a graded vesting schedule of four equal annual installments commencing on the first anniversary of the awards. These awards are subject to the participants continued employment with us and will vest automatically upon change of control of the Company.
Options generally expire ten years from the date of the grant, however, the options issued in connection with the 2014 Option Exchange will expire the later of five years after the final vesting date of the newly granted options or the original expiration date of the respective options they replaced.
Restricted Stock
Additionally, in connection with the services they provide as the Company’s Board of Directors, certain members of our Board of Directors were granted restricted stock units in fiscals 2015 and 2014, which were valued at a fair market value on the grant date of $8.00 per share. These restricted stock units granted to certain members of our Board of Directors cliff vested 100% on the first anniversary of the grant date.
In September 2014, the Company accelerated the vesting of certain restricted share units and restricted share awards issued under the 2010 Incentive Plan. This acceleration provided that these unvested restricted shares for eligible participants became immediately vested as of September 8, 2014. We accounted for the modification of these awards in accordance with ASC 718. Management concluded that the acceleration resulted in incremental compensation costs of $1 million in fiscal 2014, which were included in SG&A.
Certain of the awards had historically provided holders with rights to put shares to the Company in certain circumstances. The Company currently has no plans to open a transaction window for participants to put the shares to the Company in the foreseeable future, and therefore, the put right for these awards has effectively been eliminated. In fiscal 2014, in accordance with ASC 718 and ASC 480, the shares were reclassified from temporary equity to permanent equity as redemption of these equity awards was no longer considered probable or redeemable at the option of the holder.
Award Exchanges
In September 2014, certain participants were offered an opportunity to exchange their outstanding stock options that were granted prior to fiscal 2014 (“2014 Old Options”) under the Toys “R” Us, Inc. 2005 Management Equity Plan or the 2010 Incentive Plan for new stock options granted under the 2010 Incentive Plan (“2014 New Options”) on a one-for-one basis (the “2014 Option Exchange”). On October 10, 2014, the Company closed its offer with a total of 1,566,307 2014 Old Options canceled and an equal amount of 2014 New Options issued under the 2010 Incentive Plan. The 2014 New Options have an exercise price of $8.00 and vest as follows: (i) 2014 New Options granted in exchange for 2014 Old Options originally granted during the period commencing on January 1, 2005 and ending on December 31, 2012 vest 50% on the award exchange date and 25% on each of the first and second anniversaries of the award exchange date and (ii) 2014 New Options granted in exchange for 2014 Old Options originally granted in fiscal 2013 vest in equal annual installments over the subsequent four years from the award exchange date. We accounted for the modification in accordance with ASC 718. Management concluded that the
83
modification resulted in incremental compensation costs of less than $1 million in each of fiscals 2016 and 2015, and $2 million in fiscal 2014, which were recorded in SG&A.
In June 2015, certain participants under the 2010 Incentive Plan were offered an opportunity to exchange their unvested outstanding restricted stock units granted May 24, 2013 (“RSUs”) for a grant of two new stock options (“2015 New Options”) for every one RSU canceled. The 2015 New Options have an exercise price of $8.00. On July 31, 2015, the Company closed its offer with a total of 64,381 RSUs canceled and a total of 128,762 2015 New Options issued under the 2010 Incentive Plan. The 2015 New Options have a grant date of August 3, 2015 and vested 50% on May 24, 2016 with the remaining portion vesting on May 24, 2017, subject to the participant’s continued employment with the Company, and will vest automatically upon change of control of the Company. These options expire ten years from the date of grant, subject to the earlier expiration in accordance with the 2015 New Option award agreement. We accounted for the modification in accordance with ASC 718. Management has concluded that the modification had no impact on compensation costs.
Award Amendments
On September 12, 2016, the Company amended its stock option agreement with Michael J. Short, Executive Vice President and Chief Financial Officer, dated October 10, 2014 pursuant to which the Company amended the vesting conditions for Mr. Short’s outstanding performance-based options issued under the 2010 Incentive Plan. As a result of this amendment, these options are time-based and vested fifty percent on October 10, 2016 with the remaining portion vesting in equal annual installments over the subsequent two years. We accounted for this modification in accordance with ASC 718. The modification resulted in no incremental expense over the remaining term of the award.
On July 27, 2016, the Company amended its employment agreement with Mr. Short, dated June 19, 2014, to allow Mr. Short to participate in the 2010 Incentive Plan effective September 12, 2016. On September 12, 2016, the Company provided Mr. Short with a grant of 250,000 options under the 2010 Incentive Plan. The options have an exercise price of $11.00 per share with a grant date fair value of $1 million. The options are scheduled to vest fifty percent on the second anniversary of the grant date with the remaining portion vesting in equal annual installments over the subsequent two years, subject to Mr. Short’s continued employment on each such date.
2015 One-time Award
On June 1, 2015, the Company entered into an employment agreement with David A. Brandon to serve as Chairman of the Board and Chief Executive Officer. The employment agreement provided a one-time award of stock options under the 2010 Incentive Plan subject to time and performance based vesting conditions, which had a grant date of July 1, 2015. The award will vest ratably over forty-eight months commencing on the first month anniversary of the grant date and will only be deemed fully vested when the performance based obligations pursuant to Mr. Brandon’s employment agreement are satisfied. The one-time award has a grant date fair value of $9 million, at $8.00 per share.
Valuation Assumptions
The fair value of each option award modified or granted under the 2010 Incentive Plan is estimated on the date of modification or grant using a lattice option-pricing model that uses the assumptions noted in the following table, along with the associated weighted-average fair values. We use historical data to estimate pre-vesting option forfeitures. To the extent actual results of forfeitures differ from the estimates, such amounts will be recorded as an adjustment in the period the estimates are revised. The expected volatilities are based on a combination of implied and historical volatilities of a peer group of companies, as the Company is a non-publicly traded company. The risk-free rate is based on the United States Treasury yield curve in effect at the time of grant for periods corresponding with the expected life of the options. The expected term represents the median time until exercise and is based on contractual terms of the awards, expectations of employee exercise behavior and expectations of liquidity for the underlying shares. The expected dividend yield is based on an assumption that no dividends are expected to be approved in the near future. The following are the weighted-average assumptions used:
Fiscal Years Ended | |||||||||
January 28, 2017 | January 30, 2016 | January 31, 2015 | |||||||
Volatility | 45.0 | % | 45.0 | % | 45.0 | % | |||
Risk-free interest rate | 1.7 | % | 2.0% - 2.4% | 1.4%-2.4% | |||||
Expected term | 5.3 years | 4.0 years | 4.0-5.5 years | ||||||
Dividend Yield | — | — | — | ||||||
Weighted-average grant-date fair value per option: | $4.39 | $3.05 | $2.55 | ||||||
For fiscals 2015 and 2014, the range of assumptions presented includes the assumptions used for the modified option awards as well as the grants issued under the 2010 Incentive Plan.
84
Options
A summary of option activity under the 2010 Incentive Plan during fiscals 2016, 2015 and 2014 is presented below:
Fiscal Years Ended | |||||||||||||||||||||
January 28, 2017 | January 30, 2016 | January 31, 2015 | |||||||||||||||||||
Options | Weighted-average Exercise Price | Options | Weighted-average Exercise Price | Options | Weighted-average Exercise Price | ||||||||||||||||
Outstanding at beginning of fiscal year | 6,039,862 | $ | 8.15 | 3,922,371 | $ | 8.23 | 2,661,025 | $ | 29.40 | ||||||||||||
Granted | 1,281,129 | 11.00 | 3,245,012 | 8.00 | 3,901,217 | 8.00 | |||||||||||||||
Exercised | — | — | — | — | — | — | |||||||||||||||
Forfeited/Canceled | (561,233 | ) | 8.00 | (1,127,521 | ) | 8.00 | (2,639,871 | ) | 29.23 | ||||||||||||
Outstanding at end of fiscal year | 6,759,758 | $ | 8.70 | 6,039,862 | $ | 8.15 | 3,922,371 | $ | 8.23 | ||||||||||||
Options | Weighted-average Exercise Price | Weighted-average Remaining Contractual Term (Years) | Aggregate Intrinsic Value (in millions) | |||||||||||
Options vested or expected to vest at January 28, 2017 | 6,731,113 | $ | 8.57 | 8.0 | $ | — | ||||||||
Options exercisable at January 28, 2017 | — | — | — | — | ||||||||||
There were no options exercised in fiscals 2016, 2015 and 2014. The total fair value of options vested was $1 million in fiscal 2016 and $2 million in fiscals 2015 and 2014. We did not cash settle share-based liability awards in fiscals 2016, 2015 and 2014. We did not repurchase shares in fiscals 2016 and 2014. We paid less than $1 million in fiscal 2015 to repurchase shares.
As of January 28, 2017, there was $10 million of total unrecognized compensation cost related to option share-based compensation arrangements granted under the 2010 Incentive Plan. This cost is expected to be recognized over a weighted-average period of 2.8 years.
Restricted Shares and Units
A summary of outstanding restricted stock unit activity under the 2010 Incentive Plan during fiscals 2016, 2015 and 2014 is presented below:
Fiscal Years Ended | |||||||||||||||||||||
January 28, 2017 | January 30, 2016 | January 31, 2015 | |||||||||||||||||||
Units | Weighted-average Grant-date Fair Value | Units | Weighted-average Grant-date Fair Value | Units | Weighted-average Grant-date Fair Value | ||||||||||||||||
Outstanding units at beginning of fiscal year | 12,500 | $ | 8.00 | 290,000 | $ | 14.01 | 945,878 | $ | 29.05 | ||||||||||||
Granted | — | — | 50,000 | 8.00 | 50,000 | 8.00 | |||||||||||||||
Units converted | (12,500 | ) | 8.00 | (185,453 | ) | 26.29 | (156,079 | ) | 45.20 | ||||||||||||
Forfeited/Canceled | — | — | (142,047 | ) | 11.32 | (549,799 | ) | 30.49 | |||||||||||||
Outstanding units at end of fiscal year | — | $ | — | 12,500 | $ | 8.00 | 290,000 | $ | 14.01 | ||||||||||||
As of January 28, 2017, we did not have unrecognized compensation cost related to restricted share-based compensation arrangements under the 2010 Incentive Plan.
The fair value of restricted shares vested and restricted stock units converted was less than $1 million, $5 million and $9 million for fiscals 2016, 2015 and 2014, respectively, and we did not recognize any tax benefits as a result of the vesting and conversion.
The amount of stock-based compensation expense recognized in SG&A and the tax benefit recognized in Income tax expense in fiscals 2016, 2015 and 2014 was as follows:
Fiscal Years Ended | ||||||||||||
(In millions) | January 28, 2017 | January 30, 2016 | January 31, 2015 | |||||||||
SG&A | $ | 5 | $ | 5 | $ | 15 | ||||||
Total recognized tax benefit | — | — | — | |||||||||
85
NOTE 8 — ACCUMULATED OTHER COMPREHENSIVE LOSS
Total other comprehensive income (loss), net of tax is included in the Consolidated Statements of Comprehensive Loss and Consolidated Statements of Stockholders’ Deficit. Accumulated other comprehensive loss is reflected in the Consolidated Balance Sheets and Consolidated Statements of Stockholders’ Deficit, as follows:
(In millions) | Foreign currency translation adjustments, net of tax | Unrealized gain (loss) on hedged transactions, net of tax | Unrecognized actuarial (losses) gains, net of tax | Accumulated other comprehensive loss | ||||||||||||
Balance, February 1, 2014 | $ | (74 | ) | $ | (1 | ) | $ | (9 | ) | $ | (84 | ) | ||||
Current period change | (128 | ) | 1 | (33 | ) | (160 | ) | |||||||||
Balance, January 31, 2015 | (202 | ) | — | (42 | ) | (244 | ) | |||||||||
Current period change | (47 | ) | 1 | 20 | (26 | ) | ||||||||||
Balance, January 30, 2016 | (249 | ) | 1 | (22 | ) | (270 | ) | |||||||||
Current period change | 39 | 1 | (10 | ) | 30 | |||||||||||
Balance, January 28, 2017 | $ | (210 | ) | $ | 2 | $ | (32 | ) | $ | (240 | ) | |||||
NOTE 9 — LEASES
We lease a majority of the real estate and certain equipment used in our operations. Most real estate leases require us to pay real estate taxes and other expenses and some leases require additional payments based on percentages of sales.
Minimum rental commitments under non-cancelable operating leases, capital lease and lease financing obligations as of January 28, 2017 are as follows:
Operating Leases (1) | Capital Lease and Financing Obligations | |||||||||||||||
(In millions) | Gross Minimum Rentals | Sublease Income | Net Minimum Rentals | Lease Obligation | ||||||||||||
2017 | $ | 507 | $ | 12 | $ | 495 | $ | 31 | ||||||||
2018 | 454 | 11 | 443 | 27 | ||||||||||||
2019 | 388 | 10 | 378 | 22 | ||||||||||||
2020 | 332 | 8 | 324 | 18 | ||||||||||||
2021 | 266 | 6 | 260 | 16 | ||||||||||||
2022 and subsequent | 793 | 15 | 778 | 46 | ||||||||||||
Total | $ | 2,740 | $ | 62 | $ | 2,678 | $ | 160 | ||||||||
(1) | Excluded from the minimum rental commitments displayed above are $1.5 billion related to options to extend ground lease terms that are reasonably assured of being exercised, the balance of which is predominantly related to fiscals 2022 and thereafter. |
Total rent expense, net of sublease income, was $524 million, $546 million and $601 million in fiscals 2016, 2015 and 2014, respectively. Sublease income was $15 million, $17 million and $18 million in fiscals 2016, 2015 and 2014, respectively. We remain directly and primarily liable for lease payments to third party landlords for locations where we have subleased all or a portion of the locations to third parties. Rental payments received from our sub-lessees offset the lease payments we make to third party landlords. To the extent that sub-lessees fail to make sublease rental payments, our total net rent expense to the third party landlords would increase in direct proportion.
We record operating leases on a straight-line basis over the lease term, which includes renewal options only if those options are specified in the lease agreement and if failure to exercise the renewal option imposes a significant economic penalty on us. For Ground Lease Locations, we include renewal options in the lease term through the estimated useful life of the owned building located on the property as failure to renew a ground lease during the estimated useful life of the building would result in forgoing an economic benefit given our significant capital investment at the inception of the lease to construct a new building. For Straight Lease Locations, we do not include renewal options in the lease term as the failure to renew a straight lease does not typically result in a significant economic penalty for us, and therefore renewal cannot be reasonably assured at the inception of the lease. Substantially all of our leases include options that allow us to renew or extend the lease term beyond the initial lease period, subject to terms and conditions agreed upon at the inception of the lease. Such terms and conditions include rental
86
rates agreed upon at the inception of the lease that could represent below or above market rental rates later in the life of the lease, depending upon market conditions at the time of such renewal or extension. In addition, many leases include early termination options, which can be exercised under specified conditions, including, upon damage, destruction or condemnation of a specified percentage of the value or land area of the property.
The difference between the recognized rental expense and amounts payable under the leases is recorded as deferred rent liability. Deferred rent liabilities on our Consolidated Balance Sheets totaled $352 million and $354 million at January 28, 2017 and January 30, 2016, respectively, of which $10 million and $9 million was included in Accrued expenses and other current liabilities for each respective period.
Lease payments that depend on factors that are not measurable at the inception of the lease, such as future sales volume, are contingent rentals and are excluded from minimum lease payments. We include contingent rentals in the determination of total rental expense when it is probable that the expense has been incurred and the amount is reasonably estimable. Contingent rent expense was $12 million, $12 million and $10 million for fiscals 2016, 2015 and 2014, respectively. Future payments for maintenance, insurance and taxes to which we are obligated are excluded from minimum lease payments. Tenant allowances received upon entering into certain store leases are deferred and recognized on a straight-line basis as a reduction to rent expense over the lease term.
We have been and may be involved in the construction of leased stores which includes non-standard tenant improvements. As a result of this involvement, we were deemed the “owner” for accounting purposes and were required to capitalize the construction costs on our Consolidated Balance Sheets. Upon completion of these projects, we performed an analysis pursuant to ASC 840 and determined that we were unable to derecognize the assets capitalized during construction. Therefore, in conjunction with these leases, we recorded financing obligations equal to the cash proceeds and fair market value of the assets received. As of January 28, 2017 and January 30, 2016, the carrying amounts of our financing obligations, which primarily represent properties for which we are the deemed “owner”, were $179 million and $183 million, respectively. These carrying amounts approximate fair value. The rental payments to the landlord are recognized as a reduction of the financing obligation and interest expense. We also continue to recognize rent expense on the ground leases for the land on which these assets were constructed.
NOTE 10 — INCOME TAXES
Earnings (loss) before income taxes are as follows:
Fiscal Years Ended | ||||||||||||
(In millions) | January 28, 2017 | January 30, 2016 | January 31, 2015 | |||||||||
U.S. | $ | (147 | ) | $ | (169 | ) | $ | (263 | ) | |||
Foreign | 152 | 121 | 7 | |||||||||
Earnings (loss) before income taxes | $ | 5 | $ | (48 | ) | $ | (256 | ) | ||||
Income tax expense (benefit) is as follows:
Fiscal Years Ended | ||||||||||||
(In millions) | January 28, 2017 | January 30, 2016 | January 31, 2015 | |||||||||
Current: | ||||||||||||
U.S. Federal | $ | — | $ | 1 | $ | (13 | ) | |||||
Foreign | 53 | 54 | 46 | |||||||||
State | 5 | 4 | — | |||||||||
Total current income tax expense | $ | 58 | $ | 59 | $ | 33 | ||||||
Deferred: | ||||||||||||
U.S. Federal | $ | (29 | ) | $ | — | $ | 1 | |||||
Foreign | 7 | 17 | (2 | ) | ||||||||
State | (2 | ) | — | — | ||||||||
Total deferred income tax (benefit) expense | $ | (24 | ) | $ | 17 | $ | (1 | ) | ||||
Total income tax expense | $ | 34 | $ | 76 | $ | 32 | ||||||
Included within Income tax expense is an expense of $3 million, expense of $2 million and benefit of less than $1 million related to interest and penalties in fiscals 2016, 2015 and 2014, respectively. The interest and penalties relate to tax payments
87
and refunds for prior period tax filings made or to be made, as well as amounts associated with increases and decreases to unrecognized tax benefits.
We have not provided deferred taxes on $1 million of accumulated earnings of certain foreign subsidiaries as it is management’s intention to reinvest those earnings indefinitely. The estimated unrecognized deferred income tax liabilities on these earnings, net of associated foreign tax credits and other offsets, is zero.
The effective tax rate reconciliations are as follows:
Fiscal Years Ended | |||||||||
January 28, 2017 | January 30, 2016 | January 31, 2015 | |||||||
U.S. Federal statutory tax rate | 35.0 | % | 35.0 | % | 35.0 | % | |||
State taxes, net of U.S. Federal benefit | 29.6 | % | (5.4 | )% | — | % | |||
Foreign operations (1) | (754.6 | )% | (183.7 | )% | (13.5 | )% | |||
U.S. Federal valuation allowance | 1,249.5 | % | (10.4 | )% | (36.6 | )% | |||
Unrecognized tax benefits (2) | — | % | — | % | 3.0 | % | |||
Other | 120.5 | % | 6.2 | % | (0.4 | )% | |||
Effective tax rate | 680.0 | % | (158.3 | )% | (12.5 | )% | |||
(1) | Foreign operations benefit in fiscal 2016 primarily related to a benefit from a deemed repatriation of earnings from a high tax international jurisdiction. Foreign operations also include the net impact of: differences between local statutory rates and the U.S. Federal statutory rate; the impact of changes to foreign valuation allowances; the net cost of foreign unrecognized tax benefits; the cost of repatriating foreign earnings, net of foreign tax credits; changes to our assertion regarding the permanent reinvestment of foreign earnings related to certain foreign entities; permanent items related to foreign operations; as well as enacted changes in the tax laws or rates or a change in the status of the enterprise. |
(2) | Unrecognized tax benefits include benefits related to the resolution of issues in connection with resolving tax examinations, making protective elections, as well as changes to and clarifications of tax rules and regulations. Refer to “Unrecognized Tax Benefits” in this footnote. |
The tax effects of temporary differences that give rise to deferred tax assets and liabilities are:
(In millions) | January 28, 2017 | January 30, 2016 | ||||||
Deferred tax assets: | ||||||||
U.S. Federal tax loss and other carryforwards | $ | 364 | $ | 358 | ||||
State tax loss and other carryforwards | 86 | 83 | ||||||
Foreign tax loss and other carryforwards | 144 | 164 | ||||||
Straight line rent | 124 | 127 | ||||||
Inventory | 76 | 60 | ||||||
Insurance loss reserve | 36 | 38 | ||||||
Restructuring charges | 2 | 5 | ||||||
Other | 139 | 148 | ||||||
Gross deferred tax assets before valuation allowance | 971 | 983 | ||||||
Valuation allowance | (707 | ) | (656 | ) | ||||
Total deferred tax assets | $ | 264 | $ | 327 | ||||
Deferred tax liabilities: | ||||||||
Fixed assets (1) | $ | (17 | ) | $ | (39 | ) | ||
Undistributed earnings of foreign subsidiaries | (129 | ) | (214 | ) | ||||
Foreign currency translation | (47 | ) | (28 | ) | ||||
Other | (17 | ) | (14 | ) | ||||
Total deferred tax liabilities | $ | (210 | ) | $ | (295 | ) | ||
Net deferred tax assets | $ | 54 | $ | 32 | ||||
(1) | Includes deferred impact of finance obligations associated with capital projects. |
88
The deferred tax assets and liabilities above are reflected in the Consolidated Balance Sheets as follows:
(In millions) | January 28, 2017 | January 30, 2016 | ||||||
Deferred tax assets | $ | 129 | $ | 96 | ||||
Deferred tax liabilities | (75 | ) | (64 | ) | ||||
$ | 54 | $ | 32 | |||||
Our gross deferred tax assets above include an offset of $12 million and $8 million of unrecognized tax benefits related to tax loss carryforwards as of January 28, 2017 and January 30, 2016, respectively.
Carryforwards
In addition to the unused portion of losses and credits reported on tax returns, our carryforwards also include interest deductions that are being carried forward due to thin-capitalization and other tax limitations, as well as credits that will be realized in connection with the undistributed earnings of foreign subsidiaries on which we have provided taxes.
Of our $364 million of U.S. Federal tax loss and other carryforwards, $1 million will expire during the next 5 years, $266 million will expire during the next 6 to 20 years and $97 million may be carried forward indefinitely. Of our $86 million of state tax loss and other carryforwards, $13 million will expire during the next 5 years, $61 million will expire during the next 6 to 20 years and $12 million may be carried forward indefinitely. Of our $144 million of foreign tax loss and other carryforwards, $6 million will expire during the next 5 years, $2 million will expire during the next 6 to 20 years and $136 million may be carried forward indefinitely.
On July 21, 2005, the Company was acquired by the Sponsors. U.S. Federal and certain state and foreign taxing jurisdictions impose limitations on the amount of tax losses, credits and other carryforwards that can be used to offset current income and tax within any given year when there has been an ownership change. We have evaluated the impact of these limitations and have established a valuation allowance to reduce some of these deferred tax assets to the amount expected to be realized.
Valuation Allowance
We have evaluated the available positive and negative evidence and have concluded that, for some of our deferred tax assets, it is more likely than not that these assets will not be realized in the foreseeable future. As a result, we have established a valuation allowance to reduce these deferred tax assets for the amount we believe will not be realized. The increase to our valuation allowance for U.S. Federal and state jurisdictions, as well as in certain foreign jurisdictions, was predominantly due to the fact that, as of the end of fiscal 2016, we have incurred a pre-tax cumulative loss over the past three fiscal years. During fiscal 2016, our valuation allowance increased by $51 million. This includes a $65 million increase for U.S. Federal tax, a $1 million increase for state tax and a $15 million decrease for foreign tax.
Of our total valuation allowance of $707 million, there is $6 million related to the foreign valuation allowance which, if a benefit is subsequently recognized, will result in a reduction of another asset.
Unrecognized Tax Benefits
A reconciliation of the beginning and ending amounts of gross unrecognized tax benefits (excluding interest and penalties) is as follows:
Fiscal Years Ended | ||||||||||||
(In millions) | January 28, 2017 | January 30, 2016 | January 31, 2015 | |||||||||
Beginning balance | $ | 32 | $ | 30 | $ | 37 | ||||||
Additions for tax positions of the current year | 3 | 2 | 4 | |||||||||
Additions for tax positions of prior years | 5 | 2 | 5 | |||||||||
Reductions for tax positions of prior years (1) | (1 | ) | — | (11 | ) | |||||||
Currency translation adjustment | (1 | ) | (1 | ) | (4 | ) | ||||||
Lapse of statute of limitations | (1 | ) | (1 | ) | (1 | ) | ||||||
Ending balance | $ | 37 | $ | 32 | $ | 30 | ||||||
(1) | Reductions for tax positions of prior years include amounts related to the resolution of issues in connection with resolving tax examinations, making protective elections, as well as changes to and clarifications of tax rules and regulations. |
89
At January 28, 2017, $30 million of the $37 million of unrecognized tax benefits would affect our effective tax rate, if recognized, and the remaining $7 million would affect our deferred tax accounts. In addition, we had $8 million and less than $1 million of accrued interest and penalties, respectively, at January 28, 2017. We had $6 million and less than $1 million of accrued interest and penalties, respectively, at January 30, 2016, and $4 million and less than $1 million of accrued interest and penalties, respectively, at January 31, 2015.
The Company and its subsidiaries are subject to taxation in the United States and various foreign jurisdictions. Of the major jurisdictions, we are subject to examination in: the United States for U.S. Federal purposes for fiscal 2015 and forward and for state purposes for fiscal 2008 and forward; Australia for fiscal 2009 and forward; Canada for fiscal 2008 and forward; France for fiscal 2012 and forward; Germany for fiscal 2009 and forward; Japan for fiscal 2008 and forward; Spain for fiscal 2008 and forward; and the UK for fiscal 2009 and forward. While it is often difficult to predict whether we will prevail, we believe that our tax liabilities for unrecognized tax benefits reflect the more likely than not outcome of known tax contingencies.
We believe that it is reasonably possible that the total amount of unrecognized tax benefits of $45 million (inclusive of tax, interest and penalties) will not change during the next twelve months due to ongoing tax examinations and applicable statutes of limitations.
NOTE 11 — SEGMENTS
We generate sales, operating earnings and cash flows by retailing a variety of toy and baby product offerings worldwide. We operate all of our “R” Us branded retail stores in the United States, Puerto Rico and Guam and 76% of our 1,069 “R” Us branded retail stores internationally excluding stores with a cumulative lease term of less than two years (“Temporary Express”). The balance of our “R” Us branded retail stores internationally are operated by licensees. Licensing revenue did not have a material impact on our Net sales and accounted for $18 million in fiscal 2016 and $17 million in fiscals 2015 and 2014, respectively. We also own and operate websites including Toysrus.com and Babiesrus.com, as well as other e-commerce sites in our international markets.
Our business has two reportable segments: Toys “R” Us – Domestic (“Domestic”) and Toys “R” Us – International (“International”). The following is a brief description of our segments:
• | Domestic — Our Domestic segment sells a variety of products through 879 stores that operate in 49 states in the United States, Puerto Rico and Guam and through e-commerce. As of January 28, 2017, our Domestic stores consisted of 358 traditional toy stores, 223 baby stores, 212 side-by-side (“SBS”) stores, 48 smaller format stores with cumulative lease terms of at least two years (“Long-Term Express”) and 38 Outlet stores, as well as Temporary Express locations. |
• | International — Our International segment sells a variety of products through 812 operated and 257 licensed stores in 37 countries and jurisdictions and through e-commerce. As of January 28, 2017, our International stores consisted of 574 traditional toy stores, 208 SBS stores, 16 Long-Term Express stores and 14 baby stores, as well as Temporary Express locations. Our operated stores are located in Australia, Austria, Brunei, Canada, China, France, Germany, Hong Kong, Japan, Malaysia, Poland, Portugal, Singapore, Spain, Switzerland, Taiwan, Thailand and the United Kingdom. |
Our CEO, who is our Chief Operating Decision Maker, evaluates segment performance primarily based on Net sales, Gross margin and Operating earnings. All intercompany transactions between the segments have been eliminated. Revenues from external customers are derived primarily from merchandise sales and we do not generate material sales from any single customer.
90
The following tables show our percentage of Net sales by product category:
Fiscal Years Ended | |||||||||
Domestic: | January 28, 2017 | January 30, 2016 | January 31, 2015 | ||||||
Baby | 35.9 | % | 36.0 | % | 36.9 | % | |||
Core Toy | 19.1 | % | 18.3 | % | 17.1 | % | |||
Entertainment | 7.2 | % | 9.0 | % | 10.2 | % | |||
Learning | 24.1 | % | 23.4 | % | 22.6 | % | |||
Seasonal | 13.1 | % | 12.4 | % | 12.2 | % | |||
Other (1) | 0.6 | % | 0.9 | % | 1.0 | % | |||
Total | 100 | % | 100 | % | 100 | % | |||
(1) | Consists primarily of non-product related revenues. |
Fiscal Years Ended | |||||||||
International: | January 28, 2017 | January 30, 2016 | January 31, 2015 | ||||||
Baby | 21.3 | % | 20.5 | % | 20.2 | % | |||
Core Toy | 23.5 | % | 23.2 | % | 23.5 | % | |||
Entertainment | 6.0 | % | 7.1 | % | 8.5 | % | |||
Learning | 33.0 | % | 32.8 | % | 31.1 | % | |||
Seasonal | 15.4 | % | 15.7 | % | 15.9 | % | |||
Other (1) | 0.8 | % | 0.7 | % | 0.8 | % | |||
Total | 100 | % | 100 | % | 100 | % | |||
(1) | Consists primarily of non-product related revenues, including licensing revenue from unaffiliated third parties. |
From time to time, we may make revisions to our prior period Net sales by product category to conform to the current period allocation. These revisions did not have a significant impact to our prior year disclosure.
A summary of financial information by reportable segment is as follows:
Fiscal Years Ended | ||||||||||||
(In millions) | January 28, 2017 | January 30, 2016 | January 31, 2015 | |||||||||
Net sales | ||||||||||||
Domestic | $ | 7,131 | $ | 7,356 | $ | 7,524 | ||||||
International | 4,409 | 4,446 | 4,837 | |||||||||
Net sales | $ | 11,540 | $ | 11,802 | $ | 12,361 | ||||||
Gross margin | ||||||||||||
Domestic | $ | 2,393 | $ | 2,521 | $ | 2,563 | ||||||
International | 1,715 | 1,705 | 1,867 | |||||||||
Gross margin | $ | 4,108 | $ | 4,226 | $ | 4,430 | ||||||
Operating earnings (loss) | ||||||||||||
Domestic | $ | 414 | $ | 484 | $ | 332 | ||||||
International | 323 | 271 | 229 | |||||||||
Corporate and other | (277 | ) | (377 | ) | (370 | ) | ||||||
Operating earnings | 460 | 378 | 191 | |||||||||
Interest expense | (457 | ) | (429 | ) | (451 | ) | ||||||
Interest income | 2 | 3 | 4 | |||||||||
Earnings (loss) before income taxes | $ | 5 | $ | (48 | ) | $ | (256 | ) | ||||
Certain corporate and other items are reported separately in our disclosure of segment Operating earnings. In addition to the income items described above, charges include corporate office expenses and shared service center expenses, as well as certain other centrally managed expenses, which are not fully allocated to our reportable segments. The significant categories of expenses include salaries, benefits and related expenses, professional fees, corporate facility depreciation and amortization and
91
insurance. Salaries, benefits and related expenses include salaries, bonus, payroll taxes and health insurance expenses for corporate office employees. Professional fees include costs related to internal control compliance, financial statement audits, legal, information technology and other consulting fees, which are engaged and managed through the corporate office. Depreciation and amortization includes depreciation of leasehold improvements for properties occupied by corporate office employees. Corporate insurance expense includes the cost of fire, liability and automobile premiums.
Fiscal Years Ended | ||||||||||||
(In millions) | January 28, 2017 | January 30, 2016 | January 31, 2015 | |||||||||
Depreciation and amortization | ||||||||||||
Domestic | $ | 155 | $ | 180 | $ | 210 | ||||||
International | 111 | 107 | 116 | |||||||||
Corporate | 51 | 56 | 51 | |||||||||
Total Depreciation and amortization | $ | 317 | $ | 343 | $ | 377 | ||||||
Capital expenditures | ||||||||||||
Domestic | $ | 80 | $ | 74 | $ | 67 | ||||||
International | 99 | 74 | 83 | |||||||||
Corporate | 73 | 71 | 57 | |||||||||
Total Capital expenditures | $ | 252 | $ | 219 | $ | 207 | ||||||
(In millions) | January 28, 2017 | January 30, 2016 | ||||||
Merchandise inventories | ||||||||
Domestic | $ | 1,708 | $ | 1,559 | ||||
International | 768 | 711 | ||||||
Total Merchandise inventories | $ | 2,476 | $ | 2,270 | ||||
Total Assets | ||||||||
Domestic | $ | 3,749 | $ | 3,718 | ||||
International | 2,072 | 2,032 | ||||||
Corporate and other (1)(2) | 1,087 | 1,160 | ||||||
Total Assets | $ | 6,908 | $ | 6,910 | ||||
(1) | Includes cash and cash equivalents, deferred tax assets and other corporate assets. |
(2) | In accordance with the retrospective adoption of ASU 2015-03 and ASU 2015-15, as of January 30, 2016, we have revised the balance sheet presentation of debt issuance costs from Other assets to a deduction from the carrying amount of Long-term debt. For further details, refer to Note 1 entitled “SUMMARY OF SIGNIFICANT ACCOUNTING POLICIES.” |
Our Net sales, inclusive of each market’s respective e-commerce operations, and long-lived assets by market are as follows:
Fiscal Years Ended | ||||||||||||
(In millions) | January 28, 2017 | January 30, 2016 | January 31, 2015 | |||||||||
Net sales | ||||||||||||
United States (1) | $ | 7,131 | $ | 7,356 | $ | 7,524 | ||||||
Japan | 1,272 | 1,182 | 1,308 | |||||||||
Europe (2) | 1,163 | 1,211 | 1,405 | |||||||||
Canada | 821 | 809 | 834 | |||||||||
UK | 553 | 666 | 710 | |||||||||
China and Southeast Asia | 375 | 365 | 333 | |||||||||
Australia | 207 | 196 | 230 | |||||||||
Licensing revenue | 18 | 17 | 17 | |||||||||
Total Net sales | $ | 11,540 | $ | 11,802 | $ | 12,361 | ||||||
(1) | Includes our wholly-owned operations in Puerto Rico and Guam. |
(2) | Includes our wholly-owned operations in Austria, France, Germany, Poland, Portugal, Spain and Switzerland. |
92
(In millions) | January 28, 2017 | January 30, 2016 | ||||||
Long-lived assets | ||||||||
United States (1) | $ | 2,193 | $ | 2,275 | ||||
Europe (2) | 336 | 339 | ||||||
Japan | 263 | 277 | ||||||
UK | 233 | 266 | ||||||
Canada | 164 | 157 | ||||||
China and Southeast Asia | 50 | 43 | ||||||
Australia | 13 | 12 | ||||||
Total Long-lived assets | $ | 3,252 | $ | 3,369 | ||||
(1) | Includes our wholly-owned operations in Puerto Rico and Guam. |
(2) | Includes our wholly-owned operations in Austria, France, Germany, Poland, Portugal, Spain and Switzerland. |
93
NOTE 12 — DEFINED BENEFIT PENSION PLANS
We sponsor defined benefit pension plans covering certain international employees in the UK, Japan, Germany and Austria, with such benefits accounted for on an accrual basis using actuarial assumptions. For our pension plans, we use a measurement date matching the end of our fiscal years.
The following tables provide information regarding our pension plans:
Obligation and Funded Status at End of Fiscal Year:
(In millions) | January 28, 2017 | January 30, 2016 | ||||||
Change in projected benefit obligation: | ||||||||
Projected benefit obligation at beginning of year | $ | 148 | $ | 174 | ||||
Service cost | 4 | 5 | ||||||
Interest cost | 5 | 5 | ||||||
Plan curtailments (1) | (3 | ) | — | |||||
Benefits paid | (5 | ) | (3 | ) | ||||
Actuarial loss (gain) | 27 | (25 | ) | |||||
Foreign currency impact | (13 | ) | (8 | ) | ||||
Projected benefit obligation at end of year | $ | 163 | $ | 148 | ||||
(1) | As of the fiscal 2016 curtailment date, participants ceased to accrue future service benefits. |
(In millions) | January 28, 2017 | January 30, 2016 | ||||||
Change in fair value of plan assets: | ||||||||
Fair value of plan assets at beginning of year | $ | 123 | $ | 123 | ||||
Actual return on plan assets | 12 | (2 | ) | |||||
Employer contributions | 5 | 11 | ||||||
Benefits paid | (5 | ) | (3 | ) | ||||
Foreign currency impact | (10 | ) | (6 | ) | ||||
Fair value of plan assets at end of year | $ | 125 | $ | 123 | ||||
(In millions) | January 28, 2017 | January 30, 2016 | ||||||
Reconciliation of funded status to total amount recognized: | ||||||||
Funded status | $ | (38 | ) | $ | (25 | ) | ||
Amounts recognized on Consolidated Balance Sheets: | ||||||||
Other non-current liabilities | $ | (38 | ) | $ | (25 | ) | ||
Amounts recognized in Accumulated other comprehensive loss: | ||||||||
Unrecognized actuarial losses, net of tax | $ | 32 | $ | 22 | ||||
Of the $32 million of unrecognized actuarial losses, net of tax in Accumulated other comprehensive loss as of January 28, 2017, $1 million is expected to be amortized into net periodic benefit cost in fiscal 2017.
Information for Pension Plans with Accumulated Benefit Obligations in Excess of Plan Assets:
(In millions) | January 28, 2017 | January 30, 2016 | ||||||
Projected benefit obligation | $ | 163 | $ | 148 | ||||
Accumulated benefit obligation | 158 | 129 | ||||||
Fair value of plan assets | 125 | 123 | ||||||
94
Components of Net Periodic Benefit Cost During Each Fiscal Year:
Fiscal Years Ended | ||||||||||||
(In millions) | January 28, 2017 | January 30, 2016 | January 31, 2015 | |||||||||
Service cost | $ | 4 | $ | 5 | $ | 5 | ||||||
Interest cost | 5 | 5 | 5 | |||||||||
Expected return on plan assets | (5 | ) | (4 | ) | (5 | ) | ||||||
Actuarial losses recognized | 1 | 2 | — | |||||||||
Net periodic benefit cost | $ | 5 | $ | 8 | $ | 5 | ||||||
Contributions
For fiscal 2017, we expect to contribute $4 million to our pension plans.
Estimated Future Payments
Pension benefit payments, including amounts to be paid from our assets, and reflecting expected future service, as appropriate, are expected to be paid as follows:
(In millions) | Pension Benefits | |||
2017 | $ | 1 | ||
2018 | 1 | |||
2019 | 1 | |||
2020 | 1 | |||
2021 | 1 | |||
2022 through 2026 | 8 | |||
Weighted-average Assumptions Used to Determine Net Periodic Benefit Costs at Fiscal Year End:
January 28, 2017 | January 30, 2016 | January 31, 2015 | |||||||
Discount rate | 3.1 | % | 2.7 | % | 3.7 | % | |||
Expected rate of return on plan assets | 3.6 | % | 3.4 | % | 4.5 | % | |||
Rate of compensation increase | 2.6 | % | 2.6 | % | 2.6 | % | |||
Weighted-average Assumptions Used to Determine Benefit Obligations at Fiscal Year End:
Fiscal Years Ended | ||||||
January 28, 2017 | January 30, 2016 | |||||
Discount rate | 2.5 | % | 3.2 | % | ||
Rate of compensation increase (1) | 1.0 | % | 2.6 | % | ||
(1) | Due to the plan curtailment in fiscal 2016, there is no rate of compensation increase for the UK pension plan. |
Determination of Discount Rate
The discount rate used to determine benefit obligations for our pension plans has been developed based on the AA corporate bond yield curve.
Determination of Expected Return on Assets
The expected return on assets is the rate of return expected to be achieved on pension fund assets in the long term, net of investment expenses. More than 92% of the plan assets relate to the UK and Japan pension plans. The UK and Japan pension plans expected return on assets assumption for fiscal 2017 has been determined by considering the return on the actual asset classes held as of the measurement date and our expectations of future rates of return on each asset class. For the UK and Japan pension plans, we determine the expected rate of return by utilizing the current return available on stocks, and government and corporate bonds and applying suitable risk premiums that consider historical market returns and current market expectations. The estimate of the expected rate of return is based on a long term view and considers the impact of economic conditions in the evaluation of historical market returns.
95
Plan Assets
Investment policies and strategies
Our overall investment policy and strategic management of the plan assets are the responsibility of the trustees (acting based on advice as they deem appropriate) and are driven by investment objectives as set out below. The remaining elements of our investment policy are part of the day-to-day management of the assets, which is delegated to a professional investment manager. The trustees of our defined benefit pension plans are guided by an overall objective of achieving, over the long-term, a return on the investments, which is consistent with the long-term assumptions made by the actuaries in determining funding of the plans.
The investment returns that the trustees expect to achieve are those that are broadly in line with or above the returns of the respective market indices and performance targets against which the investment manager is benchmarked. Over the longer term, the trustees expect to achieve an investment return in excess of the consumer price index.
Weighted-average asset allocation by asset category
The primary investment goal for our plans’ assets is to maximize total asset returns while ensuring the plans’ assets are available to fund the plans’ liabilities as they become due. A change in the overall investment strategy could significantly impact the expected rate of return on plan assets.
The following represents our pension plan target asset allocations for fiscal 2017, as well as the actual asset allocations as of January 28, 2017 and January 30, 2016:
2017 Target Allocation | January 28, 2017 | January 30, 2016 | |||||||
Equity securities | 26.2 | % | 26.2 | % | 29.6 | % | |||
Debt securities | 49.3 | % | 49.3 | % | 56.6 | % | |||
Insurance contracts | 13.8 | % | 13.8 | % | 7.4 | % | |||
Cash and cash equivalents | 10.7 | % | 10.7 | % | 6.4 | % | |||
Total | 100 | % | 100 | % | 100 | % | |||
Risk management
In managing the Company’s plan assets, our investment managers evaluate and manage risk associated with funded status risk, interest rate risk, market risk, counterparty risk, liquidity risk and operational risk. Cash flow management and asset class diversification are central to our risk management strategy and are critical to the overall investment strategy of our pension plan assets.
Fair value of plan assets
The following tables present our plan assets by fair value hierarchy in accordance with ASC Topic 820, “Fair Value Measurements and Disclosures” as of January 28, 2017 and January 30, 2016. The fair value hierarchy is comprised of three levels based on the reliability of inputs used to determine fair value. Level 1 refers to fair values determined based on quoted prices in active markets for identical assets. Level 2 refers to fair values estimated using significant other observable inputs, while Level 3 includes fair values estimated using significant unobservable inputs. The level in the fair value hierarchy within which the fair value measurement falls is determined based on the lowest level input that is significant to the fair value measurement of the instrument. Investments measured using the Net Asset Value (“NAV”) are not required to be categorized within the fair value hierarchy. There have been no changes in valuation technique or related inputs for the fiscal years ended January 28, 2017 and January 30, 2016.
96
Fiscal 2016
(In millions) | Quoted Prices in Active Markets for Identical Assets (Level 1) | Significant Other Observable Inputs (Level 2) | Total | |||||||||
Insurance Contracts (1) | $ | — | $ | 17 | $ | 17 | ||||||
Cash and cash equivalents (2) | 13 | — | 13 | |||||||||
Equity Securities: (3) | ||||||||||||
Domestic | 15 | |||||||||||
International | 18 | |||||||||||
Fixed Income: (3) | ||||||||||||
Domestic | 5 | |||||||||||
International | 57 | |||||||||||
Total | $ | 13 | $ | 17 | $ | 125 | ||||||
Fiscal 2015
(In millions) | Quoted Prices in Active Markets for Identical Assets (Level 1) | Significant Other Observable Inputs (Level 2) | Total | |||||||||
Insurance Contracts (1) | $ | — | $ | 9 | $ | 9 | ||||||
Cash and cash equivalents (2) | 8 | — | 8 | |||||||||
Equity Securities: (3) | ||||||||||||
Domestic | 11 | |||||||||||
International | 25 | |||||||||||
Fixed Income: (3) | ||||||||||||
Domestic | 6 | |||||||||||
International | 64 | |||||||||||
Total | $ | 8 | $ | 9 | $ | 123 | ||||||
(1) | Insurance contracts contain a minimum guaranteed return and are categorized as Level 2 as the fair value of the assets is equal to the total amount of all individual technical reserves plus the non allocated employer’s financing fund reserves at the valuation date. The individual technical and financing fund reserves are equal to the accumulated paid contributions taking into account the insurance ratification and any allocated profit sharing return. |
(2) | Cash and cash equivalents include highly liquid investments with original maturities of three months or less at acquisition. Due to the short-term nature of these investments, their carrying amounts approximate fair value. Therefore, we have determined that our cash and cash equivalents in their entirety are classified as Level 1 within the fair value hierarchy. |
(3) | In accordance with ASU 2015-07, securities which are measured at fair value using the NAV per share practical expedient have not been classified in the fair value hierarchy. The fair value amounts presented in this table are to reconcile the fair value hierarchy to the total fair value of plan assets. |
NOTE 13 — OTHER EMPLOYEE RETIREMENT AND COMPENSATION BENEFITS
We offer other employee retirement and compensation benefits for eligible employees. The Supplemental Executive Retirement Plan (“SERP”) provides supplemental retirement benefits to certain executive officers in excess of the limitations that are imposed by Section 401(a)(17) of the Internal Revenue Code of 1986, as amended, on contributions to our TRU Partnership Employees’ Savings and Profit Sharing Plan (the “Savings Plan”). Participants are generally 100% vested in their SERP accounts after completing five years of employment with the Company. During fiscal 2016 we recorded SERP expenses of $1 million. During fiscals 2015 and 2014, we recorded SERP expenses of less than $1 million, respectively. As of January 28, 2017 and January 30, 2016, the SERP liability was $2 million, respectively.
Included in our Savings Plan, we have a 401(k) salary deferral feature, company-matching contributions and a profit sharing component for eligible U.S.-based employees. Under the terms of the Savings Plan, annual employer profit sharing contributions are made at the discretion of the Board of Directors, subject to certain limitations. The Savings Plan may be terminated at our discretion. Employee eligibility for participation in the 401(k) savings account portion of the Savings Plan
97
requires 12 months of service and completion of 1,000 hours. In addition, the Company makes a matching contribution in an amount equal to 100% of the first 4% of the participant’s contribution. We also have various defined contribution and other foreign government sponsored retirement plans for foreign employees, which are managed by each respective foreign location. Expenses related to the Savings Plan, other foreign defined contribution plans and other foreign government sponsored retirement plans were $26 million, $25 million and $24 million in fiscals 2016, 2015 and 2014, respectively. The Board of Directors did not elect to contribute to the profit sharing portion of the Savings Plan in fiscals 2016, 2015 and 2014.
NOTE 14 — LITIGATION AND LEGAL PROCEEDINGS
In May 2013, we opted out of the settlement of a class action lawsuit against Visa and MasterCard alleging violations of antitrust laws. In January 2014, we, along with several other companies, filed a separate lawsuit against Visa and MasterCard entitled Progressive Casualty Insurance Co. et al. v. Visa, Inc., et al. (United States District Court for the Eastern District of New York, No. 14-00276). A settlement was reached in December 2014, and we received a payment of $12 million in January 2015 which was recorded in SG&A.
In addition to the litigation discussed above, we are, and in the future may be, involved in various other lawsuits, claims and proceedings incident to the ordinary course of business. The results of litigation are inherently unpredictable. Any claims against us, whether meritorious or not, could be time consuming, result in costly litigation, require significant amounts of management time and result in diversion of significant resources. We are not able to estimate an aggregate amount or range of reasonably possible losses for those legal matters for which losses are not probable and estimable, primarily for the following reasons: (i) many of the relevant legal proceedings are in preliminary stages, and until such proceedings develop further, there is often uncertainty regarding the relevant facts and circumstances at issue and potential liability; and (ii) many of these proceedings involve matters of which the outcomes are inherently difficult to predict. However, based upon our historical experience with similar matters, we do not expect that any such additional losses would be material to our consolidated financial position, results of operations or cash flows.
NOTE 15 — COMMITMENTS AND CONTINGENCIES
We are subject to various claims and contingencies related to lawsuits as well as commitments under contractual and other commercial obligations. We recognize liabilities for contingencies and commitments when a loss is probable and estimable. Refer to Note 9 entitled “LEASES” for minimum rental commitments under non-cancelable operating leases having a term of more than one year as of January 28, 2017. Refer to Note 10 entitled “INCOME TAXES” for liabilities associated with uncertain tax positions.
As of January 28, 2017, we remain contingently liable for amounts due or amounts that may become due under certain real estate lease agreements that have been assigned to third parties. In the event of default by the assignees, we could be liable for payment obligations associated with these leases which have future lease related payments (not discounted to present value) of $42 million through September 2032. The impact of these obligations is not material to our Consolidated Financial Statements.
NOTE 16 — RELATED PARTY TRANSACTIONS
Sponsor Advisory Agreement
The Sponsors provide management and advisory services to us pursuant to an advisory agreement executed at the closing of the merger transaction effective as of July 21, 2005 and amended June 10, 2008, February 1, 2009, August 29, 2014, June 1, 2015 and December 1, 2015 (“Advisory Agreement”). The term of the Advisory Agreement is currently a one-year renewable term unless we or the Sponsors provide notice of termination to the other. Management and advisory fees (the “Advisory Fees”) of $6 million per annum are payable on a quarterly basis. The Advisory Agreement includes customary exculpation and indemnification provisions in favor of the Sponsors and their affiliates. In the event that the Advisory Agreement is terminated by the Sponsors or us, the Sponsors will receive all unpaid Advisory Fees and expenses due under the Advisory Agreement with respect to periods prior to the termination date plus the net present value of the Advisory Fees that would have been payable for the remainder of the then applicable one-year term of the Advisory Agreement.
In August 2014, the Advisory Agreement was amended in order to reduce the Advisory Fees to $17 million for fiscal year 2014 and each year thereafter. The amendment provided that if in the future we successfully complete an initial public offering (“IPO”), the Sponsors may elect to receive from the proceeds of such IPO, an amount equal to the aggregate difference between: (x) the Advisory Fees that would have been paid in fiscal year 2014 and each fiscal year thereafter had such amounts not been fixed and (y) the Advisory Fees that were actually paid for fiscal year 2014 and each fiscal year thereafter.
In June 2015, the Advisory Agreement was further amended in order to reduce the Advisory Fees payable in fiscal 2015 and thereafter from $17 million to $6 million annually with no further adjustment upon an IPO for such reductions. We recorded
98
Advisory Fees of $6 million for fiscals 2016 and 2015, respectively, and $17 million for fiscal 2014. We also paid the Sponsors for out-of-pocket expenses, which were nominal during fiscal 2016 and less than $1 million during fiscals 2015 and 2014, respectively.
Additionally, the original Advisory Agreement provided that affiliates of the Sponsors will be entitled to receive a fee equal to 1% of the aggregate transaction value in connection with certain financing, acquisition, disposition and change of control transactions (“Transaction Fees”). Transaction Fees were capitalized as deferred debt issuance costs and amortized over the term of the related debt agreement. In December 2015, the Advisory Agreement was further amended to waive all Transaction Fees including prior accrued and unpaid transaction fees of $47 million as well as any fees to be paid upon an IPO.
Other Relationships and Transactions with our Sponsors
From time to time, we and our subsidiaries, as well as the Sponsors or their affiliates, may acquire debt or debt securities issued by us or our subsidiaries in open market transactions, tender offers, exchange offers, privately negotiated transactions or otherwise. KKR did not own any of our debt as of January 28, 2017 and owned the following aggregate amounts of our debt as of January 30, 2016. For further details, refer to Note 2 entitled “SHORT-TERM BORROWINGS AND LONG-TERM DEBT.”
(In millions) | January 30, 2016 | |||
Propco I Term Loan Facility | $ | 16 | ||
Incremental Secured Term Loan | 12 | |||
Secured Term B-4 Loan | 2 | |||
Second Incremental Secured Term Loan | 2 | |||
Total | $ | 32 | ||
During fiscals 2016, 2015 and 2014, affiliates of KKR held debt and debt securities issued by the Company and its subsidiaries. The interest amounts paid on such debt and debt securities held by related parties were $1 million, $7 million and $10 million in fiscals 2016, 2015 and 2014, respectively.
Additionally, under lease agreements with affiliates of Vornado Realty Trust (“Vornado”), we paid an aggregate amount of $8 million in fiscals 2016, 2015 and 2014, respectively, with respect to less than 1% of our operated stores, which include Express stores. Of the aggregate amount paid in fiscals 2016, 2015 and 2014, $2 million, respectively, was allocable to joint-venture parties not otherwise affiliated with Vornado.
Each of the Sponsors, either directly or through affiliates, has ownership interests in a broad range of companies (“Portfolio Companies”) with whom we may from time to time enter into commercial transactions in the ordinary course of business, primarily for the purchase of goods and services. After a competitive bidding process, on February 1, 2015, we entered into an agreement with SquareTrade Inc. (“SquareTrade”), which was a Portfolio Company of Bain Capital Private Equity, L.P. (“Bain”). SquareTrade provides protection plans for electronic and other products that cover the repair, replacement or refund of such products. Under the agreement, we are licensed to sell protection plans on behalf of SquareTrade and receive a fixed percentage commission fee for each sale. During fiscal 2016, Bain divested its interest in SquareTrade, which is therefore no longer related to us. For fiscals 2016 and 2015, we recorded $19 million and $21 million, respectively, in commissions within Net sales. Receivables from SquareTrade were less than $1 million as of January 30, 2016 and included in Accounts and other receivables on the Consolidated Balance Sheet. Payables to SquareTrade were $3 million as of January 30, 2016 and included in Accrued expenses and other current liabilities on the Consolidated Balance Sheet.
In addition, we have a relationship with Veritiv Operating Company (“Veritiv”), which is a Portfolio Company of Bain. Prior to its formation, we had an agreement with Veritiv’s predecessor, which was independent from us. Veritiv is a strategic distribution company, from which we purchase packaging materials and receive facility and logistics solutions. In fiscals 2016, 2015 and 2014, we recorded expenses of $12 million, $13 million and $15 million, respectively, within SG&A. Payables to Veritiv were nominal as of January 28, 2017 and January 30, 2016, respectively, which are included in Accounts payable on the Consolidated Balance Sheets. We believe that none of our transactions or arrangements with Portfolio Companies are significant enough to be considered material to the Sponsors or to our business.
NOTE 17 — ACQUISITIONS
On October 31, 2011, the Company acquired a 70% ownership interest in Asia JV from Fung Retailing for a purchase price of $79 million (including a $10 million hold back) plus $8 million of contingent consideration. The terms of the agreement, as amended, provide us with the future option to acquire Fung Retailing’s 30% interest in the business and also provides Fung Retailing the option to require us to buy their 30% interest in the business beginning on April 30, 2017.
99
The Company paid the final $2 million and $1 million of contingent consideration related to the Asia JV acquisition during fiscals 2015 and 2014, respectively, which was previously accrued for on the Consolidated Balance Sheets.
As a result of the acquisition, the Company recognized Noncontrolling interest in the amount of $24 million which was measured at fair value at the acquisition date. In accordance with the terms of the agreement, the Noncontrolling interest is redeemable for cash or common stock of the Company at the option of the holder. As such, the Noncontrolling interest has been recorded in Temporary equity. Refer to Note 1 entitled “SUMMARY OF SIGNIFICANT ACCOUNTING POLICIES” for a reconciliation of the change in Noncontrolling interest to redemption value as of January 28, 2017, January 30, 2016 and January 31, 2015.
Subsequent Event
On March 24, 2017, the Company combined the legal entity structure for its Toys-Japan and Asia JV businesses (the “Asia Merger”). The combination was effected by the issuance of new shares of the Asia JV to the immediate parent company in exchange for the contribution of Toys-Japan, which resulted in Fung Retailing’s ownership of 15% and our ownership in the combined company of 85%. In conjunction with the Asia Merger, we no longer have a future option or requirement to acquire Fung Retailing’s ownership interest in the Asia JV. As such, we will reclassify the noncontrolling interest from Temporary equity to Stockholders’ deficit on the Consolidated Balance Sheet in fiscal 2017.
NOTE 18 — RECENT ACCOUNTING PRONOUNCEMENTS
In March 2017, the FASB issued ASU No. 2017-07 “Compensation-Retirement Benefits: Improving the Presentation of Net Periodic Pension Cost and Net Periodic Postretirement Benefit Cost” (“ASU 2017-07”). ASU 2017-07 provides guidance that require an employer to report the service cost component separate from the other components of net benefit pension costs. The employer is required to report the service cost component in the same line item or items as other compensation costs arising from services rendered by the pertinent employees during the period. The other components of net benefit cost are required to be presented in the income statement separately from the service cost component and outside the subtotal of income from operations, if one is presented. If a separate line item is not used, the line item used in the income statement must be disclosed. The amendments of this ASU are effective for annual reporting periods beginning after December 15, 2017 and interim periods within those years. Early adoption is permitted as of the beginning of an annual period for which financial statements (interim or annual) have not been issued or made available for issuance. Other than the revised statement of operations presentation, the adoption of ASU 2017-07 is not expected to have a material impact on our Consolidated Financial Statements.
In January 2017, the FASB issued ASU No. 2017-04 “Intangibles-Goodwill and Other (Topic 350) Simplifying the Test for Goodwill Impairment” (“ASU 2017-04”). ASU 2017-04 provides guidance to simplify the subsequent measurement of goodwill by eliminating the Step 2 procedure from the goodwill impairment test. Under the updates in ASU 2017-04, an entity should perform its annual or interim, goodwill impairment test by comparing the fair value of a reporting unit with its carrying amount. An entity should recognize an impairment charge for the amount by which the carrying amount exceeds the reporting unit’s fair value; however, the loss recognized should not exceed the total amount of goodwill allocated to that reporting unit. The amendments of this ASU are effective for annual or any interim goodwill impairment tests beginning after December 15, 2019. The adoption of ASU 2017-04 is not expected to have an impact on our Consolidated Financial Statements.
In November 2016, the FASB issued ASU No. 2016-18 “Statement of Cash Flows (Topic 230), Restricted Cash” (“ASU 2016-18”). ASU 2016-18 provides guidance on the presentation of restricted cash and restricted cash equivalents in the statement of cash flows. Under ASU 2016-18, the statement of cash flows shall explain the change during the period in the total of cash, cash equivalents, and amounts generally described as restricted cash or restricted cash equivalents. Amounts generally described as restricted cash and cash equivalents should now be included with cash and cash equivalents when reconciling the beginning-of-period and end-of-period amounts shown on the statements of cash flows. The amendments of this ASU are effective for reporting periods beginning after December 15, 2017, with early adoption permitted. Other than the revised statement of cash flows presentation, the adoption of ASU 2016-17 is not expected to have an impact on our Consolidated Financial Statements.
In October 2016, the FASB issued ASU No. 2016-17 “Consolidation (Topic 810), Interests Held Through Related Parties That Are Under Common Control” (“ASU 2016-17”). ASU 2016-17 changes how a single decision maker will consider its indirect interests when performing the primary beneficiary analysis under the variable interest entity (“VIE”) model. Under the consolidation guidance the FASB issued last year, a single decision maker was required to consider an indirect interest held by a related party under common control in its entirety. Under ASU 2016-17, the single decision maker will consider the indirect interest on a proportionate basis. ASU 2016-17 does not change the characteristics of a primary beneficiary in the VIE model. The amendments of ASU 2016-17 are effective for reporting periods beginning after December 15, 2016, with early adoption permitted. The adoption of ASU 2016-17 is not expected to have an impact on our Consolidated Financial Statements
100
In October 2016, the FASB issued ASU No. 2016-16 “Income Taxes (Topic 740), Intra-Entity Transfers of Assets Other Than Inventory” (“ASU 2016-16”). ASU 2016-16 requires companies to account for income tax effects of intercompany transactions other than inventory in the period in which the transfer occurs. This is a change from current GAAP, which requires companies to defer the income tax effects of intercompany transfers of assets until the asset has been sold to an outside party or otherwise recognized (i.e. depreciation, amortization, impaired). ASU 2016-16 will still require companies to defer the income tax effects of intercompany inventory transactions. The amendments of this ASU are effective for reporting periods beginning after December 15, 2017, with early adoption permitted. The adoption of ASU 2016-16 is not expected to have an impact on our Consolidated Financial Statements.
In August 2016, the FASB issued ASU No. 2016-15 “Statement of Cash Flows (Topic 230), Classification of Certain Cash Receipts and Cash Payments” (“ASU 2016-15”). ASU 2016-15 provides guidance on the following eight specific cash flow classification issues: (1) debt prepayment or debt extinguishment costs; (2) settlement of zero-coupon debt instruments or other debt instruments with coupon interest rates that are insignificant in relation to the effective interest rate of the borrowing; (3) contingent consideration payments made after a business combination; (4) proceeds from the settlement of insurance claims; (5) proceeds from the settlement of corporate-owned life insurance policies, including bank-owned life insurance policies; (6) distributions received from equity method investees; (7) beneficial interests in securitization transactions; and (8) separately identifiable cash flows and application of the predominance principle. Current GAAP does not include specific guidance on these eight cash flow classification issues. The amendments of this ASU are effective for reporting periods beginning after December 15, 2017, with early adoption permitted. The adoption of ASU 2016-15 is not expected to have an impact on our Consolidated Financial Statements.
In March 2016, the FASB issued ASU No. 2016-09 “Compensation-Stock Compensation (Topic 718), Improvements to Employee Share-Based Payment Accounting” (“ASU 2016-09”). Under ASU 2016-09, companies will no longer record excess tax benefits and certain tax deficiencies in additional paid-in capital (“APIC”). Instead, they will record all excess tax benefits and tax deficiencies as income tax expense or benefit in the income statement and the APIC pools will be eliminated. In addition, ASU 2016-09 eliminates the requirement that excess tax benefits be realized before companies can recognize them. ASU 2016-09 also requires companies to present excess tax benefits as an operating activity on the statement of cash flows rather than as a financing activity. Furthermore, ASU 2016-09 will increase the amount an employer can withhold to cover income taxes on awards and still qualify for the exception to liability classification for shares used to satisfy the employer’s statutory income tax withholding obligation. An employer with a statutory income tax withholding obligation will now be allowed to withhold shares with a fair value up to the amount of taxes owed using the maximum statutory tax rate in the employee’s applicable jurisdiction(s). ASU 2016-09 requires a company to classify the cash paid to a tax authority when shares are withheld to satisfy its statutory income tax withholding obligation as a financing activity on the statement of cash flows. Under current GAAP, it was not specified how these cash flows should be classified. In addition, companies will now have to elect whether to account for forfeitures on share-based payments by (1) recognizing forfeitures of awards as they occur or (2) estimating the number of awards expected to be forfeited and adjusting the estimate when it is likely to change, as is currently required. The amendments of this ASU are effective for reporting periods beginning after December 15, 2016, with early adoption permitted but all of the guidance must be adopted in the same period. The Company has elected to recognize forfeitures as they occur and the cumulative effect adjustment of that change in accounting policy has a nominal impact on our Consolidated Financial Statements. The remaining provisions of ASU 2016-09 are not expected to have a material impact on our Consolidated Financial Statements.
In March 2016, the FASB issued ASU No. 2016-07 “Investments - Equity Method and Joint Ventures (Topic 323), Simplifying the Transition to the Equity Method of Accounting” (“ASU 2016-07”). ASU 2016-07 eliminates the requirement that when an investment subsequently qualifies for use of the equity method as a result of an increase in level of ownership interest or degree of influence, an investor must adjust the investment, results of operations, and retained earnings retroactively on a step-by-step basis as if the equity method had been in effect during all previous periods that the investment had been held. This ASU requires that the equity method investor add the cost of acquiring the additional interest in the investee to the current basis of the investor’s previously held interest and to adopt the equity method of accounting as of the date the investment becomes qualified for equity method accounting. In addition, ASU 2016-07 requires that an entity that has an available-for-sale equity security that becomes qualified for the equity method of accounting recognize through earnings the unrealized gain or loss in accumulated other comprehensive income at the date the investment becomes qualified for use of the equity method. The amendments of this ASU are effective for reporting periods beginning after December 15, 2016, with early adoption permitted. The adoption of ASU 2016-07 is not expected to have an impact on our Consolidated Financial Statements.
In March 2016, the FASB issued ASU No. 2016-06 “Derivatives and Hedging (Topic 815), Contingent Put and Call Options in Debt Instruments” (“ASU 2016-06”). ASU 2016-06 clarifies the requirements for assessing whether contingent put or call options that can accelerate the payment of principal on debt instruments are clearly and closely related. Under current GAAP, two divergent approaches developed. Under the first approach, the assessment of whether contingent put or call options are clearly and closely related to the debt host only requires an analysis of the four-step decision sequence of ASC 815-15-25-42.
101
Under the second approach, in addition to the four-step decision sequence of ASC 815-15-2-42, some entities evaluate whether the ability to exercise the put or call options are triggered by the entities interest rates or credit risk. ASU 2016-06 clarifies that an entity is required to assess whether the economic characteristics and risks of embedded put or call options are clearly and closely related to those of their debt hosts only in accordance with the four-step decision sequence of ASC 815-15-2-42. An entity should not assess whether the event that triggers the ability to exercise a put or call option is related to interest rates or credit risk of the entity. ASU 2016-06 does not change the existing criteria for determining when bifurcation of an embedded put or call option in a debt instrument is required. The amendments of this ASU are effective for reporting periods beginning after December 15, 2016, with early adoption permitted. Entities are required to apply the guidance to existing debt instruments using a modified retrospective transition method as of the period of adoption. The adoption of ASU 2016-06 is not expected to have an impact on our Consolidated Financial Statements.
In March 2016, the FASB issued ASU No. 2016-05 “Derivatives and Hedging (Topic 815), Effect of Derivative Contract Novations on Existing Hedge Accounting Relationships” (“ASU 2016-05”). ASU 2015-05 provides guidance clarifying that the novation of a derivative contract (i.e. a change in counterparty) in a hedge accounting relationship does not, in and of itself, require dedesignation of that hedge accounting relationship. This ASU amends ASC 815 to clarify that such a change does not, in and of itself, represent a termination of the original derivative instrument or a change in the critical terms of the hedge relationship. ASU 2016-05 allows the hedging relationship to continue uninterrupted if all of the other hedge accounting criteria are met, including the expectation that the hedge will be highly effective when the creditworthiness of the new counterpart to the derivative contract is considered. The amendments of this ASU are effective for reporting periods beginning after December 15, 2016, with early adoption permitted. Entities may adopt the guidance prospectively or use a modified retrospective approach. The adoption of ASU 2016-05 is not expected to have an impact on our Consolidated Financial Statements.
In March 2016, the FASB issued ASU No. 2016-04 “Liabilities - Extinguishments of Liabilities (Subtopic 405-20), Recognition of Breakage for Certain Prepaid Stored-Value Products” (“ASU 2016-04”). ASU 2016-04 requires entities that sell prepaid stored-value products redeemable for goods, services or cash at third-party merchants to recognize breakage (i.e. the value that is ultimately not redeemed by the consumer) in a way that is consistent with how it will be recognized under the new revenue recognition standard. Under current GAAP, there is diversity in practice in how entities account for breakage that results when a consumer does not redeem the entire product balance. Some entities view liabilities for prepaid stored-value products that can be redeemed only for goods or services from a third-party as nonfinancial because the issuer’s obligation to the consumer will be settled by the transfer of goods or services (albeit by a third-party), not cash. Others view these liabilities as financial, given that the issuer is ultimately obligated to transfer cash to a third-party. This ASU clarifies that an entity’s liability for prepaid stored-value products within its scope meets the definition of a financial liability. The amendments of this ASU are effective for reporting periods beginning after December 15, 2017, with early adoption permitted. Entities will apply the guidance using either a modified retrospective approach or a full retrospective approach. The adoption of ASU 2016-04 is not expected to have an impact on our Consolidated Financial Statements.
In February 2016, the FASB issued ASU No. 2016-02 “Leases (Topic 842)” (“ASU 2016-02”). The FASB issued ASU 2016-02 to increase transparency and comparability among organizations by recognizing lease assets and lease liabilities on the balance sheet and disclosing key information about leasing arrangements. Under ASU 2016-02, a lessee will recognize in the statement of financial position a liability to make lease payments (the lease liability) and a right-to-use asset representing its right to use the underlying asset for the lease term. The recognition, measurement, and presentation of expenses and cash flows arising from a lease by a lessee have not significantly changed from current GAAP. ASU 2016-02 retains a distinction between finance leases (i.e. capital leases under current GAAP) and operating leases. The classification criteria for distinguishing between finance leases and operating leases will be substantially similar to the classification criteria for distinguishing between capital leases and operating leases under current GAAP. The accounting applied by the lessor is largely unchanged from that applied under current GAAP. The amendments of this ASU are effective for reporting periods beginning after December 15, 2018, with early adoption permitted. An entity will be required to recognize and measure leases at the beginning of the earliest period presented using a modified retrospective approach. Management is currently assessing the impact the adoption of ASU 2016-02 will have on our Consolidated Financial Statements.
In January 2016, the FASB issued ASU No. 2016-01 “Financial Instruments-Overall (Subtopic 825-10), Recognition and measurement of Financial Assets and Financial Liabilities” (“ASU 2016-01”). ASU 2016-01 requires the fair value measurement of equity investments that do not result in consolidation and are not accounted for under the equity method. Entities will recognize the changes in fair value through net income. ASU 2016-01 eliminates an entity’s ability to be able to recognize unrealized holding gains and losses on equity securities that are classified as available-for-sale in other comprehensive income. Entities will also no longer be able to use the cost method of accounting for equity securities that do not have readily determinable fair values. A practical expedient will be available for equity investments that do not have readily determinable fair values and do not qualify for the practical expedient to estimate fair value under ASC 820, Fair Value Measurement (i.e. net asset value practical expedient). ASU 2016-01 does not change the guidance for classifying and
102
measuring investments in debt securities and loans. In addition, for financial liabilities measured using the fair value option in ASC 825, ASU 2016-01 requires the change in fair value caused by a change in instrument-specific credit risk to be presented separately in other comprehensive income. Under ASU 2016-01, entities will be required to present financial assets and financial liabilities separately, grouped by measurement category and form of financial asset in the statement of financial position or in the accompanying notes to the financial statements. The amendments of this ASU are effective for reporting periods beginning after December 15, 2017, with early adoption permitted for certain provisions. The adoption of ASU 2016-01, is not expected to have an impact on our Consolidated Financial Statements.
In May 2014, the FASB issued ASU No. 2014-09, “Revenue from Contracts with Customers (Topic 606)” (“ASU 2014-09”). ASU 2014-09 amends the guidance for revenue recognition to replace numerous, industry-specific requirements and converges areas under this topic with those of the International Financial Reporting Standards. The ASU implements a five-step process for customer contract revenue recognition that focuses on transfer of control, as opposed to transfer of risk and rewards. The amendment also requires enhanced disclosures regarding the nature, amount, timing and uncertainty of revenues and cash flows from contracts with customers. Other major provisions include the capitalization and amortization of certain contract costs, ensuring the time value of money is considered in the transaction price, and allowing estimates of variable consideration to be recognized before contingencies are resolved in certain circumstances. The amendments of ASU 2014-09 were effective for reporting periods beginning after December 15, 2016, with early adoption prohibited. Entities can transition to the standard either retrospectively or as a cumulative-effect adjustment as of the date of adoption.
Subsequent to issuing ASU 2014-09, the FASB issued the following amendments concerning the adoption and clarification of ASU 2014-09. In August 2015, the FASB issued ASU No. 2015-14 “Revenue from Contracts with Customers (Topic 606), Deferral of the Effective Date,” which deferred the effective date one year. As a result, the amendments of ASU 2014-09 are effective for reporting periods beginning after December 15, 2017, with early adoption permitted only as of annual reporting periods beginning after December 15, 2016. In March 2016, the FASB issued ASU No. 2016-08 “Revenue from Contracts with Customers (Topic 606), Principal versus Agent Considerations (Reporting Revenue versus Net)” (“ASU 2016-08”), which clarifies the implementation guidance on principal versus agent considerations in the new revenue recognition standard. ASU 2016-08 clarifies how an entity should identify the unit of accounting (i.e. the specified good or service) for the principal versus agent evaluation and how it should apply the control principle to certain types of arrangements. In April 2016, the FASB issued ASU No. 2016-10 “Revenue from Contracts with Customers (Topic 606), Identifying Performance Obligations and Licensing” (“ASU 2016-10”), which reduces the complexity when applying the guidance for identifying performance obligations and improves the operability and understandability of the license implementation guidance. In May 2016, the FASB issued ASU No. 2016-12 “Revenue from Contracts with Customers (Topic 606), Narrow-Scope Improvements and Practical Expedients” (“ASU 2016-12”), which amends the guidance on transition, collectability, noncash consideration and the presentation of sales and other similar taxes. ASU 2016-12 clarifies that, for a contract to be considered completed at transition, all (or substantially all) of the revenue must have been recognized under legacy GAAP. In addition, ASU 2016-12 clarifies how an entity should evaluate the collectability threshold and when an entity can recognize nonrefundable consideration received as revenue if an arrangement does not meet the standard’s contract criteria. In December, FASB issued ASU No. 2016-20 “Technical Corrections and Improvements to Topic 606, Revenue from Contracts with Customers” (“ASU 2016-20”). ASU 2016-20 provides update to ASC 606, Revenue from Contracts with Customers, which will allow entities not to make quantitative disclosures about remaining performance obligations in certain cases and require entities that use any of the new or previously existing optional exemptions to expand their qualitative disclosures. It also makes 12 additional technical corrections and improvements to the new revenue standard. While the Company is continuing to assess all of the potential impacts of the new standard, we generally anticipate having substantially similar performance obligations under the amended guidance. The Company does not expect the implementation of the standard will have a material effect on the Company's consolidated results of operations, cash flows or financial position. The Company currently anticipates utilizing the full retrospective method of adoption allowed by the standard, in order to provide for comparative results in all periods presented, and plans to adopt the standard as of February 4, 2018.
103
QUARTERLY RESULTS OF OPERATIONS
The following tables set forth certain unaudited quarterly financial information:
For the 13 Weeks Ended | ||||||||||||||||
(In millions) | April 30, 2016 | July 30, 2016 | October 29, 2016 | January 28, 2017 (1) | ||||||||||||
Fiscal 2016 | ||||||||||||||||
Net sales | $ | 2,319 | $ | 2,282 | $ | 2,278 | $ | 4,661 | ||||||||
Gross margin | 846 | 862 | 821 | 1,579 | ||||||||||||
Selling, general and administrative expenses | 805 | 783 | 835 | 1,057 | ||||||||||||
Depreciation and amortization | 80 | 84 | 76 | 77 | ||||||||||||
Other income, net | (32 | ) | (23 | ) | (59 | ) | (35 | ) | ||||||||
Operating (loss) earnings | (7 | ) | 18 | (31 | ) | 480 | ||||||||||
Net (loss) earnings | (125 | ) | (93 | ) | (155 | ) | 344 | |||||||||
Net (loss) earnings attributable to Toys “R” Us, Inc. | $ | (126 | ) | $ | (95 | ) | $ | (156 | ) | $ | 341 | |||||
For the 13 Weeks Ended | ||||||||||||||||
(In millions) | May 2, 2015 | August 1, 2015 | October 31, 2015 | January 30, 2016 (1) | ||||||||||||
Fiscal 2015 | ||||||||||||||||
Net sales | $ | 2,325 | $ | 2,293 | $ | 2,331 | $ | 4,853 | ||||||||
Gross margin | 862 | 875 | 832 | 1,657 | ||||||||||||
Selling, general and administrative expenses | 827 | 796 | 827 | 1,143 | ||||||||||||
Depreciation and amortization | 87 | 86 | 80 | 90 | ||||||||||||
Other income, net | (22 | ) | (22 | ) | (21 | ) | (23 | ) | ||||||||
Operating (loss) earnings | (30 | ) | 15 | (54 | ) | 447 | ||||||||||
Net (loss) earnings | (139 | ) | (97 | ) | (166 | ) | 278 | |||||||||
Net (loss) earnings attributable to Toys “R” Us, Inc. | $ | (140 | ) | $ | (99 | ) | $ | (167 | ) | $ | 276 | |||||
(1) | Our Domestic and International businesses are highly seasonal with sales highest in the fourth quarter. During fiscals 2016, 2015 and 2014, 40%, 41% and 40%, respectively, of our total Net sales were generated in the fourth quarter. Our results of operations depend significantly upon the fourth quarter holiday selling season. |
104
PARENT COMPANY INFORMATION
Toys “R” Us, Inc.
Schedule I — Condensed Statements of Operations and Comprehensive Loss
Fiscal Years Ended | ||||||||||||
(In millions) | January 28, 2017 | January 30, 2016 | January 31, 2015 | |||||||||
Revenues | $ | — | $ | — | $ | — | ||||||
General and administrative expenses | 38 | 58 | 25 | |||||||||
Depreciation and amortization | — | — | 1 | |||||||||
Total operating expenses | 38 | 58 | 26 | |||||||||
Operating loss | (38 | ) | (58 | ) | (26 | ) | ||||||
Interest expense, net | (50 | ) | (81 | ) | (78 | ) | ||||||
Intercompany interest expense, net | (101 | ) | (78 | ) | (54 | ) | ||||||
Equity (deficit) in pre-tax earnings (loss) of consolidated subsidiaries | 187 | 163 | (102 | ) | ||||||||
Loss before income taxes | (2 | ) | (54 | ) | (260 | ) | ||||||
Income tax expense | 34 | 76 | 32 | |||||||||
Net loss | $ | (36 | ) | $ | (130 | ) | $ | (292 | ) | |||
Comprehensive loss | $ | (6 | ) | $ | (156 | ) | $ | (452 | ) | |||
See accompanying Notes to the Condensed Financial Statements.
105
Toys “R” Us, Inc.
Schedule I — Condensed Balance Sheets
(In millions) | January 28, 2017 | January 30, 2016 | ||||||
ASSETS | ||||||||
Current Assets: | ||||||||
Cash and cash equivalents | $ | 1 | $ | 1 | ||||
Income taxes receivable | 1 | 18 | ||||||
Prepaid expenses and other current assets | 7 | 16 | ||||||
Due from subsidiary | 261 | 364 | ||||||
Total current assets | 270 | 399 | ||||||
Property and equipment, net | 1 | 1 | ||||||
Other assets | 3 | 6 | ||||||
Total Assets | $ | 274 | $ | 406 | ||||
LIABILITIES AND STOCKHOLDERS’ DEFICIT | ||||||||
Current Liabilities: | ||||||||
Accrued expenses and other current liabilities | $ | 37 | $ | 77 | ||||
Income taxes payable | 3 | 2 | ||||||
Total current liabilities | 40 | 79 | ||||||
Long-term debt | 231 | 867 | ||||||
Due to subsidiaries, net | 1,195 | 638 | ||||||
Other non-current liabilities | 100 | 87 | ||||||
Stockholders’ deficit | (1,292 | ) | (1,265 | ) | ||||
Total Liabilities and Stockholders’ Deficit | $ | 274 | $ | 406 | ||||
See accompanying Notes to the Condensed Financial Statements.
106
Toys “R” Us, Inc.
Schedule I — Condensed Statements of Cash Flows
Fiscal Years Ended | ||||||||||||
(In millions) | January 28, 2017 | January 30, 2016 | January 31, 2015 | |||||||||
Cash Flows from Operating Activities | $ | 62 | $ | (25 | ) | $ | (13 | ) | ||||
Cash Flows from Investing Activities: | ||||||||||||
Investments in subsidiaries | (59 | ) | 7 | 5 | ||||||||
Intercompany loan repayments by subsidiaries | 1,233 | 1,548 | 2,056 | |||||||||
Loans to subsidiaries | (234 | ) | (1,540 | ) | (2,116 | ) | ||||||
Net cash provided by (used in) investing activities | 940 | 15 | (55 | ) | ||||||||
Cash Flows from Financing Activities: | ||||||||||||
Long-term debt repayments | (105 | ) | — | — | ||||||||
Intercompany loan repayments to subsidiaries | (897 | ) | — | — | ||||||||
Net cash used in financing activities | (1,002 | ) | — | — | ||||||||
Cash and cash equivalents: | ||||||||||||
Net decrease during period | — | (10 | ) | (68 | ) | |||||||
Cash and cash equivalents at beginning of period | 1 | 11 | 79 | |||||||||
Cash and cash equivalents at end of period | $ | 1 | $ | 1 | $ | 11 | ||||||
Supplemental Disclosures of Cash Flow Information: | ||||||||||||
Interest paid | $ | 74 | $ | 77 | $ | 77 | ||||||
Non-Cash Financing Activities: | ||||||||||||
Long-term debt exchange | $ | 537 | $ | — | $ | — | ||||||
See accompanying Notes to the Condensed Financial Statements.
107
Toys “R” Us, Inc.
Schedule I — Notes to Condensed Financial Statements
NOTE A — BASIS OF PRESENTATION
The Parent Company is a holding company that conducts substantially all of its business operations through its subsidiaries. As specified in certain of its subsidiaries’ debt agreements, there are restrictions on the Parent Company’s ability to obtain funds from certain of its subsidiaries through dividends, loans or advances (refer to Note 2 to the Consolidated Financial Statements entitled “SHORT-TERM BORROWINGS AND LONG-TERM DEBT”). Accordingly, these condensed financial statements have been presented on a “parent-only” basis. Under a parent-only presentation, the Parent Company’s investments in its consolidated subsidiaries are presented under the equity method of accounting. These parent-only financial statements should be read in conjunction with Toys “R” Us, Inc.’s audited Consolidated Financial Statements included elsewhere herein.
Due to Subsidiaries, Net - In connection with the July 21, 2005 Merger and subsequent reorganization, the Parent Company borrowed $770 million and received a promissory note of $887 million (£509 million) as a dividend from its indirect wholly-owned subsidiary, Toys “R” Us (UK) Limited (“Toys Limited”). On January 25, 2012 the $770 million intercompany note payable to Toys Limited was amended to translate the outstanding principal and accrued interest on that date to pounds sterling. As of January 30, 2016, Due to subsidiaries, net included the outstanding net intercompany receivable balance from Toys Limited of $176 million. On August 5, 2016, the Parent Company paid $897 million to Toys Limited to fully satisfy its note payable, including accrued interest, and received a payment from Toys Limited of $897 million, which satisfied all accrued interest and a majority of the principal of the note receivable. The Parent Company then contributed its remaining $195 million note receivable from Toys Limited to its wholly-owned subsidiary, Toys Europe. Toys Europe subsequently contributed the receivable to its indirect wholly-owned subsidiary.
Additionally included within Due to subsidiaries, net, as of January 28, 2017 and January 30, 2016 is a net intercompany payable to Toys-Delaware of $941 million and $835 million, respectively, which includes accrued interest. The intercompany payable to Toys-Delaware primarily consists of long-term notes payable by Parent to Toys-Delaware for which the amounts are listed in the table below. All of the notes are documented, unsecured, and include a market rate of interest. As of January 28, 2017 and January 30, 2016, the long-term notes payable by Parent to Toys-Delaware were offset by $85 million and $92 million, respectively, of third party insurance liabilities for which Toys-Delaware is the primary obligor. The remaining intercompany payable balance includes $2 million and $4 million of other payables to Toys-Delaware as of January 28, 2017 and January 30, 2016, respectively.
(In millions) | January 28, 2017 | January 30, 2016 | ||||||
Note issued by Parent in fiscal 2005 | $ | 363 | $ | 326 | ||||
Note issued by Parent in fiscal 2009 | 288 | 253 | ||||||
Note issued by Parent in fiscal 2012 (1) | 283 | 254 | ||||||
Note issued by Parent in fiscal 2012 | 90 | 90 | ||||||
Total Long-term notes payable to Toys-Delaware (2) | $ | 1,024 | $ | 923 | ||||
(1) | Note is expressly subordinated in right of payment to the senior obligations of the Parent. |
(2) | Includes accrued and unpaid interest. |
Due from Subsidiary - As of January 28, 2017 and January 30, 2016, an outstanding short-term loan of $261 million and $364 million, respectively, to Toys-Delaware was recorded in Due from subsidiary on the Condensed Balance Sheets.
Income Taxes - For fiscals 2016, 2015 and 2014, the income tax expense of $34 million, $76 million and $32 million, respectively, represents the Parent Company’s consolidated income tax expense. Such amounts include income tax expense of $98 million, $143 million and $91 million, respectively, related to our subsidiaries, which have not been consolidated for this presentation. The Parent Company is responsible for cash income tax payments on the separate company income of such subsidiaries for United States Federal and certain state filings.
108
NOTE B — DEBT
A summary of the Parent Company’s Long-term debt as of January 28, 2017 and January 30, 2016 is outlined in the table below:
(In millions) | January 28, 2017 | January 30, 2016 (1) | ||||||
10.375% senior notes, due fiscal 2017 (2) | $ | — | $ | 444 | ||||
7.375% senior notes, due fiscal 2018 (2) | 209 | 401 | ||||||
8.750% debentures, due fiscal 2021 (3) | 22 | 22 | ||||||
Total Long-term debt | $ | 231 | $ | 867 | ||||
(1) | In accordance with the retrospective adoption of ASU 2015-03 and ASU 2015-15, we have revised the presentation of the carrying amounts of individual debt liabilities as of January 30, 2016. For further details, refer to Note 1 to our Consolidated Financial Statements entitled “SUMMARY OF SIGNIFICANT ACCOUNTING POLICIES.” |
(2) | On August 16, 2016, we completed the offering to exchange the outstanding 10.375% senior notes due 2017 and 7.375% senior notes due 2018 for new 12.000% senior secured notes due 2021 issued by the Taj Note Issuers. On August 26, 2016, the Taj Note Issuers issued $142 million in additional Taj Notes in a private placement, of which a portion of the proceeds was distributed to us and used to redeem the remaining 2017 Notes. The Parent Company provides guarantees on the Taj Notes. As a result of these transactions, all of the 2017 Notes, in an aggregate principal amount of $450 million, and $192 million of the 2018 Notes were exchanged or redeemed, with $208 million in principal of the 2018 Notes still outstanding. |
(3) | Represents obligations of Toys “R” Us, Inc. and Toys–Delaware. |
The total fair values of the Parent Company’s Long-term debt, with carrying values of $231 million and $867 million at January 28, 2017 and January 30, 2016, respectively, were $223 million and $653 million, respectively. The fair values of the Parent Company’s Long-term debt are estimated using the quoted market prices for the same or similar issues and other pertinent information available to management as of the end of the respective periods.
The annual maturities of the Parent Company’s Long-term debt at January 28, 2017 are as follows:
(In millions) | Annual Maturities (at face value) | ||
2017 | $ | — | |
2018 | 208 | ||
2019 | — | ||
2020 | — | ||
2021 | 22 | ||
2022 and subsequent | — | ||
Total | $ | 230 | |
The Parent Company is a co-obligor of the outstanding Debentures, and these debt securities are included in Long-term debt within the Parent Company Condensed Balance Sheets for stand-alone reporting purposes. However, it is expected that all future principal and interest payments will be funded through the operating cash flows of Toys-Delaware. During fiscals 2016, 2015 and 2014, Toys-Delaware recorded interest expense related to the Debentures of $2 million, respectively, which is reflected as part of Equity (deficit) in pre-tax earnings (loss) of consolidated subsidiaries in the Parent Company Condensed Statements of Operations and Comprehensive Loss.
The Parent Company provides guarantees on certain subsidiaries’ borrowings. The Parent Company is the guarantor for the Taj Notes, and is the nonrecourse carve-out guarantor of the Propco II Mortgage Loan and Giraffe Junior Mezzanine Loan. The Parent Company also provides guarantees related to the uncommitted credit lines of Asia JV in an aggregate amount up to HK$198 million ($25 million at January 28, 2017) for future borrowings.
For a discussion of the debt obligations and guarantees of the Parent Company and its subsidiaries, refer to Note 2 to the Consolidated Financial Statements entitled “SHORT-TERM BORROWINGS AND LONG-TERM DEBT.”
109
NOTE C — DERIVATIVE INSTRUMENTS AND HEDGING ACTIVITIES
We are exposed to market risk from potential changes in interest rates and foreign currency exchange rates. We regularly evaluate our exposure and enter into derivative financial instruments to economically manage these risks. We record all derivatives as either assets or liabilities on the Parent Company Condensed Balance Sheets measured at estimated fair value and we do not offset assets and liabilities with the same counterparty. We recognize the changes in fair value as unrealized gains and losses. The recognition of these gains and losses depends on our intended use of the derivatives and the resulting designation. In certain defined conditions, a derivative may be specifically designated as a hedge for a particular exposure.
Interest Rate Contracts
We and our subsidiaries have a variety of fixed and variable rate debt instruments and are exposed to market risks resulting from interest rate fluctuations. We enter into interest rate swaps and/or caps to reduce our exposure to variability in expected future cash outflows attributable to the changes in LIBOR rates. Some of our interest rate contracts may contain credit-risk related contingent features and are subject to master netting arrangements. As of January 28, 2017 and January 30, 2016, we had no open derivative contracts as all of our interest rate contracts had matured during fiscal 2015.
Foreign Exchange Contracts
We occasionally enter into foreign currency forward contracts to economically hedge our short-term, cross-currency intercompany loans with our foreign subsidiaries. We enter into these contracts in order to reduce our exposure to the variability in expected cash outflows attributable to changes in foreign currency rates. These derivative contracts are not designated as hedges and are recorded on the Parent Company Condensed Balance Sheets at fair value with a gain or loss recorded in the Parent Company Condensed Statements of Operations and Comprehensive Loss in Interest expense, net. Our foreign exchange contracts typically mature within 12 months. Some of these contracts may contain credit-risk related contingent features and are subject to master netting arrangements. Some of these agreements contain provisions where we could be declared in default on our derivative obligations if we default on certain specified indebtedness. We are not required to post collateral for these contracts. As of January 28, 2017 and January 30, 2016, we had no outstanding foreign exchange contracts.
The following table sets forth the net impact of the effective portion of Parent Company’s derivatives on Accumulated other comprehensive loss for the fiscal years ended January 28, 2017, January 30, 2016 and January 31, 2015:
Fiscal Years Ended | ||||||||||||
(In millions) | January 28, 2017 | January 30, 2016 | January 31, 2015 | |||||||||
Derivatives previously designated as cash flow hedges: | ||||||||||||
Beginning balance | $ | — | $ | — | $ | 1 | ||||||
Reclassifications from Accumulated other comprehensive loss - Interest Rate Contracts | — | — | (1 | ) | ||||||||
Ending balance | $ | — | $ | — | $ | — | ||||||
The following table sets forth the impact of derivatives on Interest expense, net in the Parent Company Condensed Statements of Operations and Comprehensive Loss for the fiscal years ended January 28, 2017, January 30, 2016 and January 31, 2015:
Fiscal Years Ended | ||||||||||||
(In millions) | January 28, 2017 | January 30, 2016 | January 31, 2015 | |||||||||
Derivatives not designated for hedge accounting: | ||||||||||||
Gain on the change in fair value - Intercompany Loan Foreign Exchange Contracts (1) | $ | — | $ | 2 | $ | — | ||||||
Derivatives previously designated as cash flow hedges: | ||||||||||||
Amortization of hedged caps | — | — | 1 | |||||||||
Total Interest expense, net | $ | — | $ | 2 | $ | 1 | ||||||
(1) | Gains and losses related to our short-term, intercompany loan foreign exchange contracts are recorded in Interest expense, net, in addition to the corresponding foreign exchange gains and losses related to our short-term, cross-currency intercompany loans. For further details related to gains and losses resulting from foreign currency transactions, refer to Note 1 to our Consolidated Financial Statements entitled “SUMMARY OF SIGNIFICANT ACCOUNTING POLICIES.” |
110
Refer to Note 3 to our Consolidated Financial Statements entitled “DERIVATIVE INSTRUMENTS AND HEDGING ACTIVITIES” for further details on derivative instruments.
NOTE D — COMMITMENTS AND CONTINGENCIES
Although the Parent Company does not currently have material legal proceedings pending against it, it may be subject to various claims and contingencies related to lawsuits, as well as commitments under contractual and other obligations. Refer to Note 14 to the Consolidated Financial Statements entitled “LITIGATION AND LEGAL PROCEEDINGS” for further information. Additionally, the Parent Company is a guarantor on certain leases entered into by its subsidiaries. For a discussion of the lease obligations of the Parent Company and its subsidiaries, refer to Note 9 to the Consolidated Financial Statements entitled “LEASES.” The Parent Company is also a guarantor on certain debt of its subsidiaries. Refer to Note B to the Condensed Financial Statements entitled “DEBT” for further information.
NOTE E — DISTRIBUTIONS AND CAPITAL CONTRIBUTIONS
Distributions
The Parent Company received distributions (inclusive of returns of capital) from certain of its property subsidiaries as follows:
Fiscal Years Ended | ||||||||||||
(In millions) | January 28, 2017 | January 30, 2016 | January 31, 2015 | |||||||||
Property subsidiaries | ||||||||||||
TRU Propco I | $ | 67 | $ | 100 | $ | 86 | ||||||
Other | 8 | 7 | 7 | |||||||||
Total property subsidiaries | $ | 75 | $ | 107 | $ | 93 | ||||||
Toys Europe | 116 | — | — | |||||||||
Total cash distributions | $ | 191 | $ | 107 | $ | 93 | ||||||
Non-cash distributions (1) | $ | 537 | $ | — | $ | — | ||||||
Total distributions | $ | 728 | $ | 107 | $ | 93 | ||||||
Distributions included: | ||||||||||||
Return of capital from property subsidiaries | $ | 20 | $ | 11 | $ | — | ||||||
(1) | During fiscal 2016 the Parent Company received Non-cash distributions of $537 million related to the Taj Notes Exchange Offers. |
Capital Contributions
During fiscals 2016, 2015 and 2014, the Parent Company made capital contributions of $4 million, $4 million and $5 million, respectively, to TRU Asia, Ltd., of which $2 million and $1 million was used to satisfy contingent consideration related to the Asia JV acquisition during 2015 and 2014, respectively. No contingent consideration was paid in 2016.
During fiscal 2016, the Parent Company made a $75 million capital contribution to TRU Taj to partially fund the Exchange Offers.
ITEM 9. | CHANGES IN AND DISAGREEMENTS WITH ACCOUNTANTS ON ACCOUNTING AND FINANCIAL DISCLOSURE |
None.
ITEM 9A. | CONTROLS AND PROCEDURES |
(a) Disclosure Controls and Procedures
Disclosure controls and procedures are the controls and other procedures that are designed to ensure that information required to be disclosed by the issuer in the reports that it files or submits under the Securities Exchange Act of 1934, as amended (the “Exchange Act”) is recorded, processed, summarized and reported within the time periods specified in the Securities and
111
Exchange Commission’s rules and forms. Disclosure controls and procedures include, without limitation, controls and procedures designed to ensure that information required to be disclosed by an issuer in the reports that it files or submits under the Exchange Act is accumulated and communicated to the issuer’s management, including the principal executive and principal financial officer, or persons performing similar functions, as appropriate, to allow timely decisions regarding required disclosure. Any controls and procedures, no matter how well designed and operated, can provide only reasonable assurance of achieving the desired control objectives.
We have evaluated, under the supervision and with the participation of our management, including our Chief Executive Officer and Chief Financial Officer, the effectiveness of our disclosure controls and procedures, as defined in Rules 13a-15(e) and 15d-15(e) of the Exchange Act as of the end of the fiscal year covered by this annual report.
Based on that evaluation, our Chief Executive Officer and Chief Financial Officer have concluded that the Company’s disclosure controls and procedures were effective as of the end of the fiscal year covered by this Annual Report on Form 10-K to accomplish their objectives at the reasonable assurance level.
(b) Management’s Annual Report on Internal Control over Financial Reporting
Management is responsible for establishing and maintaining adequate internal control over financial reporting, as defined in Securities Exchange Act Rule 15d-15(f). Internal control over financial reporting is designed to provide reasonable assurance regarding the reliability of financial reporting and preparation of financial statements for external purposes in accordance with United States Generally Accepted Accounting Principles.
Under the supervision and with the participation of management, including our Chief Executive Officer and Chief Financial Officer, we conducted an assessment of the design and effectiveness of our internal control over financial reporting as of the end of the fiscal year covered by this report based on the framework issued by the Committee of Sponsoring Organizations (“COSO”) of the Treadway Commission in Internal Control—Integrated Framework (2013).
Based on this assessment, management concluded that, as of January 28, 2017, the Company’s internal control over financial reporting was effective.
This annual report does not include an attestation report of the Company’s registered public accounting firm, as non-accelerated filers are exempt from the auditor attestation requirements of Section 404(b) of the Sarbanes-Oxley Act.
(c) Change in Internal Control over Financial Reporting
There were no changes in our internal control over financial reporting during our fourth quarter of fiscal 2016 that have materially affected, or are reasonably likely to materially affect, the Company’s internal control over financial reporting.
ITEM 9B. | OTHER INFORMATION |
On April 10, 2017, the Company approved an award to Mr. Barry of 200,000 stock options under the 2010 Incentive Plan to purchase shares of the Company’s common stock to be granted at an exercise price equal to the fair market value to be approved by the Board upon completion of the Company’s next equity valuation. These options are time-based and will vest fifty percent on the second anniversary of the grant date, with the remaining portion vesting in equal annual installments over the subsequent two years, subject to Mr. Barry’s continued employment on each such date.
On April 10, 2017, the Company amended the amount of Messrs. Short and Barry’s 2015 Incentive Bonuses under the 2010 Incentive Plan to $3,250,000 and $2,500,000, respectively.
112
PART III
ITEM 10. DIRECTORS, EXECUTIVE OFFICERS AND CORPORATE GOVERNANCE
Directors
The following persons were members of our Board of Directors (the “Board”) as of March 17, 2017. Each elected director will hold office until a successor is duly elected and qualified or until his or her earlier death, resignation or removal from office by our stockholders.
Name | Age | Principal Occupation and Business Experience During Past Five Years and Other Directorships | |||
Joshua Bekenstein | 58 | Mr. Bekenstein has been our director since September 2005. Mr. Bekenstein is currently a Managing Director and Co-Chairman of Bain Capital, LP (“Bain”), having joined the firm at its inception in 1984. Mr. Bekenstein currently serves as a member of the boards of directors of Bright Horizons Family Solutions, Inc., Michaels Companies, Inc., Bombardier Recreational Products Inc., Dollarama Inc., and Waters Corporation. Mr. Bekenstein received an M.B.A. from Harvard Business School and a B.A. from Yale University. He previously served as a member of the board of directors of Burlington Stores, Inc. | |||
David A. Brandon | 64 | Mr. Brandon has served as both our Chairman of the Board and Chief Executive Officer since July 2015. From June 2015 to July 2015, Mr. Brandon served as CEO - Designate of the Company. Mr. Brandon served as Chief Executive Officer of Domino’s Pizza from March 1999 to March 2010, and as Director of Intercollegiate Athletics at the University of Michigan from March 2010 to November 2014. Mr. Brandon currently serves as a member of the boards of directors of Domino’s Pizza, Inc., Herman Miller, Inc. and DTE Energy, Inc. Mr. Brandon also previously served as a member of the boards of directors of Kaydon Corporation, The TJX Companies, Inc. and Burger King Corporation. | |||
Richard Goodman | 68 | Mr. Goodman has been our director since October 2011. Mr. Goodman served as an Executive Vice President of Global Operations at PepsiCo, Inc. from March 2010 until his retirement at the end of 2011. From October 2006 to March 2010, Mr. Goodman served as Chief Financial Officer of PepsiCo Inc. Prior to that, from 2003 to October 2006, Mr. Goodman served as Chief Financial Officer of PepsiCo International. He has served as a member of the boards of directors of Western Union since January 2011, of Kindred Healthcare since March 2014 and of Adient since October 2016. He served as a member of the board of directors of Johnson Controls from 2008 until the company’s merger with Tyco International in 2016. | |||
Matthew S. Levin | 50 | Mr. Levin has been our director since July 2005. Mr. Levin is a Senior Advisor of Bain in the private equity business. From 2000 through 2015, Mr. Levin was a Managing Director of Bain. Prior to joining Bain in 1992, Mr. Levin was a consultant at Bain & Company where he consulted in the consumer products and manufacturing industries. Mr. Levin received an M.B.A. from Harvard Business School where he was a Baker Scholar, and a B.S. from the University of California Berkeley. Mr. Levin currently serves as a member of the boards of directors of Guitar Center, Inc. and Michaels Stores, Inc. He previously served as a member of the boards of directors of Bombardier Recreational Products Inc., Dollarama Capital Corporation, Edcon Holding (Pty) Ltd., Jupiter Shop Channel and Unisource Worldwide, Inc. | |||
Joseph Macnow | 71 | Mr. Macnow has been our director since May 2013. Mr. Macnow has served as Executive Vice President - Finance and Chief Administrative Officer of Vornado Realty Trust (“Vornado”) since June 2013 and interim Chief Financial Officer since February 2017. He served as Executive Vice President - Finance and Administration of Vornado from January 1998 to June 2013. He was Vice President and Chief Financial Officer of Vornado from 1985 to January 1998 and from March 2001 to June 2013. He has been the Vice President and Chief Financial Officer of Alexander’s, Inc. since August 1995. | |||
Paul E. Raether | 70 | Mr. Raether has been our director since October 2015. Mr. Raether is an executive of Kohlberg, Kravis Roberts & Co., L.P. and/or one of its affiliates (“KKR”) and has served in various positions and played a significant role in numerous portfolio companies since he joined KKR in 1980. Mr. Raether has served as a member of the board of directors of WMI Holdings Corp since May 2015. | |||
Wendy Silverstein | 56 | Ms. Silverstein has been our director since September 2005. She has been a consultant to Winthrop REIT Advisors LLC, and advisor to the Board of New York REIT, Inc. since January 2017. As of March 2017, she is the President and CEO of New York REIT, Inc. and will be executing a shareholder approved plan of liquidation. Prior to that, she served as Executive Vice President and Co-Head of Acquisitions and Capital Markets of Vornado from November 2010 to April 2015. She served as Executive Vice President — Capital Markets of Vornado from 1998 to October 2010. Ms. Silverstein has served as a member of the board of directors of Alexander’s, Inc. since 2015. | |||
Nathaniel H. Taylor | 40 | Mr. Taylor has been our director since January 2011. Mr. Taylor is an executive of KKR and he has been an investment professional at KKR since November 2005. | |||
113
In appointing Mr. Brandon to the Board, the Board considered his significant retail business experience gained while serving in various positions at Valassis Communications Inc. over a twenty-year period including as its Chief Executive Officer. In addition, the Board considered the significant accomplishments achieved at Domino’s Pizza during Mr. Brandon’s eleven-year term as its Chief Executive Officer. The Board also considered the intimate knowledge of the Company’s business and operations that Mr. Brandon brings to the Board from his experience as the Chief Executive Officer of the Company.
In appointing Mr. Goodman to the Board, the Board considered his significant business experience including his extensive knowledge of financial statements and reporting.
Other than Messrs. Brandon and Goodman, each of the Directors were elected to the Board pursuant to a stockholders agreement dated July 21, 2005, as amended, by and among the Company and Bain, KKR and Vornado (collectively, the “Sponsors”) and a private investor (the “Stockholders’ Agreement”). Pursuant to such agreement, Messrs. Bekenstein and Levin were appointed to the Board as a consequence of their respective relationships with Bain; Messrs. Raether and Taylor were appointed to the Board as a consequence of their respective relationships with KKR; and Ms. Silverstein and Mr. Macnow were appointed to the Board as a consequence of their respective relationships with Vornado.
Executive Officers
The following persons were our Executive Officers as of March 17, 2017, having been elected to their respective offices by the Board:
Name | Age | Position with the Registrant | |||
David A. Brandon (1) | 64 | Chairman of the Board; Chief Executive Officer | |||
Michael J. Short | 56 | Executive Vice President — Chief Financial Officer | |||
Richard Barry | 50 | Executive Vice President — Global Chief Merchandising Officer | |||
N. Cornell Boggs, III | 56 | Executive Vice President — General Counsel & Corporate Secretary | |||
Timothy Grace | 53 | Executive Vice President — Global Chief Talent Officer | |||
Carla Hassan | 42 | Executive Vice President — Global Chief Marketing Officer | |||
Kevin Macnab | 56 | President — Toys “R” Us, International | |||
Patrick J. Venezia | 53 | Executive Vice President — Global Store Operations | |||
Lance Wills | 49 | Executive Vice President — Global Chief Technology Officer | |||
(1) | Refer to “Directors” above for Mr. Brandon’s biography. |
The following is a brief description of the business experience of each of our Executive Officers:
Mr. Short has served as our Executive Vice President — Chief Financial Officer since June 2014. From January 2007 to January 2014, Mr. Short served as Executive Vice President — Chief Financial Officer of AutoNation, an automotive retailer. From 2000 to 2007, Mr. Short served as Executive Vice President — Chief Financial Officer of Universal Orlando.
Mr. Barry has served as our Executive Vice President — Global Chief Merchandising Officer since October 2014. Mr. Barry served as our Executive Vice President — Chief Merchandising Officer from October 2012 to October 2014. From January 2012 to October 2012, Mr. Barry served as Senior Vice President — Chief Merchandising Officer. From March 2010 to January 2012, Mr. Barry served as Vice President — General Merchandising Manager and from September 2006 to March 2010, he served as Vice President — Divisional Merchandising Manager.
Mr. Boggs has served as our Executive Vice President — General Counsel & Corporate Secretary since February 2017. From June 2012 to July 2016, Mr. Boggs served as Senior Vice President, General Counsel & Corporate Secretary of Dow Corning Corporation. Prior to that, he served as Chief Responsibility Officer and Ethics Officer of MillerCoors LLC from January 2008 to May 2012. Mr. Boggs serves as a member of the board of directors of Thrivent Financial.
Mr. Grace has served as our Executive Vice President — Global Chief Talent Officer since September 2015. From March 2014 to September 2015, Mr. Grace served as Group Vice President — Human Resources of L’Oreal Group. From April 2002 to March 2014, Mr. Grace served as Senior Vice President — Human Resources and Administration of Schindler Elevator Corporation.
Ms. Hassan has served as our Executive Vice President — Global Chief Marketing Officer since February 2017. From August 2015 to February 2017, Ms. Hassan served as Senior Vice President, Brand Management, Global Beverage Group for PepsiCo,
114
Inc. (“PepsiCo”). Prior to that, Ms. Hassan served as Vice President, Chief Marketing Officer, Middle East/Africa for PepsiCo from October 2012 to August 2015. From October 2010 to October 2012, Ms. Hassan served as Vice President, Global Marketing, Carbonated Soft Drinks at PepsiCo.
Mr. Macnab has served as our President — Toys “R” Us, International since January 2017. From September 2015 to January 2017, he served as Executive Vice President — Special Assistant/Office of the Chairman and continued to provide leadership to Toys “R” Us (Canada) Ltd. (“Toys Canada”). From November 2007 to September 2015, Mr. Macnab served as President, Toys Canada. From May 2000 to October 2007, Mr. Macnab was Vice President of Finance, Real Estate and Information Technology for Toys Canada.
Mr. Venezia has served as our Executive Vice President — Global Store Operations since February 2016. From February 2014 to February 2016, Mr. Venezia served as our Senior Vice President — Store Operations. From August 2012 to February 2014, Mr. Venezia served as Head of Stores, Senior Vice President — Store Operations and Company Officer of The Pantry Inc., a convenience store chain. From February 2012 to August 2012, Mr. Venezia served as President of Title Max, a title lending business. From January 2008 to January 2012, he served in multiple operational roles for Walmart, culminating as Division President of the North East Division, SVP and Company Officer.
Mr. Wills has served as our Executive Vice President — Global Chief Technology Officer since June 2016. From March 2013 to June 2016, Mr. Wills served as Vice President, Global Digital Technology for American Eagle Outfitters, Inc. Prior to that, he served as Vice President, Mobile and Omnichannel for Macy’s Inc. from June 2011 to March 2013.
Section 16(a) Beneficial Ownership Reporting Compliance
As our equity securities are not registered pursuant to Section 12 of the Securities Exchange Act of 1934, as amended (the “Exchange Act”), none of our directors, officers or ten percent shareholders were subject to Section 16(a) of the Exchange Act for the past fiscal year or the filing requirements thereof.
Code of Ethics
We have adopted a code of ethics that applies to our principal executive officer, principal financial officer and principal accounting officer or any person performing similar functions (the “Code of Ethics”). The Code of Ethics is available on the Corporate Governance page of our website at www.Toysrusinc.com. If we ever were to amend or waive any provision of our Code of Ethics, we intend to satisfy our disclosure obligations with respect to any such waiver or amendment by posting such information on our Internet website set forth above rather than by filing a Form 8-K. The Code of Ethics is also available in print, free of charge, to any investor who requests it by writing to: Toys “R” Us, Inc., One Geoffrey Way, Wayne, New Jersey 07470, Attention: Investor Relations.
Audit Committee
Our Board of Directors has a separately designated audit committee established in accordance with Section 3(a)(58)(A) of the Exchange Act. The Audit Committee consists of Joseph Macnow and Richard Goodman, who serves as Chairman of the Audit Committee. Our Board of Directors has determined that each member of the Audit Committee is financially literate and that Messrs. Macnow and Goodman are “audit committee financial experts” within the meaning of the regulations adopted by the Securities and Exchange Commission.
ITEM 11. | EXECUTIVE COMPENSATION |
We refer to the persons included in the Summary Compensation Table below as our “named executive officers.” References to “2016,” “2015,” and “2014” mean, respectively, our fiscal years ended January 28, 2017, January 30, 2016 and January 31, 2015, respectively.
COMPENSATION DISCUSSION AND ANALYSIS
The following Executive Compensation discussion and analysis discusses our compensation policies and decisions regarding our named executive officers and describes the material elements of compensation for our named executive officers. Our named executive officers are:
• | David A. Brandon, Chairman of the Board and Chief Executive Officer; |
• | Michael J. Short, Executive Vice President — Chief Financial Officer; |
• | Richard Barry, Executive Vice President — Global Chief Merchandising Officer; |
• | Patrick J. Venezia, Executive Vice President — Global Store Operations; |
• | Lance Wills, Executive Vice President — Global Chief Technology Officer; |
115
• | Andre Javes, President — Toys “R” Us, Asia Pacific(1); and |
• | Dr. Wolfgang Link, President — Toys “R” Us, Europe(1). |
(1) In connection with the appointment of Mr. Macnab to President — Toys “R” Us, International on January 8, 2017, the reporting structure for our international segment, including Asia Pacific and Europe, was realigned to report directly to Mr. Macnab. Therefore, going forward, the positions held by Mr. Javes and Dr. Link will no longer be considered executive officer positions. Dr. Link’s employment with the Company terminated on January 31, 2017.
Role of Our Board of Directors in Compensation Decisions
Our Board of Directors acting through the Executive Committee of the Board pursuant to delegated authority has historically been ultimately responsible for approving both our compensation program and the specific compensation paid to each of our named executive officers. The Executive Committee of the Board, which is currently comprised of one designee from each of the three Sponsors, has discharged this responsibility pursuant to a charter approved by the Board.
Objective of Our Executive Compensation Program
The overall objective of our Executive Compensation Program is to provide compensation opportunities that will allow us to attract and retain executive officers of a caliber and level of experience necessary to effectively manage our global business and motivate such executive officers to increase the value of our Company. Our incentive structure focuses on the attainment of global financial targets and alignment of key management with long-term company growth. We believe that, in order to achieve these objectives, our program must:
• | provide each executive officer with compensation opportunities that are competitive with the compensation opportunities available to executives in comparable positions at companies with whom we compete for talent; |
• | tie a significant portion of each executive officer’s compensation to our financial performance; and |
• | align the interests of our executive officers with those of our equity holders. |
Elements of Our Executive Compensation Program
Our executive compensation program primarily consists of the following components:
• | base salary; |
• | annual incentive awards; |
• | long-term incentives; |
• | perquisites and other arrangements; |
• | other benefits; and |
• | benefits upon termination or change of control. |
Mix of Total Compensation
Cash compensation includes base salary, annual incentive awards and certain long-term cash incentives. The annual incentive for top executive officers is targeted to be a significant portion of pay to emphasize compensation linked to company performance. In fiscal 2016, we awarded long-term cash compensation incentive opportunities to select members of our Leadership Team. We also granted equity awards in connection with certain new hires, promotions into key management positions or for incentive purposes. Perquisites and other types of non-cash benefits are used on a limited basis and typically represent a small portion of total compensation for our executive officers.
In fiscal 2016, our management retained the services of Korn Ferry Hay Group to provide us insight regarding market practice including competitiveness around base salary, annual incentives and long term incentives. At that time, management reviewed the compensation of executive officers against a peer group consisting of the following 39 retailers: Advance Auto Parts, Amazon, Ascena Retail Group, AutoZone, Barnes & Noble, Best Buy Co., Inc., Big Lots, BJ’s, Burlington Stores, Coach, CVS Health, Dick’s Sporting Goods, Inc., Dollar General Corporation, Dollar Tree, DSW, The Gap, Inc., The Home Depot, Inc., Hudson Bay Company, IKEA, J.C. Penney Company, Inc., Kohl’s Corporation, L Brands, Inc., Lowe’s Companies, Inc., Macy’s, Inc., Michaels Companies, Inc., Nordstrom, Inc., Office Depot, Inc., Petco, Inc., Rent-A-Center, Ross Stores, Inc., Sears Holdings, Staples, Inc., Supervalu, Target, The TJX Companies, Inc., The Tractor Supply Company, Walgreens, Walmart and Wawa. For fiscal 2016, the recommendations from our human resources department included consideration of prior year performance ratings, information contained in the Hay Group analysis and internal pay equity, and management presented its recommendations for overall compensation including the base salary, annual incentive awards and long term incentives for fiscal 2016 to the Executive Committee of the Board.
116
Base Salary
Base salary provides fixed compensation and is designed to reward core competence in the executive officer’s role relative to his or her skills, experience and contributions to the Company.
In fiscal 2016, we hired Mr. Wills as the Executive Vice President — Global Chief Technology Officer of the Company. In determining his base salary, the Executive Committee of the Board considered Mr. Wills’ prior experience and the critical skills he brings to the Company.
The Executive Committee of the Board reviews the base salary of each of our executive officers annually as part of the Company’s performance review process described below, as well as upon a promotion or other change in job responsibility. On an annual basis, the Executive Committee of the Board determines the range, if any, for merit-based increases for eligible employees of the Company (including our executive officers) based upon the recommendation of the Company’s human resources department, after taking into account a variety of factors, including the Company’s internal financial projections and the general economy. In formulating a proposed range of merit-based increases, the Company’s human resources department considers a number of different factors, including the Company’s budget for the year, internal financial projections and historical practice, and also reviews a number of broad-based third party surveys to gain a general background understanding of the current compensation practices and trends and a sense of the reasonableness of the proposed range.
Merit-based increases to the base salary of an executive officer are based on the Executive Committee of the Board’s assessment that the executive officer performed at or above his or her established goals as well as the factors noted above. Increases in base salary due to a promotion or change in job responsibilities are based on the Executive Committee of the Board’s assessment of the responsibilities and importance of the executive officer’s new position compared to the executive officer’s prior position.
At the beginning of each fiscal year, each of our executive officers is required to establish his or her personal business goals for the year as they relate to our strategic priorities for fiscal 2016, which were as follows:
• | Make talent and culture a competitive advantage; |
• | Grow and build the TRU and BRU brands throughout the world; |
• | Create a world class experience for our customers - innovate and lead; and |
• | Create a strong financial foundation. |
At the beginning of each fiscal year, Mr. Brandon reviews and approves the goals developed by each of our executive officers, other than himself, and the Executive Committee of the Board reviews and approves Mr. Brandon’s goals. At the end of each fiscal year, Mr. Brandon reviews the individual performance of each executive officer against his or her personal goals. Mr. Brandon will also prepare a self-evaluation of his own performance. He then presents his conclusions and recommendations with respect to base salary adjustments to the Executive Committee of the Board. The Executive Committee of the Board considers these conclusions and recommendations when determining any adjustments to our executive officers’ base salaries.
117
The following table sets forth the personal business goals of our named executive officers for fiscal 2016:
Name | Personal Business Goals | |
Mr. Brandon | • Achieve 2016 budgeted Consolidated EBITDA. | |
• Develop and deliver to market the 2016 Holiday campaign. | ||
• Develop 2017 marketing plan and budget. | ||
• Develop and execute Babies “R” Us new service model. | ||
• Develop strategy to increase e-commerce fulfillment capacity. | ||
• Refinance the Company’s debt maturities. | ||
Mr. Short | • Continue to achieve target cost savings. | |
• Refinance the Company’s debt maturities. | ||
• Enhance the Company’s planning and reporting capabilities including streamlining existing processes, improving the accuracy of reports and developing a more user friendly and intuitive presentation of advanced analytics. | ||
• Develop a global system strategy, extending into international e-commerce and core systems. | ||
Mr. Barry | • Achieve Sales and Margin plan for stores and e-commerce. | |
• Transform customer experience in-store and online. | ||
• Create marketing calendar of promotional and advertising events. | ||
• Develop high performing, highly engaged, diverse teams. | ||
Mr. Venezia | • Deliver a renewed Baby Service Experience. | |
• Implement a new in-stock definition for key toy items and all non-apparel baby items. | ||
• Redefine the in-store and online customer experience. | ||
• Develop marketplace leadership bench strength. | ||
Mr. Wills | • Deliver a new organizational structure which supports the efficient and effective delivery of the new webstore. | |
• Deliver a plan to achieve a mobile-first world-class customer experience for the U.S. and Canada. | ||
• Collaborate with marketing to grow digital traffic. | ||
• Develop and deploy “Registry for the Future.” | ||
Mr. Javes | • Achieve 2016 budgeted Consolidated EBITDA for Asia Pacific. | |
• Continue to develop new stores throughout Asia Pacific in all formats. | ||
• Roll out new e-commerce platform in China. | ||
• Continue to deliver e-commerce growth in Australia and Japan. | ||
Dr. Link | • Achieve 2016 budgeted Consolidated EBITDA for Europe. | |
• Develop and deploy a Babies “R” Us marketing plan to achieve growth in baby categories. | ||
• Further expand small store formats based on the Central Europe experience. | ||
• Develop a plan to deploy new e-commerce platforms in Europe. | ||
We believe that the above criteria, when considered together, provide an appropriate method of measuring our executive officers’ personal performance. In March 2017, based upon the Company’s fiscal 2016 performance, the Executive Committee of the Board determined there would be no increase in the annual base salaries of our named executive officers.
Annual Incentive Awards
Annual incentive awards are an important part of the overall compensation we pay our executive officers. Unlike base salary, which is fixed, the annual incentive awards are paid only if specified performance levels are achieved during the year. We
118
believe that annual incentive awards encourage our executive officers to focus on specific short-term business and financial goals of the Company.
Each executive officer has an annual incentive target expressed as a percentage of his or her base salary. Those targets for our named executive officers were established in their employment agreements and may be subsequently adjusted based upon market competitiveness and/or a promotion/demotion in responsibility. Our named executive officers’ fiscal 2016 award targets are as follows: Mr. Brandon, 120%; Messrs. Short, Barry, Venezia, Wills, Javes and Dr. Link, 100%. Achievements range between a minimum of 0% and a maximum of 150% of target for each named executive officer (and in the case of Mr. Brandon, capped at 160% of his base salary). However, the Executive Committee of the Board has sole discretion to determine whether a bonus is paid to an executive officer.
In fiscal 2016, consistent with the prior year, our executive officers were awarded annual cash incentive awards under the Team Achievement Dividend Plan (“TAD”) with payouts based solely on the Company’s achievement of an adjusted Earnings Before Interest Taxes Depreciation and Amortization (“Adjusted Compensation EBITDA”) target. As Mr. Javes and Dr. Link were not executive officers for the full year, their respective TAD payouts were pro rated for the portion of the year they served as executive officers. For that portion of the year, their TAD payout was based solely on the Company’s achievement of Adjusted Compensation EBITDA target. For the portion of the year that Mr. Javes and Dr. Link did not serve as executive officers, their TAD payout was based on both the Company’s achievement of Adjusted Compensation EBITDA (50%) and the achievement of one or more business units of the Company’s Adjusted Compensation EBITDA (50%).
We believe that this program motivates our executive officers to work to improve the growth potential of the Company and supports our long range goals and strategic business initiatives.
We calculate Adjusted Compensation EBITDA for this purpose, as earnings before interest, income taxes, depreciation and amortization, further adjusted for the effects of specified period charges and gains or losses, including, among others, changes in foreign currency, non-controlling interest, severance, gains or losses on sales of properties, asset impairments and accounting changes. More detail about the calculation of Adjusted Compensation EBITDA is set forth below.
We believe that focusing incentives on Adjusted Compensation EBITDA closely aligns the executive officers’ interests with those of our stakeholders. The Adjusted Compensation EBITDA targets are established by the Executive Committee of the Board when it establishes our business plan as part of our annual financial planning process, during which we assess the future operating environment and build projections of anticipated results.
The Executive Committee of the Board sets the threshold, target and maximum funding levels for the Adjusted Compensation EBITDA metric. Achievements at the respective levels would result in a payment at, above, or below the target level of each executive officer’s percentage of base salary. If the actual Adjusted Compensation EBITDA performance is less than the minimum threshold, no payment would occur. If the actual Adjusted Compensation EBITDA performance is greater than the maximum threshold, payments would be capped at 150% of the executive officer’s annual award target (and in the case of Mr. Brandon, capped at 160% of his base salary). Payouts of the actual annual award payments are interpolated between 0% and 100% for financial performance which falls between the minimum and target thresholds and 100% and 150% for financial performance which falls between the target and maximum thresholds (and in the case of Mr. Brandon, capped at 160% of his base salary).
Notwithstanding the formulas described above for the annual incentive, the Executive Committee of the Board has the discretion to adjust the annual incentive award payouts to executive officers.
The Adjusted Compensation EBITDA target for the Company as a whole for fiscal 2016 was $880,000,000. The Adjusted Compensation EBITDA targets for Toys (Labuan) Holding Limited (“Labuan”), Europe and Asia Pacific for fiscal 2016 were $66,400,000, $196,660,000 and $169,900,000, respectively.
In fiscal 2016, the actual Adjusted Compensation EBITDA was higher than our Adjusted EBITDA due to adjustments of $6 million primarily related to the difference between the previous year’s period-end foreign currency translation rates and the actual foreign currency translation impact on our results of operations. For more information on the calculation of our Adjusted EBITDA, refer to Note 5 of Item 6 entitled “SELECTED FINANCIAL DATA” of this Annual Report on Form 10-K.
Based upon the achievement of the Consolidated Adjusted Compensation EBITDA metric, the executive officers’ payouts, excluding Mr. Javes and Dr. Link, was funded at 7.19% of their annual target bonus for fiscal 2016. For Mr. Javes, the payout was funded at 6.86% of his annual target bonus based upon a weighted average of the achievement of the Consolidated Adjusted Compensation EBITDA metric, Labuan’s Adjusted Compensation EBITDA metric, funded at 8.96% and Asia Pacific, funded at 0%. For Dr. Link, the payout was funded at 7.66% of his annual target bonus based upon a weighted average of the
119
achievement of the Consolidated Adjusted Compensation EBITDA metric and Europe’s Adjusted Compensation EBITDA metric, funded at 23.41%.
Based on the Company’s performance the following are the final annual incentive payouts for fiscal 2016: $323,550 for Mr. Brandon, $50,330 for Mr. Short, $43,140 for Mr. Barry, $37,748 for Mr. Venezia, $25,748 for Mr. Wills (prorated to reflect his June 2016 start date), $28,170 for Mr. Javes and $40,632 for Dr. Link.
The “Grants of Plan-Based Awards in Fiscal 2016” table shows the threshold, target and maximum TAD awards that each of our named executive officers was eligible to receive in fiscal 2016. The actual payouts under TAD actually earned by our named executive officers in fiscal 2016 are discussed above and in the “Non-Equity Incentive Plan Compensation” column of the “SUMMARY COMPENSATION TABLE” below.
Special Bonus
In June 2016, Mr. Javes received a one-time cash award of AUD 50,000 ($38,545 based on the conversion rate on the date of payment) in connection with his promotion to President — Toys “R” Us, Asia Pacific.
Long-Term Incentives
We believe that providing long-term incentives as a component of compensation helps us to attract and retain our executive officers. These incentives also align the financial rewards paid to our executive officers with the Company’s long-term performance, thereby encouraging our executive officers to focus on the Company’s long-term goals. The Executive Committee of the Board has offered long-term incentives under the 2010 Incentive Plan. The purpose of the 2010 Incentive Plan is to promote our success, and enhance our value, by providing us with the flexibility to motivate, attract, and retain the services of our employees, officers, directors, and consultants through the granting of incentive awards from time to time to such persons and by providing them with an incentive for outstanding performance. The 2010 Incentive Plan is an omnibus plan that provides for the granting of stock options, stock appreciation rights, restricted stock, restricted and deferred stock units, cash or stock based performance awards, dividend equivalents and other stock or stock based awards.
In fiscal 2016, the granting of cash awards rather than equity continued, with the exception of certain executives who received an equity grant when they were either hired or promoted into key management positions or for incentive purposes.
Equity Awards
During 2016, each of Messrs. Short, Venezia, Wills, and Javes was awarded stock options to purchase shares of the Company’s common stock with an exercise price of $11.00. These options are time-based and will vest 50% percent on the second anniversary of the respective grant date, with the remaining portion vesting in equal annual installments over the subsequent two years, subject, in each case, to the executive’s continued employment on each such dates. Mr. Venezia was awarded 100,000 stock options in connection with his promotion to Executive Vice President, with an initial vesting date of April 11, 2018. Mr. Wills was awarded 250,000 stock options in connection with his commencement of employment with the Company, with an initial vesting date of June 6, 2018. Mr. Javes was awarded 150,000 stock options in connection with his promotion to Executive Vice President, with an initial vesting date of June 1, 2018. Mr. Short was awarded 250,000 stock options for incentive purposes, with an initial vesting date of September 12, 2018.
In addition, in September 2016, the Company amended the vesting conditions for Mr. Short’s outstanding performance-based options granted in October 2014. As a result of this amendment, these options are now time-based and vested 50% on October 10, 2016 with the remaining portion vesting in equal annual installments over the subsequent two years, subject to Mr. Short’s continued employment on each such dates. The Executive Committee of the Board determined the amendment to be advisable to incentivize Mr. Short.
On April 10, 2017, the Company approved an award to Mr. Barry of 200,000 stock options to purchase shares of the Company’s common stock to be granted at an exercise price equal to the fair market value to be approved by the Board upon the completion of the Company’s next equity valuation. These options are time-based and will vest 50% on the second anniversary of the grant date, with the remaining portion vesting in equal annual installments over the subsequent two years, subject to Mr. Barry’s continued employment on each such date.
2015 Incentive Bonus
In July 2015, in connection with his appointment as Chief Executive Officer and Chairman of the Board, Mr. Brandon received a long-term cash incentive award of $37,500,000 (the “Brandon Award”). The Brandon Award will vest and become earned in any fiscal year ending on or before January 2018, upon the Company’s achievement of $600,000,000 in Adjusted EBITDA less average capital expenditures for the prior three fiscal years. If earned, the Brandon Award will be payable in two equal installments. The first installment is payable within thirty (30) days following the date on which the annual audited financial
120
statements of the Company are delivered to the Company and approved by the Board for the year in which the performance vesting date occurs. The second installment will be paid on the first anniversary of the first payment date. Since the grant of the Brandon Award, the Executive Committee of the Board has made grants of additional awards with the same performance criteria as the Brandon Award (each, together with the Brandon Award, a “2015 Incentive Bonus”). These were granted in the interest of aligning the senior management team under the same incentive structure and setting goals consistent with meeting objectives under the Company’s business plan over an appropriate measurement period.
In November 2015, upon the recommendation of Mr. Brandon, the Executive Committee of the Board granted Messrs. Short, Venezia and Dr. Link 2015 Incentive Bonuses of $3,000,000, $1,500,000 and EUR 1,107,076 ($1,223,762 based on the Company’s average monthly exchange rate), respectively. Additionally, in 2016, Messrs. Barry and Wills received 2015 Incentive Bonuses of $2,000,000 and $1,000,000, respectively. Dr. Link forfeited his 2015 Incentive Bonus upon his termination on January 31, 2017.
On February 1, 2017, Messrs. Venezia and Wills received amended 2015 Incentive Bonuses of $2,500,000 and $2,000,000, respectively. On March 1, 2017, Mr. Javes received a 2015 Incentive Bonus of AUD 650,000 ($485,550 based on the Company’s average monthly exchange rate) to align him with the senior management team. On April 10, 2017, Messrs. Short and Barry received amended 2015 Incentive Bonuses of $3,250,000 and $2,500,000, respectively.
Perquisites and Other Arrangements
We provide our executive officers with perquisites that we believe are reasonable and consistent with the perquisites that would be available to them at other potential employers. We provide each of our executive officers with a car allowance or company-leased car; use of Company transportation services including car and driver for business and personal use; financial planning, accounting and tax preparation services; legal services; an annual executive physical; and reimbursement of relocation expenses. Pursuant to the terms of Mr. Brandon’s employment agreement, Mr. Brandon is also entitled to travel on a private aircraft provided by the Company for business travel, travel to meetings of the Company and to meetings of certain outside boards of directors (and committees thereof on which he serves), and once per calendar quarter, to Michigan, as well as certain payments to compensate Mr. Brandon for any resulting tax obligation. In addition, in connection with Mr. Brandon’s appointment to Chief Executive Officer, he has been granted additional perquisites as described in footnote 5 of the “SUMMARY COMPENSATION TABLE.” Also, in connection with his assignment in Japan, Mr. Javes has been granted additional perquisites as described in footnote 11 of the “SUMMARY COMPENSATION TABLE.” We believe that providing Mr. Brandon and Mr. Javes with these additional perquisites was necessary in order to facilitate a smooth transition and allow them to focus on their respective business assignments. Perquisites are valued at the aggregate incremental cost to the Company.
For more information regarding perquisites for our named executive officers, refer to the “SUMMARY COMPENSATION TABLE.”
Other Benefits
Other benefits for our executive officers include retirement benefits and health and insurance benefits. Based upon annual surveys sponsored by the Retail Benefits Group in which we have participated, we believe that our retirement program, including the amount of benefits, is comparable to those offered by other companies in the retail industry and, as a result, is needed to ensure that our executive compensation program remains competitive. The Retail Benefits Group consists of 26 member companies in which organizations must have $2 billion in annual retail revenue and employ at least 20,000 retail employees. The Retail Benefits Group provides a forum for the exchange of ideas and information so that member companies are better able to improve the efficiency and competitiveness of their benefit plans.
We maintain the “TRU” Partnership Employees’ Savings and Profit Sharing Plan (the “Savings Plan”) in which our U.S. named executive officers who have at least one year of employment with the Company are eligible to participate, along with a substantial majority of our employees. The Savings Plan is a 401(k) plan, which is qualified under tax rules applicable to retirement plans, under which the Company matches 100% up to the first 4% of each plan participant’s (including our executive officers) earnings up to the Internal Revenue Code limit for each respective year in which the executive officer participates in the Savings Plan. The Company match is 100% vested on the funding date.
We also maintain the Supplemental Executive Retirement Plan (the “SERP”) for U.S. officers of the Company, including executive officers, who have one year of employment with the Company. Participants are 100% vested in their SERP accounts after completing five years of employment with the Company. The SERP provides supplemental retirement benefits that restore benefits to individuals whose retirement benefits are affected by the Internal Revenue Code limit on the maximum amount of compensation that may be taken into account under the Savings Plan. We intend the SERP to constitute an unfunded deferred compensation plan that is a “top-hat” plan under the Employee Retirement Income Security Act of 1974. We believe the SERP gives our executive officers parity in terms of retirement benefits with our other employees whose benefits are not
121
subject to these limitations. In addition, the SERP supports the financial security component of compensation by providing a level of retirement benefits that is based on the actual level of compensation earned by our named executive officers during their employment rather than only a portion of such compensation.
Mr. Javes participates in the Toys “R” Us Australia retirement program. As required by Australian law, the Company contributes 9.5% of Mr. Javes’ ordinary time earnings into a complying retirement savings fund nominated by Mr. Javes. The Toys “R” Us Australia retirement program is available to a substantial majority of our employees in Australia.
Pursuant to Dr. Link’s employment agreement, the Company was required to make monthly contributions to a third-party individual defined contribution retirement plan with an aggregate amount equal to 15% of Dr. Link’s annual base salary until his termination from the Company.
Benefits Upon Termination or Change of Control
Pursuant to their employment agreements and the 2010 Incentive Plan, our executive officers are entitled to benefits upon certain qualifying terminations of employment or a change of control. We believe these benefits play an important role in attracting and retaining high caliber executive officers and permit our executive officers to focus on their responsibilities for the Company without distractions caused by uncertainties in the context of an actual or threatened change of control. We also believe these benefits play an important role in protecting the Company’s highly competitive business by restricting our executive officers from working for a competitor during the severance period. These benefits and restrictions are described in more detail below under the section “POTENTIAL PAYMENTS UPON TERMINATION OR CHANGE IN CONTROL.”
Tax and Accounting Considerations
In making decisions about executive compensation, we take into account certain tax and accounting considerations. For example, we consider Section 409A of the Internal Revenue Code regarding non-qualified deferred compensation and Section 280G of the Internal Revenue Code with regard to change-in-control provisions. In making decisions about executive compensation, we also consider how various elements of compensation will affect our financial reporting. For example, we consider the impact of Financial Accounting Standards Board (“FASB”) Accounting Standards Codification (“ASC”) Topic 718, “Compensation—Stock Compensation” (“ASC 718”), which requires us to recognize the cost of employee services received in exchange for awards of equity instruments based upon the grant date fair value of those awards.
Compensation Committee Interlocks and Insider Participation
During fiscal 2016, Matthew S. Levin, Wendy Silverstein and Nathaniel H. Taylor were the members of the Executive Committee of the Board, which serves as the Company’s Compensation Committee.
COMPENSATION COMMITTEE REPORT
The Executive Committee of the Board, which serves as the Company’s Compensation Committee, has reviewed and discussed the Compensation Discussion and Analysis section required by Item 402(b) of Regulation S-K with management. Based on such review and discussion, the Executive Committee of the Board recommended to the Board that the Compensation Discussion and Analysis section be included in this Annual Report on Form 10-K.
THE EXECUTIVE COMMITTEE OF THE BOARD
Matthew S. Levin
Wendy Silverstein
Nathaniel H. Taylor
122
SUMMARY COMPENSATION TABLE
The following table summarizes the compensation awarded to, earned by or paid to the named executive officers for fiscals 2016, 2015 and 2014. Messrs. Venezia, Javes and Dr. Link were not named executive officers in 2015 or 2014 and Mr. Barry was not a named executive officer in 2014; therefore, in accordance with SEC disclosure rules, information regarding compensation for the years that those individuals were not named executive officers is not included in the table below. Mr. Wills joined the Company in 2016 and Mr. Brandon joined the Company in 2015.
Name and Principal Position | Fiscal Year | Salary | Bonus(1) | Stock Awards(2) | Option Awards (2) | Non-Equity Incentive Plan Compensation(3) | Change in Pension Value and Nonqualified Deferred Compensation Earnings | All Other Compensation | Total | |||||||||||||||||||||||||||
David A. Brandon Chairman of the Board and Chief Executive Officer(4) | 2016 | $ | 3,750,000 | $ | — | $ | — | $ | — | $ | 323,550 | $ | — | $ | 397,596 | (5) | $ | 4,471,146 | ||||||||||||||||||
2015 | 2,452,023 | 4,250,000 | — | 8,536,541 | 3,204,426 | — | 161,549 | 18,604,539 | ||||||||||||||||||||||||||||
Michael J. Short EVP - Chief Financial Officer(4) | 2016 | 700,000 | — | — | 1,092,500 | 50,330 | — | 73,193 | (6) | 1,916,023 | ||||||||||||||||||||||||||
2015 | 700,000 | — | — | — | 743,614 | — | 647,775 | 2,091,389 | ||||||||||||||||||||||||||||
2014 | 417,308 | — | — | 1,444,838 | 550,000 | — | 2,766 | 2,414,912 | ||||||||||||||||||||||||||||
Richard Barry EVP - Global Chief Merchandising Officer | 2016 | 600,000 | 600,000 | — | — | 43,140 | — | 73,842 | (7) | 1,316,982 | ||||||||||||||||||||||||||
2015 | 600,000 | 1,263,336 | — | — | 1,441,383 | — | 80,714 | 3,385,433 | ||||||||||||||||||||||||||||
Patrick J. Venezia EVP - Global Store Operations | 2016 | 517,308 | — | — | 437,000 | 37,748 | — | 72,335 | (8) | 1,064,391 | ||||||||||||||||||||||||||
Lance Wills EVP - Global Chief Technology Officer(4) | 2016 | 349,039 | — | — | 1,092,500 | 25,748 | — | 78,262 | (9) | 1,545,549 | ||||||||||||||||||||||||||
Andre Javes President - Toys “R” Us Asia Pacific(10) | 2016 | 385,885 | 38,545 | — | 655,500 | 28,170 | — | 578,061 | (11) | 1,686,161 | ||||||||||||||||||||||||||
Wolfgang Link Former President - Toys “R” Us Europe(12) | 2016 | 530,592 | 489,941 | — | — | 40,632 | — | 90,426 | (13) | 1,151,591 | ||||||||||||||||||||||||||
123
(1) | The amounts for Mr. Barry and Dr. Link represent 2014 Incentive Bonuses of $600,000 and EUR 435,000 ($489,941 based on the conversion rate on the date of payment). The amount for Mr. Javes represents a AUD 50,000 ($38,545 based on the conversion rate on the date of payment) one-time cash award in recognition of his promotion. Refer to “NARRATIVE SUPPLEMENT TO THE SUMMARY COMPENSATION TABLE AND THE GRANTS OF PLAN-BASED AWARDS IN FISCAL 2016 TABLE” below for further details on the incentive bonuses. |
(2) | These amounts represent the aggregate grant date fair value of option awards granted in the specified fiscal year as calculated pursuant to ASC 718 (excluding estimates of forfeitures related to service-based and performance-based vesting conditions). For additional information about the valuation assumptions with respect to option awards, refer to Note 7 of the financial statements included in this Annual Report on Form 10-K entitled “STOCK-BASED COMPENSATION.” Refer to the “OUTSTANDING EQUITY AWARDS AT 2016 FISCAL YEAR-END” table below for the vesting terms and conditions of these awards which are outstanding at the end of fiscal 2016. There was no incremental expense associated with the September 2016 amendment of vesting terms of Mr. Short’s 2014 option award to modify the performance based option to contain solely time-based vesting conditions. |
(3) | The amounts for 2016 represent payments under the TAD. |
(4) | Messrs. Brandon, Short and Wills were hired in June 2015, June 2014 and June 2016, respectively. The amounts presented for the fiscal year of each executives hire date represents pro rata compensation for the portion of the fiscal year following the date of hire. |
(5) | Includes $267,577 of Company contribution to the SERP, $60,009 for the incremental costs to the Company (calculated based upon the hourly rate, fuel costs and flight crew expenses) for Mr. Brandon’s personal usage of the corporate plane inclusive of a gross-up amount of $14,299, $20,000 for financial planning, $11,538 of Company matching contribution to the Savings Plan, $35,764 for company car costs and personal use of the corporate driver and $2,708 of other items including for life insurance premiums, Company contribution to a Health Savings Account and long-term disability premiums. Mr. Brandon is also permitted to have additional guests on the corporate plane for which there is no incremental cost to the Company. |
(6) | Includes $47,145 of Company contribution to the SERP, $20,000 for financial planning, $1,684 for relocation costs paid by the Company inclusive of a gross-up amount of $627 and $4,364 of other items including Executive Physical, life insurance premiums, Company contributions to a Health Savings Account and long-term disability premiums. |
(7) | Includes $38,895 of Company contribution to the SERP, $21,600 for car allowance, $10,369 of Company matching contribution to the Savings Plan and $2,978 of other items including financial planning, life insurance premiums, Company contribution to a Health Savings Account and long-term disability premiums. |
(8) | Includes $24,232 of Company contribution to the SERP, $20,862 for car allowance, $12,297 for financial planning, $10,908 of Company matching contribution to the Savings Plan and $4,036 of other items including Executive Physical, life insurance premiums, Company contributions to a Health Savings Account and long-term disability premiums. |
(9) | Includes $52,781 for relocation costs paid by the Company inclusive of a gross-up amount of $16,784, $13,292 for car allowance, $11,275 for financial planning and $914 of other items including life insurance premiums and long-term disability premiums. |
(10) | Mr. Javes is compensated in Australian Dollars which are converted to USD each fiscal year based on the Company’s average monthly exchange rate, which for fiscal 2016 was 1.0000 AUD = 0.7470 USD, except as it relates to certain perquisites as disclosed under All Other Compensation, while he is on an ex-patriate assignment in Hong Kong, the payments were converted to USD using the Company’s average monthly exchange rate of 1.0000 HKD = 0.1288 USD. For fiscal 2016, as it relates to the bonus in connection with his promotion, the payment was converted using the exchange rate on the date of payment of 1.0000 AUD = 0.7709 USD. |
(11) | Includes $281,614 for housing, $117,805 for host country income tax payments, $80,656 for Company contribution to the Toys “R” Us Australia retirement program, $41,855 for a Cost of Living Allowance (COLA), $23,082 for international school for one dependent child, $22,687 for home leave, furniture rental and utilities and $10,362 for a company car and related costs. |
(12) | Dr. Link is compensated in Euros which are converted to USD each fiscal year based on the Company’s average monthly exchange rate, which for fiscal 2016 was 1.0000 EURO = 1.1054 USD. For fiscal 2016, as it relates to the payment of the 2014 Incentive Bonus, the payout was converted using the exchange rate on the date of payment of 1.0000 EURO = 1.1263. |
(13) | Includes $79,589 for the Company contribution to Dr. Link’s individual defined contribution retirement plan and $10,837 for a car allowance. |
124
GRANTS OF PLAN-BASED AWARDS IN FISCAL 2016
The following table provides information on grants of plan-based awards to our named executive officers in fiscal 2016:
Estimated Future Payouts Under Non-Equity Incentive Plan Awards | Estimated Future Payouts Under Equity Incentive Plan Awards | All Other Stock Awards: Number of Shares of Stock or Units (#) | All Other Option Awards: Number of Securities Underlying Options (#) | Exercise or Base Price of Option Awards (#/sh)(1) | Grant Date Fair Value of Stock and Option Awards(2) | ||||||||||||||||||||||||||||||||||||
Name | Award Type | Approval Date | Grant Date | Threshold (#) | Target (#) | Maximum (#) | Threshold (#) | Target (#) | Maximum (#) | ||||||||||||||||||||||||||||||||
Brandon | TAD | (3) | — | $ | 4,500,000 | $ | 6,000,000 | — | — | — | — | — | $ | — | $ | — | |||||||||||||||||||||||||
Short | TAD | (3) | — | 700,000 | 1,050,000 | — | — | — | — | — | — | — | |||||||||||||||||||||||||||||
9/12/2016 | 9/12/2016 | — | — | — | — | — | — | — | 250,000 | (5) | 11.00 | 1,092,500 | |||||||||||||||||||||||||||||
Barry | TAD | (3) | — | 600,000 | 900,000 | — | — | — | — | — | — | — | |||||||||||||||||||||||||||||
LTIP | (4) | — | 2,000,000 | — | — | — | — | — | — | — | — | ||||||||||||||||||||||||||||||
Venezia | TAD | (3) | — | 525,000 | 787,500 | — | — | — | — | — | — | — | |||||||||||||||||||||||||||||
3/3/2016 | 4/11/2016 | — | — | — | — | — | — | — | 100,000 | (5) | 11.00 | 437,000 | |||||||||||||||||||||||||||||
Wills | TAD | (3) | — | 550,000 | 825,000 | — | — | — | — | — | — | — | |||||||||||||||||||||||||||||
LTIP | (4) | — | 1,000,000 | — | — | — | — | — | — | — | — | ||||||||||||||||||||||||||||||
6/6/2016 | 6/6/2016 | — | — | — | — | — | — | — | 250,000 | (5) | 11.00 | 1,092,500 | |||||||||||||||||||||||||||||
Javes | TAD | (3) | — | 410,850 | 616,275 | — | — | — | — | — | — | — | |||||||||||||||||||||||||||||
6/1/2016 | 6/1/2016 | — | — | — | — | — | — | — | 150,000 | (5) | 11.00 | 655,500 | |||||||||||||||||||||||||||||
Link | TAD | (3) | — | 530,592 | 795,888 | — | — | — | — | — | — | — | |||||||||||||||||||||||||||||
125
(1) | We utilized a per share value of $11.00, which was the fair value of our shares of common stock as determined by the Board of Directors on April 8, 2016, the most recent valuation date prior to the dates of the grants. As we are a privately held company, the value of shares of common stock is only available when a valuation is performed. |
(2) | These amounts represent the aggregate grant date fair value as calculated pursuant to ASC 718 (excluding estimates of forfeitures related to service-based and performance-based vesting conditions). For additional information about the valuation assumptions with respect to equity awards, refer to Note 7 of the financial statements included in this Annual Report on Form 10-K entitled “STOCK-BASED COMPENSATION” for further information. |
(3) | These amounts reflect estimated possible payouts under our TAD granted for fiscal 2016. Each named executive officer’s target payout was the following percentage of his or her base salary: 120% for Mr. Brandon and 100% for Messrs. Short, Barry, Wills, Venezia, Javes and Dr. Link. The target payout is based solely on the Company's achievement of specified levels of Adjusted Compensation EBITDA. The Executive Committee of the Board sets the threshold, target and maximum funding levels for the Adjusted Compensation EBITDA targets of the TAD. Achievements at the respective levels would result in a payment at, above, or below the target level of each executive officer’s percentage of base salary. If the actual Adjusted Compensation EBITDA performance is less than the minimum threshold, no payments would occur. If the actual Adjusted Compensation EBITDA performance is greater than the maximum threshold, payments would be capped at 150% of the executive officer’s annual TAD award target (and in the case of Mr. Brandon, capped at 160% of his base salary). Payouts of the actual annual TAD award payments are interpolated between 0% and 100% for financial performance which falls between the minimum and target thresholds and 100% and 150% for financial performance which falls between the target and maximum thresholds (and in the case of Mr. Brandon, capped at 160% of his base salary). For more information, refer to the “ELEMENTS OF OUR EXECUTIVE COMPENSATION PROGRAM—ANNUAL INCENTIVE AWARDS” section set forth above. |
(4) | These amounts reflect estimated possible payouts under our long-term incentive plan awards granted during fiscal 2016. These awards were granted under the 2010 Incentive Plan and shall vest and become non-forfeitable if, in any fiscal year of the Company ending on or before the last day of the Company's fiscal year ending January 2018, the Company achieves $600,000,000 in Adjusted EBITDA less the average capital expenditures for the prior three fiscal years. Payout of 50% of the award is within 30 days following the date on which the annual audited financial statements of the Company are delivered to the Company and approved by the Board. The remaining 50% of the payout is on the first anniversary of the first payment date. For more information, refer to the “ELEMENTS OF OUR EXECUTIVE COMPENSATION PROGRAM—LONG TERM INCENTIVE” section set forth above. |
(5) | These options were granted under the 2010 Incentive Plan and vest 50% on the second anniversary of the grant date with the remaining portion vesting in equal annual installments over the subsequent two years. The vesting of these awards may accelerate under certain circumstances as further described below in “POTENTIAL PAYMENTS UPON TERMINATION OR CHANGE IN CONTROL”. |
NARRATIVE SUPPLEMENT TO THE SUMMARY COMPENSATION TABLE AND THE GRANTS OF PLAN-BASED AWARDS IN FISCAL 2016 TABLE:
2010 Incentive Plan
The 2010 Incentive Plan is an omnibus plan that provides for the granting of stock options, stock appreciation rights, restricted stock, restricted and deferred stock units, cash or stock based performance awards, dividend equivalents and other stock or stock based awards.
Under the 2010 Incentive Plan, shares of common stock covered by awards that are terminated, canceled, forfeited or settled in cash, lapse without the payment of consideration, or are otherwise withheld, repurchased or not issued, may be granted again under the 2010 Incentive Plan. Generally, an unexercised or restricted award will not be transferable or assignable by a participant other than to the Company or an affiliate or by will, estate planning or by the laws of descent and distribution. Recipients of specified awards under the 2010 Incentive Plan are also subject to certain restrictive covenants, including confidentiality, non-competition and non-solicitation covenants, during their employment and for a specified period of time after termination of employment.
In the event of a corporate transaction, such as a stock dividend, stock split, spin-off, rights offering, reorganization, recapitalization, merger, or large nonrecurring cash dividend, the Board, in its discretion, will make changes to the 2010 Incentive Plan and awards, which may include adjusting the number and kind of shares subject to outstanding awards or adjusting the exercise price of outstanding awards, to prevent dilution or enlargement of the rights of participants immediately resulting from such corporate transaction.
126
The Board at any time may terminate the 2010 Incentive Plan and make such amendments as it deems advisable under the 2010 Incentive Plan, provided that certain amendments are subject to stockholder approval and the Board may not change any terms of an award agreement in a manner adverse to a participant without the prior written approval of such participant. More detail about stock options and other awards held by our named executive officers (including the vesting provisions related to these grants) are shown in the tables that follow this discussion, including the “OUTSTANDING EQUITY AWARDS AT 2016 FISCAL YEAR-END” table.
2015 Award Exchange and 2014 Short Option Award
In June 2015, certain participants were offered an opportunity to exchange outstanding restricted stock units (“RSUs”) for newly granted stock options on a one RSU-for-two option basis (“2015 Award Exchange”). Mr. Barry and Dr. Link elected to participate in the 2015 Award Exchange, and exchanged 7,918 and 3,008 RSUs, respectively, for 15,836 and 6,016 newly granted stock options, respectively.
Pursuant to the terms of the 2015 Award Exchange, the newly granted options received in exchange for RSUs that were granted on May 24, 2013 vested 50% on May 24, 2016 and will vest 50% on May 24, 2017. As a condition to participating in the 2015 Award Exchange, each executive agreed that all shares issued to the executive under the 2010 Incentive Plan will be subject to repurchase rights by the Company following a termination of employment and the exercise of any put rights on any shares held by the executive (or rights to net settlement of restricted stock units to cover tax withholding) will be subject to the prior approval of the Board. The Company has no plans to open a transaction window for participants to put the shares to the Company in the foreseeable future.
In June 2014, Mr. Short received a one-time award of 450,000 stock options (“Additional Options”), 50% of which will vest in four equal annual installments commencing October 10, 2015 with the remaining Additional Options originally subject to performance and time vesting and which would have only been deemed fully vested when they had both time vested and performance vested. In September 2016, the Company amended its stock option agreement with Mr. Short and, as a result, these options are time-based and vested 50% on October 10, 2016 with the remaining portion vesting in equal annual installments over the subsequent two years. In addition, Mr. Short received a one-time award of 30,000 stock options in June 2014, which will vest in four equal annual installments commencing October 10, 2015 (these options and the Additional Options collectively referred to herein as the “2014 Short Option Award”). For more information, see “OUTSTANDING EQUITY AWARDS AT 2016 FISCAL YEAR-END.”
2014 Long Term Performance Cash Awards
In May 2014, we granted certain long-term performance cash awards (the “2014 Long Term Incentive Awards”) under the 2010 Incentive Plan to our executive officers, including Mr. Barry. The target long-term performance cash awards as a percentage of base salary for Mr. Barry was 100%.
The 2014 Long Term Incentive Award’s target was Adjusted Compensation EBITDA of $800,000,000 for fiscal 2015 and based upon achievement (including adjustment for 2014 budgeted foreign exchange rates), the 2014 Long Term Incentive Award paid out at 134% of target and Mr. Barry received $804,000.
Incentive Bonuses
In fiscal 2014, the Company granted Mr. Barry and Dr. Link incentive bonuses (the “2014 Incentive Bonus”) in the amount of $600,000 and EUR 435,000 ($489,941 based on the conversion rate on the date of payment), respectively, which were paid on March 11, 2016 and March 22, 2016, respectively. In making these grants, the Executive Committee of the Board determined these awards to be advisable to incentivize these officers during a transition period.
In fiscal 2013, the Company granted Mr. Barry an incentive bonus (the “2013 Incentive Bonus”) in the amount of $1,200,000 which vested and was paid in March 2015.
Other Bonuses
In fiscal 2016, the Company granted Mr. Javes a one-time lump sum award of AUD 50,000 ($38,545 based on the conversion rate on the date of payment) in connection with his promotion.
In fiscal 2015, Mr. Barry received a one-time lump sum bonus of $63,336 in lieu of a 2015 merit increase.
127
OUTSTANDING EQUITY AWARDS AT 2016 FISCAL YEAR-END
The following table provides information with respect to the option awards and stock awards held by the named executive officers at fiscal year-end:
Option Awards | Stock Awards | ||||||||||||||||||||||||||||
Name | Grant Date | Number of Securities Underlying Unexercised Options Exercisable (#) | Number of Securities Underlying Unexercised Options Unexercisable (#) | Equity Incentive Plan Awards: Number of Securities Underlying Unexercised Unearned Options (#) | Option Exercise Price | Option Expiration Date | Number of Shares or Units of Stock That Have Not Vested | Market Value of Shares or Units of Stock That Have Not Vested | Equity Incentive Plan Awards: Number of Unearned Shares, Units or Other Rights That Have Not Vested | Equity Incentive Plan Awards: Market or Payout Value of Unearned Shares, Units or Other Rights That Have Not Vested | |||||||||||||||||||
Brandon | 7/1/2015 | (2) | — | — | 2,810,000 | $ | 8.00 | 7/1/2025 | — | — | — | — | |||||||||||||||||
Short | 10/10/2014 | (3) | 15,000 | 15,000 | — | 8.00 | 10/10/2024 | — | — | — | — | ||||||||||||||||||
10/10/2014 | (4) | 112,500 | 112,500 | — | 8.00 | 10/10/2024 | — | — | — | — | |||||||||||||||||||
10/10/2014 | (5) | 112,500 | 112,500 | — | 8.00 | 10/10/2024 | — | — | — | — | |||||||||||||||||||
9/12/2016 | (5) | — | 250,000 | — | 11.00 | 9/12/2026 | — | — | — | — | |||||||||||||||||||
Barry | 10/10/2014 | (6) | 14,952 | — | — | 8.00 | 10/10/2021 | — | — | — | — | ||||||||||||||||||
10/10/2014 | (3) | 12,678 | 12,679 | — | 8.00 | 12/23/2023 | — | — | — | — | |||||||||||||||||||
8/3/2015 | (7) | 7,918 | 7,918 | — | 8.00 | 8/3/2025 | — | — | — | — | |||||||||||||||||||
Venezia | 10/10/2014 | (3) | 15,333 | 15,334 | — | 8.00 | 10/10/2024 | — | — | — | — | ||||||||||||||||||
4/11/2016 | (5) | — | 100,000 | — | 11.00 | 4/11/2026 | — | — | — | — | |||||||||||||||||||
Wills | 6/6/2016 | (5) | — | 250,000 | — | 11.00 | 6/6/2026 | — | — | — | — | ||||||||||||||||||
Javes | 10/10/2014 | (3) | 15,230 | 15,231 | — | 8.00 | 10/10/2024 | — | — | — | — | ||||||||||||||||||
6/1/2016 | (5) | — | 150,000 | — | 11.00 | 6/1/2026 | — | — | — | — | |||||||||||||||||||
Link(1) | 10/10/2014 | (3) | 14,145 | 14,146 | — | 8.00 | 10/10/2024 | — | — | — | — | ||||||||||||||||||
10/10/2014 | (6) | 42,189 | — | — | 8.00 | 10/10/2021 | — | — | — | — | |||||||||||||||||||
10/10/2014 | (3) | 9,214 | 9,215 | — | 8.00 | 12/23/2023 | — | — | — | — | |||||||||||||||||||
8/3/2015 | (7) | 3,008 | 3,008 | — | 8.00 | 8/3/2025 | — | — | — | — | |||||||||||||||||||
128
(1) | Pursuant to his severance agreement, the options granted to Dr. Link are eligible to vest through December 31, 2017. For options granted on August 3, 2015, 3,008 will vest on May 24, 2017; for options granted on October 10, 2014 and scheduled to expire on October 10, 2024 and December 23, 2023, respectively, 7,073 and 4,608, respectively, will vest on October 10, 2017. The remaining unvested options will be forfeited effective December 31, 2017. |
(2) | These options are subject to both a time-vesting and a performance-vesting condition. The time-vesting condition will be satisfied in equal monthly installments over 48 months following the grant date and the performance-vesting condition will be satisfied upon the Company’s achievement, in any fiscal year ending on or before the last day of the Company’s fiscal year ending January 2021, of $750,000,000 of Adjusted EBITDA less average capital expenditures for the prior three fiscal years. The vesting of these awards may accelerate under certain circumstances as further described below in “POTENTIAL PAYMENTS UPON TERMINATION OR CHANGE IN CONTROL.” |
(3) | These options vest in four equal annual installments beginning on the first anniversary of the grant date. The vesting of these awards may accelerate under certain circumstances as further described below in “POTENTIAL PAYMENTS UPON TERMINATION OR CHANGE IN CONTROL.” |
(4) | These options were previously subject to a performance vesting requirement and were amended on September 12, 2016 and are now subject only to time-based vesting requirements and vested 50% on October 10, 2016, with the remaining portion vesting in equal annual installments over the subsequent two years. The vesting of these awards may accelerate under certain circumstances as further described below in “POTENTIAL PAYMENTS UPON TERMINATION OR CHANGE IN CONTROL.” |
(5) | These options vest 50% on the second anniversary of the grant date, 25% on the third anniversary of the grant date and 25% on the fourth anniversary of the grant date. The vesting of these awards may accelerate under certain circumstances as further described below in “POTENTIAL PAYMENTS UPON TERMINATION OR CHANGE IN CONTROL.” |
(6) | These options vest 50% on the grant date, 25% on the first anniversary of the grant date and 25% on the second anniversary of the grant date. The vesting of these awards may accelerate under certain circumstances as further described below in “POTENTIAL PAYMENTS UPON TERMINATION OR CHANGE IN CONTROL.” |
(7) | These awards vested 50% on May 24, 2016 and 50% on May 24, 2017. The vesting of these awards may accelerate under certain circumstances as further described below in “POTENTIAL PAYMENTS UPON TERMINATION OR CHANGE IN CONTROL.” |
OPTION EXERCISES AND STOCK VESTED FOR FISCAL 2016
None of our named executive officers exercised stock options or vested in any stock awards in fiscal 2016.
NONQUALIFIED DEFERRED COMPENSATION FOR FISCAL 2016
The following table provides information regarding contributions, earnings and balances for our named executive officers under nonqualified deferred compensation plans:
Name | Executive Contributions in Last FY | Registrant Contributions in Last FY (1)(2) | Aggregate Earnings in Last FY (3) | Aggregate Withdrawals / Distributions(3) | Aggregate Balance at Last FYE(4) | |||||||||||||||
Brandon | $ | — | $ | 267,577 | $ | — | $ | — | $ | 267,577 | ||||||||||
Short | — | 47,145 | 10,827 | — | 97,372 | |||||||||||||||
Barry | — | 38,895 | 11,932 | — | 221,001 | |||||||||||||||
Venezia | — | 24,232 | 5,755 | — | 56,387 | |||||||||||||||
Wills | — | — | — | — | — | |||||||||||||||
Javes | — | — | — | — | — | |||||||||||||||
Link | — | — | — | — | — | |||||||||||||||
(1) | We make an annual contribution to the SERP for each U.S. executive officer who is employed on the last day of the SERP plan year (December 31, 2016). The amount of the contribution is equal to 4% of that portion of the eligible executive officer’s “total compensation” in excess of the dollar limits under Internal Revenue Code Section 401(a)(17). Due to the fact that Mr. Wills’ employment commenced in June 2016, he was not eligible to participate in the Savings Plan and the SERP plan in 2016 as he did not yet satisfy length of employment criteria set forth under the plans. Generally, total compensation means compensation as reported on Form W-2 with the Internal Revenue Service. However, total compensation includes amounts paid pursuant to our TAD but does not include sign-on bonuses, |
129
incentive bonuses, project completion bonuses or other types of success bonuses. The Executive Committee of the Board may at its discretion also credit additional notional contributions if the Company had an exceptional year.
(2) | All contributions that we made for each executive officer for fiscal 2016 were included in the “All Other Compensation” column of the “SUMMARY COMPENSATION TABLE” above. |
(3) | Earnings on nonqualified deferred compensation were not required to be reported in the “SUMMARY COMPENSATION TABLE”. Each U.S. executive’s SERP account is credited or debited with “Declared Interest,” which is based upon hypothetical investments selected by the executive officer pursuant to procedures established by the administrative committee that administers the SERP. The Administrator of the SERP determines the number of investment options available under the SERP and such investment options are comprised of a subset of the investment options available under the Savings Plan. Participants in the SERP have the right to change their hypothetical investment selections on a daily basis. The contributions made by the Company vest five years after the executive officer’s first day of employment with the Company. All SERP distributions are paid in a lump sum upon termination of the participant’s employment with the Company. |
(4) | Of the aggregate balance amounts set forth in this column, $39,400 and $41,400 respectively, were previously reported in the Summary Compensation table for Messrs. Short and Barry for the prior fiscal year. |
POTENTIAL PAYMENTS UPON TERMINATION OR CHANGE IN CONTROL
Employment Agreements
We maintain employment agreements with each of our named executive officers. These agreements provide certain benefits upon certain terminations of employment or a Change in Control and require the named executive officers to abide by certain restrictive covenants, as described below.
For Messrs. Brandon, Short, Barry, Javes, Venezia and Wills
Termination for Cause, Resignation Without Good Reason (including Retirement). If one of the above named executive officer’s employment is terminated for Cause or he or she resigns without Good Reason (as such terms are defined in each of their employment agreements) including Retirement, the executive will receive:
• | any base salary earned, but unpaid as of the date of his or her termination; |
• | any employee benefits that he or she may be entitled to under the Company’s employee benefit plans; and |
• | any annual incentive award for the immediately preceding fiscal year that is earned, but unpaid as of the date of the executive’s termination (except that Messrs. Javes, Venezia and Wills will not receive such amount upon a Termination for Cause and Mr. Javes will not receive such amount upon a Resignation Without Good Reason). |
In addition, if the employment for Mr. Short is terminated for Cause or he resigns without Good Reason, Mr. Short shall be required to reimburse the Company for 50% of relocation expenses if such termination occurs after June 23, 2016 but before June 23, 2017.
In addition, if the employment for Mr. Wills is terminated for Cause or he resigns without Good Reason, Mr. Wills shall be required to reimburse the Company for 100% of relocation expenses if such termination occurs before June 6, 2017 or 50% of such expenses if such termination occurs after June 6, 2017 but before June 6, 2018.
In addition, Mr. Javes will be entitled to reimbursement for the cost of airfare for him and his family to return home to Australia along with the costs incurred for transporting his household goods.
Termination Due to Death or Disability. If one of the above named executives dies, or if we terminate the executive’s employment due to disability, the executive (or the executive’s estate) will receive:
• | any base salary earned, but unpaid as of the date of the executive’s termination; |
• | any employee benefits that the executive may be entitled to under the Company’s employee benefit plans; |
• | any annual incentive award for the immediately preceding fiscal year that is earned, but unpaid as of the date of the executive’s termination; and |
• | a pro rata portion of the executive’s annual incentive award for the current fiscal year earned through the date of termination, based on the Company’s actual results as opposed to the executive’s target annual incentive award. |
In addition, Mr. Javes will be entitled to reimbursement of all costs: (i) reasonably incurred in connection with relocating his family back to Australia, (ii) repatriation allowance, (iii) temporary living expenses and (iv) all costs incurred in connection with the early termination of his lease for both car and housing.
130
Termination Without Cause or Resignation for Good Reason. If one of the above named executives’ employment is terminated Without Cause (and other than due to Death or Disability) or the executive resigns for Good Reason, the executive will receive:
• | any base salary earned, but unpaid as of the date of the executive’s termination; |
• | any employee benefits that the executive may be entitled to under the Company’s employee benefit plans; |
• | any annual incentive award for the immediately preceding fiscal year that is earned, but unpaid as of the date of the executive’s termination; |
• | a pro rata portion of the executive’s annual incentive award earned through the date of termination, based on the Company’s actual results as opposed to the executive’s target annual incentive award; and |
• | except for Mr. Javes who is not entitled to benefit continuation under the terms of his employment agreement, continuation of medical, dental and life insurance benefits, with the executive paying a portion of such costs as if his employment had not terminated, until the earlier to occur of (i) the end of the twenty-four (24) month period (in the case of Messrs. Brandon and Barry) or the end of an eighteen (18) month period (in the case of Mr. Short) or the end of a twelve (12) month period (in the case of Messrs. Venezia and Wills) commencing on the date of termination of employment or (ii) the date on which the executive commences to be eligible for coverage under substantially comparable medical, dental and life insurance benefit plans from any subsequent employer. |
Mr. Brandon shall also be entitled to the following:
• | upon execution of an effective release of claims in favor of the Company, an amount equal to 1.6 times his then-current base salary, which amount is payable in twenty-four (24) monthly installments, except such amount will be payable in a lump sum, subject to statutory limitations, if his termination of employment occurs within two years after a Change in Control (as defined in the 2010 Incentive Plan); |
• | if a Change in Control of the Company occurs prior to a public offering of the Company’s stock and Mr. Brandon receives payments and benefits that would cause him to be subject to the excise tax triggered under Sections 280G and 4999 of the Internal Revenue Code, he will receive an additional amount sufficient to cover 50% of (i) the amount of such excise tax and (ii) any applicable federal, state income and employment taxes that may apply to the additional amounts paid; and |
• | reimbursement of all costs: (i) reasonably incurred in connection with relocating his family back to Michigan and (ii) all costs incurred in connection with the early termination of his lease for housing in the New Jersey area. |
Messrs. Short and Barry shall also be entitled to the following:
• | upon execution of an effective release of claims in favor of the Company, an amount equal to two times the sum of (x) the executive’s then-current base salary and (y) the executive’s target annual bonus, which amount is payable in twenty-four (24) monthly installments, except such amount will be payable in a lump sum, subject to statutory limitations, if the executive’s termination of employment occurs within two years after a Change in Control (as defined in the 2010 Incentive Plan). |
Messrs. Venezia, Wills and Javes shall also be entitled to the following:
• | upon execution of an effective release of claims in favor of the Company, an amount equal to one times the executive’s then-current base salary, which amount is payable in twelve (12) monthly installments (except for Mr. Javes which will be paid in a lump sum amount). |
In addition, Mr. Javes or his estate, as applicable, will be entitled to reimbursement of all costs: (i) reasonably incurred in connection with relocating his family back to Australia, (ii) repatriation allowance, (iii) temporary living expenses and (iv) all costs incurred in connection with the early termination of his lease for both car and housing.
Restrictive Covenants. During the term of their employment and during the twenty-four (24) month period (twelve (12) month period for Mr. Javes) commencing on the date of termination of employment, each of Messrs. Brandon, Short, Barry, Venezia, Wills and Javes have agreed not to:
• | engage in any business that directly or indirectly is a Competitive Business (as defined in each of their employment agreements); |
• | enter the employ of, or render any services to, any person who or which engages in a Competitive Business; |
• | acquire a financial interest in, or otherwise become actively involved with, any Competitive Business, directly or indirectly; |
• | interfere with, or attempt to interfere with, business relationships between the Company or any of its affiliates and customers, clients, suppliers, partners, members or investors of the Company or its affiliates; |
131
• | solicit to leave the employment of, or encourage any employee of the Company or its affiliates to leave the employment of, the Company or its affiliates; |
• | hire any such employee who was employed by the Company or its affiliates as of the date of executive’s termination of employment with the Company or who left the employment of the Company or its affiliates coincident with, or within one year prior to, the termination of his employment with the Company; and |
• | solicit to leave the employment of, or encourage to cease to work with, as applicable, the Company or its affiliates or any consultant, supplier or service provider under contract with the Company or its affiliates. |
In addition, during the term of their employment and anytime thereafter, each of the above named executive officers has agreed not to use for their benefit or disclose any of the Company’s confidential information.
For Dr. Link
Pursuant to the terms of his separation agreement, Dr. Link became entitled to: (i) a lump sum payment of €944,743 ($1,018,527 based on the conversion rate on the date of payment), and (ii) €36,758 ($40,632 based on the Company’s average monthly exchange rate for fiscal 2016) which represents his payout under the TAD for fiscal 2016. Additionally, Dr. Link will be entitled to the use of the company car provided to him until the earlier of the commencement of other employment or April 30, 2017. The options granted to Dr. Link are eligible to vest through December 31, 2017. For options granted on August 3, 2015, 3,008 will vest on May 24, 2017; for options granted on October 10, 2014 and scheduled to expire on October 10, 2024 and December 23, 2023, respectively, 7,073 and 4,608, respectively, will vest on October 10, 2017. The remaining unvested options will be forfeited effective December 31, 2017. In addition, the post-termination non-compete obligation has been revoked by the Company, but Dr. Link is prohibited from soliciting employees of the Company for a period of twelve (12) months following termination.
The 2010 Incentive Plan
The 2010 Incentive Plan and the award agreements thereunder govern the vesting and exercise of stock options, restricted stock, restricted stock units and cash-based incentives upon termination of employment.
Under the 2010 Incentive Plan and the award agreements thereunder, if an executive officer ceases to be employed by the Company or any of its subsidiaries for any reason (other than Death, Disability, Retirement or Change in Control (as such terms are defined in the 2010 Incentive Plan)), then the portion of such executive officer’s stock options, cash or stock-based performance awards, restricted stock and restricted stock units that have not fully vested as of such executive officer’s date of termination of employment (the “Termination Date”) will expire at such time, other than with respect to the 2015 Incentive Bonus and the Brandon Options, as described below. In the event an executive officer ceases to be employed by the Company or any of its subsidiaries by reason of Death, Disability or Retirement and unless their award agreement or employment agreement states otherwise, then, other than with respect to the 2015 Incentive Bonus and the Brandon Options as described below, all time-based vesting restrictions will lapse and be deemed fully satisfied as of the Termination Date.
Under the 2010 Incentive Plan and unless the award agreements thereunder states otherwise, the portion of an executive officer’s stock options that have fully vested as of such executive officer’s Termination Date shall expire (i) one year after such executive officer’s Termination Date if the executive officer is terminated due to Death, Disability or Retirement or is terminated Without Cause or for Good Reason; (ii) 90 days after such executive officer’s Termination Date if the executive officer terminates Without Good Reason (unless such termination occurs after the executive officer has attained eligibility for Retirement); and (iii) immediately upon termination if such executive officer is terminated with Cause. Award agreements for awards issued in the 2015 Award Exchange, 2014 Short Option Award and the awards granted on October 10, 2014 and August 3, 2015 provide that vested awards will remain exercisable until the original expiration date of such awards.
Unless otherwise specified in an award agreement, if an executive officer’s employment with the Company or any of its subsidiaries is terminated for any reason (including a Termination by the Company With or Without Cause, a Resignation by the Participant for any Reason, or a Termination due to Retirement, Death or Disability), then at any time during the one (1) year period commencing on the later of (i) the termination date of employment and (ii) for each share of stock acquired upon exercise of an option, the date on which such share was acquired upon such exercise, the Company may elect to purchase all or any portion of the shares of stock issued or issuable to such individual at a price per share equal to the fair market value thereof, in each case as determined as of a date determined by the Board that is the anticipated date of the closing of the repurchase. In addition, if the Company does not repurchase all of the executive’s shares, the Sponsors shall have the right to repurchase such shares of stock.
Unless otherwise specified in an employment agreement, upon the occurrence of a Change in Control (as defined in the 2010 Incentive Plan), (i) awards for outstanding time-based stock options will become fully vested and (ii) all payments for the 2015 Incentive Bonus and the vesting of the Brandon Options shall be in full and shall not be pro-rated. Please refer to the
132
“NARRATIVE SUPPLEMENT TO THE SUMMARY COMPENSATION TABLE AND THE GRANTS OF PLAN-BASED AWARDS IN FISCAL 2016 TABLE” above and the “POTENTIAL PAYMENTS UPON TERMINATION OR CHANGE IN CONTROL” tables below for more information.
2015 Incentive Bonus
The 2015 Incentive Bonus will vest upon the achievement of specified performance criteria consistent with the Brandon Award granted in July 2015, including Consolidated Adjusted EBITDA less Capital Expenditure criteria in any fiscal year of the Company ending on or before January 2018, as described above, payable in two installments. The first installment is payable within thirty (30) days following the date on which the annual audited financial statements of the Company are approved by the Board for the year in which the performance vesting date occurs. The second installment will be paid on the first anniversary of the first payment date. Upon a Change in Control of the Company, each 2015 Incentive Bonus will be 100% vested irrespective of the achievement of the performance goal and each holder will be entitled to receive both installments. The first installment will be payable immediately after the Change in Control, with the second installment payable on the first anniversary of the first payment date. Assuming their employment is terminated on or prior to the end of the fiscal year ending January 2018 by the Company Without Cause or by the executive for Good Reason, Messrs. Brandon, Short, Barry, Venezia, Wills and Javes will be entitled to the first installment of their 2015 Incentive Bonus (or in the case of Mr. Brandon, both installments), provided that the performance metric is achieved during the fiscal year in which their employment terminates (or in the case of Mr. Brandon, the fiscal year subsequent to the fiscal year in which such termination occurs), all subject to the terms of their respective award agreements. Assuming their employment is terminated on or prior to the end of the fiscal year ending January 2018 due to Death or Disability, each holder will be entitled to both installments of their 2015 Incentive Bonus, provided that the performance metric is achieved during the fiscal year in which their employment terminates, all subject to the terms of their respective award agreements. Assuming their employment terminates on or after the first payment date for any reason other than for Cause or Without Good Reason, Messrs. Short, Barry, Venezia, Wills and Javes will be entitled to the second installment of their 2015 Incentive Bonus. Mr. Brandon is entitled to both installments, to the extent vested, whether or not Mr. Brandon is employed on the applicable payment date. Refer to “POTENTIAL PAYMENTS UPON TERMINATION OR CHANGE IN CONTROL” below for further details.
Brandon Options
If Mr. Brandon’s employment is terminated by the Company Without Cause (and not due to Death or Disability) or by him for Good Reason (as such terms are defined in his employment agreement, where Good Reason includes notice by the Company that it is not extending the employment term), then the service-vesting condition will be deemed satisfied in full and the option will remain outstanding through the last day of the fiscal year subsequent to the fiscal year in which such termination occurs for purposes of determining whether the performance-vesting condition has been satisfied. If Mr. Brandon’s employment is terminated due to Death or Disability, the service-vesting condition will be deemed satisfied in full and, for purposes of determining whether the performance-vesting condition has been satisfied, the option will remain outstanding through the last day of the fiscal year in which such termination occurs. In either case, if the performance-vesting condition is satisfied during the applicable post-termination period, the option will vest in full. However, if not satisfied during the applicable period, the option will be forfeited without consideration. If Mr. Brandon terminates his employment Without Good Reason, the unvested portion of the option will be canceled without consideration. If Mr. Brandon’s employment is terminated by the Company for Cause, the vested and unvested portions of the option shall be immediately forfeited without consideration. Upon a Change in Control, both the service vesting condition and the performance vesting condition shall be deemed satisfied in full. The vested portion of the option will remain exercisable until the tenth anniversary of the grant date.
If the option has vested, Mr. Brandon has the right at any time after June 29, 2020 and until the earlier of a Change in Control or a public offering of the Company, subject to applicable law and restrictions in the Company’s debt and equity financing agreements, to sell back to the Company 50% of the shares of the Company’s common stock that he received upon exercise of the option and to the extent not exercised, sell back the remaining 50% of the shares subject to the option, at the then current per share fair market value (less the exercise price for shares that remain subject to the option) as determined by the Board of Directors, which determination shall take into account, but not be bound by certain specified factors.
TAD Plan
Under the TAD plan, unless otherwise stated in an executive officer’s employment agreement, an executive officer, who retires after the plan year but before the payout date, will still be eligible to receive their TAD award if they retire after attaining age sixty (60) and more than ten (10) years of continuous service. None of our named executive officers are Retirement eligible.
In the event of a Termination due to Death or Disability, a lump sum payment would be made for a pro rata portion of the TAD based on the actual results and percentage of the fiscal year that has elapsed through the date in which such termination occurs in accordance with the plan document.
133
Potential Payments Upon Termination or Change in Control
The following tables set forth the estimated incremental payments and benefits that would be payable to each named executive officer, excluding Dr. Link, upon termination of his employment or a Change in Control of the Company, assuming that the triggering event occurred on January 28, 2017. These amounts would be incremental to the compensation and benefit entitlements described above that are not contingent upon a Termination or Change in Control. The awards granted under the 2010 Incentive Plan are subject to the repurchase rights (which terminate upon a Change in Control or Initial Public Offering) and other rights and obligations. In calculating the amounts set forth in the tables, we utilized a per share value of $11.00, which was the fair value of our shares of common stock as determined by the Board of Directors on April 8, 2016. As we are a privately held company, the value of our shares of common stock is only available when a valuation is performed.
DAVID A. BRANDON
Type of Payment | Termination for Cause or Resignation Without Good Reason | Termination Without Cause or Resignation for Good Reason | Retirement(1) | Death | Long-Term Disability | Change in Control | Termination or Specified Resignation Due to a Change of Control | |||||||||||||||||||||
Severance(2) | $ | — | $ | 6,000,000 | $ | — | $ | — | $ | — | $ | — | $ | 6,000,000 | ||||||||||||||
Fiscal 2016 TAD(3) | — | 323,550 | — | 323,550 | 323,550 | — | 323,550 | |||||||||||||||||||||
2015 Incentive Bonus(4) | — | 37,500,000 | — | — | — | 37,500,000 | 37,500,000 | |||||||||||||||||||||
Fiscal 2015 Stock Option Grant(5) | — | 8,430,000 | — | — | — | 8,430,000 | 8,430,000 | |||||||||||||||||||||
Benefit Continuation(6) | — | 19,940 | — | — | — | — | 19,940 | |||||||||||||||||||||
Excise and Related Tax Gross Up(7) | — | — | — | — | — | 12,730,000 | 14,880,000 | |||||||||||||||||||||
TOTAL | $ | — | $ | 52,273,490 | $ | — | $ | 323,550 | $ | 323,550 | $ | 58,660,000 | $ | 67,153,490 | ||||||||||||||
(1) | Pursuant to the 2010 Incentive Plan, awards would vest upon retirement date. Because retirement eligibility is defined as attaining age sixty (60) with at least ten (10) years of continuous service, Mr. Brandon is not retirement eligible. |
(2) | Severance amounts payable due to Termination Without Cause or Resignation for Good Reason are payable over a twenty-four (24) month period. Upon such a termination during the two (2) year period following a Change in Control such payments will be paid in a lump-sum amount, subject to statutory limitations. |
(3) | In the event of Termination Without Cause, Resignation for Good Reason, Death or Disability, a payment would be made for a pro rata portion of the TAD based on the percentage of the fiscal year that has elapsed through the date in which such event occurs. |
(4) | Upon Termination for Cause or Resignation Without Good Reason, the award shall be forfeited. Upon Death or Disability at fiscal year-end, the award would have been forfeited as the performance condition was not satisfied in fiscal 2016. Upon a Change in Control, the award is deemed earned in full. Upon Termination by the Company Without Cause or a Resignation for Good Reason, the award will remain outstanding through the last day of the fiscal year subsequent to the fiscal year in which such termination occurs and the award will vest if the performance conditions are met by the end of that period. For purposes of this table, we assumed the performance vesting condition will be satisfied in fiscal 2017. |
(5) | Upon Termination for Cause or Resignation Without Good Reason, the award shall be forfeited. Upon a Change in Control, the award is deemed earned in full. Upon Death or Disability at fiscal year-end, the award would have been forfeited as the performance condition was not satisfied in fiscal 2016. Upon a Termination Without Cause or Resignation for Good Reason, the time-vesting condition shall be deemed satisfied in full and the award will remain outstanding through the last day of the fiscal year subsequent to the fiscal year in which such termination occurs and the award will fully vest if the performance conditions are met by the end of that period. For purposes of this table, we assumed the performance vesting condition will be satisfied in fiscal 2017. |
(6) | Represents estimated Company costs based on fiscal 2016 actual amounts for medical, dental and life insurance coverage for the duration of the twenty-four (24) month severance period. The amount excludes estimates for relocation costs reasonably incurred in connection with relocating his family back to Michigan and all costs incurred in connection with the early termination of his lease for housing in the New Jersey area upon a Termination Without Cause or Resignation for Good Reason. |
(7) | Represents the estimated amount of the Excise and Related Tax Gross-Up Payment to be made to Mr. Brandon if a Change in Control of the Company occurs prior to a public offering of the Company’s stock. If Mr. Brandon receives payments and benefits that would cause him to be subject to the excise taxes payable pursuant to Sections 280G and 4999 of the Internal Revenue Code, he would receive an additional amount sufficient to cover 50% of (i) the amount of |
134
such excise tax; and (ii) any applicable federal, state income and employment taxes that may apply to the additional amount paid. For purposes of this calculation, we have assumed that Mr. Brandon’s outstanding option award would be accelerated and terminated in exchange for a cash payment upon the Change in Control.
All U.S. benefit eligible employees receive, at no cost to the individual, the following life insurance benefit and long-term disability coverage: (i) a life insurance benefit in an amount equal to the individual’s base salary plus annual incentive award target, up to a maximum of $1,000,000 and (ii) long-term disability coverage in an amount per month equal to 60% of the individual’s monthly base salary, up to a maximum of $10,000 per month. The long-term disability benefit is payable beginning twenty-six (26) weeks after the onset of the disability and is payable for the duration of the disability up to age 65.
MICHAEL J. SHORT
Termination for Cause or Resignation Without Good Reason(1) | Termination Without Cause or Resignation For Good Reason | Retirement(2) | Death | Long-Term Disability | Change in Control | Termination Without Cause or Resignation for Good Reason in Connection with a Change of Control | ||||||||||||||||||||||
Severance(3) | $ | — | $ | 2,800,000 | $ | — | $ | — | $ | — | $ | — | $ | 2,800,000 | ||||||||||||||
Fiscal 2016 TAD(4) | — | 50,330 | — | 50,330 | 50,330 | — | 50,330 | |||||||||||||||||||||
Fiscal 2016 Stock Option Grant(5) | — | — | — | — | — | — | — | |||||||||||||||||||||
2015 Incentive Bonus(6) | — | — | — | — | — | 3,000,000 | 3,000,000 | |||||||||||||||||||||
Fiscal 2014 Stock Option Grant(5) | — | — | — | 720,000 | 720,000 | 720,000 | 720,000 | |||||||||||||||||||||
Benefit Continuation(7) | — | 19,807 | — | — | — | — | 19,807 | |||||||||||||||||||||
TOTAL | $ | — | $ | 2,870,137 | $ | — | $ | 770,330 | $ | 770,330 | $ | 3,720,000 | $ | 6,590,137 | ||||||||||||||
(1) | If the employment for Mr. Short is terminated for Cause or he resigns Without Good Reason, he will be required to reimburse the Company for a portion of his relocation expenses pursuant to the terms of his employment agreement. |
(2) | Pursuant to the 2010 Incentive Plan, awards would vest upon retirement date. Because retirement eligibility is defined as attaining age sixty (60) with at least ten (10) years of continuous service, Mr. Short is not retirement eligible. |
(3) | Severance amounts payable due to a Termination Without Cause or Resignation for Good Reason are payable over a twenty-four (24) month period. Upon such a termination in connection with a Change in Control, such payments will be paid in a lump-sum amount, subject to statutory limitations. |
(4) | In the event of Termination Without Cause, Resignation for Good Reason, Death or Disability, a payment would be made for a pro rata portion of the TAD based on the percentage of the fiscal year that has elapsed through the date in which such event occurs. |
(5) | Pursuant to the 2010 Incentive Plan, upon Retirement, Death, Disability or a Change in Control, the unvested portion of options will accelerate and become vested. Upon a termination for any other reason, any unvested options will be forfeited. Upon a Termination for Cause, all vested options shall also be forfeited. For the 2016 Stock Option Grant, no value is reflected in the table because the per share value of $11.00 is equal to the option exercise price of $11.00. |
(6) | In calculating the amounts set forth in the table, we determined achievement of the performance vesting condition for the 2015 Incentive Bonus was not satisfied for fiscal 2016. Upon a change in control, the participant shall be entitled to 100% of the award. |
(7) | Represents estimated Company costs based on fiscal 2016 actual amounts for medical, dental and life insurance coverage for the duration of an eighteen (18) month period. |
All U.S. benefit eligible employees receive, at no cost to the individual, the following life insurance benefit and long-term disability coverage: (i) a life insurance benefit in an amount equal to the individual’s base salary plus annual incentive award target, up to a maximum of $1,000,000 and (ii) long-term disability coverage in an amount per month equal to 60% of the individual’s monthly base salary, up to a maximum of $10,000 per month. The long-term disability benefit is payable beginning twenty-six (26) weeks after the onset of the disability and is payable for the duration of the disability up to age 65.
135
RICHARD BARRY
Type of Payment | Termination for Cause or Resignation Without Good Reason | Termination Without Cause or Resignation For Good Reason | Retirement(1) | Death | Long-Term Disability | Change in Control | Termination Without Cause or Resignation for Good Reason in Connection with a Change of Control | |||||||||||||||||||||
Severance(2) | $ | — | $ | 2,400,000 | $ | — | $ | — | $ | — | $ | — | $ | 2,400,000 | ||||||||||||||
Fiscal 2016 TAD(3) | — | 43,140 | — | 43,140 | 43,140 | — | 43,140 | |||||||||||||||||||||
2015 Incentive Bonus(4) | — | — | — | — | — | 2,000,000 | 2,000,000 | |||||||||||||||||||||
Fiscal 2015 Stock Option Grant(5) | — | — | — | 23,754 | 23,754 | 23,754 | 23,754 | |||||||||||||||||||||
Fiscal 2014 Stock Option Grant(5) | — | — | — | 38,037 | 38,037 | 38,037 | 38,037 | |||||||||||||||||||||
Benefit Continuation(6) | — | 25,962 | — | — | — | — | 25,962 | |||||||||||||||||||||
TOTAL | $ | — | $ | 2,469,102 | $ | — | $ | 104,931 | $ | 104,931 | $ | 2,061,791 | $ | 4,530,893 | ||||||||||||||
(1) | Pursuant to the 2010 Incentive Plan, awards would vest upon retirement date. Because retirement eligibility is defined as attaining age sixty (60) with at least ten (10) years of continuous service, Mr. Barry is not retirement eligible. |
(2) | Severance amounts payable due to a Termination Without Cause or Resignation for Good Reason are payable over a twenty-four (24) month period. Upon such a termination in connection with a Change in Control, such payments will be paid in a lump-sum amount, subject to statutory limitations. |
(3) | In the event of Termination Without Cause, Resignation for Good Reason, Death or Disability, a payment would be made for a pro rata portion of the TAD based on the percentage of the fiscal year that has elapsed through the date in which such event occurs. |
(4) | In calculating the amounts set forth in the table, we determined achievement of the performance vesting condition for the 2015 Incentive Bonus was not satisfied for fiscal 2016. Upon a Change in Control, the participant shall be entitled to 100% of the award. |
(5) | Pursuant to the 2010 Incentive Plan, upon Retirement, Death, Disability or a Change in Control, the unvested portion of options will accelerate and become vested. Upon a termination for any other reason, any unvested options will be forfeited. Upon a Termination for Cause, all vested options shall also be forfeited. |
(6) | Represents estimated Company costs based on fiscal 2016 actual amounts for medical, dental and life insurance coverage for the duration of the twenty-four (24) month period. |
All U.S. benefit eligible employees receive, at no cost to the individual, the following life insurance benefit and long-term disability coverage: (i) a life insurance benefit in an amount equal to the individual’s base salary plus annual incentive award target, up to a maximum of $1,000,000 and (ii) long-term disability coverage in an amount per month equal to 60% of the individual’s monthly base salary, up to a maximum of $10,000 per month. The long-term disability benefit is payable beginning twenty-six (26) weeks after the onset of the disability and is payable for the duration of the disability up to age 65.
PATRICK J. VENEZIA
Type of Payment | Termination for Cause or Resignation Without Good Reason | Termination Without Cause or Resignation For Good Reason | Retirement(1) | Death | Long-Term Disability | Change in Control | Termination Without Cause or Resignation for Good Reason in Connection with a Change of Control | |||||||||||||||||||||
Severance(2) | $ | — | $ | 525,000 | $ | — | $ | — | $ | — | $ | — | $ | 525,000 | ||||||||||||||
Fiscal 2016 TAD(3) | — | 37,748 | — | 37,748 | 37,748 | — | 37,748 | |||||||||||||||||||||
Fiscal 2016 Stock Option Grant(4) | — | — | — | — | — | — | — | |||||||||||||||||||||
2015 Incentive Bonus(5) | — | — | — | — | — | 1,500,000 | 1,500,000 | |||||||||||||||||||||
Fiscal 2014 Stock Option Grant(4) | — | — | — | 46,002 | 46,002 | 46,002 | 46,002 | |||||||||||||||||||||
Benefit Continuation(6) | — | 9,468 | — | — | — | — | 9,468 | |||||||||||||||||||||
TOTAL | $ | — | $ | 572,216 | $ | — | $ | 83,750 | $ | 83,750 | $ | 1,546,002 | $ | 2,118,218 | ||||||||||||||
(1) | Pursuant to the 2010 Incentive Plan, awards would vest upon retirement date. Because retirement eligibility is defined as attaining age sixty (60) with at least ten (10) years of continuous service, Mr. Venezia is not retirement eligible. |
136
(2) | Severance amounts payable due to a Termination Without Cause, Resignation for Good Reason or a Termination in Connection with a Change of Control are payable over a twelve (12) month period. |
(3) | In the event of Termination Without Cause, Resignation for Good Reason, Death or Disability, a payment would be made for a pro rata portion of the TAD based on the percentage of the fiscal year that has elapsed through the date in which such event occurs. |
(4) | Pursuant to the 2010 Incentive Plan, upon Retirement, Death, Disability or a Change in Control, the unvested portion of options will accelerate and become vested. Upon a termination for any other reason, any unvested options will be forfeited. Upon a Termination for Cause, all vested options shall also be forfeited. For the 2016 Stock Option Grant, no value is reflected in the table because the per share value of $11.00 is equal to the option exercise price of $11.00. |
(5) | In calculating the amounts set forth in the table, we determined achievement of the performance vesting condition for the 2015 Incentive Bonus was not satisfied for fiscal 2016. Upon a Change in Control, the participant shall be entitled to 100% of the award. |
(6) | Represents estimated Company costs based on fiscal 2016 actual amounts for medical, dental and life insurance coverage for the duration of the twelve (12) month severance period. |
All U.S. benefit eligible employees receive, at no cost to the individual, the following life insurance benefit and long-term disability coverage: (i) a life insurance benefit in an amount equal to the individual’s base salary plus annual incentive award target, up to a maximum of $1,000,000 and (ii) long-term disability coverage in an amount per month equal to 60% of the individual’s monthly base salary, up to a maximum of $10,000 per month. The long-term disability benefit is payable beginning twenty-six (26) weeks after the onset of the disability and is payable for the duration of the disability up to age 65.
LANCE WILLS
Type of Payment | Termination for Cause or Resignation Without Good Reason(1) | Termination Without Cause or Resignation For Good Reason | Retirement(2) | Death | Long-Term Disability | Change in Control | Termination Without Cause or Resignation for Good Reason in Connection with a Change of Control | |||||||||||||||||||||
Severance(3) | $ | — | $ | 550,000 | $ | — | $ | — | $ | — | $ | — | $ | 550,000 | ||||||||||||||
Fiscal 2016 TAD(4) | — | 25,748 | — | 25,748 | 25,748 | — | 25,748 | |||||||||||||||||||||
Fiscal 2016 Stock Option Grant(5) | — | — | — | — | — | — | — | |||||||||||||||||||||
2015 Incentive Bonus(6) | — | — | — | — | — | 1,000,000 | 1,000,000 | |||||||||||||||||||||
Benefit Continuation(7) | — | 2,036 | — | — | — | — | 2,036 | |||||||||||||||||||||
TOTAL | $ | — | $ | 577,784 | $ | — | $ | 25,748 | $ | 25,748 | $ | 1,000,000 | $ | 1,577,784 | ||||||||||||||
(1) | If the employment for Mr. Wills is terminated for Cause or he resigns Without Good Reason, he will be required to reimburse the Company for relocation expenses as per the terms of the relocation policy. |
(2) | Pursuant to the 2010 Incentive Plan, awards would vest upon retirement date. Because retirement eligibility is defined as attaining age sixty (60) with at least ten (10) years of continuous service, Mr. Wills is not retirement eligible. |
(3) | Severance amounts payable due to a Termination Without Cause, Resignation for Good Reason or a Termination in Connection with a Change of Control are payable over a twelve (12) month period. |
(4) | In the event of Termination Without Cause, Resignation for Good Reason, Death or Disability, a payment would be made for a pro rata portion of the TAD based on the percentage of the fiscal year that has elapsed through the date in which such event occurs. |
(5) | Pursuant to the 2010 Incentive Plan, upon Retirement, Death, Disability or a Change in Control, the unvested portion of options will accelerate and become vested. Upon a termination for any other reason, any unvested options will be forfeited. Upon a Termination for Cause, all vested options shall also be forfeited. For the 2016 Stock Option Grant, no value is reflected in the table because the per share value of $11.00 is equal to the option exercise price of $11.00. |
(6) | In calculating the amounts set forth in the table, we determined achievement of the performance vesting condition for the 2015 Incentive Bonus was not satisfied for fiscal 2016. Upon a Change in Control, the participant shall be entitled to 100% of the award. |
(7) | Represents estimated Company costs based on fiscal 2016 actual amounts (and estimated amounts for the 2016 period prior to Mr. Wills’ hiring) for medical, dental and life insurance coverage for the duration of the twelve (12) month severance period. |
All U.S. benefit eligible employees receive, at no cost to the individual, the following life insurance benefit and long-term disability coverage: (i) a life insurance benefit in an amount equal to the individual’s base salary plus annual incentive award
137
target, up to a maximum of $1,000,000 and (ii) long-term disability coverage in an amount per month equal to 60% of the individual’s monthly base salary, up to a maximum of $10,000 per month. The long-term disability benefit is payable beginning twenty-six (26) weeks after the onset of the disability and is payable for the duration of the disability up to age 65.
138
ANDRE JAVES(1)
Type of Payment | Termination for Cause or Resignation Without Good Reason | Termination Without Cause or Resignation For Good Reason | Retirement(2) | Death | Long-Term Disability | Change in Control | Termination Without Cause or Resignation for Good Reason in Connection with a Change of Control | |||||||||||||||||||||
Severance(3) | $ | — | $ | 410,850 | $ | — | $ | — | $ | — | $ | — | $ | 410,850 | ||||||||||||||
Fiscal 2016 TAD(4) | — | 28,170 | — | 28,170 | 28,170 | — | 28,170 | |||||||||||||||||||||
Fiscal 2016 Stock Option Grant(5) | — | — | — | — | — | — | — | |||||||||||||||||||||
Fiscal 2014 Stock Option Grant(5) | — | — | — | 45,693 | 45,693 | 45,693 | 45,693 | |||||||||||||||||||||
TOTAL | $ | — | $ | 439,020 | $ | — | $ | 73,863 | $ | 73,863 | $ | 45,693 | $ | 484,713 | ||||||||||||||
(1) | All amounts calculated in Australian Dollars have been converted to USD using the rate of 1.0000 AUD = 0.7470 USD. |
(2) | Pursuant to the 2010 Incentive Plan, awards would vest upon retirement date. Because retirement eligibility is defined as attaining age sixty (60) with at least ten (10) years of continuous service, Mr. Javes is not retirement eligible. |
(3) | Severance amounts payable due to a Termination Without Cause or Resignation for Good Reason or a Termination in Connection with a Change of Control are payable in a lump-sum amount, subject to statutory limitations. |
(4) | In the event of Termination Without Cause, Resignation for Good Reason, Death or Disability, a payment would be made for a pro rata portion of the TAD based on the percentage of the fiscal year that has elapsed through the date in which such event occurs. |
(5) | Pursuant to the 2010 Incentive Plan, upon Retirement, Death, Disability or a Change in Control, the unvested portion of options will accelerate and become vested. Upon a termination for any other reason, any unvested options will be forfeited. Upon a Termination for Cause, all vested options shall also be forfeited. For the 2016 Stock Option Grant, no value is reflected in the table because the per share value of $11.00 is equal to the option exercise price of $11.00. |
DIRECTOR COMPENSATION IN FISCAL 2016
The Company pays non-employee directors that are not affiliated with the Sponsors an annual cash retainer along with an annual award of options. For fiscal 2016, only Mr. Goodman received compensation for serving on our Board of Directors and as the Chair of our Audit Committee. The table below sets forth payments made to our non-management directors in fiscal 2016:
Name | Fees Earned or Paid in Cash ($) | Stock Awards (1) ($) | Option Awards (1) ($) | Non-Equity Incentive Plan Compensation ($) | Change in Pension Value and Nonqualified Deferred Compensation Earnings ($) | All Other Compensation ($) | Total ($) | |||||||||||||||||
Joshua Bekenstein | — | — | — | — | — | — | — | |||||||||||||||||
Richard Goodman(2) | 150,000 | (3) | — | 100,000 | (4) | — | — | — | 250,000 | |||||||||||||||
Matthew S. Levin | — | — | — | — | — | — | — | |||||||||||||||||
Joseph Macnow | — | — | — | — | — | — | — | |||||||||||||||||
Paul E. Raether | — | — | — | — | — | — | — | |||||||||||||||||
Wendy Silverstein | — | — | — | — | — | — | — | |||||||||||||||||
Nathaniel H. Taylor | — | — | — | — | — | — | — | |||||||||||||||||
(1) | These amounts represent the aggregate grant date fair value of the option awards granted in fiscal 2016 as calculated pursuant to ASC 718 (excluding estimates of forfeitures related to service-based and performance-based vesting conditions). For additional information about the valuation assumptions with respect to equity awards, refer to Note 7 of the financial statements included in this Annual Report on Form 10-K entitled "STOCK-BASED COMPENSATION." |
(2) | At the end of fiscal 2016, Mr. Goodman has deferred receipt of shares deliverable upon settlement of 28,409 restricted stock units, which were awarded for his services in fiscal 2012, 2014 and 2015, until his resignation from the Company's Board of Directors. Mr. Goodman has deferred receipt of shares deliverable upon settlement of 3,335 restricted stock units, which were awarded for his service in fiscal 2013, until the earlier of June 20, 2018 or his separation from service from the Company's Board of Directors. |
139
(3) | During fiscal 2016, Mr. Goodman was paid $150,000, which represents his annual cash retainer of $100,000 and his Audit Committee Chairman retainer of $50,000. |
(4) | Mr. Goodman was granted his annual award of stock options on May 16, 2016. Mr. Goodman received an award of 16,129 stock options vesting on May 16, 2017. In calculating the amounts set forth in the table, we utilized a per share value of $11.00, which was the fair value of our shares of common stock as determined by the Board of Directors on April 8, 2016. As we are a privately held company, the value of our shares of common stock are only available when a valuation is performed. |
ITEM 12. | SECURITY OWNERSHIP OF CERTAIN BENEFICIAL OWNERS AND MANAGEMENT AND RELATED STOCKHOLDER MATTERS |
The following table presents information regarding beneficial ownership of our Common Stock, as of March 1, 2017, by the named executive officers, each of our directors, all of our directors and executive officers as a group and each person who is known by us to beneficially own more than 5% of our Common Stock:
Amount and Nature of Beneficial Ownership * | |||||||||
Name of Beneficial Owner | Shares | Total Beneficial Ownership (1) | Percent of Outstanding Shares (2) | ||||||
Affiliates of Bain Capital Investors, LLC (3) | 16,040,405 | 16,040,405 | 32.50 | % | |||||
Toybox Holdings, LLC (4) | 16,040,405 | 16,040,405 | 32.50 | % | |||||
Vornado Truck LLC (5) | 16,040,405 | 16,040,405 | 32.50 | % | |||||
Richard Barry | 9,039 | 44,587 | 0.09 | % | |||||
Joshua Bekenstein (3) | — | — | — | % | |||||
David A. Brandon | — | — | — | % | |||||
Richard Goodman | — | 31,744 | 0.06 | % | |||||
Andre Javes | — | 15,230 | 0.03 | % | |||||
Matthew S. Levin (3) | — | — | — | % | |||||
Dr. Wolfgang Link | 6,757 | 75,313 | 0.15 | % | |||||
Joseph Macnow (5) | — | — | — | % | |||||
Paul E. Raether(4) | — | — | — | % | |||||
Michael J. Short | — | 240,000 | 0.49 | % | |||||
Wendy Silverstein (5) | — | — | — | % | |||||
Nathaniel H. Taylor (4) | — | — | — | % | |||||
Patrick J. Venezia | — | 15,333 | 0.03 | % | |||||
Lance Wills | — | — | — | % | |||||
Directors and executive officers as a group (16 persons) | 14,581 | 403,750 | 0.82 | % | |||||
* | For purposes of this table, “beneficial ownership” is determined in accordance with Rule 13d-3 under the Exchange Act pursuant to which a person or group of persons is deemed to have “beneficial ownership” of any shares of Common Stock with respect to which such person has (or has the right to acquire within 60 days, i.e., by April 30, 2017 in this case) sole or shared voting power or investment power. |
(1) | Total Beneficial Ownership includes shares, deferred stock units deliverable within 60 days and options exercisable within 60 days. |
(2) | Unless otherwise indicated, the beneficial ownership of any named person does not exceed, in the aggregate, one percent of our outstanding equity securities on March 1, 2017, as adjusted as required by applicable rules. |
(3) | Includes shares held by Bain Capital (TRU) VIII, L.P., Bain Capital (TRU) VIII-E, L.P., Bain Capital (TRU) VIII Coinvestment, L.P., Bain Capital Integral Investors, LLC and BCIP TCV, LLC (collectively, the “Bain Capital Entities”). Bain Capital Investors, LLC (“BCI”) is the general partner of Bain Capital Partners VIII, L.P. which is the general partner of Bain Capital (TRU) VIII, L.P. and Bain Capital (TRU) VIII Coinvestment, L.P. BCI is also the general partner of Bain Capital Partners VIII E, L.P. which is the general partner of Bain Capital (TRU) VIII-E, L.P. BCI is the administrative member of Bain Capital Integral Investors, LLC. Boylston Coinvestors, LLC, (“Boylston”) is the administrative member of BCIP TCV, LLC. The governance, investment strategy and decision-making process with respect to investments held by the Bain Capital Entities is directed by the Global Private Equity Board (“GPEB”) of BCI. Joshua Bekenstein is a member of GPEB and a Managing Director of BCI. Matthew S. Levin is a Senior Advisor of Bain Capital Investors, LLC. By virtue of the relationships described in these footnotes, Mr. Bekenstein |
140
and Mr. Levin may be deemed to share voting and dispositive power with respect to all of the shares of Common Stock held by the Bain Capital Entities. Mr. Bekenstein and Mr. Levin expressly disclaim beneficial ownership of such securities except to the extent of their pecuniary interest therein. The address of each of the Bain Capital Entities, BCI and Boylston is 200 Clarendon Street, Boston, MA 02116.
(4) | Shares owned of record by Toybox Holdings, LLC are also beneficially owned by its majority member, KKR Millennium Fund L.P. As the sole general partner of KKR Millennium Fund L.P., KKR Associates Millennium L.P. may be deemed to be the beneficial owner of such securities beneficially owned by KKR Millennium Fund L.P. As the sole general partner of KKR Associates Millennium L.P., KKR Millennium GP LLC also may be deemed to be the beneficial owner of such securities beneficially owned by KKR Millennium Fund L.P. Each of KKR Fund Holdings L.P. (as the designated member of KKR Millennium GP LLC); KKR Fund Holdings GP Limited (as a general partner of KKR Fund Holdings L.P.); KKR Group Holdings L.P. (as a general partner of KKR Fund Holdings L.P. and the sole shareholder of KKR Fund Holdings GP Limited); KKR Group Limited (as the sole general partner of KKR Group Holdings L.P.); KKR & Co. L.P. (as the sole shareholder of KKR Group Limited) and KKR Management LLC (as the sole general partner of KKR & Co. L.P.) may also be deemed to be the beneficial owner of the securities beneficially owned by KKR Millennium Fund L.P. As the designated members of KKR Management LLC, Henry R. Kravis and George R. Roberts may also be deemed to beneficially own the securities beneficially owned by KKR Millennium Fund L.P. Messrs. Kravis and Roberts have also been designated as managers of KKR Millennium GP LLC by KKR Fund Holdings L.P. Messrs. Raether and Taylor are members of our Board of Directors and are each an executive of Kohlberg Kravis Roberts & Co. L.P. and/or one or more of its affiliates. Each of Messrs. Raether and Taylor disclaim beneficial ownership of the securities held by Toybox Holdings, LLC. For a description of material relationships between KKR and us over the last three years, refer to Item 13 entitled “Certain Relationships and Related Transactions and Director Independence” of this Annual Report on Form 10-K. The address of the entities listed above and Messrs. Kravis and Raether, is c/o Kohlberg Kravis Roberts & Co. L.P., West 57th Street, Suite 4200, New York, New York 10019. For Messrs. Roberts and Taylor, the address is c/o Kohlberg Kravis Roberts & Co. L.P., 2800 Sand Hill Road, Menlo Park, CA 94025. |
(5) | Represents shares of record held by Vornado Truck LLC. As the owner of 100% of the equity of Vornado Truck LLC, Vornado Realty L.P. may be deemed to be the beneficial owner of such shares. Also, as the sole general partner of Vornado Realty L.P., Vornado Realty Trust may be deemed to be the beneficial owner of such shares. Also, Mr. Macnow is a member of our Board of Directors and also an executive of Vornado Realty Trust. As such, he may be deemed to be a beneficial owner of these shares. He disclaims beneficial ownership of shares held by Vornado Truck LLC. The address for each of these persons and entities is c/o Vornado Realty Trust, 888 Seventh Avenue, New York, New York 10019. |
Equity Compensation Plan Information
The following table sets forth information as of January 28, 2017 regarding the Company’s equity compensation plans:
( a ) | ( b ) | ( c ) | ||||||||||||
Plan Category | Number of securities to be issued upon exercise of outstanding options, warrants and rights | Weighted- average exercise price of outstanding options, warrants, and rights | Number of securities remaining available for future issuance under equity compensation (excluding securities reflected in column (a)) | |||||||||||
Equity compensation plans approved by security holders | 6,759,758 | (1) | $ | 8.70 | 1,063,130 | (2) | ||||||||
Equity compensation plans not approved by security holders | — | — | — | |||||||||||
Total | 6,759,758 | $ | 8.70 | 1,063,130 | ||||||||||
(1) | Represents the shares of our common stock issuable pursuant to outstanding options under the 2010 Incentive Plan. |
(2) | Represents the shares of our common stock which may be issued pursuant to future issuances under the 2010 Incentive Plan. |
ITEM 13. | CERTAIN RELATIONSHIPS AND RELATED TRANSACTIONS AND DIRECTOR INDEPENDENCE |
Sponsor Advisory Agreement
The Sponsors provide management and advisory services to us pursuant to an advisory agreement executed at the closing of the merger transaction effective as of July 21, 2005 and amended June 10, 2008, February 1, 2009, August 29, 2014, June 1, 2015 and December 1, 2015 (“Advisory Agreement”). The term of the Advisory Agreement is currently a one-year renewable term unless we or the Sponsors provide notice of termination to the other. Management and advisory fees (the “Advisory Fees”) of
141
$6 million per annum are payable on a quarterly basis. The Advisory Agreement includes customary exculpation and indemnification provisions in favor of the Sponsors and their affiliates. In the event that the Advisory Agreement is terminated by the Sponsors or us, the Sponsors will receive all unpaid Advisory Fees and expenses due under the Advisory Agreement with respect to periods prior to the termination date plus the net present value of the Advisory Fees that would have been payable for the remainder of the then applicable one-year term of the Advisory Agreement.
In August 2014, the Advisory Agreement was amended in order to reduce the Advisory Fees to $17 million for fiscal year 2014 and each year thereafter. The amendment provided that if in the future we successfully complete an initial public offering (“IPO”), the Sponsors may elect to receive from the proceeds of such IPO, an amount equal to the aggregate difference between: (x) the Advisory Fees that would have been paid in fiscal year 2014 and each fiscal year thereafter had such amounts not been fixed and (y) the Advisory Fees that were actually paid for fiscal year 2014 and each fiscal year thereafter.
In June 2015, the Advisory Agreement was further amended in order to reduce the Advisory Fees payable in fiscal 2015 and thereafter from $17 million to $6 million annually with no further adjustment upon an IPO for such reductions. We recorded Advisory Fees of $6 million for fiscals 2016 and 2015, respectively, and $17 million for fiscal 2014. We also paid the Sponsors for out-of-pocket expenses, which were nominal during fiscal 2016 and less than $1 million during fiscals 2015 and 2014, respectively.
Additionally, the original Advisory Agreement provided that affiliates of the Sponsors will be entitled to receive a fee equal to 1% of the aggregate transaction value in connection with certain financing, acquisition, disposition and change of control transactions (“Transaction Fees”). Transaction Fees were capitalized as deferred debt issuance costs and amortized over the term of the related debt agreement. In December 2015, the Advisory Agreement was further amended to waive all Transaction Fees including prior accrued and unpaid transaction fees of $47 million as well as any fees to be paid upon an IPO.
Other Relationships and Transactions with our Sponsors
From time to time, we and our subsidiaries, as well as the Sponsors or their affiliates, may acquire debt or debt securities issued by us or our subsidiaries in open market transactions, tender offers, exchange offers, privately negotiated transactions or otherwise. KKR did not own any of our debt as of January 28, 2017 and owned the following aggregate amounts of our debt as of January 30, 2016. For further details, refer to Note 2 entitled “SHORT-TERM BORROWINGS AND LONG-TERM DEBT.”
(In millions) | January 30, 2016 | |||
Propco I Term Loan Facility | $ | 16 | ||
Incremental Secured Term Loan | 12 | |||
Secured Term B-4 Loan | 2 | |||
Second Incremental Secured Term Loan | 2 | |||
Total | $ | 32 | ||
During fiscals 2016, 2015 and 2014, affiliates of KKR held debt and debt securities issued by the Company and its subsidiaries. The interest amounts paid on such debt and debt securities held by related parties were $1 million, $7 million, and $10 million in fiscals 2016, 2015 and 2014, respectively.
Additionally, under lease agreements with affiliates of Vornado, we paid an aggregate amount of $8 million in fiscals 2016, 2015 and 2014, respectively, with respect to less than 1% of our operated stores, which include Express stores. Of the aggregate amount paid in fiscals 2016, 2015 and 2014, $2 million, respectively, was allocable to joint-venture parties not otherwise affiliated with Vornado.
In connection with the closing of the 2005 acquisition, we entered into a Stockholders Agreement with the Sponsors and certain other investors, and members of our management are bound by certain of the provisions of such agreement. The Stockholders Agreement and management stockholder addendum are each filed as an exhibit to this Annual Report on Form 10-K.
Each of the Sponsors, either directly or through affiliates, has ownership interests in a broad range of companies (“Portfolio Companies”) with whom we may from time to time enter into commercial transactions in the ordinary course of business, primarily for the purchase of goods and services. We believe that none of our transactions or arrangements with Portfolio Companies are significant enough to be considered material to the Sponsors or to our business.
Review, Approval or Ratification of Transactions with Related Persons
Our Board has adopted written policies and procedures for the review of any transaction, arrangement or relationship in which the Company is a participant, the amount involved exceeds $120,000, and one of our executive officers, directors, director
142
nominees (or their immediate family members) or 5% stockholders or an employee serving in the capacity of an executive officer of a 5% stockholder or any consultant or an advisor of a 5% stockholder who participates in meetings of our management or Board, each of whom we refer to as a “related person,” has a direct or indirect material interest.
If a related person proposes to enter into such a transaction, arrangement or relationship, which we refer to as a “related person transaction,” the related person must report the proposed related person transaction to our General Counsel. The policy calls for the proposed related person transaction to be reviewed and, if deemed appropriate, approved by our Board’s Audit Committee. The policy also permits the Chairman of the Audit Committee to review and, if deemed appropriate, approve proposed related person transactions that arise between meetings, subject to providing notice to the other members of the Audit Committee at the next meeting of the Audit Committee. Any related person transactions that are ongoing in nature will be reviewed annually. A related person transaction reviewed under the policy will be considered approved or ratified if it is authorized by the Audit Committee (or its Chairman) after full disclosure of the related person’s interest in the transaction. The Audit Committee (or its Chairman) will review and consider such information regarding the related person transaction as it deems appropriate under the circumstances.
The Audit Committee (or its Chairman) may approve or ratify the transaction only if the Audit Committee or its Chairman, as applicable, determines that, under all of the circumstances, the transaction is not inconsistent with the Company’s best interests. The Audit Committee (or its Chairman) may impose any conditions on the related person transaction that it deems appropriate.
Director Independence
Each of the members of our Board of Directors, other than Mr. Brandon, our Chief Executive Officer, and Mr. Goodman, is affiliated with the Sponsors as further described in Item 10 entitled “DIRECTORS, EXECUTIVE OFFICERS AND CORPORATE GOVERNANCE” of this Annual Report on Form 10-K and our Board of Directors has not made a determination as to whether any of our directors are independent.
ITEM 14. | PRINCIPAL ACCOUNTING FEES AND SERVICES |
Appointment of Independent Registered Public Accounting Firm
On June 16, 2015, the Audit Committee of the Board approved the replacement of the Company’s independent registered public accounting firm of the Company and its subsidiaries, including Toys “R” Us – Delaware, Inc., Toys “R” Us Property Company I, LLC and Toys “R” Us Property Company II, LLC. The dismissal and appointment was a result of a competitive bidding process involving several accounting firms, including D&T.
The Audit Committee appointed EY as the Company’s independent registered public accounting firm to conduct the audit of the Company’s Consolidated Financial Statements for fiscals 2016 and 2015.
Audit Fees and Non-audit Fees
The aggregate fees billed by EY and D&T along with their respective affiliates for professional services rendered for the audit of the annual Consolidated Financial Statements and for the reviews of the financial statements included in our Quarterly Reports on Form 10-Q for fiscals 2016 and 2015, respectively, and for other services rendered during those fiscal years were as follows:
Fiscal 2016 | Fiscal 2015 | |||||||||||||||
EY | EY | D&T | Total | |||||||||||||
Audit Fees (1) | $ | 4,741,000 | $ | 4,067,000 | $ | 219,000 | $ | 4,286,000 | ||||||||
Audit-Related Fees (2) | 511,000 | 127,000 | 536,000 | 663,000 | ||||||||||||
Tax Fees (3) | 50,000 | 139,000 | 22,000 | 161,000 | ||||||||||||
Total Fees | $ | 5,302,000 | $ | 4,333,000 | $ | 777,000 | $ | 5,110,000 | ||||||||
(1) | For fiscals 2016 and 2015, the audit fees consisted of professional services performed in connection with the audit of the Company’s annual consolidated financial statements, review of financial statements included in our 10-Q filings, the Sarbanes-Oxley Section 404 audit and services that are normally provided in connection with statutory and regulatory filings or engagements. |
(2) | For fiscal 2016, audit-related fees primarily consisted of fees related to special purpose audits and refinancing transactions. For fiscal 2015, audit-related fees primarily consisted of fees related to special purpose audits. |
(3) | For fiscal 2016, tax fees consisted of a variety of non-U.S. tax advisory and compliance services. For fiscal 2015, tax fees consisted of a variety of U.S. Federal, state and non-U.S. tax advisory and compliance services. |
143
Audit Committee Pre-Approval of Audit and Permissible Non-Audit Services of Independent Registered Public Accounting Firm
The Audit Committee has adopted a policy for the pre-approval of all audit and permissible non-audit services provided by EY and D&T. These services may include audit services, audit-related services, tax services and other services. Under the policy, pre-approval is generally provided for up to one year and any pre-approval is detailed as to the particular service or category of services and is subject to a specific budget. In addition, the Audit Committee may also pre-approve particular services on a case-by-case basis. The Audit Committee may delegate pre-approval authority to one or more of its members. Such member or members must report any decision to the Audit Committee at its next scheduled meeting.
144
PART IV
ITEM 15. | EXHIBITS AND FINANCIAL STATEMENT SCHEDULES |
(a) Financial Statements and financial statement schedules
(1) and (2) The financial statements and financial statement schedules required to be filed as part of this report are set forth in Item 8 entitled “FINANCIAL STATEMENTS AND SUPPLEMENTARY DATA” of this Annual Report on Form 10-K.
(3) Exhibits. Refer to Item 15(b) below.
(b) Exhibits required by Item 601 of Regulation S-K
The information required by this item is incorporated herein by reference from the Index to Exhibits beginning on page 148 of this Annual Report on Form 10-K. We will furnish to any security holder, upon written request, any exhibit listed in the accompanying Index to Exhibits upon payment by such security holder of our reasonable expenses in furnishing any such exhibit. Written requests should be sent to Investor Relations, Toys “R” Us Inc., One Geoffrey Way, Wayne, New Jersey 07470.
ITEM 16. | FORM 10-K SUMMARY |
None.
145
SIGNATURES
Pursuant to the requirements of Section 13 or 15(d) of the Securities Exchange Act of 1934, the registrant has duly caused this report to be signed on its behalf by the undersigned, thereunto duly authorized.
TOYS “R” US, INC. |
(Registrant) |
/S/ DAVID A. BRANDON |
David A. Brandon |
Chairman of the Board and Chief Executive Officer |
Date: April 12, 2017
Pursuant to the requirements of the Securities Exchange Act of 1934, this report has been signed below by the following persons on behalf of the registrant and in the capacities indicated on the 12th day of April 2017.
Signature | Title | |
/s/ DAVID A. BRANDON David A. Brandon | Chairman of the Board, Chief Executive Officer and Director (Principal Executive Officer) | |
/s/ MICHAEL J. SHORT Michael J. Short | Executive Vice President – Chief Financial Officer (Principal Financial Officer) | |
/s/ CHARLES D. KNIGHT Charles D. Knight | Senior Vice President – Corporate Controller (Principal Accounting Officer) | |
* Joshua Bekenstein | Director | |
* Richard Goodman | Director | |
* Matthew S. Levin | Director | |
* Joseph Macnow | Director | |
* Paul E. Raether | Director | |
* Wendy Silverstein | Director | |
* Nathaniel H. Taylor | Director | |
The foregoing constitutes all of the Board of Directors and the Principal Executive, Financial and Accounting Officers of the Registrant.
*By | /S/ DAVID A. BRANDON | |
David A. Brandon | ||
Attorney-In-Fact | ||
146
SUPPLEMENTAL INFORMATION TO BE FURNISHED WITH REPORTS FILED PURSUANT TO SECTION 15(d) OF THE ACT BY REGISTRANTS WHICH HAVE NOT REGISTERED SECURITIES PURSUANT TO SECTION 12 OF THE ACT
We have not sent a copy of our annual report or proxy statement to our security holders.
147
INDEX TO EXHIBITS
The following is a list of all exhibits filed as part of this Report:
Exhibit No. | Document | |
2.1 | Reorganization Agreement, dated June 10, 2008, by and between the Registrant and Toys “R” Us Holdings, Inc. (filed as Exhibit 2.1 to the Registrant’s Quarterly Report on Form 10-Q, filed on June 10, 2008 and incorporated herein by reference). | |
3.1 | Amended and Restated Certificate of Incorporation of the Registrant filed with the Secretary of State of the State of Delaware on June 10, 2008 (filed as Exhibit 3.2 to the Registrant’s Quarterly Report on Form 10-Q, filed on June 10, 2008 and incorporated herein by reference). | |
3.2 | Amendment No. 1 to the Amended and Restated Certificate of Incorporation of the Registrant filed with the Secretary of State of the State of Delaware on June 3, 2015 (filed as Exhibit 3.1 to the Registrant’s Quarterly Report on Form 10-Q, filed on June 12, 2015 and incorporated herein by reference). | |
3.3 | Amendment No. 2 to the Amended and Restated Certificate of Incorporation of the Registrant filed with the Secretary of State of the State of Delaware on March 22, 2016 (filed as Exhibit 3.3 to the Registrant’s Annual Report on Form 10-K for the fiscal year ended January 30, 2016, filed on March 24, 2016 and incorporated herein by reference). | |
3.4 | Amended and Restated By-Laws of the Registrant, dated June 10, 2008 (filed as Exhibit 3.3 to the Registrant’s Quarterly Report on Form 10-Q, filed on June 10, 2008 and incorporated herein by reference). | |
4.1 | Indenture between the Registrant and Fleet Bank, as trustee, pursuant to which securities in one or more series up to $300,000,000 in principal amount may be issued by the Registrant (filed as Exhibit 4 to the Registrant’s Registration Statement on Form S-3, File No. 33-42237, filed on August 31, 1991 and incorporated herein by reference). | |
4.2 | Form of the Registrant’s 8.75% Debentures due 2021 (filed as Exhibit 4 to the Registrant’s Current Report on Form 8-K, dated August 29, 1991 and incorporated herein by reference). | |
4.3 | First Supplemental Indenture, dated as of January 1, 1996, among Toys “R” Us - Delaware, Inc., Toys “R” Us, Inc. and United Jersey Bank, as trustee (filed as Exhibit 4.3 to the Registrant’s Annual Report on Form 10-K for the fiscal year ended January 30, 2016, filed on March 24, 2016 and incorporated herein by reference). | |
4.4 | Second Supplemental Indenture, dated as of November 15, 2006, among Toys “R” Us – Delaware, Inc., Toys “R” Us, Inc. and The Bank of New York, as trustee (filed as Exhibit 10.5 to the Registrant’s Quarterly Report on Form 10-Q, filed on December 12, 2006 and incorporated herein by reference). | |
4.5 | Form of the Registrant’s 7.375% Notes due 2018 (filed as Exhibit 4.1 to the Registrant’s Current Report on Form 8-K, File No. 001-11609, filed on September 22, 2003 and incorporated herein by reference). | |
4.6 | Indenture, dated as of May 28, 2002, between the Registrant and The Bank of New York, as trustee (filed as Exhibit 4.3 to the Post-Effective Amendment to the Registrant’s Registration Statement on Form S-3, File No. 333-84254, filed on May 29, 2002 and incorporated herein by reference). | |
4.7 | First Supplemental Indenture, dated as of May 28, 2002, between the Registrant and The Bank of New York, as trustee (filed as Exhibit 4.4 to the Post-Effective Amendment to the Registrant’s Registration Statement on Form S-3, File No. 333-84254, filed on May 29, 2002 and incorporated herein by reference). | |
4.8 | Indenture, dated as of August 16, 2016, among TRU Taj LLC, TRU Taj Finance, Inc., the guarantors named therein and Wilmington Trust, National Association, as trustee and collateral trustee (filed as Exhibit 4.1 to the Registrant’s Current Report on Form 8-K, filed on August 18, 2016 and incorporated herein by reference). | |
4.9 | First Supplemental Indenture, dated as of August 26, 2016, among TRU Taj LLC, TRU Taj Finance, Inc., the guarantors named therein and Wilmington Trust, National Association, as trustee (filed as Exhibit 10.1 to the Registrant’s Current Report on Form 8-K, filed on August 26, 2016 and incorporated herein by reference). | |
148
Exhibit No. | Document | |
4.10 | Substantially all other long-term debt of the Registrant (which other debt does not exceed on an aggregate basis 10% of the total assets of the Registrant and its subsidiaries on a consolidated basis) is evidenced by, among other things, (i) industrial revenue bonds issued by industrial development authorities and guaranteed by the Registrant, (ii) mortgages held by third parties on real estate owned by the Registrant and (iii) stepped coupon guaranteed bonds held by a third party and guaranteed by the Registrant, any of which the Registrant will furnish to the Commission upon request. | |
10.1 | Third Amended and Restated Credit Agreement, dated as of March 21, 2014, among Toys “R” Us - Delaware, Inc., as the Lead Borrower, Toys “R” Us (Canada) Ltd., Toys “R” Us (Canada) Ltee, as the Canadian Borrower, and certain other subsidiaries of Toys “R” Us - Delaware, Inc., as Facility Guarantors, Bank of America N.A., as Administrative Agent, as Canadian Agent and Co-Collateral Agent, Wells Fargo Bank, National Association, as Co-Collateral Agent, and the Lenders named therein, Wells Fargo Bank National Association and JPMorgan Chase Bank, N.A., as Co-Syndication Agents, Citigroup Global Markets Inc., Deutsche Bank Securities Inc., Goldman Sachs Bank USA and Bank of Montreal as Co-Documentation Agents, Merrill Lynch, Pierce, Fenner & Smith Incorporated, Wells Fargo Bank National Association and JPMorgan Securities, LLC, as Joint Lead Arrangers, Merrill Lynch, Pierce, Fenner & Smith Incorporated, Wells Fargo Bank National Association, JPMorgan Securities, LLC, Citigroup Global Markets Inc., Deutsche Bank Securities Inc. and Goldman Sachs Bank USA as Joint Bookrunners (filed as Exhibit 10.1 to the Registrant’s Quarterly Report on Form 10-Q, filed on June 12, 2014 and incorporated herein by reference). | |
10.2 | First Amendment, dated as of October 24, 2014 to the Third Amended and Restated Credit Agreement, dated as of March 21, 2014 (and related security agreement attached as Annex C) (filed as Exhibit 10.2 to the Registrant’s Annual Report on Form 10-K for the fiscal year ended January 31, 2015, filed on March 26, 2015 and incorporated herein by reference). | |
10.3 | Amended and Restated Intercreditor Agreement, dated as of August 24, 2010, among Toys “R” Us - Delaware, Inc., the Guarantors named therein, Bank of America, N.A., as ABL Agent and as Term Agent and The Bank of New York Mellon, as Notes Agent (filed as Exhibit 4.5 to the Registrant’s Quarterly Report on Form 10-Q, filed on September 10, 2010 and incorporated herein by reference). | |
10.4 | Amendment No. 1, dated as of October 24, 2014, to the Amended and Restated Intercreditor Agreement, dated as of August 24, 2010, as amended, by and among Bank of America, N.A, as Term Agent and as ABL Agent and Toys “R” Us - Delaware, Inc., as the ABL Lead Borrower and the Term Borrower and certain other subsidiaries of Toys “R” Us - Delaware, Inc., as Facility Guarantors (filed as Exhibit 10.3 to the Registrant’s Quarterly Report on Form 10-Q, filed on December 11, 2014 and incorporated herein by reference). | |
10.5 | Second Amended and Restated Syndicated Facility Agreement, as further amended and restated as of December 18, 2015, to the Amended and Restated Syndicated Facility Agreement, dated as of October 15, 2009, as amended and restated as of March 8, 2011 and March 20, 2013, among TRU Europe Limited, TRU Iberia Holdings 1, S.L. U. (formerly known as Nutley, S.L.U.), TRU Australia Holdings, LLC, Toys “R” Us (UK) Limited, Toys “R” Us Limited, Toys “R” Us (Australia) Pty Ltd, Toys “R” Us GmbH, Toys “R” Us Iberia, S.A.U and other Obligors party thereto from time to time, the Lenders party thereto, Deutsche Bank AG, New York Branch, as Administrative Agent, Security Agent and Facility Agent, Deutsche Bank AG, New York Branch and Bank of America, N.A., as Co-Collateral Agents, Deutsche Bank Securities Inc. and Merrill Lynch, Pierce, Fenner & Smith Incorporated, as Joint Lead Arrangers, Deutsche Bank Securities Inc. and Merrill Lynch, Pierce, Fenner & Smith Incorporated, as Joint Book-Runners, Bank of America, N.A., as Syndication Agent and Citibank, N.A. and Goldman Sachs International Bank, as Documentation Agents (filed as Exhibit 10.5 to the Registrant’s Annual Report on Form 10-K for the fiscal year ended January 30, 2016, filed on March 24, 2016 and incorporated herein by reference). | |
10.6 | Amendment No.1, dated as of June 28, 2016 to the Second Amended and Restated Syndicated Facility Agreement, as further amended and restated as of December 18, 2015, to the Amended and Restated Syndicated Facility Agreement, dated as of October 15, 2009, as amended and restated as of March 8, 2011 and March 20, 2013 (filed as Exhibit 10.2 to the Registrant’s Quarterly Report on Form 10-Q, filed on September 13, 2016 and incorporated herein by reference). | |
10.7 | Amendment and Restatement Agreement, dated as of July 24, 2013, relating to the UK Propco Facility Agreement, dated as of March 25, 2013, among Toys “R” Us Properties (UK) Limited, as borrower, Debussy DTC PLC, as original lender, Elavon Financial Services Limited, as facility agent and U.S. Bank Trustees Limited, as security agent (filed as Exhibit 10.1 to the Registrant’s Quarterly Report on Form 10-Q, filed on September 17, 2013 and incorporated herein by reference). | |
149
Exhibit No. | Document | |
10.8 | Amended and Restated Credit Agreement (the “New Secured Term Loan”), dated as of August 24, 2010 by and among Toys “R” Us - Delaware, Inc., as Borrower, Banc of America, N.A., as Administrative Agent and as Collateral Agent, Goldman Sachs Credit Partners L.P. and JPMorgan Chase Bank, N.A., as Syndication Agents, the Lenders named therein, Credit Suisse Securities (USA) LLC and Wells Fargo Bank, N.A., as Documentation Agents, Banc of America Securities LLC, J.P. Morgan Securities, Inc. and Goldman Sachs Lending Partners LLC, as Joint Lead Arrangers and Banc of America Securities LLC, J. P. Morgan Securities Inc., Wells Fargo Securities, LLC, Goldman Sachs Lending Partners LLC, Credit Suisse Securities (USA) LLC, Citigroup Global Markets Inc. and Deutsche Bank Securities Inc., as Joint Bookrunning Managers (filed as Exhibit 10.2 to the Registrant’s Quarterly Report on Form 10-Q, filed on September 10, 2010 and incorporated herein by reference). | |
10.9 | Amendment No. 1, dated as of September 20, 2010, to the New Secured Term Loan (filed as Exhibit 10.7 to the Registrant’s Annual Report on Form 10-K for the fiscal year ended January 29, 2011, filed on March 24, 2011 and incorporated herein by reference). | |
10.10 | Amendment No. 2, dated as of April 10, 2012, to the New Secured Term Loan, dated as of August 24, 2010 by and between, among others, Toys “R” Us - Delaware, Inc., as the Borrower, Bank of America, N.A. as Administrative Agent, and the other agents and the lenders party thereto (filed as Exhibit 10.3 to the Registrant’s Quarterly Report on Form 10-Q, filed on June 8, 2012 and incorporated herein by reference). | |
10.11 | Amendment No. 3, dated as of October 24, 2014, to the New Secured Term Loan, dated as of August 24, 2010 by and between, among others, Toys “R” Us - Delaware, Inc., as the Borrower, Bank of America, N.A. as Administrative Agent, and the other agents and the lenders party thereto (and related security agreement attached as Annex 3) (filed as Exhibit 10.11 to the Registrant’s Annual Report on Form 10-K for the fiscal year ended January 31, 2015, filed on March 26, 2015 and incorporated herein by reference). | |
10.12 | Guarantee, dated as of October 24, 2014 among Wayne Real Estate Parent Company, LLC as the Guarantor and Bank of America, N.A., as Administrative Agent under the New Secured Term Loan, dated as of August 24, 2010, for the Benefit of the Term-B Lenders defined therein (filed as Exhibit 10.4 to the Registrant’s Quarterly Report on Form 10-Q, filed on December 11, 2014 and incorporated herein by reference). | |
10.13 | Incremental Joinder Agreement, dated as of May 25, 2011, to the New Secured Term Loan, dated as of August 24, 2010 by and between, among others, Toys “R” Us - Delaware, Inc., as the Borrower, Bank of America, N.A. as Administrative Agent, and the other agents and the lenders party thereto (filed as Exhibit 10.1 to the Registrant’s Quarterly Report on Form 10-Q, filed on June 10, 2011 and incorporated herein by reference). | |
10.14 | Incremental Joinder Agreement No. 2, dated as of April 10, 2012, to the New Secured Term Loan, dated as of August 24, 2010 by and between, among others, Toys “R” Us - Delaware, Inc., as the Borrower, Bank of America, N.A. as Administrative Agent, and the other agents and the lenders party thereto (filed as Exhibit 10.4 to the Registrant’s Quarterly Report on Form 10-Q, filed on June 8, 2012 and incorporated herein by reference). | |
10.15 | Term Loan Credit Agreement, dated as of August 21, 2013, among Toys “R” Us Property Company I, LLC, as Borrower, the Lenders named therein, Goldman Sachs Lending Partners LLC, as Administrative Agent, Joint Lead Arrangers and Bookrunners, Deutsche Bank Securities, Inc., J.P. Morgan Securities LLC, and Merrill Lynch, Pierce, Fenner & Smith Incorporated, as Joint Lead Arrangers and Bookrunners, Citigroup Global Markets Inc. and Wells Fargo Securities, LLC, as Joint Lead Arrangers, Goldman Sachs Lending Partners LLC, Deutsche Bank Securities Inc., J.P. Morgan Securities LLC and Merrill Lynch, Pierce, Fenner & Smith Incorporated, as Co-Syndication Agents, Citigroup Global Markets Inc. and Wells Fargo Securities, LLC, as Co-Documentation Agents (filed as Exhibit 10.4 to the Registrant’s Quarterly Report on Form 10-Q, filed on September 17, 2013 and incorporated herein by reference). | |
10.16 | Loan Agreement, dated as of November 3, 2016, among Toys “R” Us Property Company II, LLC, Goldman Sachs Mortgage Company and Bank of America N.A. (filed as Exhibit 10.1 to the Registrant’s Current Report on Form 8-K, filed on November 4, 2016 and incorporated herein by reference). | |
10.17 | Guaranty, dated November 3, 2016, by Toys “R” Us, Inc. (filed as Exhibit 10.2 to the Registrant’s Current Report on Form 8-K, filed on November 4, 2016 and incorporated herein by reference). | |
10.18 | Environmental Indemnity Agreement, dated November 3, 2016, by Toys “R” Us Property Company II, LLC and Toys “R” Us, Inc. (filed as Exhibit 10.3 to the Registrant’s Current Report on Form 8-K, filed on November 4, 2016 and incorporated herein by reference). | |
150
Exhibit No. | Document | |
10.19 | Mezzanine Loan Agreement, dated November 3, 2016, between Giraffe Junior Holdings, LLC and certain funds managed by Brigade Capital Management, LP (filed as Exhibit 10.4 to the Registrant’s Current Report on Form 8-K, filed on November 4, 2016 and incorporated herein by reference). | |
10.20 | Guaranty (Mezzanine Loan), dated November 3, 2016, by Toys “R” Us, Inc. (filed as Exhibit 10.5 to the Registrant’s Current Report on Form 8-K, filed on November 4, 2016 and incorporated herein by reference). | |
10.21 | Environmental Indemnity Agreement (Mezzanine Loan), dated November 3, 2016, by Giraffe Junior Holdings, LLC and Toys “R” Us, Inc. (filed as Exhibit 10.6 to the Registrant’s Current Report on Form 8-K, filed on November 4, 2016 and incorporated herein by reference). | |
10.22 | Pledge and Security Agreement (Mezzanine Loan), dated November 3, 2016, by Giraffe Junior Holdings, LLC (filed as Exhibit 10.7 to the Registrant’s Current Report on Form 8-K, filed on November 4, 2016 and incorporated herein by reference). | |
10.23 | Transaction Support Agreement (including the Term Sheet), entered into by and among Toys “R” Us, Inc. and the support parties named therein, dated June 13, 2016 (filed as Exhibit 10.1 to the Registrant’s Current Report on Form 8-K, filed on June 14, 2016 and incorporated herein by reference). | |
10.24 | Collateral Trust Agreement, dated as of August 16, 2016, among TRU Taj LLC, TRU Taj Finance, Inc., the grantors named therein and Wilmington Trust, National Association, as trustee and collateral trustee (filed as Exhibit 10.1 to the Registrant’s Current Report on Form 8-K, filed on August 18, 2016 and incorporated herein by reference). | |
10.25 | Intercreditor Agreement, dated as of August 16, 2016, among TRU Europe Limited, TRU Iberia Holdings 1, S.L.U, TRU Australia Holdings, LLC, certain other subsidiaries of Toys “R” Us, Inc. party thereto, Deutsche Bank AG New York Branch, as first lien collateral agent and Wilmington Trust, National Association, as collateral trustee and second priority representative for the second priority debt parties (filed as Exhibit 10.2 to the Registrant’s Current Report on Form 8-K, filed on August 18, 2016 and incorporated herein by reference). | |
10.26 | Stockholders Agreement among Toys “R” Us Holdings, Inc. (subsequently assumed by the Registrant), Funds managed by Bain Capital Private Equity, LP (as successor in interest to Bain Capital Partners, LLC) or its Affiliates, Toybox Holdings LLC and Vornado Truck LLC and certain other persons, dated as of July 21, 2005 (filed as Exhibit 10.2 to the Registrant’s Quarterly Report on Form 10-Q, filed on June 10, 2008 and incorporated herein by reference). | |
10.27 | Amendment No. 1, dated June 10, 2008, to the Stockholders Agreement among Toys “R” Us Holdings, Inc. (subsequently assumed by the Registrant), Funds managed by Bain Capital Private Equity, LP (as successor in interest to Bain Capital Partners, LLC)) or its Affiliates, Toybox Holdings LLC and Vornado Truck LLC and certain other persons, dated as of July 21, 2005 (filed as Exhibit 10.3 to the Registrant’s Quarterly Report on Form 10-Q, filed on June 10, 2008 and incorporated herein by reference). | |
10.28 | Amendment No. 2, dated October 14, 2015, to the Stockholders Agreement among the Registrant (as successor to Toys “R” Us Holdings, Inc.), Funds managed by Bain Capital Private Equity, LP (as successor in interest to Bain Capital Partners, LLC) or its Affiliates, Toybox Holdings LLC and Vornado Truck LLC and certain other persons, dated as of July 21, 2005 (filed as Exhibit 10.17 to the Registrant’s Annual Report on Form 10-K for the fiscal year ended January 30, 2016, filed on March 24, 2016 and incorporated herein by reference). | |
10.29 | Advisory Agreement, dated as of July 21, 2005, among the Registrant, Toys “R” Us Holdings, Inc. (subsequently assumed by the Registrant), Bain Capital Private Equity, LP (as successor in interest to Bain Capital Partners, LLC), Bain Capital Private Equity (Europe), LLP (as successor in interest to Bain Capital, Ltd.), Kohlberg Kravis Roberts & Co. L.P. and Vornado Truck LLC (filed as Exhibit 10.20 to the Registrant’s Quarterly Report on Form 10-Q, filed on September 14, 2005 and incorporated herein by reference). | |
10.30 | Amendment No. 1, dated June 10, 2008, to the Advisory Agreement among the Registrant, Toys “R” Us Holdings, Inc. (subsequently assumed by the Registrant), Bain Capital Private Equity, LP (as successor in interest to Bain Capital Partners, LLC), Bain Capital Private Equity (Europe), LLP (as successor in interest to Bain Capital, Ltd.), Kohlberg Kravis Roberts & Co. L.P. and Vornado Truck LLC, dated as of July 21, 2005 (filed as Exhibit 10.4 to the Registrant’s Quarterly Report on Form 10-Q, filed on June 10, 2008 and incorporated herein by reference). | |
151
Exhibit No. | Document | |
10.31 | Amendment No. 2, dated February 1, 2009, to the Advisory Agreement among the Registrant, Bain Capital Private Equity, LP (as successor in interest to Bain Capital Partners, LLC), Bain Capital Private Equity (Europe), LLP (as successor in interest to Bain Capital, Ltd.), Kohlberg Kravis Roberts & Co., L.P. and Vornado Truck LLC, dated as of July 21, 2005 (filed as Exhibit 10.26 to the Registrant’s Annual Report on Form 10-K for the fiscal year ended January 31, 2009, filed on March 31, 2009 and incorporated herein by reference). | |
10.32 | Amendment No. 3, dated August 29, 2014, to the Advisory Agreement among the Registrant, Bain Capital Private Equity, LP (as successor in interest to Bain Capital Partners, LLC), Bain Capital Private Equity (Europe), LLP (as successor in interest to Bain Capital, Ltd.), Kohlberg Kravis Roberts & Co., L.P. and Vornado Truck LLC (filed as Exhibit 10.7 to the Registrant’s Quarterly Report on Form 10-Q, filed on December 11, 2014 and incorporated herein by reference). | |
10.33 | Amendment No. 4, dated June 1, 2015, to the Advisory Agreement among the Registrant, Bain Capital Private Equity, LP (as successor in interest to Bain Capital Partners, LLC), Bain Capital Private Equity (Europe), LLP (as successor in interest to Bain Capital, Ltd.), Kohlberg Kravis Roberts & Co., L.P. and Vornado Truck LLC (filed as Exhibit 10.1 to the Registrant’s Quarterly Report on Form 10-Q, filed on June 12, 2015 and incorporated herein by reference). | |
10.34 | Amendment No. 5, effective as of December 1, 2015, to the Advisory Agreement among the Registrant, Bain Capital Private Equity, LP (as successor in interest to Bain Capital Partners, LLC), Bain Capital Private Equity (Europe), LLP (as successor in interest to Bain Capital, Ltd.), Kohlberg Kravis Roberts & Co., L.P. and Vornado Truck LLC (filed as Exhibit 10.23 to the Registrant’s Annual Report on Form 10-K for the fiscal year ended January 30, 2016, filed on March 24, 2016 and incorporated herein by reference). | |
10.35 | Registration Rights Agreement, dated as of July 21, 2005, among Toys “R” Us Holdings, Inc. (subsequently assumed by the Registrant), Funds managed by Bain Capital Private Equity, LP (as successor in interest to Bain Capital Partners, LLC) or its Affiliates, Toybox Holdings LLC, Vornado Truck LLC and certain other Persons (filed as Exhibit 10.12 to the Registrant’s Form S-1/A, filed on July 9, 2010 and incorporated herein by reference). | |
10.36 | Amendment No. 1, dated June 10, 2008, to the Registration Rights Agreement among Toys “R” Us Holdings, Inc. (subsequently assumed by the Registrant), Funds managed by Bain Capital Private Equity, LP (as successor in interest to Bain Capital Partners, LLC) or its Affiliates, Toybox Holdings LLC, Vornado Truck LLC and certain other Persons, dated as of July 21, 2005 (filed as Exhibit 10.13 to the Registrant’s Form S-1/A, filed on July 9, 2010 and incorporated herein by reference). | |
10.37 | Form of Advancement and Indemnification Rights Agreement (filed as Exhibit 10.1 to the Registrant’s Quarterly Report on Form 10-Q, filed on September 4, 2009 and incorporated herein by reference). | |
10.38* | Form of TAD (Team Achievement Dividend) Plan of Toys “R” Us, Inc. (filed as Exhibit 10.27 to the Registrant’s Annual Report on Form 10-K for the fiscal year ended January 30, 2016, filed on March 24, 2016 and incorporated herein by reference). | |
10.39* | Toys “R” Us, Inc. 2010 Incentive Plan (the “2010 Incentive Plan”) (filed as Exhibit 10.26 to the Registrant’s Annual Report on Form 10-K for the fiscal year ended January 29, 2011, filed on March 24, 2011 and incorporated herein by reference). | |
10.40* | Amendment No. 2, dated September 4, 2014, to the 2010 Incentive Plan (filed as Exhibit 10.5 to the Registrant’s Quarterly Report on Form 10-Q, filed on December 11, 2014 and incorporated herein by reference). | |
10.41* | Amendment No. 3, effective as of June 1, 2015, to the 2010 Incentive Plan (filed as Exhibit 10.3 to the Registrant’s Quarterly Report on Form 10-Q, filed on June 12, 2015 and incorporated herein by reference). | |
10.42* | Amendment No. 4, dated as of March 22, 2016 to the 2010 Incentive Plan (filed as Exhibit 10.31 to the Registrant’s Annual Report on Form 10-K for the fiscal year ended January 30, 2016, filed on March 24, 2016 and incorporated herein by reference). | |
10.43* | October 2014 NonQualified Stock Option Agreement, effective October 10, 2014, to the 2010 Incentive Plan, as amended, for all countries other than France (filed as Exhibit 10.6 to the Registrant’s Quarterly Report on Form 10-Q, filed on December 11, 2014 and incorporated herein by reference). | |
152
Exhibit No. | Document | |
10.44* | Form of Toys “R” Us, Inc. NonQualified Stock Option Agreement for Executive Officers for awards under the 2010 Incentive Plan (filed as Exhibit 10.29 to the Registrant’s Annual Report on Form 10-K for the fiscal year ended January 28, 2012, filed on March 21, 2012 and incorporated herein by reference). | |
10.45* | Form of Toys “R” Us, Inc. NonQualified Stock Option Agreement for Executive Officers for awards under the 2010 Incentive Plan (filed as Exhibit 10.5 to the Registrant’s Quarterly Report on Form 10-Q, filed on June 8, 2012 and incorporated herein by reference). | |
10.46* | Form of Toys “R” Us, Inc. Performance-Based NonQualified Stock Option Agreement for Executive Officers for awards under the 2010 Incentive Plan (filed as Exhibit 10.38 to the Registrant’s Annual Report on Form 10-K for the fiscal year ended February 1, 2014, filed on March 31, 2014 and incorporated herein by reference). | |
10.47* | Form of Toys “R” Us, Inc. Restricted Performance-Based Stock Award Agreement for Executive Officers for awards under the 2010 Incentive Plan (filed as Exhibit 10.30 to the Registrant’s Annual Report on Form 10-K for the fiscal year ended January 28, 2012, filed on March 21, 2012 and incorporated herein by reference). | |
10.48* | Form of Toys “R” Us, Inc. Restricted Performance-Based Stock Unit Award Agreement for Executive Officers for awards under the 2010 Incentive Plan (filed as Exhibit 10.31 to the Registrant’s Annual Report on Form 10-K for the fiscal year ended January 28, 2012, filed on March 21, 2012 and incorporated herein by reference). | |
10.49* | Form of Toys “R” Us, Inc. Restricted Stock Unit Award Agreement for Non-Employee Directors for awards under the 2010 Incentive Plan (filed as Exhibit 10.2 to the Registrant’s Quarterly Report on Form 10-Q, filed on December 17, 2013 and incorporated herein by reference). | |
10.50* | Form of Toys “R” Us, Inc. Restricted Stock Unit Award Agreement for Executive Officers for awards under the 2010 Incentive Plan (filed as Exhibit 10.42 to the Registrant’s Annual Report on Form 10-K for the fiscal year ended February 1, 2014, filed on March 31, 2014 and incorporated herein by reference). | |
10.51* | Form of Officer Incentive Cash Award Agreement for awards under the Toys “R” Us, Inc. 2010 Incentive Plan (filed as Exhibit 10.2 to the Registrant’s Quarterly Report on Form 10-Q, filed on June 12, 2014 and incorporated herein by reference). | |
10.52* | Form of Toys “R” Us, Inc. Incentive Award Agreement for David A. Brandon (filed as Exhibit A to Mr. Brandon’s employment agreement which was filed as Exhibit 10.1 to the Registrant’s Current Report on Form 8-K, filed on June 4, 2015 and incorporated herein by reference). | |
10.53* | Form of Toys “R” Us, Inc. Performance Based Nonqualified Stock Option Agreement for David A. Brandon (filed as Exhibit B to Mr. Brandon’s employment agreement which was filed as Exhibit 10.1 to the Registrant’s Current Report on Form 8-K, filed on June 4, 2015 and incorporated herein by reference). | |
10.54* | Form of Toys “R” Us, Inc. Nonqualified Stock Option Agreement, effective October 2015, for Executive Officers for awards under the 2010 Incentive Plan (filed as Exhibit 10.43 to the Registrant’s Annual Report on Form 10-K for the fiscal year ended January 30, 2016, filed on March 24, 2016 and incorporated herein by reference). | |
10.55* | Form of Leadership Team Cash LTIP Award Agreement under the Toys “R” Us, Inc. 2010 Incentive Plan, effective as of November 2015 (filed as Exhibit 10.44 to the Registrant’s Annual Report on Form 10-K for the fiscal year ended January 30, 2016, filed on March 24, 2016 and incorporated herein by reference). | |
10.56* | Amended and Restated Toys “R” Us, Inc. Grantor Trust Agreement, dated as of January 31, 2003, between Registrant and Wachovia Bank, N.A. (filed as Exhibit 10.24 to the Registrant’s Annual Report on Form 10-K for the fiscal year ended January 31, 2004, File No. 001-11609, filed on April 14, 2004 and incorporated herein by reference). | |
153
Exhibit No. | Document | |
10.57* | Toys “R” Us, Inc. Supplemental Executive Retirement Plan, effective as of February 1, 2006 (filed as Exhibit 10.1 to the Registrant’s Current Report on Form 8-K, filed on December 22, 2006 and incorporated herein by reference). | |
10.58* | Amendment No. 1, effective as of February 1, 2008, to the Toys “R” Us, Inc. Supplemental Executive Retirement Plan, effective as of February 1, 2006 (filed as Exhibit 10.32 to the Registrant’s Annual Report on Form 10-K for the fiscal year ended January 31, 2009, filed on March 31, 2009 and incorporated herein by reference). | |
10.59* | Employment Agreement between Toys “R” Us, Inc. and David A. Brandon, dated as of June 1, 2015 (filed as Exhibit 10.1 to the Registrant’s Current Report on Form 8-K, filed on June 4, 2015 and incorporated herein by reference). | |
10.60* | Employment Agreement between Toys “R” Us, Inc. and Michael J. Short, dated as of June 19, 2014 (filed as Exhibit 10.1 to the Registrant’s Quarterly Report on Form 10-Q, filed on September 10, 2014 and incorporated herein by reference). | |
10.61* | Amendment to the Michael J. Short Employment Agreement, dated July 27, 2016 (filed as Exhibit 10.3 to the Registrant’s Quarterly Report on Form 10-Q, filed on September 13, 2016 and incorporated herein by reference). | |
10.62* | Amendment No. 1, dated as of September 12, 2016, to the Stock Option Agreement by and between Toys “R” Us, Inc. and Michael J. Short (filed as Exhibit 10.4 to the Registrant’s Quarterly Report on Form 10-Q, filed on September 13, 2016 and incorporated herein by reference). | |
10.63* | Employment Agreement between Toys “R” Us, Inc. and Richard Barry, dated as of December 10, 2012 (filed as Exhibit 10.51 to the Registrant’s Annual Report on Form 10-K for the fiscal year ended January 30, 2016, filed on March 24, 2016 and incorporated herein by reference). | |
10.64* | Letter Agreement between Toys “R’ Us, Inc. and Richard Barry, dated as of October 20, 2014 (filed as Exhibit 10.52 to the Registrant’s Annual Report on Form 10-K for the fiscal year ended January 30, 2016, filed on March 24, 2016 and incorporated herein by reference). | |
10.65* | Employment Agreement between Toys “R” Us, Inc. and Lance Wills, dated as of May 23, 2016. | |
10.66* | Employment Agreement between Toys “R” Us (Australia) Pty Ltd and Andre Javes, dated as of August 26, 2014. | |
10.67* | Letter Agreement between Toys “R” Us, Inc. and Andre Javes, dated as of May 18, 2016. | |
10.68* | Amendment, dated May 18, 2016, to the Employment Agreement between Toys “R” Us (Australia) Pty Ltd and Andre Javes, dated August 26, 2014. | |
10.69* | Employment Agreement between Toys “R” Us, Inc. and Joseph Venezia, dated as of February 8, 2016. | |
10.70* | Employment Agreement between Toys “R” Us, Inc. and Dr. Wolfgang Link, dated as of October 31, 2013. | |
10.71* | Separation Agreement between Toys “R” Us GmbH and Dr. Wolfgang Link, dated as of February 2, 2017, effective as of January 31, 2017. | |
10.72* | Form of Special Transition Bonus Grant, dated March 11, 2013 (filed as Exhibit 10.50 to the Registrant’s Annual Report on Form 10-K for the fiscal year ended February 2, 2013, filed on March 29, 2013 and incorporated herein by reference). | |
10.73* | Form of Retention Bonus Agreement for Executive Vice Presidents (filed as Exhibit 10.9 to the Registrant’s Quarterly Report on Form 10-Q, filed on December 11, 2014 and incorporated herein by reference). | |
154
Exhibit No. | Document | |
12 | Statement re: computation of ratio of earnings to fixed charges. | |
21 | Subsidiaries of the Registrant as of January 28, 2017. | |
24 | Power of Attorney, dated March 17, 2017. | |
31.1 | Certification of Chief Executive Officer pursuant to Rule 13a – 14(a) and Rule 15d – 14(a) of the Securities and Exchange Act of 1934, as adopted pursuant to Section 302 of the Sarbanes-Oxley Act of 2002. | |
31.2 | Certification of Chief Financial Officer pursuant to Rule 13a – 14(a) and Rule 15d – 14(a) of the Securities and Exchange Act of 1934, as adopted pursuant to Section 302 of the Sarbanes-Oxley Act of 2002. | |
32.1 | Certification of Chief Executive Officer pursuant to 18 U.S.C. Section 1350, as adopted pursuant to Section 906 of the Sarbanes-Oxley Act of 2002. | |
32.2 | Certification of Chief Financial Officer pursuant to 18 U.S.C. Section 1350, as adopted pursuant to Section 906 of the Sarbanes-Oxley Act of 2002. | |
101.INS | XBRL Instance Document | |
101.SCH | XBRL Taxonomy Extension Schema Document | |
101.CAL | XBRL Taxonomy Extension Calculation Linkbase Document | |
101.DEF | XBRL Taxonomy Extension Definition Linkbase Document | |
101.LAB | XBRL Taxonomy Extension Label Linkbase Document | |
101.PRE | XBRL Taxonomy Extension Presentation Linkbase Document | |
* | Management contract or compensatory plan, contract or arrangement. | |
155