Attached files
| file | filename |
|---|---|
| EX-32.2 - EX-32.2 - Hill International, Inc. | a2231587zex-32_2.htm |
| EX-32.1 - EX-32.1 - Hill International, Inc. | a2231587zex-32_1.htm |
| EX-31.2 - EX-31.2 - Hill International, Inc. | a2231587zex-31_2.htm |
| EX-31.1 - EX-31.1 - Hill International, Inc. | a2231587zex-31_1.htm |
| EX-23.1 - EX-23.1 - Hill International, Inc. | a2231587zex-23_1.htm |
| EX-21 - EX-21 - Hill International, Inc. | a2231587zex-21.htm |
| EX-3.2 - EX-3.2 - Hill International, Inc. | a2231587zex-3_2.htm |
Use these links to rapidly review the document
TABLE OF CONTENTS
UNITED STATES
SECURITIES AND EXCHANGE COMMISSION
WASHINGTON, D.C. 20549
FORM 10-K
ANNUAL REPORT PURSUANT TO SECTION 13 OR 15(d) OF THE SECURITIES EXCHANGE ACT OF 1934 |
||
For the fiscal year ended December 31, 2016 |
||
Commission file number 001-33961
HILL INTERNATIONAL, INC.
(Exact name of registrant as specified in its charter)
| Delaware State or other jurisdiction of incorporation or organization |
20-0953973 (I.R.S. Employer Identification No.) |
|
One Commerce Square 2005 Market Street, 17th Floor Philadelphia, PA (Address of principal executive offices) |
19103 (Zip Code) |
Registrant's telephone number, including area code: (215) 309-7700
Securities registered pursuant to Section 12(b) of the Act:
| Title of each class | Name of each exchange on which registered | |
|---|---|---|
| Common Stock, $.0001 par value | New York Stock Exchange |
Securities registered pursuant to Section 12(g) of the Exchange Act: None
Indicate by a check mark if the registrant is a well-known seasoned issuer, as defined in Rule 405 of the Securities Act. Yes o No ý
Indicate by check mark if the registrant is not required to file reports pursuant to Section 13 or Section 15(d) of the Act. Yes o No ý
Indicate by check mark whether the Registrant (1) has filed all reports required to be filed by Section 13 or 15(d) of the Securities Exchange Act of 1934 during the preceding 12 months, and (2) has been subject to such filing requirements for the past 90 days. Yes ý No o
Indicate by a check mark whether the registrant has submitted electronically and posted on its corporate website, if any, every Interactive Data File required to be submitted and posted pursuant to Rule 405 of Regulation S-T (§232.405 of this chapter) during the preceding 12 months (or for such shorter period that the registrant was required to submit and post such files). Yes ý No o
Indicate by a check mark if disclosure of delinquent filers pursuant to Item 405 of Regulation S-K (§229.405 of this chapter) is not contained herein, and will not be contained, to the best of registrant's knowledge in definitive proxy or information statements incorporated by reference in Part III of this Form 10-K or any amendment to this Form 10-K. o
Indicate by check mark whether the registrant is a large accelerated filer, an accelerated filer, a non-accelerated filer or a smaller reporting company. See definitions of "accelerated filer," "large accelerated filer" and "smaller reporting company" in Rule 12b-2 of the Exchange Act (Check one):
| Large Accelerated Filer o | Accelerated Filer ý | Non-Accelerated Filer o (Do not check if a smaller reporting company) |
Smaller reporting company o |
Indicate by check mark whether the registrant is a shell company (as defined in Rule 12b-2 of the Exchange Act). Yes o No ý
The aggregate market value of shares of common stock held by non-affiliates on June 30, 2016 was approximately $171,669,000. As of March 17, 2017, there were 51,859,479 shares of the Registrant's Common Stock outstanding.
Documents Incorporated by Reference
Portions of the proxy statement for the 2017 Annual Meeting of Shareholders of Hill International, Inc. are incorporated by reference into Part III of this Form 10-K.
HILL INTERNATIONAL, INC. AND SUBSIDIARIES
Index to Form 10-K
2
CAUTIONARY NOTE REGARDING FORWARD-LOOKING STATEMENTS
Certain statements contained in this Annual Report on Form 10-K may constitute forward-looking statements within the meaning of the Private Securities Litigation Reform Act of 1995 (the "Reform Act"). We may also make forward-looking statements in other reports filed with the United States Securities and Exchange Commission (the "SEC"), in materials delivered to stockholders and in press releases. Forward-looking statements provide current expectations of future events based on certain assumptions and include any statement that does not directly relate to any historical or current fact. Although we believe that the expectations, estimates and assumptions reflected in our forward-looking statements are reasonable, actual results could differ materially from those projected or assumed in any of our forward-looking statements. You can identify forward-looking statements by the use of terminology such as "may," "will," "anticipate," "believe," "estimate," "expect," "future," "intend," "plan," "could," "should," "potential" or "continue" or the negative or other variations thereof, as well as other statements regarding matters that are not historical fact.
Those forward-looking statements may concern, among other things:
- •
- The markets for our services;
- •
- Statements concerning the closing of the sale of the Construction Claims Group;
- •
- Projections of revenues and earnings, anticipated contractual obligations, funding requirements or other financial items;
- •
- Statements concerning our plans, strategies and objectives for future operations; and
- •
- Statements regarding future economic conditions or performance.
Important factors that could cause our actual results, performance and achievements, or industry results to differ materially from estimates or projections contained in our forward-looking statements include:
- •
- Modifications and termination of client contracts;
- •
- Control and operational issues pertaining to business activities that we conduct pursuant to joint ventures with other parties;
- •
- Difficulties we may incur in implementing our acquisition strategy;
- •
- Unfavorable global economic conditions
- •
- Our expenses may be higher than anticipated
- •
- The closing of the sale of our Construction Claims Group may be delayed or cancelled;
- •
- The need to retain and recruit key technical and management personnel; and
- •
- Unexpected adjustments and cancellations related to our backlog.
Other factors that may affect our business, financial position or results of operations include:
- •
- Special risks of our ability to obtain debt financing or otherwise raise capital to meet required working capital needs and to support
potential future acquisition activities;
- •
- Special risks of international operations, including uncertain political and economic environments, acts of terrorism or war, potential incompatibilities with foreign joint venture partners, foreign currency fluctuations, civil disturbances and labor issues; and
3
- •
- Special risks of contracts with governmental entities, including the failure of applicable governing authorities to take necessary actions to secure or maintain funding for particular projects with us, the unilateral termination of contracts by the government and reimbursement obligations to the government for funds previously received.
We assume no obligation to update or revise any forward-looking statements. In accordance with the Reform Act, Item 1A of this Report entitled "Risk Factors" contains cautionary statements that accompany those forward-looking statements. You should carefully review such cautionary statements as they identify certain important factors that could cause actual results to differ materially from those in the forward-looking statements and from historical trends. Those cautionary statements are not exclusive and are in addition to other factors discussed elsewhere in this Form 10-K, in our other filings with the SEC or in materials incorporated therein by reference.
General
Hill International, Inc., with 4,300 professionals in 100 offices worldwide, provides program management, project management, construction management and other consulting services primarily to the buildings, transportation, environmental, energy and industrial markets. According to Engineering News-Record magazine Hill was recently ranked as the eighth largest construction management firm in the United States. The terms "Hill", the "Company", "we", "us" and "our" refer to Hill International, Inc.
We compete for business based on a variety of factors such as technical capability, global resources, price, reputation and past experience, including client requirements for substantial experience in similar projects. We have developed significant long-standing relationships, which bring us repeat business and would be very difficult to replicate. We believe we have an excellent reputation for attracting and retaining professionals. In addition, we believe there are high barriers to entry for new competitors especially in the project management market.
Our Strategy
Our strategy emphasizes the following key elements:
- •
- Increase Revenues from Our Existing Clients. We have long-standing relationships with a number
of public and private sector entities. Meeting our clients' diverse needs in managing construction risk and generating repeat business from our clients to expand our project base is one of our key
growth strategies. We accomplish this objective by providing a broad range of project management consulting services in a wide range of geographic areas that support our clients during every phase of
a project, from concept through completion. We believe that nurturing our existing client relationships expands our project base through repeat
business.
- •
- Capitalize Upon the Continued Spend in the Markets We Serve. We believe
that the demand for project management services will grow with increasing construction and infrastructure spending in the markets we serve. We believe that our reputation and experience combined with
our broad platform of service offerings will enable us to capitalize on increases in demand for our services. In addition, we strategically open new offices to expand into new geographic areas and we
aggressively hire individuals with significant contacts to accelerate growth of these new offices and to strengthen our presence in existing markets.
- •
- Strengthen Professional Resources. Our biggest asset is the people that work for Hill. We intend to continue spending significant time recruiting and retaining the best and the brightest to improve our competitive position. Our independent status has attracted top project management
4
- •
- Pursue Acquisitions Selectively. We operate in a highly fragmented industry with many smaller, regional competitors. Our acquisition strategy has allowed us to manage risk by diversifying our markets, which has enabled us to compete better by integrating capabilities and obtaining new relationships. We have pursued acquisitions primarily for three reasons: to expand into new geographic markets, to improve capabilities, resources and critical mass in existing geographic markets, and to enhance our capabilities and resources in certain strategic market sectors. Selectively, we intend to focus primarily on U.S. acquisitions to expand our domestic presence and enhance capabilities in specific areas and secondarily on foreign acquisitions that bring new relationships as well as expand our geographic base.
talent with varied industry experience. We believe maintaining and bolstering our team will enable us to continue to grow our business.
Reporting Segments
On December 20, 2016, we entered into a Stock Purchase Agreement to sell our Construction Claims Group, which is reported herein as discontinued operations. This transaction will permit us to strengthen our balance sheet and better focus on our Project Management business. See Note 2 to our consolidated financial statements for a description of the transaction.
Our Project Management Group provides fee-based or "agency" construction management services to our clients, leveraging our construction expertise to identify potential trouble, difficulties and sources of delay on a construction project before they develop into costly problems. Our experienced professionals are capable of managing all phases of the construction process from concept through completion, including cost and budget controls, scheduling, estimating, expediting, inspection, contract administration and management of contractors, subcontractors and suppliers.
Our clients are typically billed a negotiated multiple of the actual direct cost of each professional assigned to a project and we are reimbursed for our out-of-pocket expenses. We believe our fee-based consulting has significant advantages over traditional general contractors. Specifically, because we do not assume project completion risk, our fee-based model eliminates many of the risks typically associated with providing "at risk" construction services.
Our total revenue consists of two components: consulting fee revenue ("CFR") and reimbursable expenses. Reimbursable expenses are reflected in equal amounts in both total revenue and total direct expenses. Because these revenue/costs may be subject to significant fluctuation from year to year, we measure the performance of many of our key operating metrics as a percentage of CFR, as we believe that this is a better and more consistent measure of operating performance than total revenue. Throughout this report we have used CFR as the denominator in many of our ratios.
5
Global Business
We operate worldwide and currently have over 100 offices in over 40 countries. The following table sets forth the amount and percentage of our CFR by geographic region for each of the past three fiscal years (dollars in thousands):
Consulting Fee Revenue by Geographic Region
| |
2016 | 2015 | 2014 | ||||||||||||||||
|---|---|---|---|---|---|---|---|---|---|---|---|---|---|---|---|---|---|---|---|
United States |
$ | 137,528 | 31.7 | % | $ | 122,423 | 26.2 | % | $ | 102,095 | 23.8 | % | |||||||
Latin America |
18,708 | 4.3 | 26,304 | 5.6 | 36,925 | 8.6 | |||||||||||||
Europe |
38,455 | 8.8 | 39,519 | 8.4 | 34,943 | 8.2 | |||||||||||||
Middle East |
204,780 | 47.2 | 245,985 | 52.6 | 222,754 | 51.9 | |||||||||||||
Africa |
20,815 | 4.8 | 20,461 | 4.4 | 18,402 | 4.3 | |||||||||||||
Asia/Pacific |
13,861 | 3.2 | 13,185 | 2.8 | 13,708 | 3.2 | |||||||||||||
| | | | | | | | | | | | | | | | | | | | |
Total |
$ | 434,147 | 100.0 | % | $ | 467,877 | 100.0 | % | $ | 428,827 | 100.0 | % | |||||||
| | | | | | | | | | | | | | | | | | | | |
| | | | | | | | | | | | | | | | | | | | |
| | | | | | | | | | | | | | | | | | | | |
Grow Organically and Through Selective Acquisitions
Over the years, our business has expanded through organic growth and the acquisition of a number of project management businesses. Over the past 18 years, we have completed 14 acquisitions of project management businesses.
We believe that our industry includes a number of small regional companies in a highly fragmented market. We believe that we have significant experience and expertise in identifying, negotiating, completing and integrating acquisitions and view the acquisition of these smaller competitors as a key part of our growth strategy. Through our acquisitions, we gained entry into Spain, Mexico, Poland, Brazil and Turkey and expanded our presence in the United States. These transactions have enabled us to strengthen our geographic diversity and compete more effectively.
Clients
Our clients consist primarily of the United States and other national governments, state and local governments, and the private sector. The following table sets forth our breakdown of CFR attributable to these categories of clients for each of the past three fiscal years (dollars in thousands):
Consulting Fee Revenue By Client Type
| |
2016 | 2015 | 2014 | ||||||||||||||||
|---|---|---|---|---|---|---|---|---|---|---|---|---|---|---|---|---|---|---|---|
U.S. federal government |
$ | 9,600 | 2.2 | % | $ | 8,569 | 1.8 | % | $ | 9,792 | 2.3 | % | |||||||
U.S. state, regional and local governments |
94,459 | 21.8 | 82,181 | 17.6 | 70,036 | 16.3 | |||||||||||||
Foreign governments |
153,445 | 35.3 | 195,383 | 41.8 | 193,283 | 45.1 | |||||||||||||
Private sector |
176,643 | 40.7 | 181,744 | 38.8 | 155,716 | 36.3 | |||||||||||||
| | | | | | | | | | | | | | | | | | | | |
Total |
$ | 434,147 | 100.0 | % | $ | 467,877 | 100.0 | % | $ | 428,827 | 100.0 | % | |||||||
| | | | | | | | | | | | | | | | | | | | |
| | | | | | | | | | | | | | | | | | | | |
| | | | | | | | | | | | | | | | | | | | |
6
The following table sets forth the percentage of our consulting fee revenue contributed by each of our five largest clients for the years ended December 31, 2016, 2015 and 2014:
| |
For the Years Ended December 31, |
|||||||||
|---|---|---|---|---|---|---|---|---|---|---|
| |
2016 | 2015 | 2014 | |||||||
Largest client |
7.9 | % | 10.8 | % | 14.6 | % | ||||
2nd largest client |
6.5 | % | 6.7 | % | 4.6 | % | ||||
3rd largest client |
5.6 | % | 5.7 | % | 3.5 | % | ||||
4th largest client |
4.9 | % | 4.3 | % | 3.4 | % | ||||
5th largest client |
4.8 | % | 3.7 | % | 3.4 | % | ||||
| | | | | | | | | | | |
Top 5 largest clients |
29.7 | % | 31.2 | % | 29.5 | % | ||||
| | | | | | | | | | | |
| | | | | | | | | | | |
| | | | | | | | | | | |
Business Development
The process for acquiring business from each of our categories of clients is principally the same, by participating in a competitive request-for-proposal ("RFP") process, with the primary difference among clients being that the process for public sector clients is significantly more formal and complex than for private sector clients as a result of government procurement rules and regulations that govern the public-sector process.
Although a significant factor in our business development consists of our standing in our industry, including existing relationships and reputation based on performance on completed projects, our marketing department undertakes a variety of activities in order to expand our exposure to potential new clients. These activities include media relations, advertising, promotions, market sector initiatives and maintaining our website and related web marketing. Media relations include placing articles that feature us and our personnel in trade publications and other media outlets. Our promotions include arranging speaking engagements for our personnel, participation in trade shows and other promotional activities. Market sector initiatives are designed to broaden our exposure to specific sectors of the construction industry, such as, for example, participating in or organizing industry seminars.
Doing business with governments is complex and requires the ability to comply with intricate regulations and satisfy periodic audits. We believe that the ability to understand these requirements and to successfully conduct business with government agencies is a barrier to entry for smaller, less experienced competitors. Most government contracts, including those with foreign governments, are subject to termination by the government, to government audits and to continued appropriations. For the year ended December 31, 2016, CFR from U.S. and foreign government contracts represented approximately 59.3% of our total CFR.
We are required from time to time to obtain various permits, licenses and approvals in order to conduct our business in many of the jurisdictions where we operate. Our business of providing project management services is not subject to significant regulation by state, federal or foreign governments.
Contracts
The price provisions of our Project Management related contracts can be grouped into three broad categories: cost-plus, time and materials, and fixed-price. Cost-plus contracts provide for reimbursement of our costs and overhead plus a predetermined fee. Under some cost-plus contracts, our fee may be based partially on quality, schedule and other performance factors. We also enter into contracts whereby we bill our clients monthly at hourly billing rates. The hourly billing rates are determined by contract terms. For governmental clients, the hourly rates are generally calculated as salary costs plus overhead costs plus a negotiated profit percentage. For commercial clients, the hourly rate can be taken from a standard fee schedule by staff classification or it can be at a discount from this schedule. In
7
some cases, primarily for foreign work, a monthly rate is negotiated rather than an hourly rate. This monthly rate is a build-up of staffing costs plus overhead and profit. We account for these contracts on a time-and-materials method, recognizing revenue as costs are incurred. Fixed-price contracts are accounted for using the "percentage-of-completion" method, wherein revenue is recognized as costs are incurred.
Backlog
We believe a strong indicator of our future performance is our backlog of uncompleted projects under contract or awarded. Our backlog represents management's estimate of the amount of contracts and awards in hand that we expect to result in future consulting fees. Our backlog is evaluated by management on a project-by-project basis and is reported for each period shown based upon the binding nature of the underlying contract, commitment or letter of intent, and other factors, including the economic, financial and regulatory viability of the project and the likelihood of the contract being extended, renewed or cancelled.
Our backlog is important to us in anticipating and planning for our operational needs. Backlog is not a measure defined in U.S. generally accepted accounting principles, and our methodology for determining backlog may not be comparable to the methodology used by other companies in determining their backlog.
At December 31, 2016, our Project Management backlog was $831,000,000, compared to approximately $807,000,000 at December 31, 2015. Our net bookings during 2016 of $ 458,147,000, which equates to a book-to-bill ratio of 106% compared to our goal of at least 110%. While this is short of our expectations, it is consistent with the slowdown of project activity in the Middle East due to the economic impact caused by the drop in oil prices and political upheaval and civil unrest in certain parts of the region. This will continue to be a major area of focus for 2017. We estimate that approximately $334,000,000, or 40.2% of the backlog at December 31, 2016, will be recognized during our 2017 fiscal year.
Although backlog reflects business that we consider to be firm, cancellations or scope adjustments may occur. Further, substantially all of our contracts with our clients may be terminated at will, in which case the client would only be obligated to us for services provided through the termination date. Historically, the impact of terminations and modifications on our realization of revenue from our backlog has not been significant, however, in December 2016, the Company had two contracts, one in the Middle East and one in Africa, cancelled. As a result, approximately $73,000,000 was excluded from our backlog at December 31, 2016. Furthermore, reductions of our backlog as a result of contract terminations and modifications may be offset by additions to the backlog.
We adjust backlog to reflect project cancellations, deferrals and revisions in scope and cost (both upward and downward) known at the reporting date. Future contract modifications or cancellations,
8
however, may increase or reduce backlog and future revenue. The following tables show our backlog by geographic region (in thousands):
| |
Total Backlog | 12-Month Backlog | |||||||||||
|---|---|---|---|---|---|---|---|---|---|---|---|---|---|
As of December 31, 2016: |
|||||||||||||
United States |
$ | 459,000 | 55.2 | % | 141,000 | 42.2 | % | ||||||
Latin America |
10,000 | 1.2 | 8,000 | 2.4 | |||||||||
Europe |
38,000 | 4.6 | 26,000 | 7.8 | |||||||||
Middle East |
274,000 | 33.0 | 129,000 | 38.6 | |||||||||
Africa |
42,000 | 5.0 | 22,000 | 6.6 | |||||||||
Asia/Pacific |
8,000 | 1.0 | 8,000 | 2.4 | |||||||||
| | | | | | | | | | | | | | |
Total |
$ | 831,000 | 100.0 | % | $ | 334,000 | 100.0 | % | |||||
| | | | | | | | | | | | | | |
| | | | | | | | | | | | | | |
| | | | | | | | | | | | | | |
As of September 30, 2016: |
|||||||||||||
United States |
$ | 421,000 | 47.4 | % | 142,000 | 39.7 | % | ||||||
Latin America |
11,000 | 1.2 | 9,000 | 2.5 | |||||||||
Europe |
43,000 | 4.8 | 24,000 | 6.7 | |||||||||
Middle East |
358,000 | 40.3 | 153,000 | 42.7 | |||||||||
Africa |
44,000 | 5.0 | 21,000 | 5.9 | |||||||||
Asia/Pacific |
11,000 | 1.3 | 9,000 | 2.5 | |||||||||
| | | | | | | | | | | | | | |
Total |
$ | 888,000 | 100.0 | % | $ | 358,000 | 100.0 | % | |||||
| | | | | | | | | | | | | | |
| | | | | | | | | | | | | | |
| | | | | | | | | | | | | | |
As of December 31, 2015: |
|||||||||||||
United States |
$ | 372,000 | 46.1 | % | 112,000 | 32.9 | % | ||||||
Latin America |
23,000 | 2.9 | 16,000 | 4.7 | |||||||||
Europe |
44,000 | 5.5 | 25,000 | 7.4 | |||||||||
Middle East |
300,000 | 37.2 | 155,000 | 45.6 | |||||||||
Africa |
52,000 | 6.3 | 23,000 | 6.8 | |||||||||
Asia/Pacific |
16,000 | 2.0 | 9,000 | 2.6 | |||||||||
| | | | | | | | | | | | | | |
Total |
$ | 807,000 | 100.0 | % | $ | 340,000 | 100.0 | % | |||||
| | | | | | | | | | | | | | |
| | | | | | | | | | | | | | |
| | | | | | | | | | | | | | |
Competition
The project management industry is highly competitive. We compete for contracts, primarily on the basis of technical capability, with numerous entities, including design or engineering firms, general contractors, other "pure" construction management companies, management consulting firms and other entities. Compared to us, many of these competitors are larger, well-established companies that have broader geographic scope and greater financial and other resources. During 2016, some of our largest project management competitors included: AECOM, ARCADIS N.V., Jacobs Engineering Group, Inc., WSP Parsons Brinckerhoff, Inc., Parsons Corp. and Turner Construction Co.
Insurance
We maintain insurance covering general and professional liability, involving bodily injury and property damage. We have historically enjoyed a favorable loss ratio in all lines of insurance and our management considers our present limits of liability, deductibles and reserves to be adequate. We endeavor to reduce or eliminate risk through the use of quality assurance/control, risk management, workplace safety and similar methods to eliminate or reduce the risk of losses on a project. Although our actual rates have decreased, we have experienced and expect to continue to experience increases in the dollar amount of our insurance premiums because of the increase in our revenue.
9
Management
We are led by an experienced management team with significant experience in the construction industry. Additional information about our executive officers follows.
Executive Officers
Name
|
Age | Position | |||
|---|---|---|---|---|---|
David L. Richter |
50 | Chief Executive Officer | |||
Raouf S. Ghali |
55 | President and Chief Operating Officer | |||
Mohammed Al Rais |
63 | Regional President (Middle East), Project Management Group | |||
John Fanelli III |
62 | Executive Vice President and Chief Financial Officer | |||
William H. Dengler, Jr. |
50 | Executive Vice President and General Counsel | |||
Catherine H. Emma |
57 | Senior Vice President and Chief Administrative Officer | |||
Michael J. Petrisko |
52 | Senior Vice President and Chief Information Officer | |||
DAVID L. RICHTER has been our Chief Executive Officer since December 2014 and he has been a member of our Board of Directors since 1998. Prior to his current position, he was our President and Chief Operating Officer from March 2004 to December 2014. Before that, Mr. Richter was President of our Project Management Group from 2001 to 2004, Senior Vice President and General Counsel from 1999 to 2001 and Vice President and General Counsel from 1995 to 1999. Prior to joining us, he was an attorney with the New York City law firm of Weil, Gotshal & Manges LLP from 1992 to 1995. Mr. Richter is a Fellow of both the Construction Management Association of America (CMAA) and the Chartered Institute of Building. He is a member of the Young Presidents' Organization, the Construction Industry Round Table and the American Society of Civil Engineers. He is a member of the Board of Directors of the Chamber of Commerce for Greater Philadelphia and the Board of Trustees of Princeton Day School. He is a former member of the Board of Directors of the CMAA and the Board of Trustees of the Southern New Jersey Development Council. Mr. Richter is also Chairman of the Oxford Alumni Society of Philadelphia. He earned his B.S. in management, his B.S.E. in civil engineering and his J.D. from the University of Pennsylvania and his M.Sc. in major program management from the University of Oxford.
RAOUF S. GHALI has been our President and a member of our Board of Directors since August 2016 and our Chief Operating Officer since January 2015. Prior to that, he was President of our Project Management Group (International) from January 2005 to January 2015, Senior Vice President in charge of project management operations in Europe, North Africa and the Middle East from 2001 to 2004, and Vice President from 1993 to 2001. Prior to joining us, he worked for Walt Disney Imagineering from 1988 to 1993. Mr. Ghali earned both a B.S. in business administration and economics and an M.S. in business organizational management from the University of LaVerne.
MOHAMMED AL RAIS has been Regional President (Middle East) with Hill's Project Management Group since January 2015. Prior to that, he was Senior Vice President and Managing Director (Middle East) of our Project Management Group from April 2010 to January 2015 and Vice President from 2006 to 2010. Mr. Al Rais has over 39 years of experience in the management of construction projects throughout the Middle East, North Africa, the United Kingdom and Canada. He earned his B.Sc. in city and regional planning from the University of Engineering and Technology in Pakistan and his M.Sc. in project management from the University of Reading in the United Kingdom. Mr. Al Rais is a member of the Association for Project Management in the U.K., the Canadian Business Council, the Society of Engineers in the U.A.E., the Chartered Management Institute, the Project Management Institute and the Chartered Institute of Building.
JOHN FANELLI III has been our Executive Vice President and Chief Financial Officer since August 2016. Mr. Fanelli was previously Senior Vice President from 2006 to 2016. Before that,
10
Mr. Fanelli was Vice President and Chief Accounting Officer of CDI Corp. from 2005 to 2006, and he was Vice President and Corporate Controller of CDI Corporation (a subsidiary of CDI Corp.) from 2003 to 2006. CDI Corp. is a New York Stock Exchange-traded professional services and outsourcing firm based in Philadelphia with expertise in engineering, technical services and information technology. During 2003, Mr. Fanelli was a financial consultant to Berwind Corporation, an investment management company based in Philadelphia which owns a diversified portfolio of manufacturing and service businesses and real estate. Before that, Mr. Fanelli was employed for 18 years by Hunt Corporation, then a New York Stock Exchange-traded manufacturer and marketer of office products. At Hunt, he served as Vice President and Chief Accounting Officer from 1995 until 2003, and before that as Director of Budgeting, Financial Analysis and Control, from 1985 to 1995. Before that, Mr. Fanelli was employed with Coopers & Lybrand for eight years in various accounting and auditing positions. Mr. Fanelli earned his B.S. in accounting from LaSalle University and he is a Certified Public Accountant in Pennsylvania.
WILLIAM H. DENGLER, JR. has been our Executive Vice President and General Counsel since August 2016. Mr. Dengler was previously Senior Vice President from 2007 to 2016, Vice President and General Counsel from 2002 to 2007, and Corporate Counsel from 2001 to 2002. Mr. Dengler also serves as corporate secretary to Hill and its subsidiaries. Prior to joining Hill, Mr. Dengler served as Assistant Counsel to former New Jersey Governors Donald DiFrancesco and Christine Todd Whitman from 1999 to 2001. Mr. Dengler earned his B.A. in political science from McDaniel College and his J.D. from Rutgers University School of Law at Camden. He is licensed to practice law in New Jersey, as well as before the U.S. Court of Appeals for the Third Circuit and the U.S. Supreme Court.
CATHERINE H. EMMA has been our Senior Vice President and Chief Administrative Officer since January 2007. Ms. Emma had been Vice President and Chief Administrative Officer from 2005 to 2007. Before that, she served as Vice President of Human Resources and Administration. Ms. Emma has been with Hill since 1982. She is certified by the HR Certification Institute (HRCI) as a Professional in Human Resources (PHR) and certified by Society of Human Resource Management (SHRM) as a Certified Professional (SHRM- CP) and holds professional memberships with Tri-State Human Resources, the Society for Human Resource Management and Risk and Insurance Management Society, Inc. Ms. Emma previously participated in BNA's Human Resources Personnel Policies Forum.
MICHAEL J. PETRISKO has been our Senior Vice President and Chief Information Officer since June 2014. Prior to that, Mr. Petrisko was Vice President and Chief Information Officer for STV Group, an architecture, engineering and construction management firm, from June 2012 through June 2014. Before that, Mr. Petrisko was Hill's Senior Vice President and Chief Information Officer from January 2009 through June 2012, and Vice President and Chief Information Officer from 2007 to 2008. Before that, Mr. Petrisko was Director of Global IT Operations for AECOM Technology Corp. from 2005 to 2007 and Vice President and Chief Information Officer for DMJM Harris, Inc., a subsidiary of AECOM, a global architecture, engineering and construction management firm, from 2002 to 2005. From 1999 to 2002, he was Director of Technical Services for Foster Wheeler Corp., an engineering and construction services firm. Mr. Petrisko studied management information technology at Thomas Edison State College and he is a member of the New Jersey Society of Information Management and a member of the CMAA.
Employees
At March 17, 2017, we had 3,330 professionals. Of these professionals, 3,202 worked in our Project Management Group and 128 worked in our Corporate office. Our personnel included 2,898 full-time employees, 102 part-time employees and 330 independent contractors. We are not a party to any collective bargaining agreements and we have not experienced any strikes or work stoppages. We
11
consider our relationship with our employees to be satisfactory. In addition, we have 970 professionals working in our Construction Claims Group.
Access to Company Information
We electronically file our Annual Reports on Form 10-K, Quarterly Reports on Form 10-Q, Current Reports on Form 8-K and all amendments to those reports with the United States Securities and Exchange Commission (the "SEC"). The public may read and copy any of the reports that are filed with the SEC at the SEC's Public Reference Room at 100 F Street, N.E., Washington, DC 20549. The public may obtain information on the operation of the Public Reference Room by calling the SEC at (800) SEC-0330. The SEC maintains an Internet site at www.sec.gov that contains periodic reports, proxy statements, information statements and other information regarding issuers that file electronically.
We make available, free of charge, through our website or by responding to requests addressed to our Legal Department, our Annual Reports on Form 10-K, Quarterly Reports on Form 10-Q, Current Reports on Form 8-K and all amendments to those reports filed by us with the SEC pursuant to Sections 13(a) and 15(d) of the Securities Exchange Act, as amended. These reports are available as soon as practicable after such material is filed with or furnished to the SEC. Our primary website is www.hillintl.com. We post the charters for our audit, compensation and governance and nominating committees, corporate governance principles and code of ethics in the "Investors" section of our website. The information contained on our website, or on other websites linked to our website, is not part of this document.
Our business involves a number of risks, some of which are beyond our control. The risks and uncertainties described below could individually or collectively have a material adverse effect on our business, financial condition, results of operations and cash flows. While these are not the only risks and uncertainties we face, we believe that the more significant risks and uncertainties are as follows:
Risks Affecting the Business
Acts of terrorism, political, governmental and social upheaval and threats of armed conflicts in or around various areas in which we operate could limit or disrupt markets and our operations, including disruptions resulting from the evacuation of personnel, cancellation of contracts or the loss of personnel.
Acts of terrorism, political, governmental and social upheaval and threats of armed conflicts in or around various areas in which we operate could limit or disrupt markets and our operations, including disruptions resulting from the evacuation of personnel, cancellation of contracts or the loss of personnel, and may affect timing and collectability of our accounts receivable. Such events may cause further disruption to financial and commercial markets and may generate greater political and economic instability in some of the geographic areas in which we operate. In addition, any possible reprisals as a consequence of the wars and ongoing military action in the Middle East and Africa, such as acts of terrorism in the United States or elsewhere, could have a material adverse effect on our business, results of operations and financial position.
If our clients delay in paying or fail to pay amounts owed to us, it could have a material adverse effect on our liquidity, results of operations and financial condition.
Accounts receivable represent the largest asset on our balance sheet. While we take steps to evaluate and manage the credit risks relating to our clients, economic downturns or other events can adversely affect the markets we serve and our clients ability to pay, which could reduce our ability to collect all amounts due from clients. In addition, political unrest in countries in which we operate and
12
the effect of the decline of oil prices have impacted and may in the future impact our collections on accounts receivable. If our clients delay in paying or fail to pay us a significant amount of our outstanding receivables, it could have a material adverse effect on our liquidity, results of operations, and financial condition.
Our business is sensitive to oil and gas prices, and fluctuations in oil and gas prices may negatively affect our business.
Historically, oil and natural gas prices have been volatile and are subject to fluctuations in response to changes in supply and demand, market uncertainty and a variety of additional factors that are beyond our control. Consulting fee revenue derived from our operations in major oil and gas producing countries in the Middle East and Africa is approximately 52.0% of CFR. Significant drops in oil or gas prices have led, and could lead to further slowdowns, in construction in these regions, which has had and could have a material adverse effect on our business, results of operations, financial condition and cash flows.
Unfavorable global economic conditions could adversely affect our business, liquidity and financial results.
The markets that we serve are cyclical and subject to fluctuation based on general global economic conditions and other factors. Unfavorable global economic conditions, including disruption of financial markets in the United States, Europe, Brazil and elsewhere, could adversely affect our business and results of operations, primarily by limiting our access to credit and disrupting our clients' businesses. The reduction in financial institutions' willingness or ability to lend has increased the cost of capital and reduced the availability of credit. Although we currently believe that the financial institutions with which we do business will be able to fulfill their commitments to us, there is no assurance that those institutions will be able or willing to continue to do so, which could have a material adverse impact on our business. The current European debt crisis and Brazil economic crisis may cause the value of European and Brazilian currencies, including the Euro, British pound sterling and Brazilian real, to deteriorate, thus reducing the purchasing power of European and Brazilian clients and reducing the translated amounts of U.S. dollar revenues. For the year ended December 31, 2016, 8.8% and 4.3% of our consulting fee revenue was attributable to European and Brazilian clients, respectively. In addition, any negative change in general market conditions in the United States, Europe or other national economies important to our businesses may adversely affect our clients' level of spending, ability to obtain financing, and ability to make timely payments to us for our services, which could require us to increase our allowance for doubtful accounts, negatively impact our days sales outstanding and adversely affect our results of operations and liquidity.
The sale of our Construction Claims Group is contingent upon the satisfaction of a number of conditions, may require significant time and attention of our management, and may have a material adverse effect on us whether or not the transaction is completed.
On December 20, 2016, we announced the entrance into a Stock Purchase Agreement which would sell our Construction Claims Group. This transaction is subject to customary conditions. In addition, unanticipated developments or changes in our ability to satisfy closing conditions, in the buyer's willingness to waive unsatisfied closing conditions, or in certain litigation matters, as well as other developments, conditions, or changes may affect the closing of the sale. For these and other reasons, we may not complete the sale as expected or at all.
13
Our ongoing businesses may be adversely affected and we may be subject to certain risks and consequences as a result of pursuing the transaction, including, among others, the following:
- •
- Execution of the proposed transaction will continue to require significant time and attention from management, which may distract them from the
operation of our business and the execution of other initiatives that may have been beneficial to us;
- •
- Our employees may be distracted due to uncertainty about their future roles with the Company or the Construction Claims Group pending the
completion of the transaction;
- •
- We will be required to pay significant costs and expenses relating to the transaction, such as legal, accounting and other professional fees,
whether or not the transaction is completed; and
- •
- We may experience negative reactions from the financial markets if we fail to complete the transaction.
Any of these factors could have a material adverse effect on our business, financial condition, results of operations, cash flows or the price of our common stock.
We may be unable to win new contract awards if we cannot provide clients with letters of credit, bonds or other forms of guarantees.
In certain international regions, primarily the Middle East, it is industry practice for clients to require letters of credit, bonds, bank guarantees or other forms of guarantees. These letters of credit, bonds or guarantees indemnify our clients if we fail to perform our obligations under our contracts. We currently have relationships with various domestic and international banking institutions to assist us in providing clients with letters of credit or guarantees. In the event there are limitations in worldwide banking capacity, we may find it difficult to find sufficient bonding capacity to meet our future bonding needs. Failure to provide credit enhancements on terms required by a client may result in our inability to compete or win a project.
International operations and doing business with foreign governments expose us to legal, political, operational and economic risks in different countries and currency exchange rate fluctuations could adversely affect our financial results.
Our international operations contributed 68.3%, 73.8% and 76.2% of our consulting fee revenue for the years ended December 31, 2016, 2015 and 2014, respectively. There are risks inherent in doing business internationally, including:
- •
- Lack of developed legal systems to enforce contractual rights;
- •
- Foreign governments may assert sovereign or other immunity if we seek to assert our contractual rights thus depriving us of any ability to seek
redress against them;
- •
- Greater difficulties in managing and staffing foreign operations;
- •
- Differences in employment laws and practices which could expose us to liabilities for payroll taxes, pensions and other expenses;
- •
- Inadequate or failed internal controls, processes, people, and systems associated with foreign operations;
- •
- Increased logistical complexity;
- •
- Increased selling, general and administrative expenses associated with managing a larger and more global business;
- •
- Greater risk of uncollectible accounts and longer collection cycles;
14
- •
- Currency exchange rate fluctuations;
- •
- Restrictions on the transfer of cash from certain foreign countries;
- •
- Imposition of governmental controls;
- •
- Political and economic instability;
- •
- Changes in U.S. and other national government policies affecting the markets for our services and our ability to do business with certain
foreign governments or their political leaders;
- •
- Conflict between U.S. and non-U.S. law;
- •
- Changes in regulatory practices, tariffs and taxes;
- •
- Less well established bankruptcy and insolvency procedures;
- •
- Potential non-compliance with a wide variety of non-U.S. laws and regulations; and
- •
- General economic, political and civil conditions in these foreign markets.
Any of these factors could have a material adverse effect on our business, results of operations, financial condition or cash flows.
We operate in many different jurisdictions and we could be adversely affected by any violations of the U.S. Foreign Corrupt Practices Act or similar worldwide and local anti-corruption laws.
The U.S. Foreign Corrupt Practices Act, the U.K. Bribery Act and similar worldwide and local anti-corruption laws in other jurisdictions, generally prohibit companies and their intermediaries from making improper payments to officials for the purpose of obtaining or retaining business. Our internal policies mandate compliance with these anti-corruption laws. The policies also are applicable to agents through which we do business in certain non-U.S. jurisdictions. We operate in many parts of the world that have experienced governmental corruption to some degree, and in certain circumstances, strict compliance with anti-corruption laws may conflict with local customs and practices. Despite our training and compliance programs, we cannot assure you that our internal control policies and procedures always will protect us from improper or criminal acts committed by our employees or agents. Our continued expansion outside the U.S., including in developing countries, could increase the risk of such violations in the future. Violations of these laws, or allegations of such violations, could disrupt our business, subject us to fines, penalties and restrictions and otherwise result in a material adverse effect on our results of operations or financial condition. All of our recently acquired businesses are subject to our internal policies. However, because our internal policies are more restrictive than some local laws or customs where we operate, we may be at an increased risk for violations while we train our new employees to comply with our internal policies and procedures.
Our business sometimes requires our employees to travel to and work in high security risk countries, which may result in employee injury, repatriation costs or other unforeseen costs.
Many of our employees often travel to and work in high security risk countries around the world that are undergoing or that may undergo political, social and economic upheavals resulting in war, civil unrest, criminal activity or acts of terrorism. For example, we have had and expect to have significant projects in the Middle East and Africa, including in Afghanistan, Iraq, Libya, Egypt, Saudi Arabia, Qatar and Oman. As a result, we may be subject to costs related to employee injury, repatriation or other unforeseen circumstances. Further, circumstances in these countries could make it difficult or impossible to attract and retain qualified employees. Our inability to attract and retain qualified employees to work in these countries could have a material adverse effect on our operations.
15
We depend on government contracts for a significant portion of our consulting fee revenue. Our inability to win profitable government contracts could harm our operations and adversely affect our net earnings.
In 2016, U.S. federal government contracts and U.S. state, regional and local government contracts contributed approximately 2.2% and 21.8%, respectively, of our consulting fee revenue, and foreign government contracts contributed approximately 35.3% of our consulting fee revenue. Our inability to win profitable government contracts could harm our operations and adversely affect our net earnings. Government contracts are typically awarded through a heavily regulated procurement process. Some government contracts are awarded to multiple competitors, causing increases in overall competition and pricing pressure. In turn, the competition and pricing pressure may require us to make sustained post-award efforts to reduce costs under these contracts. If we are not successful in reducing the amount of costs, our profitability on these contracts may be negatively impacted. Also, some of our federal government contracts require U.S. government security clearances. If we or certain of our personnel were to lose these security clearances, our ability to continue performance of these contracts or to win new contracts requiring such clearances may be negatively impacted.
We depend on long-term government contracts, many of which are funded on an annual basis. If appropriations are not made in subsequent years of a multiple-year contract, we will not realize all of our potential revenue and profit from that project.
During the years ended December 31, 2016, 2015 and 2014, approximately 59.3%, 61.2% and 63.7%, respectively, of our consulting fee revenue was derived from contracts with federal, state, regional, local and foreign governments.
Most government contracts are subject to the continuing availability of legislative appropriation. Legislatures typically appropriate funds for a given program on a year-by-year basis, even though contract performance may take more than one year. As a result, at the beginning of a program, the related contract is only partially funded, and additional funding is normally committed only as appropriations are made in each subsequent fiscal year. These appropriations and the timing of payment of appropriated amounts may be influenced by, among other things, the state of the economy, budgetary and other political issues affecting the particular government and its appropriations process, competing priorities for appropriation, the timing and amount of tax receipts and the overall level of government expenditures. If appropriations are not made in subsequent years on government contracts, then we will not realize all of our potential revenue and profit from those contracts.
We depend on contracts that may be terminated by our clients on short notice, which may adversely impact our ability to recognize all of our potential revenue and profit from the projects.
Substantially all of our contracts are subject to termination by the client either at its convenience or upon our default. If one of our clients terminates a contract at its convenience, then we typically are able to recover only costs incurred or committed, settlement expenses and profit on work completed prior to termination, which could prevent us from recognizing all of our potential revenue and profit from that contract. If one of our clients terminates the contract due to our default, we could be liable for excess costs incurred by the client in re-procuring services from another source, as well as other costs.
Our contracts with governmental agencies are subject to audit, which could result in adjustments to reimbursable contract costs or, if we are charged with wrongdoing, possible temporary or permanent suspension from participating in government programs.
Our books and records are subject to audit by the various governmental agencies we serve and by their representatives. These audits can result in adjustments to reimbursable contract costs and allocated overhead. In addition, if as a result of an audit, we or one of our subsidiaries is charged with
16
wrongdoing or the government agency determines that we or one of our subsidiaries is otherwise no longer eligible for federal contracts, then we or, as applicable, that subsidiary, could be temporarily suspended or, in the event of convictions or civil judgments, could be prohibited from bidding on and receiving future government contracts for a period of time. Furthermore, as a U.S. government contractor, we are subject to an increased risk of investigations, criminal prosecution, civil fraud, whistleblower lawsuits and other legal actions and liabilities, the results of which could have a material adverse effect on our operations.
We submit change orders to our clients for work we perform beyond the scope of some of our contracts. If our clients do not approve these change orders, our net earnings could be adversely impacted.
We typically submit change orders under some of our contracts for payment for work performed beyond the initial contractual requirements. The clients may not approve or may contest these change orders and we cannot assure you that these claims will be approved in whole, in part or at all. If these claims are not approved, our net earnings could be adversely impacted.
Because our backlog of uncompleted projects under contract or awarded is subject to unexpected adjustments and cancellations, including the amount, if any, of future appropriations by the applicable contracting governmental agency, it may not be indicative of our future revenue and profits.
At December 31, 2016, our backlog of uncompleted projects under contract or awarded was approximately $831 million. The inability to obtain financing or governmental approvals, changes in economic or market conditions or other unforeseen events, such as terrorist acts or natural disasters, could lead to us not realizing any revenue under some or all of these contracts. We cannot assure you that the backlog attributed to any of our uncompleted projects under contract will be realized as revenue or, if realized, will result in profits.
Many projects may remain in our backlog for an extended period of time because of the size or long-term nature of the contract. In addition, from time to time projects are scaled back or cancelled. These types of backlog reductions adversely affect the revenue and profit that we ultimately receive. Included in our backlog is the maximum amount of all indefinite delivery/indefinite quantity ("ID/IQ"), or task order, contracts, or a lesser amount if we do not reasonably expect to be issued task orders for the maximum amount of such contracts. A significant amount of our backlog is derived from ID/IQ contracts and we cannot provide any assurance that we will in fact be awarded the maximum amount of such contracts.
Our dependence on subcontractors, partners and specialists could adversely affect our business.
We rely on third-party subcontractors as well as third-party strategic partners and specialists to complete our projects. To the extent that we cannot engage such subcontractors, partners or specialists or cannot engage them on a competitive basis, our ability to complete a project in a timely fashion or at a profit may be impaired. If we are unable to engage appropriate strategic partners or specialists in some instances, we could lose the ability to win some contracts. In addition, if a subcontractor or specialist is unable to deliver its services according to the negotiated terms for any reason, including the deterioration of its financial condition or over-commitment of its resources, we may be required to purchase the services from another source at a higher price. This may reduce the profit to be realized or result in a loss on a project for which the services were needed.
If our partners fail to perform their contractual obligations on a project, we could be exposed to legal liability, loss of reputation or reduced profits.
We sometimes enter into joint venture agreements and other contractual arrangements with outside partners to jointly bid on and execute a particular project. The success of these joint projects
17
depends on the satisfactory performance of the contractual obligations of our partners. If any of our partners fails to satisfactorily perform its contractual obligations, we may be required to make additional investments and provide additional services to complete the project. If we are unable to adequately address our partner's performance issues, then our client could terminate the joint project, exposing us to legal liability, loss of reputation or reduced profits.
The project management business is highly competitive and if we fail to compete effectively, we may miss new business opportunities or lose existing clients and our revenues may decline.
The project management industry is highly competitive. We compete for contracts, primarily on the basis of technical capability, with numerous entities, including design or engineering firms, general contractors, other "pure" construction management companies, management consulting firms and other entities. Compared to us, many of these competitors are larger, well-established companies that have broader geographic scope and greater financial and other resources. If we cannot compete effectively with our competitors, or if the costs of competing, including the costs of retaining and hiring professionals, become too expensive, our revenue growth and financial results may differ materially from our expectations.
We have acquired and may continue to acquire businesses as strategic opportunities arise and may be unable to realize the anticipated benefits of those acquisitions, or if we are unable to take advantage of strategic acquisition situations, our ability to expand our business may be slowed or curtailed.
Over the past 18 years, we have acquired 14 companies related to the Project Management business and our strategy is to continue to expand and diversify our operations with additional acquisitions as strategic opportunities arise. If the competition for acquisitions increases, or if the cost of acquiring businesses or assets becomes too expensive, the number of suitable acquisition opportunities may decline, the cost of making an acquisition may increase or we may be forced to agree to less advantageous acquisition terms for the companies that we are able to acquire. Alternatively, at the time an acquisition opportunity presents itself, internal and external pressures (including, but not limited to, borrowing capacity under our credit facilities or the availability of alternative financing), may cause us to be unable to pursue or complete an acquisition. Our ability to grow our business, particularly through acquisitions, may depend on our ability to raise capital by selling equity or debt securities or obtaining additional debt financing. There can be no assurance that we will be able to obtain financing when we need it or on terms acceptable to us.
In addition, managing the growth of our operations will require us to continually increase and improve our operational, financial and human resources management and our internal systems and controls. If we are unable to manage growth effectively or to successfully integrate acquisitions or if we are unable to grow organically, that could have a material adverse effect on our business.
Systems and information technology interruption and breaches in data security could adversely impact our ability to operate and our operating results.
As a global company, we are heavily reliant on computer, information and communications technology and related systems in order to properly operate. From time to time, we experience system interruptions and delays. In the event we are unable to regularly deploy software and hardware, effectively upgrade our systems and network infrastructure, and take other steps to improve the efficiency and effectiveness of our systems, the operation of such systems could be interrupted or delayed, or our data security could be breached. In addition, our computer and communications systems and operations could be damaged or interrupted by natural disasters, power loss, telecommunications failures, acts of war or terrorism, acts of God, computer viruses, physical or electronic security breaches. Any of these or other events could cause system interruptions, delays, and loss of critical data including private data. While we have taken steps to address these concerns by
18
implementing sophisticated network security, training and internal control measures, there can be no assurance that a system failure or loss or data security breach will not materially adversely affect our business, financial condition and operating results.
Risks Related to Ownership of Our Common Stock
We have identified material weaknesses in our internal control over financial reporting and determined that our disclosure controls and procedures were not effective which could, if not remediated, result in additional material misstatements in our financial statements.
Our management is responsible for establishing and maintaining adequate disclosure controls and procedures and internal control over our financial reporting, as defined in Rules 13a-15(e) and 13a-15(f), respectively, under the Securities Exchange Act of 1934, as amended. As disclosed in Item 9A of this Form 10-K, management identified material weaknesses in our internal control over financial reporting and determined our disclosure controls and procedures were not effective based upon our identification of certain errors related to the estimation of potential losses on our accounts receivable and ineffective procedures related to the accounting close process, accounting estimates, and non-routine transactions in addition to a newly identified material weakness related to certain tax controls. A material weakness is defined as a deficiency, or combination of significant deficiencies, in internal control over financial reporting, such that there is a more than a remote likelihood that a material misstatement of our annual or interim financial statements will not be prevented or detected on a timely basis. As a result of these material weaknesses, our management concluded that the Company did not maintain effective disclosure controls and procedures and internal control over financial reporting as of December 31, 2016.
We have developed and implemented a remediation plan designed to address these material weaknesses in internal control over financial reporting and ineffective disclosure controls and procedures. If our remedial measures are insufficient, or if additional material weaknesses or significant deficiencies in our internal controls are discovered or occur in the future, our consolidated financial statements may contain material misstatements and we could be required to restate our financial results, which could materially and adversely affect our business and results of operations or financial condition, restrict our ability to access the capital markets, require us to expend significant resources to correct the weaknesses or deficiencies, subject us to fines, penalties or judgments, harm our reputation or otherwise cause a decline in investor confidence.
Future sales of our common and preferred stock may depress the price of our common stock.
As of March 17, 2017, there were 51,859,479 shares of our common stock outstanding. An additional 6,627,473 shares of our common stock may be issued upon the exercise of options held by employees, management and directors. We also have the authority to issue up to 1,000,000 shares of preferred stock upon terms that are determined by our Board of Directors and additional options to purchase 2,077,459 shares of our common stock without stockholder approval. In addition, we have a registration statement on file with the SEC for an aggregate issuance of 20,000,000 common shares (of which 10,453,371 shares remain available for issuance), which may be used for working capital and general corporate purposes, subject to the restrictions of our Secured Credit Facilities and another registration statement on file with the SEC for an aggregate issuance of 20,000,000 common shares, (of which 18,926,804 shares remain available for issuance), which may be used in future acquisitions. Sales of a substantial number of these shares in the public market, or factors relating to the terms we may determine for our preferred stock, options or warrants, could decrease the market price of our common stock. In addition, the perception that such sales might occur may cause the market price of our common stock to decline. Future issuances or sales of our common stock could have an adverse effect on the market price of our common stock.
19
Because we have no current plans to pay cash dividends on our common stock, you may not receive any return on investment unless you sell your common stock for a price greater than that which you paid for it.
We may retain future earnings, if any, for future operations, expansion and debt repayment and have no current plans to pay any cash dividends. Any decision to declare and pay dividends in the future will be made at the discretion of our Board of Directors and will depend on, among other things, our results of operations, financial condition, cash requirements, contractual restrictions and other factors that our Board of Directors may deem relevant. In addition, our ability to pay dividends is limited by covenants of our Secured Credit Facilities and may be limited by future indebtedness incurred by us or our subsidiaries. As a result, you may not receive any return on an investment in our common stock unless you sell our common stock for a price greater than that which you paid for it.
We are able to issue shares of preferred stock with greater rights than our common stock.
Our Board of Directors is authorized to issue one or more series of preferred stock from time to time without any action on the part of our stockholders. Our Board of Directors also has the power, without stockholder approval, to set the terms of any such series of preferred stock that may be issued, including voting rights, dividend rights and preferences over our common stock with respect to dividends and other terms. If we issue preferred stock in the future that has a preference over our common stock with respect to the payment of dividends or other terms, or if we issue preferred stock with voting rights that dilute the voting power of our common stock, the rights of holders of our common stock or the market price of our common stock could be adversely affected.
Provisions in our organizational documents and Delaware law could discourage potential acquisition proposals, could delay or prevent a change in control of the Company that our stockholders may consider favorable and could adversely affect the market value of our common stock.
Provisions in our organizational documents and Delaware law could discourage potential acquisition proposals, could delay or prevent a change in control of the Company that our stockholders may consider favorable and could adversely affect the market value of our common stock. Our amended and restated certificate of incorporation and amended and restated bylaws include provisions that:
- •
- Our Board of Directors is expressly authorized to make, alter or repeal our bylaws;
- •
- Our Board of Directors is divided into three classes of service with staggered three-year terms. This means that only one class of directors
will be elected at each annual meeting of stockholders, with the other classes continuing for the remainder of their respective terms;
- •
- Our Board of Directors is authorized to issue preferred stock without stockholder approval;
- •
- Only our Board of Directors, our Chairman of the Board, our Chief Executive Officer or the holders of not less than 25% of our outstanding
common stock and entitled to vote may call a special meeting of stockholders;
- •
- Our bylaws require advance notice for stockholder proposals and director nominations;
- •
- Our bylaws limit the removal of directors and the filling of director vacancies; and
- •
- We will indemnify officers and directors against losses that may incur in connection with investigations and legal proceedings resulting from their services to us, which may include services in connection with takeover defense measures.
These provisions may make it more difficult for stockholders to take specific corporate actions and could have the effect of delaying or preventing a change in control of the Company.
20
In addition, Section 203 of the Delaware General Corporation Law imposes certain restrictions on mergers and other business combinations between the Company and any holder of 15% or more of our outstanding common stock. This provision is applicable to Hill and may have an anti-takeover effect that may delay, defer or prevent a tender offer or takeover attempt that a stockholder might consider in the stockholder's best interest. In general, Section 203 could delay for three years and impose conditions upon "business combinations" between an "interested shareholder" and Hill, unless prior approval by our Board of Directors is given. The term "business combination" is defined broadly to include mergers, asset sales and other transactions resulting in financial benefit to a stockholder. An "interested shareholder," in general, would be a person who, together with affiliates and associates, owns or within three years did own, 15% or more of a corporation's voting stock.
A small group of stockholders own a large quantity of our common stock, thereby potentially exerting significant influence over the Company.
As of December 31, 2016, Irvin E. Richter, David L. Richter and other members of the Richter family beneficially owned approximately 20.5% of our common stock. This concentration of ownership could significantly influence matters requiring stockholder approval and could delay, deter or prevent a change in control of the Company or other business combinations that might otherwise be beneficial to our other stockholders. Accordingly, this concentration of ownership may impact the market price of our common stock. In addition, the interest of our significant stockholders may not always coincide with the interest of the Company's other stockholders. In deciding how to vote on such matters, they may be influenced by interests that conflict with our other stockholders.
Item 1B. Unresolved Staff Comments.
None.
Our executive and certain operating offices are currently located at One Commerce Square, 2005 Market Street, 17th Floor, Philadelphia, Pennsylvania 19103. We lease all of our office space and do not own any real property. The telephone number at our executive office is (215) 309-7700. In addition to our executive offices, we have approximately 100 operating leases for office facilities throughout the world. Due to acquisition and growth we may have more than one operating lease in the cities in which we are located. Additional space may be required as our business expands geographically, but we believe we will be able to obtain suitable space as needed.
21
As of March 17, 2017, our principal worldwide office locations and the geographic regions in which we reflect their operations are:
| U.S./Canada Albuquerque, NM Atlanta, GA Austin, TX Baltimore, MD Bensalem, PA Boston, MA Broadview Heights, OH Columbus, OH East Hartford, CT Fresno, CA Granite Bay, CA Houston, TX Irvine, CA Irving, TX Jacksonville, FL Las Vegas, NV Lemont Furnace, PA Los Angeles, CA Miami, FL Mission Viejo, CA New York, NY Ontario, CA Orlando, FL Perrysburg, OH Philadelphia, PA (Headquarters) Phoenix, AZ Pittsburgh, PA Providence, RI San Diego, CA San Francisco, CA Seattle, WA Spokane, WA Tampa, FL Toronto, Canada Woodbridge, NJ Washington, DC |
Europe Amsterdam, Netherlands Athens, Greece Baku, Azerbaijan Barcelona, Spain Belgrade, Serbia Birmingham, UK Bucharest, Romania Cumbria, UK Daresbury, UK Dundee, UK Dusseldorf, Germany Edinburgh, UK Frankfurt, Germany Geneva, Switzerland Glasgow, UK Hamburge, Germany Istanbul, Turkey Lisbon, Portugal London, UK Luxembourg Madrid, Spain Manchester, UK Munich, Germany Pristina, Kosovo Riga, Latvia Teesdale, UK Warsaw, Poland Latin America/ the Caribbean Bogota, Colombia Mexico City, Mexico Rio de Janeiro, Brazil Sao Paulo, Brazil Trinidad and Tobago |
Middle East Abu Dhabi, UAE Amman, Jordan Aqaba, Jordan Baghdad, Iraq Doha, Qatar Dubai, UAE Jeddah, Saudi Arabia Kuwait City, Kuwait Manama, Bahrain Muscat, Oman Riyadh, Saudi Arabia Africa Algiers, Algeria Cairo, Egypt Cape Town, South Africa Casablanca, Morocco Johannesburg, South Africa Tripoli, Libya Asia/Pacific Almaty, Kazakhstan Astana City, Kazakhstan Beijing, China Brisbane, Australia Danang City, Vietnam Gurgaon, India Hong Kong, China Jakarta, Indonesia Kabul, Afghanistan Kuala Lumpur, Malaysia Manila, Philippines Melbourne, Australia Perth, Australia Shanghai, China Singapore Sydney, Australia |
General Litigation
Knowles Limited ("Knowles"), a subsidiary of the Company's Construction Claims Group, is a party to an arbitration proceeding instituted on July 8, 2014 in which Knowles claimed that it was entitled to payment for services rendered to Celtic Bioenergy Limited ("Celtic"). The arbitrator decided in favor of Knowles. The arbitrator's award was appealed by Celtic to the U.K. High Court of Justice, Queen's Bench Division, Technology and Construction Court ("Court"). On March 16, 2017, the Court (1) determined that certain relevant facts had been deliberately withheld from the arbitrator
22
by an employee of Knowles and (2) remitted the challenged parts of the arbitrator's award back to the arbitrator to consider the award in possession of the full facts. The Company is evaluating the impact of the judgment of the Court.
From time to time, the Company is a defendant or plaintiff in various legal actions which arise in the normal course of business. As such the Company is required to assess the likelihood of any adverse outcomes to these matters as well as potential ranges of probable losses. A determination of the amount of the provision required for these commitments and contingencies, if any, which would be charged to earnings, is made after careful analysis of each matter. The provision may change in the future due to new developments or changes in circumstances. Changes in the provision could increase or decrease the Company's earnings in the period the changes are made. It is the opinion of management, after consultation with legal counsel, that the ultimate resolution of these matters will not have a material adverse effect on the Company's financial condition, results of operations or cash flows.
Item 4. Mine Safety Disclosures.
Not applicable.
23
Item 5. Market for Registrant's Common Equity, Related Stockholder Matters and Issuer Purchases of Equity Securities.
Market Information
Our common stock is traded on the New York Stock Exchange ("NYSE") under the trading symbol "HIL." The following table includes the range of high and low trading prices for our common stock as reported on the NYSE for the periods presented.
| |
Price Range | ||||||
|---|---|---|---|---|---|---|---|
| |
High | Low | |||||
2016 |
|||||||
Fourth Quarter |
$ | 4.62 | $ | 1.95 | |||
Third Quarter |
4.64 | 3.96 | |||||
Second Quarter |
4.68 | 3.20 | |||||
First Quarter |
4.07 | 2.62 | |||||
2015 |
|||||||
Fourth Quarter |
$ | 4.02 | $ | 3.11 | |||
Third Quarter |
5.38 | 3.20 | |||||
Second Quarter |
5.50 | 3.49 | |||||
First Quarter |
4.38 | 3.26 | |||||
Stockholders
As of December 31, 2016, there were 90 holders of record of our common stock. However, a single record stockholder account may represent multiple beneficial owners, including owners of shares in street name accounts. We believe there are approximately 5,000 beneficial owners of our common stock.
Dividends
We have not paid any dividends on our common stock. The payment of dividends in the future will be contingent upon our earnings, if any, capital requirements and general financial condition of our business. Our Secured Credit Facilities currently limit the payment of dividends.
Securities Authorized for Issuance under Equity Compensation Plans
The table setting forth this information is included in Part III—Item 12. Security Ownership of Certain Beneficial Owners and Management and Related Stockholder Matters.
Recent Sales of Unregistered Securities
None.
Performance Graph
The performance graph and table below compare the cumulative total return of our common stock for the period from December 31, 2011 to December 31, 2016 with the comparable cumulative total returns of the Russell 2000 Index (of which the Company is a component stock) and a peer group which consists of the following ten companies: AECOM (ACM), CDI Corp. (CDI), Fluor Corporation (FLR), Granite Construction Incorporated (GVA), Jacobs Engineering Group Inc. (JEC), KBR, Inc. (KBR), NV5 Global, Inc. (NVEE), TRC Companies Inc. (TRR), Tutor Perini Corporation (TPC), and
24
Tetra Tech, Inc. (TTEK). For 2016, we changed our peer group to consist of only construction companies. In prior years, the peer group consisted of a blend of construction companies and consulting companies.
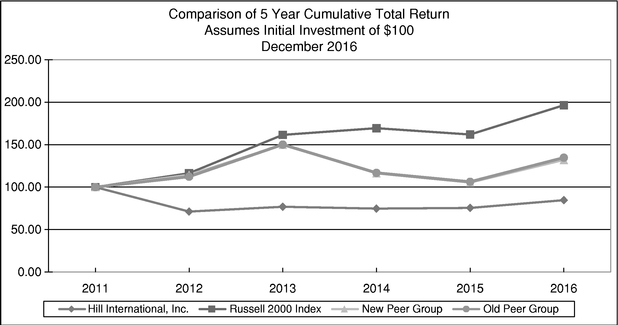
| |
2011 | 2012 | 2013 | 2014 | 2015 | 2016 | |||||||||||||
|---|---|---|---|---|---|---|---|---|---|---|---|---|---|---|---|---|---|---|---|
Hill International, Inc. |
$ | 100.00 | $ | 71.21 | $ | 76.85 | $ | 74.71 | $ | 75.49 | $ | 84.63 | |||||||
Russell 2000 Index |
100.00 | 116.35 | 161.52 | 169.42 | 161.95 | 196.45 | |||||||||||||
Peer Group |
100.00 | 114.46 | 149.81 | 116.27 | 105.39 | 132.04 | |||||||||||||
Old Peer Group |
100.00 | 112.30 | 150.15 | 116.81 | 106.25 | 134.70 | |||||||||||||
25
Item 6. Selected Financial Data.
The following is selected financial data from our audited consolidated financial statements for each of the last five years. This data should be read in conjunction with our consolidated financial statements (and related notes) appearing in Item 8 of this report and with Item 7, "Management's Discussion and Analysis of Financial Condition and Results of Operations." On December 20, 2016, we entered into a definitive Stock Purchase Agreement to sell our Construction Claims Group, which is reported as discontinued operations for each year presented. See Note 3 to our consolidated financial statements for additional information. The data presented below is in thousands, except for (loss) earnings per share data.
| |
Years Ended December 31, | |||||||||||||||
|---|---|---|---|---|---|---|---|---|---|---|---|---|---|---|---|---|
| |
2016 | 2015 | 2014 | 2013 | 2012 | |||||||||||
Income Statement Data: |
||||||||||||||||
Consulting fee revenue |
$ | 434,147 | $ | 467,877 | $ | 428,827 | $ | 392,602 | $ | 312,232 | ||||||
Reimbursable expenses |
86,700 | 84,699 | 58,927 | 59,915 | 60,049 | |||||||||||
| | | | | | | | | | | | | | | | | |
Total revenue |
520,847 | 552,576 | 487,754 | 452,517 | 372,281 | |||||||||||
| | | | | | | | | | | | | | | | | |
Cost of services |
272,243 | 288,845 | 263,806 | 244,003 | 192,592 | |||||||||||
Reimbursable expenses |
86,700 | 84,699 | 58,927 | 59,915 | 60,049 | |||||||||||
| | | | | | | | | | | | | | | | | |
Total direct expenses |
358,943 | 373,544 | 322,733 | 303,918 | 252,641 | |||||||||||
| | | | | | | | | | | | | | | | | |
Gross profit |
161,904 | 179,032 | 165,021 | 148,599 | 119,640 | |||||||||||
Selling, general and administrative expenses |
162,721 |
159,691 |
142,079 |
126,072 |
171,013 |
|||||||||||
Share of loss of equity method affiliates |
37 | 237 | — | — | — | |||||||||||
| | | | | | | | | | | | | | | | | |
Operating (loss) profit |
(854 | ) | 19,104 | 22,942 | 22,527 | (51,373 | ) | |||||||||
Interest and related financing fees, net |
694 | 2,026 | 1,564 | 1,841 | 2,353 | |||||||||||
| | | | | | | | | | | | | | | | | |
(Loss) earnings before income taxes |
(1,548 | ) | 17,078 | 21,378 | 20,686 | (53,726 | ) | |||||||||
Income tax expense |
6,068 | 6,465 | 7,512 | 4,558 | 12,388 | |||||||||||
| | | | | | | | | | | | | | | | | |
(Loss) earnings from continuing operations |
(7,616 | ) | 10,613 | 13,866 | 16,128 | (66,114 | ) | |||||||||
Loss from discontinued operations |
(11,076 | ) | (2,874 | ) | (18,713 | ) | (10,644 | ) | (8,780 | ) | ||||||
| | | | | | | | | | | | | | | | | |
Net (loss) earnings |
(18,692 | ) | 7,739 | (4,847 | ) | 5,484 | (74,894 | ) | ||||||||
Less: net earnings—noncontrolling interests |
136 | 808 | 1,301 | 1,922 | 1,872 | |||||||||||
| | | | | | | | | | | | | | | | | |
Net (loss) earnings attributable to Hill International, Inc. |
$ | (18,828 | ) | $ | 6,931 | $ | (6,148 | ) | $ | 3,562 | $ | (76,766 | ) | |||
| | | | | | | | | | | | | | | | | |
| | | | | | | | | | | | | | | | | |
| | | | | | | | | | | | | | | | | |
Basic (loss) earnings per common share from continuing operations |
$ | (0.15 | ) | $ | 0.20 | $ | 0.28 | $ | 0.36 | $ | (1.76 | ) | ||||
Basic (loss) per common share from discontinued operations |
(0.21 | ) | (0.06 | ) | (0.42 | ) | (0.27 | ) | (0.23 | ) | ||||||
| | | | | | | | | | | | | | | | | |
Basic (loss) earnings per common share—Hill International, Inc. |
$ | (0.36 | ) | $ | 0.14 | $ | (0.14 | ) | $ | 0.09 | $ | (1.99 | ) | |||
| | | | | | | | | | | | | | | | | |
| | | | | | | | | | | | | | | | | |
| | | | | | | | | | | | | | | | | |
Basic weighted average common shares outstanding |
51,724 | 50,874 | 44,370 | 39,098 | 38,500 | |||||||||||
| | | | | | | | | | | | | | | | | |
| | | | | | | | | | | | | | | | | |
| | | | | | | | | | | | | | | | | |
Diluted (loss) earnings per common share from continuing operations |
$ | (0.15 | ) | $ | 0.20 | $ | 0.28 | $ | 0.36 | $ | (1.76 | ) | ||||
Diluted (loss) per common share from discontinued operations |
(0.21 | ) | (0.06 | ) | (0.42 | ) | (0.27 | ) | (0.23 | ) | ||||||
| | | | | | | | | | | | | | | | | |
Diluted (loss) earnings per common share—Hill International, Inc. |
$ | (0.36 | ) | $ | 0.14 | $ | (0.14 | ) | $ | 0.09 | $ | (1.99 | ) | |||
| | | | | | | | | | | | | | | | | |
| | | | | | | | | | | | | | | | | |
| | | | | | | | | | | | | | | | | |
Diluted weighted average common shares outstanding |
51,724 | 51,311 | 44,370 | 39,322 | 38,500 | |||||||||||
| | | | | | | | | | | | | | | | | |
| | | | | | | | | | | | | | | | | |
| | | | | | | | | | | | | | | | | |
26
| |
Years Ended December 31, | |||||||||||||||
|---|---|---|---|---|---|---|---|---|---|---|---|---|---|---|---|---|
| |
2016 | 2015 | 2014 | 2013 | 2012 | |||||||||||
Discontinued Operations Data(1): |
||||||||||||||||
Consulting fee revenue |
$ | 164,478 | $ | 163,074 | $ | 148,290 | $ | 119,483 | $ | 105,366 | ||||||
Operating profit |
6,517 | (2) | 11,740 | 10,996 | 12,171 | 8,071 | ||||||||||
Interest and related financing fees, net |
12,932 | 12,637 | 28,921 | 21,023 | 15,797 | |||||||||||
(Loss) before income taxes |
(6,415 | ) | (897 | ) | (17,925 | ) | (8,852 | ) | (7,726 | ) | ||||||
Loss from discontinued operations |
(11,076 | ) | (2,874 | ) | (18,713 | ) | (10,644 | ) | (8,780 | ) | ||||||
- (1)
- See
Note 3 to our consolidated financial statements for further information regarding this statement.
- (2)
- There were significant expenses totaling $5,150,000 that adversly affected discontinued operations for 2016. The expenses consisted of $3,044,000 of legal and other professional fees related to the pending sale and $2,106,000 related to certain tax matters in foreign jurisdictions.
| |
As of December 31, | |||||||||||||||
|---|---|---|---|---|---|---|---|---|---|---|---|---|---|---|---|---|
| |
2016 | 2015 | 2014 | 2013 | 2012 | |||||||||||
Selected Balance Sheet Data: |
||||||||||||||||
Cash and cash equivalents |
$ | 25,637 | $ | 24,089 | $ | 30,124 | $ | 30,381 | $ | 16,716 | ||||||
Accounts receivable, net |
164,554 | 187,553 | 145,330 | 128,241 | 109,440 | |||||||||||
Current assets held for sale |
54,144 | 60,092 | 53,393 | 51,071 | 45,557 | |||||||||||
Current assets |
266,171 | 291,591 | 256,589 | 238,298 | 194,582 | |||||||||||
Noncurrent assets held for sale |
33,298 | 36,608 | 39,126 | 38,588 | 39,427 | |||||||||||
Total assets |
401,208 | 428,746 | 412,897 | 393,476 | 363,905 | |||||||||||
Current liabilities held for sale |
27,703 | 27,497 | 28,779 | 22,258 | 17,550 | |||||||||||
Current liabilities |
140,104 | 143,048 | 139,244 | 139,124 | 138,082 | |||||||||||
Noncurrent liabilities held for sale |
4,679 | 6,403 | 4,326 | 4,043 | 4,551 | |||||||||||
Total debt |
144,103 | 144,983 | 121,524 | 131,235 | 106,704 | |||||||||||
Stockholders' equity: |
||||||||||||||||
Hill International, Inc. share of equity |
$ | 88,370 | $ | 113,969 | $ | 113,288 | $ | 84,969 | $ | 78,997 | ||||||
Noncontrolling interests |
2,016 | 4,070 | 8,712 | 11,887 | 13,557 | |||||||||||
| | | | | | | | | | | | | | | | | |
Total equity |
$ | 90,386 | $ | 118,039 | $ | 122,000 | $ | 96,856 | $ | 92,554 | ||||||
| | | | | | | | | | | | | | | | | |
| | | | | | | | | | | | | | | | | |
| | | | | | | | | | | | | | | | | |
27
Item 7. Management's Discussion and Analysis of Financial Condition and Results of Operations.
Overview
On December 20, 2016, we entered into a definitive Stock Purchase Agreement to sell our Construction Claims Group, which is reported herein as discontinued operations. This transaction will permit us to better focus on our Project Management business. See Note 3 to our consolidated financial statements for a description of the transaction.
Our revenue consists of two components: consulting fee revenue ("CFR") and reimbursable expenses. Reimbursable expenses are reflected in equal amounts in both total revenue and total direct expenses. Because these pass-through revenue/costs are subject to significant fluctuation from year to year, we measure the performance of many of our key operating metrics as a percentage of CFR, as we believe that this is a better and more consistent measure of operating performance than total revenue.
Over the years, the amount of CFR attributable to operations in the Middle East and Africa has grown to approximately 52.0% of total consolidated CFR in 2016. There has been significant political upheaval and civil unrest in certain parts of this region, most notably in Libya and Iraq where we previously had substantial operations. In 2012, we reserved a $59,937,000 receivable from the Libyan Organization for Development of Administrative Centres ("ODAC"). Subsequently, we have received payments totaling approximately $9,511,000, but this situation with ODAC put a considerable strain on our liquidity. In 2016, we established reserves of $5,100,000 against accounts receivable from various projects in Iraq. As a result, we have had to rely heavily on debt and equity transactions to fund our operations.
We have recently seen further slowing of collections from our clients in the Middle East, primarily in Oman. In 2012, we commenced operations on the Muscat International Airport (the "Oman Airport") project with the Ministry of Transport and Communications ("MOTC"). The original contract term was to expire in November 2014. In October 2014, we applied for a twelve-month extension of time ("first extension") (which was subsequently approved in March 2016) and we continued to work on the Oman Airport projects. The Company began to experience delays in payment during 2015. In December 2015, the Company began discussions with MOTC on a second extension of time amendment ("second extension") and has since commenced additional work. When MOTC resumed payments in 2016, the Company received approximately $42,000,000 during the year. At December 31, 2016, accounts receivable from Oman totaled approximately $27,132,000 and approximately $16,500,000 was past due based on contractual terms. We acknowledge that this client is a slow payer, however the MOTC intends to meet its obligations to us as Oman is a wealthy, stable and solvent country. In connection with the work performed there, our consolidated financial statements for the years ended December 31, 2016, 2015 and 2014 reflected the following (in thousands):
| |
2016 | 2015 | 2014 | |||||||
|---|---|---|---|---|---|---|---|---|---|---|
Consulting fee revenue |
$ | 34,245 | $ | 50,740 | $ | 62,585 | ||||
Accounts receivable, net |
$ | 27,132 | (1) | $ | 28,711 | $ | 11,571 | |||
Collections received during the year |
$ | 42,000 | $ | 29,958 | $ | 53,277 | ||||
- (1)
- We received payments of approximately $6,153,000 against this receivable in the first quarter of 2017.
Going forward, we will continue to closely monitor this receivable as well as any other receivables where collections are not received in a timely manner. This may result in increases in the allowance for doubtful accounts which may have a significant negative impact on our financial position and results of operations.
28
2016 Business Overview
Consolidated Results
(In thousands)
| |
Years Ended December 31, |
Change | |||||||||||
|---|---|---|---|---|---|---|---|---|---|---|---|---|---|
| |
2016 | 2015 | $ | % | |||||||||
Income Statement Data: |
|||||||||||||
Consulting fee revenue |
$ | 434,147 | $ | 467,877 | (33,730 | ) | (7.2 | )% | |||||
Reimbursable expenses |
86,700 | 84,699 | 2,001 | 2.4 | % | ||||||||
| | | | | | | | | | | | | | |
Total revenue |
520,847 | 552,576 | (31,729 | ) | (5.7 | )% | |||||||
| | | | | | | | | | | | | | |
Cost of services |
272,243 | 288,845 | (16,602 | ) | (5.7 | )% | |||||||
Reimbursable expenses |
86,700 | 84,699 | 2,001 | 2.4 | % | ||||||||
| | | | | | | | | | | | | | |
Total direct expenses |
358,943 | 373,544 | (14,601 | ) | (3.9 | )% | |||||||
| | | | | | | | | | | | | | |
Gross profit |
161,904 | 179,032 | (17,128 | ) | (9.6 | )% | |||||||
Selling, general and administrative expenses |
162,721 |
159,691 |
3,030 |
1.9 |
% |
||||||||
Equity in loss of affiliates |
37 | 237 | (200 | ) | |||||||||
| | | | | | | | | | | | | | |
Operating (loss) profit |
(854 | ) | 19,104 | (19,958 | ) | (104.5 | )% | ||||||
Interest and related financing fees, net |
694 | 2,026 | (1,332 | ) | (65.7 | )% | |||||||
| | | | | | | | | | | | | | |
(Loss) earnings before income taxes |
(1,548 | ) | 17,078 | (18,626 | ) | (109.1 | )% | ||||||
Income tax expense |
6,068 | 6,465 | (397 | ) | (6.1 | )% | |||||||
| | | | | | | | | | | | | | |
(Loss) earnings from continuing operations |
(7,616 | ) | 10,613 | (18,229 | ) | (171.8 | )% | ||||||
(Loss) from discontinued operations |
(11,076 | ) | (2,874 | ) | (8,202 | ) | 285.4 | % | |||||
| | | | | | | | | | | | | | |
Net (loss) earnings |
(18,692 | ) | 7,739 | (26,431 | ) | (341.5 | )% | ||||||
Less: net earnings—noncontrolling interests |
136 | 808 | (672 | ) | (83.2 | )% | |||||||
| | | | | | | | | | | | | | |
Net (loss) earnings attributable to Hill International, Inc. |
$ | (18,828 | ) | $ | 6,931 | (25,759 | ) | (371.6 | )% | ||||
| | | | | | | | | | | | | | |
| | | | | | | | | | | | | | |
| | | | | | | | | | | | | | |
CFR decreased $33,730,000, or 7.2%, to $434,147,000 in 2016. The primary decrease in CFR occurred in the Middle East as economic conditions caused a decrease in project activity and a decrease in Oman as a major project began to wind down.
Cost of services decreased $16,602,000, or 5.7%, to $272,243,000 in 2016 primarily due to decreases in the Middle East partially offset by increases in the United States.
Gross profit decreased $17,128,000, or 9.6%, to $161,904,000 in 2016 due to lower margins, in both dollars and percentages, primarily in the Middle East.
Selling, general and administrative ("SG&A") expenses increased $3,030,000, or 1.9%, primarily due to increased bad debt expense of $8,193,000, partially offset by a decrease in unapplied and indirect labor cost in Brazil and Spain.
Operating loss was ($854,000) in 2016 compared to an operating profit of $19,104,000 in 2015. The decrease in operating profit was primarily due to the decrease in CFR and the increase in bad debt expense in the Middle East, partially offset by an increase in operating profit in the United States.
Income tax expense was $6,068,000 for 2016 compared to $6,465,000 for 2015. The increase in expense results from increased pretax profits from foreign operations, the mix of tax rates in those jurisdictions and no offsetting tax benefits arising from the Company's U.S. net operating losses which management believes the Company will not be able to utilize.
29
Net loss attributable to Hill was ($18,828,000) in 2016 compared to net earnings of $6,931,000 in 2015. Diluted loss per common share was ($0.36) in 2016 based upon 51,724,000 diluted common shares outstanding compared to net earnings per diluted common share of $0.13 in 2015 based upon 51,311,000 diluted common shares outstanding. Diluted loss per common share from continuing operations in 2016 was ($0.15) compared to diluted earnings per share from continuing operations in 2015 of $0.19.
Despite the drop in global oil prices and its negative impact on the construction industry, particularly in the Middle East, we remain optimistic about maintaining our current growth strategy to pursue new business development opportunities, continue to take advantage of organic growth opportunities, continue to pursue selective acquisitions and strengthen our professional resources. In addition, in the latter part of 2016, we initiated a review of our corporate and operational overhead cost structure. The areas that will be most affected will be overhead personnel and related benefits and expenses. We believe these efforts combined with the sale of the pending sale of the Construction Claims Group and deleveraging of our balance sheet should significantly improve profitability and shareholder value.
Critical Accounting Policies and Estimates
Our consolidated financial statements contained in this Annual Report on Form 10-K were prepared in accordance with U.S. generally accepted accounting principles. While there are a number of accounting policies, methods and estimates that affect the consolidated financial statements as described in Note 4 to the consolidated financial statements, areas that are particularly significant are discussed below. We believe our assumptions are reasonable and appropriate, however actual results may be materially different than estimated.
Revenue Recognition
We generate revenue primarily from providing professional services to our clients. Revenue is generally recognized upon the performance of services. In providing these services, we may incur reimbursable expenses, which consist of amounts paid to subcontractors and other third parties as well as travel and other job related expenses that are contractually reimbursable from clients. We will include reimbursable expenses in computing and reporting our total contract revenue as long as we remain responsible to the client for the fulfillment of the contract and for the overall acceptability of all services provided.
We earn our revenue from cost-plus, fixed-price and time-and-materials contracts. If estimated total costs on any contract indicate a loss, we charge the entire estimated loss to operations in the period the loss becomes known. The cumulative effect of revisions to revenue, estimated costs to complete contracts, including penalties, incentive awards, change orders, claims, anticipated losses, and other effects are recorded in the accounting period in which the events indicating a loss are known and the loss can be reasonably estimated. Such revisions could occur at any time and the effects may be material. The majority of our contracts are for work where we bill the client monthly at hourly billing rates. The hourly billing rates are determined by contract terms. For governmental clients, the hourly rates are generally calculated as either (i) a negotiated multiplier of our direct labor costs or (ii) as direct labor costs plus overhead costs plus a negotiated profit percentage. For commercial clients, the hourly rates are generally taken from a standard fee schedule by staff classification or they can be at a negotiated discount from this schedule. In some cases, primarily for foreign work, a fixed monthly staff rate is negotiated rather than an hourly rate. This monthly rate is determined based upon a buildup of direct labor costs plus overhead and profit. We account for these contracts on a time-and-expenses method, recognizing revenue as costs are incurred.
30
We account for fixed-price contracts on the "percentage-of-completion" method, wherein revenue is recognized as costs are incurred. Under the percentage-of-completion method for revenue recognition, we estimate the progress towards completion to determine the amount of revenue and profit to be recognized. We generally utilize a cost-to-cost approach in applying the percentage-of-completion method, where revenue is earned in proportion to total costs incurred divided by total costs expected to be incurred.
Under the percentage-of-completion method, recognition of profit is dependent upon the accuracy of estimates. We have a history of making reasonably dependable estimates of contract revenue, the extent of progress towards completion and contract completion costs on our long-term construction management contracts. However, due to uncertainties inherent in the estimation process, it is possible that actual completion costs may vary from estimates.
Allowance for Doubtful Accounts
We make ongoing estimates relating to the collectability of our accounts receivable and maintain an allowance for estimated losses resulting from the inability of our clients to make required payments. Estimates used in determining accounts receivable allowances are based on our evaluation of specific client accounts and contracts involved and the financial condition of our clients. The factors we consider in our evaluations include, but are not limited to, client type (U.S. federal and other national governments, state and local governments or private sector), historical contract performance, historical collection and delinquency trends, client credit worthiness, and general economic and political conditions. At December 31, 2016 and 2015, the allowance for doubtful accounts was $71,081,700 and $60,535,000, respectively.
Goodwill and Acquired Intangible Assets
Goodwill is tested annually for impairment in our third fiscal quarter or more frequently if events or circumstances indicate that there may be impairment. We have determined that, with the pending sale of our Construction Claims Group, we now operate one reporting unit, the Project Management unit. We made that determination based on the similarity of the services provided, the methodologies in delivering our services and the similarity of the client base. To determine the fair value of our reporting unit, we use the market approach and the income approach, weighting the results of each approach.
Under the market approach, we determine fair value using the public company method and the quoted price method. We utilized a control premium of 30% to arrive at the preliminary fair value, and we applied a weighting of 20% to the preliminary fair value determined by using the public company method. The quoted price method is based upon the market value of the transactions of minority interests in the publicly-traded shares of the Company. We utilized a control premium of 30% to arrive at the preliminary fair value, and we applied a weighting of 50% to the preliminary fair value determined using the quoted price method.
Our calculation under the income approach utilizes our internal forecasts. In the income approach (that is, the discounted cash flow method), the projected cash flows reflect the cash flows subsequent to the sale of the reporting unit pursuant to the guidance in ASC 350 and ASC 820. Consistent with applicable literature, we include in projected cash flows any expected improvements in cash flows or other changes that, in our view, a market participant would consider and be willing to pay for (but we exclude any buyer- or entity-specific synergies). The projections are developed by us and are based upon cash flows that maximize reporting unit value by taking into account improvements that controlling-interest holders can make, but minority interest holders cannot make. These improvements include: increasing revenues, reducing operating costs, or reducing non-operating costs such as taxes. The owners of the enterprise may also increase enterprise value by reducing risk; for example, by
31
diversifying the business, improving access to capital, increasing the certainty of cash flows, or optimizing the capital structure.
We considered the factors listed above when developing the cash flows to support the income approach. Recognizing that due to elements of control incorporated into our reporting unit's forecast, we applied no control premium to our conclusion of value indicated by the discounted cash flows. In determining fair value, we applied a weighting of 30% to the preliminary fair value determined using the income approach.
With regard to weighting the conclusions rendered by the approaches utilized, we believe that the quoted price method provides the most reliable indication of value (that is, a Level 1 input); therefore, we placed the greatest emphasis upon this method assigning a 50% weighting. We also determined that the value using the discounted cash flow method (to which we assigned a 30% weighting) provided a more reliable indication of value than the public company method (to which we assigned a 20% weighting) with the relative levels of reliability contributing to the weighting accorded to each approach.
Application of the goodwill impairment test requires significant judgments including estimation of future cash flows, which is dependent on internal forecasts, estimation of the long-term rate of growth, the period over which cash flows will occur, and determination of the weighted average cost of capital, among other things. Based on the valuation as of July 1, 2016, the fair value of the Project Management unit substantially exceeded its carrying value. Changes in these estimates and assumptions could materially affect our determination of fair value and/or goodwill impairment. Changes in future market conditions, our business strategy, or other factors could impact upon the future value of our Project Management operations, which could result in future impairment charges.
At the time of the annual impairment test, the Construction Claims unit was still part of our continuing operations. Based on the valuation as of July 1, 2016, which utilized the same processes noted above, the fair value of the Construction Claims unit substantially exceeded its carrying value.
We amortize acquired intangible assets over their estimated useful lives and review the long-lived assets for impairment whenever events or changes in circumstances indicate that the related carrying amounts may not be recoverable. Determining whether impairment has occurred typically requires various estimates and assumptions, including determining which cash flows are directly related to the potentially impaired asset, the useful life over which cash flows will occur, their amount and the asset's residual value, if any. In turn, measurement of an impairment loss requires a determination of fair value, which is based on the best information available. We use internal discounted cash flow estimates, quoted market prices when available and independent appraisals, as appropriate, to determine fair value. We derive the required cash flow estimates from our historical experience and our internal business plans and apply an appropriate discount rate.
Income Taxes
We make judgments and interpretations based on enacted tax laws, published tax guidance, as well as estimates of future earnings. These judgments and interpretations affect the provision for income taxes, deferred tax assets and liabilities and the valuation allowance. We evaluate the deferred tax assets to determine on the basis of objective factors whether the net assets will be realized through future years' taxable income. In the event that actual results differ from these estimates and assessments, additional valuation allowances may be required.
We will recognize a tax benefit in the financial statements for an uncertain tax position only if management's assessment is that the position is "more likely than not" (i.e., a likelihood greater than 50 percent) to be allowed by the tax jurisdiction based solely on the technical merits of the position. The term "tax position" refers to a position in a previously filed tax return or a position expected to be taken in a future tax return that is reflected in measuring current or deferred income tax assets and liabilities for interim or annual periods.
32
Stock Options
We recognize compensation expense for all stock-based awards. These awards have included awards of common stock, deferred stock units and stock options. While fair value may be readily determinable for awards of stock and deferred stock units, market quotes are not available for long-term, nontransferable stock options because these instruments are not traded. We currently use the Black-Scholes option pricing model to estimate the fair value of options. Option valuation models require the input of highly subjective assumptions, including but not limited to stock price volatility, expected life and stock option exercise behavior.
Contingencies
Estimates are inherent in the assessment of our exposure to insurance claims that fall below policy deductibles and to litigation and other legal claims and contingencies, as well as in determining our liabilities for incurred but not reported insurance claims. Significant judgments by us and reliance on third-party experts are utilized in determining probable and/or reasonably estimable amounts to be recorded or disclosed in our financial statements. The results of any changes in accounting estimates are reflected in the financial statements of the period in which the changes are determined. We do not believe that material changes to these estimates are reasonably likely to occur.
Results of Operations
Year Ended December 31, 2016 Compared to
Year Ended December 31, 2015
Consulting Fee Revenue ("CFR") (dollars in thousands)
| |
2016 | 2015 | Change | ||||||||||||||||
|---|---|---|---|---|---|---|---|---|---|---|---|---|---|---|---|---|---|---|---|
United States |
$ | 137,528 | 31.7 | % | $ | 122,423 | 26.2 | % | $ | 15,105 | 12.3 | % | |||||||
Latin America |
18,708 | 4.3 | 26,304 | 5.6 | (7,596 | ) | (28.9 | ) | |||||||||||
Europe |
38,455 | 8.8 | 39,519 | 8.4 | (1,064 | ) | (2.7 | ) | |||||||||||
Middle East |
204,780 | 47.2 | 245,985 | 52.6 | (41,205 | ) | (16.8 | ) | |||||||||||
Africa |
20,815 | 4.8 | 20,461 | 4.4 | 354 | 1.7 | |||||||||||||
Asia/Pacific |
13,861 | 3.2 | 13,185 | 2.8 | 676 | 5.1 | |||||||||||||
| | | | | | | | | | | | | | | | | | | | |
Total |
$ | 434,147 | 100.0 | % | $ | 467,877 | 100.0 | % | $ | (33,730 | ) | (7.2 | )% | ||||||
| | | | | | | | | | | | | | | | | | | | |
| | | | | | | | | | | | | | | | | | | | |
| | | | | | | | | | | | | | | | | | | | |
The primary decrease in CFR occurred in the Middle East with decreases of $15,493,000 in the United Arab Emirates and $5,565,000 in Saudi Arabia as economic conditions caused a decrease in funding for projects and a decrease of $14,962,000 in Oman with the beginning of a wind down of a major project. The increase in CFR in the United States occurred throughout all regions. In Latin America, the decrease was primarily in Brazil where CFR decreased by $6,774,000 as the economic conditions in the region continue to reduce available work. In Europe, decreases in Romania, Azerbaijan and Luxembourg were partially offset by increases in Turkey, Germany, Serbia and Poland. In Africa, CFR was up slightly where increases in Algeria and Morocco were partially offset by a decrease in Egypt. The increase in Asia/Pacific occurred primarily in India.
33
Reimbursable Expenses (dollars in thousands)
| |
2016 | 2015 | Change | ||||||||||||||||
|---|---|---|---|---|---|---|---|---|---|---|---|---|---|---|---|---|---|---|---|
United States |
$ | 66,508 | 76.7 | % | 64,976 | 76.7 | % | $ | 1,532 | 2.4 | % | ||||||||
Latin America |
66 | 0.1 | 47 | 0.1 | 19 | 40.4 | |||||||||||||
Europe |
2,787 | 3.2 | 3,394 | 4.0 | (607 | ) | (17.9 | ) | |||||||||||
Middle East |
13,095 | 15.1 | 9,912 | 11.7 | 3,183 | 32.1 | |||||||||||||
Africa |
3,222 | 3.7 | 3,474 | 4.1 | (252 | ) | (7.3 | ) | |||||||||||
Asia/Pacific |
1,022 | 1.2 | 2,896 | 3.4 | (1,874 | ) | (64.7 | ) | |||||||||||
| | | | | | | | | | | | | | | | | | | | |
Total |
$ | 86,700 | 100.0 | % | $ | 84,699 | 100.0 | % | $ | 2,001 | 2.4 | % | |||||||
| | | | | | | | | | | | | | | | | | | | |
| | | | | | | | | | | | | | | | | | | | |
| | | | | | | | | | | | | | | | | | | | |
Reimbursable expenses consist of amounts paid to subcontractors and other third parties, and travel and other job-related expenses that are contractually reimbursable from clients. These items are reflected as separate line items in both our revenue and cost of services captions in our consolidated statements of operations. The increase in reimbursable expenses is primarily due to increased use of subcontractors in our Mid-Atlantic region and Qatar.
Cost of Services (dollars in thousands)
| |
2016 | 2015 | Change | ||||||||||||||||||||||
|---|---|---|---|---|---|---|---|---|---|---|---|---|---|---|---|---|---|---|---|---|---|---|---|---|---|
| |
|
|
% of CFR |
|
|
% of CFR |
|
|
|||||||||||||||||
United States |
$ | 77,065 | 28.3 | % | 56.0 | % | $ | 67,060 | 23.2 | % | 54.8 | % | $ | 10,005 | 14.9 | % | |||||||||
Latin America |
11,405 | 4.2 | 61.0 | 15,230 | 5.3 | 57.9 | (3,825 | ) | (25.1 | ) | |||||||||||||||
Europe |
24,809 | 9.1 | 64.5 | 25,578 | 8.9 | 64.7 | (769 | ) | (3.0 | ) | |||||||||||||||
Middle East |
140,438 | 51.6 | 68.6 | 161,464 | 55.9 | 65.6 | (21,026 | ) | (13.0 | ) | |||||||||||||||
Africa |
12,045 | 4.4 | 57.9 | 13,292 | 4.6 | 65.0 | (1,247 | ) | (9.4 | ) | |||||||||||||||
Asia/Pacific |
6,481 | 2.4 | 46.8 | 6,221 | 2.1 | 47.2 | 260 | 4.2 | |||||||||||||||||
| | | | | | | | | | | | | | | | | | | | | | | | | | |
Total |
$ | 272,243 | 100.0 | % | 62.7 | % | $ | 288,845 | 100.0 | % | 61.7 | % | $ | (16,602 | ) | (5.7 | )% | ||||||||
| | | | | | | | | | | | | | | | | | | | | | | | | | |
| | | | | | | | | | | | | | | | | | | | | | | | | | |
| | | | | | | | | | | | | | | | | | | | | | | | | | |
Cost of services consists of labor expenses for time charged directly to contracts and non-reimbursable job-related travel and out-of-pocket expenses. The decrease in cost of services is primarily due to decreases in the Middle East direct labor due to lower CFR partially offset by increased direct labor in the United States supporting increased CFR.
Gross Profit (dollars in thousands)
| |
2016 | 2015 | Change | ||||||||||||||||||||||
|---|---|---|---|---|---|---|---|---|---|---|---|---|---|---|---|---|---|---|---|---|---|---|---|---|---|
| |
|
|
% of CFR |
|
|
% of CFR |
|
|
|||||||||||||||||
United States |
$ | 60,463 | 37.3 | % | 44.0 | % | $ | 55,363 | 30.9 | % | 45.2 | % | $ | 5,100 | 9.2 | % | |||||||||
Latin America |
7,303 | 4.5 | 39.0 | 11,074 | 6.2 | 42.1 | (3,771 | ) | (34.1 | ) | |||||||||||||||
Europe |
13,646 | 8.4 | 35.5 | 13,941 | 7.8 | 35.3 | (295 | ) | (2.1 | ) | |||||||||||||||
Middle East |
64,342 | 39.7 | 31.4 | 84,521 | 47.2 | 34.4 | (20,179 | ) | (23.9 | ) | |||||||||||||||
Africa |
8,770 | 5.4 | 42.1 | 7,169 | 4.0 | 35.0 | 1,601 | 22.3 | |||||||||||||||||
Asia/Pacific |
7,380 | 4.6 | 53.2 | 6,964 | 3.9 | 52.8 | 416 | 6.0 | |||||||||||||||||
| | | | | | | | | | | | | | | | | | | | | | | | | | |
Total |
$ | 161,904 | 100.0 | % | 37.3 | % | $ | 179,032 | 100.0 | % | 38.3 | % | $ | (17,128 | ) | (9.6 | )% | ||||||||
| | | | | | | | | | | | | | | | | | | | | | | | | | |
| | | | | | | | | | | | | | | | | | | | | | | | | | |
| | | | | | | | | | | | | | | | | | | | | | | | | | |
34
The decrease in gross profit included decreases in the Middle East and Latin America due to the decreases in CFR partially offset by increases in the United States. The overall gross profit percentage decreased due to lower margins primarily in the United Arab Emirates, Oman and Qatar.
Selling, General and Administrative ("SG&A") Expenses (dollars in thousands)
| |
2016 | 2015 | Change | ||||||||||||||||||||||
|---|---|---|---|---|---|---|---|---|---|---|---|---|---|---|---|---|---|---|---|---|---|---|---|---|---|
| |
|
|
% of CFR |
|
|
% of CFR |
|
|
|||||||||||||||||
United States |
$ | 42,482 | 26.1 | % | 9.8 | % | $ | 40,904 | 25.6 | % | 8.7 | % | $ | 1,578 | 3.9 | % | |||||||||
Latin America |
8,990 | 5.5 | 2.1 | 9,765 | 6.1 | 2.1 | (775 | ) | (7.9 | ) | |||||||||||||||
Europe |
18,292 | 11.2 | 4.2 | 20,253 | 12.7 | 4.3 | (1,961 | ) | (9.7 | ) | |||||||||||||||
Middle East |
44,233 | 27.2 | 10.2 | 40,729 | 25.5 | 8.7 | 3,504 | 8.6 | |||||||||||||||||
Africa |
6,807 | 4.2 | 1.6 | 6,347 | 4.0 | 1.4 | 460 | 7.2 | |||||||||||||||||
Asia/Pacific |
5,666 | 3.5 | 1.3 | 4,877 | 3.1 | 1.0 | 789 | 16.2 | |||||||||||||||||
Corporate Expenses |
36,251 | 22.3 | 8.3 | 36,816 | 23.1 | 7.9 | (565 | ) | (1.5 | ) | |||||||||||||||
| | | | | | | | | | | | | | | | | | | | | | | | | | |
Total |
$ | 162,721 | 100.0 | % | 37.5 | % | $ | 159,691 | 100.0 | % | 34.1 | % | $ | 3,030 | 1.9 | % | |||||||||
| | | | | | | | | | | | | | | | | | | | | | | | | | |
| | | | | | | | | | | | | | | | | | | | | | | | | | |
| | | | | | | | | | | | | | | | | | | | | | | | | | |
The increase in selling, general and administrative expenses was primarily due to the following:
- •
- A net increase of $8,193,000 in bad debt expense for increased reserves for certain accounts receivable due primarily to Middle East and Asia
Pacific regions, partially offset by reduction in the United States; and
- •
- A decrease of $4,969,000 in unapplied and indirect labor due primarily to reductions in staff in Brazil and Spain during 2015 and early 2016.
Operating Profit (Loss) (dollars in thousands)
| |
2016 | 2015 | |
|
|||||||||||||||
|---|---|---|---|---|---|---|---|---|---|---|---|---|---|---|---|---|---|---|---|
| |
|
% of CFR |
|
% of CFR |
Change | ||||||||||||||
United States |
$ | 17,981 | 13.1 | % | $ | 14,459 | 11.8 | % | $ | 3,522 | 24.4 | % | |||||||
Latin America |
(1,687 | ) | (9.0 | ) | 1,309 | 5.0 | (2,996 | ) | N.M | ||||||||||
Europe |
(4,646 | ) | (12.1 | ) | (6,312 | ) | (16.0 | ) | 1,666 | (26.4 | ) | ||||||||
Middle East |
20,109 | 9.8 | 43,792 | 17.8 | (23,683 | ) | (54.1 | ) | |||||||||||
Africa |
1,963 | 9.4 | 822 | 4.0 | 1,141 | 138.8 | |||||||||||||
Asia/Pacific |
1,677 | 12.1 | 1,850 | 14.0 | (173 | ) | (9.4 | ) | |||||||||||
Corporate |
(36,251 | ) | 8.3 | (36,816 | ) | 7.9 | 565 | (1.5 | ) | ||||||||||
| | | | | | | | | | | | | | | | | | | | |
Total |
$ | (854 | ) | (0.2 | )% | $ | 19,104 | 4.1 | % | $ | (19,958 | ) | (104.5 | )% | |||||
| | | | | | | | | | | | | | | | | | | | |
| | | | | | | | | | | | | | | | | | | | |
| | | | | | | | | | | | | | | | | | | | |
The decrease in operating profit was primarily due to the decrease in CFR and the increase in bad debt expense in the Middle East partially offset by an increase in the United States. Corporate expenses decreased by $565,000, but represented 8.3% of CFR in 2016 compared to 7.9% of CFR in 2015.
Interest and related financing fees, net
Net interest and related financing fees decreased $1,332,000 to $694,000 in 2016 as compared with $2,026,000 in 2015. The decrease was primarily due to interest of $1,056,000 paid to a subcontractor as a result of a legal settlement in 2015.
35
Income Taxes
In 2016, income tax expense was $6,068,000 compared to $6,465,000 in 2015. The effective income tax expense rates for 2016 and 2015 were (392.0%) and 37.9%, respectively. The decrease in expense in 2016 compared to 2015 results from the mix of income and tax rates in various foreign jurisdictions. The difference in the Company's 2016 effective tax rate compared to the 2015 rate is primarily related to a significant decrease in the Company's foreign pretax earnings of approximately $24,000,000, primarily related to the Middle East operations without a significant related income tax benefit. In addition, the Company recognized an income tax expense of $689,000 in 2016 resulting from adjustments to agree the 2015 book amount to the actual amounts reported on the tax returns in foreign jurisdictions. In both years, the Company's effective tax rate is significantly higher than the U.S. federal statutory rate primarily as a result of increases caused by various foreign withholding taxes and the inability to record an income tax benefit related to the U.S. net operating loss.
In 2015, several items materially affected the Company's effective tax rate. An income tax benefit of $205,000 resulted from adjustments to agree the 2014 book amount to the actual amounts reported on the tax returns in foreign jurisdictions. The benefit was offset by increased foreign withholding taxes.
Net (Loss) Earnings Attributable to Hill
Net loss attributable to Hill International, Inc. for 2016 was ($18,828,000), or ($0.36) per diluted common share based on 51,724,000 diluted common shares outstanding, as compared to net earnings for 2015 of $6,931,000, or $0.13 per diluted common share based upon 51,311,000 diluted common shares outstanding. Net loss from continuing operations for 2016 was ($7,752,000), or ($0.15) per diluted share, compared to net earnings from continuing operations of $9,805,000, or $0.20 per diluted share, in 2015.
Year Ended December 31, 2015 Compared to
Year Ended December 31, 2014
Consulting Fee Revenue ("CFR") (dollars in thousands)
| |
2015 | 2014 | Change | ||||||||||||||||
|---|---|---|---|---|---|---|---|---|---|---|---|---|---|---|---|---|---|---|---|
United States |
$ | 122,423 | 26.2 | % | $ | 102,095 | 23.8 | % | $ | 20,328 | 19.9 | % | |||||||
Latin America |
26,304 | 5.6 | 36,925 | 8.6 | (10,621 | ) | (28.8 | ) | |||||||||||
Europe |
39,519 | 8.4 | 34,943 | 8.2 | 4,576 | 13.1 | |||||||||||||
Middle East |
245,985 | 52.6 | 222,754 | 51.9 | 23,231 | 10.4 | |||||||||||||
Africa |
20,461 | 4.4 | 18,402 | 4.3 | 2,059 | 11.2 | |||||||||||||
Asia/Pacific |
13,185 | 2.8 | 13,708 | 3.2 | (523 | ) | (3.8 | ) | |||||||||||
| | | | | | | | | | | | | | | | | | | | |
Total |
$ | 467,877 | 100.0 | % | $ | 428,827 | 100.0 | % | $ | 39,050 | 9.1 | % | |||||||
| | | | | | | | | | | | | | | | | | | | |
| | | | | | | | | | | | | | | | | | | | |
| | | | | | | | | | | | | | | | | | | | |
The primary increases in CFR occurred in the Middle East and the United States. In the Middle East, there was an increase of $37,614,000 in the United Arab Emirates and $6,400,000 in Saudi Arabia where several new projects started partially offset by decreases of $13,883,000 in Iraq due to the cessation of projects caused by the political turmoil and $8,093,000 in Oman where a major project continued at a lower volume. The increase of $20,328,000 in CFR in the United States occurred throughout all regions. In Latin America, the decrease of $10,621,000 was primarily in Brazil where CFR decreased by $8,914,000 as the economic conditions continue to cause reduced work. In Europe, there were increases of $4,898,000 in Kazakhstan and $3,683,000 in Turkey due to the acquisition of IMS Proje Yonetimi ve Dansmanlik A.S. ("IMS") in April 2015. This was partially offset by decreases in Spain and Latvia. In Africa, CFR was up with increases in Egypt and Algeria partially offset by a decrease in Morocco. The decrease in Asia/Pacific occurred primarily in Afghanistan partially offset by an increase in India.
36
Reimbursable Expenses (dollars in thousands)
| |
2015 | 2014 | Change | ||||||||||||||||
|---|---|---|---|---|---|---|---|---|---|---|---|---|---|---|---|---|---|---|---|
United States |
$ | 64,976 | 76.7 | % | $ | 44,129 | 74.9 | % | $ | 20,847 | 47.2 | % | |||||||
Latin America |
47 | 0.1 | 23 | — | 24 | 104.3 | |||||||||||||
Europe |
3,394 | 4.0 | 2,415 | 4.1 | 979 | 40.5 | |||||||||||||
Middle East |
9,912 | 11.7 | 8,124 | 13.8 | 1,788 | 22.0 | |||||||||||||
Africa |
3,474 | 4.1 | 3,255 | 5.5 | 219 | 6.7 | |||||||||||||
Asia/Pacific |
2,896 | 3.4 | 981 | 1.7 | 1,915 | 195.2 | |||||||||||||
| | | | | | | | | | | | | | | | | | | | |
Total |
$ | 84,699 | 100.0 | % | $ | 58,927 | 100.0 | % | $ | 25,772 | 43.7 | % | |||||||
| | | | | | | | | | | | | | | | | | | | |
| | | | | | | | | | | | | | | | | | | | |
| | | | | | | | | | | | | | | | | | | | |
Reimbursable expenses consist of amounts paid to subcontractors and other third parties, and travel and other job-related expenses that are contractually reimbursable from clients. These items are reflected as separate line items in both our total revenue and total direct expenses captions in our consolidated statements of operations. The increase in reimbursable expenses is primarily due to increased use of subcontractors throughout the United States, primarily in our Northeast and Mid-Atlantic regions.
Cost of Services (dollars in thousands)
| |
2015 | 2014 | Change | ||||||||||||||||||||||
|---|---|---|---|---|---|---|---|---|---|---|---|---|---|---|---|---|---|---|---|---|---|---|---|---|---|
| |
|
|
% of CFR |
|
|
% of CFR |
|
|
|||||||||||||||||
United States |
$ | 67,060 | 23.2 | % | 54.8 | % | $ | 56,474 | 21.4 | % | 55.3 | % | $ | 10,586 | 18.7 | % | |||||||||
Latin America |
15,230 | 5.3 | 57.9 | 22,444 | 8.5 | 60.8 | (7,214 | ) | (32.1 | ) | |||||||||||||||
Europe |
25,578 | 8.9 | 64.7 | 22,079 | 8.4 | 63.2 | 3,499 | 15.8 | |||||||||||||||||
Middle East |
161,464 | 55.9 | 65.6 | 145,210 | 55.0 | 65.2 | 16,254 | 11.2 | |||||||||||||||||
Africa |
13,292 | 4.6 | 65.0 | 11,300 | 4.3 | 61.4 | 1,992 | 17.6 | |||||||||||||||||
Asia/Pacific |
6,221 | 2.1 | 47.2 | 6,299 | 2.4 | 46.0 | (78 | ) | (1.2 | ) | |||||||||||||||
| | | | | | | | | | | | | | | | | | | | | | | | | | |
Total |
$ | 288,845 | 100.0 | % | 61.7 | % | $ | 263,806 | 100.0 | % | 61.5 | % | $ | 25,039 | 9.5 | % | |||||||||
| | | | | | | | | | | | | | | | | | | | | | | | | | |
| | | | | | | | | | | | | | | | | | | | | | | | | | |
| | | | | | | | | | | | | | | | | | | | | | | | | | |
Cost of services consists of labor expenses for time charged directly to contracts and non-reimbursable job-related travel and out-of-pocket expenses. The increase in cost of services is primarily due to increases in direct labor in the Middle East and the United States due to higher CFR partially offset by decreased direct labor in Latin America due to decreased CFR.
Gross Profit (dollars in thousands)
| |
2015 | 2014 | Change | ||||||||||||||||||||||
|---|---|---|---|---|---|---|---|---|---|---|---|---|---|---|---|---|---|---|---|---|---|---|---|---|---|
| |
|
|
% of CFR |
|
|
% of CFR |
|
|
|||||||||||||||||
United States |
$ | 55,363 | 30.9 | % | 45.2 | % | $ | 45,621 | 27.6 | % | 44.7 | % | $ | 9,742 | 21.4 | % | |||||||||
Latin America |
11,074 | 6.2 | 42.1 | 14,481 | 8.8 | 39.2 | (3,407 | ) | (23.5 | ) | |||||||||||||||
Europe |
13,941 | 7.8 | 35.3 | 12,864 | 7.8 | 36.8 | 1,077 | 8.4 | |||||||||||||||||
Middle East |
84,521 | 47.2 | 34.4 | 77,544 | 47.0 | 34.8 | 6,977 | 9.0 | |||||||||||||||||
Africa |
7,169 | 4.0 | 35.0 | 7,102 | 4.3 | 38.6 | 67 | 0.9 | |||||||||||||||||
Asia/Pacific |
6,964 | 3.9 | 52.8 | 7,409 | 4.5 | 54.0 | (445 | ) | (6.0 | ) | |||||||||||||||
| | | | | | | | | | | | | | | | | | | | | | | | | | |
Total |
$ | 179,032 | 100.0 | % | 38.3 | % | $ | 165,021 | 100.0 | % | 38.5 | % | $ | 14,011 | 8.5 | % | |||||||||
| | | | | | | | | | | | | | | | | | | | | | | | | | |
| | | | | | | | | | | | | | | | | | | | | | | | | | |
| | | | | | | | | | | | | | | | | | | | | | | | | | |
The increase in gross profit included increases in the United States and the Middle East due to increased CFR partially offset by a decrease in Latin America due to the decreases in CFR. The overall gross profit percentage remained relatively constant at 38.3% in 2015 compared to 38.5% in 2014.
37
Selling, General and Administrative ("SG&A") Expenses (dollars in thousands)
| |
2015 | 2014 | Change | ||||||||||||||||||||||
|---|---|---|---|---|---|---|---|---|---|---|---|---|---|---|---|---|---|---|---|---|---|---|---|---|---|
| |
|
|
% of CFR |
|
|
% of CFR |
|
|
|||||||||||||||||
United States |
$ | 40,904 | 25.6 | % | 8.7 | % | $ | 38,197 | 26.9 | % | 8.9 | % | $ | 2,707 | 7.1 | % | |||||||||
Latin America |
9,765 | 6.1 | 2.1 | 13,063 | 9.2 | 3.0 | (3,298 | ) | (25.2 | ) | |||||||||||||||
Europe |
20,253 | 12.7 | 4.3 | 18,009 | 12.7 | 4.2 | 2,244 | 12.5 | |||||||||||||||||
Middle East |
40,729 | 25.5 | 8.7 | 35,176 | 24.8 | 8.2 | 5,553 | 15.8 | |||||||||||||||||
Africa |
6,347 | 4.0 | 1.4 | 2,286 | 1.6 | 0.5 | 4,061 | 177.6 | |||||||||||||||||
Asia/Pacific |
4,877 | 3.1 | 1.0 | 5,116 | 3.6 | 1.2 | (239 | ) | (4.7 | ) | |||||||||||||||
Corporate Expenses |
36,816 | 23.0 | 7.9 | 30,232 | 21.2 | 7.0 | 6,584 | 21.8 | |||||||||||||||||
| | | | | | | | | | | | | | | | | | | | | | | | | | |
|
$ | 159,691 | 100.0 | % | 34.1 | % | $ | 142,079 | 100.0 | % | 33.1 | % | $ | 17,612 | 12.4 | % | |||||||||
| | | | | | | | | | | | | | | | | | | | | | | | | | |
| | | | | | | | | | | | | | | | | | | | | | | | | | |
| | | | | | | | | | | | | | | | | | | | | | | | | | |
The increase in selling, general and administrative expenses was primarily due to the following:
- •
- An increase of $11,595,000 in bad debt expense for increased reserves for certain accounts receivable in the Middle East and due to the 2014
collection of previously reserved Libya receivables;
- •
- An increase in legal fees of $2,259,000 primarily related to the proxy contest; and
- •
- An increase of $4,163,000 in unapplied and indirect labor due primarily to increases in staff in the Middle East in support of increased CFR.
Operating Profit (Loss) (dollars in thousands)
| |
2015 | 2014 | Change | ||||||||||||||||
|---|---|---|---|---|---|---|---|---|---|---|---|---|---|---|---|---|---|---|---|
| |
|
% of CFR |
|
% of CFR |
|
|
|||||||||||||
United States |
$ | 14,459 | 11.8 | % | $ | 7,424 | 7.3 | % | $ | 7,035 | 94.8 | % | |||||||
Latin America |
1,309 | 5.0 | 1,418 | 3.8 | (109 | ) | (7.7 | ) | |||||||||||
Europe |
(6,312 | ) | (16.0 | ) | (5,145 | ) | (14.7 | ) | (1,167 | ) | 22.7 | ||||||||
Middle East |
43,792 | 17.8 | 42,368 | 19.0 | 1,424 | 3.4 | |||||||||||||
Africa |
822 | 4.0 | 4,816 | 26.2 | (3,994 | ) | (82.9 | ) | |||||||||||
Asia Pacific |
1,850 | 14.0 | 2,293 | 16.7 | (443 | ) | (19.3 | ) | |||||||||||
Corporate |
(36,816 | ) | (30,232 | ) | (6,584 | ) | 21.8 | ||||||||||||
| | | | | | | | | | | | | | | | | | | | |
Total |
$ | 19,104 | 4.1 | % | $ | 22,942 | 5.3 | % | $ | (3,838 | ) | (16.7 | )% | ||||||
| | | | | | | | | | | | | | | | | | | | |
| | | | | | | | | | | | | | | | | | | | |
| | | | | | | | | | | | | | | | | | | | |
The decrease in operating profit was primarily due to the decrease in Africa of $3,994,000 due to the 2014 reversal of bad debt expense for the Libya collection and an increase of $2,900,000 in bad debt expense in the Middle East and an increase in Corporate expenses including an increase in legal fees of $2,353,000 related to the proxy contest and an increase of $2,594,000 in indirect labor support of the overall growth in CFR. Corporate expenses represented 7.9% in 2015 compared to 7.0% in 2014.
Interest and related financing fees, net
Interest and related financing fees increased $462,000 to $2,026,000 in 2015 as compared with $1,564,000 in 2014, primarily due to additional borrowings to support our operations in the Middle East.
Income Taxes
In 2015, the income tax expense was $6,465,000 compared to an income tax expense of $7,512,000 in 2014. The effective income tax expense rates for 2015 and 2014 were 37.9% and 35.1%, respectively.
38
The decrease in expense results from the mix of income tax rates in the Company's foreign jurisdictions. The difference in the Company's 2015 effective tax rate compared to the 2014 rate is also primarily related to the mix of income and tax rates in the Company's foreign jurisdictions. In both years, the Company's effective tax rate is significantly higher than it otherwise would be primarily as a result of not being able to record an income tax benefit related to the U.S. net operating loss plus increases caused by various foreign withholding taxes.
In 2015, several items materially affected the Company's effective tax rate. An income tax benefit of $205,000 resulted from adjustments to agree the 2014 book amount to the actual amounts reported on the tax returns in foreign jurisdictions. This benefit was offset by increased foreign withholding taxes.
In 2014, several items materially affected the Company's effective tax rate. The Company realized a net benefit of $2,379,000 primarily from the reversal of prior year's uncertain tax positions based on management's assessment that these items were effectively settled with the appropriate foreign tax authorities. An income tax expense of $1,050,000 resulted from adjustments to agree the 2013 book amount to the actual amounts reported on the tax returns in foreign jurisdictions.
Net Earnings (Loss) Attributable to Hill
Net earnings attributable to Hill International, Inc. for 2015 were $6,931,000, or $0.14 per diluted common share based on 51,311,000 diluted common shares outstanding, as compared to a net loss in 2014 of ($6,148,000), or ($0.14) per diluted common share based upon 44,370,000 diluted common shares outstanding. Net earnings from continuing operations for 2015 were $9,805,000, or $0.21 per diluted share, compared to $12,565,000, or $0.31 per fully diluted share for 2014.
Non-GAAP Financial Measures
EBITDA, a non-GAAP performance measure used by management, is defined as net earnings plus interest expense, income tax expense and depreciation and amortization, as shown in the table below. EBITDA does not purport to be an alternative to net earnings as a measure of financial and operating performance or ability to generate cash flows from operations that are available for taxes and capital expenditures. Because not all companies use identical calculations, this presentation of EBITDA may not be comparable to other similarly-titled measures of other companies. We use, and we believe investors benefit from the presentation of, EBITDA in evaluating our operating performance because it provides us and our investors with an additional tool to compare our operating performance on a consistent basis by removing the impact of certain items that management believes do not directly reflect our core operations. We believe that EBITDA is useful to investors and other external users of our financial statements in evaluating our operating performance because EBITDA is widely used by investors to measure a company's operating performance without regard to items such as interest expense, taxes, and depreciation and amortization, which can vary substantially from company to company depending upon accounting methods and book value of assets, capital structure and the method by which assets were acquired.
Using EBITDA as a performance measure has material limitations as compared to net earnings, or other financial measures as defined under U.S. GAAP as it excludes certain recurring items which may be meaningful to investors. EBITDA excludes interest expense; however, as we have borrowed money in order to finance transactions and operations, interest expense is an element of our cost structure and can affect our ability to generate revenue and returns for our stockholders. Further, EBITDA excludes depreciation and amortization; however, as we use capital and intangible assets to generate revenues, depreciation and amortization are a necessary element of our costs and ability to generate revenue. Finally, EBITDA excludes income taxes; however, as we are organized as a corporation, the payment of taxes is a necessary element of our operations. As a result of these exclusions from EBITDA, any
39
measure that excludes interest expense, depreciation and amortization and income taxes has material limitations as compared to net earnings. When using EBITDA as a performance measure, management compensates for these limitations by comparing EBITDA and net earnings in each period, so as to allow for the comparison of the performance of the underlying core operations with the overall performance of the company on a full-cost, after-tax basis. Using both EBITDA and net earnings to evaluate the business allows management and investors to (a) assess our relative performance against our competitors and (b) monitor our capacity to generate returns for our stockholders.
A reconciliation of EBITDA to the most directly comparable GAAP measure follows (in thousands):
| |
Years Ended December 31, | |||||||||
|---|---|---|---|---|---|---|---|---|---|---|
| |
2016 | 2015 | 2014 | |||||||
Net (loss) earnings from continuing operations |
$ | (7,752 | ) | $ | 9,805 | $ | 12,565 | |||
Interest |
694 | 2,026 | 1,564 | |||||||
Income taxes |
6,068 | 6,465 | 7,512 | |||||||
Depreciation and amortization |
7,153 | 7,909 | 7,104 | |||||||
| | | | | | | | | | | |
EBITDA |
$ | 6,163 | $ | 26,205 | $ | 28,745 | ||||
| | | | | | | | | | | |
| | | | | | | | | | | |
| | | | | | | | | | | |
Liquidity and Capital Resources
At December 31, 2016, our primary sources of liquidity consisted of $25,637,000 of cash and cash equivalents, of which $25,187,000 was on deposit in foreign locations, and $13,176,000 of available borrowing capacity under our various credit facilities. At December 31, 2016, we were in default of our Consolidated Net Leverage Ratio. On March 27, 2017, we received a waiver of the default from the Agent. See Note 11 to our consolidated financial statements for a description of our credit facilities and term loan. We believe that we have sufficient liquidity to support the reasonably anticipated cash needs of our operations over the next twelve months. However, significant unforeseen events, such as termination or cancellation of major contracts or further delays in receivable collections, could adversely affect our liquidity and results of operations. If market opportunities exist, we may choose to undertake financing actions to further enhance our liquidity, which could include borrowing additional funds under our credit agreements, obtaining new bank debt, raising funds through capital market transactions, or other strategic initiatives. See "Sources of Additional Capital" for further information.
The amount of CFR attributable to operations in the Middle East and Africa has grown to approximately 52.0% of total consolidated CFR in 2016. We have recently experienced a slowdown in collections from our clients in the Middle East primarily due to the drop in oil prices. This has put a considerable strain on our liquidity. As a result, we have had to rely heavily on debt and equity transactions to fund our operations and we may continue our reliance on debt and equity transactions for our liquidity needs over the next 18 months.
In 2012, we commenced operations on the Oman Airport project with the Ministry of Transport and Communications ("MOTC"). The original contract term was to expire in November 2014. In October 2014, we applied for a twelve-month extension of time amendment ("first extension") (which was subsequently approved in March 2016) and we continued to work on the Oman Airport project. We began to experience some delays in payment during the second quarter of 2015 when MOTC commenced its formal review and certification of our invoices. In December 2015, we began discussions with the MOTC on a second extension of time amendment ("second extention") and have since commenced additional work, which we expect to last approximately 18 months. When the MOTC resumed payments in 2016, we received approximately $42,000,000 during the year and approximately $6,153,000 during the first quarter of 2017. At December 31, 2016, accounts receivable from Oman totaled approximately $27,132,000. Approximately $16,500,000 was past due based on contractual terms.
40
Although MOTC has not made payments under the contractual terms of the first extension and second extension amendments, we have received full payment under the first extension and believe that the same will hold true for the second extension as there is no evidence to the contrary. In fact, there are multiple indicators that we will receive payment: Oman is a wealthy, stable and solvent country which recently raised funds in the capital markets to help finance its budget, the MOTC has certified the past due invoices and MOTC has indicated that it is committed to paying its obligations to us.
Additional Capital Requirements
Our subsidiary, Hill International (Spain), S.A. ("Hill Spain"), owns an indirect 91% interest in Engineering S.A. ("ESA"), a firm located in Brazil, and now known as Hill International do Brasil, S.A. ESA's shareholders entered into an agreement whereby the minority shareholders have a right to compel ("ESA Put Option") Hill Spain to purchase any or all of their shares during the period from February 28, 2014 to February 28, 2021. Hill Spain also has the right to compel ("ESA Call Option") the minority shareholders to sell any or all of their shares during the same time period. The purchase price for such shares shall be seven times the earnings before interest and taxes for ESA's most recently ended fiscal year, net of any financial debt plus excess cash multiplied by a percentage which the shares to be purchased bear to the total number of shares outstanding at the time of purchase, but in the event the ESA Call Option is exercised by Hill Spain, the purchase price shall be increased by five percent. The ESA Put Option and the ESA Call Option must be made within three months after the audited financial statements of ESA have been completed. On June 17, 2016, the three remaining minority shareholders exercised their ESA Put Option claiming a value of BRL 8,656,000 (approximately $2,670,000 at June 30, 2016). The Company accrued the liability which is included in other current liabilities and as an adjustment to additional paid-in capital in the consolidated balance sheet at December 31, 2016. The amount is subject to negotiation and any difference will be recorded upon completion of the transaction.
Hill Spain entered into a new credit agreement with three new banks. The total new facility is for €2,770,000 (approximately $2,915,000) at December 31, 2016. The facility was fully utilized at December 31, 2016. Interest rates at December 31, 2016 were between 1.85% and 3.50%. The loans have varying expiration dates between 36 and 60 months.
In connection with the acquisition of IMS on April 15, 2015, the Company had accrued approximately TRY 1,700,000 for a potential earn out which would be payable if earnings before interest, income taxes, depreciation and amortization for the twelve month period subsequent to the closing date ("EBITDA") exceeded TRY 3,500,000. A lesser amount would have been payable if EBITDA was between TRY 3,200,000 and TRY 3,500,000. IMS's EBITDA through the one-year anniversary of the acquisition date was not sufficient to earn any of the Additional Purchase Price and the liability was eliminated by a credit of approximately $673,000 to selling, general and administrative expenses for the year ended December 31, 2016.
Sources of Additional Capital
We have an effective registration statement on Form S-3 on file with the SEC to register 20,000,000 shares of our common stock for issuance and sale by us at various times in the future. To date, we have issued 9,546,629 shares under this registration statement, leaving a balance of 10,453,371 shares. The proceeds, if any, will be used for working capital and general corporate purposes, subject to the restrictions of our Secured Credit Facilities. We cannot predict the amount of proceeds from those future sales, if any, or whether there will be a market for our common stock at the time of any such offering or offerings to the public.
In addition, we have an effective registration statement on Form S-4 on file with the SEC to register 20,000,000 shares of our common stock for issuance in connection with business acquisitions.
41
To date, we have issued 1,073,196 shares under this registration statement, leaving a balance of 18,926,804 shares. We cannot predict whether, in the future, we will offer these shares to potential sellers of businesses or assets we might consider acquiring or whether these shares will be acceptable as consideration by any potential sellers.
At December 31, 2016, we had $13,176,000 of available borrowing capacity under our various credit agreements.
We also have relationships with other foreign banks for the issuance of letters of credit, letters of guarantee and performance bonds in a variety of foreign currencies. At December 31, 2016, we had approximately $44,702,000 of availability under these arrangements.
We cannot provide any assurance that any other sources of financing will be available, or if available, that the financing will be on terms acceptable to us.
Cash Flow Activity During the Year Ended December 31, 2016
For the year ended December 31, 2016, our cash and cash equivalents increased by $1,548,000 to $25,637,000. This compares to a net decrease in cash and cash equivalents of ($6,035,000) during the prior year. Cash provided by operations was $9,568,000, cash used in investing activities was ($3,884,000) and cash used in financing activities was ($3,167,000). We also experienced a decrease in cash of ($969,000) from the effect of foreign currency exchange rate fluctuations.
Operating Activities
Our operations generated cash of $9,568,000 in 2016. This compares to cash used of ($6,853,000) in 2015 and cash generated of $6,305,000 in 2014. We had a net loss from continuing operations in 2016 amounting to ($7,616,000), net earnings of $10,613,000 in 2015 and net earnings of $13,866,000 in 2014. Depreciation and amortization was $7,153,000 in 2016 compared to $7,909,000 in 2015 and $7,104,000 in 2014; the decrease in this category in 2016 versus 2015 is due to the full amortization of the shorter-lived intangible assets of companies which we acquired over the last several years; the increase in 2015 over 2014 is due to significant additions to property and equipment related to our move to Philadelphia in 2015. We had a deferred tax provision of $2,293,000 in 2016 primarily due to several temporary differences in foreign jurisdictions.
Cash held in restricted accounts as collateral for the issuance of performance and advance payment bonds and letters of credit at December 31, 2016 and 2015 were $4,625,000 and $4,694,000, respectively. The decrease between years is due to a reduction in the collateral requirements that we were able to achieve with certain foreign lenders.
Average days sales outstanding ("DSO") at December 31, 2016 was 125 days compared to 104 days at December 31, 2015. DSO is a measure of our ability to collect our accounts receivable and is calculated by dividing the total of the period-end billed accounts receivable balance by average daily revenue (i.e., revenue for the quarter divided by 90 days). Generally, the age of our receivables is adversely affected by the timing of payments from our clients in Europe and Africa, which have historically been slower than payments from clients in other geographic regions of the Company's operations. The increase in DSO in 2016 from 2015 was due to a slowing of collections from our clients in the Middle East, particularly Oman.
Although we continually monitor our accounts receivable, we manage our operating cash flows by managing the working capital accounts in total, rather than by individual elements. The primary elements of our working capital are accounts receivable, prepaid and other current assets, accounts payable and deferred revenue. Accounts receivable consist of billing to our clients for our consulting fees and other job-related costs. Prepaid expenses and other current assets consist of prepayments for various selling, general and administrative costs, such as insurance, rent, maintenance, etc. Accounts
42
payable consist of obligations to third parties relating primarily to costs incurred for specific engagements, including pass-through costs such as subcontractor costs. Deferred revenue consists of payments received from clients in advance of work performed.
From year to year, the components of our working capital accounts may reflect significant changes. The changes are due primarily to the timing of cash receipts and payments with our working capital accounts combined with increases in our receivables and payables relative to the increase in our overall business, as well as our acquisition activity. In 2016 and 2015, payments to our vendors were drawn out due to a slowdown in our receipts against accounts receivable primarily in the Middle East and particularly Oman.
Investing Activities
Net cash used in investing activities was ($3,884,000) for the purchase of leasehold improvements, computers, office equipment and furniture and fixtures. Of this amount, $1,800,000 was used to implement a database system for our Human Resources department.
Financing Activities
Net cash used in financing activities was ($3,167,000). We made payments in the amount of $803,000 in borrowings under various credit facilities. We paid $1,200,000 against the 2014 Term Loan Facility and $55,000 against the Philadelphia Industrial Development Corp. loan. We paid $1,531,000 of holdback purchase price to the former owners of IMS. We also received $533,000 from the exercise of stock options and purchases under our Employee Stock Purchase Plan. We paid $111,000 as dividends to noncontrolling interests.
New Accounting Pronouncements
For information with respect to new accounting pronouncements and the impact of these pronouncements on our consolidated financial statements, see Note 4 to the consolidated financial statements in Item 8 hereof.
Quarterly Fluctuations
Our operating results vary from period to period as a result of the timing of projects and assignments. We do not believe that our business is seasonal.
Inflation
Although we are subject to fluctuations in the local currencies of the countries in which we operate, we do not believe that inflation will have a significant effect on our results of operations or our financial position.
43
Off-Balance Sheet Arrangements
The following chart provides information with respect to off-balance sheet arrangements including those arrangements attributable to discontinued operations (in thousands).
| |
Total(1) | 2017 | 2018 - 2019 | 2020 - 2021 | 2022 and later |
|||||||||||
|---|---|---|---|---|---|---|---|---|---|---|---|---|---|---|---|---|
Performance bonds(2) |
$ | 53,237 | $ | 28,875 | $ | 7,085 | $ | 17,277 | $ | — | ||||||
Advance payment bonds(2) |
39,580 | 29,496 | — | 10,084 | — | |||||||||||
Bid bonds(3) |
7,114 | 6,566 | 548 | — | — | |||||||||||
Other |
927 | 800 | — | — | 127 | |||||||||||
Letters of credit(4) |
4,519 | 2,912 | 447 | 1,160 | — | |||||||||||
| | | | | | | | | | | | | | | | | |
|
$ | 105,377 | $ | 68,649 | $ | 8,080 | $ | 28,521 | $ | 127 | ||||||
| | | | | | | | | | | | | | | | | |
| | | | | | | | | | | | | | | | | |
| | | | | | | | | | | | | | | | | |
- (1)
- At
December 31, 2016, the Company had provided cash collateral amounting to $4,625,000 for certain of these items. That collateral is reflected in restricted
cash on the consolidated balance sheet. See Note 16 to our consolidated financial statements for further information regarding these arrangements.
- (2)
- Represents
guarantee of service performance bonds issued through international banks required under certain international contracts.
- (3)
- Represents
bid bonds issued through international banks as part of the bidding process for new work to demonstrate our financial strength.
- (4)
- Represents letters of credit issued through a domestic bank in support for certain performance, advance payments and bid bonds.
Contractual Obligations
The following chart provides information with respect to contractual obligations including those obligations attributable to discontinued operations (in thousands).
| |
Total | 2017 | 2018 - 2019 | 2020 - 2021 | 2022 and later |
|||||||||||
|---|---|---|---|---|---|---|---|---|---|---|---|---|---|---|---|---|
Long-term debt obligations |
$ | 144,103 | 1,983 | 31,408 | 110,354 | 358 | ||||||||||
Interest expense on notes payable(1) |
46,848 | 12,793 | 24,372 | 9,655 | 28 | |||||||||||
Operating lease obligations(2) |
36,720 | 7,607 | 11,239 | 6,911 | 10,963 | |||||||||||
| | | | | | | | | | | | | | | | | |
|
$ | 227,671 | $ | 22,383 | $ | 67,019 | $ | 126,920 | $ | 11,349 | ||||||
| | | | | | | | | | | | | | | | | |
| | | | | | | | | | | | | | | | | |
| | | | | | | | | | | | | | | | | |
- (1)
- Estimated
using the interest rates in effect at December 31, 2016.
- (2)
- Represents future minimum rental commitments under non-cancelable leases. The Company expects to fund these commitments with existing cash and cash flow from operations.
Item 7A. Quantitative and Qualitative Disclosures About Market Risk
We are exposed to certain market risks primarily related to foreign currency exchange rates and interest rates.
Foreign Exchange Rates
We are exposed to foreign currency exchange rate risk resulting from our operations outside of the U.S. which are denominated primarily in Euros, U.A.E. dirhams, Qatari riyal, Omani rial, Saudi riyal,
44
Brazilian real, Polish zloty as well as other currencies. We do not comprehensively hedge our exposure to currency rate changes; however, we limit exposure to foreign currency fluctuations in most of our contracts through provisions that require client payments to be in currencies corresponding to the currency in which costs are incurred. As a result of this natural hedge, we currently do not hedge foreign currency cash flows for contract work performed, although we may do so in the future. The functional currency of our significant foreign operations is the respective local currency.
Interest Rates
All of our borrowings under our revolving credit facilities bear interest at variable rates. If market interest rates had changed by 100 basis points, interest expense and our cash flows would have changed by $308,000 each.
45
Item 8. Financial Statements and Supplementary Data.
HILL INTERNATIONAL, INC. AND SUBSIDIARIES
CONSOLIDATED BALANCE SHEETS
(In thousands, except per share data)
| |
December 31, | ||||||
|---|---|---|---|---|---|---|---|
| |
2016 | 2015 | |||||
Assets |
|||||||
Cash and cash equivalents |
$ | 25,637 | $ | 24,089 | |||
Cash—restricted |
4,312 | 4,435 | |||||
Accounts receivable, less allowance for doubtful accounts of $71,082 and $60,535 |
164,554 | 187,553 | |||||
Accounts receivable—affiliates |
5,712 | 5,205 | |||||
Prepaid expenses and other current assets |
7,751 | 7,030 | |||||
Income taxes receivable |
4,061 | 3,187 | |||||
Current assets held for sale |
54,144 | 60,092 | |||||
| | | | | | | | |
Total current assets |
266,171 | 291,591 | |||||
Property and equipment, net |
16,787 | 18,981 | |||||
Cash—restricted, net of current portion |
313 | 259 | |||||
Retainage receivable |
17,225 | 2,638 | |||||
Acquired intangibles, net |
6,747 | 9,773 | |||||
Goodwill |
50,665 | 49,739 | |||||
Investments |
3,581 | 8,378 | |||||
Deferred income tax assets |
2,197 | 4,602 | |||||
Other assets |
4,224 | 6,177 | |||||
Non-current assets held for sale |
33,298 | 36,608 | |||||
| | | | | | | | |
Total assets |
$ | 401,208 | $ | 428,746 | |||
| | | | | | | | |
| | | | | | | | |
| | | | | | | | |
Liabilities and Stockholders' Equity |
|||||||
Current maturities of notes payable and long-term debt |
1,983 | 4,357 | |||||
Accounts payable and accrued expenses |
83,992 | 89,336 | |||||
Income taxes payable |
5,315 | 8,983 | |||||
Deferred revenue |
12,943 | 9,866 | |||||
Other current liabilities |
8,168 | 3,009 | |||||
Current liabilities held for sale |
27,703 | 27,497 | |||||
| | | | | | | | |
Total current liabilities |
140,104 | 143,048 | |||||
Notes payable and long-term debt, net of current maturities |
142,120 | 140,626 | |||||
Retainage payable |
961 | 1,929 | |||||
Deferred income taxes |
535 | 988 | |||||
Deferred revenue |
12,691 | 9,921 | |||||
Other liabilities |
9,732 | 7,792 | |||||
Non-current liabilities held for sale |
4,679 | 6,403 | |||||
| | | | | | | | |
Total liabilities |
310,822 | 310,707 | |||||
| | | | | | | | |
Commitments and contingencies |
|||||||
Stockholders' equity: |
|||||||
Preferred stock, $0.0001 par value; 1,000 shares authorized, none issued |
— | — | |||||
Common stock, $0.0001 par value; 100,000 shares authorized, 58,835 shares and 58,335 shares issued at December 31, 2016 and 2015, respectively |
6 | 6 | |||||
Additional paid-in capital |
190,355 | 188,869 | |||||
Retained earnings (deficit) |
(17,623 | ) | 1,205 | ||||
Accumulated other comprehensive loss |
(54,327 | ) | (46,866 | ) | |||
| | | | | | | | |
|
118,411 | 143,214 | |||||
Less treasury stock of 6,977 shares and 6,743 shares at December 31, 2016 and December 31, 2015, respectively |
(30,041 | ) | (29,245 | ) | |||
| | | | | | | | |
Hill International, Inc. share of equity |
88,370 | 113,969 | |||||
Noncontrolling interests |
2,016 | 4,070 | |||||
| | | | | | | | |
Total equity |
90,386 | 118,039 | |||||
| | | | | | | | |
Total liabilities and stockholders' equity |
$ | 401,208 | $ | 428,746 | |||
| | | | | | | | |
| | | | | | | | |
| | | | | | | | |
See accompanying notes to consolidated financial statements.
46
HILL INTERNATIONAL, INC. AND SUBSIDIARIES
CONSOLIDATED STATEMENTS OF OPERATIONS
(In thousands, except per share data)
| |
Years Ended December 31, | |||||||||
|---|---|---|---|---|---|---|---|---|---|---|
| |
2016 | 2015 | 2014 | |||||||
Consulting fee revenue |
$ | 434,147 | $ | 467,877 | $ | 428,827 | ||||
Reimbursable expenses |
86,700 | 84,699 | 58,927 | |||||||
| | | | | | | | | | | |
Total revenue |
520,847 | 552,576 | 487,754 | |||||||
| | | | | | | | | | | |
Cost of services |
272,243 | 288,845 | 263,806 | |||||||
Reimbursable expenses |
86,700 | 84,699 | 58,927 | |||||||
| | | | | | | | | | | |
Total direct expenses |
358,943 | 373,544 | 322,733 | |||||||
| | | | | | | | | | | |
Gross profit |
161,904 | 179,032 | 165,021 | |||||||
Selling, general and administrative expenses |
162,721 | 159,691 | 142,079 | |||||||
Share of loss of equity method affiliates |
37 | 237 | — | |||||||
| | | | | | | | | | | |
Operating (loss) profit |
(854 | ) | 19,104 | 22,942 | ||||||
Interest and related financing fees, net |
694 | 2,026 | 1,564 | |||||||
| | | | | | | | | | | |
(Loss) earnings before income taxes |
(1,548 | ) | 17,078 | 21,378 | ||||||
Income tax expense |
6,068 | 6,465 | 7,512 | |||||||
| | | | | | | | | | | |
(Loss) earnings from continuing operations |
(7,616 | ) | 10,613 | 13,866 | ||||||
(Loss) from discontinued operations |
(11,076 | ) | (2,874 | ) | (18,713 | ) | ||||
| | | | | | | | | | | |
Net (loss) earnings |
(18,692 | ) | 7,739 | (4,847 | ) | |||||
Less: net earnings—noncontrolling interests |
136 | 808 | 1,301 | |||||||
| | | | | | | | | | | |
Net (loss) earnings attributable to Hill International, Inc. |
$ | (18,828 | ) | $ | 6,931 | $ | (6,148 | ) | ||
| | | | | | | | | | | |
| | | | | | | | | | | |
| | | | | | | | | | | |
Basic (loss) earnings per common share from continuing operations |
$ | (0.15 | ) | 0.20 | $ | 0.28 | ||||
Basic (loss) per common share from discontinued operations |
(0.21 | ) | (0.06 | ) | (0.42 | ) | ||||
| | | | | | | | | | | |
Basic (loss) earnings per common share—Hill International, Inc. |
$ | (0.36 | ) | $ | 0.14 | $ | (0.14 | ) | ||
| | | | | | | | | | | |
| | | | | | | | | | | |
| | | | | | | | | | | |
Basic weighted average common shares outstanding |
51,724 | 50,874 | 44,370 | |||||||
| | | | | | | | | | | |
| | | | | | | | | | | |
| | | | | | | | | | | |
Diluted (loss) earnings per common share from continuing operations |
$ | (0.15 | ) | $ | 0.20 | $ | 0.28 | |||
Diluted (loss) per common share from discontinued operations |
(0.21 | ) | (0.06 | ) | (0.42 | ) | ||||
| | | | | | | | | | | |
Diluted (loss) earnings per common share—Hill International, Inc. |
$ | (0.36 | ) | $ | 0.14 | $ | (0.14 | ) | ||
| | | | | | | | | | | |
| | | | | | | | | | | |
| | | | | | | | | | | |
Diluted weighted average common shares outstanding |
51,724 | 51,311 | 44,370 | |||||||
| | | | | | | | | | | |
| | | | | | | | | | | |
| | | | | | | | | | | |
See accompanying notes to consolidated financial statements.
47
HILL INTERNATIONAL, INC. AND SUBSIDIARIES
CONSOLIDATED STATEMENTS OF COMPREHENSIVE LOSS
(In thousands)
| |
Years Ended December 31, | |||||||||
|---|---|---|---|---|---|---|---|---|---|---|
| |
2016 | 2015 | 2014 | |||||||
Net (loss) earnings |
$ | (18,692 | ) | $ | 7,739 | $ | (4,847 | ) | ||
Foreign currency translation adjustment, net of tax |
(10,124 | ) | (14,861 | ) | (9,786 | ) | ||||
Other, net |
584 | (228 | ) | 123 | ||||||
| | | | | | | | | | | |
Comprehensive loss |
(28,232 | ) | (7,350 | ) | (14,510 | ) | ||||
Comprehensive loss attributable to noncontrolling interests |
(1,943 | ) | (15 | ) | (353 | ) | ||||
| | | | | | | | | | | |
Comprehensive loss attributable to Hill International, Inc. |
$ | (26,289 | ) | $ | (7,335 | ) | $ | (14,157 | ) | |
| | | | | | | | | | | |
| | | | | | | | | | | |
| | | | | | | | | | | |
See accompanying notes to consolidated financial statements.
48
HILL INTERNATIONAL, INC. AND SUBSIDIARIES
CONSOLIDATED STATEMENTS OF STOCKHOLDERS' EQUITY
For the Years Ended December 31, 2016, 2015, and 2014
(In thousands)
| |
Common Stock | |
|
Accumulated Other Comprehensive (Loss) |
Treasury Stock | Hill Share of Stockholders' Equity |
|
|
|||||||||||||||||||||||
|---|---|---|---|---|---|---|---|---|---|---|---|---|---|---|---|---|---|---|---|---|---|---|---|---|---|---|---|---|---|---|---|
| |
Additional Paid-in Capital |
Retained Earnings (Deficit) |
Non- controlling Interests |
Total Stockholders' Equity |
|||||||||||||||||||||||||||
| |
Shares | Amount | Shares | Amount | |||||||||||||||||||||||||||
Balance—December 31, 2013 |
46,598 | $ | 5 | $ | 136,899 | $ | 422 | $ | (24,591 | ) | 6,434 | $ | (27,766 | ) | $ | 84,969 | $ | 11,887 | $ | 96,856 | |||||||||||
Net (loss) earnings |
— | — | — | (6,148 | ) | — | — | — | (6,148 | ) | 1,301 | (4,847 | ) | ||||||||||||||||||
Other comprehensive loss |
— | — | — | — | (8,009 | ) | — | — | (8,009 | ) | (1,654 | ) | (9,663 | ) | |||||||||||||||||
Sale of common stock |
9,547 | 1 | 38,041 | — | — | — | — | 38,042 | — | 38,042 | |||||||||||||||||||||
Stock issued to Board of Directors |
27 | — | 175 | — | — | — | — | 175 | — | 175 | |||||||||||||||||||||
Stock-based compensation expense |
— | — | 3,327 | — | — | — | — | 3,327 | — | 3,327 | |||||||||||||||||||||
Cancelation of restricted stock |
(2 | ) | — | (8 | ) | — | — | — | — | (8 | ) | — | (8 | ) | |||||||||||||||||
Stock issued under employee stock purchase plan |
55 | — | 197 | — | — | — | — | 197 | — | 197 | |||||||||||||||||||||
Exercise of stock options |
324 | — | 1,032 | — | — | — | — | 1,032 | — | 1,032 | |||||||||||||||||||||
Cashless exercise of stock options |
200 | — | 538 | — | — | 112 | (538 | ) | — | — | — | ||||||||||||||||||||
Stock issued for acquisition of CPI |
171 | — | 618 | — | — | — | — | 618 | — | 618 | |||||||||||||||||||||
Dividends paid to noncontrolling interests |
— | — | — | — | — | — | — | — | (173 | ) | (173 | ) | |||||||||||||||||||
Acquisition of additional interest in subsidiary |
— | — | (907 | ) | — | — | — | — | (907 | ) | (2,649 | ) | (3,556 | ) | |||||||||||||||||
| | | | | | | | | | | | | | | | | | | | | | | | | | | | | | | | |
Balance—December 31, 2014 |
56,920 | 6 | 179,912 | (5,726 | ) | (32,600 | ) | 6,546 | (28,304 | ) | 113,288 | 8,712 | 122,000 | ||||||||||||||||||
Net earnings |
— | — | — | 6,931 | — | — | — | 6,931 | 808 | 7,739 | |||||||||||||||||||||
Other comprehensive loss |
— | — | — | — | (14,266 | ) | — | — | (14,266 | ) | (823 | ) | (15,089 | ) | |||||||||||||||||
Stock issued to Board of Directors |
25 | — | 115 | — | — | — | — | 115 | — | 115 | |||||||||||||||||||||
Stock-based compensation expense |
— | — | 2,983 | — | — | — | — | 2,983 | — | 2,983 | |||||||||||||||||||||
Stock issued under employee stock purchase plan |
43 | — | 126 | — | — | — | — | 126 | — | 126 | |||||||||||||||||||||
Exercise of stock options |
189 | — | 468 | — | — | — | — | 468 | — | 468 | |||||||||||||||||||||
Cashless exercise of stock options |
85 | — | 361 | — | — | 67 | (361 | ) | — | — | — | ||||||||||||||||||||
Stock issued for acquisition of CPI |
148 | — | 530 | — | — | — | — | 530 | — | 530 | |||||||||||||||||||||
Dividends paid to noncontrolling interests |
— | — | — | — | — | — | — | — | (253 | ) | (253 | ) | |||||||||||||||||||
Acquisition of additional interest in subsidiary |
925 | — | 4,374 | — | — | — | — | 4,374 | (4,374 | ) | — | ||||||||||||||||||||
Purchase of treasury stock |
— | — | — | — | — | 130 | (580 | ) | (580 | ) | — | (580 | ) | ||||||||||||||||||
| | | | | | | | | | | | | | | | | | | | | | | | | | | | | | | | |
Balance—December 31, 2015 |
58,335 | 6 | 188,869 | 1,205 | (46,866 | ) | 6,743 | (29,245 | ) | 113,969 | 4,070 | 118,039 | |||||||||||||||||||
Net (loss) earnings |
— | — | — | (18,828 | ) | — | — | — | (18,828 | ) | 136 | (18,692 | ) | ||||||||||||||||||
Other comprehensive loss |
— | — | — | — | (7,461 | ) | — | — | (7,461 | ) | (2,079 | ) | (9,540 | ) | |||||||||||||||||
Stock issued to Board of Directors |
3 | — | 10 | — | — | — | — | 10 | — | 10 | |||||||||||||||||||||
Stock-based compensation expense |
— | — | 2,817 | — | — | — | — | 2,817 | — | 2,817 | |||||||||||||||||||||
Stock issued under employee stock purchase plan |
59 | — | 182 | — | — | — | — | 182 | — | 182 | |||||||||||||||||||||
Exercise of stock options |
117 | — | 351 | — | — | — | — | 351 | — | 351 | |||||||||||||||||||||
Cashless exercise of stock options |
321 | — | 796 | — | — | 234 | (796 | ) | — | — | — | ||||||||||||||||||||
Dividends paid to noncontrolling interests |
— | — | — | — | — | — | — | — | (111 | ) | (111 | ) | |||||||||||||||||||
Decrease related to ESA Put Options |
— | — | (2,670 | ) | — | — | — | — | (2,670 | ) | — | (2,670 | ) | ||||||||||||||||||
| | | | | | | | | | | | | | | | | | | | | | | | | | | | | | | | |
Balance—December 31, 2016 |
58,835 | $ | 6 | $ | 190,355 | $ | (17,623 | ) | $ | (54,327 | ) | 6,977 | $ | (30,041 | ) | $ | 88,370 | $ | 2,016 | $ | 90,386 | ||||||||||
| | | | | | | | | | | | | | | | | | | | | | | | | | | | | | | | |
| | | | | | | | | | | | | | | | | | | | | | | | | | | | | | | | |
| | | | | | | | | | | | | | | | | | | | | | | | | | | | | | | | |
See accompanying notes to consolidated financial statements.
49
HILL INTERNATIONAL, INC. AND SUBSIDIARIES
CONSOLIDATED STATEMENTS OF CASH FLOWS
(In thousands)
| |
Years Ended December 31, | |||||||||
|---|---|---|---|---|---|---|---|---|---|---|
| |
2016 | 2015 | 2014 | |||||||
Cash flows from operating activities: |
||||||||||
Net (loss) earnings |
$ | (18,692 | ) | $ | 7,739 | $ | (4,847 | ) | ||
Loss from discontinued operations |
11,076 | 2,874 | 18,713 | |||||||
| | | | | | | | | | | |
(Loss) earnings from continuing operations |
(7,616 | ) | 10,613 | 13,866 | ||||||
Adjustments to reconcile net (loss) earnings to net cash provided by (used in): |
||||||||||
operating activities: |
||||||||||
Depreciation and amortization |
7,153 | 7,909 | 7,104 | |||||||
Provision for bad debts |
14,454 | 6,262 | (5,195 | ) | ||||||
Interest accretion on term loan |
— | — | 15,526 | |||||||
Amortization of loan fees |
1,778 | 1,778 | 555 | |||||||
Deferred tax (benefit) provision |
2,293 | (2,306 | ) | (3,372 | ) | |||||
Stock based compensation |
2,827 | 2,755 | 3,189 | |||||||
Changes in operating assets and liabilities (net of acquisitions): |
||||||||||
Restricted cash |
(106 | ) | 11,313 | 2,499 | ||||||
Accounts receivable |
(4,926 | ) | (47,786 | ) | (9,641 | ) | ||||
Accounts receivable—affiliate |
(511 | ) | 166 | (3,501 | ) | |||||
Prepaid expenses and other current assets |
(1,012 | ) | 4,802 | (1,772 | ) | |||||
Income taxes receivable |
(1,058 | ) | 129 | (779 | ) | |||||
Retainage receivable |
(14,587 | ) | 662 | (2,088 | ) | |||||
Other assets |
5,170 | (1,843 | ) | 7,569 | ||||||
Accounts payable and accrued expenses |
(2,372 | ) | 14,089 | 9,023 | ||||||
Income taxes payable |
(3,512 | ) | (420 | ) | (1,308 | ) | ||||
Deferred revenue |
6,907 | (6,342 | ) | (3,310 | ) | |||||
Other current liabilities |
4,067 | (5,178 | ) | (4,825 | ) | |||||
Retainage payable |
(963 | ) | (519 | ) | 1,431 | |||||
Other liabilities |
1,990 | 5,289 | (2,512 | ) | ||||||
| | | | | | | | | | | |
Net cash provided by continuing operations |
9,976 | 1,373 | 22,459 | |||||||
Net cash (used in) discontinued operations |
(408 | ) | (8,226 | ) | (16,154 | ) | ||||
| | | | | | | | | | | |
Net cash provided by (used in) operating activities |
9,568 | (6,853 | ) | 6,305 | ||||||
| | | | | | | | | | | |
Cash flows from investing activities: |
||||||||||
Purchase of businesses, net of cash acquired |
— | (4,384 | ) | (2,701 | ) | |||||
Purchase of additional interest in Engineering S.A. |
— | — | (3,556 | ) | ||||||
Payments for purchase of property and equipment |
(956 | ) | (13,508 | ) | (3,580 | ) | ||||
| | | | | | | | | | | |
Net cash used in investing activities of continuing operations |
(956 | ) | (17,892 | ) | (9,837 | ) | ||||
Net cash used in investing activities of discontinued operations |
(2,928 | ) | (694 | ) | (2,141 | ) | ||||
| | | | | | | | | | | |
Net cash used in investing activities |
(3,884 | ) | (18,586 | ) | (11,978 | ) | ||||
| | | | | | | | | | | |
Cash flows from financing activities: |
||||||||||
Due to bank |
— | — | (2 | ) | ||||||
Proceeds from secondary public offering of common stock |
— | — | 38,042 | |||||||
Proceeds from term loan borrowing |
— | — | 120,000 | |||||||
Payoff and termination of term loan |
— | — | (100,000 | ) | ||||||
Payoff and termination of revolving credit facility |
— | — | (25,500 | ) | ||||||
Payment of financing fees |
— | — | (10,065 | ) | ||||||
Payments on term loan |
(1,255 | ) | (1,240 | ) | (13,833 | ) | ||||
Net borrowings (payments) on revolving loans |
(803 | ) | 23,229 | (300 | ) | |||||
Proceeds from Philadelphia Industrial Development Corporation loan |
— | 750 | — | |||||||
Payment of holdback purchase price |
(1,531 | ) | — | — | ||||||
Dividends paid to noncontrolling interest |
(111 | ) | (253 | ) | (173 | ) | ||||
Proceeds from stock issued under employee stock purchase plan |
182 | 126 | 197 | |||||||
Proceeds from exercise of stock options |
351 | 272 | 1,032 | |||||||
Purchase of treasury stock |
— | (580 | ) | — | ||||||
| | | | | | | | | | | |
Net cash (used in) provided by financing activities |
(3,167 | ) | 22,304 | 9,398 | ||||||
| | | | | | | | | | | |
Effect of exchange rate changes on cash |
(969 | ) | (2,900 | ) | (3,982 | ) | ||||
| | | | | | | | | | | |
Net increase (decrease) in cash and cash equivalents |
1,548 | (6,035 | ) | (257 | ) | |||||
Cash and cash equivalents—beginning of year |
24,089 | 30,124 | 30,381 | |||||||
| | | | | | | | | | | |
Cash and cash equivalents—end of year |
$ | 25,637 | $ | 24,089 | $ | 30,124 | ||||
| | | | | | | | | | | |
| | | | | | | | | | | |
| | | | | | | | | | | |
See accompanying notes to consolidated financial statements.
50
HILL INTERNATIONAL, INC. AND SUBSIDIARIES
NOTES TO CONSOLIDATED FINANCIAL STATEMENTS
Note 1—The Company
Hill International, Inc. ("Hill" or the "Company") is a professional services firm that provides program management, project management, construction management and other consulting services primarily to the buildings, transportation, environmental, energy and industrial markets worldwide. Hill's clients include the U.S. federal government, U.S. state and local governments, foreign governments and the private sector.
Note 2—Liquidity
Over the years, the amount of CFR attributable to operations in the Middle East and Africa has grown to approximately 52.0% of total consolidated CFR in 2016. There has been significant political upheaval and civil unrest in this region, most notably in Libya and Iraq where the Company had substantial operations. In 2012, due to the overthrow of the Libyan government, the Company reserved a $59,937,000 receivable from the Libyan Organization for Development of Administrative Centres ("ODAC"). Subsequently, the Company received payments totaling approximately $9,511,000. In 2016, the Company established reserves of $5,078,000 against accounts receivable from various projects in Iraq. This shortfall of cash flows continues to put a considerable strain on its liquidity.
The Company continues to experience slowing of collections from its clients in the Middle East, primarily Oman. In 2012, the Company commenced operations on the Muscat International Airport (the "Oman Airport") project with the Ministry of Transport and Communications (the "MOTC") in Oman. The original contract term expired in November 2014. In October 2014, the Company applied for a twelve-month extension of time amendment (the "first extension") which was subsequently approved in March 2016 and the Company continued to work on the Oman Airport project. The Company began to experience some delays in payment during the second quarter of 2015 when MOTC commenced its formal review and certification of the Company's invoices. In October 2015, the MOTC paid the Company for work performed in April and May 2015. In December 2015, the Company began discussions with the MOTC on a second extension of time amendment ("the second extension") and has since commenced additional work, which management expects to last through approximately June 2018. MOTC resumed payments in 2016 paying the Company approximately $42,000,000 during the year and $6,153,000 in the first quarter of 2017. At December 31, 2016, accounts receivable from Oman totaled approximately $27,132,000 of which approximately $16,500,000 was past due based on contractual terms.
The delays in payments from MOTC and other foreign governments have had a negative impact on the Company's liquidity, financial covenants, financial position and results of operations. As a result, the Company has had to rely heavily on debt and equity transactions to fund its operations over the past few years.
Note 3—Discontinued Operations
In early 2016, the Company began to investigate the sale of its Construction Claims Group (the "Claims Group"). The pending sale of that segment represents a strategic shift that will have a major effect on our operations and financial results. Accordingly, the Company has classified the assets and liabilities of that segment as held for sale and has reflected its operations and cash flows as discontinued operations for all periods presented.
On December 20, 2016, the Company and its subsidiary Hill International N.V. ("Hill N.V." and, collectively with the Company, the "Sellers") entered into a Stock Purchase Agreement (the
51
HILL INTERNATIONAL, INC. AND SUBSIDIARIES
NOTES TO CONSOLIDATED FINANCIAL STATEMENTS (Continued)
Note 3—Discontinued Operations (Continued)
"Agreement") with Liberty Mergeco, Inc. (the "US Purchaser") and Liberty Bidco UK Limited (the "UK Purchaser" and, collectively with the US Purchaser, the "Purchasers") pursuant to which the Purchasers will acquire the Claims Group by the US Purchaser's acquisition of all of the stock of Hill International Consulting, Inc. from the Company and the UK Purchaser's acquisition of all of the stock of Hill International Consulting B.V. from Hill N.V. for a total purchase price of $147,000,000 in cash reduced by assumed indebtedness, as defined in the Agreement. The closing was anticipated to occur within the first quarter of 2017 but is currently expected to close on or about April 30, 2017. The Purchasers are companies controlled by funds managed by Bridgepoint Development Capital, part of international private equity group Bridgepoint.
The carrying amounts of assets and liabilities of the discontinued operations which have been classified as held for sale are as follows (in thousands):
| |
December 31, | ||||||
|---|---|---|---|---|---|---|---|
| |
2016 | 2015 | |||||
Trade receivables |
$ | 50,892 | $ | 55,864 | |||
Prepaid expense and other current assets |
3,064 | 3,269 | |||||
Income taxes receivable |
188 | 959 | |||||
| | | | | | | | |
Total current assets classified as held for sale |
$ | 54,144 | $ | 60,092 | |||
| | | | | | | | |
| | | | | | | | |
| | | | | | | | |
Property, plant and equipment |
4,617 | 4,770 | |||||
Acquired intangibles, net |
3,397 | 4,886 | |||||
Goodwill |
22,714 | 25,154 | |||||
Investments |
6 | 8 | |||||
Deferred income tax assets |
1,954 | 1,305 | |||||
Other assets |
610 | 485 | |||||
| | | | | | | | |
Total non-current assets classified as held for sale |
$ | 33,298 | $ | 36,608 | |||
| | | | | | | | |
| | | | | | | | |
| | | | | | | | |
Accounts payable |
23,406 | 23,121 | |||||
Income taxes payable |
(415 | ) | 81 | ||||
Deferred revenue |
1,562 | 1,444 | |||||
Other current liabilities |
3,150 | 2,851 | |||||
| | | | | | | | |
Total current liabilities classified as held for sale |
$ | 27,703 | $ | 27,497 | |||
| | | | | | | | |
| | | | | | | | |
| | | | | | | | |
Deferred income taxes |
2,022 | 1,536 | |||||
Deferred revenue |
1,012 | 1,998 | |||||
Other liabilities |
1,645 | 2,869 | |||||
| | | | | | | | |
Total non-current liabilities classified as held for sale |
$ | 4,679 | $ | 6,403 | |||
| | | | | | | | |
| | | | | | | | |
| | | | | | | | |
52
HILL INTERNATIONAL, INC. AND SUBSIDIARIES
NOTES TO CONSOLIDATED FINANCIAL STATEMENTS (Continued)
Note 3—Discontinued Operations (Continued)
The line items constituting earnings from discontinued operations consist of the following (in thousands):
| |
Years Ended December 31, | |||||||||
|---|---|---|---|---|---|---|---|---|---|---|
| |
2016 | 2015 | 2014 | |||||||
Consulting fee revenue |
$ | 164,478 | $ | 163,074 | $ | 148,290 | ||||
Reimbursable expenses |
4,774 | 4,955 | 5,549 | |||||||
| | | | | | | | | | | |
Total revenue |
169,252 | 168,029 | 153,839 | |||||||
| | | | | | | | | | | |
Cost of services |
73,914 | 73,521 | 65,949 | |||||||
Reimbursable expenses |
4,774 | 4,955 | 5,549 | |||||||
| | | | | | | | | | | |
Total direct expenses |
78,688 | 78,476 | 71,498 | |||||||
| | | | | | | | | | | |
Gross profit |
90,564 | 89,553 | 82,341 | |||||||
Selling, general and administrative expenses |
84,047 | 77,813 | 71,345 | |||||||
| | | | | | | | | | | |
Operating profit |
6,517 | 11,740 | 10,996 | |||||||
Interest and related financing fees, net |
12,932 | 12,637 | 28,921 | |||||||
| | | | | | | | | | | |
(Loss) earnings before income taxes |
(6,415 | ) | (897 | ) | (17,925 | ) | ||||
Income tax expense |
4,661 | 1,977 | 788 | |||||||
| | | | | | | | | | | |
Net loss from discontinued operations |
$ | (11,076 | ) | $ | (2,874 | ) | $ | (18,713 | ) | |
| | | | | | | | | | | |
| | | | | | | | | | | |
| | | | | | | | | | | |
In connection with the sale of the Construction Claims Group, the Company will be required to pay off the Secured Credit Facilities (See Note 11). Accordingly, the Company has allocated to discontinued operations all interest expense related to the Secured Credit Facilities. During 2016, the Company expensed $3,044,000 of costs related to the pending sale of the Construction Claims Group and $2,106,000 for a potential tax liability related to foreign jurisdictions (see Note 16).
Note 4—Summary of Significant Accounting Policies
(a) Basis of Presentation and Principles of Consolidation
The accompanying consolidated financial statements were prepared in accordance with accounting principles generally accepted in the United States ("GAAP"). The consolidated financial statements include the accounts of Hill International, Inc. and its majority owned subsidiaries. All intercompany balances and transactions have been eliminated in consolidation.
(b) Foreign Currency Translations and Transactions
Assets and liabilities of all foreign operations are translated at year-end rates of exchange while revenues and expenses are translated at the average monthly exchange rates. Gains or losses resulting from translating foreign currency financial statements are accumulated in a separate component of stockholders' equity entitled accumulated other comprehensive loss until the entity is sold or substantially liquidated. Gains or losses arising from foreign currency transactions (transactions denominated in a currency other than the entity's local currency) are reflected in selling, general and administrative expenses in the consolidated statement of operations.
53
HILL INTERNATIONAL, INC. AND SUBSIDIARIES
NOTES TO CONSOLIDATED FINANCIAL STATEMENTS (Continued)
Note 4—Summary of Significant Accounting Policies (Continued)
(c) Use of Estimates and Assumptions
The preparation of financial statements in conformity with GAAP requires management to make estimates and assumptions that affect the reported amounts of certain assets and liabilities and the revenue and expenses reported for the periods covered by the financial statements and certain amounts disclosed in the accompanying notes to the consolidated financial statements. Actual results could differ significantly from those estimates and assumptions. The estimates affecting the consolidated financial statements that are particularly significant include revenue recognition, allocation of purchase price to acquired intangibles and goodwill, fair value of contingent consideration, recoverability of long-lived assets, income taxes, allowance for doubtful accounts and commitments and contingencies.
(d) Fair Value Measurements
The fair value of financial instruments, which primarily consists of cash and cash equivalents, accounts receivable and accounts payable, approximates carrying value due to the short-term nature of the instruments. The carrying value of our various credit facilities approximates fair value as the interest rate is variable.
Fair value is the price that would be received from selling an asset or paid to transfer a liability in an orderly transaction between market participants at the measurement date. When determining fair value, the Company considers the principal or most advantageous market in which it would transact, and the Company considers assumptions that market participants would use when pricing the asset or liability.
Nonfinancial assets and liabilities, such as goodwill and long lived assets that are initially recorded at fair value, will be assessed for impairment, if deemed necessary. During the years ended December 31, 2016 and 2015, the Company did not record any impairment to any financial or nonfinancial assets or liabilities.
(e) Cash and Cash Equivalents
Cash and cash equivalents include cash on hand and investments in money market funds and investment grade securities held with high quality financial institutions. The Company considers all highly liquid instruments purchased with a remaining maturity of three months or less at the time of purchase to be cash equivalents.
(f) Restricted Cash
Restricted cash represents cash collateral required to be maintained in foreign bank accounts to serve as collateral for letters of credit, bonds or guarantees on several projects. The cash will remain restricted until the respective project has been completed, which typically is greater than one year.
(g) Concentrations of Credit Risk
Financial instruments that potentially subject the Company to concentrations of credit risk consist principally of cash investments and accounts receivable.
The Company maintains its cash accounts with high quality financial institutions. Although the Company currently believes that the financial institutions, with which it does business, will be able to
54
HILL INTERNATIONAL, INC. AND SUBSIDIARIES
NOTES TO CONSOLIDATED FINANCIAL STATEMENTS (Continued)
Note 4—Summary of Significant Accounting Policies (Continued)
fulfill their commitments to it, there is no assurance that those institutions will be able to continue to do so.
The Company provides professional services, under contractual arrangements, to domestic and foreign governmental units, institutions and the private sector. To reduce credit risk, the Company performs ongoing credit evaluations of its clients and does not require collateral beyond customary retainers.
The following tables show the number of the Company's clients which contributed 10% or more of total revenue and accounts receivable:
| |
Years Ended December 31, |
|||||||||
|---|---|---|---|---|---|---|---|---|---|---|
| |
2016 | 2015 | 2014 | |||||||
Number of 10% clients |
— | 1 | 1 | |||||||
Percentage of total revenue |
— | 10 | % | 13 | % | |||||
| |
December 31, | ||||||
|---|---|---|---|---|---|---|---|
| |
2016 | 2015 | |||||
Number of 10% clients |
2 | 1 | |||||
Percentage of accounts receivable |
32 | % | 19 | % | |||
The following provides information with respect to total revenue from contracts with U.S. federal government agencies:
| |
Years Ended December 31, |
|||||||||
|---|---|---|---|---|---|---|---|---|---|---|
| |
2016 | 2015 | 2014 | |||||||
Percentage of total revenue |
2 | % | 2 | % | 3 | % | ||||
| | | | | | | | | | | |
| | | | | | | | | | | |
| | | | | | | | | | | |
(h) Allowance for Doubtful Accounts
The allowance for doubtful accounts is an estimate prepared by management based on identification of the collectability of specific accounts and the overall condition of the receivable portfolios. When evaluating the adequacy of the allowance for doubtful accounts, the Company specifically analyzes trade receivables, including retainage receivable, historical bad debts, client credits, client concentrations, client credit worthiness, current economic trends and changes in client payment terms. If the financial condition of clients were to deteriorate, resulting in an impairment of their ability to make payments, additional allowances may be required. Likewise, should the Company determine that it would be able to realize more of its receivables in the future than previously estimated, an adjustment to the allowance would increase earnings in the period such determination was made. The allowance for doubtful accounts is reviewed on a quarterly basis and adjustments are recorded as deemed necessary.
55
HILL INTERNATIONAL, INC. AND SUBSIDIARIES
NOTES TO CONSOLIDATED FINANCIAL STATEMENTS (Continued)
Note 4—Summary of Significant Accounting Policies (Continued)
(i) Property and Equipment
Property and equipment is stated at cost, less accumulated depreciation and amortization. Depreciation and amortization is provided over the estimated useful lives of the assets as follows:
| |
Method | Estimated Useful Life | ||
|---|---|---|---|---|
Furniture and equipment |
Straight-line | 10 years | ||
Leasehold improvements |
Straight-line | Shorter of estimated useful life or lease term | ||
Computer equipment and software |
Straight-line | 3 to 5 years | ||
Automobiles |
Straight-line | 5 years |
The Company capitalizes costs associated with internally developed and/or purchased software systems that have reached the application development stage and meet recoverability tests. Capitalized costs include external direct costs of materials and services utilized in developing or obtaining internal-use software, payroll and payroll-related expenses for employees who are directly associated with and devote time to the internal-use software project. Capitalization of such costs begins when the preliminary project stage is complete and ceases no later than the point at which the project is substantially complete and ready for its intended purpose. Costs for general and administrative, overhead, maintenance and training, as well as the cost of software that does not add functionality to existing systems, are expensed as incurred.
Upon retirement or other disposition of these assets, the cost and related depreciation are removed from the accounts and the resulting gain or loss, if any, is reflected in results of operations. Expenditures for maintenance, repairs and renewals of minor items are charged to expense as incurred. Major renewals and improvements are capitalized.
(j) Retainage Receivable
Retainage receivable represents balances billed but not paid by clients pursuant to retainage provisions in the construction management contracts and will be due upon completion of specific tasks or the completion of the contract. The current portion of retainage receivable is included in accounts receivable and the long-term portion of retainage receivable is included in retainage receivable in the consolidated balance sheets.
(k) Long-Lived Assets
Acquired intangible assets consist of contract rights, client related intangibles and trade names arising from the Company's Project Management acquisitions. Contract rights represent the fair value of contracts in progress and backlog of an acquired entity. For intangible assets purchased in a business combination, the estimated fair values of the assets are used to establish the cost bases. Valuation techniques consistent with the market approach, the income approach and the cost approach are used to measure fair value. These assets are amortized over their estimated lives which range from three to fifteen years.
The Company reviews long-lived assets to be held-and-used for impairment whenever events or changes in circumstances indicate that the carrying amount of the assets may not be recoverable. If the sum of the undiscounted expected future cash flows over the remaining useful life of a long-lived asset is less than its carrying amount, the asset is considered to be impaired. Impairment losses are measured
56
HILL INTERNATIONAL, INC. AND SUBSIDIARIES
NOTES TO CONSOLIDATED FINANCIAL STATEMENTS (Continued)
Note 4—Summary of Significant Accounting Policies (Continued)
as the amount by which the carrying amount of the asset exceeds the fair value of the asset. When fair values are not available, the Company estimates fair value using the expected future cash flow discounted at a rate commensurate with the risks associated with the recovery of the asset. Assets to be disposed of are reported at the lower of carrying amount or fair value less costs to sell.
(l) Goodwill
Goodwill represents the excess of purchase price and other related costs over the value assigned to the net tangible and identifiable intangible assets of businesses acquired. Acquired intangible assets other than goodwill are amortized over their useful lives. For intangible assets purchased in a business combination, the estimated fair values of the assets are used to establish the cost bases. Valuation techniques consistent with the market approach and the income approach are used to measure fair value.
Goodwill is tested annually for impairment in its fiscal third quarter. The Company has determined that, due to the pending sale of its Construction Claims Group, it now has one reporting unit, the Project Management unit. The Company made that determination based on the similarity of the services provided, the methodologies in delivering its services and the similarity of the client base. Goodwill is assessed for impairment using a two-step approach. In the first step of the impairment test, the Company compares the fair value of the reporting unit to its carrying value. To the extent the carrying amount of the reporting unit exceeds its fair value, an indication exists that goodwill may be impaired and the Company must perform a second more detailed assessment. The second step, if necessary, involves allocating the reporting unit's fair value to all of its recognized and unrecognized assets and liabilities in order to determine the implied fair value of the goodwill as of the assessment date. The implied fair value of the goodwill is then compared to the carrying amount of goodwill to quantify an impairment charge as of the assessment date.
Application of the goodwill impairment test requires significant judgments including estimation of future cash flows, which is dependent on internal forecasts, estimation of the long-term rate of growth for the businesses, the useful life over which cash flows will occur, and determination of the Company's weighted average cost of capital. The Company's changes in estimates and assumptions could materially affect the determination of fair value and/or conclusions on goodwill impairment. The Company performed its annual impairment test effective July 1, 2016 and noted no impairment. In the future, the Company will continue to perform the annual test during its fiscal third quarter unless events or circumstances indicate an impairment may have occurred before that time.
At the time of the annual impairment test, the Construction Claims unit was still part of our continuing operations. Based on the valuation as of July 1, 2016, which utilized the same processes noted above, the fair value of the Construction Claims unit substantially exceeded its carrying value.
(m) Investments
The Company will, in the ordinary course, form joint ventures for specific projects. These joint ventures have historically required limited or no investment and simply provide a pass-through for the Company's billings. Any distributions in excess of the Company's billings are accounted for as income
57
HILL INTERNATIONAL, INC. AND SUBSIDIARIES
NOTES TO CONSOLIDATED FINANCIAL STATEMENTS (Continued)
Note 4—Summary of Significant Accounting Policies (Continued)
when received. The Company's cost-basis investments at December 31, 2016 and 2015 are as follows (in thousands):
| |
December 31, | ||||||
|---|---|---|---|---|---|---|---|
| |
2016 | 2015 | |||||
RAMPED Metro Joint Venture(1) |
$ | 767 | $ | 4,696 | |||
Concessia, Cartera y Gestion de Infrastructuras S.A.(2) |
2,515 | 2,927 | |||||
Other |
299 | 755 | |||||
| | | | | | | | |
|
$ | 3,581 | $ | 8,378 | |||
| | | | | | | | |
| | | | | | | | |
| | | | | | | | |
- (1)
- The
Company has a 45% interest in this joint venture which was formed for construction management of the Riyadh Metro system in Saudi Arabia.
- (2)
- The Company has a 4.45% interest in this entity which invests in the equity of companies which finance, construct and operate various public and private infrastructure projects in Spain.
(n) Deferred Revenue
In certain instances the Company may collect advance payments from clients for future services. Upon receipt, the payments are reflected as deferred revenue in the Company's consolidated balance sheet. As the services are performed, the Company reduces the balance and recognizes revenue.
(o) Deferred Rent
Rent expenses for operating leases which include scheduled rent increases is determined by expensing the total amount of rent due over the life of the operating lease on a straight-line basis. The difference between the rent paid under the terms of the lease and the rent expensed on a straight-line basis is recorded as a liability. The deferred rent at December 31, 2016 and 2015 was $2,830,000 and $1,732,000, respectively, and is included in other liabilities in the consolidated balance sheet.
(p) Income Taxes
The Company estimates income taxes in each of the jurisdictions in which it operates. This process involves estimating its actual current tax exposure together with assessing temporary differences resulting from differing treatment of items for tax and accounting purposes. These differences result in deferred tax assets and liabilities, which are included within the Company's consolidated balance sheets. The Company assesses the likelihood that the deferred tax assets will be recovered from future taxable income and to the extent it believes recovery is not likely, the Company establishes a valuation allowance. To the extent the Company establishes a valuation allowance in a period, it must include an expense within the tax provision in the consolidated statements of earnings. The Company has recorded a valuation allowance to reduce the deferred tax asset to an amount that is more likely to be realized in future years. If the Company determines in the future that it is more likely that the deferred tax assets subject to the valuation allowance will be realized, then the previously provided valuation allowance will be adjusted.
58
HILL INTERNATIONAL, INC. AND SUBSIDIARIES
NOTES TO CONSOLIDATED FINANCIAL STATEMENTS (Continued)
Note 4—Summary of Significant Accounting Policies (Continued)
The Company recognizes a tax benefit in the financial statements for an uncertain tax position only if management's assessment is that the position is "more likely than not" (i.e., a likelihood greater than 50 percent) to be allowed by the tax jurisdiction based solely on the technical merits of the position. The term "tax position" refers to a position in a previously filed tax return or a position expected to be taken in a future tax return that is reflected in measuring current or deferred income tax assets and liabilities for interim or annual periods.
(q) Revenue Recognition
The Company generates revenue primarily from providing professional services to its clients. Revenue is generally recognized upon the performance of services. In providing these services, the Company may incur reimbursable expenses, which consist principally of amounts paid to subcontractors and other third parties and travel and other job related expenses that are contractually reimbursable from clients. The Company has determined that it will include reimbursable expenses in computing and reporting its total revenue as long as the Company remains responsible to the client for the fulfillment of the contract and for the overall acceptability of all services provided.
The Company earns its revenue from time-and-materials, cost-plus and fixed-price contracts. If estimated total costs on any contract indicate a loss, the Company charges the entire estimated loss to operations in the period the loss becomes known. The cumulative effect of revisions to revenue, estimated costs to complete contracts, including penalties, incentive awards, change orders, claims, anticipated losses, and others are recorded in the accounting period in which the events indicating a loss are known and the loss can be reasonably estimated. Such revisions could occur at any time and the effects may be material.
Time-and-Materials Contracts
Under its time-and-materials contracts, the Company negotiates hourly billing rates and charges its clients based on the actual time that the Company spends on a project. In addition, clients reimburse the Company for its actual out-of-pocket costs of materials and other direct incidental expenditures that the Company incurs in connection with its performance under the contract. Its profit margins on time-and-materials contracts fluctuate based on actual labor and overhead costs that the Company directly charges or allocates to contracts compared with negotiated billing rates. Revenue on these contracts are recognized based on the actual number of hours the Company spends on the projects plus any actual out-of-pocket costs of materials and other direct incidental expenditures that the Company incurs on the projects. Its time-and-materials contracts generally include annual billing rate adjustment provisions.
Cost-Plus Contracts
The Company has two major types of cost-plus contracts:
Cost-Plus Fixed Fee
Under cost-plus fixed fee contracts, the Company charges its clients for its costs, including both direct and indirect costs, plus a fixed negotiated fee. In negotiating a cost-plus fixed fee contract, the Company estimates all recoverable direct and indirect costs and then adds a fixed profit component. The total estimated cost plus the negotiated fee represents the total contract value. The Company recognizes revenue based on the actual labor costs, based on hours of labor effort, plus non-labor costs
59
HILL INTERNATIONAL, INC. AND SUBSIDIARIES
NOTES TO CONSOLIDATED FINANCIAL STATEMENTS (Continued)
Note 4—Summary of Significant Accounting Policies (Continued)
the Company incurs, plus the portion of the fixed fee the Company has earned to date. The Company invoices for its services as revenue is recognized or in accordance with agreed-upon billing schedules. Aggregate revenue from cost-plus fixed fee contracts may vary based on the actual number of labor hours worked and other actual contract costs incurred. However, if actual labor hours and other contract costs exceed the original estimate agreed to by its client, the Company generally must obtain a change order, contract modification, or successfully prevail in a claim in order to receive additional revenue relating to the additional costs (see "Change Orders and Claims").
Cost-Plus Fixed Rate
Under its cost-plus fixed rate contracts, the Company charges clients for its costs plus negotiated rates based on its indirect costs. In negotiating a cost-plus fixed rate contract, the Company estimates all recoverable direct and indirect costs and then adds a profit component, which is a percentage of total recoverable costs to arrive at a total dollar estimate for the project. The Company recognizes revenue based on the actual total number of labor hours and other costs the Company expends at the cost plus the fixed rate the Company negotiated. Similar to cost-plus fixed fee contracts, aggregate revenue from cost-plus fixed rate contracts may vary and the Company generally must obtain a change order, contract modification, or successfully prevail in a claim in order to receive additional revenue relating to any additional costs that exceed the original contract estimate (see "Change Orders and Claims").
Labor costs and subcontractor services are the principal components of its direct costs on cost-plus contracts, although some include materials and other direct costs. Some of these contracts include a provision that the total actual costs plus the fee will not exceed a guaranteed price negotiated with the client. Others include rate ceilings that limit the reimbursement for general and administrative costs, overhead costs and materials handling costs. The accounting for these contracts appropriately reflects such guaranteed price or rate ceilings.
Firm Fixed-Price ("FFP") Contracts
The Company's FFP contracts have historically accounted for most of its fixed-price contracts. Under FFP contracts, the Company's clients pay an agreed amount negotiated in advance for a specified scope of work. The Company recognizes revenue on FFP contracts using the percentage-of-completion method (recognizing revenue as costs are incurred). Profit margins the Company recognizes in all periods prior to completion of the project on any FFP contract depend on the accuracy of the Company's estimates of approximate revenue and expenses and will increase to the extent that its current estimates of aggregate actual costs are below amounts previously estimated. Conversely, if the Company's current estimated costs exceed prior estimates, its profit margins will decrease and the Company may realize a loss on a project. In order to increase aggregate revenue on the contract, the Company generally must obtain a change order, contract modification, or successfully prevail in a claim in order to receive payment for the additional costs (see "Change Orders and Claims").
Change Orders and Claims
Change orders are modifications of an original contract that effectively change the provisions of the contract without adding new provisions. Either the Company or its client may initiate change orders. They may include changes in specifications or design, manner of performance, facilities,
60
HILL INTERNATIONAL, INC. AND SUBSIDIARIES
NOTES TO CONSOLIDATED FINANCIAL STATEMENTS (Continued)
Note 4—Summary of Significant Accounting Policies (Continued)
equipment, materials, sites and period of completion of the work. Claims are amounts in excess of the agreed contract price that the Company seeks to collect from its clients or others for client-caused delays, errors in specifications and designs, contract terminations, change orders that are either in dispute or are unapproved as to both scope and price, or other causes of unanticipated additional contract costs.
Change orders and claims occur when changes are experienced once contract performance is underway. Change orders are sometimes documented and terms of such change orders are agreed with the client before the work is performed. Sometimes circumstances require that work progresses before agreement is reached with the client. Costs related to change orders and claims are recognized when they are incurred. Change orders and claims are included in total estimated contract revenue when it is probable that the change order or claim will result in a bona fide addition to contract value that can be reliably estimated. No profit is recognized on claims until final settlement occurs; unapproved change orders are evaluated as claims. This can lead to a situation where costs are recognized in one period and revenue is recognized when client agreement is obtained or claims resolution occurs, which can be in subsequent periods.
The Company has contracts with the U.S. government that contain provisions requiring compliance with the U.S. Federal Acquisition Regulations ("FAR"). These regulations are generally applicable to all of its federal government contracts and are partially or fully incorporated in many local and state agency contracts. They limit the recovery of certain specified indirect costs on contracts subject to the FAR. Cost-plus contracts covered by the FAR provide for upward or downward adjustments if actual recoverable costs differ from the estimate billed under forward pricing arrangements. Most of its federal government contracts are subject to termination at the convenience of the client. Contracts typically provide for reimbursement of costs incurred and payment of fees earned through the date of such termination.
Federal government contracts which are subject to the FAR and some state and local governmental agencies require audits, which are performed for the most part by the Defense Contract Audit Agency ("DCAA"). The DCAA audits the Company's overhead rates, cost proposals, incurred government contract costs, and internal control systems. During the course of its audits, the DCAA may question incurred costs if it believes the Company has accounted for such costs in a manner inconsistent with the requirements of the FAR or Cost Accounting Standards and recommend that its U.S. government corporate administrative contracting officer disallow such costs. Historically, the Company has not experienced significant disallowed costs as a result of such audits. However, the Company can provide no assurance that the DCAA audits will not result in material disallowances of incurred costs in the future.
(r) Share-Based Compensation
The Company uses the Black-Scholes option pricing model to measure the estimated fair value of options to purchase the Company's common stock. The compensation expense, less estimated forfeitures, is being recognized over the service period on a straight-line basis. The Company's policy is to use newly issued shares to satisfy the exercise of stock options.
61
HILL INTERNATIONAL, INC. AND SUBSIDIARIES
NOTES TO CONSOLIDATED FINANCIAL STATEMENTS (Continued)
Note 4—Summary of Significant Accounting Policies (Continued)
(s) Advertising Costs
Advertising costs are expensed as incurred and amounted to the following (in thousands):
| Years Ended December 31, | |||||||
|---|---|---|---|---|---|---|---|
| 2016 | 2015 | 2014 | |||||
| $556 | $ | 421 | $ | 536 | |||
| | | | | | | | |
| | | | | | | | |
| | | | | | | | |
(t) Earnings per Share
Basic earnings per common share has been computed using the weighted-average number of shares of common stock outstanding during the year. Diluted earnings per common share incorporates the incremental shares issuable upon the assumed exercise of stock options using the treasury stock method.
Dilutive stock options increased average common shares outstanding by approximately 437,000 shares for the year ended December 31, 2015.
Options to purchase 6,899,000 shares, 3,849,000 shares and 3,521,000 shares of the Company's common stock were not included in the calculation of common shares outstanding for the years ended December 31, 2016, 2015 and 2014, respectively, because they were anti-dilutive.
The following table provides a reconciliation to net (loss) earnings used in the numerator for (loss) earnings per share from continuing operations (in thousands):
| |
2016 | 2015 | 2014 | |||||||
|---|---|---|---|---|---|---|---|---|---|---|
(Loss) earnings from continuing operations |
$ | (7,616 | ) | $ | 10,613 | $ | 13,866 | |||
Less: net earnings—noncontrolling interest |
136 | 808 | 1,301 | |||||||
| | | | | | | | | | | |
(Loss) earnings |
$ | (7,752 | ) | $ | 9,805 | $ | 12,565 | |||
| | | | | | | | | | | |
| | | | | | | | | | | |
| | | | | | | | | | | |
(u) New Accounting Pronouncements
In May 2014, the Financial Accounting Standards Board ("FASB") issued Accounting Standards Update ("ASU") No. 2014-09, Revenue from Contracts with Customers, which will replace most existing revenue recognition guidance in U.S. GAAP, including industry-specific guidance. The core principle of the ASU is that an entity should recognize revenue for the transfer of goods or services equal to the amount that it expects to be entitled to receive for those goods or services. The ASU requires additional disclosure about the nature, amount, timing and uncertainty of revenue and cash flows arising from customer contracts, including significant judgments and changes in judgments. The ASU allows for both retrospective and prospective methods of adoption. The ASU was to be effective for interim and annual periods commencing after December 15, 2016, however, in August 2015, the FASB issued ASU 2015-14 which defers the effective date for one year. Early adoption is permitted as of January 1, 2017. In December 2016, the FASB issued ASU 2016-20, Technical Corrections and Improvements to Topic 606, 'Revenue From Contracts With Customers,"' which made minor changes to certain narrow aspects of the guidance. The Company anticipates that it will use the modified retrospective method of adoption in which the cumulative effect of applying the ASU will be recognized at January 1, 2018, the date of initial application. The Company is in the process of
62
HILL INTERNATIONAL, INC. AND SUBSIDIARIES
NOTES TO CONSOLIDATED FINANCIAL STATEMENTS (Continued)
Note 4—Summary of Significant Accounting Policies (Continued)
determining the method of adoption and assessing the impact of this ASU on its consolidated financial statements.
In August 2014, the FASB issued Accounting Standards Update No. 2014-15, Disclosure of Uncertainties about an Entity's Ability to Continue as a Going Concern ("ASU 2014-15"). The objective of ASU 2014-15 is to provide guidance in GAAP about management's responsibility to evaluate whether there is substantial doubt about an entity's ability to continue as a going concern and to provide related footnote disclosures. ASU 2014-15 requires a management evaluation about whether there are conditions or events, considered in the aggregate, that raise substantial doubt about an entity's ability to continue as a going concern within one year after the date the financial statements are issued or available to be issued. In doing so, ASU 2014-15 should reduce diversity in the timing and content of footnote disclosures. ASU 2014-15 is effective for fiscal years ending after December 15, 2016. The Company has adopted this guidance effective for its year ended December 31, 2016.
In January 2016, the FASB issued ASU 2016-01, Financial Instruments—Overall (Topic 825-10), which requires all equity investments to be measured a fair value with changes in fair value recognized through net income (other than those accounted for under equity method of accounting or those that result in consolidation of the investee). The amendments in this ASU also require an entity to (1) present separately in other comprehensive income the portion of the total change in the fair value of a liability resulting from a change in the instrument-specific credit risk when the entity has elected to measure the liability at fair value in accordance with the fair value option for financial instruments and (2) provide separate presentation of financial assets and financial liabilities by measurement category and form of financial asset on the balance sheet or the accompanying notes to the financial statements. In addition the amendments in this Update eliminate the requirement to disclose the method(s) and significant assumptions used to estimate the fair value that is required to be disclosed for financial instruments measured at amortized cost on the balance sheet. This ASU is effective for the Company commencing January 1, 2018. The Company is in the process of assessing the impact of this ASU on its consolidated financial statements.
In February 2016, the FASB issued ASU 2016-02, Leases (Topic 842), which will require the Company the recognize lease assets and lease liabilities (related to leases previously classified as operating under previous GAAP) on its consolidated balance sheet. The ASU will be effective for the Company commencing January 1, 2019. The Company is in the process of assessing the impact of this ASU on its consolidated financial statements.
In June 2016, the FASB issued ASU 2016-13, Financial Instruments (Topic 326)—Credit Losses: Measurement of Credit Losses on Financial Instruments, which provides guidance regarding the measurement of credit losses on financial instruments. The new guidance replaces the incurred loss impairment methodology in the current guidance with a methodology that reflects expected credit losses and requires consideration of a broader range of reasonable and supportable information to determine credit loss estimates. This ASU will be effective for us commencing January 1, 2020 with early adoption permitted commencing January 1, 2019. We are in the process of assessing the impact of this ASU on our consolidated financial statements.
In August 2016, the FASB issued ASU 2016-15, Statement of Cash Flows (Topic 230): Classification of Certain Cash Receipts and Cash Payments. The primary purpose of the ASU is to reduce the diversity in practice that has resulted from the lack of consistent principles on this topic. This ASU's amendments add or clarify guidance on eight cash flow issues: debt prepayment, settlement of zero-coupon debt instruments, contingent consideration payments, insurance claim proceeds, life
63
HILL INTERNATIONAL, INC. AND SUBSIDIARIES
NOTES TO CONSOLIDATED FINANCIAL STATEMENTS (Continued)
Note 4—Summary of Significant Accounting Policies (Continued)
insurance proceeds, distributions from equity method investees, beneficial interests in securitization transactions and separately identifiable cash flows and application of the predominance principle. The ASU is effective commencing January 1, 2018 with earlier adoption permitted. We adopted this ASU which only affected our presentation of payments for deferred consideration related to the IMS acquisition by reclassifying the payments from operating cash flows to financing cash flows.
In October 2016, the FASB issued ASU 2016-16, Income Taxes (Topic 740): Intra-Entity Transfers of Assets Other Than Inventory. Under the new standard, an entity is required to recognize the income tax consequences of an intra-entity transfer of an asset (with the exception of inventory) when the transfer occurs. Under current GAAP, entities are prohibited from recognizing current and deferred income taxes for an intra-entity transfer until the asset is sold to a third party. Examples of assets that would be affected by the new guidance are intellectual property and property, plant, and equipment. The ASU will be effective for us commencing January 1, 2018 with early adoption permitted as of January 1, 2017. We expect that adoption of this ASU will not have a material effect on our consolidated financial statements.
In November 2016, the FASB issued ASU 2016-18, Restricted Cash (a consensus of the FASB Emerging Issues Task Force), which addresses classification and presentation of changes in restricted cash on the statement of cash flows. The ASU requires an entity's reconciliation of the beginning-of-period and end-of-period total amounts shown on the statement of cash flows to include in cash and cash equivalents amounts generally described as restricted cash and restricted cash equivalents. The ASU does not define restricted cash or restricted cash equivalents, but the Company will need to disclose the nature of the restrictions. The ASU is effective for the Company for annual and interim periods in fiscal years beginning after December 15, 2017. Early adoption is permitted. When the Company adopts the ASU, it will use a retrospective transition method for each period presented.
In January 2017, the FASB issued ASU 2017-01, amending Business Combinations: Clarifying the Definition of a Business, to clarify the definition of a business with the objective of providing a more robust framework to assist management when evaluating whether transactions should be accounted for as acquisitions (or disposals) of assets or businesses. The standard will be effective for the Company for its fiscal year beginning April 1, 2018, including interim periods within that fiscal year, with early application permitted. The amendments are to be applied prospectively to business combinations that occur after the effective date.
Note 5—Acquisitions
Our recent acquisition activity is detailed below. The Company's consolidated financial statements include the operating results of these businesses from their respective dates of acquisition. Pro forma results of operations for these acquisitions have not been presented because they are not material to the Company's consolidated results of operations, either individually or in the aggregate.
The Company expenses all acquisition-related costs plus any anticipated restructuring costs for which it is not obligated at the acquisition date, rather than including such costs as a component of the purchase consideration. During 2016, 2015 and 2014, the Company expensed $0, $139,000 and $0, respectively, of acquisition-related costs.
64
HILL INTERNATIONAL, INC. AND SUBSIDIARIES
NOTES TO CONSOLIDATED FINANCIAL STATEMENTS (Continued)
Note 5—Acquisitions (Continued)
IMS Proje Yonetimi ve Danismanlik A.S.
On April 15, 2015, the Company acquired all of the equity interests of IMS, a firm that provides project management services for international developers, institutional investors and major retailers. IMS had approximately 80 professionals and is headquartered in Istanbul, Turkey. Consideration consisted of an Initial Purchase Price of 12,411,000 Turkish Lira ("TRY") (approximately $4,640,000 as of the closing date) comprised of TRY 4,139,000 (approximately $1,547,000) paid in cash on the closing date plus a second payment of TRY 8,272,000 (approximately $3,145,000) which was paid on May 12, 2015; a Holdback Purchase Price of TRY 4,400,000 (approximately $1,626,000) which was paid on April 15, 2016, less any set off related to certain indemnification obligations; and a potential Additional Purchase Price of (i) TRY 1,700,000 (approximately $628,000) if earnings before interest, income taxes, depreciation and amortization for the twelve month period subsequent to the closing date ("EBITDA") exceeds TRY 3,500,000 (approximately $1,294,000) or (ii) TRY 1,500,000 ($554,000) if EBITDA is less than TRY 3,500,000 but not less than TRY 3,200,000 ($1,183,000). IMS's EBITDA through the one-year anniversary of the acquisition date was not sufficient to earn any of the Additional Purchase Price and the liability was eliminated by a credit of approximately $673,000 to selling, general and administrative expenses for the year ended December 31, 2016.
Collaborative Partners, Inc.
On December 23, 2013, Hill acquired all of the outstanding common stock of Collaborative Partners, Inc. ("CPI"), a firm that provides project management, strategic planning and regulatory services for healthcare, life sciences, educational, commercial and residential construction projects throughout New England. CPI, which has about 30 professionals, has offices in Boston, Massachusetts and Providence, Rhode Island. The acquisition expands the Company's project management business in the New England region of the United States. At closing, the sellers received $2,450,000 in the form of 678,670 shares of the Company's common stock priced at $3.61 per share. On March 7, 2014, the sellers received 171,308 shares of common stock with a value of $618,000 representing CPI's common equity in excess of $600,000. On December 23, 2014, the sellers were to receive, subject to potential offset, an additional $350,000 ("holdback") in shares of common stock; the number of shares was determined based on the average closing price of the common stock for the ten trading days ending on December 18, 2014. The Agreement also provided that should the price of the Company's common stock not increase by 50% to $5.42 on December 23, 2014, the Company will issue additional shares to the sellers representing the difference between $5.42 and the price on December 23, 2014 and (2) the sellers are entitled to receive additional shares of the Company's common stock for (i) 50% of the operating profit of CPI in excess of $1,000,000 for the first 12-month period after closing, but in no event more than $500,000, and (ii) 5% of the net revenue backlog in excess of $10,000,000 on the date 60 days after closing. The Company estimated and accrued $2,697,000 for the potential additional consideration which was included in other current liabilities in the consolidated balance sheet at December 31, 2013. In April 2014, the portion of the liability attributable to the change in the common stock price was waived by the sellers and the liability was eliminated by a credit of $1,225,000 to selling, general and administrative expenses in the consolidated statement of operations for the year ended December 31, 2014. In addition, a portion of the liability attributable to the holdback in shares was not paid and $215,000 was credited to selling, general and administrative expense in the consolidated statement of operations for the year ended December 31, 2014. In May 2015, the Company paid the final installment to the sellers by issuing 148,460 shares of its common stock valued at approximately $530,000.
65
HILL INTERNATIONAL, INC. AND SUBSIDIARIES
NOTES TO CONSOLIDATED FINANCIAL STATEMENTS (Continued)
Note 5—Acquisitions (Continued)
Engineering S.A.
On February 28, 2011, the Company's subsidiary, Hill Spain, indirectly acquired 60% of the outstanding common stock of Engineering S.A., now known as Hill International do Brasil, S.A. ("ESA") one of the largest project management firms in Brazil with approximately 400 professionals. It has main offices in Rio de Janeiro and Sao Paulo and an additional office in Parauapebas. Engineering S.A. provides project management, construction management and engineering consulting services throughout Brazil. Total consideration will not exceed 42,000,000 Brazilian Reais ("BRL") (approximately $25,336,000 at the date of acquisition) consisting of an initial cash payment of BRL 22,200,000 (approximately $13,392,000) plus minimum additional payments of BRL 7,400,000 (approximately $4,464,000) due on each of April 30, 2012 and 2013 and a potential additional payment of BRL 5,000,000 ($3,016,000). Also, ESA's shareholders entered into an agreement whereby the minority shareholders have a right to compel ("ESA Put Option") Hill Spain to purchase any or all of their shares during the period from February 28, 2014 to February 28, 2021. Hill Spain also has the right to compel ("ESA Call Option") the minority shareholders to sell any or all of their shares during the same time period. The purchase price for such shares shall be seven times the earnings before interest and taxes for ESA's most recently ended fiscal year, net of any financial debt plus excess cash multiplied by a percentage which the shares to be purchased bear to the total number of shares outstanding at the time of purchase, but in the event the ESA Call Option is exercised by Hill Spain, the purchase price shall be increased by five percent. The ESA Put Option and the ESA Call Option must be made within three months after the audited financial statements of ESA have been completed. In April 2014, two of the minority shareholders exercised their ESA Put Option whereby Hill Spain paid approximately 7,838,000 Brazilian Reais (approximately $3,556,000) in October 2014. After the transaction, Hill Spain owned approximately 72% of ESA. In accordance with the guidance in ASC 810-10-45-23, under Changes in the Parent's Ownership Interest in a Subsidiary When There Is No Change in Control, the Company has accounted for this transaction as an equity transaction. Accordingly, Hill Spain reduced noncontrolling interests by BRL 5,839,000 (approximately $2,649,000), and reduced additional paid in capital by approximately BRL 1,999,000 (approximately $907,000) which represents the excess of the fair value over the amount of the adjustment to noncontrolling interests.
The Company estimated the fair value of the potential additional payments to total approximately BRL17,200,000 (approximately $10,376,000) and discounted that amount using an interest rate of 4.72%, the weighted average interest rate on the outstanding borrowings under the Company's credit agreement at the acquisition date. The Company paid the first installment amounting to BRL 6,624,000 (approximately $3,508,000 on April 30, 2012 and paid the second installment amounting to BRL 11,372,000 (approximately $5,095,000) on July 23, 2013.
In April 2015, two shareholders who owned approximately 19% of ESA exercised their ESA Put Options claiming an aggregate value of BRL 10,645,000. As an incentive to the sellers to receive Hill's common stock as payment, the Company offered the sellers a 25% premium. The sellers countered the Company's offer by requesting payment in common stock at the U.S. dollar value on April 4, 2015 (approximately $4,374,000) as well as a price guarantee upon the sale of the stock during a 30-day period after closing. The Company agreed to the counter offer and paid the liability with 924,736 shares of its common stock in August 2015. In November 2015, the Company paid approximately $580,000 to the selling shareholders to repurchase 129,648 shares of its common stock. The Company now owns approximately 91% of ESA.
On June 17, 2016, the three remaining minority shareholders exercised their ESA Put Option claiming a value of BRL 8,656,000 (approximately $2,659,000 at December 31, 2016. The company accrued the liability which is included in other current liabilities and as an adjustment to additional paid-in capital in the consolidated balance sheet at December 31, 2016. The amount is subject to negotiation and any difference will be recorded upon completion of the transaction.
66
HILL INTERNATIONAL, INC. AND SUBSIDIARIES
NOTES TO CONSOLIDATED FINANCIAL STATEMENTS (Continued)
Note 6—Accounts Receivable
The components of accounts receivable are as follows (in thousands):
| |
December 31, | ||||||
|---|---|---|---|---|---|---|---|
| |
2016 | 2015 | |||||
Billed |
$ | 200,134 | $ | 216,618 | |||
Retainage, current portion |
10,824 | 13,660 | |||||
Unbilled |
24,678 | 17,810 | |||||
| | | | | | | | |
|
235,636 | 248,088 | |||||
Allowance for doubtful accounts |
(71,082 | ) | (60,535 | ) | |||
| | | | | | | | |
Total |
$ | 164,554 | $ | 187,553 | |||
| | | | | | | | |
| | | | | | | | |
| | | | | | | | |
Unbilled receivables primarily represent revenue earned on contracts, which the Company is contractually precluded from billing until predetermined future dates.
The decrease in accounts receivable in 2016 is attributable to the decrease in revenues, the increase in the allowance for bad debts, and the impact of foreign exchange, offset to some degree by a slowdown of collections primarily in the Middle East and particularly Oman.
Included in billed receivables are $673,000 and $694,000 of the amounts due from various branches of the U.S. federal government and $100,409,000 and $131,015,000 of receivables from foreign governments at December 31, 2016 and December 31, 2015, respectively.
Bad debt expense of $14,454,000, $6,262,000 and ($5,195,000) is included in selling, general and administrative expenses in the consolidated statements of operations for the years ended December 31, 2016, 2015 and 2014, respectively. The increase in bad debt expense in 2016 is related to certain accounts receivable, primarily in the Middle East.
In 2012, the Company commenced operations on the Muscat International Airport (the "Oman Airport") project with the Ministry of Transport and Communications (the "MOTC") in Oman. The original contract term expired in November 2014. In October 2014, the Company applied for a twelve-month extension of time amendment (the "first extension") which was subsequently approved in March 2016 and the Company continued to work on the Oman Airport project. The Company began to experience some delays in payment during the second quarter of 2015 when MOTC commenced its formal review and certification of the Company's invoices. In December 2015, the Company began discussions with the MOTC on a second extension of time amendment (the "second extension") and has since commenced additional work, which management expects to last approximately 18 months. When the MOTC resumed payments in 2016, the Company received approximately $42,000,000 during the year. At December 31, 2016, accounts receivable from Oman totaled approximately $27,132,000, of which approximately $16,500,000 was past due based on contractual terms. In February 2017, the Company received payments totalling $6,153,000 against this receivable.
In addition, there is approximately $16,400,000 included in non-current Retainage Receivable in the consolidated balance sheet at December 31, 2016. Of that amount, approximately $8,400,000 relates to retention and approximately $8,000,000 relates to a Defect and Liability Period ("DLP"). Retention represents five percent of each monthly invoice which is retained by MOTC. Fifty percent of the retention will be released one year from the commencement of the DLP and the balance will be release upon the issuance of final Completion Certificates. DLP represents the period by which the
67
HILL INTERNATIONAL, INC. AND SUBSIDIARIES
NOTES TO CONSOLIDATED FINANCIAL STATEMENTS (Continued)
Note 6—Accounts Receivable (Continued)
contractor must address any defect issues. This period commences upon the issuance of a "Taking Over Certificate" (by MOTC) to contractors for up to a period of 24 months and then final certificate closing the project.
The delays in payments from MOTC and other foreign governments have had a negative impact on the Company's liquidity, financial covenants, financial position and results of operations.
Note 7—Property and Equipment
The components of property and equipment are as follows (in thousands):
| |
December 31, | ||||||
|---|---|---|---|---|---|---|---|
| |
2016 | 2015 | |||||
Furniture and equipment |
$ | 10,434 | $ | 9,625 | |||
Leasehold improvements |
8,615 | 9,914 | |||||
Automobiles |
844 | 1,131 | |||||
Computer equipment and software |
28,881 | 26,887 | |||||
| | | | | | | | |
|
48,774 | 47,557 | |||||
Less accumulated depreciation and amortization |
(31,987 | ) | (28,576 | ) | |||
| | | | | | | | |
Property and equipment, net |
$ | 16,787 | $ | 18,981 | |||
| | | | | | | | |
| | | | | | | | |
| | | | | | | | |
Information with respect to depreciation expense is as follows (in thousands):
| |
Years Ended December 31, | |||||||||
|---|---|---|---|---|---|---|---|---|---|---|
| |
2016 | 2015 | 2014 | |||||||
Total depreciation expense |
$ | 4,108 | $ | 3,556 | $ | 2,604 | ||||
| | | | | | | | | | | |
| | | | | | | | | | | |
| | | | | | | | | | | |
Portion charged to cost of services |
$ | 890 | $ | 813 | $ | 841 | ||||
| | | | | | | | | | | |
| | | | | | | | | | | |
| | | | | | | | | | | |
Portion charged to selling, general and administrative expense |
$ | 3,218 | $ | 2,743 | $ | 1,763 | ||||
| | | | | | | | | | | |
| | | | | | | | | | | |
| | | | | | | | | | | |
Note 8—Intangible Assets
The following table summarizes the Company's acquired intangible assets (in thousands):
| |
December 31, | ||||||||||||
|---|---|---|---|---|---|---|---|---|---|---|---|---|---|
| |
2016 | 2015 | |||||||||||
| |
Gross Carrying Amount |
Accumulated Amortization |
Gross Carrying Amount |
Accumulated Amortization |
|||||||||
Client relationships |
$ | 16,699 | $ | 11,298 | $ | 19,851 | $ | 12,464 | |||||
Acquired contract rights |
2,058 | 1,912 | 11,801 | 10,832 | |||||||||
Trade names |
2,339 | 1,139 | 2,524 | 1,107 | |||||||||
| | | | | | | | | | | | | | |
Total |
$ | 21,096 | $ | 14,349 | $ | 34,176 | $ | 24,403 | |||||
| | | | | | | | | | | | | | |
| | | | | | | | | | | | | | |
| | | | | | | | | | | | | | |
Intangible assets, net |
$ | 6,747 | $ | 9,773 | |||||||||
| | | | | | | | | | | | | | |
| | | | | | | | | | | | | | |
| | | | | | | | | | | | | | |
68
HILL INTERNATIONAL, INC. AND SUBSIDIARIES
NOTES TO CONSOLIDATED FINANCIAL STATEMENTS (Continued)
Note 8—Intangible Assets (Continued)
Amortization expense related to intangible assets was as follows (in thousands):
| Years Ended December 31, | |||||||
|---|---|---|---|---|---|---|---|
| 2016 | 2015 | 2014 | |||||
| $3,045 | $ | 4,353 | $ | 4,500 | |||
| | | | | | | | |
| | | | | | | | |
| | | | | | | | |
The following table presents the estimated amortization expense based on our present intangible assets for the next five years (in thousands):
Years Ending December 31,
|
Estimated Amortization Expense |
|||
|---|---|---|---|---|
2017 |
$ | 2,187 | ||
2018 |
1,276 | |||
2019 |
1,189 | |||
2020 |
928 | |||
2021 |
542 | |||
Note 9—Goodwill
The addition to goodwill in 2015 is due to the acquisition of IMS (see Note 5 for further information).
The following table summarizes the changes in the Company's carrying value of goodwill during 2016 and 2015 (in thousands):
Balance, December 31, 2014 |
$ | 53,669 | ||
Additions |
3,783 | |||
Translation adjustments |
(7,713 | ) | ||
| | | | | |
Balance, December 31, 2015 |
49,739 | |||
Translation adjustments |
926 | |||
| | | | | |
Balance, December 31, 2016 |
$ | 50,665 | ||
| | | | | |
| | | | | |
| | | | | |
69
HILL INTERNATIONAL, INC. AND SUBSIDIARIES
NOTES TO CONSOLIDATED FINANCIAL STATEMENTS (Continued)
Note 10—Accounts Payable and Accrued Expenses
Below are the components of accounts payable and accrued expenses (in thousands):
| |
December 31, | ||||||
|---|---|---|---|---|---|---|---|
| |
2016 | 2015 | |||||
Accounts payable |
$ | 30,944 | $ | 38,094 | |||
Accrued payroll and related expenses |
31,095 | 35,024 | |||||
Accrued subcontractor fees |
9,188 | 5,864 | |||||
Accrued agency fees |
5,702 | 6,282 | |||||
Accrued legal and professional fees |
2,223 | 1,114 | |||||
Other accrued expenses |
4,840 | 2,958 | |||||
| | | | | | | | |
|
$ | 83,992 | $ | 89,336 | |||
| | | | | | | | |
| | | | | | | | |
| | | | | | | | |
Note 11—Notes Payable and Long-Term Debt
Outstanding debt obligations are as follows (in thousands):
| |
December 31, | ||||||
|---|---|---|---|---|---|---|---|
| |
2016 | 2015 | |||||
2014 Term Loan Facility |
$ | 112,884 | $ | 112,906 | |||
2014 Domestic Revolving Credit Facility |
16,500 | 17,500 | |||||
2014 International Revolving Credit Facility |
11,102 | 10,715 | |||||
Borrowings under revolving credit facilities with a consortium of banks in Spain |
2,962 | 3,013 | |||||
Borrowing from Philadelphia Industrial Development Corporation |
655 | 710 | |||||
Other notes payable |
— | 139 | |||||
| | | | | | | | |
|
144,103 | 144,983 | |||||
Less current maturities |
1,983 | 4,357 | |||||
| | | | | | | | |
Notes payable and long-term debt, net of current maturities |
$ | 142,120 | $ | 140,626 | |||
| | | | | | | | |
| | | | | | | | |
| | | | | | | | |
The Company and its subsidiary Hill International N.V. (the "Subsidiary") are parties to a credit agreement with Société Générale (the "Agent") TD Bank, N.A., and HSBC Bank USA, N.A., (collectively, the "U.S. Lenders") consisting of a term loan facility of $120,000,000 (the "Term Loan Facility") and a $30,000,000 U.S. dollar-denominated facility available to the Company (the "U.S. Revolver," together with the Term Loan Facility, the "U.S. Credit Facilities") and a credit agreement with the Agent as administrative agent and collateral agent, (the "International Lender") providing a facility of €11,765,000 ($15,000,000 at closing and $12,380,000 at December 31, 2016) which is available to the Subsidiary (the "International Revolver" and together with the U.S. Revolver, the "Revolving Credit Facilities" and, together with the U.S. Credit Facilities, the "Secured Credit Facilities"). The U.S. Revolver and the International Revolver include sub-limits for letters of credit amounting to $25,000,000 and $10,000,000, respectively.
The Secured Credit Facilities contain customary default provisions, representations and warranties, and affirmative and negative covenants, and require the Company to comply with certain financial and
70
HILL INTERNATIONAL, INC. AND SUBSIDIARIES
NOTES TO CONSOLIDATED FINANCIAL STATEMENTS (Continued)
Note 11—Notes Payable and Long-Term Debt (Continued)
reporting covenants. The financial covenants consist of a Maximum Consolidated Net Leverage Ratio and an Excess Account Concentration requirement.
The Consolidated Net Leverage Ratio is the ratio of (a) consolidated total debt (minus cash of up to $10,000,000 held in the aggregate) to consolidated earnings before interest, taxes, depreciation, amortization, non-cash items and share-based compensation and other non-cash charges, including bad debt expense, for the trailing twelve months. In the event of a default, the U.S. Lenders and the International Lender may increase the interest rates by 2.0%. At December 31, 2016, the Company's Consolidated Net Leverage Ratio was 3.89 to 1.00 which exceeded the 2.75 to 1.00 limit imposed by the Secured Credit Facilities and constituted a default.
The Excess Account Concentration covenant permits the U. S. Lenders and the International Lender to increase the interest rates by 2.0% if, as of the last day of any fiscal quarter, either (a) the accounts receivable from any country not listed as a Permitted Country as defined in the Secured Credit Facilities (other than the United Arab Emirates) that are more than 120 days old (relative to the invoice date) constitute more than 10% of the total outstanding accounts receivable or (b) accounts receivable from any individual client located in the United Arab Emirates that are more than 120 days old (relative to the invoice date) constitute more than 14% of the total outstanding accounts receivable. The interest rate will be reset as soon as the accounts receivable over 120 days decline below the 10% or 14% levels.
In anticipation of the event of default upon delivery of the quarterly compliance certificate, the Company requested a waiver from the Agent. On March 27, 2017, the Company obtained the waiver of the Consolidated Net Leverage Ratio default. In connection with the waiver, the Company incurred a consent fee amounting to approximately $401,000 which will be charged to interest expense in the first quarter of 2017.
The U.S. Credit Facilities are guaranteed by certain U.S. subsidiaries of the Company, and the International Revolver is guaranteed by the Company and certain of the Company's U.S. and non-U.S. subsidiaries.
Term Loan Facility
The interest rate on the Term Loan Facility will be, at the Company's option, either:
- •
- the London Inter-Bank Offered Rate ("LIBOR") for the relevant interest period plus 6.75% per annum, provided that such LIBOR shall not be lower
than 1.00% per annum; or
- •
- the Base Rate (as described below) plus 5.75% per annum.
The "Base Rate" is a per annum rate equal to the highest of (A) the prime rate, (B) the federal funds effective rate plus 0.50%, or (C) the LIBOR for an interest period of one month plus 1.0% per annum. Upon a default, the applicable rate of interest under the Secured Credit Facilities may increase by 2.0%. The LIBOR on the Term Loan Facilities (including when determining the Base Rate) shall in no event be less than 1.0% per annum.
At December 31, 2016, the interest rate on the Term Loan was 7.75%
The Company has the right to prepay the Term Loan Facility in full or in part at any time without premium or penalty. The Company is required to make mandatory prepayments of the Term Loan
71
HILL INTERNATIONAL, INC. AND SUBSIDIARIES
NOTES TO CONSOLIDATED FINANCIAL STATEMENTS (Continued)
Note 11—Notes Payable and Long-Term Debt (Continued)
Facility, without premium or penalty, (i) with net proceeds of any issuance or incurrence of indebtedness (other than that permitted under the Term Loan Facility) by the Company, (ii) with net proceeds from certain asset sales outside the ordinary course of business, and (iii) with 50% of the excess cash flow (as defined in the agreement) for each fiscal year of the Borrowers commencing with the year ending December 31, 2016 (which percentage would be reduced to 25% if the Consolidated Net Leverage Ratio is equal to or less than 2.25 to 1.00 or reduced to 0% if the Consolidated Net Leverage Ratio is equal to or less than 1.50 to 1.00).
The Term Loan Facility is generally secured by a first-priority security interest in substantially all assets of the Company and certain of the Company's U.S. subsidiaries other than accounts receivable, cash proceeds thereof and certain bank accounts, as to which the Term Loan Facility is secured by a second-priority security interest.
The Term Loan Facility has a term of six years, requires repayment of 0.25% of the original principal amount on a quarterly basis through September 30, 2020, the maturity date. Any amounts repaid on the Term Loan Facility will not be available to be re-borrowed.
The Company incurred fees and expenses related to the Term Loan Facility aggregating $7,066,000 which were deferred. The deferred fees are being amortized on a straight-line basis, which approximates the effective interest method, to interest and related financing fees, net over a six-year period which ends on September 30, 2020. Unamortized balances of $4,416,000 and $5,594,000 are reflected as reductions of the term loan in the consolidated balance sheets at December 31, 2016 and 2015, respectively.
Revolving Credit Facilities
The interest rate on borrowings under the U.S. Revolver will be, at the Company's option from time to time, either the LIBOR for the relevant interest period plus 3.75% per annum or the Base Rate plus 2.75% per annum. At December 31, 2016 the interest rate was 6.50%.
The interest rate on borrowings under the International Revolver will be the European Inter-Bank Offered Rate, or "EURIBOR," for the relevant interest period (or at a substitute rate to be determined to the extent EURIBOR is not available) plus 4.00% per annum. At December 31, 2016 the interest rate was 4.38%.
The Company will pay a commitment fee calculated at 0.50% annually on the average daily unused portion of the U.S. Revolver, and the Subsidiary will pay a commitment fee calculated at 0.75% annually on the average daily unused portion of the International Revolver.
The ability to borrow under each of the U.S. Revolver and the International Revolver is subject to a "borrowing base," calculated using a formula based upon approximately 85% of receivables that meet or satisfy certain criteria ("Eligible Receivables") and that are subject to a perfected security interest held by either the U.S. Lenders or the International Lender, plus, in the case of the International Revolver only, 10% of Eligible Receivables that are not subject to a perfected security interest held by the International Lender, subject to certain exceptions and restrictions.
The Company or the Subsidiary, as applicable, will be required to make mandatory prepayments under their respective Revolving Credit Facilities to the extent that the aggregate outstanding amount thereunder exceeds the then-applicable borrowing base, which payments will be made without penalty or premium. At December 31, 2016, the domestic borrowing base was $30,000,000 and the international borrowing base was €11,765,000 (approximately $12,380,000 at December 31, 2016).
72
HILL INTERNATIONAL, INC. AND SUBSIDIARIES
NOTES TO CONSOLIDATED FINANCIAL STATEMENTS (Continued)
Note 11—Notes Payable and Long-Term Debt (Continued)
Generally, the obligations of the Company under the U.S. Revolver are secured by a first-priority security interest in the above-referenced accounts receivable, cash proceeds and bank accounts of the Company and certain of the Company's U.S. subsidiaries, and a second-priority security interest in substantially all other assets of the Company and such subsidiaries. The obligations of the Subsidiary under the International Revolver would generally be secured by a first-priority security interest in substantially all accounts receivable, cash proceeds thereof and certain bank accounts of the Subsidiary and certain of the Company's non-U.S. subsidiaries, and a second-priority security interest in substantially all other assets of the Company and certain of the Company's U.S. and non-U.S. subsidiaries.
The Revolving Credit Facilities have a term of five years and require payment of interest only during the term. Under the Revolving Credit Facilities, outstanding loans may be repaid in whole or in part at any time, without premium or penalty, subject to certain customary limitations, and will be available to be re-borrowed from time to time through expiration on September 30, 2019.
The Company incurred fees and expenses related to the Revolving Credit Facilities aggregating $3,000,000 which was deferred. The deferred fees are being amortized on a straight-line basis, which approximates the effective interest method, to interest expense and related financing fees, net over a five-year period which ends on September 30, 2019. Unamortized balances of $1,650,000 and $2,250,000 are included in other assets in the consolidated balance sheet at December 31, 2016 and 2015, respectively.
At December 31, 2016, the Company had $4,519,000 of outstanding letters of credit and $8,981,000 of available borrowing capacity under the U.S. Revolver.
At December 31, 2016, the Company had $945,000 of outstanding letters of credit and $4,195,000 of available borrowing capacity under the International Revolver and its other foreign credit agreements (See "Other Debt Arrangements" below for more information).
Other Debt Arrangements
In connection with the 2015 move of its corporate headquarters to Philadelphia, Pennsylvania, the Company received a loan from the Philadelphia Industrial Development Corporation in the amount of $750,000 which bears interest at 2.75%, is repayable in 144 equal monthly installments of $6,121 and matures on May 1, 2027.
The Company's subsidiary, Hill International (Spain) S.A. ("Hill Spain"), maintained a revolving credit facility with six banks (the "Financing Entities") in Spain which initially provided for total borrowing of up to €5,640,000 with interest at 6.50% on outstanding borrowings. The facility expired on December 17, 2016. Concurrent with the satisfaction of this facility Hill Spain entered into a new agreement with three new banks. The total new facility is for €2,770,000 (approximately $2,915,000) at December 31, 2016. The facility was fully utilized at December 31, 2016. Interest rates at December 31, 2016 were between 1.85% and 3.50%. The loans have varying expiration dates between 36 and 60 months.
Hill Spain also maintains an ICO (Official Credit Institute) loan with Bankia Bank in Spain for €45,000 (approximately $47,355) at December 31, 2016. The availability is reduced by €15,000 on a quarterly basis. At December 31, 2016, the loan was fully utilized with total borrowings outstanding of €
73
HILL INTERNATIONAL, INC. AND SUBSIDIARIES
NOTES TO CONSOLIDATED FINANCIAL STATEMENTS (Continued)
Note 11—Notes Payable and Long-Term Debt (Continued)
45,000 (approximately $47,355). The interest rate at December 31, 2016 was 6.50%. The ICO loan expires on August 10, 2017.
The Company maintains a credit facility with the National Bank of Abu Dhabi which provides for total borrowings of up to AED 11,500,000 (approximately $3,131,000 at December 31, 2016) collateralized by certain overseas receivables. At December 31, 2016, there were no borrowings outstanding. The interest rate is the one-month Emirates InterBank Offer Rate plus 3.00% (or 4.41% at December 31, 2016) but no less than 5.50%. This facility allow for up to AED 200,000,000 (approximately $54,451,000 at December 31, 2016) of which AED 127,377,000 (approximately $34,686,000) was outstanding at December 31, 2016. The credit facility is subject to periodic review by the bank.
Engineering S.A. maintains four unsecured revolving credit facilities with two banks in Brazil aggregating 2,380,000 Brazilian Reais (BRL) (approximately $732,000 at December 31, 2016), with a weighted average interest rate of 5.09% per month at December 31, 2016. There were no borrowings outstanding on any of these facilities which are renewed automatically every three months.
The Company also maintains relationships with other foreign banks for the issuance of letters of credit, letters of guarantee and performance bonds in a variety of foreign currencies. At December 31, 2016, the maximum U.S. dollar equivalent of the commitments was $83,382,000 of which $38,680,000 is outstanding.
At December 31, 2016, contractually scheduled maturities of long term debt were as follows (in thousands):
Years Ending December 31,
|
|
|||
|---|---|---|---|---|
2017 |
$ | 1,983 | ||
2018 |
1,902 | |||
2019 |
29,506 | |||
2020 |
109,834 | |||
2021 |
520 | |||
Thereafter |
358 | |||
| | | | | |
Total |
$ | 144,103 | ||
| | | | | |
| | | | | |
| | | | | |
Note 12—Supplemental Cash Flow Information
The Company issues shares of its common stock and deferred stock units to its non-employee directors as partial compensation for services on the Company's Board through the next annual stockholders meeting. See Note 13 for further information with respect to this plan.
74
HILL INTERNATIONAL, INC. AND SUBSIDIARIES
NOTES TO CONSOLIDATED FINANCIAL STATEMENTS (Continued)
Note 12—Supplemental Cash Flow Information (Continued)
Other activity is provided in the following table (in thousands):
| |
Years Ended December 31, | |||||||||
|---|---|---|---|---|---|---|---|---|---|---|
| |
2016 | 2015 | 2014 | |||||||
Interest and related financing fees paid |
$ | 12,004 | $ | 13,180 | $ | 22,753 | ||||
| | | | | | | | | | | |
| | | | | | | | | | | |
| | | | | | | | | | | |
Income taxes paid |
$ | 9,523 | $ | 5,684 | $ | 10,863 | ||||
| | | | | | | | | | | |
| | | | | | | | | | | |
| | | | | | | | | | | |
Increase in property and equipment from a tenant improvement allowance related to the relocation of the corporate headquarters |
$ | — | $ | 3,894 | $ | — | ||||
| | | | | | | | | | | |
| | | | | | | | | | | |
| | | | | | | | | | | |
Reduction of noncontrolling interest in connection with acquisitions of additional interests in Engineering S.A. |
$ | — | $ | (4,374 | ) | $ | (2,649 | ) | ||
| | | | | | | | | | | |
| | | | | | | | | | | |
| | | | | | | | | | | |
Increase in additional paid in capital from issuance of shares of common stock in connection with the acquisition of an additional interest in ESA |
$ | — | $ | 4,374 | $ | — | ||||
| | | | | | | | | | | |
| | | | | | | | | | | |
| | | | | | | | | | | |
Decrease in additional paid-in capital related to ESA Put Options |
$ | (2,670 | ) | $ | — | $ | — | |||
| | | | | | | | | | | |
| | | | | | | | | | | |
| | | | | | | | | | | |
Increase in additional paid in capital from issuance of shares of common stock related to purchase of CPI |
$ | — | $ | 530 | $ | 618 | ||||
| | | | | | | | | | | |
| | | | | | | | | | | |
| | | | | | | | | | | |
Increase in additional paid in capital from issuance of shares of common stock from cashless exercise of stock options |
$ | 796 | $ | 361 | $ | 538 | ||||
| | | | | | | | | | | |
| | | | | | | | | | | |
| | | | | | | | | | | |
Note 13—Share-Based Compensation
2009 Non-Employee Director Stock Grant Plan
The 2009 Non-Employee Director Stock Grant Plan covers 400,000 shares of the Company's common stock. Awards under the plan may take the form of share of the Company's common stock or deferred stock units ("DSU") which entitle the participants to receive one share of common stock for each DSU upon retirement from the Board of directors. Only the Company's Non-Employee Directors are eligible to receive awards under the plan. Information with respect to the plan's activity follows (in thousands):
| |
Years Ended December 31, |
|||||||||
|---|---|---|---|---|---|---|---|---|---|---|
| |
2016 | 2015 | 2014 | |||||||
Shares issued |
3 | 25 | 27 | |||||||
Compensation expense |
$ | 10 | $ | 115 | $ | 175 | ||||
Deferred stock units issued |
96 |
— |
— |
|||||||
Compensation expense |
$ | 350 | $ | — | $ | — | ||||
75
HILL INTERNATIONAL, INC. AND SUBSIDIARIES
NOTES TO CONSOLIDATED FINANCIAL STATEMENTS (Continued)
Note 13—Share-Based Compensation (Continued)
2008 Employee Stock Purchase Plan
The Employee Stock Purchase Plan covers 2,000,000 shares of the Company's common stock. Eligible employees may purchase shares at 85% of the fair market value on the date of purchase. Information with respect to the plan's activity follows (in thousands):
| |
Years Ended December 31, |
|||||||||
|---|---|---|---|---|---|---|---|---|---|---|
| |
2016 | 2015 | 2014 | |||||||
Shares purchased |
59 | 43 | 55 | |||||||
Aggregate purchase price |
$ | 182 | $ | 126 | $ | 197 | ||||
Compensation expense |
$ | 32 | $ | 22 | $ | 35 | ||||
2006 Employee Stock Option Plan
The 2006 Employee Stock Option Plan, as amended, covers 10,000,000 shares of the Company's common stock. Under its terms, directors, officers and employees of the Company and its subsidiaries are eligible to receive non-qualified and incentive stock options. Options granted to non-employee directors vest immediately and have a five year contractual term. Options granted to officers and employees vest over five years and have a seven-year contractual term. Generally, each option has an exercise price equal to the closing quoted market price of a share of the Company's common stock on the date of grant. For grants of incentive stock options, if the grantee owns, or is deemed to own, 10% or more of the total voting power of the Company, then the exercise price shall be 110% of the closing quoted market price on the date of grant and the option will have a five-year contractual term. Options that are forfeited or expire are available for future grants. At December 31, 2016, a total of 1,643,000 shares of common stock were reserved for future issuance under the plan.
The Black-Scholes option valuation model is used to estimate the fair value of the options. The following table summarizes the fair value of options granted during 2016, 2015 and 2014 and the assumptions used to estimate the fair value:
| |
December 31, | |||||||||
|---|---|---|---|---|---|---|---|---|---|---|
| |
2016 | 2015 | 2014 | |||||||
Average expected life (years) |
4.98 | 4.86 | 4.59 | |||||||
Forfeiture range |
0 | % | 0 - 5.0 | % | 0 - 5.0 | % | ||||
Weighted average forfeiture rate |
0 | % | 0.3 | % | 0.9 | % | ||||
Dividends |
0 | % | 0 | % | 0 | % | ||||
Volatility range |
47.4 - 57.5 | % | 46.9 - 59.9 | % | 61.5 - 65.5 | % | ||||
Weighted average volatility |
56.5 | % | 58.9 | % | 62.9 | % | ||||
Range of risk-free interest rates |
0.97 - 1.46 | % | 1.07 - 1.61 | % | 0.86 - 1.74 | % | ||||
Weighted average risk-free interest rate |
1.22 | % | 1.45 | % | 1.67 | % | ||||
Weighted average fair value at grant date |
$ | 1.52 | $ | 2.01 | $ | 2.28 | ||||
The expected term of the options is estimated based on the "simplified method" as permitted by SAB No. 110. Expected volatility was calculated using the average historical volatility of the Company. The risk-free interest rate is based on U.S. Treasury yields for securities in effect at the time of grants with terms approximating the term of the grants. The assumptions used in the Black-Scholes option
76
HILL INTERNATIONAL, INC. AND SUBSIDIARIES
NOTES TO CONSOLIDATED FINANCIAL STATEMENTS (Continued)
Note 13—Share-Based Compensation (Continued)
valuation model are highly subjective, particularly as to stock price volatility of the underlying stock, which can materially affect the resulting valuation.
A summary of the Company's stock option activity and related information for the years ended December 31, 2016, 2015 and 2014 is as follows (in thousands, except exercise price and remaining life data):
| |
Options | Weighted Average Exercise Price |
Weighted Average Remaining Contractual Life |
Aggregate Intrinsic Value |
|||||||||
|---|---|---|---|---|---|---|---|---|---|---|---|---|---|
Outstanding, December 31, 2013 |
6,574 | $ | 4.67 | ||||||||||
Granted |
1,849 | 4.57 | |||||||||||
Exercised |
(524 | ) | 3.00 | ||||||||||
Expired |
(496 | ) | 7.66 | ||||||||||
Forfeited |
(44 | ) | 4.37 | ||||||||||
| | | | | | | | | | | | | | |
Outstanding, December 31, 2014 |
7,359 | 4.57 | |||||||||||
Granted |
1,117 | 4.02 | |||||||||||
Exercised |
(274 | ) | 3.03 | ||||||||||
Expired |
(405 | ) | 7.11 | ||||||||||
Forfeited |
(86 | ) | 4.50 | ||||||||||
| | | | | | | | | | | | | | |
Outstanding, December 31, 2015 |
7,711 | 4.41 | |||||||||||
Granted |
1,025 | 4.40 | |||||||||||
Exercised |
(438 | ) | 2.66 | ||||||||||
Expired |
(1,154 | ) | 6.81 | ||||||||||
Forfeited |
(82 | ) | 4.24 | ||||||||||
| | | | | | | | | | | | | | |
Outstanding, December 31, 2016 |
7,062 | $ | 4.45 | 1.78 | $ | — | |||||||
| | | | | | | | | | | | | | |
| | | | | | | | | | | | | | |
| | | | | | | | | | | | | | |
Exercisable, December 31, 2016 |
3,727 | $ | 4.64 | 3.07 | $ | — | |||||||
| | | | | | | | | | | | | | |
| | | | | | | | | | | | | | |
| | | | | | | | | | | | | | |
Aggregate intrinsic value represents the difference between the exercise prices and the closing stock price on December 31, 2016. At December 31, 2016, the weighted average exercise price of the outstanding options was $4.45 and the closing stock price was $4.35.
77
HILL INTERNATIONAL, INC. AND SUBSIDIARIES
NOTES TO CONSOLIDATED FINANCIAL STATEMENTS (Continued)
Note 13—Share-Based Compensation (Continued)
For various price ranges, weighted average characteristics of outstanding stock options at December 31, 2016 are as follows:
| |
Options Outstanding | Options Exercisable | ||||||||||||||
|---|---|---|---|---|---|---|---|---|---|---|---|---|---|---|---|---|
Exercise Prices
|
Number Outstanding at December 31, 2016 |
Weighted Average Remaining Contractual Life |
Weighted Average Exercise Price |
Number Exercisable at December 31, 2016 |
Weighted Average Exercise Price |
|||||||||||
$2.85 |
68,181 | 0.44 | $ | 2.85 | 68,181 | $ | 2.85 | |||||||||
2.89 |
69,768 | 1.43 | 2.89 | 69,768 | 2.89 | |||||||||||
3.00 |
10,101 | 4.10 | 3.00 | 10,101 | 3.00 | |||||||||||
3.12 |
10,000 | 3.60 | 3.12 | 6,000 | 3.12 | |||||||||||
3.35 |
15,000 | 6.06 | 3.35 | — | 3.35 | |||||||||||
3.46 |
13,274 | 3.86 | 3.46 | 13,274 | 3.46 | |||||||||||
3.55 |
5,000 | 5.78 | 3.55 | 1,000 | 3.55 | |||||||||||
3.67 |
781,000 | 3.06 | 3.67 | 465,000 | 3.67 | |||||||||||
3.91 |
500,000 | 5.01 | 3.91 | 100,000 | 3.91 | |||||||||||
3.95 |
500,000 | 4.01 | 3.95 | 200,000 | 3.95 | |||||||||||
4.00 |
500,000 | 6.25 | 4.00 | — | 4.00 | |||||||||||
4.03 |
475,000 | 5.08 | 4.03 | 95,000 | 4.03 | |||||||||||
4.04 |
1,000,000 | 1.06 | 4.04 | 750,000 | 4.04 | |||||||||||
4.31 |
112,500 | 6.45 | 4.31 | — | 4.31 | |||||||||||
4.35 |
500,000 | 2.01 | 4.35 | 250,000 | 4.35 | |||||||||||
4.46 |
25,000 | 6.76 | 4.46 | — | 4.46 | |||||||||||
4.84 |
37,974 | 3.60 | 4.84 | 37,974 | 4.84 | |||||||||||
4.90 |
10,000 | 5.59 | 4.90 | 2,000 | 4.90 | |||||||||||
4.95 |
680,000 | 4.19 | 4.95 | 272,000 | 4.95 | |||||||||||
5.00 |
250,000 | 6.25 | 5.00 | — | 5.00 | |||||||||||
5.17 |
112,500 | 6.45 | 5.17 | — | 5.17 | |||||||||||
5.31 |
20,000 | 0.07 | 5.31 | 20,000 | 5.31 | |||||||||||
5.47 |
880,200 | 0.18 | 5.47 | 880,200 | 5.47 | |||||||||||
5.73 |
8,000 | 1.84 | 5.73 | 8,000 | 5.73 | |||||||||||
5.83 |
265,000 | 0.24 | 5.83 | 265,000 | 5.83 | |||||||||||
6.31 |
175,000 | 1.42 | 6.31 | 175,000 | 6.31 | |||||||||||
6.61 |
38,322 | 2.45 | 6.61 | 38,322 | 6.61 | |||||||||||
| | | | | | | | | | | | | | | | | |
|
7,061,820 | 3.07 | $ | 4.13 | 3,726,820 | $ | 4.64 | |||||||||
| | | | | | | | | | | | | | | | | |
| | | | | | | | | | | | | | | | | |
| | | | | | | | | | | | | | | | | |
In the years ended December 31, 2016, 2015 and 2014, the Company recorded share-based compensation related to stock options of approximately $2,436,000, $2,960,000 and $3,292,000, respectively, which is included in selling, general and administrative expenses.
78
HILL INTERNATIONAL, INC. AND SUBSIDIARIES
NOTES TO CONSOLIDATED FINANCIAL STATEMENTS (Continued)
Note 13—Share-Based Compensation (Continued)
The following table summarizes the Company's non-vested stock option activity and related information for the years ended December 31, 2016, 2015 and 2014 (in thousands, except weighted average grant date fair value):
| |
Options | Weighted Average Grant Date Fair Value Per Share |
|||||
|---|---|---|---|---|---|---|---|
Non-vested options at December 31, 2013 |
3,541 | 2.20 | |||||
Granted |
1,849 | 2.28 | |||||
Vested |
(1,289 | ) | 2.19 | ||||
Forfeited |
(44 | ) | 2.33 | ||||
| | | | | | | | |
Non-vested options at December 31, 2014 |
4,057 | 2.24 | |||||
Granted |
1,117 | 2.01 | |||||
Vested |
(1,434 | ) | 2.26 | ||||
Forfeited |
(86 | ) | 2.48 | ||||
| | | | | | | | |
Non-vested options at December 31, 2015 |
3,654 | 2.15 | |||||
Granted |
1,025 | 1.52 | |||||
Vested |
(1,262 | ) | 2.18 | ||||
Forfeited |
(82 | ) | 2.76 | ||||
| | | | | | | | |
Non-vested options at December 31, 2016 |
3,335 | $ | 1.92 | ||||
| | | | | | | | |
| | | | | | | | |
| | | | | | | | |
At December 31, 2016, total unrecognized compensation cost related to non-vested options was $4,546,000 which will be recognized over the remaining weighted-average service period of 1.91 years.
Note 14—Stockholders' Equity
During the year ended December 31, 2016, the Company received cash proceeds of $351,000 from the exercise of stock options.
During 2016, certain officers exercised 320,745 options with an exercise price of $2.45 through the Company. The Company withheld 233,752 shares as payment for the options and placed those shares in treasury. The officers received 87,713 shares from these transactions.
During May 2015, four of the Company's directors exercised an aggregate of 84,868 options with an exercise price of $4.25 through the Company on a cashless basis. The Company withheld 67,400 shares as payment for the options and placed those shares in treasury. The directors received a total of 17,468 shares from this transaction.
In April 2015, two shareholders who owned approximately 19% of ESA exercised their ESA Put Options. On August 12, 2015, the Company paid the $4,374,000 liability with 924,736 shares of its common stock, of which it repurchased 129,648 shares for an aggregate price of $580,000. See Note 5 for further information.
On August 6, 2014, in connection with the Refinancing (See Note 11), the Company sold 9,546,629 shares of its common stock in an underwritten equity offering and received net proceeds aggregating
79
HILL INTERNATIONAL, INC. AND SUBSIDIARIES
NOTES TO CONSOLIDATED FINANCIAL STATEMENTS (Continued)
Note 14—Stockholders' Equity (Continued)
approximately $38,078,000, of which two mandatory prepayments of $9,522,402 were used to pay down the 2012 Term Loan Agreement and the 2009 Revolving Credit Agreement.
In March 2014, the Company's former Chairman and Chief Executive Officer exercised 200,000 options with an exercise price of $2.70 through the Company on a cashless basis. The Company withheld 112,788 shares as payment for the options and placed those shares in treasury. The Chairman and Chief Executive Officer received 87,212 shares from this transaction.
We have an effective registration statement on Form S-3 on file with the U.S. Securities and Exchange Commission (the "SEC") which registered 20,000,000 shares of our common stock for issuance and sale by us at various times in the future. The proceeds, if any, will be used for working capital and general corporate purposes, subject to the restrictions of our Secured Credit Facilities.
We have an effective registration statement on Form S-4 on file with the SEC which registered 20,000,000 shares of our common stock, which includes 6,438,923 shares of our common stock registered under a previous Form S-4, for use in future acquisitions. During 2013, we issued 1,389,769 shares in connection with our acquisitions of BCA and CPI. During 2014, we issued 171,308 shares in connection with certain additional consideration for CPI. In 2015, we issued 148,460 shares of our common stock for additional consideration for CPI. See Note 5 for further information.
Note 15—Income Taxes
The effective tax rates for the years ended December 31, 2016, 2015 and 2014 were (392.3%), 37.9% and 35.1% respectively. For all the years presented, the Company's effective tax rate is significantly higher than the U.S. federal statutory rate primarily as a result of various foreign withholding taxes and the inability to record an income tax benefit related to the U.S. net operating loss. In 2014, the effective tax rate was favorably impacted by a reversal of approximately $2,500,000 for uncertain tax positions based on management's assessment that those items were effectively settled with a foreign jurisdiction.
The components of earnings before income taxes by United States and foreign jurisdictions were as follows (in thousands):
| |
Years Ended December 31, | |||||||||
|---|---|---|---|---|---|---|---|---|---|---|
| |
2016 | 2015 | 2014 | |||||||
United States |
$ | (5,793 | ) | $ | (10,963 | ) | $ | (11,803 | ) | |
Foreign jurisdictions |
4,245 | 28,041 | 33,181 | |||||||
| | | | | | | | | | | |
|
$ | (1,548 | ) | $ | 17,078 | $ | 21,378 | |||
| | | | | | | | | | | |
| | | | | | | | | | | |
| | | | | | | | | | | |
80
HILL INTERNATIONAL, INC. AND SUBSIDIARIES
NOTES TO CONSOLIDATED FINANCIAL STATEMENTS (Continued)
Note 15—Income Taxes (Continued)
Income tax expense (benefit) consists of the following (in thousands):
| |
Current | Deferred | Total | |||||||
|---|---|---|---|---|---|---|---|---|---|---|
Year ended December 31, 2016: |
||||||||||
U.S. federal |
$ | — | $ | — | $ | — | ||||
State and local |
— | — | — | |||||||
Foreign jurisdictions |
6,527 | (459 | ) | 6,068 | ||||||
| | | | | | | | | | | |
|
$ | 6,527 | $ | (459 | ) | $ | 6,068 | |||
| | | | | | | | | | | |
| | | | | | | | | | | |
| | | | | | | | | | | |
Year ended December 31, 2015: |
||||||||||
U.S. federal |
$ | — | $ | — | $ | — | ||||
State and local |
— | — | — | |||||||
Foreign jurisdictions |
6,948 | (483 | ) | 6,465 | ||||||
| | | | | | | | | | | |
|
$ | 6,948 | $ | (483 | ) | $ | 6,465 | |||
| | | | | | | | | | | |
| | | | | | | | | | | |
| | | | | | | | | | | |
Year ended December 31, 2014: |
||||||||||
U.S. federal |
$ | — | $ | — | $ | — | ||||
State and local |
— | — | — | |||||||
Foreign jurisdictions |
8,037 | (525 | ) | 7,512 | ||||||
| | | | | | | | | | | |
|
$ | 8,037 | $ | (525 | ) | $ | 7,512 | |||
| | | | | | | | | | | |
| | | | | | | | | | | |
| | | | | | | | | | | |
The decrease in tax expense in 2016 compared to 2015 results from the mix of income and tax rates in various foreign jurisdictions
The decrease in tax expense in 2015 compared to 2014 results from the mix of income and tax rates in various foreign jurisdictions. In 2014, approximately $2,500,000 of reversal for uncertain tax positions was recorded based on management's assessment that those items were effectively settle with a foreign jurisdiction.
The differences between income taxes based on the statutory U.S. federal income tax rate and the Company's effective income tax rate are provided in the following reconciliation (in thousands).
| |
Years Ended December 31, | |||||||||
|---|---|---|---|---|---|---|---|---|---|---|
| |
2016 | 2015 | 2014 | |||||||
Statutory federal income tax |
$ | (542 | ) | $ | 5,977 | $ | 7,268 | |||
Foreign tax benefit for earnings taxed at lower rates |
3,013 | (2,939 | ) | (3,044 | ) | |||||
Change in the valuation allowance |
3,687 | 7,629 | 17,267 | |||||||
Valuation allowance—discontinued operations NOL adjustment |
(4,758 | ) | (4,192 | ) | (11,197 | ) | ||||
Net liability (reductions) additions for uncertain tax positions |
(40 | ) | 21 | (2,379 | ) | |||||
Excess compensation |
513 | 485 | 646 | |||||||
State and local income taxes, net of federal income tax benefit |
(133 | ) | (447 | ) | (552 | ) | ||||
Stock options |
4,355 | 266 | 224 | |||||||
Purchase accounting reversal |
— | — | (490 | ) | ||||||
Other |
(27 | ) | (335 | ) | (231 | ) | ||||
| | | | | | | | | | | |
Total |
$ | 6,068 | $ | 6,465 | $ | 7,512 | ||||
| | | | | | | | | | | |
| | | | | | | | | | | |
| | | | | | | | | | | |
81
HILL INTERNATIONAL, INC. AND SUBSIDIARIES
NOTES TO CONSOLIDATED FINANCIAL STATEMENTS (Continued)
Note 15—Income Taxes (Continued)
The tax effect of temporary differences that give rise to deferred tax assets and deferred tax liabilities are as follows (in thousands):
| |
December 31, | ||||||
|---|---|---|---|---|---|---|---|
| |
2016 | 2015 | |||||
Deferred tax assets: |
|||||||
Net operating loss carry forward—U.S. operations |
$ | 52,401 | $ | 46,493 | |||
Amortization of intangibles |
3,002 | 7,010 | |||||
Net operating loss carry forward—foreign operations |
8,459 | 6,690 | |||||
Compensated absences |
2,184 | 2,371 | |||||
Foreign income taxes on currency translation |
2,632 | 2,392 | |||||
Share based compensation |
309 | 3,764 | |||||
Allowance for uncollectible accounts |
13,691 | 13,139 | |||||
Bonus accrual |
— | 488 | |||||
Foreign tax credit |
991 | 982 | |||||
Other |
961 | 1,133 | |||||
| | | | | | | | |
Total gross deferred tax assets |
84,630 | 84,462 | |||||
Valuation allowances |
(72,154 | ) | (66,043 | ) | |||
| | | | | | | | |
Net deferred tax assets |
12,476 | 18,419 | |||||
| | | | | | | | |
Deferred tax liabilities: |
|||||||
Intangible assets |
(5,954 | ) | (10,763 | ) | |||
Depreciation |
(3,009 | ) | (2,729 | ) | |||
Prepaid expenses |
(1,021 | ) | (1,123 | ) | |||
Change in tax method |
(101 | ) | (190 | ) | |||
Accrued expenses |
(729 | ) | — | ||||
| | | | | | | | |
Total gross deferred tax liabilities |
(10,814 | ) | (14,805 | ) | |||
| | | | | | | | |
Net deferred tax assets |
$ | 1,662 | $ | 3,614 | |||
| | | | | | | | |
| | | | | | | | |
| | | | | | | | |
The deferred taxes have been reflected in the balance sheet based on tax jurisdiction as follows:
Deferred tax asset |
$ | 2,197 | $ | 4,602 | |||
Deferred tax liability |
(535 | ) | (988 | ) | |||
| | | | | | | | |
Net deferred tax assets |
$ | 1,662 | $ | 3,614 | |||
| | | | | | | | |
| | | | | | | | |
| | | | | | | | |
In assessing the realizability of deferred tax assets, management considers whether it is more likely than not that some portion or all of the deferred tax assets will not be realized. The ultimate realization of deferred tax assets is dependent upon the generation of future taxable income during the periods in which those temporary differences become deductible. Management considers the scheduled reversal of deferred tax liabilities and projected future taxable income in making this assessment. Management evaluates the need for valuation allowances on the deferred tax assets according to the provisions of ASC 740, Income Taxes. They consider both positive and negative evidence. In making this determination, management assesses all of the evidence available at the time including recent earnings, internally-prepared income projections, and historical financial performance.
82
HILL INTERNATIONAL, INC. AND SUBSIDIARIES
NOTES TO CONSOLIDATED FINANCIAL STATEMENTS (Continued)
Note 15—Income Taxes (Continued)
Due to recurring net operating losses in the United States, management has determined that it is more likely than not that the Company will not be able to utilize its U.S. deferred tax assets. The Company continues to generate U.S. net operating losses and recorded additional valuation allowances of $1,317,000 and $7,583,000 at December 31, 2016 and 2015, respectively. U.S. valuation allowances of $50,987,000 and $49,670,000 were recorded at December 31, 2016 and 2015, respectively, primarily related to the U.S. net operating loss carryforwards. As a result, the U.S. deferred tax assets, net of U.S. deferred tax liabilities, are fully reserved at December 31, 2016. Cumulative U.S. federal and state net operating losses at December 31, 2016 are $132,331,000 and $135,234,000, respectively.
At December 31, 2016 and 2015, there were approximately $36,256,000 and $27,571,000, respectively, of gross foreign net operating loss carry forwards. The majority of these net operating loss carry forwards have an unlimited carry forward period. It is anticipated that these losses will not be utilized due to continuing losses in these jurisdictions. Foreign valuation allowances of $21,167,000 and $16,373,000 were recorded at December 31, 2016 and 2015, respectively, primarily related to the foreign allowance for doubtful accounts in connection with the Libya Receivable reserve and the foreign net operating loss carry forwards. In 2016, $2,424,000 of the valuation allowance is recorded to Accumulated Other Comprehensive Income and is related to the deferred tax asset recorded as a foreign exchange adjustment related to long term notes payable.
The Company has made no provision for U.S. taxes on $128,175,000 of cumulative earnings of foreign subsidiaries as those earnings are intended to be reinvested for an indefinite period of time and are not intended to be distributed to the U.S. Upon distribution of these earnings in the form of dividends or otherwise, the Company may be subject to U.S. income taxes and foreign withholding taxes. It is not practical, however, to estimate the amount of taxes that may be payable on the eventual repatriation of these earnings.
The Company will recognize a tax benefit in the financial statements for an uncertain tax position only if management's assessment is that the position is "more likely than not" (i.e., a likelihood greater than 50 percent) to be allowed by the tax jurisdiction based solely on the technical merits of the position. The term "tax position" refers to a position in a previously filed tax return or a position expected to be taken in a future tax return that is reflected in measuring current or deferred income tax assets and liabilities for financial reporting purposes.
The following table indicates the changes to the Company's uncertain tax positions for the years ended December 31, 2016 and 2015 including interest and penalties (in thousands):
| |
Years Ended December 31, |
||||||
|---|---|---|---|---|---|---|---|
| |
2016 | 2015 | |||||
Balance, beginning of year |
$ | 996 | $ | 975 | |||
Reductions based on tax positions related to prior years |
(40 | ) | (16 | ) | |||
Reduction due to settlements with taxing authorities |
(172 | ) | (265 | ) | |||
Additions based on tax positions related to prior years |
914 | 302 | |||||
| | | | | | | | |
Balance, end of year |
$ | 1,698 | $ | 996 | |||
| | | | | | | | |
| | | | | | | | |
| | | | | | | | |
The Company files income tax returns in the U.S. federal jurisdiction and in various state and foreign jurisdictions. The Company generally is no longer subject to U.S. or state examinations by tax
83
HILL INTERNATIONAL, INC. AND SUBSIDIARIES
NOTES TO CONSOLIDATED FINANCIAL STATEMENTS (Continued)
Note 15—Income Taxes (Continued)
authorities for taxable years prior to 2013. However, net operating losses utilized from prior years in subsequent years' tax returns are subject to examination until three years after the filing of subsequent years' tax returns. The statute of limitations expiration in foreign jurisdictions for corporate tax returns generally ranges between two and five years depending on the jurisdiction.
The Company's policy is to record income tax related interest and penalties in income tax expense. At December 31, 2016, 2015 and 2014, the Company has accrued $206,000, $500,000 and $520,000, respectively, related to potential interest and penalties.
The Company's income tax returns are based on calculations and assumptions that are subject to examinations by the Internal Revenue Service and other tax authorities. While the Company believes it has appropriate support for the positions taken on its tax returns, the Company regularly assesses the potential outcomes of these examinations and any future examinations for the current or prior years in determining the adequacy of its provision for income taxes. As part of its assessment of potential adjustments to its tax returns, the Company increases its current tax liability to the extent an adjustment would result in a cash tax payment or decreases its deferred tax assets to the extent an adjustment would not result in a cash tax payment. The Company continually assesses the likelihood and amount of potential adjustments and adjusts the income tax provision, the current tax liability and deferred taxes in the period in which the facts that give rise to a revision become known.
Note 16—Commitments and Contingencies
General Litigation
In 2013, M.A. Angeliades, Inc. ("Plaintiff") filed a complaint with the Supreme Court of New York against the Company and the New York City Department of Design and Construction ("DDC") regarding payment of approximately $8,771,000 for work performed as a subcontractor to the Company plus interest and other costs. On October 5, 2015, pursuant to a settlement agreement, Hill paid Plaintiff approximately $2,596,000, including interest amounting to $1,056,000, of which $448,000 had been previously accrued and $608,000 was charged to expense for the year ended December 31, 2015. The remaining issues regarding Plaintiff's requests for change orders and compensation for delay are being negotiated between Plaintiff and the DDC.
In 2014, a former executive of the Company ("Plaintiff") resigned and filed a labor dispute with the Company in the Dubai Labour Court seeking AED 4,536,239 (approximately $1,210,000) for end of service remuneration. The Company filed a counterclaim against Plaintiff for breach of employment contract and filed a complaint against Plaintiff's new employer, Driver Group plc, in the UK for breach of non-solicitation and non-compete obligations in Plaintiff's employment agreement. On June 15, 2015, the Company paid Plaintiff AED 750,000 (approximately $200,000) pursuant to an executed settlement agreement. During year ended December 31, 2015, the Company recorded an additional $100,000 associated with the settlement payment and $834,000 of related legal costs.
Knowles Limited ("Knowles"), a subsidiary of the Company, is a party to an arbitration proceeding instituted on July 8, 2014 in which Knowles claimed that it was entitled to payment for services rendered to Celtic Bioenergy Limited ("Celtic"). The arbitrator decided in favor of Knowles. The arbitrator's award was appealed by Celtic to the U.K. High Court of Justice, Queen's Bench Division, Technology and Construction Court ("Court"). On March 16, 2017, the Court (1) determined that certain relevant facts had been deliberately withheld from the arbitrator by an employee of Knowles
84
HILL INTERNATIONAL, INC. AND SUBSIDIARIES
NOTES TO CONSOLIDATED FINANCIAL STATEMENTS (Continued)
Note 16—Commitments and Contingencies (Continued)
and (2) remitted the challenged parts of the arbitrator's award back to the arbitrator to consider the award in possession of the full facts. The Company is evaluating the impact of the judgment of the Court.
From time to time, the Company is a defendant or plaintiff in various legal actions which arise in the normal course of business. As such the Company is required to assess the likelihood of any adverse outcomes to these matters as well as potential ranges of probable losses. A determination of the amount of the provision required for these commitments and contingencies, if any, which would be charged to earnings, is made after careful analysis of each matter. The provision may change in the future due to new developments or changes in circumstances. Changes in the provision could increase or decrease the Company's earnings in the period the changes are made. It is the opinion of management, after consultation with legal counsel, that the ultimate resolution of these matters will not have a material adverse effect on the Company's financial condition, results of operations or cash flows.
Off-Balance Sheet Arrangements
The Company enters into agreements with banks for the banks to issue bonds to clients or potential clients for three separate purposes as follows:
- (1)
- Certain
of the Company's subsidiaries (Hill International N.V., Hill International (UK) Ltd. and Hill International (Middle East) Ltd.) have
entered into contracts for the performance of construction management services which provide that the Company receive advance payment of some of the management fee from the client prior to
commencement of the construction project. However, the clients require a guarantee of service performance in the form of an advance payment bond. These bonds are evidenced by Letters of Guarantee
issued by the subsidiaries' banks in favor of the clients. In some cases these clients also require a parent company guarantee.
- (2)
- The
Company may also enter into certain contracts which require a performance bond to be issued by a bank in favor of the client for a portion of the value of the
contract. These bonds may be exercised by the client in instances where the Company fails to provide the contracted services.
- (3)
- Certain clients may require bonds as part of the bidding process for new work. The bid bonds are provided to demonstrate the financial strength of the companies seeking the work and are usually outstanding for short periods. If the bid is rejected the bond is cancelled and if the bid is accepted the Company may be required to provide a performance bond.
The maximum potential future payment under these arrangements at December 31, 2016 was $105,377,000.
Cash held in restricted accounts as collateral for the issuance of performance and advance payment bonds and letters of credit at December 31, 2016 and 2015 were $4,625,000 and $4,694,000, respectively.
Acquisition-Related Contingencies
As of December 31, 2016 our subsidiary, Hill International (Spain), S.A. ("Hill Spain"), owned an indirect 91% interest in Engineering S.A. ("ESA"), a firm located in Brazil. ESA's shareholders entered into an agreement whereby the minority shareholders have a right to compel ("ESA Put Option") Hill
85
HILL INTERNATIONAL, INC. AND SUBSIDIARIES
NOTES TO CONSOLIDATED FINANCIAL STATEMENTS (Continued)
Note 16—Commitments and Contingencies (Continued)
Spain to purchase any or all of their shares during the period from February 28, 2014 to February 28, 2021. Hill Spain also has the right to compel ("ESA Call Option") the minority shareholders to sell any or all of their shares during the same time period. The purchase price for such shares shall be seven times the earnings before interest and taxes for ESA's most recently ended fiscal year, net of any financial debt plus excess cash multiplied by a percentage which the shares to be purchased bear to the total number of shares outstanding at the time of purchase, but in the event the ESA Call Option is exercised by Hill Spain, the purchase price shall be increased by five percent. The ESA Put Option and the ESA Call Option must be made within three months after the audited financial statements of ESA have been completed. On June 17, 2016, the three remaining minority shareholders exercised their ESA Put Options claim a value of BRL 8,656,000 (approximately $2,659,000 at December 31, 2016). The Company accrued the liability which is included in other current liabilities and as an adjustment to additional paid in capital in the consolidated balance sheet at December 31, 2016. The amount is subject to negotiation and any difference will be recorded upon completion of the transaction. See Note 5.
The Company accrued approximately TRY 6,100,000 ($2,088,000) for potential future payments in connection with the acquisition of IMS. IMS's EBITDA through the one-year anniversary of the acquisition date was not sufficient to earn any of the Additional Purchase Price and the liability was eliminated by a credit of approximately $673,000 to selling, general and administrative expenses at December 31, 2016. See Note 5.
Other
The Company has identified a potential tax liability related to certain foreign subsidiaries' failure to comply with laws and regulations of the jurisdictions, outside of their home country, in which their employees provided services. The Company has estimated the potential liability to be approximately $2,106,000 and has reflected that amount in discontinued operations in the consolidated statement of operations for the year ended December 31, 2016 and in other liabilities in the consolidated balance sheet at December 31, 2016.
Note 17—Operating Leases
The Company has numerous operating leases which have various expiration dates through December, 2027. Rent expense was approximately $9,208,000, $8,724,000 and $8,416,000 for the years ended December 31, 2016, 2015 and 2014, respectively, which is included in selling, general and administrative expenses in the consolidated statements of earnings. The Company is required to pay property taxes, utilities and other costs related to several of its leased office facilities.
At December 31, 2016, approximate future minimum payments under these leases that have remaining non-cancelable lease terms in excess of one year are as follows (in thousands):
Years Ending December 31,
|
|
|||
|---|---|---|---|---|
2017 |
$ | 7,607 | ||
2018 |
6,213 | |||
2019 |
5,026 | |||
2020 |
3,766 | |||
2021 |
3,145 | |||
Thereafter |
10,963 | |||
| | | | | |
Total |
$ | 36,720 | ||
| | | | | |
| | | | | |
| | | | | |
86
HILL INTERNATIONAL, INC. AND SUBSIDIARIES
NOTES TO CONSOLIDATED FINANCIAL STATEMENTS (Continued)
Note 18—Benefit Plans
The Company maintains a 401(k) Retirement Savings Plan (the "401(k) Plan") for qualified employees. The terms of the 401(k) Plan define qualified employees as those over 21 years of age. The Company matches 50% of employee contributions up to 2% of employee compensation up to a maximum $2,650. For the years ended December 31, 2016, 2015 and 2014, the Company recognized expense amounting to $1,005,000, $905,000 and $801,000, respectively, which is included in selling, general and administrative expenses in the consolidated statements of earnings.
Note 19—Segment and Related Information
At December 31, 2016, due to the pending sale of our Construction Claims Group, the Company now has one operating segment, the Project Management Group, which reflects how the Company will be managed going forward. The Project Management Group provides extensive construction and project management services to construction owners worldwide. Such services include program management, project management, construction management, project management oversight, troubled project turnaround, staff augmentation, project labor agreement consulting, commissioning, estimating and cost management, labor compliance services and facilities management services. The information for 2015 and 2014 has been revised to exclude the operations of the Construction Claims Group which is accounted for as discontinued operations.
The following tables present certain information for the Project Management Group's operations (in thousands):
Consulting Fee Revenue by Geographic Region
| |
2016 | 2015 | 2014 | ||||||||||||||||
|---|---|---|---|---|---|---|---|---|---|---|---|---|---|---|---|---|---|---|---|
United States |
$ | 137,528 | 31.7 | % | $ | 122,423 | 26.2 | % | $ | 102,095 | 23.8 | % | |||||||
Latin America |
18,708 | 4.3 | 26,304 | 5.6 | 36,925 | 8.6 | |||||||||||||
Europe |
38,455 | 8.8 | 39,519 | 8.4 | 34,943 | 8.2 | |||||||||||||
Middle East |
204,780 | 47.2 | 245,985 | 52.6 | 222,754 | 51.9 | |||||||||||||
Africa |
20,815 | 4.8 | 20,461 | 4.4 | 18,402 | 4.3 | |||||||||||||
Asia/Pacific |
13,861 | 3.2 | 13,185 | 2.8 | 13,708 | 3.2 | |||||||||||||
| | | | | | | | | | | | | | | | | | | | |
Total |
$ | 434,147 | 100.0 | % | $ | 467,877 | 100.0 | % | $ | 428,827 | 100.0 | % | |||||||
| | | | | | | | | | | | | | | | | | | | |
| | | | | | | | | | | | | | | | | | | | |
| | | | | | | | | | | | | | | | | | | | |
For the year ended December 31, 2016, consulting fee revenue from the United Arab Emirates amounted to $70,834,000 representing 16.3% of the total and Saudi Arabia amounted to $47,783,000 representing 11.0% of the total. No other country except for the United States accounted for over 10% of consulting fee revenue.
For the year ended December 31, 2015, consulting fee revenue from the United Arab Emirates amounted to $86,327,000 representing 18.5% of the total, Saudi Arabia amounted to $53,348,000 representing 11.4% of the total and Oman amounted to $54,243,000 representing 11.6% of the total. No other country except for the United States accounted for over 10% of consulting fee revenue.
For the year ended December 31, 2014, consulting fee revenue from the United Arab Emirates amounted to $48,713,000 representing 11.4% of the total, Oman amounted to $62,337,000 representing 14.5% of the total and Saudi Arabia amounted to $48,259,000 representing 11.3% of the total. No other country except for the United States accounted for over 10% of consulting fee revenue.
87
HILL INTERNATIONAL, INC. AND SUBSIDIARIES
NOTES TO CONSOLIDATED FINANCIAL STATEMENTS (Continued)
Note 19—Segment and Related Information (Continued)
Total Revenue by Geographic Region
| |
2016 | 2015 | 2014 | ||||||||||||||||
|---|---|---|---|---|---|---|---|---|---|---|---|---|---|---|---|---|---|---|---|
United States |
$ | 204,036 | 39.2 | % | $ | 187,399 | 33.9 | % | $ | 146,224 | 30.0 | % | |||||||
Latin America |
18,774 | 3.6 | 26,351 | 4.8 | 36,948 | 7.6 | |||||||||||||
Europe |
41,242 | 7.9 | 42,913 | 7.8 | 37,358 | 7.7 | |||||||||||||
Middle East |
217,875 | 41.8 | 255,897 | 46.3 | 230,879 | 47.3 | |||||||||||||
Africa |
24,037 | 4.6 | 23,935 | 4.3 | 21,657 | 4.4 | |||||||||||||
Asia/Pacific |
14,883 | 2.9 | 16,081 | 2.9 | 14,688 | 3.0 | |||||||||||||
| | | | | | | | | | | | | | | | | | | | |
Total |
$ | 520,847 | 100.0 | % | $ | 552,576 | 100.0 | % | $ | 487,754 | 100.0 | % | |||||||
| | | | | | | | | | | | | | | | | | | | |
| | | | | | | | | | | | | | | | | | | | |
| | | | | | | | | | | | | | | | | | | | |
For the year ended December 31, 2016, total revenue from the United Arab Emirates amounted to $75,641,000 representing 14.5% of the total. No other country except for the United States accounted for over 10% of total revenue.
For the year ended December 31, 2015, total revenue from the United Arab Emirates amounted to $89,618,000 representing 16.2% of the total and total revenue from Oman amounted to $58,390,000 representing 10.6% of the total. No other country except for the United States accounted for over 10% of total revenue.
For the year ended December 31, 2014, total revenue from the United Arab Emirates amounted to $49,855,000 representing 10.2% of the total, Oman amounted to $66,175,000 representing 13.6% of the total and Saudi Arabia amounted to $48,919,000 representing 10.0% of the total. No other country except for the United States accounted for over 10% of total revenue.
Operating Profit (Loss)
| |
2016 | 2015 | 2014 | |||||||
|---|---|---|---|---|---|---|---|---|---|---|
United States |
$ | 17,981 | $ | 14,459 | $ | 7,424 | ||||
Latin America |
(1,687 | ) | 1,309 | 1,418 | ||||||
Europe |
(4,646 | ) | (6,312 | ) | (5,145 | ) | ||||
Middle East |
20,109 | 43,792 | 42,368 | |||||||
Africa |
1,963 | 822 | 4,816 | |||||||
Asia/Pacific |
1,677 | 1,850 | 2,293 | |||||||
Corporate |
(36,251 | ) | (36,816 | ) | (30,232 | ) | ||||
| | | | | | | | | | | |
Total |
$ | (854 | ) | $ | 19,104 | $ | 22,942 | |||
| | | | | | | | | | | |
| | | | | | | | | | | |
| | | | | | | | | | | |
Depreciation and Amortization Expense
| |
2016 | 2015 | 2014 | |||||||
|---|---|---|---|---|---|---|---|---|---|---|
Project Management |
$ | 6,535 | $ | 7,477 | $ | 6,888 | ||||
Corporate |
618 | 432 | 216 | |||||||
| | | | | | | | | | | |
Total |
$ | 7,153 | $ | 7,909 | $ | 7,104 | ||||
| | | | | | | | | | | |
| | | | | | | | | | | |
| | | | | | | | | | | |
88
HILL INTERNATIONAL, INC. AND SUBSIDIARIES
NOTES TO CONSOLIDATED FINANCIAL STATEMENTS (Continued)
Note 19—Segment and Related Information (Continued)
Consulting Fee Revenue By Client Type
| |
2016 | 2015 | 2014 | ||||||||||||||||
|---|---|---|---|---|---|---|---|---|---|---|---|---|---|---|---|---|---|---|---|
U.S. federal government |
$ | 9,600 | 2.2 | % | $ | 8,569 | 1.8 | % | $ | 9,792 | 2.3 | % | |||||||
U.S. state, regional and local governments |
94,459 | 21.8 | 82,181 | 17.6 | 70,036 | 16.3 | |||||||||||||
Foreign governments |
153,445 | 35.3 | 195,383 | 41.8 | 193,283 | 45.1 | |||||||||||||
Private sector |
176,643 | 40.7 | 181,744 | 38.8 | 155,716 | 36.3 | |||||||||||||
| | | | | | | | | | | | | | | | | | | | |
Total |
$ | 434,147 | 100.0 | % | $ | 467,877 | 100.0 | % | $ | 428,827 | 100.0 | % | |||||||
| | | | | | | | | | | | | | | | | | | | |
| | | | | | | | | | | | | | | | | | | | |
| | | | | | | | | | | | | | | | | | | | |
Total Revenue By Client Type
| |
2016 | 2015 | 2014 | ||||||||||||||||
|---|---|---|---|---|---|---|---|---|---|---|---|---|---|---|---|---|---|---|---|
U.S. federal government |
$ | 12,046 | 2.3 | % | $ | 10,656 | 1.9 | % | $ | 12,398 | 2.5 | % | |||||||
U.S. state, regional and local governments |
155,596 | 29.9 | 138,044 | 25.0 | 107,247 | 22.0 | |||||||||||||
Foreign governments |
168,833 | 32.4 | 211,907 | 38.3 | 205,601 | 42.2 | |||||||||||||
Private sector |
184,372 | 35.4 | 191,969 | 34.8 | 162,508 | 33.3 | |||||||||||||
| | | | | | | | | | | | | | | | | | | | |
Total |
$ | 520,847 | 100.0 | % | $ | 552,576 | 100.0 | % | $ | 487,754 | 100.0 | % | |||||||
| | | | | | | | | | | | | | | | | | | | |
| | | | | | | | | | | | | | | | | | | | |
| | | | | | | | | | | | | | | | | | | | |
Property, Plant and Equipment, Net by Geographic Location
| |
December 31, | ||||||
|---|---|---|---|---|---|---|---|
| |
2016 | 2015 | |||||
United States |
$ | 13,024 | $ | 13,304 | |||
Latin America |
881 | 1,017 | |||||
Europe |
218 | 807 | |||||
Middle East |
1,645 | 2,318 | |||||
Africa |
169 | 589 | |||||
Asia/Pacific |
850 | 946 | |||||
| | | | | | | | |
Total |
$ | 16,787 | $ | 18,981 | |||
| | | | | | | | |
| | | | | | | | |
| | | | | | | | |
89
REPORT OF INDEPENDENT REGISTERED PUBLIC ACCOUNTING FIRM
To
the Board of Directors and Stockholders of
Hill International, Inc. and Subsidiaries
We have audited the accompanying consolidated balance sheets of Hill International, Inc. and Subsidiaries (the "Company") as of December 31, 2016 and 2015, and the related consolidated statements of operations, comprehensive loss, stockholders' equity, and cash flows for each of the years in the three-year period ended December 31, 2016. In connection with our audits of the consolidated financial statements, we have also audited financial statement schedule "Schedule II—Valuation and Qualifying Accounts" for each of the years in the three-year period ended December 31, 2016. The financial statements and financial statement schedule are the responsibility of the Company's management. Our responsibility is to express an opinion on these financial statements and financial statement schedule based on our audits.
We conducted our audits in accordance with the standards of the Public Company Accounting Oversight Board (United States). Those standards require that we plan and perform the audit to obtain reasonable assurance about whether the financial statements are free of material misstatement. An audit includes examining, on a test basis, evidence supporting the amounts and disclosures in the financial statements. An audit also includes assessing the accounting principles used and significant estimates made by management, as well as evaluating the overall financial statement presentation. We believe that our audits provide a reasonable basis for our opinion.
In our opinion, the financial statements referred to above present fairly, in all material respects, the consolidated financial position of Hill International, Inc. and Subsidiaries as of December 31, 2016 and 2015, and the consolidated results of their operations and their cash flows for each of the years in the three-year period ended December 31, 2016 in conformity with accounting principles generally accepted in the United States of America. Also, in our opinion, the related financial statement schedule, when considered in relation to the basic financial statements taken as a whole, presents fairly, in all material respects, the information stated therein.
We also have audited, in accordance with the standards of the Public Company Accounting Oversight Board (United States), Hill International, Inc. and Subsidiaries' internal control over financial reporting as of December 31, 2016, based on criteria established in the 2013 Internal Control—Integrated Framework issued by the Committee of Sponsoring Organizations of the Treadway Commission ("COSO"), and our report dated March 31, 2017 expressed an adverse opinion on the Company's internal control over financial reporting.
/s/
EisnerAmper LLP
Iselin, New Jersey
March 31, 2017
90
REPORT OF INDEPENDENT REGISTERED PUBLIC ACCOUNTING FIRM
To
the Board of Directors and Stockholders
Hill International, Inc. and Subsidiaries
We have audited Hill International, Inc. and Subsidiaries' (the "Company") internal control over financial reporting as of December 31, 2016, based on criteria established in the 2013 Internal Control—Integrated Framework issued by the Committee of Sponsoring Organizations of the Treadway Commission ("COSO"). The Company's management is responsible for maintaining effective internal control over financial reporting and for its assessment of the effectiveness of internal control over financial reporting, included in the accompanying Management's Annual Report on Internal Control over Financial Reporting. Our responsibility is to express an opinion on the Company's internal control over financial reporting based on our audit.
We conducted our audit in accordance with the standards of the Public Company Accounting Oversight Board (United States). Those standards require that we plan and perform the audit to obtain reasonable assurance about whether effective internal control over financial reporting was maintained in all material respects. Our audit included obtaining an understanding of internal control over financial reporting, assessing the risk that a material weakness exists, and testing and evaluating the design and operating effectiveness of internal control based on the assessed risk. Our audit also included performing such other procedures as we considered necessary in the circumstances. We believe that our audit provides a reasonable basis for our opinion.
An entity's internal control over financial reporting is a process designed to provide reasonable assurance regarding the reliability of financial reporting and the preparation of financial statements for external purposes in accordance with generally accepted accounting principles. An entity's internal control over financial reporting includes those policies and procedures that (i) pertain to the maintenance of records that, in reasonable detail, accurately and fairly reflect the transactions and dispositions of the assets of the entity; (ii) provide reasonable assurance that transactions are recorded as necessary to permit preparation of financial statements in accordance with generally accepted accounting principles, and that receipts and expenditures of the entity are being made only in accordance with authorizations of management and directors of the entity; and (iii) provide reasonable assurance regarding prevention or timely detection of unauthorized acquisition, use, or disposition of the entity's assets that could have a material effect on the financial statements.
Because of its inherent limitations, internal control over financial reporting may not prevent or detect misstatements. Also, projections of any evaluation of effectiveness to future periods are subject to the risk that controls may become inadequate because of changes in conditions, or that the degree of compliance with the policies or procedures may deteriorate.
A material weakness is a control deficiency, or combination of deficiencies, in internal control over financial reporting, such that there is a reasonable possibility that a material misstatement of the Company's annual or interim financial statements will not be prevented or detected on a timely basis. The following material weaknesses have been identified and included in management's assessment: (i) material weaknesses exist relating to the controls of estimating the potential loss on the Company's accounts receivable, (ii) ineffective controls for the accounting closing process, accounting estimates and non-routine transactions, and (iii) lack of controls in place to timely identify non-compliance or the misapplication of local employment related tax regulations as of December 31, 2016. These material weaknesses were considered in determining the nature, timing, and extent of the audit tests applied in our audit of the December 31, 2016 financial statements, and this report does not affect our report dated March 31, 2017, on those financial statements.
91
In our opinion, because of the effect of the material weaknesses described above on the achievement of the objectives of the control criteria, Hill International, Inc. and Subsidiaries has not maintained effective internal control over financial reporting as of December 31, 2016, based on criteria established in the 2013 Internal Control—Integrated Framework issued by COSO.
We also have audited, in accordance with the standards of the Public Company Accounting Oversight Board (United States), the consolidated balance sheets of Hill International, Inc. and Subsidiaries as of December 31, 2016 and 2015, and the related consolidated statements of operations, comprehensive loss, stockholders' equity, and cash flows for each of the years in the three-year period ended December 31, 2016, and our report dated March 31, 2017 expressed an unqualified opinion thereon.
/s/
EisnerAmper LLP
Iselin, New Jersey
March 31, 2017
92
Quarterly Results (Unaudited)
Due to the pending sale of its Construction Claims Group, the Company has classified the assets and liabilities of that segment as held for sale and has reflect its operations as discontinued operations for all periods presented. The following is a summary of certain quarterly financial information for fiscal years 2016 and 2015 (in thousands except per share data).
| |
First Quarter |
Second Quarter |
Third Quarter |
Fourth Quarter |
Total | |||||||||||
|---|---|---|---|---|---|---|---|---|---|---|---|---|---|---|---|---|
2016 |
||||||||||||||||
Consulting fee revenue |
$ | 116,579 | $ | 110,126 | $ | 106,868 | $ | 100,574 | $ | 434,147 | ||||||
Total revenue |
134,370 | 131,845 | 125,872 | 128,760 | 520,847 | |||||||||||
Gross profit |
41,069 | 39,491 | 43,543 | 37,801 | 161,904 | |||||||||||
Operating profit (loss) |
2,686 | 3,765 | (3,396 | ) | (3,909 | )(1) | (854 | ) | ||||||||
Earnings (loss) from continuing operations |
2,307 | 873 | (6,476 | ) | (4,320 | ) | (7,616 | ) | ||||||||
(Loss) earnings from discontinued operations |
(853 | ) | 604 | (279 | ) | (10,548 | )(1) | (11,076 | ) | |||||||
Net earnings (loss) attributable to Hill |
1,450 | 1,490 | (6,866 | ) | (14,902 | ) | (18,828 | ) | ||||||||
Basic earnings (loss) per common share from continuing operations |
$ | 0.04 | $ | 0.02 | $ | (0.12 | ) | $ | (0.08 | ) | $ | (0.15 | ) | |||
Basic earnings (loss) per common share from discontinued operations |
(0.01 | ) | 0.01 | (0.01 | ) | (0.20 | ) | (0.21 | ) | |||||||
| | | | | | | | | | | | | | | | | |
Basic earnings (loss) per common share—Hill International, Inc. |
$ | 0.03 | $ | 0.03 | $ | (0.13 | ) | $ | (0.28 | ) | $ | (0.36 | ) | |||
| | | | | | | | | | | | | | | | | |
| | | | | | | | | | | | | | | | | |
| | | | | | | | | | | | | | | | | |
Diluted earnings (loss) per common share from continuing operations |
$ | 0.04 | $ | 0.02 | $ | (0.12 | ) | $ | (0.08 | ) | $ | (0.15 | ) | |||
Diluted earnings (loss) per common share from discontinued operations |
(0.01 | ) | 0.01 | (0.01 | ) | (0.20 | ) | (0.21 | ) | |||||||
| | | | | | | | | | | | | | | | | |
Diluted earnings (loss) per common share—Hill International, Inc. |
$ | 0.03 | $ | 0.03 | $ | (0.13 | ) | $ | (0.28 | ) | $ | (0.36 | ) | |||
| | | | | | | | | | | | | | | | | |
| | | | | | | | | | | | | | | | | |
| | | | | | | | | | | | | | | | | |
2015 |
||||||||||||||||
Consulting fee revenue |
$ | 112,117 | $ | 116,464 | $ | 116,541 | $ | 122,755 | $ | 467,877 | ||||||
Total revenue |
129,995 | 137,052 | 135,539 | 149,990 | 552,576 | |||||||||||
Gross profit |
43,386 | 43,089 | 46,082 | 46,475 | 179,032 | |||||||||||
Operating profit |
3,273 | 5,880 | 7,111 | 2,840 | (2) | 19,104 | ||||||||||
Earnings from continuing operations |
2,310 | 3,700 | 2,476 | 2,127 | 10,613 | |||||||||||
(Loss) earnings from discontinued operations |
(1,462 | ) | 835 | 860 | (3,107 | ) | (2,874 | ) | ||||||||
Net earnings (loss) attributable to Hill |
$ | 702 | $ | 4,395 | $ | 2,948 | $ | (1,114 | ) | $ | 6,931 | |||||
Basic earnings (loss) per common share from continuing operations |
$ | 0.04 | $ | 0.07 | $ | 0.05 | $ | 0.04 | $ | 0.20 | ||||||
Basic earnings (loss) per common share from discontinued operations |
$ | (0.03 | ) | $ | 0.02 | $ | 0.01 | $ | (0.06 | ) | $ | (0.06 | ) | |||
| | | | | | | | | | | | | | | | | |
Basic earnings (loss) per common share—Hill International, Inc. |
$ | 0.01 | $ | 0.09 | $ | 0.06 | $ | (0.02 | ) | $ | 0.14 | |||||
| | | | | | | | | | | | | | | | | |
| | | | | | | | | | | | | | | | | |
| | | | | | | | | | | | | | | | | |
Diluted earnings (loss) per common share from continuing operations |
0.04 | $ | 0.07 | $ | 0.05 | $ | 0.04 | $ | 0.20 | |||||||
Diluted earnings (loss) per common share from discontinued operations |
$ | (0.03 | ) | $ | 0.02 | $ | 0.01 | $ | (0.06 | ) | $ | (0.06 | ) | |||
| | | | | | | | | | | | | | | | | |
Diluted earnings (loss) per common share—Hill International, Inc. |
$ | 0.01 | $ | 0.09 | $ | 0.06 | $ | (0.02 | ) | $ | 0.14 | |||||
| | | | | | | | | | | | | | | | | |
| | | | | | | | | | | | | | | | | |
| | | | | | | | | | | | | | | | | |
- (1)
- There
were significant charges totaling $10,377,000 that adversely affected the results for the fourth quarter of 2016. These charges included the
following:
- •
- $2,106,000 related to certain tax matters in foreign jurisdictions was charged to discontinued operations;
93
- •
- $6,047,000 of bad debt expense, of which $4,190,000 was charged to SG&A expenses and $1,857,000 was
charged to discontinued operations; and
- •
- $2,224,000 of legal and professional costs related to the pending sale of CCG which was charged to
discontinued operations
- (2)
- There
were significant charges totaling $ 4,998,000 that adversely affected the results for the fourth quarter of 2015. These charges included the
following:
- •
- $2,247,000 of increased bad debt expense;
- •
- $959,000 related to a write-down of a note receivable to the value of the underlying collateral;
- •
- $832,000 of legal and other professional fees related to the shareholder proxy contest;
- •
- $562,000 of severance costs associated with our cost optimization plan; and
- •
- $398,000 of legal and other professional fees related to the restatement of the Company's consolidated financial statements for 2014, 2013 and 2012.
94
Item 9. Changes in and Disagreements with Accountants on Accounting and Financial Disclosure.
None.
Item 9A. Controls and Procedures.
(a) Evaluation of Disclosure Controls and Procedures.
The Management of the Company, under the supervision and with the participation of our Chief Executive Officer and Chief Financial Officer, has evaluated the effectiveness of the Company's disclosure controls and procedures (as such term is defined in Rule 13a-15(e) of the Securities Exchange Act of 1934, as amended (the "Exchange Act")), as of December 31, 2016.
Notwithstanding the existence of the material weaknesses described below, the Chief Executive Officer and Chief Financial Officer have concluded that the consolidated financial statements in this report fairly present, in all material respects, the Company's financial position, results of operations and cash flows as of the dates and for the periods presented, in conformity with accounting principles generally accepted in the United States of America ("GAAP").
As described below, the Company's Management has identified material weaknesses in its internal control over financial reporting. These material weaknesses, as further explained below, require additional time to test the effectiveness of corrective measures taken, and thus have not been remediated. Therefore the Company's Management concluded that its disclosure controls and procedures were not effective as of December 31, 2016 to provide reasonable assurance that information required to be disclosed by the Company in this Form 10-K is recorded, processed, summarized and reported within the time periods specified in the Securities and Exchange Commission's rules and forms, and that such information is accumulated and communicated to Management, including its principal executive officer and principal financial officer, as appropriate, to allow timely decisions regarding required disclosure.
(b) Management's Report on Internal Control over Financial Reporting.
The Company's Management is responsible for establishing and maintaining adequate internal control over financial reporting. The Company's internal control over financial reporting is a process designed to provide reasonable assurance of the reliability of financial reporting and of the preparation of financial statements for external reporting purposes, in accordance with GAAP.
Internal control over financial reporting includes policies and procedures that (1) pertain to the maintenance of records that, in reasonable detail, accurately and fairly reflect transactions and disposition of assets; (2) provide reasonable assurance that transactions are recorded as necessary to permit preparation of financial statements in accordance with U.S. generally accepted accounting principles, and that receipts and expenditures are being made only in accordance with the authorization of its Management and directors; and (3) provide reasonable assurance regarding the prevention or timely detection of unauthorized acquisition, use, or disposition of the Company's assets that could have a material effect on its financial statements.
Because of its inherent limitations, internal control over financial reporting may not prevent or detect misstatements. Also, projections of any evaluation of the effectiveness to future periods are subject to the risk that controls may become inadequate because of changes in conditions, or that the degree of compliance with the policies and procedures included in such controls may deteriorate.
The Company's Management has assessed the effectiveness of the Company's internal control over financial reporting as of December 31, 2016. In making this assessment, the Company's Management used the criteria established by the Committee of Sponsoring Organizations of the Treadway Commission (COSO) in Internal Control—Integrated Framework (2013). These criteria are in the areas
95
of control environment, risk assessment, control activities, information and communication, and monitoring. The Company's Management assessment included extensive documenting, evaluating and testing the design and operating effectiveness of its internal control over financial reporting. Since first identifying the two material weaknesses in 2015, as detailed below, we have monitored the remediation efforts to evaluate whether the reported material weaknesses have been effectively remediated. Although control changes have been implemented we have concluded that the period of time which the operating effectiveness over newly implemented and modified controls was not sufficient for Management to conclude that these material weaknesses have been remediated. Based on the Company's processes and assessment, as described above, Management has concluded that, as of December 31, 2016, the Company's internal control over financial reporting was not effective because of the previously identified material weaknesses set forth below in addition to a newly identified material weakness related to certain tax controls.
Accounts Receivable Controls
- •
- Management misapplied GAAP as it relates to the estimation of the potential loss on the Company's accounts receivable. Specifically, the Company did not have sufficient procedures and controls in place to enable the proper application of GAAP to significant, non-routine transactions.
Accounting Close Controls
- •
- Management did not maintain effective procedures in the areas of the accounting closing process, accounting estimates and non-routine transactions.
Additionally, it was discovered in 2016, that controls were either inadequately designed or did not exist as it relates to taxes in certain foreign jurisdictions to ensure compliance with the respective tax laws and regulations of the jurisdictions in which the employees were providing services. The Company's Management would advise local management on the rules and regulations in those jurisdictions and the proper tax implications. However, it was discovered in connection with the sale of the Construction Claims Group these procedures were not followed by local management and Corporate Management did not have a control in place to identify non-compliance or the misapplication of local employment related tax laws.
Management's Plan for Remediation
Management is committed to the implementation of a plan to address the material weaknesses and to ensure that each area affected by a material control weakness is adequately remediated. These remediation efforts, summarized below, portions of which are either implemented or in process, are intended to both address the identified material weaknesses and to enhance the Company's overall financial control environment. Because some of the controls included in our remediation plan will be implemented in 2017, and other new and modified controls, as previously described, have only been operational for a portion of 2016, we have concluded that more time is necessary to observe the effectiveness of the controls before Management can conclude that these material weaknesses have been effectively remediated.
- •
- Material Weakness related to Accounts Receivable controls: We have taken or completed actions with certain other planned actions to be completed over the next 12 months to remediate the material weakness.
96
Completed Actions
The Company's Management under the direction of the Board of Directors has further strengthened the existing controls surrounding reviews of accounts receivable and reserves for potential losses by developing and implementing the following controls:
- •
- Increased accountability at the operational manger and local finance director levels to closely monitor significant past due accounts and
surface potential collection issues to regional or upper management on a monthly basis or sooner. Required independent and detail documentation and contracts will be provided to country or regional
CFOs and headquarter management who will evaluate the collectability of significant client account balances.
- •
- Enhanced transparency and active monitoring at the executive level will be achieved through quarterly meetings to review and assess the proper
application of GAAP in financial reporting and estimates. Material accruals and contingencies (including reserves for account receivable) will be evaluated objectively by the executive management with
input from the business segment units prior to the conclusion of quarterly financial reporting processes.
- •
- Enhanced transparency and effective monitoring at the Audit Committee of the Board of Directors will be achieved through regular or quarterly meetings of the Board to review and evaluate the Company's conclusion and assessment on the key estimates and reserves that will have significant impact on the Company's financial position, results of operation or cash flows.
Planned Actions
- •
- Enhance the documentation and evidence to support the above controls to ensure that the conclusions reached regarding the accounts receivable
reserves are clear.
- •
- Implement a timely follow-up process with local operations management and finance director levels to verify that the most current information
is utilized for financial reporting.
- •
- Conduct a training with personnel involved with the accounts receivable controls to reinforce the importance of the controls and the
application of controls on a consistent basis.
- •
- Material Weakness related to Accounting Close controls: We have taken or completed actions with certain other planned actions to be completed over the next 12 months to remediate the material weakness.
Completed Actions
- •
- Implemented and enhanced process level policies and procedures over the financial close process to ensure reconciliations and accruals are
accurate in all material respects, completed in a timely manner, and properly reviewed by the Company's Management.
- •
- Implemented new and/or improved joint venture accounting controls that will provide for greater transparency and accuracy of the joint venture and its applicable accounting.
Planned Actions
- •
- Review financial controls to assess if additional management review controls are necessary and work with all finance personnel to establish the appropriate documentation criteria for the existing controls including evidence of review, timeliness and variance thresholds.
97
Material Weakness related to Tax controls:
Planned Actions
- •
- Corporate Management will develop controls to follow up with foreign local management to ensure the proper analysis was prepared and the proper assessment made as to compliance with the respective employment related tax laws and regulations of the jurisdictions in which the employees are providing services.
When fully implemented and operational, which we expect will occur prior to the end of 2017, the Company's Management believes the measures described above will remediate the material weaknesses identified and strengthen its internal control over financial reporting. The Company is committed to continuing to improve its internal control processes, and will continue to diligently and vigorously review its financial reporting controls and procedures. As the Company's Management continues to evaluate and work to improve its internal control over financial reporting, the Company's Management may determine to take additional measures to address the material weaknesses or determine to modify, or in appropriate circumstances not to complete, certain of the remediation measures described above.
Not applicable.
98
Item 10. Directors, Executive Officers and Corporate Governance.
The information in our 2017 Proxy Statement, which will be filed with the U. S. Securities and Exchange Commission within 120 days after the close of our fiscal year, regarding directors and executive officers appearing under the headings "Proposal 1: Election of Directors" and "Other Matters—Section 16(a) Beneficial Ownership Reporting Compliance" is incorporated by reference in this section. The information under the heading "Executive Officers" in Part I, Item 1 of this Form 10-K is also incorporated by reference in this section. In addition, the information under the heading "Corporate Governance" in our 2015 Proxy Statement is incorporated by reference in this section.
We have adopted a code of ethics that applies to all of our employees, including our principal executive officer, principal financial officer, principal accounting officer or controller, or persons performing similar functions. This code of ethics is available on our website at www.hillintl.com, or may be obtained free of charge by making a written request addressed to our Legal Department. We will disclose on our website amendments to, and, if any are granted, waivers of, our code of ethics.
Item 11. Executive Compensation.
The information appearing in our 2017 Proxy Statement under the headings "Director Compensation," "Compensation Discussion and Analysis," "Report of the Compensation Committee", and "Executive Compensation" is incorporated by reference in this section.
Item 12. Security Ownership of Certain Beneficial Owners and Management and Related Stockholder Matters.
The information appearing in our 2017 Proxy Statement under the heading "Security Ownership of Certain Beneficial Owners and Management" is incorporated by reference in this section.
Equity Compensation Plan Information
The following table provides information as of December 31, 2016 for common shares of the Company that may be issued under our 2006 Employee Stock Option Plan, our 2008 Employee Stock Purchase Plan and our 2009 Non-Employee Director Stock Grant Plan. See Note 13 to the consolidated financial statements for further information related to these plans.
| |
Number of securities to be issued upon exercise of outstanding options, warrants and rights A |
Weighted-average exercise price of outstanding options, warrants and rights B |
Number of securities remaining available for future issuance under equity compensation plans (excluding securities reflected in column A) C |
|||||||
|---|---|---|---|---|---|---|---|---|---|---|
Equity compensation plans approved by security holders |
7,061,820 | $ | 4.13 | 3,032,558 | (1) | |||||
Equity compensation plans not approved by security holders |
— | — | — | |||||||
| | | | | | | | | | | |
Total |
7,061,820 | $ | 4.13 | 3,032,558 | ||||||
| | | | | | | | | | | |
| | | | | | | | | | | |
| | | | | | | | | | | |
- (1)
- As of December 31, 2016, the Company had 1,643,112 shares remaining available for future issuance under our 2006 Employee Stock Option Plan, 1,274,259 shares remaining available for future issuance under our 2008 Employee Stock Purchase Plan and 115,187 (including 95,884
99
Deferred Stock Units issued to directors) shares remaining available for future issuance under our 2009 Non-Employee Director Stock Grant Plan.
Item 13. Certain Relationships and Related Transactions, and Director Independence.
The information appearing in our 2017 Proxy Statement under the headings "Corporate Governance" and "Certain Relationships and Related Transactions" is incorporated by reference in this section.
Item 14. Principal Accounting Fees and Services.
The information appearing in our 2017 Proxy Statement under the headings "Independent Auditors" and "Audit Committee Report" is incorporated by reference in this section.
100
Item 15. Exhibits and Financial Statement Schedules.
- (a)
- Documents filed as part of this report:
Financial statements:
The consolidated balance sheets of the Registrant as of December 31, 2016 and 2015, the related consolidated statements of operations, comprehensive (loss) earnings, stockholders' equity and cash flows for each of the years in the three-year period ended December 31, 2016, the footnotes thereto, and the report of EisnerAmper LLP, independent auditors, are filed herewith.
Financial statement schedule:
Schedule II—Valuation and Qualifying Accounts for the years ended December 31, 2016, 2015 and 2014.
101
- (b)
- Exhibits
| Exhibit No. | Description | ||
|---|---|---|---|
| 2.1 | Agreement and Plan of Merger dated December 5, 2005, by and among Arpeggio Acquisition Corporation, Hill International, Inc. and certain stockholders of Hill International, Inc., as amended.(1) | ||
| 3.1 | Amended and Restated Certificate of Incorporation of Arpeggio Acquisition Corporation.(2) | ||
| 3.2 | Amended and Restated By-laws of Hill International, Inc. | ||
| 3.3 | Certificate of First Amendment of Amended and Restated Certificate of Incorporation of Hill International, Inc.(3) | ||
| 4.1 | Specimen Common Stock Certificate.(4) | ||
| 10.1 | * | Hill International, Inc. 2006 Employee Stock Option Plan (as amended through June 11, 2012).(5) | |
| 10.2 | * | Employment Agreement between the Company and Irvin E. Richter, dated as of December 31, 2014.(6) | |
| 10.3 | * | Employment Agreement between the Company and David L. Richter, dated as of December 31, 2014.(7) | |
| 10.4 | U.S. Credit Agreement, dated as of September 26, 2014, among Hill International, Inc., as borrower, Société Générale, as administrative agent, collateral agent and lender, the other lenders party thereto, and certain subsidiaries of the Company.(8) | ||
| 10.5 | U.S. Guaranty and Security Agreement, dated as of September 26, 2014, among Hill International, Inc., Société Générale, as administrative agent and collateral agent and certain subsidiaries of the Company.(9) | ||
| 10.6 | International Credit Agreement, dated as of September 26, 2014, among Hill International N.V., as borrower, Hill International, Inc., certain of its subsidiaries party thereto, and Société Générale, as administrative agent, collateral agent and letter of credit issuer, and the lenders party thereto.(10) | ||
| 10.7 | International Guaranty and Security Agreement, dated as of September 26, 2014, among Hill International N.V., as borrower, Hill International, Inc., and the lenders party thereto in favor of Société Générale, as administrative agent.(11) | ||
| 10.8 | Intercreditor Agreement, dated as of September 26, 2014, by and among Société Générale, as collateral agent, and the loan parties thereto.(12) | ||
| 10.9 | * | Hill International, Inc. 2009 Non-Employee Director Stock Grant Plan, as amended.(13) | |
| 10.10 | * | Hill International, Inc. 2007 Restricted Stock Grant Plan.(14) | |
| 10.11 | * | Hill International, Inc. 2008 Employee Stock Purchase Plan.(15) | |
| 10.12 | * | Hill International, Inc. 2015 Senior Executive Retention Plan.(16) | |
| 10.13 | Hill International, Inc. 2010 Senior Executive Bonus Plan.(17) | ||
102
| Exhibit No. | Description | ||
|---|---|---|---|
| 10.14 | Stock Purchase Agreement, dated as of December 20, 2016, by and among Hill International, Inc., Hill International N.V., Liberty Mergeco, Inc. and Liberty Bidco UK Limited.(18) | ||
| 10.15 | * | Employment Agreement between the Company and Raouf S. Ghali, dated August 18, 2016.(19) | |
| 10.16 | * | Hill International, Inc. 2016 Executive Retention Plan.(20) | |
| 10.17 | * | Form of Hill International, Inc. 2016 Executive Retention Plan Participation Agreement.(21) | |
| 10.18 | Settlement Agreement among the Company, Bulldog Investors LLC, and certain directors of the Company, dated September 16, 2016.(22) | ||
| 21 | Subsidiaries of the Registrant. | ||
| 23.1 | Consent of EisnerAmper LLP, Independent Registered Public Accounting Firm | ||
| 31.1 | Certification of Chief Executive Officer pursuant to Section 302 of the Sarbanes-Oxley Act of 2002. | ||
| 31.2 | Certification of Chief Financial Officer pursuant to Section 302 of the Sarbanes-Oxley Act of 2002. | ||
| 32.1 | Certification of Chief Executive Officer pursuant to Section 906 of the Sarbanes-Oxley Act of 2002. | ||
| 32.2 | Certification of Chief Financial Officer pursuant to Section 906 of the Sarbanes-Oxley Act of 2002. | ||
| 101.INS | XBRL Instance Document. | ||
| 101.SCH | XBRL Taxonomy Extension Schema Document. | ||
| 101.PRE | XBRL Taxonomy Presentation Linkbase Document. | ||
| 101.CAL | XBRL Taxonomy Calculation Linkbase Document. | ||
| 101.LAB | XBRL Taxonomy Label Linkbase Document. | ||
| 101.DEF | XBRL Taxonomy Extension Definition Linkbase Document. | ||
| (1) | Included as Annex A of the Definitive Proxy Statement (No. 000-50781) filed on June 6, 2006 and incorporated herein by reference. | |
(2) |
Included as Annex B of the Definitive Proxy Statement (No. 000-50781) filed on June 6, 2006 and incorporated herein by reference. |
|
(3) |
Included as Exhibit 3.3 to the Registrant's Annual Report on Form 10-K for the year ended December 31, 2012 filed on March 18, 2013 and incorporated herein by reference. |
|
(4) |
Included as Exhibit 4.2 to the Registrant's Registration Statement on Form S-1 (No. 333-114816) filed on April 23, 2004 and incorporated herein by reference. |
|
(5) |
Included as Exhibit 10.1 to the Registrant's Current Report on Form 8-K filed on June 14, 2012 and incorporated herein by reference. |
|
(6) |
Included as Exhibit 10.1 to the Registrant's Current Report on Form 8-K filed on January 31, 2014 and incorporated herein by reference. |
103
| (7) | Included as Exhibit 10.2 to the Registrant's Current Report on Form 8-K filed on January 31, 2014 and incorporated herein by reference. | |
(8) |
Included as Exhibit 10.1 to the Registrant's Current Report on Form 8-K filed on October 2, 2014 and incorporated herein by reference. |
|
(9) |
Included as Exhibit 10.2 to the Registrant's Current Report on Form 8-K filed on October 2, 2014 and incorporated herein by reference. |
|
(10) |
Included as Exhibit 10.3 to the Registrant's Current Report on Form 8-K filed on October 2, 2014 and incorporated herein by reference. |
|
(11) |
Included as Exhibit 10.4 to the Registrant's Current Report on Form 8-K filed on October 2, 2014 and incorporated herein by reference. |
|
(12) |
Included as Exhibit 10.5 to the Registrant's Current Report on Form 8-K filed on October 2, 2014 and incorporated herein by reference. |
|
(13)* |
Included as Exhibit 10.1 to the Registrant's Current Report on Form 8-K filed on June 6, 2013 and incorporated herein by reference. |
|
(14)* |
Included as Exhibit 4.4 to the Registrant's Registration Statement on Form S-8 (No. 333-141814), filed on April 2, 2007 and incorporated herein by reference. |
|
(15)* |
Included as Exhibit 4.4 to the Registrant's Registration Statement on Form S-8 (No. 333-152145), filed on July 3, 2008 and incorporated herein by reference. |
|
(16)* |
Included as Exhibit 10.1 to the Registrant's Current Report on Form 8-K filed on February 2, 2015 and incorporated herein by reference. |
|
(17) |
Included as Appendix A to the Registrant's Definitive Proxy Statement on Schedule 14A filed on April 30, 2010 and incorporated herein by reference. |
|
(18) |
Included as Exhibit 2.1 to the Registrant's Current Report on Form 8-K filed on December 20, 2016 and incorporated herein by reference. |
|
(19)* |
Included as Exhibit 10.1 to the Registrant's Current Report on Form 8-K filed on August 19, 2016 and incorporated herein by reference. |
|
(20)* |
Included as Exhibit 10.1 to the Registrant's Current Report on Form 8-K filed on November 9, 2016 and incorporated herein by reference. |
|
(21)* |
Included as Exhibit 10.2 to the Registrant's Current Report on Form 8-K filed on November 9, 2016 and incorporated herein by reference. |
|
(22) |
Included as Exhibit 10.2 to the Registrant's Quarterly Report on Form 10-Q filed on November 14, 2016 and incorporated herein by reference. |
|
* |
Constitutes a management contract or compensatory plan. |
104
Pursuant to the requirements of Section 13 or 15(d) of the Securities Exchange Act of 1934, the Registrant has duly caused this report to be signed on its behalf by the undersigned, thereunto duly authorized.
| Hill International, Inc. | ||||
By: |
/s/ DAVID L. RICHTER David L. Richter Chief Executive Officer Date: March 31, 2017 |
|||
Pursuant to the requirements of the Securities and Exchange Act of 1934, this report has been signed by the following persons on behalf of the Registrant and in the capacities and on the dated indicated.
| By: | /s/ CRAIG L. MARTIN Craig L. Martin Chairman and Director Date: March 31, 2017 |
By: | /s/ DAVID L. RICHTER David L. Richter Chief Executive Officer and Director (Principal Executive Officer) Date: March 31, 2017 |
|||
By: |
/s/ RAOUF S. GHALI Raouf S. Ghali President, Chief Operating Officer and Director Date: March 31, 2017 |
By: |
/s/ BRIAN W. CLYMER Brian W. Clymer Director Date: March 31, 2017 |
|||
By: |
/s/ JOHN FANELLI III John Fanelli III Executive Vice President and Chief Financial Officer (Principal Financial Officer and Principal Accounting Officer) Date: March 31, 2017 |
By: |
/s/ ALAN S. FELLHEIMER Alan S. Fellheimer Director Date: March 31, 2017 |
|||
By: |
/s/ CAMILLE S. ANDREWS Camille S. Andrews Director Date: March 31, 2017 |
By: |
/s/ PAUL J. EVANS Paul Evans Director Date: March 31, 2017 |
|||
By: |
/s/ STEVEN R. CURTS Steven R. Curts Director Date: March 31, 2017 |
By: |
/s/ DAVID D. SGRO David Sgro Director Date: March 31, 2017 |
|||
By: |
/s/ CHARLES M. GILLMAN Charles M. Gillman Director Date: March 31, 2017 |
105
Schedule II
Hill International, Inc. and Subsidiaries
Valuation and Qualifying Accounts
(Allowance for Uncollectible
Receivables—in thousands)
| |
Balance at Beginning of Fiscal Year |
Additions (Recoveries) Charged (Credited) to Earnings |
Other—Allowance Acquired in Business Combinations |
Uncollectible Receivables Written off, Net of Recoveries |
Balance at End of Fiscal Year |
|||||||||||
|---|---|---|---|---|---|---|---|---|---|---|---|---|---|---|---|---|
Fiscal year ended December 31, 2016 |
$ | 60,535 | $ | 14,454 | $ | — | $ | (3,907 | ) | $ | 71,082 | |||||
| | | | | | | | | | | | | | | | | |
| | | | | | | | | | | | | | | | | |
| | | | | | | | | | | | | | | | | |
Fiscal year ended December 31, 2015 |
$ | 66,119 | $ | 6,262 | $ | 120 | $ | (11,966 | ) | $ | 60,535 | |||||
| | | | | | | | | | | | | | | | | |
| | | | | | | | | | | | | | | | | |
| | | | | | | | | | | | | | | | | |
Fiscal year ended December 31, 2014 |
$ | 64,108 | $ | (5,195 | ) | $ | — | $ | 7,206 | $ | 66,119 | |||||
| | | | | | | | | | | | | | | | | |
| | | | | | | | | | | | | | | | | |
| | | | | | | | | | | | | | | | | |
106