Attached files
| file | filename |
|---|---|
| 8-K - 8-K - TELLURIAN INC. /DE/ | d257326d8k.htm |
| Exhibit 99.1
|
NASDAQ: TELL Investor presentation Scotia Howard Weil Conference – March 27, 2017 Meg Gentle, President & CEO
|
|
Notice The information in this presentation includes “forward-looking statements” within the meaning of Section 27A of the Securities Act of 1933, as amended, and Section 21E of the Securities Exchange Act of 1934, as amended. All statements other than statements of historical fact are forward-looking statements. The words “anticipate,” “assume,” “believe,” “budget,” “estimate,” “expect,” “forecast,” “initial,” “intend,” “may,” “plan,” “potential,” “project,” “should,” “will,” “would,” and similar expressions are intended to identify forward-looking statements. The forward-looking statements in this presentation relate to, among other things, our business and prospects, future costs, financial results, liquidity and financing, regulatory and permitting developments and future demand and supply affecting LNG and general energy markets. Our forward-looking statements are based on assumptions and analyses made by us in light of our experience and our perception of historical trends, current conditions, expected future developments, and other factors that we believe are appropriate under the circumstances. These statements are subject to numerous known and unknown risks and uncertainties, which may cause actual results to be materially different from any future results or performance expressed or implied by the forward-looking statements. These risks and uncertainties include those described in the “Risk Factors” section of Exhibit 99.1 to our Current Report on Form 8-K/A filed with the Securities and Exchange Commission (the “SEC”) on March 15, 2017 and other filings with the SEC, which are incorporated by reference in this presentation. Many of the forward-looking statements in this presentation relate to events or developments anticipated to occur numerous years in the future, which increases the likelihood that actual results will differ materially from those indicated in such forward-looking statements. The forward-looking statements made in or in connection with this presentation speak only as of the date hereof. Although we may from time to time voluntarily update our prior forward-looking statements, we disclaim any commitment to do so except as required by securities laws. This presentation contains information about projected EBITDA of Tellurian. EBITDA is not a financial measure determined in accordance with U.S. generally accepted accounting principles (“GAAP”), should not be viewed as a substitute for any financial measure determined in accordance with GAAP and is not necessarily comparable to similarly titled measures reported by other companies. It would not be possible without unreasonable efforts to reconcile the projected GAAP information presented herein to net income, the most directly comparable GAAP financial measure. Similarly, projected future cash flows as set forth herein may differ from cash flows determined in accordance with GAAP.
|
|
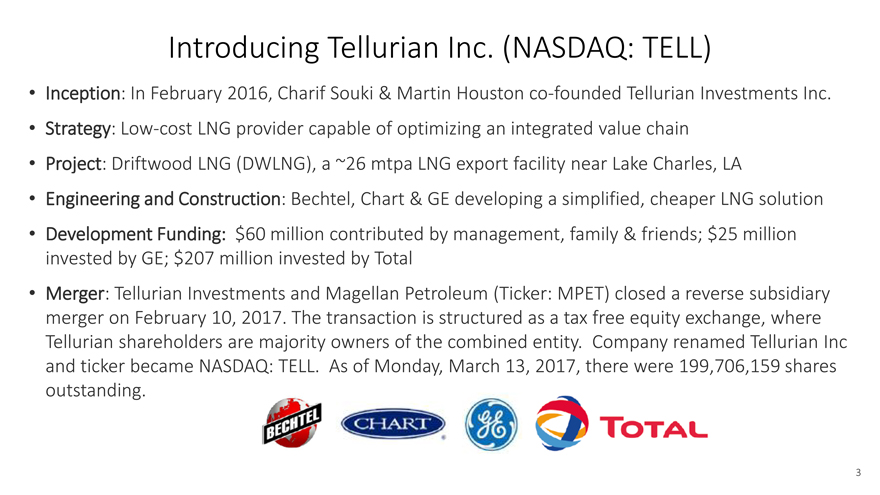
Introducing Tellurian Inc. (NASDAQ: TELL)
Inception: In February 2016, Charif Souki & Martin Houston co-founded Tellurian Investments Inc.
Strategy: Low-cost LNG provider capable of optimizing an integrated value chain
Project: Driftwood LNG (DWLNG), a ~26 mtpa LNG export facility near Lake Charles, LA
Engineering and Construction: Bechtel, Chart & GE developing a simplified, cheaper LNG solution
Development Funding: $60 million contributed by management, family & friends; $25 million invested by GE; $207 million invested by Total
Merger: Tellurian Investments and Magellan Petroleum (Ticker: MPET) closed a reverse subsidiary merger on February 10, 2017. The transaction is structured as a tax free equity exchange, where Tellurian shareholders are majority owners of the combined entity. Company renamed Tellurian Inc and ticker became NASDAQ: TELL. As of Monday, March 13, 2017, there were 199,706,159 shares outstanding.
|
|
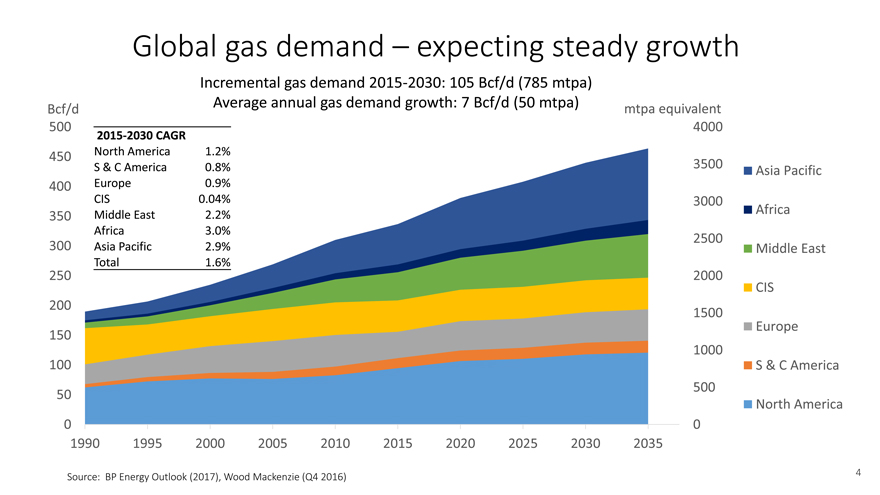
Global gas demand – expecting steady growth Incremental gas demand 2015-2030: 105 Bcf/d (785 mtpa) Average annual gas demand growth: 7 Bcf/d (50 mtpa) Bcf/d mtpa equivalent 500 4000 2015-2030 CAGR 450 North America 1.2% S & C America 0.8% 3500 Asia Pacific 400 Europe 0.9% CIS 0.04% 3000 Africa 350 Middle East 2.2% Africa 3.0% 2500 300 Asia Pacific 2.9% Middle East Total 1.6% 250 2000 CIS 200 1500 Europe 150 1000 100 S & C America 500 50 North America 0 0 1990 1995 2000 2005 2010 2015 2020 2025 2030 2035
|
|
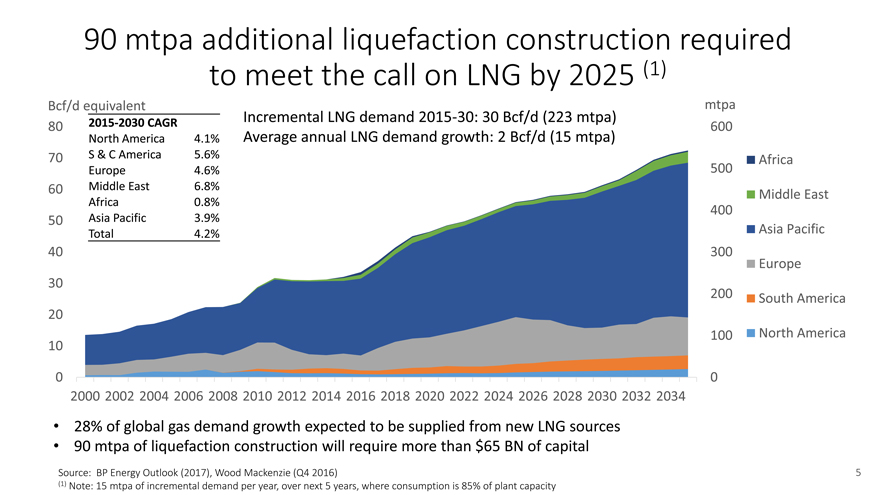
90 mtpa additional liquefaction construction required to meet the call on LNG by 2025 (1) Bcf/d equivalent mtpa 2015-2030 CAGR Incremental LNG demand 2015-30: 30 Bcf/d (223 mtpa) 80 600 North America 4.1% Average annual LNG demand growth: 2 Bcf/d (15 mtpa) 70 S & C America 5.6% Africa Europe 4.6% 500 60 Middle East 6.8% Middle East Africa 0.8% 400 50 Asia Pacific 3.9% Total 4.2% Asia Pacific 40 300 Europe 30 200 South America 20 100 North America 10 0 0 2000 2002 2004 2006 2008 2010 2012 2014 2016 2018 2020 2022 2024 2026 2028 2030 2032 2034 • 28% of global gas demand growth expected to be supplied from new LNG sources • 90 mtpa of liquefaction construction will require more than $65 BN of capital Source: BP Energy Outlook (2017), Wood Mackenzie (Q4 2016) 5 (1) Note: 15 mtpa of incremental demand per year, over next 5 years, where consumption is 85% of plant capacity 4 Source: BP Energy Outlook (2017), Wood Mackenzie (Q4 2016)
|
|
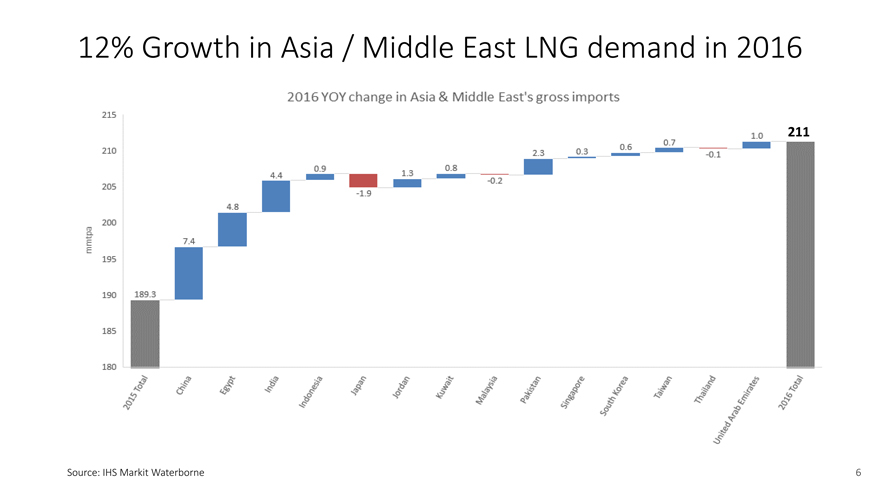
12% Growth in Asia / Middle East LNG demand in 2016 211 Source: IHS Markit Waterborne 6
|
|
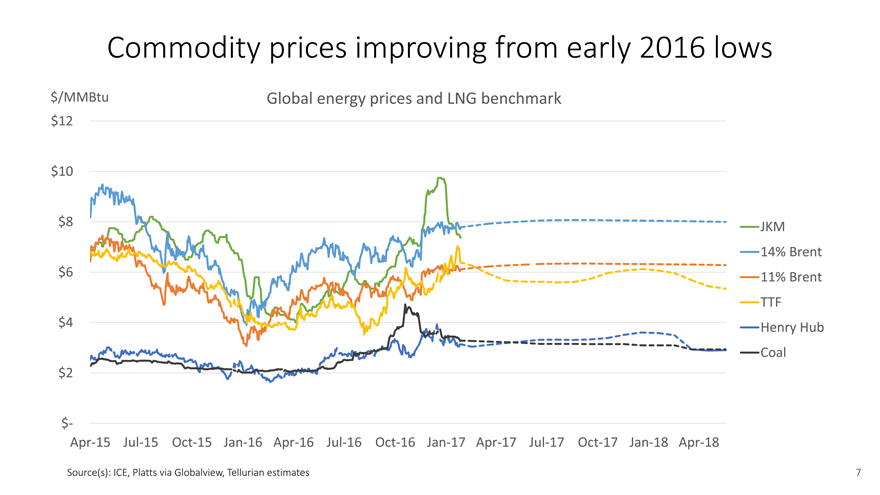
Commodity prices improving from early 2016 lows
$/MMBtu Global energy prices and LNG benchmark
$12
$10
$8 JKM 14% Brent
$6 11% Brent TTF
$4 Henry Hub Coal $2
$-
Apr-15 Jul-15 Oct-15 Jan-16 Apr-16 Jul-16 Oct-16 Jan-17 Apr-17 Jul-17 Oct-17 Jan-18 Apr-18
Source(s): ICE, Platts via Globalview, Tellurian estimates 7
|
|
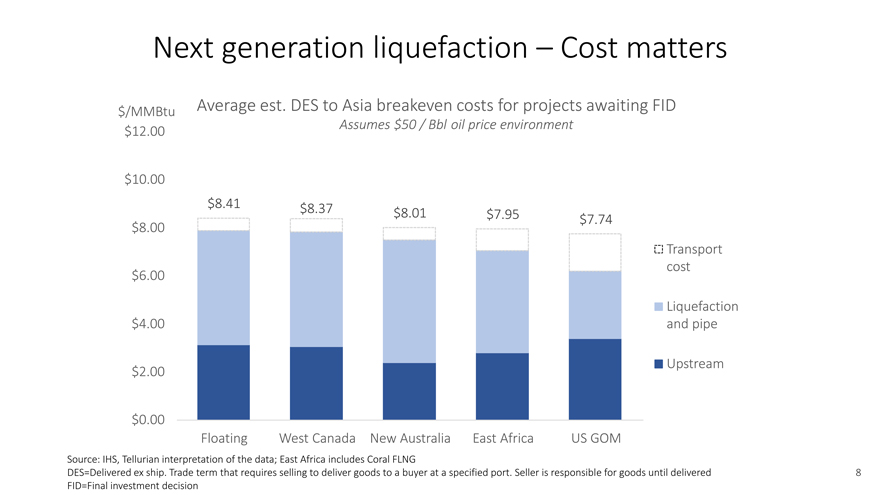
Next generation liquefaction – Cost matters $/MMBtu Average est. DES to Asia breakeven costs for projects awaiting FID Assumes $50 / Bbl oil price environment $12.00 $10.00 $8.41 $8.37 $8.01 $7.95 $7.74 $8.00 Transport cost $6.00
|
|
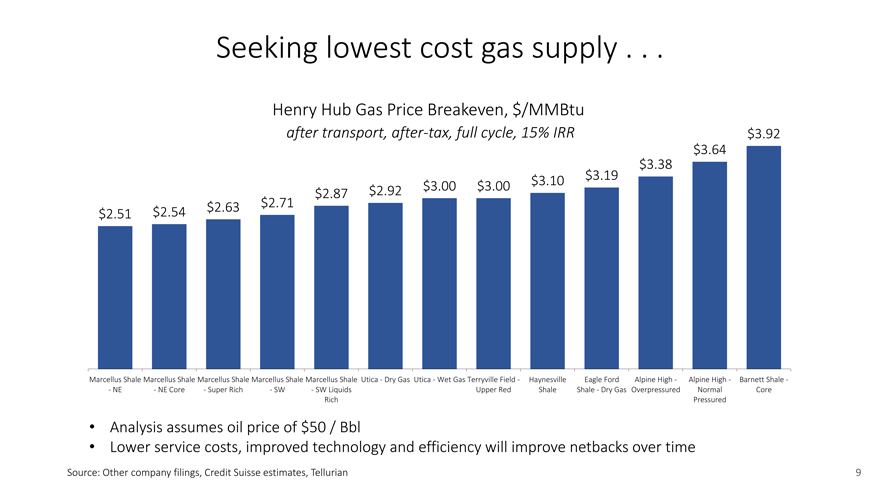
Seeking lowest cost gas supply . . .
Henry Hub Gas Price Breakeven, $/MMBtu
after transport, after-tax, full cycle, 15% IRR $3.92
$3.64 $3.19 $3.38 $3.00 $3.00 $3.10 $2.87 $2.92 $2.63 $2.71 $2.51 $2.54 Marcellus Shale Marcellus Shale Marcellus Shale Marcellus Shale Marcellus Shale Utica—Dry Gas Utica—Wet Gas Terryville Field—Haynesville Eagle Ford Alpine High—Alpine High—Barnett Shale - - NE—NE Core—Super Rich—SW—SW Liquids Upper Red Shale Shale—Dry Gas Overpressured Normal Core Rich Pressured • Analysis assumes oil price of $50 / Bbl • Lower service costs, improved technology and efficiency will improve netbacks over time Source: Other company filings, Credit Suisse estimates, Tellurian 9
|
|
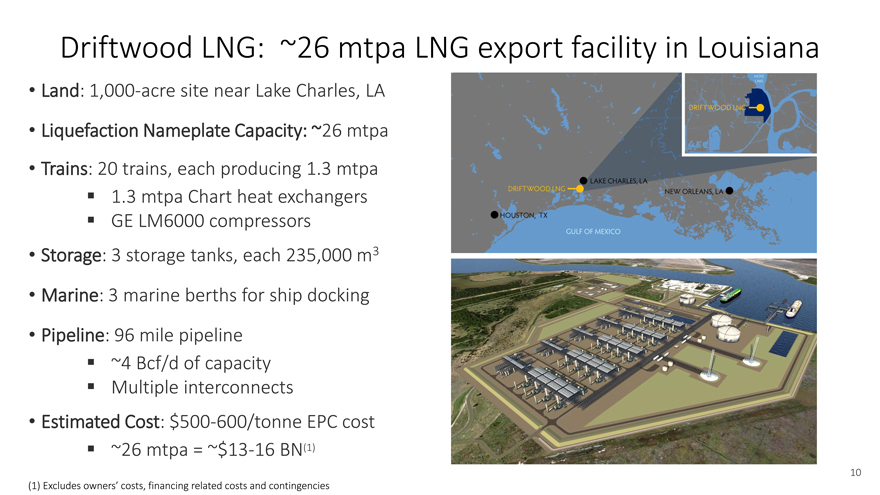
Driftwood LNG: ~26 mtpa LNG export facility in Louisiana
• Land: 1,000-acre site near Lake Charles, LA
• Liquefaction Nameplate Capacity: ~26 mtpa
• Trains: 20 trains, each producing 1.3 mtpa ? 1.3 mtpa Chart heat exchangers ? GE LM6000 compressors
• Storage: 3 storage tanks, each 235,000 m3
• Marine: 3 marine berths for ship docking
• Pipeline: 96 mile pipeline ? ~4 Bcf/d of capacity ? Multiple interconnects
• Estimated Cost: $500-600/tonne EPC cost ? ~26 mtpa = ~$13-16 BN(1) 10 (1) Excludes owners’ costs, financing related costs and contingencies Liquefaction $4.00 and pipe
|
|
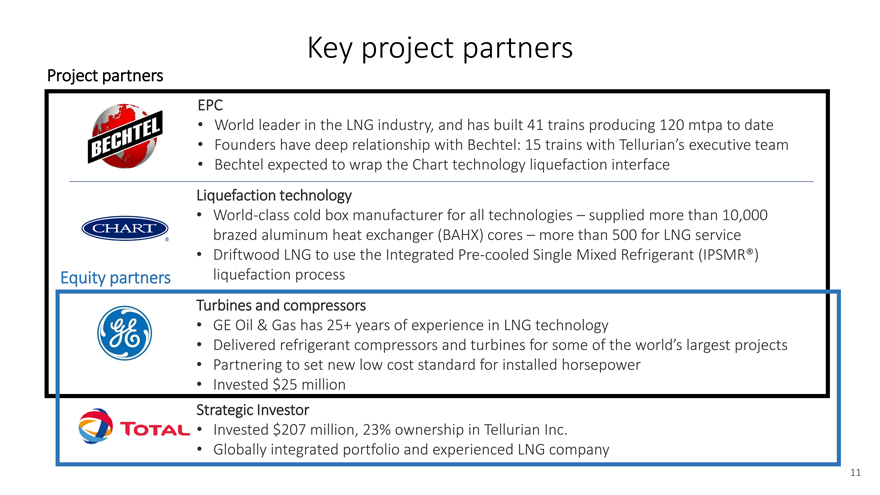
Key project partners
Project partners
EPC
• World leader in the LNG industry, and has built 41 trains producing 120 mtpa to date
• Founders have deep relationship with Bechtel: 15 trains with Tellurian’s executive team
• Bechtel expected to wrap the Chart technology liquefaction interface
Liquefaction technology
• World-class cold box manufacturer for all technologies – supplied more than 10,000 brazed aluminum heat exchanger (BAHX) cores – more than 500 for LNG service
• Driftwood LNG to use the Integrated Pre-cooled Single Mixed Refrigerant (IPSMR®) Equity partners liquefaction process Turbines and compressors
• GE Oil & Gas has 25+ years of experience in LNG technology
• Delivered refrigerant compressors and turbines for some of the world’s largest projects
• Partnering to set new low cost standard for installed horsepower
• Invested $25 million
Strategic Investor
• Invested $207 million, 23% ownership in Tellurian Inc.
• Globally integrated portfolio and experienced LNG company
11
|
|
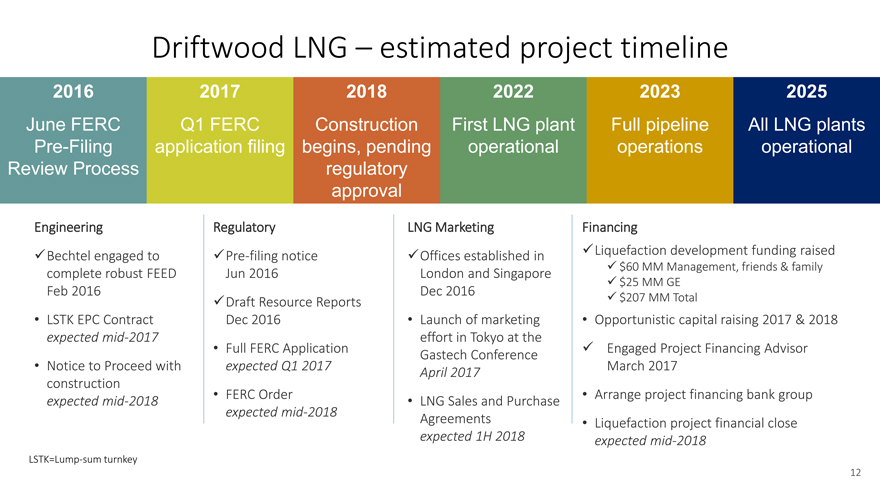
Driftwood LNG – estimated project timeline
2016 2017 2018 2022 2023 2025
June FERC Q1 FERC Construction First LNG plant Full pipeline All LNG plants Pre-Filing application filing begins, pending operational operations operational Review Process regulatory approval Engineering Regulatory LNG Marketing Financing Liquefaction development funding raised Bechtel engaged to Pre-filing notice Offices established in
$60 MM Management, friends & family complete robust FEED Jun 2016 London and Singapore $25 MM GE Feb 2016 Dec 2016 Draft Resource Reports $207 MM Total • LSTK EPC Contract Dec 2016 • Launch of marketing • Opportunistic capital raising 2017 & 2018 expected mid-2017 Full FERC Application effort in Tokyo at the Financing Advisor
• Engaged Project Proceed with 2017 Gastech Conference March 2017 • Notice to expected Q1 construction April 2017 • FERC Order • Arrange project financing bank group expected mid-2018 expected mid-2018 • LNG Sales and Purchase Agreements • Liquefaction project financial close expected 1H 2018 expected mid-2018 LSTK=Lump-sum turnkey 12
|
|
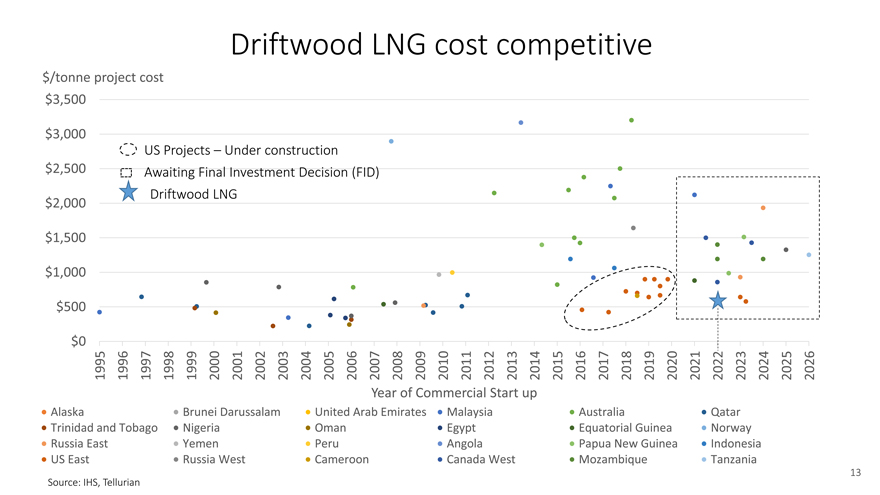
Driftwood LNG cost competitive
$/tonne project cost $3,500
$3,000
US Projects – Under construction $2,500 Awaiting Final Investment Decision (FID) Driftwood LNG $2,000
$1,500 $1,000 $500
$0
1995 1996 1997 1998 1999 2000 2001 2002 2003 2004 2005 2006 2007 2008 2009 2010 2011 2012 2013 2014 2015 2016 2017 2018 2019 2020 2021 2022 2023 2024 2025 2026 Year of Commercial Start up
Alaska Brunei Darussalam United Arab Emirates Malaysia Australia Qatar Trinidad and Tobago Nigeria Oman Egypt Equatorial Guinea Norway Russia East Yemen Peru Angola Papua New Guinea Indonesia US East Russia West Cameroon Canada West Mozambique Tanzania
13 Source: IHS, Tellurian
|
|
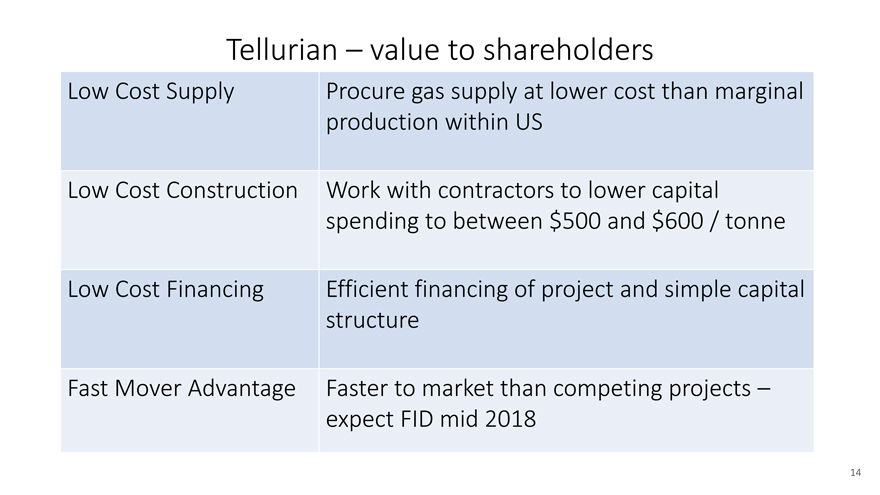
Tellurian – value to shareholders
Low Cost Supply Procure gas supply at lower cost than marginal production within US
Low Cost Construction Work with contractors to lower capital spending to between $500 and $600 / tonne
Low Cost Financing Efficient financing of project and simple capital structure
Fast Mover Advantage Faster to market than competing projects – expect FID mid 2018
|
|
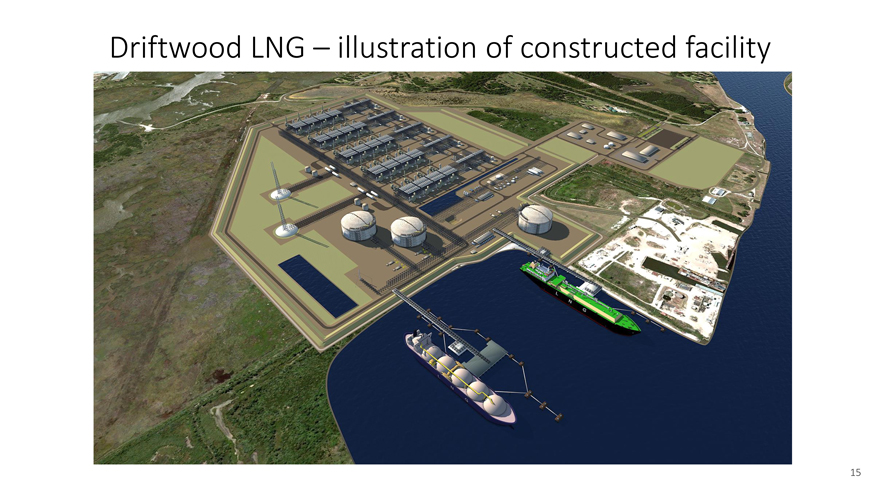
Driftwood LNG – illustration of constructed facility
15
14
|
|
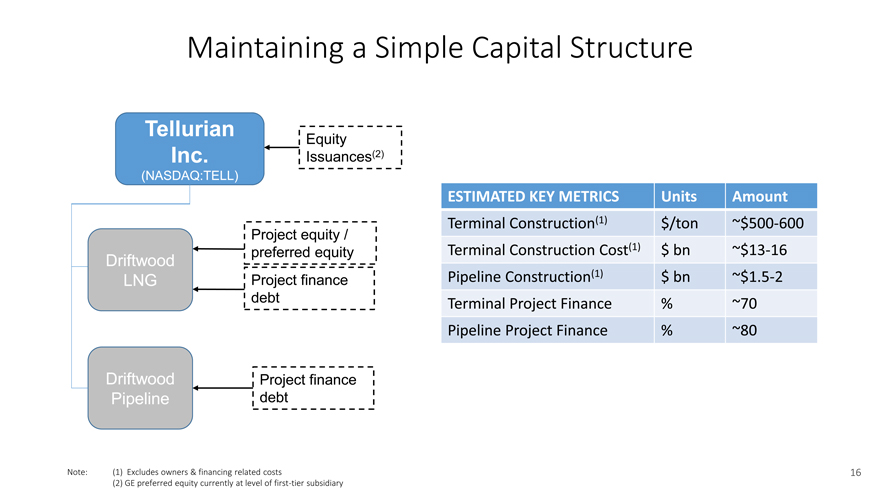
Maintaining a Simple Capital Structure
Tellurian
Equity Inc. Issuances(2)
(NASDAQ:TELL)
ESTIMATED KEY METRICS Units Amount
Terminal Construction(1) $/ton ~$500-600
Project equity /
preferred equity Terminal Construction Cost(1) $ bn ~$13-16
Driftwood
LNG Project finance Pipeline Construction(1) $ bn ~$1.5-2 debt Terminal Project Finance % ~70 Pipeline Project Finance % ~80
Driftwood Project finance
Pipeline debt
Note: (1) Excludes owners & financing related costs 16 (2) GE preferred equity currently at level of first-tier subsidiary
|
|
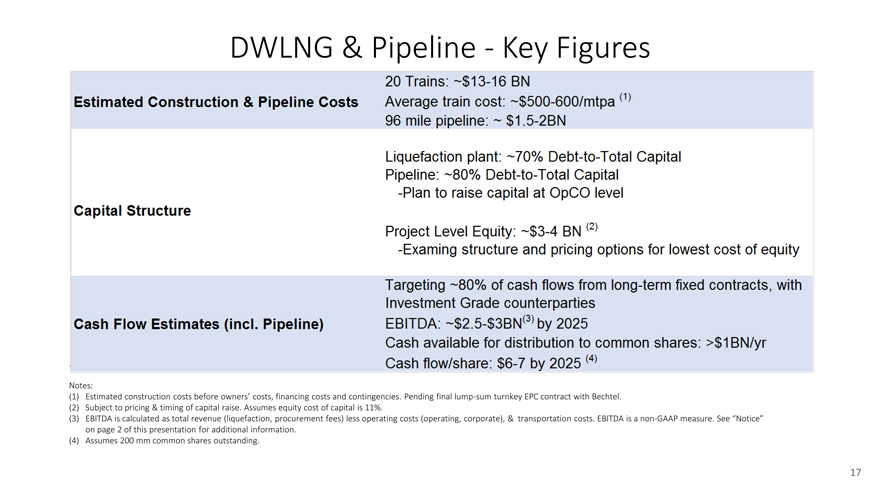
DWLNG & Pipeline—Key Figures
.
Notes:
(1) Estimated construction costs before owners’ costs, financing costs and contingencies. Pending final lump-sum turnkey EPC contract with Bechtel.
(2) Subject to pricing & timing of capital raise. Assumes equity cost of capital is 11%.
(3) EBITDA is calculated as total revenue (liquefaction, procurement fees) less operating costs (operating, corporate), & transportation costs. EBITDA is a non-GAAP measure. See “Notice” on page 2 of this presentation for additional information.
(4) Assumes 200 mm common shares outstanding.
17
|
|
Thank you
|
|
Investor Contacts
Investor Relations
Amit Marwaha, 832-485-2004
amit.marwaha@tellurianinc.com
David Castaneda, 414-351-9758
dcastaneda@mdcgroup.com
Public Relations
Joi Lecznar, 832-962-4044
joi.lecznar@tellurianinc.com
|
|

Appendix
20
19
|
|
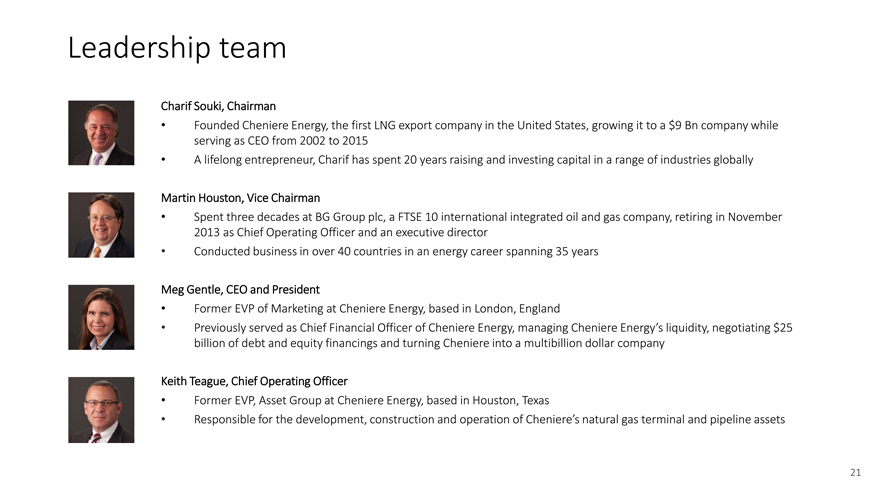
Leadership team
Charif Souki, Chairman
• Founded Cheniere Energy, the first LNG export company in the United States, growing it to a $9 Bn company while serving as CEO from 2002 to 2015
• A lifelong entrepreneur, Charif has spent 20 years raising and investing capital in a range of industries globally
Martin Houston, Vice Chairman
• Spent three decades at BG Group plc, a FTSE 10 international integrated oil and gas company, retiring in November 2013 as Chief Operating Officer and an executive director
• Conducted business in over 40 countries in an energy career spanning 35 years
Meg Gentle, CEO and President
• Former EVP of Marketing at Cheniere Energy, based in London, England
• Previously served as Chief Financial Officer of Cheniere Energy, managing Cheniere Energy’s liquidity, negotiating $25 billion of debt and equity financings and turning Cheniere into a multibillion dollar company
Keith Teague, Chief Operating Officer
• Former EVP, Asset Group at Cheniere Energy, based in Houston, Texas
• Responsible for the development, construction and operation of Cheniere’s natural gas terminal and pipeline assets
21
|
|
Leadership team
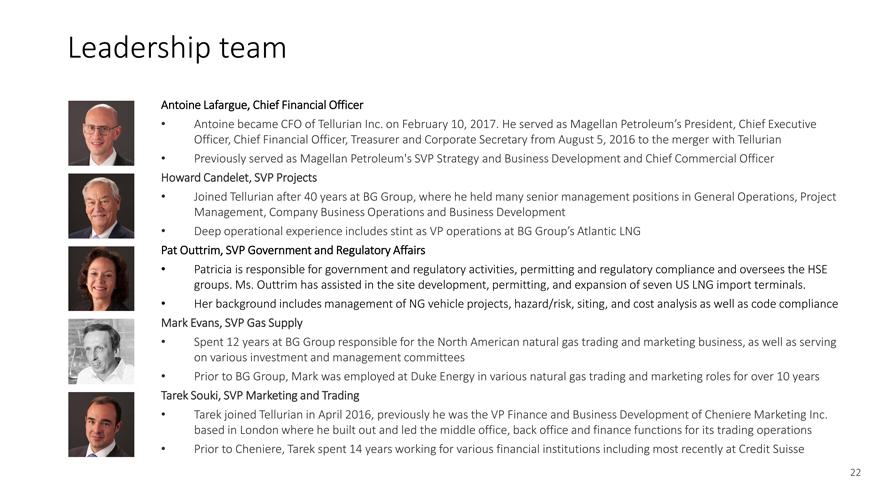
Antoine Lafargue, Chief Financial Officer
• Antoine became CFO of Tellurian Inc. on February 10, 2017. He served as Magellan Petroleum’s President, Chief Executive
Officer, Chief Financial Officer, Treasurer and Corporate Secretary from August 5, 2016 to the merger with Tellurian
• Previously served as Magellan Petroleum’s SVP Strategy and Business Development and Chief Commercial Officer Howard Candelet, SVP Projects
• Joined Tellurian after 40 years at BG Group, where he held many senior management positions in General Operations, Project Management, Company Business Operations and Business Development
• Deep operational experience includes stint as VP operations at BG Group’s Atlantic LNG
Pat Outtrim, SVP Government and Regulatory Affairs
• Patricia is responsible for government and regulatory activities, permitting and regulatory compliance and oversees the HSE groups. Ms. Outtrim has assisted in the site development, permitting, and expansion of seven US LNG import terminals.
• Her background includes management of NG vehicle projects, hazard/risk, siting, and cost analysis as well as code compliance Mark Evans, SVP Gas Supply
• Spent 12 years at BG Group responsible for the North American natural gas trading and marketing business, as well as serving on various investment and management committees
• Prior to BG Group, Mark was employed at Duke Energy in various natural gas trading and marketing roles for over 10 years Tarek Souki, SVP Marketing and Trading
• Tarek joined Tellurian in April 2016, previously he was the VP Finance and Business Development of Cheniere Marketing Inc. based in London where he built out and led the middle office, back office and finance functions for its trading operations
• Prior to Cheniere, Tarek spent 14 years working for various financial institutions including most recently at Credit Suisse
22
|
|
Experience matters
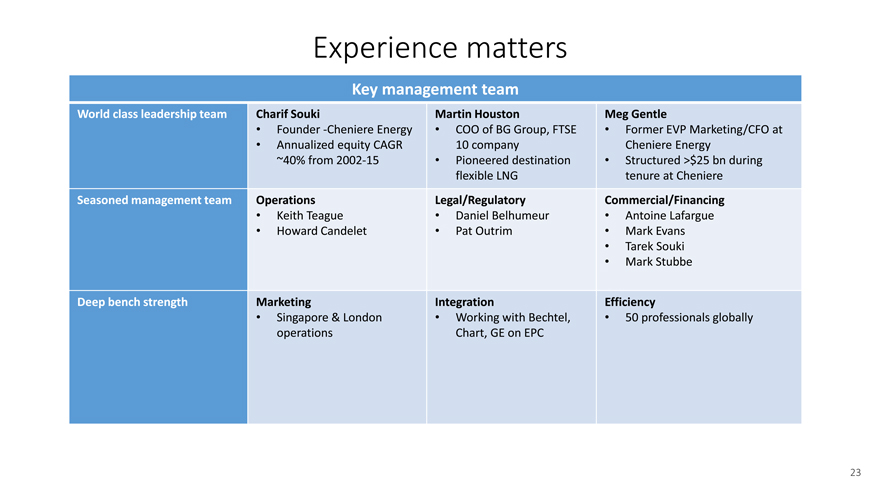
Key management team
World class leadership team Charif Souki Martin Houston Meg Gentle
• Founder -Cheniere Energy • COO of BG Group, FTSE • Former EVP Marketing/CFO at
• Annualized equity CAGR 10 company Cheniere Energy
~40% from 2002-15 • Pioneered destination • Structured >$25 bn during flexible LNG tenure at Cheniere
Seasoned management team Operations Legal/Regulatory Commercial/Financing
• Keith Teague • Daniel Belhumeur • Antoine Lafargue
• Howard Candelet • Pat Outrim • Mark Evans
• Tarek Souki
• Mark Stubbe
Deep bench strength Marketing Integration Efficiency
• Singapore & London • Working with Bechtel, • 50 professionals globally operations Chart, GE on EPC
23
|
|
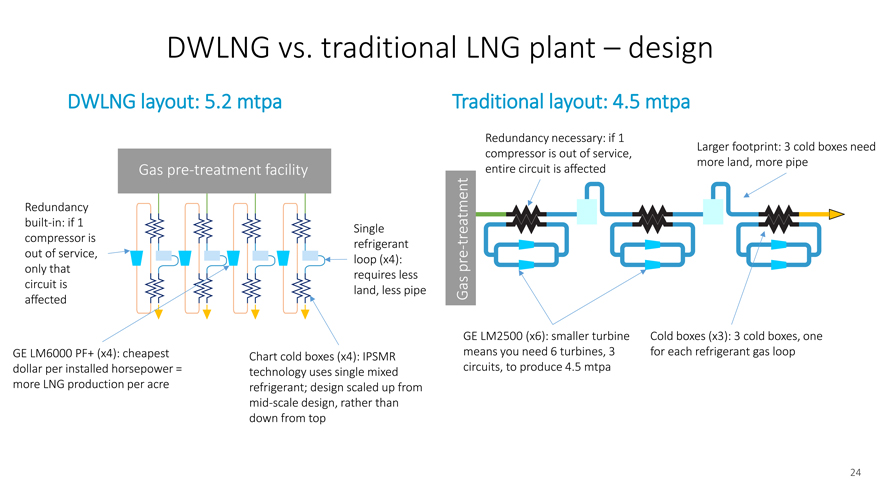
DWLNG vs. traditional LNG plant – design
DWLNG layout: 5.2 mtpa Traditional layout: 4.5 mtpa
Redundancy necessary: if 1
Larger footprint: 3 cold boxes need compressor is out of service, more land, more pipe
Gas pre-treatment facility entire circuit is affected
Redundancy built-in: if 1 compressor is Single treatment out of service, refrigerant -only that loop (x4): pre requires less circuit is affected land, less pipe Gas
GE LM2500 (x6): smaller turbine Cold boxes (x3): 3 cold boxes, one GE LM6000 PF+ (x4): cheapest means you need 6 turbines, 3 for each refrigerant gas loop Chart cold boxes (x4): IPSMR dollar per installed horsepower = circuits, to produce 4.5 mtpa technology uses single mixed more LNG production per acre refrigerant; design scaled up from mid-scale design, rather than down from top
24
|
|
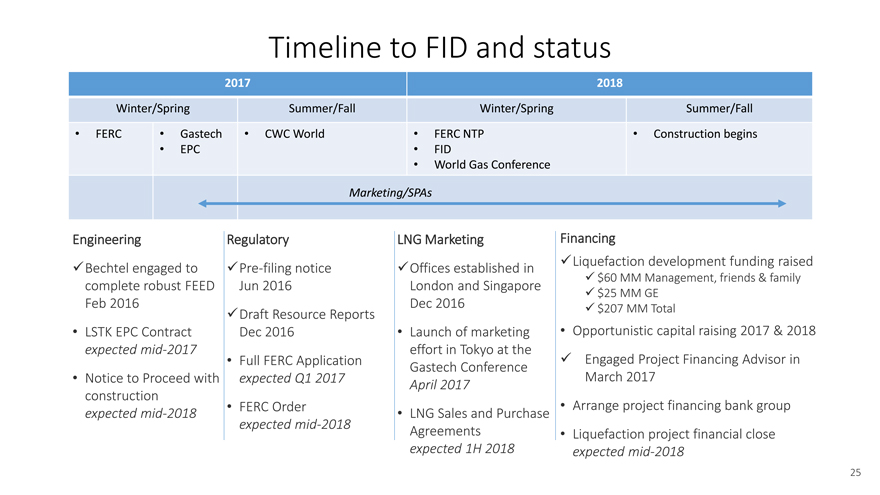
Timeline to FID and status
2017 2018
Winter/Spring Summer/Fall Winter/Spring Summer/Fall
• FERC • Gastech • CWC World • FERC NTP • Construction begins
• EPC • FID
• World Gas Conference
Marketing/SPAs
Engineering Regulatory LNG Marketing Financing
Liquefaction development funding raised Bechtel engaged to Pre-filing notice Offices established in
$60 MM Management, friends & family complete robust FEED Jun 2016 London and Singapore Feb 2016 Dec 2016 $25 MM GE
$207 MM Total
Draft Resource Reports
• LSTK EPC Contract Dec 2016 • Launch of marketing • Opportunistic capital raising 2017 & 2018 expected mid-2017 effort in Tokyo at the
• Full FERC Application Engaged Project Financing Advisor in Gastech Conference
• Notice to Proceed with expected Q1 2017 March 2017 construction April 2017
• FERC Order • Arrange project financing bank group expected mid-2018 expected mid-2018 • LNG Sales and Purchase Agreements • Liquefaction project financial close expected 1H 2018 expected mid-2018
25
|
|
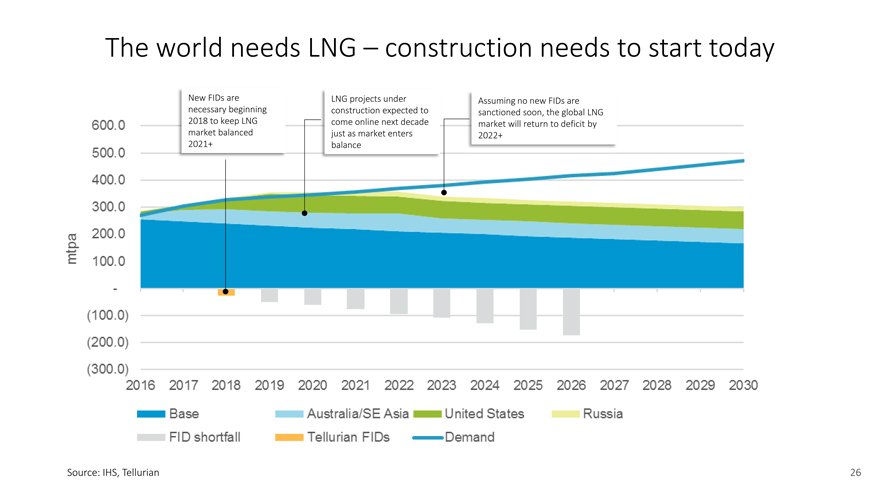
The world needs LNG – construction needs to start today
New FIDs are LNG projects under Assuming no new FIDs are necessary beginning construction expected to sanctioned soon, the global LNG 2018 to keep LNG come online next decade market will return to deficit by market balanced just as market enters 2022+ 2021+ balance
Source: IHS, Tellurian 26
|
|
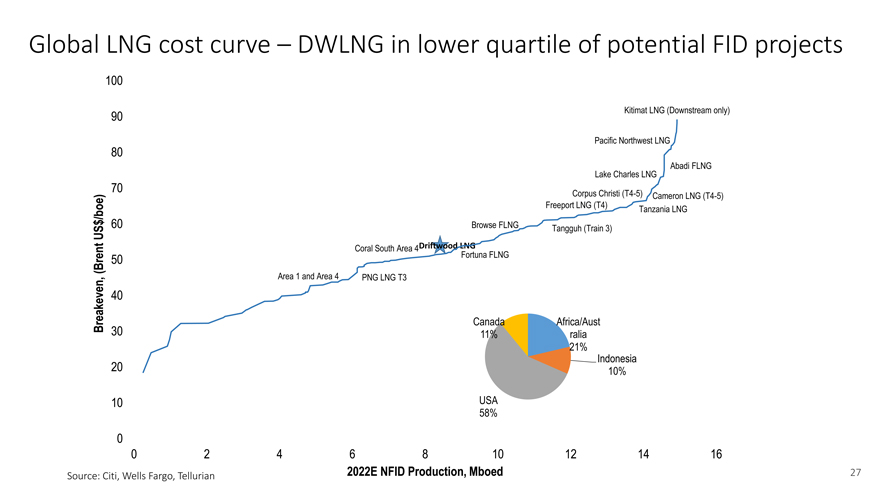
Global LNG cost curve – DWLNG in lower quartile of potential FID projects
100
90 Kitimat LNG (Downstream only) Pacific Northwest LNG
80
Lake Charles LNG Abadi FLNG
70
Corpus Christi (T4-5) Cameron LNG (T4-5) /boe) Freeport LNG (T4) Tanzania LNG
$ 60 Browse FLNG
US Tangguh (Train 3) Coral South Area 4Driftwood LNG ent 50 Fortuna FLNG
(Br
Area 1 and Area 4 PNG LNG T3
40
Breakeven, Canada Africa/Aust
30 11% ralia 21%
Indonesia
20 10%
10 USA 58%
0
0 2 4 6 8 10 12 14 16
Source: Citi, Wells Fargo, Tellurian 2022E NFID Production, Mboed 27