Attached files
Table of Contents
UNITED STATES
SECURITIES AND EXCHANGE COMMISSION
Washington, D.C. 20549
Form 10-K
(Mark One)
| þ | ANNUAL REPORT PURSUANT TO SECTION 13 OR 15(d) OF THE SECURITIES EXCHANGE ACT OF 1934 |
For the fiscal year ended June 30, 2010
or
| ¨ | TRANSITION REPORT PURSUANT TO SECTION 13 OR 15(d) OF THE SECURITIES EXCHANGE ACT OF 1934 |
For the transition period from to
Commission file number 1-5507
Magellan Petroleum Corporation
(Exact name of registrant as specified in its charter)
| Delaware | 06-0842255 | |
| State or other jurisdiction of incorporation or organization |
(I.R.S. Employer Identification No.) | |
| 7 Custom House Street, 3rd Floor, Portland ME | 04101 | |
| (Address of principal executive offices) | (Zip Code) |
Registrant’s telephone number, including area code
(207) 619-8500
Securities registered pursuant to Section 12(b) of the Act:
| Title of Each Class |
Name of Each Exchange on Which Registered | |
| Common stock, par value $.01 per share |
NASDAQ Capital Market |
Securities registered pursuant to Section 12(g) of the Act
Title of Class
None
Indicate by check mark if the registrant is a well-known seasoned issuer, as defined in Rule 405 of the Securities Act. Yes ¨ No þ
Indicate by check mark if the registrant is not required to file reports pursuant to Section 13 or Section 15(d) of the Act. Yes ¨ No þ
Indicate by check mark whether the registrant (1) has filed all reports required to be filed by Section 13 or 15(d) of the Securities Exchange Act of 1934 during the preceding 12 months (or for such shorter period that the registrant was required to file such reports), and (2) has been subject to such filing requirements for the past 90 days. Yes þ No ¨
Indicate by check mark whether the registrant has submitted electronically and posted on its corporate Web site, if any, every Interactive Data File required to be submitted and posted pursuant to Rule 405 of Regulation S-T (§ 232.405 of this chapter) during the preceding 12 months (or for such shorter period that the registrant was required to submit and post such files). Yes ¨ No ¨
Indicate by check mark if disclosure of delinquent filers pursuant to Item 405 of Regulation S-K (§ 229.405 of this chapter) is not contained herein, and will not be contained, to the best of registrant’s knowledge, in definitive proxy or information statements incorporated by reference in Part III of this Form 10-K or any amendment to this Form 10-K. ¨
Indicate by check mark whether the registrant is a large accelerated filer, an accelerated filer, a non-accelerated filer, or a smaller reporting company. See the definitions of “large accelerated filer,” “accelerated filer” and “smaller reporting company” in Rule 12b-2 of the Exchange Act. (Check one):
| Large accelerated filer ¨ |
Accelerated filer ¨ | Non-accelerated filer þ | Smaller reporting company ¨ | |||
| (Do not check if a smaller reporting company) | ||||||
Indicate by check mark whether the registrant is a shell company (as defined in Rule 12b-2 of the Exchange Act). Yes ¨ No þ
The aggregate market value of the voting and non-voting common equity held by non-affiliates of the registrant at the $1.73 closing price on December 31, 2009 (the last business day of the most recently completed second quarter) was $72,951,630.
Indicate the number of shares outstanding of each of the registrant’s classes of common stock, as of the latest practicable date:
Common stock, par value $.01 per share, 52,335,977 shares outstanding as of September 24, 2010
DOCUMENTS INCORPORATED BY REFERENCE
Portions of the Proxy Statement related to the Annual Meeting of Stockholders for the fiscal year ended June 30, 2010, are incorporated by reference in Part III of this Form 10-K to the extent stated herein.
Table of Contents
| Page | ||||
| PART I | ||||
| Item 1. | 3 | |||
| Item 1A. | 15 | |||
| Item 1B. | 24 | |||
| Item 2. | 24 | |||
| Item 3. | 28 | |||
| Item 4. | 28 | |||
| PART II | ||||
| Item 5. | Market for Registrant’s Common Equity, Related Stockholder Matters and Issuer Purchases of Equity Securities | 28 | ||
| Item 6. | 31 | |||
| Item 7. | Management’s Discussion and Analysis of Financial Condition and Results of Operations |
32 | ||
| Item 7A. | 48 | |||
| Item 8. | 49 | |||
| Item 9. | Changes in and Disagreements with Accountants on Accounting and Financial Disclosure |
87 | ||
| Item 9A. | 87 | |||
| Item 9B. | 88 | |||
| PART III | ||||
| Item 10. | 88 | |||
| Item 11. | 88 | |||
| Item 12. | Security Ownership of Certain Beneficial Owners and Management and Related Stockholder Matters | 88 | ||
| Item 13. | Certain Relationships and Related Transactions, and Director Independence |
88 | ||
| Item 14. | 88 | |||
| PART IV | ||||
| Item 15. | 89 | |||
Unless otherwise indicated, all dollar figures set forth herein are in United States currency. Amounts expressed in Australian currency are indicated as “(AUS) $00”. The exchange rate at September 1, 2010 was approximately (AUS) $1.00 equaled U.S. $0.89.
2
Table of Contents
PART I
| Item 1. | Business |
Magellan Petroleum Corporation (the “Company” or “Magellan” or “MPC” or “we” or “us”) is engaged in the sale of oil and gas and the exploration for and development of oil and gas reserves. At June 30, 2010, MPCs has three reporting segments: (1) 100.00% equity interest in its subsidiary, Magellan Petroleum Australia Limited (“MPAL”); (2) an 83.5% controlling member interest in Nautilus Poplar, LLC (“Nautilus”), based in Denver, Colorado and (3) MPC the parent company that owns directly a 26.3% working interest in the Poplar Fields in Montana. Magellan is a development company, early in the business cycle, with reserves that need to be developed. We now have a larger asset base, increased probable reserves that need to be developed and are in a strong strategic position in a large natural gas basin which can be used in Chinese fuel, oxygenate, and olefins demand.
MPAL’s major assets are two petroleum production leases covering the Mereenie oil and gas field (35% working interest), one petroleum production lease covering the Palm Valley gas field (52% working interest) and seventeen licenses in the United Kingdom, five of which are operated by MPAL. Both the Mereenie and Palm Valley fields are located in the Amadeus Basin in the Northern Territory of Australia. Santos Ltd (“Santos”), a publicly owned Australian company, owns a 65% interest in the Mereenie field, a 48% interest in the Palm Valley field and is the operator of the Mereenie field. MPAL is operator of the Palm Valley field.
In March 2010, MPAL entered into an agreement with Santos to purchase Santos’ 40% interest in the Evans Shoal natural gas field, located in the Bonaparte Basin offshore Northern Australia. The field has a contingent gas resource in excess of 6.6 trillion cubic feet (Tcf), including carbon dioxide (CO2) gas content. Under the agreement, Magellan is obligated to pay Santos time-staged cash consideration equal to (AUS) $100 million for its interest in Evans Shoal. Magellan would also pay additional contingent payments to Santos of (AUS) $50 million upon a favorable partner vote on any final investment decision to develop Evans Shoal and (AUS) $50 million upon first stabilized gas production from NT/P 48. Closing and completion of the purchase is subject to regulatory and other approvals and is expected to occur in the second half of calendar 2010. See Note 10 for further discussion.
On December 4, 2009, the Company announced the sale of all its interests in the Nockatunga oil fields, the Kiana and Aldinga oil fields, the Udacha gas field and its exploration acreage in the Cooper Basin of Queensland and South Australia. The Company subsequently entered into sales agreements to affect the sale of those licenses. The Company also entered into a sales agreement for the sale of its ATP 613P, ATPA 674P and ATPA 733P interests in the Maryborough Basin of Queensland. These assets were disposed of because they are non-core to our strategies. See Note 9 for further discussion.
MPC acquired its 83.5% controlling interest in Nautilus in October 2009. Nautilus, based in Denver, Colorado, operates and holds a 68.75% interest in the East Polar Unit and varied interests averaging 57% in the Northwest Poplar Fields. The two fields with 23,000 combined licensed acres have between 700 and 800 million barrels of oil in place with 52 million barrels recovered to date or approximately 79% reserves. See Note 11 for further discussion.
MPC owns interests of 83.7% in the East Poplar Unit and varied interests in the Northwest Poplar Fields through its controlling interest in Nautilus and through the purchase of interests from Hunter Energy LLC and Nautilus Technical Group, LLC which were completed in March 2010.
MPC has a direct 2.67% carried interest in the Kotaneelee gas field in the Yukon Territory of Canada.
3
Table of Contents
The following chart illustrates the various relationships between MPC and the various companies discussed above.
The following is a tabular presentation of the omitted material:
MPC — MPAL RELATIONSHIPS CHART
MPC owns 100% of MPAL.
MPC owns 2.67% of the Kotaneelee Field, Canada.
MPAL owns varied interests in the Weald-Wessec Basin, UK.
MPAL owns 34.3% of the Dingo Field, Australia
MPAL owns 52% of the Palm Valley Field, Australia.
MPAL owns 35% of the Mereenie Field, Australia.
SANTOS owns 65.7% of the Dingo Field, Australia
SANTOS owns 48% of the Palm Valley Field, Australia.
SANTOS owns 65% of the Mereenie Field, Australia.
MPC — NAUTILUS POPLAR RELATIONSHIPS CHART
Through the controlling member interest of Nautilus and a direct Interest in the fields, Magellan owns a 83.7% average working interest in the Poplar fields.
MPC owns 83.5% of Nautilus.
MPC owns 26.3% direct working interest in the East Poplar Unit and varied interests averaging 22.7% in the Northwest Poplar Fields
Nautilus owns 68.75% working interest in the East Poplar Unit and varied interests averaging 57% in the Northwest Poplar Fields
(a) General Development of Business.
Operational Developments Since the Beginning of the Last Fiscal Year:
The following is a summary of oil and gas properties that the Company has an interest in. The Company is committed to certain exploration and development expenditures, some of which may be farmed out to third parties.
AUSTRALIA
Mereenie Oil and Gas Field
MPAL (35%) and Santos (65%), the operator (together known as the “Mereenie Producers”), own the Mereenie field which is located in the Amadeus Basin of the Northern Territory. At June 30, 2010, MPAL’s share of the Mereenie field proved developed oil reserves was zero. Under SEC revised rules, neither proved nor probable reserves of natural gas can be booked for Mereenie until a natural gas sales agreement is completed. Probable developed oil reserves have been booked at Mereenie. Additionally, MPAL does not yet have sufficient history to use cost structure reduction assumptions making gas re-injection into the Mereenie field economic at June 30, 2010. During fiscal 2010, MPAL’s share of oil and condensate sales was approximately 80,000 barrels and 2.3 Bcf of gas, which is subject to net overriding royalties aggregating 4.38% and the statutory government
4
Table of Contents
royalty of 10%. Prior to June 2009, the oil was transported by means of a 167-mile eight-inch oil pipeline east from the field to an industrial park near Alice Springs. The oil was then shipped south approximately 950 miles by road to the Port Bonython Export Terminal at Whyalla, South Australia for sale. Since June 2009, the oil is transported by road directly from the field to Port Bonython Export Terminal. The cost of transporting the oil to the terminal is borne by the Mereenie Producers. The oil pipeline has been placed in care and maintenance because of environmental concerns by the operator over its integrity. The petroleum leases covering the Mereenie field expire in November 2023.
The Mereenie Producers were contracted until September 5, 2010 to supply gas on a reasonable endeavors basis to the Power and Water Corporation (“PWC”) for use in the Northern Territory. See “Gas Supply Contracts” below.
Palm Valley Gas Field
MPAL has a 52.023% interest in, and is the operator of, the Palm Valley gas field which is also located in the Amadeus Basin of the Northern Territory. Santos, the operator of the Mereenie field, owns the remaining 47.977% interest in the Palm Valley field. MPAL and Santos (“Palm Valley Producers”) provide Palm Valley gas to meet a supply contract with PWC. See “Gas Supply Contracts” below. MPAL’s share of the Palm Valley proved developed reserves (net of royalties) was 1.2 Bcf at June 30, 2010 and is based upon gas contract amounts. During fiscal 2010, MPAL’s share of gas sales was 1.2 Bcf which is subject to a 10% statutory government royalty and net overriding royalties aggregating 7.31%. PWC funds the cost of additions and modifications to the gas delivery system under the gas supply agreement. The petroleum lease covering the Palm Valley field expires in November 2024.
Gas Supply Contracts
In 1983, the Palm Valley Producers commenced the sale of gas to Alice Springs under a 1981 agreement. That agreement terminated in June 2008. In 1985, the Palm Valley Producers and Mereenie Producers signed agreements for the sale of gas to PWC, through its wholly-owned company Gasgo Pty Ltd (“Gasgo”), for use in PWC’s Darwin electricity generating station and at a number of other generating stations in the Northern Territory. The price of gas under the Palm Valley and Mereenie gas contracts is adjusted quarterly to reflect changes in the Australian Consumer Price Index. The gas is delivered into the 922-mile Amadeus Basin gas pipeline which was built by an Australian consortium in 1987. Since 1985, there have been several additional contracts for the sale of Mereenie gas, the latest being the Mereenie Sales Agreement No. 4 in June 2006 for the supply of an additional 4.4 Bcf of gas to be supplied prior to December 31, 2008. The principal Mereenie contracts and supply obligations under the various agreements expired in January and June 2009. The Palm Valley gas contract expires in January 2012.
MPAL’s major customer, PWC, contracted with Eni Australia in 2006 for the supply of PWC’s Northern Territory gas demand requirement for twenty five years, commencing January 2009. Eni Australia expected to commence sales from its Blacktip field offshore of the Northern Territory in January 2009; however, the Blacktip development encountered significant delays and only commenced partial production in September 2009 with full production not achieved until February 2010. The Mereenie Producers continued to supply PWC’s gas requirements on a reasonable endeavors basis to supplement Blacktip gas sales until early February, 2010.
MPAL is actively pursuing gas sales contracts for the remaining uncontracted reserves at Mereenie and Palm Valley. While gas marketing efforts to date have identified several potential customers, the majority have a gas requirement commencing in the 2011-2013 timeframe. There is strong competition within the market with Blacktip gas now available, and MPAL may not be able to contract for the sale of the remaining uncontracted reserves in the short term, but may be able to do so in the longer term with increasing demand from new mining developments and industrial users in the Northern Territory and the adjacent areas of neighboring states. As MPAL has not been able to sell its uncontracted gas reserves, its revenues have declined in 2010. Mereenie gas
5
Table of Contents
sales were approximately $11.6 million (net of royalties) or 85% of total gas sales for the year ended June 30, 2010 and $12.4 million (net of royalties) or 85% of total sales for the year ended June 30, 2009.
At June 30, 2010, MPAL’s commitment to supply gas under the Palm Valley and Mereenie agreements was as follows:
| Period |
Bcf | |
| Less than one year |
0.93 | |
| Between 1-5 years |
0.50 | |
| Total |
1.43 | |
At the present time, the Company’s principal income producing operations are in Australia and for this reason; current competitive conditions in Australia are material to the Company’s future. Currently, most indigenous crude oil is consumed within Australia. In addition, refiners and others import crude oil to meet the overall demand in Australia. The Palm Valley Producers and the Mereenie Producers are developing and separately marketing the production from each field. Because of the relatively remote location of the Amadeus Basin and the inherent nature of the market for gas, it would be impractical for each working interest partner to attempt to market separately its respective share of gas production from each field. MPAL’s major customer, PWC, has contracted with Eni Australia for the supply of PWC’s Northern Territory gas demand requirement for twenty five years. Eni Australia, initially expected to commence sales in January 2009, is to supply the gas from its Blacktip field offshore of the Northern Territory. The follow-on production schedule and timing is not yet available to us. The Mereenie Producers continued to supply PWC’s gas demand on a reasonable endeavors basis to supplement Blacktip gas sales as required until September 5, 2010. All prices for those sales now fall under the Backstop Agreement. MPAL is actively pursuing gas sales contracts for the remaining uncontracted reserves. While gas marketing efforts to date have identified several potential customers, the majority have a gas requirement commencing in the 2010-2013 timeframe. With Blacktip gas now available, there is be strong competition within the market and MPAL may not be able to contract for the sale of the remaining uncontracted reserves in the short term, but may be able to do so in the longer term with increasing demand from new mining developments and industrial users in the Northern Territory and the adjacent areas of neighboring states. Unless MPAL is able to sell uncontracted gas, including reasonable endeavors gas not taken by PWC, its revenues will continue to be substantially reduced in 2010 and beyond. Mereenie gas sales were approximately $11.6 million (net of royalties) or 85% of total gas sales for the year ended June 30, 2010 and $12.4 million (net of royalties) or 85% of total sales for the year ended June 30, 2009.
Evans Shoal Gas Field
Evans Shoal is a large, yet to be developed natural gas field with an estimated contingent gas resource in excess of 6.6 Tcf, including CO2 gas content. The field was discovered in 1998 and lies in a range of water depths from very shallow to more than 300 feet. There have been three wells drilled in the NT/P48 permit area. A drill stem test on the Evans Shoal-2 well flowed gas at a stabilized rate of 25 million cubic feet per day (MMcf/D). The field has had a complete 3D seismic program covering 840 square miles within the permit. Seismic analysis has confirmed the field’s structural closure to be in excess of 125 square miles. The gas resource is dependent upon completion, submission, and approval of a development plan and upon further drilling which Magellan believes will support the field’s potential. Carbon dioxide is a significant feed component for the production of Methanol, but can add cost to LNG development.
MPAL entered into an agreement with Santos on March 25, 2010, to purchase Santos’ 40% interest in the Evans Shoal natural gas field (Exploration Permit for Petroleum NT/P48), located in the Bonaparte Basin, offshore Northern Australia. The Company will pay Santos a time-staged cash consideration equal to (AUS) $100 million for its interest in the Evans Shoal field. The Company would also pay additional contingent payments to Santos of (AUS) $50 million upon a favorable partner vote on any final investment decision to
6
Table of Contents
develop the Evans Shoal field and a further (AUS) $50 million upon first stabilized gas production from the field. Closing and completion of the purchase is subject to regulatory and other approvals and is expected to occur in the second half of 2010. The Australian Foreign Investment Review Board has indicated it has ‘no objection’ to the acquisition of Santos’ interest by Magellan.
Based on its available cash on hand, and the expected liquidity to be generated from the Company’s Australian and U.S. operations during the remainder of 2010, the Company will need to raise additional debt or equity financing from third parties to complete this acquisition. The Company is currently working towards new equity financing options to raise sufficient funds to complete the Evans Shoal acquisition and its other requirements for capital resources over the next 12 month period, which are estimated to be approximately (AUS) $85 million. In the event the Company is unable to make the required payment on or before December 25, 2010 or to extend the time, under certain circumstances the Company could lose its rights to the (Aus) $15 million deposit.
Nockatunga Oil Fields
MPAL purchased a 40.97% working interest (38.70% net revenue interest) in the Nockatunga oil fields in the Cooper Basin in southwest Queensland, effective July 1, 2003. Santos is operator of the fields and held the remaining interest. The Nockatunga oil fields are comprised of eleven producing oil fields (Currambar, Kamel, Dilkera, Dilkera North, Koora, Maxwell, Maxwell South, Muthero, Nockatunga, Thungo and Winna) in Petroleum Leases 33, 50, 51, 244 and 245, together with exploration acreage in the adjacent Authority to Prospect for Petroleum (“ATP”) No. 267P.
On December 22, 2009, the Company entered into an asset sale agreement with Santos to sell all of its ownership interests in the five petroleum leases and ATP. The sale was completed in March 2010. Through the date of disposition, MPAL’s share of oil sales was approximately 32,000 barrels which is subject to a 10% statutory government royalty and net overriding royalties aggregating 3.00%.
Dingo Gas Field
MPAL has a 34.34% interest in the Dingo gas field which is held under Retention License 2 in the Amadeus Basin in the Northern Territory. No market has emerged for gas volumes that have been discovered in the Dingo gas field. MPAL’s share of potential production from this permit area is subject to a 10% statutory government royalty and overriding royalties aggregating 4.81%. The license was renewed for a further five year term and expires in February 2014.
Bonaparte Basin
The Commonwealth – Northern Territory Offshore Petroleum Joint Authority granted Exploration Permit for Petroleum No. NT/P82 to the Company (100% interest) over Area NT09-1, offshore Northern Territory. Area NT09-1 was offered for competitive bid under the Australian Government 2009 Release of Offshore Petroleum Exploration Areas. The exploration permit was granted on May 13, 2010 for a six year term. The committed work program under the permit during the first three years of the term involves the reprocessing of existing seismic data, the acquisition of additional 2D and 3D seismic data and the interpretation of the combined seismic database. NT/P82 lies to the south and southeast of the Evans Shoal gas field within the Bonaparte Basin. At June 30, 2010, MPAL work obligations on the NT/P82 licenses totaled $24,460,000 of which $2,300,000 was committed.
Maryborough Basin
MPAL holds a 100% interest in exploration permit ATP 613P in the Maryborough Basin in Queensland, Australia. MPAL (100%) also has applications pending for permits ATP 674P and ATP 733P which are adjacent
7
Table of Contents
to ATP 613P. The grant of ATPA 674P and ATP 733P is subject to the agreement of the native title claimants to the area. The Company executed native title agreements with the native title claimants over the area of ATPA 733P and ATPA 674P in June 2010, and is now waiting on the grant of ATP 674P, ATP 733P and the excluded areas of ATP 613P by the Queensland Government. ATP 613P was renewed in March 2008 for a further 12-year term ending in March 2019.
In May 2006, MPAL entered into a farm-out agreement in relation to ATP 613P, ATPA 674P and ATPA 733P with Eureka Petroleum, under which that company funded the drilling of two exploration wells in 2007 which intersected multiple thin coal seams. Evaluation of the coal seam gas potential is continuing. Eureka Petroleum has agreed to undertake a staged evaluation of the area to earn a 75% interest in any petroleum lease granted. MPAL retained a 25% interest and is carried by Eureka Petroleum through any development to the grant of a petroleum lease.
On January 16, 2010, the Company entered into an asset sale agreement with Adelaide Energy to sell all of its ownership interests in the three petroleum exploration permits ATP 613P, ATPA 733P and ATPA 674P. The transaction with Adelaide Energy will close following the grant of the ATP 613P excluded areas and third party approvals and notices which are procedural only in nature. Closing and completion of the sale is subject to regulatory and other approvals and is expected to occur in fiscal 2011.
Cooper/Eromanga Basin
PEL 94, PEL 95 & PPL 210
On December 22, 2009, the Company entered into an asset sale agreement with Strike Energy to sell all of its ownership interests in PEL 94, PEL 95 and PPL 210. This sale was completed in the third quarter of fiscal 2010.
PEL 106, PEL 107 & PPL 212
On January 15, 2010, the MPAL entered into a share sale agreement with Drillsearch Energy to sell all of the shares in its wholly-owned subsidiary, Magellan Petroleum (Southern) Pty Ltd, which held MPAL’s interests in PEL 107, PPL 212 and the PEL 91-PEL 106 Udacha Block. The effective date of the sale of the licenses was November 1, 2009. The transaction was completed in the third quarter of fiscal 2010 for a price of approximately $468,000. During the date of disposition, MPAL’s share of oil production was approximately 700 barrels which is subject to a 10% statutory government royalty and net overriding royalties aggregating 4.0%.
PEL 110
On December 15, 2009, the Company entered into an asset sale agreement with Victoria Oil Exploration (1977) to sell all of its ownership interests in PEL 110. The transaction was completed in the second quarter of fiscal 2010 for a price of approximately $364,000.
UNITED KINGDOM
PEDL 098 & PEDL 240
During fiscal year 2001, MPAL acquired an interest in an exploration license in southern England in the Weald-Wessex Basins. The license, Petroleum Exploration and Development License (“PEDL”) 098 (22.5%) on the Isle of Wight was granted for a term of six years. The Sandhills-2 well, drilled in PEDL 098 during 2005, encountered a heavily biodegraded remnant oil column and was plugged and abandoned. PEDL 098 expires in September 2011. Effective July 1, 2008, MPAL and its joint venture partners were granted PEDL 240
8
Table of Contents
(22.5%) adjacent to PEDL 098 for an initial exploration term of six years. The license has a drill or drop obligation at the end of its initial exploration term. An exploration well has to be drilled within the first six years of the initial term in order for the license to be extended into the next five-year license term, as was the case for PEDL 098. At June 30, 2010, MPAL’s share of the work obligations of the PEDL 098 and PEDL 240 licenses totaled $1,484,000, of which $77,000 was committed.
PEDL 125 & PEDL 126
Effective July 1, 2003, MPAL acquired two exploration licenses, PEDL 125 (40%) in Hampshire and PEDL 126 (40%) in West Sussex, in the Weald Basin of southern England; each granted for an initial exploration term of six years. The drilling plans for the Markwells Wood-1 well in PEDL 126 are well advanced. All necessary approvals have been received and the well site constructed ready for drilling. However, Northern Petroleum, operator of the PEDL 126 joint venture, announced in May 2010 that it was offering for sale all its production and exploration interests in the Weald Basin. The drilling of the well as a consequence has been delayed. Plans for drilling Hedge End-2 in PEDL 125 are in progress. The UK company Egdon Resources (the interest was formerly held by Encore Oil) will fund part of MPAL’s share of the cost of drilling the two wells to acquire a 10% interest in each of the licenses. The terms of both PEDLs were extended by the Government; PEDL 126 will expire in June 2011 and PEDL 125 in June 2012. At June 30, 2010, MPAL’s share of the work obligations of the PEDL 125 and PEDL 126 licenses totaled $3,938,000 which was committed.
PEDL 135, PEDL 136, PEDL 137, PEDL 242 & PEDL 246
Effective October 1, 2004, MPAL was granted 100% interest in PEDL 135, PEDL 136 and PEDL 137 in the Weald Basin in southern England for a term of six years. Effective July 1, 2008, MPAL was granted 100% interest in PEDL 242 and PEDL 246 located adjacent to the other licences; each with a six year initial term. Each licence has a drill or drop obligation at the end of its initial term. MPAL has undertaken a program of seismic data purchase, reprocessing and interpretation and has identified three drilling prospects. Drilling of a well in each of PEDL 135 and PEDL 137 is being planned and government drilling approvals sought. The initial exploration term of each of PEDL 135 and PEDL 137 have been extended by a further one year. PEDL 136 will expire on September 30, 2010. At June 30, 2010, MPAL’s work obligation for the PEDL 135, PEDL 136, PEDL 137, PEDL 242 and PEDL 246 licenses totaled $22,758,000, of which $147,000 was committed.
PEDL 152, PEDL 153, PEDL 154, PEDL 155 & PEDL 256
Effective October 1, 2004, MPAL acquired four licenses, PEDL 152 (22.5%), PEDL 153 (33.3%), PEDL 154 (50%) and PEDL 155 (40%), in the Weald-Wessex Basins in southern England, each granted for an initial exploration term of six years. Each license has a drill or drop obligation at the end of its initial exploration term. The drilling plans for the Havant-1 well in PEDL 155 are well advanced, and the well will be drilled immediately following the drilling of the Markwells Wood well in PEDL 126. All necessary approvals have been received and the well site is constructed ready for drilling. Because of access restrictions to the area of the prospect, the well will be drilled in the area of PEDL 256, adjacent to PEDL 155, but will be regarded by the Government as fulfilling the PEDL 155 work obligation. However, as noted above Northern Petroleum, operator of the PEDL 155 joint venture, announced in June 2010 that it was offering for sale all its production and exploration interests in the Weald Basin. The drilling of the well as a consequence has been delayed. The initial exploration term of PEDL 155 was extended for a further one year and will expire on September 30, 2011. PEDL 152 was surrendered on September 30, 2009 and PEDL 153 and PEDL 154 will expire on September 30, 2010. The U.K. company, Egdon Resources (the interest was formerly held by Encore Oil) will fund part of MPAL’s share of the PEDL 155 drilling and exploration costs to acquire a 10% interest in the license.
During fiscal year 2001, MPAL acquired an interest in exploration license PEDL 099 of the Portsdown area of Hampshire in southern England in the Weald Basin. The license (MPAL 40%) expired in September 2008.
9
Table of Contents
The former PEDL 099 licensees made an out-of-round application for a license over the northeast portion of the former PEDL 099 area which is adjacent to the Havant Prospect in PEDL 155. PEDL 256 was granted to MPAL (40% interest) and its joint venturers for a period of six years with effect from May 2009 with a drill or drop obligation at the end of the initial exploration term. PEDL 256 expires in April 2015.
At June 30, 2010, MPAL’s share of the work obligations of the PEDL 153, PEDL 154, PEDL 155 & PEDL 256 licenses totaled $3,901,000, of which $1,753,000 was committed.
PEDL 231, PEDL 232, PEDL 234 & PEDL 243
Effective July 1, 2008, MPAL (50%) and its joint venture partner were granted interests in PEDL 231, PEDL 232, PEDL 234 and PEDL 243 located in the central Weald Basin of southern England. Each license has a drill or drop obligation at the end of its initial exploration term and expires in June 2014. At June 30, 2010, MPAL’s share of the work obligations of the PEDL 231, PEDL 232, PEDL 234 & PEDL 243 licenses totaled $12,110,000 of which $340,000 was committed.
UNITED STATES
East Poplar Unit and Northwest Poplar Oil Fields
On October 15, 2009, MPC completed the purchase of an 83.5% controlling interest in Nautilus. Nautilus, based in Denver, Colorado, owns and operates oil development assets in Roosevelt County, Montana known as the East Poplar Unit and the Northwest Poplar Field. The controlling interest in Nautilus was purchased from White Bear LLC and YEP I, SICAV- FIS, entities affiliated with Nicolay Bogachev and Thomas Wilson, two directors of the Company.
MPC also completed a consolidation of interests in the fields by purchasing a 25.05% average working interest from Hunter Energy LLC and a 1.25% average working interest from Nautilus Technical Group LLC in March 2010. Magellan, itself now owns a 83.70% average working interest in the Poplar fields and through its subsidiaries controls a 95.05% average working interest there.
The Poplar assets were discovered and developed in 1954 by Murphy Oil Company. The two fields, with 23,000 combined licensed acres, have an estimated 800 million barrels of original oil in-place with 52 million barrels recovered to-date (largely from just the Charles formation) or approximately 7% of in-place reserves. Typical recovery factors in other fields with like characteristics are 20% to 30%. Magellan (through Nautilus) will embark on an active development program utilizing both secondary infill and tertiary enhanced oil recovery programs shown to be successful and productive in adjacent, similar fields in both the U.S. and in nearby Canada. Although certain contingencies must materialize, attractive upside potential is seen in the three producing oil horizons in the Mississippian Charles formation, up to 23,000 acres of Bakken shale, and both shallow and deep gas plays.
From the acquisition date, October 2009, to June 30, 2010, the Poplar assets produced a net average of 66,000 Bbls with approximately 35 active wells producing from the Charles Formation and 2 wells producing from the Tyler Formation. At June 30, 2010, MPC’s share of the Poplar fields proved developed oil reserves (net of royalties) was approximately 2,515 Bbls. during fiscal year 2010. At June 30, 2010, MPC’s share of the Poplar fields proved developed oil reserves (net of royalties) was approximately 2,515 thousand Bbls. During fiscal 2010, MPC’s share of oil sales was approximately 42,000 Bbls, which is subject to royalties and overriding royalties averaging 12%.
The oil is transported by truck to a lease automatic custody transfer (LACT) facility in Reserve, MT where it enters the Enbridge Oil Pipeline to Clearbrook, MN. The East Poplar Unit and Northwest Poplar Field leases are held by production.
10
Table of Contents
To increase production, MPC through Nautilus, plans to drill infill wells in fiscal year 2011, farmout, sell, or partner on the Bakken shale development, and complete well tracer operations to test residual oil saturation and determine potential CO2 effectiveness for enhanced oil recovery operations. The Poplar assets are in close proximity (less than 90 miles) to several current and projected CO2 sources that could be used for enhanced oil recovery through CO2 injection.
(b) Financial Information about Industry Segments.
The Company is engaged in only one industry, namely, oil and gas exploration, development, production and sale. The Company conducts such business through its three operating segments; MPC, its 100% equity interest in its subsidiary, Magellan Petroleum Australia Limited (“MPAL”), and its 83.5% controlling member interest in Nautilus Poplar, LLC, See Note 11.
(c) (1) Narrative Description of the Business.
MPC was incorporated in 1957 under the laws of Panama and was reorganized under the laws of Delaware in 1967. MPC is directly engaged in the exploration for, and the development, production and sale of oil and gas reserves in the United States, Canada, and indirectly through its subsidiary MPAL in Australia and the United Kingdom.
(i) Principal Products.
MPAL has an interest in the Palm Valley gas field and in the Mereenie oil and gas field in the Amadeus Basin of the Northern Territory. See Item 1(a) — Australia — for a discussion of the oil and gas production from these fields.
MPC has a direct 2.67% carried interest in the Kotaneelee gas field in Canada. MPC has an 83.5% controlling member interest in Nautilus Poplar LLC, and an average working interest of 26.3% in the Poplar Fields in Montana, USA. See Item 1(a).
(ii) Status of Product or Segment.
See Item 1(a) and (b) — Australia, Canada, U.S. — for a discussion of the current and future operations of the Mereenie and Palm Valley fields in Australia, MPC’s interest in the Kotaneelee field in Canada, and in the Poplar Fields in the United States.
(iii) Raw Materials.
Not applicable.
(iv) Patents, Licenses, Franchises and Concessions Held.
11
Table of Contents
MPAL has interests directly and indirectly in the following permits. Permit holders are generally required to carry out agreed work and expenditure programs.
| Permit |
Expiration Date |
Location | ||
| Petroleum Lease No. 4 and No. 5 (Mereenie) (Amadeus Basin) |
November 2023 | Northern Territory, Australia | ||
| Petroleum Lease No. 3 (Palm Valley) (Amadeus Basin) |
November 2024 | Northern Territory, Australia | ||
| Retention License No. 2 (Dingo) (Amadeus Basin) |
February 2014 | Northern Territory, Australia | ||
| ATP 613P (Maryborough Basin) |
March 2019 | Queensland, Australia | ||
| ATP 674P (Maryborough Basin) |
Application pending | Queensland, Australia | ||
| ATP 733P (Maryborough Basin) |
Application pending | Queensland, Australia | ||
| ATP 732P (Cooper Basin) |
Application pending | Queensland, Australia | ||
| NT/P82 (Bonaparte Basin) |
12 May 2016 | Offshore Northern Territory, Australia | ||
| PEDL 098 (Weald-Wessex Basins) |
September 2011 | United Kingdom | ||
| PEDL 125 (Weald-Wessex Basins) |
June 2012 | United Kingdom | ||
| PEDL 126 (Weald-Wessex Basins) |
June 2011 | United Kingdom | ||
| PEDL 135 (Weald Basin) |
September 2011 | United Kingdom | ||
| PEDL 136 (Weald Basin) |
September 2010 | United Kingdom | ||
| PEDL 137 (Weald Basin) |
September 2011 | United Kingdom | ||
| PEDL 153 (Weald Basin) |
September 2010 | United Kingdom | ||
| PEDL 154 (Weald Basin) |
September 2010 | United Kingdom | ||
| PEDL 155 (Weald Basin) |
September 2011 | United Kingdom | ||
| PEDL 231 (Weald Basin) |
June 2014 | United Kingdom | ||
| PEDL 232 (Weald Basin) |
June 2014 | United Kingdom | ||
| PEDL 234 (Weald Basin) |
June 2014 | United Kingdom | ||
| PEDL 240 (Weald-Wessex Basins) |
June 2014 | United Kingdom | ||
| PEDL 242 (Weald Basin) |
June 2014 | United Kingdom | ||
| PEDL 243 (Weald Basin) |
June 2014 | United Kingdom | ||
| PEDL 246 (Weald Basin) |
June 2014 | United Kingdom | ||
| PEDL 256 (Weald Basin) |
April 2015 | United Kingdom |
PEDL 136, 153 and 154 expired in September 2010 and will not be renewed.
Petroleum permits issued by the Northern Territory are subject to the Petroleum (Prospecting and Mining) Act and the Petroleum Act of the Northern Territory. Lessees have the exclusive right to produce petroleum from the land subject to payment of a rental and a royalty at the rate of 10% of the wellhead value of the petroleum produced. Rental payments may be offset against the royalty paid. The term of a lease is 21 years, and leases may be renewed for successive terms of 21 years each. Petroleum Exploration and Development Licenses issued by the Government of the United Kingdom are subject to the Petroleum Act. Licensees have the exclusive right to produce petroleum from the land subject to payment of a rental. The term of the license is 31 years.
(v) Seasonality of Business.
Although the Company’s business is not seasonal, the demand for oil and especially gas is subject to seasonal fluctuations in the weather.
(vi) Working Capital Items.
See Item 7 — Liquidity and Capital Resources for a discussion of this information.
12
Table of Contents
(vii) Customers.
Although MPAL’s producing oil and gas properties are located in a remote area in central Australia (See Item 1 — Business and Item 2 — Properties), the completion in January 1987 of the Amadeus Basin to Darwin gas pipeline has provided access to and expanded the potential market for MPAL’s gas production.
Natural Gas Production
MPAL’s customer, PWC, contracted with Eni Australia in 2006 for the supply of PWC’s Northern Territory gas demand requirement for twenty five years, commencing January 2009. Eni Australia expected to commence sales from its Blacktip field offshore of the Northern Territory in January 2009; however, the Blacktip development encountered significant delays and only commenced partial production in September 2009 with full production not achieved until February 2010. The Mereenie Producers continued to supply PWC’s gas requirements on a reasonable endeavors basis to supplement Blacktip gas sales until early February, 2010. MPAL is actively pursuing gas sales contracts for the remaining uncontracted reserves at Mereenie and Palm Valley. While gas marketing efforts to date have identified several potential customers, the majority have a gas requirement commencing in the 2011-2013 timeframe. There is strong competition within the market with Blacktip gas now available, and MPAL may not be able to contract for the sale of the remaining uncontracted reserves in the short term, but may be able to do so in the longer term with increasing demand from new mining developments and industrial users in the Northern Territory and the adjacent areas of neighboring states. As MPAL has not been able to sell its uncontracted gas, its revenues have declined in 2010. Unless MPAL is able to sell uncontracted gas, including reasonable endeavors gas not taken by PWC or be successful in its current exploration program, its revenues will continue to be substantially reduced in 2011 and beyond, which will materially affect the Company’s liquidity and results of operations.
Mereenie gas sales were approximately $11.6 million (net of royalties) or 85% of total gas sales for the year ended June 30, 2010 and $12.4 million (net of royalties) or 85% of total sales for the year ended June 30, 2009.
Oil Production
MPAL — Presently all of the crude oil and condensate production from Mereenie is being shipped and sold through the Port Bonython Export Terminal, Whyalla, South Australia. Prior to the sale of the MPAL’s Cooper Basin oil field, crude oil production from Kiana and Aldinga were generally shipped through the Moomba processing facility in northeastern South Australia and piped from there to the Port Bonython Export Terminal where it was sold. Nockatunga crude oil was shipped and sold through the IOR Energy refinery at Eromanga, Southwest Queensland. Oil sales during fiscal 2010 were 47.40% to the Santos group of companies, 14.70% to the Beach Petroleum group of companies, and 9.40% to Origin Energy Resources and 28.5% to IOR Energy.
Nautilus Poplar – Presently all of the oil production from the East Poplar Unit and the Northwest Poplar Oil Field is being trucked to a terminal in Reserve, MT and sold to Nexen, Inc.
(viii) Backlog.
Not applicable.
(ix) Renegotiation of Profits or Termination of Contracts or Subcontracts at the Election of the Government.
Not applicable.
13
Table of Contents
(x) Competitive Conditions in the Business.
The exploration for and production of oil and gas are highly competitive operations. The ability to exploit a discovery of oil or gas is dependent upon such considerations as the ability to finance development costs, the availability of equipment, and the possibility of engineering and construction delays and difficulties. The Company also must compete with major oil and gas companies which have substantially greater resources.
Furthermore, various forms of energy legislation which have been or may be proposed in the countries in which the Company holds interests may substantially affect competitive conditions. However, it is not possible to predict the nature of any such legislation which may ultimately be adopted or its effects upon the future operations of the Company.
(xi) Research and Development.
Not applicable.
(xii) Environmental Regulation.
The Company is subject to the environmental laws and regulations of the jurisdictions in which it carries on its business, and existing or future laws and regulations could have a significant impact on the exploration for and development of natural resources by the Company. However, to date, the Company has not been required to spend any material amounts for environmental control facilities. The federal and state governments in Australia strictly monitor compliance with these laws but compliance therewith has not had any adverse impact on the Company’s operations or its financial resources. We are subject to stringent and complex U.S. and Canadian federal, state, provincial and local environmental laws, regulations and permits and international environmental conventions, including those relating to the generation, storage, handling, use, disposal, movement and remediation of natural gas, NGLs, oil and other hazardous materials; the emission and discharge of such materials to the ground, air and water; wildlife protection; the storage, use and treatment of water; and the placement, operation and reclamation of wells. These requirements are a significant consideration for us as our operations involve the generation, storage, handling, use, disposal, movement and remediation of natural gas, NGLs, oil and other hazardous or regulated materials and the emission and discharge of such materials to the environment. If we violate these requirements, or fail to obtain and maintain the necessary permits, we could be fined or otherwise sanctioned, which sanctions could include the imposition of fines and penalties and orders enjoining future operations. Pursuant to such laws, regulations and permits, we have made and expect to continue to make capital and other compliance expenditures.
At June 30, 2010, the Company had accrued approximately $9.3 million for asset retirement obligations for the Mereenie, Palm Valley, Dingo and Poplar fields. See Note 4 of the Consolidated Financial Statements under Item 8 — Financial Statements and Supplementary Data.
(xiii) Number of Persons Employed by Company.
At June 30, 2010 the Company had 39 total employees. MPC had 7 employees and Nautilus had 10 employees in the United States. At that date, MPAL had 22 employees in Australia.
(d) (2) Financial Information Relating to Foreign and Domestic Operations.
See Note 17 to the Consolidated Financial Statements.
14
Table of Contents
(3) Risks Attendant to Foreign Operations.
Many of the properties in which the Company has interests are located outside the United States and are subject to certain risks involved in the ownership and development of such foreign property interests. These risks include but are not limited to those of: nationalization; expropriation; confiscatory taxation; changes in foreign exchange controls; currency revaluations; price controls or excessive royalties; export sales restrictions; limitations on the transfer of interests in exploration licenses; and other laws and regulations which may adversely affect the Company’s properties, such as those providing for conservation, proration, curtailment, cessation, or other limitations of controls on the production of or exploration for hydrocarbons. Thus, an investment in the Company represents a speculation with risks in addition to those inherent in domestic petroleum exploratory ventures.
Since 1992, there has been an ongoing controversy regarding the Aborigines and the ownership of their traditional lands. There has been legislation aimed at resolving this controversy. The Company does not believe that this issue will have a material adverse impact on MPAL’s properties.
(4) Data Which are Not Indicative of Current or Future Operations.
(e) Available Information
Information regarding the Company, including corporate governance policies, code of ethics and charters for the committees of the board of directors can be found on our Internet website at http://www.magellanpetroleum.com and copies of these documents are available to stockholders, without charge, upon request to Jeffrey Tounge, Investor Relations, Magellan Petroleum Corporation, 7 Custom House Street, 3rd Floor, Portland, Maine 04101 (tel: (207) 619-8500. The information contained in our website is not intended to be incorporated into this Form 10-K. In addition, our annual reports on Form 10-K, quarterly reports on Form 10-Q, current reports on Form 8-K and amendments to those reports filed or furnished pursuant to Section 13(a) or 15(d) of the Securities Exchange Act of 1934 are made available free of charge on our Internet website on the same day that we electronically file such material with, or furnish it to, the Securities and Exchange Commission (the “SEC”). Information filed with the SEC may be read or copied at the SEC’s Public Reference Room at 100 F Street, N.E., Washington, D.C. 20549. Information on operation of the Public Reference Room may be obtained by calling the SEC at 1-800-SEC-0330. These filings are also available to the public from commercial document retrieval services and at the Internet website maintained by the SEC at http://www.sec.gov that contains reports, proxy and information statements, and other information regarding issuers that file electronically with the SEC.
| Item 1A. | Risk Factors |
Set forth below and elsewhere in this Annual Report on Form 10-K are the risks and uncertainties that should be considered in evaluating the Company’s common stock and that could cause the actual future results of the Company to differ from those expressed or implied in the forward-looking statements contained in this Annual Report and in other public statements the Company makes. Additionally, because of the following risks and uncertainties, as well as other variables affecting the Company’s operating results, the Company’s past financial performance should not be considered an indicator of future performance.
The principal oil and gas properties owned by MPAL, MPC and Nautilus could stop producing oil and gas.
MPAL’s Palm Valley and Mereenie fields and / or Nautilus’s Poplar fields could stop producing oil and gas or there could be a material decrease in production levels at the fields. Since these are the three principal revenue producing properties of Magellan, any decline in production levels at these properties could cause Magellan’s revenues to decline. Any such adverse impact on the revenues and cashflows being received by Magellan could restrict our ability to explore and develop oil and gas properties in the future and cause our stock price to decline.
15
Table of Contents
If MPAL’s existing long-term gas supply contracts are terminated or not renewed, MPAL’s business could be adversely affected.
MPAL’s financial performance and cash flows have historically been dependent upon its Palm Valley and Mereenie existing supply contracts to sell gas produced at these fields to MPAL’s former major customer, Gasgo, a subsidiary of PWC of the Northern Territory. Gasgo has contracted with Eni Australia for the supply of PWC’s Northern Territory gas demand requirement for twenty five years. Eni Australia, commenced sales in January 2009, is to supply the gas from its Blacktip field offshore of the Northern Territory. The Blacktip development has encountered delays but has already commenced partial production. The Mereenie Producers continued to supply PWC’s gas demand on a reasonable endeavors basis to supplement Blacktip gas sales as required until September 5, 2010. All prices for those sales now fall under the Backstop Agreement. MPAL is actively pursuing gas sales contracts for the remaining uncontracted reserves. While gas marketing efforts to date have identified several potential customers, the majority have a gas requirement commencing in the 2011-2013 timeframe. With Blacktip gas now available, there is strong competition within the market and MPAL may not be able to contract for the sale of the remaining uncontracted reserves in the short term, but may be able to do so in the longer term with increasing demand from new mining developments and industrial users in the Northern Territory and the adjacent areas of neighboring states. Unless MPAL is able to sell uncontracted gas, including reasonable endeavors gas not taken by PWC, its revenues will continue to decline in 2011. Mereenie gas sales were approximately $11.6 million (net of royalties) or 85% of total gas sales for the year ended June 30, 2010 and $12.4 million (net of royalties) or 85% of total sales for the year ended June 30, 2009.
The Palm Valley Darwin contract expires in the year 2012. The expiration of these contracts, if not replaced, will have an adverse effect on MPAL’s revenues and business outlook and possibly its share price. Palm Valley gas sales were approximately $2.1 million (net of royalties) or 18% of total gas sales for the year ended June 30, 2010 and $2.2 million (net of royalties) or 17% of total sales for the year ended June 30, 2009.
We recently completed an acquisition of a 83.5% controlling member interest in Nautilus and may make acquisitions or investments in new oil and gas reserves, operating businesses or assets that involve additional risks, which could disrupt our business or harm our financial condition or results of operations.
As part of our business strategy, we have recently acquired a controlling interest in Nautilus Poplar LLC. We expect to continue to make acquisitions of companies that possess oil and gas reserves or other businesses or assets that are complementary to our growth strategy. Such acquisitions or investments involve a number of risks, including:
| • | assimilating operations and new personnel may be unexpectedly difficult; |
| • | management’s attention may be diverted from other business concerns; |
| • | we may enter markets in which we have limited or no direct experience; |
| • | we may lose key employees of an acquired business; |
| • | we may not realize the value of the acquired assets relative to the price paid; and |
| • | despite our due diligence efforts, we may not succeed at quality control or other customer issues. |
These factors could have a material adverse effect on our business, financial condition and operating results. Consideration paid for any future acquisitions could include our stock or require that we incur additional debt and contingent liabilities. As a result, future acquisitions could cause dilution of existing equity interests and earnings per share.
16
Table of Contents
We recently entered into an agreement with Santos to purchase Santos’ 40% interest in a large gas field offshore in Australia, under which we made an initial cash deposit of (AUS) $15 million as partial payment of the purchase price, that could be forfeited should we be unable to complete the purchase of the interest by the “completion date” specified under the agreement.
On March 25, 2010, our subsidiary MPAL entered into an agreement with Santos Limited (Santos) to purchase Santos’ 40% interest in Evans Shoal natural gas field (NT/P48), located in the Bonaparte Basin offshore Northern Australia. Under the agreement, we paid a cash deposit of (AUS) $15 million to be credited against the (AUS) $100 million initial purchase price for the Santos interest. If we are unable to complete the purchase of Santos’ interest by the completion date specified under the agreement (which will occur during December 2010) either because we are unable to raise additional funding by the sale of additional equity or debt securities in the near future, would likely forfeit our initial (AUS) $15 million deposit payment to Santos, which would adversely impact our financial condition and could cause our stock price to decline. For a more complete description of the Evans Shoal agreement and gas field, see Note 10 to the Consolidated Financial Statements included herein in Item 8.
Our plans to drill for oil and gas on fields located in the U.K. may not result in successful discoveries of oil and gas.
During fiscal year 2011, we expect that at least two new wells, Markwells Wood-1, Havant-1, in the Weald Basin in the United Kingdom in which we hold interests will be drilled in an attempt to recover oil and gas in commercially viable quantities. If these drilling projects are not successful, no revenues will be achieved from the drilling projects and our results of operations would be adversely affected.
We may not be successful in sharing the exploration and development costs of the fields and permits in which we hold interests.
Our plans for drilling in the U.K. and North America depend, in certain cases, on our ability to enter into farm-in, joint venture or other cost sharing arrangements with other oil and gas companies. If we are not able to secure such farm-in or other arrangements in a timely manner, or on terms which are economically attractive to the Company, we may be forced to bear higher exploration and development costs with respect to our fields and interests. We may also be unable to fully develop and/or explore certain fields if the costs to do so would exceed our available exploration budget and capital resources. In either case, our results of operations could be adversely affected and the market price of our common shares could decline.
Fluctuations in our operating results and other factors may depress our stock price.
During the past few years, the equity trading markets in the United States have experienced price volatility that has often been unrelated to the operating performance of particular companies. These fluctuations may adversely affect the trading price of our common shares. From time to time, there may be significant volatility in the market price of our common shares. Investors could sell shares of our common stock at or after the time that it becomes apparent that the expectations of the market may not be realized, resulting in a decrease in the market price of our common shares.
The loss of key personnel could adversely affect our ability to operate.
We depend, and will continue to depend in the foreseeable future, on the services of the officers and key employees of MPC, Nautilus, and MPAL. The ability to retain its officers and key employees is important to our continued success and growth. The unexpected loss of the services of one or more of these individuals could have a detrimental effect on our business.
17
Table of Contents
There are risks inherent in foreign operations such as adverse changes in currency values and foreign regulations relating to MPAL’s exploration and development operations and to MPAL’s payment of dividends to MPC.
The properties in which Magellan has interests located outside the United States are subject to certain risks related to the indirect ownership and development of foreign properties, including government expropriation, adverse changes in currency values and foreign exchange controls, foreign taxes, nationalization and other laws and regulations, any of which may adversely affect the Company’s properties. Although there are currently no exchange controls on the payment of dividends to the Company by MPAL, such payments could be restricted by Australian foreign exchange controls, if implemented.
Our dividend policy could depress our stock price.
We have never declared or paid dividends on our common stock and have no current intention to change this policy. We plan to retain any future earnings to reduce our accumulated deficit and finance growth. As a result, our dividend policy could depress the market price for our common stock and cause investors to lose some or all of their investment.
We may issue a substantial number of shares of our common stock under our stock option plans and shareholders may be adversely affected by the issuance of those shares.
As of June 30, 2010, there were 4,347,826 warrants outstanding and 3,880,000 stock options outstanding of which 2,230,000 were fully vested and exercisable. As of that date, there were also 800,000 options available for future grants under our 1998 Stock Incentive Plan as amended in May of 2009. If all of these options and warrants, which total 9,027,826 in the aggregate, were awarded and exercised these shares would represent approximately 17.24% of our outstanding common shares and would, upon their exercise and the payment of the exercise prices, dilute the interests of other shareholders and could adversely affect the market price of our common stock.
If our shares are delisted from trading on the Nasdaq Capital Market, their liquidity and value could be reduced.
In order for us to maintain the listing of our shares of common stock on the Nasdaq Capital Market, the Company’s shares must maintain a minimum bid price of $1.00 as set forth in Marketplace Rule 5550(a)(2). If the bid price of the Company’s shares trade below $1.00 for 30 consecutive trading days, then the bid price of the Company’s shares must trade at $1.00 or more for 10 consecutive trading days during a 180-day grace period to regain compliance with the rule. On September 1, 2010 the Company’s shares closed at $1.63 per share. If the Company shares were to be delisted from trading on the Nasdaq Capital Market, then most likely the shares would be traded on the Electronic Bulletin Board, or OTC-BB. The delisting of the Company’s shares from NASDAQ could adversely impact the liquidity and value of the Company’s shares.
We have limited management and staff and will be dependent upon partnering arrangements.
The Company and its affiliates had approximately 39 total employees as of June 30, 2010. Despite this increase in employment, we expect that we will continue to require the services of independent consultants and contractors to perform various professional services, including reservoir engineering, land, legal, environmental and tax services. We will also pursue alliances with partners in the areas of geological and geophysical services and prospect generation, evaluation and prospect leasing. Our dependence on third party consultants and service providers creates a number of risks, including but not limited to:
| • | the possibility that such third parties may not be available to us as and when needed; and |
| • | the risk that we may not be able to properly control the timing and quality of work conducted with respect to our projects. |
If we experience significant delays in obtaining the services of such third parties or poor performance by such parties, our results of operations and stock price will be materially adversely affected.
18
Table of Contents
RISKS RELATED TO THE OIL AND GAS INDUSTRY
Oil and gas prices are volatile. A decline in prices could adversely affect our financial position, financial results, cash flows, access to capital and ability to grow.
Our revenues, operating results, profitability, future rate of growth and the carrying value of our oil and gas properties depend primarily upon the prices we receive for the oil and gas we sell. Prices also affect the amount of cash flow available for capital expenditures and our ability to borrow money or raise additional capital. The prices of oil, natural gas, methane gas and other fuels have been, and are likely to continue to be, volatile and subject to wide fluctuations in response to numerous factors, including the following:
| • | worldwide and domestic supplies of oil and gas; |
| • | changes in the supply and demand for such fuels; |
| • | political conditions in oil, natural gas, and other fuel-producing and fuel-consuming areas; |
| • | the extent of Australian domestic oil and gas production and importation of such fuels and substitute fuels in Australian and other relevant markets; |
| • | weather conditions, including effects on prices and supplies in worldwide energy markets because of recent hurricanes in the United States; |
| • | the competitive position of each such fuel as a source of energy as compared to other energy sources; and |
| • | the effect of governmental regulation on the production, transportation, and sale of oil, natural gas, and other fuels. |
These factors and the volatility of the energy markets make it extremely difficult to predict future oil and gas price movements with any certainty. Furthermore, the ongoing worldwide financial and credit crisis has reduced the availability of liquidity and credit to fund the continuation and expansion of industrial business operations worldwide. The shortage of liquidity and credit combined with recent substantial losses in worldwide equity markets could lead to an extended worldwide economic recession. A slowdown in economic activity caused by a recession would likely reduce worldwide demand for energy and result in lower oil and natural gas prices. Oil prices declined from record levels in early July 2008 of over $140 per barrel to below $70 per barrel in August 2009 and are back up to $76 per barrel as of September 2010, while natural gas prices have declined from over $13 per mcf to approximately $4 per mcf over the same period.
Sustained declines in oil and gas prices (such as those experienced in the second half of 2008) would not only reduce our revenues, but could reduce the amount of oil and gas that we can produce economically and, as a result, could have a material adverse effect on our financial condition, results of operations and reserves. Further, oil and gas prices do not necessarily move in tandem. Approximately 2.6% of our proved reserves at June 30, 2010 were natural gas reserves. Gas sales contracts in Australia are adjusted to the gas price movements related to the Australian Consumer Price Index. Future gas sales not governed by existing contracts would generate lower revenue if natural gas prices in Australia were to decline. Sales of our proved oil reserves are dependent on world oil prices. The volatility of these prices will affect future oil revenues. Gas sales, which represented approximately 50% of production revenues in 2010, are derived primarily from the Palm Valley and Mereenie fields in the Northern Territory of Australia and the gas prices are set according to contracts that are subject to changes in the Australian Consumer Price Index.
Competition in the oil and natural gas industry is intense, and many of our competitors have greater financial and other resources than Magellan.
We operate in the highly competitive areas of oil and natural gas acquisition, development, exploitation, exploration and production and face intense competition from both major and other independent oil and natural
19
Table of Contents
gas companies. Many of our Australian competitors have financial and other resources substantially greater than ours, and some of them are fully integrated oil companies. These companies may be able to pay more for development prospects and productive oil and natural gas properties and may be able to define, evaluate, bid for and purchase a greater number of properties and prospects than our financial or human resources permit. Our ability to develop and exploit our oil and natural gas properties and to acquire additional properties in the future will depend upon our ability to successfully conduct operations, evaluate and select suitable properties and consummate transactions in this highly competitive environment. In addition, we may not be able to compete with, or enter into cooperative relationships with, any such firms.
Our oil and gas exploration and production operations are subject to numerous environmental laws, compliance with which may be extremely costly.
Our operations are subject to environmental laws and regulations in the various countries in which they are conducted. Such laws and regulations frequently require completion of a costly environmental impact assessment and government review process prior to commencing exploratory and/or development activities. In addition, such environmental laws and regulations may restrict, prohibit, or impose significant liability in connection with spills, releases, or emissions of various substances produced in association with fuel exploration and development.
We can provide no assurance that we will be able to comply with applicable environmental laws and regulations or that those laws, regulations or administrative policies or practices will not be changed by the various governmental entities. The cost of compliance with current laws and regulations or changes in environmental laws and regulations could require significant expenditures. Moreover, if we breach any governing laws or regulations, we may be compelled to pay significant fines, penalties, or other payments. Costs associated with environmental compliance or noncompliance may have a material adverse impact on our cash flows, financial condition or results of operations in the future.
The potential impacts of climate change may negatively impact our business and results of operations.
Climate change has become the subject of an important public policy debate. Climate change remains a complex issue, with some scientific research suggesting that an increase in greenhouse gas emissions (GHGs) may pose a risk to society and the environment. The oil and natural gas exploration and production industry is a source of certain GHGs, namely carbon dioxide and methane, and future restrictions on the combustion of fossil fuels or the venting of natural gas could have a significant impact on our future operations.
We depend on one purchaser for a substantial portion of our revenue in North America. The inability of the purchaser to meet their payment obligations to us may adversely affect our financial results.
Currently, Nautilus relies on its contract with Nexen, Inc. as the sole customer for its oil produced in Montana.
Our estimated reserves are based on many assumptions that may turn out to be inaccurate. Any significant inaccuracies in these reserve estimates or underlying assumptions may materially affect the quantities and present value of our reserves.
This annual report and the documents incorporated by reference in this annual report contain estimates of our proved reserves and the estimated future net revenues from our proved reserves. These estimates are based upon various assumptions, including assumptions required by the SEC relating to oil and gas prices, drilling and operating expenses, capital expenditures, taxes and availability of funds. The process of estimating oil and gas reserves is complex. The process involves significant decisions and assumptions in the evaluation of available geological, geophysical, engineering and economic data for each reservoir. Actual future production, oil and gas
20
Table of Contents
prices, revenues, taxes, development expenditures, operating expenses and quantities of recoverable oil and gas reserves most likely will vary from these estimates. Such variations may be significant and could materially affect the estimated quantities and present value of our proved reserves. In addition, we may adjust estimates of proved reserves to reflect production history, results of exploration and development drilling, prevailing oil and gas prices and other factors, many of which are beyond our control. Our properties may also be susceptible to hydrocarbon drainage from production by operators on adjacent properties.
The present value of future net cash flows from our proved reserves is not necessarily the same as the current market value of our estimated oil and natural gas reserves. We base the estimated discounted future net cash flows from our proved reserves on the average, first-day-of-the-month price during the 12-month period preceding the measurement date. However, actual future net cash flows from our oil and natural gas properties also will be affected by factors such as:
| • | actual prices we receive for oil and natural gas; |
| • | actual cost of development and production expenditures; |
| • | the amount and timing of actual production; |
| • | supply of and demand for oil and natural gas; and |
| • | changes in governmental regulations or taxation. |
The timing of both our production and our incurrence of expenses in connection with the development and production of oil and natural gas properties will affect the timing of actual future net cash flows from proved reserves, and thus their actual present value. In addition, the 10% discount factor we use when calculating discounted future net cash flows for financial statement disclosure, may not be the most appropriate discount factor based on interest rates in effect from time to time and risks associated with us or the oil and natural gas industry in general.
Our reserves as of June 30, 2010 have been reported under new SEC Rules. The estimates provided in accordance with the new SEC rules may change materially as a result of interpretive guidance that may be subsequently released by the SEC.
We have included in this report estimates of our proved reserves at June 30, 2010 as prepared consistent with our independent reserve engineers’ interpretations of the new SEC rules relating to disclosures of estimated natural gas and oil reserves. These new rules are effective for fiscal years ending on or after December 31, 2009. These newly adopted rules require SEC reporting companies to prepare their reserve estimates using revised reserve definitions and revised pricing based on 12-month unweighted first-day-of-the-month average pricing. The SEC has not specifically reviewed our reserve estimates under the new rules and has released only limited interpretive guidance regarding reporting of reserve estimates under the new rules. Accordingly, while the estimates of our proved reserves at June 30, 2010 included in this report have been prepared based on what we and our independent reserve engineers believe to be reasonable interpretations of the new SEC rules, those estimates could ultimately differ materially from any estimates we might prepare applying more specific SEC interpretive guidance.
We may be limited in our ability to book additional proved undeveloped reserves under the new SEC rules.
Another impact of the new SEC reserve rules is a general requirement that, subject to limited exceptions, proved undeveloped reserves may only be booked if they relate to wells scheduled to be drilled within five years of the date of booking. This new rule may limit our potential to book additional proved undeveloped reserves as we pursue our drilling program on our undeveloped properties.
21
Table of Contents
We may not have funds sufficient to make the significant capital expenditures required to replace our reserves.
Our exploration, development and acquisition activities require substantial capital expenditures. Historically, we have funded our capital expenditures through a combination of cash flows from operations, farming-in other companies or investors to MPAL’s exploration and development projects in which we have an interest and/or equity issuances. Future cash flows are subject to a number of variables, such as the level of production from existing wells, prices of oil and gas, and our success in developing and producing new reserves. If revenue were to decrease as a result of lower oil and gas prices or decreased production, and our access to capital were limited, we would have a reduced ability to replace our reserves. If our cash flow from operations is not sufficient to fund the Company’s capital expenditure budget, we may not be able to rely upon additional farm-in opportunities, debt or equity offerings or other methods of financing to meet these cash flow requirements.
If we are not able to replace reserves, we may not be able to sustain production.
Our future success depends largely upon our ability to find, develop or acquire additional oil and gas reserves that are economically recoverable. Unless we replace the reserves we produce through successful development, exploration or acquisition activities, our proved reserves will decline over time. Recovery of any additional reserves will require significant capital expenditures and successful drilling operations. We may not be able to successfully find and produce reserves economically in the future. In addition, we may not be able to acquire proved reserves at acceptable costs.
Exploration and development drilling may not result in commercially productive reserves.
We do not always encounter commercially productive reservoirs through our drilling operations. The new wells we drill or participate in may not be productive and we may not recover all or any portion of our investment. The seismic data and other technologies we use do not allow us to know conclusively prior to drilling a well that oil or gas is present or may be produced economically. The cost of drilling, completing and operating a well is often uncertain, and cost factors can adversely affect the economics of a project. Our efforts will be unprofitable if we drill dry wells or wells that are productive but do not produce enough reserves to return a profit after drilling, operating and other costs. Further, our drilling operations may be curtailed, delayed or canceled as a result of a variety of factors, including:
| • | unexpected drilling conditions; |
| • | title problems; |
| • | pressure or irregularities in formations; |
| • | equipment failures or accidents; |
| • | adverse weather conditions; |
| • | compliance with environmental and other governmental requirements; and |
| • | increases in the cost of, or shortages or delays in the availability of, drilling rigs and equipment. |
Future price declines may result in a write-down of our asset carrying values.
We follow the successful efforts method of accounting for our oil and gas operations. Under this method, the costs of successful wells, development dry holes and productive leases are capitalized and amortized on a units-of-production basis over the life of the related reserves. Cost centers for amortization purposes are determined on a field-by-field basis. Magellan records its proportionate share in its working interest agreements in the respective classifications of assets, liabilities, revenues and expenses. Unproved properties with significant acquisition costs are periodically, but at least annually, assessed for impairment in value with any required impairment charged to expense. The successful efforts method also imposes limitations on the carrying or book
22
Table of Contents
value of proved oil and gas properties. Oil and gas properties (including exploration rights), along with goodwill, are reviewed for impairment annually or whenever events or circumstances indicate that the carrying amounts may not be recoverable. We estimate the future undiscounted cash flows from the affected properties to determine the recoverability of carrying amounts. In general, analyses are based on proved developed reserves for gas, except in the case of Palm Valley proved gas, which is based in contracted volumes. At June 30, 2010, Mereenie had no gas contracts, thus no gas reserves. The Mereenie discounted future net cash flows were negative due to the loss of the gas contract. According to the SEC definition of proved reserves, this results in zero proved oil reserves. For Palm Valley, reserves were based upon the quantities of gas committed to the contract. If such contracts are extended, the proved developed reserves will be increased to the lesser of the actual proved developed reserves and risk adjusted probable and possible reserves or the contracted quantities. A significant decline in oil and gas prices from current levels, or other factors, without other mitigating circumstances, could cause a future write down of capitalized costs and a non-cash charge against future earnings.
Oil and gas drilling and producing operations are hazardous and expose us to environmental liabilities.
Oil and gas operations are subject to many risks, including well blowouts, cratering and explosions, pipe failure, fires, formations with abnormal pressures, uncontrollable flows of oil, natural gas, brine or well fluids, and other environmental hazards and risks. Our drilling operations involve risks from high pressures and from mechanical difficulties such as stuck pipes, collapsed casings and separated cables. If any of these risks occur, we could sustain substantial losses as a result of:
| • | injury or loss of life; |
| • | severe damage to or destruction of property, natural resources and equipment; |
| • | pollution or other environmental damage; |
| • | clean-up responsibilities; |
| • | regulatory investigations and penalties; |
| • | and suspension of operations. |
Our liability for environmental hazards includes those created either by the previous owners of properties that we purchase or lease or by acquired companies prior to the date we acquire them. We maintain insurance against some, but not all, of the risks described above. Our insurance may not be adequate to cover casualty losses or liabilities. Also, in the future we may not be able to obtain insurance at premium levels that justify its purchase.
Difficult conditions resulting from the ongoing U.S. and worldwide financial and credit crisis, and significant concerns over the continuing recessions in the U.S. and Australian economies, may materially adversely affect our business and results of operations and we do not expect these conditions to improve in the near future.
Continual volatility and disruption, since 2008, in worldwide capital and credit markets and further deteriorating conditions in the U.S. and Australian economies could affect our revenues and earnings negatively and could have a material adverse effect on our business, results of operations and financial condition. For example, purchasers of our oil and gas production may reduce the amounts of oil and gas they purchase from us and/or delay or be unable to make timely payments to us.
Further, a number of our oil and gas properties are operated by third parties whom we depend upon for timely performance of drilling and other contractual obligations and, in some cases, for distribution to us of our proportionate share of revenues from sales of oil and gas we produce. If current economic conditions adversely impact our third party operators, we are exposed to the risk that drilling operations or revenue disbursements to us could be delayed. This “trickle down” effect could significantly harm our business, financial condition and results of operation.
23
Table of Contents
We cannot control activities on properties that we do not operate and are unable to control their proper operation and profitability.
We do not operate all of the properties in which we own an ownership interest. As a result, we have limited ability to exercise influence over, and control the risks associated with, the operations of these non-operated properties. The failure of an operator of our wells to adequately perform operations, an operator’s breach of the applicable agreements or an operator’s failure to act in ways that are in our best interests could reduce our production, revenues and reserves. The success and timing of our drilling and development activities on properties operated by others therefore depend upon a number of factors outside of our control, including the operator’s:
| • | nature and timing of drilling and operational activities; |
| • | timing and amount of capital expenditures; |
| • | expertise and financial resources; |
| • | the approval of other participants in drilling wells; and |
| • | selection of suitable technology. |
Currency exchange rate fluctuations may negatively affect our operating results.
The exchange rates among the Australian dollar and the U.S. dollar, as well as the exchange rates between the Australian dollar and the U.K. pound sterling, have changed in recent periods and may fluctuate substantially in the future. We expect that a majority of our revenue will continue to be generated in the Australian dollar in the future. Since June 30, 2009, the U.S. dollar has slightly strengthened against the Australian dollar which has had, and may continue to have, a positive impact on our revenues generated in the Australian dollar, as well as our operating income and net income, as considered on a consolidated basis. The foreign exchange gain for the year ended June 30, 2010 was $1.4 million and is included in accumulated other comprehensive income on the balance sheet. Any continued appreciation of the U.S. dollar against the Australian dollar is likely to have a positive impact on our revenue, operating income and net income. Because of our U.K. development program, a portion of our expenses, including exploration costs and capital and operating expenditures will continue to be denominated in U.K. pound sterling. Accordingly, any material appreciation of the U.K. pound sterling against the Australian dollar could have a negative impact on our business, operating results and financial condition.
| Item 1B. | Unresolved Staff Comments. |
None
| Item 2. | Properties. |
(a) MPC has interests in properties in Australia through its 100% equity interest in MPAL which holds interests in the Northern Territory, Queensland and South Australia. MPAL also has interests in the United Kingdom. In the United States, MPC has an 83.5% controlling member interest in Nautilus. Nautilus, based in Denver, Colorado, owns and operates oil development assets in Roosevelt County, Montana known as the East Poplar Unit and the Northwest Poplar Field. MPC also owns a 26.3% average working interest in these Montana fields. In Canada, MPC has a direct interest in one lease. For additional information regarding the Company’s properties, see Item 1 — Business.
(b) (1) Detailed information regarding reserves, costs of oil and gas activities, capitalized costs, discounted future net cash flows and results of operations is disclosed in note 17 — Supplementary Oil & Gas Information under Item 8 — Financial Statements and Supplementary Data.
24
Table of Contents
A summary of our estimated proved, probable and possible reserves as of June 30, 2010 are set for the in the table below.
| Total | Australia | United States | All other Foreign Geographic areas | |||||||||||||
| Proved Reserves: |
Oil | Gas | Oil | Gas | Oil | Gas | Oil | Gas | ||||||||
| PDP |
1,746 | 1.53 | — | 1.53 | 1,746 | — | — | — | ||||||||
| PDNP |
769 | — | — | 769 | — | — | — | |||||||||
| PUD |
6,963 | — | — | 6,963 | — | — | — | |||||||||
| Total Proved |
9,478 | 1.53 | — | 1.53 | 9,478 | — | — | — | ||||||||
| Probable developed |
536 | — | 536 | — | — | — | — | |||||||||
| Probable undeveloped |
3,999 | — | 2,215 | 1,784 | — | — | — | |||||||||
| Total Probable |
4,535 | — | 2,751 | — | 1,784 | — | — | — | ||||||||
| Possible developed |
208 | — | 208 | — | — | — | — | |||||||||
| Possible undeveloped |
3,775 | — | 833 | 2,942 | — | — | — | |||||||||
| Total Possible |
3,983 | — | 1,041 | — | 2,942 | — | — | — | ||||||||
| Total reserves |
17,996 | 1.53 | 3,792 | 1.53 | 14,204 | |||||||||||
Oil reserves stated in 1,000 Bbls; natural gas reserves stated in Mmcf.
Oil and gas production for the twelve months ended June 30, 2010 was as follows:
| Total | Australia (c) | United States | All other | |||||||||
| Total US | ||||||||||||
| Oil (a) | Gas (a) | Oil | Gas | Oil (b) | Gas | |||||||
| 2010 |
139 | 3.486 | 97 | 3.430 | 42 | 0.056 | ||||||
| (a) | Oil reserves stated in 1,000 Bbls: natural gas reserves stated in Mmcf. |
| (b) | Includes 6.1 Bbls attributable to a consolidated subsidiary in which there is an 16.5% non-controlling interest. |
AUSTRALIAN MAP WITH MPAL PROJECTS SHOWN
AMADEUS BASIN PROJECTS MAP
The map indicates the location of the Amadeus Basin interests in the Northern Territory of Australia. The following items are identified:
Palm Valley Gas Field
Mereenie Oil & Gas Field
Dingo Gas Field
Palm Valley — Alice Springs Gas Pipeline
Palm Valley — Darwin Gas Pipeline
Mereenie Spur Gas Pipeline
Mereenie Oil Pipeline
25
Table of Contents
CANADIAN PROPERTY INTERESTS MAP
The map indicates the location of the Kotaneelee Gas Field in the Yukon Territories of Canada. The map identifies the following items:
Kotaneelee Gas Field
Pointed Mountain Gas Field
Beaver River Gas Field
UNITED KINGDOM PROPERTY INTERESTS MAP
The map indicates the location of the MPAL property interests in the United Kingdom.
Production
MPC’s production volumes, net of royalties, for gas and oil during the three years ended June 30, 2010, 2009 and 2008 are as follows (data for Canada has not been included since MPC is in a carried interest position and the data is not material):
| 2010 | 2009 | 2008 | ||||
| Australia: |
||||||
| Gas (BOE) |
481,000 | 863,000 | 945,000 | |||
| Crude oil (bbl) |
97,000 | 153,000 | 211,000 | |||
| United States (1): |
||||||
| Crude oil (bbl) |
42,000 | — | — |
| (1) | Production by field was 37,000 bbls for Poplar East and 5,000 bbls for Northwest Poplar. |
The average sales price per unit of production for Australia and the United States for the following fiscal years ended June 30, 2010, 2009 and 2008 are as follows:
| 2010 | 2009 | 2008 | ||||||
| Australia (1): |
||||||||
| Gas (per mcf) |
A.$ 5.07 | A.$ | 3.54 | A.$ | 3.39 | |||
| Crude oil (per bbl) |
A.$82.19 | A.$ | 91.21 | A.$ | 102.35 | |||
| United States: |
||||||||
| Crude oil (bbl) |
U.S.$67.88 | — | — | |||||
The average production cost per unit of production for Australia and the United States for the following fiscal years ended June 30, 2010, 2009 and 2008 are as follows:
| 2010 | 2009 | 2008 | ||||||
| Australia (1): |
||||||||
| Gas (per mcf) |
A.$ 1.86 | A.$ | .99 | A.$ | .82 | |||
| Crude oil (per bbl) |
A.$30.92 | A.$ | 26.72 | A.$ | 17.98 | |||
| United States: |
||||||||
| Crude oil (bbl) |
U.S.$36.43 | — | — | |||||
26
Table of Contents
Productive Wells and Acreage
Productive wells and acreage at June 30, 2010
| Productive Wells | ||||||||||||
| Oil | Gas | Developed Acreage | ||||||||||
| Gross | Net | Gross | Net | Gross Acres | Net Acres | |||||||
| Australia |
16.0 | 5.6 | 13.0 | 5.23 | 73,211 | 32,713 | ||||||
| United States |
37.0 | 33.4 | — | — | 22,893 | 18,693 | ||||||
| Other Foreign Countries |
— | — | 3.0 | .08 | 3,350 | 89 | ||||||
| 53.0 | 39.0 | 16.0 | 5.31 | 99,454 | 51,495 | |||||||
Undeveloped Acreage
The Company’s undeveloped acreage (except as indicated below) is set forth in the table below:
GROSS AND NET ACREAGE AS OF JUNE 30, 2010
MPAL, MPC and Nautilus have interests in the following properties (before royalties).
| MPC | ||||||
| Gross Acres | Net Acres | Interest % | ||||
| Australia |
||||||
| Northern Territory |
||||||
| PL 4/PL 5 Mereenie (Amadeus Basin) |
70,049 | 24,517 | 35.00 | |||
| PL 3 Palm Valley (Amadeus Basin) |
157,932 | 82,161 | 52.02 | |||
| RL 2 Dingo (Amadeus Basin) |
116,139 | 39,878 | 34.34 | |||
| NT/P82 Offshore |
1,566,647 | 1,566,647 | 100.00 | |||
| 1,910,767 | 1,713,203 | |||||
| Queensland: |
||||||
| ATP 613P (Maryborough Basin) |
153,387 | 153,387 | 100.00 | |||
| United Kingdom: |
||||||
| PEDL 098/152/240 (Wessex Basin) |
25,737 | 5,791 | 22.50 | |||
| PEDL 125/126/155/256 (Weald Basin) |
74,532 | 29,813 | 40.00 | |||
| PEDL 135/136/137/242/246 (Weald Basin) |
155,459 | 155,459 | 100.00 | |||
| PEDL 153 (Weald Basin) |
66,242 | 22,078 | 33.33 | |||
| PEDL 154 (Weald Basin) |
84,834 | 42,417 | 50.00 | |||
| PEDL 231/232/234/243 (Weald Basin) |
270,342 | 135,171 | 50.00 | |||
| 677,146 | 390,729 | |||||
| Total MPAL |
2,741,300 | 2,257,319 | ||||
| United States |
||||||
| Poplar Field |
648 | 542 | 83.68 | |||
| Canada: |
||||||
| Kotaneelee carried interest |
31,885 | 851 | 2.67 | |||
| Total |
2,773,833 | 2,258,712 | ||||
27
Table of Contents
Drilling Activity
There were no wells in process at June 30, 2010.
Productive and dry net wells drilled during the following years (data concerning Canada is insignificant):
| Total | Australia | United States | All Other Foreign Geographic Areas | |||||||||||||||||||||||||||||
| Year |
Exploration | Development | Exploration | Development | Exploration | Development | Exploration | Development | ||||||||||||||||||||||||
| Productive | Dry | Productive | Dry | Productive | Dry | Productive | Dry | Productive | Dry | Productive | Dry | Productive | Dry | Productive | Dry | |||||||||||||||||
| 2010 |
0 | 0 | 0 | 0 | 0 | 0 | 0 | 0 | 0 | 0 | 0 | 0 | 0 | 0 | 0 | 0 | ||||||||||||||||
| 2009 |
0 | 0 | 0 | 0 | 0 | 0 | 0 | 0 | 0 | 0 | 0 | 0 | 0 | 0 | 0 | 0 | ||||||||||||||||
| 2008 |
0 | 0.9 | 0.41 | 0 | 0 | 0.9 | 0.41 | 0 | 0 | 0 | 0 | 0 | 0 | 0 | 0 | 0 | ||||||||||||||||
Present Activities
See Item 1 — Cooper Basin and United Kingdom for a discussion of the present activities of MPAL and United States, for the present activities of MPC and Nautilus.
Delivery Commitments
See discussion under Item 1 concerning the Palm Valley and Mereenie fields.
| Item 3. | Legal Proceedings. |
None
| Item 4. | Reserved. |
PART II
| Item 5. | Market for the Registrant’s Common Equity, Related Stockholder Matters and Issuer Purchases of Securities |
(a) Principal Market
The principal market for MPC’s common stock is the NASDAQ Capital Market under the symbol MPET. The stock is also traded on the Australian Stock Exchange in the form of CHESS depository interests under the symbol MGN. The quarterly high and low prices on the most active market, NASDAQ, during the quarterly periods indicated were as follows:
| 2010 |
1st Qtr. | 2nd Qtr. | 3rd Qtr. | 4th Qtr. | ||||
| High |
1.59 | 1.76 | 2.42 | 2.26 | ||||
| Low |
0.91 | 1.30 | 1.53 | 1.54 |
| 2009 |
1st Qtr. | 2nd Qtr. | 3rd Qtr. | 4th Qtr. | ||||
| High |
1.64 | 1.10 | 0.78 | 1.35 | ||||
| Low |
1.02 | 0.48 | 0.58 | 0.61 |
28
Table of Contents
(b) Approximate Number of Holders of Common Stock at September 15, 2010
| Title of Class |
Number of Record Holders | |
| Common stock, par value $.01 per share |
5,761 |
(c) Frequency and Amount of Dividends
MPC has never paid a cash dividend on its common stock.
(e) Performance Graph
The graph below compares the cumulative total returns, including reinvestment of dividends, if applicable, on the Company’s Common Stock with the returns on companies in the NASDAQ Index and Industry Group Index (the Hemscott Index).
The chart displayed below is presented in accordance with SEC requirements. The graph assumes a $100 investment made on July 1, 2005 and the reinvestment of all dividends. Stockholders are cautioned against drawing any conclusions from the data contained therein, as past results are not necessarily indicative of future performance.
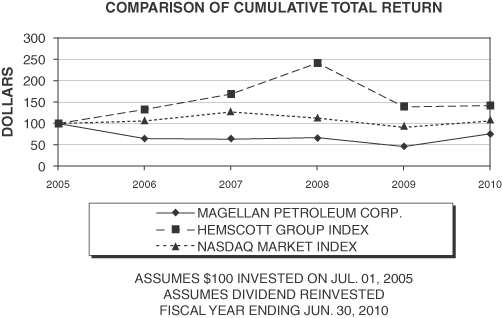
| 2005 | 2006 | 2007 | 2008 | 2009 | 2010 | |||||||
| MAGELLAN PETROLEUM CORP. |
100.00 | 65.42 | 63.33 | 67.50 | 46.25 | 76.25 | ||||||
| HEMSCOTT GROUP INDEX |
100.00 | 133.25 | 169.16 | 242.42 | 138.94 | 141.98 | ||||||
| NASDAQ MARKET INDEX |
100.00 | 106.44 | 127.60 | 113.21 | 91.52 | 106.15 |
29
Table of Contents
Recent Sales of Unregistered Securities
During the fiscal year ended June 30, 2010, other than as described below, there were no equity securities of the Company sold that were not registered under the Securities Act of 1933, as amended (the “Securities Act”).
As previously disclosed in the Company’s current reports filed on May 14, 2010, February 10, 2009, April 8, 2009, June 2, 2009 and July 14, 2009, the Company entered into a Securities Purchase Agreement (the “Purchase Agreement”), dated February 9, 2009, with Young Energy Prize S.A. (“YEP”) under which the Company agreed to sell, and YEP agreed to purchase, 8,695,652 shares (the “Shares”) of the Company’s common stock, par value $0.01 per share (the “Common Stock”) at a purchase price of $1.15 per share, or an aggregate of $10,000,000. The Purchase Agreement was amended on April 3, 2009 and June 30, 2009. On July 9, 2009, the Company and YEP completed the issuance and sale of the Shares to YEP. The Company received gross proceeds of $10 million, which was used for acquisitions, general corporate and working capital purposes. On July 9, 2009, the Company also executed and delivered to YEP a Warrant Agreement entitling YEP to purchase an additional 4,347,826 shares of the Company’s Common Stock (the “Warrant Shares”) at an exercise price of $1.20 per Warrant Share, subsequently reduced to $1.15 per share on July 30, 2009. The shares sold to YEP in the private placement and the Warrant Shares were not registered under the Securities Act or state securities laws, and may not be resold in the United States in the absence of an effective registration statement filed with the U.S. Securities and Exchange Commission (“SEC”) or an available exemption from the applicable federal and state registration requirements. In the Purchase Agreement, YEP represented to the Company that: (a) it is an accredited investor, as such term is defined in Rule 501 of Regulation D promulgated under the Securities Act; (b) it acquired the Shares and the Warrant as principal for its own account for investment purposes only and not with a view to or for distributing or reselling the Shares and the Warrant or any part thereof, and (c) it is knowledgeable, sophisticated, and experienced in making, and qualified to make, decisions with respect to investments in securities representing an investment decision similar to that involved in the purchase of the Shares and the Warrant. The Company has relied on the exemption from the registration requirements of the Securities Act set forth in Regulation S promulgated thereunder for the purposes of the YEP transaction.
On October 14, 2009, the Company entered into a Purchase and Sale Agreement (the “Nautilus Purchase Agreement”), dated October 15, 2009, with White Bear LLC, a Montana limited liability company (“White Bear”) and YEP I, SICAV-FIS, a Luxembourg entity (“the YEP I Fund”, and collectively with White Bear, the “Sellers”) and simultaneously closed the transactions described therein. Under the Nautilus Purchase Agreement, the Company has acquired from the Sellers an 83.5% controlling ownership interest in Nautilus Poplar, LLC, a Montana limited liability company. The Company paid gross $10.9 million for the controlling interest in Nautilus Poplar, comprised of a cash payment totaling approximately $7.3 million and the issuance of 1.7 million new shares of Company’s common stock, par value $.01 per share (the “Common Stock”), valued by the parties at $2,380,000 (or $1.40 per share), with an adjustment for $1.2 million of net debt. The shares sold to the ECP Fund, SICAV-FIS in the private placement pursuant to the Nautilus Purchase Agreement were not been registered under the Securities Act or state securities laws, and may not be resold in the United States in the absence of an effective registration statement filed with the SEC or an available exemption from the applicable federal and state registration requirements. The Company replied upon the exemption from the registration requirements of the Securities Act provided by Regulation S promulgated under the Securities Act.
On August 5, 2010, the Company entered into a second securities purchase agreement with YEP related to the planned sale of an additional 5,200,000 shares of the Company’s common stock. See Note 18 to the Consolidated Financial Statements in Item 8 — Financial Statements and Supplementary Data.
30
Table of Contents
Issuer Purchases of Equity Securities
The following table sets forth the number of shares that the Company has repurchased under any of its repurchase plans for the stated periods, the cost per share of such repurchases and the number of shares that may yet be repurchased under the plans:
| Period |
Total Number of Shares Purchased |
Average Price Paid per Share |
Total Number of Shares Purchased as Part of Publicly Announced Plan (1) |
Maximum Number of Shares that May Yet Be Purchased Under Plan | ||||
| July 1, 2009 – June 30, 2010 |
0 | 0 | 0 | 319,150 |
| (1) | The Company through its stock repurchase plan may purchase up to one million shares of its common stock in the open market. Through June 30, 2010, the Company had purchased 680,850 of its shares at an average price of $1.01 per share, or a total cost of approximately $686,000, all of which shares have been cancelled. No shares were purchased during 2010, 2009, or 2008. |
| Item 6. | Selected Financial Data. |
The following table sets forth selected data (in thousands except for exchange rates and per share data) and other operating information of the Company. The selected consolidated financial data in the table, except for the exchange rate and market value per share and book value per share, are derived from the consolidated financial statements of the Company. This data should be read in conjunction with the consolidated financial statements, related notes and other financial information included herein.
| Years Ended June 30, | ||||||||||||||||||||
| 2010 | 2009 | 2008 | 2007 | 2006 | ||||||||||||||||
| Financial Data |
||||||||||||||||||||
| Total revenues |
$ | 28,525 | $ | 28,191 | $ | 40,895 | $ | 30,675 | $ | 26,562 | ||||||||||
| Net (loss) income attributable to MPC |
(1,447 | ) | 665 | (8,892 | ) | 447 | 749 | |||||||||||||
| Net (loss) income per share (basic and diluted) attributable to MPC |
(0.03 | ) | 0.02 | (0.21 | ) | 0.01 | 0.03 | |||||||||||||
| Working capital |
35,658 | 37,161 | 37,780 | 29,004 | 24,820 | |||||||||||||||
| Cash provided by operating activities |
3,220 | 9,239 | 5,496 | 15,936 | 9,875 | |||||||||||||||
| Property and equipment (net) |
25,914 | 17,529 | 28,447 | 40,321 | 27,783 | |||||||||||||||
| Total assets |
90,706 | 71,704 | 85,295 | 85,616 | 68,580 | |||||||||||||||
| Long-term liabilities |
10,775 | 11,809 | 14,153 | 13,076 | 8,583 | |||||||||||||||
| Non-controlling interests |
1,914 | — | — | — | — | |||||||||||||||
| Equity: |
||||||||||||||||||||
| Capital |
92,428 | 73,726 | 73,631 | 73,568 | 73,560 | |||||||||||||||
| Accumulated deficit |
(23,640 | ) | (22,193 | ) | (22,858 | ) | (13,966 | ) | (14,413 | ) | ||||||||||
| Accumulated other comprehensive income (loss) |
3,116 | 1,980 | 11,690 | 4,373 | (3,028 | ) | ||||||||||||||
| Total equity attributable to Magellan Petroleum Corporation |
71,904 | 53,513 | 62,463 | 63,975 | 56,119 | |||||||||||||||
| Exchange rate A.$ = U.S. at end of period |
.86 | .80 | .96 | .84 | .73 | |||||||||||||||
| Common stock outstanding shares end of period |
52,336 | 41,500 | 41,500 | 41,500 | 41,500 | |||||||||||||||
| Book value per share |
1.37 | 1.29 | 1.51 | 1.54 | 1.35 | |||||||||||||||
| Quoted market value per share (NASDAQ) |
1.83 | 1.11 | 1.62 | 1.52 | 1.57 | |||||||||||||||
| Operating Data |
||||||||||||||||||||
| Annual production (net of royalties) Gas (bcf) |
2.9 | 5.2 | 5.7 | 5.9 | 5.7 | |||||||||||||||
| Annual production (net of royalties) Oil (bbls) (in thousands) |
139 | 153 | 210 | 179 | 155 | |||||||||||||||
31
Table of Contents
| Item 7. | Management’s Discussion and Analysis of Financial Condition and Results of Operations. |
Forward Looking Statements
Our disclosure and analysis in this report contains forward-looking information that involves risks and uncertainties. Our forward-looking statements express our current expectations or forecasts of possible future results or events, including projections of future performance, statements of management’s plans and objectives, future contracts, and forecasts of trends and other matters. Forward-looking statements speak only as of the date of this filing, and we undertake no obligation to update or revise such statements to reflect new circumstances or unanticipated events as they occur. You can identify these statements by the fact that they do not relate strictly to historic or current facts and often use words such as “anticipate”, “estimate”, “expect”, “believe”, “will likely result”, “outlook”, “project” and other words and expressions of similar meaning. No assurance can be given that the results in any forward-looking statements will be achieved and actual results could be affected by one or more factors, which could cause them to differ materially. For these statements, we claim the protection of the safe harbor for forward-looking statements contained in the Private Securities Litigation Reform Act of 1995.
Among these risks and uncertainties are the ability of MPAL, with the assistance of the Company, to successfully and timely close the Evans Shoal acquisition, the likelihood and timing of the receipt of proceeds from the YEP private placement transaction due to conditions stipulated in the Securities Purchase Agreement, the ability of the Company to successfully develop a strategy for methanol development, pricing and production levels from the properties in which Magellan and MPAL have interests, the extent of the recoverable reserves at those properties, the profitable integration of acquired businesses, including Nautilus Poplar LLC, the future outcome of the negotiations for gas sales contracts for the remaining uncontracted reserves at both the Mereenie and Palm Valley gas fields in the Amadeus Basin, including the likelihood of success of other potential suppliers of gas to the current customers of Mereenie and Palm Valley production. In addition, MPAL has a large number of exploration permits and faces the risk that any wells drilled may fail to encounter hydrocarbons in commercially recoverable quantities. Any forward-looking information provided in this report should be considered with these factors in mind. Magellan assumes no obligation to update any forward-looking statements contained in this report, whether as a result of new information, future events or otherwise.
Executive Summary
Overview
MPC is engaged in the sale of oil and gas resulting from the exploration for and development of oil and gas reserves. Magellan’s most significant assets are its 100% equity ownership interest in MPAL and its 83.7% interest, through its ownership of Nautilus and directly, Poplar LLC in all zones surface to deep at the Poplar Dome fields, Roosevelt Co., Montana. MPAL also has signed an agreement to acquire a 40% equity interest in the Evans Shoal gas field, offshore Northern Territory, Australia. Magellan and MPAL also hold various override and working interest holdings elsewhere in the United Kingdom and in Canada.
Mission and Strategy
Magellan’s mission is to provide substantial growth and long-term value to stockholders by acquiring, developing and producing oil and natural gas resources using the following strategies to achieve this mission:
| • | acquire and develop discovered, but “under-exploited” natural gas and oil reserves |
| • | maintain a strong balance sheet and financial flexibility. |
The Company has assembled a management team with over 100 man years of large oil-company experience to accomplish this mission. In 2009, Magellan added two assets to its portfolio; Poplar Oil Fields in Montana with CO2 tertiary recovery potential and a contract to purchase a 40% interest in the Evans Shoal Natural Gas Field in offshore Darwin, Australia that may ultimately be developed into a world class Methanol project. These “under exploited” assets will provide the foundation of the Company and lead earnings and create opportunities for future growth through acquisitions and development of neighboring fields.
32
Table of Contents
The success of these strategies are shaped by emerging trends in the global energy industry that will have long term effects on the value of Magellan’s business model:
| • | The recognition of the need for alternative fuels, especially in high growth population centers in Asia, has significant impact on the Methanol market as a fuel blending alternative. Methanol is cost effective and a clean fuel oxygenate, essential to the monetization of stranded gas assets in proximity to Asia’s growing demand centers. |
| • | The global commitment to reducing carbon emissions has led to increased carbon capture technology that can be deployed to capture and sequestrate carbon emissions in oil reservoirs. |
| • | As the discussions of resources scarcity and social responsibility progresses, it will be essential for oil and gas companies to find innovative ways to develop new resources in an economic and environmentally conscience manner. |
The team at Magellan is dedicated to understanding these trends as well as capitalizing on its extensive experience, innovative approach to problem solving, and determination to successfully grow a unique oil and gas company moving in a new direction.
Overview of our FY 2010 Financial Results
Magellan realized a 44% decrease in gas sales volume this fiscal year due to the term end of the Mereenie Sales Agreement resulting in year end June 30, 2010 gas sales of $13.6 million (net of royalties) or 48% of total revenues for the year ended June 30, 2010 and was offset by a 43% increase in the average price per mcf.
Magellan also saw a 36% decrease in oil sales volume due to the sale of Cooper Basin assets and a 9% decrease in average price per barrel partially offset by the purchase of Nautilus Poplar and the Poplar Oil Fields resulting in $2.6 million of total $9.9 million in oil sales.
For the year, Magellan recorded a net loss of $1.4 million on total revenues of $28.5 million. The following items impacted our 2010 earnings and cash flow as compared to 2009:
| • | Gas sales decreased to $13.6 million due to the term end of the Mereenie Sales Agreement |
| • | Cooper Basin Asset Sale resulted in a $1.6 million loss in oil revenues for the fiscal year. |
| • | Poplar Fields Acquisition resulted in $2.6 million in additional oil sales |
| • | Non-cash items included in the Statements of Operations included; $4.3million in warrant expense, $1.4 million in Employee stock compensation, $508,000 of Director Stock compensation, $400,000 of non-employee Stock compensation |
The net loss in fiscal year 2010 income was largely the result of the term end of the Mereenie Sales Agreement. Moving forward, Magellan is looking to develop the Poplar Fields and, after MPAL completes its planned acquisition of a 40% interest, the Evans Shoal Gas Field to increase cash flows and provide significant growth opportunities to shareholders. Magellan will incur significant capital obligations for Poplar development and the remainder of the Evans Shoal acquisition and development. The Company intends to raise the capital requirements through equity financing in the near term, to include the Securities Purchase Agreement with its largest stockholder, Young Energy Prize S.A. (“YEP”), executed on August 5, 2010. The placement involves the issuance and sale of up to 5.2 million new shares of the Company’s common stock to YEP and/or one or more of its affiliates in return for $3.00 per new share issued and sold. YEP’s share price for this transaction is indicative of our largest stockholder’s confidence in the pending Evans Shoal acquisition and our other projects, as the Company continues to build substantial stockholder value.
33
Table of Contents
Operational Results
Australia
MPC’s Australia production volumes, net of royalties, were 2.9 BCF of gas and 97,000 Bbls of Oil for year ended June 30, 2010 or 56% of total gas production and 63% of total oil production for the year ended June 30, 2009.
Mereenie: Natural gas takes at Mereenie were significantly reduced in the third and fourth fiscal quarters. Under the provisions of the MSA4 Sales Agreement, given the low take levels, the Mereenie Producers advised PWC that pursuant to the terms of the Agreement, Mereenie Producer obligations to PWC under the current MSA4 Agreement ceased effective on September 5, 2010. Significant remaining gas reserves, not yet committed to market, are seen as a viable fuel gas option in the construction of a large, new Methanol complex in Darwin using Evans Shoal feed gas.
Palm Valley: The Palm Valley Darwin gas sales contract expires in the year 2012. The Palm Valley local sales contract expires in January 2012. The Company is making strong efforts to dedicate remaining natural gas to area buyers under “life of remaining reserves” agreement(s).
Evans Shoal (NT/P48): Magellan agreed to purchase a significant interest in an already discovered, Evans Shoal natural gas field, offshore Australia. On March 25, 2010, MPAL executed an agreement with Santos to purchase Santos’ 40% interest in the Evans Shoal natural gas field (NT/P48), located in the Bonaparte Basin offshore Northern Australia. Under the agreement, Magellan paid a deposit of AU$15 million and is obligated to pay Santos time-staged cash consideration equal to AUS $100 million for its interest in Evans Shoal. Magellan is also required to pay additional contingent payments to Santos of AUS $50 million upon a favorable partner vote on any final investment decision to develop Evans Shoal and AUS $50 million upon first stabilized gas production from NT/P 48. Closing and completion of the purchase is expected to occur in December 2010.
NT09-1: In March, Magellan accepted an offer from the Commonwealth — Northern Territory Offshore Petroleum Joint Authority for the grant of an exploration permit for petroleum over Area NT09-1 offshore Northern Territory. The area is located 220 kilometers (137 miles) northwest of Darwin. The permit covers 6,305 square kilometers (2,434 square miles). It is seen as a good fit with Magellan’s stated gas development strategy. We believe an important structural closure exists within this license area and are anxious to initiate a technical work program to study the area’s potential. Commercially, any gas that can be found in NT09-1 will yield incremental economics for development through Evans Shoal and will offset our neighbors at Caldita to the north.
Montana
MPC’s Poplar Fields oil production for this fiscal year was 36,553 Bbls net to Magellan at an average price of $67.88/Bbl for year ended June 30, 2010.
Poplar Fields: On October 15, 2009, the Company acquired an 83.5% controlling interest in Nautilus. Nautilus, based in Denver, Colorado, owns and operates oil development assets in Roosevelt County, Montana known as the East Poplar Unit and the Northwest Poplar Field. On March 15, 2010, Magellan consolidated interests at the Poplar Fields by purchasing Hunter Energy’s 25.05% average working interests and an additional 1.25% of Nautilus Technical Group’s working interest. Magellan, itself and through its subsidiaries, now owns an 83.7% average working interest there.
Magellan has begun work with an intermediary to farm-out a share of our 23,000 acres Bakken position within the Poplar Fields.
34
Table of Contents
Magellan, through Nautilus, will drill at least two targeted development wells (in the fall of 2010) to test wettability development strategies for the Tyler and Nisku oil formations. The Company will gain benefit from these wells by testing all of the producing formations on the way to the deeper Nisku formation for reservoir quality, producing capacity given new drilling technology, and for other pertinent reservoir data.
We will also conclude Single Well Tracer tests for residual oil saturation within the Mississippian Charles formation(s). This will allow us to determine the applicability of tertiary oil recovery strategies — including, but not limited to, carbon dioxide flooding. Furthermore, we will initiate work on a shallow natural gas development program involving a large industrial buyer wishing to restart operations in Canada.
United Kingdom
After significant weather delays in the winter of 2010 and ongoing discussions with Northern Petroleum, the Operator of the Markwells Wood and Havant wells, onshore Weald Basin, UK, these wells are expected to spud in the fall of 2010. While site preparation had been completed, projected drilling costs were higher than anticipated. Active discussions and focused work by the Operator, Northern Petroleum, yielded a cost that all parties found acceptable and the wells are planned to proceed. Markwells Wood is a promising offset location to the adjacent producing Horndean oil field. While there remains reservoir risk with the project, we are optimistic that surface proceedings have been concluded to all interested parties satisfaction with the well spud to occur as soon as is practical. Although this drilling program is not core to the Company’s long-term strategy, it is important that these wells are finally drilled to the satisfaction of all parties involved.
Magellan has a gross 240,000 acre Weald Basin position in Southern England, U.K., is a newer, less mature shale play, where Magellan is a 50% partner with Celtique Energie. The Weald Basin shale play is unexplored and is based on the Lower Jurassic (Liassic) shale which lies in both the oil and gas window. There are currently no producing wells in the license area; however, with the recent developments in shale development technology, coupled with the Basin’s proximity to UK and NW European oil and gas markets and infrastructure, these licenses are an attractive opportunity for near term development. The Company’s goal is to establish near-term monetization and strategic drilling programs for UK shale acreage.
Critical Accounting Estimates
Oil and Gas Properties
The Company follows the successful efforts method of accounting for its oil and gas operations. Under this method, the costs of successful wells, development dry holes, productive leases, and permit and concession costs are capitalized and amortized on a units-of-production basis over the life of the related reserves. Cost centers for amortization purposes are determined on a field-by-field basis. The Company records its proportionate share in joint venture operations in the respective classifications of assets, liabilities and expenses. Unproved properties with significant acquisition costs are periodically assessed for impairment in value, with any impairment charged to expense. The successful efforts method also imposes limitations on the carrying or book value of proved oil and gas properties. Oil and gas properties are reviewed for impairment whenever events or changes in circumstances indicate that the carrying amounts may not be recoverable. In general, analyses are based on proved developed reserves, except in circumstances where it is probable that additional resources will be developed and contribute to cash flows in the future. For Palm Valley, reserves were based upon the quantities of gas committed to the contract and estimated sales subsequent to the contract date. If such contracts are extended, the proved developed reserves will be increased to the lesser of the actual proved developed reserves and risk adjusted probable and possible reserves or the contracted quantities.
Exploratory drilling costs are initially capitalized pending determination of proved reserves but are charged to expense if no proved reserves are found. Other exploration costs, including geological and geophysical expenses, leasehold expiration costs and delay rentals, are expensed as incurred. Because the Company follows
35
Table of Contents
the successful efforts method of accounting, the results of operations may vary materially from quarter to quarter. An active exploration program may result in greater exploration and dry hole costs.
Historically, we have adjusted our depletion rates during the year when new reserve information is available. For the year ended June 30, 2010, we adopted the new SEC accounting and disclosure regulations for oil and gas companies effective June 30, 2010. The change in price encompassed in the new SEC rules is a change in accounting principle inseparable from a change in estimate for 2009 and will be accounted for prospectively. The price used under the new rules is a 12 month average price on the first day of the month for the 12 month reporting period. The price used in prior periods was the price on the last day of the reporting period. There was no measurable difference in the two prices and as such there was no material dollar impact caused by the change.
Nondepletable assets
At June 30, 2010 and 2009 oil and gas properties include $4.3 million and $6.6 million respectively, of capitalized costs that are currently not being depleted. Components of these costs are as follows:
| Nondepletable capitalized costs |
2010 | 2009 | ||||||
| PEL 106 – Cooper Basin (1) |
||||||||
| Balance beginning of year |
$ | 1,552,838 | $ | 1,855,186 | ||||
| Additions to capitalized costs |
— | — | ||||||
| Assets sold or held for sale |
(1,552,838 | ) | ||||||
| Exchange adjustment |
— | (302,348 | ) | |||||
| Balance end of year |
$ | — | $ | 1,552,838 | ||||
| Weald/Wessex Basin U.K. (2) |
||||||||
| Balance beginning of year |
$ | 983,548 | $ | 549,935 | ||||
| Additions to capitalized costs |
608,479 | 485,725 | ||||||
| Exchange adjustment |
45,571 | (52,112 | ) | |||||
| Balance end of year |
$ | 1,637,598 | $ | 983,548 | ||||
| Poplar Field (2) |
||||||||
| Balance beginning of year |
$ | — | $ | — | ||||
| Additions to capitalized costs |
313,710 | — | ||||||
| Reclassified to producing properties |
— | — | ||||||
| Balance end of year |
$ | 313,710 | $ | — | ||||
| Exploration permits and licenses – Australia and U.K. (3) |
||||||||
| Balance beginning of year |
$ | 4,104,491 | $ | 4,425,749 | ||||
| Assets sold or held for sale |
(1,518,665 | ) | ||||||
| Charged to expense |
(231,798 | ) | (321,258 | ) | ||||
| Balance end of year |
$ | 2,354,028 | $ | 4,104,491 | ||||
| Total |
||||||||
| Balance beginning of year |
$ | 6,640,877 | $ | 6,830,870 | ||||
| Additions to capitalized costs |
922,189 | 485,725 | ||||||
| Assets sold or held for sale |
(3,071,503 | ) | — | |||||
| Reclassified to producing properties |
— | — | ||||||
| Charged to expense (3) |
(231,798 | ) | (321,258 | ) | ||||
| Exchange adjustment |
45,571 | (354,460 | ) | |||||
| Balance end of year |
$ | 4,305,336 | $ | 6,640,877 | ||||
36
Table of Contents
| (1) | During the year ended June 30, 2010, Cooper Basin assets were sold. Prior costs were capitalized during the year ended June 30, 2006 and remained capitalized through the date of the sale, because the related well had sufficient quantity of reserves to justify its completion as a producing well. |
| (2) | Capitalized exploratory well costs pending discovery of reserves. |
| (3) | The Company evaluates exploration permits and licenses annually or whenever events or changes in circumstances indicate that the carrying value, related to step up to fair value for the 44.87% remaining interest of MPAL acquired in 2006, may be impaired. |
Goodwill
As of June 30, 2010, we have $4,695,206 of goodwill of which $674,500 is attributable to the October 15, 2009 acquisition of Nautilus. We have determined the annual impairment testing date to be October 1 for Nautilus.
$4,020,706 of our goodwill is related to the fiscal 2006 acquisition of the 44.87% of MPAL that we did not own at the time. Goodwill is not amortized and is tested for impairment annually or whenever events or changes in circumstances indicate that the carrying value may be impaired. We perform our annual impairment testing as of June 30 on this goodwill. We employ the adjusted balance sheet method to estimate the fair value of MPAL. This method entails estimating the fair value of all of MPAL’s balance sheet items as of the valuation date. If the adjusted equity value, after considering the fair values of the assets and liabilities, is greater than the carrying value of MPAL, then no impairment is indicated. As of June 30, 2010, no impairment existed as the adjusted fair value exceeded the carrying value by 19%.
The fair value of our oil and gas properties are estimated based on the discounted cash flows of our proved and risk adjusted probable and possible reserves. The significant assumptions used in estimating the fair values of the oil and gas properties are oil and gas selling prices for non-contracted volumes, oil and gas sales volumes, discount rates, and production trends. The fair value of MPAL is most susceptible to changes in selling prices of oil and gas and changes in estimated sales volume.
The fair value of our nondepletable exploration permits and licenses is estimated separately using one of four methods — discounted cash flows; discounted cash flows adjusted for chances of success, recent farmin costs and premiums, and estimated costs of committed work programs. The majority of the permits and licenses are valued based on the estimated cost of agreed work program commitments, which is a methodology that is not dependent on significant assumptions.
Asset Retirement Obligations
Legal obligations associated with the retirement of long-lived assets to be recognized at their fair value at the time that the obligations are incurred. Upon initial recognition of a liability, that cost is capitalized as part of the related long-lived asset (oil & gas properties) and amortized on a units-of-production basis over the life of the related reserves. Accretion expense in connection with the discounted liability is recognized over the remaining life of the related reserves.
The estimated liability is based on the future estimated cost of land reclamation, plugging the existing oil and gas wells and removing the surface facilities equipment in our operating fields. The liability is a discounted liability using a credit-adjusted risk-free rate on the date such liabilities are determined. Revisions to the liability could occur due to changes in the estimates or timing of these costs, acquisition of additional properties and as new wells are drilled.
Estimates of future asset retirement obligations include significant management judgment and are based on projected future retirement costs. Judgments are based upon such things as field life and estimated costs. Such costs could differ significantly when they are incurred.
37
Table of Contents
Income Taxes
The Company follows the liability method in accounting for income taxes. Under this method, deferred tax assets and liabilities are determined based on differences between the financial reporting and tax bases of assets and liabilities and are measured using the enacted tax rates and laws that will be in effect when the differences are expected to reverse. The Company records a valuation allowance for deferred tax assets when it is more likely than not that such assets will not be recovered.
The Company evaluates uncertain tax positions, which requires significant judgments and estimates regarding the recoverability of deferred tax assets, the likelihood of the outcome of examinations of tax positions that may or may not be currently under review and potential scenarios involving settlements of such matters. Changes in these estimates could materially impact the consolidated financial statements. There are no significant uncertain tax positions for fiscal 2010 and 2009.
Business combinations
The Company applies the acquisition method of recording business combinations. Under this method, the Company recognizes and measures the fair value of identifiable assets acquired, the liabilities assumed and any non-controlling interest in the acquiree. Any goodwill or gain is identified and recorded. We engaged an independent valuation consultant to assist us in determining the fair values of crude oil and natural gas properties acquired, and other third-party consultants as needed to assist us in assessing the fair value of other assets and liabilities assumed. This valuation requires management to make significant estimates and assumptions, especially with respect to the oil and gas properties.
Liquidity and Capital Resources
At June 30, 2010, the Company on a consolidated basis had approximately $33.6 million of cash and cash equivalents. The Company considers cash equivalents to be short term, highly liquid investments that are both readily convertible to known amounts of cash and so near their maturity that they present insignificant risk of changes in value because of change in interest rates. Cash balances were $18.0 million as of June 30, 2010 and the remaining $15.6 million was held in time deposit accounts in several Australian banks that have terms of 90 days or less. National Australia Bank, Ltd. (“NAB”) holds 48% of the cash and cash equivalent balance.
Consolidated
When considering our liquidity and capital resources, we consider cash and cash equivalents and marketable securities together since all of these amounts are available to fund operating, exploration and development activities. The balance of cash and cash equivalents and marketable securities decreased $2.1 million during the year ended June 30, 2010 compared to a $637,000 decrease in those balances during the year ended June 30, 2009.
The factors favorably impacting our liquidity and capital resources during the year ended June 30, 2010 included:
| • | cash provided by operating activities of $3.2 million |
| • | proceeds of $10.0 million from the issuance of stock, net proceeds of $2.4 million from the sale of securities available for sale |
| • | proceeds of $7.3 million from the sale of the Aldinga and Nockatunga oil fields and certain exploration licenses in the Cooper Basin (see Note 9) |
38
Table of Contents
| • | proceeds of approximately $465,000 from the sale of a subsidiary |
| • | debt borrowings of $570,000 |
| • | effect of exchange rate changes on cash and cash equivalents of $2.6 million |
Factors contributing to a decrease in our liquidity and capital resources during the year ended June 30, 2010 included:
| • | $7.3 million expended to acquire an approximately 83.5% controlling interest in Nautilus Poplar (see Note 11) |
| • | $4.1 million expended to acquire a 25.05% average working interest in Montana fields (see Note 11) |
| • | principal payments of $845,000 on debt |
| • | $2.3 million expended for property and equipment |
| • | $13.8 million deposit made for the purchase of 40% interest in the Evans Shoal natural gas field (see Note 10) |
Cash provided by operating activities for the year ended June 30, 2010 decreased $6.0 million from the year ended June 30, 2009 as discussed below:
Cash from revenues increased approximately $1.8 million over the prior year.
Australian oil and gas sales volume decreased resulting from the sale of Cooper Basin, natural declines and significantly reduced sales to PWC were bolstered by oil sales volumes from Nautilus Poplar. Gas sales benefited from a 43% net increase in price per mcf while oil sales were unfavorably affected by a 10% net decrease in price per barrel in Australia. In addition, accounts receivable decreased due to reduced billings at June 30, 2010 relating to the cessation of Mereenie gas sales to PWC in mid/late February, 2010 creating a net increase in collections over the prior year. Cash from revenues also benefited from an 18% increase in the average exchange rate.
Operating cash outflows increased approximately $7.2 million over the prior year due to the following:
| • | $3.5 million pay down of accounts payable |
| • | increased production expenditures due primarily to the Nautilus ($1,400,000) and Poplar Field working interest ($158,000) acquisitions |
| • | $883,000 employee termination costs in fiscal year 2010 |
| • | increased salaries of $669,000 relating to additional executive employees at MPC and additional employees from the acquisition of Nautilus |
| • | increased auditing, accounting and legal services of $256,000 relating to the February 2009 securities purchase agreement with YEP and the acquisition of Nautilus |
| • | the payment of $440,000 in closing costs relating to the July 2009 closing of the YEP investment transaction, |
| • | increased travel expenses of $308,000 |
| • | increased director fees of $250,000 related to the addition of three new directors |
| • | increased consulting costs of $725,000 |
| • | An 18% increase in the average exchange rate. |
Our cash position was unfavorably affected, when compared to the same period in the prior year by the decrease of exchange rate changes on cash and cash equivalents of $1.2 million resulting from a weakened Australian dollar and an approximately $460,000 foreign exchange transaction loss.
39
Table of Contents
The Company invested $2.8 million and $2.9 million in oil and gas exploration activities, which includes additions to property and equipment, during years ended June 30, 2010 and 2009, respectively.
Effect of exchange rate changes
The value of the Australian dollar relative to the U.S. dollar increased 7.5% to $0.86 at June 30, 2010 compared to a value of $0.80 at June 30, 2009.
As to MPC
On March 7, 2010, MPAL loaned $4 million to MPC. On June 17, 2009, MPAL loaned $2.4 million to MPC.
On February 18, 2010, MPC extended credit of $1 million to Nautilus. As of June 30, 2010, Nautilus has borrowed $475,000.
On July 9, 2009, MPC completed, pursuant to the terms of a definitive purchase agreement and related amendments, an equity investment in MPC by MPC’s strategic investor, YEP, through the issuance to YEP of 8,695,652 shares of the Company’s common stock, $0.01 par value per share and warrants to acquire an additional 4,347,826 shares of Common Stock. The Company received gross proceeds of $10 million, which are being used for acquisitions, working capital and general corporate purposes.
At June 30, 2010 MPC, on an unconsolidated basis, had working capital of $10.5 million. Working capital is comprised of current assets less current liabilities. MPC’s current cash position and any future MPAL dividends will be adequate to meet MPC’s current obligations for the 2011 fiscal year, other than those obligations related to the Evans Shoal agreement, discussed below.
On October 15, 2009, MPC paid $7.3 million in cash for a controlling interest in Nautilus Poplar, LLC. See Note 11 to the consolidated financial statements.
In Montana, the Company has completed a consolidation of interest in the East Poplar Unit and Northwest Poplar Fields, in Roosevelt County Montana. On March 9, 2010, the Company entered into a purchase and sale agreement with Hunter Energy LLC, under which the Company purchased Hunters 25.05% average working interest in those Montana fields, for $3.9 million. In a separate transaction the Company also purchased a 1.25% interest in the same fields for from a different owner, for $240,000. See Note 11 to the consolidated financial statements.
As to MPAL
At June 30, 2010 MPAL had working capital of $25.0 million and has budgeted approximately (AUS) $7.8 million for specific exploration projects in fiscal year 2011 as compared to the (AUS) $1.8 million expended during the year ended June 30, 2010. The current composition of MPAL’s oil and gas reserves are such that MPAL’s future revenues in the long-term are expected to be derived from the sale of oil and gas in Australia. MPAL’s current contract for the sale of Palm Valley gas will expire during fiscal year 2012. Mereenie contracts expired in January and June 2009. Supply obligations ceased in June 2009, however, there is a reasonable endeavor obligation to supply certain of PWC’s requirements through to September 5, 2010 under the provisions of the Mereenie sales Agreement No. 4 (MSA 4). These sales took place into mid/late February, 2010 at which point volumes from the Blacktip field, PWC’s other gas supplier, began to flow in earnest. PWC’s most recent advisory to the Mereenie Producers (Magellan and Santos) states that Mereenie gas was no longer required. Under the provisions of that same MSA4 Sales Agreement, the Mereenie Producers advised PWC that pursuant to the terms of the Agreement, Mereenie Producer obligations to PWC under the current MSA4 Agreement
40
Table of Contents
ceased effective on September 5, 2010. Unless MPAL is able to sell uncontracted gas, including reasonable endeavors gas not taken by PWC or are successful in its current exploration program, its revenues will continue to be substantially reduced, which will materially affect liquidity. The price of gas under the Palm Valley and Mereenie gas contracts is adjusted quarterly to reflect changes in the Australian Consumer Price Index. Future oil revenues will be impacted by any volatility in the world price for crude oil. MPAL will strive to optimize operating expenses with any reductions in revenues.
As previously discussed, on March 25, 2010, MPAL executed an agreement with Santos Limited (Santos) to purchase Santos’ 40% interest in the Evans Shoal natural gas field (NT/P48), located in the Bonaparte Basin offshore Northern Australia. Under the agreement, Magellan is obligated to pay Santos time-staged cash consideration equal to (AUS) $100 million ) for its interest in Evans Shoal on or before December 25, 2010. Magellan would also pay additional contingent payments to Santos of (AUS) $50 million upon a favorable partner vote on any final investment decision to develop Evans Shoal and (AUS) $50 million upon first stabilized gas production from NT/P 48. Closing and completion of the purchase is subject to regulatory and other approvals and is expected to occur in December 2010. Based on its available cash on hand, and the expected liquidity to be generated from the Company’s Australian and U.S. operations during the remainder of 2010, the Company will need to raise additional debt or equity financing from third parties. The Company is currently working towards new equity financing options to raise sufficient funds to complete the Evans Shoal acquisition and its other requirements for capital resources over the next 12 month period, which are estimated to be approximately (AUS) $85 million. In the event the Company is unable to make the required payment on or before December 25, 2010, under certain circumstances, the Company would forfeit its (AUS) $15 million deposit.
As in the past, MPAL expects to fund its exploration costs other than Evans Shoal through its cash and cash equivalents and cash flow from Australian operations. MPAL also expects that it will continue to seek partners to share its exploration costs. If MPAL’s efforts to find partners are unsuccessful, it may be unable or unwilling to complete the exploration program for some of its properties.
As to Nautilus
On February 18, 2010, MPC extended credit of $1 million to Nautilus. As of June 30, 2010, Nautilus has borrowed $475,000.
At June 30, 2010, Nautilus had working capital of ($342,000). Working capital is comprised of current assets less current liabilities.
At June 30, 2010 Nautilus has debt comprising a note payable of $660,220 and short term borrowings of $470,000 on a letter of credit (LOC), both issued by a bank.
In addition to other projects, Nautilus will begin work with an intermediary to farm-out a share of its 23,000 acres Bakken position within the fields. There has been strong external interest in a farm-in program. This work is now ongoing and we expect to report results within three months.
The Company will also drill at least two targeted development wells (during the fall of 2010) to test wettability development strategies for the Tyler and Nisku oil formations. We will also gain benefit from these wells by testing all of the producing formations on the way to the deeper Nisku formation for reservoir quality, producing capacity given new drilling technology, and for other pertinent reservoir properties.
Funding for these projects will primarily come from bank financing.
41
Table of Contents
Off Balance Sheet Arrangements
None
Contractual Obligations
The following is a summary of our consolidated contractual obligations at June 30, 2010, in thousands:
| PAYMENTS DUE BY PERIOD | |||||||||||||||
| TOTAL | LESS THAN 1 YEAR |
1-3 YEARS | 3-5 YEARS | MORE THAN 5 YEARS | |||||||||||
| Operating lease obligations |
$ | 1,236 | $ | 437 | $ | 494 | $ | 143 | $ | 162 | |||||
| Purchase obligations (1) |
5,856 | 4,016 | 1,840 | — | — | ||||||||||
| Asset retirement obligations-undiscounted (2) |
19,739 | — | 1,529 | 289 | 17,921 | ||||||||||
| Time staged and contingent payments (3) |
77,350 | 77,350 | — | — | — | ||||||||||
| Credit facilities including interest (4) |
1,231 | 987 | 244 | — | — | ||||||||||
| Total |
$ | 105,412 | $ | 82,790 | $ | 4,107 | $ | 432 | $ | 18,083 | |||||
| (1) | Represents firm commitments for exploration and capital expenditures. Although the Company is committed to these expenditures, some may be farmed out to third parties. Exploration contingent expenditures of $22,280,000 which are not legally binding have been excluded from the table above and based on exploration decisions would be due as follows: $0 (less than 1 year), $0 (1-3 years), $21,850,000 (3-5 years), $430,000 (greater than 5 years). This figure is approximately a net $1 million decrease over prior quarters reporting. |
| (2) | During the years ended June 30, 2009 and 2010, the Company decreased total asset retirement obligations by $626,000 and $2,232,000 respectively, due to changes in cost estimates and expected restoration dates (see Note 4 to the consolidated financial statements). |
| (3) | Relates to the Evans Shoal agreement. As the Company progresses through the different stages of this agreement, two additional contingent payments will be due of $45,500,000 in December of 2012 and 2015 (see Note 10 to the consolidated financial statements). |
| (4) | Includes interest at a 6.5% based on the rate at June 30, 2010. |
Recent Accounting Pronouncements
On December 31, 2008, the Securities and Exchange Commission (“SEC”) published the final rules and interpretations updating its oil and gas reporting requirements. Many of the revisions are updates to definitions in the existing oil and gas rules to make them consistent with the petroleum resource management system, which is a widely accepted standard for the management of petroleum resources that was developed by several industry organizations. Key revisions include changes to the pricing used to estimate reserves, the ability to include nontraditional resources in reserves, the use of new technology for determining reserves, and permitting disclosure of probable and possible reserves. The SEC will require companies to comply with the amended disclosure requirements for annual reports for fiscal years ending on or after December 15, 2009. The SEC’s new rules are effective for the Company for the fiscal year ended June 30, 2010.
In January 2010, the Financial Accounting Standards Board (“FASB”) issued Accounting Standards Update (ASU) 2010-03, Extractive Activities Oil and Gas (Topic 932) — Oil and Gas Reserve Estimation and Disclosures, and in April 2010 issued ASU 2010-14, Accounting for extractive activities — Oil and Gas —Amendments to paragraph 932-10-599-1, to align the oil and gas reserve estimation and disclosure requirements of FASB ASC Topic 932, Extractive Activities — Oil and Gas, with the requirements in the SEC’s new oil and gas reporting requirements. The ASU is effective for the Company for the fiscal year ended June 30, 2010.
42
Table of Contents
Results of Operations
2010 vs. 2009
REVENUES AND INVESTMENT INCOME
Changes in revenues are as follows:
| Twelve Months ended June 30, |
|||||||||||||
| 2010 | 2009 | $ Variance | % Variance | ||||||||||
| Oil sales |
$ | 9,886,592 | $ | 11,479,660 | $ | (1,593,068 | ) | (14 | %) | ||||
| Gas sales |
13,615,755 | 14,740,296 | (1,124,541 | ) | (8 | %) | |||||||
| Other production related revenues |
5,022,210 | 1,970,621 | 3,051,589 | 155 | % | ||||||||
| Investment and other income |
3,012,831 | 1,583,065 | 1,429,766 | 90 | % | ||||||||
Significant changes are discussed below.
OIL SALES DECREASED in Australia due to a 36% decrease in volume due to the sale of the Cooper Basin assets and a 10% decrease in average price per barrel partially offset by the U.S. purchase of a controlling member interest in Nautilus Poplar, LLC and an 18% increase in the average exchange rate discussed below. Oil unit sales (after deducting royalties) in barrels (bbls) and the average price per barrel sold during the periods indicated were as follows:
| TWELVE MONTHS ENDED JUNE 30, | ||||||||||||||
| 2010 SALES | 2009 SALES | |||||||||||||
| BBLS | AVERAGE PRICE A.$ PER BBL |
BBLS | AVERAGE PRICE A.$ PER BBL |
% Variance BBLS |
% Variance A.$ PER BBL |
|||||||||
| Australia: |
||||||||||||||
| Mereenie field |
68,344 | 85.50 | 90,267 | 94.20 | (24 | %) | (9 | %) | ||||||
| Cooper Basin |
1,086 | 83.62 | 2,362 | 101.42 | (54 | %) | (18 | %) | ||||||
| Nockatunga project (1) |
27,962 | 73.92 | 60,668 | 86.30 | (54 | %) | (14 | %) | ||||||
| Total |
97,392 | 153,297 | (36 | %) | (10 | %) | ||||||||
| BBLS | AVERAGE PRICE U.S.$ PER BBL |
BBLS | AVERAGE PRICE U.S.$ PER BBL |
% Variance BBLS |
% Variance U.S.$ PER BBL |
|||||||||
| United States: |
||||||||||||||
| Poplar Fields (1) |
42,017 | 67.88 | — | — | 100 | % | 100 | % | ||||||
| (1) | Nockatunga and Poplar average price per bbl is net of crude oil transportation costs which are deducted from the gross sales price. |
Amounts presented above for oil prices and below for gas prices in Australia are in Australian dollars to show a more meaningful trend of underlying operations. For the fiscal years ended June 30, 2010 and 2009, the average foreign exchange rates were .8826 and .7471 respectively.
GAS SALES DECREASED due to a 44% decrease in volume resulting from natural field decline and significantly reduced sales to PWC. PWC’s most recent advisory to the Mereenie Producers (Magellan and Santos) states that Mereenie gas is no longer required, other than the reasonable endeavors obligation under the MSA No. 4 agreement to supply certain of PWC’s requirements on request through September 5, 2010. For further information, see “Gas Supply Contracts” in Item 1-Business and Item 7-Executive Summary, the decrease
43
Table of Contents
is partially offset by the 18% increase in the average exchange rate discussed below and by a 43% increase in the average price per mcf. The volumes in billion cubic feet (bcf) (after deducting royalties) and the average price of gas per thousand cubic feet (mcf) sold during the periods indicated were as follows:
| TWELVE MONTHS ENDED JUNE 30, | ||||||||||||||
| 2010 SALES | 2009 SALES | |||||||||||||
| BCF | AVERAGE PRICE A.$ PER MCF |
BCF | AVERAGE PRICE A.$ PER MCF |
% Variance BCF |
% Variance A.$ PER MCF |
|||||||||
| Australia: Palm Valley |
1.166 | 2.25 | 1.165 | 2.25 | (17 | %) | 0 | % | ||||||
| Australia: Mereenie |
2.264 | 6.53 | 3.996 | 3.93 | (51 | %) | 66 | % | ||||||
| Total |
3.430 | 5.07 | 5.161 | 3.54 | (44 | %) | 43 | % | ||||||
OTHER PRODUCTION RELATED REVENUES are primarily MPAL’s share of gas pipeline tariff revenues which increased as a result of an increase in Amadeus Gas Trust revenues on Blacktip Gas, MPAL’s portion of a PWC contract settlement, and the 18% increase in the average exchange rate.
INVESTMENT AND OTHER INCOME increased primarily due to the MEO investment gain.
COSTS AND EXPENSES
Changes in costs and expenses were as follows:
| Twelve Months Ended June 30, |
|||||||||||
| 2010 | 2009 | $ Variance | % Variance | ||||||||
| Production costs |
10,116,320 | 8,153,263 | 1,963,057 | 24 | % | ||||||
| Exploration and dry hole costs |
1,273,268 | 3,475,937 | (2,202,669 | ) | (63 | %) | |||||
| Salaries and employee benefits |
4,816,350 | 1,708,997 | 3,107,353 | 182 | % | ||||||
| Depletion, depreciation and amortization |
4,680,240 | 6,785,952 | (2,105,712 | ) | (31 | %) | |||||
| Auditing, accounting and legal services |
1,947,901 | 1,576,509 | 371,392 | 24 | % | ||||||
| Accretion expense |
748,209 | 531,405 | 216,804 | 41 | % | ||||||
| (Gain) Loss on sale of assets |
(6,817,304 | ) | 12,072 | (6,829,376 | ) | (56,572 | %) | ||||
| Impairment loss |
2,049,616 | 63,740 | 1,985,876 | 3,116 | % | ||||||
| Other administrative expenses |
6,707,184 | 3,969,658 | 2,737,526 | 69 | % | ||||||
| Warrant Expense |
4,276,471 | — | 4,276,471 | * | |||||||
| Income tax provision |
2,645,763 | 2,198,422 | 447,341 | 20 | % | ||||||
| * | Not meaningful |
Significant changes are discussed below.
PRODUCTION COSTS INCREASED due primarily to the acquisition of a controlling member interest in the Poplar Fields ($1,500,000) along with the 18% increase in the average exchange rate described below partially offset by the sale of the Cooper Basin assets (see Note 9 to the Consolidated Financial Statements).
EXPLORATION AND DRY HOLE COSTS DECREASED primarily due to prior year’s cost of ($300,000) related to the write down of the value of U.K. exploration licenses, seismic survey costs related to the Nockatunga fields ($1.6 million), and the sale of Cooper Basin assets (see Note 9 to the consolidated financial statements). These costs are partially offset by the 18% increase in the average exchange rate described below.
SALARIES AND EMPLOYEE BENEFITS INCREASED mostly due to the payment of employee termination costs ($883,000) at MPAL, non cash expense related to awarded of employee stock options ($1,400,000), the addition of new personnel at MPC ($338,000), the Nautilus acquisition ($331,000) and the 18% increase in the average exchange rate.
44
Table of Contents
DEPLETION, DEPRECIATION AND AMORTIZATION DECREASED due to lower depletable costs related to the Cooper Basin assets sales (see Note 9 to the consolidated financial statements), partially offset by the 18% increase in the average exchange rate described below and the acquisition of Nautilus ($448,000).
AUDITING, ACCOUNTING AND LEGAL SERVICES INCREASED due mostly to legal and accounting costs associated with the Nautilus acquisition, consulting fees related to the Evans Shoal transaction, and the 18% increase in the average exchange rate discussed below.
ACCRETION EXPENSE INCREASED due mostly to the controlling member interest in the Poplar Fields ($70,000) along with the 18% increase in the average exchange rate.
(GAIN) LOSS ON THE SALE OF ASSETS INCREASED due to the 2010 gain recorded on the sale of MPAL’S Cooper Basin assets ($6.8 million) (see Note 9 to the Consolidated Financial Statements).
IMPAIRMENT LOSS INCREASED due mostly to the impairment loss recorded on MPAL’s Udacha, Dingo and some UK assets (see Note 2 to the Consolidated Financial Statements).
OTHER ADMINISTRATIVE EXPENSES INCREASED due to the foreign exchange rate loss on U.S. dollar cash held by MPAL ($168,000), costs relating to the July 2009 closing of the YEP equity-investment ($440,000), increased travel costs ($308,000), increased directors’ fees including the addition of three new directors ($250,000), Board of Director stock options ($103,000), Board of Directors Restricted Stock ($405,000), increased consulting costs ($725,000), closing costs for the Nautilus acquisition ($138,000) and the 18% increase in the average exchange rate described below.
WARRANT EXPENSE INCREASED (non-cash) due entirely to the increase in the fair value of the YEP warrants, which was driven by increases in the Company’s stock price. These warrants did not exist in 2009.
INCOME TAX PROVISION INCREASED due to the taxability in the U.S. of intercompany dividends which were not completely offset by available net operating loss carry forwards and nondeductible warrant and stock related compensation, offset by a decrease in Australian taxes due to the non-taxability of certain capital receipts (see Note 6 to the Consolidated Financial Statements). The effective tax rate of 223% results from the fact that MPC book losses do not generate a corresponding tax benefit because the taxable intercompany dividends and the nondeductible warrant and stock related compensation exceed book losses and thus create taxable income.
EXCHANGE EFFECT
The value of the Australian dollar relative to the U.S. dollar increased to $.8567 at June 30, 2010 compared to $.8048 at June 30, 2009. This resulted in a $1,358,464 credit to accumulated translation adjustments for fiscal 2010. The annual average exchange rate used to translate MPAL’s operations in Australia for fiscal 2010 was $.8826, which is an 18% increase compared to the $.7471 rate for fiscal 2009.
2009 vs. 2008
REVENUES AND INVESTMENT INCOME
Changes in revenues are as follows:
| Twelve Months ended June 30, |
|||||||||||||
| 2009 | 2008 | $ Variance | % Variance | ||||||||||
| Oil sales |
$ | 11,479,660 | $ | 19,786,175 | $ | (8,306,515 | ) | (42 | %) | ||||
| Gas sales |
14,740,296 | 18,523,095 | (3,782,799 | ) | (20 | %) | |||||||
| Other production related revenues |
1,970,621 | 2,585,540 | (614,919 | ) | (24 | %) | |||||||
| Investment and other income |
1,583,065 | 2,122,642 | (539,577 | ) | (25 | %) | |||||||
45
Table of Contents
Significant changes are discussed below.
OIL SALES DECREASED due to a 27% decrease in production, an 11% decrease in average price per barrel and the 17% decrease in the average exchange rate discussed below. Oil unit sales (after deducting royalties) in barrels (bbls) and the average price per barrel sold during the periods indicated were as follows:
| TWELVE MONTHS ENDED JUNE 30, | ||||||||||||||
| 2009 SALES | 2008 SALES | |||||||||||||
| BBLS | AVERAGE PRICE A.$ PER BBL |
BBLS | AVERAGE PRICE A.$ PER BBL |
% Variance BBLS |
% Variance A.$ PER BBL |
|||||||||
| Australia: |
||||||||||||||
| Mereenie field |
90,267 | 94.20 | 95,429 | 113.33 | (5 | %) | (17 | %) | ||||||
| Cooper Basin |
2,362 | 101.42 | 6,826 | 114.28 | (65 | %) | (11 | %) | ||||||
| Nockatunga project (1) |
60,668 | 86.30 | 108,311 | 91.82 | (44 | %) | (6 | %) | ||||||
| Total |
153,297 | 91.21 | 210,566 | 102.35 | (27 | %) | (11 | %) | ||||||
| (1) | Nockatunga average price per bbl is net of crude oil transportation costs which are deducted from the gross sales price. |
Amounts presented above for oil prices and below for gas prices are in Australian dollars to show a more meaningful trend of underlying operations. For the fiscal years ended June 30, 2009 and 2008, the average foreign exchange rates were .7471 and .8965 respectively.
GAS SALES DECREASED due to a 10% decrease in volume resulting from natural field decline and the 17% decrease in the average exchange rate discussed below partially offset by a 4% increase in the average price per mcf. The volumes in billion cubic feet (bcf) (after deducting royalties) and the average price of gas per thousand cubic feet (mcf) sold during the periods indicated were as follows:
| TWELVE MONTHS ENDED JUNE 30, | ||||||||||||||
| 2009 SALES | 2008 SALES | |||||||||||||
| BCF | AVERAGE PRICE A.$ PER MCF |
BCF | AVERAGE PRICE A.$ PER MCF |
% Variance BCF |
% Variance A.$ PER MCF |
|||||||||
| Australia: Palm Valley |
1.165 | 2.25 | 1.319 | 2.22 | (12 | %) | 1 | % | ||||||
| Australia: Mereenie |
3.996 | 3.93 | 4.388 | 3.77 | (9 | %) | 4 | % | ||||||
| Total |
5.161 | 3.54 | 5.707 | 3.39 | (10 | %) | 4 | % | ||||||
Mereenie contracts expired in January and June 2009. Supply obligations ceased in June 2009, however, they were ultimately extended to September 5, 2010. For further information, see “Gas Supply Contracts” in Item 1-Business and Item 7-Executive Summary above.
46
Table of Contents
OTHER PRODUCTION RELATED REVENUES are primarily MPAL’s share of gas pipeline tariff revenues which decreased as a result of a decrease in volumes of gas sold at Mereenie and the 17% Australian foreign exchange rate decrease discussed below.
INTEREST INCOME DECREASED due to a decrease in market interest rates and the 17% decrease in the average exchange rate discussed below.
COSTS AND EXPENSES
Changes in costs and expenses are as follows:
| Twelve Months Ended June 30, |
|||||||||||
| 2009 | 2008 | $ Variance | % Variance | ||||||||
| Production cost |
8,153,263 | 8,865,663 | (712,400 | ) | (8 | %) | |||||
| Exploration and dry hole costs |
3,475,937 | 3,318,810 | 157,127 | 5 | % | ||||||
| Salaries and employee benefits |
1,708,997 | 1,605,341 | 103,656 | 6 | % | ||||||
| Depletion, depreciation and amortization |
6,785,952 | 18,021,236 | (11,235,284 | ) | (62 | %) | |||||
| Auditing, accounting and legal services |
1,576,509 | 1,102,115 | 474,394 | 43 | % | ||||||
| Accretion expense |
531,405 | 716,130 | (184,725 | ) | (26 | %) | |||||
| Shareholder communications |
633,112 | 392,880 | 240,232 | 61 | % | ||||||
| Loss (gain) on sale of field equipment |
12,072 | (35,235 | ) | 47,307 | (134 | %) | |||||
| Impairment loss |
63,740 | — | 63,740 | — | |||||||
| Other administrative expenses |
3,969,658 | 3,591,856 | 377,802 | 11 | % | ||||||
| Income tax provision |
2,198,422 | 14,330,301 | (12,131,879 | ) | (85 | %) | |||||
Significant changes are discussed below.
PRODUCTION COSTS DECREASED due to the 17% decrease in the average exchange rate described below offset by increased labor and rental costs in the Nockatunga project ($438,000).
EXPLORATION AND DRY HOLE COSTS INCREASED due to seismic survey costs related to the Nockatunga fields ($1.4 million) and the write off of certain U.K. permits in 2009 ($296,000) offset by Cooper Basin drilling costs incurred in 2008 but not in 2009 ($1.3 million) and the 17% decrease in the average exchange rate described below.
DEPLETION, DEPRECIATION AND AMORTIZATION DECREASED due to lower depletable costs and the 17% decrease in the average exchange rate described below. Lower depletable costs result from recent depletion charges in excess of recent capital spending.
AUDITING, ACCOUNTING AND LEGAL SERVICES INCREASED due mostly to legal fees related to the YEP investment transaction in July 2009 and the shareholder agreement of approximately $574,000 partially offset by the 17% decrease in the average exchange rate described below.
ACCRETION EXPENSE DECREASED due mostly because of a reduction of the Mereenie asset retirement obligations (“ARO”) in the first quarter of fiscal 2009 ($995,000) and the 17% decrease in the exchange rate described below.
SHAREHOLDER COMMUNICATION COSTS INCREASED due to an increase in proxy and regulatory filing activity. The increased proxy activity was due to a threatened director election and additional voting matters which required stockholder approval, including the YEP investment transaction.
47
Table of Contents
OTHER ADMINISTRATIVE EXPENSES INCREASED due to net exchange rate losses ($461,000), increased travel costs ($125,000), increased repair and maintenance costs ($138,000) and increased due diligences costs related to the YEP investment transaction ($393,000), offset by a decrease in costs related to the ATO settlement ($597,000) that were incurred in 2008 but not in 2009, decrease in insurance expense in 2009 ($247,000) and the 17% decrease in the average exchange rate described below.
INCOME TAX PROVISION DECREASED due to the decrease in income before taxes as well as the provision of the ATO settlement in the prior fiscal period (see Note 6 to the Consolidated Financial Statements for a discussion of effective tax rates used and the ATO settlement).
EXCHANGE EFFECT
The value of the Australian dollar relative to the U.S. dollar decreased to $.8048 at June 30, 2009 compared to $.9615 at June 30, 2008. This resulted in a $9,931,978 debit to accumulated translation adjustments for fiscal 2009. The 16% decrease in the value of the Australian dollar decreased the reported asset and liability amounts in the balance sheet at June 30, 2009 from the June 30, 2008 amounts. The annual average exchange rate used to translate MPAL’s operations in Australia for fiscal 2009 was $.7471, which is a 17% decrease compared to the $.8965 rate for fiscal 2008.
| Item 7A. | Quantitative and Qualitative Disclosure about Market Risk. |
The Company’s exposure to market risk relates to fluctuations in foreign currency and world prices for crude oil, as well as market risk related to investment in marketable securities. The exchange rates between the Australian dollar and the U.S. dollar, as well as the exchange rates between the U.S. dollar and the U.K. pound sterling, have changed in recent periods and may fluctuate substantially in the future. We expect that a majority of our revenue will continue to be generated in the Australian dollar in the future. Any appreciation of the U.S. dollar against the Australian dollar is likely to have a positive impact on our revenue, operating income and net income. Because of our U.K. development program, a portion of our expenses, including exploration costs and capital and operating expenditures will continue to be denominated in U.K. pound sterling. Accordingly, any material appreciation of the U.K. pound sterling against the Australian and U.S. dollars could have a negative impact on our business, operating results and financial condition. A 10% change in the Australian foreign currency rate compared to the U.S. dollar would increase or decrease revenues and costs and expenses by approximately $2.9 million and $2.6 million, respectively, for the twelve months ended June 30, 2010.
For the twelve months ended June 30, 2010, oil sales represented approximately 42% of total oil and gas revenues. Based on the current twelve month’s sales volume and revenues, a 10% change in oil price would increase or decrease oil revenues by $989,000. Gas sales, which represented approximately 58% of total oil and gas revenues in the current twelve months, are derived primarily from the Palm Valley and Mereenie fields in the Northern Territory of Australia and the gas prices are set according to long term contracts that are subject to changes in the Australian Consumer Price Index for the twelve months ended June 30, 2010.
At June 30, 2010, the carrying value of cash and cash equivalents was approximately $15.6 million, which approximates the fair value of the securities. Since the Company expected to hold the investments to maturity, the maturity value should be realized. The value of these marketable securities has not been impacted by the ongoing U.S. credit crisis.
48
Table of Contents
| Item 8. | Financial Statements and Supplementary Data. |
REPORT OF INDEPENDENT REGISTERED PUBLIC ACCOUNTING FIRM
To the Board of Directors and Stockholders of
Magellan Petroleum Corporation
Portland, Maine
We have audited the accompanying consolidated balance sheets of Magellan Petroleum Corporation and subsidiaries (the “Company”) as of June 30, 2010 and 2009, and the related consolidated statements of operations, equity, and cash flows for each of the three years in the period ended June 30, 2010. These financial statements are the responsibility of the Company’s management. Our responsibility is to express an opinion on these financial statements based on our audits.
We conducted our audits in accordance with the standards of the Public Company Accounting Oversight Board (United States). Those standards require that we plan and perform the audit to obtain reasonable assurance about whether the financial statements are free of material misstatement. The Company is not required to have, nor were we engaged to perform, an audit of its internal control over financial reporting. Our audits included consideration of internal control over financial reporting as a basis for designing audit procedures that are appropriate in the circumstances, but not for the purpose of expressing an opinion on the effectiveness of the Company’s internal control over financial reporting. Accordingly, we express no such opinion. An audit also includes examining, on a test basis, evidence supporting the amounts and disclosures in the financial statements, assessing the accounting principles used and significant estimates made by management, as well as evaluating the overall financial statement presentation. We believe that our audits provide a reasonable basis for our opinion.
In our opinion, such consolidated financial statements present fairly, in all material respects, the financial position of Magellan Petroleum Corporation and subsidiaries as of June 30, 2010 and 2009, and the results of their operations and their cash flows for each of the three years in the period ended June 30, 2010, in conformity with accounting principles generally accepted in the United States of America.
As discussed in Note 1 to the consolidated financial statements, on June 30, 2010, the Company adopted Accounting Standards Update No. 2010-3, “Oil and Gas Reserve Estimation and Disclosures”.
/s/ DELOITTE & TOUCHE LLP
Hartford, Connecticut
September 28, 2010
49
Table of Contents
MAGELLAN PETROLEUM CORPORATION
CONSOLIDATED BALANCE SHEETS
| June 30, | ||||||||
| 2010 | 2009 | |||||||
| ASSETS | ||||||||
| Current assets: |
||||||||
| Cash and cash equivalents |
$ | 33,591,534 | $ | 34,688,842 | ||||
| Accounts receivable — trade (net of allowance for doubtful accounts of $95,912 and $90,102 at June 30, 2010 and 2009, respectively) |
4,427,245 | 5,346,111 | ||||||
| Accounts receivable — working interest partners |
204,630 | 500,404 | ||||||
| Marketable securities |
— | 997,306 | ||||||
| Securities available-for-sale (at fair value) |
192,417 | — | ||||||
| Inventories |
815,179 | 847,159 | ||||||
| Deferred income taxes |
189,236 | 563,853 | ||||||
| Assets held for sale |
648,217 | — | ||||||
| Other assets |
1,702,091 | 598,509 | ||||||
| Total current assets |
41,770,549 | 43,542,184 | ||||||
| Deferred income taxes |
5,262,649 | 5,708,448 | ||||||
| Securities available-for-sale (at fair value) |
— | 903,924 | ||||||
| Deposit on Evans Shoal |
12,850,500 | |||||||
| Property and equipment, net: |
||||||||
| Oil and gas properties (successful efforts method) |
113,646,852 | 117,617,555 | ||||||
| Land, buildings and equipment |
3,328,670 | 2,962,649 | ||||||
| Field equipment |
5,843,939 | 868,504 | ||||||
| 122,819,461 | 121,448,708 | |||||||
| Less accumulated depletion, depreciation and amortization |
(96,905,478 | ) | (103,919,971 | ) | ||||
| Net property and equipment |
25,913,983 | 17,528,737 | ||||||
| Goodwill |
4,695,204 | 4,020,706 | ||||||
| Other assets |
213,500 | |||||||
| Total assets |
$ | 90,706,385 | $ | 71,703,999 | ||||
| LIABILITIES AND EQUITY | ||||||||
| Current liabilities: |
||||||||
| Accounts payable |
$ | 2,387,857 | $ | 2,688,342 | ||||
| Accrued liabilities |
2,064,979 | 1,639,284 | ||||||
| Demand notes payable |
470,000 | — | ||||||
| Current portion of notes payable |
451,585 | — | ||||||
| Liability related to assets held for sale |
194,465 | — | ||||||
| Deferred income taxes |
83,400 | — | ||||||
| Income taxes payable |
460,617 | 2,054,052 | ||||||
| Total current liabilities |
6,112,903 | 6,381,678 | ||||||
| Long term liabilities: |
||||||||
| Deferred income taxes |
1,157,735 | 1,923,907 | ||||||
| Notes payable |
232,430 | |||||||
| Other long term liabilities |
92,577 | 70,232 | ||||||
| Asset retirement obligations |
9,292,556 | 9,815,262 | ||||||
| Total long term liabilities |
10,775,298 | 11,809,401 | ||||||
| Commitments and contingencies (Note 14) |
— | — | ||||||
| Equity: |
||||||||
| Common stock, par value $.01 per share: Authorized 200,000,000 shares outstanding, 52,355,977 at June 30, 2010 and 41,500,325 at June 30, 2009 |
523,358 | 415,001 | ||||||
| Capital in excess of par value |
91,905,062 | 73,311,075 | ||||||
| Accumulated deficit |
(23,640,191 | ) | (22,192,919 | ) | ||||
| Accumulated other comprehensive income |
3,116,263 | 1,979,763 | ||||||
| Total equity attributable to Magellan Petroleum Corporation |
71,904,492 | 53,512,920 | ||||||
| Non-controlling interest in subsidiaries |
1,913,692 | — | ||||||
| Total equity |
73,818,184 | 53,512,920 | ||||||
| Total liabilities and equity |
$ | 90,706,385 | $ | 71,703,999 | ||||
See accompanying notes.
50
Table of Contents
MAGELLAN PETROLEUM CORPORATION
CONSOLIDATED STATEMENTS OF OPERATIONS
| Years Ended June 30, | |||||||||||
| 2010 | 2009 | 2008 | |||||||||
| Revenues: |
|||||||||||
| Oil sales |
$ | 9,886,592 | $ | 11,479,660 | $ | 19,786,175 | |||||
| Gas sales |
13,615,755 | 14,740,296 | 18,523,095 | ||||||||
| Other production related revenues |
5,022,210 | 1,970,621 | 2,585,540 | ||||||||
| Total revenues |
28,524,557 | 28,190,577 | 40,894,810 | ||||||||
| Costs and expenses: |
|||||||||||
| Production costs |
10,116,320 | 8,153,263 | 8,865,663 | ||||||||
| Exploratory and dry hole costs |
1,273,268 | 3,475,937 | 3,318,810 | ||||||||
| Salaries and employee benefits |
4,816,350 | 1,708,997 | 1,605,341 | ||||||||
| Depletion, depreciation and amortization |
4,680,240 | 6,785,952 | 18,021,236 | ||||||||
| Auditing, accounting and legal services |
1,947,901 | 1,576,509 | 1,102,115 | ||||||||
| Accretion expense |
748,209 | 531,405 | 716,130 | ||||||||
| Shareholder communications |
551,408 | 633,112 | 392,880 | ||||||||
| (Gain) loss on sale of field equipment |
(6,817,304 | ) | 12,072 | (35,235 | ) | ||||||
| Impairment loss |
2,049,616 | 63,740 | — | ||||||||
| Other administrative expenses |
6,707,184 | 3,969,658 | 3,591,856 | ||||||||
| Total costs and expenses |
26,073,192 | 26,910,645 | 37,578,796 | ||||||||
| Operating income |
2,451,365 | 1,279,932 | 3,316,014 | ||||||||
| Warrant expense |
(4,276,471 | ) | |||||||||
| Investment and other income |
3,012,831 | 1,583,065 | 2,122,642 | ||||||||
| Income before income taxes |
1,187,725 | 2,862,997 | 5,438,656 | ||||||||
| Income tax expense |
2,645,763 | 2,198,422 | 14,330,301 | ||||||||
| Net (loss) income |
$ | (1,458,038 | ) | $ | 664,575 | $ | (8,891,645 | ) | |||
| Less net (loss) attributable to non-controlling interest in subsidiaries |
(10,766 | ) | — | — | |||||||
| Net (Loss) income attributable to Magellan Petroleum Corporation |
$ | (1,447,272 | ) | $ | 664,575 | $ | (8,891,645 | ) | |||
| Average number of shares of common stock: |
|||||||||||
| Basic and Dilutive |
51,410,596 | 41,500,325 | 41,500,325 | ||||||||
| Net (loss) income per basic and dilutive common shares attributable to Magellan Petroleum Corporation common shareholders |
$ | (0.03 | ) | $ | 0.02 | $ | (0.21 | ) | |||
See accompanying notes.
51
Table of Contents
MAGELLAN PETROLEUM CORPORATION
CONSOLIDATED STATEMENT OF CHANGES IN EQUITY
Three Years Ended June 30, 2010
| Number of Shares |
Common Stock |
Capital in Excess of Par Value |
Accumulated Deficit |
Accumulated Other Comprehensive Income (Loss) |
Non-controlling interest |
Total | Total Comprehensive Income (Loss) |
|||||||||||||||||||||
| June 30, 2007 |
41,500,325 | 415,001 | 73,153,002 | (13,965,849 | ) | 4,372,626 | — | 63,974,780 | ||||||||||||||||||||
| Net loss |
— | — | — | (8,891,645 | ) | — | — | (8,891,645 | ) | (8,891,645 | ) | |||||||||||||||||
| Foreign currency translation adjustments |
— | — | — | — | 7,317,151 | — | 7,317,151 | 7,317,151 | ||||||||||||||||||||
| Stock exchange |
— | — | 63,141 | — | — | — | 63,141 | |||||||||||||||||||||
| Stock option compensation |
— | — | — | — | — | — | — | — | ||||||||||||||||||||
| Total comprehensive (loss) |
— | — | — | — | — | — | — | (1,574,494 | ) | |||||||||||||||||||
| June 30, 2008 |
41,500,325 | 415,001 | 73,216,143 | (22,857,494 | ) | 11,689,777 | 62,463,427 | |||||||||||||||||||||
| Net income |
— | — | — | 664,575 | — | — | 664,575 | 664,575 | ||||||||||||||||||||
| Foreign currency translation adjustments |
— | — | — | — | (9,931,978 | ) | — | (9,931,978 | ) | (9,931,978 | ) | |||||||||||||||||
| Unrealized holding gains, net of deferred tax of $122,112 |
— | — | — | — | 221,964 | — | 221,964 | 221,964 | ||||||||||||||||||||
| Stock option compensation |
— | — | 94,932 | — | — | — | 94,932 | — | ||||||||||||||||||||
| Total comprehensive loss |
— | — | — | — | — | — | — | (9,045,439 | ) | |||||||||||||||||||
| June 30, 2009 |
41,500,325 | 415,001 | 73,311,075 | (22,192,919 | ) | 1,979,763 | — | 53,512,920 | ||||||||||||||||||||
| Net loss |
— | — | — | (1,447,272 | ) | — | (10,766 | ) | (1,458,038 | ) | (1,458,038 | ) | ||||||||||||||||
| Foreign currency translation adjustments |
— | — | — | — | 1,358,464 | — | 1,358,464 | 1,358,464 | ||||||||||||||||||||
| Unrealized holding gains, net of taxes |
— | — | — | — | (221,964 | ) | — | (221,964 | ) | (221,964 | ) | |||||||||||||||||
| Stock and stock option based compensation |
440,000 | 4,400 | 2,301,352 | — | — | — | 2,305,752 | — | ||||||||||||||||||||
| Equity investment YEP |
8,695,652 | 86,957 | 7,527,870 | — | — | — | 7,614,827 | — | ||||||||||||||||||||
| Warrants issued |
— | — | 6,401,765 | — | — | — | 6,401,765 | — | ||||||||||||||||||||
| Nautilus acquisition |
1,700,000 | 17,000 | 2,363,000 | — | — | 1,924,458 | 4,304,458 | — | ||||||||||||||||||||
| Total comprehensive (loss) |
— | — | — | — | — | — | — | $ | (321,538 | ) | ||||||||||||||||||
| June 30, 2010 |
52,335,977 | $ | 523,358 | $ | 91,905,062 | $ | (23,640,191 | ) | $ | 3,116,263 | $ | 1,913,692 | $ | 73,818,184 | ||||||||||||||
See accompanying notes.
52
Table of Contents
MAGELLAN PETROLEUM CORPORATION
CONSOLIDATED STATEMENTS OF CASH FLOWS
| Years Ended June 30, | ||||||||||||
| 2010 | 2009 | 2008 | ||||||||||
| Operating Activities: |
||||||||||||
| Net (loss) income |
$ | (1,458,038 | ) | $ | 664,575 | $ | (8,891,645 | ) | ||||
| Adjustments to reconcile net income to net cash provided by operating activities: |
||||||||||||
| (Gain)/loss from disposal of assets |
(6,817,304 | ) | 12,072 | (35,235 | ) | |||||||
| Gain from sale of investments |
(1,975,286 | ) | — | — | ||||||||
| Depletion, depreciation and amortization |
4,680,240 | 6,785,952 | 18,021,236 | |||||||||
| Accretion expense |
748,209 | 531,405 | 716,130 | |||||||||
| Deferred income taxes |
921,934 | (1,618,033 | ) | (4,541,695 | ) | |||||||
| Stock-based compensation and change in warrant valuation |
6,582,223 | 94,932 | 63,141 | |||||||||
| Exploration and dry hole costs |
— | 5,765 | 1,328,114 | |||||||||
| Write off of exploration permits |
— | 359,471 | — | |||||||||
| Impairment loss |
2,049,616 | — | — | |||||||||
| Changes in operating assets and liabilities: |
||||||||||||
| Accounts receivable |
2,734,772 | 1,270,721 | (2,640,315 | ) | ||||||||
| Other assets |
(105,952 | ) | 65,531 | (26,946 | ) | |||||||
| Inventories |
646,986 | 203,312 | (428,332 | ) | ||||||||
| Accounts payable and accrued liabilities |
(1,689,063 | ) | 1,793,486 | 70,480 | ||||||||
| Income taxes payable |
(3,097,915 | ) | (930,137 | ) | 1,860,666 | |||||||
| Net cash provided by operating activities |
3,220,422 | 9,239,052 | 5,495,599 | |||||||||
| Investing Activities: |
||||||||||||
| Additions to property and equipment |
(2,276,128 | ) | (2,430,184 | ) | (4,249,215 | ) | ||||||
| Proceeds from sale of assets |
7,280,402 | 27,728 | 35,235 | |||||||||
| Oil and gas exploration activities |
(567,343 | ) | (491,490 | ) | (1,890,795 | ) | ||||||
| Proceeds from sale of securities available for sale |
9,615,215 | — | — | |||||||||
| Purchase of securities available for sale |
(7,259,082 | ) | (559,850 | ) | — | |||||||
| Proceeds from sale of securities |
465,004 | — | — | |||||||||
| Marketable securities matured or sold |
7,194,090 | 3,109,611 | 4,435,820 | |||||||||
| Marketable securities purchased |
(6,196,784 | ) | (2,398,695 | ) | (1,765,775 | ) | ||||||
| Deposit for purchase of Evans Shoal |
(13,751,850 | ) | — | — | ||||||||
| Purchase of controlling interest — Nautilus Poplar LLC |
(7,309,113 | ) | — | — | ||||||||
| Cash acquired — purchase of Nautilus Poplar LLC |
314,727 | — | — | |||||||||
| Purchase of working interest in oil and gas properties |
(4,090,170 | ) | — | — | ||||||||
| Increase in restricted cash |
(75,444 | ) | — | — | ||||||||
| Net cash (used) in investing activities |
(16,656,476 | ) | (2,742,880 | ) | (3,434,730 | ) | ||||||
| Financing Activities: |
||||||||||||
| Debt principal payments |
(845,147 | ) | — | — | ||||||||
| Proceeds from borrowings |
570,000 | — | — | |||||||||
| Proceeds from issuance of stock and warrants |
10,000,000 | — | — | |||||||||
| Equity issuance costs |
— | (259,879 | ) | — | ||||||||
| Net cash provided by (used in) financing activities |
9,724,853 | (259,879 | ) | — | ||||||||
| Effect of exchange rate changes on cash and cash equivalents |
2,613,893 | (6,162,679 | ) | 4,083,911 | ||||||||
| Net increase in cash and cash equivalents |
(1,097,308 | ) | 73,614 | 6,144,780 | ||||||||
| Cash and cash equivalents at beginning of year |
34,688,842 | 34,615,228 | 28,470,448 | |||||||||
| Cash and cash equivalents at end of year |
$ | 33,591,534 | $ | 34,688,842 | $ | 34,615,228 | ||||||
| Cash payments: |
||||||||||||
| Income taxes |
4,821,744 | 4,746,589 | 13,072,505 | |||||||||
| Interest on tax settlement |
— | — | 3,893,014 | |||||||||
| Supplemental Schedule of Noncash Investing and Financing Activities: |
||||||||||||
| Unrealized holding gains |
— | 344,074 | — | |||||||||
| Revision to estimate of asset retirement obligations |
(2,231,849 | ) | (625,962 | ) | 43,482 | |||||||
| Accounts payable related to property and equipment |
48,029 | 163,457 | 1,993,964 | |||||||||
See accompanying notes.
53
Table of Contents
1. Summary of Significant Accounting Policies
Principles of Consolidation
Magellan Petroleum Corporation (“MPC” or “Magellan”) is engaged in the sale of oil and gas and the exploration for and development of oil and gas reserves. At June 30, 2010 and 2009, MPC’s principal asset was a 100% equity interest in its subsidiary, Magellan Petroleum Australia Limited (“MPAL”). MPAL’s major assets are two petroleum production leases covering the Mereenie oil and gas field (35% working interest), one petroleum production lease covering the Palm Valley gas field (52% working interest) and seventeen licenses in the United Kingdom, three of which are operating licenses. Both the Mereenie and Palm Valley fields are located in the Amadeus Basin in the Northern Territory of Australia.
During the year ended June 30, 2010 MPC added to its holdings, an 83.5% controlling member interest in Nautilus Poplar, LLC. (“Nautilus”) and a 26.3% average working interest in the Poplar fields. Nautilus, based in Denver, Colorado, operates and holds a 68.75% interest in the East Polar Unit and varied interests averaging 57% in the Northwest Poplar Fields in Montana, USA.
MPC has a direct 2.67% carried interest in the Kotaneelee gas field in the Yukon Territory of Canada.
The accompanying consolidated financial statements include the accounts of MPC and its subsidiaries, MPAL and Nautilus, (collectively the “Company”). All intercompany transactions have been eliminated.
Use of Estimates
The preparation of consolidated financial statements in conformity with accounting principles generally accepted in the United States of America (“GAAP”) requires management to make estimates and assumptions that affect the amounts reported in the financial statements and accompanying notes. Actual results could differ from those estimates.
Revenue Recognition
The Company recognizes oil and gas revenue (net of royalties) from its interests in producing wells as oil and gas is produced and sold from those wells. Revenues from the sale and transportation of natural gas are recognized upon completion of the sale and when transported volumes are delivered. Other production related revenues are primarily MPAL’s share of gas pipeline tariff revenues which are recorded at the time of sale. The Company records pipeline tariff revenues on a gross basis with the revenue included in other production related revenues and the remittance of such tariffs are included in production costs. Government sales taxes related to MPAL’s oil and gas production revenues are collected by MPAL and remitted to the Australian government. Such amounts are excluded from revenue and expenses. Shipping and handling costs in connection with such deliveries are included in production costs except for Nautilus crude oil transportation costs which are deducted from gross sales. Revenue under carried interest agreements is recorded in the period when the net proceeds become receivable, measurable and collection is reasonably assured. The time when the net revenues become receivable and collection is reasonably assured depends on the terms and conditions of the relevant agreements and the practices followed by the operator. As a result, net revenues may lag the production month by one or more months. Other production revenues for the twelve months ended June 30, 2010 also included MPAL’s share of Power and Water Corporation (PWC)’s contract settlement for a breach in their gas contract in the amount of $1.0 million.
Trade receivables
Collectability of trade receivables is reviewed on an ongoing basis. Receivables which are known to be uncollectible are written off by reducing the carrying amount directly. An allowance for doubtful accounts is used when there is objective evidence that the Company will not be able to collect all amounts due, according to
54
Table of Contents
the original terms of the related sales. Significant financial difficulties of the debtor, probability that the debtor will enter bankruptcy or financial reorganization, and default or delinquency in payments are considered indicators that the trade receivable is not collectable. The amount of bad debt expense is recognized in the income statement within other administrative expenses. When a trade receivable, for which an allowance had been recognized, becomes uncollectible in a subsequent period, it is written off against the allowance account. Subsequent recoveries of amounts previously written off are credited against other administrative expenses in the income statement.
Stock-Based Compensation
The Company has one stock incentive plan which was amended on May 27, 2009 to, among other things, increase the aggregate number of shares issuable under the plan to 5,205,000. The costs resulting from all share-based payment transactions are recognized in the consolidated financial statements. U.S. Generally Accepted Accounting Principles (GAAP) establishes fair value as the measurement objective in accounting for share-based payment arrangements and requires the application of a fair-value measurement method of accounting for share-based payment transactions with employees and non-employees. The Company uses the Black-Scholes option valuation model to determine the fair value of its time based stock option share awards and the Monte Carlo model for performance based options share awards that include a market condition. These models include various assumptions, including the expected volatility and the expected life of the share awards as well as significant assumptions for performance based awards that include probabilities of certain vesting conditions and behaviors impacting exercise. These assumptions, as detailed in Note 5-Capital and Stock-Based Compensation, reflect the Company’s best estimates, but they involve inherent uncertainties based on market conditions generally outside of the control of the Company. As a result, if other assumptions had been used, stock-based compensation expense, as calculated and recorded could have been significantly impacted. Furthermore, if the Company uses different assumptions in future periods, stock-based compensation expense could be significantly impacted in future periods. The Company’s policy for attributing the value of graded vested share-based payments is an accelerated multiple-option approach.
Concentration of Credit Risk
The Company’s financial instruments exposed to concentrations of credit risk consist primarily of cash and cash equivalents. The Company places its cash and cash equivalents with reputable financial institutions. At times, balances deposited may exceed FDIC insured limits. The Company has not incurred any losses related to these deposits.
Oil and Gas Properties
The Company follows the successful efforts method of accounting for its oil and gas operations. Under this method, the costs of successful wells, development dry holes, productive leases, and permit and concession costs are capitalized and amortized on a units-of-production basis over the life of the related reserves. Cost centers for amortization purposes are determined on a field-by-field basis. The Company records its proportionate share in joint venture operations in the respective classifications of assets, liabilities and expenses. Unproved properties with significant acquisition costs are periodically assessed for impairment in value, with any impairment charged to expense. The successful efforts method also imposes limitations on the carrying or book value of proved oil and gas properties. Oil and gas properties are reviewed for impairment whenever events or changes in circumstances indicate that the carrying amounts may not be recoverable. The Company estimates the future undiscounted cash flows from the affected properties to determine the recoverability of carrying amounts. In general, analyses are based on proved developed reserves for gas, except in the case of Palm Valley proved gas, which is based in contracted volumes. At June 30, 2010, Mereenie had no gas contracts, thus no gas reserves. For Palm Valley, reserves were based upon the quantities of gas committed to the contract and estimated sales subsequent to the contract date. If such contracts are extended, the proved developed reserves will be increased to the lesser of the actual proved developed reserves and risk adjusted probable and possible reserves or the contracted quantities.
55
Table of Contents
Exploratory drilling costs are initially capitalized pending determination of proved reserves but are charged to expense if no proved reserves are found. Other exploration costs, including geological and geophysical expenses, leasehold expiration costs and delay rentals, are expensed as incurred. Because the Company follows the successful efforts method of accounting, the results of operations may vary materially from quarter to quarter. An active exploration program may result in greater exploration and dry hole costs.
Nondepletable assets
At June 30, 2010 and 2009 oil and gas properties include $4.3 million, $6.6 million and $6.8 million respectively, of capitalized costs that are currently not being depleted. Components of these costs are as follows:
| Nondepletable capitalized costs |
2010 | 2009 | ||||||
| PEL 106 – Cooper Basin (1) |
||||||||
| Balance beginning of year |
$ | 1,552,838 | $ | 1,855,186 | ||||
| Additions to capitalized costs |
— | — | ||||||
| Assets sold or held for sale OR |
(1,552,838 | ) | ||||||
| Exchange adjustment |
— | (302,348 | ) | |||||
| Balance end of year |
$ | — | $ | 1,552,838 | ||||
| Weald/Wessex Basin U.K. (2) |
||||||||
| Balance beginning of year |
$ | 983,548 | $ | 549,935 | ||||
| Additions to capitalized costs |
608,479 | 485,725 | ||||||
| Exchange adjustment |
45,571 | (52,112 | ) | |||||
| Balance end of year |
$ | 1,637,598 | $ | 983,548 | ||||
| Poplar Field (2) |
||||||||
| Balance beginning of year |
$ | — | $ | — | ||||
| Additions to capitalized costs |
313,710 | — | ||||||
| Balance end of year |
$ | 313,710 | $ | — | ||||
| Exploration permits and licenses – Australia and U.K. (3) |
||||||||
| Balance beginning of year |
$ | 4,104,491 | $ | 4,425,749 | ||||
| Assets sold or held for sale |
(1,518,665 | ) | ||||||
| Charged to expense |
(231,798 | ) | (321,258 | ) | ||||
| Balance end of year |
$ | 2,354,028 | $ | 4,104,491 | ||||
| Total |
||||||||
| Balance beginning of year |
$ | 6,640,877 | $ | 6,830,870 | ||||
| Additions to capitalized costs |
922,189 | 485,725 | ||||||
| Assets sold or held for sale |
(3,071,503 | ) | — | |||||
| Reclassified to producing properties |
— | — | ||||||
| Charged to expense (3) |
(231,798 | ) | (321,258 | ) | ||||
| Exchange adjustment |
45,571 | (354,460 | ) | |||||
| Balance end of year |
$ | 4,305,336 | $ | 6,640,877 | ||||
| (1) | During the year ended June 30, 2010, Cooper Basin assets were sold. Prior costs were capitalized during the year ended June 30, 2006 and remained capitalized through the date of the sale, because the related well had sufficient quantity of reserves to justify its completion as a producing well. |
| (2) | Capitalized exploratory well costs pending discovery of reserves. |
| (3) | The Company evaluates exploration permits and licenses annually or whenever events or changes in circumstances indicate that the carrying value, related to step up to fair value for the 44.87% remaining interest of MPAL acquired in 2006, may be impaired. |
56
Table of Contents
Goodwill
The aggregate amount of goodwill is $4,695,204 and $4,020,706 at June 30, 2010 and at June 30, 2009, respectively. As of June 30, 2010, $674,498 of our goodwill is related to the October 15, 2009 acquisition of Nautilus. $4,020,706 of our goodwill is related to the fiscal 2006 acquisition of the 44.87% of MPAL that we did not own at the time. Goodwill is not amortized but is tested for impairment annually or whenever events or changes in circumstances indicate that the carrying value may be impaired. Our annual impairment testing date for MPAL related goodwill is June 30. We performed our annual impairment testing for MPAL related goodwill as of June 30, 2010 and 2009. We determined that no impairment existed as either of those dates.
We employ the adjusted balance sheet method to estimate the fair value of MPAL. This method entails estimating the fair value of all of MPAL’s balance sheet items as of the valuation date. If the adjusted equity value, after considering the fair values of the assets and liabilities, is greater than the carrying value of MPAL, then no impairment is indicated. Management believes that this methodology is most meaningful since the highest and best use of these assets would be to continue to hold and exploit the assets over time.
The fair value of our oil properties are estimated based on the discounted cash flows of our proved and risk adjusted probable and possible reserves. In general, analyses are based on proved developed reserves for gas. The significant assumptions used in estimating the fair values of the oil and gas properties are oil and gas selling prices for non-contracted volumes, oil and gas sales volumes, discount rates, and production trends. The fair value of MPAL is most susceptible to changes in selling prices of oil and gas and changes in estimated sales volume.
The fair value of our nondepletable exploration permits and licenses is estimated separately using one of four methods – discounted cash flow, discounted cash flows adjusted for chances of success, recent farmin costs and premiums, and estimated costs of committed work programs. The majority of the permits and licenses are valued based on the estimated cost of agreed work program commitments, which is a methodology that is not dependent on significant assumptions.
Our annual impairment testing date for Nautilus — Related Goodwill is October 1. There have been no events or circumstances that would indicate that other carrying value may be impaired since we purchased the working interest in Nautilus on October 15, 2009.
Asset Retirement Obligations
Obligations associated with the retirement of long-lived assets are recognized at their fair value at the time that the obligations are incurred. Upon initial recognition of a liability, that cost is capitalized as part of the related long-lived asset (oil and gas properties) and amortized on a units-of-production basis over the life of the related reserves. Accretion expense in connection with the discounted liability is recognized over the remaining life of the related liability.
The estimated liability is based on the future estimated cost of land reclamation, plugging the existing oil and gas wells and removing the surface facilities equipment in Australia and The United States. The liability is a discounted liability using a credit-adjusted risk-free rate on the date such liabilities are determined. Revisions to the liability could occur due to changes in the estimated life of the field, estimates of these costs, acquisition of additional properties and as new wells are drilled.
Estimates of future asset retirement obligations include significant management judgment and are based on projected future retirement costs. Judgments are based upon such things as field life and estimated costs. Such costs could differ significantly when they are incurred.
Land, Buildings and Equipment and Field Equipment
Land, buildings and equipment and field equipment are carried at cost. Depreciation and amortization are provided on a straight-line basis over their estimated useful lives. The estimated useful lives are: buildings — 40 years, equipment and field equipment — 3 to 15 years.
57
Table of Contents
Inventories
Inventories consist of crude oil in various stages of transit to the point of sale and are valued at the lower of cost (determined on an average cost basis) or market. Inventories at Nautilus consists of parts inventory using the first in-first out (FIFO) method.
Foreign Currency Translations
The accounts of MPAL, whose functional currency is the Australian dollar, are translated into U.S. dollars. The translation adjustment is included in accumulated other comprehensive income (loss), which is a component of equity, whereas gains or losses on foreign currency transactions are included in the determination of income. All assets and liabilities are translated at the rates in effect at the balance sheet dates. Revenues, expenses, gains and losses are translated using quarterly weighted average exchange rates during the period. At June 30, 2010 and 2009, the Australian dollar was equivalent to U.S. $.8567 and $.8048, respectively. The annual average exchange rates used to translate MPAL’s operations in Australia for the fiscal years 2010, 2009, and 2008 were $.8826, $.7471, and $.8965, respectively.
Accrued Liabilities
At June 30, 2010 and 2009, balances in accrued liabilities which exceeded 5% of current liabilities include $766,317 and $770,024 of employment benefits, respectively, and $356,812 and $350,886 of withholding and sale taxes, respectively.
Accounting for Income Taxes
The Company follows the liability method in accounting for income taxes. Under this method, deferred tax assets and liabilities are determined based on differences between the financial reporting and tax bases of assets and liabilities and are measured using the enacted tax rates and laws that will be in effect when the differences are expected to reverse. The Company records a valuation allowance for deferred tax assets when it is more likely than not that such assets will not be recovered.
GAAP prescribes a comprehensive model for recognizing, measuring, presenting, and disclosing in the financial statements uncertain tax positions that the Company has taken or expects to take in its tax returns. Under GAAP, the Company recognizes tax positions when it is more likely than not that a tax position will be sustained upon examination, including resolution of any related appeals or litigation processes, based on the technical merits of the position. In evaluating whether a tax position has met the more-likely-than-not recognition threshold, the Company has presumed that its positions will be examined by the appropriate taxing authority that has full knowledge of all relevant information. The next step is measurement. A tax position that meets the more-likely-than-not recognition threshold is measured to determine the amount of benefit to recognize in the financial statements. A tax position is measured at the largest amount of benefit that is greater than 50 percent likely of being realized upon ultimate settlement. An uncertain income tax position will not be recognized if it does not meet the more-likely-than-not threshold. To appropriately account for income tax matters, the Company is required to make significant judgments and estimates regarding the recoverability of deferred tax assets, the likelihood of the outcome of examinations of tax positions that may or may not be currently under review and potential scenarios involving settlements of such matters. Changes in these estimates could materially impact the consolidated financial statements. There are no significant uncertain tax positions for fiscal 2010 and 2009.
The Company has adopted an accounting policy to record all tax related interest and penalties in its tax provision calculation.
58
Table of Contents
Financial Instruments
The carrying value for cash and cash equivalents, accounts receivable, marketable securities, accounts payable and debt approximates fair value based on the timing of the anticipated cash flows and current market conditions.
Cash and Cash Equivalents
The Company considers all highly liquid short term investments with maturities of three months or less at the date of acquisition to be cash equivalents. The components of cash and cash equivalents are as follows:
| June 30, | ||||||
| 2010 | 2009 | |||||
| Cash |
$ | 18,030,155 | $ | 13,294,642 | ||
| Australian money market accounts without restriction |
15,561,379 | 21,394,200 | ||||
| $ | 33,591,534 | $ | 34,688,842 | |||
National Australia Bank, Ltd. (“NAB”) holds 48% of the cash and cash equivalent balance.
Marketable Securities
The Company’s marketable securities are held-to-maturity securities and are carried at amortized costs. At June 30, 2010 MPC had no marketable securities. At June 30, 2009, MPC had the following marketable securities which were held until maturity:
| June 30, 2009 |
Par Value | Maturity Date | Amortized Cost | Fair Value | |||||||
| Short-term securities |
|||||||||||
| U.S. government agency note |
$ | 250,000 | Jul. 15, 2009 | $ | 249,690 | $ | 250,000 | ||||
| U.S. government agency note |
250,000 | Aug. 14, 2009 | 249,449 | 249,975 | |||||||
| U.S. government agency note |
250,000 | Sep. 21, 2009 | 249,179 | 249,925 | |||||||
| U.S. government agency note |
250,000 | Oct. 15, 2009 | 248,988 | 249,875 | |||||||
| Total short-term |
$ | 1,000,000 | $ | 997,306 | $ | 999,775 | |||||
Securities Available-for-Sale
The Company classifies equity securities that have a readily determinable fair value and are not bought and not held principally for the purpose of selling them in the near term as securities available-for-sale. Unrealized holding gains and losses for available-for-sale securities are excluded from earnings and reported in other comprehensive income until realized. The Company had the following securities classified as available for sale at June 30, 2010 and June 30, 2009:
| June 30, 2010 |
Maturity Date | Fair Value | |||
| Equity securities |
Not applicable | $ | 192,417 | ||
| June 30, 2009 |
Maturity Date | Fair Value | |||
| Equity securities |
Not applicable | $ | 903,924 | ||
As of June 30, 2010, the Company has one foreign equity security classified as available for sale. At June 30, 2010 the Company realized a loss of $90,083 included in earnings on these securities as they will be sold in the next quarter. Therefore the amount of net unrealized holding losses that have been included in accumulated other comprehensive income is $0 for securities available-for-sale for the twelve months ended June 30, 2010.
59
Table of Contents
During the twelve months ended June 30, 2010, the Company received proceeds of $2,648,278, upon the sale of available-for-sale equity securities. The gain on sale was calculated on a last-in-first-out basis. Realized gains of $2,065,369 for the twelve months ended June 30, 2010 were included in earnings for these securities sold during fiscal year ended June 30, 2010. The amount of unrealized holding gains for the twelve months ended June 30, 2010 that has been reclassified out of accumulated other comprehensive income into earnings and included in the gain on sale is $221,964.
Business combinations
The Company applies the acquisition method of recording business combinations. Under this method, the Company recognizes and measures the identifiable assets acquired, the liabilities assumed and any non-controlling interest in the acquiree. Any goodwill or gain is identified and recorded. We engage an independent valuation consultant to assist us in determining the fair values of crude oil and natural gas properties acquired, and other third-party specialists as needed to assist us in assessing the fair value of other assets and liabilities assumed. This valuation requires management to make significant estimates and assumptions, especially with respect to the oil and gas properties.
(Loss) Earnings per Share
Earnings per common share are based upon the weighted average number of common and common equivalent shares outstanding during the period. The only reconciling items in the calculation of diluted EPS are the dilutive effect of stock options, warrants and non-vested shares. The dilutive impact of non-vested shares is determined using either the treasury stock method or the two-class method, whichever leads to higher dilution. The dilutive impact of stock options and warrants is determined using the treasury stock method.
At June 30, 2010, the Company had 8,127,826 options and warrants outstanding that had an exercise price below the average stock price for the periods that resulted in 1,634,797 incremental dilutive shares for the respective periods. The Company also had 208,334 non-vested shares of company stock that are anti-dilutive at June 30, 2010. There were no other potentially dilutive items at June 30, 2010.
In 2010, the Company issued 637,500 stock options, 4,347,826 warrants and 350,000 non-vested shares. An additional 700,000 stock options were awarded on April 1, 2010 which are subject to shareholder approval at the next annual shareholders meeting. As this approval is pending, there was no grant date for accounting purposes and, consequently, there was no financial statement impact during the year ended June 30, 2010. (See Note 5-Capital and Stock-Based Compensation)
In 2009, the Company issued 2,712,500 stock options. At June 30, 2009, the Company had 3,242,500 stock options outstanding all of which were anti-dilutive.
In 2008, the Company had 100,000 outstanding options that were issued that had a strike price below the average stock price for the period and resulted in 8,661 incremental diluted shares for the respective period. However, since the Company incurred a loss from operations, the incremental shares were anti-dilutive.
Stock Compensation
The Company’s 1998 Stock Incentive Plan (the “Plan”) provides for grants of shares of stock, stock appreciation rights (“SARs”), restricted shares and non-qualified stock options principally at an option price per share of 100% of the fair value of the Company’s common stock on the date awarded. The Plan was amended on May 27, 2009. The amended Plan has 5,205,000 shares authorized for awards. (See Note 5-Capital and Stock-Based Options)
GAAP requires recognition in the financial statements of the cost resulting from all share-based payment transactions by applying a fair-value-based measurement method to account for all share-based payment transactions with employees.
60
Table of Contents
Accumulated Other Comprehensive Income
Accumulated other comprehensive income at June 30, 2010 and 2009 was as follows:
| 2010 | 2009 | |||||
| Foreign currency translation adjustments |
$ | 3,116,263 | $ | 1,757,799 | ||
| Unrealized holding gains, net of deferred tax |
— | 221,964 | ||||
| Accumulated other comprehensive income |
$ | 3,116,263 | $ | 1,979,763 | ||
Recent Accounting Pronouncements
On December 31, 2008, the Securities and Exchange Commission (“SEC”) published the final rules and interpretations updating its oil and gas reporting requirements. Many of the revisions are updates to definitions in the existing oil and gas rules to make them consistent with the petroleum resource management system, which is a widely accepted standard for the management of petroleum resources that was developed by several industry organizations. Key revisions include changes to the pricing used to estimate reserves, the ability to include nontraditional resources in reserves, the use of new technology for determining reserves, and permitting disclosure of probable and possible reserves.
In January 2010, the Financial Accounting Standards Board (“FASB”) issued Accounting Standards Update (ASU) 2010-03, Extractive Activities Oil and Gas (Topic 932) — Oil and Gas Reserve Estimation and Disclosures, and in April 2010 issued ASU 2010-14, Accounting for extractive activities — Oil and Gas — Amendments to paragraph 932-10-599-1, to align the oil and gas reserve estimation and disclosure requirements of FASB ASC Topic 932, Extractive Activities — Oil and Gas, with the requirements in the SEC’s new oil and gas reporting requirements. The ASU’s are effective for the Company for the fiscal year ended June 30, 2010.
2. Fair Value Measurements
The Company’s items to which fair value measurements apply are securities available for sale. Securities available for sale are classified as Level 1 in the fair value hierarchy. These investments are traded in active markets and quoted prices are available for identical investments.
Cash balances were $18,030,155 as of June 30, 2010 and the remaining $15,561,379 was held in time deposit accounts in several Australian banks that have terms of 90 days or less, and are therefore classified as cash equivalents. The fair value of cash equivalents approximates carrying value due to the short term nature of those instruments. National Australia Bank, Ltd. (“NAB”) holds 48% of the cash and cash equivalent balance.
Assets required to be measured at fair value on a nonrecurring basis include an unproved property with significant acquisition costs and certain drilling permits which we assessed for impairment. The fair value was based on the contracted selling price, which involved Level 3 inputs. See Impairment discussion on page 62.
The following table presents the amounts of assets carried at fair value at June 30, 2010 by the level in which they are classified within the valuation hierarchy:
| Fair Value Measurements at Reporting Date Using | |||||
| Description |
Quoted Prices in
Active Markets for Identical Assets Level 1 |
Significant
Other Observable Inputs Level 2 | |||
| Securities available for sale |
$ | 192,417 | — | ||
61
Table of Contents
The following table presents the amounts of assets carried at fair value at June 30, 2009 by the level in which they are classified within the valuation hierarchy:
| Fair Value Measurements at Reporting Date Using | ||||
| Description |
Quoted Prices in
Active Markets for Identical Assets Level 1 |
Significant
Other Observable Inputs Level 2 | ||
| Securities available for sale |
903,924 | — | ||
3. Property and equipment
Property and equipment consisted of the following as of June 30:
| 2010 | 2009 | |||||||
| Oil and gas properties |
||||||||
| Subject to depletion |
$ | 109,989,733 | $ | 110,977 | ||||
| Not subject to depletion |
4,305,336 | 6,641 | ||||||
| Less assets held for sale |
(648,217 | ) | — | |||||
| Total costs |
113,646,852 | 117,617,555 | ||||||
| Less accumulated depreciation, depletion |
(94,516,696 | ) | (101,027,192 | ) | ||||
| Net oil and gas properties |
19,130,156 | 16,590,363 | ||||||
| Land, buildings and equipment |
3,328,670 | 2,962,649 | ||||||
| Less accumulated depreciation |
(2,196,040 | ) | (2,024,762 | ) | ||||
| Net Land, buildings and equipment |
1,132,630 | 937,887 | ||||||
| Field equipment |
5,843,939 | 868,504 | ||||||
| Less accumulated depreciation |
(192,742 | ) | (868,017 | ) | ||||
| Net field equipment |
5,651,197 | 487 | ||||||
| Total property and equipment, net |
$ | 25,913,983 | $ | 17,528,737 | ||||
MPC had the following amounts of depletion and depreciation costs related to oil & gas properties recorded in the consolidated statements of operations related to oil & gas properties for the years ended June 30:
| 2010 | 2009 | 2008 | |||||||
| Depletion and depreciation expense, Oil & Gas properties |
$ | 4,507,582 | $ | 6,681,468 | $ | 17,903,334 | |||
| Depletion and depreciation expense, all other assets |
172,658 | 104,484 | 117,902 | ||||||
| Total Depletion, Depreciation and Amortization |
$ | 4,680,240 | $ | 6,785,952 | $ | 18,021,236 | |||
During the years ended June 30, 2010, 2009 and 2008, the depletion rate by field was as follows:
| 2010 | 2009 | 2008 | ||||
| Percent | ||||||
| Mereenie and Palm Valley (Australia) |
32.2 | 63.8 | 45.3 | |||
| Nockatunga (Australia) |
— | 64.6 | 66.5 | |||
| Cooper Basin (Australia) |
— | 13.3 | 35.9 | |||
| Poplar Fields |
13.0 | — | — | |||
62
Table of Contents
Exploratory and Dry Hole Costs
Exploration and dry hole costs relate to the exploration work performed on MPAL’s properties. Components of these costs are as follows (see Note 14 for a summary of MPAL’s required and contingent commitments for exploration expenditures):
| Year ended June 30 | |||||||||
| Exploration and Dry Hole Costs |
2010 | 2009 | 2008 | ||||||
| Farmout, Field Monitoring and Technical Costs |
$ | 984,747 | $ | 1,807,129 | $ | 1,892,528 | |||
| Seismic Data and Acquisition Costs (1) |
288,521 | 1,367,312 | 98,168 | ||||||
| Dry Hole Drilling (2) |
— | 5,765 | 1,328,114 | ||||||
| Write off expired permits – U.K (3). |
— | 295,731 | — | ||||||
| Total |
$ | 1,273,268 | $ | 3,475,937 | $ | 3,318,810 | |||
| (1) | Seismic data costs related to the U.K. permits in 2010, Nockatunga fields in 2009, Cooper Basin and U.K. permits in 2008. |
| (2) | Dry hole costs related mostly to Cooper Basin in 2008. |
| (3) | June 30, 2009 includes a write off of expired U.K. permits of $295,000. |
Impairment Loss
The Company recorded impairment losses during 2010 of approximately $2 million, of which $1.6 million of this amount related to its Udacha assets, PEL91 and 106, located in the Cooper Basin. This loss reflected the difference in the fair value, which was based on the expected sales price, and the net book value of the assets at December 31, 2009, and is reported as an impairment loss in the statement of income. These losses related to the MPAL segment.
In addition, the Company wrote down the value of its Dingo assets (approximately $213,000) and has written off the value of U.K permits that will not be renewed ($232,000).
An impairment loss of $63,740 was recorded in 2009 relating to the decreased value of U.K. exploration permits and licenses that were recognized under purchase accounting. The losses related to the exploration permits and licenses resulted from the ongoing exploration program which did not result in discovery of reserves. These losses related to the MPAL segment.
There was no impairment loss recorded for fiscal 2008.
4. Asset Retirement Obligations
A reconciliation of the Company’s asset retirement obligations for the years ended June 30 is as follows:
| 2010 | 2009 | |||||||
| Balance at beginning of year |
$ | 9,815,262 | $ | 11,596,084 | ||||
| Liabilities incurred – acquisition of Nautilus (Note 11) |
1,649,000 | — | ||||||
| Liabilities incurred – acquisition of working interest (Note 11) |
667,218 | — | ||||||
| Liabilities settled |
— | — | ||||||
| Accretion expense |
748,209 | 531,405 | ||||||
| Revisions to estimate (1) |
(2,231,849 | ) | (625,962 | ) | ||||
| Sale of Cooper Basin assets |
(1,864,783 | ) | — | |||||
| Exchange effect |
509,499 | (1,686,265 | ) | |||||
| Balance at end of year |
$ | 9,292,556 | $ | 9,815,262 | ||||
| (1) | During the year ended June 30, 2010 and 2009, changes in expected restoration dates resulted in decreases in total asset retirement obligations. |
63
Table of Contents
5. Capital and Stock-Based Compensation
On May 27, 2009, shareholders approved an amendment to the 1998 Stock Incentive Plan (the “Plan”) which reserved for issuance an aggregate of 5,205,000 shares of the Company’s common stock in the form of non-qualified stock options, Stock appreciation rights (SARs), restricted share awards, annual awards of stock to non-employee directors and performance based awards.
Options and non-vested shares
The Plan provides for options to be issued with an exercise price of not less than fair value of the stock price on the date of the award and for a term of not greater than ten years. As of June 30, 2010, 800,000 options were available for future issuance under the Plan. However, effective August 2, 2010 the Company awarded the remaining 800,000 available options to its new Chief Financial Officer.
The following is a summary of option transactions for the three years ended June 30, 2010:
| Options Outstanding |
Expiration Dates |
Number of Shares |
Exercise Prices ($) annual weighted avg. price |
Fair Value at Grant Date | |||||
| June 30, 2008 |
530,000 | (1.51 weighted average price) | |||||||
| Awarded |
Dec. 2018 | 2,712,500 | 1.20 | $ | 1,881,362 | ||||
| June 30, 2009 |
3,242,500 | (1.25 weighted average price) | |||||||
| Awarded |
July 2019 | 387,500 | 1.20 | $ | 330,337 | ||||
| Awarded |
Oct. 2019 | 150,000 | 1.40 | $ | 115,868 | ||||
| Awarded |
Dec. 2019 | 100,000 | 1.72 | $ | 95,725 | ||||
| June 30, 2010 |
3,880,000 | (1.26 weighted average price) | |||||||
The weighted average remaining contractual term as of June 30, 2010 is 8.1 years.
Summary of Options Outstanding at June 30, 2010
| Expiration Dates |
Total Awarded | Total Vested and exercisable |
Exercise Prices ($) | |||||
| Fiscal year 2004 |
Jul. 2014 | 30,000 | 30,000 | 1.45 | ||||
| Fiscal year 2006 |
Nov. 2015 | 400,000 | 400,000 | 1.60 | ||||
| Fiscal year 2008 |
Feb. 2018 | 100,000 | 100,000 | 1.16 | ||||
| Fiscal year 2009 |
Dec. 2018 | 2,712,500 | — | 1.20 | ||||
| Fiscal year 2010: |
Jul. 2019 | 387,500 | 1.20 | |||||
| Oct. 2019 | 150,000 | 1.40 | ||||||
| Dec. 2019 | 100,000 | 1.72 | ||||||
| Total fiscal year 2010 |
637,500 | 1,700,000 | ||||||
| 3,880,000 | 2,230,000 | |||||||
All of the options have been issued with an exercise price equal to or greater than the fair value of the Company’s stock at the date of the award, which may differ from the grant date used for accounting purposes. For the years ended June 30, 2010, 2009, and 2008, the Company recorded stock-based compensation expense for the cost of stock options of $1,797,366, $83,560, and $63,141 pretax and post tax of $1,528,495, $83,560 and $63,141, respectively. These expenses have no effect on cash flow. As of June 30, 2010, 2009 and 2008, there was $645,320, $1,797,802 and $0 of total unrecognized compensation costs related to stock options.
64
Table of Contents
At June 30, 2010 the Company had 8,127,826 options and warrants outstanding that had an exercise price below the average stock price for the periods that resulted in 1,634,797 incremental dilutive shares for the respective periods. The Company also had 208,334 non-vested shares of company stock that were non-dilutive at June 30, 2010. There were no other potentially dilutive items at June 30, 2010.
During the next fiscal year ended June 30, 2011 an additional 825,000 of the above options will vest.
No options were exercised in fiscal years 2010, 2009, 2008.
Non-employee options
Of the 637,500 options awarded in the year ended June 30, 2010, 387,500 (262,500 time based and 125,000 performance based options (PBO) that included a market condition) were issued to a consultant of the Company. There were no non-employee options awarded in 2008 or 2009.
Since these options were issued to a non-employee, the Company determined their fair value at the end of each reporting period until the measurement date. The option expense is recognized in the statement of operations using the accelerated method for the time-based awards with graded vesting and over the derived term for PBO’s.
The fair value of these time-based options at June 30, 2010 was determined to be $358,951 based on the Black-Scholes valuation model using the following assumptions:
| March 31, 2010 | |||
| Risk free interest rate |
2.71 | % | |
| Expected life |
8.58 yrs | ||
| Expected volatility (based on historical price) |
62 | % | |
| Expected dividend |
$ 0 |
The expected life of the time-based options is the remaining contractual term. The Company recorded non-cash charges of $398,097 related to these time based options for the year ended June 30, 2010. There were no non-employee options awarded in 2009 or 2008. Unrecognized compensation for these options was $139,592 as of June 30, 2010. The time-based stock options vest in equal annual installments over the vesting period, which is also the requisite service period.
During the year ended June 30, 2010, the PBOs of the consultant vested upon the attainment of the market condition.
Due to the attainment of the market condition, the Company changed from a valuation approach that was appropriate for the market-conditioned based options to the Black-Scholes method for final measurement, which is consistent with the treatment of other similar instruments issued by the Company.
The fair value of the PBO’s was measured on the date vesting occurred, March 2, 2010. Based on the Black-Scholes valuation model, the fair value was determined to be $178,738. The Company recorded non-cash charges of $178,738 during the twelve months ended June 30, 2010, related to the PBOs. The variables and assumptions used in this calculation at March 2, 2010, were as follows:
| March 2, 2010 | |||
| Risk free interest rate |
3.2 | 0% | |
| Expected life |
8.8 y | rs | |
| Expected volatility (based on historical price) |
6 | 3% | |
| Expected dividend |
$ | 0 |
65
Table of Contents
Employee options
During the year ended June 30, 2010, 250,000 stock options were issued to employees as time-based options.
The Company determined the fair value of the options at the date of grant using the Black-Scholes option pricing model for the time based options. Option valuation models require the input of certain assumptions including the expected stock price volatility. The assumptions used to value the Company’s time based grants were as follows:
| Oct. 1, 2009 | Dec. 15, 2009 | May 27, 2009 | Feb. 18, 2008 | Nov. 28, 2005 | |||||||||||||||
| Risk free interest rate |
2.43 | % | 2.62 | 2.82 | % | 3.20 | % | 4.58 | % | ||||||||||
| Expected life |
5.75 | 5.75 | 6 yrs | 5 yrs | 5 yrs | ||||||||||||||
| Expected volatility (based on historical price) |
.620 | .625 | .650 | .611 | .627 | ||||||||||||||
| Expected dividend |
$ | 0 | $ | 0 | $ | 0 | $ | 0 | $ | 0 | |||||||||
The expected life of the time based employee options was determined under the “simplified” method.
The time based stock options vest in equal annual installments over the vesting period, which is also the requisite service period. Time based stock options are generally granted with a 3-year vesting period and a 10-year term. The 400,000 options granted to Directors on November 28, 2005 and 100,000 on February 18, 2008 each vested immediately.
All options vest in the event of change of control of the Company.
Vesting criteria of PBOs are determined by the Company’s compensation committee. The Monte Carlo model was used to value the PBO’s. A Monte Carlo simulation allows for the analysis of a complex security through statistical measures applied to a model that is simulated thousands of times to build distributions of potential outcomes. The variables and assumptions used in this calculation were as follows:
| May 27, 2009 | |||
| Risk free interest rate |
3.71 | % | |
| Expected volatility (based on historical price) |
70 | % | |
| Expected dividend |
$ 0 | ||
| Closing stock price as of May 27, 2009 |
$1.23 | ||
| Term |
10 years | ||
| Days until expiration (per annum) |
252 days | ||
| Steps until expiration |
2,520 | ||
| Probability of performance criteria occurring over term of options: |
|||
| Monetization of uncontracted reserves |
25% – 60 | % | |
| Change of control |
10% – 50 | % |
As of March 2, 2010, the Company’s stock closed at or above $1.50 per share for sixty (60) consecutive days. According to the provisions of the option agreement, the 875,000 employee PBO’s vested in full upon the attainment of this market condition.
As of June 30, 2010 there were 1,400,000 unvested options outstanding under the Plan with a weighted average fair value at grant date of award of $1.20 per share, 150,000 unvested options outstanding under the Plan with a weighted average fair value at grant date of award of $1.40 per share, and 100,000 unvested options outstanding under the Plan with a weighted average fair value at grant date of award of $1.72 per share.
66
Table of Contents
On March 31, 2010, the Company awarded 700,000 options to its directors. All of these options are subject to shareholder approval at the annual shareholders’ meeting to be held in November of 2010. As this approval is pending, there is no grant date for accounting purposes and, consequently, there was no financial statement impact during the year ended June 30, 2010. The options have an exercise price of $2.24, vest evenly over 3 years beginning April 1, 2011 and expire on April 1, 2020.
On March 31, 2010, the Company also awarded to its directors 350,000 non-vested shares of the Company common stock which vest over 3 years. The aggregate grant date fair value of these shares was $784,000. Of these shares 141,666 vested on April 1, 2010 and 104,167 vest on April 1, 2011 and 2012. Compensation expense of $405,787 was recorded for year ended June 30, 2010 and is included in the statements of operations for the periods then ended. Unrecorded compensation expense for these non-vested shares was $378,213 as of June 30, 2010.
6. Income Taxes
Components of income (loss) before income taxes by geographic area (in thousands) are as follows:
| Years Ended June 30, | ||||||||||||
| 2010 | 2009 | 2008 | ||||||||||
| United States |
$ | (8,456 | ) | $ | (3,845 | ) | $ | (2,119 | ) | |||
| Foreign |
9,644 | 6,708 | 7,558 | |||||||||
| Total |
$ | 1,188 | $ | 2,863 | $ | 5,439 | ||||||
Reconciliation of the provision for income taxes (in thousands) computed at the Australian statutory rate to the reported provision for income taxes is as follows:
| Years Ended June 30, | ||||||||||||
| 2010 | 2009 | 2008 | ||||||||||
| Tax provision computed at statutory rate (30)% |
$ | 356 | $ | 859 | $ | 1,632 | ||||||
| MPC (parent company) nontaxable losses |
— | 1,154 | 636 | |||||||||
| Non-taxable Australian revenue |
(953 | ) | (342 | ) | (443 | ) | ||||||
| Increase in valuation reserve for foreign (UK) exploration expenditures |
302 | 382 | 271 | |||||||||
| Australian Taxation Office settlement (a) |
— | — | 12,085 | |||||||||
| Rate differential on MPC book loss |
(338 | ) | (154 | ) | — | |||||||
| MPC capitalized facilitation costs |
201 | 268 | — | |||||||||
| MPC taxable dividend from MPAL, net of foreign tax credits |
1,690 | — | — | |||||||||
| Nondeductible warrant and stock related compensation |
2,203 | — | — | |||||||||
| MPC decrease in valuation reserve |
(648 | ) | — | — | ||||||||
| Other |
(167 | ) | 31 | 149 | ||||||||
| Consolidated income tax provision |
$ | 2,646 | $ | 2,198 | $ | 14,330 | ||||||
| Current income tax provision |
$ | 1,724 | $ | 3,816 | $ | 18,872 | ||||||
| Deferred income tax benefit |
922 | (1,618 | ) | (4,542 | ) | |||||||
| Consolidated income tax provision |
$ | 2,646 | $ | 2,198 | $ | 14,330 | ||||||
| Effective tax rate |
223 | % | 77 | % | 263 | % | ||||||
| (a) | See discussion below under Australia. |
67
Table of Contents
Significant components of the Company’s deferred tax assets and liabilities (in thousands) were as follows:
| June 30, 2010 |
June 30, 2009 |
|||||||
| Deferred tax liabilities |
||||||||
| Stepped up basis of oil and gas properties |
$ | (1,046 | ) | $ | (1,842 | ) | ||
| Other |
(195 | ) | (82 | ) | ||||
| Total deferred tax liabilities |
$ | (1,241 | ) | $ | (1,924 | ) | ||
| Deferred tax assets |
||||||||
| Acquisition and development costs |
3,045 | 2,752 | ||||||
| Asset retirement obligations |
2,127 | 2,945 | ||||||
| Net operating losses and foreign tax credits |
3,122 | 3,562 | ||||||
| United Kingdom exploration costs |
1,545 | 1,274 | ||||||
| Stock options |
— | 211 | ||||||
| Interest |
539 | 539 | ||||||
| Other |
280 | 575 | ||||||
| Total deferred tax assets |
10,658 | 11,858 | ||||||
| Valuation allowance (1) |
(5,206 | ) | (5,586 | ) | ||||
| Net deferred tax assets |
$ | 4,211 | $ | 4,348 | ||||
| (1) | The Company records a valuation allowance for deferred tax assets when management believes it is more likely than not that such assets will not be recovered. The valuation allowance decreased from the prior year due to utilization of net operating losses in the US offset by an increase in the valuation allowance for the tax benefit of U.K. exploration costs. |
Tax years that remain subject to examination are 1991, 1992, 1999, 2000, 2002 and 2006 and forward for the United Sates. Tax years that remain subject to examination for Australia are 2006 and forward for returns excluding issues previously under audit and 1997 and forward for amendment on issues previously under audit.
United States
At June 30, 2010, the Company had net operating loss and foreign tax credit carry forwards for federal and state income tax purposes, respectively, which are scheduled to expire periodically as follows (in thousands):
| Net Operating Losses | Foreign Tax Credit | |||||||||||
| Paroo USA Federal |
MPC Federal |
MPC State |
MPC Federal | |||||||||
| Expires: |
||||||||||||
| 2010 |
$ | 1,669 | $ | — | $ | — | $ | — | ||||
| 2011 |
1,764 | — | — | — | ||||||||
| 2012 |
2,856 | — | — | — | ||||||||
| 2013 |
230 | — | — | — | ||||||||
| 2019 |
96 | — | — | — | ||||||||
| 2020 |
— | — | — | 362 | ||||||||
| 2021 |
25 | — | 56 | — | ||||||||
| 2022 |
74 | 67 | 302 | — | ||||||||
| 2023 |
3 | — | 359 | — | ||||||||
| 2024 |
2 | — | — | — | ||||||||
| 2025 |
1 | 296 | 1,058 | — | ||||||||
| 2026 |
— | 1,374 | 1,341 | — | ||||||||
| 2027 |
— | — | 1,462 | — | ||||||||
| 2028 |
— | 2,071 | 2,057 | — | ||||||||
| 2029 |
— | — | 2,974 | — | ||||||||
| Total |
$ | 6,720 | $ | 3,808 | $ | 9,609 | $ | 362 | ||||
68
Table of Contents
For financial reporting purposes, a full valuation allowance has been recognized to offset the deferred tax assets related to the U.S. state tax loss carry forwards and foreign tax credit carry forwards as it is more likely than not that under current circumstances such assets will not be recovered.
Australia
The net deferred tax asset at June 30, 2010, consists of $3,045,000 primarily relating to acquisition and development costs and $2,127,000 primarily relating to asset retirement obligations which will result in tax deductions when paid.
As previously disclosed, the Australian Taxation Office (“ATO”) conducted an audit of the Australian income tax returns of MPAL and its wholly owned subsidiaries for the years 1997-2005. The ATO audit focused on certain income tax deductions claimed by Paroo Petroleum Pty. Ltd. (“PPPL”), a wholly-owned subsidiary of MPAL related to the write-off of outstanding loans made by PPPL to other entities within the MPAL group of companies. As a result of the settlement reached with the ATO, the Company recorded taxes and interest in the amount of (US) $13,252,469 ($0.31 per share) as part of the income tax provision for the year ended June 30, 2008 which included (US) $2,725,110 of interest net of the tax benefit related to the interest deduction. No additional interest related to tax matters was recorded for the year ended June 30, 2009.
There are no significant uncertain tax positions for fiscal 2010 and 2009.
7. Debt
The Company’s long-term debt consists of the following:
| June 30, 2010 | |||
| Note payable to bank in monthly installments of $36,500 plus interest, at variable rate through 2011 |
$ | 660,220 | |
| Loans payable, varying terms through 2012, collateralized by vehicles |
23,795 | ||
| 684,015 | |||
| Less current portion |
451,585 | ||
| Long-term debt, excluding current portion |
$ | 232,430 | |
The following is a summary of principal maturities of long-term debt:
| Less than 1 year |
$ | 451,585 | |
| Two years |
$ | 232,430 |
The variable rate of the note is based upon the Wall Street Journal Prime Rate (the index). The index currently is 3.250%, resulting in an interest rate of 6% per annum as of June 30, 2010. Under the note, Nautilus is subject to both financial and non-financial covenants. The financial covenant includes maintaining a debt service coverage ratio, as defined, of 1.2 to 1.0, which is calculated based on the annual tax return.
The Company also has a demand note payable, classified as short term debt, which consists of advances under a $750,000 working capital line of credit. The line bears interest at a variable rate and is 6.50% as of June 30, 2010. This line of credit matures on March 31, 2011.
The note payable to bank and the demand note payable are collateralized by first mortgages and assignment of production for the East Poplar and Northwest Poplar Fields and is guaranteed by Magellan Petroleum Corporation up to $2,000,000.
69
Table of Contents
The debt referred to above is the debt of Nautilus.
The carrying amount of the Company’s long term debt approximates its fair value, because of the variable rate, which resets based on the market.
8. Geographic Information
As of each of the stated dates, the Company’s revenue and long-lived assets (in thousands) were geographically attributable as follows:
| Years Ended June 30, | |||||||||
| 2010 | 2009 | 2008 | |||||||
| Revenue: |
|||||||||
| Australia |
$ | 25,908 | $ | 28,027 | $ | 40,662 | |||
| United States |
2,594 | — | — | ||||||
| Other Foreign Geographic areas |
23 | 164 | 233 | ||||||
| $ | 28,525 | $ | 28,191 | $ | 40,895 | ||||
| Long-lived assets: |
|||||||||
| Australia |
$ | 22,682 | $ | 20,317 | $ | 31,577 | |||
| United States |
19,354 | 660 | 8 | ||||||
| Other Foreign Geographic areas |
1,638 | 1,477 | 883 | ||||||
| $ | 43,674 | $ | 22,454 | $ | 32,468 | ||||
Substantially all of MPAL’s gas sales were to the Power and Water Corporation of the Northern Territory of Australia. Oil sales during fiscal 2010 were 47.40% to the Santos group of companies, 14.70% to the Beach Petroleum group of companies, and 9.40% to Origin Energy Resources and 28.5% to IOR Energy.
Nautilus Poplar – Presently all of the oil production from the East Poplar Unit and the Northwest Poplar Oil Field is being trucked to a terminal in Reserve, MT and sold to Nexen, Inc..
9. Sale of Cooper Basin Assets and Assets held for Sale
During the year ended June 30, 2010, the Company entered into agreements to sell all of its assets located in the Cooper Basin, Australia. The proceeds from the series of transactions to sell the Cooper Basin assets, which includes Nockatunga, Kiana, and Aldinga oil fields and other miscellaneous exploration licenses (subject to final sale agreements) are expected to total AUS $9.975 million, subject to final accounting adjustments. These assets, which related to the MPAL reporting segment, were disposed of because they are non-core to our strategies. All of these properties were previously carried in property and equipment at $20,684,459, net of accumulated depletion of $17,094,936.
The Nockatunga, Kiana and Aldinga oil fields and certain exploration licenses were sold in the twelve months ended June 30, 2010. The Company recorded a gain of approximately $6.8 million ($4.8 million net of tax) for the twelve months ended June 30, 2010, related to the sale of these assets.
The sale of the remaining Cooper Basin Assets, which includes certain associated exploration licenses, is expected to be completed in the near term. These assets and the related liabilities are included in assets held for sale and liabilities related to assets held for sale.
The Company also recorded an impairment loss in the year ended June 30, 2010 of approximately $2 million. Of this amount, $1.6 million related to its Udacha assets, PEL91 and 106, located in the Cooper Basin.
70
Table of Contents
This loss reflected the difference in the fair value, which was based on the expected sales price, and the net book value of the assets as of the dates each sale finalized during the year ended June 30, 2010, and is reported as an impairment loss in the statement of income.
Assets held for sale at June 30, 2010 consists of the following:
| Oil and gas properties |
$ | 648,217 | ||
| Liability related to assets held for sale |
(194,465 | ) | ||
| Assets held for sale |
$ | 453,752 | ||
10. Evans Shoal Agreement
On March 25, 2010, MPAL entered into an agreement with Santos Limited (Santos) to purchase Santos’ 40% interest in the Evans Shoal natural gas field (NT/P48), located in the Bonaparte Basin offshore Northern Australia.
Under the agreement, Magellan is obligated to pay Santos time-staged cash consideration equal to (AUS) $100 million for its interest in Evans Shoal on or before December 25, 2010. Magellan would also pay additional contingent payments to Santos of (AUS) $50 million upon a favorable partner vote on any final investment decision to develop Evans Shoal and (AUS) $50 million upon first stabilized gas production from NT/P 48. Closing and completion of the purchase is subject to regulatory and other approvals and is expected to occur in December 2010.
In the event the Company is unable to make the required payment on or before December 25, 2010 or to extend the time, under certain circumstances the Company could lose its rights to the (AUS) $15 million deposit.
The Company is currently working toward initiatives including but not limited to; new equity financing options, private investment and or partner contributions to meet the financial commitments related to this agreement. The first segment of the transaction was a cash deposit of (AUS) $15 million (U.S. $12.9 million) which is included in the consolidated balance sheet at June 30, 2010. In certain circumstances the Company could lose its rights to the deposit.
The Company’s exposure to market risk relates to fluctuations in foreign currency and world prices for crude oil, as well as market risk related to investment in marketable securities. The exchange rates between the Australian dollar and the U.S. dollar, have changed in recent periods and may fluctuate substantially in the future. We expect that a majority of our revenue will continue to be generated in the Australian dollar in the future.
11. Acquisitions
Acquisition of controlling member interest in Nautilus Poplar LLC
On October 15, 2009, Magellan acquired an approximate 83.5% controlling member interest in Nautilus. Based in Denver, Colorado, Nautilus owns and operates oil development assets in Roosevelt County, Montana known as the East Poplar Unit and the Northwest Poplar field. Consideration for this acquisition consisted of a cash payment totaling approximately $7.3 million, issuance of 1.7 million new shares of Company Common Stock (valued at $1.40 per share on the date of the acquisition), and the assumption of $1.6 million of debt. The controlling interest in Nautilus was purchased from White Bear LLC and YEP 1 Fund, SICAV- FIS, entities affiliated with Nikolay Bogachev, a director of the Company. In addition, Thomas Wilson, a director of the Company, has a direct ownership interest in Nautilus.
The purchase was accounted for under the acquisition method of accounting. Under this method, the purchase price is allocated to the assets acquired and liabilities assumed based on their estimated fair values. The results of Nautilus’ operations have been included in the consolidated financial statements since October 15, 2009.
71
Table of Contents
The following table presents the allocation of the acquisition cost based upon fair value estimates.
| Purchase price: |
||||
| Cash consideration |
$ | 7,309,113 | ||
| Value of Magellan common stock issued |
2,380,000 | |||
| Total consideration |
$ | 9,689,113 | ||
| Recognized amounts of identifiable assets acquired and liabilities assumed |
||||
| Cash |
$ | 314,727 | ||
| Accounts receivable |
968,847 | |||
| Other current assets |
547,620 | |||
| Oil & gas properties |
9,874,615 | |||
| Field Equipment |
3,647,000 | |||
| Other non-current assets |
387,943 | |||
| Total assets acquired |
15,740,752 | |||
| Accounts payable |
886,165 | |||
| Other current liabilities |
1,139,451 | |||
| Current portion of LTD |
505,586 | |||
| Asset retirement obligations |
1,649,000 | |||
| Other non-current liabilities |
621,477 | |||
| Total liabilities acquired |
4,801,679 | |||
| Total identifiable net assets |
10,939,073 | |||
| Less non controlling interest |
(1,924,458 | ) | ||
| Goodwill |
674,498 | |||
| Net assets acquired by Magellan Petroleum Corporation |
$ | 9,689,113 | ||
The preliminary allocation has been revised since March 31, 2010 for a revision to the asset retirement obligation which resulted in a change to goodwill.
The results of operations of Nautilus included in the consolidated statement of operations of Magellan for the period ended June 30, 2010 was net income of $65,072 on revenues of $2,291,270.
Professional services for the acquisitions approximated $300,000.
Acquisition of working interest in Poplar Fields
On March 9, 2010, the Company entered into a Purchase and Sale Agreement with Hunter Energy LLC under which the Company assumed Hunter’s 25.05% average working interests in the Poplar fields. On March 8, 2010, the Company also acquired a 1.25% average working interest in the same fields from Nautilus Technical Group (NTG). Thomas Wilson, a director and consultant for the Company owns 22.25% of NTG. Magellan itself and through its subsidiaries, now owns an 83.68% average working interests in these Montana fields, after consideration of its controlling interest in Nautilus. Nautilus will continue to serve as the operator of the Poplar Fields.
A working interest in an oil and gas property is considered a business for reporting purposes. As such, the purchases were accounted for under the acquisition method of accounting. Therefore, the purchase price is allocated to the assets acquired and liabilities assumed based on their estimated fair values. The allocation of the purchase price has been prepared based on final estimates of fair values.
72
Table of Contents
The following table presents the allocation of the acquisition costs of these transactions, based upon fair value estimates.
| Purchase price/cash consideration |
$ | 4,090,170 | |
| Recognized amounts of identifiable assets acquired and liabilities assumed |
|||
| Oil & Gas properties |
3,584,999 | ||
| Field Equipment |
1,172,389 | ||
| Total identifiable net assets |
4,757,388 | ||
| Asset retirement obligations |
667,218 | ||
| Net assets acquired by Magellan Petroleum Corporation |
$ | 4,090,170 | |
The preliminary allocation has been revised since March 31, 2010 for a revision to the oil & gas properties and the ARO liability.
Working interest revenues of $303,084 and operating costs of $191,800 from this working interest, are included in the consolidated statement of operations of Magellan for the year ended June 30, 2010.
Supplemental Pro Forma Results (Unaudited)
The following unaudited pro forma financial information represents the combined results for the Company including, Nautilus and the working interests purchased in the Poplar Fields for the three years ended June 30, 2010, 2009 and 2008, as if the acquisitions had occurred on July 1, 2008:
| Year ended June 30, 2010 |
Year ended June 30, 2009 |
Year ended June 30, 2008 |
||||||||||
| Total Revenue |
$ | 30,159,759 | $ | 32,194,261 | $ | 47,220,813 | ||||||
| Costs and expenses |
27,485,527 | 30,832,963 | 41,920,765 | |||||||||
| Operating income |
2,674,232 | 1,361,298 | 5,300,048 | |||||||||
| Other (expense) income — net |
(1,263,309 | ) | 1,527,112 | 1,988,216 | ||||||||
| Income (loss) before taxes |
1,410,923 | 2,888,410 | 7,288,264 | |||||||||
| Income tax (provision) |
(2,645,763 | ) | (2,198,422 | ) | (14,330,301 | ) | ||||||
| Net (Loss) income |
(1,234,840 | ) | 689,988 | (7,042,037 | ) | |||||||
| Less net income (loss) attributable to non-controlling interests in subsidiaries |
47,735 | 66,953 | (139,431 | ) | ||||||||
| Net (Loss) income attributable to Magellan Petroleum Corporation |
$ | (1,187,105 | ) | $ | 756,941 | $ | (7,181,468 | ) | ||||
73
Table of Contents
12. Leases
At June 30, 2010, future minimum rental payments applicable to MPC’s, MPAL’s and Nautilus’ non-cancelable office and vehicle operating leases were as follows:
| Fiscal Year |
Future Minimum Rental Payments | ||
| 2011 |
$ | 436,800 | |
| 2012 |
$ | 424,400 | |
| 2013 |
$ | 69,500 | |
| 2014 |
$ | 70,925 | |
| 2015 through 2018 |
$ | 233,986 | |
Operating lease rental expenses for each of the years ended June 30, 2010, 2009 and 2008 were $386,513, $415,760 and $473,944, respectively.
13. Segment Information
The Company has three reportable segments, MPC, its wholly owned subsidiary- MPAL and Nautilus. The Company’s chief operating decision maker is William H. Hastings (President and Chief Executive Officer) who reviews the results of the MPC, MPAL, and Nautilus businesses on a regular basis. MPC, MPAL, and Nautilus all engage in business activities from which they may earn revenues and incur expenses. MPAL and its subsidiaries are considered one segment.
74
Table of Contents
Segment information (in thousands) for the Company’s three operating segments is as follows:
| Years Ended June 30, | ||||||||||||
| 2010 | 2009 | 2008 | ||||||||||
| Revenues: |
||||||||||||
| MPC |
$ | 326 | $ | 164 | $ | 233 | ||||||
| MPAL |
25,908 | 28,027 | 40,662 | |||||||||
| Nautilus |
2,291 | — | — | |||||||||
| Total consolidated revenues |
$ | 28,525 | $ | 28,191 | $ | 40,895 | ||||||
| Investment and other income: |
||||||||||||
| MPC |
$ | 1,395 | $ | 24 | $ | 159 | ||||||
| MPAL |
1,600 | 1,559 | 1,964 | |||||||||
| Nautilus |
18 | — | — | |||||||||
| Total consolidated |
$ | 3,013 | $ | 1,583 | $ | 2,123 | ||||||
| Net (Loss) Income attributable to MPC: |
||||||||||||
| MPC |
$ | (263 | ) | $ | (885 | ) | $ | (2,177 | ) | |||
| MPAL, net of related costs |
7,569 | 4,550 | (6,715 | ) | ||||||||
| Elimination of intersegment dividend |
(8,698 | ) | (3,000 | ) | — | |||||||
| Nautilus |
(55 | ) | — | — | ||||||||
| Consolidated Net (Loss) Income attributable to MPC |
$ | (1,447 | ) | $ | 665 | $ | (8,892 | ) | ||||
| Assets: |
||||||||||||
| MPC |
$ | 90,345 | $ | 68,349 | $ | 65,555 | ||||||
| MPAL |
63,131 | 69,711 | 82,935 | |||||||||
| Nautilus |
5,427 | — | — | |||||||||
| Equity elimination |
(68,197 | ) | (66,356 | ) | (63,195 | ) | ||||||
| Total consolidated assets |
$ | 90,706 | $ | 71,704 | $ | 85,295 | ||||||
| Expenditures for additions to long-lived assets: |
||||||||||||
| MPC |
$ | 306 | $ | — | $ | — | ||||||
| Nautilus |
328 | — | — | |||||||||
| MPAL |
1,642 | 2,430 | 4,249 | |||||||||
| Total expenditures for additions to long-lived assets |
$ | 2,276 | $ | 2,430 | $ | 4,249 | ||||||
| Other significant items: |
||||||||||||
| Depletion, depreciation and amortization: |
||||||||||||
| MPC |
$ | 77 | $ | 5 | $ | 6 | ||||||
| MPAL |
4,155 | 6,781 | 18,015 | |||||||||
| Nautilus |
448 | — | — | |||||||||
| Total consolidated |
$ | 4,680 | $ | 6,786 | $ | 18,021 | ||||||
| Production costs: |
||||||||||||
| MPC |
$ | 158 | $ | — | $ | — | ||||||
| MPAL |
8,585 | 8,153 | 8,866 | |||||||||
| Nautilus |
1,373 | — | — | |||||||||
| Total consolidated |
$ | 10,116 | $ | 8,153 | $ | 8,866 | ||||||
| Exploratory and dry hole costs: |
||||||||||||
| MPC |
$ | — | $ | — | $ | — | ||||||
| MPAL |
1,273 | 3,476 | 3,319 | |||||||||
| Nautilus |
— | — | — | |||||||||
| Total consolidated |
$ | 1,273 | $ | 3,476 | $ | 3,319 | ||||||
| Income tax expense: |
||||||||||||
| MPC |
$ | 570 | $ | 41 | $ | 58 | ||||||
| MPAL |
2,076 | 2,157 | 14,272 | |||||||||
| Nautilus |
— | — | — | |||||||||
| Total consolidated |
$ | 2,646 | $ | 2,198 | $ | 14,330 | ||||||
75
Table of Contents
14. Commitments and Contingencies
The Company is exposed to oil and gas market price volatility and for gas sales uses fixed pricing contracts with inflation clauses to mitigate this exposure.
The following is a summary of our consolidated contractual obligations at June 30, 2010, in thousands:
| PAYMENTS DUE BY PERIOD | |||||||||||||||
| TOTAL | LESS THAN 1 YEAR |
1-3 YEARS | 3-5 YEARS | MORE THAN 5 YEARS | |||||||||||
| Operating lease obligations |
$ | 1,236 | $ | 437 | $ | 494 | $ | 143 | $ | 162 | |||||
| Purchase obligations (1) |
5,856 | 4,016 | 1,840 | — | — | ||||||||||
| Asset retirement obligations-undiscounted (2) |
19,739 | — | 1,529 | 289 | 17,921 | ||||||||||
| Time staged and contingent payments (3) |
77,350 | 77,350 | — | — | — | ||||||||||
| Credit facilities including interest (4) |
1,231 | 987 | 244 | — | — | ||||||||||
| Total |
$ | 105,412 | $ | 82,790 | $ | 4,107 | $ | 432 | $ | 18,083 | |||||
| (1) | Represents firm commitments for exploration and capital expenditures. Although the Company is committed to these expenditures, some may be farmed out to third parties. Exploration contingent expenditures of $22,280,000 which are not legally binding have been excluded from the table above and based on exploration decisions would be due as follows: $0 (less than 1 year), $0 (1-3 years), $21,850,000 (3-5 years), $430,000 (greater than 5 years). This figure is approximately a net $1 million decrease over prior quarters reporting. |
| (2) | During the years ended June 30, 2009 and 2010, the Company decreased total asset retirement obligations by $626,000 and $2,232,000 respectively, due to changes in cost estimates and expected restoration dates (see Note 4). |
| (3) | Relates to the Evans Shoal agreement. As the Company progresses through the different stages of this agreement, two additional contingent payments will be due of approximately $45,500,000 in December of 2012 and 2015 (Note 10). |
| (4) | Includes interest at a 6.5% based on rate at June 30, 2010. |
Gas Supply Contracts
In 1983, the MPAL and Santos (“Palm Valley Producers”) commenced the sale of gas to Alice Springs under a 1981 agreement. That agreement terminated in June 2008. In 1985, the Palm Valley Producers and Mereenie Producers (MPAL and Santos) signed agreements for the sale of gas to PWC, through its wholly-owned company Gasgo Pty. Ltd. (“Gasgo”), for use in PWC’s Darwin electricity generating station and at a number of other generating stations in the Northern Territory. The price of gas under the Palm Valley and Mereenie gas contracts is adjusted quarterly to reflect changes in the Australian Consumer Price Index. The gas is being delivered via the 922-mile Amadeus Basin gas pipeline which was built by an Australian consortium. Since 1985, there have been several additional contracts for the sale of Mereenie gas, the latest being in June 2006 for the supply of an additional 4.4 Bcf of gas to be supplied prior to December 31, 2008. The Palm Valley Darwin contract expires in the year 2012 and the principal Mereenie contracts expired in January and June 2009. Supply obligations under the Mereenie contracts ceased in June 2009, however, there is a reasonable endeavor obligation to supply certain of PWC’s requirements through September 5, 2010.
At June 30, 2010, MPAL’s commitment to supply gas under the above agreements was as follows:
| Period |
Bcf | |
| Less than one year |
0.93 | |
| Between 1-5 years |
0.50 | |
| Total |
1.43 | |
76
Table of Contents
15. Selected Quarterly Financial Data (Unaudited)
The following is a summary (in thousands, except for per share amounts) of the quarterly results of operations for the years ended June 30, 2010 and 2009:
| September
30, 2009 3 Months |
December
31, 2009 3 Months |
March
31, 2010 3 Months |
June
30, 2010 3 Months |
|||||||||||||
| 2010 |
||||||||||||||||
| Total revenues |
$ | 8,879 | $ | 9,716 | $ | 5,137 | $ | 4,793 | ||||||||
| Costs and expenses (includes warrant expense) |
(10,974 | ) | (8,835 | ) | (2,820 | ) | (7,721 | ) | ||||||||
| Investment and other income |
1,497 | 1,038 | 327 | 151 | ||||||||||||
| Income tax (provision) benefit |
(699 | ) | (323 | ) | (1,464 | ) | (160 | ) | ||||||||
| Net (Loss) Income |
$ | (1,297 | ) | $ | 1,596 | $ | 1,180 | $ | (2,937 | ) | ||||||
| Net (Loss) Income attributable to MPC |
$ | (1,297 | ) | $ | 1,592 | $ | 1,162 | $ | (2,905 | ) | ||||||
| Per share (basic & diluted) attributable to MPC |
$ | (0.03 | ) | $ | 0.03 | $ | 0.02 | $ | (0.06 | ) | ||||||
| Average number of shares outstanding |
49,546 | 51,680 | 51,990 | 52,336 | ||||||||||||
| September
30, 2008 3 Months |
December
31, 2008 3 Months |
March
31, 2009 3 Months |
June
30, 2009 3 Months |
|||||||||||||
| 2009 |
||||||||||||||||
| Total revenues |
$ | 10,439 | $ | 5,172 | $ | 5,523 | $ | 7,057 | ||||||||
| Costs and expenses |
(7,959 | ) | (5,436 | ) | (6,489 | ) | (7,027 | ) | ||||||||
| Investment and other income |
628 | 460 | 274 | 221 | ||||||||||||
| Income tax (provision) benefit |
(1,600 | ) | (721 | ) | 1,083 | (960 | ) | |||||||||
| Net income (loss) |
$ | 1,508 | $ | (525 | ) | $ | 391 | $ | (709 | ) | ||||||
| Per share (basic & diluted) |
$ | 0.04 | $ | (0.01 | ) | $ | 0.01 | $ | (0.02 | ) | ||||||
| Average number of shares outstanding |
41,500 | 41,500 | 41,500 | 41,500 | ||||||||||||
16. Related Party and Other Transactions
Mr. Timothy L. Largay, a director of the Company through December 2008, is a partner of the law firm of Murtha Cullina LLP, which firm was paid fees of $347,361 and $689,652 and $264,170 by the Company in fiscal years 2010, 2009 and 2008, respectively. At June 30, 2010, 2009 and 2008, the Company’s payables included $69,882, $50,812, and $22,196, respectively, owed to Murtha Cullina, LLP. Mr. Whittemore serves as the Company’s corporate Secretary and is also a partner in the law firm of Murtha Cullina, LLP.
The Company leases its Denver office (the office of Nautilus) from an entity owned partially by Thomas Wilson, a director of and consultant to the Company. The lease is month to month. The total rent paid to the related parties from October 15, 2009 (the date of the Nautilus acquisition – Note 11) to June 30, 2010 was $51,683.
In July 2009, Young Energy Prize, S.A. (“YEP”), a Luxembourg entity whose Chairman and CEO is Nikolay Bogachev, a director of the Company, purchased from the Company 8,698,652 shares of common stock, plus a warrant to purchase an additional 4,347,826 shares. Subsequent to June 30, 2010, YEP has agreed to purchase an additional 5.2 million shares of the Company’s common stock.
On October 15, 2009, the Company acquired an approximate 83.5% controlling member interest in Nautilus (Note 11). The controlling interest in Nautilus was purchased from White Bear LLC and YEP I, SICAV- FIS, entities affiliated with Nikolay Bogachev, a director of the Company. In addition, Thomas Wilson, a director of the Company, continues to have a direct ownership interest in Nautilus.
77
Table of Contents
On March 8, 2010, the Company acquired a 1.25% average working interest in East Poplar Unit and Northwest Poplar fields in Roosevelt County, Montana, from Nautilus Technical Group (NTG). Mr. Wilson owns 22.25% of NTG.
Accounts receivable — working interest partners, includes $13,300 due from NTG as of June 30, 2010
Accounts payable includes $14,512 due to NTG for its portion of June sales not distributed at June 30, 2010
Accounts receivable includes $311,777 due from NTG as of June 30, 2010.
Mr. J. Robinson West, a director of the Company has served as a consultant on various Australian projects. Mr. West is Chairman, Founder and CEO of PFC Energy and has been paid $39,745 in fiscal year 2010. At June 30, 2010 the Company’s payables included $110,779 owed PFC Energy.
Mr. Monty Hoffman, consultant to Nautilus, is a partner in NTG, which has an interest in Nautilus Poplar, LLC.
Mr. Wayne Kahnmeyer, controller of Nautilus, is a 1% interest owner in NTG, which has an interest in Nautilus Poplar, LLC.
17. Supplementary Oil and Gas Disclosure (Unaudited)
The consolidated data presented herein include estimates which should not be construed as being exact and verifiable quantities. The reserves may or may not be recovered, and if recovered, the cash flows therefrom, and the costs related thereto, could be more or less than the amounts used in estimating future net cash flows. Moreover, estimates of proved reserves may increase or decrease as a result of future operations and economic conditions, and any production from these properties may commence earlier or later than anticipated.
In June 2010, the Company adopted revised oil and gas reserve estimation and disclosure rules. The primary impact of the new disclosure is to conform the definition of proved reserves to the definition now included in the SEC “Modernization of Oil and Gas Reporting Release”, which was released by the SEC in December of 2008. The new rules revised the definition of proved oil and gas reserves to require that the average, first-day-of-the-month price during the 12-month period before the end of the year rather than the year-end price, must be used when estimating whether reserve quantities are economical to produce. This same 12-month average price is also used in calculating the aggregate amount of (and changes in) future cash inflows related to the standardized measure of discounted future net cash flows.
As part of the new disclosure requirements, we are required to define our geographic areas about which we will be reporting detailed oil and gas data. The revised rules require disclosing certain information by geographic area that represents 15% or more of our total proved reserves. A geographical area as defined by the SEC represents either 1) by individual country 2) by groups of countries within a continent or 3) by continent as deemed meaningful for disclosures by the Company. We have determined that for meaningful disclosure, we will continue to disclose Australia as a geographic area even though it does not presently represent 15% of our fiscal 2010 reserves. Therefore the geographic areas will include the United States and Australia. All other geographic areas not representing a significant geographic area are reported below as “All other foreign Geographic areas”.
Reserve Estimation
The Company has limited management and staff and is dependent upon partnering arrangements. The Company and its affiliates had approximately 39 total employees as of June 30, 2010, and we expect that we will continue to require the services of independent consultants and contractors to perform various professional services, including reservoir engineering.
78
Table of Contents
United States — The Company’s subsidiary, Nautilus, employs an internal petroleum engineer who works closely with management to ensure the integrity, accuracy and timeliness of data furnished to the independent petroleum consultants for their reserves review process. The reserve reports were prepared by Mr. Naing Aye. Mr. Aye holds a Bachelor of Science — Petroleum Engineering Degree from the Colorado School of Mines. He has the responsibility for maintaining the reserve software program and has been preparing the in-house reserve estimates. He has worked over 6 years in the Petroleum Industry, including 4 years of reserve evaluation experience. Mr. Aye is a member of the Society of Petroleum Engineers. Mr. Aye met the requirements with regards to qualifications, independence, objectivity and confidentiality set forth in the Standards Pertaining to the Estimating and Auditing of Oil and Gas Reserves Information promulgated by the Society of Petroleum Engineers. The Company then has consultants perform an audit and the differences are reviewed with our senior geologist. No differences were identified in the review of the reserves estimate as of June 30, 2010.
At June 30, 2010, Allen & Crouch Petroleum Engineers, an independent petroleum consultant, conducted an audit of our United States reserves. These engineers were selected for their geographic expertise and their historical experience in engineering certain properties. At June 30, 2010, these consultants reviewed 100% of our U.S proved, probable and possible reserves. A copy of the summary reserve report of this independent petroleum consultant is included as Exhibit 99.1 to this Annual Report on Form 10-K. Allen & Crouch does not own an interest in any of Magellan’s oil and gas properties and is not employed by Magellan on a contingent basis.
Nautilus staff met with the independent engineers to discuss the assumptions and methods used in the proved reserve estimation process. We provide historical information to our consultants for our properties such as ownership interest; oil and gas production; well test data; commodity prices and operating and development costs.
Australia — RISC Pty Ltd (RISC), an independent petroleum engineering firm, has reviewed the estimate of the Company’s Australian oil and gas reserves as of June 30, 2010. David Capon, the person responsible for the review of the proved reserves estimates meet the requirements with regards to qualifications, independence, objectivity and confidentiality set forth in the Standards Pertaining to the Estimating and Auditing of Oil and Gas Reserves Information promulgated by the Society of Petroleum Engineers. RISC does not own an interest in any of Magellan’s oil and gas properties and is not employed by Magellan on a contingent basis.
The Company’s internal geosciences professional staff worked closely with RISC to ensure the integrity, accuracy and timeliness of the data used to calculate the proved oil and gas reserves. Magellan staff met with RISC to discuss the assumptions and methods used in the proved reserve estimation process. Magellan provided historical information to RISC for the oil and gas properties such as ownership interest; oil and gas production; well test data; commodity prices and operating and development costs. The preparation of the Company’s proved reserve estimates are completed in accordance with our internal control procedures, which include the verification of input data used by RISC, as well as management review and approval. At June 30, 2010, these consultants reviewed 100% of our Australian proved, probable and possible reserves. A copy of the summary reserve report of the independent petroleum consultant is included as Exhibit 99.2 to this Annual Report on Form 10-K.
All other Foreign Geographic areas — includes operations in the U.K. and our carried interest in gas fields in Canada. There were no proved reserves reported in either of these areas.
Technologies used to determine Proved Reserve Estimate
A variety of methodologies are used to determine our proved reserve estimates. The principal methodologies employed are decline curve analysis, volumetric, production type curve matching and analogy. Some combination of these methods is used to determine reserve estimates in substantially all of our fields.
The SEC defines proved reserves as those volumes of crude oil; condensate, natural gas liquids and natural gas that geological and engineering data demonstrate with reasonable certainty are recoverable in future years
79
Table of Contents
from known reservoirs under existing economic and operating conditions. Proved developed reserves are those proved reserves, which can be expected to be recovered from existing wells with existing equipment and operating methods. Proved undeveloped reserves are volumes expected to be recovered from new wells on undrilled acreage or from existing wells where a relatively major expenditure is required for recompletion. Reserves on undrilled acreage shall be limited to those drilling units offsetting productive units that are reasonably certain of production when drilled. Proved reserves for other undrilled units can be claimed only where it can be demonstrated with certainty that there is continuity of production from the existing productive formation. Proved undeveloped reserves can only be assigned to acreage for which improved recovery technology is contemplated when such techniques have been proven effective by actual tests in the area and in the same reservoir. Undrilled locations can be classified as having undeveloped reserves only if a development plan has been adopted indicating they are scheduled to be drilled within five years, unless specific circumstances, justify a longer time.
Production quantities shown in table below are net volumes withdrawn from reservoirs. These may differ from sales quantities due to inventory changes, and, especially in the case of natural gas, volumes consumed for fuel and/or shrinkage from extraction of natural gas liquids. The reported value of proved reserves is not necessarily indicative of either fair market value or present value of future net cash flows because prices, costs and governmental policies do not remain static, appropriate discount rates may vary, and extensive judgment is required to estimate the timing of production. Other logical assumptions would likely have resulted in significantly different amounts.
Changes in our proved reserves for the three years ended June 30, 2010 were as follows:
| Total | Australia | United States | All other Foreign Geographic areas |
|||||||||||||||||||
| Proved Reserves: | Oil (a) | Gas (a) | Oil | Gas (c) | Oil (b) | Gas | Oil | Gas | ||||||||||||||
| June 30, 2007 |
722 | 13.53 | 722 | 13.47 | — | — | .06 | |||||||||||||||
| Extensions and discoveries |
141 | 0.09 | 141 | — | — | — | .09 | |||||||||||||||
| Revision of previous estimates |
125 | (0.65 | ) | 125 | (0.65 | ) | — | — | — | |||||||||||||
| Production |
(210 | ) | (5.79 | ) | (210 | ) | (5.71 | ) | — | — | (0.08 | ) | ||||||||||
| June 30, 2008 |
778 | 7.18 | 778 | 7.11 | — | — | 0.07 | |||||||||||||||
| Extensions and discoveries |
0 | 0.05 | — | — | 0.05 | |||||||||||||||||
| Revision of previous estimates |
371 | 1.38 | 371 | 1.38 | — | |||||||||||||||||
| Production |
(153 | ) | (5.23 | ) | (153 | ) | (5.16 | ) | — | — | (0.07 | ) | ||||||||||
| June 30, 2009 |
996 | 3.38 | 996 | 3.33 | — | — | — | 0.05 | ||||||||||||||
| Extensions and discoveries (g) |
6,963 | — | — | — | 6,963 | |||||||||||||||||
| Revision of previous estimates (f) |
(768 | ) | 1.64 | (694 | ) | 1.63 | (74 | ) | 0.01 | |||||||||||||
| Improved recovery |
— | — | — | — | ||||||||||||||||||
| Purchases of minerals in place (d) |
2,631 | — | — | — | 2,631 | |||||||||||||||||
| Sales of minerals in place (e) |
(205 | ) | — | (205 | ) | — | — | — | — | |||||||||||||
| Production |
(139 | ) | (3.49 | ) | (97 | ) | (3.43 | ) | (42 | ) | — | (0.06 | ) | |||||||||
| June 30, 2010 (b) |
9,478 | 1.53 | — | 1.53 | 9,478 | — | — | — | ||||||||||||||
| Proved Developed Reserves: |
||||||||||||||||||||||
| June 30, 2008 |
520 | 7.18 | 520 | 7.11 | — | — | — | 0.07 | ||||||||||||||
| June 30, 2009 |
789 | 3.38 | 789 | 3.33 | — | — | — | 0.05 | ||||||||||||||
| June 30, 2010 |
2,515 | 1.53 | — | 1.53 | 2,515 | — | — | — | ||||||||||||||
| Proved Undeveloped Reserves: |
||||||||||||||||||||||
| June 30, 2008 |
258 | — | 258 | — | — | — | — | — | ||||||||||||||
| June 30, 2009 |
207 | — | 207 | — | — | — | — | — | ||||||||||||||
| June 30, 2010 |
6,963 | — | — | — | 6,963 | — | — | — | ||||||||||||||
| (a) | oil reserves stated in 1,000 Bbls: natural gas reserves stated in Bcf |
80
Table of Contents
| (b) | proved U.S. oil reserves at June 30, 2010 includes 1,124 Bbls attributable to a consolidated subsidiary in which there is an 16.5% non- controlling interest. |
| (c) | The amount of proved reserves applicable to the Australian Gas only reflects the amount of gas committed to specific contracts and are net of royalties. |
| (d) | Purchases of minerals in place during 2010 relate to Poplar Field acquisitions. |
| (e) | Sales of minerals in place during 2010 relate to the Cooper basin asset sales. |
| (f) | Revisions of estimates for each period presented represent upward (downward) changes in previous estimates attributable to new information gained primarily from development activity & production history and changes to the economic conditions present at the time of each estimate. |
| (g) | We evaluated the assets acquired in October 2009 and through petro physical geophysical and petro graphic data indentified certain locations as proved undeveloped reserves based on our current proved developed wells. |
There were no changes to proved reserves relating to improved recovery, purchase of minerals in place or sales of mineral in place for the years ended June 30, 2009, or 2008.
No wells were drilled during the twelve months ended June 30, 2010.
The volumes and standardized measure reported for our Australian reserves are just for the Palm Valley area. The proved reserves in our Mereenie area at June 30, 2009 have been produced or revised down to zero as there is not sufficient history to show that the reduced cost structure of converting to an oil only play is economic.
| Oil and Gas Production: | Total | Australia | United States | All other | ||||||||
| Total US | ||||||||||||
| Oil | Gas | Oil (1) |
Gas (2) |
Oil (3) | Gas | |||||||
| 2010 |
139 | 3.486 | 97 | 3.430 | 42 | 0.056 | ||||||
| 2009 |
153 | 5.229 | 153 | 5.161 | — | 0.068 | ||||||
| 2008 |
210 | 5.784 | 210 | 5.707 | — | 0.077 | ||||||
| 1) |
Australia oil production by field (000 bbl) | |||||||
| 2010 | 2009 | 2008 | ||||||
| Mereenie | 68 | 90 | 95 | |||||
| Nockatunga | 28 | 61 | 108 | |||||
| Cooper Basin | 1 | 2 | 7 | |||||
| 97 | 153 | 210 | ||||||
| 2) |
Australia gas production by field (bcf) | |||||||
| 2010 | 2009 | 2008 | ||||||
| Palm Valley | 1.166 | 1.165 | 1.319 | |||||
| Mereenie | 2.264 | 3.996 | 4.388 | |||||
| 3.430 | 5.161 | 5.707 | ||||||
| 3) |
U.S. Oil production by field | |||||||
| 2010 | ||||||||
| East Poplar | 32 | |||||||
| Northwest Poplar | 10 | |||||||
| 42 | ||||||||
Note: Sales and cost per unit of production are included in tables in Item 1.
81
Table of Contents
Costs of Oil and Gas Activities (In thousands):
| Fiscal Year 2010: |
Total | Australia | United States | All other | ||||
| Acquisition of properties: |
||||||||
| Proved |
13,456 | — | 13,456 | — | ||||
| Unproved |
— | — | — | — | ||||
| Exploration Costs |
1,844 | 714 | — | 1,127 | ||||
| Development Costs |
1,742 | 1,428 | 314 | — | ||||
| Fiscal Year 2009: |
Total | Australia | United States | All other | ||||
| Acquisition of properties: |
||||||||
| Proved |
— | — | — | — | ||||
| Unproved |
— | — | — | — | ||||
| Exploration Costs |
3,925 | 3,439 | — | 486 | ||||
| Development Costs |
631 | 631 | — | — | ||||
| Fiscal Year 2008: |
Total | Australia | United States | All other | ||||
| Acquisition of properties: |
||||||||
| Proved |
— | — | — | — | ||||
| Unproved |
— | — | — | — | ||||
| Exploration Costs |
3,810 | 3,260 | — | 550 | ||||
| Development Costs |
1,200 | 1,200 | — | — | ||||
| Exploration costs have been expensed except for capitalized costs relating to drilling in the U.K. of $486,000 and $550,000, for 2009 and 2008, respectively. |
| Development costs have been capitalized. |
The carrying value of our consolidated oil and gas properties as of June 30, 2010, and 2009 were as follows (in thousands):
| 2010 |
Total | Australia | United States | All other | |||||||||||
| Oil and gas Properties subject to Depreciation, Depletion, and Amortization |
$ | 109,990 | $ | 96,538 | $ | 13,452 | — | ||||||||
| Oil and gas Properties not subject to Depreciation, Depletion, and Amortization |
4,306 | 415 | 314 | 3,577 | |||||||||||
| Accumulated Depreciation, Depletion, and Amortization O&G properties |
(94,699 | ) | (94,244 | ) | (455 | ) | — | ||||||||
| 19,597 | 2,709 | 13,311 | 3,577 | ||||||||||||
| Less assets held for sale — net |
(648 | ) | (648 | ) | — | — | |||||||||
| Net Capitalized costs |
$ | 18,949 | $ | 2,061 | $ | 13,311 | $ | 3,577 | |||||||
| 2009 |
Total | Australia | United States | All other | |||||||||||
| Oil and gas Properties subject to Depreciation, Depletion, and Amortization |
$ | 110,977 | $ | 110,977 | — | — | |||||||||
| Oil and gas Properties not subject to Depreciation, Depletion, and Amortization |
6,641 | 3,486 | — | 3,155 | |||||||||||
| Accumulated Depreciation, Depletion, and Amortization O&G properties |
(101,027 | ) | (101,027 | ) | — | — | |||||||||
| Net Capitalized costs |
$ | 16,591 | $ | 13,436 | — | $ | 3,155 | ||||||||
82
Table of Contents
Discounted Future Net Cash Flows:
Year-end prices applied to proved reserves to calculate the standardized measure for each of the three years presented is as follows:
| At June 30, | ||||||
| 2010 | 2009 | 2008 | ||||
| Australian $: | ||||||
| Gas Prices (per MCF) |
||||||
| Palm Valley (1) |
2.2542 | 2.2532 | 2.2312 | |||
| Mereenie (2) |
||||||
| DAR85 |
N/A | N/A | 2.2904 | |||
| MSA2 |
N/A | N/A | 3.8378 | |||
| MSA4 |
N/A | 6.663 | N/A | |||
| Oil Prices (per BBL) (3) |
||||||
| Mereenie |
N/A | 95.73 | 147.44 | |||
| Cooper |
||||||
| Aldinga |
N/A | 97.80 | 138.24 | |||
| Kiana |
N/A | 87.66 | 129.07 | |||
| Nockatunga |
N/A | 90.82 | 124.55 | |||
| U.S. $: | ||||||
| Oil Prices (per BBL) (4) |
||||||
| East Poplar and NW Poplar fields |
66.24 | N/A | N/A | |||
| (1) | Contract price through term of contract. |
| (2) | Year end contract price. |
| (3) | Year end 6/30/2010 no proved reserves, yearend price for 2009 and 2008. |
| (4) | Average twelve month price on the first of the month. |
83
Table of Contents
The following is the standardized measure of discounted (at 10%) future net cash flows (in thousands) relating to proved oil and gas reserves during the three years ended June 30, 2010. These amounts were calculated using prices and costs in effect for each individual property as of June 30 for each year. These prices were not changed except where different prices were fixed and determinable from applicable contracts.
| Australia (in thousands): |
2010 | 2009 | 2008 | |||||||||
| Future cash inflows |
$ | 3,031 | $ | 88,152 | $ | 137,791 | ||||||
| Future production costs |
(1,870 | ) | (46,440 | ) | (60,969 | ) | ||||||
| Future development costs |
(1,780 | ) | (16,532 | ) | (26,401 | ) | ||||||
| Future income tax expense |
(297 | ) | (2,493 | ) | (8,157 | ) | ||||||
| Future net cash flows |
(916 | ) | 22,687 | 42,264 | ||||||||
| 10% annual discount for estimating timing of cash flows |
1,062 | (2,632 | ) | (2,884 | ) | |||||||
| Standardized measures of discounted future net cash flows |
$ | 146 | $ | 20,055 | $ | 39,380 | ||||||
| United States (in thousands): |
2010 | 2009 | 2008 | |||||||||
| Future cash inflows |
$ | 627,842 | — | — | ||||||||
| Future production costs |
(251,335 | ) | — | — | ||||||||
| Future development costs |
(27,293 | ) | — | — | ||||||||
| Future income tax expense |
(132,843 | ) | — | — | ||||||||
| Future net cash flows |
216,371 | — | — | |||||||||
| 10% annual discount for estimating timing of cash flows |
(131,163 | ) | — | — | ||||||||
| Standardized measures of discounted future net cash flows |
$ | 85,208 | — | — | ||||||||
| All other Geographic Areas (in thousands): |
2010 | 2009 | 2008 | |||||||||
| Future cash inflows |
— | $ | 80 | $ | 380 | |||||||
| Future production costs |
— | (70 | ) | (129 | ) | |||||||
| Future development costs |
— | — | — | |||||||||
| Future income tax expense |
— | (3 | ) | (63 | ) | |||||||
| Future net cash flows |
— | 7 | 188 | |||||||||
| 10% annual discount for estimating timing of cash flows |
— | 1 | (6 | ) | ||||||||
| Standardized measures of discounted future net cash flows |
— | $ | 8 | $ | 182 | |||||||
| Total (in thousands): |
2010 | 2009 | 2008 | |||||||||
| Future cash inflows |
$ | 630,873 | $ | 88,232 | $ | 138,171 | ||||||
| Future production costs |
(253,205 | ) | (46,510 | ) | (61,098 | ) | ||||||
| Future development costs |
(29,073 | ) | (16,532 | ) | (26,401 | ) | ||||||
| Future income tax expense |
(133,140 | ) | (2,496 | ) | (8,220 | ) | ||||||
| Future net cash flows |
215,455 | 22,694 | 42,452 | |||||||||
| 10% annual discount for estimating timing of cash flows |
(130,101 | ) | (2,631 | ) | (2,890 | ) | ||||||
| Standardized measures of discounted future net cash flows |
$ | 85,354 | $ | 20,063 | $ | 39,562 | ||||||
84
Table of Contents
The following are the principal sources of changes in the above standardized measure of discounted future net cash flows for the Australia (in thousands).
| 2010 | 2009 | 2008 | ||||||||||
| Net change in prices and production costs |
$ | — | $ | (13,429 | ) | $ | 31,551 | |||||
| Extensions and discoveries |
— | — | — | |||||||||
| Revision of previous quantity estimates |
1,850 | 1,045 | (1,351 | ) | ||||||||
| Changes in estimated future development costs |
10,997 | (5,006 | ) | |||||||||
| Divestiture of reserves |
(11,687 | ) | ||||||||||
| Sales and transfers of oil and gas produced |
(12,299 | ) | (18,169 | ) | (30,637 | ) | ||||||
| Previously estimated development cost incurred during the period |
— | (1,124 | ) | (696 | ) | |||||||
| Accretion of discount |
— | 621 | 1,847 | |||||||||
| Net change in income taxes |
2,227 | 4,463 | 1,160 | |||||||||
| Net change in exchange rate |
— | (3,903 | ) | 4,847 | ||||||||
| $ | (19,909 | ) | $ | (19,499 | ) | $ | 1,715 | |||||
The following are the principal sources of changes in the above standardized measure of discounted future net cash flows for the United States for 2010. There were no Untied States reserves in 2009 or 2008. (in thousands).
| 2010 | ||||
| Net change in prices and production costs |
$ | — | ||
| Extensions and discoveries |
115,092 | |||
| Acquisition of reserves |
29,656 | |||
| Revision of previous quantity estimates |
(8,258 | ) | ||
| Changes in estimated future development costs |
— | |||
| Sales and transfers of oil and gas produced |
(1,064 | ) | ||
| Previously estimated development cost incurred during the period |
— | |||
| Accretion of discount |
1,725 | |||
| Net change in income taxes |
(53,722 | ) | ||
| Changes in timing and other |
1,779 | |||
| $ | 85,208 | |||
85
Table of Contents
Results of Operations
The following are the Company’s results of operations (in thousands) for the oil and gas producing activities during the three years ended June 30, 2010:
| Total | United States | Australia | All other Foreign geographic areas |
|||||||||||||||||||||||||||||||||||||||
| 2010 | 2009 | 2008 | 2010 | 2009 | 2008 | 2010 | 2009 | 2008 | 2010 | 2009 | 2008 | |||||||||||||||||||||||||||||||
| Revenues: |
||||||||||||||||||||||||||||||||||||||||||
| Oil sales |
$ | 9,887 | 11,480 | 19,786 | $ | 2,594 | — | — | $ | 7,292 | 11,480 | 19,786 | $ | — | — | — | ||||||||||||||||||||||||||
| Gas sales |
13,615 | 14,740 | 18,523 | — | — | — | 13,593 | 14,576 | 18,289 | 23 | 164 | 233 | ||||||||||||||||||||||||||||||
| Other production income |
3,984 | 1,971 | 2,586 | — | — | — | 3,984 | 1,971 | 2,587 | — | — | — | ||||||||||||||||||||||||||||||
| Total revenues |
27,486 | 28,191 | 40,895 | 2,594 | — | — | 24,869 | 28,027 | 40,662 | 23 | 164 | 233 | ||||||||||||||||||||||||||||||
| Costs: |
||||||||||||||||||||||||||||||||||||||||||
| Production costs |
10,116 | 8,153 | 8,866 | 1,530 | — | — | 8,586 | 8,153 | 8,866 | — | — | — | ||||||||||||||||||||||||||||||
| Depletion, exploratory and dry hole costs |
5,953 | 10,476 | 21,222 | 525 | — | — | 4,868 | 8,773 | 20,187 | 560 | 1,703 | 1,035 | ||||||||||||||||||||||||||||||
| Total costs |
16,069 | 18,629 | 30,088 | 2,055 | — | — | 13,454 | 16,926 | 29,053 | 560 | 1,703 | 1,035 | ||||||||||||||||||||||||||||||
| Income before taxes |
11,417 | 9,562 | 10,807 | 539 | — | — | 11,415 | 11,101 | 11,609 | (537 | ) | (1,539 | ) | (802 | ) | |||||||||||||||||||||||||||
| Income tax provision* |
(3,640 | ) | (2,860 | ) | (3,230 | ) | (216 | ) | — | — | (3,425 | ) | (2,860 | ) | (3,230 | ) | ||||||||||||||||||||||||||
| Net income from operations |
$ | 7,776 | 6,702 | 7,577 | $ | 323 | — | — | $ | 7,990 | 8,241 | 8,379 | $ | (537 | ) | (1,539 | ) | (802 | ) | |||||||||||||||||||||||
| Depletion per unit of production |
A$ | 6.82 | A$ | 8.39 | A$ | 14.66 | $ | 6.50 | $ | 6.82 | $ | 8.39 | $ | 14.66 | ||||||||||||||||||||||||||||
| U$ | 6.50 | |||||||||||||||||||||||||||||||||||||||||
| * | Income tax provision used for Australia is based on a rate of 30%. The United States 40% is due to a 25% Canadian withholding tax on Kotaneelee gas sales. |
18. Subsequent Events
The Company has evaluated subsequent events and noted no additional events that require recognition or disclosure at June 30, 2010, other than those listed below.
On August 3, 2010, Magellan announced that the Board of Directors appointed Antoine J. Lafargue as its new Chief Financial Officer (CFO) and Treasurer.
On August 5, 2010, Magellan executed a Securities Purchase Agreement and an Investor’s Agreement to finalize the terms of its previously announced second Private Investment in a Public Equity (“PIPE”) with its largest stockholder, Young Energy Prize S.A. (“YEP”), a Luxembourg corporation. The placement involves the issuance and sale of up to 5.2 million new shares of the Company’s common stock, $0.01 par value per share to YEP and/or one or more of its affiliates in return for $3.00 per new share issued and sold. Placement of the shares is expected to occur in one or more closings through December 25, 2010, with the proceeds to be used to cover operating and financing expenditures associated with the purchase by MPAL of the 40% interest in the Evans Shoal field (see Note 10). The share purchase price is approximately 63% above the Common Stock closing price on August 6, 2010. If all shares are placed, the ownership position of YEP and its affiliates in the Company will consist of approximately 15.5 million shares of Common Stock and 4.4 million shares of Common Stock issuable under YEP’s existing warrant, or approximately 33% of the outstanding shares of Common Stock, assuming the full exercise of such warrant.
86
Table of Contents
| Item 9. | Changes in and Disagreements with Accountants on Accounting and Financial Disclosure |
None
| Item 9A. | Controls and Procedures |
Disclosure Controls and Procedures
An evaluation was performed under the supervision and with the participation of the Company’s management, including William H. Hastings, the Company’s President and Chief Executive Officer (“CEO”), and Antoine J. Lafargue, the Company’s Chief Financial Officer (“CFO”), of the effectiveness of the design and operation of the Company’s disclosure controls and procedures (as defined in Rule 13a-15(e) and Rule 15d-15(e) promulgated under the Securities and Exchange Act of 1934, the “Exchange Act”) as of June 30, 2010. Based on this evaluation, the Company’s CEO and CFO concluded that the Company’s disclosure controls and procedures were effective such that the material information required to be included in the Company’s Securities and Exchange Commission reports is recorded, processed, summarized and reported within the time periods specified in SEC rules and forms relating to the Company, including its consolidated subsidiaries, and the information required to be disclosed was accumulated and communicated to management as appropriate to allow timely decisions for disclosure.
Internal Control Over Financial Reporting
Internal control over financial reporting (as defined in Rule 13a-15(f) adopted under the Exchange Act) is a process designed to provide reasonable assurance regarding the reliability of financial reporting and the preparation of financial statements in accordance with accounting principles generally accepted in the United States of America. Internal control over financial reporting includes those policies and procedures that (1) pertain to the maintenance of records that, in reasonable detail, accurately and fairly reflect the transactions and dispositions of the Company’s assets; (2) provide reasonable assurance that transactions are recorded as necessary to permit preparation of financial statements in accordance with accounting principles generally accepted in the United States of America, and that the Company’s receipts and expenditures are being made only in accordance with authorizations of the Company’s management and directors; and (3) provide reasonable assurance regarding prevention or timely detection of unauthorized acquisition, use, or disposition of the company’s assets that could have a material effect on the consolidated financial statements.
Management acknowledges its responsibility for establishing and maintaining adequate internal control over financial reporting. We have used the criteria established in Internal Control — Integrated Framework issued by the Committee of Sponsoring Organizations of the Treadway Commission (COSO) in conducting our evaluation of the effectiveness of the internal control over financial reporting. Based on our evaluation, we concluded that the Company’s internal control over financial reporting was effective as of June 30, 2010. During fiscal year 2010, the Company acquired a controlling interest in Nautilus Poplar LLC. While the company has begun the process of incorporating its controls and procedures into Nautilus Poplar LLC, management did not complete the documentation, evaluation and testing of internal controls over the financial reporting of Nautilus Poplar LLC as of June 30, 2010. Therefore, the Company did not include Nautilus Poplar LLC in its assessment of the effectiveness of the company’s internal controls over financial reporting as of June 30, 2010.
This annual report does not include an attestation report of the Company’s independent registered public accounting firm regarding internal control over financial reporting. Management’s report was not subject to attestation by the Company’s independent registered public accounting firm pursuant to Section 989G of the Dodd-Frank Act of 2010 that permits the Company to provide only management’s report in this annual report.
Limitations
Because of its inherent limitations, internal control over financial reporting and procedures may not prevent or detect misstatements. A control system, no matter how well conceived and operated, can provide only
87
Table of Contents
reasonable, not absolute, assurance that the objectives of the control system are met. Because of the inherent limitations in all control systems, no evaluation of controls can provide absolute assurance that all control issues and instances of fraud, if any, have been detected. Also, projections of any evaluation of effectiveness to future periods are subject to the risk that controls may become inadequate because of changes in conditions, or that the degree of compliance with the policies and procedures may deteriorate.
Changes in Internal Control Over Financial Reporting
There have not been any other changes in the Company’s internal control over financial reporting (as such term is defined in Rules 13a-15(f) and 15d-15(f) under the Exchange Act) during the fourth fiscal quarter of the Company’s fiscal year ended June 30, 2010 that have materially affected, or are reasonably likely to materially affect, the Company’s internal control over financial reporting.
| Item 9B. | Other Information |
None
PART III
Pursuant to General Instruction G(3), the information called for by Items 10, (except for information concerning the executive officers of the Company) 11, 12, 13 and 14 is hereby incorporated by reference to the Company’s definitive proxy statement to be filed on EDGAR with respect to the fiscal year ended June 30, 2010. Certain information concerning the executive officers of the Company is included as Item 10 of this report.
| Item 10. | Directors, Executive Officers and Corporate Governance |
The following is a list of the executive officers of the Company:
| Name |
Age | Office Held | Length of Service as an Officer |
Other Positions Held with Company | ||||
| William H. Hastings |
55 | President and Chief Executive Officer | Since 2008 | None | ||||
| Antoine J. Lafargue |
36 | Chief Financial Officer and Treasurer | Since 2010 | None |
For further information regarding the named executive officers see the Company’s Proxy Statement to be filed with the SEC on or about October 4, 2010.
| Item 11. | Executive Compensation |
| Item 12. | Security Ownership of Certain Beneficial Owners and Management and Related Stockholder Matters |
Information to be included in annual Proxy Statement.
| Item 13. | Certain Relationships and Related Transactions, and Director Independence |
Information to be included in annual Proxy Statement.
| Item 14. | Principal Accounting Fees and Services |
Information to be included in annual Proxy Statement.
88
Table of Contents
PART IV
| Item 15. | Exhibits, Financial Statement Schedules |
(a) (1) Financial Statements.
The financial statements listed below and included under Item 8 are filed as part of this report.
| Page Reference | ||
| Report of Independent Registered Public Accounting Firm |
49 | |
| Consolidated balance sheets as of June 30, 2010 and 2009 |
50 | |
| Consolidated statements of operations for each of the three years in the period ended June 30, 2010 |
51 | |
| Consolidated statements of stockholders’ equity for each of the three years in the period ended June 30, 2010 |
52 | |
| Consolidated statements of cash flows for each of the three years in the period ended June 30, 2010 |
53 | |
| Notes to consolidated financial statements |
54 | |
| Supplementary oil and gas information (unaudited) |
78 |
(2) Financial Statement Schedules.
All schedules have been omitted since the required information is not present or not present in amounts sufficient to require submission of the schedule, or because the information required is included in the consolidated financial statements and the notes thereto.
(d) Exhibits.
The following exhibits are filed or furnished as part of this report:
Item Number
2. Plan of acquisition, reorganization, arrangement, liquidation or succession.
None.
3. Articles of Incorporation and By-Laws.
(a) Restated Certificate of Incorporation as filed on May 4, 1987 with the State of Delaware and Amendment of Article Twelfth as filed on February 12, 1988 with the State of Delaware filed as exhibit 4(b) to Form S-8 Registration Statement, filed on January 14, 1999, are incorporated herein by reference.
(b) Certificate of Amendment to Certificate of Incorporation as filed on December 26, 2000 with the State of Delaware, filed as Exhibit 3(a) to the Company’s quarterly report on Form 10-Q filed on February 13, 2001 and incorporated herein by reference.
(c) Certificate of Amendment to restated certificate of incorporation related to article 12 as filed on October 15, 2009 with the state of Delaware, filed as exhibit 3.3 to quarterly report on form 10Q filed on February 16, 2010, is incorporated herein by reference.
(d) Certificate of Amendment to restated March 10, 2010 certificate of incorporation related to article 13 as filed on October 15, 2009 with the state of Delaware, filed as Exhibit 3.4 to quarterly report on form 10Q filed on February 16, 2010, is incorporated herein by reference.
89
Table of Contents
(e) By-Laws, as amended on March 10, 2010, as filed as Exhibit 3.1 to current Report on Form 8-K filed on March 15, 2010, are incorporated by reference.
4. Instruments defining the rights of security holders, including indentures.
None.
9. Voting Trust Agreement.
None.
10. Material contracts.
(a) Petroleum Lease No. 4 dated November 18, 1981 granted by the Northern Territory of Australia to United Canso Oil & Gas Co. (N.T.) Pty Ltd. filed as Exhibit 10(a) to Annual Report on Form 10-K for the year ended June 30, 1999 (File No. 001-5507) is incorporated herein by reference.
(b) Petroleum Lease No. 5 dated November 18, 1981 granted by the Northern Territory of Australia to Magellan Petroleum (N.T.) Pty. Ltd. filed as Exhibit 10(b) to Annual Report on Form 10-K for the year ended June 30, 1999 (File No. 001-5507) is incorporated herein by reference.
(c) Gas Sales Agreement between The Palm Valley Producers and The Northern Territory Electricity Commission dated November 11, 1981 filed as Exhibit 10(c) to Annual Report on Form 10-K for the year ended June 30, 1999 (File No. 001-5507) is incorporated herein by reference.
(d) Palm Valley Petroleum Lease (OL3) dated November 9, 1982 filed as Exhibit 10(d) to Annual Report on Form 10-K for the year ended June 30, 1999 (File No. 001-5507) is incorporated herein by reference.
(e) Agreements relating to Kotaneelee.
(1) Copy of Agreement dated May 28, 1959 between the Company et al and Home Oil Company Limited et al and Signal Oil and Gas Company filed as Exhibit 10(e) to Annual Report on Form 10-K for the year ended June 30, 1999 (File No. 001-5507) is incorporated herein by reference.
(2) Copies of Supplementary Documents to May 28, 1959 Agreement (see (e)(1) above), dated June 24, 1959, consisting of Guarantee by Home Oil Company Limited and Pipeline Promotion Agreement filed as Exhibit 10(e) to Annual Report on Form 10-K for the year ended June 30, 1999 (File No. 001-5507) is incorporated herein by reference.
(3) Copy of Modification to Agreement dated May 28, 1959 (see (e)(1) above), made as of January 31, 1961. Filed as Exhibit 10(e) to Annual Report on Form 10-K for the year ended June 30, 1999 (File No. 001-5507) is incorporated herein by reference.
(4) Copy of Letter Agreement dated February 1, 1977 between the Company and Columbia Gas Development of Canada, Ltd. for operation of the Kotaneelee gas field filed as Exhibit 10(e) to Annual Report on Form 10-K for the year ended June 30, 1999 (File No. 001-5507) is incorporated herein by reference.
(f) Palm Valley Operating Agreement dated April 2, 1985 between Magellan Petroleum (N.T.) Pty. Ltd., C. D. Resources Pty. Ltd., Farmout Drillers N.L., Canso Resources Limited, International Oil Proprietary, Pancontinental Petroleum Limited, I.E.D.C. Australia Pty. Ltd., Southern Alloys Ventures Pty. Limited and Amadeus Oil N.L. filed as Exhibit 10(f) to Annual Report on Form 10-K for the year ended June 30, 1999 (File No. 001-5507) is incorporated herein by reference.
90
Table of Contents
(g) Mereenie Operating Agreement dated April 27, 1984 between Magellan Petroleum (N.T.) Pty., United Oil & Gas Co. (N.T.) Pty. Ltd., Canso Resources Limited, Oilmin (N.T.) Pty. Ltd., Krewliff Investments Pty. Ltd., Transoil (N.T.) Pty. Ltd. and Farmout Drillers NL and Amendment of October 3, 1984 to the above agreement filed as Exhibit 10(g) to Annual Report on Form 10-K for the year ended June 30, 1999 (File No. 001-5507) is incorporated herein by reference.
(h) Palm Valley Gas Purchase Agreement dated June 28, 1985 between Magellan Petroleum (N.T.) Pty. Ltd., C. D. Resources Pty. Ltd., Farmout Drillers N.L., Canso Resources Limited, International Oil Proprietary, Pancontinental Petroleum Limited, IEDC Australia Pty Limited, Amadeus Oil N.L., Southern Alloy Venture Pty. Limited and Gasgo Pty. Limited. Also included are the Guarantee of the Northern Territory of Australia dated June 28, 1985 and Certification letter dated June 28, 1985 that the Guarantee is binding. All of the above were filed as Exhibit 10(h) to Annual Report on Form 10-K for the year ended June 30, 1999 (File No. 001-5507) and are incorporated herein by reference.
(i) Mereenie Gas Purchase Agreement dated June 28, 1985 between Magellan Petroleum (N.T.) Pty. Ltd., United Oil & Gas Co. (N.T.) Pty. Ltd., Canso Resources Limited, Moonie Oil N.L., Petromin No Liability, Transoil No Liability, Farmout Drillers N.L., Gasgo Pty. Limited, The Moonie Oil Company Limited, Magellan Petroleum Australia Limited and Flinders Petroleum N.L. Also included is the Guarantee of the Northern Territory of Australia dated June 28, 1985. All of the above were filed as Exhibit 10(i) to Annual Report on Form 10-K for the year ended June 30, 1999 (File No. 001-5507) and are incorporated herein by reference.
(j) Agreements dated June 28, 1985 relating to Amadeus Basin-Darwin Pipeline which include Deed of Trust Amadeus Gas Trust, Undertaking by the Northern Territory Electric Commission and Undertaking from the Northern Territory Gas Pty Ltd. filed as Exhibit 10(j) to Annual Report on Form 10-K for the year ended June 30, 1999 (File No. 001-5507) is incorporated herein by reference.
(k) Agreement between the Mereenie Producers and the Palm Valley Producers dated June 28, 1985 filed as Exhibit 10(k) to Annual Report on Form 10-K for the year ended June 30, 1999 (File No. 001-5507) is incorporated herein by reference.
(l) Form of Indemnification Agreement for Directors and Officers pursuant to Article SIXTEENTH of the Company’s Restated Certificate of Incorporation and the Company’s Bylaws, filed as Exhibit 10.1 to current report on Form 8-K filed on June 2, 2009, is incorporated herein by reference.
(m) 1998 Stock Option Plan, filed as Exhibit 4(a) to Form S-8 Registration Statement on January 14, 1999, filed as Exhibit 10(m) to Annual Report on Form 10-K for the year ended June 30, 1999 (File No. 001-5507) is incorporated herein by reference.
(n) First Amendment to the 1998 Stock Option Plan dated October 24, 2007, filed as Exhibit 10 (n) to Annual Report on Form 10-K for the year ended June 30, 2008 (File No. 001-5507) is incorporated herein by reference.
(o) 1989 Stock Option Plan filed as Exhibit O to Annual Report on Form 10-K for the year ended June 30, 2002 (File No. 001-5507) is incorporated herein by reference.
(p) Amended and Restated Employment Agreement between Daniel J. Samela and Magellan Petroleum Corporation effective September 28, 2008, filed as exhibit 10(p) to Annual Report on Form 10-K for the year ended June 30, 2008 (File No. 001-5507) is incorporated herein by reference.
(q) Palm Valley Renewal of Petroleum Lease dated November 6, 2003, filed as Exhibit 10 (s) to Annual Report on Form 10-K for the year ended June 30, 2005, is incorporated herein by reference.
91
Table of Contents
(r) 1998 Magellan Petroleum Corporation Stock Incentive Plan, as amended through May 27, 2009, filed Exhibit 10(c) to annual report on form 10K for the year ended June 30, 2009 (file No. 001-5507) is incorporated herein by reference.
(s) Form of Non-Qualified Stock Option Award Agreement for officers and directors, filed as Exhibit 10.1 to current report on Form 8-K filed on November 30, 2005, is incorporated by reference herein.
(t) Form of Amendment to Non-Qualified Stock Option Agreement for directors, December 11, 2008, filed as Exhibit 10.2 to current report on Form 8-K filed on December 15, 2008, is incorporated by reference herein.
(u) Employment Agreement between the Company and William H. Hastings, dated as of February 3, 2009, filed as Exhibit 10.1 to current report on Form 8-K filed on February 9, 2009, is incorporated by reference herein.
(v) Indemnification Agreement between the Company and William H. Hastings, dated as of February 3, 2009, filed as Exhibit 10.2 to current report on Form 8-K filed on February 9, 2009, is incorporated by reference herein.
(w) Non-Qualified Stock Option Award Agreement between the Company and William H. Hastings, dated as of February 3, 2009, filed as Exhibit 10.3 to current report on Form 8-K filed on February 9, 2009, is incorporated by reference herein.
(x) Non-Qualified Stock Option Performance Award Agreement between the Company and William H. Hastings, dated as of February 3, 2009, filed as Exhibit 10.4 to current report on Form 8-K filed on February 9, 2009, is incorporated by reference herein.
(y) Warrant Agreement between the Company and Young Energy Prize S.A, dated July 9, 2009, filed as Exhibit 10.1 to current report on Form 8-K filed on July 14, 2009, is incorporated herein by reference.
(z) Registration Rights Agreement between the Company and Young Energy Prize S.A, dated July 9, 2009, filed as Exhibit 10.2 to current report on Form 8-K filed on July 14, 2009, is incorporated herein by reference.
(aa) Consulting Agreement between the Company and J. Thomas Wilson, dated July 9, 2009, filed as Exhibit 10.4 to current report on Form 8-K filed on July 14, 2009, is incorporated herein by reference.
(bb) Non-qualified stock option award agreement between the Company and J. Thomas Wilson, dated July 9, 2009, filed as Exhibit 10.5 to current report on Form 8-K filed on July 14, 2009, is incorporated herein by reference.
(cc) Non-qualified stock option performance award agreement between the Company and J. Thomas Wilson, dated July 9, 2009, filed as Exhibit 10.6 to current report on Form 8-K filed on July 14, 2009, is incorporated herein by reference.
(dd) Purchase and Sale Agreement between and among the Company, White Bear and the YEP I Fund, dated as of October 14, 2009, filed as Exhibit 2.1 to current report on Form 8-K filed on October 14, 2009, is incorporated by reference herein.
(ee) Amended and Restated Operating Agreement of Nautilus Poplar, between and among White Bear, the YEP I Fund, Nautilus Tech and Eastern Rider, dated as of October 14, 2009, filed as Exhibit 10.1 to current report on Form 8-K filed on October 14, 2009, is incorporated by reference herein.
92
Table of Contents
(ff) First Amendment to Registration Rights Agreement, between and among the Company, YEP and the YEP I Fund, dated as of October 14, 2009, filed as Exhibit 10.2 to current report on Form 8-K filed on October 14, 2009, is incorporated by reference herein.
(gg) Letter Agreement between and among the Company, Eastern Rider, Nikolay V. Bogachev and Nautilus Tech, dated October 14, 2009, filed as Exhibit 10.3 to current report on Form 8-K filed on October 14, 2009, is incorporated by reference herein.
(hh) Nockatunga Asset Sale Agreement, Magellan Petroleum (Eastern) Pty Ltd and Santos QNT Pty Ltd, dated as of December 22, 2009, filed as Exhibit 10.4 to quarterly report on Form 10-Q filed on February 16, 2010, is incorporated herein by reference.
(ii) Employment Agreement between the Company and Susan M. Filipos, dated as of September 28, 2009, filed as Exhibit 10.1 to current report on Form 8-K filed on May 7, 2010, is incorporated herein by reference.
(jj) Non-qualified Stock Option Award Agreement between the Company and Susan M. Filipos, dated as of October 1, 2009, filed as Exhibit 10.2 to current report on Form 8-K filed on May 7, 2010, is incorporated herein by reference.
(kk)Assets Sale Deed between Magellan Petroleum Australia Limited and Santos Offshore Pty Ltd., dated as of March 25, 2010, filed as Exhibit 2.1 to quarterly report on Form 10-Q filed on May 14, 2010, is incorporated herein by reference.
(ll) Amended and Restated Warrant Agreement, dated March 11, 2010, filed as Exhibit 10.1 to quarterly report on Form 10-Q filed on May 14, 2010, is incorporated herein by reference.
(mm) Form of non-qualified stock option award agreement between the Company and non-employee directors, dated April 1, 2010, filed as Exhibit 10.2 to quarterly report on Form 10-Q filed on May 14, 2010, is incorporated herein by reference.
(nn) Form of restricted stock award agreement between the Company and non-employee directors, dated April 1, 2010 (Version A), filed as Exhibit 10.3 to quarterly report on Form 10-Q filed on May 14, 2010, is incorporated herein by reference.
(oo) Form of restricted stock award agreement between the Company and non-employee directors, dated April 1, 2010 (Version B), filed as Exhibit 10.4 to quarterly report on Form 10-Q filed on May 14, 2010, is incorporated herein by reference.
(pp) Indemnification Agreement between the Company and Susan M. Filipos, dated as of May 3, 2010, filed as Exhibit 10.3 to current report on Form 8-K filed on May 7, 2010, is incorporated herein by reference.
(qq) Employment Agreement between the Company and Antoine J. Lafargue, dated as of August 2, 2010, filed as Exhibit 10.1 to current report on Form 8-K filed on August 4, 2010, is incorporated herein by reference.
(rr) Indemnification Agreement between the Company and Antoine J. Lafargue, dated as of August 2, 2010, filed as Exhibit 10.2 to current report on Form 8-K filed on August 4, 2010, is incorporated herein by reference.
(ss) Non-Qualified Stock Option Award Agreement between the Company and Antoine J. Lafargue, dated as of August 2, 2010, filed as Exhibit 10.3 to current report on Form 8-K filed on August 4, 2010, is incorporated herein by reference.
93
Table of Contents
(tt) Non-Qualified Stock Option Performance Award Agreement between the Company and Antoine J. Lafargue, dated as of August 2, 2010, filed as Exhibit 10.4 to current report on Form 8-K filed on August 4, 2010, is incorporated herein by reference.
(uu) Securities Purchase Agreement between the Company and Young Energy Prize S.A., dated August 5, 2010, filed as Exhibit 10.1 to current report on Form 8-K filed on Aug. 11, 2010, is incorporated herein by reference.
(vv) Memorandum of Agreement between the Company and Young Energy Prize S.A., dated August 5, 2010, filed as Exhibit 10.2 to current report on Form 8-K filed on Aug. 11, 2010, is incorporated herein by reference.
(ww) Investor Rights Agreement, between the Company and Young Energy Prize S.A., dated August 5, 2010, filed as Exhibit 10.3 to current report on Form 8-K filed on Aug. 11, 2010, is incorporated herein by reference.
(xx) Second Amendment to Registration Rights Agreement between and among the Company, YEP and the ECP Fund, SICAV-FIS, dated June 23, 2010, is filed herewith.
11. Statement re computation of per share earnings.
Not applicable.
12. Statement re computation of ratios.
None.
13. Annual report to security holders, Form 10-Q or quarterly report to security holders.
Not applicable.
14. Code of Ethics
Magellan Petroleum Corporation Standards of Conduct filed as Exhibit 14 to Annual Report Form 10-K for the year ended June 30, 2006, is incorporated herein by reference.
16. Letter re change in certifying accountant.
None
18. Letter re change in accounting principles.
None.
21. Subsidiaries of the registrant.
Filed herewith.
22. Published report regarding matters submitted to vote of security holders.
Not applicable.
94
Table of Contents
23. Consent of experts and counsel.
1. Consent of Deloitte & Touche LLP is filed herewith.
2. Consent of Allen & Crouch Petroleum Engineers Inc. is filed herewith.
3. Consent of RISC Pty Ltd. is filed herewith.
24. Power of attorney.
None.
31. Rule 13a-14(a) Certifications.
31.1 Certification of William H. Hastings, President and Chief Executive Officer, pursuant to Rule 13a-14(a) under the Securities Exchange Act of 1934, is filed herewith.
31.2 Certification of Antoine J. Lafargue, Chief Financial and Accounting Officer, pursuant to Rule 13a-14(a) under the Securities Exchange Act of 1934, is filed herewith.
32. Section 1350 Certifications.
32.1 Certification of William H. Hastings, President and Chief Executive Officer, pursuant to 18 U.S.C. Section 1350, as adopted pursuant to Section 906 of the Sarbanes-Oxley Act of 2002, is furnished herewith.
32.2 Certification of Antoine J. Lafargue, Chief Financial and Accounting Officer, pursuant to 18 U.S.C. Section 1350, as adopted pursuant to Section 906 of the Sarbanes-Oxley Act of 2002, is furnished herewith.
99.1 Summary reserves report of Allen & Crouch Petroleum Engineers Inc.
99.2 Summary reserves report of RISC Pty Ltd.
(d) Financial Statement Schedules.
None.
95
Table of Contents
SIGNATURES
Pursuant to the requirements of Section 13 or 15(d) of the Securities Exchange Act of 1934, the registrant has duly caused this report to be signed on its behalf by the undersigned, thereunto duly authorized.
| MAGELLAN PETROLEUM CORPORATION (Registrant) | ||
| By |
/s/ WILLIAM H. HASTINGS | |
| William H. Hastings President and Chief Executive Officer (Duly Authorized Officer) | ||
| By |
/s/ ANTOINE J. LAFARGUE | |
| Antoine J. Lafargue Chief Financial Officer and Treasurer (as Principal Accounting Officer) | ||
Dated: September 28, 2010
Pursuant to the requirements of the Securities Exchange Act of 1934, this report has been signed below by the following persons on behalf of the registrant and in the capacities and on the date indicated.
| /s/ WILLIAM H. HASTINGS William H. Hastings |
President and Chief Executive Officer |
Dated: September 28, 2010 | ||
| /S/ ANTOINE J. LAFARGUE Antoine J. Lafargue |
Chief Financial Officer and Treasurer |
Dated: September 28, 2010 | ||
| /S/ DONALD V. BASSO Donald V. Basso |
Director |
Dated: September 28, 2010 | ||
| /S/ NIKOLAY V. BOGACHEV Nikolay V. Bogachev |
Director |
Dated: September 28, 2010 | ||
| /S/ ROBERT J. MOLLAH Robert Mollah |
Director |
Dated: September 28, 2010 | ||
| /S/ WALTER MCCANN Walter Mccann |
Director |
Dated: September 28, 2010 | ||
| /S/ RONALD P. PETTIROSSI Ronald P. Pettirossi |
Director |
Dated: September 28, 2010 | ||
| /S/ J. THOMAS WILSON J. Thomas Wilson |
Director |
Dated: September 28, 2010 | ||
| /S/ J. ROBINSON WEST J. Thomas Wilson |
Director |
Dated: September 28, 2010 | ||
96
Table of Contents
INDEX TO EXHIBITS
| 10(xx) | Second Amendment to Registration Rights Agreement between and among the Company, YEP and the ECP Fund, SICAV-FIS, dated as of June 23, 2010. | |
| 21. | Subsidiaries of the Registrant. | |
| 23. | 1. Consent of Deloitte & Touche LLP | |
| 2. Consent of Allen & Crouch Petroleum Engineers Inc | ||
| 3. Consent of RISC Pty Ltd. | ||
| 31. | Rule 13a-14(a) Certifications. | |
| 32. | Section 1350 Certifications. | |
| 99. | 1. Summary Reserves Report of Allen & Crouch, Inc
2. Summary Reserves Report of RISC Pty Ltd. | |
97