Attached files
| file | filename |
|---|---|
| 8-K - 8-K - XERIUM TECHNOLOGIES INC | sidoti8k.htm |

Investor Presentation
March 2017

2
Forward Looking Statements and Non-GAAP Reconciliations
These slides and any remarks about Xerium’s future expectations, plans and prospects are forward-looking statements within
the meaning of the federal securities laws. Forward-looking statements involve risks, uncertainties and other factors, including
those discussed in our earnings press release dated March 1, 2017 and in our filings with the SEC, which could cause our actual
results to differ materially from the results expressed or implied by our statements. Any forward-looking statements which we
make in this presentation or in our remarks, represent our views only as of the date made. We disclaim any duty to update any
such forward-looking statements.
These slides also include and we plan to discuss supplementary non-GAAP financial measures such as:
Adjusted EBITDA
Free cash flow
Net debt
Certain sales figures excluding currency effects
We use these numbers internally to assess financial performance, and therefore, we believe they will assist you in better
understanding our company. See our most recent earnings release, the end of this presentation and our annual report on Form
10-K for reconciliations of the non-GAAP numbers to their comparable GAAP numbers. Our use of these non-GAAP measures
in this presentation is subject to those additional disclosures, which we urge you to read.

3
Harold Bevis
• President, CEO, Director of Xerium Technologies (NYSE: XRM) since 2012
• Director of Commercial Vehicle Group (NASDAQ: CVGI) since 2014
• 31 years of experience; 15th year as a CEO, President, Director
• Experienced at repositioning – 3 corporate turnarounds (one underway!), 11 acquisitions,
3 divestitures, 11 new business/new plant startups, 24 plant expansions, 26 plant closures
• Experienced at growth and cost optimization - launched 150+ new products, companies
received 500+ new patents, 26 industry awards. Lean Six Sigma - Green Belt
• Own 533k shares of Xerium stock, recently purchased stock at $6.05/share
Management in Attendance Today

4
Conveyor Belts,
Machine Clothing
Roll Service,
Recovering
Optimization
Analytics
Part Repair,
Service
Customer
End Products
Cardboard, Consumer Packaging
Copy Paper, Magazines
Tissue, Paper Towels
Nonwoven fabrics, diapers
Siding, Roofing
Xerium Provides Consumable Parts & Services for its
Customer’s Manufacturing Process
Products & Services

5
Xerium at a Glance
2016 Sales $471 million
2016 EBITDA $95 million
20% of Sales
2016 Free Cash Flow $23 million
~3,000 Employees
Direct Sales
• Customers in 63 Countries
• ~70% sales outside U.S.
• 11 Primary Currencies
Continuous Innovation
• 3 R&D Centers
• 450+ Patents
Powerful Data Analytics
• Industrial Internet of Things (IIoT)
“Digital to Win”
28 Plants in 13 Countries
Lean Six Sigma culture

6
North
America
9 Plants
Europe
9 Plants
Latin
America
5 Plants*
Asia-Pacific
5 Plants
* New Rolls plant under construction in Concepción, Chile
Where We Are Located
Machine Clothing Roll Covers and Mechanical Services Xerium Global Headquarters
10 Factories
18 Repair Centers
13 Countries
~3,000 Employees
Customers in 63 Countries

7
Core value proposition: improve our
customer’s machine operating performance
through innovative and reliable clothing and
roll cover solutions
Attach the Company to naturally growing
segments of the market
Deploy the Company’s successful recurring
revenue model into new markets
Revenue Growth
Strategic
Objective
1
Pursuit of this strategic objective requires
high-quality capacity to be in the right
geographies and equipped with winning
technical designs
Key 2017 actions – globally rolling out a new
containerboard machine (~50% of the
world’s machines) product line called
TransFormTM , expanding China operations,
expanding capacity for new products

8
Emerging Country Growth
China/Asia
Chile/Latin America
Turkey/Middle East
Have a Strategic Goal to Align With Stable,
Growing Segments of the Market
2013 2016
Clothing 72%
79%
% of Revenue from Steady,
Growing Market Segments
End Product Growth
Consumer packaging
Tissue
eCommerce boxes
Tissue converting
Paper towels, napkins
Shipping containers
Folding cartons

9
8 Plants Closed, Equipment Retooled,
And Relocated
Xerium is
Repositioning…
10 Plants Renovated, Equipment Repurposed,
And Repositioned For Growth
Argentina
Brazil
Canada
Spain
Charlotte, NC
France
Germany
Middletown, VA
Canada
Austria
Brazil
China (new)
Chile (new, underway)
China
Griffin, GA
Neenah, WI
Ruston, LA
Turkey (new)
Machine Clothing Plants Rolls Plants Machine Clothing Plants Rolls Plants
…Into Growth
Markets

10
This New Plant Was the Main Reason for Above-Trend
Capital Investment 2013 – 2016
Average depreciation was historically $35 million per year (2003-2012)
Average capital spending was historically $27 million per year (2003-
2012)
Invested a cumulative $35 million above these traditional levels during
2013 – 2016
Capital spending required to build new machine clothing plant in China
was $35 million cumulative during 2013-2016, or the entire amount of
the overage
Centerpiece of 2013 – 2016 Repositioning Investment Plan
Xerium’s First-Ever Machine Clothing Plant in China
Having a machine clothing
plant located in the largest
and fastest growing market in
the world for the Company’s
products is a game-changer
for Xerium

11
Xerium Asia Press Felt Sales Growth
Permanently corrected lead time and delivered cost
competitiveness for press felts for Asian market
Plant is focused on growing markets & segments
Plant launched ground-up with Lean Six Sigma
Plant in full ramp-up mode, adding forming fabric
production in 2017
New credibility in region, game-changing
commitment from “Voice of the Customer”
2012 2016
600
to
n
s
+47%
New China Machine Clothing Plant a Success, Ramping Up

12
Expanded press felt business
(underway)
Expanded forming fabric
business (underway)
Expanded local market
customer base (underway)
Expanded roll service in
Southern China mills (2018)
Sales Pathways Now Open Region Number of Paperboard,
Tissue, Pulp & Paper
Machines*
Asia-Pacific 4,604
China 2,749
EMEA 1,906
North America 835
Latin America 650
Global Total 7,995
Source: Fisher International.
*Machines that produce >30 tons per day as of February 23, 2017.
**Modeled based on historical tissue machine growth + GDP or population growth for developed, and developing countries.
Improved Presence in China is Opening Up Many Opportunities
Paperboard
Paper Tissue
Nonwovens Building Products
o 34% of the world’s
machines in China
o Many new machines
forecasted
o 1,040 new tissue
machines worldwide by
2025 alone**
Kunshan Machine Clothing & Asia HQ
Xi’An Roll Plant
Changzhou Roll Plant
Dongguan Roll Plant (2018)

13
Xerium’s most profitable and
advanced product line
A major break-though in
competitiveness for Xerium & will
help sales growth in the region
First 20 orders have been received
with elite customers including
Nine Dragons and Asia Symbol
First shipment within weeks
Next production phase is also
already underway
Xerium’s 2nd Machine Clothing Operation in China is Starting Up Now
Forming Fabric Production Has Begun

14
Startups Outpacing Closures
March 10, 2017 YTD - new machine startups
outpacing old machine closures by ~ 2:1
o Start-ups = 45 machines
o Closures = 24 machines
Significant market correction occurred during
2013 – 2015, and the machine closure pace
declined significantly in 2016
Graphical market decline will continue
(~20% of the market), but closure pace and
impact will be less
Growth of GDP grades (~80% of the market)
is continuing and is overcoming the declining
grades
Base Business Stabilizing
Global Machines Shut Down
2013 2014 2015 2016
#
o
f
M
a
c
h
in
e
s
38%
improvement
170 173 167
104
Source: Fisher International, machines that
produce >30 tons per day
2017
323 New Machines
Announced for 2017
239
54
22
8
Asia
EMEA
LA
NA
Source: Fisher International

15
2016 Orders were above prior year, 2017
orders are above 2016 orders YTD
Sales slightly down due to end of year
timing, some production ramp-up issues
Backlog up, repositioning program is
working – new products and new
capacity in the right spots
Sales Are Stabilizing
Constant Currency
$477m $474m
2015 2016
(1)%
$115m $114m
(1)% Q4 Q4

16
2014 2015 2016 2017
$15m
$34m
$45m
Target
Repositioning Initiatives in Ramp-Up Phase, $94 million of New Wins & Climbing
China press felt plant (underway)
Shoe press belt ramp-up (underway)
TransFormTM forming fabrics (underway)
Spencer Johnston acquisition full-year
effect (underway)
Production increases for new products
(now)
China forming fabric plant (now)
Chile rolls & service plant (Q4)
New Business Wins Increasing

17
2017 backlog continues to increase YTD
90 new products launched since 2013, very
successful value propositions
Synergies between machine clothing, roll
technology, analytics. Delivering unique
customer value.
New capacity in targeted regions, enabling
growth volume.
Spencer Johnston integration fully underway
Order Levels Strong, Backlogs Steadily Improving
Year End
2015
Year End
2016
Clothing
Rolls
Clothing
Rolls
+5%

18
Lean Six Sigma
Lead in quality, delivery, cost
Achieve > 99% delivered quality
Offset inflation, price, mix
Operational Excellence
Strategic
Objective
Leading Financial Outcomes
38-40% gross margin
19-21% EBITDA
21-23% working capital
2

19
Reduce Leverage
Strategic
Objective
3
Generate free cash flow
Pay down debt and reduce leverage over the next 3-5 years
Target leverage reduction from 5.1x (pro-forma including Spencer Johnston) to <3x
Annual debt reduction, timing around interest payments
Improvement and de-risking of EBITDA driven by stronger commercial program &
repositioning actions

20
2016 was a good start with free cash flow
generation
Headed towards long term goal
Free Cash Flow
Goal
Range
$100m
$23m
2016

21
Q3
2016
$523m
Q4
2016
$512m
Net Debt Reduction Underway
Committed to paying down $100
million of debt
Continue to reposition & de-risk the
Company commercially &
financially
Benefit from 2013-2015 equipment
modernization and maintain
modest capex spending levels

22
Chile Rolls & Services Plant
Key 2017 Projects
Q4
China Forming Fabric Plant
Starting Now
Increase Production
for New Products
Starting Now

23
Expect Market Environment to
Continue to Improve
Non-declining grades now 79% of
sales, was 72% three years ago
New wins and business growth are
now outpacing graphical paper
business declines
Expect new machine startups to
outpace old machine closures
Expect Brazil macro-economic
environment to continue its
gradual improvement, and our
business alongside it
Outlook for 2017
Expect Business Growth
to Continue to Increase
Repositioned people, capacity,
products go-forward
opportunities much more robust
Foundational China machine
clothing plant in place & ramping
up – press felts and forming
fabrics
Additional new business growth
projects ramping up this year
Backlog has continued to grow,
good backlog headed into Q2
Generate Free Cash Flow
and Pay Down Debt
2017 capex investment will be
similar to 2016. Benefiting from
newly refurbished, repositioned
machines, will result in a sustained
modest level of spending
After 2 years of unfavorable
currency environment, expect
stability

24
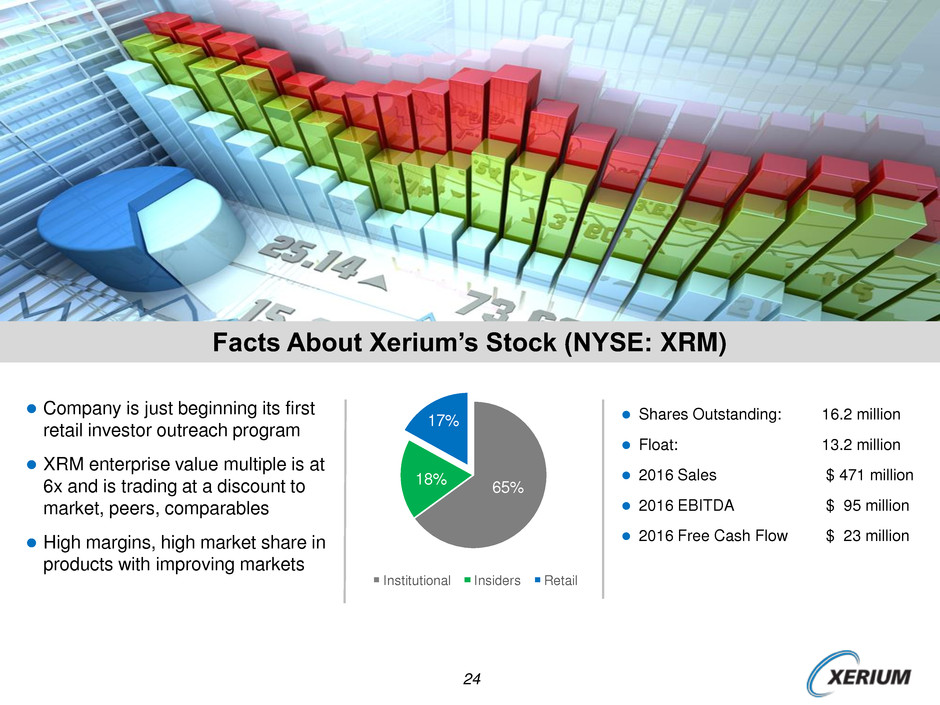
65%
18%
17%
Institutional Insiders Retail
Facts About Xerium’s Stock (NYSE: XRM)
Company is just beginning its first
retail investor outreach program
XRM enterprise value multiple is at
6x and is trading at a discount to
market, peers, comparables
High margins, high market share in
products with improving markets
Shares Outstanding: 16.2 million
Float: 13.2 million
2016 Sales $ 471 million
2016 EBITDA $ 95 million
2016 Free Cash Flow $ 23 million

25
Investment Highlights
Passing through a tough business
cycle of machine closures and
strong dollar effects, and
consensus among industry peers
that the market future looks better.
Implemented a large repositioning
program, go-forward sales
opportunities brighter and more robust.
Committed to deleveraging and a multi-
year goal of paying down $100 million
of debt.

26
2017 Update
Q1 has been a good start to the year
Orders, sales, production, costs, margins, EBITDA, customers, prices, cash,
capex on track
Excellent backlog of good-mix business headed into Q2
Continue to have FX headwind
Next round of strategic programs coming on line right now

27
Supplemental
Information

28
% Change
% Excluding
2016 2015 Change Currency Impacts
Total 113$ 115$ (2)% (1)%
Machine Clothing 69$ 71$ (3)% (3)%
Rolls & Services 44$ 44$ (1)% 0%
% Change
% Excluding
2016 2015 Change Currency Impacts
Total 471$ 477$ (1)% (1)%
Machine Clothing 286$ 300$ (5)% (5)%
Rolls & Services 185$ 177$ 4% 6%
Q4
Full Year
Sales by Segment
- %
Note:
All numbers rounded to the nearest million

29
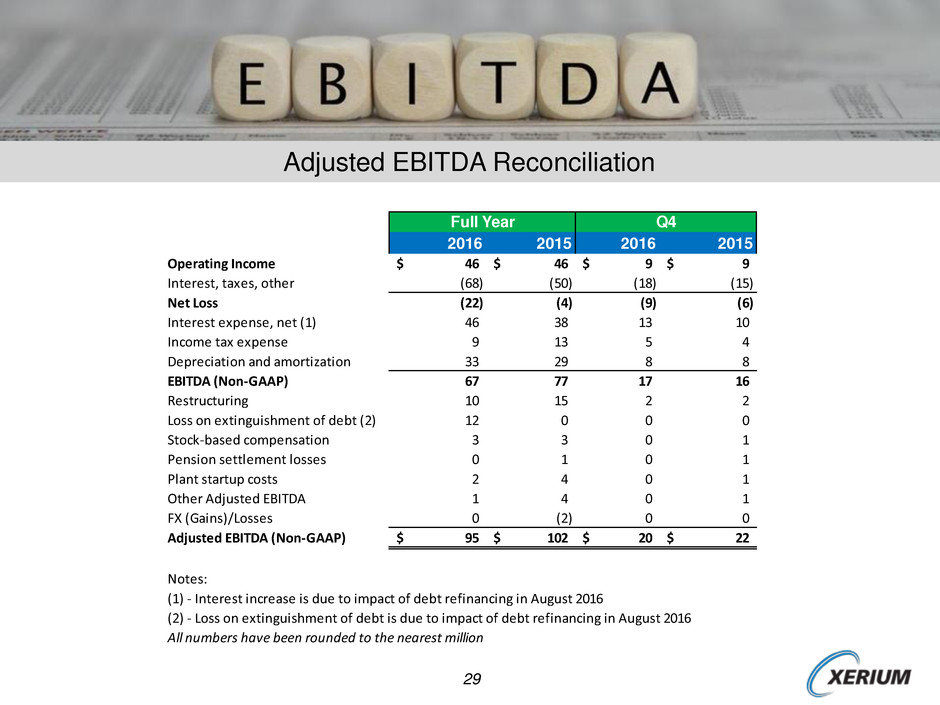
Adjusted EBITDA Reconciliation
2016 2015 2016 2015
Operating Income 46$ 46$ 9$ 9$
Interest, taxes, other (68) (50) (18) (15)
Net Loss (22) (4) (9) (6)
Interest expense, net (1) 46 38 13 10
Income tax expense 9 13 5 4
Depreciation and amortization 33 29 8 8
EBITDA (Non-GAAP) 67 77 17 16
Restructuring 10 15 2 2
Loss on extinguishment of debt (2) 12 0 0 0
Stock-based compensation 3 3 0 1
Pension settlement losses 0 1 0 1
Plant startup costs 2 4 0 1
Other Adjusted EBITDA 1 4 0 1
FX (Gains)/Losses 0 (2) 0 0
Adjusted EBITDA (Non-GAAP) 95$ 102$ 20$ 22$
Notes:
(1) - Interest increase is due to impact of debt refinancing in August 2016
(2) - Loss on extinguishment of debt is due to impact of debt refinancing in August 2016
All numbers have been rounded to the nearest million
Full Year Q4

30
Thank You!
