Attached files
| file | filename |
|---|---|
| EX-32.2 - EXHIBIT 32.2 - XERIUM TECHNOLOGIES INC | xrm-ex322_20161231xq4.htm |
| EX-32.1 - EXHIBIT 32.1 - XERIUM TECHNOLOGIES INC | xrm-ex321_20161231xq4.htm |
| EX-31.2 - EXHIBIT 31.2 - XERIUM TECHNOLOGIES INC | xrm-ex312_20161231xq4.htm |
| EX-31.1 - EXHIBIT 31.1 - XERIUM TECHNOLOGIES INC | xrm-ex311_20161231xq4.htm |
| EX-23.1 - EXHIBIT 23.1 - XERIUM TECHNOLOGIES INC | a12312016xeriumconsent.htm |
| EX-21.1 - EXHIBIT 21.1 - XERIUM TECHNOLOGIES INC | exhibit211_xeriumsubsidiar.htm |
UNITED STATES
SECURITIES AND EXCHANGE COMMISSION
Washington, D.C. 20549
FORM 10-K
ANNUAL REPORT PURSUANT TO SECTION 13 OR 15(d) OF THE SECURITIES EXCHANGE ACT OF 1934 | |
For the fiscal year ended December 31, 2016
or
TRANSITION REPORT PURSUANT TO SECTION 13 OR 15(d) OF THE SECURITIES EXCHANGE ACT OF 1934 | |
For the transition period from to
Commission File Number 001-32498
Xerium Technologies, Inc.
(Exact name of registrant as specified in its charter)
DELAWARE | 42-1558674 | |
(State or other jurisdiction of incorporation or organization) | (I.R.S. Employer Identification No.) | |
14101 Capital Boulevard
Youngsville, North Carolina 27596
(Address of principal executive offices)
(919) 526-1400
Registrant’s telephone number (including area code)
Securities registered pursuant to Section 12(b) of the Act:
Title of each class | Name of each exchange on which registered | |
Common Stock, $0.001 par value per share | New York Stock Exchange | |
Preferred Stock Purchase Rights | New York Stock Exchange | |
Securities registered pursuant to Section 12(g) of the Act: None
Indicate by check mark if the registrant is a well-known seasoned issuer, as defined in Rule 405 of the Securities Act. Yes No X
Indicate by check mark if the registrant is not required to file reports pursuant to Section 13 or Section 15(d) of the Act. Yes No X
Indicate by check mark whether the registrant (1) has filed all reports required to be filed by Section 13 or 15(d) of the Securities Exchange Act of 1934 during the preceding 12 months (or for such shorter period that the registrant was required to file such reports), and (2) has been subject to such filing requirements for the past 90 days. Yes X No
Indicate by check mark whether the registrant has submitted electronically and posted on its corporate Web site, if any, every Interactive Data File required to be submitted and posted pursuant to Rule 405 of Regulation S-T (§ 232.405 of this
chapter) during the preceding 12 months (or for such shorter period that the registrant was required to submit and post such files). Yes X No
Indicate by check mark if disclosure of delinquent filers pursuant to Item 405 of Regulation S-K (§ 229.405 of this chapter) is not contained herein, and will not be contained, to the best of registrant’s knowledge, in definitive proxy or information statements incorporated by reference in Part III of this Form 10-K or any amendment to this Form 10-K. ¨
Indicate by check mark whether the registrant is a large accelerated filer, an accelerated filer, a non-accelerated filer, or a smaller reporting company. See the definitions of “large accelerated filer”, “accelerated filer” and “smaller reporting company” in Rule 12b-2 of the Exchange Act. (Check one):
Large accelerated filer | Accelerated filer | X | ||||||
Non-accelerated filer | (Do not check if a smaller reporting company) | Smaller reporting company | ||||||
Indicate by check mark whether the registrant is a shell company (as defined in Rule 12b-2 of the Exchange Act). Yes No X
The aggregate market value of the voting common stock held by non-affiliates of the registrant on June 30, 2016, the last business day in the second fiscal quarter, was approximately $63,778,812. There were 16,010,059 shares of the registrant’s common stock, $0.001 par value per share, outstanding as of June 30, 2016.
Indicate by check mark whether the registrant has filed all documents and reports required to be filed by Section 12, 13 or 15(d) of the Securities Exchange Act of 1934 subsequent to the distribution of securities under a plan confirmed by a court. Yes X No
DOCUMENTS INCORPORATED BY REFERENCE
Proxy Statement for the 2017 Annual Meeting of Shareholders which will be filed pursuant to Regulation 14A, is incorporated by reference in Part III to the extent described therein.
TABLE OF CONTENTS
PAGE | ||
PART I. | ||
ITEM 1. | Business | 4 |
ITEM 1A. | Risk Factors | 11 |
ITEM 1B. | Unresolved Staff Comments | 26 |
ITEM 2. | Properties | 26 |
ITEM 3. | Legal Proceedings | 26 |
ITEM 4. | Mine Safety Disclosures | 27 |
PART II. | ||
ITEM 5. | Market For Registrant’s Common Equity, Related Stockholder Matters and Issuer Purchases of Equity Securities | 27 |
ITEM 6. | Selected Financial Data | 29 |
ITEM 7. | Management’s Discussion and Analysis of Financial Condition and Results of Operations | 30 |
ITEM 7A. | Quantitative and Qualitative Disclosures About Market Risk | 41 |
ITEM 8. | Financial Statements and Supplementary Data | 43 |
ITEM 9. | Changes in and Disagreements with Accountants on Accounting and Financial Disclosure | 43 |
ITEM 9A. | Controls and Procedures | 43 |
ITEM 9B. | Other Information | 46 |
PART III. | ||
ITEM 10. | Directors, Executive Officers and Corporate Governance | 46 |
ITEM 11. | Executive Compensation | 46 |
ITEM 12. | Security Ownership of Certain Beneficial Owners and Management and Related Stockholder Matters | 46 |
ITEM 13. | Certain Relationships and Related Transactions, and Director Independence | 46 |
ITEM 14. | Principal Accounting Fees and Services | 46 |
PART IV. | ||
ITEM 15. | Exhibits, Financial Statement Schedules | 47 |
SIGNATURES | 48 | |
2
This Annual Report on Form 10-K contains “forward-looking statements” within the meaning of the Private Securities Litigation Reform Act of 1995 that are subject to the safe harbor created by that Act. These statements relate to future events or to our future financial performance and involve known and unknown risks, uncertainties, and other factors that may cause our actual results, levels of activity, performance, or achievements to be materially different from any future results, levels of activity, performance, or achievements expressed or implied by these forward-looking statements. In some cases, forward-looking statements can be identified by the use of words such as “may,” “could,” “expect,” “intend,” “plan,” “seek,” “anticipate,” “believe,” “estimate,” “predict,” “potential,” or “continue” or the negative of these terms or other comparable terminology. Undue reliance should not be placed on forward-looking statements because they involve known and unknown risks, uncertainties, and other factors that are, in some cases, beyond our control and that could materially affect actual results, levels of activity, performance, or achievements. Factors that could materially affect our actual results, levels of activity, performance or achievements include the following items:
• | rate and magnitude of decline in graphical grade paper production; |
• | fluctuations in interest rates and currency exchange rates; |
• | over-capacity of certain grades of paper, leading to distressed profit situations at our customers; |
• | execution risk related to our expansion projects; |
• | local economic conditions in the areas around the world where we conduct business; |
• | quality issues with new products that could lead to higher warranty and quality costs; |
• | structural shifts in the demand for paper; |
• | the effectiveness of our strategies and plans; |
• | sudden increase or decrease in production capacity; |
• | trend toward extended life in forming fabrics, leading to reduced market share; |
• | our development and marketing of new technologies and our ability to compete against new technologies developed by competitors; |
• | variations in demand for our products, including our new products; |
• | fluctuations in the price of our component supply costs and energy costs; |
• | our ability to generate substantial operating cash flow to fund growth and unexpected cash needs; |
• | occurrences of terrorist attacks or an armed conflict involving the United States or any other country in which we conduct business, or any other domestic or international calamity, including natural disasters; |
• | changes in the policies, laws, regulations and practices of the United States and any foreign country in which we operate or conduct business, including changes regarding taxes and the repatriation of earnings; and |
• | anti-takeover provisions in our charter documents. |
If any of these risks or uncertainties materialize, or if our underlying assumptions prove to be incorrect, actual results may vary significantly from what we project. Any forward-looking statement in this Annual Report on Form 10-K reflects our current views with respect to future events and is subject to these and other risks, uncertainties, and assumptions relating to our operations, results of operations, growth strategy, and liquidity. We assume no obligation to publicly update or revise these forward-looking statements for any reason, whether as a result of new information, future events, or otherwise, except as required by law.
All references in this Annual Report to “Xerium”, “the Company”, “we”, “our” and “us” means Xerium Technologies, Inc. and its subsidiaries.
3
PART I
ITEM 1. | BUSINESS |
General
Xerium Technologies, Inc. (the "Company") is a leading, global provider of industrial consumable products and services including machine clothing, roll coverings, roll repair and mechanical services. These goods and services are used in the production of paper, paperboard, building products and nonwoven materials. Its operations are strategically located in the major paper-making regions of the world, including North America, Europe, Latin America and Asia-Pacific. We market our products through the following industry-recognized brands:
Brand | Product Category | Geographic Region | ||
Huyck Wangner | Machine Clothing | Worldwide, other than North America | ||
Weavexx | Machine Clothing | North America | ||
Stowe Woodward | Roll Covers & Spreader Rolls | Worldwide | ||
Mount Hope | Spreader Rolls | Worldwide | ||
Robec | Spreader Rolls | Europe | ||
IRGA | Spreader Rolls | Southern Europe and Indonesia | ||
Xibe/Stowe | Roll Covers | China | ||
JJ Plank | Specialty Services & Embossing, | North America | ||
Watermark & Dandy Rolls | ||||
Spencer Johnston | Spreader Rolls | North America, Japan, Latin America | ||
We have an extensive global footprint of 28 manufacturing facilities in 13 countries, strategically located in the major paper-producing regions of North America, Europe, Latin America and Asia Pacific, and have approximately 2,950 employees worldwide. We market our products, primarily using our direct sales force, to the paper industry’s leading producers. In 2016, we generated net sales of $471.3 million.
Company Overview
Our machine clothing and roll cover products are primarily installed on pulp and paper-making machines and play key roles in the process by which raw materials are converted into finished paper. A fundamental characteristic of our products is that they are consumed in the paper production process and must be regularly replaced. This positions us to make recurring sales to our customers, and accordingly, the number of paper machines in operation throughout the world and the amount of paper, pulp and board produced globally each year are primary drivers of the demand for our products. In addition, our products are also installed in other industrial applications such as nonwoven and fiber cement machines.
Paper-making machines utilize different processes and have different requirements depending on the design of the machine, the raw materials used, the type of paper being made and the preferences of individual production managers. We employ our broad portfolio of patented and proprietary product and manufacturing technologies, as well as our extensive industry experience, to provide our customers with tailored solutions designed to optimize the performance of their equipment and significantly reduce the costs of their operations. We systematically track and report the impact of these customized solutions to our customers through our ValueResults™ program which quantifies the optimization process on their machines.
Our machine clothing products are highly engineered synthetic textile belts that transport and filter paper as it is processed in a paper-making machine. Machine clothing plays a significant role in the forming, pressing and drying stages of paper production. Our machine clothing segment represented 61% of our net sales for the year ended December 31, 2016, 63% in 2015 and 64% in 2014.
Roll cover products cover the rolls on a paper-making machine, which are the large steel cylinders over which machine clothing is mounted and between which the paper travels as it is processed. Our roll covers provide a surface with the mechanical properties necessary to process the paper in a cost-effective manner that delivers the sheet qualities desired by the paper producer. We currently use several hundred chemical compounds in our roll cover manufacturing process. Our roll cover segment represented 39% of our net sales for the year ended December 31, 2016, 37% in 2015 and 36% in 2014.
Our products are in constant contact with the paper during the manufacturing process. As a result, our products have a significant effect on paper quality and the ability of a paper producer to differentiate its products, two factors that we believe
4
are increasingly important to paper producers. In addition, while machine clothing and roll covers represent only approximately 3%, on average, of a typical paper producer’s production costs, they can help a paper producer improve productivity and reduce overall costs. Our machine clothing and roll covers facilitate the paper producers' use of less expensive raw materials (including recycled fiber), their ability to run paper-making machines faster and with fewer interruptions and their ability to decrease the amount of energy required in the expensive drying portion of the paper-making process. We have found that, in certain cases, our products and services provide paper producers with cost savings that substantially offset the costs of such products and services.
We estimate that there are approximately 7,995 paper-making machines worldwide, all of which require a regular supply of machine clothing and roll covers. Machine clothing and roll covers must be replaced regularly to sustain high quality paper output and operate efficiently. Roll covers also require regular refurbishment, a service that we provide to our customers. Paper producers typically replace machine clothing multiple times per year, replace roll covers every two to five years and refurbish roll covers several times between each replacement.
We have a reputation for technological innovation in the paper-making industry. In our machine clothing segment, in recent years we have focused our research and development efforts on higher value-added, technologically advanced products, such as forming fabrics and press felts, which offer paper producers greater potential for differentiating their products through quality improvements and increasing their operating efficiency. Historically, we have pioneered a number of technologies that have become industry standards, including in our machine clothing business, synthetic forming fabrics (which replaced bronze wire technology), double-layer forming fabrics, laminated press felts and, most recently, triple-layer forming fabrics.
In our roll covers segment, we have introduced a number of innovations to our roll cover and spreader roll products in recent years, including (1) SMART™ Technology, the first continuous pressure sensing paper machine roll that enables the papermaker to maximize performance by knowing the pressure of the paper machine while the machine is running; (2) composite calendar roll covers that use nanoparticle technology to improve roll cover durability and paper gloss; (3) covers that use an improved polyurethane to increase abrasion and moisture resistance as well as responsiveness and stability; and (4) uniquely designed and proprietary grooving patterns that improve machine performance and reduce energy consumption.
Our portfolio of patented and proprietary product and manufacturing technologies differentiates our product offerings from others in the market and allows us to deliver high value products and services to our customers. As of December 31, 2016, we had approximately 444 issued patents and over 67 pending patent applications. Our patents and patent applications cover approximately 62 different inventions. We currently license certain of our patents and technologies to some of our competitors, which we believe helps further demonstrate our technological leadership in the industry. We believe that the technological sophistication of the products needed in our business and the capital-intensive nature of our business present significant challenges to any potential new competitors in our field.
We organized our business in 1999 in connection with the acquisition of the paper technology group of Invensys plc. We completed our initial public offering on May 19, 2005.
Recent Developments
New Technology
In December 2016, the Company introduced TransForm, a new generation of forming fabrics designed specifically for paperboard and packaging machines that lowers energy consumption and extends fabric life, among other considerable benefits. The TransForm technology is applicable for machines producing: paperboard, containerboard, fluting/corrugating, linerboard, kraft bag, liquid packaging board, food and beverage containers, bleach board, white top paperboard, boxboard, and other related subgrades. We believe that Transform helps our customers reduce energy consumption by more than 15 percent while extending fabric life between 15 and 25 percent.
Asian Expansion
In the fourth quarter of 2016, we surpassed 1,000 shipments of press felt from our new state-of-the-art machine clothing plant located in Kunshan, China. As a result of our new Kunshan facility, we are now routinely producing press felt solutions locally for customers in China and the Asia-Pacific region. Our Kunshan plant is located in the heart of the Yangtze River paper-making region in China, at the center of the largest papermaking region in the world. Prior to building the Kunshan plant, we served the Asia region as an exporter of products made in Europe. With the Kunshan facility, we have significantly increased our competitive position and is now closely partnering with customers in China and the rest of Asia. Xerium has a multi-year plan to continue expanding the scope of machine clothing production in Kunshan. We are underway right now with an expansion to make forming fabrics in Kunshan.
5
Global Trends in Paper Demand
The Company's markets have gone through a tough business cycle. Demand for the Company’s products are tied to our customer’s production rates and our product’s useful lives. While the majority of the Company’s end markets are growing, certain graphical grade paper production market segments have been in decline. Non-declining markets make up greater than 75% of the Company’s business model. Production of these grades of paper and board (tissue, paper towels, napkins, cardboard, consumer packaging, consumer durable packaging, e-commerce packaging) is steady and/or increasing globally. Declining grades of paper production are newsprint globally, and printing/writing papers in mature economies with full access to wireless/digital media. These market corrections have been very strong in the last few years and many paper machines dedicated to graphical paper production have been closed. At the same time, new machines have been installed to make the growing grades of paper and board. Both of these trends are continuing. In order to optimize outcomes in this changing environment, the Company has been implementing a repositioning program to re-map its plant locations, people, products, equipment tooling, and machine services offered to more naturally align with growing markets both geographically and by type of paper machine serviced.
Business Strategy
• | Correct footprint in order to deliver market competitive lead-times and cost structures, and outfit equipment to pursue new growth business - in the last four years, we closed and relocated equipment from declining market areas and into growing areas. Specifically, the Company closed 8 manufacturing locations as the source of new capacity, retooled and relocated that equipment to 9 other locations, and has 1 additional new plant under construction. That new plant will also receive equipment from the other locations. |
Closed/Provide Equipment to Others | Installed Equipment/Repositioned for Growth |
1. Argentina MC plant | 1. Canada MC plant |
2. Brazil MC plant | 2. Austria MC plant |
3. Charlotte, NC rolls plant | 3. Brazil MC plant |
4. Canada MC plant | 4. Chile rolls plant (new, underway) |
5. France rolls plant | 5. China MC plant (new) |
6. Germany rolls plant | 6. China rolls plant |
7. Middletown, VA rolls plant | 7. Griffin, GA rolls plant |
8. Spain MC plant | 8. Neenah, WI rolls plant |
9. Ruston, LA rolls plant | |
10. Turkey rolls plant (new) | |
• | Renovate products & services to leadership levels in order to secure New Business Wins on targeted machines - 90 new products in the last four years, several core mechanical service offerings were added into certain roll repair centers, patent portfolio expanded to 444 total patents with 67 pending applications. Company has added new sales personnel and is marketing to new market segments including: pulp, tissue, fiber cement, non-paper industries, paper and tissue converting, Turkey and Middle East markets, China and Asian markets, Mexico and Central American markets, Chile and South American markets. |
• | Create a unified, low-cost business model with one set of value-added processes - eliminate redundancy between regions and amongst product groups, supplement and top-grade team in certain areas, unify ERP and business systems, connect data streams into cohesive value-added processes using Industrial Internet of Things (IIoT) methodologies, and implement Lean Six Sigma in every plant globally. |
• | Pay down debt and deleverage the Company - after the majority of repositioning activities have been accomplished to install a go-forward business model, use excess free cash flow to pay down debt over a multi-year period in order to deleverage the company. |
Products
We operate through two principal business segments, machine clothing and roll covers. Our machine clothing segment products include various types of industrial textiles used on paper-making machines and other industrial applications. Through our roll covers segment, we manufacture various types of roll covers, refurbish previously installed roll covers, provide
6
mechanical services for the internal mechanisms of rolls used on paper-making machines and manufacture spreader rolls. For additional financial information about our machine clothing and roll covers segments, please see “Management’s Discussion and Analysis of Financial Condition and Results of Operations” and Note 12 "Business Segment Information" to the accompanying audited consolidated financial statements.
Machine Clothing Products
Our machine clothing segment products are large, highly engineered synthetic textile belts that transport paper as it is processed in a paper-making machine from paper stock into finished paper. Machine clothing products must be tailored to each machine because all paper-making machines have different physical configurations and operating parameters. Machine clothing generally ranges in size from approximately 7 feet to over 30 feet wide and 24 feet to more than 460 feet long and operates on paper-making machines that run at speeds up to 7,500 feet per minute.
We manufacture three general types of machine clothing products used on paper-making machines—forming fabrics, press felts and dryer fabrics—each of which is located in a different section of a paper machine. Forming fabrics and press felts are typically replaced multiple times a year, but replacement frequency varies significantly by the grade of paper being produced, the manner in which the paper-making machine is operated and the quality of raw materials used in the paper stock. Dryer fabrics are replaced less frequently, with replacement typically taking place approximately once per year.
Forming fabrics. Forming fabrics are used at the beginning of paper-making machines, where highly diluted paper stock is deposited on the forming fabric while the fabric is traveling at a very high speed. Forming fabrics allow water to drain from the paper stock, creating an initial wet sheet. Forming fabrics must be sufficiently porous to allow water to drain evenly and quickly, yet tight enough to retain and align the fiber and other materials that form the sheet of paper. They must also be strong enough to withstand high mechanical stresses. Forming fabrics are custom-manufactured in single, double and triple layer designs in a variety of meshes to suit particular machines and paper grades. Customers are increasingly demanding the higher-priced triple layer designs that remove more moisture and produce higher quality paper. In 2016, forming fabrics accounted for approximately 34% of net sales in our machine clothing segment.
Press felts. Press felts are used to carry the paper sheet through a series of press rolls that mechanically press water from the sheet under high pressure. Press felts are designed to maximize water removal, which reduces the amount of water that must be removed during the expensive energy-intensive drying section of the production process. Press felts must maximize water removal while maintaining the orientation of the fibers and the consistency of the thickness of the paper, without removing chemicals or fillers from the paper.
Press felts differ from forming fabrics and dryer fabrics due to the addition of several layers of staple fiber that are needled into the fabric base. The staple fiber provides a smooth surface to meet the wet sheet of paper and creates a wicking effect to remove water from the paper sheet as it is pressed under high pressure between press rolls. Press felts are manufactured in a variety of designs, including lightweight single layer felts, multi-layer laminated endless felts and seamed felts that allow for reduced installation times. In 2016, press felts accounted for approximately 47% of net sales in our machine clothing segment.
Dryer fabrics. Dryer fabrics are used to transport the paper sheet through the drying section of paper-making machines, where high temperatures from large, steam-heated dryer cylinders evaporate the remaining moisture from the paper sheet. Dryer fabrics, which are less technically advanced than forming fabrics or press felts, are woven from heat-resistant yarns with a coarser mesh than forming fabrics. In 2016, dryer fabrics accounted for approximately 5% of net sales in our machine clothing segment.
Industrials and Other. We manufacture other fabrics used in other industrial applications, such as pulp, non-woven textiles, fiber cement, tannery sludge de-watering and textiles manufacturing. In 2016, net sales for such industrial applications accounted for 14% of net sales in our machine clothing segment.
New Machine Clothing Products. The major goal of research and development is to create customer value and solutions by combining latest technologies with excellent quality and unique product characteristics. This commitment will improve our competitive position and ensures a continuously optimized product portfolio. In recent years, we have focused our research and development efforts on higher performance, value-added, sustainable product solutions throughout our entire machine clothing offering. Our efforts have resulted in several innovative and revolutionary new forming fabric and press felt product solutions, which prove their performance benefits globally every day.
7
Roll Covers and Services
In our roll covers segment (or "rolls segment"), the majority of our sales are generated through the replacement and refurbishment of roll covers and spreader rolls, the manufacturing of new spreader rolls and general mechanical maintenance and repair services for the internal mechanisms of rolls.
Roll covers. We manufacture, refurbish and replace covers of all types of roll applications used in paper-making machines, such as press section rolls including suction rolls, lump breaker rolls, coater rolls, sizing rolls, calendar rolls and all purpose conveying rolls. There can be up to 200 such rolls in a typical paper-making machine. These metal rolls, which can be up to 39 feet long, 6 feet in diameter and weigh 500 to 140,000 pounds, are covered with an exterior layer of rubber, polyurethane, composite or ceramic, each of which is designed for use in a particular phase of the paper-making process. Roll covers operate in temperatures up to 400 degrees Fahrenheit, under pressures up to 12,000 pounds per square inch and at speeds up to 10,000 feet per minute. Roll covers are typically replaced every two to five years.
Roll cover replacement is performed at the manufacturing facility of the supplier, such as Xerium, which necessitates removing the roll from the paper-making machine, transporting it to the supplier’s site and using a spare roll in the interim. In general, each roll on a paper-making machine is unique due to its dimensions, specific design and cover material, and generally not interchangeable with other rolls. Because of their large size, paper producers generally maintain only one spare roll for each position on a paper-making machine. It is important that the roll cover replacement be completed quickly, because damage or a malfunction of the spare roll could render the paper-making machine inoperable.
Due to the large size and weight of a roll, transportation to and from a supplier’s site can be costly and is occasionally subject to regulations on road use that restrict available routes and times of travel, and that may require safety escorts. Round-trip transcontinental travel can take several weeks and intercontinental travel is rare. We offer an extensive network of manufacturing facilities worldwide, often in close proximity to our customers, which we believe is a significant competitive advantage.
Roll covers accounted for approximately 55% of our total net sales in our roll covers segment in 2016.
Services. Roll covers are typically refurbished several times over the two to five years they are in service before needing to be replaced. Refurbishment typically includes the regrinding of the roll cover to standard specifications and inspecting the bearings and other mechanical components of the roll. As with roll cover replacement, refurbishment is performed at the supplier’s manufacturing facility. Similar to the paper producer’s selection of a roll cover supplier, the selection of a refurbishment provider is influenced by the time and expense of transporting a roll cover.
We offer a wide range of mechanical maintenance and repair services for the internal mechanisms of rolls. Paper producers are increasingly finding it economical to have the company that refurbishes or replaces a roll cover also perform work on the internal roll mechanisms at the same time, which avoids having multiple suppliers and incurring additional time and transportation charges. We have begun performing such services to meet the demands of our customers and gain a competitive advantage. As of December 31, 2016, we provide major mechanical services at ten locations around the world. Roll cover refurbishment services and mechanical services accounted for approximately 25% of our total net sales in our roll covers segment in 2016.
Spreader rolls. We manufacture and repair spreader rolls, which are small-diameter curved rolls used throughout a paper-making machine to stretch, smooth and remove wrinkles from the paper and machine clothing. There are approximately five to seven spreader rolls in a typical paper-making machine. Spreader rolls and related services accounted for approximately 18% of our total net sales in our roll covers segment in 2016.
New Roll Products. We have introduced a number of innovations to our roll cover and spreader roll products in recent years, including composite calendar roll covers that use nanoparticle technology to improve roll cover durability and paper gloss, as well as covers that use an improved polyurethane to increase abrasion and moisture resistance as well as responsiveness and stability. We are evaluating new products, which will use different materials and utilize different sales channels and provide enhancements to our existing product line. The acquisition of Spencer Johnston in May of 2016 broadened the Company's capabilities with respect to spreader rolls, dandy rolls, and tissue embossing rolls. Sales generated by these new and other roll products account for approximately 2% of our total net sales in our roll covers segment in 2016.
Customers
We supply leading paper producers worldwide. Our top ten customers accounted for 26.6% of net sales in 2016 and individually, no customer accounted for more than 6% of 2016 net sales. In 2016, we generated 39% of our net sales in North America, 32% in Europe, 10% in Latin America and 19% in Asia-Pacific. See Note 12 "Business Segment Information" to the accompanying audited consolidated financial statements for geographic information related to net sales and long-lived assets.
8
Due to competitive market forces, we offer our customers payment terms similar to those offered by our competitors. Also, agreements with certain customers require us to maintain modest amounts of finished machine clothing inventory to assure those customers of supply continuity. We do not maintain finished rolls inventories.
Competition
Our largest competitors are the two leading manufacturers of paper-making machines and one independent machine clothing producer. In addition, we also face competition from smaller regional suppliers.
We compete primarily based on the value, price and production lead times of our products. Competition with respect to both machine clothing and roll covers, particularly as it relates to our technologically advanced forming fabrics, press felts and roll covers, is based primarily on the value that the products deliver to the paper producer through the ability of such products to reduce production costs and improve paper quality. Also, because our customers operate continuously, we aim to offer competitive delivery schedules from customer order to placement in their machines.
Competition in the machine clothing and roll covers market is also based on a supplier’s ability to deliver engineering and technical services. Many paper producers have been reducing their in-house engineering and technical staff and increasingly expect their suppliers to provide such services. While smaller suppliers often lack the resources necessary to invest in and provide this level of engineering and technical service, we have made investments in order to provide the following services to the paper producers: specialist advice and resident engineers, installation support, on-call “trouble-shooting” and performance monitoring and analysis of paper-making machines.
In the roll covers market, competition is also based on a supplier’s proximity to the paper producer’s facilities, which affects the transportation time and expense associated with refurbishing or replacing a roll cover, and on the supplier’s ability to provide mechanical services to a roll’s internal mechanisms while the roll cover is being refurbished or replaced. We offer an extensive network of facilities throughout the world and provide mechanical services at the majority of our locations.
Research and Development
Our continuing ability to deliver value depends on developing product innovations. As we create new and improved products, we are often able to obtain patent protection for our innovations, which is indicative of our technical capabilities and creativity. Although we do not consider any single patent to be material to our business, we believe that, in the aggregate, our patents and other intellectual property provide us with a competitive advantage. At December 31, 2016, we have approximately 444 domestic and foreign patents outstanding and approximately 67 pending patent applications. Our patents and patent applications cover approximately 62 different inventions. Some of our competitors license our technology in exchange for royalty payments, although such licensing does not represent a material amount of our business. Research and development expenses totaled $7.1 million in 2016, $7.4 million in 2015 and $7.9 million 2014, and were approximately 1.5%, 1.6% and 1.5% of our net sales in 2016, 2015 and 2014, respectively.
Production
Machine Clothing Production Process
The following diagram represents the machine clothing production process.
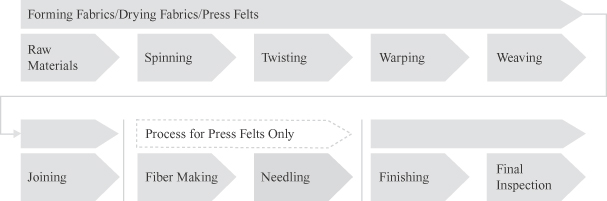
The machine clothing production process begins with the spinning of synthetic fiber threads to produce yarn, which is then twisted in preparation for the manufacturing of machine clothing. Yarn, which companies sometimes purchase as a raw material, is then wound on large spools prior to installation on the loom. The yarn is drawn through needles in preparation for weaving.
9
With the yarn prepared for weaving, a weave pattern can be installed in the loom controller. The nature of the weave pattern is critical to how the machine clothing performs in the paper-making process. The yarn is then woven to the desired length.
Technological advancements have resulted in weaving becoming an almost entirely automated process. Following weaving of a forming or dryer fabric, the two ends are permanently joined to form a continuous loop of machine clothing. Although significant automation has occurred in the joining process, it remains the most labor intensive element of the machine clothing production process.
Press felts are woven in a continuous loop and undergo a process that is not necessary for forming and dryer fabrics. An additional layer of fibers is added to the outside surface with the use of an advanced needling machine, such that a very smooth felt surface is created.
All machine clothing then undergoes heat setting and chemical treating. Heat setting tightens the machine clothing giving it the necessary mechanical properties for the paper-making process. Finally, the machine clothing is meticulously inspected prior to being shipped to the customer.
The machine clothing production process is capital intensive and requires a variety of equipment, including warping equipment, weaving looms, heat set equipment, joining equipment, needle looms and finishing machines.
Roll Cover Production Process
The following diagram represents the roll covering production process.
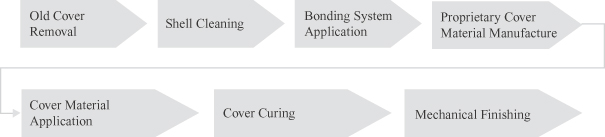
The covering on the rolls used in the paper-making process wear over time and must be periodically replaced for the roll to function properly. Rolls are removed from the paper-making machine and delivered to one of our facilities for re-covering. During this time, a spare roll is placed in the paper machine to enable continuous operations.
The roll covering process begins with the removal of the old cover. A lathe and belt grinder are used to remove the old cover, exposing the roll shell. The shell is cleaned with a pressure washer and blasted with solid particles to increase the shell’s surface area for bonding of the new cover. Following the blasting process, the shell is ready to be re-covered.
The shell is then coated with proprietary bonding agents that affix the new roll cover to the shell. Each type of cover material is applied with a different process. Rubber and composite covers are extruded in a slow spinning lathe. Polyurethane covers are typically cast on the core using a mold, and ceramic covering is expelled onto the shell at high pressure.
Following application of the core material, the cover undergoes a curing process. Rubber covers are cured for 12 to 28 hours in vulcanizers under high temperature and pressure, whereas polyurethane and composite materials are cured in a hot air oven. After curing, the roll cover is ground with belts and grinding stones. Depending on the type of roll, a proprietary pattern of holes and grooves is then drilled into the cover to aid in water removal. Finally, the roll is balanced for proper spinning motion and meticulously checked for quality before being returned to the customer.
The roll cover production process is capital intensive and requires a variety of equipment, including lathes, belt grinders, polyurethane casting molds (for polyurethane roll covers), extruders, mix stations, vulcanizers, ovens and balancing equipment.
Raw Materials
The primary raw materials used in our machine clothing production are synthetic yarns and fibers. The primary raw materials used in our roll cover products are synthetic and natural rubber, monomers, epoxy resins and polyurethane. A number of suppliers provide the materials used in our product lines, so availability has not posed a significant concern. Since both the machine clothing and primary roll cover materials are based on petroleum and natural gas derivatives, their prices are subject to changes in supply/demand and the price of petroleum and natural gas and their derivatives. The global average price for petroleum bottomed out one year ago and has almost doubled to $53/barrel since then. The U.S. Energy Information
10
Administration’s latest forecast is for pricing to remain at this level throughout 2017. We have recently seen the impact of this rise in energy prices, coupled with supply/demand issues of certain raw materials, causing an increase in certain synthetic yarn materials, as well as synthetic rubber. It is expected that these increases will abate as we head towards Q3 2017. Natural Rubber prices tend to be influenced directly by the weather in the Asian crop regions and by demand in China. This winter has been especially difficult in Asia with long-lasting rains, causing a temporary price increase in Natural Rubber. Pricing is expected to rescind towards mid-year. Xerium mitigates these impacts by placing blanket orders ahead of the winter while prices are lower.
Environmental
Our operations and facilities are subject to a number of national, state and local laws and regulations protecting the environment and human health in the United States and foreign countries that govern, among other things, the handling, storage and disposal of hazardous materials, discharges of pollutants into the air and water and workplace safety. Because of our operations, the history of industrial uses at some of our facilities, the operations of predecessor owners or operators of some of the businesses, and the use and release of hazardous substances at these sites, the liability provisions of environmental laws may affect us.
We believe that any liability in excess of amounts provided in Note 9 "Commitments and Contingencies" to the accompanying audited consolidated financial statements which may result from the resolution of such matters will not have a material adverse effect on our financial condition, liquidity or cash flow.
Employees
As of December 31, 2016 we had approximately 2,950 employees worldwide, of which approximately 67% were manufacturing employees. As of December 31, 2016, 2,010, or 68%, of our employees are members of labor unions, trade unions, employee associations or workers councils. We believe that we have good relations with our employees and the various groups that represent our employees.
Our Corporate Information
We are subject to the information requirements of the Securities Exchange Act of 1934 (the “Exchange Act”). Therefore, we file periodic reports, proxy statements and other information with the SEC. Such reports, proxy statements and other information may be obtained by visiting the Public Reference Room of the SEC at 100 F Street, NE, Washington, DC 20549 or by calling the SEC at 1-800-SEC-0330. In addition, the SEC maintains an Internet site at https://www.sec.gov that contains reports, proxy and information statements and other information regarding issuers that file electronically.
We maintain a website at www.xerium.com to provide information to the general public and our shareholders on our products and services, along with general information on Xerium. We make our periodic and current reports available, free of charge, on our website as soon as reasonably practicable after these reports are filed with, or furnished to, the SEC. Our corporate code of business conduct and ethics, our corporate governance guidelines, and the charters of each of the Audit, Compensation and Nominating and Corporate Governance Committees of our Board of Directors are also made available, free of charge, on our website. Our corporate code of business conduct and ethics, which includes our code of ethics, and related waivers (if any) are posted on our website and we intend to post on our website and (if required) file on Form 8-K all disclosures required by applicable law or the rules of the SEC concerning any amendment to, or waiver from, our code of ethics. Copies of these documents may be obtained, free of charge, by writing Investor Relations, Xerium Technologies, Inc., 14101 Capital Boulevard, Youngsville, NC 27596, or telephoning us at 919-526-1444.
ITEM 1A. | RISK FACTORS |
Our business, results of operations and financial condition, and an investment in our securities, are subject to various risks. Investors should carefully consider the risks described below in conjunction with the other information in this Form 10-K, including our Consolidated Financial Statements and related notes. If any of the following risks or other risks which have not been identified or which we may believe are immaterial or unlikely, actually occur, our business, financial condition and results of operations could be harmed. This could cause the value of our securities to decline and holders could lose part or all of their investment. This section does not describe all risks applicable to us, our business or industry, and it is intended only as a summary of certain material factors.
11
Risks Relating to Our Business and the Industry
Our current and anticipated restructuring actions aimed at shifting our cost structure from high-cost to low-cost markets and realigning our operations with market demand in the paper industry has required and may require significant expenditures in the future and may not be successful.
Beginning in 2012 and continuing through the present, we have announced and taken various operational restructuring measures in response to changed market conditions in the paper industry triggered by the structural realignment in the demand for the various grades of paper. For example, we have announced the termination of sales agency relationships in Europe, workforce reductions in Germany, the closure of four rolls facilities in Middletown, Virginia, Meyzieu, France, Charlotte, North Carolina and Heidenheim, Germany and the closure of four machine clothing facilities in Warwick, Quebec, Canada, Berazategui, Argentina, Zizurkil, Spain and Joao Pessoa, Brazil. We anticipate pursuing additional cost reduction programs in the future.
In connection with these cost reduction measures and with any future plant closures or workforce reductions, delays or failures in the transition of production from a closed facility to our other facilities or the rate of absorption of job assignments by the remaining workforce could also adversely affect our financial performance. We may not recoup the costs of programs we have already initiated, or other programs we may in the future decide to engage in, the costs of which may be significant. In addition, our profitability may decline if our restructuring efforts do not sufficiently reduce our future costs while at the same time positioning us to maintain or increase our sales and gross margins.
We have targeted expansion projects where we have identified opportunities for business growth. Our various expansion projects are subject to execution risk and uncertainties that could adversely impact our business, results of operations and financial condition.
In connection with our efforts to realign our manufacturing footprint by either expanding in line with growth opportunities or by closing facilities in high cost regions and transferring production to lower cost regions, we are in the midst of, or have completed, significant expansions of several of our existing facilities. The completion and ramp up of these projects is dependent upon a number of factors, many of which may be beyond our control. For example, we may experience significant delays in completing these projects because we may not be able to acquire appropriate permits. For example, we may encounter unanticipated complications with the installation and implementation of the complex systems and equipment that would impair our ability to begin production within the time frame estimated for the projects. We also may be unable to attract a sufficient number of skilled workers to meet the needs of the new or expanded facilities.
In addition, the cost to implement our strategic projects ultimately may prove to be greater than originally anticipated. We have spent significant capital and managerial resources on these new facilities and expansions. Furthermore, our assessment of the projected benefits associated with the construction of these new facilities is subject to a number of estimates and assumptions, which in turn are subject to significant economic, competitive and other uncertainties that are beyond our control. If we incur unanticipated costs in connection with this project, are not able to complete these new facilities in a timely manner or at all, or otherwise unable to achieve the anticipated benefits from this project, our business, results of operations and financial position could be materially adversely affected.
New developments and trends in the paper industry could adversely affect our net sales and profitability.
Because demand for our products has been driven primarily by the volume of paper produced on a worldwide basis, trends that affect the production level of the paper industry, such as declining demand for newsprint and printing and writing paper due to increased adoption of digital media, will impact our business and financial results.
We have experienced, and we believe our industry in general has experienced significant declines in sales to the graphical and newsprint industry. We expect such declines to continue for the foreseeable future, and unless we are successful in increasing our sales to industries other than the graphical and newsprint industry, such declines may adversely affect our net sales and profitability.
The profitability of paper producers has historically been highly cyclical due to wide swings in the price of paper, driven to a high degree by the oversupply of paper during periods when paper producers have more aggregate capacity than the market requires. In response to significant changes in the sector and other technological shifts affecting paper consumption, paper producers have continually sought to improve the balance between the supply of and demand for paper. As part of these efforts, they have permanently shut down many paper-making machines or entire manufacturing facilities. Should papermakers continue to experience low levels of profitability, we would expect that further consolidation among papermakers, reducing the
12
number of paper producers, and shutdowns of paper-making machines or facilities could occur, particularly in Europe and North America, until there is a better balance between supply and demand for paper and the profit levels of paper producers improve.
Global paper production growth in developing markets such as Asia and South America could be moderated by the level of industry consolidation and paper machine shutdown activity that appears to be an underlying trend in developed markets. We have observed a trend that paper producers are focusing on cost reduction strategies and, as a result, are extending the life of roll covers and machine clothing products through additional maintenance cycles before replacing them. New developments and trends in the paper industry, either globally or in a particular region, could cause our paper manufacturing customers to reduce production, cease operations or declare bankruptcy, each of which would adversely affect our net sales and profitability.
Price competition in our industry could adversely affect our gross margins and net sales.
Historically, we and our competitors have been able to sell machine clothing and roll cover products and services at favorable prices that reflect the value they deliver to customers. This favorable pricing has been particularly derived from our more technologically advanced products, such as forming fabrics, press felts and advanced roll covers. In the event that competition increases due to global economic conditions or continued over capacity in the paper manufacturing industry, we may be required to price our products, in some cases, at levels insufficient to realize our historical gross margins. Such pricing pressure from our competitors might require price decreases or make us unable to affect planned price increases and, thereby, adversely affect our profitability.
Balancing production levels at our manufacturing facilities could negatively affect our production, customer order time, product quality, labor relations or gross margin.
As part of our efforts to reduce our costs, we have attempted to reduce or eliminate excess manufacturing capacity through closure of certain of our manufacturing plants and consolidation of our production. As a result, however, from time to time, our ability to meet customer demand for our products may rely on our ability to operate our remaining manufacturing facilities at or near capacity on an uninterrupted basis. Our manufacturing facilities are dependent on critical equipment, and operating such equipment at or near capacity for extended periods may result in increased equipment failures or other reliability problems, which may result in production shutdowns or periods of reduced production. Such disruptions could have an adverse effect on our operations and financial results. In addition, insufficient manufacturing capacity or other delays may cause our customer order times to increase and our product quality to decrease, which may increase warranty costs and negatively affect customer demand for our products and customer relations generally. Operating our facilities at or near capacity may also negatively affect relations with our employees, which could result in higher employee turnover, labor disputes and disruptions in our operations. On the other hand, if we anticipate or experience a significant decrease in demand for our products, we may choose to temporarily decrease production or idle manufacturing facilities and employees. While decreasing production may mitigate some of the risks of operating at or near capacity discussed above, a significant drop off in production to meet lower demand, including idling facilities or employees, may negatively impact our gross margin.
Fluctuations in currency exchange rates could adversely affect our net sales, profitability and compliance with our debt covenants.
Our foreign operations expose us to fluctuations in currency exchange rates and currency devaluations. We report our financial results in U.S. Dollars, but a substantial portion of our sales and expenses are denominated in Euros and other currencies. As a result, changes in the relative values of U.S. Dollars, Euros and other currencies will affect our levels of net sales and profitability. Currency fluctuations, as they pertain to the Euro, generally have a greater effect on the level of our net sales due to the amount of business we conduct in Euros. An increase in the U.S. Dollar against the Euro generally results in a decrease to net sales and net income. Increases in the U.S. Dollar against other currencies, such as the Brazilian Real, would not impact consolidated net sales as much, as a significant portion of sales in that country is denominated in or indexed to U.S. Dollars, but generally would increase net income as local currency costs would be translated into lower U.S. Dollar expenses for financial reporting purposes. We would expect a similar but opposite effect in a period in which the value of the U.S. Dollar decreases against these currencies. Although in certain circumstances we may attempt to hedge our cash exposure to fluctuations in currency exchange rates, our hedging strategies may not be effective.
Our industry is competitive and our future success will depend on our ability to effectively develop, market and supply competitive products.
The paper-making consumables industry is highly competitive. Some of our competitors are larger than us, have greater financial and other resources and are well-established suppliers to the markets we serve. For example, while we have recently expanded our business in China, we face substantial competition from manufacturers already operating there that are more
13
established and familiar with the Chinese marketplace. In addition, some of our competitors also manufacture paper-making machines and have the ability to initially package sales of their machine clothing and roll cover products with the sale of their machines and/or to tie the warranties on their machines to the use of their machine clothing and roll cover products. Due to various factors such as price or product innovation by our competitors, our products may not be able to compete successfully with the products of our competitors, which could result in a loss of customers and, as a result, decreased net sales and profitability.
Because we have substantial operations outside the United States, we are subject to the economic and political conditions of foreign nations.
We have 28 manufacturing facilities in 13 foreign countries. In 2016, we sold products in approximately 62 countries other than the United States, which represented approximately 69.5% of our net sales. Operating in foreign countries presents challenges unique to each country such as in hiring employees, our relations with various parties, including suppliers and governmental agencies, and in production.
Furthermore, we may decide to do business in countries where we have not previously done business. In such countries, we face the additional uncertainty of entering a new market and its social customs, laws and practices. Should these challenges be realized, our operating results could be adversely impacted and our business or production may be delayed.
Our foreign operations are subject to a number of risks and uncertainties, including risks that:
• | foreign governments may impose limitations on our ability to repatriate funds; |
• | foreign governments may impose withholding or other taxes on remittances and other payments to us, or the amount of any such taxes may increase; |
• | an outbreak or escalation of any insurrection or armed conflict may occur; |
• | foreign governments may impose or increase investment barriers or other restrictions affecting our business; or |
• | changes in and interpretations of tax policies of foreign governments may adversely affect our foreign subsidiaries. |
The occurrence of any of these conditions could disrupt our business in particular countries or regions of the world, or prevent us from conducting business in particular countries or regions, which could adversely affect our net sales and profitability. In addition, we rely on dividends and other payments or distributions from our subsidiaries to meet our debt obligations. If foreign governments impose limitations on our ability to repatriate funds or impose or increase taxes on remittances or other payments to us, the amount of dividends and other distributions we receive from our subsidiaries could be reduced, which could reduce the amount of cash available to us to meet our debt obligations.
Energy price increases may negatively impact our results of operations.
Certain of the components that we use in our manufacturing activities are petroleum-based. In addition, we, along with our suppliers and customers, rely on various energy sources (including oil) in our transportation activities. While significant uncertainty currently exists about the future levels of energy prices, significant increases are possible. Increased energy prices could cause an increase to our raw material costs and transportation costs. In addition, increased transportation costs of certain of our suppliers could be passed along to us. We may not be able to increase our prices enough to offset these increased costs. In addition, any increase in our prices may reduce our future customer orders and profitability.
We must continue to innovate and improve our products.
We compete primarily based on the value our products delivered to our customers. Our value proposition is based on a combination of price and the technology and performance of our products, including the ability of our products to help reduce our customers’ production costs and increase the quality of the paper they produce. Our ability to retain our customers and increase our business depends on our ability to continually develop new, technologically superior products that support our value proposition. We cannot assure that our investments in technological development will be sufficient, that we will be able to create and market new products, that such new products will be accepted by our customers or that we will be successful in competing against new technologies developed by competitors. In addition, either we or our competitors could develop new technologies that increase the useful life of machine clothing or roll covers, which could reduce the frequency with which our customers would need to replace their machine clothing and refurbish or replace their roll covers, and consequently lead to fewer sales.
14
We believe that market recognition of the extended life of our roll cover products and the trend towards new paper-making machine designs which have fewer rolls will continue to negatively impact the demand for our roll cover products.
We have seen a trend that paper producers are placing an increasingly strong emphasis on maintenance cost reduction and, as a result, are extending the life of roll covers through additional maintenance cycles before replacing them. Market recognition of the extended life of our roll cover products negatively impacts the demand for these products. In addition, we have seen a trend towards new paper-making machine designs which have fewer rolls, also negatively impacting the demand for our roll cover products. If we are not able to offset these negative impacts on the demand for our roll cover products with growth from new roll cover products, the sale of roll cover products in regions which we believe have high growth potential such as China, or from other sources, the volume of our roll cover sales will be adversely affected.
The loss of major customers or the shut down of a mill or mills by one of our customers could have a material adverse effect on our net sales and profitability.
Our top ten customers generated 26.6% of our net sales during 2016. The loss of major customers, financial difficulties faced by our customers or a substantial decrease in such customers’ purchases from us, for instance through the closure of mills, could have a material adverse effect on our net sales and profitability. Because we do not generally have binding long-term purchasing agreements with our customers, there can be no assurance that our existing customers will continue to purchase products from us.
We may fail to adequately protect our proprietary technology, which would allow competitors or others to take advantage of our research and development efforts.
We rely upon trade secrets, proprietary know-how, and continuing technological innovation to develop new products and remain competitive. If our competitors learn of our proprietary technology, they may use this information to produce products that are equivalent or superior to our products, which could reduce the net sales of our products. Our employees, consultants, and corporate collaborators may breach their obligations not to reveal our confidential information, and any remedies available to us may be insufficient to compensate our damages. Even in the absence of such breaches, our trade secrets and proprietary know-how may otherwise become known to our competitors, or be independently discovered by our competitors, which could adversely affect our competitive position.
Our success and ability to compete in the future may depend upon obtaining sufficient patent protection for proprietary technology.
Our patent applications may not result in issued patents, and even if they result in issued patents, the patents may not have claims of the scope we seek. Even in the event that these patents are not issued, the applications may become publicly available and proprietary information disclosed in the applications will become available to others. In addition, any issued patents may be challenged, invalidated or declared unenforceable. The term of any issued patent in the United States is 20 years from its filing date, and if our applications are pending for a long time period, we may have a correspondingly shorter term for any patent that may be issued. Our present and future patents may provide only limited protection for our technology and may not be sufficient to provide competitive advantages to us. For example, competitors could be successful in challenging any issued patents or, alternatively, could develop similar or more advantageous technologies on their own or design around our patents. Also, patent protection in certain foreign countries may not be available or may be limited in scope and any patents obtained may not be as readily enforceable as in the United States, making it difficult for us to effectively protect our intellectual property from misuse or infringement by other companies in these countries. Our inability to obtain and enforce our intellectual property rights in some countries may harm our business. In addition, given the costs of obtaining patent protection, we may choose not to protect certain innovations that later turn out to be important.
We may be liable for product defects or other claims relating to our products.
Our products could be defective, fail to perform as designed or otherwise cause harm to our customers, their equipment or their products. If any of our products are defective, we may be required to recall the products and/or repair or replace them, which could result in substantial expenses and affect our profitability. Any problems with the performance of our products could harm our reputation, which could result in a loss of sales to customers and/or potential customers. In addition, if our customers believe that they have suffered harm caused by our products, they could bring claims against us that could result in significant liability. A failure of our products could cause substantial damage to a paper-making machine. Any claims brought against us by customers may result in:
• | diversion of management’s time and attention; |
• | expenditure of large amounts of cash on legal fees, expenses, and payment of damages; |
• | decreased demand for our products and services; and |
15
• | injury to our reputation. |
Our insurance may not sufficiently cover a large judgment against us or a large settlement payment, and is subject to customary deductibles, limits and exclusions.
Cybersecurity incidents could disrupt business operations, result in the loss of critical and confidential information, and adversely impact our reputation and results of operations.
Global cybersecurity threats can range from uncoordinated individual attempts to gain unauthorized access to our information technology ("IT") systems to sophisticated and targeted measures known as advanced persistent threats. While we employ comprehensive measures to prevent, detect, address and mitigate these threats (including access controls, data encryption, vulnerability assessments, continuous monitoring of our IT networks and systems and maintenance of backup and protective systems), cybersecurity incidents, depending on their nature and scope, could potentially result in the misappropriation, destruction, corruption or unavailability of critical data and confidential or proprietary information (our own or that of third parties) and the disruption of business operations. The potential consequences of a material cybersecurity incident include reputational damage; litigation with third parties; diminution in the value of our investment in research, development and engineering, and increased cybersecurity protection and remediation costs, which in turn could adversely affect our competitiveness and results of operations.
We may be adversely affected if we fail to attract and retain key personnel.
Our future success depends on the continued contributions of our key senior management personnel, including members of our senior sales staff and research and development team. The loss of services of any one or more of our key personnel might significantly delay or prevent the achievement of our business objectives and could cause us to incur additional costs to recruit replacements. Each member of our executive management team may terminate his or her employment at any time. We do not maintain “key person” life insurance with respect to any of our executives.
We could incur substantial costs as a result of violations of or liabilities under laws protecting the environment and human health.
Our operations and facilities are subject to a number of national, state and local laws and regulations protecting the environment and human health in the United States and foreign countries that govern, among other things, the handling, storage and disposal of hazardous materials, discharges of pollutants into the air and water and workplace safety. The U.S. Federal Comprehensive Environmental Response, Compensation and Liability Act, as amended, provides for responses to, and, in some instances, joint and several liability for releases of hazardous substances into the environment. Environmental laws also hold current owners or operators of land or businesses liable for their own and for previous owners’ or operators’ releases of hazardous or toxic substances, materials or wastes, pollutants or contaminants, including petroleum and petroleum products. Because of our operations, the history of industrial uses at some of our facilities, the operations of predecessor owners or operators of some of the businesses and the use and release of hazardous substances at these sites, the liability provisions of environmental laws may affect us. Many of our facilities have experienced some level of regulatory scrutiny in the past and are or may be subject to further regulatory inspections, future requests for investigation or liability for regulated materials management practices.
We cannot assure that we have been or will be at all times in complete compliance with all laws and regulations applicable to us which are designed to protect the environment and human health. We could incur substantial costs, including clean-up costs, fines and sanctions and third party property damage or personal injury claims, as a result of violations of or liabilities under environmental laws, relevant common law or the environmental permits required for our operations or under workplace safety laws. While we believe that the current level of reserves is adequate, the adequacy of these reserves may change in the future due to new developments in particular matters.
Adverse labor relations could harm our operations and reduce our profitability.
We are subject to risk of work stoppages and other labor relations matters because a significant portion of our workforce is unionized. As of December 31, 2016, we had approximately 2,950 employees worldwide, approximately 13% of whom were subject to protection of various North American collective bargaining agreements and approximately 55% of whom were subject to job protection as members of European or South American trade unions, employee associations or workers’ councils. As of December 31, 2016, approximately 11% of the employees subject to North American collective bargaining agreements (or approximately 1.4% of our total employees) were covered by an agreement that is set to expire prior to December 31, 2017. We cannot be certain that we will be able to renew the collective bargaining agreement set to expire this year, or enter into a new collective bargaining agreement that does not adversely affect our operating results or that we will be without production interruptions, including labor stoppages. In addition, all of our European and South American employees subject to job
16
protection as members of trade unions, employee associations or workers’ councils are subject to arrangements that typically result in higher negotiated or mandated salary increases on either an annual or biannual basis. We cannot be certain that the terms of employment applicable to such employees will not change in the future in a manner which could adversely affect our operating results. We cannot be certain that we will not experience disruptions in our operations as a result of labor disputes or experience other labor relations issues. If we are unable to maintain good relations with our employees, our ability to produce our products and provide services to our customers could be reduced and/or our production costs could increase, either of which could disrupt our business and reduce our net sales and profitability.
We may be subject to assessment of income taxes for which we have not accrued any liability.
We accrue for certain known and reasonably anticipated income tax obligations after assessing the likely outcome. In the event that actual results differ from these accruals or if we become subject to a tax obligation for which we have made no accrual, we may need to make adjustments, which could materially impact our financial condition and results of operations. For example, taxing authorities may disagree with our tax accounting methodologies and may subject us to inquiries regarding such taxes, which potentially could result in additional income tax assessments against us. In accordance with accounting rules, we do not accrue for potential income tax obligations if we deem a particular tax position, based solely on its technical merits, is more likely than not to be sustained upon examination. In making our determination, we assume that the taxing authorities will have access to all relevant facts and information.
Risks Relating to Our Capital Structure
Our level of indebtedness could adversely affect our ability to raise additional capital to fund our operations, limit our ability to plan for and react to changes in the economy, our industry or our business and prevent us from meeting our debt obligations.
We are significantly leveraged. As of December 31, 2016, our total indebtedness was approximately $524.5 million. Our substantial degree of leverage could have important consequences to us, including the following:
• | it may limit our ability to obtain additional debt or equity financing for working capital, capital expenditures, product development, debt service requirements, acquisitions or general corporate or other purposes; |
• | a substantial portion of our cash flows from operations will be dedicated to the payment of principal and interest on our indebtedness and will not be available for other purposes, including our operations, capital expenditures and other business opportunities; |
• | certain of our borrowings, including borrowings under our ABL Facility (defined in "Management Discussion & Analysis of Financial Conditions & Results of Operations & Credit Facility and Notes"), are at variable rates of interest, exposing us to the risk of increased interest rates; |
• | if we seek to refinance our debt or require additional refinancing in the future, we may be unable to do so on attractive terms or at all; |
• | it may limit our flexibility in planning for, or our ability to adjust to, changes in our business or the industry in which we operate, and place us at a competitive disadvantage compared to our competitors that have less debt; and |
• | we may be vulnerable to a downturn in general economic conditions or in our business, or we may be unable to carry out capital spending that is important to our growth. |
Despite current indebtedness levels, we may still be able to incur substantially more debt. This could further exacerbate the risks associated with our substantial leverage.
We may be able to incur substantial additional indebtedness in the future. Although the terms of our indenture ("Indenture") governing our 9.50% senior secured notes due 2021 (the "Notes") will limit, and our ABL Facility limits, our ability and the ability of our restricted subsidiaries to incur additional indebtedness, these restrictions are subject to a number of qualifications and exceptions and, under certain circumstances, debt incurred in compliance with these restrictions could be substantial. For example, under the Indenture, we may incur additional indebtedness and certain of such additional indebtedness may be secured, including in the case of additional Notes by a pari passu lien on the collateral, subject to certain conditions. In addition, the Indenture may not prevent us from incurring obligations that do not constitute indebtedness. To the extent that we incur additional indebtedness or such other obligations, the risks associated with our substantial leverage described below, including our possible inability to service our debt, would increase. See “Management’s Discussion and Analysis of Financial Condition and Results of Operations - Credit Facility and Notes” for a more complete description of the terms and features of the ABL Facility and the Notes.
17
The Indenture to the Notes and the ABL Facility include a number of significant restrictions and covenants that limit our flexibility in operating our business.
The Indenture and the ABL Facility include a number of customary and significant restrictions and covenants, subject to certain exceptions, that limit our ability to, among other things:
• | declare dividends or redeem or repurchase equity interests; |
•prepay, redeem or purchase debt;
• incur liens and engage in sale-leaseback transactions;
• make loans and investments;
• incur additional indebtedness;
•amend or otherwise alter debt and other material agreements;
•engage in mergers, acquisitions and asset sales;
•transact with affiliates; and
•engage in businesses that are not related to the Company's existing business.
A breach of any of these covenants could result in a default under our Notes and ABL Facility. Upon the occurrence of an event of default under the Notes or ABL Facility, the our creditors could elect to declare all amounts outstanding thereunder to be immediately due and payable. If we were unable to repay those amounts, our creditors could proceed against the collateral granted to them to secure the Notes and ABL Facility. We have pledged a significant portion of our assets as collateral under the Notes and ABL Facility. If our creditors accelerate the repayment of borrowings, there can be no assurance that we will have sufficient assets to repay the Notes and ABL Facility, or borrow sufficient funds to refinance the Notes and ABL Facility. Even if we are able to obtain new financing, it may not be on commercially reasonable terms, or terms that are acceptable to us.
We may not be able to generate sufficient cash to service all of our indebtedness and may be forced to take other actions to satisfy our obligations under our indebtedness, which may not be successful.
Our ability to make scheduled payments or to refinance our debt obligations depends on our financial and operating performance, which is subject to prevailing economic and competitive conditions and to certain financial, business and other factors beyond our control. There can be no assurance that our future operating performance will generate sufficient cash flows to support our cash requirements. If our cash flows and capital resources are insufficient to fund our debt service obligations, we may be forced to reduce or delay capital expenditures, sell assets or operations, seek additional capital or restructure or refinance our indebtedness. There can be no assurance that we would be able to take any of these actions, that these actions would be successful and permit us to meet our scheduled debt service obligations or that these actions would be permitted under the terms of our existing or future debt agreements, including the ABL Facility or the Indenture. In the absence of such operating results and resources, we could face substantial liquidity problems and might be required to dispose of material assets or operations to meet our debt service and other obligations. Our Indenture restricts our ability to dispose of assets and use the proceeds from the disposition. We may not be able to consummate those dispositions or obtain the proceeds which we could realize from them, and these proceeds may not be adequate to meet any debt service obligations then due.
If we cannot make scheduled payments on our debt, we will be in default and, as a result our debt holders could declare all outstanding debt to be due and payable; the lenders under our ABL Facility could terminate their commitments to lend us money, declare all outstanding amounts there under due and payable and foreclose against the assets securing their borrowings; and we could be forced into bankruptcy or liquidation, which could result in our security holders’ loss of their investment.
Risks Relating to Our Notes
Not all of our subsidiaries are guaranteeing our obligations under the Notes, and the Notes are structurally subordinated to all indebtedness of our non-guarantor subsidiaries.
The Notes are guaranteed by each of our existing and subsequently acquired, direct or indirect wholly-owned domestic subsidiaries. Except for such subsidiary guarantors of the Notes, our subsidiaries, including all of our foreign subsidiaries and our subsidiaries that are less than wholly-owned, have no obligation, contingent or otherwise, to pay amounts due under the Notes or to make any funds available to pay those amounts, whether by dividend, distribution, loan or other payment.
The Notes are structurally subordinated to all indebtedness and other obligations of any non-guarantor subsidiary, even if such obligations do not constitute senior indebtedness, such that, in the event of insolvency, liquidation, reorganization, dissolution or other winding up of any non-guarantor subsidiary, all of such subsidiary’s creditors (including trade creditors and
18
preferred stockholders, if any) would be entitled to payment in full out of such subsidiary’s assets before we would be entitled to any payment. As a result, the Notes are structurally subordinated to all liabilities of our non-guarantor subsidiaries.
Our non-guarantor subsidiaries also may be subject to restrictions on their ability to distribute cash to us as a result of law and, as a result, we may not be able to access their cash flows to service our debt obligations, including the Notes.
Our non-guarantor subsidiaries accounted for approximately $327.7 million or 69.5% of our net sales for year ended December 31, 2016 and $388.5 million or 71.7% of our total assets and $171.3 million or 24.9% of our total liabilities as of December 31, 2016.
Our ability to make any required payments on the Notes is dependent on the operations of and the distribution of funds from our subsidiaries.
We conduct a significant portion of our operations through our subsidiaries. Accordingly, repayment of our indebtedness, including the Notes, is dependent, to a significant extent, on the generation of cash flow by our subsidiaries and their ability to make such cash available to us, by dividend, debt repayment or otherwise. Each of our subsidiaries is a legally distinct entity and, while certain of our domestic subsidiaries have guaranteed the Notes, such Note guarantees (the "Note Guarantees") are subject to risks. The ability of our subsidiaries to pay dividends and make distributions will be subject to, among other things, the terms of any debt instruments of those subsidiaries then in effect, applicable law and, in the case of our foreign subsidiaries, limitations on the repatriation of earnings. If distributions from our subsidiaries to us were eliminated, delayed, reduced or otherwise impaired, our ability to make payments on the Notes would be substantially impaired.
The value of the collateral may not be sufficient to satisfy all the obligations secured by such collateral. As a result, holders of the Notes may not receive full payment on their Notes following an event of default.
In connection with the offering of the Notes, the collateral agent under the Indenture and the agent under our ABL facility entered into an inter-creditor agreement pursuant to which (a) the liens on the ABL Priority Collateral (as defined in the Indenture) securing the Notes and the Note Guarantees are contractually subordinated to the liens thereon that secure our revolving credit facility and certain hedge obligations and cash management service obligations; (b) the lenders under our revolving credit facility, such lenders (or affiliates thereof) who are owed such hedging obligations and cash management service obligations will be entitled to receive proceeds from any realization of such collateral to repay their obligations in full before the holders of the Notes will be entitled to any recovery from such collateral; and (c) the liens on the Notes Priority Collateral securing our revolving credit facility are contractually subordinated to the liens thereon that secure the Notes and the Note Guarantees. In the event of a foreclosure, the proceeds from the sale of all of such collateral and the other collateral that secures the Notes may not be sufficient to satisfy the amounts outstanding under the Notes (and other obligations similarly secured, if any).
No appraisal has been made of the collateral. The value of the collateral is subject to fluctuations and in the event of liquidation will depend upon market and economic conditions, the availability of buyers and similar factors. The collateral does not include contracts, agreements, licenses and other rights that by their express terms prohibit the assignment thereof or the grant of a security interest therein. Some of these may be material to us and such exclusion could have a material adverse effect on the value of the collateral. By its nature, some or all of the collateral may be illiquid, may not have a readily ascertainable market value or may not be saleable or, if saleable, there may be substantial delays in its liquidation. To the extent that liens, security interests and other rights granted to other parties (including the lenders under our ABL facility with respect to the ABL Priority Collateral) encumber assets owned by us, those parties have or may exercise rights and remedies with respect to the property subject to their liens that could adversely affect the value of that collateral and the ability of the collateral agent under the Indenture or the holders thereof to realize or foreclose on that collateral. Consequently, we cannot assure investors in the Notes that liquidating the collateral securing the Notes would produce proceeds in an amount sufficient to pay any amounts due under the Notes after also satisfying the obligations to pay any creditors with prior claims on the collateral, including in the case of the ABL Priority Collateral, the lenders under our revolving credit facility, if applicable. If the proceeds of any sale of collateral are not sufficient to repay all amounts due on the Notes, the holders of the Notes (to the extent not repaid from the proceeds of the sale of the collateral securing the Notes) would have only an unsecured, unsubordinated claim against our and the Guarantors’ remaining assets. Bankruptcy laws and other laws relating to foreclosure and sale also could substantially delay or prevent the ability of the collateral agent or any holder of the Notes to obtain the benefit of any collateral securing the Notes. Such delays could have a material adverse effect on the value of the collateral.
19
We will in most cases have control over the collateral, and the sale of particular assets by us could reduce the pool of assets securing the Notes and the Note Guarantees.
The collateral documents allow us to remain in possession of, retain exclusive control over, freely operate, and collect, invest and dispose of any income from the collateral securing the Notes and the Note Guarantees, in each case subject to certain limitations. There are circumstances other than repayment or discharge of the Notes under which the collateral securing the Notes and the Note Guarantees will be released automatically, without your consent or the consent of the trustee or the collateral agent, including:
• | a sale, transfer or other disposal of such collateral in a transaction not prohibited under the Indenture; |
• | with respect to collateral held by a Guarantor, upon the release of such Guarantor from its Note Guarantee; and |
• | with respect to the ABL Priority Collateral that secures our revolving credit facility, if applicable, upon any release in connection with a foreclosure or exercise of remedies with respect to such collateral in accordance with the terms of the intercreditor agreement. |
The Indenture also permits us to designate any existing or future restricted subsidiary that is a Guarantor or any future subsidiary, whether or not it is a guarantor, as an unrestricted subsidiary. If we designate such a Guarantor as an unrestricted subsidiary for purposes of the Indenture, all of the liens on any collateral owned by such subsidiary or any of its subsidiaries and any Note Guarantee by such subsidiary or any of its subsidiaries will be released under the Indenture but not necessarily under our revolving credit facility, if applicable. Designation of an unrestricted subsidiary will reduce the aggregate value of the collateral securing the Notes to the extent that liens on the assets of the unrestricted subsidiary and its subsidiaries are released.
The lien-ranking provisions set forth in the inter-creditor agreement are expected to substantially limit the rights of the holders of the Notes with respect to liens on the ABL Priority Collateral securing the Notes and the Note Guarantees.
Pursuant to the expected terms of the inter-creditor agreement, the rights of the holders of the Notes with respect to the ABL Priority Collateral are substantially limited. Holders of the Notes may not be able to control actions with respect to the ABL Priority Collateral, including the commencement and conduct of enforcement proceedings against the ABL Priority Collateral, whether or not the holders of the Notes agree or disagree with those actions and even if the rights of the holders of the Notes are adversely affected. Under the inter-creditor agreement, the lenders under our ABL Facility have the sole and exclusive right to exercise remedies with respect to the ABL Priority Collateral for a period of at least 270 days. In addition, such lenders will have rent-free access to, and use of, the Notes Priority Collateral in connection with enforcing their rights against the ABL Priority Collateral for a period of at least 180 days.
The pledge of securities (including the capital stock) of our subsidiaries that secures the Notes will automatically be released from the lien on them and no longer constitute collateral when the pledge of such capital stock or such other securities would require the filing of separate financial statements with the SEC for that subsidiary.
The Notes and the Note Guarantees are secured by a pledge of the capital stock of subsidiaries held by us and the Guarantors (subject in the case of such subsidiaries that are foreign subsidiaries, up to 65% of the voting stock of such subsidiaries and 100% of their non-voting capital stock) and intercompany notes held by us and the Guarantors. Under SEC regulations in effect as of the issue date of the Notes, if the par value, book value as carried by us or market value (whichever is greatest) of the capital stock, other securities or similar items of a subsidiary pledged as part of the collateral is greater than or equal to 20% of the aggregate principal amount of the notes then outstanding, such a subsidiary would be required to provide separate financial statements to the SEC. Therefore, the Indenture and the related collateral documents provide that any capital stock and other securities of our subsidiaries will be excluded from the collateral that secures the Notes and Note Guarantees to the extent that the pledge of such capital stock or other securities would cause such companies to be required to file separate financial statements with the SEC pursuant to Rule 3-16 of Regulation S-X (as in effect from time to time). As a result, holders of the Notes could lose a portion or all of their security interest in the capital stock or other securities of those subsidiaries. It may be more difficult, costly and time-consuming for holders of the Notes to foreclose on the assets of such a subsidiary that is a Guarantor than to foreclose on its capital stock or other securities, so the proceeds realized upon any such foreclosure could be significantly less than those that would have been received upon any sale of the capital stock or other securities of such subsidiary.
20
The rights of holders of Notes to the collateral securing the Notes may be adversely affected by the failure to perfect security interests in the collateral and other issues generally associated with the realization of security interests in collateral.
The Noteholders' rights in the collateral may be adversely affected by the failure to perfect security interests in certain collateral in the future. Applicable law requires that certain property and rights acquired after the grant of a general security interest, such as real property, equipment subject to a certificate of title and certain proceeds, can be perfected only at the time at which such property and rights are acquired and identified. The trustee and the collateral agent for the Notes may not monitor the future acquisition of property and rights that constitute collateral, and necessary action may not be taken to properly perfect the security interest in such after-acquired collateral. The collateral agent for the Notes has no obligation to monitor the acquisition of additional property or rights that constitute collateral or the perfection of any security interest in favor of the Notes against third parties. A failure to monitor such acquisitions and take necessary action may result in the loss of the effectiveness of the grant of the security interest therein or the priority of the security interest in favor of the Notes against third parties.
In addition, the security interest of the collateral agent for the Notes are subject to practical challenges generally associated with the realization of security interests in collateral. For example, the collateral agent may need to obtain the consent of third parties and make additional filings. If we or the collateral agent are unable to obtain these consents or make these filings, the security interests may be invalid and the holders of the Notes will not be entitled to the collateral or any recovery with respect to the collateral. Further, the consents of any third parties (such as a lessor whose consent is required for a mineral lease assignment) may not be given when required to facilitate a foreclosure on such collateral. Accordingly, the collateral agent may not have the ability to foreclose upon those assets, and the value of the collateral may significantly decrease. We are also not required to obtain third party consents in certain categories of collateral.
The imposition of certain permitted liens will cause the assets on which such liens are imposed to be excluded from the collateral securing the Notes and the Note Guarantees. There are also certain other categories of property that are also excluded from the collateral.
The Indenture permits liens in favor of third parties to secure certain indebtedness, such as indebtedness incurred under our ABL facility, purchase money debt and capitalized lease obligations. Certain of these third party liens will rank senior to the liens securing the Notes and in certain circumstances the assets subject to such liens (e.g., assets securing permitted purchase money debt and capitalized lease obligations) will be excluded from the collateral securing the Notes and the Note Guarantees. In addition, certain categories of assets are excluded from the collateral securing the Notes and the Note Guarantees (e.g., voting stock of a foreign subsidiary that is in excess of 65% of all voting stock of such foreign subsidiary) and the liens on certain categories of assets (e.g., motor vehicles subject to title statutes) are not required to be perfected. If an event of default occurs and the Notes are accelerated, the Notes and the Note Guarantees will rank equally with the holders of other unsubordinated and unsecured indebtedness of the relevant entity with respect to such excluded property and will be effectively subordinated to holders of obligations secured by a lien perfected on such excluded property.
Rights of holders of Notes in the collateral may be adversely affected by bankruptcy proceedings.
The right of the collateral agent for the Notes to repossess and dispose of the collateral securing the Notes upon acceleration is likely to be significantly impaired by federal bankruptcy law if bankruptcy proceedings are commenced by or against us prior to or possibly even after the collateral agent has repossessed and disposed of the collateral. Under the U.S. Bankruptcy Code, a secured creditor, such as the collateral agent for the Notes, is prohibited from repossessing its security from a debtor in a bankruptcy case, or from disposing of security repossessed from a debtor, without bankruptcy court approval. Moreover, bankruptcy law permits the debtor to continue to retain and to use collateral, and the proceeds, products, rents or profits of the collateral, even though the debtor is in default under the applicable debt instruments, provided that the secured creditor is given “adequate protection.” The meaning of the term “adequate protection” may vary according to circumstances, but it is intended in general to protect the value of the secured creditor’s interest in the collateral and may include cash payments or the granting of additional security, if and at such time as the court in its discretion determines, for any diminution in the value of the collateral as a result of the stay of repossession or disposition or any use of the collateral by the debtor during the pendency of the bankruptcy case. In view of the broad discretionary powers of a bankruptcy court, it is impossible to predict how long payments under the Notes could be delayed following commencement of a bankruptcy case, whether or when the collateral agent would repossess or dispose of the collateral, the value of the collateral at the time of the bankruptcy petition or whether or to what extent holders of the Notes would be compensated for any delay in payment or loss of value of the collateral through the requirements of “adequate protection.” Any disposition of the collateral during a bankruptcy case would also require permission of the bankruptcy court. Furthermore, in the event the bankruptcy court determines that the value of the collateral is not sufficient to repay all amounts due on the Notes, the holders of the Notes would have “under-secured claims”
21
as to the difference. Federal bankruptcy laws do not permit the payment or accrual of interest, costs and attorneys’ fees for “under-secured claims” during the debtor’s bankruptcy case. Additionally, the trustee’s ability to foreclose on the collateral on the Noteholders' behalf may be subject to the consent of third parties, prior liens and practical problems associated with the realization of the trustee’s security interest in the collateral. Moreover, the debtor or trustee in a bankruptcy case may seek to void an alleged security interest in collateral for the benefit of the bankruptcy estate. It may successfully do so if the security interest is not properly perfected or was perfected within a specified period of time (generally 90 days) prior to the initiation of such proceeding. Under such circumstances, a creditor may hold no security interest and be treated as holding a general unsecured claim in the bankruptcy case. It is impossible to predict what recovery (if any) would be available for such an unsecured claim if we became a debtor in a bankruptcy case. While bankruptcy law generally invalidates provisions restricting a debtor’s ability to assume and/or assign a contract, there are exceptions to this rule which could be applicable in the event that we become subject to a bankruptcy proceeding.
Federal and state fraudulent transfer laws may permit a court to void the Notes, the Note Guarantees and the liens granted in respect thereof, subordinate claims in respect of the Notes and the Note Guarantees and require Noteholders to return payments received and, if that occurs, Noteholders may not receive any payments on the Notes.
Federal and state fraudulent transfer and conveyance statutes may apply to the issuance of the Notes, the incurrence of any Note Guarantees of the Notes and the granting of any liens in respect thereof. Under federal bankruptcy law and comparable provisions of state fraudulent transfer or conveyance laws, which may vary from state to state, the Notes, any Note Guarantee or any lien granted in respect thereof could be voided as a fraudulent transfer or conveyance if (i) we or any Guarantor, as applicable, issued the Notes or incurred the Note Guarantees with the intent of hindering, delaying or defrauding creditors or (ii) we or any Guarantor, as applicable, received less than reasonably equivalent value or fair consideration in return for either issuing the Notes, incurring the Note Guarantees or granting any lien in respect thereof and, in the case of (ii) only, one of the following is also true at the time thereof: (1) we or any Guarantor, as applicable, were insolvent or rendered insolvent by reason of the issuance of the Notes or the incurrence of the Note Guarantees; (2) the issuance of the Notes or the incurrence of the Note Guarantees left us or any Guarantor, as applicable, with an unreasonably small amount of capital to carry on its business; or (3) we or any Guarantor intended to, or believed that we or such Guarantor would, incur debts beyond our or such Guarantor’s ability to pay such debts as they mature.
A court would likely find that we or a Guarantor did not receive reasonably equivalent value or fair consideration for the Notes, such Note Guarantee or such lien if we or such Guarantor did not substantially benefit directly or indirectly from the issuance of the Notes or the applicable Note Guarantee or such lien. As a general matter, value is given for a transfer or an obligation if, in exchange for the transfer or obligation, property is transferred or an antecedent debt is secured or satisfied. A debtor will generally not be considered to have received value in connection with a debt offering if the debtor uses the proceeds of that offering to make a dividend payment or otherwise retire or redeem equity securities issued by the debtor.
We cannot be certain as to the standards a court would use to determine whether or not we or such Guarantor were solvent at the relevant time or, regardless of the standard that a court uses, that the issuance of the Note Guarantee would not be subordinated to our or any Guarantor’s other debt. Generally, however, an entity would be considered insolvent if, at the time it incurred indebtedness: (i) the sum of its debts, including contingent liabilities, was greater than the fair saleable value of all its assets; or (ii) the present fair saleable value of its assets was less than the amount that would be required to pay its probable liability on its existing debts, including contingent liabilities, as they become absolute and mature; or (iii) it could not pay its debts as they become due.
If a court were to find that the issuance of the Notes, the incurrence of the Note Guarantees or the granting of any lien is respect thereof was a fraudulent transfer or conveyance, the court could void the payment obligations under the Notes or such Note Guarantees, void such lien or subordinate the Notes or such Note Guarantees to presently existing and future indebtedness of ours or of the related Guarantor, or require the holders of the Notes to repay any amounts received with respect to such Note Guarantees. In the event of a finding that a fraudulent transfer or conveyance occurred, Noteholders may not receive any repayment on the Notes. Further, the voidance of the Notes could result in an event of default with respect to our and our subsidiaries’ other debt that could result in acceleration of such debt.
Although any Note Guarantee entered into in connection with the issuance of the Notes will contain a provision intended to limit that Guarantor’s liability to the maximum amount that it could incur without causing the incurrence of obligations under its Note Guarantee to be a fraudulent transfer, this provision may not be effective to protect such Note Guarantee from being voided under fraudulent transfer law, or may reduce that Guarantor’s obligation to an amount that effectively makes its Note Guarantee worthless.
22
If we default on our obligations to pay our other indebtedness, we may not be able to make payments on the Notes.
Any default under the agreements governing our current or future indebtedness, including a default under our revolving credit facility, that is not waived by the required lenders, and the remedies sought by the holders of such indebtedness could prevent us from paying principal, premium, if any, interest on the Notes and substantially decrease the market value of the Notes. If we are unable to generate sufficient cash flow and are otherwise unable to obtain funds necessary to meet required payments of principal, premium, if any, interest and additional interest, if any, on our indebtedness, or if we otherwise fail to comply with the various covenants, including financial and operating covenants in the instruments governing our indebtedness (including covenants in our ABL facility and the Indenture), we could be in default under the terms of the agreements governing such indebtedness, including our ABL facility and the Indenture. In the event of such default:
• | the holders of such indebtedness may be able to cause all of our available cash flow to be used to pay such indebtedness and, in any event, could elect to declare all the funds borrowed thereunder to be due and payable, together with accrued and unpaid interest; and |
• | the lenders under our ABL facility could elect to terminate their commitments thereunder, cease making further loans and institute foreclosure proceedings against our assets; and |
• | we could be forced into bankruptcy or liquidation. |
If our operating performance declines, we may in the future need to obtain waivers from the required lenders under our ABL facility to avoid being in default. If we breach our covenants under our ABL facility and seek a waiver, we may not be able to obtain a waiver from the required lenders. If this occurs, we would be in default under our ABL facility, the lenders could exercise their rights, as described above, and we could be forced into bankruptcy or liquidation.
Because each Guarantor’s liability under its Note Guarantees may be reduced to zero, avoided or released under certain circumstances, Noteholders may not receive any payments from some or all of the Guarantors.
The Note Guarantees by the Guarantors are limited to the maximum amount that the Guarantors are permitted to guarantee under applicable law. As a result, a Guarantor’s liability under its Note Guarantee could be reduced to zero, depending on the amount of other obligations of such Guarantor. Further, under the circumstances discussed more fully above, a court under federal or state fraudulent conveyance and transfer statutes could void the obligations under a guarantee or subordinate it to all other obligations of the Guarantor. In addition, Noteholders will lose the benefit of a particular guarantee if it is released under certain circumstances.
The collateral is subject to casualty risks.
We intend to maintain insurance or otherwise insure against hazards in a manner appropriate and customary for our business. There are, however, certain losses that may be either uninsurable or not economically insurable, in whole or in part. Insurance proceeds may not compensate us fully for our losses. If there is a complete or partial loss of any of the collateral, the insurance proceeds may not be sufficient to satisfy all of the secured obligations, including the Notes and the Note Guarantees.
We may not be permitted to use the funds necessary to finance the repurchase of the Notes in connection with an excess cash flow offer required by the Indenture.
Subject to certain conditions, the Indenture governing the Notes requires us, within 95 days of the end of each fiscal year, to make an offer to repurchase Notes at 101.5% of the principal amount thereof, plus accrued and unpaid interest and additional interest, if any, to the date of purchase with a portion of our excess cash flow for the prior fiscal year; provided that for the fiscal year ending December 31, 2017, excess cash flow will be calculated for the five consecutive fiscal quarters ended December 31, 2017. However, restrictions under our ABL facility or other future debt instruments may not allow us to repurchase the Notes in an excess cash flow offer. If we could not refinance such debt or otherwise obtain a waiver from the holders of such debt, we would be prohibited from repurchasing the Notes, which would constitute an event of default under the Indenture. If the indebtedness under our ABL facility is not paid, the lenders thereunder may seek to enforce security interests in the collateral securing such indebtedness, thereby limiting our ability to raise cash to purchase the Notes, and reducing the practical benefit of the offer to purchase provisions to the holders of the Notes.
The credit ratings assigned to the Notes may not reflect all risks of an investment in the Notes.
The credit ratings assigned to the Notes reflect the rating agencies’ assessments of our ability to make payments on the Notes when due. Consequently, actual or anticipated changes in these credit ratings will generally affect the market value of
23
the Notes. These credit ratings, however, may not reflect the potential impact of risks related to structure, market or other factors related to the value of the Notes.
Our ability to repurchase the Notes upon a change of control may be limited.
Upon the occurrence of specific change of control events, we will be required to offer to repurchase all outstanding Notes at 101% of the principal amount thereof, plus accrued and unpaid interest and additional interest, if any, to the date of repurchase. In addition, lenders under our ABL facility may have the right to accelerate the indebtedness thereunder upon a change of control. Any of our future debt agreements may contain a similar provision regarding the lender’s right to accelerate the indebtedness upon a change of control. However, we may not have sufficient funds at the time of the change of control to make the required repurchase of Notes or repayment of our other indebtedness.
If we fail to repurchase any Notes submitted in a change of control offer, it would constitute an event of default under the Indenture which, in turn, would constitute an event of default under our ABL facility and could constitute an event of default under our other indebtedness, even if the change of control itself would not cause a default. Important corporate events, such as takeovers, recapitalizations or similar transactions, may not constitute a change of control under the Indenture and thus not permit the holders of the Notes to require us to repurchase or redeem the Notes.
Noteholders may not be able to determine when a change of control giving rise to mandatory repurchase rights has occurred following a sale of “substantially all” of our assets and our restricted subsidiaries’ assets.
The definition of change of control in the Indenture includes a phrase relating to the direct or indirect sale, conveyance, transfer, lease or other disposition of “all or substantially all” of our assets and our restricted subsidiaries’ assets. There is no precise established definition of the phrase “substantially all” under applicable law. Accordingly, the Noteholders' ability to require us to repurchase Notes as a result of a sale, conveyance, transfer, lease or other disposition of less than all of our assets and our restricted subsidiaries’ assets to another individual, group or entity may be uncertain.
We cannot assure Noteholders that an active trading market will develop for the Notes. The failure of a market to develop for the Notes could affect the liquidity and value of the Notes.
The Notes are a new issue of securities, and there is no existing market for the Notes. The Notes are not listed on any national securities exchange or quoted on any inter-dealer quotation system. The initial purchasers of the Notes (the "Initial Purchasers") have informed us that they intend to make a market in the Notes. However, the Initial Purchasers are under no obligation to do so and each Initial Purchaser may cease its market making activities at any time in its sole discretion and without notice. In addition, the liquidity of any trading market in the Notes and the exchange notes, if any, and any market price quoted for the Notes and the exchange notes, may be adversely affected by changes in the overall market for high-yield securities and by changes in our financial performance or prospects or in the financial performance or prospects of companies in our industry generally. In addition, such market-making activities will be subject to limits imposed by the U.S. federal securities laws, and may be limited during the exchange offer or the pendency of any shelf registration statement. As a result, we cannot assure Noteholders that an active trading market will develop or be maintained for the Notes. If an active trading market does not develop or is not maintained, the market price and liquidity of the Notes may be adversely affected. In that case Noteholders may not be able to sell their Notes at a particular time or they may not be able to sell their Notes at a favorable price.
The market price for the Notes may be volatile.
Historically, the market for non-investment grade debt has been subject to disruptions that have caused substantial volatility in the prices of securities similar to the Notes. The market for the Notes, if any, may be subject to similar disruptions. Any such disruptions may adversely affect the value of the Notes. In addition, subsequent to their initial issuance, the Notes may trade at a discount from their initial offering price, depending upon prevailing interest rates, the market for similar Notes, our performance and other factors.
Risks Relating to Our Common Stock
We do not anticipate paying a dividend on our common stock in the foreseeable future, which may adversely affect the market price of our common stock.
Our ABL Facility and the Indenture governing our Notes limits the payment of dividends on our common stock. Accordingly, we do not anticipate paying dividends on our common stock for the foreseeable future. The lack of dividend payments may adversely affect the market price of our common stock.
24
The market price of our common stock has been volatile since our initial public offering and may continue to be volatile.
Shares of our common stock may continue to experience substantial price volatility, including significant decreases, in response to a number of events, including:
• | sales of our common stock by principal stockholders; |
• | our quarterly operating results; |
• | issuances of our common stock; |
• | future announcements concerning our business; |
• | our dividend policy; |
• | the failure of securities analysts to cover our common stock and/or changes in financial estimates and recommendations by securities analysts; |
• | actions of competitors; |
• | fluctuations in foreign currency exchange rates; |
• | changes in U.S. and foreign government regulation; |
• | general market, economic and political conditions; and |
• | natural disasters, terrorist attacks and acts of war. |
On December 31, 2016, the last trading day in 2016, the closing price of our common stock was $5.62 as compared with $11.85 as of December 31, 2015. During the twelve months ended December 31, 2016, the lowest trading price of our common stock was $4.26 and the highest trading price was $12.23.
Some companies that have had volatile market prices for their securities have had securities class action lawsuits filed against them. Such lawsuits, should they be filed against us in the future, could result in substantial costs and a diversion of management’s attention and resources. This could have a material adverse effect on our business, results of operations and financial condition.
Certain shareholders have significant influence over our business and significant transactions.
We have a director nomination agreement with Carl Marks Strategic Investments, LP (together with its affiliates, "Carl Marks") pursuant to which Carl Marks may designate one individual for nomination to our Board of Directors, so long as Carl Marks continues to own at least 50% of the common stock issued to them under the plan of reorganization in connection with our bankruptcy in 2010. As of February 28, 2017, Carl Marks owned 13.1% of the outstanding shares of our common stock. Mr. Wilson, who is a general partner of Carl Marks Management Company, is also our Chairman of the Board. As a result, Carl Marks has a strong ability to influence our business, policies and affairs, and we cannot be certain that their interests will be consistent with the interests of other holders of our common stock.
Anti-takeover provisions could make it more difficult for a third-party to acquire us.
Our Board of Directors has the authority to issue up to one million shares of preferred stock (of which 20,000 shares have been designated as Series A Junior Participating Preferred Stock) and to determine the price, rights, preferences, privileges and restrictions, including voting rights, of those shares without any further vote or action by the stockholders.
The rights of the holders of our common stock may be subject to, and may be adversely affected by, the rights of the holders of any preferred stock that may be issued in the future. The issuance of preferred stock may have the effect of delaying, deterring or preventing a change in control of our company without further action by the stockholders and may adversely affect the voting and other rights of the holders of our common stock. For instance, we previously adopted a shareholder rights plan, which has since lapsed, that if implemented could have substantially diluted the stock ownership of a person or group attempting to take us over without the approval of our Board of Directors. Our Board of Directors could choose to adopt a stockholder rights plan in the future that may have the effect of making it more difficult for a third party to acquire us (or a significant percentage of our outstanding capital stock) without first negotiating with our Board of Directors regarding that acquisition.
Further, some provisions of our charter documents, including provisions eliminating the ability of stockholders to take action by written consent and limiting the ability of stockholders to raise matters at a meeting of stockholders without giving advance notice, may have the effect of delaying or preventing changes in control or management of our company, which could have an adverse effect on the market price of our stock. In addition, our charter documents do not permit cumulative voting, which may make it more difficult for a third party to gain control of our Board of Directors. Further, we are subject to the anti-takeover provisions of Section 203 of the Delaware General Corporation Law, which will prohibit us from engaging in a “business combination” with an “interested stockholder” for a period of three years after the date of the transaction in which the person became an interested stockholder, even if such combination is favored by a majority of stockholders, unless the business
25
combination is approved in a prescribed manner. The application of Section 203 also could have the effect of delaying or preventing a change in control of our company.
If securities or industry analysts downgrade our common shares or publish misleading or unfavorable research about our business, our share price and trading volume could decline.
The trading market for our common shares is influenced in part on the research and reports that securities or industry analysts publish about us or our business. If one or more of these analysts downgrades our shares or publishes misleading or unfavorable research about our business, our share price would likely decline. If one or more of these analysts ceases coverage of our Company or fails to publish reports on us regularly, demand for our shares could decrease, which could cause our share price or trading volume to decline.
We are exposed to risks relating to evaluations of our internal controls required by Section 404 of the Sarbanes-Oxley Act.
If we fail to maintain an effective system of internal controls, we may not be able to accurately report our financial results. We are required to provide reliable financial statements and reports to our shareholders. To monitor the accuracy and reliability of our financial reporting, we have established an internal audit function that oversees our internal controls. In addition, we have developed policies and procedures with respect to company-wide business processes and cycles in order to implement effective internal control over financial reporting. While we have undertaken substantial work to comply with Section 404 of the Sarbanes-Oxley Act, we cannot be certain that we will be successful in maintaining effective internal control over our financial reporting and may determine in the future that our existing internal controls need improvement. If we fail to comply with proper overall controls, we could be materially harmed or fail to meet our reporting obligations. In addition, the existence of a material weakness or significant deficiency in our internal controls could result in errors in our financial statements that could require a restatement, cause us to fail to meet our reporting obligations, result in increased costs to remediate any deficiencies, attract regulatory scrutiny or lawsuits and cause investors to lose confidence in our reported financial information, leading to a substantial decline in the market price of our common stock.
ITEM 1B. | UNRESOLVED STAFF COMMENTS |
None.
ITEM 2. | PROPERTIES |
As of December 31, 2016, we operate 28 manufacturing facilities in the following 13 countries: Argentina, Austria, Australia, Brazil, Canada, China, Finland, Germany, Italy, Japan, Mexico, Turkey and the United States. Of the 28 manufacturing facilities that we operate, 10 are clothing manufacturing facilities and 18 are rolls manufacturing facilities; five of our facilities are leased and twenty-three are owned by the Company. We believe that the production capacity under these facilities is adequate to meet our operational needs for 2017. De-bottlenecking of certain assets in certain facilities will continue into the foreseeable future as the Company evolves its business into targeted growth areas. Additionally, the Company is underway with construction of its 29th plant located in Chile to serve that local market.
ITEM 3. | LEGAL PROCEEDINGS |
We and our subsidiaries are involved in various legal matters, which have arisen in the ordinary course of business as a result of various labor claims, taxing authority reviews and other legal matters. As of December 31, 2016, we accrued an immaterial amount in our financial statements for these matters for which we believed the possibility of loss was either probable or possible, and we were able to estimate the damages or, under applicable income tax accounting guidance, it was more likely than not we would not be able to sustain a particular income tax position. These estimates have been developed in consultation with counsel and are based upon an analysis of potential results, assuming a combination of litigation and settlement strategies. It is possible, however, that future results of operations for any particular period could be materially affected by changes in our assumptions or the effectiveness of our strategies related to these proceedings.
Governmental Proceedings and Undertakings.
None.
26
ITEM 4. | MINE SAFETY DISCLOSURES |
Not applicable.
PART II
ITEM 5. | MARKET FOR REGISTRANT’S COMMON EQUITY, RELATED STOCKHOLDER MATTERS AND ISSUER PURCHASES OF EQUITY SECURITIES |
Our common stock is quoted on the New York Stock Exchange under the symbol “XRM”. On February 28, 2017, there were approximately 83 stockholders of record of our common stock, and the closing price of our common stock as reported by the New York Stock Exchange was $5.14 per share. The following table lists the high and low sales prices for our common stock within the two most recent fiscal years.
Period | High | Low | ||||||
2016 | ||||||||
Fourth quarter | $ | 8.23 | $ | 5.20 | ||||
Third quarter | $ | 8.96 | $ | 6.42 | ||||
Second quarter | $ | 7.59 | $ | 4.26 | ||||
First quarter | $ | 12.23 | $ | 4.98 | ||||
2015 | ||||||||
Fourth quarter | $ | 14.83 | $ | 10.25 | ||||
Third quarter | $ | 18.80 | $ | 11.53 | ||||
Second quarter | $ | 18.93 | $ | 16.10 | ||||
First quarter | $ | 16.39 | $ | 14.20 | ||||
The following information in this Item 5 of this Annual Report on Form 10-K is not deemed to be “soliciting material” or to be “filed” with the SEC or subject to Regulation 14A or 14C under the Exchange Act or to the liabilities of Section 18 of the Exchange Act, and will not be deemed to be incorporated by reference into any filing under the Securities Act or the Exchange Act, except to the extent we specifically incorporate it by reference into such filing.
Since 2007, we have not declared or paid cash dividends on our common stock. Under the Indenture governing our Notes and our ABL Facility, we are prohibited from paying cash dividends, and therefore we currently do not anticipate paying any cash dividends in the foreseeable future. Any future determination to declare cash dividends will be made at the discretion of our board of directors, subject to applicable laws, and will depend on our financial condition, results of operations, capital requirements, general business conditions and other factors that our board of directors may deem relevant.
27
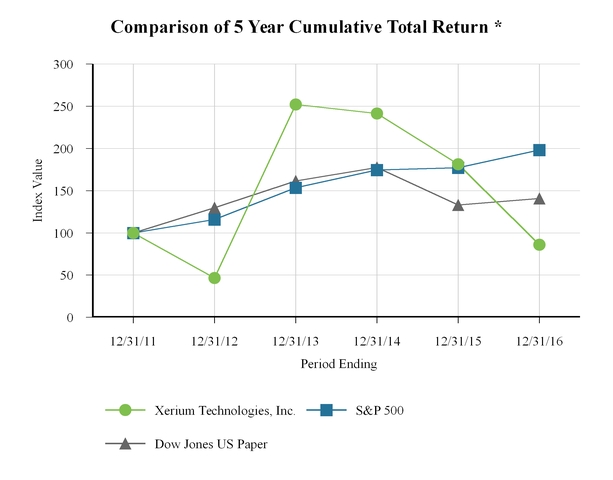
* $100 invested on 12/31/2011 in stock or index, including reinvestment of dividends. Fiscal year ending December 31.
28
ITEM 6. | SELECTED FINANCIAL DATA |
The following selected financial data should be read in conjunction with our financial statements and the related Notes to Consolidated Financial Statements.
Year ended December 31, | ||||||||||||||||||||
2016 | 2015 | 2014 | 2013 | 2012 | ||||||||||||||||
(in thousands, except per share data) | ||||||||||||||||||||
Statement of operations data: | ||||||||||||||||||||
Net sales | $ | 471,317 | $ | 477,243 | $ | 542,932 | $ | 546,892 | $ | 538,740 | ||||||||||
Costs and expenses: | ||||||||||||||||||||
Cost of products sold | 293,842 | 288,512 | 327,161 | 337,256 | 345,171 | |||||||||||||||
Selling | 62,810 | 64,414 | 73,002 | 73,348 | 76,083 | |||||||||||||||
General and administrative | 51,063 | 56,250 | 56,539 | 60,214 | 63,701 | |||||||||||||||
Research and development | 7,100 | 7,404 | 7,903 | 7,858 | 11,681 | |||||||||||||||
Restructuring | 10,362 | 14,649 | 18,142 | 14,844 | 25,708 | |||||||||||||||
Total operating costs and expenses | 425,177 | 431,229 | 482,747 | 493,520 | 522,344 | |||||||||||||||
Income from operations | 46,140 | 46,014 | 60,185 | 53,372 | 16,396 | |||||||||||||||
Other (expense) income: | ||||||||||||||||||||
Interest expense, net | (46,155 | ) | (38,413 | ) | (36,768 | ) | (40,681 | ) | (37,878 | ) | ||||||||||
(Loss) gain on extinguishment of debt | (11,938 | ) | (388 | ) | — | (3,123 | ) | 243 | ||||||||||||
Foreign exchange (loss) gain | (383 | ) | 1,872 | (719 | ) | (1,052 | ) | (358 | ) | |||||||||||
(Loss) income before (provision) benefit for income taxes | (12,336 | ) | 9,085 | 22,698 | 8,516 | (21,597 | ) | |||||||||||||
(Provision) benefit for income taxes | (9,282 | ) | (13,465 | ) | (30,080 | ) | (4,363 | ) | 3,562 | |||||||||||
Net (loss) income | $ | (21,618 | ) | $ | (4,380 | ) | $ | (7,382 | ) | $ | 4,153 | $ | (18,035 | ) | ||||||
Net (loss) income per common share—basic | $ | (1.35 | ) | $ | (0.28 | ) | $ | (0.48 | ) | $ | 0.27 | $ | (1.18 | ) | ||||||
Net (loss) income per common share—diluted | $ | (1.35 | ) | $ | (0.28 | ) | $ | (0.48 | ) | $ | 0.26 | $ | (1.18 | ) | ||||||
Cash dividends per common share | $ | — | $ | — | $ | — | $ | — | $ | — | ||||||||||
Year ended December 31, | ||||||||||||||||||||
2016 | 2015 | 2014 | 2013 | 2012 | ||||||||||||||||
Balance sheet data (at end of period): | ||||||||||||||||||||
Unrestricted cash and cash equivalents | $ | 12,808 | $ | 9,839 | $ | 9,517 | $ | 25,716 | $ | 34,777 | ||||||||||
Total assets | $ | 541,913 | $ | 550,374 | $ | 584,273 | $ | 612,986 | $ | 605,330 | ||||||||||
Total debt (1) | $ | 508,087 | $ | 483,173 | $ | 469,435 | $ | 443,139 | $ | 444,992 | ||||||||||
Total stockholders’ deficit | $ | (146,905 | ) | $ | (113,070 | ) | $ | (74,110 | ) | $ | (11,449 | ) | $ | (29,061 | ) | |||||
Cash flow data: | ||||||||||||||||||||
Net cash provided by operating activities (2) | $ | 36,509 | $ | 33,287 | $ | 8,834 | $ | 36,232 | $ | 39,645 | ||||||||||
Net cash used in investing activities | $ | (29,814 | ) | $ | (47,605 | ) | $ | (41,788 | ) | $ | (41,869 | ) | $ | (20,617 | ) | |||||
Net cash (used in) provided by financing activities (2) | $ | (2,326 | ) | $ | 14,450 | $ | 18,751 | $ | (3,392 | ) | $ | (27,795 | ) | |||||||
Other financial data: | ||||||||||||||||||||
Depreciation and amortization | $ | 32,956 | $ | 29,250 | $ | 34,292 | $ | 36,403 | $ | 40,838 | ||||||||||
Capital expenditures | $ | 13,706 | $ | 50,871 | $ | 45,218 | $ | 44,145 | $ | 21,705 | ||||||||||
(1) Previously disclosed prior year amounts were reduced by deferred financing costs, amounts shown above reflect the Company adopting ASU 2015-03 at December 31, 2015.
(2) Previously disclosed prior year amounts were adjusted to reflect the adoption of ASU 2016-09 at December 31, 2016. Further discussion available in Footnote 2.
29
ITEM 7. | MANAGEMENT’S DISCUSSION AND ANALYSIS OF FINANCIAL CONDITION AND RESULTS OF OPERATIONS |
The following discussion should be read in conjunction with the section titled “Risk Factors,” the Consolidated Financial Statements and related Notes and other financial information appearing elsewhere in this Annual Report on Form 10-K.
Company Overview
We are a leading global manufacturer and supplier of two types of consumable products used primarily in the production of paper—machine clothing and roll covers. Our operations are strategically located in the major paper-producing regions of North America, Europe, South America and Asia-Pacific.
Our products play key roles in the formation and processing of paper along the length of a paper-making machine. Paper producers rely on our products and services to help improve the quality of their paper, differentiate their paper products, operate their paper-making machines more efficiently and reduce production costs. Our products and services typically represent only a small percentage of a paper producer’s overall production costs, yet they can reduce costs by permitting the use of lower-cost raw materials and by reducing energy consumption. Paper producers must replace machine clothing and refurbish or replace roll covers periodically as these products wear down during the paper production process. Our products are designed to withstand high temperatures, chemicals and high pressure conditions and are the result of a substantial investment in research and development and highly sophisticated manufacturing processes.
We operate in two principal business segments: machine clothing and roll covers. In our machine clothing segment, we manufacture and sell highly engineered synthetic textile belts that transport paper as it is processed in a paper-making machine. Machine clothing plays a significant role in the forming, pressing and drying stages of paper production. Because paper-making processes and machine specifications vary widely, the machine clothing size, form, material and function is custom engineered to fit each individual paper-making machine and process. For the year ended December 31, 2016, our machine clothing segment represented 61% of our net sales.
Our roll cover products provide a surface with the mechanical properties necessary to process the paper sheet in a cost-effective manner that delivers the sheet qualities desired by the paper producer. We tailor our roll covers to individual paper-making machines and processes, using different materials, treatments and finishings. In addition to manufacturing and selling new roll covers, we also provide mechanical and refurbishment services for previously installed roll covers and we manufacture new and rebuilt spreader rolls. We also provide various related mechanical services both directly and through third party providers. For the year ended December 31, 2016, our roll cover segment represented 39% of our net sales.
Industry Trends and Outlook
The Company's markets have gone through a tough business cycle. Demand for the Company’s products are tied to our customer’s production rates and our product’s useful lives. While the majority of the Company’s end markets are growing, certain graphical grade paper production market segments have been in decline. Non-declining markets make up greater than 75% of the Company’s business model. Production of these grades of paper and board (tissue, paper towels, napkins, cardboard, consumer packaging, consumer durable packaging, e-commerce packaging) is steady and/or increasing globally. Declining grades of paper production are newsprint globally, and printing/writing papers in mature economies with full access to wireless/digital media. These market corrections have been very strong in the last few years and many paper machines dedicated to graphical paper production have been closed. At the same time, new machines have been installed to make the growing grades of paper and board. Both of these trends are continuing. In order to optimize outcomes in this changing environment, the company has been implementing a repositioning program to re-map its people, products, equipment tooling, machine services offered, and plant locations to more naturally align with growing markets both geographically and by type of paper machine serviced.
Net Sales and Expenses
Net sales in both our machine clothing and roll covers segments are primarily driven by the following factors:
Ÿ | the volume (tonnage) of worldwide paper production; | ||
Ÿ | our ability to introduce new products that our customers value and will pay for; | ||
Ÿ | advances in the technology of our products, which can provide value to our customers by improving the efficiency of paper-making machines and reduce their manufacturing costs; | ||
Ÿ | growth in developing markets, particularly in Asia-Pacific; | ||
Ÿ | the mix of paper grades being produced; | ||
Ÿ | our ability to enter and expand our business in non-paper products; and | ||
30
Ÿ | the impact of currency fluctuations. | ||
Net sales in our roll covers segment include our mechanical services business. We have expanded this business in response to demand from paper producers. We perform work on the internal mechanisms of their rolls while we refurbish or replace a roll cover. In our machine clothing segment, a small portion of our business has been conducted pursuant to consignment arrangements; for these, we do not recognize a sale of a product to a customer until the customer places the product into use, which typically occurs some period after the product is shipped to the customer or to a warehouse location near the customer’s facility. As part of the consignment agreement, we deliver the goods to a location designated by the customer. In addition, we agree to a “sunset” date with the customer, which represents the date by which the customer must accept all risks and responsibilities of ownership of the product and payment terms begin. For consignment sales, revenue is recognized on the earlier of the actual product installation date or the “sunset” date.
Our operating cost levels are impacted by total sales volume, raw material costs, the impact of inflation, foreign currency fluctuations and the success of our cost reduction programs.
The level of our cost of products sold is primarily attributable to labor costs, raw material costs, product shipping costs, plant utilization and depreciation, with labor costs constituting the largest component. We invest in facilities and equipment that enable innovative product development and improve production efficiency and costs. Recent examples of capital spending for such purposes include faster weaving looms and seaming machines with accurate electronic controls, automated compound mixing equipment and computer-controlled lathes and mills.
The level of research and development spending is driven by market demand for technology enhancements, including both specific customer needs and general market requirements, as well as by our own analysis of applied technology opportunities. With the exception of purchases of equipment and similar capital items used in our research and development activities, all research and development is expensed as incurred. Research and development expenses were $7.1 million in 2016, $7.4 million in 2015 and $7.9 million in 2014.
Foreign Exchange
A substantial portion of our net sales is denominated in Euros or other currencies. As a result, changes in the relative values of U.S. Dollars, Euros and other currencies affect our reported levels of net sales and profitability as the results are translated into U.S. Dollars for reporting purposes. In particular, decreases in the value of the U.S. Dollar relative to the value of the Euro and these other currencies positively impact our levels of revenue and profitability because the translation of a certain number of Euros or units of such other currencies into U.S. Dollars for financial reporting purposes will represent more U.S. Dollars than it would have prior to the relative decrease in the value of the U.S. Dollar. Conversely, a decline in the value of the Euro will result in a lower number of U.S. Dollars for financial reporting purposes.
For certain transactions, our net sales are denominated in U.S. Dollars, but all or a substantial portion of the associated costs are denominated in a different currency. As a result, changes in the relative values of U.S. Dollars, Euros and other currencies can affect the level of the profitability of these transactions. The largest proportion of such transactions consists of transactions in which the net sales are denominated in or indexed to the U.S. Dollar and all or a substantial portion of the associated costs are denominated in Brazilian Reals or other currencies.
During the year ended December 31, 2016, we conducted business in ten foreign currencies. The following table provides the average exchange rate for the year ended December 31, 2016 and the year ended December 31, 2015 of the U.S. Dollar against each of the four foreign currencies in which we conduct the largest portion of our operations.
Currency | Average exchange rate of the U.S. Dollar in the year December 31, 2016 | Average exchange rate of the U.S. Dollar in the year December 31, 2015 | ||
Euro | $1.11 = 1 Euro | $1.11 = 1 Euro | ||
Brazilian Real | $0.29 = 1 Brazilian Real | $0.31= 1 Brazilian Real | ||
Chinese Renminbi | $0.15 = 1 Chinese Renminbi | $0.16 = 1 Chinese Renminbi | ||
Australian Dollar | $0.75 = 1 Australian Dollar | $0.75 = 1 Australian Dollar | ||
For the year ended December 31, 2016, we conducted approximately 31% of our operations in Euros, approximately 8% in the Australian Dollar, approximately 8% in the Brazilian Real (although a significant portion of Brazil net sales are in U.S. Dollars) and approximately 8% in the Chinese Renminbi.
31
To mitigate the risk of transactions in which a sale is made in one currency and associated costs are denominated in a different currency, we may utilize forward currency contracts in certain circumstances to lock in exchange rates with the objective that the gain or loss on the forward contracts will approximate the loss or gain that results from the transaction or transactions being hedged. We determine whether to enter into hedging arrangements based upon the size of the underlying transaction or transactions, an assessment of the risk of adverse movements in the applicable currencies and the availability of a cost effective hedge strategy. To the extent we do not engage in hedging or such hedging is not effective, changes in the relative value of currencies can affect our profitability.
Domestic and Foreign Operating Results
The following is an analysis of our domestic and foreign operations during the year ended December 31, 2016 and 2015 and a discussion of the results of operations during those periods (in thousands):
Twelve Months Ended December 31, | |||||||
2016 | 2015 | ||||||
Domestic income (loss) from operations | $ | 11,335 | $ | (3,114 | ) | ||
Foreign income from operations | 34,805 | 49,128 | |||||
Total income from operations | $ | 46,140 | $ | 46,014 | |||
During the year ended December 31, 2016, domestic income (loss) from operations was lower than foreign income from operations primarily due to product mix, corporate overhead costs and market differences. We intend for all earnings generated by foreign subsidiaries after 2012 to be remitted to the parent company at some point in the future. U.S. income taxes and foreign withholding taxes have been provided related to those foreign earnings. All other foreign un-remitted earnings generated in years prior to 2013 likely will remain indefinitely reinvested, except for a portion of the earnings generated prior to 2013 related to our Brazilian and Chinese operations.
Cost Reduction Programs
An important part of our strategy is to seek to reduce our overall costs and improve our competitiveness. As a part of this effort, we engage in cost reduction programs, which are designed to improve the cost structure of our global operations in response to changing market conditions. These cost reduction programs include headcount reductions throughout the world as well as plant closures that are intended to rationalize production among our facilities to better enable us to match our cost structure with customer demand. Cost savings have been realized and are expected to continue to be realized in labor costs and other production overhead, other components of costs of products sold, general and administrative expenses and facility costs. The majority of cost savings begin at the time of the headcount reductions or plant closure with remaining cost savings recognized over subsequent periods. Cost savings from headcount reductions are expected to be partially offset by related increases in other expenses, such as wage inflation. Cost savings related to plant closures have been and are expected to be partially offset by additional costs incurred in the facilities that assumed the operations of the closed facility.
During 2016, we incurred restructuring expenses of $10.4 million, a decrease of $(4.2) million, or (28.8)%, from $14.6 million in 2015. These included $1.8 million of charges related to the closure of the Middletown, VA facility and $8.6 million of charges related to headcount reductions and other costs relating to previously announced plant closures.
During 2015, we incurred restructuring expenses of $14.6 million. These included $4.4 million of charges related to the closure of the Joao Pessoa, Brazil clothing facility; $4.9 million of charges related to the closure of the Warwick, Canada machine clothing facility; and $6.4 million of charges relating to headcount reductions, and other costs relating to previously announced plant closures. The costs were partially offset by a gain of $1.1 million on the sale of the Joao Pessoa, Brazil machine clothing facility in the fourth quarter of 2015.
During 2014, the Company incurred restructuring expenses of $18.1 million. These charges were related to $4.0 million in headcount reductions, $4.5 million of charges related to the closure of the Heidenheim rolls facility, $4.8 million in impairment charges and severance and other charges due to the closing of the Joao Pessoa, Brazil clothing facility, a $1.6 million charge in Italy to terminate a sales agency contract, $1.5 million in severance charges relating to the closure of the Argentina press felt facility, $1.2 million of charges relating to the closed France rolls facility, including costs related moving certain assets to China and other locations in Europe, $0.2 million of costs associated with liquidating the Vietnam facility, and $1.2 million in severance and facility charges relating to the Spain closure. These costs were partially offset by a gain of $0.9 million recorded in connection with the sale of the Spain and France facilities in the third and fourth quarters of 2014.
32
Results of Operations
The table that follows sets forth for the periods presented certain consolidated operating results.
Year Ended December 31, | |||||||||||
2016 | 2015 | 2014 | |||||||||
(in thousands) | |||||||||||
Net sales | $ | 471,317 | $ | 477,243 | $ | 542,932 | |||||
Costs and expenses: | |||||||||||
Cost of products sold | 293,842 | 288,512 | 327,161 | ||||||||
Selling | 62,810 | 64,414 | 73,002 | ||||||||
General and administrative | 51,063 | 56,250 | 56,539 | ||||||||
Research and development | 7,100 | 7,404 | 7,903 | ||||||||
Restructuring | 10,362 | 14,649 | 18,142 | ||||||||
425,177 | 431,229 | 482,747 | |||||||||
Income from operations | 46,140 | 46,014 | 60,185 | ||||||||
Interest expense, net | (46,155 | ) | (38,413 | ) | (36,768 | ) | |||||
Loss on extinguishment of debt | (11,938 | ) | (388 | ) | — | ||||||
Foreign exchange (loss) gain | (383 | ) | 1,872 | (719 | ) | ||||||
Income before provision for income taxes | (12,336 | ) | 9,085 | 22,698 | |||||||
Provision for income taxes | (9,282 | ) | (13,465 | ) | (30,080 | ) | |||||
Net loss | $ | (21,618 | ) | $ | (4,380 | ) | $ | (7,382 | ) | ||
Year Ended December 31, 2016 Compared to the Year December 31, 2015
Net Sales. Net sales for the year ended December 31, 2016 decreased by $(5.9) million, or (1.2)%, to $471.3 million from $477.2 million for the year ended December 31, 2015. Unfavorable currency effects were $(2.5) million. For the year ended December 31, 2016, approximately 61% of our net sales were in our clothing segment and approximately 39% were in our roll covers segment.
In our clothing segment, net sales for the year ended December 31, 2016 decreased $(13.6) million, or (4.5)%, to $286.4 million from $300.0 million for the year ended December 31, 2015. Excluding favorable currency effects of $0.4 million, the $(14.0) million decrease was primarily due to a global machine clothing market decline.
In our rolls segment, net sales for the year ended December 31, 2016 increased by $7.6 million, or 4.3%, to $184.9 million from $177.3 million for the year ended December 31, 2015. Excluding unfavorable currency effects of $(2.9) million, the $10.5 million increase was driven by the acquisition of Spencer Johnston.
Cost of Products Sold. Cost of products sold for the year ended December 31, 2016 increased by $5.3 million, or 1.8%, to $293.8 million from $288.5 million for the year ended December 31, 2015.
In our clothing segment, cost of products sold decreased $(2.8) million in the year ended December 31, 2016 compared to the year ended December 31, 2015. This decrease was primarily due to decreased sales volume and favorable currency effects. Cost of products sold as a percentage of net sales increased by 1.9% to 59.8% in the year ended December 31, 2016 from 57.9% in the year ended December 31, 2015. This decrease was primarily due to a weak economic environment in Brazil and margin compression in certain regions, partially offset by favorable currency effects.
In our rolls segment, cost of products sold increased $8.1 million in the year ended December 31, 2016 compared to the year ended December 31, 2015, primarily as a result of increased sales volume and unfavorable currency effects. Cost of products sold as a percentage of net sales increased by 1.8% to 66.2% in the year ended December 31, 2016 from 64.4% in the year ended December 31, 2015, due to negative product mix.
Selling Expenses. In the year ended December 31, 2016, selling expenses decreased by $(1.6) million, or (2.5)%, to $62.8 million from $64.4 million in the year ended December 31, 2015. This decrease was primarily driven by favorable currency and decreased sales commissions on lower sales volume.
33
General and Administrative Expenses. For the year ended December 31, 2016, general and administrative expenses decreased by $(5.2) million, or (9.2)%, to $51.1 million from $56.3 million for the year ended December 31, 2015, primarily as a result of cost reduction programs, net of inflation, favorable currency effects and a 2015 pension settlement charge. These decreases were partially offset by the addition of expenses from the recently acquired Spencer Johnston business.
Restructuring Expenses. For the year ended December 31, 2016, restructuring expense declined by $(4.2) million or (28.8)%, to $10.4 million from $14.6 million in 2015.These included $1.8 million of charges related to the closure of the Middletown, VA facility and $8.6 million of charges related to headcount reductions and other costs relating to previously announced plant closures.
Interest Expense, Net. Net interest expense for the year ended December 31, 2016 was $46.2 million, up $7.8 million from $38.4 million for the year ended December 31, 2015. The increase was driven by the higher interest rate on the new bonds issued in the refinancing and a higher average debt balance during 2016 versus 2015.
Provision for Income Taxes. For the years ended December 31, 2016 and 2015, the provision for income taxes was $(9.3) million and $(13.5) million, respectively. The decrease in tax expense in the year ended December 31, 2016, was primarily attributable to the geographic mix of earnings, as well as tax benefits from interest deductions in Brazil. Generally, our provision for income taxes is primarily impacted by the income we earn in tax paying jurisdictions relative to the income we earn in non-tax paying jurisdictions. The majority of income recognized for purposes of computing our effective tax rate is earned in countries where the statutory income tax rates range from 15.0% to 35.4%. However, permanent income adjustments recorded against pre-tax earnings may result in an effective tax rate that is higher or lower than the statutory tax rate in these jurisdictions. We generate losses in certain jurisdictions for which we realize no tax benefit as the deferred tax assets in these jurisdictions (including net operating losses) are fully reserved in our valuation allowance. For this reason, we recognize minimal income tax expense or benefit in these jurisdictions, of which the most material jurisdictions are the United States and Australia. Due to these reserves, the geographic mix of our pre-tax earnings has a direct correlation with how high or low our annual effective tax rate is relative to consolidated earnings. As the Company continues to reorganize and restructure its operations, it is possible that deferred tax assets, for which no income tax benefit has previously been provided, may more likely than not become realized. The Company continues to evaluate future operations and will record an income tax benefit in the period where it believes it is more likely than not that the deferred tax asset will be able to be realized.
Year Ended December 31, 2015 Compared to the Year December 31, 2014
Net Sales. Net sales for the year ended December 31, 2015 decreased by $(65.7) million, or (12.1)%, to $477.2 million from $542.9 million for the year ended December 31, 2014. Unfavorable currency effects were $(43.6) million. For the year ended December 31, 2015, approximately 63% of our net sales were in our clothing segment and approximately 37% were in our roll covers segment.
In our clothing segment, net sales for the year ended December 31, 2015 decreased $(47.0) million, or (13.5)%, to $300.0 million from $347.0 million for the year ended December 31, 2014 Excluding unfavorable currency effects of $(26.8) million, the remaining $(20.2) million decrease was primarily due to the continued decline in the graphical grades of paper and continued mill closures in North America; declines in Asia, due to the softening of the Indonesia and Korea markets and declines in South America and Europe, due to a weak Brazilian economy and the over-supply of machine clothing in Europe.
In our rolls segment, net sales for the year ended December 31, 2015 decreased by $(18.6) million, or (9.5)%, to $177.3 million from $195.9 million for the year ended December 31, 2014. Excluding unfavorable currency effects of $(16.8) million, the remaining $(1.8) million decrease was primarily due to the continued decline in the graphical grades of paper and mill closures in North America and declines in Asia due to the softening of the China market. These decreases were partially offset by increases in Europe, driven primarily by increased rubber and spreader rolls sales.
Cost of Products Sold. Cost of products sold for the year ended December 31, 2015 decreased by $(38.7) million, or (11.8)%, to $288.5 million from $327.2 million for the year ended December 31, 2014.
In our clothing segment, cost of products sold decreased $(28.6) million in the year ended December 31, 2015 compared to the year ended December 31, 2014. This decrease was primarily due to favorable currency effects, decreased sales volume, cost reduction programs, net of inflation, partially offset by unfavorable absorption, unfavorable sales mix and plant startup costs. Cost of products sold as a percentage of net sales decreased by (0.5)% to 57.9% in the year ended December 31, 2015 from 58.4% in the year ended December 31, 2014. This decrease was primarily due to favorable currency effects and cost reduction programs, net of inflation, partially offset by unfavorable absorption, unfavorable sales mix and increased plant startup costs.
34
In our rolls segment, cost of products sold decreased $(10.3) million in the year ended December 31, 2015 compared to the year ended December 31, 2014, primarily as a result of favorable currency effects, decreased sales volume and cost reduction programs, net of inflation, partially offset by unfavorable sales mix and plant startup costs. Cost of products sold as a percentage of net sales increased by 0.9% to 64.4% in the year ended December 31, 2015 from 63.5% in the year ended December 31, 2014, primarily as a result of unfavorable currency effects, increased plant startup costs and unfavorable sales mix, partially offset by our cost reduction programs, net of inflation.
Selling Expenses. In the year ended December 31, 2015, selling expenses decreased by $(8.6) million, or (11.8)%, to $64.4 million from $73.0 million in the year ended December 31, 2014. This decrease was primarily driven by favorable currency effects and decreased sales commissions.
General and Administrative Expenses. For the year ended December 31, 2015, general and administrative expenses decreased by $(0.2) million, or (0.4)%, to $56.3 million from $56.5 million for the year ended December 31, 2014, primarily as a result of favorable currency effects and lower management incentive costs. These decreases were partially offset by incremental charges related to a deferred refinancing transaction, a one-time pension settlement in the U.S., increased bad debt expense related to mill closures in 2015 and increased medical benefit costs in 2015.
Restructuring Expenses. For the year ended December 31, 2015, restructuring expense declined by $(3.5) million, or (19.3)%, to $14.6 million from $18.1 million in 2014. In 2015, restructuring expense included $4.4 million of charges related to the closure of the Joao Pessoa, Brazil clothing facility; $4.9 million of charges related to the closure of the Warwick, Canada machine clothing facility; and $6.4 million of charges relating to headcount reductions, and other costs relating to previously announced plant closures. The costs were partially offset by a gain of $1.1 million on the sale of the Joao Pessoa, Brazil machine clothing facility in the fourth quarter of 2015.
Interest Expense, Net. Net interest expense for the year ended December 31, 2015 was $38.4 million, up $(1.6) million from $36.8 million for the year ended December 31, 2014. Increases were primarily due to increased average borrowings from 2014 to 2015.
Provision for Income Taxes. For the years ended December 31, 2015 and 2014, the provision for income taxes was $(13.5) million and $(30.1) million, respectively. The decrease in tax expense in the year ended December 31, 2015, was primarily attributable to a tax provision recorded in 2014 related to settling a tax assessment in Brazil, along with the geographic mix of earnings. Generally, our provision for income taxes is primarily impacted by the income we earn in tax paying jurisdictions relative to the income we earn in non-tax paying jurisdictions. The majority of income recognized for purposes of computing our effective tax rate is earned in countries where the statutory income tax rates range from 15% to 37.11%. However, permanent income adjustments recorded against pre-tax earnings may result in an effective tax rate that is higher or lower than the statutory tax rate in these jurisdictions. We generate losses in certain jurisdictions for which we realize no tax benefit as the deferred tax assets in these jurisdictions (including net operating losses) are fully reserved in our valuation allowance. For this reason, we recognize minimal income tax expense or benefit in these jurisdictions, of which the most material jurisdictions are the United States and Australia. Due to these reserves, the geographic mix of our pre-tax earnings has a direct correlation with how high or low our annual effective tax rate is relative to consolidated earnings. As the Company continues to reorganize and restructure its operations, it is possible that deferred tax assets, for which no income tax benefit has previously been provided, may more likely than not become realized. The Company continues to evaluate future operations and will record an income tax benefit in the period where it believes it is more likely than not that the deferred tax asset will be able to be realized.
35
Liquidity and Capital Resources
Our principal liquidity requirements are for debt service, working capital and capital expenditures. We plan to use cash on hand, cash generated by operations and access to our revolving credit facility, as our primary sources of liquidity. Our operations are highly dependent upon the paper production industry and the degree to which the paper industry is affected by global economic conditions and the availability of credit. Demand for our products could decline if paper manufacturers are unable to obtain required financing or if economic conditions cause additional mill closures.
Net cash provided by operating activities was $36.5 million for the year ended December 31, 2016 and $33.3 million for the year ended December 31, 2015. The $3.2 million increase was due primarily decreased working capital, partially offset by lower earnings. Net cash provided by operating activities was $33.3 million for the year ended December 31, 2015 and $8.8 million for the year ended December 31, 2014. The $24.5 million increase was due primarily to the settlement of the 2014 Brazilian tax matter as discussed in Note 7 to our Consolidated Financial Statements.
Net cash used in investing activities was $29.8 million for the year ended December 31, 2016 and $47.6 million for the year ended December 31, 2015. The decrease of $17.8 million was primarily due to a decrease in capital expenditures, partially offset by the acquisition of Spencer Johnston. Net cash used in investing activities was $47.6 million for the year ended December 31, 2015 and $41.8 million for the year ended December 31, 2014. The increase of $5.8 million was primarily due to an increase in capital expenditures.
Net cash (used in) provided by financing activities was $(2.3) million for the year ended December 31, 2016 and $14.5 million for the year ended December 31, 2015. The decrease of ($16.8) million was driven by lower capital expenditures in 2016 compared to 2015, partially offset by the acquisition of Spencer Johnston and higher capital lease payments. Net cash provided by financing activities was $14.5 million for the year ended December 31, 2015 and net cash provided by financing activities was $18.8 million for the year ended December 31, 2014. The decrease of $4.3 million was due to the settlement of the Brazilian tax matter in 2014 net of cash draw-down, partially offset by higher capital expenditures in 2015.
As of December 31, 2016, an additional $32.7 million available for additional borrowings under the ABL Facility. This availability represents $35.8 million under the ABL revolver that is currently collateralized by certain assets of the Company less $3.1 million of that facility committed for letters of credit or additional borrowings. In addition, the Company had approximately $3.2 million available for borrowings under other small lines of credit. The Company had cash and cash equivalents of $12.8 million at December 31, 2016 compared to $9.8 million at December 31, 2015.
We expect to pay approximately $5 million related to the continuation of our restructuring initiatives in 2017. Actual restructuring costs for 2017 may substantially differ from estimates at this time, depending on the timing of the restructuring activities.
Capital Expenditures
We use the term “capital expenditures” to refer to costs incurred to purchase or significantly upgrade property and equipment. The majority of our capital expenditures relate to purchases of machinery and equipment used in the manufacturing of our products. Capital expenditures were funded from net cash provided by operating activities and borrowings under our ABL Facility. For the year ended December 31, 2016, we had capital expenditures of $13.7 million. We analyze our planned capital expenditures based on investment opportunities available to us and our financial and operating performance, and accordingly, actual capital expenditures may be more or less than this amount. We intend to use existing cash and cash from operations to fund our capital expenditures. We target capital expenditures for 2017 to be approximately $16.0 million.
See “Credit Facility and Notes” below for a description on limitations on capital expenditures imposed by our ABL Facility and Indenture.
Credit Facility and Notes
On August 9, 2016, the Company closed on $480 million aggregate principal amount of 9.5% Senior Secured Notes due August 2021 (the "Notes"), which were sold at a price equal to 98.54% of their face value. The Notes will pay interest semi-annually in arrears on February 15 and August 15 of each year beginning on February 15, 2017 and will mature on August 15, 2021, unless earlier redeemed or repurchased.
The Company used the net proceeds from the Notes offering to repay all amounts outstanding under its existing term loan credit facility, to redeem all of its 8.875% Senior Notes due 2018 at a redemption price equal to 102.219% of the principal amount thereof, together with accrued and unpaid interest, to the date of redemption, to pay fees and expenses relating to these transactions, and for working capital and other general corporate purposes.
36
On May 17, 2013, the Company also entered into a Revolving Credit and Guaranty Agreement originally for a $40.0 million asset-based revolving credit facility subject to a borrowing base among Xerium Technologies, Inc., as a US borrower, Xerium Canada Inc., as Canadian borrower, certain direct and indirect U.S. subsidiaries of the Company as guarantors and certain financial institutions (the "Domestic Revolver"). On March 3, 2014, the Company entered into an amendment to the Revolving Credit and Guaranty Agreement (as amended, the “old ABL Facility,” and collectively with the Term Credit Facility, the “Credit Facility”), increasing the aggregate availability under the old ABL Facility to $55 million. On November 3, 2015, the Company refinanced the old ABL Facility and entered into a new Revolving Credit and Guaranty Agreement (as amended, the "ABL Facility") with one of its existing ABL lenders. The amount of the ABL Facility continues to provide aggregate availability of $55 million and the collateral pledged thereunder has remained the same. The ABL Facility matures in November of 2020 and accrues interest at either an Alternative Base rate (Prime plus 75 bps) or Fixed LIBOR rate (LIBOR +175 bps). As of December 31, 2016 these rates were 4.50% and 2.57%, respectively.
The Indenture and the ABL Facility contain certain customary covenants that, subject to exceptions, restrict our ability to, among other things:
• | declare dividends or redeem or repurchase equity interests; |
•prepay, redeem or purchase debt;
• incur liens and engage in sale-leaseback transactions;
• make loans and investments;
• incur additional indebtedness;
•amend or otherwise alter debt and other material agreements;
•engage in mergers, acquisitions and asset sales;
•transact with affiliates; and
•engage in businesses that are not related to the Company's existing business.
On July 17, 2015 (the "Closing Date"), Xerium China, Co., Ltd. ("Xerium China"), a wholly-owned subsidiary of the Company entered into and closed a Fixed Assets Loan Contract (the "Loan Agreement") with the Industrial and Commercial Bank of China Limited, Shanghai-Jingan Branch (the “Bank”) with respect to a RMB 58.5 million loan, which was approximately $9.4 million USD on July 17, 2015. The loan is secured by pledged machinery and equipment of Xerium China and guaranteed by Xerium Asia Pacific (Shanghai) Limited and Stowe Woodward (Changzhou) Roll Technologies Co. Ltd., which are wholly-owned subsidiaries of the Company, pursuant to guarantee agreements (the "Guarantee Agreements"). Interest on the outstanding principal balance of the loan accrues at a benchmark rate plus a margin. The current interest rate at December 31, 2016 is approximately 5.8%. The interest rate will be adjusted every 12 months during the term of the loan, based on the benchmark interest rate adjustment. Interest under the loan is payable quarterly in arrears. Principal on the loan is to be repaid in part every six months following the Closing Date, in accordance with a predetermined schedule set forth in the Loan Agreement. Proceeds of the Loan will be used by Xerium China to purchase production equipment. The Loan Agreement contains certain customary representations and warranties and provisions relating to events of default.
On May 26, 2011, the Company completed a refinancing transaction, which replaced certain of its then outstanding indebtedness with $240 million aggregate principal amount of 8.875% senior unsecured notes. The notes were repaid with proceeds from the 9.5% Notes.
We are in compliance with all covenants under the Indenture and ABL Facility at December 31, 2016, and expect to remain in compliance in 2017.
Contractual Obligations and Commercial Commitments
The following tables provide aggregated information about our contractual obligations as of December 31, 2016.
Payments Due by Period | ||||||||||||||||||||||||
Contractual Obligations | Total | Less than 1 year | 1-3 years | 3-5 years | More than 5 years | Other | ||||||||||||||||||
(in millions) | ||||||||||||||||||||||||
Long-term debt obligations | $ | 500.2 | $ | 11.2 | $ | 4.6 | $ | 482.4 | $ | 2.0 | $ | — | ||||||||||||
Interest expense on long-term debt (1) | 215.8 | 46.7 | 92.3 | 76.7 | 0.1 | — | ||||||||||||||||||
Operating leases | 7.0 | 1.6 | 2.6 | 1.8 | 1.0 | — | ||||||||||||||||||
Capital leases | 31.8 | 6.2 | 9.5 | 3.3 | 12.8 | — | ||||||||||||||||||
Purchase obligations (2) | 15.8 | 8.9 | 5.5 | 1.4 | — | — | ||||||||||||||||||
Pension and other post-retirement obligations | 76.6 | 13.4 | 12.6 | 14.1 | 36.5 | — | ||||||||||||||||||
Net unrecognized tax benefit obligation under Topic 740 (3) | 4.1 | 0.2 | — | — | — | 3.9 | ||||||||||||||||||
Total contractual cash obligations | $ | 851.3 | $ | 88.2 | $ | 127.1 | $ | 579.7 | $ | 52.4 | $ | 3.9 | ||||||||||||
(1) | Interest expense shown above is based on the effective interest rate at December 31, 2016. |
(2) | Includes obligations with respect to raw material purchases, repairs and maintenance services, utilities and other capital expenditures. |
(3) | The amounts in “Other” represent future cash outlays for which we are unable to reasonably estimate the period of cash settlement. |
Off-Balance Sheet Financing
During the year ended December 31, 2016, we did not engage in any off-balance sheet activities, including the use of structured finance or special purpose entities.
Critical Accounting Policies and Estimates
The preparation of financial statements in conformity with U.S. GAAP requires management to make estimates and assumptions that affect the reported amounts of assets and liabilities, the disclosure of contingent assets and liabilities at the date of the financial statements and the reported amounts of net sales and expenses. Actual results could differ from those estimates. We have formal accounting policies in place including those that address critical and complex accounting areas. Note 2 "Accounting Policies" to the Consolidated Financial Statements included elsewhere in this Annual Report identifies the significant accounting policies used in preparation of the Consolidated Financial Statements. The most significant areas involving management judgments and estimates are described below.
Derivatives and Hedging. Effective January 1, 2009, we adopted ASC Topic 815-10-65-1, Transition and Effective Date Related to FASB Statement No. 161, Disclosures about Derivative Instruments and Hedging Activities—an amendment of FASB Statement No. 133 (“Topic 815-10-65-1”) for disclosures related to derivatives and hedging. Topic 815-10-65-1 amends and expands the disclosure requirements to provide users of financial statements with an enhanced understanding of: (a) how and why an entity uses derivative instruments, (b) how derivative instruments and related hedged items are accounted for and (c) how derivative instruments and related hedged items affect an entity’s financial position, financial performance, and cash flows. Topic 815-10-65-1 requires qualitative disclosures about objectives and strategies for using derivatives, quantitative disclosures about the fair value of and gains and losses on derivative instruments and disclosures about credit-risk-related contingent features in derivative instruments.
As required by Topic 815-10-65-1, we record all derivatives on the balance sheet at fair value. The accounting for changes in the fair value of derivatives depends on the intended use of the derivative, whether we have elected to designate a derivative in a hedging relationship and apply hedge accounting and whether the hedging relationship has satisfied the criteria necessary to apply hedge accounting. Derivatives designated and qualifying as a hedge of the exposure to changes in the fair value of an asset, liability or firm commitment attributable to a particular risk are considered fair value hedges. Derivatives designated and qualifying as a hedge of the exposure to variability in expected future cash flows or other types of forecasted transactions are considered cash flow hedges. Derivatives may also be designated as hedges of the foreign currency exposure of a net investment in a foreign operation. Hedge accounting generally provides for the matching of the timing of gain or loss recognition on the hedging instrument with the recognition of the changes in the fair value of the hedged asset or liability that
37
are attributable to the hedged risk in a fair value hedge or the earnings effect of the hedged forecasted transactions in a cash flow hedge. We may enter into derivative contracts that are intended to economically hedge certain of our risks, even though hedge accounting does not apply or if we elect not to apply hedge accounting under Topic 815.
We have measured our derivative assets and liabilities under ASC Topic 820, Fair Value Measurements and Disclosures (“Topic 820”), and have classified our interest rate swaps in Level 2 of the Topic 820 fair value hierarchy, as the significant inputs to the overall valuations are based on market-observable data or information derived from or corroborated by market-observable data, including market-based inputs to models, model calibration to market-clearing transactions, broker or dealer quotations, or alternative pricing sources with reasonable levels of price transparency. Where models are used, the selection of a particular model to value a derivative depends upon the contractual terms of, and specific risks inherent in, the instrument as well as the availability of pricing information in the market. We use similar models to value similar instruments. Valuation models require a variety of inputs, including contractual terms, market prices, yield curves, credit curves, measures of volatility, and correlations of such inputs. For our derivatives, all of which traded in liquid markets, model inputs can generally be verified and model selection does not involve significant management judgment.
To comply with the provisions of Topic 820, we performed a review of the necessity to incorporate credit valuation adjustments to appropriately reflect both our own nonperformance risk and the respective counterparty’s nonperformance risk in the fair value measurements of our derivatives and determined these adjustments to be immaterial to the fair value derivative assets/(liabilities) recorded on our Consolidated Balance Sheet at December 31, 2016.
Although we have determined that the majority of the inputs used to value our derivatives fall within Level 2 of the fair value hierarchy, the credit valuation adjustments associated with our derivatives utilize estimates of current credit spreads to evaluate the likelihood of default by us and our counterparties. As a result, we have determined that our derivative valuations in their entirety are classified in Level 2 of the fair value hierarchy. We do not have any fair value measurements using significant unobservable inputs (Level 3) as of December 31, 2016.
Impairment of Goodwill. We account for acquired goodwill and goodwill impairment in accordance with Topic 350, which requires considerable judgment in the valuation of acquired goodwill and the ongoing evaluation of goodwill impairment. Topic 350 requires that goodwill not be amortized but, instead, must be tested at least annually for impairment or whenever events or business conditions warrant.
The Company accounts for goodwill and other intangible assets in accordance with ASC Topic 350, Intangibles—Goodwill and Other Intangible Assets (“Topic 350”). Topic 350 requires that goodwill and intangible assets that have indefinite lives not be amortized but, instead, must be tested at least annually for impairment or whenever events or business conditions warrant. The Company first assessed qualitative factors to determine whether it was more likely than not that the fair value of its single reporting unit was less than its carrying amount as a basis for determining whether it is necessary to perform the two-step goodwill impairment test. The Company’s assessment is that the two-step goodwill impairment test is not necessary for the year ending December 31, 2016 for either its clothing or rolls reporting units. If the qualitative factors had indicated that it was more likely than not that the fair value of the reporting units was less than its carrying amount, the Company would have tested goodwill for impairment at the reporting unit level using a two-step approach.
Step 1 involves comparing the fair value of the Company’s reporting unit to its carrying amount. If the fair value of the reporting unit is greater than its carrying amount, there is no impairment. If the reporting unit carrying amount is greater than the fair value then the second step must be completed to measure the amount of impairment, if any. Step 2 calculates the implied fair value of goodwill by deducting the fair value of the net assets of the reporting unit from the fair value of the reporting unit as determined in Step 1. The implied fair value of goodwill determined in this step is compared to the carrying value of goodwill. If the implied fair value of goodwill is less than the carrying value of goodwill, an impairment loss is recognized equal to the difference.
The Company has two reporting units: machine clothing and roll covers. For the purpose of performing the annual impairment test, the Company allocates all shared assets and liabilities to the reporting units based on the percentage of each reporting unit’s revenue to total revenue. Shared operating expenses are allocated to the reporting unit to the extent necessary to allow them to operate as independent businesses. To determine if impairment exists, the fair value of each reporting unit is compared to its carrying value. The fair value of the Company’s reporting unit is determined by using a weighted combination of both a market multiple approach and an income approach. The market multiple approach utilizes the Company’s and its competitors’ proprietary information that is used to value its reporting units. The income approach is a present value technique used to measure the fair value of future cash flows produced by each reporting unit. During the fourth quarter of 2016, the Company voluntarily changed the date of its annual goodwill impairment testing from December 31, the last day of the fiscal year, to October 1. The voluntary change in accounting principle related to the annual testing date will not delay, accelerate or avoid an impairment charge. This change is not being applied retrospectively, as it would require application of significant estimates and assumptions with the use of hindsight. Accordingly, the change will be applied prospectively. As a result of the
38
annual tests for goodwill impairment performed as of October 1, 2016 and December 31, 2015, the Company determined that no goodwill impairment exists.
Pension Expense - Selection of Assumptions. The Company has defined benefit pension plans covering substantially all of its U.S. and Canadian employees and employees of certain subsidiaries in other countries. Benefits are generally based on the employee's years of service and compensation. Annual pension expense consists of several components:
• | Service Cost, which represents the present value of benefits attributed to services rendered in the current year, measured by expected future salary levels. |
• | Interest Cost, which represents the accretion cost on the liability that has been discounted to its present value. |
• | Expected Return on Assets, which represents the expected investment return on pension plan assets. |
• | Amortization of Prior Service Cost and Actuarial Gains and Losses, which represent components that are recognized over time rather than immediately. |
These components are calculated annually to determine the pension expense that is reflected in the Company's results of operations. Management believes the selection of assumptions related to the annual pension expense is a critical accounting estimate due to the high degree of volatility in the expense dependent on selected assumptions. The key assumptions are as follows:
• | The discount rate is the rate used to present value the pension obligation and represents the current rate at which the pension obligations could be effectively settled. |
• | The rate of compensation increase is used to project the pay-related pension benefit formula and should estimate actual future compensation levels. |
• | The expected long-term return on plan assets is used to estimate future asset returns and should reflect the average rate of long-term earnings on assets already invested. |
Management’s selection of the discount rate is based on an analysis that estimates the current rate of return for high-quality, fixed-income investments with maturities matching the payment of pension benefits that could be purchased to settle the obligations. At December 31, 2016, the Company selected a discount rate assumption of 3.67%.
Management’s selection of the rate of future compensation increase is generally based on our historical salary increases, including cost of living adjustments and merit and promotion increases, giving consideration to any known future trends. A higher rate of increase will result in a higher pension expense. The Company selected an actual rate of compensation increase assumption of 3.50%.
Management’s selection of the expected long term return on plan assets is based on a building-block approach, whereby the components are weighted based on the allocation of pension plan assets. Given that these returns are long-term, there are generally not significant fluctuations in the expected rate of return from year to year. The Company selected a rate of return assumption of 6.42%.
Using these assumptions, the 2016 pension expense was $3.4 million. A change in the assumptions would have had the following impact on the 2016 expense. A change of 1% in the discount rate would have changed 2016 expense by approximately $0.3 million. A change of 1% in the expected long-term rate of return on assets would have changed the 2016 expense by approximately $0.9 million.
Contingencies. We are subject to various claims and contingencies associated with lawsuits, insurance, tax, environmental and other issues arising out of the normal course of business. Our Consolidated Financial Statements reflect the treatment of claims and contingencies based on management’s view of the expected outcome. We consult with legal counsel on those issues related to litigation with respect to matters in the ordinary course of business. If the likelihood of an adverse outcome is probable and the amount is estimable, we accrue a liability in accordance with ASC Topic 450, Contingencies. While we believe that the current level of reserves is adequate, the adequacy of these reserves may change in the future due to new developments in particular matters.
Income Taxes. We utilize the asset and liability method for accounting for income taxes in accordance with ASC Topic 740, Income Taxes (“Topic 740”). Under this method, deferred tax assets and liabilities are determined based on differences
39
between financial reporting and tax bases of assets and liabilities. Deferred tax assets and liabilities are measured using the enacted tax rates and statutes that will be in effect when the differences are expected to reverse.
We record net deferred tax assets to the extent we believe that it is more likely than not that these assets will be realized. In making such determination, we consider all available positive and negative evidence, including scheduled reversals of deferred tax liabilities, projected future taxable income, tax planning strategies and recent results of operations. We reduce our deferred tax assets by a valuation allowance if, based upon the weight of available evidence, it is more likely than not that some portion or all of the deferred tax assets will not be realized. In light of our accumulated loss position in certain tax jurisdictions, and the uncertainty of taxability in future periods, we recorded a valuation allowance against all U.S. deferred tax assets and against certain of our foreign deferred tax assets primarily related to net operating loss carry-forwards in Australia, Spain, Germany, Sweden, the United Kingdom, China, Turkey and France. During the year ended December 31, 2016, we recorded $1.0 million of tax benefits related to the partial reversal of the valuation allowance previously established against certain Italian company deferred tax assets. We believe that the Australian company's net operating loss deferred tax asset is more likely than not to be realized within the carry-forward period based on estimates of future taxable income generated by future earnings of the Italian business.
As the Company continues to reorganize and restructure its operations, it is possible that deferred tax assets, for which no income tax benefit has previously been provided, may more likely than not become realized. The company continues to evaluate future operations and will record an income tax benefit in the period where it believes it is more likely than not that the deferred tax asset will be able to be realized. The most material unrecognized deferred tax asset relates to the U.S. By 2031, future U.S. earnings ranging between $40 million and $130 million, generated by U.S earnings from continuing operations or qualified tax planning strategies, would be required in order to fully recognize the U.S. deferred tax asset.
In addition, we operate within multiple taxing jurisdictions and could be subject to audit in these jurisdictions. These audits can involve complex issues and rely on estimates and assumptions. These audits may require an extended period of time to resolve and may cover multiple years. We adopted the uncertain tax provisions of Topic 740 on January 1, 2007. ASC Topic 740-10-25 relates to uncertain tax positions and prescribes a two-step process to determine the amount of tax benefit to be recognized as it relates to uncertain tax positions. First, the tax position must be evaluated to determine the likelihood that it will be sustained upon external examination. If the tax position is deemed “more-likely-than-not” to be sustained, the tax position is then assessed to determine the amount of benefit to recognize in the financial statements. The amount of the benefit that may be recognized is the largest amount that has a greater than 50% likelihood of being realized upon ultimate settlement with the taxing authority having full knowledge of all relevant information.
We accrue for certain known and reasonably anticipated income tax obligations after assessing the likely outcome. Although we believe that the estimates and assumptions are reasonable, the final determination of tax audits and any related litigation could be different than that which is reflected in historical income tax provisions and recorded assets and liabilities.
With respect to all jurisdictions, we believe we have made adequate provision for all income tax uncertainties.
We have a net deferred tax asset of $3.6 million at December 31, 2016 and $3.1 million deferred tax asset at December 31, 2015. The net deferred tax asset relates principally to pension and post-retirement benefits, net operating loss carry-forwards and differences between the book and tax treatment of accrued expenses.
Undistributed earnings of the Company’s foreign subsidiaries amounted to approximately $133.4 million at December 31, 2016. Earnings generated prior to 2013 are considered to be indefinitely reinvested for continued use in foreign operations except for a portion of the earnings generated by our Brazil and China operations. Approximately $9.0 million of unremitted earnings in Brazil generated before 2013 are considered permanently reinvested to support local debt obligations, meet capital expenditures and reinvest in the operations. All earnings generated prior to 2013 related to our Mexico operations have been distributed for U.S. income tax purposes. All earnings generated in all foreign subsidiaries for 2013 through 2016 are not considered to be permanently reinvested, because of our desire to manage global cash and liquidity related to ongoing financial obligations, capital expenditures, restructuring payments and other changes in business conditions going forward. The amount of undistributed earnings not considered to be permanently reinvested, for which we have recorded a deferred tax liability, is $109.1 million. U.S. Federal income taxes and foreign withholding taxes are provided on the portion of the income of foreign subsidiaries that is expected to be remitted to the United States and be taxable. For the earnings generated prior to 2013 considered to be indefinitely reinvested, no provision for U.S. income taxes or foreign withholding taxes has been provided. Upon distribution of those earnings in the form of dividends or otherwise, the Company may be subject to both U.S. income taxes and foreign withholding taxes payable to the various jurisdictions. The earnings that are considered indefinitely reinvested relate to on-going operations and were approximately $24.4 million as of December 31, 2016.
40
Non-GAAP Financial Measures
We use EBITDA and Adjusted EBITDA as supplementary non-GAAP liquidity measures to assist us in evaluating our liquidity and financial performance, specifically our ability to service indebtedness and to fund ongoing capital expenditures. Neither EBITDA nor Adjusted EBITDA should be considered in isolation or as a substitute for income (loss) from operations or cash flows (as determined in accordance with U.S. GAAP).
EBITDA is defined as net income (loss) before interest expense, income tax provision (benefit) and depreciation (including non-cash impairment charges) and amortization.
"Adjusted EBITDA" means, with respect to any period, the total of (A) the consolidated net income for such period, plus (B) without duplication, to the extent that any of the following were deducted in computing such consolidated net income for such period: (i) provision for taxes based on income or profits, including, without limitation, federal, state, provincial, franchise and similar taxes, including any penalties and interest relating to any tax examinations, (ii) consolidated interest expense, (iii) consolidated depreciation and amortization expense, (iv) reserves for inventory in connection with plant closures, (v) consolidated operational restructuring costs, (vi) noncash charges resulting from the application of purchase accounting, including push-down accounting, (vii) non-cash expenses resulting from the granting of common stock, stock options, restricted stock or restricted stock unit awards under equity compensation programs solely with respect to common stock, and cash expenses for compensation mandatorily applied to purchase common stock, (viii) non-cash items relating to a change in or adoption of accounting policies, (ix) non-cash expenses relating to pension or benefit arrangements, (x) expenses incurred as a result of the repurchase, redemption or retention of common stock earned under equity compensation programs solely in order to make withholding tax payments, (xi) amortization or write-offs of deferred financing costs, (xii) any non-cash losses resulting from mark to market hedging obligations (to the extent the cash impact resulting from such loss has not been realized in such period), (xiii) foreign currency losses and (xiv) other non-cash losses or charges (excluding, however, any non-cash loss or charge which represents an accrual of, or a reserve for, a cash disbursement in a future period), minus (C) without duplication, to the extent any of the following were included in computing consolidated net income for such period, (i) foreign currency gains, (ii) non-cash gains with respect to the items described in clauses (vi), (vii), (ix), (xi), (xii), (xiii) and xiv (other than, in the case of clause (xiv), any such gain to the extent that it represents a reversal of an accrual of, or reserve for, a cash disbursement in a future period) of clause (B) above and (iii) provisions for tax benefits based on income or profits. Notwithstanding the foregoing, Adjusted EBITDA, as defined and calculated below, may not be comparable to similarly titled measurements used by other companies.
Consolidated net income is defined as net income (loss) determined on a consolidated basis in accordance with GAAP; provided, however, that the following, without duplication, shall be excluded in determining consolidated net income: (i) any net after-tax extraordinary or non-recurring gains, losses or expenses (less all fees and expenses relating thereto), (ii) the cumulative effect of changes in accounting principles, (iii) any fees and expenses incurred during such period in connection with the issuance or repayment of indebtedness, any refinancing transaction or amendment or modification of any debt instrument, in each case and (iv) any cancellation of indebtedness income. Table 4 provides a reconciliation from net income and operating cash flows, which are the most directly comparable GAAP financial measures, to EBITDA and Adjusted EBITDA.
Adjusted EBITDA Definition Modification
During the 4th quarter of 2016, the Company modified its definition of Adjusted EBITDA to exclude foreign exchange gains and losses from this non-GAAP measure. This change enhances investor insight into the Company’s operational performance. In previous filings, Full year 2015 and 2014 Adjusted EBITDA were stated at $103,724 and $115,969, respectively.
41
Year ended December 31, | ||||||||||||
2016 | 2015 | 2014 | ||||||||||
(in thousands) | ||||||||||||
Net loss | $ | (21,618 | ) | $ | (4,380 | ) | $ | (7,382 | ) | |||
Stock-based compensation | 2,612 | 3,298 | 2,548 | |||||||||
Depreciation | 32,115 | 28,952 | 32,752 | |||||||||
Amortization of other intangibles | 841 | 298 | 1,540 | |||||||||
Deferred financing cost amortization | 3,063 | 3,462 | 3,303 | |||||||||
Unrealized foreign exchange gain on revaluation of debt | (3,267 | ) | (3,426 | ) | (259 | ) | ||||||
Deferred taxes | 219 | (2,785 | ) | (4,857 | ) | |||||||
Asset impairments | — | 1,536 | 136 | |||||||||
Loss (gain) on disposition of property and equipment | 50 | (1,383 | ) | (1,036 | ) | |||||||
Pension settlement losses | — | 1,108 | — | |||||||||
Loss on extinguishment of debt | 11,938 | 388 | — | |||||||||
Change in assets and liabilities which provided (used) cash: | 10,556 | 6,219 | (17,911 | ) | ||||||||
Net cash provided by operating activities | 36,509 | 33,287 | 8,834 | |||||||||
Interest expense, excluding amortization | 43,092 | 34,951 | 33,465 | |||||||||
Net change in operating assets and liabilities | (10,556 | ) | (6,219 | ) | 17,911 | |||||||
Current portion of income tax expense | 9,063 | 16,250 | 34,937 | |||||||||
Stock-based compensation | (2,612 | ) | (3,298 | ) | (2,548 | ) | ||||||
Pension settlement loss | — | (1,108 | ) | — | ||||||||
Unrealized foreign exchange gain on revaluation of debt | 3,267 | 3,426 | 259 | |||||||||
Asset Impairment | — | (1,536 | ) | (136 | ) | |||||||
(Loss) gain on disposition of property and equipment | (50 | ) | 1,383 | 1,036 | ||||||||
Loss on extinguishment of debt | (11,938 | ) | (388 | ) | — | |||||||
EBITDA | 66,775 | 76,748 | 93,758 | |||||||||
Operational restructuring | 10,362 | 14,649 | 18,142 | |||||||||
Loss on extinguishment of debt | 11,938 | 388 | — | |||||||||
Non-recurring expenses | 1,116 | 2,569 | — | |||||||||
Stock-based compensation | 2,612 | 3,298 | 2,548 | |||||||||
Pension settlement losses | — | 1,108 | — | |||||||||
Non-restructuring impairment charges | — | 494 | — | |||||||||
Plant startup costs | 2,176 | 3,886 | 1,521 | |||||||||
Inventory write-off of closed facilities | — | 587 | — | |||||||||
Foreign exchange loss (gain) | $ | 383 | $ | (1,872 | ) | $ | 719 | |||||
Adjusted EBITDA | $ | 95,362 | $ | 101,855 | $ | 116,688 | ||||||
ITEM 7A. | QUANTITATIVE AND QUALITATIVE DISCLOSURES ABOUT MARKET RISK |
The effects of potential changes in interest rates and foreign currency rates are discussed below. Our market risk discussion includes “forward-looking statements” and represents an estimate of possible changes in fair value or future earnings that would occur assuming hypothetical future movements in interest rates and foreign currency rates. Actual future results may differ materially from those presented. See “Item 7. Management’s Discussion and Analysis of Financial Condition and Results of Operations—Liquidity and Capital Resources” and the Notes to Consolidated Financial Statements for a description of our accounting policies and other information related to these financial instruments.
Foreign Currency Hedging
We have foreign currency cash flow and earnings exposure with respect to specific sale and intercompany debt transactions denominated in currencies other than the functional currency of the unit incurring the costs associated with such transactions. To mitigate the risks related to these exposures, we utilize forward currency contracts in certain circumstances, to lock in exchange rates with the objective that the gain or loss on the forward contracts will approximate the loss or gain on the
42
transaction or transactions being hedged. We determine whether to enter into hedging arrangements based upon the size of the underlying transaction or transactions, an assessment of the risk of adverse movements in the applicable currencies and the availability of a cost-effective hedging strategy. In South America, substantially all of our net sales are indexed to U.S. Dollars, but the associated costs are recorded in the local currencies of the operating units. Generally, we do not hedge this U.S. Dollar exposure as it would not be cost effective due to the relatively inefficient foreign exchange markets for local currencies in that region. To the extent we do not engage in hedging or such hedging is not effective, changes in the relative value of currencies can affect our profitability.
The value of these contracts is recognized at fair value based on market exchange forward rates and amounted to a net liability position of $1.5 million at December 31, 2016. These contracts mature at various dates through June of 2017.
As of December 31, 2016, we had open foreign currency exchange contracts maturing through June of 2017 with total net notional amounts of approximately $54.3 million. At December 31, 2016, a hypothetical adverse exchange rate movement of 10% against our forward foreign exchange contracts would have resulted in a potential net loss in fair value of these contracts of approximately $5.4 million. The calculation assumes that each exchange rate would change in the same direction relative to the U.S. Dollar. Any gain or loss recognized on a foreign exchange contract would generally be offset by the gain or loss on the underlying hedge transaction. In addition to the direct effects of changes in exchange rates, such changes may affect the volume of sales or the foreign currency sales price as competitors’ products become more or less attractive. Our sensitivity analysis of the effects of changes in foreign currency exchange rates does not factor in a potential change in sales levels or local currency selling prices.
For additional information about the risks associated with fluctuations in currency exchange rates, see “Management’s Discussion and Analysis of Financial Condition and Results of Operations—Foreign Exchange.”
ITEM 8. | FINANCIAL STATEMENTS AND SUPPLEMENTARY DATA |
All financial statements required to be filed under this Item 8, other than selected quarterly financial data, are filed as Appendix A hereto, are listed under Item 15(a) and are incorporated herein by this reference.
Selected quarterly financial data are included under Item 6 and are incorporated herein by reference.
ITEM 9. | CHANGES IN AND DISAGREEMENTS WITH ACCOUNTANTS ON ACCOUNTING AND FINANCIAL DISCLOSURE |
Not applicable.
ITEM 9A. | CONTROLS AND PROCEDURES |
Disclosure Controls and Procedures
As of December 31, 2016, under the supervision of our principal executive officer and principal financial officer, and with the participation of our management, we have evaluated the effectiveness of the design and operation of our disclosure controls and procedures, as defined in Rules 13a–15(e) and 15d–15(e) under the Exchange Act. Based upon that evaluation, our principal executive officer and principal financial officer concluded that our disclosure controls and procedures were effective to provide reasonable assurance that information required to be disclosed by us in the reports that we file or submit under the Exchange Act is (i) recorded, processed, summarized and reported, within the time periods specified in the SEC’s rules and forms; and (ii) accumulated and communicated to our management, including our principal executive and principal financial officers, as appropriate to allow timely decisions regarding required disclosures. No evaluation of disclosure controls and procedures can provide absolute assurance that these controls and procedures will operate effectively under all circumstances. However, our disclosure controls and procedures are designed to provide reasonable assurance of achieving their objectives, and our principal executive officer and principal financial officer have concluded that our disclosure controls and procedures are effective at the reasonable assurance level as set forth above.
Management’s Annual Report on Internal Control Over Financial Reporting
Our management is responsible for establishing and maintaining adequate internal control over financial reporting. Internal control over financial reporting is a process designed to provide reasonable assurance regarding the reliability of financial reporting and the preparation of financial statements for external reporting purposes in accordance with accounting
43
principles generally accepted in the United States of America. Because of its inherent limitations, internal control over financial reporting may not prevent or detect misstatements. Our management has assessed the effectiveness of our internal control over financial reporting as of December 31, 2016. In making its assessment, management has utilized the criteria set forth by the Committee of Sponsoring Organizations ("COSO") of the Treadway Commission in Internal Control—Integrated Framework. Our management concluded that based on its assessment, our internal control over financial reporting was effective as of December 31, 2016. Ernst & Young LLP, our independent registered public accounting firm, has issued its report on the effectiveness of internal control over financial reporting as of December 31, 2016, which appears in this 2016 Form 10-K.
There has been no change in our internal control over financial reporting during the quarter ended December 31, 2016 that has materially affected, or is reasonably likely to materially affect, our internal control over financial reporting.
In May 2013, COSO issued its Internal Control - Integrated Framework (the “2013 Framework”). While the 2013 Framework’s internal control components (i.e., control environment, risk assessment, control activities, information and communication and monitoring activities) are the same as those in the 1992 Framework, the new framework requires companies to assess whether 17 principles are present and functioning in determining whether their system of internal control is effective. The Company adopted the 2013 Framework during the fiscal year ending December 31, 2015.
44
Report of Independent Registered Public Accounting Firm
Board of Directors and Shareholders
Xerium Technologies, Inc.
We have audited Xerium Technologies, Inc.’s internal control over financial reporting as of December 31, 2016, based on criteria established in Internal Control-Integrated Framework issued by the Committee of Sponsoring Organizations of the Treadway Commission (2013 framework) (the COSO criteria). Xerium Technologies, Inc.’s management is responsible for maintaining effective internal control over financial reporting, and for its assessment of the effectiveness of internal control over financial reporting included in the accompanying Management’s Annual Report on Internal Control Over Financial Reporting. Our responsibility is to express an opinion on the company’s internal control over financial reporting based on our audit.
We conducted our audit in accordance with the standards of the Public Company Accounting Oversight Board (United States). Those standards require that we plan and perform the audit to obtain reasonable assurance about whether effective internal control over financial reporting was maintained in all material respects. Our audit included obtaining an understanding of internal control over financial reporting, assessing the risk that a material weakness exists, testing and evaluating the design and operating effectiveness of internal control based on the assessed risk, and performing such other procedures as we considered necessary in the circumstances. We believe that our audit provides a reasonable basis for our opinion.
A company’s internal control over financial reporting is a process designed to provide reasonable assurance regarding the reliability of financial reporting and the preparation of financial statements for external purposes in accordance with generally accepted accounting principles. A company’s internal control over financial reporting includes those policies and procedures that (1) pertain to the maintenance of records that, in reasonable detail, accurately and fairly reflect the transactions and dispositions of the assets of the company; (2) provide reasonable assurance that transactions are recorded as necessary to permit preparation of financial statements in accordance with generally accepted accounting principles, and that receipts and expenditures of the company are being made only in accordance with authorizations of management and directors of the company; and (3) provide reasonable assurance regarding prevention or timely detection of unauthorized acquisition, use or disposition of the company’s assets that could have a material effect on the financial statements.
Because of its inherent limitations, internal control over financial reporting may not prevent or detect misstatements. Also, projections of any evaluation of effectiveness to future periods are subject to the risk that controls may become inadequate because of changes in conditions, or that the degree of compliance with the policies or procedures may deteriorate.
In our opinion, Xerium Technologies, Inc. maintained, in all material respects, effective internal control over financial reporting as of December 31, 2016, based on the COSO criteria.
We also have audited, in accordance with the standards of the Public Company Accounting Oversight Board (United States), the consolidated balance sheets of Xerium Technologies, Inc. as of December 31, 2016 and 2015, and the related consolidated statements of operations, comprehensive income (loss), stockholders’ deficit and cash flows for each of the three years in the period ended December 31, 2016 of Xerium Technologies, Inc. and our report dated March 1, 2017 expressed an unqualified opinion thereon.
/s/ Ernst & Young LLP
Raleigh, North Carolina
March 1, 2017
45
ITEM 9B. | OTHER INFORMATION |
None.
ITEM 10. | DIRECTORS, EXECUTIVE OFFICERS AND CORPORATE GOVERNANCE |
The information required by this item is incorporated by reference to our Proxy Statement for the 2017 Annual Meeting of Shareholders.
ITEM 11. | EXECUTIVE COMPENSATION |
The information required by this item is incorporated by reference to our Proxy Statement for the 2017 Annual Meeting of Shareholders.
ITEM 12. | SECURITY OWNERSHIP OF CERTAIN BENEFICIAL OWNERS AND MANAGEMENT AND RELATED STOCKHOLDER MATTERS |
The information required by this item is incorporated by reference to our Proxy Statement for the 2017 Annual Meeting of Shareholders.
ITEM 13. | CERTAIN RELATIONSHIPS AND RELATED TRANSACTIONS AND DIRECTOR INDEPENDENCE |
The information required by this item is incorporated by reference to our Proxy Statement for the 2017 Annual Meeting of Shareholders.
ITEM 14. | PRINCIPAL ACCOUNTING FEES AND SERVICES |
The information required by this item is incorporated by reference to our Proxy Statement for the 2017 Annual Meeting of Shareholders.
46
PART IV
ITEM 15. | EXHIBITS, FINANCIAL STATEMENT SCHEDULES |
(a) (1) Financial Statements. The following documents are filed as Appendix A hereto and are included as part of this Annual Report on Form 10-K:
Financial Statements of Xerium Technologies, Inc.:
Report of Independent Registered Public Accounting Firm on the Consolidated Financial Statements and Schedule
Consolidated Balance Sheets as of December 31, 2016 and 2015
Consolidated Statements of Operations for the years ended December 31, 2016, 2015 and 2014
Consolidated Statements of Comprehensive Income (Loss) for the years ended December 31, 2016, 2015 and 2014
Consolidated Statements of Stockholders’ Deficit for the years ended December 31, 2016, 2015 and 2014
Consolidated Statements of Cash Flows for the years ended December 31, 2016, 2015 and 2014
Notes to Consolidated Financial Statements
(a) (2) Financial Statement Schedules. The following financial statement schedule is included as part of this Annual Report on Form 10-K:
Schedule II, Valuation and Qualifying Accounts
Certain schedules are omitted because they are not applicable, or not required, or because the required information is included in the financial statements or notes thereto.
(a) (3) Exhibits. The exhibits filed as part of this Annual Report on Form 10-K are listed in the Exhibit Index immediately preceding such exhibits, and are incorporated herein by this reference. We have identified with plus symbols in the Exhibit Index each management contract and compensation plan filed as an exhibit to this Annual Report on Form 10-K.
47
Signatures
Pursuant to the requirements of Section 13 or 15(d) of the Securities Exchange Act of 1934, as amended, the registrant has duly caused this report to be signed on its behalf by the undersigned, thereunto duly authorized, in Raleigh, North Carolina, on March 1, 2017.
XERIUM TECHNOLOGIES, INC. | ||
By: | /s/ HAROLD C. BEVIS | |
Harold C. Bevis President and Chief Executive Officer | ||
Pursuant to the requirements of the Securities Exchange Act of 1934, as amended, this report has been signed below by the following persons in the capacities indicated on March 1, 2017.
Signature | Title | |
/S/ HAROLD C. BEVIS Harold C. Bevis | President, Chief Executive Officer and Director (Principal Executive Officer) | |
/S/ CLIFFORD E. PIETRAFITTA Clifford E. Pietrafitta | Executive Vice President and Chief Financial Officer (Principal Financial and Accounting Officer) | |
/S/ AMBASSADOR APRIL H. FOLEY Ambassador April H. Foley | Director | |
/S/ JAY GURANDIANO Jay Gurandiano | Director | |
/S/ JOHN F. MCGOVERN John F. McGovern | Director | |
/S/ ROGER A. BAILEY Roger A. Bailey | Director | |
/S/ ALEXANDER TOELDTE Alexander Toeldte | Director | |
/S/ JAMES F. WILSON James F. Wilson | Chairman | |
48
Report of Independent Registered Public Accounting Firm
Board of Directors and Shareholders
Xerium Technologies, Inc.
We have audited the accompanying consolidated balance sheets of Xerium Technologies, Inc. as of December 31, 2016 and 2015, and the related consolidated statements of operations, comprehensive (loss) income, stockholders' deficit and cash flows for each of the three years in the period ended December 31, 2016. Our audits also included the financial statement schedule listed in the Index at Item 15(a). These financial statements and schedule are the responsibility of the Company's management. Our responsibility is to express an opinion on these financial statements and schedule based on our audits.
We conducted our audits in accordance with the standards of the Public Company Accounting Oversight Board (United States). Those standards require that we plan and perform the audit to obtain reasonable assurance about whether the financial statements are free of material misstatement. An audit includes examining, on a test basis, evidence supporting the amounts and disclosures in the financial statements. An audit also includes assessing the accounting principles used and significant estimates made by management, as well as evaluating the overall financial statement presentation. We believe that our audits provide a reasonable basis for our opinion.
In our opinion, the financial statements referred to above present fairly, in all material respects, the consolidated financial position of Xerium Technologies, Inc. at December 31, 2016 and 2015, and the consolidated results of its operations and its cash flows for each of the three years in the period ended December 31, 2016, in conformity with U.S. generally accepted accounting principles. Also, in our opinion, the related financial statement schedule, when considered in relation to the basic financial statements taken as a whole, presents fairly in all material respects the information set forth therein.
We also have audited, in accordance with the standards of the Public Company Accounting Oversight Board (United States), Xerium Technologies, Inc.’s internal control over financial reporting as of December 31, 2016, based on criteria established in Internal Control-Integrated Framework issued by the Committee of Sponsoring Organizations of the Treadway Commission (2013 framework) and our report dated March 1, 2017 expressed an unqualified opinion thereon.
/s/ Ernst & Young LLP
Raleigh, North Carolina
March 1, 2017
49
XERIUM TECHNOLOGIES, INC.
CONSOLIDATED BALANCE SHEETS
December 31, | |||||||
2016 | 2015 | ||||||
(dollars in thousands) | |||||||
ASSETS | |||||||
Current assets: | |||||||
Cash and cash equivalents | $ | 12,808 | $ | 9,839 | |||
Accounts receivable, (net of allowance for doubtful accounts of $3,620 in 2016 and $5,184 in 2015) | 68,667 | 68,562 | |||||
Inventories | 70,822 | 71,698 | |||||
Prepaid expenses | 6,325 | 6,649 | |||||
Other current assets | 15,784 | 16,869 | |||||
Total current assets | 174,406 | 173,617 | |||||
Property and equipment, net | 284,101 | 297,083 | |||||
Goodwill | 56,783 | 58,599 | |||||
Intangible assets | 7,330 | 1,547 | |||||
Non-current deferred tax asset | 10,737 | 9,325 | |||||
Other assets | 8,556 | 10,203 | |||||
Total assets | $ | 541,913 | $ | 550,374 | |||
LIABILITIES AND STOCKHOLDERS’ DEFICIT | |||||||
Current liabilities: | |||||||
Notes payable | $ | 7,328 | $ | 6,556 | |||
Accounts payable | 36,158 | 40,696 | |||||
Accrued expenses | 64,532 | 56,076 | |||||
Current maturities of long-term debt | 8,600 | 5,410 | |||||
Total current liabilities | 116,618 | 108,738 | |||||
Long-term debt, net of current maturities and deferred financing costs | 472,923 | 462,470 | |||||
Liabilities under capital lease | 19,236 | 8,737 | |||||
Non-current deferred tax liability | 7,157 | 8,770 | |||||
Pension, other post-retirement and post-employment obligations | 65,026 | 63,606 | |||||
Other long-term liabilities | 7,858 | 11,123 | |||||
Commitments and contingencies (Note 9) | |||||||
Stockholders’ deficit: | |||||||
Preferred stock, $0.001 par value, 1,000,000 shares authorized; no shares outstanding as of December 31, 2016 and December 31, 2015 | — | — | |||||
Common stock, $0.001 par value, 20,000,000 shares authorized; 16,152,946 and 15,745,914 shares outstanding as of December 31, 2016 and December 31, 2015, respectively | 16 | 16 | |||||
Paid-in capital | 430,823 | 430,054 | |||||
Accumulated deficit | (443,066 | ) | (421,448 | ) | |||
Accumulated other comprehensive loss | (134,678 | ) | (121,692 | ) | |||
Total stockholders’ deficit | (146,905 | ) | (113,070 | ) | |||
Total liabilities and stockholders’ deficit | $ | 541,913 | $ | 550,374 | |||
See accompanying notes.
50
XERIUM TECHNOLOGIES, INC.
CONSOLIDATED STATEMENTS OF OPERATIONS
Year ended December 31, | |||||||||||
2016 | 2015 | 2014 | |||||||||
(dollars in thousands, except per share data) | |||||||||||
Net sales | $ | 471,317 | $ | 477,243 | $ | 542,932 | |||||
Costs and expenses: | |||||||||||
Cost of products sold | 293,842 | 288,512 | 327,161 | ||||||||
Selling | 62,810 | 64,414 | 73,002 | ||||||||
General and administrative | 51,063 | 56,250 | 56,539 | ||||||||
Research and development | 7,100 | 7,404 | 7,903 | ||||||||
Restructuring | 10,362 | 14,649 | 18,142 | ||||||||
425,177 | 431,229 | 482,747 | |||||||||
Income from operations | 46,140 | 46,014 | 60,185 | ||||||||
Interest expense, net | (46,155 | ) | (38,413 | ) | (36,768 | ) | |||||
Loss on extinguishment of debt | (11,938 | ) | (388 | ) | — | ||||||
Foreign exchange (loss) gain | (383 | ) | 1,872 | (719 | ) | ||||||
(Loss) income before provision for income taxes | (12,336 | ) | 9,085 | 22,698 | |||||||
Provision for income taxes | (9,282 | ) | (13,465 | ) | (30,080 | ) | |||||
Net loss | $ | (21,618 | ) | $ | (4,380 | ) | $ | (7,382 | ) | ||
Net loss per share: | |||||||||||
Basic and diluted | $ | (1.35 | ) | $ | (0.28 | ) | $ | (0.48 | ) | ||
Shares used in computing net loss per share: | |||||||||||
Basic and diluted | 15,994,467 | 15,640,836 | 15,458,810 | ||||||||
See accompanying notes.
51
XERIUM TECHNOLOGIES, INC.
CONSOLIDATED STATEMENTS OF COMPREHENSIVE INCOME (LOSS)
Year ended December 31, | |||||||||||
2016 | 2015 | 2014 | |||||||||
Net loss | $ | (21,618 | ) | $ | (4,380 | ) | $ | (7,382 | ) | ||
Other comprehensive loss before income taxes: | |||||||||||
Foreign currency translation adjustments | (7,959 | ) | (50,980 | ) | (39,751 | ) | |||||
Unrealized gain on derivative instruments | — | 1,126 | 127 | ||||||||
Defined benefit pension plan | |||||||||||
Amortization of net loss | 1,949 | 2,140 | 1,124 | ||||||||
Net (loss) gain on liability | (12,883 | ) | 14,643 | (27,455 | ) | ||||||
Net gain (loss) on asset | 4,406 | (5,466 | ) | 3,827 | |||||||
Settlement gain | — | 1,324 | 258 | ||||||||
Currency translation impact | 2,471 | 2,592 | 2,895 | ||||||||
Defined benefit pension plan, net | (4,057 | ) | 15,233 | (19,351 | ) | ||||||
Other comprehensive loss, before income taxes | (12,016 | ) | (34,621 | ) | (58,975 | ) | |||||
Income tax (provision) benefit related to components of other comprehensive loss | (970 | ) | (1,133 | ) | 3,089 | ||||||
Other comprehensive loss, net of tax | (12,986 | ) | (35,754 | ) | (55,886 | ) | |||||
Comprehensive loss, net of tax | $ | (34,604 | ) | $ | (40,134 | ) | $ | (63,268 | ) | ||
See accompanying notes.
52
XERIUM TECHNOLOGIES, INC.
CONSOLIDATED STATEMENTS OF STOCKHOLDERS’ DEFICIT
Common Stock | Warrants | Paid-in Capital | Accumulated Deficit | Accumulated Other Comprehensive Loss | Total Stockholders’ Deficit | |||||||||||||||||||||
Shares | Amount | |||||||||||||||||||||||||
(dollars in thousands) | ||||||||||||||||||||||||||
Balance at December 31, 2013 | 15,383,903 | $ | 15 | $ | 13,532 | $ | 414,742 | $ | (409,686 | ) | $ | (30,052 | ) | $ | (11,449 | ) | ||||||||||
Net loss | — | — | — | — | (7,382 | ) | — | (7,382 | ) | |||||||||||||||||
Other comprehensive loss | — | — | — | — | — | (55,886 | ) | (55,886 | ) | |||||||||||||||||
Issuance of common stock | 176,724 | 1 | — | (1,942 | ) | — | — | (1,941 | ) | |||||||||||||||||
Stock-based compensation | — | — | — | 2,548 | — | — | 2,548 | |||||||||||||||||||
Reclass warrants to additional paid in capital | — | — | (13,532 | ) | 13,532 | — | — | — | ||||||||||||||||||
Balance at December 31, 2014 | 15,560,627 | 16 | — | 428,880 | (417,068 | ) | (85,938 | ) | (74,110 | ) | ||||||||||||||||
Net loss | — | — | — | — | (4,380 | ) | — | (4,380 | ) | |||||||||||||||||
Other comprehensive loss | — | — | — | — | — | (35,754 | ) | (35,754 | ) | |||||||||||||||||
Issuance of common stock | 185,287 | — | — | (2,124 | ) | — | — | (2,124 | ) | |||||||||||||||||
Stock-based compensation | — | — | — | 3,298 | — | — | 3,298 | |||||||||||||||||||
Balance at December 31, 2015 | 15,745,914 | 16 | — | 430,054 | (421,448 | ) | (121,692 | ) | (113,070 | ) | ||||||||||||||||
Net loss | — | — | — | — | (21,618 | ) | — | (21,618 | ) | |||||||||||||||||
Other comprehensive loss | — | — | — | — | — | (12,986 | ) | (12,986 | ) | |||||||||||||||||
Issuance of common stock | 407,032 | — | — | (1,843 | ) | — | — | (1,843 | ) | |||||||||||||||||
Stock-based compensation | — | — | — | 2,612 | — | — | 2,612 | |||||||||||||||||||
Balance at December 31, 2016 | 16,152,946 | $ | 16 | $ | — | $ | 430,823 | $ | (443,066 | ) | $ | (134,678 | ) | $ | (146,905 | ) | ||||||||||
See accompanying notes.
53
XERIUM TECHNOLOGIES, INC.
CONSOLIDATED STATEMENTS OF CASH FLOWS
Year ended December 31, | ||||||||||||
2016 | 2015 | 2014 | ||||||||||
(dollars in thousands) | ||||||||||||
Operating activities | ||||||||||||
Net loss | $ | (21,618 | ) | $ | (4,380 | ) | $ | (7,382 | ) | |||
Adjustments to reconcile net loss to net cash provided by operating activities: | ||||||||||||
Stock-based compensation | 2,612 | 3,298 | 2,548 | |||||||||
Depreciation | 32,115 | 28,952 | 32,752 | |||||||||
Amortization of other intangibles | 841 | 298 | 1,540 | |||||||||
Deferred financing cost amortization | 3,063 | 3,462 | 3,303 | |||||||||
Unrealized foreign exchange gain on revaluation of debt | (3,267 | ) | (3,426 | ) | (259 | ) | ||||||
Deferred taxes | 219 | (2,785 | ) | (4,857 | ) | |||||||
Asset impairments | — | 1,536 | 136 | |||||||||
Loss (gain) on disposition of property and equipment | 50 | (1,383 | ) | (1,036 | ) | |||||||
Pension settlement losses | — | 1,108 | — | |||||||||
Loss on extinguishment of debt | 11,938 | 388 | — | |||||||||
Provision for doubtful accounts | 275 | 1,117 | 274 | |||||||||
Change in assets and liabilities which provided (used) cash: | ||||||||||||
Accounts receivable | 1,677 | 5,234 | (3,461 | ) | ||||||||
Inventories | 3,746 | 2,985 | (9,009 | ) | ||||||||
Prepaid expenses | 332 | 757 | (837 | ) | ||||||||
Other current assets | (1,284 | ) | (3,219 | ) | (3,278 | ) | ||||||
Accounts payable and accrued expenses | 4,504 | 5,300 | 2,539 | |||||||||
Deferred and other long-term liabilities and assets | 1,306 | (5,955 | ) | (4,139 | ) | |||||||
Net cash provided by operating activities | 36,509 | 33,287 | 8,834 | |||||||||
Investing activities | ||||||||||||
Capital expenditures | (13,706 | ) | (50,871 | ) | (45,218 | ) | ||||||
Proceeds from disposals of property and equipment | 117 | 3,266 | 3,430 | |||||||||
Acquisition of business, net of cash acquired | (16,225 | ) | — | — | ||||||||
Net cash used in investing activities | (29,814 | ) | (47,605 | ) | (41,788 | ) | ||||||
Financing activities | ||||||||||||
Proceeds from borrowings | 565,553 | 99,948 | 102,159 | |||||||||
Increase (decrease) in note payable | 1,121 | 6,759 | (7,168 | ) | ||||||||
Principal payments on debt | (539,711 | ) | (88,058 | ) | (71,953 | ) | ||||||
Payment of obligations under capital leases | (3,950 | ) | (1,413 | ) | (821 | ) | ||||||
Payment of deferred financing fees | (23,496 | ) | (662 | ) | (1,524 | ) | ||||||
Employee taxes paid on equity awards | (1,843 | ) | (2,124 | ) | (1,942 | ) | ||||||
Net cash (used in) provided by financing activities | (2,326 | ) | 14,450 | 18,751 | ||||||||
Effect of exchange rate changes on cash flows | (1,400 | ) | 190 | (1,996 | ) | |||||||
Net increase (decrease) in cash | 2,969 | 322 | (16,199 | ) | ||||||||
Cash and cash equivalents at beginning of year | 9,839 | 9,517 | 25,716 | |||||||||
Cash and cash equivalents at end of year | $ | 12,808 | $ | 9,839 | $ | 9,517 | ||||||
Cash paid for interest | $ | 28,692 | $ | 34,129 | $ | 33,519 | ||||||
Cash paid for income taxes | $ | 13,666 | $ | 10,517 | $ | 33,213 | ||||||
Non-cash accrual for new facility | $ | — | $ | 1,937 | $ | 5,695 | ||||||
Non-cash capitalized leases | $ | 11,008 | $ | 8,725 | $ | 4,766 | ||||||
See accompanying notes.
54
Xerium Technologies, Inc.
Notes to Consolidated Financial Statements
(Dollars in thousands, except share and per share data)
1. Company Description
Xerium Technologies, Inc. (the "Company") is a leading, global provider of industrial consumable products and services including machine clothing, roll coverings, roll repair and mechanical services. These goods and services are used in the production of paper, paperboard, building products and nonwoven materials. Its operations are strategically located in the major paper-making regions of the world, including North America, Europe, Latin America and Asia-Pacific.
2. Accounting Policies
Basis of Presentation and Consolidation
The consolidated financial statements have been prepared on the basis of U.S. generally accepted accounting principles ("U.S. GAAP"). The consolidated financial statements include the accounts of Xerium Technologies, Inc. and its wholly-owned subsidiaries. Intercompany accounts and transactions have been eliminated.
Revenue Recognition
Revenue on product sales is recognized when persuasive evidence of an arrangement exists, the price is fixed and determinable, delivery including transfer of title has occurred and there is a reasonable assurance of collection of the sales proceeds. The Company generally obtains written purchase authorizations from customers for a specific product or service at a specified price and considers delivery and transfer of title to have occurred in accordance with our shipping terms. Revenue is recorded net of applicable allowances, including estimated allowances for returns, rebates and other discounts. In the machine clothing segment, a small portion of the business has been conducted pursuant to consignment arrangements under which the Company does not recognize a sale of a product to a customer until the customer places the product into use, which typically occurs some period after the product is shipped to the customer or to a warehouse location near the customer’s facility. As part of the consignment agreement, the Company delivers the goods to a location designated by the customer. In addition, the customer and the Company agree to a “sunset” date, which represents the date by which the customer must accept all risks and rewards of ownership of the product and payment terms begin. For consignment sales, revenue is recognized on the earlier of the actual product installation date or the “sunset” date.
Classification of Costs and Expenses
Cost of products sold includes raw materials, manufacturing labor, direct and indirect overhead costs, product freight, and depreciation of manufacturing plant and equipment. Warehousing costs incurred as a result of customer-specific delivery terms are also included in cost of products sold.
Selling expenses include direct sales force salaries, commissions, travel and entertainment expenses and other expenses as well as agents’ commissions and fees, other warehousing costs, advertising costs and marketing costs.
General and administrative expenses include costs relating to management and administrative staff such as employee compensation and benefits, travel and entertainment (non-sales), non-manufacturing facility occupancy costs, including rent expense and professional fees, as well as depreciation on non-manufacturing equipment and office supplies and expenses.
Research and development expenses are comprised of engineering staff wages and associated fringe benefits, as well as the cost of prototypes, testing materials and non-capitalizable testing equipment.
Advertising Costs
Selling expenses include advertising expenses of $1.1 million, $1.2 million and $1.3 million in 2016, 2015 and 2014, respectively. The Company expenses all advertising costs as incurred.
Translation of Financial Statements
The reporting currency of the Company is U.S. Dollars. Assets and liabilities of non-U.S. operations are translated at year-end rates of exchange and the Consolidated Statements of Operations and Cash Flows are translated at the average rates of exchange during the year. Gains and losses resulting from translating non-U.S. Dollar denominated financial statements are recorded in accumulated other comprehensive income (loss) as a component of stockholders’ deficit.
55
Foreign Exchange
Foreign exchange gains and losses arising out of transactions denominated in currencies other than a subsidiary’s functional currency are recorded in the Consolidated Statements of Operations. Net exchange gains and losses are recorded in “Foreign exchange (loss) gain” and amounted to a (loss) gain of $(383), $1,872 and $(719) for the years ended December 31, 2016, 2015 and 2014, respectively. Certain intercompany loans have been determined to be permanent, and accordingly, foreign exchange gains or losses related to such loans are recorded in accumulated other comprehensive loss within equity.
Derivatives and Hedging
As required by ASC Topic 815, Derivatives and Hedging (“Topic 815”), the Company records all derivatives on the balance sheet at fair value. The accounting for changes in the fair value of derivatives depends on the intended use of the derivative, whether the Company has elected to designate a derivative in a hedging relationship and apply hedge accounting and whether the hedging relationship has satisfied the criteria necessary to apply hedge accounting. Derivatives designated and qualifying as a hedge of the exposure to changes in the fair value of an asset, liability or firm commitment attributable to a particular risk are considered fair value hedges. Derivatives designated and qualifying as a hedge of the exposure to variability in expected future cash flows, or other types of forecasted transactions, are considered cash flow hedges. Derivatives may also be designated as hedges of the foreign currency exposure of a net investment in a foreign operation. Hedge accounting generally provides for the matching of the timing of gain or loss recognition on the hedging instrument with the recognition of the changes in the fair value of the hedged asset or liability that are attributable to the hedged risk in a fair value hedge or the earnings effect of the hedged forecasted transaction in a cash flow hedge.
The Company may enter into derivative contracts that are intended to economically hedge certain of its risks, even though hedge accounting does not apply or the Company elects not to apply hedge accounting under Topic 815. See Note 6 "Derivatives and Hedging" for further discussion on the Company’s derivatives.
Freight Costs
The Company incurred $10.3 million, $10.2 million and $12.4 million in freight costs in the years ended December 31, 2016, 2015 and 2014 respectively. These costs are includes in cost of good sold in the Consolidated Income Statements.
Estimates
The preparation of financial statements in conformity with U.S. GAAP requires management to make estimates and assumptions that affect the reported amounts of assets and liabilities and disclosure of contingent assets and liabilities at the date of the financial statements and the reported amounts of net sales and expenses during the reporting period. Actual results could differ from those estimates.
Cash and Cash Equivalents
Cash and cash equivalents consist of cash and highly liquid short-term investments with maturities of three months or less when acquired. Short-term investments consist of time deposits or money market accounts at investment-grade banks.
Accounts Receivable and Allowance for Doubtful Accounts
Accounts receivable are recorded at cost and do not bear interest. Bad debt provisions are included in general and administrative expense. The amounts recorded are derived based upon the general aging of receivables, specific customer credit history and payment trends and new business conditions.
Inventories
Inventories are generally valued at the lower of cost or market using the first-in, first-out ("FIFO") method. Raw materials are valued principally on a weighted average cost basis. The Company’s work in process and finished goods are specifically identified and valued based on actual inputs to production. Provisions are recorded as appropriate to write-down obsolete and excess inventory to estimated net realizable value. The process for evaluating obsolete and excess inventory often requires management to make subjective judgments and estimates concerning future sales levels, quantities and prices at which such inventory will be able to be sold in the normal course of business, while considering the general aging of inventory and factoring in any new business conditions.
The components of inventories are as follows at:
56
December 31, | ||||||||
2016 | 2015 | |||||||
Raw materials | $ | 14,089 | $ | 12,389 | ||||
Work in process | 25,879 | 25,203 | ||||||
Finished goods (includes consigned inventory of $6,673 in 2016 and $6,513 in 2015) | 37,155 | 40,058 | ||||||
Inventory allowances | (6,301 | ) | (5,952 | ) | ||||
$ | 70,822 | $ | 71,698 | |||||
Financial Instruments
The carrying value of cash and cash equivalents, trade receivables, other current assets, accounts payable, notes payable and amounts included in accruals meeting the definition of a financial instrument under U.S. GAAP approximate fair value due to their short-term nature. The carrying value of long-term debt is less than its fair value (see Note 5 "Long-term Debt"). The Company determines estimated fair values based upon quoted market values where applicable or management estimates.
Long-lived Assets
Property and equipment
Property and equipment are recorded at cost. Property and equipment acquired in connection with acquisitions are recorded at fair value as of the date of the acquisition, and subsequent additions are recorded at cost. Depreciation is computed using the straight-line method over the following estimated useful lives:
Asset | Years | |||
Buildings and improvements | 3-50 | |||
Machinery and equipment | — Heavy | 16-25 | ||
— General | 13-15 | |||
— Light | 6-12 | |||
— Molds, tools, office and computers | 2-5 | |||
Property and equipment consist of the following at:
December 31, | ||||||||
2016 | 2015 | |||||||
Land | $ | 21,323 | $ | 20,664 | ||||
Building and improvements | 142,435 | 140,362 | ||||||
Machinery and equipment | 610,586 | 606,958 | ||||||
Construction in progress | 6,827 | 13,640 | ||||||
Assets under capital lease | 19,605 | 15,710 | ||||||
Total | 800,776 | 797,334 | ||||||
Less accumulated depreciation | (516,675 | ) | (500,251 | ) | ||||
$ | 284,101 | $ | 297,083 | |||||
The Company recorded $32.1 million, $29.0 million and $32.8 million in depreciation expense in 2016, 2015 and 2014, respectively. Amortization related to assets under capital lease is included in depreciation expense.
Assets held for sale or sold
During the first quarter of 2016, the Company determined that the Middletown, VA. facility, with a NBV of $3.0 million met the criteria under ASC Topic 360, Property, Plant, and Equipment (“Topic 360”) to be classified as held for sale. Accordingly, the related assets were reclassified out of property, plant and equipment to other assets in the Company's Consolidated Balance Sheet.
57
During 2015, the Company determined that the Warwick, Quebec, Canada machine clothing facility, with a NBV of $0.5 million met the criteria under ASC Topic 360, Property, Plant, and Equipment (“Topic 360”) to be classified as held for sale.
During 2013, a rolls facility in Charlotte, NC was classified as held for sale. This property had a carrying value of $0.5 million. Accordingly, the related assets were reclassified out of property, plant and equipment to other assets in the Company's Consolidated Balance Sheet. This facility had not been sold as of December 31, 2016.
Impairment
The Company reviews its long-lived assets that have finite lives for impairment in accordance with Topic 360. This topic requires that companies evaluate the fair value of long-lived assets based on the anticipated un-discounted future cash flows to be generated by the assets when indicators of impairment exist to determine if there is impairment to the carrying value. Any change in the carrying amount of an asset as a result of the Company’s evaluation has been recorded in restructuring expense in the Consolidated Statements of Operations. Impairment charges associated with restructuring are discussed in Note 11 "Restructuring Expense".
Intangible assets
Intangible assets consist of patents, licenses and trademarks. Patents, licenses and trademarks are amortized on a straight-line basis over their useful lives, which range from three to fifteen years.
Goodwill
The Company accounts for goodwill and other intangible assets in accordance with ASC Topic 350, Intangibles—Goodwill and Other Intangible Assets (“Topic 350”). Topic 350 requires that goodwill and intangible assets that have indefinite lives not be amortized but, instead, must be tested at least annually for impairment or whenever events or business conditions warrant. The Company first assessed qualitative factors to determine whether it was more likely than not that the fair value of its reporting units were less than the carrying amounts as a basis for determining whether it is necessary to perform the two-step goodwill impairment test. The Company’s assessment is that the two-step goodwill impairment test is not necessary for the year ending December 31, 2016 for either its clothing or rolls reporting units. If the qualitative factors had indicated that it was more likely than not that the fair value of the reporting units was less than its carrying amount, the Company would have tested goodwill for impairment at the reporting unit level using a two-step approach.
Step 1 involves comparing the fair value of the Company’s reporting unit to its carrying amount. If the fair value of the reporting unit is greater than its carrying amount, there is no impairment. If the reporting unit carrying amount is greater than the fair value then the second step must be completed to measure the amount of impairment, if any. Step 2 calculates the implied fair value of goodwill by deducting the fair value of the net assets of the reporting unit from the fair value of the reporting unit as determined in Step 1. The implied fair value of goodwill determined in this step is compared to the carrying value of goodwill. If the implied fair value of goodwill is less than the carrying value of goodwill, an impairment loss is recognized equal to the difference.
The Company performs an annual test for goodwill impairment as of December 31 at the reporting unit level. The Company has two reporting units: machine clothing and roll covers. For the purpose of performing the annual impairment test, the Company allocates all shared assets and liabilities to the reporting units based on the percentage of each reporting unit’s revenue to total revenue. Shared operating expenses are allocated to the reporting unit to the extent necessary to allow them to operate as independent businesses. To determine if impairment exists, the fair value of each reporting unit is compared to its carrying value. The fair value of the Company’s reporting unit is determined by using a weighted combination of both a market multiple approach and an income approach. The market multiple approach utilizes the Company’s and its competitors’ proprietary information that is used to value its reporting units. The income approach is a present value technique used to measure the fair value of future cash flows produced by each reporting unit. During the fourth quarter of 2016, the Company voluntarily changed the date of its annual goodwill impairment testing from December 31, the last day of the fiscal year, to October 1. The voluntary change in accounting principle related to the annual testing date will not delay, accelerate or avoid an impairment charge. This change is not being applied retrospectively, as it would require application of significant estimates and assumptions with the use of hindsight. Accordingly, the change will be applied prospectively. As a result of the annual tests for goodwill impairment performed as of October 1, 2016 and December 31, 2015, the Company determined that no goodwill impairment exists.
Stock-Based Compensation
The Company records stock-based compensation expense in accordance with ASC Topic 718, Compensation—Stock Compensation (“Topic 718”) which generally requires that such transactions be recognized in the statement of operations based
58
on their fair values at the date of grant. See Note 10 "Stock-Based Compensation and Stockholders' Deficit" for further discussion.
Net (Loss) Income Per Common Share
Net (loss) income per common share has been computed and presented pursuant to the provisions of ASC Topic 260, Earnings per Share (“Topic 260”). Net (loss) income per share is based on the weighted-average number of shares outstanding during the period.
As of December 31, 2016, 2015 and 2014, the Company had outstanding restricted stock units (“RSUs”) (See Note 10 "Stock-Based Compensation and Stockholders' Deficit"). Diluted average shares outstanding were computed using (i) the average market price for time-based RSUs and (ii) the actual grant date market price for non-employee director RSUs. The calculation of diluted earnings per share excludes the Company’s performance-based RSUs that are based on Adjusted EBITDA targets whose performance criteria have not been contingently achieved and therefore the RSUs have not been issued or are not contingently issuable. For the years ended December 31, 2016, 2015, and 2014 the dilutive effect of potential future issuances of common stock underlying the Company’s RSUs was excluded from the calculation of diluted average shares outstanding because their effect would have been anti-dilutive as the Company incurred a net loss.
2016 | 2015 | 2014 | |||||||
Weighted-average common shares outstanding—basic | 15,994,467 | 15,640,836 | 15,458,810 | ||||||
Dilutive effect of stock-based compensation awards outstanding | — | — | — | ||||||
Weighted-average common shares outstanding—diluted | 15,994,467 | 15,640,836 | 15,458,810 | ||||||
Dilutive securities aggregating approximately 0.9 million, 1.1 million and 1.3 million outstanding during the years ended December 31, 2016, 2015 and 2014, respectively, were not included in the computation of diluted earnings per share because the impact would be anti-dilutive to the earnings per share calculation.
Income Taxes
The Company accounts for income taxes in accordance with ASC Topic 740, Income Taxes (“Topic 740”), which requires the recognition of deferred tax assets and liabilities for the expected future consequences attributable to differences between the financial statement carrying amounts of existing assets and liabilities and their respective tax bases. Deferred tax assets, representing future tax benefits, are reduced by a valuation allowance when the determination can be made that it is “more likely than not” that all or a portion of the related tax asset will not be realized. The deferred tax provision or benefit represents the annual change in deferred tax assets and liabilities, excluding any amounts accounted for as components of goodwill or accumulated other comprehensive loss, including the effect of foreign currency translation thereon. While the Company believes it has adequately provided for its income tax receivable or liabilities and its deferred tax assets or liabilities in accordance with Topic 740 income tax guidance, adverse determination by taxing authorities or changes in tax laws and regulations could have a material adverse effect on the Company’s consolidated financial position, results of operations or cash flows. Income taxes are further discussed in Note 7.
Warranties
The Company offers warranties on certain rolls products that it sells. The specific terms and conditions of these warranties vary depending on the product sold, the country in which the product is sold and arrangements with the customer. The Company estimates the costs that may be incurred under its warranties and records a liability for such costs. Factors that affect the Company’s warranty liability include the number of units sold, historical and anticipated rates of warranty claims, cost per claim and new product introduction. The Company periodically assesses the adequacy of its recorded warranty claims and adjusts the amounts as necessary. The table below represents the changes in the Company’s warranty liability included in accrued expenses for 2016 and 2015:
Balance at Beginning of Year | Charged to Cost of Products Sold | Effect of Foreign Currency Translation | Deduction from Reserves | Balance at End of Year | ||||||||||||||||
For the year ended December 31, 2016 | $ | 2,175 | $ | 1,616 | $ | 26 | $ | (1,614 | ) | $ | 2,203 | |||||||||
For the year ended December 31, 2015 | $ | 2,685 | $ | 1,134 | $ | (153 | ) | $ | (1,491 | ) | $ | 2,175 | ||||||||
59
Commitments and Contingencies
The Company provides accruals for all direct costs associated with the estimated resolution of contingencies at the earliest date at which it is deemed probable that a liability has been incurred and the amount of such liability can be reasonably estimated. Costs accrued have been estimated based on consultation with legal counsel and are based upon an analysis of potential results, assuming a combination of litigation and settlement strategies and outcomes.
Acquisitions
Acquired businesses are accounted for using the acquisition method of accounting (ASC 805-10-50), which requires that assets acquired and liabilities assumed be recorded at fair value, with limited exceptions. Any excess of the purchase price over the fair value of the net assets acquired is recorded as goodwill. Transaction costs and costs to restructure the acquired company are expensed as incurred. The operating results of the acquired business are reflected in our consolidated financial statements after the date of acquisition.
Prior Period Disclosure Adjustment
The Company has adjusted its year ending December 31, 2015 Non-cash capitalized leases disclosure within the Consolidated Statement of Cash Flows to be consistent with 2016 presentation increasing December 31, 2015 Non-cash capitalized leases by $3.9 million to $8.7 million from $4.8 million.
New Accounting Standards
In March of 2016, the FASB issued Accounting Standards Update No 2016-09 Improvements to Employee Share-Based Payment Accounting ("ASU 2016-09"). ASU 2016-09 will change certain aspects of accounting for share-based payments to employees. The new guidance will require all income tax effects of awards to be recognized in the income statement when the awards vest or are settled. It also will allow an employer to repurchase more of an employee’s shares than it can today for tax withholding purposes without triggering liability accounting and to make a policy election to account for forfeitures as they occur. ASU 2016-09 is required to be adopted in January of 2017. The Company early adopted this standard at June 30, 2016 and applied the standard retrospectively. As of December 31, 2016, the adoption of the standard has resulted in the classification of $1.8 million, $2.1 million, and $1.9 million of employee taxes paid on equity awards as a financing activity in the statement of cash flows, for the twelve months ended December 31, 2016, December 31, 2015, and December 31, 2014, respectively. The remaining provisions of ASU 2016-09 did not have a material impact on the accompanying condensed consolidated financial statements.
In February of 2016, the FASB issued Accounting Standards Update No 2016-02 Leases ("ASU 2016-02"). ASU 2016-02 includes final guidance that requires lessees to put most leases on their balance sheets but recognize expenses in the income statement in a manner similar to today’s accounting. The guidance also eliminates today’s real estate-specific provisions and changes the guidance on sale-leaseback transactions, initial direct costs and lease executory costs for all entities. For lessors, the standard modifies the classification criteria and the accounting for sales-type and direct financing leases. All entities will classify leases to determine how to recognize lease-related revenue and expense. Classification will continue to affect amounts that lessors record on the balance sheet. Entities are required to use a modified retrospective approach for leases that exist or are entered into after the beginning of the earliest comparative period in the financial statements. They have the option to use certain relief. Full retrospective application is prohibited. ASU 2016-02 is effective for public companies with annual periods beginning after 15 December 2018, and interim periods within those years. For all other entities, it is effective for annual periods beginning after 15 December 2019, and interim periods the following year. Early adoption is permitted for all entities. The Company is in the process of evaluating this accounting standard update.
In November of 2015, the FASB issued ASU 2015-17 Income Taxes (Topic 740), Balance Sheet Classification of Deferred Taxes ("ASU 2015-17"). This guidance requires companies to classify all deferred tax assets and liabilities as non-current on the balance sheet instead of separating deferred taxes into current and non-current amounts. For public companies, the guidance is effective for financial statements issued for annual periods beginning after 15 December 2016 (i.e., 2017 for a calendar-year company) and interim periods within those annual periods. Early adoption of the guidance is permitted. Companies can adopt the guidance either prospectively or retrospectively. The Company early adopted this standard at December 31, 2016, using the prospective method; prior periods were not retrospectively adjusted. The provisions of ASU 2015-17 did not have a material impact on the consolidated financial statements.
In July of 2015, the FASB issued Accounting Standards Update Inventory ("ASU 2015-11"). ASU 2015-11 applies only to first-in, first-out (FIFO) and average cost inventory costing methods and will reduce costs and increase comparability for
60
these methods. There will be no change for last-in, first-out, (LIFO) or retail inventory methods as the costs of transitioning to a new method would outweigh the benefits due to the complexity of these methods. Under this ASU, inventory should be measured at the lower of cost and net realizable value (selling prices in the ordinary course of business less reasonably predictable costs of completion, disposal, and transportation). When the net realizable value of inventory is less than its cost, the difference will be recognized as a loss in earnings in the period in which it occurs. This ASU more closely aligns the measurement of inventory under GAAP with International Financial Reporting Standards guidance. The amendments are effective for public companies for fiscal years beginning after December 15, 2016, including interim periods within those fiscal years, and for other entities, the amendments are effective for fiscal years beginning after December 15, 2016, and interim periods within fiscal years beginning after December 15, 2017. The amendments should be applied prospectively, and early application is permitted as of the beginning of an interim or annual reporting period. The Company is in the process of evaluating this accounting standard update.
In May 2015, the FASB issued ASU 2015-07, Fair Value Measurement (Topic 820)- Disclosures for Investments in Certain Entities That Calculate Net Asset Value per Share (or Its Equivalent) (a consensus of the Emerging Issues Task Force). ASU 2015-07 eliminates the requirement to categorize investments measured using the net asset value (NAV) practical expedient in the fair value hierarchy. Further, ASU 2015-07 changed certain disclosure requirements by: limiting the disclosures in paragraph 820-10-50-6A to only those investments measured using the NAV practical expedient, excluding investments measured using the NAV practical expedient from the recurring and nonrecurring disclosure requirements in paragraph 820-10-50-2, and providing that although investments measured using the NAV practical expedient are not categorized in the fair value hierarchy, entities are required to disclose the fair value of investments measured using the practical expedient so that financial statement users can reconcile amounts reported in the fair value hierarchy table to amounts reported on the balance sheet. For public business entities, the guidance is effective for annual periods beginning after 15 December 2015, and interim periods within those fiscal years. For all other entities, it is effective for annual periods beginning after 15 December 2016, and interim periods within those fiscal years. The Company has adopted ASU 2015-07. The provisions of of ASU 2015-07 did not have a material impact on the disclosures contained within the Notes to the Consolidated Financial Statements.
In May of 2014, the FASB issued Accounting Standard Update No. 2014-09 Revenue from Contracts with Customers ("ASU 2014-09"). ASU 2014-09 requires the use of a new five-step model to recognize revenue from customer contracts. The five-step model requires that the Company identify the contract with the customer, identify the performance obligations in the contract, determine the transaction price, allocate the transaction price to the performance obligations in the contract and recognize revenue when it satisfies the performance obligations. The Company will also be required to disclose information regarding the nature, amount, timing and uncertainty of revenue and cash flows arising from contracts with customers. ASU 2014-09 is required to be adopted in January of 2018. Retrospective application is required either to all periods presented or with the cumulative effect of initial adoption recognized in the period of adoption. ASU 2014-09 is required to be adopted in January of 2018. The Company has commenced a comprehensive project plan to direct the implementation of the new revenue recognition standards and an assessment of the impact to business processes. The Company intends to adopt the new standard using the modified retrospective transition method effective January 1, 2018.
3. Goodwill and Intangible Assets
At December 31, 2016 and 2015, the Company had cumulative goodwill impairment of $265.9 million. The following table provides changes in the carrying amount of goodwill by segment for the years ended December 31, 2016 and 2015:
Machine Clothing | Roll Covers | Total | ||||||||||
Balance at December 31, 2014 | $ | 43,369 | $ | 18,558 | $ | 61,927 | ||||||
Foreign currency translations | (2,426 | ) | (902 | ) | (3,328 | ) | ||||||
Balance at December 31, 2015 | 40,943 | 17,656 | 58,599 | |||||||||
Spencer Johnston Acquisition | — | 1,877 | 1,877 | |||||||||
Foreign currency translations | (3,445 | ) | (248 | ) | (3,693 | ) | ||||||
Balance at December 31, 2016 | $ | 37,498 | $ | 19,285 | $ | 56,783 | ||||||
61
The components of intangible assets are summarized as follows at:
December 31, | ||||||||
2016 | 2015 | |||||||
Patents and licenses | $ | 32,535 | $ | 32,562 | ||||
Less accumulated amortization | (31,421 | ) | (31,173 | ) | ||||
Net patents and licenses | 1,114 | 1,389 | ||||||
Trademarks | 19,088 | 18,920 | ||||||
Less accumulated amortization | (18,934 | ) | (18,920 | ) | ||||
Net trademarks | 154 | — | ||||||
Other intangibles | 7,446 | 1,006 | ||||||
Less accumulated amortization | (1,384 | ) | (848 | ) | ||||
Net other intangibles | 6,062 | 158 | ||||||
Net amortizable intangible assets | $ | 7,330 | $ | 1,547 | ||||
Amortization expense for patents, licenses, trademarks and other intangibles amounted to $841, $298 and $1,540 for the years ended December 31, 2016 and 2015 and 2014, respectively. Definite-lived intangible assets of $6.6 million were recorded in the Spencer Johnston acquisition. Refer to Note 15 for further discussion.
As of December 31, 2016, the estimated amortization expense for patents, licenses, trademarks and other intangibles for each of the following periods total $7.3 million as follows:
2017 | $ | 1,352 | |
2018 | 1,223 | ||
2019 | 1,223 | ||
2020 | 1,223 | ||
2021 and thereafter | 2,309 | ||
The weighted average amortization period for the net amortizable intangible assets is 6.5 years.
4. Notes Payable
At December 31, 2016 and December 31, 2015, the balances of the Austrian working capital loan is $7.3 million and $6.6 million, respectively. At December 31, 2016, this loan bears interest at a variable rate of 2.05% and has a maturity date of June 30, 2017, with an annual twelve month roll-over option.
62
5. Long-Term Debt
At December 31, 2016 and 2015, long-term debt consisted of the following:
December 31, 2016 | December 31, 2015 | ||||||
Notes (Secured), payable semi-annually–U.S. Dollar denominated interest rate fixed at 9.50%. Sold at a price equal to 98.54% of their face value. Matures August of 2021. | $ | 480,000 | $ | — | |||
Senior secured term loan facility, payable quarterly, U.S. Dollar denominated–LIBOR (minimum 1.25%) plus 5.0% (6.25%) net of $0.6 million discount. Matures May of 2019. | — | 223,937 | |||||
Senior Notes (Unsecured), payable semi-annually–U.S. Dollar denominated interest rate fixed at 8.875%. Matures June of 2018. | — | 236,410 | |||||
Notes payable, working capital loan, variable interest rate at 2.05%. Matures June 30, 2017, with one-year rollover option. | 7,328 | 6,556 | |||||
Fixed asset loan contract, variable interest rate of 5.78%. Matures June of 2020. | 7,511 | 8,548 | |||||
Other debt | 10,448 | 6,278 | |||||
Total debt (excluding long-term capital leases and deferred finance fees) | 505,287 | 481,729 | |||||
Less deferred financing costs and debt discount | (16,436 | ) | (7,293 | ) | |||
Less current maturities of long term debt and notes payable | $ | (15,928 | ) | $ | (11,966 | ) | |
Total long term debt | 472,923 | 462,470 | |||||
During 2016, 2015 and 2014, the Company recorded $46.2 million, $38.4 million and $36.8 million in interest expense, respectively.
On August 9, 2016, the Company closed on $480 million aggregate principal amount of 9.5% Senior Secured Notes due August 2021 (the "Notes"), which were sold at a price equal to 98.54% of their face value. The Notes will pay interest semi-annually in arrears on February 15 and August 15 of each year beginning on February 15, 2017 and will mature on August 15, 2021, unless earlier redeemed or repurchased.
The Company used the net proceeds from the offering to repay all amounts outstanding under its existing term loan credit facility, to redeem all of its 8.875% Senior Notes due 2018 at a redemption price equal to 102.219% of the principal amount thereof, together with accrued and unpaid interest, to the date of redemption, to pay fees and expenses relating to these transactions, and for working capital and other general corporate purposes.
As of December 31, 2016, an additional $32.7 million was available for additional borrowings under the $55.0 million Revolving Credit and Guaranty Agreement ("ABL Facility"). This availability represents $35.8 million under the ABL revolver that is currently collateralized by certain assets of the Company less $3.1 million of that facility committed for letters of credit or additional borrowings. In addition, the Company had approximately $3.2 million available for borrowings under other small lines of credit.
On May 17, 2013, the Company entered into a Credit and Guaranty Agreement for $200.0 million (increased to$230 million on August 18, 2016) term loan credit facility (the “Term Credit Facility”), net of a discount of $1.0 million, among the Company, certain direct and indirect U.S. subsidiaries of the Company as guarantors and certain financial institutions. This facility was repaid with proceeds from the 9.5% senior secured notes.
On May 17, 2013, the Company also entered into a Revolving Credit and Guaranty Agreement originally for a $40.0 million asset-based revolving credit facility subject to a borrowing base among Xerium Technologies, Inc., as a US borrower, Xerium Canada Inc., as Canadian borrower, certain direct and indirect U.S. subsidiaries of the Company as guarantors and certain financial institutions (the "Domestic Revolver"). On March 3, 2014, the Company entered into an amendment to the Revolving Credit and Guaranty Agreement (as amended, the “old ABL Facility,” and collectively with the Term Credit Facility, the “Credit Facility”), increasing the aggregate availability under the old ABL Facility to $55 million. On November 3, 2015, the Company refinanced the old ABL Facility and entered into the ABL Facility with one of its existing ABL lenders. The amount of the ABL Facility continues to provide aggregate availability of $55 million and the collateral pledged thereunder has remained the same. The ABL Facility matures in November of 2020 and accrues interest at either an Alternative Base rate (Prime plus 75 bps) or Fixed LIBOR (LIBOR +175 bps). As of December 31, 2016 these rates were 4.50% and 2.57%, respectively.
The Indenture and the ABL Facility contain certain customary covenants that, subject to exceptions, restrict our ability to, among other things:
• | declare dividends or redeem or repurchase equity interests; |
63
•prepay, redeem or purchase debt;
• incur liens and engage in sale-leaseback transactions;
• make loans and investments;
• incur additional indebtedness;
•amend or otherwise alter debt and other material agreements;
•engage in mergers, acquisitions and asset sales;
•transact with affiliates; and
•engage in businesses that are not related to the Company's existing business.
On July 17, 2015 (the "Closing Date"), Xerium China, Co., Ltd. ("Xerium China"), a wholly-owned subsidiary of the Company entered into and closed a Fixed Assets Loan Contract (the "Loan Agreement") with the Industrial and Commercial Bank of China Limited, Shanghai-Jingan Branch (the “Bank”) with respect to a RMB 58.5 million loan, which was approximately $9.4 million USD on July 17, 2015. The loan is secured by pledged machinery and equipment of Xerium China and guaranteed by Xerium Asia Pacific (Shanghai) Limited and Stowe Woodward (Changzhou) Roll Technologies Co. Ltd., which are wholly-owned subsidiaries of the Company, pursuant to guarantee agreements (the "Guarantee Agreements"). Interest on the outstanding principal balance of the loan accrues at a benchmark rate plus a margin. The current interest rate at December 31, 2016 is approximately 5.8%. The interest rate will be adjusted every 12 months during the term of the loan, based on the benchmark interest rate adjustment. Interest under the loan is payable quarterly in arrears. Principal on the loan is to be repaid in part every six months following the Closing Date, in accordance with a predetermined schedule set forth in the Loan Agreement. Proceeds of the Loan will be used by Xerium China to purchase production equipment. The Loan Agreement contains certain customary representations and warranties and provisions relating to events of default.
On May 26, 2011, the Company completed a refinancing transaction, which replaced certain of its then outstanding indebtedness with $240 million aggregate principal amount of 8.875% senior unsecured notes. The notes were repaid with proceeds from the 9.5% Senior Secured Notes.
The following table outlines the estimated future interest payments to be made under the Notes, notes payable and other debt over the term of the obligations:
Total Estimated Interest Payments at December 31, 2016 | |||
2017 | $ | 46,958 | |
2018 | 46,311 | ||
2019 | 46,040 | ||
2020 | 45,948 | ||
2021 | 30,655 | ||
2022 and thereafter | 162 | ||
$ | 216,074 | ||
As of December 31, 2016 the carrying value of the Company’s long-term debt was $489.4 million (excluding deferred financing costs) and its fair value was approximately $485.8 million. The Company determined the fair value of its debt utilizing significant other observable inputs (Level 2 of the fair value hierarchy).
Capitalized Lease Liabilities
As of December 31, 2016, the Company had long-term capitalized lease liabilities totaling $19.2 million. These amounts represent the lease on the corporate headquarters and the Kunshan, China facility, as well as other leases for software, vehicles and machinery and equipment. In addition, in April of 2016, the Company entered into sales - lease back arrangements totaling $6.0 million for various machinery and equipment in North America. The proceeds were used to partially fund the Spencer Johnston acquisition, which closed in May of 2016.
64
6. Derivatives and Hedging
Risk Management Objective of Using Derivatives
The Company is exposed to certain risks arising from both its business operations and economic conditions. The Company principally manages its exposures to a wide variety of business and operational risks through management of its core business activities. From time to time, the Company enters into derivative financial instruments to manage exposures that arise from business activities that result in the receipt or payment of future known cash amounts, the value of which are determined by interest rates or foreign exchange rates.
Cash Flow Hedges of Interest Rate Risk
The Company’s objectives when using interest rate derivatives are to add stability to interest expense and to manage its exposure to interest rate movements. To accomplish this objective, the Company may use interest rate caps and interest rate swaps as part of its interest rate risk management strategy. Interest rate caps designated as cash flow hedges protect the Company from increases in interest rates above the strike rate of the interest rate cap. Interest rate swaps designated as cash flow hedges involve the receipt of variable-rate amounts from a counter-party in exchange for the Company making fixed-rate payments over the life of the agreements without exchange of the underlying notional amount. At December 31, 2016, the Company had no open cash flow hedges of interest rate risk as all such contracts settled in 2016.
Non-Designated Hedges of Foreign Exchange Risk
Derivatives not designated as hedges are not speculative and are used to manage the Company’s exposure to foreign exchange rates, but do not meet the strict hedge accounting requirements of Topic 815. Changes in the fair value of derivatives not designated in hedging relationships are recorded directly to earnings.
The Company, from time to time, may enter into foreign exchange forward contracts to fix currencies at specified rates based on expected future cash flows to protect against the fluctuations in cash flows resulting from sales denominated in foreign currencies. Additionally, to manage its cash exposure to fluctuations in foreign currency on intercompany balances and certain purchase commitments, the Company, from time to time, may use foreign exchange forward contracts.
As of December 31, 2016 and 2015, the Company had outstanding derivatives that were not designated as hedges in qualifying hedging relationships. The value of these contracts is recognized at fair value based on market exchange forward rates and is recorded in other liabilities on the Consolidated Balance Sheet. The fair value of these derivatives at December 31, 2016 and 2015 was $(1.5) million and $(1.2) million, respectively. The change in fair value of these contracts is included in foreign exchange loss and was $(2.8) million, $(3.7) million and $(1.7) million for the years ended December 31, 2016, 2015 and 2014, respectively, and is recorded in the Consolidated Statements of Operations.
The following represents the notional amounts sold and purchased for the year ended December 31, 2016:
Foreign Currency Derivative | Notional Sold | Notional Purchased | ||||||
Non-designated hedges of foreign exchange risk | $ | 4,052 | $ | (58,360 | ) | |||
Fair Value of Derivatives Under ASC Topic 820
ASC Topic 820, Fair Value Measurements and Disclosures (“Topic 820”), emphasizes that fair value is a market-based measurement, not an entity-specific measurement. Therefore, a fair value measurement should be determined based on the assumptions that market participants would use in pricing the asset or liability. As a basis for considering market participant assumptions in fair value measurements, Topic 820 establishes a fair value hierarchy that distinguishes between market participant assumptions based on market data obtained from sources independent of the reporting entity (observable inputs that are classified within Levels 1 and 2 of the hierarchy) and the reporting entity’s own assumptions about market participant assumptions (unobservable inputs classified within Level 3 of the hierarchy).
Level 1 inputs utilize quoted prices (unadjusted) in active markets for identical assets or liabilities that the Company has the ability to access. Level 2 inputs are inputs other than quoted prices included in Level 1 that are observable for the asset or liability, either directly or indirectly. Level 2 inputs may include quoted prices for similar assets and liabilities in active markets, as well as inputs that are observable for the asset or liability (other than quoted prices), such as interest rates, foreign exchange rates and yield curves that are observable at commonly quoted intervals. Level 3 inputs are unobservable inputs including fair value of investments that do not have the ability to redeem at net asset value as of the measurement date or during the first quarter following the measurement date. The derivative assets or liabilities are typically based on an entity’s own assumptions, as there is little, if any, market activity. In instances where the determination of the fair value measurement is
65
based on inputs from different levels of the fair value hierarchy, the level in the fair value hierarchy within which the entire fair value measurement falls is based on the lowest level input that is significant to the fair value measurement in its entirety. The Company’s assessment of the significance of a particular input to the fair value measurement in its entirety requires judgment, and the Company considers factors specific to the asset or liability.
To comply with Topic 820, the Company incorporates credit valuation adjustments to appropriately reflect both its own nonperformance risk and the respective counter-party’s nonperformance risk in the fair value measurements. Although the Company has determined that the majority of the inputs used to value its derivatives fall within Level 2 of the fair value hierarchy, the credit valuation adjustments associated with its derivatives utilized Level 3 inputs, such as estimates of current credit spreads to evaluate the likelihood of default by itself and its counter-parties. However, as of December 31, 2016 and December 31, 2015, respectively, the Company assessed the significance of the impact of the credit valuation adjustments on the overall valuation of its derivative positions and has determined that the credit valuation adjustments were not significant to the overall valuation of its derivatives. As a result, the Company determined that its derivative valuations in their entirety were classified in Level 2 of the fair value hierarchy. The Company does not have any derivatives valued using significant unobservable inputs (Level 3) as of December 31, 2016 or 2015. The table below presents the Company’s assets and liabilities measured at fair value on a recurring basis as of December 31, 2016 and 2015, aggregated by the level in the fair value hierarchy within which those measurements fall.
As of December 31, 2016
Liabilities | Total | Quoted Prices in Active Markets for Identical Assets (Level 1) | Significant Other Observables Inputs (Level 2) | Significant Unobservable Inputs (Level 3) | ||||||||||||
Derivatives | $ | (1,461 | ) | $ | — | $ | (1,461 | ) | $ | — | ||||||
Total | $ | (1,461 | ) | $ | — | $ | (1,461 | ) | $ | — | ||||||
As of December 31, 2015
Liabilities | Total | Quoted Prices in Active Markets for Identical Assets (Level 1) | Significant Other Observables Inputs (Level 2) | Significant Unobservable Inputs (Level 3) | ||||||||||||
Derivatives | $ | (1,188 | ) | $ | — | $ | (1,188 | ) | $ | — | ||||||
Total | $ | (1,188 | ) | $ | — | $ | (1,188 | ) | $ | — | ||||||
7. Income Taxes
The components of domestic and foreign (loss) income before the provision for income taxes are as follows:
Year ended December 31, | ||||||||||||
2016 | 2015 | 2014 | ||||||||||
U.S. | $ | (43,041 | ) | $ | (38,240 | ) | $ | (16,311 | ) | |||
Foreign | 30,705 | 47,325 | 39,009 | |||||||||
Total | $ | (12,336 | ) | $ | 9,085 | $ | 22,698 | |||||
The components of the income tax provision (benefit) are as follows:
66
Year ended December 31, | |||||||||
2016 | 2015 | 2014 | |||||||
Current: | |||||||||
U.S. | $ | 929 | $ | 1,196 | $ | 247 | |||
Foreign | 8,134 | 15,054 | 34,690 | ||||||
Total current | 9,063 | 16,250 | 34,937 | ||||||
Deferred: | |||||||||
U.S. | (1,707 | ) | (195 | ) | 330 | ||||
Foreign | 1,926 | (2,590 | ) | (5,187 | ) | ||||
Total deferred | 219 | (2,785 | ) | (4,857 | ) | ||||
Total provision | $ | 9,282 | $ | 13,465 | $ | 30,080 | |||
For the years ended December 31, 2016 and 2015, the provision for income taxes was $9.3 million and $13.5 millions respectively. The Company's effective income tax rate for the year ended December 31, 2016 was (75.2)% as compared with our effective rate for the year ended December 31, 2015 of 148.2%. The Company's effective income tax rate is primarily impacted by income the Company earns in tax paying jurisdictions relative to income it earns in non-tax paying jurisdictions. The majority of income recognized for purposes of computing the Company's effective tax rate is earned in countries where the statutory income tax rates range from 15.0% to 35.4%. The Company generates losses in certain jurisdictions for which it receives no tax benefit as the deferred tax assets in these jurisdictions (including the net operating losses) are fully reserved by a valuation allowance. For this reason, the Company recognizes minimal income tax expense or benefit in these jurisdictions, of which the most material jurisdictions are the United States and Australia. Due to these reserves, the geographic mix of its pre-tax earnings has a direct correlation with how high or low its annual effective tax rate is relative to consolidated earnings.
The provision for income taxes differs from the amount computed by applying the U.S. statutory tax rate (35)% to income before income taxes, due to the following:
Year ended December 31, | |||||||||
2016 | 2015 | 2014 | |||||||
Book income at U.S. 35% statutory rate | $ | (4,318 | ) | $ | 3,180 | $ | 7,944 | ||
State income and other taxes due, net of federal benefit | 1,168 | 1,556 | 1,095 | ||||||
Foreign tax rate differential | (2,305 | ) | (1,927 | ) | (3,110 | ) | |||
Dividends and other foreign (loss) income | 11,233 | 11,079 | (2,922 | ) | |||||
Change in valuation allowance | 4,922 | (544 | ) | 2,084 | |||||
Tax rate changes | 290 | (103 | ) | 454 | |||||
Tax credits and refunds | (91 | ) | (372 | ) | (449 | ) | |||
Change in unrecognized tax benefits and tax reserves | 2,097 | (372 | ) | (136 | ) | ||||
Provision to return adjustments | (1,001 | ) | (68 | ) | (251 | ) | |||
Non-deductible expenses | 2,246 | 1,246 | 1,906 | ||||||
Statute expiration of tax attributes | — | — | (30 | ) | |||||
Other, net | (2,913 | ) | (455 | ) | 259 | ||||
Other foreign permanent items | (2,046 | ) | (314 | ) | — | ||||
Settlement of tax assessments | — | 559 | 23,236 | ||||||
Total | $ | 9,282 | $ | 13,465 | $ | 30,080 | |||
The effective tax rate on continuing operations for the year ended December 31, 2016 varied from the statutory rate of 35% primarily due to the tax effect of intra-period tax allocations, dividends and other foreign income, foreign rate differentials and changes in valuation allowances. Included in the effective tax rate is a benefit of $(2.2) million from the impact on intra-period tax allocations, included in the Other, net line in the table above. Intra-period tax allocation rules require that all items, including other comprehensive income and discontinued operations, be considered for purposes of determining the amount of tax benefit that results from a loss in continuing operations. As a result, an income tax benefit was recorded in continuing operations for the year ended December 31, 2016, with offsets of income tax expense in other comprehensive income. The amount for dividends and other foreign income of $11.2 million was primarily related to residual U.S. taxes provided on foreign earnings no longer considered permanently reinvested. The foreign rate differential arises as a result of income earned
67
in countries where the statutory income tax rates vary from the U.S. statutory rate of 35%, for which Austria creates the Company’s largest tax rate benefit. The change in the valuation allowance is $4.6 million from US and $0.3 million from an increase of pre-tax losses generated in other foreign jurisdictions for which the Company has determined no benefit should be recorded.
The effective tax rate on continuing operations for the year ended December 31, 2015 varied from the statutory rate of 35% primarily due to the tax effect of dividends and other foreign income, foreign rate differentials and changes in valuation allowances. The amount for dividends and other foreign income of $11.1 million was primarily related to residual U.S. taxes provided on foreign earnings no longer considered permanently reinvested. The foreign rate differential arises as a result of income earned in countries where the statutory income tax rates vary from the U.S. statutory rate of 35%, for which Austria creates the Company’s largest tax rate benefit. The change in the valuation allowance of $(0.5) million relates primarily to a decrease in domestic deferred tax assets of $(0.4) million, a removal of a portion of the Australian valuation allowance of $(1.1) million and an increase of pre-tax losses generated in other foreign jurisdictions for which the Company has determined no benefit should be recorded.
The effective tax rate on continuing operations for the year ended December 31, 2014 varied from the statutory rate of 35% primarily due to the tax effect on dividends and other foreign income, foreign rate differentials, settling a tax assessment in Brazil and changes in valuation allowances. The amount for dividends and other foreign income of $(2.9) million was primarily related to residual U.S. taxes provided on foreign earnings no longer considered permanently reinvested. The foreign rate differential arises as a result of income earned in countries where the statutory income tax rates vary from the U.S. statutory rate of 35%, for which Austria creates the Company's largest tax rate benefit. The settlement of a assessment in Brazil also resulted in current tax expense of $23.4 million and utilization of tax attributes of $1,912 and tax deductible interest of $(2.1) million. The change in the valuation allowance of $2.1 million relates primarily to an increase in domestic deferred tax assets of $9.2 million, a removal of a portion of the U.K. holding company valuation allowance of $(6.6) million and approximately $(0.5) million of pre-tax losses generated in foreign jurisdictions for which the Company has determined no benefit should be recorded.
For the years ended December 31, 2016 and 2015, tax expense included a benefit of approximately $32 and $190 for a Chinese tax holiday expired in the year ending December 31, 2016.
The Company utilizes the asset and liability method for accounting for income taxes in accordance with ASC Topic 740, Income Taxes (“Topic 740”). Under Topic 740, deferred tax assets and liabilities are determined based on the difference between their financial reporting and tax basis. The assets and liabilities are measured using the enacted tax rates and laws that will be in effect when the differences are expected to reverse. The Company reduces its deferred tax assets by a valuation allowance if, based upon the weight of available evidence, it is more likely than not that some or all of the deferred tax assets will not be realized. In making this determination, the Company evaluates all available information including the Company’s financial position and results of operations for the current and preceding years, as well as any available projected information for future years.
The tax effect of temporary differences which give rise to deferred income tax assets and liabilities are as follows:
68
Year Ended December 31, | ||||||
2016 | 2015 | |||||
Deferred tax assets arising from: | ||||||
Loss carryforwards | $ | 117,485 | $ | 105,096 | ||
Intangible assets, net | 161 | — | ||||
Pension and other benefit accruals | 14,604 | 14,161 | ||||
Tax credits | 1,488 | 1,421 | ||||
Investments | 2,082 | 3,384 | ||||
Interest and finance fees | 972 | 1,229 | ||||
Other allowances and accruals, net | 10,676 | 11,670 | ||||
Total | 147,468 | 136,961 | ||||
Deferred tax liabilities arising from: | ||||||
Property and equipment, net | 21,096 | 22,906 | ||||
Intangible assets, net | 2,074 | 3,866 | ||||
Foreign income inclusions | 21,243 | 12,615 | ||||
Other allowances and accruals, net | 1,616 | 126 | ||||
Total | 46,029 | 39,513 | ||||
Valuation allowance | 97,859 | 94,330 | ||||
Net deferred tax (asset) liability | $ | (3,580 | ) | $ | (3,118 | ) |
Deferred taxes are recorded as follows in the consolidated balance sheets:
December 31, | ||||||
2016 | 2015 | |||||
Current deferred tax asset, net | $ | — | $ | 4,912 | ||
Current deferred tax liability, net | — | 2,349 | ||||
Non-current deferred tax asset, net | 10,737 | 9,325 | ||||
Non-current deferred tax liability, net | 7,157 | 8,770 | ||||
Net deferred tax (asset) liability | $ | (3,580 | ) | $ | (3,118 | ) |
The Company has adopted ASU 2015-17 prospectively, with all deferred taxes classified as non-current as of December 31, 2016. The Company also adopted ASU 2016-09 in the current year, which resulted in immaterial impacts to the Company's net deferred tax assets. As of December 31, 2016, the Company has pre-tax net operating loss carry-forwards for U.S. federal income tax purposes of approximately $226.4 million that expire on various dates from 2025 through 2036 and federal tax credits of approximately $166 that either expire on various dates or can be carried forward indefinitely. As of December 31, 2016, the Company has pre-tax net operating loss carry-forwards for U.S. state income tax purposes of approximately $225.3 million that expire on various dates from 2017 through 2036. As of December 31, 2016, the U.S. federal and U.S. state net operating loss carry-forwards and federal tax credits are fully reserved in our valuation allowance. The Company has foreign federal net operating loss carry-forwards of approximately $114.3 million and capital loss carry forwards of $7.0 million, the majority of which can be carried forward indefinitely, and federal and provincial tax credits of approximately $1.3 million that begin to expire primarily in 2024 or are carried forward indefinitely. As of December 31, 2016, $57.5 million, $7.0 million and $0.2 million, of foreign federal net operating loss carry-forwards, capital loss carry-forwards and federal and provincial tax credits, respectively, are reserved in our valuation allowance. Historic and future ownership changes could potentially reduce the amount of net operating loss carry-forwards available for use.
As of December 31, 2016, the Company had a valuation allowance in place for certain of its deferred tax assets due to the Company’s accumulated loss position and its uncertainty around the future profitability in certain of its tax jurisdictions. The valuation allowance primarily relates to deferred tax assets for available net operating loss carry forwards in the United States, the U.K., Germany, Sweden, France, Australia, China, Turkey and Spain. While the Company believes it has adequately provided for its income tax assets and liabilities in accordance with Topic 740, it recognizes that adverse determinations by taxing authorities, or changes in tax laws and regulations could have a material adverse effect on its consolidated financial position, results of operations or cash flows.
69
During the year ended December 31, 2016, the Company reassessed its valuation allowance requirements related to specific tax carry-forwards of its Italian operations, evaluating all available evidence in its analysis, both positive and negative, including historical and projected income and losses before the provision for income taxes, as well as reversals of temporary differences. The Company also considered tax planning strategies that are prudent and can be reasonably implemented if needed in order to realize the related tax benefits. During the year ended December 31, 2016, the Company recorded $962 of tax benefits related to the reversal of a portion of its valuation allowance previously established against certain Italian deferred tax assets. The Company believes that the deferred tax assets are more likely than not to be realized based on estimates of future taxable income generated by future earnings of its Italian business.
As the Company continues to reorganize and restructure its operations, it is possible that deferred tax assets, for which no income tax benefit has previously been provided, may more likely than not become realized. The Company continues to evaluate future operations and will record an income tax benefit in the period where it believes it is more likely than not that the deferred tax asset will be able to be realized. The most material unrecognized deferred tax asset relates to the U.S. By 2031, future U.S. earnings ranging between $40 million and $130 million, generated by U.S. earnings from continuing operations or qualified tax planning strategies, would be required in order to fully recognize the U.S. deferred tax asset.
Undistributed earnings of the Company’s foreign subsidiaries amounted to approximately $133.4 million at December 31, 2016. Earnings generated prior to 2013 are considered to be indefinitely reinvested for continued use in foreign operations except for a portion of the earnings generated by our Brazil and China operations. Approximately $9.0 million of unremitted earnings in Brazil generated before 2013 are considered permanently reinvested to support local debt obligations, meet capital expenditures and reinvest in the operations. All earnings generated prior to 2013 related to our Mexico operations have been distributed for U.S. income tax purposes. All earnings generated in all foreign subsidiaries for 2013 through 2016 are not considered to be permanently reinvested, because of our desire to manage global cash and liquidity related to ongoing financial obligations, capital expenditures, restructuring payments and other changes in business conditions going forward. The amount of undistributed earnings not considered to be permanently reinvested, for which we have recorded a deferred tax liability, is $109.1 million. U.S. Federal income taxes and foreign withholding taxes are provided on the portion of the income of foreign subsidiaries that is expected to be remitted to the United States and be taxable. For the earnings generated prior to 2013 considered to be indefinitely reinvested, no provision for U.S. income taxes or foreign withholding taxes has been provided. Upon distribution of those earnings in the form of dividends or otherwise, the Company may be subject to both U.S. income taxes and foreign withholding taxes payable to the various jurisdictions. The earnings that are considered indefinitely reinvested relate to on-going operations and were approximately $24.4 million as of December 31, 2016.
The Company accrues for certain known and reasonably anticipated income tax obligations after assessing the likely outcome. In the event that actual results differ from these accruals or if the Company becomes subject to a tax obligation for which the Company has made no accrual, the Company may need to make adjustments, which could materially impact the financial condition and results of operations. For example, taxing authorities may disagree with the Company’s tax accounting methodologies and may subject the Company to inquiries regarding such taxes, which potentially could result in additional income tax assessments. In accordance with ASC 740-10-25-6, the Company does not accrue for potential income tax obligations if management deems a particular tax position, based solely on its technical merits, is more likely than not to be sustained upon examination. In making this determination, the Company assumes that the taxing authorities will have access to all relevant facts and information in accordance with ASC 740-10-25-7.
As of December 31, 2016, the Company had a gross unrecognized tax benefit of $9.3 million, exclusive of interest and penalties. The unrecognized tax benefit increased by approximately $1.8 million and $25 during the years ended December 31, 2016 and 2015, respectively. The unrecognized tax benefit increased primarily as a result of transfer pricing positions taken in a foreign jurisdiction in prior periods.
A reconciliation of the balances of the unrecognized tax benefits is as follows, excluding interest and penalties:
Year Ended December 31, | |||||||||
2016 | 2015 | 2014 | |||||||
Balance as of January 1 | $ | 7,527 | $ | 7,502 | $ | 7,492 | |||
Gross decreases-tax positions in prior period due to settlements | — | — | (286 | ) | |||||
Gross increases (decreases)-tax positions in prior period-other | 849 | (104 | ) | 100 | |||||
Gross decreases-related to lapse in statute of limitations | (115 | ) | (209 | ) | (251 | ) | |||
Gross increases-tax positions in current period | 1,046 | 688 | 911 | ||||||
Currency effects | (22 | ) | (350 | ) | (464 | ) | |||
Balance at December 31 | $ | 9,285 | $ | 7,527 | $ | 7,502 | |||
70
The Company’s policy is to recognize interest and penalties related to income tax matters as income tax expense, and accordingly, the Company recorded a $890 expense, including currency effects, and a $451 benefit, including currency effects, for interest and penalties during the years ended December 31, 2016 and 2015, respectively. As of December 31, 2016 and 2015, the Company had accrued interest and penalties related to uncertain tax positions of approximately $1.7 million and $0.8 million, respectively. If the Company were to prevail on all unrecognized tax benefits recorded, approximately $5.8 million would benefit the effective tax rate. During the next twelve months, management estimates a range between $0 and $168 of the Company's gross unrecognized tax benefit will reverse due to expected settlements and statute of limitations expiring which relate to various items and will benefit the effective tax rate. The Company regularly evaluates, assesses and adjusts the related liabilities in light of changing facts and circumstances, which could cause the effective tax rate to fluctuate from period to period.
The tax years 2005 through 2016 remain open to examination in the Company's U.S. Federal jurisdiction, and the tax years 2002 through 2016 remain open to examination in the Company's U.S. state jurisdictions. The tax years 2006 through 2016 remain open to examination in the major foreign tax jurisdictions to which the Company and its subsidiaries are subject. There are currently no U.S. Federal audits or examinations underway. The Company has ongoing audits or tax litigation in Italy. During 2016, tax audits related to Mauritius and the state of New York were closed, with no significant changes.
The Company believes that it has made adequate provisions for all income tax uncertainties.
8. Pensions and Other Post Retirement Benefits
Pension Plans
The Company accounts for its pensions, other post-retirement and post-employment benefit plans in accordance with ASC Topic 715, Compensation—Retirement Benefits (“Topic 715”). The Company has defined benefit pension plans covering substantially all of its U.S. and Canadian employees and employees of certain subsidiaries in other countries. Benefits are generally based on the employee’s years of service and compensation. These plans are funded in conformity with the funding requirements of applicable government regulations.
The Company does not fund certain plans, as funding is not required. Approximately $43.1 million of the total underfunded status of $64.8 million and $43.3 million of the total underfunded status of $62.8 million relate to these unfunded pension plans as of December 31, 2016 and 2015, respectively. The Company plans to continue to fund its U.S. defined benefit plans to comply with the Pension Protection Act of 2006. In addition, the Company also intends to fund its U.K. and Canadian defined benefit plans in accordance with local regulations. Additional discretionary contributions are made when deemed appropriate to meet the long-term obligations of the plans.
In accordance with the provisions of Topic 715, the measurement date for defined benefit plans is December 31.
Benefit Obligations and Plan Assets
A summary of the changes in benefit obligations and plan assets as of December 31, 2016 and 2015 is presented below.
71
Defined Benefit Plans | |||||||||
2016 | 2015 | ||||||||
Change in benefit obligation | |||||||||
Benefit obligation at beginning of year | $ | 149,108 | $ | 178,165 | |||||
Service cost | 1,668 | 3,256 | |||||||
Interest cost | 5,133 | 5,656 | |||||||
Plan participants’ contributions | 22 | 93 | |||||||
Actuarial loss (gain) | 15,583 | (10,177 | ) | ||||||
Currency translation impact | (7,796 | ) | (10,237 | ) | |||||
Administrative expenses paid | (191 | ) | (234 | ) | |||||
Settlement/curtailment | (2,700 | ) | (9,456 | ) | |||||
Benefits paid | (7,571 | ) | (7,958 | ) | |||||
Benefit obligation at end of year | 153,256 | 149,108 | |||||||
Change in plan assets | |||||||||
Fair value of plan assets at beginning of year | 86,313 | 97,480 | |||||||
Actual return on plan assets | 9,789 | 755 | |||||||
Employer contributions | 5,460 | 6,700 | |||||||
Plan participants’ contributions | 22 | 93 | |||||||
Settlement/curtailment | — | (4,825 | ) | ||||||
Administrative expenses paid | (191 | ) | (234 | ) | |||||
Currency translation impact | (5,354 | ) | (5,698 | ) | |||||
Benefits paid | (7,571 | ) | (7,958 | ) | |||||
Fair value of plan assets at end of year | 88,468 | 86,313 | |||||||
Funded status (1) | $ | (64,788 | ) | $ | (62,795 | ) | |||
(1) | In accordance with Topic 715, $3.1 million and $3.0 million of this amount is recorded in accrued expenses as of December 31, 2016 and 2015, respectively. |
All of the Company’s pension plans that comprise the pension obligation amounts above have a projected benefit obligation equal to or in excess of plan assets as of the years ended December 31, 2016 and 2015. The accumulated benefit obligation was $150.0 million and $144.2 million as of the years ended December 31, 2016 and 2015, respectively.
Information for pension plans with an accumulated benefit obligation in excess of plan assets is as follows:
December 31, | ||||||||
2016 | 2015 | |||||||
Projected benefit obligation | $ | 153,256 | $ | 149,108 | ||||
Accumulated benefit obligation | $ | 150,005 | $ | 144,231 | ||||
Fair value of plan assets | $ | 88,468 | $ | 86,313 | ||||
72
Components of Net Periodic Benefit Cost
Defined Benefit Plan | |||||||||||||
2016 | 2015 | 2014 | |||||||||||
Service cost | $ | 1,668 | $ | 3,256 | $ | 3,532 | |||||||
Interest cost | 5,133 | 5,656 | 6,483 | ||||||||||
Expected return on plan assets | (5,383 | ) | (6,221 | ) | (6,156 | ) | |||||||
Settlement losses | — | 1,108 | — | ||||||||||
Amortization of net loss | 1,949 | 2,139 | 1,124 | ||||||||||
Net periodic benefit cost | $ | 3,367 | $ | 5,938 | $ | 4,983 | |||||||
The total unrecognized net loss recorded in Other Comprehensive Loss at December 31, 2016 is $42.9 million. For defined benefit plans, the estimated net loss and prior service cost to be amortized from accumulated other comprehensive loss during 2017 is expected to be $2.1 million and $0, respectively.
Additional Information | Defined Benefit Plans | ||||||||
2016 | 2015 | ||||||||
Change in funded status included in accumulated other comprehensive loss, net of tax | $ | 3,687 | $ | (11,057 | ) | ||||
Assumptions
Weighted-average assumptions used to determine benefit obligations at December 31 are as follows:
Defined Benefit Plans | |||||||
2016 | 2015 | ||||||
Discount rate | 3.10 | % | 3.67 | % | |||
Rate of compensation increase | 3.47 | % | 3.50 | % | |||
Weighted-average assumptions used to determine net periodic benefit cost for years ended December 31 are as follows:
Defined Benefit Plans | |||||||
2016 | 2015 | ||||||
Discount rate | 3.67 | % | 3.40 | % | |||
Expected long-term return on plan assets | 6.42 | % | 6.62 | % | |||
Rate of compensation increase | 3.50 | % | 3.64 | % | |||
The expected long-term return on plan assets is calculated based on a building-block approach, whereby the components are weighted based on the long-term allocation of pension plan assets.
Plan Assets
The percentage of fair value of total plan assets for funded plans are invested as follows:
Plan Assets at December 31, | ||||||
Asset Category | 2016 | 2015 | ||||
Marketable equities | 56 | % | 54 | % | ||
Fixed income securities | 44 | % | 46 | % | ||
Total | 100 | % | 100 | % | ||
73
The Company’s plan assets are invested in the U.S., the U.K. and Canada. Plan asset investments are accounted for at cost on the trade date and are reported at fair value, using the net asset value per share practical expedient. Canadian plan assets totaling $24.6 million, U.K. plan assets totaling $30.9 million and U.S. plan assets totaling $32.9 million are classified as Level 2 within the fair value hierarchy. Level 2 valuations are based on quoted prices in active markets for instruments that are similar, or quoted prices in markets that are not active for identical or similar instruments and model-derived valuations in which all significant inputs and significant value drivers are observable in active markets.
In general, plan assets are exposed to various risks, such as interest rate risk, credit risk, and overall market volatility. Due to the level of risk associated with certain investments, it is reasonably possible that changes in the values of investments will occur in the near term and that such changes could materially affect the amounts reported in the plan assets. The investment objective of the plans is to maximize the return on plan assets over a long time horizon, while meeting the plan obligations. Investment risk is substantially reduced by diversification of investments within particular asset classes. The expected future rate of return on plan assets is based on historic performance of bonds and equities and the higher returns expected by equity-based capital relative to debt capital. The agreements with the fund managers include a number of restrictions which are designed to ensure that only suitable investments are held. Generally, investment performance is provided to and reviewed by the Company on a quarterly basis. If any changes take place in the legal, regulatory or tax environment which impact the investment of the portfolios or the investment returns, the fund manager is expected to notify the Company immediately and to advise on their anticipated impact.
Details relating to the Company’s plan assets are as follows:
U.S. Plan Assets: Approximately 88% of the Company’s U.S. plan assets are invested in the U.S., of which 52% are invested in marketable equity securities and 48% are invested in fixed income securities managed by the fund manager. This allocation is in accordance with the strategic allocation adopted by the Company’s pension committee comprising of approximately 50% equity investment and 50% bond investment.
U.K. Plan Assets: Approximately 70% of the Company’s U.K. plan assets are invested in the U.K., of which 29% are invested in marketable equity securities and 71% are invested in fixed income securities managed by the fund manager. The trustees of the U.K. pension plan have adopted a strategic allocation comprising of 50% equity investment and 50% bond investment.
Canadian Plan Assets: Approximately 57% of the Company’s Canadian plan assets are invested in Canada, of which 46% are invested in marketable equity securities, 54% are invested in fixed income securities managed by the fund manager. The Company’s pension committee has adopted a strategic allocation comprising of approximately 65% equity investment and 35% bond investment.
Contributions and Benefit Payments
The Company expects to make contributions and benefit payments of approximately $5,850 under its defined benefit plans in 2017.
Estimated Future Benefit Payments
The following benefit payments, which reflect expected future service, as appropriate, are expected to be paid:
Defined Benefit Plans | |||||
2017 | $ | 13,403 | |||
2018 | 6,226 | ||||
2019 | 6,331 | ||||
2020 | 6,557 | ||||
2021 | 7,578 | ||||
Years 2022 and thereafter | 36,530 | ||||
The Company sponsors various unfunded defined contribution plans that provide for retirement benefits to employees, some in accordance with local government requirements. The Company also maintains a funded retirement savings plan for U.S. employees which is qualified under Section 401(k) of the U.S. Internal Revenue Code. The plan allows eligible employees to contribute up to 99% of their compensation (subject to certain Internal Revenue Service limitations), with the Company matching 100% of the first 3% of employee compensation and 50% of the next 2% of employee compensation. The following represents the approximate matching contribution expense for the years ended December 31, 2016, 2015 and 2014:
74
Year ended December 31, | ||||||||||||
2016 | 2015 | 2014 | ||||||||||
Matching contribution expense | $ | 1,590 | $ | 1,333 | $ | 1,420 | ||||||
9. Commitments and Contingencies
Leases
The Company leases office buildings, vehicles and computer equipment for its worldwide operations. Minimum rent is expensed on a straight-line basis over the term of the leases. Operating lease rental expense was $2.4 million, $3.2 million and $4.7 million during the years ended December 31, 2016, 2015 and 2014, respectively. These leases expire at various dates through 2023. At December 31, 2016, future minimum rental payments due under non-cancelable operating leases were as follows:
2017 | $ | 1,606 | |
2018 | 1,389 | ||
2019 | 1,241 | ||
2020 | 904 | ||
2021 | 899 | ||
Thereafter | 996 | ||
Total minimum operating lease payments | $ | 7,035 | |
The Company entered into a capitalized lease during 2013 for its corporate headquarter location and entered into various machinery and equipment capitalized leases in 2015 and 2016. Additionally, in 2016, the Company commenced a $7.5 million capital lease for its Kunshan machine clothing operating facility. These leases expire at various dates through 2024.
2017 | $ | 6,160 | |
2018 | 5,211 | ||
2019 | 4,259 | ||
2020 | 2,192 | ||
2021 | 1,124 | ||
Thereafter | 12,792 | ||
Total minimum capital lease payments | $ | 31,738 | |
Collective Bargaining and Union Agreements
Approximately 68% of the Company’s employees either are subject to various collective bargaining agreements or are members of trade unions, employee associations or workers councils predominantly outside of the United States. Approximately 4.7% of those employees subject to collective bargaining agreements, or 3.2% of the Company’s total employees, are covered by agreements that are set to expire during 2017.
Legal Proceedings
The Company and its subsidiaries are involved in various legal matters, which have arisen in the ordinary course of business as a result of various labor claims, taxing authority reviews and other legal matters. As of December 31, 2016, the Company had accrued an immaterial amount in its financial statements for these matters for which (1) management believed the possibility of loss was either probable or possible and (2) was able to estimate the damages. These estimates have been developed in consultation with counsel and are based upon an analysis of potential results, assuming a combination of litigation
75
and settlement strategies. It is possible, however, that future results of operations for any particular period could be materially affected by changes in the Company’s assumptions or the effectiveness of our strategies related to these proceedings.
Environmental Matters
The Company’s operations and facilities are subject to a number of national, state and local laws and regulations protecting the environment and human health in the United States and foreign countries that govern, among other things, the handling, storage and disposal of hazardous materials, discharges of pollutants into the air and water and workplace safety. Because of the Company’s operations, the history of industrial uses at some of these facilities, the operations of predecessor owners or operators of some of the businesses, and the use and release of hazardous substances at these sites, the liability provisions of environmental laws may affect the Company. The Company is not aware of any material unasserted claims.
The Company believes that any additional liability in excess of amounts provided which may result from the resolution of such matters will not have a material adverse effect on the financial condition, liquidity or cash flow of the Company.
10. Stock-Based Compensation and Stockholders’ Deficit
The Company records stock-based compensation expense in accordance with ASC Topic 718, Accounting for Stock Compensation ("Topic 718") and has used the straight-line attribution method to recognize expense for time-based restricted stock units ("RSUs") and deferred stock units ("DSUs") and recognizes expense for the performance and market-based restricted stock units based on management's estimate of performance against the targets in each plan. The Company recorded stock-based compensation expense during the years ended December 31, 2016, 2015 and 2014 as follows:
For the Years Ended December 31, | |||||||||||
2016 | 2015 | 2014 | |||||||||
RSU and DSU Awards (1) | $ | 2,240 | $ | 2,740 | $ | 2,176 | |||||
Other Awards (2) | 372 | 558 | 372 | ||||||||
Total | $ | 2,612 | $ | 3,298 | $ | 2,548 | |||||
(1) | Related to RSUs and DSUs awarded to certain employees and non-employee directors. |
(2) | This amount relates to options awarded on August 15, 2012 to the Chief Executive Officer. |
The related tax impact on stock-based compensation was a tax benefit of $21, $26 and $28 for the years ended December 31, 2016, 2015 and 2014, respectively.
Long-Term Incentive Program—2016 LTIP
On May 4, 2016, the Board of Directors approved the 2016 - 2018 Long-Term Incentive Plan (the “2016 - 2018 LTIP”) under the 2010 Equity Incentive Plan (the “2010 Plan”). Awards under the 2016 - 2018 LTIP are time-based, performance-based and market-based. A specific target share award has been set for each participant in the 2016 - 2018 LTIP. Awards will be paid in the form of shares of common stock of the Company, as described below:
• | 182,190 Time-based awards, or 35% of the total target award for each participant, have been granted in the form of time-based restricted stock units under the Company’s 2010 Plan. The time-based restricted stock units vest on the third anniversary of the date of grant. |
• | 338,354 Performance-based and Market-based awards, 65% of the total target award for each participant, have been granted in the form of performance-based stock units under the 2010 Plan. Of these units, one third will vest based on the financial performance of the Company as measured by Adjusted EBITDA, one third will vest based on the free cash flow of the Company and the other one third will vest based on the stock price performance of the Company. |
• | On August 2, 2016 an additional amount of 8,562 time-based awards and 15,900 performance based awards were granted under the 2016-2018 LTIP. |
Half of the performance-based stock units whose vesting is subject to the financial performance of the Company (the “financial stock units”) will vest based on the degree to which the Company achieves a targeted three-year cumulative Adjusted EBITDA metric, adjusted for currency fluctuations, over the performance period of January 1, 2016 through December 31, 2018. Financial stock units that vest will convert into shares of the Company’s common stock and be paid after the close of a three-year performance period. The amount of units that vest will range from 50% to 200% of the employee's total financial
76
stock units. Upon attainment of cumulative Adjusted EBITDA equal to 90% or less of the targeted Adjusted EBITDA, none of the financial stock units will vest. Upon attainment of more than 90% of the targeted Adjusted EBITDA, the financial stock units will begin vesting on a straight-line basis from 50% of the financial stock units at 90% of the targeted Adjusted EBITDA to 100% of the financial stock units at 100% of the targeted Adjusted EBITDA, up to a maximum payout of 200% of the financial stock units at 110% of the targeted Adjusted EBITDA.
Half of the performance-based stock units whose vesting is subject to the financial performance of the Company (the “financial stock units”) will vest based on the degree to which the Company achieves a targeted three-year cumulative Free Cash Flow metric, adjusted for currency fluctuations, over the performance period of January 1, 2016 through December 31, 2018. Financial stock units that vest will convert into shares of the Company’s common stock and be paid after the close of a three-year performance period. The amount of units that vest will range from 50% to 200% of the employee's total financial stock units. Upon attainment of cumulative Free Cash Flow equal to 88% or less of the targeted Free Cash Flow, none of the financial stock units will vest. Upon attainment of more than 88% of the targeted Free Cash Flow, the financial stock units will begin vesting on a straight-line basis from 50% of the financial stock units at 88% of the targeted Free Cash Flow to 100% of the financial stock units at 100% of the targeted Free Cash Flow, up to a maximum payout of 200% of the financial stock units at 113% of the targeted Free Cash Flow.
The market-based stock units whose vesting is subject to stock price performance of the Company (the “market-based stock units”) will vest based on the Company's total stock price change (plus dividends) over the three-year performance period of May 4, 2016 through May 4, 2019 (“TSR”) relative to the TSR over the same performance period of companies listed on the S&P Global Small Cap Index on the third anniversary of the grant date, or May 4, 2019. Market-based stock units that vest will convert into shares of the Company’s common stock and will be paid after the third anniversary of the grant date, or May 4, 2019. The amount of units that vest will range from 50% to 200% of the employee's total market-based stock units. If the Company’s TSR over the performance period is less than the 35th percentile TSR of companies in the S&P Global Small Cap Index, then no market-based units will vest. If the Company’s TSR over the performance period is equal to the 35th percentile TSR of the companies in the S&P Global Small Cap Index, then 50% of the market-based stock units will vest. Full payout at 100% of the market-based stock units will be made if the Company’s TSR over the performance period is equal to the 55th percentile TSR of companies in the S&P Global Small Cap Index and payout of 200% of the market-based stock units made if the Company's TSR over the performance period is equal to the 75th percentile TSR of companies in the S&P Global Small Cap Index. TSR performance between the 35th and 75th percentile TSR of companies in the S&P Global Small Cap Index will result in an interpolated payout percentage of the market-based stock units between 50% and 200%.
Subject to early acceleration and payment under certain circumstances consistent with the terms of the Company’s 2016 - 2018 LTIP and LTIP Share Agreement thereunder, delivery of shares of common stock underlying the time-based, performance-based and market-based awards that become vested are subject to the participant’s continued service to the Company through May 4, 2019.
Long-Term Incentive Program—2015 LTIP and 2014 LTIP
Long-Term Incentive Program—2015 LTIP
On March 2, 2015, the Board of Directors approved the 2015-2017 Long-Term Incentive Plan (the “2015 - 2017 LTIP”) under the 2010 Equity Incentive Plan (the “2010 Plan”). Awards under the 2015 - 2017 LTIP are time-based, performance-based and market-based. A specific target share award has been set for each participant in the 2015-2017 LTIP. Awards will be paid in the form of shares of common stock of the Company, as described below:
• | 52,601 time-based awards, or 35% of the total target award for each participant, have been granted in the form of time-based restricted stock units under the Company’s 2010 Plan. The time-based restricted stock units vest on the third anniversary of the date of grant. |
• | 97,681 performance-based and market-based awards, 65% of the total target award for each participant, have been granted in the form of performance-based stock units under the 2010 Plan. Of these units, half will vest based on the financial performance of the Company and the other half will vest based on the stock price performance of the Company. |
The performance-based stock units whose vesting is subject to the financial performance of the Company (the “financial stock units”) will vest based on the degree to which the Company achieves a targeted three-year cumulative Adjusted EBITDA metric, adjusted for currency fluctuations, over the performance period of January 1, 2015 through December 31, 2017. Financial stock units that vest will convert into shares of the Company’s common stock and be paid after the close of
77
a three-year performance period. The amount of units that vest will range from 0% to 100% of the employee's total financial stock units. Upon attainment of cumulative Adjusted EBITDA equal to 80% or less of the targeted Adjusted EBITDA, none of the financial stock units will vest. Upon attainment of more than 80% of the targeted Adjusted EBITDA, the financial stock units will begin vesting on a straight-line basis from 0% of the financial stock units at 80% of the targeted Adjusted EBITDA to 100% of the financial stock units at 100% of the targeted Adjusted EBITDA, up to a maximum payout of 100% of the financial stock units.
The market-based stock units whose vesting is subject to stock price performance of the Company (the “market-based stock units”) will vest based on the Company's total stock price change (plus dividends) over the three-year performance period of March 2, 2015 through March 2, 2018 (“TSR”) relative to the TSR over the same performance period of companies listed on the S&P Global Small Cap Index on the third anniversary of the grant date, or March 2, 2018. Market-based stock units that vest will convert into shares of the Company’s common stock and will be paid after the third anniversary of the grant date, or March 2, 2018. The amount of units that vest will range from 0% to 100% of the employee's total market-based stock units. If the Company’s TSR over the performance period is less than the 35th percentile TSR of companies in the S&P Global Small Cap Index, then no market-based units will vest. If the Company’s TSR over the performance period is equal to the 35th percentile TSR of the companies in the S&P Global Small Cap Index, then 50% of the market-based stock units will vest. Full payout at 100% of the market-based stock units will be made if the Company’s TSR over the performance period is equal to the 55th percentile TSR of companies in the S&P Global Small Cap Index. TSR performance between the 35th and 55th percentile TSR of companies in the S&P Global Small Cap Index will result in an interpolated payout percentage of the market-based stock units between 50% and 100%.
Long-Term Incentive Program—2014 LTIP
On May 8, 2014, the Board approved the granting of awards under the 2014 Executive Long-Term Incentive Plan (the "2014 Executive LTIP") under the 2010 Plan. Awards under the 2014 Executive LTIP are time-based, performance-based and market-based and will be paid in the form of RSUs or shares of common stock of the Company. Time-based awards, or 35% of the total award, were granted in the form of 60,339 time-based RSUs under the Company’s 2010 Plan. These time-based awards will cliff vest on May 8, 2017, and will be converted to common stock, net of applicable tax withholdings.
The performance-based awards, which constitute 32.5% of the total award, were granted in the form of 56,029 performance-based RSUs under the Company’s 2010 Plan. These awards will vest based on a targeted Adjusted EBITDA performance. The targeted Adjusted EBITDA performance portion of the award measures the Company’s performance against a three-year cumulative Adjusted EBITDA metric, adjusted for currency fluctuations during the term of the 2014 – 2016 Executive LTIP. These awards will convert into shares of the Company’s common stock and be paid after the close of a three-year performance period of January 1, 2014 through December 31, 2016. The amount of the payment will range from 0% to 100% of the employee's total Adjusted EBITDA performance shares. Upon attainment of cumulative Adjusted EBITDA equal to 80% or less of the target, none of the Adjusted EBITDA performance shares will vest. Upon attainment of more than 80% of the target, the adjusted EBITDA performance shares will begin vesting on a straight-line basis from 0% at 80% of the target to 100% at 100% of the target, up to a maximum payout of 100% of the Adjusted EBITDA performance shares.
The market-based awards, which constitute 32.5% of the total award, were granted in the form of 56,029 market-based RSU's under the Company's 2010 Plan. These awards will vest, based on the performance of the Company's common stock against the performance of listed companies on the S&P Global Small Cap Index, on the third anniversary of the grant date, or May 8, 2017. These awards will convert into shares of the Company’s common stock and be paid after the close of the three-year performance period of May 8, 2014 through May 8, 2017. The shares that may vest will be up to 100%, with a lower threshold of a a 50% payout for 35th percentile performance and full payout at 100% for 55th percentile performance. Performance between the 35th and 55th percentile performance will result in an interpolated payout percentage between 50% and 100%.
During the year ended December 31, 2016, based on the current financial performance and current stock price of the Company, management performed a valuation on the performance-based stock units, and determined the estimated payout to be 53.8%, or 24,100 shares and 53.8%, or 27,224 shares for the performance-based stock units under the 2015 and 2014 LTIP plans, respectively.
During the year ended December 31, 2016, based on the current stock price of the Company, management performed a valuation on the market-based stock units, and determined the estimated payout to be at 0% under both the 2015 and 2014 LTIP plans, and reduced stock compensation by $0.2 million in accordance with ASC Topic 718, Compensation—Stock Compensation.
78
Long-Term Incentive Program—2013 LTIP
Awards under the 2013 LTIP vested on March 15, 2016, and were converted to 207,385 shares of common stock, net of withholdings.
Directors’ Deferred Stock Unit Plan
Under the 2011 non-management directors stock plan ("2011 DSU Plan”), as amended in January of 2015, each director receives an annual retainer of $132, to be paid on a quarterly basis in arrears. Approximately 54% of the annual retainer is payable in DSUs, with the remaining 46% payable in cash or a mix of both cash and DSUs at the election of each director. The non-management directors were awarded an aggregate of 74,663 DSUs under the 2011 DSU Plan for service during the year ended December 31, 2016. In addition, in accordance with the 2011 DSU Plan, as amended in January of 2015, 63,044 DSUs were settled in common stock during the year ended December 31, 2016. In addition, in March of 2016, 22,234 DSU's were settled in common stock in connection with the retirement of a director in September of 2015.
Other Stock Compensation Plans
On August 15, 2012, the Company granted Harold Bevis, the Company's CEO, an award of 204,208 restricted stock units and options to acquire 781,701 shares of the Company's common stock, par value $0.001 per share. Both the restricted stock units and the options vested over a three year period, with the first, second, and third tranches having vested on August 15, 2014, 2015, and 2016, respectively. The options have a 10-year term and exercise price of $4.00 per share, the August 15, 2012 closing price of the Company's common stock on the New York Stock Exchange. On August 15, 2016, one third of Mr. Bevis's restricted stock units and options vested. Mr. Bevis received 35,539 shares of common stock, net of withholdings as a result of the restricted stock unit vesting. In addition, Mr. Bevis exercised his vested options, and received 68,106 shares of common stock, in a cashless exercise, net of withholdings. This compensation plan has been completed, and Mr. Bevis exercised all of his options to purchase stock.
A summary of RSUs outstanding as of December 31, 2016 and their vesting dates is as follows.
Plan Description | Remaining Vesting Dates | Number of RSUs | |||
DSUs | Vested immediately upon grant, on a quarterly basis | 64,596 | |||
Executive time-based RSUs granted during 2014 | March 10, 2017 | 54,506 | |||
Executive market and performance based RSUs granted during 2014 | March 10, 2017 | 101,225 | |||
Executive time-based RSUs granted during 2015 | March 2, 2018 | 48,217 | |||
Executive market and performance based RSUs granted during 2015 | March 2, 2018 | 89,541 | |||
Executive time-based RSUs granted during 2016 | May 5, 2019 and August 2, 2019 | 180,478 | |||
Executive market and performance based RSUs granted during 2016 | May 5, 2019 and August 2, 2019 | 335,174 | |||
873,737 | |||||
79
RSU activity during years ended December 31, 2014, 2015 and 2016, are presented below.
Number of RSUs | Price Range of Grant- Date Fair Value Per RSU | Weighted Average Grant-Date Fair Value Price Per RSU | ||||||||
Outstanding, December 31, 2013 | 697,604 | $4.04 – $21.69 | $ | 6.57 | ||||||
Granted | 176,118 | 12.00 – 15.05 | 12.06 | |||||||
Forfeited | (702 | ) | 4.07 – 21.69 | 3.71 | ||||||
Issued or withheld for tax withholding purposes | (134,296 | ) | 4.07 – 21.69 | 5.18 | ||||||
Outstanding, December 31, 2014 | 738,724 | 4.04 – 21.69 | 8.61 | |||||||
Granted | 181,831 | 9.71 – 15.97 | 14.93 | |||||||
Forfeited | (282 | ) | 8.25 | 8.25 | ||||||
Issued or withheld for tax withholding purposes | (104,917 | ) | 4.04 – 9.71 | 5.35 | ||||||
Outstanding, December 31, 2015 | 815,356 | 4.04 – 15.97 | 10.93 | |||||||
Granted | 619,669 | 5.02 – 7.95 | 5.24 | |||||||
Forfeited | (40,468 | ) | 5.02 – 15.97 | 7.94 | ||||||
Issued or withheld for tax withholding purposes | (520,820 | ) | 2.90 – 15.97 | 8.62 | ||||||
Outstanding, December 31, 2016 | 873,737 | 2.90 – 24.05 | 8.40 | |||||||
Exercisable, December 31, 2016 (1) | 64,596 | $2.90 – $24.05 | $ | 9.81 | ||||||
(1) | The Company had 64,596 non-employee director DSUs that have vested, but have not yet been converted to common stock. These DSUs have a weighted average grant-date fair value price per share of $9.81 and a total grant-date fair value of $635. As the non-employee director can elect to defer the receipt of these DSUs until six months following their retirement from the Board of Directors, there is no definite weighted average life of these DSUs. |
Assumptions
In accordance with Topic 718, the Company uses the following assumptions in determining compensation expense:
Grant-Date Fair Value
The Company calculates the grant-date fair value of time-based RSUs, performance-based RSUs and non-employee directors’ DSUs based on the closing price of the Company’s common stock on the date of grant.
Forfeitures
As the time-based and performance-based RSUs require continued employment or service up to the time of vesting, the amount of stock-based compensation recognized during a period is required to include an estimate of forfeitures. No estimate of forfeitures has been made for RSUs and DSU’s awarded to non-employee directors because they vest immediately upon grant. Topic 718 requires forfeitures to be estimated at the time of grant and revised, if necessary, in subsequent periods if actual forfeitures differ from those estimates. The term “forfeitures” is related to employee attrition and based on a historical analysis of its employee turnover. This analysis is re-evaluated quarterly and the forfeiture rate will be adjusted as necessary. Ultimately, the actual expense recognized over the vesting period will be only for those shares that meet the requirements of continued employment up to the time of vesting. As of December 31, 2016, the forfeiture rates for the 2014, 2015 and 2016 plans are estimated at 0%.
As of December 31, 2016, there was approximately $2.5 million of total unrecognized compensation expense related to un-vested share-based awards which is expected to be recognized over a weighted average period of 2.05 years.
Dividends
The Company’s Indenture to the Notes and ABL Facility generally prohibit the payment of dividends and accordingly, no such payments were made during the years ended December 31, 2016 and 2015.
11. Restructuring Expense
Restructuring expense included in the Company’s statements of operations are the result of its long-term strategy to reduce production costs and improve long-term competitiveness. Restructuring and impairments expense consists principally of
80
severance costs related to reductions in work force and of facility costs and impairments of assets principally related to closing facilities and/or the relocation of production to another facility. Impairment amounts for assets held for sale reflect estimated selling prices less costs to sell and are considered to be a Level 2 within the fair value hierarchy. Facility costs are principally comprised of costs to relocate assets to the Company’s other facilities, operating lease termination costs and other associated costs.
During 2016, the Company incurred restructuring expenses of $10.4 million, a decrease of $(4.2) million, or (28.8)% from $14.6 million in 2015. These included $1.8 million of charges related to the closure of the Middletown, VA facility and $8.6 million of charges related to headcount reductions and other costs relating to previously announced plant closures.
During 2015, we incurred restructuring expenses of $14.6 million. These included $4.4 million of charges related to the closure of the Joao Pessoa, Brazil clothing facility; $4.9 million of charges related to the closure of the Warwick, Canada machine clothing facility; and $6.4 million of charges relating to headcount reductions, and other costs relating to previously announced plant closures. The costs were partially offset by a gain of $1.1 million on the sale of the Joao Pessoa, Brazil machine clothing facility in the fourth quarter of 2015.
During 2014, the Company incurred restructuring expenses of $18.1 million. These charges were related to $4.0 million in headcount reductions, $4.5 million of charges related to the closure of the Heidenheim rolls facility, $4.8 million in impairment charges and severance and other charges due to the closing of the Joao Pessoa, Brazil clothing facility, a $1.6 million charge in Italy to terminate a sales agency contract, $1.5 million in severance charges relating to the closure of the Argentina press felt facility, $1.2 million of charges relating to the closed France rolls facility, including costs related moving certain assets to China and other locations in Europe, $0.2 million of costs associated with liquidating the Vietnam facility, and $1.2 million in severance and facility charges relating to the Spain closure. These costs were partially offset by a gain of $0.9 million recorded in connection with the sale of the Spain and France facilities in the third and fourth quarters of 2014.
The Company expects to continue to review its business to determine if additional actions will be taken to further improve its cost structure. Restructuring expenses of approximately $4 million are estimated during 2017, primarily related to the continuation of streamlining the operating structure and improving long-term competitiveness of the Company. Actual restructuring costs for 2017 may substantially differ from estimates at this time, depending on actual operating results in 2017 and the timing of the restructuring activities.
The table below sets forth the significant components and activity in the restructuring program during the years ended December 31, 2016, 2015 and 2014:
2016 | Balance at December 31, 2015 | Charges (1) | Currency Effects | Cash Payments | Balance at December 31, 2016 (2) | ||||||||||||||
Severance | $ | 5,308 | $ | 5,646 | $ | (146 | ) | $ | (7,003 | ) | $ | 3,805 | |||||||
Facility costs and other | 903 | 4,716 | (25 | ) | (5,202 | ) | 392 | ||||||||||||
Total | $ | 6,211 | $ | 10,362 | $ | (171 | ) | $ | (12,205 | ) | $ | 4,197 | |||||||
(1) There are no impairment charges, other non-cash charges, or (gains)/losses included in the current year amounts.
(2) Amount included in Accrued Expenses on the Consolidated Balance Sheets at December 31, 2016.
2015 | Balance at December 31, 2014 | Charges (1) | Currency Effects | Cash Payments | Balance at December 31, 2015 (2) | ||||||||||||||
Severance | $ | 4,880 | $ | 8,006 | $ | (728 | ) | $ | (6,850 | ) | $ | 5,308 | |||||||
Facility costs and other | 818 | 6,486 | (122 | ) | (6,279 | ) | 903 | ||||||||||||
Total | $ | 5,698 | $ | 14,492 | $ | (850 | ) | $ | (13,129 | ) | $ | 6,211 | |||||||
(1) Amount excludes $986 related to impairment charges, $243 in other non-cash charges and $(1,072) related to the gain on sale of certain assets.
(2) Amount included in Accrued Expenses on the Consolidated Balance Sheets at December 31, 2015.
81
2014 | Balance at December 31, 2013 | Charges (1) | Currency Effects | Cash Payments | Balance at December 31, 2014 (2) | ||||||||||||||
Severance | $ | 6,466 | $ | 13,095 | $ | (786 | ) | $ | (13,895 | ) | $ | 4,880 | |||||||
Facility costs and other | 1,468 | 5,638 | (333 | ) | (5,955 | ) | 818 | ||||||||||||
Total | $ | 7,934 | $ | 18,733 | $ | (1,119 | ) | $ | (19,850 | ) | $ | 5,698 | |||||||
(1) Amount excludes $263 related to impairment charges and $(854) related to the gain on sale of certain assets.
(2) Amount included in Accrued Expenses on the Consolidated Balance Sheets at December 31, 2014.
12. Business Segment Information
The Company is a leading global provider of web handling products and services including machine clothing, roll coverings, roll repair and mechanical services. These goods and services are used in the production of paper, paperboard, building products and nonwoven materials and are organized into two reportable segments: machine clothing and roll covers. The machine clothing segment represents the manufacture and sale of synthetic textile belts used to transport paper along the length of papermaking machines. The roll covers segment primarily represents the manufacture and refurbishment of covers used on the steel rolls of a papermaking machine. The Company manages each of these operating segments separately.
Management evaluates segment performance based on earnings before interest, taxes, depreciation and amortization before allocation of corporate charges. Such measure is then adjusted to exclude items that are of an unusual nature and are not used in measuring segment performance or are not segment specific (“Segment Earnings (Loss)”). The accounting policies of these segments are the same as those described in Accounting Policies in Note 2. Inter-segment net sales and inter-segment eliminations are not material for any of the periods presented.
The corporate column consists of the Company’s headquarters, related assets and expenses that are not allocable to reportable segments. Significant corporate assets include cash, investments in subsidiaries and deferred financing costs. Corporate depreciation and amortization consists primarily of deferred financing costs. Corporate segment earnings (loss) consists of general and administrative expenses. The eliminations column represents eliminations of investments in subsidiaries.
Summarized financial information for the Company’s reportable segments is presented in the tables that follow for each of the three years ended December 31, 2016.
82
Machine Clothing | Roll Covers | Corporate | Eliminations | Total | |||||||||||||||
2016 | |||||||||||||||||||
Net sales | $ | 286,373 | $ | 184,944 | $ | — | $ | — | $ | 471,317 | |||||||||
Depreciation and amortization (1) | $ | 20,452 | $ | 10,253 | $ | 2,251 | $ | — | $ | 32,956 | |||||||||
Restructuring | $ | 6,266 | $ | 3,063 | $ | 1,033 | $ | — | $ | 10,362 | |||||||||
Segment earnings (loss) (2) | $ | 75,158 | $ | 36,463 | $ | (16,259 | ) | $ | — | $ | 95,362 | ||||||||
Total assets | $ | 519,176 | $ | 450,314 | $ | 315,040 | $ | (742,617 | ) | $ | 541,913 | ||||||||
Capital expenditures | $ | 7,644 | $ | 5,118 | $ | 944 | $ | — | $ | 13,706 | |||||||||
2015 | |||||||||||||||||||
Net sales | $ | 299,991 | $ | 177,252 | $ | — | $ | — | $ | 477,243 | |||||||||
Depreciation and amortization (1) | $ | 18,889 | $ | 8,754 | $ | 1,607 | $ | — | $ | 29,250 | |||||||||
Restructuring | $ | 4,318 | $ | 1,833 | $ | 8,498 | $ | — | $ | 14,649 | |||||||||
Segment earnings (loss) (2) | $ | 81,843 | $ | 35,894 | $ | (15,882 | ) | $ | — | $ | 101,855 | ||||||||
Total assets | $ | 441,742 | $ | 228,477 | $ | 627,121 | $ | (746,966 | ) | $ | 550,374 | ||||||||
Capital expenditures | $ | 25,560 | $ | 17,914 | $ | 7,397 | $ | — | $ | 50,871 | |||||||||
2014 | |||||||||||||||||||
Net sales | $ | 347,003 | $ | 195,929 | $ | — | $ | — | $ | 542,932 | |||||||||
Depreciation and amortization (1) | $ | 23,457 | $ | 9,666 | $ | 1,169 | $ | — | $ | 34,292 | |||||||||
Restructuring | $ | 10,730 | $ | 6,835 | $ | 577 | $ | — | $ | 18,142 | |||||||||
Segment earnings (loss) (2) | $ | 88,798 | $ | 41,485 | $ | (13,595 | ) | $ | — | $ | 116,688 | ||||||||
Total assets | $ | 475,945 | $ | 222,355 | $ | 661,217 | $ | (775,244 | ) | $ | 584,273 | ||||||||
Capital expenditures | $ | 22,964 | $ | 10,918 | $ | 11,336 | $ | — | $ | 45,218 | |||||||||
(1) | Depreciation and amortization excludes amortization of financing costs, included in interest expense of $3.1 million, $3.5 million, and $3.3 million for 2016, 2015 and 2014, respectively. |
(2) | Prior year amounts updated to exclude impact of FX gain/loss in line with the updated Non-GAAP Adjusted EBITDA definition. |
Provided below is a reconciliation of Segment Earnings (Loss) to income before provision for income taxes for each of the three years in the period ended December 31:
2016 | 2015 | 2014 | |||||||||
Segment earnings (loss): | |||||||||||
Machine clothing | $ | 75,158 | $ | 81,843 | $ | 88,798 | |||||
Roll Covers | 36,463 | 35,894 | 41,485 | ||||||||
Corporate | (16,259 | ) | (15,882 | ) | (13,595 | ) | |||||
Stock-based compensation | (2,612 | ) | (3,298 | ) | (2,548 | ) | |||||
Inventory write-off related to closed facilities | — | (587 | ) | — | |||||||
Non-restructuring impairment charges | — | (494 | ) | — | |||||||
Pension settlement losses | — | (1,108 | ) | — | |||||||
Plant startup costs | (2,176 | ) | (3,886 | ) | (1,521 | ) | |||||
Non-recurring expenses | (1,116 | ) | (2,569 | ) | — | ||||||
Interest expense, net | (46,155 | ) | (38,413 | ) | (36,768 | ) | |||||
Depreciation and amortization (1) | (32,956 | ) | (29,250 | ) | (34,292 | ) | |||||
Restructuring expenses | (10,362 | ) | (14,649 | ) | (18,142 | ) | |||||
Loss on debt extinguishment | (11,938 | ) | (388 | ) | — | ||||||
Foreign exchange (loss) gain | (383 | ) | 1,872 | (719 | ) | ||||||
Income before provision for income taxes | $ | (12,336 | ) | $ | 9,085 | $ | 22,698 | ||||
(1) Excludes amortization of deferred finance costs that are charged to interest expense.
83
Information concerning principal geographic areas is set forth below. Net sales amounts are for the years ended December 31, 2016, 2015 and 2014 and property, plant and equipment amounts are as of December 31, 2016, 2015 and 2014.
North America (1) | Europe | Asia- Pacific | Latin America (1) | Total | |||||||||||||||
2016 | |||||||||||||||||||
Net sales | $ | 182,978 | $ | 149,039 | $ | 90,171 | $ | 49,129 | $ | 471,317 | |||||||||
Property, plant and equipment | $ | 94,177 | $ | 91,076 | $ | 62,919 | $ | 35,929 | $ | 284,101 | |||||||||
2015 | |||||||||||||||||||
Net sales | $ | 179,725 | $ | 154,180 | $ | 91,471 | $ | 51,867 | $ | 477,243 | |||||||||
Property, plant and equipment | $ | 96,789 | $ | 100,022 | $ | 69,164 | $ | 31,108 | $ | 297,083 | |||||||||
2014 | |||||||||||||||||||
Net sales | $ | 202,328 | $ | 182,788 | $ | 101,596 | $ | 56,220 | $ | 542,932 | |||||||||
Property, plant and equipment | $ | 97,603 | $ | 113,217 | $ | 50,038 | $ | 42,760 | $ | 303,618 | |||||||||
(1) During 2016, the Company re-aligned its geographical regions to include Mexico in the presentation of Latin America and removed from North America. The prior periods above are restated. The restatement of the prior period amounts resulted in an increase for Latin America and an equal decrease for North America of $6.2 million in Net Sales and $662 in PPE, and $5.5 million in Net Sales and $819 in PPE, respectively for 2015 and 2014.
13. Supplemental Guarantor Financial Information
On August 9, 2016, the Company closed on the sale of its Notes. The Notes are secured obligations of the Company and are fully and unconditionally guaranteed on a senior secured basis by all of the domestic wholly owned subsidiaries of the Company (the “Guarantors”). In accordance with Rule 3-10 of Regulation S-X promulgated under the Securities Act of 1933, as amended, the following condensed consolidating financial statements present the financial position, results of operations and cash flows of Xerium Technologies, Inc. (referred to as “Parent” for the purpose of this note only) on a stand-alone parent-only basis, the Guarantors on a Guarantors-only basis, the combined non-Guarantor subsidiaries and elimination entries necessary to arrive at the information for the Parent, the Guarantors and non-Guarantor subsidiaries on a consolidated basis.
84
Xerium Technologies, Inc.
Consolidating Balance Sheet
At December 31, 2016
(Dollars in thousands)
Parent | Total Guarantors | Total Non Guarantors | Other Eliminations | The Company | |||||||||||||||
ASSETS | |||||||||||||||||||
Current assets: | |||||||||||||||||||
Cash and cash equivalents | $ | 1,368 | $ | 279 | $ | 11,161 | $ | — | $ | 12,808 | |||||||||
Accounts receivable, net | 70 | 18,787 | 49,810 | — | 68,667 | ||||||||||||||
Intercompany (payable) receivable | (410,370 | ) | 419,192 | (8,822 | ) | — | — | ||||||||||||
Inventories | — | 17,356 | 54,577 | (1,111 | ) | 70,822 | |||||||||||||
Prepaid expenses | 545 | 395 | 5,385 | — | 6,325 | ||||||||||||||
Other current assets | — | 3,842 | 11,942 | — | 15,784 | ||||||||||||||
Total current assets | (408,387 | ) | 459,851 | 124,053 | (1,111 | ) | 174,406 | ||||||||||||
Property and equipment, net | 8,393 | 67,794 | 207,914 | — | 284,101 | ||||||||||||||
Investments | 869,508 | 211,897 | — | (1,081,405 | ) | — | |||||||||||||
Goodwill | — | 19,614 | 37,169 | — | 56,783 | ||||||||||||||
Intangible assets | — | 7,265 | 65 | — | 7,330 | ||||||||||||||
Non-current deferred tax asset | — | — | 10,737 | — | 10,737 | ||||||||||||||
Other assets | — | — | 8,556 | — | 8,556 | ||||||||||||||
Total assets | $ | 469,514 | $ | 766,421 | $ | 388,494 | $ | (1,082,516 | ) | $ | 541,913 | ||||||||
LIABILITIES AND STOCKHOLDERS’ (DEFICIT) EQUITY | |||||||||||||||||||
Current liabilities: | |||||||||||||||||||
Notes payable | $ | — | $ | — | $ | 7,328 | $ | — | $ | 7,328 | |||||||||
Accounts payable | 2,279 | 10,307 | 23,572 | — | 36,158 | ||||||||||||||
Accrued expenses | 26,495 | 8,659 | 29,378 | — | 64,532 | ||||||||||||||
Current maturities of long-term debt | 2,342 | 2,320 | 3,938 | — | 8,600 | ||||||||||||||
Total current liabilities | 31,116 | 21,286 | 64,216 | — | 116,618 | ||||||||||||||
Long-term debt, net of current maturities and deferred financing costs | 464,494 | — | 8,429 | — | 472,923 | ||||||||||||||
Liabilities under capital lease | 5,830 | 4,627 | 8,779 | — | 19,236 | ||||||||||||||
Non-current deferred tax liability | 1,270 | — | 5,887 | — | 7,157 | ||||||||||||||
Pension, other post-retirement and post-employment obligations | 20,923 | 763 | 43,340 | — | 65,026 | ||||||||||||||
Other long-term liabilities | — | 1,250 | 6,608 | — | 7,858 | ||||||||||||||
Intercompany loans | 63,923 | (97,953 | ) | 34,030 | — | — | |||||||||||||
Total stockholders’ (deficit) equity | (118,042 | ) | 836,448 | 217,205 | (1,082,516 | ) | (146,905 | ) | |||||||||||
Total liabilities and stockholders’ equity (deficit) | $ | 469,514 | $ | 766,421 | $ | 388,494 | $ | (1,082,516 | ) | $ | 541,913 | ||||||||
85
Xerium Technologies, Inc.
Consolidating Balance Sheet
At December 31, 2015
(Dollars in thousands)
Parent | Total Guarantors | Total Non Guarantors | Other Eliminations | The Company | |||||||||||||||
ASSETS | |||||||||||||||||||
Current assets: | |||||||||||||||||||
Cash and cash equivalents | $ | 3,105 | $ | (2 | ) | $ | 6,736 | $ | — | $ | 9,839 | ||||||||
Accounts receivable, net | 20 | 18,585 | 49,957 | — | 68,562 | ||||||||||||||
Intercompany (payable) receivable | (110,541 | ) | 113,736 | (3,195 | ) | — | — | ||||||||||||
Inventories | — | 14,694 | 57,929 | (925 | ) | 71,698 | |||||||||||||
Prepaid expenses | 510 | 1,330 | 4,809 | — | 6,649 | ||||||||||||||
Other current assets | — | 2,849 | 14,020 | — | 16,869 | ||||||||||||||
Total current assets | (106,906 | ) | 151,192 | 130,256 | (925 | ) | 173,617 | ||||||||||||
Property and equipment, net | 9,518 | 68,075 | 219,490 | — | 297,083 | ||||||||||||||
Investments | 837,064 | 207,443 | — | (1,044,507 | ) | — | |||||||||||||
Goodwill | — | 17,737 | 40,862 | — | 58,599 | ||||||||||||||
Intangible assets | — | 1,389 | 158 | — | 1,547 | ||||||||||||||
Non-current deferred tax asset | — | — | 9,325 | — | 9,325 | ||||||||||||||
Other assets | — | — | 10,203 | — | 10,203 | ||||||||||||||
Total assets | $ | 739,676 | $ | 445,836 | $ | 410,294 | $ | (1,045,432 | ) | $ | 550,374 | ||||||||
LIABILITIES AND STOCKHOLDERS’ (DEFICIT) EQUITY | |||||||||||||||||||
Current liabilities: | |||||||||||||||||||
Notes payable | $ | — | $ | — | $ | 6,556 | $ | — | $ | 6,556 | |||||||||
Accounts payable | 2,642 | 11,100 | 26,954 | — | 40,696 | ||||||||||||||
Accrued expenses | 12,661 | 9,668 | 33,747 | — | 56,076 | ||||||||||||||
Current maturities of long-term debt | 2,663 | 1,937 | 810 | — | 5,410 | ||||||||||||||
Total current liabilities | 17,966 | 22,705 | 68,067 | — | 108,738 | ||||||||||||||
Long-term debt, net of current maturities and deferred financing costs | 451,923 | — | 10,547 | — | 462,470 | ||||||||||||||
Liabilities under capital lease | 3,276 | 4,425 | 1,036 | — | 8,737 | ||||||||||||||
Non-current deferred tax liability | (1,515 | ) | 1,243 | 9,042 | — | 8,770 | |||||||||||||
Pension, other post-retirement and post-employment obligations | 19,950 | 2,619 | 41,037 | — | 63,606 | ||||||||||||||
Other long-term liabilities | — | — | 11,123 | — | 11,123 | ||||||||||||||
Intercompany loans | 341,412 | (403,154 | ) | 61,742 | — | — | |||||||||||||
Total stockholders’ (deficit) equity | (93,336 | ) | 817,998 | 207,700 | (1,045,432 | ) | (113,070 | ) | |||||||||||
Total liabilities and stockholders’ equity (deficit) | $ | 739,676 | $ | 445,836 | $ | 410,294 | $ | (1,045,432 | ) | $ | 550,374 | ||||||||
86
Xerium Technologies, Inc.
Consolidating Statement of Operations and Comprehensive (Loss) Income
For the year ended December 31, 2016
(Dollars in thousands)
Parent | Total Guarantors | Total Non Guarantors | Other Eliminations | The Company | |||||||||||||||
Net sales | $ | — | $ | 172,405 | $ | 327,732 | $ | (28,820 | ) | $ | 471,317 | ||||||||
Costs and expenses: | |||||||||||||||||||
Cost of products sold | (58 | ) | 116,369 | 206,165 | (28,634 | ) | 293,842 | ||||||||||||
Selling | 970 | 19,916 | 41,924 | — | 62,810 | ||||||||||||||
General and administrative | 12,409 | 2,698 | 35,956 | — | 51,063 | ||||||||||||||
Research and development | 1,146 | 3,916 | 2,038 | — | 7,100 | ||||||||||||||
Restructuring | 1,033 | 2,671 | 6,658 | — | 10,362 | ||||||||||||||
15,500 | 145,570 | 292,741 | (28,634 | ) | 425,177 | ||||||||||||||
(Loss) income from operations | (15,500 | ) | 26,835 | 34,991 | (186 | ) | 46,140 | ||||||||||||
Interest (expense) income, net | (43,543 | ) | 646 | (3,258 | ) | — | (46,155 | ) | |||||||||||
Loss on extinguishment of debt | (11,938 | ) | — | — | — | (11,938 | ) | ||||||||||||
Equity in subsidiaries income | 32,444 | 22,602 | — | (55,046 | ) | — | |||||||||||||
Foreign exchange (loss) gain | 436 | (217 | ) | (602 | ) | — | (383 | ) | |||||||||||
Dividend income | 14,858 | 3,413 | — | (18,271 | ) | — | |||||||||||||
(Loss) income before provision for income taxes | (23,243 | ) | 53,279 | 31,131 | (73,503 | ) | (12,336 | ) | |||||||||||
Provision for income taxes | 1,625 | (847 | ) | (10,060 | ) | — | (9,282 | ) | |||||||||||
Net (loss) income | $ | (21,618 | ) | $ | 52,432 | $ | 21,071 | $ | (73,503 | ) | $ | (21,618 | ) | ||||||
Comprehensive (loss) income | $ | (25,476 | ) | $ | 54,949 | $ | 9,426 | $ | (73,503 | ) | $ | (34,604 | ) | ||||||
Xerium Technologies, Inc.
Consolidating Statement of Operations and Comprehensive (Loss) Income
For the year ended December 31, 2015
(Dollars in thousands)
Parent | Total Guarantors | Total Non Guarantors | Other Eliminations | The Company | |||||||||||||||
Net sales | $ | — | $ | 167,986 | $ | 343,024 | $ | (33,767 | ) | $ | 477,243 | ||||||||
Costs and expenses: | |||||||||||||||||||
Cost of products sold | (290 | ) | 116,041 | 206,379 | (33,618 | ) | 288,512 | ||||||||||||
Selling | 1,073 | 19,804 | 43,537 | — | 64,414 | ||||||||||||||
General and administrative | 14,022 | 4,968 | 37,260 | — | 56,250 | ||||||||||||||
Research and development | 921 | 4,526 | 1,957 | — | 7,404 | ||||||||||||||
Restructuring | 8,498 | 1,537 | 4,614 | — | 14,649 | ||||||||||||||
24,224 | 146,876 | 293,747 | (33,618 | ) | 431,229 | ||||||||||||||
(Loss) income from operations | (24,224 | ) | 21,110 | 49,277 | (149 | ) | 46,014 | ||||||||||||
Interest (expense) income, net | (38,239 | ) | 3,732 | (3,906 | ) | — | (38,413 | ) | |||||||||||
Loss on extinguishment of debt | (388 | ) | — | — | — | (388 | ) | ||||||||||||
Equity in subsidiaries income | 41,480 | 27,828 | — | (69,308 | ) | — | |||||||||||||
Foreign exchange gain (loss) | (73 | ) | (410 | ) | 2,355 | — | 1,872 | ||||||||||||
Dividend income | 17,204 | — | — | (17,204 | ) | — | |||||||||||||
(Loss) income before provision for income taxes | (4,240 | ) | 52,260 | 47,726 | (86,661 | ) | 9,085 | ||||||||||||
Provision for income taxes | (140 | ) | (861 | ) | (12,464 | ) | — | (13,465 | ) | ||||||||||
Net (loss) income | $ | (4,380 | ) | $ | 51,399 | $ | 35,262 | $ | (86,661 | ) | $ | (4,380 | ) | ||||||
Comprehensive (loss) income | $ | (1,925 | ) | $ | 53,194 | $ | (4,742 | ) | $ | (86,661 | ) | $ | (40,134 | ) | |||||
87
Xerium Technologies, Inc.
Consolidating Statement of Operations and Comprehensive (Loss) Income
For the year ended December 31, 2014
(Dollars in thousands)
Parent | Total Guarantors | Total Non Guarantors | Other Eliminations | The Company | |||||||||||||||
Net sales | $ | — | $ | 184,053 | $ | 395,751 | $ | (36,872 | ) | $ | 542,932 | ||||||||
Costs and expenses: | |||||||||||||||||||
Cost of products sold | (1,372 | ) | 126,004 | 239,576 | (37,047 | ) | 327,161 | ||||||||||||
Selling | 945 | 20,628 | 51,429 | — | 73,002 | ||||||||||||||
General and administrative | 8,718 | 8,448 | 39,373 | — | 56,539 | ||||||||||||||
Research and development | 1,007 | 4,676 | 2,220 | — | 7,903 | ||||||||||||||
Restructuring and impairment | 576 | 936 | 16,630 | — | 18,142 | ||||||||||||||
9,874 | 160,692 | 349,228 | (37,047 | ) | 482,747 | ||||||||||||||
(Loss) income from operations | (9,874 | ) | 23,361 | 46,523 | 175 | 60,185 | |||||||||||||
Interest (expense) income, net | (35,016 | ) | 5,469 | (7,221 | ) | — | (36,768 | ) | |||||||||||
Foreign exchange (loss) gain | (827 | ) | (215 | ) | 323 | — | (719 | ) | |||||||||||
Equity in subsidiaries income | 38,777 | 8,014 | — | (46,791 | ) | — | |||||||||||||
(Loss) income before provision for income taxes | (6,940 | ) | 36,629 | 39,625 | (46,616 | ) | 22,698 | ||||||||||||
Provision for income taxes | $ | (442 | ) | $ | (135 | ) | $ | (29,503 | ) | $ | — | $ | (30,080 | ) | |||||
Net (loss) income | $ | (7,382 | ) | $ | 36,494 | $ | 10,122 | $ | (46,616 | ) | $ | (7,382 | ) | ||||||
Comprehensive (loss) income | $ | (20,810 | ) | $ | 36,072 | $ | (31,914 | ) | $ | (46,616 | ) | $ | (63,268 | ) | |||||
88
Xerium Technologies, Inc.
Consolidating Statement of Cash Flows
For the year ended December 31, 2016
(Dollars in thousands)
Parent | Total Guarantors | Total Non Guarantors | Other Eliminations | The Company | |||||||||||||||
Operating activities | |||||||||||||||||||
Net (loss) income | $ | (21,618 | ) | $ | 52,432 | $ | 21,071 | $ | (73,503 | ) | $ | (21,618 | ) | ||||||
Adjustments to reconcile net (loss) income to net cash provided by (used in) operating activities: | |||||||||||||||||||
Stock-based compensation | 2,612 | — | — | — | 2,612 | ||||||||||||||
Depreciation | 2,250 | 8,188 | 21,677 | — | 32,115 | ||||||||||||||
Amortization of other intangibles | — | 747 | 94 | — | 841 | ||||||||||||||
Deferred financing cost amortization | 2,967 | — | 96 | — | 3,063 | ||||||||||||||
Unrealized foreign exchange gain on revaluation of debt | (3,267 | ) | — | — | — | (3,267 | ) | ||||||||||||
Deferred taxes | (1,707 | ) | — | 1,926 | — | 219 | |||||||||||||
(Gain) loss on disposition of property and equipment | — | 30 | 20 | — | 50 | ||||||||||||||
Provision for doubtful accounts | — | (57 | ) | 332 | — | 275 | |||||||||||||
Loss on extinguishment of debt | 11,938 | — | — | — | 11,938 | ||||||||||||||
Undistributed equity in earnings of subsidiaries | (32,444 | ) | (22,602 | ) | — | 55,046 | — | ||||||||||||
Change in assets and liabilities which provided (used) cash: | |||||||||||||||||||
Accounts receivable | (50 | ) | 2,461 | (734 | ) | — | 1,677 | ||||||||||||
Inventories | — | 256 | 3,304 | 186 | 3,746 | ||||||||||||||
Prepaid expenses | (34 | ) | 907 | (541 | ) | — | 332 | ||||||||||||
Other current assets | — | 713 | (1,997 | ) | — | (1,284 | ) | ||||||||||||
Accounts payable and accrued expenses | 15,635 | (3,513 | ) | (7,618 | ) | — | 4,504 | ||||||||||||
Deferred and other long-term liabilities | 136 | 780 | 390 | — | 1,306 | ||||||||||||||
Intercompany loans | 299,828 | (305,386 | ) | 5,558 | — | — | |||||||||||||
Net cash (used in) provided by operating activities | 276,246 | (265,044 | ) | 43,578 | (18,271 | ) | 36,509 | ||||||||||||
Investing activities | |||||||||||||||||||
Capital expenditures | (944 | ) | (2,907 | ) | (9,855 | ) | — | (13,706 | ) | ||||||||||
Intercompany property and equipment transfers, net | 26 | 42 | (68 | ) | — | — | |||||||||||||
Proceeds from disposals of property and equipment | — | 5 | 112 | — | 117 | ||||||||||||||
Acquisition of business, net of cash acquired | — | (16,225 | ) | — | — | (16,225 | ) | ||||||||||||
Net cash used in investing activities | (918 | ) | (19,085 | ) | (9,811 | ) | — | (29,814 | ) | ||||||||||
Financing activities | |||||||||||||||||||
Increase in notes payable | — | — | 1,121 | — | 1,121 | ||||||||||||||
Proceeds from borrowings | 557,032 | — | 8,521 | — | 565,553 | ||||||||||||||
Principal payments on debt | (532,249 | ) | — | (7,462 | ) | — | (539,711 | ) | |||||||||||
Payment of deferred financing fees | (23,567 | ) | — | 71 | — | (23,496 | ) | ||||||||||||
Payment of obligations under capital leases | (1,428 | ) | (2,137 | ) | (385 | ) | — | (3,950 | ) | ||||||||||
Dividends paid | — | (14,858 | ) | (3,413 | ) | 18,271 | — | ||||||||||||
Intercompany loans | (275,010 | ) | 301,405 | (26,395 | ) | — | — | ||||||||||||
Employee taxes paid on equity awards | (1,843 | ) | — | — | — | (1,843 | ) | ||||||||||||
Net cash provided by (used in) financing activities | (277,065 | ) | 284,410 | (27,942 | ) | 18,271 | (2,326 | ) | |||||||||||
Effect of exchange rate changes on cash flows | — | — | (1,400 | ) | — | (1,400 | ) | ||||||||||||
Net increase (decrease) in cash | (1,737 | ) | 281 | 4,425 | — | 2,969 | |||||||||||||
Cash and cash equivalents at beginning of period | 3,105 | (2 | ) | 6,736 | — | 9,839 | |||||||||||||
Cash and cash equivalents at end of period | $ | 1,368 | $ | 279 | $ | 11,161 | $ | — | $ | 12,808 | |||||||||
89
Xerium Technologies, Inc.
Consolidating Statement of Cash Flows
For the year ended December 31, 2015
(Dollars in thousands)
Parent | Total Guarantors | Total Non Guarantors | Other Eliminations | The Company | |||||||||||||||
Operating activities | |||||||||||||||||||
Net (loss) income | $ | (4,380 | ) | $ | 51,399 | $ | 35,262 | $ | (86,661 | ) | $ | (4,380 | ) | ||||||
Adjustments to reconcile net (loss) income to net cash provided by (used in) operating activities: | |||||||||||||||||||
Stock-based compensation | 3,007 | — | 291 | — | 3,298 | ||||||||||||||
Depreciation | 1,545 | 7,180 | 20,227 | — | 28,952 | ||||||||||||||
Amortization of other intangibles | — | 275 | 23 | — | 298 | ||||||||||||||
Deferred financing cost amortization | 3,367 | — | 95 | — | 3,462 | ||||||||||||||
Unrealized foreign exchange gain on revaluation of debt | (3,426 | ) | — | — | — | (3,426 | ) | ||||||||||||
Deferred taxes | (196 | ) | — | (2,589 | ) | — | (2,785 | ) | |||||||||||
Asset impairment | 61 | 421 | 1,054 | — | 1,536 | ||||||||||||||
(Gain) loss on disposition of property and equipment | 4 | (45 | ) | (1,342 | ) | (1,383 | ) | ||||||||||||
Pension settlement losses | — | 1,108 | — | — | 1,108 | ||||||||||||||
Loss on extinguishment of debt | 388 | — | — | — | 388 | ||||||||||||||
Provision for doubtful accounts | — | 266 | 851 | — | 1,117 | ||||||||||||||
Undistributed equity in earnings of subsidiaries | (41,480 | ) | (27,828 | ) | — | 69,308 | — | ||||||||||||
Change in assets and liabilities which provided (used) cash: | |||||||||||||||||||
Accounts receivable | 29 | 3,508 | 1,697 | — | 5,234 | ||||||||||||||
Inventories | — | 2,615 | 220 | 150 | 2,985 | ||||||||||||||
Prepaid expenses | 36 | 139 | 582 | — | 757 | ||||||||||||||
Other current assets | — | (620 | ) | (2,599 | ) | — | (3,219 | ) | |||||||||||
Accounts payable and accrued expenses | 2,105 | 2,254 | 941 | — | 5,300 | ||||||||||||||
Deferred and other long-term liabilities | 459 | 1,282 | (7,696 | ) | — | (5,955 | ) | ||||||||||||
Intercompany loans | (14,972 | ) | (6,050 | ) | 21,022 | — | — | ||||||||||||
Net cash (used in) provided by operating activities | (53,453 | ) | 35,904 | 68,039 | (17,203 | ) | 33,287 | ||||||||||||
Investing activities | |||||||||||||||||||
Capital expenditures | (7,396 | ) | (11,788 | ) | (31,687 | ) | — | (50,871 | ) | ||||||||||
Intercompany property and equipment transfers, net | 8,588 | (1,568 | ) | (7,020 | ) | — | — | ||||||||||||
Proceeds from disposals of property and equipment | 157 | 117 | 2,992 | — | 3,266 | ||||||||||||||
Net cash provided by (used) in investing activities | 1,349 | (13,239 | ) | (35,715 | ) | — | (47,605 | ) | |||||||||||
Financing activities | |||||||||||||||||||
Proceeds from borrowings | 73,094 | 4,076 | 22,778 | — | 99,948 | ||||||||||||||
Increase in notes payable | — | — | 6,759 | — | 6,759 | ||||||||||||||
Principal payments on debt | (75,318 | ) | — | (12,740 | ) | — | (88,058 | ) | |||||||||||
Payment of obligations under capital leases | (597 | ) | (708 | ) | (108 | ) | — | (1,413 | ) | ||||||||||
Payment of deferred financing fees | (893 | ) | — | 231 | — | (662 | ) | ||||||||||||
Dividends paid | — | (15,410 | ) | (1,793 | ) | 17,203 | — | ||||||||||||
Intercompany loans | 54,942 | (10,610 | ) | (44,332 | ) | — | — | ||||||||||||
Other financing activities | 5,500 | — | (5,500 | ) | — | — | |||||||||||||
Employee taxes paid on equity awards | (2,124 | ) | — | — | — | (2,124 | ) | ||||||||||||
Net cash provided by (used in) financing activities | 54,604 | (22,652 | ) | (34,705 | ) | 17,203 | 14,450 | ||||||||||||
Effect of exchange rate changes on cash flows | — | — | 190 | — | 190 | ||||||||||||||
Net increase (decrease) in cash | 2,500 | 13 | (2,191 | ) | — | 322 | |||||||||||||
Cash and cash equivalents at beginning of period | 605 | (15 | ) | 8,927 | — | 9,517 | |||||||||||||
Cash and cash equivalents at end of period | $ | 3,105 | $ | (2 | ) | $ | 6,736 | $ | — | $ | 9,839 | ||||||||
90
Xerium Technologies, Inc.
Consolidating Statement of Cash Flows
For the year ended December 31, 2014
(Dollars in thousands)
Parent | Total Guarantors | Total Non Guarantors | Other Eliminations | The Company | |||||||||||||||
Operating activities | |||||||||||||||||||
Net (loss) income | $ | (7,382 | ) | $ | 36,494 | $ | 10,122 | $ | (46,616 | ) | $ | (7,382 | ) | ||||||
Adjustments to reconcile net (loss) income to net cash provided by (used in) operating activities: | |||||||||||||||||||
Stock-based compensation | 2,295 | — | 253 | — | 2,548 | ||||||||||||||
Depreciation | 1,168 | 7,102 | 24,482 | — | 32,752 | ||||||||||||||
Amortization of other intangibles | — | 1,430 | 110 | — | 1,540 | ||||||||||||||
Deferred financing cost amortization | 3,227 | — | 76 | — | 3,303 | ||||||||||||||
Unrealized foreign exchange gain on revaluation of debt | (259 | ) | — | — | — | (259 | ) | ||||||||||||
Deferred taxes | 330 | — | (5,187 | ) | — | (4,857 | ) | ||||||||||||
Asset impairment | — | — | 136 | — | 136 | ||||||||||||||
(Gain) loss on disposition of property and equipment | — | 100 | (1,136 | ) | — | (1,036 | ) | ||||||||||||
Provision for doubtful accounts | — | 67 | 207 | — | 274 | ||||||||||||||
Undistributed equity in earnings of subsidiaries | (38,777 | ) | (8,014 | ) | — | 46,791 | — | ||||||||||||
Change in assets and liabilities which provided (used) cash: | |||||||||||||||||||
Accounts receivable | (50 | ) | (237 | ) | (3,174 | ) | — | (3,461 | ) | ||||||||||
Inventories | — | 14 | (8,848 | ) | (175 | ) | (9,009 | ) | |||||||||||
Prepaid expenses | (148 | ) | (534 | ) | (155 | ) | — | (837 | ) | ||||||||||
Other current assets | 514 | (297 | ) | (3,495 | ) | — | (3,278 | ) | |||||||||||
Accounts payable and accrued expenses | (747 | ) | (27 | ) | 3,313 | — | 2,539 | ||||||||||||
Deferred and other long-term liabilities | (666 | ) | 28 | (3,501 | ) | — | (4,139 | ) | |||||||||||
Intercompany loans | (5,785 | ) | 2,928 | 2,857 | — | — | |||||||||||||
Net cash (used in) provided by operating activities | (46,280 | ) | 39,054 | 16,060 | — | 8,834 | |||||||||||||
Investing activities | |||||||||||||||||||
Capital expenditures | (11,336 | ) | (6,259 | ) | (27,623 | ) | — | (45,218 | ) | ||||||||||
Intercompany property and equipment transfers, net | 17,290 | (101 | ) | (17,189 | ) | — | — | ||||||||||||
Proceeds from disposals of property and equipment | — | 79 | 3,351 | — | 3,430 | ||||||||||||||
Other investing activities | (26,100 | ) | 25,600 | 500 | — | — | |||||||||||||
Net cash provided by (used) in investing activities | (20,146 | ) | 19,319 | (40,961 | ) | — | (41,788 | ) | |||||||||||
Financing activities | |||||||||||||||||||
Proceeds from borrowings | 85,463 | — | 16,696 | — | 102,159 | ||||||||||||||
Increase in notes payable | — | — | (7,168 | ) | — | (7,168 | ) | ||||||||||||
Principal payments on debt | (56,743 | ) | (12 | ) | (15,198 | ) | — | (71,953 | ) | ||||||||||
Payment of obligations under capital leases | (511 | ) | (310 | ) | — | — | (821 | ) | |||||||||||
Payment of deferred financing fees | (729 | ) | — | (795 | ) | — | (1,524 | ) | |||||||||||
Intercompany loans | 54,423 | (58,056 | ) | 3,633 | — | — | |||||||||||||
Other financing activities | (17,050 | ) | — | 17,050 | — | — | |||||||||||||
Employee taxes paid on equity awards | (1,942 | ) | — | — | — | (1,942 | ) | ||||||||||||
Net cash provided by (used in) financing activities | 62,911 | (58,378 | ) | 14,218 | — | 18,751 | |||||||||||||
Effect of exchange rate changes on cash flows | — | — | (1,996 | ) | — | (1,996 | ) | ||||||||||||
Net increase (decrease) in cash | (3,515 | ) | (5 | ) | (12,679 | ) | — | (16,199 | ) | ||||||||||
Cash and cash equivalents at beginning of period | 4,120 | (10 | ) | 21,606 | — | 25,716 | |||||||||||||
Cash and cash equivalents at end of period | $ | 605 | $ | (15 | ) | $ | 8,927 | $ | — | $ | 9,517 | ||||||||
91
14. Comprehensive Loss and Accumulated Other Comprehensive Loss
Comprehensive loss for the years ended December 31, 2016 and 2015 is as follows (net of taxes):
Years Ended December 31, | |||||||
2016 | 2015 | ||||||
Net loss | $ | (21,618 | ) | $ | (4,380 | ) | |
Foreign currency translation adjustments | (9,299 | ) | (46,968 | ) | |||
Pension liability changes under Topic 715 | (3,687 | ) | 11,057 | ||||
Change in value of derivative instruments | — | 157 | |||||
Comprehensive loss | $ | (34,604 | ) | $ | (40,134 | ) | |
The components of accumulated other comprehensive loss for the year ended December 31, 2016 are as follows (net of
tax benefits of $1.0 million in 2016.)
Foreign Currency Translation Adjustment | Pension Liability Changes Under Topic 715 | Change in Value of Derivative Instruments | Accumulated Other Comprehensive (Loss) Income | ||||||||||||
Balance at December 31, 2015 | $ | (85,982 | ) | $ | (35,759 | ) | $ | 49 | $ | (121,692 | ) | ||||
Other comprehensive loss before reclassifications | (9,299 | ) | (5,636 | ) | — | (14,935 | ) | ||||||||
Amounts reclassified from other comprehensive (loss) income: | |||||||||||||||
Amortization of actuarial losses | — | 1,949 | — | 1,949 | |||||||||||
Net current period other comprehensive (loss) income | (9,299 | ) | (3,687 | ) | — | (12,986 | ) | ||||||||
Balance at December 31, 2016 | $ | (95,281 | ) | $ | (39,446 | ) | $ | 49 | $ | (134,678 | ) | ||||
92
15. Business Acquisitions
On May 4, 2016, the Company acquired certain assets and liabilities of JJ Plank Corporation/Spencer Johnston (“Spencer Johnston”), a spreader roll company headquartered in Neenah, Wisconsin for an adjusted purchase price of $17.6 million. This acquisition adds diversity to the Company's growing rolls business in North America and expands its current product offerings, service capabilities and markets served, strengthens its financial profile and grows its customer base. The Company acquired all of the assets and assumed certain liabilities of Spencer Johnston.
Because the transaction was completed on May 4, 2016, the final purchase price allocation at the acquisition date was subject to change with respect to closing date working capital balances and other post-closing adjustments. The measurement period remains open as of December 31, 2016.
The adjusted purchase price of $17.6 million resulted in net assets acquired other than goodwill of $15.7 million and goodwill of $1.9 million. All of the goodwill is allocated to the Rolls Covers business segment. The Company made $0.9 million in goodwill reductions during the quarter ending September 30, 2016, a $0.5 million inventory valuation adjustment, and a $0.4 million working capital purchase price adjustment.
Goodwill represents the excess purchase price over the fair values of assets acquired and liabilities assumed. The goodwill was generated by the synergies the transaction provides.
The Company incurred roughly $0.8 million of transaction related expenses during the year ended December 31, 2016. These expenses were charged to SG&A expense in the period incurred.
16. Quarterly Financial Data (Unaudited)
The following table presents our unaudited consolidated statements of operations data for each quarter in the two years ended December 31, 2016. We believe that all necessary adjustments, consisting only of normal recurring adjustments, have been made to present fairly the unaudited quarterly results when read in conjunction with our audited consolidated financial statements and the notes thereto appearing elsewhere in this document. These operating results are not necessarily indicative of the results of operations that may be expected for any future period.
93
For the Three Months Ended | ||||||||||||||||||||||||||||||||
Dec. 31, 2016 | Sept. 30, 2016 | June 30, 2016 | Mar. 31, 2016 | Dec. 31, 2015 | Sept. 30, 2015 | June 30, 2015 | Mar. 31, 2015 | |||||||||||||||||||||||||
(in thousands, except per share data) | ||||||||||||||||||||||||||||||||
Net sales | $ | 113,188 | $ | 119,191 | $ | 123,973 | $ | 114,965 | $ | 115,347 | $ | 117,739 | $ | 123,128 | $ | 121,029 | ||||||||||||||||
Costs and expenses: | ||||||||||||||||||||||||||||||||
Cost of products sold | 71,247 | 75,385 | 75,782 | 71,428 | 71,099 | 71,252 | 73,686 | 72,476 | ||||||||||||||||||||||||
Selling | 15,538 | 15,816 | 15,735 | 15,721 | 15,770 | 15,889 | 16,429 | 16,326 | ||||||||||||||||||||||||
General and administrative | 13,486 | 12,644 | 13,427 | 11,507 | 15,987 | 14,370 | 12,045 | 13,846 | ||||||||||||||||||||||||
Research and development | 1,829 | 1,786 | 1,545 | 1,940 | 1,709 | 1,841 | 1,892 | 1,962 | ||||||||||||||||||||||||
Restructuring | 2,259 | 2,493 | 2,777 | 2,832 | 1,916 | 5,001 | 5,509 | 2,224 | ||||||||||||||||||||||||
Total operating costs and expenses | 104,359 | 108,124 | 109,266 | 103,428 | 106,481 | 108,353 | 109,561 | 106,834 | ||||||||||||||||||||||||
Income from operations | 8,829 | 11,067 | 14,707 | 11,537 | 8,866 | 9,386 | 13,567 | 14,195 | ||||||||||||||||||||||||
Other income (expense): | ||||||||||||||||||||||||||||||||
Interest expense, net | (12,940 | ) | (12,216 | ) | (10,658 | ) | (10,341 | ) | (10,269 | ) | (9,775 | ) | (8,705 | ) | (9,664 | ) | ||||||||||||||||
Loss on extinguishment of debt | (202 | ) | (11,736 | ) | — | — | (388 | ) | — | — | — | |||||||||||||||||||||
Foreign exchange (loss) gain | 94 | (429 | ) | (72 | ) | 24 | (278 | ) | 2,059 | (885 | ) | 977 | ||||||||||||||||||||
Income before (provision) benefit for income taxes | (4,219 | ) | (13,314 | ) | 3,977 | 1,220 | (2,069 | ) | 1,670 | 3,977 | 5,508 | |||||||||||||||||||||
(Provision) benefit for income taxes | (4,725 | ) | (25 | ) | (1,867 | ) | (2,665 | ) | (4,256 | ) | (755 | ) | (4,680 | ) | (3,775 | ) | ||||||||||||||||
Net (loss) income | $ | (8,944 | ) | $ | (13,339 | ) | $ | 2,110 | $ | (1,445 | ) | $ | (6,325 | ) | $ | 915 | $ | (703 | ) | $ | 1,733 | |||||||||||
Comprehensive (loss) income | $ | (37,497 | ) | $ | (10,988 | ) | $ | 6,507 | $ | 7,373 | $ | (6,428 | ) | $ | (11,012 | ) | $ | 6,704 | $ | (29,398 | ) | |||||||||||
Net (loss) income per common share—basic | $ | (0.55 | ) | $ | (0.83 | ) | $ | 0.13 | $ | (0.09 | ) | $ | (0.40 | ) | $ | 0.06 | $ | (0.05 | ) | $ | 0.11 | |||||||||||
Net (loss) income per common share—diluted | $ | (0.55 | ) | $ | (0.83 | ) | $ | 0.13 | $ | (0.09 | ) | $ | (0.40 | ) | $ | 0.06 | $ | (0.05 | ) | $ | 0.11 | |||||||||||
94
EXHIBIT INDEX
Exhibit No. | Description of Exhibit |
2.1(1)* | Joint Prepackaged Plan of Reorganization, as confirmed by the bankruptcy court on May 12, 2010. |
2.2(2) | Confirmation Order, dated May 12, 2010. |
3.1(3) | Second Amended and Restated Certificate of Incorporation of Xerium Technologies, Inc. |
3.2(4) | Amended and Restated By-Laws of Xerium Technologies, Inc. |
4.1(5) | Form of Stock Certificate. |
4.2(6) | Dividend Reinvestment Plan. |
4.3(7) | Indenture among the Company, the guarantor parties thereto and U.S. Bank National Association as Trustee, dated August 9, 2016. |
4.4(8) | Form of 9.500% Senior Secured Notes due 2021 (included in exhibit 4.3). |
4.5(9) | Pledge and Security Agreement among the Company, the grantor parties thereto and U.S. Bank National Association as Collateral Agent, dated August 9, 2016. |
10.1(10) | Director Nomination Agreement entered into by and among the Company, Carl Marks Strategic Investments, L.P., and Carl Marks Strategic Opportunities Fund, L.P., dated May 25, 2010. |
10.2(11)+ | Amendment No. 1 to 2010 Equity Incentive Plan. |
10.3(12)+ | Amendment No. 2 to 2010 Equity Incentive Plan. |
10.4(13)+ | Form of Independent Director Indemnification Agreement entered into between the Registrant and certain independent directors. |
10.5(14)+ | Directors’ Deferred Stock Unit Plan. |
10.6(15)+ | Employment Agreement with Harold C. Bevis. |
10.7(16)+ | Restricted Stock Unit Agreement with Harold C. Bevis. |
10.8(17)+ | Option Agreement with Harold C. Bevis. |
10.9(18)+ | Employment Agreement with Clifford E. Pietrafitta. |
10.10(19)+ | Amended and Restated Employment Agreement with David Pretty. |
10.11(20)+ | Amendment to Amended and Restated Employment Agreement with David Pretty. |
10.12(21)+ | Amendment No. 3 to Employment Agreement with David Pretty. |
10.13(22)+ | Employment Agreement with Eduardo Fracasso. |
10.14(23)+ | Employment Agreement with Kevin McDougall. |
10.15(24)+ | Amendment to Employment Agreement with Kevin McDougall. |
10.16(25)+ | Form of December 2011 Amendment to Employment Agreements with senior executive officers. |
10.17(26)+ | Employment Agreement with Michael Bly. |
10.18(27)+ | Employment Agreement with William Butterfield. |
10.19(28)+ | Form of 2014 Management Incentive Plan |
10.20(29)+ | Employment Agreements with Wern-Lirn "Paul" Wang |
10.21(30)+ | 2014-2016 Executive Long Term Incentive Plan and Form of Agreement |
10.22(31)+ | Form of 2015 Management Incentive Plan Award Agreement |
10.23(32)+ | Form of 2015 Long Term Incentive Plan Award Agreement |
10.24(33) | Translated version of Fixed Asset Loan Agreement by and between Xerium China, Co., Ltd and Industrial and Commercial Bank of China Limited, Shanghai-Jingan Branch dated July 17, 2015. |
10.25(34) | Translated version of Guarantee Agreement between Stowe Woodward (Changzhou) Roll Technologies Co. Ltd. and Industrial and Commercial Bank of China Limited, Shanghai-Jingan Branch dated July 17, 2015. |
10.26(35) | Translated version of Guarantee Agreement between Xerium Asia Pacific (Shanghai) Limited and Industrial and Commercial Bank of China Limited, Shanghai-Jingan Branch dated July 17, 2015. |
10.27(36) | Revolving Credit and Guarantee Agreement, dated as of November 3, 2015 |
10.28(37) | Amendment No. 1 to Revolving Credit and Guarantee Agreement, dated as of February 19, 2016 |
10.29(38) | Amendment No. 2 to Revolving Credit and Guarantee Agreement, dated as of August 9, 2016 |
10.30(39) | Amendment No. 3 to Revolving Credit and Guarantee Agreement, dated as of November 30, 2016 |
10.31(40) | 2016-2018 Executive Long Term Incentive Plan and Form of Agreement |
95
Exhibit No. | Description of Exhibit |
10.32(41)+ | 2016 Management Incentive Compensation Award Agreement |
21.1 | Subsidiaries of the Registrant. |
23.1 | Consent of Ernst & Young LLP. |
31.1 | Certification Statement of Chief Executive Officer pursuant to Section 302 of the Sarbanes-Oxley Act of 2002. |
31.2 | Certification Statement of Chief Financial Officer pursuant to Section 302 of the Sarbanes-Oxley Act of 2002. |
32.1 | Certification Statement of Chief Executive Officer pursuant to Section 906 of the Sarbanes-Oxley Act of 2002. |
32.2 | Certification Statement of Chief Financial Officer pursuant to Section 906 of the Sarbanes-Oxley Act of 2002. |
101.INS | XBRL Instance Document |
101.SCH | XBRL Taxonomy Extension Schema Document |
101.CAL | XBRL Taxonomy Extension Calculation Linkbase Document |
101.DEF | XBRL Taxonomy Extension Definition Linkbase Document |
101.LAB | XBRL Taxonomy Extension Label Linkbase Document |
101.PRE | XBRL Taxonomy Extension Presentation Linkbase Document |
(1) | Filed as Exhibit 2.1 to the Registrant’s Quarterly Report on Form 10-Q filed on May 14, 2010, and incorporated herein by reference. | |
(2) | Filed as Exhibit 2.2 to the Registrant’s Quarterly Report on Form 10-Q filed on May 14, 2010, and incorporated herein by reference. | |
(3) | Filed as Exhibit 3.1 to the Registrant’s Current Report on Form 8-K filed on May 28, 2010, and incorporated herein by reference. | |
(4) | Filed as Exhibit 3.1 to the Registrant’s Quarterly Report on Form 10-Q filed on May 11, 2015, and incorporated herein by reference. | |
(5) | Filed as Exhibit 4.1 to the Registrant’s Current Report on Form 8-K filed on May 28, 2010, and incorporated herein by reference. | |
(6) | Filed as Exhibit 99.2 to the Registrant’s Current Report on Form 8-K filed on February 20, 2007, and incorporated herein by reference. | |
(7) | Filed as Exhibit 4.1 to the Registrant’s Current Report on Form 8-K filed on August 9, 2016, and incorporated herein by reference. | |
(8) | Filed as Exhibit 4.1 to the Registrant’s Current Report on Form 8-K filed on August 9, 2016, and incorporated herein by reference. | |
(9) | Filed as Exhibit 10.1 to the Registrant's Current Report on Form 8-K filed on August 9, 2016, and incorporated herein by reference. | |
(10) | Filed as Exhibit 10.6 to the Registrant’s Current Report on Form 8-K filed on May 28, 2010, and incorporated herein by reference. | |
(11) | Filed as Exhibit 10.3 to the Registrant’s Quarterly Report on Form 10-Q filed on August 9, 2011, and incorporated herein by reference. | |
(12) | Filed as Exhibit 10.3 to the Registrant’s Quarterly Report on Form 10-Q filed on August 1, 2013, and incorporated herein by reference. | |
(13) | Filed as Exhibit 10.5 to the Registrant’s Quarterly Report on Form 10-Q filed on November 10, 2008, and incorporated herein by reference. | |
(14) | Filed as Exhibit 10.8 to the Registrant’s Quarterly Report on Form 10-Q filed on May 5, 2011 and incorporated herein by reference. | |
(15) | Filed as Exhibit 10.1 to the Registrant’s Quarterly Report on Form 10-Q filed on November 5, 2012, and incorporated herein by reference. | |
(16) | Filed as Exhibit 10.2 to the Registrant’s Quarterly Report on Form 10-Q filed on November 5, 2012, and incorporated herein by reference. | |
(17) | Filed as Exhibit 10.3 to the Registrant’s Quarterly Report on Form 10-Q filed on November 5, 2012, and incorporated herein by reference. | |
(18) | Filed as Exhibit 10.1 to the Registrant’s Quarterly Report on Form 10-Q filed on May 5, 2011, and incorporated herein by reference. | |
96
(19) | Filed as Exhibit 10.36 to the Registrant’s Annual Report on Form 10-K filed on March 12, 2009, and incorporated herein by reference. | |
(20) | Filed as Exhibit 10.4 to the Registrant’s Quarterly Report on Form 10-Q filed on May 5, 2011, and incorporated herein by reference. | |
(21) | Filed as Exhibit 10.5 to the Registrant’s Quarterly Report on Form 10-Q filed on November 5, 2012, and incorporated herein by reference. | |
(22) | Filed as Exhibit 10.46 to the Registrant’s Annual Report on Form 10-K filed on March 26, 2010, and incorporated herein by reference. | |
(23) | Filed as Exhibit 10.10 to the Registrant’s Quarterly Report on Form 10-Q filed on August 13, 2010, and incorporated herein by reference. | |
(24) | Filed as Exhibit 10.6 to the Registrant’s Quarterly Report on Form 10-Q filed on May 5, 2011, and incorporated herein by reference. | |
(25) | Filed as Exhibit 10.56 to the Registrant’s Registration Statement on Form S-4 filed on December 22, 2011, and incorporated herein by reference. | |
(26) | Filed as Exhibit 10.5 to the Registrant’s Quarterly Report on Form 10-Q filed on August 1, 2013, and incorporated herein by reference. | |
(27) | Filed as Exhibit 10.1 to the Registrant’s Quarterly Report on Form 10-Q filed on November 6, 2013, and incorporated herein by reference. | |
(28) | Filed as Exhibit 10.1 to the Registrant's Quarterly Report on Form 10-Q filed on May 8, 2014, and incorporated herein by reference. | |
(29) | Filed as Exhibit 10.2 to the Registrant's Quarterly Report on Form 10-Q filed on May 8, 2014, and incorporated herein by reference. | |
(30) | Filed as Exhibit 10.1 to the Registrant's Quarterly Report on Form 10-Q filed on August 5, 2014, and incorporated herein by reference. | |
(31) | Filed as Exhibit 10.2 to the Registrant's Quarterly Report on Form 10-Q filed on May 11, 2015, and incorporated herein by reference. | |
(32) | Filed as Exhibit 10.3 to the Registrant's Quarterly Report on Form 10-Q filed on May 11, 2015, and incorporated herein by reference. | |
(33) | Filed as Exhibit 10.1 to the Registrant's Current Report on Form 8-K filed on July 22, 2015, and incorporated herein by reference. | |
(34) | Filed as Exhibit 10.2 to the Registrant's Current Report on Form 8-K filed on July 22, 2015, and incorporated herein by reference. | |
(35) | Filed as Exhibit 10.3 to the Registrant's Current Report on Form 8-K filed on July 22, 2015, and incorporated herein by reference. | |
(36) | Filed as Exhibit 10.54 to the Registrant’s Annual Report on Form 10-K filed on March 14, 2016, and incorporated herein by reference. | |
(37) | Filed as Exhibit 10.1 to the Registrant’s Quarterly Report on Form 10-Q filed on October 27, 2016, and incorporated herein by reference. | |
(38) | Filed as Exhibit 10.2 to the Registrant’s Quarterly Report on Form 10-Q filed on October 27, 2016, and incorporated herein by reference. | |
(39) | Filed as Exhibit 10.1 to the Registrant’s Current Report on Form 8-K filed on May 10, 2016, and incorporated herein by reference. | |
(40) | Filed as Exhibit 10.1 to the Registrant’s Quarterly Report on Form 10-Q filed on August 2, 2016, and incorporated herein by reference. | |
+ | Management contract or compensatory arrangement or plan. | |
* | The following exhibits to the Joint Prepackaged Plan of Reorganization were filed with the bankruptcy court, which, as permitted by Item 601(b)(2) of Regulation S-K, have been omitted from this Annual Report on Form 10-K. We will furnish supplementally a copy of any exhibit to the Joint Prepackaged Plan of Reorganization to the Securities and Exchange Commission upon request. | |
Exhibit A | Amended and Restated Credit Facility | |
Exhibit B | Commitment Letter | |
Exhibit C | New Management Incentive Plan | |
Exhibit D | New Warrants | |
Exhibit E | Executory Contracts and Unexpired Leases to be Rejected | |
97
Exhibit F | Amended and Restated Pledge and Security Agreement | |
Exhibit G | Austria Contribution Agreement | |
Exhibit H | Austria Note | |
Exhibit I | Austria Purchase Agreement | |
Exhibit J | Canada Direction Letter Agreement | |
Exhibit K | Exit Facility Credit Agreement | |
Exhibit L | Exit Facility Pledge and Security Agreement | |
Exhibit M | Germany Assumption Agreement | |
Exhibit N | Intercreditor Agreement | |
Exhibit O | Nominating Agreement | |
Exhibit P | Registration Rights Agreement | |
Exhibit Q | Restated Bylaws of each Reorganized Debtor | |
Exhibit R | Restated Charters of each Reorganized Debtor | |
Exhibit S | Shareholder Rights Plan | |
Exhibit T | U.S. Direction Letter Agreement | |
Exhibit U | Initial Directors and Initial Officers of the Reorganized Debtors | |
Exhibit V | Retained Actions | |
Exhibit W | Additional Intercompany Transactions | |
98
XERIUM TECHNOLOGIES, INC.
SCHEDULE II
VALUATION AND QUALIFYING ACCOUNTS
(dollars in thousands)
ALLOWANCE FOR DOUBTFUL ACCOUNTS
For the years ended:
Balance at Beginning of Year | Charged to Cost and Expense | Effect of Foreign Currency Translation | Deduction from Reserves | Balance at End of Year | |||||||||||||||
2016 | $ | 5,184 | $ | 275 | $ | 27 | $ | (1,866 | ) | $ | 3,620 | ||||||||
2015 | $ | 5,002 | $ | 1,117 | $ | (641 | ) | $ | (294 | ) | $ | 5,184 | |||||||
2014 | $ | 5,553 | $ | 274 | $ | (579 | ) | $ | (246 | ) | $ | 5,002 | |||||||
ALLOWANCE FOR SALES RETURNS
For the years ended:
Balance at Beginning of Year | Charged to Revenue | Effect of Foreign Currency Translation | Deduction from Reserves | Balance at End of Year | |||||||||||||||
2016 | $ | 4,036 | $ | 2,258 | $ | 139 | $ | (2,274 | ) | $ | 4,159 | ||||||||
2015 | $ | 5,052 | $ | 2,173 | $ | (687 | ) | $ | (2,502 | ) | $ | 4,036 | |||||||
2014 | $ | 7,074 | $ | 5,453 | $ | (6,937 | ) | $ | (538 | ) | $ | 5,052 | |||||||
ALLOWANCE FOR CUSTOMER REBATES
For the years ended:
Balance at Beginning of Year | Charged to Revenue | Effect of Foreign Currency Translation | Deduction from Reserves | Balance at End of Year | |||||||||||||||
2016 | $ | 1,685 | $ | 36 | $ | (20 | ) | $ | (619 | ) | $ | 1,082 | |||||||
2015 | $ | 1,595 | $ | 1,296 | $ | (101 | ) | $ | (1,105 | ) | $ | 1,685 | |||||||
2014 | $ | 1,314 | $ | 1,009 | $ | (129 | ) | $ | (599 | ) | $ | 1,595 | |||||||
INCOME TAX VALUATION ACCOUNT
For the years ended:
Balance at Beginning of Year | Charged to (Credited to) Income Tax Provision | Effect of Foreign Currency Translation (1) | Deduction from Reserves | Balance at End of Year | |||||||||||||||
2016 | $ | 94,330 | $ | 6,473 | $ | (1,982 | ) | $ | (962 | ) | $ | 97,859 | |||||||
2015 | $ | 102,795 | $ | 2,422 | $ | (8,932 | ) | $ | (1,955 | ) | $ | 94,330 | |||||||
2014 | $ | 99,859 | $ | 7,519 | $ | 2,042 | $ | (6,625 | ) | $ | 102,795 | ||||||||
(1) This includes amounts recorded to accumulated other comprehensive income (loss).
99