Attached files
| file | filename |
|---|---|
| EX-32.1 - EX-32.1 - Bankrate, Inc. | rate-20161231xex32_1.htm |
| EX-32.2 - EX-32.2 - Bankrate, Inc. | rate-20161231xex32_2.htm |
| EX-31.2 - EX-31.2 - Bankrate, Inc. | rate-20161231xex31_2.htm |
| EX-31.1 - EX-31.1 - Bankrate, Inc. | rate-20161231xex31_1.htm |
| EX-24.1 - EX-24.1 - Bankrate, Inc. | rate-20161231xex24_1.htm |
| EX-23.1 - EX-23.1 - Bankrate, Inc. | rate-20161231xex23_1.htm |
| EX-21.1 - EX-21.1 - Bankrate, Inc. | rate-20161231xex21_1.htm |
| EX-10.22 - EX-10.22 - Bankrate, Inc. | rate-20161231xex10_22.htm |
| EX-10.17 - EX-10.17 - Bankrate, Inc. | rate-20161231xex10_17.htm |
UNITED STATES
SECURITIES AND EXCHANGE COMMISSION
Washington, D.C. 20549
FORM 10-K
(Mark One)
|
|
☑ |
ANNUAL REPORT PURSUANT TO SECTION 13 OR 15(d) OF THE SECURITIES EXCHANGE ACT OF 1934 FOR THE FISCAL YEAR ENDED DECEMBER 31, 2016 |
OR
|
|
☐ |
TRANSITION REPORT PURSUANT TO SECTION 13 OR 15 (d) OF THE SECURITIES EXCHANGE ACT OF 1934 FOR THE TRANSITION PERIOD FROM TO |
Commission File No. 1-35206

(Exact name of registrant as specified in its charter)
|
Delaware |
65-0423422 |
|
|
(State or other jurisdiction of incorporation or organization) |
(I.R.S. Employer Identification No.) |
|
|
1675 Broadway, 22nd Floor New York, NY |
10019 |
|
|
(Address of principal executive offices) |
(Zip Code) |
Registrant’s telephone number, including area code: (917) 368-8600
Securities registered pursuant to Section 12(b) of the Exchange Act:
|
|
|
|
|
Title of Each Class |
Name of Each Exchange on Which Registered |
|
|
Common Stock, $0.01 Par Value |
New York Stock Exchange |
Securities registered pursuant to Section 12(g) of the Exchange Act: None
Indicate by check mark if the registrant is a well-known seasoned issuer, as defined in Rule 405 of the Securities Act. Yes ☐ No ☑
Indicate by check mark if the registrant is not required to file reports pursuant to Section 13 or Section 15(d) of the Act. Yes ☐ No ☑
Indicate by check mark whether the registrant: (1) has filed all reports required to be filed by Section 13 or 15(d) of the Securities Exchange Act of 1934 during the preceding 12 months (or for such shorter period that the registrant was required to file such reports), and (2) has been subject to such filing requirements for the past 90 days. Yes ☑ No ☐
Indicate by check mark whether the registrant has submitted electronically and posted on its corporate Web site, if any, every Interactive Data File required to be submitted and posted pursuant to Rule 405 of Regulation S-T (§232.405 of this chapter) during the preceding 12 months (or for such shorter period that the registrant was required to submit and post such files). Yes ☑ No ☐
Indicate by check mark if disclosure of delinquent filers pursuant to Item 405 of Regulation S-K is not contained herein, and will not be contained, to the best of registrant’s knowledge in definitive proxy or information statements incorporated by reference in Part III of this Form 10-K or any amendment of this Form 10-K. ☑
Indicate by check mark whether the registrant is a large accelerated filer, an accelerated filer, a non-accelerated filer, or a smaller reporting company. See definitions of “large accelerated filer,” “accelerated filer” and “smaller reporting company” in Rule 12b-2 of the Exchange Act.
|
Large accelerated filer ☐ |
Accelerated filer ☑ |
|
|
Non-accelerated filer ☐(Do not check if a smaller reporting company) |
Smaller reporting company ☐ |
Indicate by check mark whether the registrant is a shell company (as defined in Rule 12b-2 of the Exchange Act). Yes☐ No ☑
The aggregate market value of the registrant’s outstanding common stock held by non-affiliates of the registrant computed by reference to the price at which the common stock was last sold as of the last business day of the registrant’s most recently completed second fiscal quarter was $341,615,552 (based on a closing price of $7.48 per share for the registrant’s common stock on the New York Stock Exchange on June 30, 2016).
The number of outstanding shares of the issuer’s common stock as of February 28, 2017 was as follows: 89,915,676 shares of Common Stock, $0.01 par value.
Table of Contents
Bankrate, Inc. and Subsidiaries
Annual Report on Form 10-K for the Year Ended December 31, 2016
2
CAUTIONARY STATEMENT CONCERNING FORWARD-LOOKING STATEMENTS
This Annual Report on Form 10-K contains “forward-looking statements” which involve risks and uncertainties. You can identify forward-looking statements because they contain words such as “believes,” “expects,” “may,” “should,” “seeks,” “approximately,” “intends,” “plans,” “estimates,” or “anticipates” or similar expressions that relate to our strategy, plans or intentions. All statements we make relating to our estimated and projected earnings, margins, revenues, costs, expenditures, cash flows, growth rates, strategy and financial results or to our expectations regarding future industry trends and competitive dynamics or regarding resolution of litigation or governmental matters described in this Annual Report on Form 10-K are forward-looking statements. In addition, we, through our senior management, from time to time make forward-looking public statements concerning our expected future operations and performance and other developments. These forward-looking statements are subject to risks and uncertainties that may change at any time, and, therefore, our actual results may differ materially from those that we expected. We derive many of our forward-looking statements from our operating budgets and forecasts, which are based upon certain assumptions. While we believe that our assumptions are reasonable, we caution that it is very difficult to predict the impact of known or unknown factors, and it is impossible for us to anticipate all factors that could affect our actual results. All forward-looking statements are based upon information available to us on, and speak only as of, the date of this report.
Important factors that could cause actual results to differ materially from our expectations, which we refer to as cautionary statements, are discussed in detail in Part I, Item 1A. “Risk Factors” in this Annual Report on Form 10-K. All forward-looking information in this Annual Report on Form 10-K and subsequent written and oral forward-looking statements attributable to us, or persons acting on our behalf, are expressly qualified in their entirety by the cautionary statements. Some of the factors that we believe could affect our results include without limitation:
|
· |
the willingness or interest of credit card issuers, banks, lenders, brokers, senior care providers and other advertisers in the business verticals in which we operate to advertise on our websites or mobile applications, or purchase our leads, clicks, calls and referrals; |
|
· |
changes in application approval rates by our credit card issuer customers; |
|
· |
increased competition and its effect on our website traffic, click-through rates, advertising rates, margins, and market share; |
|
· |
our dependence on internet search engines to attract a significant portion of the visitors to our websites and our ability to diversify the sources from which we obtain visitor traffic to our websites and mobile applications, including without limitation through use of social media channels; |
|
· |
changes in the way that search engines display paid and organic search results and the impact of those changes on the number of consumers that visit our online network; |
|
· |
the cost of driving consumers to our online network, including without limitation our ability to generate traffic profitably through online and offline marketing channels and branding efforts; |
|
· |
our dependence on traffic from our partners to produce a significant portion of the Company’s revenue and our ability to establish and maintain distribution arrangements; |
|
· |
the willingness of consumers to accept the Internet and our online network as a medium for obtaining information on financial products or senior care; |
|
· |
shift of visitors from desktop to mobile and mobile app environments; |
|
· |
the rate of conversion of consumers’ visits to our websites or mobile applications into senior care referrals and the rate at which those referrals result in move-ins with our senior care customers; |
|
· |
the number of consumers seeking information about the financial and senior care products we have on our websites or mobile applications; |
|
· |
our ability to successfully execute on our strategies, and the effectiveness of our strategies and investments in our business, including without limitation whether they result in increased revenue or profitability; |
|
· |
risks relating to the defense or litigation of lawsuits; |
|
· |
the timing and outcome of, including potential expense associated with, and the potential impact on our business and stock price of any announcements regarding, the United States Department of Justice (“DOJ”) investigation; |
|
· |
the timing and outcome of, including potential expense associated with, and the potential impact on our business and stock price of any announcements regarding, the Consumer Financial Protection Bureau (“CFPB”) investigation; |
|
· |
the costs of indemnification obligations to current and former directors, officers and employees; |
|
· |
any delay or failure to collect the deferred portion of the purchase price due to us in connection with the sale of the Company’s Insurance business in December 2015; |
|
· |
our ability to anticipate and manage cybersecurity risk and data security risk and to mitigate or resolve issues that may arise; |
|
· |
the effects of any security breach, data breach or cyberattack on our systems, websites or mobile applications, or on our reputation, and the impact of any notification costs or other liability arising from any security breach, data breach or cyberattack on our business; |
|
· |
technological changes and our ability to adapt to new or evolving technologies that affect our business environment or operations; |
|
· |
the material weakness in our internal controls over financial reporting and our ability to rectify this issue completely and promptly; |
|
· |
our ability to otherwise maintain effective disclosure controls and procedures and internal control over financial reporting; |
|
· |
our ability to manage traffic on our websites or mobile applications, and service interruptions; |
|
· |
our indebtedness and the effect such indebtedness may have on our business; |
|
· |
our need and our ability to obtain additional debt or equity financing; |
|
· |
our ability to integrate the operations and realize the expected benefits of businesses that we have acquired, including without limitation the NextAdvisor business, and businesses we may acquire in the future; |
|
· |
the effect of unexpected liabilities we assume (whether intentional or not) from our acquisitions; |
|
· |
our ability to attract and retain executive officers and personnel; |
|
· |
any failure or refusal by our insurance providers to provide coverage under our insurance policies; |
|
· |
our ability to protect our intellectual property; |
|
· |
the effects of potential liability for content on our websites or mobile applications; |
|
· |
the effect of our operations in the United Kingdom and possible expansion to other international markets, in which we may have limited experience, and our ability to successfully execute on our business strategies in international markets; |
|
· |
risks associated with the wind down of our operations in China; |
|
· |
the strength of the U.S. economy in general and the financial services industry in particular; |
|
· |
changes in monetary and fiscal policies of the U.S. government and interest rate volatility; |
|
· |
review of our business and operations by regulatory or other governmental authorities; |
|
· |
changes in laws and regulations or interpretations of laws and regulations, other changes in the legal and regulatory environment, and the impact of such changes on the operation of our business; |
|
· |
any further impairment to our goodwill and/or intangible assets, including without limitation further impairment of the goodwill of our Banking or Senior Care reporting units; |
|
· |
changes in accounting principles, policies, practices or guidelines; and |
|
· |
our ability to manage the risks involved in the foregoing. |
We caution you that the foregoing list of important factors may not contain all of the material factors that are important to you. In addition, in light of these risks and uncertainties, the matters referred to in the forward-looking statements contained in this Annual Report on Form 10-K may not in fact occur. Accordingly, investors should not place undue reliance on those statements. We undertake no obligation to publicly update or revise any forward-looking statement as a result of new information, future events or otherwise, except as otherwise required by law.
3
|
PART I. |
Overview
Bankrate, Inc. and its subsidiaries (“Bankrate” or the “Company,” “we,” “us,” “our”) aggregate large scale audiences of in-market consumers by providing them with proprietary, fully researched, comprehensive, independent and objective personal finance and senior care editorial content across multiple verticals including credit cards, mortgages, deposits, senior care and other categories, such as retirement, automobile loans, credit management techniques and taxes. Our comprehensive content offering and product research has positioned us as a recognized personal finance and senior care authority for consumers. Top media outlets, such as The Wall Street Journal, Associated Press, CNBC, USA Today and Forbes, regularly turn to us for our proprietary data or as an expert source for their audience. Our flagship websites CreditCards.com, Bankrate.com and Caring.com are leading vertical content destinations in each of their respective categories and connect our audience with financial service and senior care providers and contextually relevant advertisers. We also own and operate a number of specialist sites, blogs, apps and social platforms, including The Points Guy, NextAdvisor.com, MillionMileSecrets.com, Interest.com, Quizzle.com, Walla.by and SeniorHomes.com. In addition, we distribute our content on a daily basis to over 100 online partners and print publications, including some of the most recognized brands in the United States.
Our business benefits from the secular shift toward consumers researching and shopping for personal finance products online. The Internet’s unique aggregation capabilities allow consumers to access and research vast amounts of information to efficiently compare prices and enable an informed purchase decision. We believe this is driving consumers to increasingly research and engage online for personal finance products and shift away from more traditional buying patterns. We stand to benefit from this major secular shift as a result of our leading position online in the personal financial services markets driven by our strong brands, proprietary and aggregated content, breadth and depth of personal finance products, broad distribution, leading position in algorithmic search results, and paid marketing and monetization capabilities.
Founded as a financial and market data research business, Bankrate began moving from print-based to online in 1996. We have strategically broadened and diversified our product, content and consumer offerings through internal development activities and acquisitions. We now offer:
|
· |
branded content that educates consumers and financial professionals on a variety of personal finance topics; |
|
· |
credit card offers, comparison capabilities and content for consumer and business credit cards in the United States, the United Kingdom and Canada through our leading network of credit card websites; |
|
· |
a market leading platform for consumers searching for competitive rates on mortgages, deposits, money market accounts and other personal finance categories; |
|
· |
helpful caregiving content, a comprehensive online senior living community directory for the United States, a local directory covering a wide array of other senior caregiving services, and telephone support and advice from trained Family Advisors to consumers looking for senior care options; and |
|
· |
personal financial service offerings including credit monitoring. |
Our unique content and rate information is distributed through two main sources: through our owned and operated websites and online co-brands, and through our partners. We own a network of content-rich, proprietary websites focused on specific vertical categories, including credit cards, mortgages, deposits, senior care and other personal finance categories. We also develop and provide content, tools, web services and co-branded websites to approximately 100 online partners, including some of the most trusted and frequently visited personal finance sites on the Internet including Bloomberg, Kiplinger, MarketWatch, TheStreet.com and Yahoo!.
Our primary sources of revenue are consumer credit card accounts, consumer inquiries and senior care community residents that we deliver to our financial service and senior care provider customers, and display advertising. During the year ended December 31, 2016, we generated revenue of $434.2 million, net loss from continuing operations of $34 million, Adjusted EBITDA of $114.8 million and cash flow provided by operating activities of $79.8 million. During the year ended December 31, 2015, we generated revenue of $372 million, net income from continuing operations of $16.8 million, Adjusted EBITDA of $127.1 million, and cash flow provided by operating activities of $86 million. Financial results for all periods presented have been adjusted for the reclassification of the results of our China operations from a discontinued operation to continuing operations as we initiated the process of winding down our operations in China after negotiations with potential buyers did not result in a transaction. See “Selected Financial Data” for a reconciliation of Adjusted EBITDA to net income.
Segments
Our business is organized into the following reportable segments:
|
· |
Credit Cards – we present visitors with a comprehensive selection of consumer and business credit and prepaid cards, providing detailed information and comparison capabilities, and host news and advice on personal finance and on credit card and bank policies, as well as tools, calculators, products and services to estimate credit scores and card benefits, provide identity theft protection and credit monitoring. |
|
· |
Banking – we offer information on rates for various types of mortgages, home lending and refinancing options, specific to geographic location and covering all 50 states, and personal and auto loans; rate information on various deposit products such as money markets, savings and certificates of deposits; and information on retirement, taxes and debt management. This segment also provides original articles on topics related to the housing market and loan refinancing; provides online analytic tools and services to calculate investment values, provide home loan estimates and recommendations, budget planning and credit reports and monitoring; and provides content on topics such as retirement 401(k) accounts, Social Security, tax deductions and exemptions, auto loans, debt consolidation and management and credit risk and credit management techniques. |
|
· |
Senior Care – we offer visitors information on a variety of senior care services and support as they care for aging parents and loved ones. We provide thousands of original articles, helpful tools, a comprehensive online senior living community directory for the United States and a local directory covering a wide array of other senior caregiving services. |
|
· |
Other – includes unallocated corporate overhead, the elimination of transactions between segments and the wind down of our China operations. |
For financial information about our reportable segments for the years ended December 31, 2016, 2015 and 2014, see Item 7 – Management’s Discussion and Analysis of Financial Conditions and Results of Operations, and Item 8, Note 6 – Segment Information, Geographic Data and Concentrations.
Company Developments
Acquisitions
The Company has grown significantly in size and scope of offerings via acquisitions. In 2014 we acquired Caring, Inc. (“Caring”), which provides editorial content on senior living and trained senior living advisors and provides us access to the fast growing senior care market. In 2015 we acquired (i) SeniorHomes.com, which complements our Senior Care business and increases our penetration into the senior care market; (ii) Quizzle, LLC (“Quizzle”), which operated Quizzle.com and is now integrated into our Banking segment, complementing our financial services offerings with a national free credit report and monitoring site that provides users with free credit scores and credit reports, as well as offering credit monitoring and identity protection services; and (iii) certain assets of LoanTek, Inc., (“LoanTek”), which complements the financial service offerings in our Banking segment with subscription based mortgage software solutions, including pricing engines, offered to mortgage companies and other loan originators. In 2016 we acquired certain assets of Next Advisor, Inc. (the “Acquired NextAdvisor Business”), an online source of research and reviews of credit cards, personal finance and internet services. The objective of this acquisition was to accelerate growth in our credit cards business, broadening our reach and increasing the number of ways we engage consumers looking for credit cards.
In each case these acquisitions enabled us to strengthen our offering to providers seeking high quality leads and new consumers who are looking for a comprehensive suite of financial and senior care services. These acquisitions have strengthened our position through increased selection of products and increased scale of our audience resulting in greater appeal to personal financial services partners.
Divestiture
In 2015, we sold our Insurance business, including NetQuote Holdings, Inc. and its subsidiaries (“NetQuote”), which we had acquired in 2010, along with other assets used in the operation of the Insurance business for a price comprised of (i) $140.0 million in cash paid to us at closing, plus $200,000 for cash to remain at the Insurance business companies, and (ii) $23.1 million to be paid to us on the second anniversary of the closing date.
Secondary Offering
In 2014, the Company completed a secondary offering (the “Offering”) of 16,100,000 shares of common stock (the “Shares”) owned by Ben Holding S.à r.l. (an entity wholly owned by Apax VII Funds which are advised by Apax Partners L.P. and Apax Partners LLP). The Company did not receive any of the proceeds from the Offering. The Offering was made pursuant to the Company’s shelf registration statement on Form S-3, filed with the SEC on February 27, 2014, and related prospectus supplement dated March 4, 2014.
Industry
The Internet has evolved into one of the most effective and comprehensive sources for personal finance content. Traditionally, consumers used sources of information such as word-of-mouth, referrals, newspapers and mortgage guides to research and address their financial needs. However, these approaches are often time consuming, error prone, and not transparent. Widespread access to the Internet and availability of content and the benefits associated with shopping and researching online has allowed consumers to increasingly rely on the Internet for their financial shopping needs. Using the Internet, consumers can search for and compare financial products and services across multiple sites and choose the right alternative for them.
Companies continue to expand their online marketing efforts to reach this large and growing online audience cost-effectively. As website traffic grows, online advertising continues to grow as a share of overall advertising. In a 2015 study, eMarketer noted that U.S. internet advertising continues to be the fastest growing advertising medium with forecasted annual average growth of 17% from 2014 to 2019. eMarketer also estimated that internet advertising will increase its share of the U.S. advertising market from 31.6% in 2015 to 41.1% in 2019. Additionally, eMarketer forecast an annual average growth rate of 13% for U.S. internet advertising for financial services from 2014 to 2019. The main driver of U.S. and global advertising spend growth is mobile and it is estimated that mobile will contribute 87% of all new global ad spend between 2015 and 2018. We believe our business will continue to benefit as the percentage of advertising dollars spent online increases to reflect the greater amount of media consumed online.
Our Solution
We provide consumers and institutions with a comprehensive personal finance marketplace through our leading content-rich flagship websites: CreditCards.com, Bankrate.com, Caring.com, and our other branded personal finance destination websites. We allow consumers to shop for a wide variety of financial products and services online, including credit cards, mortgages, deposit accounts and senior living community options. We offer fully researched, independent and objective financial content to our in-market visitor base. We understand the importance of critical financial decisions and have designed our solutions to provide relevant information, content and advice to consumers to help them make the right decisions more efficiently and conveniently. We provide information, options and support for consumers as they cope with the emotional stress and importance of decisions related to finding care for aging parents and loved ones. Our brands and the scale and quality of our content have helped us attract increasing numbers of in-market consumers over the years. As more consumers visited and researched personal finance products on our websites, more financial institutions listed their products and services with us. The combination of an increasing amount of consumers seeking personal finance products online and more companies providing products and services online increases the quality, depth and breadth of our offerings and attracts even more consumers, advertisers and institutions as a result. Additionally, the prominence of our brands, the quality of our content, the engineering architecture and interface of our sites, and other factors that drive relevance have generally resulted in prominent placement in financial services search results from the leading search engines. This increased distribution via search provides additional traffic to our websites, again further attracting more partners and resulting in increased selection of personal finance products and more content. This virtuous cycle has enabled us to reinforce our leadership position and achieve a loyal advertiser and consumer base.
Our Strengths
Market Leader for Personal Finance Content. We are a leading publisher, aggregator and distributor of personal finance content on the Internet. We believe our leading position will continue to enable us to take advantage of the secular shift to the Internet as a source of personal finance solutions, including a broad range of personal finance services products across numerous verticals including credit cards, mortgages, deposits, senior care and other personal finance categories, including retirement, automobile loans, credit reports, credit scores, budget planning and taxes, and a great depth of selection in each category. Our selection both across and within these categories is a key differentiator in the value proposition to consumers.
Leading Consumer Brands. We have built strong, recognizable and highly trusted brands over our long history. We believe this is an important competitive differentiator. Furthermore, the strength of our brands has permitted us to be a partner of choice for other leading personal finance content providers and other general interest publishers.
High Quality, Proprietary Content, Driving Consistent Leadership in Search Results. We provide consumers with proprietary, researched, independent and objective personal finance content, data and tools. Our editorial staff consists of editors, reporters, expert columnists and freelancers delivering “best in class” content and providing news and advice through hundreds of new articles per month on top of approximately 53,000 stories in our database. We actively list approximately 200 credit card offers on our websites and have a robust, proprietary card repository of over 3,300 products. We aggregate rate information from institutions for more than 300 financial products in more than 600 local markets. Our senior care directory has information regarding more than 20,000 senior housing facilities including over 7,000 to which we can refer consumers.
Diversified Traffic Sources. Our leadership in search results is complemented by our expertise in paid marketing. We generate traffic from a variety of paid marketing channels including search engine marketing, display advertising and content marketing. Paid marketing represents a growing share of our traffic, and has diversified the sources of traffic to our owned and operated sites. We also advertise our CreditCards.com site through traditional media (e.g., television).
Long-term Relationships with Leading Financial Institutions. We have long-term relationships with the leading institutions in our markets. We have relationships that are on average over 15 years old for our largest five customers. Financial institutions typically pay us only when in-market consumers are approved for one of their credit cards, specifically express interest in their bank offerings or place a new resident in one of their facilities. Moreover, for much of our revenue these financial institutions effectively set the pricing via their participation in an auction process. This business model design allows financial institutions to set their spending to drive profitability.
Superior Distribution Platforms. Our unique content and rate information is distributed through two main sources: our owned and operated websites, and through partners and affiliates. This distribution network enables us to drive large amounts of high quality traffic to our network while increasing our brand awareness in a cost-effective way.
Consistent, Strong Cash Flow. Alignment with our customers goals, combined with a highly scalable infrastructure, has resulted in strong cash flow. Our cash flow from operations was $79.8 million, $86.0 million and $42.5 million in our 2016, 2015 and 2014 fiscal years, respectively.
Strong, Experienced Management Team. Our management team has an in-depth understanding of the online media and personal finance industries as well as extensive experience growing companies' profitability, both organically and through acquisitions.
Our Growth Strategy
We believe that the personal finance sector contains significant opportunities for growth. Elements of our strategy include:
Maintaining Leadership as a Trusted and Authoritative Source for Personal Finance Content and Information about Senior Care. We are focused on maintaining our position as a leading destination platform for personal finance information. We intend to continuously enhance the consumer experience and engagement on our websites to help us maintain this leadership position. One of the primary ways that we seek to differentiate ourselves is through the quality, breadth and depth of our financial content and data. As consumers increase their usage of the Internet as a tool for personal finance needs, we intend to maintain and improve our position in online comparative research for credit cards, mortgages, deposit products, senior care and potentially in additional personal finance markets.
Increasing Traffic to Our Network. We believe our unique and differentiated content offering, the strength of our brands and our marketing efforts will allow us to drive substantial traffic to our online network. We intend to continue to focus on efforts that explicitly drive traffic to our online network including providing highly relevant search results, public relations, social media efforts, paid search efforts, increasing the size of our co-brand partner network and print partnerships. In 2017 and beyond, we anticipate increasing the investment in our CreditCards.com brand through offline marketing.
Continuing to Increase Monetization of Our Traffic. By advertising on our online network, credit card issuers, banks, brokers, senior care communities and other advertisers are accessing targeted, quality consumers. By allowing advertisers to efficiently access these “in-market” consumers, we are ultimately creating a transaction that is beneficial for the advertiser, the consumer and us. As we continue to improve customer engagement and drive traffic to our online network to reach a greater number of users, we expect to strengthen our relationships with existing advertisers and build new relationships with potential advertisers. We intend to continuously enhance our product offering and targeting capabilities to advertisers to ensure we are increasing our monetization of content and traffic.
Establish an Ongoing and Personalized Relationship with Our Audience. By providing tools and services such as free credit reporting and transaction monitoring, in addition to personalized offers that anticipate consumers’ individual needs, we believe we can build a meaningful base of consumers who have an ongoing relationship with one or more of our flagship sites. We believe we will benefit from connecting these consumers with products and providers they are interested in, without the cost of “re-acquiring” the customer for each transaction.
Developing New Products that Increase the Quality of Our Offering to Consumers, Advertisers and Partners. By enhancing and expanding our product set, we seek to maintain our industry leadership. The key goals of all of our product development efforts are to satisfy consumers, drive traffic, increase monetization and increase affiliate and partner opportunities. Examples of some areas that our product development teams are currently focused on include using advanced analytics and data testing to enhance site infrastructure for ongoing optimization and improving site design for increased engagement, creating new tools to enhance offerings of our affiliates and partners’ apps and mobile platforms, initiatives to enhance the end-to-end mobile experience and, as referenced above, initiatives to broaden our consumer relationships from being transaction oriented to an ongoing relationship anticipating consumer needs.
Pursuing Additional Strategic Acquisitions. Acquiring businesses continues to be a strategic focus for us. We believe our industry relationships allow us to identify specialized companies that are attractive acquisition candidates. We intend to continue to pursue strategic growth opportunities that complement our online network to cost-effectively gain market share and strengthen our content portfolio.
Our Products and Services
Consumers
As a leading provider of personal finance content, we offer our consumers deep and broad information, analytics and advice across multiple categories of personal finance including: (i) credit cards, (ii) deposits, (iii) mortgages and home lending, (iv) senior care, and (v) other financial products, including those related to retirement, tax, autos, credit scores and reports and debt management.
We aggregate rate information from institutions for more than 300 financial products in more than 600 local markets in all 50 states. In addition, we offer customizable search and compare capabilities, as well as analytic tools to calculate value and costs. We believe our comprehensive marketplace of real-time, easily accessible, and relevant information equips consumers with the right tools to make informed personal finance decisions.
We operate a select group of content-rich, branded destination websites including, but not limited to, CreditCards.com, Bankrate.com and Caring.com.
|
· |
Credit Cards. We present a comprehensive selection of consumer and business credit and prepaid cards. We provide detailed credit card information and comparison capabilities, as well as relevant personal finance and credit card content, and allow consumers to search for cards that cater to their specific needs. We display cards by various attributes including by bank or issuer, card network, credit quality, and type of card, such as reward, cash back or low interest. |
|
· |
Mortgages and Home Lending. We offer information on rates for various types of mortgages, home lending and refinancing. We maintain current rate information for more than 600 local markets, covering all 50 U.S. states. Consumers can customize searches for mortgage rates by loan size, type, maturity, and location through our online portals. We also provide calculators and original editorial content that cover topics such as trends in housing markets and refinancing perspectives to help consumers with their decision making. |
|
· |
Deposits. We offer rate information on various deposit products such as money market accounts, savings accounts and certificates of deposit. We also provide online analytical tools to help consumers calculate investment value using customized inputs. |
|
· |
Personal Loans. We present a selection of personal loan products, along with information that assists consumers in understanding this product category. |
|
· |
Senior Care. We provide helpful caregiving content, a comprehensive online senior living community directory for the United States, a local directory covering a wide array of other senior caregiving services, and telephone support and advice from trained Family Advisors. |
|
· |
Other Personal Finance Products. Relevant content is provided on topics including retirement 401(k) accounts, Social Security, tax deductions and exemptions, auto loans, debt consolidation and management and credit risk and credit management techniques. |
Advertisers
We believe advertisers appreciate our value proposition as one of the leading personal finance content providers. Our relevant and proprietary content attracts consumers who are actively searching for personal finance products, allowing advertisers to effectively reach their target customer base. Our trusted reputation as an objective provider of reliable information further drives traffic and establishes a credible platform for advertisers to list their offers. We also offer advertisers an attractive path to access high quality consumer inquiries, all of which have resulted in the continued growth of our advertiser relationships.
We provide consumer inquiries in the credit card, banking and senior care verticals. In credit cards, consumer inquiries are a click or phone call to our advertisers; in banking, consumer inquiries are delivered in the form of clicks and calls; and in senior care, consumer inquiries are qualified contacts delivered though our call center.
Our leading credit card comparison marketplace is one of the largest third party online consumer inquiry and application sources for major credit card issuers. We primarily earn and recognize revenue after a consumer has: (i) clicked on and through a card offer on one of our or our partners’ websites, (ii) completed an application at the card issuers’ site and (iii) received approval on the card application.
In our banking vertical, advertisers that are listed in our rate tables have the opportunity to hyperlink their listings and provide a phone number. By clicking on the hyperlink, users are taken to the advertiser’s website. We typically charge our advertisers per delivered consumer inquiry. Under this arrangement, advertisers pay Bankrate each time a consumer clicks on that advertiser’s hyperlink or calls the phone number. All clicks and calls are screened for fraudulent characteristics by an independent third party vendor and the filtered clicks and calls are then charged to the customer’s account.
In the senior care vertical, we deliver consumer inquiries to contracting senior living communities. After qualifying the inquiries through our call center and referring them to a number of participating senior living communities, we earn a referral fee for a consumer who moves in. We also deliver consumer leads to contracting in-home care providers, for which we receive fees on a per-lead basis.
In the banking and senior care verticals, we also charge for a variety of digital ad display formats. Our most common digital display advertisement sizes are leader boards and flex units, which are prominently displayed at the top, bottom or sides of a page. We charge for these advertisements based on the number of times the advertisement is displayed or based on a fixed amount for a campaign. Advertising rates may vary depending upon the product areas targeted, geo-targeting, the quantity of advertisements purchased by an advertiser, and the length of time an advertiser runs an advertisement on our online network. We sell to advertisers targeting a specific audience in a city or state and also to national advertisers targeting the entire country.
Sales Strategy
We have sales teams that are dedicated to specific vertical categories and customer groups, giving them greater expertise in designing solutions for our advertisers, and also have sales personnel serving our national, regional and local advertising customers. For example we have separate sales teams trained and dedicated to serving credit card issuers, local, regional and national banks, local mortgage companies and senior living chains and independent senior living communities.
Our selling strategy focuses on leveraging our core strengths in a flexible manner to respond to our customers’ specific requirements. For example, in collaborating with a large branded bank, we may feature a branded cost-per-thousand-impressions-based display campaign if the advertiser plans to compete primarily on brand and visibility on our sites. A different advertiser may be focused on competing directly on the basis of superior rates and therefore a rate table cost-per-click or cost-per-call approach may be more beneficial than a cost-per-impression model. Other advertisers may be interested in maximizing conversion and achieving a specific return on investment, and given the conversion rates of our traffic, a per-action or per-click solution may be the most appropriate in such a case. This array of advertising options and ability to tailor a campaign to our advertisers’ needs results in more revenue for us, better information for our consumers and superior consumer traffic and conversions for our customers. We have the capability to execute on this selling strategy not only because of our wide variety of product monetization options (per-thousand-impressions, per-click, per-call, per-action and per-move in), but also because we have highly developed direct relationships with our customers. We work directly with top branded banks, credit card issuers, mortgage lenders and senior care communities. Our sales teams are very knowledgeable about our advertisers’ products and are viewed as partners by our advertisers, thus allowing for a close and collaborative relationship in which we can offer solutions that satisfy our advertisers’ needs.
We attract our consumer audience by offering comprehensive and objective comparisons based on rates, selection, features, brand, flexibility and other key attributes, as well as content to educate our consumers on these matters. Our platform is compelling for our advertisers for several reasons including:
|
· |
Historically, Bankrate has delivered a high proportion of consumers who are of the highest credit and financial quality and predominately “Prime” in terms of their personal finance profile. |
|
· |
Bankrate’s platforms are specific, highly contextual destinations for consumers who are generally in market for a product. Leads and click-throughs therefore have a high conversion rate for our advertisers. |
|
· |
Bankrate’s platforms are leading generators of highly targeted contextual consumer traffic seeking credit cards, mortgage, deposit and senior care products and therefore we have provided a constant and reliable flow of prospects for our advertisers. |
Marketing
Bankrate has been able to establish itself as one the most recognized brands in the online personal finance market. The strength of our brands lead to many of our visitors coming to our websites by directly typing our Internet addresses. Another critical factor in attracting visitors to our websites is how prominently we are displayed in response to search queries regarding vertical categories in which we operate. CreditCards.com, Bankrate.com and Caring.com and other key pages of our online network routinely rank at or near the top of consumers’ organic search results for highly searched key words and phrases related to credit card and personal finance products and senior care. The high rankings are largely a result of our success at creating highly relevant, contextual, authoritative, widely read and widely distributed content.
We augment the traffic coming to our websites through search engine marketing by bidding for placement of hyperlinks next to algorithmic search results for relevant keywords that link back to our sites as well as display, sponsored content and marketing on social networks.
For our Bankrate.com site, traffic in 2016 was also driven through approximately 100 online partners, including Bloomberg, Kiplinger, MarketWatch, TheStreet.com and Yahoo!. Our partners place our content and rate tables on co-branded pages within their sites and we sell the advertisements on these pages and share the advertising revenues with the partner. We benefit from these relationships as these pages are exposed to traffic that would not otherwise be generated from our website.
We also actively conduct media public relations campaigns to promote our editorial content and personnel to the consumer and trade media. Company spokespersons are routinely featured in newspapers, magazines and in broadcast media, and are promoted to and are featured as expert commentators on major broadcast and cable news programs and talk radio. Top media outlets, such as The Wall Street Journal, Associated Press, CNBC, USA Today and Forbes, regularly turn to us for our proprietary data or as an expert source for their audience.
Customers
A significant portion of our customer base by revenue is comprised of large financial institutions such as banks which may have products in multiple vertical categories on our online network. Our largest customers by total revenue generated in the years ended December 31, 2016 and 2015 include Chase, Capital One, American Express, Discover, Bank of America, Citibank and Synchrony Bank. For the year ended December 31, 2016, Chase accounted for approximately 25%, and for the year ended December 31, 2015, Capital One accounted for approximately 20%, of our total revenue across all products. For the years ended December 31, 2016 and 2015, our ten largest customers accounted for approximately 69% and 74%, respectively, of total revenues across all products.
Product Development Strategy
Our product development strategy is designed to expand our advertiser base, traffic origination sources and highly targeted consumer audience, all of which are critical to our success and drive monetization. Key elements of this strategy include:
|
· |
enhancing the consumer experience and engagement on our websites and mobile applications; |
|
· |
increasing traffic to our websites and mobile applications; |
|
· |
increasing monetization of our traffic and advertiser satisfaction; |
|
· |
developing products to expand opportunities with partners and affiliates; and |
|
· |
expanding into new products and features to further enhance our consumer relationships. |
Our continuously evolving flagship websites feature a modern modular design enabling us to add features and additional content rapidly, test consumers’ response and engagement and optimize satisfaction as a result. We plan to further enhance our back-end infrastructure, creating an even stronger network for our consumers, advertisers, partners and affiliates. In addition, we have many initiatives underway to create an even more substantial mobile presence.
In fulfilling our product mission, we make extensive use of site tracking and optimization technologies, and we continually monitor and improve consumer engagement and monetization. We believe that our goal-oriented product development strategy and execution, our rapid incremental iterative process, and our overall discipline have been some of the key components of our success and we believe these will continue to assist us in maintaining our competitive advantage in the future.
Competition
We compete for advertising revenues across the broad categories of credit card marketplaces, personal finance content and senior care marketplaces, both in traditional media and online. There are many competitors in our market verticals. Our online and traditional media competition includes the following:
|
· |
numerous websites in each of our vertical categories competing for traffic and for advertisers; |
|
· |
search engines that display their own proprietary content or services in search results that in some cases compete with the content or services in one or more of our vertical categories; |
|
· |
financial institutions, including credit card issuers, mortgage lenders and deposit institutions, and many of which are also our customers; |
|
· |
lead aggregators and websites committed to specific personal finance products and senior care services; |
|
· |
senior care service providers, many of which are also our customers; |
|
· |
traditional offline personal finance marketing channels, including direct mail, television, radio, call centers, retail bank branches and print; and |
|
· |
general interest websites that compete for advertising dollars such as Yahoo! and AOL. |
Competition in the online publishing business is generally directed at growing users and revenue using marketing and promotion to increase traffic to websites. We believe that we compete favorably within each of the categories described above and that we will be able to maintain and enhance our leadership position.
Technology
We currently operate our online network and supporting systems primarily on servers at secure third-party and cloud hosting facilities, including Amazon Web Services and locations across the United States. Most of our critical properties and consumer facing operations operate concurrently from multiple data centers. Multiple data centers are key to our business continuity strategy, providing continuity and recovery options if a data center should suffer a major outage.
These facilities are powered continuously from multiple sources, including uninterruptible power supplies and emergency power generators. The facilities are connected to the Internet with redundant high-speed data lines. The systems at each data center are protected by multi-layered security and switching systems, including redundant routers, firewalls, switches, and load balancers at each data center. To provide maximum scalability, many of our high-traffic web pages are served from multiple active/active data centers through an independent content distribution network. Multi-node clusters and active load balancing systems are used for key functions, including web serving, web services, and many databases. Mission-critical information presented on our websites, including back-end databases that provide the raw information, is stored and delivered via such multi-node or multi-system configurations from one or both of the co-location facilities.
The extensive use of a multi-data center active/active architecture, combined with load balancing at multiple levels, ensures our ability to handle load and scale capacity to match demand.
We also leverage third party content distribution networks, ad serving, optimization, and tracking services to improve performance and provide instrumentation, while leveraging the scalability of major vendors in these arenas.
Intellectual Property
Our proprietary intellectual property consists of our unique research and editorial content, computer programs relating to our websites, our website applications and our domain names. We rely primarily on a combination of copyrights, trademarks, trade secret laws, our user policy and restrictions on disclosure to protect this content. In addition, we license some of our data and content from other parties. Our copyrights, trademarks and licenses expire at various dates, and we believe that none is individually significant.
Regulatory Matters
We are affected by laws and regulations that apply to businesses in general, as well as to businesses operating on the Internet. This includes a continually expanding and evolving range of laws, regulations and standards that address information security, data protection, privacy, consent and advertising, among other things. To the extent we provide a medium through which users can post content and communicate with one another, we may also be subject to laws governing intellectual property ownership, obscenity, libel, and privacy, among other issues. Advertising and promotional information presented to visitors to our online services, and our other marketing activities, are subject to federal and state consumer protection laws that regulate unfair and deceptive practices. There are laws, regulations and standards that regulate certain aspects of the Internet, including online content, user privacy, taxation, liability for third-party activities and jurisdiction. These include the Communications Decency Act of 1996, which regulates content of material on the Internet, and the Digital Millennium Copyright Act of 1998, which provides recourse for owners of copyrighted material who believe that their rights under U.S. copyright law have been infringed on the Internet. In the area of data protection, the U.S. Federal Trade Commission and certain state agencies have investigated various Internet companies’ use of their customers’ personal information, and certain federal and state statutes regulate specific aspects of privacy and data collection practices. There are also a variety of state and federal restrictions on marketing activities conducted by telephone, the mail or by email, or over the Internet, including the Telephone Consumer Protection Act, the Telemarketing Sales Rule, state telemarketing laws, federal and state privacy laws, the CAN-SPAM Act, the Federal Trade Commission Act, the Fair Credit Reporting Act and the Consumer Protection Act and their accompanying regulations and guidelines. Because we engage in marketing activities over the Internet and by telephone, mail and email, we may be subject to these laws and regulations.
State, federal and foreign lending laws and regulations generally require accurate disclosure of the critical components of credit costs so that consumers can readily compare credit terms from various lenders. These laws and regulations also impose certain restrictions on the advertisement of these credit terms. Because we are an aggregator of rate and other information regarding many financial products, including mortgages, deposits and credit cards, we may be subject to some of these laws and regulations. The senior care industry is also subject to a number of federal and state laws and regulations. We believe that we have structured our business and our online services to comply with applicable laws and regulations as are currently in effect. Because of uncertainties as to the applicability of some of these laws and regulations to the Internet and, more specifically, to our type of business, and considering that our business has evolved and expanded in a relatively short period of time, and will continue to evolve and develop, we may not always have been, and may not always be, in compliance with all applicable federal, state and foreign laws and regulations.
Federal, state, local and foreign governments are also considering other legislative and regulatory proposals that would regulate the Internet in more and different ways than exist today. In addition, several states are considering legislative proposals to regulate senior living referral services. It is impossible to predict whether new restrictions, fees, or taxes will be imposed on our services, and whether and how we would be affected. Increased regulation of the Internet both in the United States and abroad may decrease its growth and hinder technological development, which may negatively impact the cost of doing business via the Internet or otherwise materially adversely affect our business, financial condition or operational results.
As a public company with securities listed on the New York Stock Exchange, we are also subject to review and oversight by the Securities and Exchange Commission (“SEC”) and the New York Stock Exchange.
Employees
As of December 31, 2016, we employed approximately 600 people. None of our employees are represented under collective bargaining agreements. We have never had a work stoppage. We consider our employee relations to be good.
Available Information
The Company’s annual reports on Form 10-K, quarterly reports on Form 10-Q, current reports on Form 8-K and all amendments to those reports are available free of charge on the Company’s website at investor.bankrate.com as soon as practicable after such material is electronically filed with, or furnished to, the SEC. Information contained on our websites is not incorporated by reference into this Annual Report on Form 10-K.
In addition, copies of the Company’s Annual Report on Form 10-K will be made available, free of charge, on written request.
For further discussion concerning our business, see the information included in Items 7 (Management’s Discussion and Analysis of Financial Condition and Results of Operations) and 8 (Financial Statements and Supplementary Data) of this report.
4
An investment in our securities involves risk. You should carefully consider the following risks as well as the other information included in this Annual Report on Form 10-K, including “Management’s Discussion and Analysis of Financial Condition and Results of Operations” and our financial statements and related notes, before investing in our securities. Any of the following risks could materially and adversely affect our business, financial condition, results of operations or prospects, and cause the value of our securities to decline, which could cause you to lose all or part of your investment in our Company.
Risks Related to Our Business
Our success depends on revenue from online advertising and the sale of financial and senior care consumer inquiries.
We have historically derived, and we expect to continue to derive, the majority of our revenue through the monetization of consumer inquiries and the sale of advertising impressions on our online network. Any factors that reduce the amount our customers are willing to and do spend on advertising with us, or that limit their willingness to purchase consumer inquiries from us, could have a material and adverse effect on our business. These factors may include:
|
· |
our ability to maintain a significant number of unique website visitors, mobile visitors and application users; |
|
· |
the willingness or interest of banks, credit card issuers, lenders, brokers, senior care providers and other advertisers in the business verticals in which we operate to advertise on our websites or mobile applications or purchase our leads, clicks, calls and referrals; |
|
· |
the rate of conversion of visitors to some of our websites or mobile applications into credit card applicants and the rate at which credit card applications from consumers that come through our websites or mobile applications are approved by our credit card issuer customers; |
|
· |
changes in law or regulation, or the enforcement of laws or regulations, including without limitation with respect to the advertising of personal financial services or senior care services, the provision of financial product consumer inquiries or senior care consumer inquiries, or privacy; |
|
· |
the rate of conversion of consumers’ visits to our websites or mobile applications into transaction fees and/or revenue from banks, mortgage brokers or other lenders; |
|
· |
the rate of conversion of consumers’ visits to our websites or mobile applications into senior care referrals and the rate at which those referrals result in move-ins with our senior care customers; |
|
· |
our ability to compete with alternative advertising sources; |
|
· |
our ability to maintain a significant number of sellable impressions generated from website visitors available to advertisers; |
|
· |
our ability to accurately assess the number and demographic characteristics of our visitors; |
|
· |
our ability to handle temporary high volume traffic spikes to our online network; |
|
· |
our ability to convince traditional media advertisers to advertise on our online network; and |
|
· |
our ability to increase traffic to our online network. |
Most of our customer contracts are short-term and are subject to termination by the customer at any time and/or do not have any minimum purchase requirements. Customers who have longer-term contracts may fail to honor their existing contracts, choose not to renew their contracts or reduce their purchase volume under those contracts. If a significant number of customers or a few large customers decide not to continue advertising with us or purchasing our consumer inquiries, or materially reduce such activities, we could experience an immediate and substantial decline in our revenues and operating results over a relatively short period of time.
We face intense competitive pressures that may have a material and adverse effect on our business, financial condition and operating results.
We face intense competition in all our businesses, and we expect competition to remain intense in the future. We compete with, among others, search engines utilizing keyword cost-per-click advertising or comparison advertising sites/networks; lead aggregators and websites committed to specific personal finance or senior care products; numerous websites in each of our vertical categories competing for traffic and for advertisers; financial institutions, including mortgage lenders, deposit institutions, credit card issuers and other lenders, many of whom are also our customers; and traditional offline personal finance marketing channels, including direct mail, retail bank branch networks, television, radio, call centers and print advertising. Some of these competitors have significantly greater financial resources than we do and could use those resources to develop more directly competitive product offerings and editorial content and undertake advertising campaigns to promote those new offerings and content, which could result in diminished traffic to our online services and reduce our overall competitive and market position.
Our online competitors may adopt certain aspects of our business model or replicate the appearance and features of our online services, which could reduce our ability to differentiate our services. In addition, new competitors may enter this market as there are few barriers to entry. If one of these competitors is successful in such efforts, it could have a material and adverse effect on our business and operating results. For example, prior to Google’s termination of its Google Compare product in early 2016, Google Compare presented prominent comparisons of credit cards through its search engine, and in certain markets presented prominent comparisons of mortgage rates through its search engine. This diverted consumers away from our online services, including consumers who would otherwise have found, been directed to or been linked to our online services through the Google search engine. This diversion adversely impacted our business and operating results. In the future Google may choose to reenter our business verticals, or make available new products that compete with other parts of our business such as deposit rates, auto loans, personal loans or other rate information and tools (e.g., mortgage calculators) with similar adverse effect.
Many of our competitors have longer operating histories, greater name recognition, larger customer bases and/or significantly greater financial, technical or marketing resources than us. Many competitors have complementary products or services that drive traffic to their online services. In the future, competitors could introduce superior products and services or reduce prices below ours. Increased competition could result in lower consumer traffic, advertising rate reductions, reduced margins or loss of market share, any of which would adversely affect our business, financial condition and operating results.
We depend upon Internet search engines to attract a significant portion of the visitors to our websites, and any change in the prominence of our websites in search result listings or changes the visual layout of those listings could cause the number of visitors and/or the quality of those visitors to our websites to decline and have a material and adverse effect on our business, financial condition and operating results.
We depend in significant part on various Internet search engines, such as Google, Bing and Yahoo!, and other search websites to direct a significant number of visitors to our websites to provide our online services to our clients. Search websites typically provide two types of search results, algorithmic and paid listings. Algorithmic, or organic, listings are determined and displayed solely by a set of formulas designed by search companies. Paid listings can be purchased and then are displayed if particular words are included in a user’s Internet search. Placement in paid listings is generally not determined solely on the bid price, but also takes into account the search engines’ assessment of the quality of the website featured in the paid listing and other factors. We rely on both algorithmic and paid search results, as well as advertising on other websites, to direct a substantial share of the visitors to our websites.
Our ability to maintain the number of visitors to our websites from Internet search engines and other websites is not entirely within our control. Internet search engines frequently revise their algorithms in an attempt to optimize their search result listings or to implement their internal standards and strategies. Changes in the algorithms could cause our websites to receive less favorable placements, which could reduce the number of users who visit our websites. We have experienced and continue to experience fluctuations in the search result rankings for a number of our websites. Even where our search result rankings do not fluctuate, an Internet search website could take other steps to displace the placement of our websites on a search results page or otherwise change the visual layout of the search results page, which can reduce the number of consumer visits to our websites and adversely affect our business and operating results. For example, in early 2016 Google increased the number of paid advertisements at the top of its search results, which adversely impacted the number of consumers that click through to the websites managed by our businesses and adversely affected our business and operating results.
In addition, the prominence of the placement of our advertisements is in part determined by the amount we are willing to pay for the advertisement. We bid against our competitors for the display of paid search engine advertisements and some of our competitors have greater resources with which to bid and better brand recognition than we have. If competition for the display of paid advertisements in response to search terms related to our online services increases, our online advertising expenses could rise significantly or we may be required to reduce the number of our paid search advertisements. If we were to reduce our advertising with search engines, our consumer traffic may significantly decline or we may be unable to maintain a cost-effective search engine marketing program.
Other factors, such as search engine technical difficulties, search engine technical changes and technical or presentation changes we make to our websites, could also cause our websites to be listed less prominently in algorithmic search results. In addition, search engines retain broad discretion to remove from search results any company whose marketing practices are deemed to be inconsistent with the search engine’s guidelines. If our marketing practices do not comply with search engine guidelines, we may, without warning, not appear in search result listings at all. Any adverse effect on the placement of our websites in search engine results could reduce the number of users who visit our websites. In turn, any reduction in the number of visitors to our websites would negatively affect our ability to earn revenue. If visits to our websites decrease, our revenue may decline or we may need to resort to more costly sources to replace lost visitors, and such decreased revenue and/or increased expense could materially and adversely affect our business and profitability.
We depend on third parties for a portion of our credit card, banking and senior care traffic and revenues, and any material decline in our relationships with these third parties, or increase in the price of consumer inquiries from these third parties, could have an adverse impact on our revenues or operating results.
A portion of our revenue is attributable to consumer inquiries sourced from third parties, including but not limited to website publishers, lead aggregators and email marketers. In many instances, these third parties can change the inventory they make available to us at any time and, therefore, impact our revenue. If these third parties decide not to make inventory available to us, are purchased by one of our competitors or another company that decides to no longer make inventory available to us, or decides to demand a higher price for their products, we may not be able to find replacement inventory from other sources that satisfy our requirements in a timely and cost-effective manner, which could have an adverse impact on our revenues or operating results.
If we fail to keep pace with rapidly-changing technologies and industry standards, including without limitation the increasing shift by consumers to mobile devices from personal computers and the increasing use of social media channels, we could lose consumers, customers or advertising inventory and our results of operations may suffer.
The business lines in which we currently operate and compete are characterized by rapidly-changing Internet media and marketing standards, changing technologies and platforms, frequent new product and service introductions, and changing consumer and customer demands and modes of accessing and providing information. The number of individuals who access the Internet through devices other than a personal computer, such as tablets and smartphones, has increased dramatically. The introduction of new technologies and services embodying new technologies and the emergence of new industry standards and practices could render our existing technologies and services obsolete and unmarketable or require unanticipated investments in technology. If consumers find our online services difficult to access through alternative devices or our competitors develop product offerings that are better adapted to or more easily accessible through alternative devices, we may fail to capture a sufficient share of an increasingly important portion of the market for online services and may fail to attract both advertisers and online traffic.
Our future success will depend in part on our ability to adapt to these rapidly-changing digital media formats and platforms and other technologies and platforms, including without limitation new online and mobile technologies. We will need to enhance our existing technologies and services and develop and introduce new technologies and services to address our customers’ changing demands and consumer expectations and the ways consumers access online information. For example, consumers are increasingly using online social media channels, such as Facebook, as a means to communicate and exchange information, including information and opinions regarding financial services and senior care. We believe this trend will continue and we will need to better develop our ability to attract new consumers and deploy effective advertising solutions using these social media channels or other new platforms that develop. In addition, we believe that successful execution on a social media strategy will be important to diversify away from our dependence on search engines. If we fail to adapt successfully to such developments in a timely manner or if the execution of our social media strategy is not successful, we could lose consumers and customers, our expenses could increase and we could lose advertising inventory, any of which could have a material and adverse impact on our business, financial condition and results of operations.
New technologies that block online advertisements could adversely affect our business and operating results.
Technologies have been developed that can block the display of advertisements and that provide tools to consumers to opt out of advertising products. A portion of our revenues are derived from fees paid to us by advertisers in connection with the display of advertisements on the web pages of our websites and those of our business partners or in connection with certain actions consumers take with respect to those advertisements. As a result, technologies that prevent or diminish our ability to display advertisements to consumers, or the ability of consumers to click on such advertisements tools could adversely affect our business and operating results.
Our websites, applications, widgets and other products may encounter technical problems, service interruptions or security failures.
In the past, our websites have experienced significant increases in traffic and our applications and widgets have experienced significant increases in use in response to interest rate movements and other business or financial news events. The number of our visitors has continued to increase over time, and we are seeking to further increase our visitor traffic. As a result, our servers must accommodate spikes in demand for our web pages in addition to potential significant growth in traffic.
Our websites, applications, widgets and other products have in the past, and may in the future, experience slower response times or interruptions as a result of increased traffic or for other reasons. These delays and interruptions may increase in the future if our servers and infrastructure are not able to accommodate potential significant traffic growth and spikes in demand. Delays and interruptions resulting from the failure to maintain service connections to our websites or applications could frustrate visitors and reduce future traffic on our online platforms, which could have a material adverse effect on our business or results of operations.
Our principal communications, networking and operations equipment is located in commercial co-location data centers and through Amazon Web Services. Additional communications, networking and operations equipment is located at our office locations in Palm Beach Gardens, Florida and Austin, Texas, as well as other of our locations. Multiple system or network failures or catastrophic loss of facility involving these locations, particularly data centers, could lead to interruptions or delays in service for our websites or applications, which could have a material and adverse effect on our business and results of operations. Additionally, we are dependent on third-party providers and their ability to provide safe, effective and cost-efficient hardware and operating environments. Our operations are dependent upon our ability, and our third-party providers’ ability, to protect our systems against damage from fires, floods, tornadoes, hurricanes, earthquakes, power losses, telecommunications failures, physical or electronic break-ins, computer viruses, acts of terrorism, hacker attacks and other events beyond our control. If any of these events were to occur, it could have a material and adverse effect on our business and results of operations. Although we maintain insurance to cover a variety of risks, the scope and amount of our insurance coverage may not be sufficient to cover our losses resulting from system or security failures or other disruptions to our online operations.
Fraudulent Internet transactions, consumer identity theft, security breaches and privacy concerns could have a material and adverse effect on our business, financial condition, operating results and reputation.
If consumers experience identity theft, data security breaches or fraud after clicking through one of our websites or mobile applications to apply for credit cards on the websites of credit card issuers, or mortgage or deposit products or other loan or banking products on the websites of brokers, lenders or banks, or following the completion of a lead form, or as a result of the use of our My.CreditCards, myBankrate, Quizzle, Score&Report, Wallaby or other platforms or services, we may be exposed to significant liability, adverse publicity and damage to our reputation. Despite our implementation of security measures, our computer systems may be susceptible to electronic or physical computer break-ins, viruses and other disruptions and security breaches. In addition, we depend on vendors to store or process certain information, some of which may be private or include personally-identifiable information. If these vendors fail to maintain adequate information security systems, or in the event they experience a breach of their networks, and consumer information is compromised, our business, reputation or results of operations could be significantly harmed. In addition, third parties may attempt to fraudulently induce employees or consumers to disclose information in order to gain access to consumer data. Any perceived or actual unauthorized disclosure of personally-identifiable information of consumers using our services could significantly harm our reputation, impair our ability to attract consumers and attract and retain our advertisers, subject us to regulatory inquiry, investigation and claims, and subject us to private claims or litigation alleging damages suffered by consumers, any of which alone or together could have a material and adverse effect on our business, financial condition and operating results.
To the extent that fraud or identity theft causes a general decline in consumer confidence in online financial transactions, our revenues could decline and our reputation could be damaged. If consumers are reluctant to use our services because of concerns over data privacy or fraud, our ability to generate revenues would be impaired. Our revenues would also decline if changes in industry standards, regulations or laws deterred people from using online services to conduct transactions, such as applying for credit cards, or from seeking information or services that involve the transmission of confidential information. In addition, if technology upgrades or other expenditures are required to prevent security breaches of our network, boost general consumer confidence in sharing information or conducting financial transactions using online services, or prevent fraud and identity theft, we may be required to expend significant capital and other resources. Further, advances in computer capabilities, new discoveries in the field of cryptography, or other events or developments could result in a compromise or breach of the algorithms we use to protect consumers’ and customer companies’ confidential information, which could have a material and adverse effect on our business, financial condition and operating results.
Our business depends on a strong brand and content, thus we will not be able to attract visitors and advertisers if we do not maintain and develop our brands and content.
It is critical for us to maintain and develop our brands and content so as to effectively expand our visitor base and our revenues. Our success in promoting and enhancing our brands, as well as our ability to remain relevant and competitive, depends on our success in offering high quality content, features, product offers, services and functionality. In addition, we may take actions that have the unintended consequence of harming our brand. If our actions cause consumers to question the value of our marketplace, our business and reputation may suffer. If we fail to promote our brands successfully or if visitors to our websites, users of our applications, or advertisers do not perceive our content and services to be of high quality, we may not be able to continue growing our business and attracting visitors and advertisers, which will in turn negatively impact our operating results.
Our results of operations may fluctuate significantly.
Our results of operations are difficult to predict and may fluctuate significantly in the future as a result of factors, many of which are beyond our control. These factors include:
|
· |
changes in fees paid by our customers or customer demand for our services; |
|
· |
traffic levels on our websites and mobile applications, which can fluctuate significantly; |
|
· |
changes in the demand for online products and services; |
|
· |
changes in fee or revenue-sharing arrangements with our distribution partners; |
|
· |
changes in application approval rates by our credit card issuer customers; |
|
· |
our ability to enter into or renew key distribution agreements; |
|
· |
the introduction of new advertising services by our competitors; |
|
· |
failure by advertisers or their agencies to pay amounts owed to us in a timely manner or at all; |
|
· |
failure by our credit card customers to timely report, or to report at all, approved credit card applications for consumers that come through our websites; |
|
· |
failure by our senior care customers to timely report, or to report at all, completed move-ins of the consumers that come through our websites; |
|
· |
changes in our capital or operating expenses; |
|
· |
changes in consumer confidence; |
|
· |
changes in interest rates; |
|
· |
general economic conditions; and |
|
· |
changes in financial services, senior care-related, or privacy laws or regulations, or other laws or regulations, or changes in the interpretations or enforcement by government regulators of such laws or regulations. |
Our future revenue and results of operations are difficult to forecast due to these factors as well as other factors. As a result, period-to-period comparisons of our results of operations may not be meaningful, and you should not rely on past periods as indicators of future performance.
Failure to maintain effective disclosure controls and procedures or internal control over our financial reporting could materially and adversely affect our operations, profitability or reputation.
We have concluded that, as of December 31, 2016, we had a material weakness in our internal control over financial reporting and that, as a result, our internal control over financial reporting was not effective at such date. See Item 9A “Controls and Procedures.” A material weakness is a deficiency, or combination of deficiencies, in internal controls over financial reporting, such that there is a reasonable possibility that a material misstatement of our annual or interim financial statements will not be prevented or detected on a timely basis. We are in the process of implementing efforts to remediate the identified material weakness.
There can be no assurance that our disclosure controls and procedures will be effective in the future or that we will not experience any other material weaknesses or significant deficiencies in internal control over financial reporting. Any such lapses or deficiencies could adversely impact our ability to provide timely and accurate financial information. An inability to report financial information timely and accurately or to maintain effective disclosure controls and procedures could materially and adversely affect our business, operating results or financial condition, restrict our ability to access the capital markets, require us to expend significant resources to correct the lapses or deficiencies, expose us to regulatory or legal proceedings, including litigation brought by private individuals, subject us to fines, penalties or judgments, harm our reputation, or otherwise cause a decline in investor confidence and our stock price.
Our visitor traffic can be impacted by interest rate volatility.
We provide interest rate information for credit cards, mortgages and other loans, and a variety of deposit accounts. Visitor traffic to our online platforms tends to increase with interest rate movements. Factors that have caused significant visitor fluctuations in the past have been Federal Reserve Board actions and general market conditions affecting home mortgage and deposit interest rates and access to credit. Additionally, the level of traffic to our websites can be dependent on interest rate levels as well as mortgage financing and refinancing activity. Accordingly, a slowdown in mortgage production or refinancing volumes could have a material and adverse effect on our business. Conversely, a sudden, significant change in interest rates could dramatically increase our page views such that we would be unable to sell sufficient advertisements to take full advantage of the spike in traffic.
Risks associated with our strategic acquisitions or dispositions could adversely affect our business or results of operations.
We have acquired a number of companies and assets of companies in the past and may make additional acquisitions, asset purchases and strategic investments in the future. For example, in April 2015 we completed the acquisition of Quizzle, LLC (owner of Quizzle.com) and in June 2016 we completed the acquisition of the NextAdvisor business. We will continue to consider acquisitions, asset purchases and joint ventures as a means of enhancing stockholder value. Our success in integrating our acquired businesses will depend upon our ability to retain key personnel, avoid diversion of management’s attention from operational matters, integrate the technical operations and personnel of the acquired companies, and achieve the expected financial results, synergies and other benefits from our acquisitions.
In addition, future acquisitions could result in the incurrence of additional debt, costs and contingent liabilities. Integration of acquired operations may take longer, or be more costly or disruptive to our business, than originally anticipated.
It is also possible that expected synergies and other benefits from our acquisitions may not materialize in full or at all. We may also incur costs and divert management attention through potential acquisitions that are never consummated. Future impairment losses on goodwill and intangible assets with an indefinite life recorded in connection with an acquisition, or restructuring charges, could also occur and negatively affect our results of operations.
Despite our due diligence investigation of an acquisition target, there may be liabilities of the seller companies that we fail to or are unable to discover during the due diligence investigation and for which we, as a successor owner, may be responsible and which could have a material and adverse effect on our business, financial condition or results of operations. In connection with acquisitions, we generally seek to minimize the impact of these types of potential liabilities through the structure of the transaction or through indemnities and warranties from the seller, which may in some instances be supported by deferring payment of a portion of the purchase price or use of an escrow. However, these indemnities and warranties, if obtained, may not fully cover the liabilities due to limitations in scope, amount or duration, financial limitations of the indemnitor or warrantor, or other reasons.
In connection with a disposition of assets or a business, we may provide a buyer with certain indemnities or warranties, such as was the case with the disposition of our Insurance business at the end of 2015. There may also be liabilities or obligations we retain with respect to the sold assets or business. Liability from these indemnities or warranties, or from any retained liabilities or obligations, could have a material and adverse effect on our business, financial condition or results of operations, as could any successful invocation by the buyer of contract provisions that permit post-closing adjustments to the purchase price.
Our ability to consummate any future acquisitions on terms that are favorable to us may be limited by the number of attractive acquisition targets, internal demands, our resources and our ability to obtain financing.
We depend on attracting and retaining executive officers and personnel to continue the implementation of our long-term business strategy and could be harmed by the loss of their services.
We believe that our continued growth and future success will depend in large part on the skills of our senior management team and other skilled employees. The loss of service of one or more of our executive officers or of other key personnel could reduce our ability to successfully implement our long-term business strategy, our business could suffer and the value of our common stock could be materially and adversely affected. Leadership changes will occur from time to time and we cannot predict whether significant resignations will occur or whether we will be able to recruit additional qualified personnel. We believe our senior management team possesses valuable knowledge about our business and that their knowledge and relationships would be very difficult to replicate. Our success and the quality of our content also depend on the expertise of our writers and bloggers and on their relationships with consumers, the media, financial experts and other sources of information. For example, the performance of The Points Guy business has been driven by the ability of the founder of that business and his team to connect with and grow the target audience of that business. The loss of key personnel, or the inability to recruit and retain qualified personnel in the future, could have a material and adverse effect on our business, financial condition or operating results.
If our employees were to unionize, our operating costs would likely increase.
None of our employees are currently represented by a union or subject to a collective bargaining agreement. However, we have no assurance that some or all of our employees will not unionize in the future, which could increase our operating costs, result in other business challenges, force us to alter our operating methods, and have a material and adverse effect on our operating results.
We are from time to time involved in, or may in the future be subject to, claims, suits, government inquiries or investigations, and other proceedings that may have a material and adverse effect on our business, operating results or financial condition.
We are from time to time involved in, or may in the future be subject to, claims, suits, government inquiries or investigations, and proceedings arising from our business or the fact that we are a public company, including actions with respect to intellectual property claims, privacy, consumer protection, information security, securities laws and regulations, transactions in which we are involved, data protection or law enforcement matters, tax matters, labor and employment claims, commercial claims, as well as shareholder derivative actions, class action lawsuits, and other matters. We are also at risk where we have agreed to indemnify others for losses related to legal proceedings or from direct harm, including without limitation in connection with the sale of our Insurance business. Such claims, suits, inquiries, investigations, and proceedings are inherently uncertain and their results cannot be predicted with certainty. Defense costs and any resulting damage awards or settlement amounts may not be fully covered by our insurance policies. Regardless of the outcome, any such legal proceedings can have an adverse impact on us because of legal costs, diversion of attention of management and other personnel, and other factors. In addition, it is possible that a resolution of one or more such proceedings could result in reputational harm, liability, penalties, or sanctions, as well as judgments, consent decrees, or orders preventing us from offering certain features, functionalities, products, or services, or requiring a change in our business practices, products or technologies, which could in the future materially and adversely affect our business, operating results or financial condition. In addition, accounting rules may require us to record a liability related to a particular matter prior to its resolution if the incurrence of a loss related to such matter becomes probable and reasonably estimable.
In addition to litigation in the ordinary course of business, we are currently involved in litigation in which it has been alleged that we have participated in anti-competitive conduct. See the description of the Banxcorp litigation in Note 10 (Commitments and Contingencies) to our consolidated financial statements in this report. Antitrust litigation is by its nature not in the ordinary course. Defending antitrust allegations, even if ultimately successful, can be costly and have a negative effect on our business. In addition, the relief sought by the plaintiffs in this case, if granted, could prevent Bankrate from continuing to pursue at least some aspects of its current business model, which could have a material and adverse effect on our business, financial condition and results of operations.
We make product and investment decisions that may not prioritize short-term financial results.
We make product and investment decisions that may have the effect of reducing our short-term revenue or profitability if we believe that the decisions benefit the consumer experience, conversion rates and/or the pricing of our products or services, thereby ultimately improving our financial performance over the long-term. For example, we have reduced the cost-per-click pricing on certain of our rate tables at certain times to increase the number of advertisers and thereby increase the number of search results that appear in response to a consumer query. Any short-term reductions in revenue or profitability could be more severe than we anticipate or these decisions may not produce the long-term benefits that we expect, in which case our relationships with consumers and advertisers and our business and results of operations could be adversely affected.
Insurance coverage may not be available to cover all of our potential liability and available coverage may not be sufficient to cover all claims that we may incur.
Our ability to obtain liability insurance, its coverage levels, deductibles, premiums and exclusions are all dependent on market factors, our loss history and insurers’ perception of our overall risk profile. We cannot ensure that our insurance will cover all claims or that insurance coverage will be available at economically acceptable rates. Significant uninsured liabilities could have a material and adverse effect on our business, financial condition and results of operations. In addition, we are self-insured for our health benefits. We estimate future expenditures and establish accruals (reserves) based on the estimates. If the number or severity of claims increases, or we are required to accrue or pay additional amounts because the claims prove to be more severe than our original assessment, our operating results would be adversely affected.
We are subject to operational risk.
We are subject to operational risk, which represents the risk of loss resulting from human error, inadequate or failed internal processes and systems, and external events. Operational risk also encompasses compliance and legal risk, which is the risk of loss from violations of, or noncompliance with, laws, rules, regulations, prescribed practices or ethical standards, as well as the risk of our noncompliance with contractual and other obligations. We are also exposed to operational risk through the aspects of our business that we outsource, and the effect that changes in circumstances or capabilities of our outsourcing vendors can have on our ability to continue to perform operational functions necessary to our business. Although we seek to mitigate operational risk through a system of internal controls, no system of controls, however well designed and maintained, is infallible. Control weaknesses or failures or other operational risks could result in charges, increased operational costs, harm to our reputation or foregone business opportunities, any of which could have a material and adverse effect on our business or results of operations.
We rely on the protection of our intellectual property.
Our intellectual property includes our unique research and editorial content of our websites, our applications, our domain names, our URLs, our trade secrets and know-how, our registered and unregistered trademarks and our print publications. We rely on a combination of copyrights, patents, trademarks, trade secret laws, and our policy and restrictions on disclosure to protect our intellectual property. We also enter into confidentiality agreements with our employees and consultants and seek to control access to and distribution of our proprietary information. Despite these precautions, it may be possible for other parties to copy or otherwise obtain and use the content of our websites, mobile applications or print publications without authorization. A failure to protect our intellectual property in a meaningful manner could have a material and adverse effect on our business.
We may be subject to claims that we violated intellectual property rights of others, which even if unfounded or decided in our favor may be extremely costly to defend, could require us to pay significant damages and could limit our ability to operate.
Companies in the Internet and technology industries, and other patent holders seeking to profit from royalties in connection with grants of licenses, own large numbers of patents, copyrights, trademarks and trade secrets and frequently enter into litigation based on allegations of infringement or other violations of intellectual property rights. We may in the future receive notices that claim we have misappropriated or misused other parties’ intellectual property rights. There may be intellectual property rights held by others, including issued or pending patents and trademarks, that cover significant aspects of our technologies, content, branding or business methods.
Because we license some of our data and content from other parties, we may be exposed to infringement actions if such parties do not possess the necessary proprietary rights. Generally, we obtain representations as to the origin and ownership of licensed content and obtain indemnification to cover any breach of any of these representations. However, these representations may not be accurate and the indemnification may be limited or otherwise may not be sufficient to provide adequate compensation for any breach of these representations.
Any future infringement or other claims or prosecutions related to our intellectual property could have a material and adverse effect on our business and results of operations. Defending against any of these claims, with or without merit, could be time-consuming, result in costly litigation and diversion of technical and management personnel or require us to introduce new content or trademarks, develop new technology or enter into royalty or licensing agreements. These royalty or licensing agreements, if required, may not be available on acceptable terms, if at all.
We may face liability for, and may be subject to claims related to, information on our websites or mobile applications, which even if unfounded or decided in our favor may be extremely costly to defend, could require us to pay significant damages and could limit our ability to operate.
Much of the information published on our online platforms and in our print publications relates to the competitiveness of financial institutions’ rates, products and services. We also publish editorial and other content designed to educate consumers about banking, personal finance and senior care products, and on certain of our websites provide a platform for user-generated content. If the information we provide is not accurate or is construed as misleading or outdated, consumers and others could lose confidence in our services and attempt to hold us liable for damages and government regulators could impose fines or penalties on us. We may be subjected to claims of violations of law or regulation, and claims for defamation, negligence, discrimination, invasion of personal privacy, fraud, deceptive practices, copyright or trademark infringement, conflicts of interest or other theories relating to the information we publish. We may also be exposed to similar liability in connection with content that users post to our websites through ratings, reviews, forums, blogs, comments, and other social media features. In addition, if there are errors or omissions in information we publish, consumers, individually or through consumer class actions, could seek damages from us for losses incurred if they relied on incorrect information we provided. These types of claims have been brought, sometimes successfully, against providers of online services as well as print publications. The scope and amount of our insurance may not adequately protect us against these types of claims.
We may face liability for, and may be subject to claims related to, inaccurate advertising content provided to us, which even if unfounded or decided in our favor may be extremely costly to defend, could require us to pay significant damages and could limit our ability to operate.
Much of the information on our online platforms that is provided by advertisers and collected from third parties relates to the rates, costs and features for various loan, depository, personal credit and investment products offered by financial institutions, mortgage companies, investment companies and others participating in the personal finance marketplace, and for providers of senior care facilities. We are exposed to the risk that some advertisers may provide us, or directly post on our websites or mobile applications, (i) inaccurate information about their product rates, costs and features, or (ii) rates, costs and features that are not available to all consumers. This could cause consumers to lose confidence in the information we provide, causing certain advertisers to become dissatisfied with our services, and result in lawsuits being filed or regulatory action against us which could materially and adversely affect our business and results of operations. The scope and amount of our insurance may not adequately protect us against these types of lawsuits or actions.
Our success depends on establishing and maintaining distribution arrangements.
Our business strategy includes the distribution of our content through the establishment of co-branded web pages with high traffic business and personal finance sections of third party online services and websites. Providing access to these co-branded web pages is a significant part of the value we offer to our advertisers. We compete with other providers of services similar to ours to maintain our current relationships with these third party online operators and establish new relationships. In addition, as we expand our personal finance content or change our services, or as these third party online operators acquire or develop their own services, some of these third party online operators may perceive us as a competitor. As a result, they may be unwilling to promote distribution of our content or services. If our distribution arrangements do not attract a sufficient number of visitors to support our current advertising model, or if we do not establish and maintain distribution arrangements on favorable economic terms, our business could be adversely affected.
We do not have exclusive relationships or long-term contracts with the banks, credit card issuers, mortgage brokers and lenders, other lenders, or senior care companies that are our customers, which may limit our ability to retain these customers as participants in our marketplace and maintain the attractiveness of our services to consumers.
We do not have exclusive relationship with the banks, credit card issuers, mortgage brokers and lenders, other lenders, or senior care companies whose products are advertised on our online marketplace, and thus, consumers may obtain services or products from these companies without using our services. Many of our customers also offer their products directly to consumers through agents, mass marketing campaigns or other traditional methods of distribution. In many cases, our customers also offer their products and services online, either directly to consumers or through one or more of our online competitors, or both. An inability to retain these customers as participants in our marketplace could materially and adversely affect our business, revenues and results of operations.
Our credit card and senior care revenue is concentrated among a small number of customers.
A significant portion of the revenue in our credit card and senior care businesses is generated from a small number of trade customers. Our credit card business revenue is concentrated among six of the major credit card issuers and therefore the loss of any one of these issuers as a customer, or a significant reduction in business with an issuer, could meaningfully reduce our credit cards business revenue. We also expect that a meaningful portion of our senior care referral revenues will continue to depend on referral fees from a small group of customers. The loss of one of these customers, or a significant reduction in advertising spend with us by one of these customers, could meaningfully reduce our senior care referral revenue. Industry consolidation resulting in a combination of customers in either of these businesses could also result in the loss of a customer, or a significant reduction in business with a customer, which could meaningfully reduce our revenues. In addition, if a significant customer in either of these businesses experiences operating issues, regulatory issues, bad publicity or other problems, the fees we receive from that customer may be materially reduced.
We may be required to record a significant charge to earnings if our goodwill or amortizable intangible assets become impaired.
We are required under accounting principles generally accepted in the United States of America to review our amortizable intangible assets for impairment when events or changes in circumstances indicate the carrying value may not be recoverable. Goodwill is required to be tested for impairment at least annually and may be tested at other times if a triggering event occurs. Factors that may be considered a change in circumstances indicating that the carrying value of our amortizable intangible assets may not be recoverable include, among others, unanticipated competition, loss of key personnel, or a significant adverse change in the business environment or performance of the reporting unit. We may be required to record a significant charge to earnings in our consolidated financial statements during the period in which any impairment of our goodwill or amortizable intangible assets is determined. This could adversely impact our results of operations. During the second quarter 2016 management noted that the operating results of its Banking reporting unit had begun to track below plan, primarily due to macroeconomic trends impacting its deposit and display advertising businesses. This triggering event resulted in impairment testing as of June 30, 2016 where it was concluded that the reporting unit’s goodwill was impaired, and we recorded a $25.0 million expense for the impairment. In the third quarter 2016, as a result of management’s revision of the strategy of its Quizzle reporting unit and integration of the Quizzle operations into the Banking segment, management determined that a triggering event for impairment testing at the pre-realigned Quizzle reporting unit had occurred. An estimated impairment of goodwill for the pre-realigned Quizzle reporting unit of $4.2 million was recorded as of September 30, 2016. The impairment analysis for Quizzle was completed in the fourth quarter 2016, and we recorded an additional $2.4 million impairment to goodwill and $7.5 million impairment to intangible assets for the pre-realigned Quizzle reporting unit. During the fourth quarter 2016, management noted that the operating results of its Senior Care reporting unit was tracking below plan, resulting in a triggering event for impairment testing as of December 31, 2016. It was concluded that the reporting unit goodwill was impaired and we recorded a $4.0 million expense for the impairment of goodwill.
Our business and results of operations could be negatively impacted by adverse tax events.
New sales or use or other tax laws, statutes, rules, regulations or ordinances could be enacted at any time. Such enactments could adversely affect our business and results of operations. Further, existing tax laws, statutes, rules, regulations or ordinances could be interpreted, changed, modified or applied adversely to us, or our conclusions regarding the applicability of existing tax laws, statutes, rules, regulations and ordinances could be incorrect. These events could require us to pay additional tax amounts on a prospective or retroactive basis, as well as require us to pay fees, penalties and/or interest for past amounts deemed to be due. In addition, our revenue may decline because we may have to charge more for our services which could reduce demand for those services.
New, changed, modified or newly interpreted or applied tax laws could also increase our compliance, operating and other costs, as well as the costs of our products or services. Further, these events could decrease the capital we have available to operate our business. Any or all of these events could adversely affect our business and results of operations.
Unfavorable resolution of tax contingencies could adversely affect us.
Our tax returns and positions are subject to review and audit by federal, state, local and international taxing authorities. An unfavorable outcome to a tax audit could result in higher tax expense, and could adversely impact our financial condition, results of operations or cash flows.
We may expand to other international markets, in addition to our United Kingdom operations, in which we may have limited experience.
We have websites for consumers located in the United Kingdom. In the event that we expand into other international markets, we will have only limited experience in marketing and operating our products and services in those markets. Expansion into international markets requires significant management attention and financial resources, may require the attraction, retention and management of local offices or personnel, and requires us to tailor our services and information to the local market as well as to adapt to local cultures, languages, regulations and standards. Certain international markets may be slower than domestic markets in adopting the Internet as an advertising and commerce medium or in developing telecommunications or online infrastructure and so our operations in international markets may not develop at a rate that supports our level of investment. In addition, international consumers may not adopt the Internet for personal finance content at all or as frequently as U.S. consumers.
Our international operations are subject to increased risks which could harm our business, operating results and financial condition.
We face certain risks inherent in doing business internationally, including:
|
· |
trade barriers and changes in trade regulations; |
|
· |
difficulties in developing, staffing and simultaneously managing foreign operations as a result of distance, language, and cultural differences; |
|
· |
restrictions on the use of or access to the Internet; |
|
· |
longer payment cycles; |
|
· |
credit risk and higher levels of payment fraud; |
|
· |
currency exchange rate fluctuations; |
|
· |
political or social unrest or economic instability; |
|
· |
seasonal volatility in business activity; |
|
· |
risks related to compliance with applicable regulations, including but not limited to anti-corruption laws such as the Foreign Corrupt Practices Act and U.K. Bribery Act; |
|
· |
risks related to government regulation or required compliance with local laws in certain jurisdictions, including labor laws; and |
|
· |
potentially adverse tax consequences. |
One or more of these factors could harm our future international operations and consequently, could harm our brand, business, operating results, and financial condition.
If we fail to detect click-through fraud or other invalid clicks, other fraud on advertisements or unscrupulous advertisers, we could lose the confidence of our other advertisers or our customers and all or part of their business, thereby causing our business to suffer or resulting in adverse regulatory actions.
We are exposed to the risk of fraudulent or other invalid clicks on our advertisements or actions with respect to our consumer inquiry sources. We may in the future have to refund revenue that our advertisers or customers have paid to us and that was later attributed to, or suspected to be caused by fraud or other invalid clicks. Fraudulent or other invalid clicks may result in us receiving advertising fees that are not the result of clicks generated by consumers. Click-through fraud occurs when a person or automated system clicks on an advertisement displayed on a website with the intent of generating the revenue share payment to the publisher rather than to view the underlying content. Action fraud occurs when on-line forms are completed with false or fictitious information in an effort to increase the compensable actions in respect of which the recipient of such information is to be compensated. We do not charge our advertisers or customers for fraudulent or certain other invalid clicks or actions when they are detected, and such fraudulent or invalid activities could negatively affect our profitability or harm our reputation. If fraudulent or other invalid clicks or actions are not detected, the affected advertisers or customers may experience a reduced return on their investment in our programs, which could lead the advertisers or customers to become dissatisfied with our campaigns, and in turn, lead to loss of advertisers or customers and the related revenue.
We are also exposed to the risk that advertisers who advertise on our website will advertise interest rates or other terms on a variety of financial products that they do not intend to honor. This “bait and switch” activity encourages consumers to contact fraudulent advertisers over legitimate advertisers because the fraudulent advertisers claim to offer better interest rates or other terms. Such activity could hurt our reputation and our brand and lead to our other advertisers becoming dissatisfied with our advertising programs, which could lead to loss of advertisers and revenue. It could also result in regulatory action against us, including without limitation by the Federal Trade Commission (“FTC”) or the CFPB, which could have a material and adverse effect on our business and results of operations.
Regulation of the Internet is uncertain and subject to change.
Laws and regulations that apply to online communications, commerce and advertising are continuously evolving and developing and the extent of future government regulation is uncertain. Federal and state laws and regulations govern various aspects of our online business, including intellectual property ownership and infringement, trade secrets, the distribution of electronic communications, marketing and advertising, sweepstakes and promotions, user privacy and data security, search engines and Internet tracking technologies. Additionally, taxation of online services or electronic commerce transactions may be imposed. Future laws, regulations or taxation, or changes in interpretations of existing laws or regulations, could result in a decline in the use of online services and the viability of Internet commerce, which could have a material and adverse effect on our business.
Laws and regulations may limit, restrict or place additional requirements on the way we operate our business or establish and maintain our online relationships, and may subject us to liabilities, any of which could materially and adversely affect our business, financial condition and results of operations.
We market and provide services in heavily regulated industries through a number of different channels across the United States and abroad. As a result, our businesses have been and remain subject to a variety of statutes, rules, regulations, policies and procedures in various jurisdictions in the United States as well as other countries, which are subject to change at any time. If we fail to comply with applicable laws, rules and regulations, or to obtain and maintain required licenses, we could be subject to fines and/or proceedings by governmental agencies and/or private litigation, which could materially and adversely affect our business, financial condition and results of operations.
Federal, state and foreign lending laws and regulations generally require accurate disclosure of the critical components of credit costs so that consumers can readily compare credit terms from various lenders. These laws and regulations also impose certain restrictions on the advertisement of these credit terms. Because we are an aggregator of rate and other information regarding many financial products, including mortgages, deposits and credit cards, we may be subject to some of these laws and regulations and we may be held liable under these laws and regulations for information provided through our online services.
We conduct marketing activities using the telephone, email and other online marketing channels to generate consumer inquiries for our business. The marketing industry is subject to numerous federal and state laws and regulations, such as the Telemarketing Sales Rule, state telemarketing laws, federal and state privacy laws, the CAN-SPAM Act, the Telephone Consumer Protection Act (“TCPA”) and the Federal Trade Commission Act and its accompanying regulations and guidelines, among others. Foreign laws and regulations, such as the Canadian Anti-Spam Law (“CASL”), may also apply to our business activities to the extent we are doing business with or marketing to consumers in foreign jurisdictions.
Most of the statutes and regulations in the United States (and certain foreign statutes and regulations, such as CASL) allow a private right of action for the recovery of damages or provide for enforcement by the FTC, CFPB, Federal Communications Commission (“FCC”), other governmental bodies, state attorneys general or state agencies permitting the recovery of significant civil or criminal penalties, costs and attorneys’ fees in the event that regulations are violated. We believe that we comply with all such applicable laws and regulations, and try to obtain assurances that our advertisers, third party partners, and third parties that we rely on for telemarketing, email marketing and other lead generation activities operate in compliance with all applicable laws and regulations. However, we cannot ensure that the FTC, CFPB, FCC, other governmental bodies, state attorneys general, state agencies or private litigants will not take the position that we are not in compliance with applicable laws and regulations, or that they will not attempt to hold us responsible for any unlawful acts conducted by our advertisers, third party partners, or third party vendors. It may also not be possible to successfully enforce or collect upon any indemnities provided to us by third parties. Penalties for failure to comply with certain of these statutes and regulations can become material quickly. For example, under the TCPA, plaintiffs may seek injunctive relief and actual monetary loss or statutory damages of $500 per violation, whichever is greater, and courts may treble the damage award for willful or knowing violations.
Certain states have enacted, or are considering enacting, legislation that places limitations and requirements on businesses that provide referrals for senior housing. Such legislation could make the provision of our senior care services more expensive and less profitable, or prohibit the operation of those services, which would have an adverse effect on our business and results of operations. Federal and state fraud and abuse laws could be applied to senior care referral sources where referral fees are funded using government funds resulting in significant liability.
We believe that we have structured our business and our online services to comply with applicable laws and regulations as are currently in effect. Because of uncertainties as to the applicability of some of these laws and regulations to online services and, more specifically, to our type of business, and considering that our business has evolved and expanded in a relatively short period of time, and will continue to evolve and develop, we may not always have been, and may not always be, in compliance with all applicable federal, state and foreign laws and regulations. If we are found to be in violation of any applicable laws or regulations, we could be subject to administrative enforcement actions and fines, class action lawsuits, cease and desist orders, and civil and criminal liability. In addition, we could face the revocation of or inability to renew required licenses or registrations, and our advertisers and other business partners could terminate their commercial relationships with us. Liabilities resulting from our failure, or alleged failure, to comply with applicable laws and regulations could materially and adversely affect our business, results of operations and financial condition.
In addition, if applicable laws and regulations are changed or interpreted differently, or if new laws or regulations are enacted, these events could prohibit or substantially alter the content we provide on our websites and the operation of our business, and could result in our advertisers or other business partners ceasing or reducing the business they do with us. These events could materially and adversely affect our business, results of operations and financial condition.
Changes in general economic conditions and changes in market conditions may adversely affect the financial services industry and harm our revenue opportunities, business, financial condition and results of operations.
General shifts in economic trends, reduced availability of commercial credit and increasing unemployment negatively impact the credit performance of commercial and consumer credit. Concerns over the stability of the financial markets and the economy in the past have resulted, and may result in the future, in decreased lending by financial institutions to their customers and to each other. These macroeconomic conditions have affected and may in the future negatively affect our business, financial condition and results of operations. Economic pressure on consumers and businesses and declining confidence in the financial markets would likely cause a decrease in the demand for advertising financial products and services. Additionally, advertising expenditures tend to be cyclical, reflecting overall economic conditions and budgeting and buying patterns. Since we derive most of our revenues from advertising, changes in economic conditions could cause decreases in or delays in advertising spending and would be likely to reduce our revenue and could have a material and adverse effect on our business, financial condition or operating results.
Restrictive covenants in the indenture governing our outstanding senior notes, our revolving credit facility or other future indebtedness may limit our current and future operations, particularly our ability to respond to changes in our business or to pursue our business strategies.
The Indenture, dated as of August 7, 2013 (the “Senior Notes Indenture”), governing our 6.125% senior notes due 2018 (the “Senior Notes”) and our $70.0 million revolving facility (“Revolving Credit Facility”) contain, and any future indebtedness may contain, a number of restrictive covenants that impose significant operating and financial restrictions, including restrictions on our ability to take actions that we believe may be in our interest. The Senior Notes Indenture and the Revolving Credit Facility limit, among other things, our ability to:
|
· |
incur additional indebtedness and guarantee indebtedness; |
|
· |
pay dividends on or make distributions in respect of capital stock or make certain other restricted payments (including redemptions of subordinated indebtedness); |
|
· |
enter into agreements that restrict distributions from restricted subsidiaries; |
|
· |
sell or otherwise dispose of assets, including capital stock of restricted subsidiaries; |
|
· |
enter into transactions with affiliates; |
|
· |
create or incur liens; |
|
· |
enter into sale/leaseback transactions; |
|
· |
merge, consolidate or sell all or substantially all of our assets; |
|
· |
make investments; and |
|
· |
change our business operations. |
A breach of the covenants or restrictions under the Senior Notes, the Revolving Credit Facility or any agreement governing our future indebtedness could result in a default under the applicable indebtedness. Such default may allow the creditors to accelerate the related debt and may result in the acceleration of any other debt to which a cross-acceleration or cross-default provision applies. In the event our lenders and note holders accelerate the repayment of our borrowings, we cannot assure that we and our subsidiaries would have sufficient assets to repay such indebtedness.
The restrictions contained in the Senior Notes Indenture and the Revolving Credit Facility could adversely affect our ability to:
|
· |
finance our operations; |
|
· |
make needed or desired capital expenditures; |
|
· |
make strategic acquisitions or investments or enter into strategic alliances; |
|
· |
withstand a future downturn in our business or the economy in general; |
|
· |
engage in business activities, including future opportunities, that may be in our interest; and |
|
· |
plan for or react to market conditions or otherwise execute our business strategies. |
These restrictions could materially and adversely affect our financial condition and results of operations and our ability to satisfy our obligations under the Senior Notes and the Revolving Credit Facility.
Our substantial indebtedness could adversely affect our financial flexibility and prevent us from fulfilling our obligations under the Senior Notes and Revolving Credit Facility.
We have, and will continue to have, a significant amount of indebtedness. As of December 31, 2016, our total indebtedness was $295.7 million, net of unamortized discount and deferred financing costs comprised of the Senior Notes in an aggregate principal amount of $300.0 million. As of December 31, 2016, we had no loans outstanding under our Revolving Credit Facility. Our interest expense, including the amortization of original issue discount and deferred financing costs, for the year ended December 31, 2016 was $21.5 million. Our substantial level of indebtedness increases the risk that we may be unable to generate cash sufficient to invest in our business at an appropriate level, thereby making it more difficult to pay amounts due in respect of our indebtedness. Our substantial indebtedness could have other important consequences to you and significant effects on our business. For example, it could:
|
· |
make it more difficult for us to satisfy our obligations with respect to other contractual and commercial commitments; |
|
· |
limit our ability to obtain additional financing amounts to fund working capital, capital expenditures, debt service requirements, execution of our business strategy, or acquisitions and other purposes; |
|
· |
require us to dedicate a substantial portion of our cash flow from operations to pay principal and interest on our debt, which would reduce the funds available to us for other purposes; |
|
· |
make us more vulnerable to adverse changes in general economic, industry and competitive conditions, changes in government regulation and changes in our business by limiting our flexibility in planning for, and making it more difficult for us to react quickly to, changing conditions; |
|
· |
place us at a competitive disadvantage compared to our competitors that have less debt; |
|
· |
expose us to risks inherent in interest rate fluctuations because some of our borrowings are at variable rates of interest, which could result in higher interest expenses in the event of increases in interest rates; and |
|
· |
make it more difficult to satisfy our financial obligations, including payments on the Senior Notes and amounts outstanding from time to time under the Revolving Credit Facility. |
In addition, the Senior Notes Indenture and the Revolving Credit Facility each contain, and the agreements evidencing or governing other future indebtedness may contain, restrictive covenants that limit our ability to engage in activities that may be in our long-term best interests. Our failure to comply with those covenants could result in an event of default which, if not cured or waived, could result in the acceleration of all of our indebtedness.
We may not be able to generate sufficient cash to service all of our indebtedness, including the Senior Notes, and may be forced to take other actions to satisfy our obligations under our indebtedness, which may not be successful or if successful, could adversely impact our business.
Our ability to make scheduled payments on or to refinance our debt obligations, including the Senior Notes, depends on our financial condition and operating performance, which are subject to prevailing economic and competitive conditions and to certain financial, business, legislative, regulatory and other factors beyond our control. Our debt service obligations are currently $18.6 million per year. In addition, if our Revolving Credit Facility is drawn in the future it would increase the amount of our current debt service obligations. We may be unable to maintain a level of cash flows from operating activities sufficient to permit us to fund our day-to-day operations or to pay the principal, premium, if any, and interest on our indebtedness, including the Senior Notes.
If our cash flows and capital resources are insufficient to fund our debt service obligations, we could face substantial liquidity problems and could be forced to reduce or delay investments and capital expenditures or to sell assets or operations, seek additional capital or restructure or refinance our indebtedness, including the Senior Notes. We may not be able to effect any such alternative measures, if necessary, on commercially reasonable terms or at all and, even if successful, such alternative actions may not allow us to meet our scheduled debt service obligations. The Senior Notes Indenture and the Revolving Credit Facility each restrict, and any of our other future debt agreements may restrict, our ability to dispose of assets and use the proceeds from any such dispositions and may also restrict our ability to raise debt or equity capital to be used to repay other indebtedness when it becomes due. We may not be able to consummate those dispositions or to obtain proceeds in an amount sufficient to meet any debt service obligations then due.
In addition, we conduct our operations through our subsidiaries, certain of which may not be guarantors of the Senior Notes or guarantors of our other indebtedness. Accordingly, repayment of our indebtedness, including the Senior Notes, is dependent on the generation of cash flow by our subsidiaries and their ability to make such cash available to us, by dividend, debt repayment or otherwise. Unless they are guarantors of the Senior Notes, our obligations from time to time under the Revolving Credit Facility or any future indebtedness, our subsidiaries do not have any obligation to pay amounts due on the Senior Notes or under the Revolving Credit Facility or to make funds available for such purposes. Our subsidiaries may not be able to, or may not be permitted to, make distributions to enable us to make payments in respect of our indebtedness, including the Senior Notes. Each subsidiary is a distinct legal entity and, under certain circumstances, legal and contractual restrictions may limit our ability to obtain cash from our subsidiaries. Although the Senior Notes Indenture and the Revolving Credit Facility do, and other future debt agreements may, limit the ability of certain of our subsidiaries to incur consensual restrictions on their ability to pay dividends or make other intercompany payments to us, these limitations are, or in the case of future debt agreements may be, subject to certain qualifications and exceptions. In the event that we do not receive distributions from our subsidiaries, we may be unable to make required principal and interest payments on our indebtedness, including the Senior Notes.
Our inability to generate sufficient cash flows to satisfy our debt obligations, or to refinance our indebtedness on commercially reasonable terms or at all, would materially and adversely affect our financial position and results of operations.
If we cannot make scheduled payments on our debt, we will be in default and, as a result, holders of Senior Notes or our other indebtedness could declare all outstanding principal and interest to be due and payable and we could be forced into bankruptcy or liquidation.
Despite restrictions in the Senior Notes Indenture and the Revolving Credit Facility, we may still be able to incur additional indebtedness. This could increase the risks associated with our leverage, including the ability to service our indebtedness.
We may be able to incur additional indebtedness pursuant to the Senior Notes Indenture and the Revolving Credit Facility in the future, including additional secured indebtedness. As of December 31, 2016, we were able to incur up to an additional $330.6 million of indebtedness, of which up to $100.0 million could be secured indebtedness, pursuant to the incurrence tests described in the Senior Notes Indenture and Revolving Credit Facility. Although covenants under the Senior Notes Indenture and the Revolving Credit Facility limit our ability and the ability of our present and future subsidiaries to incur additional indebtedness, these restrictions are subject to a number of qualifications and exceptions and, under certain circumstances, debt incurred in compliance with these restrictions could be substantial. The Senior Notes Indenture and the Revolving Credit Facility also allow us to incur certain additional secured and unsecured debt and allow our foreign restricted subsidiaries and our future unrestricted subsidiaries to incur additional debt, which would be structurally senior to the Senior Notes and amounts outstanding from time to time under the Revolving Credit Facility. In addition, the Senior Notes Indenture and the Revolving Credit Facility do not prohibit us from incurring obligations that do not constitute indebtedness as defined therein. To the extent that we incur additional indebtedness or such other obligations, the risk associated with substantial additional indebtedness described above, including our possible inability to service our debt will increase.
We may not receive some or all of the purchase price in connection with the sale of our Insurance business, which could adversely affect our operations.
The Equity Purchase Agreement (the “Purchase Agreement”) with All Web Leads, Inc. provides that $25.0 million of the $165.0 million aggregate purchase price payable to us as consideration for the sale of our Insurance business to All Web Leads will be paid on the second anniversary of the closing date. Following the adjustment for closing working capital, that deferred consideration was reduced to $23.1 million. If All Web Leads is unable to pay the deferred payment amount in full on or before the second anniversary of the closing date as a result of restrictions under its Revolving Credit Facility, All Web Leads will pay us as much of the deferred payment amount as is permitted under its Revolving Credit Facility and deliver to us a subordinated promissory note in a principal amount equal to the unpaid portion of the deferred payment amount plus interest accrued at one-year LIBOR plus 8.0% per annum from the date of closing on such unpaid portion. The subordinated promissory note will have an interest rate of one-year LIBOR plus 8.0% per annum and will mature on the date that is six months after the maturity date of All Web Leads’ credit facility. Both the deferred compensation payable under the Purchase Agreement and the obligations under promissory note, if it is issued in lieu of cash payment, will be subordinated to All Web Leads’ senior indebtedness.
We have no assurance that All Web Leads can or will perform its payment and other obligations with respect to the deferred compensation payable under the Purchase Agreement or under the promissory note, if it is issued in lieu of cash payment. If All Web Leads is unable to perform its obligations with respect to the deferred compensation payable under the Purchase Agreement or under the promissory note, if it is issued in lieu of cash payment, our receipt of the full amount of the deferred compensation payable under the Purchase Agreement may be delayed or may not be collectible at all. Additionally, we may incur significant legal fees in pursuing collection of the deferred compensation payable under the Purchase Agreement or under the promissory note, if it is issued in lieu of cash payment. Any such delay, additional costs, loss or nonpayment could adversely affect our ability to fund our remaining operations.
Risks Related to our 2014 Restatement and Other Accounting Issues
The Company is the subject of an ongoing investigation by the DOJ. The DOJ investigation and its outcome could adversely affect the Company, require significant management time and attention, result in significant legal expenses (including settlement costs) or damages, and cause our business, financial condition, results of operations and cash flows to suffer.
The Company is the subject of an ongoing investigation by the DOJ, which is related to our amendment and restatement of our consolidated financial statements and other financial information (the “Restatement”). We could be subject to fines, settlement costs, penalties, or other sanctions as a result of this investigation. It is not possible to predict when the DOJ investigation will be completed, the final outcome of the investigation, and what if any actions may be taken by the DOJ.
Our indemnification obligations and advancement and reimbursement of expenses, and limitations of our director and officer liability insurance, could result in significant legal expenses or damages and cause our business, financial condition, results of operations and cash flows to suffer.
Certain of our former employees have been sued by the SEC for alleged violations of the securities laws relating to accounting issues referenced above and may become defendants in future proceedings relating to such matters. Under Delaware law, our Certificate of Incorporation, our Bylaws and certain indemnification agreements, we may have indemnification obligations to these former employees in relation to these matters, and are advancing legal expenses to these former employees. These indemnity obligations and expense advancements have resulted and may continue to result in significant legal expenses or damages and cause our business, financial condition, results of operations and cash flow to suffer. The former employees receiving expense advancement are obligated to reimburse us under certain circumstances. Those circumstances may not occur, however, or the individuals may refuse or be unable to provide such reimbursement.
While we maintain director and officer liability insurance, following the insurance funding of the class action settlement described in Note 10 (Commitments and Contingencies) to our consolidated financial statements in this report we have exhausted the coverage available to us for the policy year applicable to the class action lawsuit and the SEC and DOJ investigations. As a result, further expenses or liabilities related to these matters, including indemnification and expense advancement obligations, will be borne by us and could have a material and adverse impact on our financial condition, results of operations and cash flows.
The DOJ investigation and the settled SEC investigation, and other issues in connection with the Restatement could have an adverse impact on our business relationships.
Our operations and business rely on our reputation with consumers and relationships with our advertisers, co-brand partners, distribution partners, print partners and other business partners. The DOJ investigation and settled SEC investigation, and other issues in connection with the Restatement, could have an adverse impact on our business relationships with our partners. Among other outcomes, these partners may seek out new partners or rely on their other partners more heavily, and reduce or potentially become unwilling to do business with us, causing our business, financial condition, results of operations and cash flows to suffer.
Risks Related to Ownership of Shares of Our Securities
The Apax Holders (defined below) control a significant interest in us and their interests may conflict with or differ from stockholder interests.
To our knowledge, Ben Holding S.à r.l., which is beneficially owned by Apax US VII, L.P., Apax Europe VII-A, L.P., Apax Europe VII-B, L.P. and Apax Europe VII-1, L.P. (the “Apax Holders”), currently owns approximately 41.9% of our common stock. As a result of its ownership, the Apax Holders have the power, and pursuant to the stockholders agreement, their majority-owned subsidiary Ben Holding S.à r.l. has the contractual right, to nominate a number of directors equal to 30% of the total number of directors. Accordingly, the Apax Holders have significant influence over any decision to approve or reject any transaction that requires the approval of our board of directors or our stockholders, including significant corporate transactions such as business combinations. In addition, following a reduction of the equity owned by the Apax Holders to below 30% of our outstanding common stock, the Apax Holders, through Ben Holding S.à r.l., will retain the right to designate a certain number of designees for our board of directors until the Apax Holders’ ownership percentage falls below 5%. The Apax Holders’ ability to significantly influence our decisions will continue even after selling a portion of their interests in us.
The interests of the Apax Holders could conflict with or differ from other stockholder interests. For example, the concentration of ownership held by the Apax Holders could delay, defer or prevent a change of control of the Company or impede a merger, takeover or other business combination that other stockholders may otherwise support, or approve such transactions notwithstanding opposition from other stockholders. Additionally, Apax Partners is in the business of advising on investments in companies the Apax Holders hold, and they or other funds advised by Apax Partners may from time to time in the future acquire, interests in businesses that directly or indirectly compete with certain portions of our business or are suppliers or customers of ours. They may also pursue acquisitions that may be complementary to our business, and, as a result, those acquisition opportunities may not be available to us.
None.
Our corporate headquarters is in New York, New York, where we lease approximately 24,000 square feet of office space under a lease expiring in September 2027.
Our Credit Cards business has its principal facility in Austin, Texas where we lease approximately 22,000 square feet of office space under a lease expiring in November 2018.
Our Banking business has its principal facility in Palm Beach Gardens, Florida, where we lease approximately 26,000 square feet of office space under a lease expiring in January 2027.
Our Senior Care business has its principal facility in San Mateo, California where we lease approximately 8,000 square feet of office space under a lease expiring in December 2019.
In addition to these principal facilities we lease office space at various properties in the United States and sublease a facility in Colchester, England. These leases expire at various times. We use these office properties for administration, sales, operations, and business development. We operate our online network and supporting systems on servers at secure third-party co-locations, including facilities in Atlanta, Georgia, Austin, Texas and several other locations. We believe we can relocate any of our facilities without significant cost or disruption.
The information with respect to legal proceedings is incorporated by reference from Note 10 of our Consolidated Financial Statements included in this document.
Not applicable
5
|
PART II. |
|
Item 5. Market for Registrant’s Common Equity, Related Stockholder Matters and Issuer Purchases of Equity Securities |
Our common stock has been listed on the NYSE under the symbol “RATE” since June 17, 2011. The following table sets forth for the indicated periods the high and low sales prices per share for our common stock on the NYSE.
|
|
|
|
|
|
|
|
|
|
|
Fiscal Quarter Ended |
|
Low |
High |
|
March 31, 2015 |
|
$ 11.09 |
$ 13.57 |
|
June 30, 2015 |
|
$ 10.48 |
$ 13.92 |
|
September 30, 2015 |
|
$ 8.87 |
$ 11.52 |
|
December 31, 2015 |
|
$ 10.20 |
$ 15.80 |
|
March 31, 2016 |
|
$ 6.59 |
$ 13.12 |
|
June 30, 2016 |
|
$ 7.11 |
$ 9.71 |
|
September 30, 2016 |
|
$ 6.91 |
$ 8.73 |
|
December 31, 2016 |
|
$ 7.10 |
$ 11.60 |
Holders of Record
As of December 31, 2016, there were approximately 155 stockholders of record of our common stock, and the closing price of our common stock was $11.05 per share as reported by the NYSE. Because many of our shares of common stock are held by brokers and other institutions on behalf of stockholders, we are unable to estimate the total number of stockholders represented by these record holders.
Dividend Policy
We have not declared or paid any dividends on our common stock. We currently intend to retain all of our future earnings, if any, for use in our business and do not anticipate paying any cash dividends for the common stock in the foreseeable future. Our ability to pay dividends on our common stock is currently limited by the covenants of our Senior Notes and Revolving Credit Facility and may be further restricted by the terms of any future debt or preferred securities. Payments of future dividends, if any, will be at the discretion of our board of directors after taking into account various factors, including our business, operating results and financial condition, current and anticipated cash needs, plans for expansion and any legal or contractual limitations on our ability to pay dividends.
Stock Performance Graph
The graph set forth below compares the cumulative total stockholder return on an initial investment of $100 in our common stock between December 31, 2011 and December 31, 2016, with the comparative cumulative total return of such amount on the NYSE Market Index and the RDG Internet Composite Index, over the period of December 31, 2011 to December 31, 2016. We have not paid any cash dividends and, therefore, the cumulative total return calculation for us is based solely upon stock price appreciation and not upon reinvestment of cash dividends. Data for the NYSE Market Index and the RDG Internet Composite Index assume reinvestment of dividends. The graph assumes our closing sales price on December 31, 2011 of $21.50 per share as the initial value of our common stock.
6
The comparisons shown in the graph below are based upon historical data. We caution that the stock price performance shown in the graph below is not necessarily indicative of, nor is it intended to forecast, the potential future performance of our common stock.
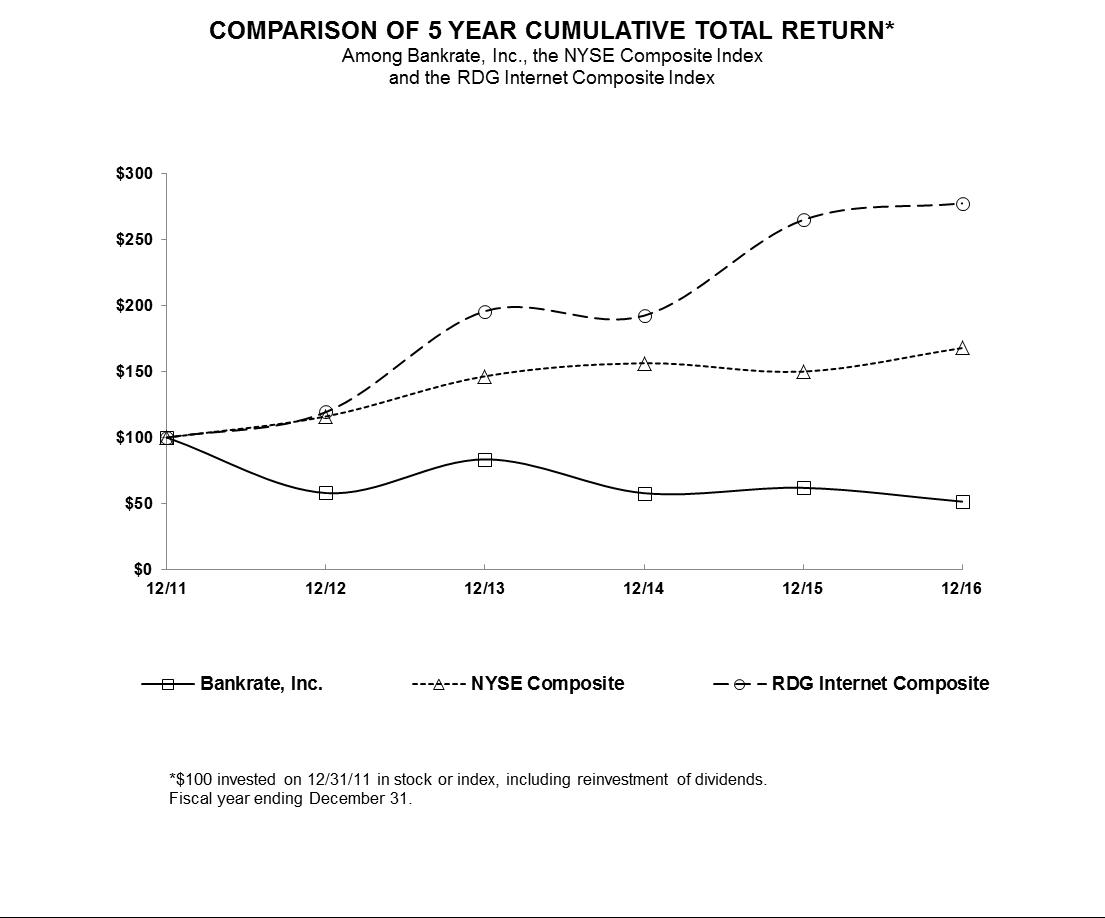
The information presented above in the stock performance graph shall not be deemed to be “soliciting material” or to be “filed” with the SEC or subject to Regulation 14A or 14C, except to the extent that we subsequently specifically request that such information be treated as soliciting material or specifically incorporate it by reference into a filing under the Securities Act of 1933, as amended, or a filing under the Securities Exchange Act of 1934, as amended.
Recent Sale of Unregistered Securities
None.
7
Company Purchase of Equity Securities
|
|
|
|
|
|
|
|
|
|
|
|
|
|
|
|
|
|
|
|
|
|
|
|
|
|
|
|
|
|
|
|
|
|
Maximum Number |
|
|
|
|
|
|
|
|
|
|
|
(or Approximate |
|
|
|
|
|
|
|
|
|
Total Number of |
|
Dollar Value) |
|
|
|
|
|
|
|
|
|
Shares Purchased as |
|
of Shares That May |
|
|
|
|
|
|
|
|
|
Part of Publicly |
|
Yet Be Purchased |
|
|
|
|
Total Number of |
|
Average Price |
|
Announced Plans |
|
Under the Plans or |
||
|
Period |
|
Shares Purchased |
|
Paid Per Share |
|
or Programs |
|
Programs |
||
|
October 1, 2016 through October 31, 2016 |
|
12,230 |
|
$ |
8.44 |
|
- |
|
$ |
- |
|
November 1, 2016 through November 30, 2016 |
|
4,417 |
|
$ |
7.78 |
|
- |
|
$ |
- |
|
December 1, 2016 through December 31, 2016 |
|
54,975 |
|
$ |
10.50 |
|
- |
|
$ |
- |
|
|
|
|
|
|
|
|
|
|
|
|
|
|
|
|
|
|
|
|
|
|
|
|
Equity Compensation Plan Information
The following table sets forth certain information relating to the shares of common stock that may be issued under our stock-based incentive plans at December 31, 2016:
|
|
|
|
|
|
|
|
|
|
|
|
Number of securities |
|
Weighted average |
|
Number of securities |
|
|
|
|
to be issued upon |
|
exercise price of |
|
remaining available for |
|
|
|
|
exercise of outstanding |
|
outstanding options, |
|
future issuance under |
|
|
|
|
options, warrants, rights |
|
warrants and rights |
|
equity compensation plans |
|
|
Plan Category |
|
and restricted stock units |
|
(excluding restricted stock units) |
|
(excluding those in first column) |
|
|
Equity compensation plans approved by securities holders |
|
4,186,922 |
|
$ |
16.81 |
|
6,249,614 |
|
Total |
|
4,186,922 |
|
$ |
16.81 |
|
6,249,614 |
For information on the features of the Company’s equity compensation plan, see Management’s Discussion and Analysis of Financial Condition and Results of Operations; Critical Accounting Policies; Stock-Based Compensation and Note 8 in Notes to Consolidated Financial Statements in Item 8.
The following table presents our selected historical consolidated financial data. The consolidated statements of operations data for the years ended December 31, 2016, 2015 and 2014 and the consolidated balance sheet data as of December 31, 2016 and 2015 are derived from our audited consolidated financial statements appearing in Item 8 of this Annual Report on Form 10-K. The consolidated statements of operations data for the years ended December 31, 2013 and 2012, and the consolidated balance sheet data as of December 31, 2014, 2013 and 2012, are derived from our audited consolidated financial statements that are not included in this Annual Report on Form 10-K. During 2015, the Company sold its Insurance business and the results of operations, assets and liabilities of that business have been reclassified and presented as a discontinued operation in the following table of selected financial data for all periods presented. The information set forth below should be read in conjunction with our consolidated financial statements and the related notes thereto, included elsewhere in this Annual Report on Form 10-K, and the sections entitled “Management’s Discussion and Analysis of Financial Condition and Results of Operations.”
|
|
|
|
|
|
|
|
|
|
|
|
|
|
|
|
|
|
Year ended December 31, |
|||||||||||||
|
(In thousands, except share and per share data) |
2016 |
|
2015 |
|
2014 |
|
2013 |
|
2012 |
|||||
|
Statement of Operations Data: |
|
|
|
|
|
|
|
|
|
|
|
|
|
|
|
Revenue |
$ |
434,161 |
|
$ |
371,964 |
|
$ |
352,051 |
|
$ |
296,976 |
|
$ |
246,418 |
|
(Loss) income from operations |
|
(6,017) |
|
|
49,236 |
|
|
36,095 |
|
|
42,262 |
|
|
56,835 |
|
Net (loss) income from continuing operations |
|
(34,038) |
|
|
16,842 |
|
|
7,019 |
|
|
(1,732) |
|
|
26,732 |
|
Net (loss) income |
|
(34,134) |
|
|
(13,346) |
|
|
5,172 |
|
|
(11,196) |
|
|
27,045 |
|
|
|
|
|
|
|
|
|
|
|
|
|
|
|
|
|
Other Financial Data: |
|
|
|
|
|
|
|
|
|
|
|
|
|
|
|
Basic net (loss) income per share-continuing operations: |
$ |
(0.38) |
|
$ |
0.17 |
|
$ |
0.07 |
|
$ |
(0.02) |
|
$ |
0.27 |
|
|
|
|
|
|
|
|
|
|
|
|
|
|
|
|
|
Adjusted EBITDA (1) |
$ |
114,797 |
|
$ |
127,123 |
|
$ |
117,800 |
|
$ |
110,364 |
|
$ |
94,292 |
|
|
|
|
|
|
|
|
|
|
|
|
|
|
|
|
|
Cash Flow Data: |
|
|
|
|
|
|
|
|
|
|
|
|
|
|
|
Net cash provided by operating activities |
$ |
79,756 |
|
$ |
86,049 |
|
$ |
42,507 |
|
$ |
101,887 |
|
$ |
49,207 |
|
Net cash (used in) provided by investing activities |
|
(76,184) |
|
|
94,498 |
|
|
(82,695) |
|
|
(32,583) |
|
|
(32,147) |
|
Net cash (used in) provided by financing activities |
|
(63,999) |
|
|
(85,256) |
|
|
(47,736) |
|
|
77,196 |
|
|
(3,344) |
|
|
|
|
|
|
|
|
|
|
|
|
|
|
|
|
|
Balance Sheet Data: |
|
|
|
|
|
|
|
|
|
|
|
|
|
|
|
Cash and cash equivalents |
$ |
176,680 |
|
$ |
237,204 |
|
$ |
119,354 |
|
$ |
206,399 |
|
$ |
51,018 |
|
Working capital |
|
217,087 |
|
|
261,276 |
|
|
369,396 |
|
|
134,622 |
|
|
20,266 |
|
Intangible assets, net |
|
192,119 |
|
|
205,766 |
|
|
222,779 |
|
|
286,899 |
|
|
306,731 |
|
Goodwill |
|
599,805 |
|
|
567,544 |
|
|
545,772 |
|
|
454,846 |
|
|
445,074 |
|
Total assets |
|
1,083,860 |
|
|
1,126,966 |
|
|
1,258,429 |
|
|
924,605 |
|
|
786,662 |
|
Long-term debt |
|
295,721 |
|
|
293,284 |
|
|
291,784 |
|
|
290,276 |
|
|
189,525 |
|
Total stockholders' equity |
|
689,378 |
|
|
761,195 |
|
|
823,286 |
|
|
835,573 |
|
|
825,950 |
During 2016, 2015, 2014, 2013 and 2012 we recorded $1.8 million, $569,000, $3.6 million, $81,000 and $601,000, respectively, for acquisition, disposition, offering and related expenses, primarily related to the acquisition and integration of acquired businesses with our operations. In 2016 these costs primarily related to the NextAdvisor acquisition. In 2015 these costs primarily related to the acquisitions of Quizzle, LLC and certain assets of Moseo Corporation (SeniorHomes.com) and LoanTek, as well as our disposition of our former Insurance business (see Note 14 to our Consolidated Financial Statements). In 2014 these costs primarily relate to the acquisition of Caring, Inc. and Wallaby Financial Inc.
During 2016, 2015, 2014, 2013 and 2012 we recorded $7.9 million, $11.4 million, $23.6 million, $1.3 million and $1.2 million, respectively, for restatement-related expenses, which include expenses related to the Restatement, the Internal Review, the SEC and DOJ investigations and related litigation and indemnification obligations.
During 2016 we recorded $43.1 million for the impairment of goodwill within our Banking, pre-realigned Quizzle and Senior Care reporting units and intangible assets within our pre-realigned Quizzle reporting unit.
During 2016 we recorded $6.2 million for contingent deferred compensation and other expenses related to the NextAdvisor acquisition.
During 2015, 2012 and 2011 we recorded $5.6 million, $267,000 and $75,000, respectively, for restructuring charges to implement best practices and various initiatives to enhance controls, drive efficiency, and further align the Company leadership structure with strategic initiatives.
_________
|
(1) |
Adjusted EBITDA represents (loss) income before income taxes, less interest, depreciation and amortization, stock-based compensation, changes in fair value of contingent acquisition consideration, and other items such as loss on extinguishment of debt, legal settlements, acquisition, disposition, offering and related expenses, restructuring charges, any impairment charge, CEO transition costs and costs related to the Restatement, the Internal Review, the SEC and DOJ investigations and related litigation, purchase accounting adjustments, NextAdvisor contingent deferred compensation, and our operations in China as we are winding down and ceasing its operations. Adjusted EBITDA is a supplemental measure of our performance and is not a measurement of our performance under GAAP and should not be considered as an alternative to net income or other performance measures derived in accordance with GAAP, or as an alternative to cash flow from operating activities as a measure of our liquidity. Management believes that the presentation of Adjusted EBITDA provides useful information to investors regarding the results of our operations because it assists in analyzing and benchmarking the performance and value of our business. Our determination of Adjusted EBITDA may not be comparable to similarly titled measures used by other companies. Following is a reconciliation of Adjusted EBITDA to income (loss) before taxes: |
|
|
|
|
|
|
|
|
|
|
|
|
|
|
|
|
|
|
Year ended December 31, |
|||||||||||||
|
(In thousands) |
2016 |
|
2015 |
|
2014 |
|
2013 |
|
2012 |
|||||
|
|
|
|
|
|
|
|
|
|
|
|
|
|
|
|
|
(Loss) income before taxes |
$ |
(25,694) |
|
$ |
26,957 |
|
$ |
15,279 |
|
$ |
126 |
|
$ |
31,310 |
|
Interest, net and other expenses |
|
19,677 |
|
|
22,279 |
|
|
20,816 |
|
|
24,961 |
|
|
25,525 |
|
Depreciation and amortization |
|
42,247 |
|
|
40,843 |
|
|
34,502 |
|
|
31,854 |
|
|
28,322 |
|
Stock-based compensation (a) |
|
19,159 |
|
|
19,417 |
|
|
13,870 |
|
|
9,834 |
|
|
7,638 |
|
Loss on extinguishment of debt |
|
- |
|
|
- |
|
|
- |
|
|
17,175 |
|
|
- |
|
Change in fair value of contingent acquisition consideration |
|
(6,481) |
|
|
(421) |
|
|
3,633 |
|
|
17,380 |
|
|
(2,347) |
|
Acquisition, disposition, offering and related expenses |
|
1,811 |
|
|
569 |
|
|
3,590 |
|
|
81 |
|
|
601 |
|
Restatement-related charges |
|
7,853 |
|
|
11,432 |
|
|
23,586 |
|
|
1,269 |
|
|
1,249 |
|
Legal settlements |
|
5,345 |
|
|
3 |
|
|
1,403 |
|
|
- |
|
|
874 |
|
China operations (b) |
|
1,682 |
|
|
393 |
|
|
565 |
|
|
882 |
|
|
853 |
|
Restructuring-related expenses |
|
(117) |
|
|
5,616 |
|
|
- |
|
|
- |
|
|
267 |
|
Impairment charges |
|
43,110 |
|
|
- |
|
|
- |
|
|
- |
|
|
- |
|
Impact of purchase accounting |
|
- |
|
|
35 |
|
|
556 |
|
|
- |
|
|
- |
|
Other charges (c) |
|
6,205 |
|
|
- |
|
|
- |
|
|
6,802 |
|
|
- |
|
Adjusted EBITDA |
$ |
114,797 |
|
$ |
127,123 |
|
$ |
117,800 |
|
$ |
110,364 |
|
$ |
94,292 |
|
(a) |
Excludes $3.9 million, $3.2 million, $2.3 million, $1.5 million and $796,000 in 2015, 2014, 2013, 2012 and 2011, respectively, related to the disposition of our Insurance business, which is included in net (loss) income from discontinued operation. Excludes $5.8 million related to CEO transition in 2013, which is included in other charges. |
|
(b) |
Represents the loss from the operations in China, and includes legal and other costs incurred to wind down those operations. The results of China were previously presented as a discontinued operation when it was actively marketed for sale. After the negotiations with the potential buyer did not result in a sale of the business, we initiated the process to wind down the operations. |
|
(c) |
Other charges include (i) $6.2 million for contingent deferred compensation expense related to the NextAdvisor acquisition for 2016 and (ii) CEO transition costs of $6.8 million (of which $5.8 million is stock-based compensation) for 2013. |
8
You should read the following discussion of our results of operations and financial condition with the financial statements and related notes included elsewhere in this Annual Report on Form 10-K. The following discussion contains forward-looking statements that reflect our plans, estimates and beliefs, and that involve numerous risks and uncertainties, including, but not limited to, those described in the “Cautionary Statement Concerning Forward-Looking Statements” and “Risk Factors” sections of this Annual Report on Form 10-K. Actual results may differ materially from those contained in any forward-looking statements. See “Cautionary Statement Concerning Forward-Looking Statements” and “Risk Factors.”
Introduction
Our Company
We are a leading publisher, aggregator and distributor of personal finance content on the Internet. We provide consumers with proprietary, fully researched, comprehensive, independent and objective personal finance editorial content across multiple vertical categories including credit cards, mortgages, deposits, senior care and other personal finance categories.
Our sources of revenue include performance-based advertising, lead generation, display advertising, distribution arrangements and traditional media avenues, such as syndication of editorial content and subscriptions.
Primarily through our CreditCards.com brand and our other owned and operated sites, we provide free credit card marketplaces for consumers seeking a new, different or better credit card. Our credit card marketplaces provide consumers with free content, tools, applications, credit scores, card matching services and comparisons of numerous credit card offers. Via these credit card offers that are largely clicked on by consumers, we provide consumer inquiries to credit card issuers and principally record revenue after the credit card issuers approve the consumer’s credit card application.
Primarily through our Bankrate.com brand, we provide consumer inquiries to advertisers that are listed in our mortgage and deposit rate tables and that hyperlink their listings or provide a phone number. Under this arrangement, advertisers pay Bankrate each time a consumer clicks on that advertiser's hyperlink or calls the phone number. All clicks and calls are screened for fraudulent characteristics in accordance with Interactive Advertising Bureau advertising standards by an independent third party vendor and then charged to the customer’s account. Through our Quizzle.com brand, we provide consumers with tools, services and content that includes credit monitoring, identity theft protection, debt management, credit reports and credit scores, budget planning and credit management techniques.
Primarily through our Caring.com brand, we provide helpful caregiving content, a comprehensive online senior living community directory for the United States, and telephone support and advice from trained Family Advisors to consumers looking for senior care options as well as thousands of original articles, helpful tools, a local directory covering a wide array of other senior caregiving services, and the collective wisdom of an involved online community.
We provide a variety of digital display advertising formats. Our most common digital display advertisement sizes are leader boards and banners, which are prominently displayed at the top, bottom or side rails of a page. We charge for these advertisements based on the number of times the advertisement is displayed or based on a fixed amount for a campaign. Advertising rates may vary depending upon the product areas targeted, geo-targeting, the quantity of advertisements purchased by an advertiser, and the length of time an advertiser runs an advertisement on our online network. We sell to advertisers targeting a specific audience in a city or state and also to national advertisers targeting the entire country.
We also derive revenue through the sale of print advertisements and the distribution (or syndication) of our editorial content.
We operate the following reportable segments:
|
· |
Credit Cards – we present visitors with a comprehensive selection of consumer and business credit and prepaid cards, providing detailed information and comparison capabilities, and host news and advice on personal finance, credit card and bank policies, as well as tools, calculators, products and services to estimate credit scores and card benefits. |
|
· |
Banking – we offer information on rates for various types of mortgages, home lending and refinancing options, specific to geographic location and covering all 50 states; rate information on various deposit products such as money markets, savings and certificates of deposits; and information on retirement, taxes and debt management. This segment also provides original articles on topics related to the housing market and loan refinancing; provides online analytic tools to calculate investment values; and provides content on topics such as retirement 401(k) accounts, Social Security, tax deductions and exemptions, auto loans, debt consolidation and credit risk. |
|
· |
Senior Care – we provide a comprehensive online senior living community directory for the United States, and telephone support and advice from trained Family Advisors to consumers looking for senior care options, as well as thousands of original articles, helpful tools, a local directory covering a wide array of other senior caregiving services, and the collective wisdom of an involved online community. |
|
· |
Other – includes unallocated corporate overhead, the elimination of transactions between segments and the wind down of our China operations. |
2016 Executive Summary
|
· |
Revenues of $434.2 million, a 16.7% increase from 2015, including the results of the NextAdvisor Business since the acquisition of that business in June 2016 |
|
· |
Net loss from continuing operations of $34 million; a $50.9 million decrease from 2015 |
|
· |
Adjusted EBITDA of $114.8 million; a 9.7% decrease from 2015 |
|
· |
Completed the acquisition of the NextAdvisor Business, a leading online source of independent and in-depth research and reviews of credit cards, personal finance and internet services, which we believe will accelerate our credit cards business, broaden our reach and increase the number of ways we can engage with consumers |
|
· |
Completed the authorized share repurchase program with the repurchase of approximately 5.6 million shares |
|
· |
Initiated the process of winding down our operations in China after negotiations with potential buyers did not result in a transaction |
|
· |
Realigned our management reporting structure and integrated our Quizzle operations into the Banking segment |
|
· |
Recorded a $6.6 million goodwill impairment and a $7.5 million intangible asset impairment in our pre-realigned Quizzle reporting unit |
|
· |
Recorded a $25.0 million impairment charge to goodwill in our Banking reporting unit |
|
· |
Recorded a $4.0 million impairment charge to goodwill in our Senior Care reporting unit |
|
· |
Funded $6.1 million to a settlement fund for the $20.0 million court approved settlement of the private securities class action lawsuit; approximately $13.8 million of the settlement was funded by insurance proceeds |
Certain Trends Influencing Our Business
Our business benefits from the secular shift toward consumer use of the Internet to research and shop for personal finance products coupled with increased consumer interest in comparison shopping for such products, and the related shift in advertiser demand from offline to online and toward the targeting of in-market consumers. Our ability to benefit from these trends depends on the strength of our position in the personal finance services markets driven by our brands, proprietary and aggregated content, breadth and depth of personal finance products, distribution, position in search results and monetization capabilities. The key drivers of our business include the number of in-market consumers visiting our online network, the number of page views they generate, the availability of financial products and the demand of our online network advertisers, each of which are correlated to general macroeconomic conditions in the United States. We believe that increases in housing activity and general consumer financial activity and fluctuations in interest rates positively impact these drivers while decreases in these areas, or a deterioration in macroeconomic conditions, could have a negative impact on these drivers.
Key Initiatives
We are focused on the following key initiatives to drive our business:
|
· |
increasing visitor traffic to our online network, including enhancing search engine marketing and keyword buying, and expanding display advertising and content marketing on social networks and via direct response advertising; |
|
· |
traffic optimization and monetization for both desktop and mobile; |
|
· |
investing in our technical infrastructure to enhance the experience of both consumers and advertisers; |
|
· |
developing tools and content that result in repeat visits and ongoing engagement by the consumers on our site; |
|
· |
optimizing the revenue from our cost-per-approval, cost-per-click, cost-per-thousand-impressions and cost-per-call models, and testing and deploying a cost-per-lead model initiative; |
|
· |
revenue optimization associated with updated site designs and functionality; |
|
· |
revenue optimization through value-based pricing for our mortgage and deposit products; and |
|
· |
integrating our acquisitions to maximize synergies and efficiencies. |
Revenue
We generate revenue in each of our verticals by connecting consumers with our advertisers. The amount of revenue we generate is a function of the traffic to our owned and operated properties as well as to our partners’ websites and mobile applications and our ability to effectively match these consumers with relevant advertisers.
Credit Card Revenue
In the credit card segment we generate revenue through consumer inquiries by delivery of qualified click-throughs from hyperlinks in credit card listings and qualified phone calls to our advertisers’ application forms. Consumers are presented credit card offers on our owned and operated websites and mobile applications as well as on affiliate websites and mobile applications. Our advertisers pay us a designated transaction fee for either approved applications or completed applications, resulting from those click-throughs or phone calls, which occur after a user clicks on any of their advertisement listings or makes a phone call to the advertiser and then completes an application and in most instances passes the advertiser’s internal approval processes. The designated transaction fee can vary based on the quality of the credit card applicant, the type of credit card that the applicant applies for and the volume of credit card clicks and applicants delivered to the card issuers.
Banking Revenue
In our banking segment we primarily generate revenue through consumer inquiries upon delivery of qualified and reported click-throughs to our advertisers from hyperlinks in tables listing rates for deposits, mortgages or other loan products, or qualified phone calls. Consumers are presented these rate table listings on our owned and operated websites and mobile applications as well as on partner websites and mobile applications. These advertisers pay us a fee for each click-through or phone call, which occurs when a user clicks on any of their advertisement listings or makes a phone call to the advertiser. Each phone call or click-through on an advertisement listing represents a completed transaction once it passes our validation filtering process. We also sell display advertisements on our online network consisting primarily of leaderboards, banners, badges, islands, posters, and skyscraper advertisements on a cost-per-impression basis. We typically charge for these advertisements based on the number of times the advertisement is displayed.
Senior Care Revenue
In our Senior Care segment we mainly generate revenue through move-ins to communities that result from consumer inquiries that are generated on our sites or through our affiliate relationships and are qualified in our call centers. In addition, we sell leads to in-home care providers on a cost-per-lead basis, and we generate some revenue on a subscription basis, whereby senior living communities, in-home care services and other types of senior care providers pay us a flat fee for leads and inclusion in our directory regardless of lead conversion.
Operating Expenses
Cost of Revenue
Cost of revenue represents expenses directly associated with the creation of revenue and costs of fulfilling services. These costs include contractual revenue sharing obligations resulting from our distribution arrangements ("distribution payments"), cost of traffic and lead acquisition (primarily search engine marketing expense), display advertising expense, direct response television advertising expense, salaries, editorial costs, research costs, credit card processing fees, and allocated overhead. Distribution payments are made to website operators for visitors directed to our online network which we monetize through advertising, as well as credit card offer clicks that are generated on our affiliated websites and monetized through our issuer network. These costs generally increase proportionately with revenue from our online network and distribution platforms. Editorial costs relate to writers and editors who create original content for our online publications and associates who build web pages. These costs have increased as we have added online publications and co-branded versions of our websites under distribution arrangements. Research costs include expenses related to gathering data on banking and credit products and consist primarily of compensation and benefits along with allocated overhead.
Sales and Marketing
Sales and marketing costs represent expenses associated with expanding brand awareness of our products and services to consumers and include Internet advertising, marketing and promotion costs including email marketing and telephone marketing, and include compensation and benefits, sales commissions, allocated overhead, and stock-based compensation expense.
Product Development and Technology
Product development and technology costs represent compensation and benefits related to site development, network systems and telecommunications infrastructure support, programming, new product design and development, other technology costs, and stock-based compensation expense.
General and Administrative
General and administrative expenses represent compensation and benefits for executive, finance and administrative personnel, professional fees, stock-based compensation expense, allocated overhead and other general corporate expenses.
Acquisition, Disposition and Related Expenses
Acquisition, disposition and related expenses represent direct expenses related to our successful acquisitions and divestitures and fees associated with our various offerings.
Depreciation and Amortization
Depreciation and amortization expense includes the cost of capital asset acquisitions spread over their expected useful lives on a straight-line basis. Leasehold improvements are depreciated over the shorter of their estimated useful life or the underlying lease term, not to exceed twenty years. The depreciation periods are as follows:
|
|
Estimated Useful Life |
|
Furniture and fixtures |
5-7 years |
|
Computers and software |
3-5 years |
|
Equipment |
3 years |
|
Leasehold improvements |
≤ 20 years |
|
|
Depreciation and amortization also includes the amortization of intangible assets, consisting primarily of trademarks and domain names, software licenses, customer relationships, agent/vendor relationships, developed technologies and non-compete agreements, all of which were either acquired separately or as part of business combinations recorded under the acquisition method of accounting.
The amortization periods for intangible assets are as follows:
|
|
Estimated Useful Life |
|
Trademarks and domain names |
2-25 years |
|
Customer relationships |
3-15 years |
|
Affiliate relationships |
1-15 years |
|
Developed technologies |
1-10 years |
Interest and Other Expenses, Net
Interest and other expenses, net primarily consists of expenses associated with our long-term debt, amortization of debt issuance costs, interest on acquisition-related payments, interest income earned on cash and cash equivalents and other income.
Income Tax (Benefit) Expense
Income tax (benefit) expense consists of federal and state income taxes in the United States and taxes in certain foreign jurisdictions.
Critical Accounting Policies
Critical Accounting Estimates
The preparation of consolidated financial statements in conformity with GAAP requires management to make judgments, estimates and assumptions that affect the reported amounts of assets and liabilities, and disclosure of contingent gains and losses at the date of the consolidated financial statements and the reported amounts of revenue and expenses during the period. We base our judgments, estimates and assumptions on historical experience and various other factors that we believe to be reasonable under the circumstances. Actual results could differ materially from these estimates under different assumptions or conditions. We evaluate our judgments, estimates and assumptions on a regular basis and make changes accordingly. We believe that the judgments, estimates and assumptions involved in the accounting for revenue recognition, income taxes, the allowance for doubtful accounts receivable, stock-based compensation, useful lives of intangible assets and intangible asset impairment, goodwill impairment, acquisition accounting including the fair value of contingent acquisition consideration, and contingencies have the greatest potential impact on our consolidated financial statements, so we consider these to be our critical accounting policies. Below we discuss the critical accounting estimates associated with these policies. For further information on our critical accounting policies, see Note 2 to our consolidated financial statements included in this Annual Report on Form 10-K.
Revenue Recognition
Online advertising is the sale of advertising, sponsorships, hyperlinks, and lead generation within our online network through our owned and operated sites, such as CreditCards.com, Bankrate.com and Caring.com. The print publishing and licensing business is primarily engaged in the sale of advertising, mortgage and interest rate tables and licensing of research information.
Consumer Inquiry Revenue
In the credit card segment, we deliver consumer inquiries as a click or phone call to our advertisers and primarily recognize revenue on a per-completed and approved application basis. We also have some card issuer agreements which recognize revenue on a per-completed application basis.
In the banking segment, we deliver consumer inquiries in the form of clicks and calls and recognize revenue monthly based on the number of clicks and calls at a cost-per-click/call for our mortgage and deposit and other banking products.
In the senior care vertical we deliver consumer inquiries to contracting senior care communities after qualifying the inquiries in our call center and matching them to a number of suitable communities. We recognize revenue for each consumer who actually moves into a community for which we provided the initial referral. We also deliver consumer leads to participating in-home care providers, for which we receive fees on a per-lead basis.
We have also entered into revenue sharing arrangements with our vertical content and affiliate partners based on the revenue earned from their consumer inquiries. Revenue is recorded at gross amounts and partnership and affiliate payments are recorded in cost of revenue, pursuant to the provisions of Accounting Standards Codification (“ASC”) Topic 605-45, Reporting Revenue Gross as a Principal versus Net as an Agent.
Display Advertising Revenue
Display advertising sales are invoiced monthly at amounts based on specific contract terms, which are predominantly based on the number of impressions delivered to the advertiser.
Print Publishing and Licensing Revenue
We charge for placement in the mortgage and interest rate table for print publication. Advertising revenue is recognized when the rate tables run in a publication. Revenue from the sale of research information is recognized ratably over the contract period.
Stock-Based Compensation
We account for share-based compensation in accordance with ASC 718, Compensation—Stock Compensation. Under the fair value recognition provisions of ASC 718, share-based compensation cost is measured at the grant date based on the fair value of the award and is recognized as an expense on a straight-line basis over the requisite service period, which is generally the vesting period. For awards with performance conditions, the probable outcomes of the performance conditions are assessed and if the conditions are determined as not probable to be achieved, no compensation cost will be recognized. If it is determined that the conditions are probable to be achieved, the related stock-based compensation expense is recognized over the requisite service period of the related awards. The valuation provisions of ASC 718 apply to new grants and to grants that are subsequently modified.
Acquisition Accounting
We have acquired numerous businesses and websites. The acquisition method of accounting requires companies to assign values to assets and liabilities acquired based upon their fair values. In most instances, there is not a readily defined or listed market price for individual assets and liabilities acquired in connection with a business, including intangible assets. The determination of fair value for assets and liabilities in many instances requires a high degree of estimation. The valuation of intangibles assets, in particular, is very subjective. We generally use internal cash flow models. The use of different valuation techniques and assumptions can change the amounts and useful lives assigned to the assets and liabilities acquired, including goodwill and other intangible assets and related amortization expense. We applied ASC 805, Business Combinations to all business combinations.
Goodwill Impairment
The Company records the excess of purchase price over the fair value of the net tangible and identified intangible assets acquired as goodwill. The goodwill is tested for impairment annually, as well as when an event, or change in circumstances, indicates impairment may have occurred. In accordance with ASC 350, Intangibles-Goodwill and Other, we first assess qualitative factors to determine whether the existence of events or circumstances leads to a determination that it is more likely than not (a likelihood of more than 50%) that the fair value of our reporting unit is less than its carrying amount. We perform this assessment at the reporting unit level annually on October 1st, or more frequently if facts and circumstances warrant a review. If after assessing the qualitative factors we determine that it is not more likely than not that the fair value of the reporting unit is less than the carrying value, then we conclude that we have no goodwill impairment and no further testing is performed; otherwise, we proceed to the two-step process. The first step under the two-step process is to compare the fair value of the reporting unit to its carrying value. If the fair value exceeds the carrying value, goodwill is not impaired and no further testing is performed. The reporting unit fair values are determined by using a weighted valuation approach among three different valuation methodologies consisting of an income approach and a market approach, which is made up of the ‘guideline company method’ and the ‘reference transaction method’. The second step is performed if the carrying value exceeds the fair value. The implied fair value of the reporting unit’s goodwill must be determined and compared to the carrying value of the goodwill. If the carrying value of a reporting unit’s goodwill exceeds its implied fair value, an impairment loss equal to the difference will be recorded.
The Company followed the guidance in ASC 350-20-35 and performed the annual impairment test of goodwill as of October 1, 2016. In performing that test, it was noted that the carrying value of the Senior Care reporting unit exceeded its fair value. As a result, the second step was required to be performed. The implied fair value of goodwill was determined in the same manner as the amount of goodwill recognized in a business combination. We have determined the fair value of the reporting unit using the income and market approaches. We also determined the fair value of developed technology, domain names and customer relationships, using relevant market related data. We recorded $4.0 million for impairment of goodwill of the Senior Care reporting unit for the year ended December 31, 2016.
During 2016, management revised the strategy of its Quizzle reporting unit to focus its technology resources primarily on enhancing the user experience of the products and services provided by the Banking segment through greater personalization, and realigned its management reporting structure by integrating the Quizzle operations and reporting unit into the Banking reporting unit. Management determined that the revised strategy, reporting structure and the performance of initiatives utilizing Quizzle resources, each represented triggering events for impairment testing at the pre-realigned Quizzle reporting unit. As a result we completed Step 1 analysis of goodwill during the third quarter of 2016, which indicated that the fair value was lower than the reporting unit’s carrying value, and recorded an estimated goodwill impairment of $4.2 million in the third quarter of 2016. During the fourth quarter 2016, we completed Step 2 of the analysis, recording an additional goodwill impairment of $2.4 million for the pre-realigned Quizzle reporting unit for the year ended December 31, 2016. The impairment amount was determined using the income and market approaches, and was based on a number of factors including the estimated fair value of developed technology, trademarks and customer relationships, as well as relevant market related data.
During the second quarter 2016, management noted that the operating results of its Banking reporting unit had begun to track below plan, primarily due to macroeconomic trends impacting its deposit and display advertising businesses. This triggering event resulted in impairment testing as of June 30, 2016 determined using the income and market approaches. It was concluded that the reporting unit’s goodwill was impaired and we recorded a $25.0 million impairment of its goodwill in the second quarter of 2016. The Banking reporting unit was tested for impairment again during our annual assessment and it was concluded that no impairment had occurred.
During 2015, it was determined that a triggering event had occurred in our former Insurance business unit. We recorded a $35.0 million charge for the impairment of goodwill within our Insurance reporting unit resulting from the difference between the net book value of the business segment and the estimated fair value of the business. During the annual goodwill impairment testing, on October 1, 2015, we performed the assessment for all reporting units, including Step 2 testing for the Insurance reporting unit, and concluded that there was no impairment of goodwill, including any further impairment of the Insurance reporting unit. During the fourth quarter 2015, the Insurance business was disposed and as such, the results of the business are presented as a discontinued operation for all periods presented.
Impairment of Long-Lived Assets including intangible assets with finite lives
ASC 360, Property, Plant and Equipment, requires that long-lived assets including intangible assets with finite lives be amortized over their estimated useful life and reviewed for impairment. We continually monitor events and changes in circumstances that could indicate carrying amounts of our long-lived assets including intangible assets with finite lives may not be recoverable. When such events or changes in circumstances occur, we assess the recoverability of such assets by determining whether the carrying value will be recovered through the undiscounted expected future cash flows. If the future undiscounted cash flows are less than the carrying amount of such assets, we recognize an impairment loss based on the excess of the carrying amount over the fair value of the assets.
As noted above, during the third quarter 2016, management realigned its management reporting structure by integrating the Quizzle operations into the Banking reporting unit, and revised the strategy of the Quizzle reporting unit to focus its technology resources primarily on enhancing the user experience of the products and services provided by the Banking segment through greater personalization. These changes, along with a change in the estimated useful life of Quizzle’s developed technology intangible asset and the performance of initiatives utilizing Quizzle resources, represented a triggering event for impairment testing at the pre-realigned Quizzle reporting unit. It was determined that the intangible assets of our pre-realigned Quizzle reporting unit were impaired and we recorded a $7.5 million impairment to the pre-realigned Quizzle reporting unit intangible assets.
We performed impairment evaluations in 2015 and 2014, and concluded that there was no impairment of long-lived assets including intangible assets with finite lives.
Allowance for Doubtful Accounts
We maintain an allowance for doubtful accounts for estimated losses resulting from the inability or unwillingness of our customers to make required payments. We look at historical write-offs and sales growth when determining the adequacy of the allowance. This estimate is inherently subjective because our estimates may be revised as more information becomes available. Should the financial condition of our customers deteriorate, resulting in an impairment of their ability to make payments, or if the level of accounts receivable increases, the need for possible additional allowances may be necessary. Any additions to the allowance for doubtful accounts are recorded as bad debt expense and included in general and administrative expenses.
Contingencies
As discussed in Note 10 to our consolidated financial statements, included elsewhere in this Annual Report on Form 10-K, various legal proceedings are pending against us. We record provisions in the consolidated financial statements for pending litigation when we determine that an unfavorable outcome is probable and the amount of the loss can be reasonably estimated. Except as discussed in Note 10, at the present time, while it is reasonably possible that an unfavorable outcome in a case may occur, (i) management has concluded that it is not probable that a loss has been incurred; (ii) management is unable to estimate the possible loss or range of loss that could result from an unfavorable outcome; and (iii) accordingly, management has not provided any amounts in the consolidated financial statements for unfavorable outcomes, if any. Legal defense costs are expensed as incurred.
Income Tax Expense (Benefit)
We account for income taxes in accordance with ASC 740, Income Taxes. Under this method, deferred income taxes are determined based on the estimated future tax effects of differences between the financial statement and tax basis of assets and liabilities given the provisions of enacted tax laws. Deferred income tax provisions and benefits are based on changes to the assets or liabilities from year to year. In providing for deferred taxes, we consider tax regulations of the jurisdictions in which we operate, estimates of future taxable income, and available tax planning strategies. If tax regulations, operating results, or the ability to implement tax-planning strategies vary, adjustments to the carrying value of the deferred tax assets and liabilities may be required. Valuation allowances are based on the “more likely than not” criteria of ASC 740.
The accounting for uncertain tax positions guidance under ASC 740 requires that we recognize the financial statement benefit of a tax position only after determining that the relevant tax authority would more likely than not sustain the position following an audit. For tax positions meeting the more likely than not threshold, the amount recognized in the consolidated financial statements is the largest benefit that has a greater than 50 percent likelihood of being realized upon ultimate settlement with the relevant tax authority. We recognize interest and penalties on uncertain tax positions as a component of income tax expense. If our assessment of whether a tax position meets or does not meet the more likely than not threshold were to change, adjustments to income tax benefits may be required.
Results of Operations
The following is our analysis of the results of operations for the periods covered by our consolidated financial statements. This analysis should be read in conjunction with our consolidated financial statements, including the related notes to the consolidated financial statements. A detailed discussion of our accounting policies and procedures is set forth in the applicable sections of this analysis. Other accounting policies are contained in Note 2 to the consolidated financial statements.
Our chief operating decision maker, the Company’s Chief Executive Officer, manages, assesses performance and allocates resources for our businesses based upon separate financial information for each of our operating segments (see Note 6 to our Consolidated Financial Statements for further information). In identifying the reportable segments, we also considered the nature of the services provided by our operating segments and other relevant factors. Senior Care does not meet the quantitative thresholds for a reportable segment, however management believes that information about the segment should be separately disclosed as it is useful to the readers of the consolidated financial statements.
During 2016, management realigned its reporting structure by integrating the Quizzle operations into the Banking segment and revised the strategy of our Quizzle operations to focus its technology resources primarily on enhancing the user experience of the products and services provided by the Banking segment through greater personalization. Segment results reported for all periods since the acquisition of Quizzle in 2015 have been revised to reflect such change.
Our operations in China were previously presented as a discontinued operation, as we were marketing them for sale. During the first half of 2016 we could not come to terms with the potential buyers of the business, negotiations ended, and the plan to sell the business was abandoned. It was then determined to start the process of winding down and closing the operations in China, a process which, based on local requirements and regulations, is not expected to be completed until 2018. The operations of China are now included in our continuing operations for all periods presented.
Management evaluates the operating results of each of the Company’s operating segments based upon revenue and “Adjusted EBITDA”, which we define as income from continuing operations before depreciation and amortization; interest; income taxes; changes in fair value of contingent acquisition consideration; stock-based compensation and other items such as loss on extinguishment of debt, legal settlements, acquisition, disposition and related expenses; restructuring charges; any impairment charges; NextAdvisor contingent deferred compensation for the acquisition; costs related to the Restatement, the Internal Review, the SEC and DOJ investigations and related litigation and indemnification obligations; purchase accounting adjustments; and our operations in China as we are winding down and ceasing its operations. The Company’s presentation of Adjusted EBITDA, a non-GAAP measure, may not be comparable to similarly titled measures used by other companies.
The following table displays our results for the respective periods expressed as a percentage of total revenue:
|
|
|
|
|
|
|
|
|
|
|
Year ended |
||||
|
|
|
December 31, |
|
December 31, |
|
December 31, |
|
Statement of Operations Data: |
|
2016 |
|
2015 |
|
2014 |
|
Revenue |
|
100% |
|
100% |
|
100% |
|
|
|
|
|
|
|
|
|
Costs and expenses: |
|
|
|
|
|
|
|
Cost of revenue |
|
52% |
|
47% |
|
51% |
|
Sales and marketing |
|
4% |
|
4% |
|
4% |
|
Product development and technology |
|
7% |
|
6% |
|
5% |
|
General and administrative |
|
18% |
|
17% |
|
17% |
|
Legal settlements |
|
1% |
|
0% |
|
0% |
|
Acquisition, disposition and related expenses |
|
0% |
|
0% |
|
1% |
|
Restructuring-related expenses |
|
0% |
|
2% |
|
0% |
|
Changes in fair value of contingent acquisition consideration |
|
(1%) |
|
0% |
|
1% |
|
Impairment charges |
|
10% |
|
0% |
|
0% |
|
Depreciation and amortization |
|
10% |
|
11% |
|
10% |
|
Total costs and expenses |
|
101% |
|
87% |
|
90% |
|
(Loss) income from operations |
|
(1%) |
|
13% |
|
10% |
|
|
|
|
|
|
|
|
|
Interest and other expenses, net |
|
5% |
|
6% |
|
6% |
|
|
|
|
|
|
|
|
|
(Loss) income before taxes |
|
(6%) |
|
7% |
|
4% |
|
Income tax expense |
|
2% |
|
3% |
|
2% |
|
Net (loss) income from continuing operations |
|
(8%) |
|
5% |
|
2% |
|
|
|
|
|
|
|
|
|
Net loss from discontinued operation, net of income taxes |
|
0% |
|
(8%) |
|
(1%) |
|
Net (loss) income |
|
(8%) |
|
(4%) |
|
1% |
|
|
|
|
|
|
|
|
Year Ended December 31, 2016 Compared to Year Ended December 31, 2015
Revenue
Total revenue was $434.2 million and $372.0 million for the years ended December 31, 2016 and 2015, respectively, representing an increase of $62.2 million or 16.7%, and includes the results of the NextAdvisor business acquired in June 2016. This increase is primarily due to higher consumer inquiry revenue on our owned and operated websites, partially offset by lower third-party affiliate, display and print revenues.
Revenues from our Credit Cards segment increased $73.0 million or 30.2% to $314.9 million in 2016 compared to 2015. The Banking segment, total revenue of $101.4 million in 2016 was $8.2 million or 7.5% lower as compared to 2015. Senior Care revenues decreased $375,000 to $23.5 million in 2016. Revenues in Other, which includes the eliminations of intra-segment revenues, decreased $2.2 million from 2015 due to higher intra-segment revenue eliminations. See our segment discussion below for more information on our segment results.
Costs and Expenses
Cost of Revenue
Cost of revenue for the year ended December 31, 2016 of $227.5 million was $54.2 million higher than the year ended December 31, 2015. This increase was primarily due to $45.5 million in higher paid marketing expense, $5.2 million of higher employee compensation, benefit and incentive compensation expense, $756,000 increase in information technology spend, $504,000 increase in professional fees and $497,000 in additional stock compensation expense.
Sales and Marketing
Sales and marketing expenses for the year ended December 31, 2016 of $17.5 million were $1.7 million higher than the year ended December 31, 2015, primarily due to $1.0 million additional information technology spend, $973,000 increased consulting and professional fees, $285,000 higher compensation, benefits and incentive compensation, and $242,000 in higher sales commissions, partially offset by $686,000 in decreased stock compensation expense and $644,000 lower marketing and advertising spend.
Product Development and Technology
Product development and technology costs for the year ended December 31, 2016 of $29.3 million were $5.6 million higher than the comparable period in 2015, primarily due to $4.0 million in higher compensation and benefit costs and incentive compensation expense, $1.1 million higher information technology costs, $610,000 higher stock-based compensation expense, $395,000 higher web analytic costs and $120,000 increased outside contract labor.
General and Administrative
General and administrative expenses for the year ended December 31, 2016 of $79.9 million were $16.5 million higher than the year ended December 31, 2015, primarily due to $6.5 million in higher employee compensation and benefit costs, $6.2 million in deferred compensation expenses related to NextAdvisor acquisition, a $3.1 million increase in contract labor and consulting costs, $2.1 million increase in incentive compensation, an increase of $1.3 million in professional fee expenses, mainly for accounting services, and a $2.0 million increase in other expenses including travel, insurance, facility and other costs, partially offset by $3.6 million lower expenses related to the restatement, $680,000 decreased stock-based compensation expense and $450,000 lower technology related expenses.
Acquisition, Disposition, Offering and Related Expenses
Acquisition, disposition, offering and related expenses for the year ended December 31, 2016 were $1.8 million as compared to $569,000 for the same period in 2015. For the year ended December 31, 2016 these expenses related to the NextAdvisor Acquisition and during the year ended December 31, 2015 were related to our several small acquisitions and early costs leading to our disposition of our Insurance business.
Change in Fair Value of Contingent Acquisition Consideration
Change in fair value of contingent acquisition consideration for the year ended December 31, 2016 was of a credit of $6.5 million compared to a credit of $421,000 for the same period in 2015 due to reduction of the earnout accrual for lower projected future contingent payments related to the operating results of acquired businesses not projected to achieve performance targets.
Impairment Charges
During the year ended December 31, 2016, we recorded an impairment charge of $43.1 million, consisting of $25.0 million, $6.6 million and $4.0 million for impairment of goodwill to our Banking, pre-realigned Quizzle and Senior Care reporting units, respectively, and $7.5 million for the impairment of intangible assets to our pre-realigned Quizzle reporting unit.
Depreciation and Amortization
Depreciation and amortization expense for the year ended December 31, 2016 of $42.2 million was $1.4 million higher than the same period in 2015 due to $1.9 million additional depreciation expense of our fixed assets, partially offset by a $569,000 decrease in amortization expense, resulting primarily from the $1.8 million charge taken in 2015 to fully amortize certain domain names that were made dormant during the year.
Interest and Other Expenses, net
Interest and other expenses, net of $19.7 million for the year ended December 31, 2016 decreased $2.6 million from prior year primarily due the interest income of approximately $2.5 million, primarily recognized on our deferred receivable for the sale of our Insurance business in 2015.
Income Tax Expense
Our effective tax rate on continuing operations was an expense of (32.5%) for the year ended December 31, 2016 compared to an expense of 37.5% for the year ended December 31, 2015. The change was principally due to a higher charge taken for stock compensation and the tax non-deductibility of a portion of the GAAP goodwill impairment charge over a loss before income taxes in 2016.
Net Loss from Discontinued Operation
Net loss from discontinued operation for the year ended December 31, 2016 includes costs related to the sale of our former Insurance business and in 2015 was primarily due to a $35.0 million charge for the impairment of goodwill at our former Insurance business resulting from the difference between the net book value of the business segment and the estimated fair value of the business and an $11.9 million charge for sales tax expense in the Insurance business, partially offset by a $14.1 million tax benefit, and the $8.6 million gain on sale, net of tax, of the Insurance business, which was sold in 2015.
Following is a detailed discussion of our segment results of operations:
|
|
|
|
|
|
|
|
|
|
|
|
|
|
|
|
|
|
|
|
|
|
|
|
|
|
|
|
|
|
|
Revenues |
|
Adjusted EBITDA |
||||||||
|
|
|
Year ended |
|
Year ended |
||||||||
|
(In thousands) |
|
December 31, 2016 |
|
December 31, 2015 |
|
December 31, 2016 |
|
December 31, 2015 |
||||
|
Credit Cards (A) |
|
$ |
314,853 |
|
$ |
241,854 |
|
$ |
117,612 |
|
$ |
113,644 |
|
Banking (B) |
|
|
101,440 |
|
|
109,677 |
|
|
24,166 |
|
|
33,070 |
|
Senior Care |
|
|
23,480 |
|
|
23,855 |
|
|
983 |
|
|
389 |
|
Other |
|
|
(5,612) |
|
|
(3,422) |
|
|
(27,964) |
|
|
(19,980) |
|
Total Company |
|
$ |
434,161 |
|
$ |
371,964 |
|
|
114,797 |
|
|
127,123 |
|
|
|
|
|
|
|
|
|
|
|
|
|
|
|
|
|
|
|
|
|
|
|
|
|
|
|
|
|
Less: |
|
|
|
|
|
|
|
|
|
|
|
|
|
Interest and other expenses, net (C) |
|
|
|
|
|
|
|
|
19,677 |
|
|
22,279 |
|
Depreciation and amortization |
|
|
|
|
|
|
|
|
42,247 |
|
|
40,843 |
|
Changes in fair value of contingent acquisition consideration |
|
|
|
|
|
|
|
|
(6,481) |
|
|
(421) |
|
Stock-based compensation expense (D) |
|
|
|
|
|
|
|
|
19,159 |
|
|
19,417 |
|
Legal settlements |
|
|
|
|
|
|
|
|
5,345 |
|
|
3 |
|
Acquisition, disposition and related expenses |
|
|
|
|
|
|
|
|
1,811 |
|
|
569 |
|
Restructuring charge |
|
|
|
|
|
|
|
|
(117) |
|
|
5,616 |
|
Impairment charges (E) |
|
|
|
|
|
|
|
|
43,110 |
|
|
- |
|
Restatement-related expenses (F) |
|
|
|
|
|
|
|
|
7,853 |
|
|
11,432 |
|
NextAdvisor contingent deferred compensation (G) |
|
|
|
|
|
|
|
|
6,205 |
|
|
- |
|
China operations (H) |
|
|
|
|
|
|
|
|
1,682 |
|
|
393 |
|
Impact of purchase accounting |
|
|
|
|
|
|
|
|
- |
|
|
35 |
|
(Loss) income before income taxes |
|
|
|
|
|
|
|
$ |
(25,694) |
|
$ |
26,957 |
|
|
|
|
|
|
|
|
|
|
|
|
|
|
__________
|
(A) |
Includes the results of NextAdvisor since its acquisition in June of 2016. |
|
(B) |
During the third quarter 2016, management realigned its management reporting structure by integrating the Quizzle operations into the Banking segment. All segment results reported for the years ended December 31, 2016 and 2015 have been revised to reflect such change. |
|
(C) |
The year ended December 31, 2016 includes the implied interest income related to the deferred receivable from the sale of our former Insurance business and the year ended December 31, 2015, includes a $703,000 charge related to the exit of an office lease. |
|
(D) |
Excludes approximately $3.9 million of stock based compensation costs for the year ended December 31, 2015 related to the divestiture of our Insurance business during 2015. The costs related to our Insurance business are presented as a discontinued operation. |
|
(E) |
During the year ended December 31, 2016, $25.0 million, $6.6 million and $4.0 million was recorded for goodwill impairment to our Banking, pre-realigned Quizzle and Senior Care reporting units, respectively, and $7.5 million was recorded for intangible asset impairment to our pre-aligned Quizzle reporting unit. |
|
(F) |
Restatement charges include costs related to the Restatement, the Internal Review, the SEC and DOJ investigations and related litigation and indemnification obligations. |
|
(G) |
Represents contingent deferred compensation expense related to the NextAdvisor acquisition. |
|
(H) |
Represents the loss from the operations in China, and includes legal and other costs incurred to wind down those operations. The results of China were previously presented as a discontinued operation when it was actively marketed for sale. After the negotiations with the potential buyer did not result in a sale of the business, we initiated the process to wind down the operations. |
Credit Cards
Revenue increased $73.0 million (30.2 %) for the year ended December 31, 2016 compared with 2015. Approximately $29.1 million of the revenue growth came from NextAdvisor, which was acquired in June 2016. Excluding the impact of the acquisition, consumer inquiry revenue from our owned and operated sites grew by $40.2 million (23.4%). About 65% of consumer inquiry revenue growth resulted from higher pricing and sales conversion with the remaining from increased consumer volume. Other revenue, which is largely comprised of revenue generated through third-party affiliates, increased approximately 5.3%. Affiliate revenues yield substantially lower margins compared to revenues from owned and operated sites.
Adjusted EBITDA increased $4.0 million (3.5%) due to increased revenues. Expenses increased primarily due to the inclusion of NextAdvisor, since its acquisition in June 2016, and higher paid marketing expense. Cost of revenue increased $57.4 million, mainly due to increased paid marketing expense and affiliate revenue share payments. Sales and marketing expense increased by $812,000. Product development cost increased by $4.9 million primarily due to higher compensation and incentive expense. General and administrative expenses were $5.9 million higher, mainly attributed to higher employee compensation and incentive expenses, increased consulting costs and higher facility and other costs.
Banking
Revenue decreased $8.2 million (7.5%) for the year ended December 31, 2016 compared with 2015. Of the total revenue decrease, consumer inquiry revenues generated through our rate tables decreased by $1.9 million (2.7%) as growth in mortgage and other products was offset by lower advertiser demand in our deposit vertical compared to prior year. Overall unit pricing was 19.4% lower due to our year-long efforts to align the price of each click with the value received by the advertiser, offset by a 20.8% increase in volume due to growth in our mortgage vertical. Other revenue, primarily from sold advertising impressions, was down approximately $6.3 million versus 2015.
Adjusted EBITDA decreased $8.9 million (26.9%), primarily due to the decrease in revenues. Expenses included in Adjusted EBITDA increased $668,000 from the prior year. Cost of revenue decreased $633,000, primarily due to lower partner revenue share payments and paid marketing expense. Sales and marketing expenses increased $1.9 million, primarily due to increased compensation, benefits and incentive compensation, and increased information technology spending. Product development costs decreased by $43,000. General and administrative expenses were $597,000 lower due primarily to information technology and facility costs, partially offset by increased compensation, benefits and incentive compensation expense.
Senior Care
Revenues decreased $375,000 (1.6%) for the year ended December 31, 2016 compared with 2015. Senior housing referral revenue grew $1.3 million (7%) due to an increase in the number of move-ins and the average referral fee per move-in, despite losing our largest senior housing client in January 2016. The communities lost with that client’s departure were more than replaced in our directory of providers, but by smaller, lower-converting senior housing providers. In the latter part of 2016 we conducted a pilot program with a small number of communities for this large senior housing client, and at year-end we won back a significant chunk of their business. In-home care referral revenue grew $289,000 with the Company’s launch of its new home care cost-per-lead business in the summer of 2016. Subscription revenue declined $889,000 (36%) as senior housing clients were converted to referral contracts and in-home care clients were converted to cost-per-lead agreements. The loss of our largest senior housing client also adversely impacted subscription revenue. Advertising revenue was down $1.1 million (58%) following a decision to de-emphasize low margin pharmaceutical ad campaigns starting in 2016.
Adjusted EBITDA increased $594,000 primarily due to a $1.5 million decrease in cost of revenue related to lower paid marketing expense. Sales and Marketing expense increased $585,000 primarily due to compensation, benefits and incentive compensation. Product development increased $108,000 and general and administrative expenses decreased $243,000.
Other
The Other segment includes general corporate expenses and intra-segment eliminations. Revenue for the year ended December 31, 2016 compared with 2015 decreased $1.4 million excluding China, while Adjusted EBITDA excluding China operations, which are being wound down, decreased $8.0 million. The revenue decrease is attributed primarily to higher intra-segment revenue eliminations. The decrease in Adjusted EBITDA was primarily due to $3.5 million in compensation, benefits and incentive compensation expense, $2.3 million in increased consulting costs, $1.7 million higher accounting and other professional fees, and higher facility and information technology costs.
Year Ended December 31, 2015 Compared to Year Ended December 31, 2014
Revenue
Total revenue increased 5.7% to $372.0 million from $352.1 million for the years ended December 31, 2015 and 2014, respectively. This increase is primarily due to higher consumer inquiry revenue on our owned and operated websites, partially offset by lower third-party affiliate, display and print revenues. Revenues from our Credit Cards segment increased $15.0 million or 6.6% to $241.9 million in 2015 compared to 2014. Within the Banking segment, total revenue of $109.7 million in 2015 was 7.4% lower as compared to 2014. Senior Care revenues grew $13.6 million to $23.9 million in 2015 compared to a partial year of results after the business was acquired in May 2014. Other revenues increased $163,000, representing primarily lower intra-segment revenue eliminations. See our segment results discussion for more information.
Costs and Expenses
Cost of Revenue
Cost of revenue for the year ended December 31, 2015 of $173.3 million was $7.2 million lower than the same period in 2014. This decrease was primarily due to reduction of $28.6 million in distribution payments, mainly to our online partners and affiliates as a result of lower online revenue from affiliate sites, partially offset by $13.3 million in higher paid marketing expense, $4.3 million in higher employee compensation and benefit expense, $2.8 million increase in web analytic marketing costs and $117,000 additional stock compensation expense.
Sales and Marketing
Sales and marketing expenses for the year ended December 31, 2015 of $15.8 million were $1.1 million higher than the year ended December 31, 2014, primarily due $869,000 in higher stock-based compensation expense, $343,000 higher compensation and benefits and $174,000 higher sales commissions, partially offset by lower marketing and advertising spend.
Product Development and Technology
Product development and technology costs for the year ended December 31, 2015 of $23.7 million were $6.9 million higher than the comparable period in 2014, primarily due to $3.5 million in higher compensation and benefit costs, $1.3 million higher stock-based compensation expense, $644,000 increased outside contract labor, $406,000 higher web analytic costs and $253,000 higher information technology costs.
General and Administrative
General and administrative expenses for the year ended December 31, 2015 of $63.3 million, were $2.5 million higher than the 2014, due primarily to $5.1 million in higher employee compensation and benefit costs, $3.3 million increased stock-based compensation expense, an increase of $1.6 million in professional fee expenses, mainly for accounting services, a $920,000 increase in contract labor and consulting costs, $840,000 higher technology related expenses and a $3.1 million increase in other expenses including travel, insurance, facility and other costs, partially offset by $12.2 million lower expenses related to the restatement, primarily related to the accrual of $15.0 million for the settlement with the SEC recorded in the third quarter 2014.
Acquisition, Disposition, Offering and Related Expenses
Acquisition, disposition, offering and related expenses for the year ended December 31, 2015 were $569,000 as compared to $3.6 million for the same period in 2014. During the year ended December 31, 2015 these expenses and fees decreased due to lower acquisition activity and during 2014 they were primarily related to our acquisition of Caring.
Change in Fair Value of Contingent Acquisition Consideration
Change in fair value of contingent acquisition consideration for the year ended December 31, 2015 was a credit of $421,000 compared to an expense of $3.6 million for the same period in 2014 due to fewer contingent earnouts required to be accrued for and a reduction of the accrual due to lower projected future contingent payments related to the operating results of acquired businesses.
Depreciation and Amortization
Depreciation and amortization expense for the year ended December 31, 2015 of $40.8 million was $6.3 million higher than the same period in 2014 primarily due to a $3.8 million increase in amortization expense, resulting primarily from intangibles acquired during 2015, and full year of amortization of intangibles acquired during 2014 and a $1.9 million charge to fully amortize certain domain names that were made dormant during the year, and additional depreciation expense of our fixed assets.
Interest and Other Expenses, net
Interest and other expenses, net of $22.3 million for the year ended December 31, 2015 increased $1.5 million from prior year primarily due to the amortization of debt holder consent fees incurred in connection with the delayed 2014 financial statements due to the restatement and a charge related to the exit of an office lease.
Income Tax Expense
Our effective tax rate on continuing operations was 37.5% and 54.1% for the years ended December 31, 2015 and 2014 respectively. The change was principally due to the non-deductibility of the SEC settlement.
Net Loss from Discontinued Operation
Net loss from discontinued operation for the year ended December 31, 2015 increased $28.3 million from the prior year, primarily due to a $35.0 million charge for the impairment of goodwill at our Insurance business segment resulting from the difference between the net book value of the business segment and the estimated fair value of the business and an $11.9 million charge for sales tax expense in the Insurance business, partially offset by a $14.1 million tax benefit, and the $8.6 million gain on sale, net of tax, of the Insurance business, which was sold on December 29, 2015.
Following is a detailed discussion of our segment results of operations:
|
|
|
|
|
|
|
|
|
|
|
|
|
|
|
|
|
|
|
|
|
|
|
|
|
|
|
|
|
|
|
Revenues |
|
Adjusted EBITDA |
||||||||
|
|
|
Year ended |
|
Year ended |
||||||||
|
(In thousands) |
|
December 31, 2015 |
|
December 31, 2014 |
|
December 31, 2015 |
|
December 31, 2014 |
||||
|
Credit Cards |
|
$ |
241,854 |
|
$ |
226,869 |
|
$ |
113,644 |
|
$ |
92,227 |
|
Banking (A) |
|
|
109,677 |
|
|
118,465 |
|
|
33,070 |
|
|
44,854 |
|
Senior Care |
|
|
23,855 |
|
|
10,302 |
|
|
389 |
|
|
(2,581) |
|
Other |
|
|
(3,422) |
|
|
(3,585) |
|
|
(19,980) |
|
|
(16,700) |
|
Total Company |
|
$ |
371,964 |
|
$ |
352,051 |
|
|
127,123 |
|
|
117,800 |
|
|
|
|
|
|
|
|
|
|
|
|
|
|
|
|
|
|
|
|
|
|
|
|
|
|
|
|
|
Less: |
|
|
|
|
|
|
|
|
|
|
|
|
|
Interest and other expenses, net |
|
|
|
|
|
|
|
|
22,279 |
|
|
20,816 |
|
Depreciation and amortization |
|
|
|
|
|
|
|
|
40,843 |
|
|
34,502 |
|
Changes in fair value of contingent acquisition consideration |
|
|
|
|
|
|
|
|
(421) |
|
|
3,633 |
|
Stock-based compensation expense (B) |
|
|
|
|
|
|
|
|
19,417 |
|
|
13,870 |
|
Legal settlements |
|
|
|
|
|
|
|
|
3 |
|
|
1,403 |
|
Acquisition, disposition, offering and related expenses |
|
|
|
|
|
|
|
|
569 |
|
|
3,590 |
|
Restructuring charges |
|
|
|
|
|
|
|
|
5,616 |
|
|
- |
|
Restatement-related expenses (C) |
|
|
|
|
|
|
|
|
11,432 |
|
|
23,586 |
|
China operations (D) |
|
|
|
|
|
|
|
|
393 |
|
|
565 |
|
Impact of purchase accounting |
|
|
|
|
|
|
|
|
35 |
|
|
556 |
|
Net income from continuing operations |
|
|
|
|
|
|
|
$ |
26,957 |
|
$ |
15,279 |
|
|
|
|
|
|
|
|
|
|
|
|
|
|
__________
|
(A) |
During the third quarter 2016, management realigned its management reporting structure by integrating the Quizzle operations into the Banking segment. All segment results reported for the year ended December 31, 2015 have been revised to reflect such change. |
|
(B) |
Excludes approximately $3.9 million and $3.2 million of stock-based compensation costs for the years ended December 31, 2015 and 2014, respectively, related to the divestiture of our Insurance business during 2015. The costs related to our Insurance business are presented as a discontinued operation. |
|
(C) |
Restatement charges include costs related to the Restatement, the Internal Review, the SEC and DOJ investigations and related litigation. |
|
(D) |
Represents the loss from operations in China, and includes legal and other costs incurred to wind down those operations. The results of China were previously presented as a discontinued operation when it was actively marketed for sale. After the negotiations with the potential buyer did not result in a sale of the business, we initiated the process to wind down the operations. |
Credit Cards
Revenue increased $15.0 million (6.6%) for the year ended December 31, 2015 compared with 2014. Of the total revenue growth, consumer inquiry revenues from our owned and operated sites grew by $48.3 million (39.1%). About 54% of consumer inquiry revenue growth came from higher inquiry volume with the remaining increase through better monetization. Inquiry volume was partially driven by the April 2015 mobile responsive redesign of our creditcards.com site. Monetization growth was partly driven by higher advertising and marketing spend by credit card issuers through our owned and operated sites. However, overall revenue growth was negatively impacted by lower affiliate revenues. During the year, certain issuers and third party affiliates shifted their monetization links to other competing networks. Affiliate revenues yield substantially lower margins compared to revenues from owned and operated sites.
Adjusted EBITDA increased $21.4 million (23.2%) due to a combination of increased revenues and a $6.4 million decrease in expenses included in Adjusted EBITDA. The decrease in expenses was primarily due to an $11.4 million decrease in cost of revenue, mainly related to lower affiliate revenue share payments. Sales and marketing expense decreased by $84,000. Product development cost increased by $1.9 million primarily due to higher compensation and incentive expense, increased professional fees and other costs. General and administrative expenses were $3.2 million higher, mainly attributed to higher employee compensation and incentive expenses, increased consulting costs and higher travel, facility and other costs.
Banking
Revenue decreased $8.8 million (7.4%) for the year ended December 31, 2015 compared with 2014. Consumer inquiry revenues generated through our rate tables decreased by $5.5 million (7.7%) primarily due to lower advertiser demand on our mortgage and deposit tables which resulted in a fewer consumer inquiries and lower monetization. This lower demand also impacted display revenue as many of the largest display advertisers on the Bankrate network also participate on our rate tables. As a result, other revenue, primarily from sold advertising impressions, was down approximately $3.2 million versus 2014. 2015 results include the results of Quizzle, which we acquired in 2015.
Adjusted EBITDA decreased $11.8 million (26.3%), primarily due to decreased revenues. Expenses included in Adjusted EBITDA increased $3.0 million from the prior year and include the expenses of Quizzle, acquired in 2015. Cost of revenue decreased $2.7 million, mainly related to lower partner revenue share payments. Sales and marketing expenses were $338,000 lower, primarily due to $274,000 lower sales commissions. Product development costs increased by $3.4 million, due primarily to higher employee compensation and benefits expense, and outside contract labor costs. General and administrative expenses were $2.7 million higher due primarily to employee compensation and benefit expense, information technology expenses and facility costs.
Senior Care
Revenues increased $13.6 million (131.6%) for the year ended December 31, 2015 compared with 2014 due partially to a full year of operations during 2015 after the mid-2014 acquisition of Caring and the acquisition of Senior Homes during 2015. In addition, the number of senior living communities contracted on a referral fee basis increased 50%, leading to a higher number of move-ins on an annualized basis, and the average referral fee increased by 18%.
Adjusted EBITDA increased $3.0 million primarily due to revenue growth as expenses included in Adjusted EBITDA increased approximately $10.1 million, primarily due to a full year of operations and the acquisition of Senior Homes.
Other
Other includes general corporate expenses and intra-segment eliminations. Revenue for the year ended December 31, 2015 compared with 2014 increased $163,000 due to primarily to lower intra-segment eliminations of segment revenue sharing. Adjusted EBITDA decreased by $3.3 million, due to higher corporate expenses.
Liquidity and Capital Resources
|
|
|
|
|
|
|
|
|
|
|
|
|
|
|
|
|
|
|
|
|
|
|
(In thousands) |
|
December 31, 2016 |
|
December 31, 2015 |
|
|
Change |
||
|
Cash and cash equivalents |
|
$ |
176,680 |
|
$ |
237,204 |
|
$ |
(60,524) |
|
Working capital |
|
$ |
217,087 |
|
$ |
261,276 |
|
$ |
(44,189) |
|
Stockholders' equity |
|
$ |
689,378 |
|
$ |
761,195 |
|
$ |
(71,817) |
Our principal ongoing source of operating liquidity is the cash generated by our business operations. We consider all highly liquid investments and debt investments purchased with an original maturity of less than three months to be cash equivalents.
Our primary uses of cash have been to fund our working capital and capital expenditure needs, fund acquisitions, repurchase shares of our common stock and service our debt obligations. We believe that we have the ability to generate sufficient cash flows from operations to fund our operating and capital expenditure requirements, as well as to service our debt obligations, for the next 12 months. In the event we experience a significant adverse change in our business operations, we would likely need to secure additional sources of financing if our needs were in excess of the amount of funding available under our revolving credit facility.
As of December 31, 2016, we had working capital of $217.1 million and our primary commitments were normal working capital requirements and $6.9 million in accrued interest for the Senior Notes. In addition, we have commitments for acquisition related obligations related to past acquisitions totaling $3.7 million, for guaranteed earnouts, as of December 31, 2016 due within the next twelve months.
As of December 31, 2015, we had working capital of $261.3 million and our primary commitments were normal working capital requirements and $6.9 million in accrued interest for the Senior Notes. In addition, we had commitments for acquisition related obligations related to past acquisitions totaling $13.0 million, including both guaranteed and contingent earnouts, as of December 31, 2015 due within the next twelve months. We completed the sale of our Insurance business on December 29, 2015, at which time we received $140.2 million in proceeds on the sale and a deferred receivable of $23.1 million, to be paid to us on the second anniversary of the closing date, for which we recorded a receivable of $18.4 million for its present value. The divestiture of our Insurance business during 2015 is not expected to have a negative impact on our future working capital but may increase our cash conversion cycle as that business had a faster receivable turnover than our other operating segments.
We assess acquisition opportunities as they arise. Financing may be required if we decide to make additional acquisitions or if we are required to make any earnout payments to which the former owners of our acquired businesses may be entitled. There can be no assurance, however, that any such opportunities may arise, or that any such acquisitions may be consummated. Additional financing may not be available on satisfactory terms or at all when required.
Debt Financing
Senior Notes
As of December 31, 2016, we had $300.0 million in Senior Notes outstanding for which interest is accrued daily on the outstanding principal amount at 6.125% and is payable semi-annually, in arrears, on February 15th and August 15th. The Senior Notes are due August 15, 2018. Accrued interest on the Senior Notes as of December 31, 2016 is approximately $6.9 million. Refer to Note 11 in the Notes to Consolidated Financial Statements for a further description of the Senior Notes. The Company was in compliance with all required covenants as of December 31, 2016.
As previously reported in the Company's Current Report on Form 8-K dated November 14, 2014, pursuant to the Second Supplemental Indenture, dated as of November 14, 2014, by and among the Company, certain subsidiaries of the Company party thereto as guarantors and Wilmington Trust, National Association, as trustee, the Company obtained, among other things, an extension of the time permitted to deliver the requisite financial information for the quarter ended September 30, 2014 and, subject to payment by the Company of an additional consent fee, for the year ended December 31, 2014. The Company paid this additional consent fee on March 31, 2015. As a result of obtaining such extension and paying the additional consent fee, the Company was in compliance with all required covenants as of December 31, 2014. As previously reported in the Company's Current Report on Form 8-K dated May 15, 2015, pursuant to the Third Supplemental Indenture, dated as of May 11, 2015, by and among the Company, certain subsidiaries of the Company party thereto as guarantors and Wilmington Trust, National Association, as trustee, the Company obtained an extension of the time permitted to deliver the requisite financial information for the quarters ended September 30, 2014 and March 31, 2015 and for the year ended December 31, 2014.
Our Senior Notes Indenture and Revolving Credit Facility generally permit us to apply the net cash proceeds of approximately $130.0 million from the sale of our Insurance business to prepay outstanding debt and/or invest in assets useful to our business, in each case, within 365 days of our receipt of such net cash proceeds (subject, in the case of any investment, to a further 180-day extension under certain circumstances). If we do not apply such net cash proceeds in the manner and within the time period described above and the amount of unapplied net cash proceeds exceeds $10.0 million, we will be required to offer to purchase a portion of our outstanding Senior Notes using those unapplied net cash proceeds at an offer price equal to 100% of the principal amount of the Senior Notes, plus accrued and unpaid interest, if any, up to but not including, the date of purchase. As of December 31, 2016, it was determined that there were less than $10.0 million in unused net cash proceeds from the sale of our Insurance business that had not been applied as described above.
Revolving Credit Facility
We have a Revolving Credit Facility in an aggregate amount of $70.0 million which matures on May 17, 2018 ("Revolving Credit Facility"). All obligations under the Revolving Credit Facility are guaranteed by the Guarantors and are secured, subject to certain exceptions, by first priority liens and security interests in the assets of the Company and the Guarantors. As of December 31, 2016, there are letters of credits outstanding against our Revolving Credit Facility in the amount of $593,000 and we have approximately $69.4 million available under our Revolving Credit Facility. We are in compliance with all required covenants as of December 31, 2016.
On November 6, 2014, the Company announced it had obtained a waiver under the Revolving Credit Facility with respect to compliance with its obligation to deliver the requisite financial information for the quarter ended September 30, 2014. On March 24, 2015, the Company announced it had obtained a second waiver under the Revolving Credit Facility with respect to compliance with its obligation to deliver the requisite financial information for the year ended December 31, 2014. On May 11, 2015, the Company announced it had obtained a third waiver under the Revolving Credit Facility with respect to compliance with its obligation to deliver the requisite financial information for the quarter ended March 31, 2015.
Cash Flows
Operating Activities
During the year ended December 31, 2016, $79.8 million of cash was provided by operating activities compared to $86 million for the same period in 2015. The decrease is primarily due to:
|
· |
$5.8 million of net cash refunded for income taxes in 2016, compared to $9.6 million in 2015, a decrease of $3.8 million |
|
· |
$24.5 million decrease in net income excluding non-cash charges (primarily depreciation and amortization, impairment charges, deferred income taxes and changes in fair value of contingent acquisition consideration) |
|
· |
$22.0 million increase in working capital changes in operating assets and liabilities, compared to prior year, including in 2016 an approximately $6.1 million payment for a legal settlement and in the 2015 the $15.0 million payment of an SEC settlement |
During the year ended December 31, 2015, operating activities provided cash of $86 million compared to $42.5 million for the same period in 2014. The increase is primarily due to:
|
· |
$9.6 million of net cash refunded for income taxes in 2015, compared to net cash paid for taxes in 2014 of $48.4 million, a net increase of $58.1 million |
|
· |
$1.6 million increase in net income excluding non-cash charges (primarily depreciation and amortization, an impairment charge in our Insurance business, deferred income taxes, changes in fair value of contingent acquisition consideration and an $18.4 million deferred receivable related to the sale of our Insurance business) |
|
· |
$16.2 million decrease in working capital changes in operating assets and liabilities, compared to prior year, including the $15.0 million payment of an SEC settlement in 2015 |
Investing Activities
For the year ended December 31, 2016, cash flows used in investing activities was $76.2 million compared to $94.5 million provided by investing activities for the same period in 2015. The $170.7 million change is primarily due to:
|
· |
the $140.2 million of cash provided by the sale of the Insurance business in 2015 |
|
· |
an increase of $33.9 million of cash used for business acquisitions in 2016 |
For the year ended December 31, 2015, cash flows provided by investing activities was $94.5 million compared to $82.7 million used in investing activities for the same period in 2014. The increase is primarily due to:
|
· |
the $140.2 million of cash provided by the sale of the Insurance business in 2015 |
|
· |
$3.9 million of transaction expenses related to the sale of the Insurance business in 2015 |
|
· |
a decrease of $40.9 million of cash used for business acquisitions in 2015 |
Financing Activities
For the year ended December 31, 2016, cash used in financing activities was $64 million compared to $85.3 million for the same period in 2015. The change is primarily due to:
|
· |
a decrease of $23.8 million of cash used for the purchase of common stock in 2016 |
|
· |
$1.2 million more paid for acquisition consideration in 2016 |
|
· |
$1.4 million of fewer proceeds from the issuance of common stock from the exercise of stock options in 2015 |
For the year ended December 31, 2015, cash flows used in financing activities was $85.3 million, compared to $47.7 million of cash used in financing activities in the same period of 2014. The change is primarily due to:
|
· |
an increase of $21.2 million of cash used for the purchase of common stock in 2015 |
|
· |
$21.4 million of fewer proceeds from the issuance of common stock from the exercise of stock options in 2015 |
|
· |
$5.1 million less paid for contingent acquisition consideration in 2015 |
We estimate that our capital expenditures for furniture, fixtures, equipment and capitalized software will approximate $8.3 million during 2017.
Contractual Obligations
The following table represents the amounts due under the specified types of contractual obligations as of December 31, 2016:
|
|
|
|
|
|
|
|
|
|
|
|
|
|
|
|
|
(In thousands) |
Payments Due Less Than One Year |
|
One to Three Years |
|
Three to Five Years |
|
More Than Five Years |
|
Total |
|||||
|
Operating lease obligations (1) |
$ |
3,240 |
|
$ |
6,712 |
|
$ |
5,693 |
|
$ |
13,434 |
|
$ |
29,079 |
|
Purchase obligations (2) |
|
1,938 |
|
|
1,327 |
|
|
9 |
|
|
- |
|
|
3,274 |
|
Long-term debt (3) |
|
18,729 |
|
|
318,640 |
|
|
- |
|
|
- |
|
|
337,369 |
|
Acquisition obligations |
|
3,750 |
|
|
- |
|
|
- |
|
|
- |
|
|
3,750 |
|
|
$ |
27,657 |
|
$ |
326,679 |
|
$ |
5,702 |
|
$ |
13,434 |
|
$ |
373,472 |
__________
(1) Includes our obligations under existing operating leases.
(2) Represents base contract amounts for Internet hosting, co-location, content distribution and other infrastructure costs.
(3) Represents interest and principal payments on the Senior Notes and commitment fees on the Revolving Credit Facility.
In January 2017, we entered into a new office lease for one of our businesses which expires in June 2022.
As of December 31, 2016, we have approximately $5.6 million accrued for uncertain tax positions, including estimated interest and penalties, included in other liabilities and non-current deferred tax assets, respectively, as we cannot determine when (or if) any tax payments will ultimately be paid. We also have approximately $31.6 million in other liabilities accrued for contingent labilities as of December 31, 2016.
OFF-BALANCE SHEET ARRANGEMENTS
Off-balance sheet arrangements include the following four categories: obligations under certain guarantees or contracts; retained or contingent interests in assets transferred to an unconsolidated entity or similar arrangements; obligations under certain derivative arrangements; and obligations under material variable interests.
We have not entered into any material arrangements which would fall under any of these four categories and which would be reasonably likely to have a current or future material effect on our results of operations, liquidity or financial condition.
Interest Rate Risk
We maintain or may maintain a portfolio of investments including bank deposits, U.S. Treasury securities, U.S. Government Agency securities, municipal securities, corporate debt securities and money market funds. The Company’s investment objectives, in order of priority, are 1) to preserve capital, 2) to maintain liquidity, and 3) to obtain a fair rate of return. In addition to other restrictions based on credit quality, the maximum maturity date for each investment is 24 months and the weighted average maturity of the portfolio may not exceed 12 months.
None of our outstanding debt as of December 31, 2016 was subject to variable interest rates as we did not have an outstanding balance for borrowed money under our Revolving Credit Facility as of December 31, 2016. Interest under our Revolving Credit Facility accrues at variable rates based, at our option, on the alternate base rate (as defined in the Revolving Credit Facility) plus a margin of 3.00% or at the adjusted LIBO rate (as defined in the Revolving Credit Facility) plus a margin of 2.00%. Our fixed interest rate debt includes $300.0 million of our Senior Notes in aggregate principal amount.
Exchange Rate Sensitivity
Our exposure to exchange rate risk is primarily that of a net receiver of currencies other than the U.S. dollar, primarily British Pound Sterling. Accordingly, changes in exchange rates, and in particular a strengthening of the U.S. dollar, can affect the Company's net sales and income from operations as expressed in U.S. dollars. Additionally, we have not engaged in any derivative or hedging transactions to date. During the year ended December 31, 2016, non-U.S. revenues were less than 1% of our total revenue. We estimate that a hypothetical 10% change (increase or decrease) in exchange rates would not have a material impact to our consolidated financial statements.
9
INDEX TO FINANCIAL STATEMENTS
10
REPORT OF INDEPENDENT REGISTERED PUBLIC ACCOUNTING FIRM
Board of Directors and Stockholders
Bankrate, Inc.
We have audited the accompanying consolidated balance sheets of Bankrate, Inc. (a Delaware corporation) and subsidiaries (the “Company”) as of December 31, 2016 and 2015, and the related consolidated statements of comprehensive income (loss), changes in stockholders’ equity, and cash flows for each of the three years in the period ended December 31, 2016. These financial statements are the responsibility of the Company’s management. Our responsibility is to express an opinion on these financial statements based on our audits.
We conducted our audits in accordance with the standards of the Public Company Accounting Oversight Board (United States). Those standards require that we plan and perform the audit to obtain reasonable assurance about whether the financial statements are free of material misstatement. An audit includes examining, on a test basis, evidence supporting the amounts and disclosures in the financial statements. An audit also includes assessing the accounting principles used and significant estimates made by management, as well as evaluating the overall financial statement presentation. We believe that our audits provide a reasonable basis for our opinion.
In our opinion, the consolidated financial statements referred to above present fairly, in all material respects, the financial position of Bankrate, Inc. and subsidiaries as of December 31, 2016 and 2015, and the results of their operations and their cash flows for each of the three years in the period ended December 31, 2016 in conformity with accounting principles generally accepted in the United States of America.
We also have audited, in accordance with the standards of the Public Company Accounting Oversight Board (United States), the Company’s internal control over financial reporting as of December 31, 2016, based on criteria established in the 2013 Internal Control—Integrated Framework issued by the Committee of Sponsoring Organizations of the Treadway Commission (COSO), and our report dated March 22, 2017 expressed an adverse opinion.
/s/ GRANT THORNTON LLP
New York, New York
March 22, 2017
11
REPORT OF INDEPENDENT REGISTERED PUBLIC ACCOUNTING FIRM
Board of Directors and Stockholders
Bankrate, Inc.
We have audited the internal control over financial reporting of Bankrate, Inc. (a Delaware corporation) and subsidiaries (the “Company”) as of December 31, 2016, based on criteria established in the 2013 Internal Control—Integrated Framework issued by the Committee of Sponsoring Organizations of the Treadway Commission (COSO). The Company’s management is responsible for maintaining effective internal control over financial reporting and for its assessment of the effectiveness of internal control over financial reporting, included in the accompanying Management’s Report on Internal Control over Financial Reporting (“Management’s Report”). Our responsibility is to express an opinion on the Company’s internal control over financial reporting based on our audit. Our audit of, and opinion on, the Company’s internal control over financial reporting does not include the internal control over financial reporting of the NextAdvisor business, whose financial statements reflect total assets and revenues constituting 10% and 7% percent, respectively, of the related consolidated financial statement amounts as of and for the year ended December 31, 2016. As indicated in Management’s Report, the NextAdvisor business was acquired during 2016. Management’s assertion on the effectiveness of the Company’s internal control over financial reporting excluded internal control over financial reporting of NextAdvisor.
We conducted our audit in accordance with the standards of the Public Company Accounting Oversight Board (United States). Those standards require that we plan and perform the audit to obtain reasonable assurance about whether effective internal control over financial reporting was maintained in all material respects. Our audit included obtaining an understanding of internal control over financial reporting, assessing the risk that a material weakness exists, testing and evaluating the design and operating effectiveness of internal control based on the assessed risk, and performing such other procedures as we considered necessary in the circumstances. We believe that our audit provides a reasonable basis for our opinion.
A company’s internal control over financial reporting is a process designed to provide reasonable assurance regarding the reliability of financial reporting and the preparation of financial statements for external purposes in accordance with generally accepted accounting principles. A company’s internal control over financial reporting includes those policies and procedures that (1) pertain to the maintenance of records that, in reasonable detail, accurately and fairly reflect the transactions and dispositions of the assets of the company; (2) provide reasonable assurance that transactions are recorded as necessary to permit preparation of financial statements in accordance with generally accepted accounting principles, and that receipts and expenditures of the company are being made only in accordance with authorizations of management and directors of the company; and (3) provide reasonable assurance regarding prevention or timely detection of unauthorized acquisition, use, or disposition of the company’s assets that could have a material effect on the financial statements.
Because of its inherent limitations, internal control over financial reporting may not prevent or detect misstatements. Also, projections of any evaluation of effectiveness to future periods are subject to the risk that controls may become inadequate because of changes in conditions, or that the degree of compliance with the policies or procedures may deteriorate.
A material weakness is a deficiency, or combination of control deficiencies, in internal control over financial reporting, such that there is a reasonable possibility that a material misstatement of the company’s annual or interim financial statements will not be prevented or detected on a timely basis. The following material weakness has been identified and included in management’s assessment. The material weakness related to the validation of key inputs to the valuation reports used to determine the contingent consideration liability in connection with the acquisition of NextAdvisor and the valuation of the impairment of finite lived assets and goodwill for the Quizzle business have been identified and included in Management’s Report on Internal Control over Financial Reporting appearing under Item 9A of the Company’s December 31, 2016 Annual Report on Form 10-K.
In our opinion, because of the effect of the material weakness described above on the achievement of the objectives of the control criteria, the Company has not maintained effective internal control over financial reporting as of December 31, 2016, based on criteria established in the 2013 Internal Control—Integrated Framework issued by COSO.
We also have audited, in accordance with the standards of the Public Company Accounting Oversight Board (United States), the consolidated financial statements of the Company as of and for the year ended December 31, 2016. The material weakness identified above was considered in determining the nature, timing, and extent of audit tests applied in our audit of the 2016 consolidated financial statements, and this report does not affect our report dated March 22, 2017, which expressed an unqualified opinion on those financial statements.
We do not express an opinion or any other form of assurance on management’s remediation plans for the identified material weakness.
/s/ GRANT THORNTON LLP
New York, New York
March 22, 2017
12
Bankrate, Inc. and Subsidiaries
(In thousands, except share and per share data)
|
|
|
|
|
|
|
|
|
|
|
|
|
|
|
|
|
|
|
December 31, |
|
December 31, |
||
|
|
|
2016 |
|
2015 |
||
|
Assets |
|
|
|
|
|
|
|
Cash and cash equivalents |
|
$ |
176,680 |
|
$ |
237,204 |
|
Accounts receivable, net of allowance for doubtful accounts of |
|
|
|
|
|
|
|
$190 and $147, respectively |
|
|
52,211 |
|
|
56,265 |
|
Prepaid expenses and other current assets |
|
|
42,041 |
|
|
26,871 |
|
Total current assets |
|
|
270,932 |
|
|
320,340 |
|
Furniture, fixtures and equipment, net of accumulated depreciation of |
|
|
|
|
|
|
|
$19,514 and $16,027, respectively |
|
|
15,440 |
|
|
10,189 |
|
Intangible assets, net of accumulated amortization of |
|
|
|
|
|
|
|
$202,331 and $168,627, respectively |
|
|
192,119 |
|
|
205,766 |
|
Goodwill |
|
|
599,805 |
|
|
567,544 |
|
Other assets |
|
|
5,564 |
|
|
23,127 |
|
Total assets |
|
$ |
1,083,860 |
|
$ |
1,126,966 |
|
Liabilities and stockholders' equity |
|
|
|
|
|
|
|
Liabilities |
|
|
|
|
|
|
|
Accounts payable |
|
$ |
11,191 |
|
$ |
10,147 |
|
Accrued expenses |
|
|
27,887 |
|
|
25,838 |
|
Deferred revenue and customer deposits |
|
|
1,369 |
|
|
1,508 |
|
Accrued interest payable |
|
|
6,887 |
|
|
6,890 |
|
Other current liabilities |
|
|
6,511 |
|
|
14,681 |
|
Total current liabilities |
|
|
53,845 |
|
|
59,064 |
|
Deferred income taxes |
|
|
5,118 |
|
|
7,552 |
|
Long term debt, net of unamortized discount |
|
|
295,721 |
|
|
293,284 |
|
Other liabilities |
|
|
39,798 |
|
|
5,871 |
|
Total liabilities |
|
|
394,482 |
|
|
365,771 |
|
Commitments and contingencies (Note 10) |
|
|
|
|
|
|
|
Stockholders' equity |
|
|
|
|
|
|
|
Preferred stock, par value $.01 per share - 50,000,000 authorized, none issued |
|
|
- |
|
|
- |
|
Common stock, par value $.01 per share - |
|
|
|
|
|
|
|
300,000,000 shares authorized |
|
|
|
|
|
|
|
103,132,289 and 103,845,310 shares issued, respectively; |
|
|
|
|
|
|
|
90,072,482 and 96,794,018 shares outstanding, respectively |
|
|
1,032 |
|
|
1,039 |
|
Additional paid-in capital |
|
|
903,177 |
|
|
886,261 |
|
Accumulated deficit |
|
|
(71,119) |
|
|
(36,985) |
|
Less: Treasury stock, at cost - 13,059,807 and 7,051,292 shares, respectively |
|
|
(142,983) |
|
|
(88,616) |
|
Accumulated other comprehensive loss |
|
|
(729) |
|
|
(504) |
|
Total stockholders' equity |
|
|
689,378 |
|
|
761,195 |
|
Total liabilities and stockholders' equity |
|
$ |
1,083,860 |
|
$ |
1,126,966 |
The accompanying notes are an integral part of these consolidated financial statements.
13
Bankrate, Inc. and Subsidiaries
Consolidated Statements of Comprehensive Income (Loss)
(In thousands, except share and per share data)
|
|
|
|
|
|
|
|
|
|
|
|
|
Year ended |
||||||
|
|
December 31, |
|
December 31, |
|
December 31, |
|||
|
|
2016 |
|
2015 |
|
2014 |
|||
|
Revenue |
$ |
434,161 |
|
$ |
371,964 |
|
$ |
352,051 |
|
|
|
|
|
|
|
|
|
|
|
Costs and expenses: |
|
|
|
|
|
|
|
|
|
Cost of revenue |
|
227,546 |
|
|
173,261 |
|
|
180,445 |
|
Sales and marketing |
|
17,512 |
|
|
15,821 |
|
|
14,756 |
|
Product development and technology |
|
29,312 |
|
|
23,689 |
|
|
16,786 |
|
General and administrative |
|
79,893 |
|
|
63,347 |
|
|
60,841 |
|
Legal settlements |
|
5,345 |
|
|
3 |
|
|
1,403 |
|
Acquisition, disposition and related expenses |
|
1,811 |
|
|
569 |
|
|
3,590 |
|
Restructuring-related expenses |
|
(117) |
|
|
5,616 |
|
|
- |
|
Changes in fair value of contingent acquisition consideration |
|
(6,481) |
|
|
(421) |
|
|
3,633 |
|
Impairment charges |
|
43,110 |
|
|
- |
|
|
- |
|
Depreciation and amortization |
|
42,247 |
|
|
40,843 |
|
|
34,502 |
|
Total costs and expenses |
|
440,178 |
|
|
322,728 |
|
|
315,956 |
|
(Loss) income from operations |
|
(6,017) |
|
|
49,236 |
|
|
36,095 |
|
|
|
|
|
|
|
|
|
|
|
Interest and other expenses, net |
|
19,677 |
|
|
22,279 |
|
|
20,816 |
|
|
|
|
|
|
|
|
|
|
|
(Loss) income before taxes |
|
(25,694) |
|
|
26,957 |
|
|
15,279 |
|
Income tax expense |
|
8,344 |
|
|
10,115 |
|
|
8,260 |
|
Net (loss) income from continuing operations |
|
(34,038) |
|
|
16,842 |
|
|
7,019 |
|
Net loss from discontinued operation, net of income taxes |
|
(96) |
|
|
(30,188) |
|
|
(1,847) |
|
Net (loss) income |
$ |
(34,134) |
|
$ |
(13,346) |
|
$ |
5,172 |
|
|
|
|
|
|
|
|
|
|
|
Basic net (loss) income per share: |
|
|
|
|
|
|
|
|
|
Continuing operations |
$ |
(0.38) |
|
$ |
0.17 |
|
$ |
0.07 |
|
Discontinued operation |
|
- |
|
|
(0.31) |
|
|
(0.02) |
|
Basic net (loss) income per share |
$ |
(0.38) |
|
$ |
(0.14) |
|
$ |
0.05 |
|
|
|
|
|
|
|
|
|
|
|
Diluted net (loss) income per share: |
|
|
|
|
|
|
|
|
|
Continuing operations |
$ |
(0.38) |
|
$ |
0.17 |
|
$ |
0.07 |
|
Discontinued operation |
|
- |
|
|
(0.30) |
|
|
(0.02) |
|
Diluted net (loss) income per share |
$ |
(0.38) |
|
$ |
(0.13) |
|
$ |
0.05 |
|
|
|
|
|
|
|
|
|
|
|
Weighted average common shares outstanding: |
|
|
|
|
|
|
|
|
|
Basic |
|
89,181,386 |
|
|
97,637,936 |
|
|
100,399,458 |
|
Diluted |
|
89,181,386 |
|
|
99,723,532 |
|
|
102,417,273 |
|
|
|
|
|
|
|
|
|
|
|
Net (loss) income |
$ |
(34,134) |
|
$ |
(13,346) |
|
$ |
5,172 |
|
Other comprehensive loss, net of tax |
|
(225) |
|
|
(138) |
|
|
(173) |
|
Comprehensive (loss) income |
$ |
(34,359) |
|
$ |
(13,484) |
|
$ |
4,999 |
The accompanying notes are an integral part of these consolidated financial statements.
14
Bankrate, Inc. and Subsidiaries
Consolidated Statements of Stockholders’ Equity
(In thousands)
|
|
|
|
|
|
|
|
|
|
|
|
|
|
|
|
|
|
|
|
|
|
|
|
|
|
|
|
Common Stock |
|
|
|
|
|
|
|
Treasury Stock |
|
|
|
|
|
|
|||||||
|
(In thousands) |
|
Shares |
|
Amount |
|
Additional paid-in capital |
|
Accumulated Deficit |
|
Shares |
|
Amount |
|
Accumulated Other Comprehensive Loss - Foreign Currency Translation |
|
Total Stockholders' Equity |
|||||||
|
|
|
|
|
|
|
|
|
|
|
|
|
|
|
|
|
|
|
|
|
|
|
|
|
|
Balance at January 1, 2014 |
|
101,749 |
|
$ |
1,017 |
|
$ |
864,152 |
|
$ |
(28,811) |
|
|
(50) |
|
$ |
(592) |
|
$ |
(193) |
|
$ |
835,573 |
|
Other comprehensive loss, net of taxes |
|
- |
|
|
- |
|
|
- |
|
|
- |
|
|
- |
|
|
- |
|
|
(173) |
|
|
(173) |
|
Treasury stock purchased |
|
- |
|
|
- |
|
|
- |
|
|
- |
|
|
(3,940) |
|
|
(57,879) |
|
|
- |
|
|
(57,879) |
|
Restricted stock issued, net of cancellations |
|
824 |
|
|
8 |
|
|
(10,993) |
|
|
- |
|
|
701 |
|
|
10,985 |
|
|
- |
|
|
- |
|
Performance stock issued, net of cancellations |
|
528 |
|
|
6 |
|
|
(998) |
|
|
- |
|
|
73 |
|
|
992 |
|
|
- |
|
|
- |
|
Common stock issued |
|
1,540 |
|
|
16 |
|
|
22,810 |
|
|
- |
|
|
- |
|
|
- |
|
|
- |
|
|
22,826 |
|
Common stock issued as acquisition payment |
|
60 |
|
|
- |
|
|
700 |
|
|
- |
|
|
- |
|
|
- |
|
|
- |
|
|
700 |
|
Stock-based compensation |
|
- |
|
|
- |
|
|
17,067 |
|
|
- |
|
|
- |
|
|
- |
|
|
- |
|
|
17,067 |
|
Net income |
|
- |
|
|
- |
|
|
- |
|
|
5,172 |
|
|
- |
|
|
- |
|
|
- |
|
|
5,172 |
|
Balance at December 31, 2014 |
|
104,701 |
|
$ |
1,047 |
|
$ |
892,738 |
|
$ |
(23,639) |
|
|
(3,216) |
|
$ |
(46,494) |
|
$ |
(366) |
|
$ |
823,286 |
|
Other comprehensive loss, net of taxes |
|
- |
|
|
- |
|
|
- |
|
|
- |
|
|
- |
|
|
- |
|
|
(138) |
|
|
(138) |
|
Treasury stock purchased |
|
- |
|
|
- |
|
|
- |
|
|
- |
|
|
(6,786) |
|
|
(79,119) |
|
|
- |
|
|
(79,119) |
|
Restricted stock issued, net of cancellations |
|
(426) |
|
|
(4) |
|
|
(19,244) |
|
|
- |
|
|
1,557 |
|
|
19,248 |
|
|
- |
|
|
- |
|
Performance stock issued, net of cancellations |
|
(529) |
|
|
(5) |
|
|
(17,744) |
|
|
- |
|
|
1,394 |
|
|
17,749 |
|
|
- |
|
|
- |
|
Common stock issued |
|
99 |
|
|
1 |
|
|
1,407 |
|
|
- |
|
|
- |
|
|
- |
|
|
- |
|
|
1,408 |
|
Stock-based compensation |
|
- |
|
|
- |
|
|
19,417 |
|
|
- |
|
|
- |
|
|
- |
|
|
- |
|
|
19,417 |
|
Divestiture and restructuring award modification |
|
- |
|
|
- |
|
|
9,687 |
|
|
- |
|
|
- |
|
|
- |
|
|
- |
|
|
9,687 |
|
Net loss |
|
- |
|
|
- |
|
|
- |
|
|
(13,346) |
|
|
- |
|
|
- |
|
|
- |
|
|
(13,346) |
|
Balance at December 31, 2015 |
|
103,845 |
|
$ |
1,039 |
|
$ |
886,261 |
|
$ |
(36,985) |
|
|
(7,051) |
|
$ |
(88,616) |
|
$ |
(504) |
|
$ |
761,195 |
|
Other comprehensive loss, net of taxes |
|
- |
|
|
- |
|
|
- |
|
|
- |
|
|
- |
|
|
- |
|
|
(225) |
|
|
(225) |
|
Treasury stock purchased |
|
- |
|
|
- |
|
|
- |
|
|
- |
|
|
(6,087) |
|
|
(55,297) |
|
|
- |
|
|
(55,297) |
|
Restricted stock issued, net of cancellations |
|
(102) |
|
|
(1) |
|
|
(929) |
|
|
- |
|
|
79 |
|
|
930 |
|
|
- |
|
|
- |
|
Performance stock issued, net of cancellations |
|
(611) |
|
|
(6) |
|
|
6 |
|
|
- |
|
|
- |
|
|
|
|
|
- |
|
|
- |
|
Stock-based compensation |
|
- |
|
|
- |
|
|
17,839 |
|
|
- |
|
|
- |
|
|
- |
|
|
- |
|
|
17,839 |
|
Net loss |
|
- |
|
|
- |
|
|
- |
|
|
(34,134) |
|
|
- |
|
|
- |
|
|
- |
|
|
(34,134) |
|
Balance at December 31, 2016 |
|
103,132 |
|
$ |
1,032 |
|
$ |
903,177 |
|
$ |
(71,119) |
|
|
(13,059) |
|
$ |
(142,983) |
|
$ |
(729) |
|
$ |
689,378 |
The accompanying notes are an integral part of these consolidated financial statements.
15
Bankrate, Inc. and Subsidiaries
Consolidated Statements of Cash Flows
(In thousands)
|
|
|
|
|
|
|
|
|
|
|
|
|
|
|
|
|
|
|
|
|
|
|
|
|
Year ended |
|
|
|
||||
|
|
|
December 31, |
|
December 31, |
|
December 31, |
|||
|
|
|
2016 |
|
2015 |
|
2014 |
|||
|
Cash flows from operating activities |
|
|
|
|
|
|
|
|
|
|
Net (loss) income |
|
$ |
(34,134) |
|
$ |
(13,346) |
|
$ |
5,172 |
|
Adjustments to reconcile net (loss) income to net cash provided by operating activities: |
|
|
|
|
|
|
|
|
|
|
Depreciation and amortization |
|
|
42,247 |
|
|
65,884 |
|
|
58,989 |
|
Provision for doubtful accounts receivable |
|
|
183 |
|
|
584 |
|
|
494 |
|
Deferred income taxes |
|
|
(2,434) |
|
|
(18,296) |
|
|
(382) |
|
Amortization of deferred financing charges and original issue discount |
|
|
2,438 |
|
|
1,803 |
|
|
2,201 |
|
Stock-based compensation |
|
|
19,159 |
|
|
19,417 |
|
|
17,067 |
|
Divestiture and restructuring stock award modifications |
|
|
- |
|
|
7,254 |
|
|
- |
|
Loss (gain) on disposal of assets |
|
|
256 |
|
|
(493) |
|
|
- |
|
Changes in fair value of contingent acquisition consideration |
|
|
(6,481) |
|
|
(421) |
|
|
3,633 |
|
Gain on sale of discontinued operation |
|
|
- |
|
|
(8,566) |
|
|
- |
|
Impairment charges |
|
|
43,110 |
|
|
35,000 |
|
|
- |
|
Change in operating assets and liabilities, net of effect of business acquisitions: |
|
|
|
|
|
|
|
|
|
|
Accounts receivable |
|
|
12,280 |
|
|
(6,274) |
|
|
(8,560) |
|
Prepaid expenses and other assets |
|
|
2,193 |
|
|
4,892 |
|
|
(21,870) |
|
Accounts payable |
|
|
(1,232) |
|
|
1,409 |
|
|
(317) |
|
Accrued expenses |
|
|
(16) |
|
|
(18,329) |
|
|
7,105 |
|
Other liabilities |
|
|
2,326 |
|
|
15,987 |
|
|
(21,500) |
|
Deferred revenue and customer deposits |
|
|
(139) |
|
|
(456) |
|
|
475 |
|
Net cash provided by operating activities |
|
|
79,756 |
|
|
86,049 |
|
|
42,507 |
|
|
|
|
|
|
|
|
|
|
|
|
Cash flows from investing activities |
|
|
|
|
|
|
|
|
|
|
Purchases of furniture, fixtures and equipment and capitalized software and website development costs |
|
|
(11,455) |
|
|
(10,987) |
|
|
(10,972) |
|
Cash received on sale of discontinued operation |
|
|
- |
|
|
140,200 |
|
|
- |
|
Transaction expenses |
|
|
- |
|
|
(3,905) |
|
|
- |
|
Restricted cash |
|
|
(1) |
|
|
- |
|
|
6 |
|
Cash used in business acquisitions, net |
|
|
(64,728) |
|
|
(30,810) |
|
|
(71,729) |
|
Net cash (used in) provided by investing activities |
|
|
(76,184) |
|
|
94,498 |
|
|
(82,695) |
|
|
|
|
|
|
|
|
|
|
|
|
Cash flows from financing activities |
|
|
|
|
|
|
|
|
|
|
Cash paid for contingent acquisition consideration |
|
|
(5,181) |
|
|
(7,545) |
|
|
(12,683) |
|
Cash paid for deferred acquisition consideration |
|
|
(3,521) |
|
|
- |
|
|
- |
|
Purchase of Company stock |
|
|
(55,297) |
|
|
(79,119) |
|
|
(57,879) |
|
Proceeds from exercise of stock options, net of costs |
|
|
- |
|
|
1,408 |
|
|
22,826 |
|
Net cash used in financing activities |
|
|
(63,999) |
|
|
(85,256) |
|
|
(47,736) |
|
|
|
|
|
|
|
|
|
|
|
|
Effect of exchange rate on cash and cash equivalents |
|
|
(97) |
|
|
(138) |
|
|
(96) |
|
Net (decrease) increase in cash |
|
|
(60,524) |
|
|
95,153 |
|
|
(88,020) |
|
Cash - beginning of period |
|
|
237,204 |
|
|
142,051 |
|
|
230,071 |
|
Cash - end of period |
|
|
176,680 |
|
|
237,204 |
|
|
142,051 |
|
Less cash of discontinued operation - end of period |
|
|
- |
|
|
- |
|
|
22,697 |
|
Cash of continuing operations - end of period |
|
$ |
176,680 |
|
$ |
237,204 |
|
$ |
119,354 |
|
|
|
|
|
|
|
|
|
|
|
|
Supplemental disclosure of other cash flow activities |
|
|
|
|
|
|
|
|
|
|
Cash paid for interest |
|
$ |
18,691 |
|
$ |
19,650 |
|
$ |
19,532 |
|
Cash (refunded) paid for taxes, net |
|
|
(5,793) |
|
|
(9,645) |
|
|
48,444 |
|
|
|
|
|
|
|
|
|
|
|
|
Supplemental disclosure of non-cash investing and financing activities |
|
|
|
|
|
|
|
|
|
|
Contingent acquisition consideration |
|
|
37,293 |
|
|
3,747 |
|
|
1,930 |
|
Deferred receivable for business divestiture |
|
|
- |
|
|
18,391 |
|
|
- |
The accompanying notes are an integral part of these consolidated financial statements.
NOTE 1 – ORGANIZATION AND BASIS OF PRESENTATION
Bankrate, Inc. and its subsidiaries (“Bankrate” or the “Company,” “we,” “us,” “our”) own and operate an Internet-based consumer banking, personal finance and senior care network (“Online Network”). Our flagship websites, CreditCards.com, Bankrate.com, and Caring.com are some of the Internet’s leading aggregators of information on more than 300 financial and senior care products and services, including credit cards, mortgages, deposits, and other personal finance categories. Additionally, we provide financial applications and information to a network of distribution partners and through national and state publications.
We operate the following reportable business segments:
|
· |
Credit Cards – we present visitors a comprehensive selection of consumer and business credit and prepaid cards, providing detailed information and comparison capabilities, and host news and advice on personal finance, credit card and bank policies, as well as tools, calculators, products and services to estimate credit scores and card benefits. |
|
· |
Banking – we offer information on rates for various types of mortgages, home lending and refinancing. We maintain current rate information for more than 600 local markets, covering all 50 U.S. states. Consumers can customize searches for mortgage rates by loan size, type, maturity, and location through our online portals. We also offer rate information and original editorial content on various deposit products, retirement, taxes and debt management. |
|
· |
Senior Care – we provide helpful caregiving content, a comprehensive online senior living directory for the United States, a local directory covering a wide array of other senior caregiving services and telephone support and advice from trained Family Advisors. |
|
· |
Other – includes unallocated corporate overhead, the elimination of transactions between segments and the wind down of our China operations. |
Basis of Presentation
The accompanying consolidated financial statements include the accounts of Bankrate, Inc., and subsidiaries CreditCards.com, Inc. (“CreditCards”), LinkOffers, Inc., CreditCards.com Limited (United Kingdom), Freedom Marketing Limited (United Kingdom), Caring, Inc., Wallaby Financial Inc., Quizzle, LLC., and Bankrate, LLC., after elimination of all intercompany accounts and transactions. During 2015, we sold our Insurance business. The operating results and the assets and liabilities of the Insurance business through the date of sale are classified as a discontinued operation for all periods presented in the Company’s consolidated financial statements with the exception of consolidated statements of cash flows which are presented on a consolidated basis.
Reclassification
During 2016, expenses were reclassified from sales and marketing expenses to cost of revenue and general and administration for one of our businesses. The expenses moved to cost of revenue are traffic acquisition costs in nature and more appropriately classified as costs of revenue, and the other costs more appropriately classified as general and administrative expenses. For 2015, $994,000 was reclassified from sales and marketing to cost of revenue and $290,000 was reclassified from sales and marketing to general and administrative expense. For 2014, $178,000 was reclassified from sales and marketing to cost of revenue and $881,000 was reclassified from sales and marketing to general and administrative expense.
During 2016, management revised the strategy of its Quizzle reporting unit to focus its technology resources primarily on enhancing the user experience of the products and services provided by the Banking segment through greater personalization, and realigned its management reporting structure by integrating the Quizzle operations and reporting unit into the Banking reporting unit. All segment results reported for the years ended December 31, 2016 and 2015, and as of December 31, 2016, have been revised to reflect such change.
In accordance with the adoption of Accounting Standards Update (“ASU”) 2016-15, “Statement of Cash Flows (Topic 230): Classification of Certain Cash Receipts and Cash Payments”, classifications of certain transactions were adjusted in our consolidated statement of cash flows for the presentation of cash flows from operating, investing and financing activities, for each year presented.
In accordance with the adoption of Accounting Standards Update (“ASU”) ASU 2015-03, “Imputation of Interest—Simplifying the Presentation of Debt Issuance Costs,” our senior unsecured notes are presented net of their related deferred financing costs as of December 31, 2016 and 2015.
Our operations in China were previously presented as a discontinued operation as we were marketing them for sale. During the first half of 2016 we could not come to terms with the potential buyers of the business, negotiations ended and the plan to sell the business was abandoned. It was then determined to start the process of winding down and closing the operations in China, a process which, based on local requirements and regulations, is not expected to be completed until 2018. During the year ended December 31, 2016, we recorded approximately $588,000 for the acceleration of amortization and depreciation of certain intangible and work-in-process assets, furniture, fixtures and equipment and other assets based on their estimated remaining future economic life, and $529,000 as employee severance as the operations wind down. The accelerated amortization and depreciation recorded had an immaterial impact to our earnings per share for the year. Certain trademark intangible assets and certain internally developed fixed assets deemed to have future economic lives, with fair values of $35,000 and $13,000, respectively, were transferred from the business to the Company.
Share Repurchase Program
In February 2016, the Company’s Board of Directors authorized a $50.0 million share repurchase program. Under the terms of the program, the Company was authorized to repurchase up to $50.0 million of its outstanding common stock, excluding commissions. Stock repurchases under this program could be made through open market and privately negotiated transactions. The timing and amount of specific repurchases were subject to the requirements of federal securities law, market conditions, alternative uses of capital and other factors. The stock repurchase program did not obligate the Company to acquire any particular amount of shares and the program could have been limited or terminated at any time without prior notice. The program was completed in April 2016. During the year ended December 31, 2016, we repurchased approximately 5.6 million shares for approximately $50.0 million, plus commission fees.
During the year ended December 31, 2016, we increased our treasury stock by 496,000 shares ($5.2 million) for shares withheld from the vesting of stock-based compensation awards to pay for employee tax withholding.
NOTE 2—SUMMARY OF SIGNIFICANT ACCOUNTING POLICIES
Use of Estimates
The preparation of the consolidated financial statements in conformity with accounting principles generally accepted in the United States requires management to make estimates and assumptions that affect the reported amounts of assets and liabilities and disclosure of contingent gains and losses at the date of the consolidated financial statements and the reported amounts of revenue and expenses during the reporting period. We believe that the judgments, estimates and assumptions involved in the accounting for revenue recognition, income taxes, the allowance for doubtful accounts receivable, useful lives of intangible assets, share based payments and intangible asset impairment, goodwill impairment, acquisition accounting including the fair value of contingent acquisition consideration, and contingencies have the greatest potential impact on our consolidated financial statements, so we consider these to be our critical accounting policies. Actual results could differ from those estimates.
Revenue Recognition
Online revenue comprised 99%, 99% and 99% of total revenues during the years ended December 31, 2016, 2015 and 2014, respectively. Online advertising is monetized through the sale of advertising and sponsorships through displays, hyperlinks, and lead generation within the many owned and operated websites of our Online Network. In general, the amount of advertising we sell is a function of a number of market conditions including (i) the number of visitors to our Online Network, (ii) the number of ad pages we serve to those visitors, (iii) the click-through rate of our visitors on hyperlinks, (iv) the number of advertisements per page, (v) the rate at which visitors apply for and are approved for financial product offerings, and (vi) advertiser demand.
The print publishing and licensing business is primarily engaged in the sale of advertising, mortgage and interest rate tables, and licensing of research information.
Consumer Inquiry Revenue
In the credit card segment, we deliver consumer inquiries as a click or phone call to our advertisers and primarily recognize revenue on a per-completed and approved application basis. We also have some card issuer agreements which recognize revenue on a per completed application basis.
In the banking segment, we deliver consumer inquiries in the form of clicks and calls and recognize revenue monthly for each inquiry based on the number of clicks at a cost-per-click-for our mortgage and deposit and other banking products. Additionally, we recognize revenue based on the number of calls at a rate per-call.
In the senior care segment we deliver consumer inquiries to contracting senior care communities after qualifying the inquiries in our call center and matching them to a number of suitable communities. We recognize revenue for each consumer who moves into a community for which we provided the initial referral. We also deliver consumer leads to participating in-home care providers, for which we received fees on a per-lead basis.
We have also entered into revenue sharing arrangements with our vertical content and affiliate partners based on the revenue earned from their consumer inquiries. Revenue is recorded at gross amounts and partnership and affiliate payments are recorded in cost of revenue, pursuant to the provisions of ASC Topic 605-45, Reporting Revenue Gross as a Principal versus Net as an Agent.
Display Advertising Revenue
Display advertising sales are invoiced monthly at amounts based on contract terms predominantly based on the number of impressions delivered to the advertiser.
Print Publishing and Licensing Revenue
We charge for placement in the interest rate table for print publication. Advertising revenue is recognized when the rate tables are run in a publication. Revenue from the sale of research information is recognized ratably over the contract period.
Cost of Revenue
Cost of revenue represents expenses directly associated with the creation of revenue and costs of fulfilling services. These costs include contractual revenue sharing obligations resulting from our distribution arrangements ("distribution payments"), cost of traffic acquisition (primarily search engine marketing expense), display advertising expense, direct response television advertising expense, salaries, editorial costs, research costs, credit card processing fees, and allocated overhead. Distribution payments are made to website operators for visitors directed to our online network which we monetize through advertising, as well as for credit card offer clicks that are generated on our affiliated websites and monetized through our issuer network. Editorial costs relate to writers and editors who create original content for our online publications and associates who build web pages. Research costs include expenses related to gathering data on banking and credit products and consist primarily of compensation and benefits along with allocated overhead.
Fair Value Measurement
Fair value, in accordance with ASC 820, Fair Value Measurement, is defined as the exchange price that would be received for an asset or paid to transfer a liability (an exit price) in the principal or most advantageous market for the asset or liability in an orderly transaction between market participants at the measurement date. As such, fair value is a market-based measurement that should be determined based on assumptions that market participants would use in pricing an asset or liability. Valuation techniques include the market approach (comparable market prices), the income approach (present value of future income or cash flow), and the cost approach (cost to replace the service capacity of an asset or replacement cost). These valuation techniques may be based upon observable and unobservable inputs. The three levels of inputs used to measure fair value pursuant to the guidance are as follows:
Level 1—Quoted prices in active markets for identical assets or liabilities.
Level 2—Observable inputs other than quoted prices included in Level 1, such as quoted prices for similar assets and liabilities in active markets; quoted prices for identical or similar assets and liabilities in markets that are not active; or other inputs that are observable or can be corroborated by observable market data.
Level 3—Unobservable inputs that are supported by little or no market activity and that are significant to the fair value of the assets or liabilities, which includes certain pricing models, discounted cash flow methodologies and similar techniques that use significant unobservable inputs.
Our financial instruments consist primarily of cash and cash equivalents, accounts receivable, the assets held in the Rabbi Trust and our Senior Notes. Given their short term nature, the carrying amounts of cash and cash equivalents, accounts receivable and accrued interest approximate estimated fair value and are considered Level 1 investments. The assets held in the Rabbi Trust are invested in equity securities and are considered Level 1 investments. The Senior Notes are considered Level 2 investments and the Company uses market information in measuring the fair value. These estimates require considerable judgment in interpreting market data, and changes in assumptions or estimation methods could significantly affect the fair value estimates.
Contingent liabilities include contingent acquisition consideration in connection with certain earnout provisions included in certain of the Company’s acquisitions. The contingent liabilities are recognized at fair value on the acquisition date and remeasured each reporting period with subsequent adjustments recognized in the consolidated statements of comprehensive income (loss). The fair value of the contingent acquisition consideration liability is expected to increase each period with the recognition of change in fair value of contingent consideration resulting from the passage of time at the applicable discount rate as we approach the payment dates of the contingent consideration absent any significant changes in assumptions related to the valuation or the probability of payment. Contingent acquisition consideration is valued using significant inputs that are not observable in the market which are defined as Level 3 inputs.
The contingent liabilities also include contingent deferred compensation in connection with certain of the Company’s acquisitions. These contingent liabilities are remeasured each reporting period with subsequent adjustments recognized in the consolidated statements of comprehensive income (loss). The fair value of the contingent deferred compensation liability is based on the achievement of certain Adjusted EBITDA targets, tied to the participant’s employment, and is expected to increase each period with the recognition of change in fair value of contingent consideration resulting from the passage of time at the applicable discount rate as we approach the payment dates, absent any significant changes in assumptions related to the valuation or the probability of payment. Contingent deferred compensation is valued using significant inputs that are not observable in the market which are defined as Level 3 inputs.
The Company believes its estimates and assumptions are reasonable, however, there is significant judgment involved and actual results could differ from those estimates. See Note 7 – Fair Value Measurements for further information.
Goodwill
The Company records the excess of purchase price over the fair value of the net tangible and identified intangible assets acquired as goodwill. The goodwill is tested for impairment annually, as well as when an event, or change in circumstances, indicates impairment may have occurred. In accordance with Accounting Standards Codification (“ASC”) 350, Intangibles-Goodwill and Other, we first assess qualitative factors to determine whether the existence of events or circumstances leads to a determination that it is more likely than not (a likelihood of more than 50%) that the fair value of our reporting unit is less than its carrying amount. We perform this assessment annually, on October 1st of each year, or more frequently if facts and circumstances warrant a review, at the reporting unit level. If after assessing the qualitative factors, we determine that it is not more likely than not that the fair value of the reporting unit is less than the carrying value then we conclude that we have no goodwill impairment and no further testing is performed, otherwise, we proceed to the two-step process. The first step under the two step process is to compare the fair value of the reporting unit to its carrying value. If the fair value exceeds the carrying value, goodwill is not impaired and no further testing is performed. The reporting unit fair values are determined by using a weighted valuation approach among three different valuation methodologies consisting of an income approach and a market approach which is made up of the ‘guideline company method’ and the ‘reference transaction method’. The second step is performed if the carrying value exceeds the fair value. The implied fair value of the reporting unit’s goodwill must be determined and compared to the carrying value of the goodwill. If the carrying value of a reporting unit’s goodwill exceeds its implied value, an impairment loss equal to the difference will be recorded.
See Note 4 – Goodwill and Intangible Assets for discussion of the 2016 and 2015 impairments.
The Company followed the guidance in ASC 350-20-35 and performed the annual impairment test of goodwill as of October 1, 2016.
Intangible Assets
Intangible assets consist primarily of trademarks and domain names, customer relationships, affiliate relationships and developed technologies acquired in connection with our acquisitions. Intangible assets are being amortized over their estimated useful lives on a straight-line basis.
|
|
|
|
|
Estimated Useful Life |
|
Trademarks and domain names |
2-25 years |
|
Customer relationships |
3-15 years |
|
Affiliate relationships |
1-15 years |
|
Developed technologies |
1-10 years |
Impairment of Long-Lived Assets Including Intangible Assets with Finite Lives
ASC 360, Property, Plant and Equipment, requires that long-lived assets, including intangible assets with finite lives, be amortized over their estimated useful life and reviewed for impairment. We continually monitor events and changes in circumstances that could indicate carrying amounts of our long-lived assets may not be recoverable. When such events or changes in circumstances occur, we assess the recoverability of such assets by determining whether the carrying value will be recovered through the undiscounted expected future cash flows. If the undiscounted future cash flows are less than the carrying amount of such assets, we recognize an impairment loss based on the excess of the carrying amount over the fair value of the assets.
See Note 4 – Goodwill and Intangible Assets for discussion of the 2016 impairment. There was no impairment of long-lived assets including intangible assets with finite lives for the years ended December 31, 2015 and 2014.
Stock-Based Compensation
We account for share-based compensation in accordance with ASC 718, Compensation—Stock Compensation. Under the fair value recognition provisions of ASC 718, share-based compensation cost is measured at the grant date based on the fair value of the award and is recognized as an expense on a straight-line basis over the requisite service period, which is generally the vesting period. For awards with performance conditions, the probable outcomes of the performance conditions are assessed and if the conditions are determined as not probable to be achieved, no compensation cost will be recognized. If it is determined that the conditions are probable to be achieved, the related stock-based compensation expense is recognized over the requisite service period of the related awards. For awards containing market conditions, we estimate the fair value of the award using a Monte Carlo simulation model. Key inputs and assumptions used in the Monte Carlo simulation model include the stock price of the award on the grant date, the expected term, the risk-free interest rate over the expected term, the expected annual dividend yield and the expected stock price volatility. See Note 8 – Stock-Based Compensation for further information regarding our stock-based compensation assumptions and expense.
Website and Internal-Use Software Development Costs
We account for website development costs under ASC 350-50, Intangibles—Goodwill and Other—Website Development Costs. ASC 350-50 provides guidance on the accounting for the costs of development of company websites, dividing the website development costs into five stages: (i) the planning stage, during which the business and/or project plan is formulated and functionalities, necessary hardware and technology are determined, (ii) the website application and infrastructure development stage, which involves acquiring or developing hardware and software to operate the website, (iii) the graphics development stage, during which the initial graphics and layout of each page are designed and coded, (iv) the content development stage, during which the information to be presented on the website, which may be either textual or graphical in nature, is developed, and (v) the operating stage, during which training, administration, maintenance and other costs to operate the existing website are incurred. The costs incurred in the website application and infrastructure stage, the graphics development stage and the content development stage are capitalized; all other costs are expensed as incurred. In addition, the Company incurs costs to develop software for internal use which are accounted for under ASC 350-40, Intangibles—Goodwill and Other—Internal-Use Software. The Company expenses all costs that relate to the preliminary project and post-implementation operation phases of development as product development expense. Costs incurred in the application development phase are capitalized until the project is completed and the asset is placed in service. The Company capitalized website and internal-use software development costs totaling approximately $4.6 million, $2.8 million and $2.5 million during the years ended December 31, 2016, 2015 and 2014, respectively, which are recorded as a component of other assets on the balance sheet. Upon being placed into service and transferred to furniture, fixtures and equipment these capitalized costs are amortized over a three year period.
Marketing Expense
Marketing expense represents costs associated with expanding brand awareness of our products and services to consumers, and include internet and print advertising, marketing and promotion costs and direct response and television advertising. Marketing expenses are expensed as incurred within cost of revenues and sales and marketing expense. During the years ended December 31, 2016, 2015 and 2014, we incurred approximately $117.7 million, $72.4 million and $56.6 million, respectively, in marketing and advertising expenses recorded in cost of revenue and marketing and sales expense.
Cash and Cash Equivalents
We state all cash and cash equivalents at cost, which approximates market value. We consider all short-term highly liquid investments, with an original maturity of three months or less when purchased, to be cash equivalents. The carrying value of these investments approximates fair value. As of December 31, 2016, our cash and cash equivalents consisted of approximately $175.8 million of operating cash subject to the $250,000 FDIC insured deposit limit, approximately $531,000 held in British pound sterling and approximately $350,000 in Chinese Renminbi.
Allowance for Doubtful Accounts
We maintain an allowance for doubtful accounts for estimated losses resulting from the inability or unwillingness of our customers to make required payments. We look at historical write-offs and sales growth when determining the adequacy of the allowance. Should the financial condition of our customers deteriorate, resulting in an impairment of their ability to make payments, or if the level of accounts receivable increases, the need for possible additional allowances may be necessary. Any additions to the allowance for doubtful accounts are recorded as bad debt expense and included in general and administrative expenses. During the years ended December 31, 2016, 2015 and 2014 we charged approximately $183,000, $265,000 and $130,000, respectively, to bad debt expense. During the years ended December 31, 2016, 2015 and 2014 we wrote off (net of recoveries) approximately $140,000, $305,000 and ($17,000), respectively, of accounts deemed uncollectible.
Furniture, Fixtures and Equipment
Furniture, fixtures and equipment, including computers and software, are stated at cost less accumulated depreciation, and are depreciated on a straight-line basis over the estimated useful lives of the assets which range from three to seven years. Expenditures related to maintenance and technical support are expensed as incurred. Leasehold improvements are depreciated on a straight-line basis over the shorter of their estimated useful lives or the underlying lease term, not to exceed twenty years.
Basic and Diluted Income (Loss) Per Share
We compute basic income (loss) per share by dividing net income (loss) for the year by the weighted average number of shares outstanding for the year. Diluted income (loss) per share includes the effects of dilutive common stock equivalents, consisting of outstanding share-based awards, in accordance with ASC 718, Compensation—Stock Compensation, to the extent the effect is not antidilutive, using the treasury stock method.
Deferred Financing Costs
Deferred financing costs represent the costs incurred in connection with the issuance of debt, (i.e. legal fees, underwriting, accounting and other direct costs). When incurred, these costs are deferred and amortized to interest expense on the straight-line method, which approximates the effective interest method, over the term of the related debt. The deferred costs are presented on the consolidated balance sheets within long-term debt, net. See Note 11– Debt for additional information.
Self-Insurance Reserves
The Company is self-insured for certain losses relating to medical claims. Self-insurance claims filed and claims incurred but not reported are accrued based upon management’s estimates of the discounted ultimate cost for self-insured claims incurred using actuarial assumptions followed in the insurance industry and historical experience. Although management believes it has the ability to reasonably estimate losses related to claims, it is possible that actual results could differ from recorded self-insurance liabilities. These reserves are included in accrued expenses in the accompanying consolidated balance sheets.
Deferred Compensation Plan
During 2002, we established a non-qualified deferred compensation plan that permitted eligible employees to defer a portion of their compensation. The plan is no longer accepting additional deferrals. The deferred compensation liability (included in other non-current liabilities) was $229,000 and $227,000 at December 31, 2016 and 2015, respectively. We have established a grantor trust (“Rabbi Trust”) to provide funding for benefits payable under our non-qualified deferred compensation plan. The assets held in the trust amounted to $178,000 and $173,000 at December 31, 2016 and 2015, respectively, and are included in other assets. The Rabbi Trust’s assets consist of short-term cash investments and a managed portfolio of equity securities. These assets are included in other assets in the accompanying consolidated balance sheets.
Income Tax Expense (Benefit)
We account for income taxes in accordance with ASC 740, Income Taxes. Under this method, deferred income taxes are determined based on the estimated future tax effects of differences between the financial statement and tax basis of assets and liabilities given the provisions of enacted tax laws. Deferred income tax provisions and benefits are based on changes to the assets or liabilities from year to year. In providing for deferred taxes, we consider tax regulations of the jurisdictions in which we operate, estimates of future taxable income, and available tax planning strategies. If tax regulations, operating results, or the ability to implement tax-planning strategies varies, adjustments to the carrying value of the deferred tax assets and liabilities may be required. Valuation allowances are based on the “more likely than not” criteria of ASC 740.
The accounting for uncertain tax positions guidance under ASC 740 requires that we recognize the financial statement benefit of a tax position only after determining that the relevant tax authority would more likely than not sustain the position following an audit. For tax positions meeting the more-likely-than-not threshold, the amount recognized in the consolidated financial statements is the largest benefit that has a greater than 50 percent likelihood of being realized upon ultimate settlement with the relevant tax authority. We recognize interest and penalties on uncertain tax positions as a component of income tax expense.
Foreign Currency Translation
Our foreign operations generally use the local currency as their functional currency. Assets and liabilities of these operations are translated at the exchange rates in effect on the balance sheet date. Income statement items are translated at the prevailing monthly average rate of exchange. The impact of currency fluctuations is recorded in accumulated other comprehensive loss as a currency translation adjustment.
Comprehensive Income (Loss)
Comprehensive income (loss) consists of net income (loss) and other gains (losses) for foreign currency translation that, under accounting principles generally accepted in the United States, are excluded from net income (loss).
Related Parties
The Company receives consulting services related to research and development from Global Logic, Inc., a portfolio company of funds advised by Apax Partners L.P. We made payments to Global Logic of approximately $128,000, $278,000 and $120,000 for the years ended December 31, 2016, 2015 and 2014, respectively.
New Accounting Pronouncements
Recently Adopted Pronouncements
In June 2014, the FASB issued ASU 2014-12, “Accounting for Share-Based Payments When the Terms of an Award Allow a Performance Target to Be Achieved After the Requisite Service Period,” which requires that a performance target that could be achieved after the requisite service period be treated as a performance condition that affects the vesting of the award. We adopted ASU 2014-12 on January 1, 2016, as required, and it did not have a significant impact on our consolidated financial statements.
In January 2015, the FASB issued ASU 2015-01, “Income Statement—Extraordinary and Unusual Items.” This guidance eliminates the concept of an extraordinary item, which required that an entity separately classify, present, and disclose extraordinary events and transactions, on the income statement, net of tax after earnings from continuing operations and disclose applicable income taxes and earnings per share date applicable to the extraordinary item. We adopted ASU 2015-01 on January 1, 2016, as required, and it did not have a significant impact on our consolidated financial statements.
In April 2015, the FASB issued ASU 2015-03, “Imputation of Interest—Simplifying the Presentation of Debt Issuance Costs.” This guidance requires that the debt issuance costs related to a recognized debt liability be presented in the balance sheet as a direct deduction from the debt liability, consistent with the presentation of a debt discount. We adopted ASU 2015-03 on January 1, 2016, as required. The Company’s $300.0 million senior unsecured notes due 2018 are presented at December 31, 2016 and December 31, 2015 net of deferred financing costs of $3.1 million and $4.9 million, respectively. Deferred financing costs were previously included in other assets in the consolidated financial statements.
In April 2015, the FASB issued ASU 2015-05 “Intangibles—Goodwill and Other—Internal-Use Software (Subtopic 350-40)—Customers Accounting for Fees Paid in a Cloud Computing Arrangement.” The guidance in this update provide a basis for evaluating whether a cloud computing arrangement includes a software license and clarification of the treatment of fees paid by the customer if that license is to internal-use software, other than internal-use software or not considered a license. We adopted ASU 2015-05 on January 1, 2016, as required, and it did not have a significant impact on our consolidated financial statements.
In June 2015, the FASB issued ASU 2015-10, “Technical Corrections and Improvements.” This guidance’s intention is (i) to clarify the Codification for differences between original guidance and the Codification, (ii) correct unintended application of guidance and correct references, or (iii) streamline, simplify or make minor improvements to the Codification through minor structural changes to headings or minor editing of text to improve the usefulness and understandability, that are not expected to have a significant effect on current accounting practice. We adopted ASU 2015-10 on January 1, 2016, as required, and it did not have a significant impact on our consolidated financial statements.
In September 2015, the FASB issued ASU 2015-16, “Business Combinations (Topic 805)—Simplifying the Accounting for Measurement-Period Adjustments.” The intention of this guidance is to simplify the accounting adjustments made to provisional amounts recognized in business combinations, as the amendment requires the adjustments to provisional amounts be recorded in the current period that they are identified, which eliminates the need to retrospectively account for those adjustments. We adopted ASU 2015-16 on January 1, 2016, as required, and it did not have a significant impact on our consolidated financial statements.
In August 2016, the FASB issued ASU 2016-15, “Statement of Cash Flows (Topic 230): Classification of Certain Cash Receipts and Cash Payments,” to address diversity in how certain specific cash receipts and cash payments are presented and classified in the statement of cash flows. We adopted this ASU 2016-15 for the year ended December 31, 2016, as permitted and applied a retrospective method as required, impacting the classification of certain transactions on our statement of cash flows.
Recently Issued Pronouncements, Not Adopted as of December 31, 2016
The FASB issued several updates on Topic 606 “Revenue from Contracts with Customers”, including:
|
· |
ASU 2014-09, “Revenue from Contracts with Customers (Topic 606)” |
|
· |
ASU 2016-08 “Revenue from Contracts with Customers (Topic 606): Principal versus Agent Considerations (Reporting Revenue Gross versus Net).” |
|
· |
ASU 2016-10, “Revenue from Contracts with Customers (Topic 606): Identifying Performance Obligations and Licensing.” |
|
· |
ASU 2016-11, “Revenue Recognition (Topic 605) and Derivatives and Hedging (Topic 815): Rescission of SEC Guidance Because of Accounting Standards Updates 2014-09 and 2014-16 Pursuant to Staff Announcements at the March 3, 2016 EITF (Emerging Issue Task Force) Meeting.” |
|
· |
ASU 2016-12, “Revenue from Contracts with Customers (Topic 606): Narrow-Scope Improvements and Practical Expedients.” |
|
· |
ASU 2016-20, “Technical Corrections and Improvements to Topic 606, Revenue from Contracts with Customers.” |
The standards provide companies with a single model for use in accounting for revenue arising from contracts with customers that supersedes current revenue recognition guidance, including industry-specific revenue guidance. The core principle of the model is to recognize revenue when control of the goods or services transfers to the customer, as opposed to recognizing revenue when the risks and rewards transfer to the customer under the existing revenue guidance. The guidance permits companies to either apply the requirements retrospectively to all prior periods presented, or apply the requirements in the year of adoption, through a cumulative adjustment. The guidance is effective for fiscal years, and interim periods within those fiscal years, beginning after December 15, 2017. Early adoption is permitted, to be effective for fiscal years, and interim periods within those fiscal years, beginning after December 15, 2016. We plan to adopt this guidance effective January 1, 2018, as required. We understand that the adoption of these updates have the potential to materially impact our revenue recognition process and related expenses. We have engaged a third-party to assist in our analysis and review of our contracts regarding this guidance and we are in the process of completing the analysis of the standards’ impact on our Credit Cards segment, our largest revenue producing segment. While we have not completed our analysis of the impact of the provisions of these standards on the Credit Cards segment, at this time we have not identified any provisions that we would expect to have a significant impact on how we recognize revenue and related expenses for our Credit Cards segment. When the assessment of the Credit Cards segment is complete, we will analyze our remaining segments. We expect to complete our assessments prior to adoption of the guidance.
In August 2014, the FASB issued ASU 2014-15, “Disclosure of Uncertainties about an Entity’s Ability to Continue as a Going Concern,” which requires management to perform interim and annual assessments of an entity’s ability to continue as a going concern within one year of the date the consolidated financial statements are issued and to provide related footnote disclosures in certain circumstances. This guidance is effective for fiscal years, and interim periods within those fiscal years, beginning after December 15, 2016. We do not expect the adoption of this guidance to have an impact on our consolidated financial statements and related disclosures.
In January 2016, the FASB issued ASU 2016-01 “Financial Instruments—Overall (Subtopic 825-10): Recognition and Measurement of Financial Assets and Financial Liabilities.” This update amends some of the existing guidance related to the recognition, measurement, presentation, and disclosure of financial instruments. This update is effective for fiscal years, and interim periods within those fiscal years, beginning after December 15, 2017. We are evaluating the effect that this update will have on our consolidated financial statements and related disclosures.
In January 2016, the FASB issued ASU 2016-02 “Leases (Topic 842).” This update will supersede the leases requirements in Topic 840, Leases, and create an additional Topic 842, which specifies the accounting for leases. The objective is to establish the principles that lessees and lessors shall apply to report useful information to users of financial statements about the amount, timing, and uncertainty of cash flows arising from a lease. This update is effective for fiscal years, and interim periods within those fiscal years, beginning after December 15, 2018. We are evaluating the effect that this update will have on our consolidated financial statements and related disclosures.
In March 2016, the FASB issued ASU 2016-09 “Compensation—Stock Compensation (Topic 718): Improvements to Employee Share-Based Payment Accounting.” This update is intended to reduce complexity in accounting standard and simplify several aspects of the accounting for employee share-based payment transactions, including the income tax consequences, classification of awards as either equity or liabilities, and classification on the statement of cash flows. In addition, the amendments in this update eliminate the guidance in Topic 718. This update is effective for fiscal years, and interim periods within those fiscal years, beginning after December 15, 2016. Early adoption is permitted for any entity in any interim or annual period. We will adopt this guidance on January 1, 2017, as required. While we do not expect the adoption of this guidance to have a material impact on our consolidated financial statements, earnings per share and related disclosures, we are adopting on a prospective basis and will be using actual forfeiture rates in related calculations.
In June 2016, the FASB issued ASU 2016-13, “Financial Instruments—Credit Losses (Topic 326): Measurement of Credit Losses on Financial Instruments.” This update requires a financial asset, or group of financial assets, measured at amortized cost basis to be presented at the net amount expected to be collected. This update is effective for fiscal years, and interim periods within those fiscal years, beginning after December 15, 2019. Early adoption is permitted for any entity in any interim or annual period within those fiscal years, beginning after December 15, 2018. We are evaluating the effect that this update will have on our consolidated financial statements and related disclosures.
In October 2016, the FASB issued ASU 2016-16, “Income Taxes (Topic 740): Intra-Entity Transfers of Assets Other Than Inventory,” to improve the accounting for the income tax consequences of intra-entity transfers of assets other than inventory. This update is effective for fiscal years, and interim periods within those fiscal years, beginning after December 15, 2017. Early adoption is permitted for all entities in the first interim period if an entity issues interim financial statements. We are evaluating the effect that this update will have on our consolidated financial statements and related disclosures.
In November 2016, the FASB issued ASU 2016-18, “Statement of Cash Flows (Topic 230): Restricted Cash,” to provide guidance on the presentation of restricted cash or restricted cash equivalents in the statement of cash flows, thereby reducing the diversity in presentation. This update is effective for fiscal years, and interim periods within those fiscal years, beginning after December 15, 2017. This update will effect the classification of certain transactions on our consolidated statements of cash flows and related disclosures.
In December 2016, the FASB issued ASU 2016-19, “Technical Corrections and Improvements.” This guidance’s intention is to (i) clarify the guidance and (ii) simplify the Accounting Standards Codification and improve its usefulness and understandability. The amendments in this update that require transition guidance, and that are effective under paragraph 350-40-65-2 are effective for public business entities for annual periods, including interim periods within those annual periods, beginning after December 15, 2016. The amendments that are effective under paragraph 820-10-65-11 are effective for fiscal years, and interim periods within those fiscal years, for all entities beginning after December 15, 2016. Early adoption for all amendments under ASU 2016-19 is permitted. We are evaluating this update, but do not expect it to have a significant impact on our consolidated financial statements and related disclosures.
In January 2017, the FASB issued ASU 2017-01, “Business Combinations (Topic 805): Clarifying the Definition of a Business.” These amendments clarify the definition of a business. The amendments affect all companies and other reporting organizations that must determine whether they have acquired or sold a business. The definition of a business affects many areas of accounting including acquisitions, disposals, goodwill, and consolidation. The amendments are intended to help companies and other organizations evaluate whether transactions should be accounted for as acquisitions (or disposals) of assets or businesses. This update is effective for fiscal years, and interim periods within those fiscal years, beginning after December 15, 2017. Early adoption is permitted under certain circumstances. The amendments should be applied prospectively as of the beginning of the period of adoption. We are evaluating the effect that this update will have on our consolidated financial statements and related disclosures.
In January 2017, the FASB issued ASU 2017-04, “Intangibles-Goodwill and Other (Topic 350): Simplifying the Test for Goodwill Impairment.” The primary amendment of the guidance update to simplify the subsequent measurement of goodwill eliminated Step 2 from the goodwill impairment test. Instead, under the amendments in this update, an entity should perform its annual, or interim, goodwill impairment test by comparing the fair value of a reporting unit with its carrying amount. An entity should recognize an impairment charge for the amount by which the carrying amount exceeds the reporting unit’s fair value. This update is effective for fiscal years, and interim periods within those fiscal years, beginning after December 15, 2019. Early adoption is permitted for any entity in any interim or annual goodwill impairment tests performed on testing dates after January 1, 2017. We are evaluating the effect that this update will have on our consolidated financial statements and related disclosures.
NOTE 3 – FINANCIAL STATEMENT DETAILS
Prepaid Expenses and Other Current Assets
Prepaid expenses and other current assets consisted of the following:
|
|
|
|
|
|
|
|
|
|
|
|
|
|
|
|
December 31, |
|
December 31, |
||
|
(In thousands) |
2016 |
|
2015 |
||
|
Deferred receivable for business divestiture (a) |
$ |
20,592 |
|
$ |
- |
|
Deferred payment in escrow (b) |
|
7,928 |
|
|
- |
|
Prepaid income taxes |
|
6,358 |
|
|
21,728 |
|
Other current assets |
|
7,163 |
|
|
5,143 |
|
|
$ |
42,041 |
|
$ |
26,871 |
__________
|
(a) |
This deferred receivable is the December 31, 2016 present value of the $23.1 million to be paid to us on the second anniversary of the closing date of the sale of our Insurance business. As of December 31, 2015, the receivable was classified as non-current. |
|
(b) |
Represents an unpaid deferred payment for the Acquired NextAdvisor Business, held in escrow for indemnity obligations. |
Non-current assets
Non-current assets consisted of the following:
|
|
|
|
|
|
|
|
|
|
|
|
|
|
|
|
December 31, |
|
December 31, |
||
|
(In thousands) |
2016 |
|
2015 |
||
|
Work-in-progress software development costs |
$ |
2,398 |
|
$ |
2,640 |
|
Deferred receivable for business divestiture (a) |
|
- |
|
|
18,391 |
|
Other |
|
3,166 |
|
|
2,096 |
|
|
$ |
5,564 |
|
$ |
23,127 |
|
|
|
|
|
|
|
__________
|
(a) |
This deferred receivable is the December 31, 2015 present value of the $23.1 million to be paid to us on the second anniversary of the closing date of the sale of our Insurance business. As of December 31, 2016, the receivable is classified as current. |
Furniture, Fixtures and Equipment
Furniture, fixtures and equipment consisted of the following:
|
|
|
|
|
|
|
|
|
|
|
|
|
|
|
|
December 31, |
|
December 31, |
||
|
(In thousands) |
2016 |
|
2015 |
||
|
Furniture and fixtures |
$ |
2,797 |
|
$ |
1,239 |
|
Computers and software |
|
22,629 |
|
|
20,425 |
|
Equipment |
|
2,334 |
|
|
1,759 |
|
Leasehold improvements |
|
7,194 |
|
|
2,793 |
|
|
|
34,954 |
|
|
26,216 |
|
Less accumulated depreciation and amortization |
|
19,514 |
|
|
16,027 |
|
|
$ |
15,440 |
|
$ |
10,189 |
Depreciation expense was approximately $6.4 million, $4.4 million and $3.8 million for the years ended December 31, 2016, 2015 and 2014, respectively. Included in the depreciation expense for the year ended December 31, 2016 is a charge of $929,000 ($585,000 net of tax) to accelerate the depreciation of certain assets that were removed from service during the year. This charge accounted for less than one cent of earnings per share.
Accrued Expenses
Accrued expenses consisted of the following:
|
|
|
|
|
|
|
|
|
|
|
|
|
|
|
|
December 31, |
|
December 31, |
||
|
(In thousands) |
2016 |
|
2015 |
||
|
Accrued payroll and related benefits |
$ |
12,022 |
|
$ |
5,892 |
|
Due to distribution partners |
|
5,998 |
|
|
6,041 |
|
Marketing |
|
3,324 |
|
|
1,781 |
|
Acquisition, disposition and related expenses |
|
- |
|
|
4,986 |
|
Other |
|
6,543 |
|
|
7,138 |
|
|
$ |
27,887 |
|
$ |
25,838 |
Other Current Liabilities
Other current liabilities consisted of the following:
|
|
|
|
|
|
|
|
|
|
|
|
|
|
|
|
December 31, |
|
December 31, |
||
|
(In thousands) |
2016 |
|
2015 |
||
|
Current acquisition related payables |
$ |
3,695 |
|
$ |
12,490 |
|
Other |
|
2,816 |
|
|
2,191 |
|
|
$ |
6,511 |
|
$ |
14,681 |
Other Liabilities
Other liabilities consisted of the following:
|
|
|
|
|
|
|
|
|
|
|
|
|
|
|
|
December 31, |
|
December 31, |
||
|
(In thousands) |
2016 |
|
2015 |
||
|
Noncurrent acquisition related payables |
$ |
30,711 |
|
$ |
3,906 |
|
Noncurrent deferred rent and lease obligation |
|
4,137 |
|
|
29 |
|
Liability for uncertain tax positions |
|
3,500 |
|
|
1,736 |
|
Other |
|
1,450 |
|
|
200 |
|
|
$ |
39,798 |
|
$ |
5,871 |
NOTE 4 – GOODWILL AND INTANGIBLE ASSETS
During the second quarter 2016, management noted that the operating results of its Banking reporting unit had begun to track below plan, primarily due to macroeconomic trends impacting its deposit and display advertising businesses. This triggering event resulted in impairment testing as of June 30, 2016. It was concluded that the reporting unit’s goodwill was impaired and we recorded a $25.0 million impairment of its goodwill in the second quarter 2016, determined using the income and market approaches. The Banking reporting unit was tested for impairment again during our annual assessment and it was concluded that no further impairment had occurred.
During 2016, management revised the strategy of its Quizzle reporting unit to focus its technology resources primarily on enhancing the user experience of the products and services provided by the Banking segment through greater personalization, and realigned its management reporting structure by integrating the Quizzle operations and reporting unit into the Banking reporting unit. Management determined that the revised strategy, reporting structure, change in the estimated useful life of Quizzle’s developed technology intangible asset and the performance of initiatives utilizing Quizzle resources, each represented triggering events for impairment testing at the pre-realigned Quizzle reporting unit. As a result, we completed Step 1 analysis of goodwill, which indicated that the fair value was lower than the reporting unit’s carrying value. In accordance with ASC 350-20-35-18, management elected to record an estimated goodwill impairment of $4.2 million as of September 30, 2016, subject to completing our review and finalizing Step 2 of the analysis during the fourth quarter 2016. During the fourth quarter 2016, we completed Step 2 of the analysis, recording an additional goodwill impairment of $2.4 million for the pre-realigned Quizzle reporting unit for the year ended December 31, 2016. The impairment amount was determined using the income and market approaches, and was based on a number of factors including the estimated fair value of developed technology, trademarks and customer relationships (all valued using an income approach), as well as relevant market related data. Additionally, it was determined that the intangible assets of our pre-realigned Quizzle business unit were impaired and we recorded an intangible asset impairment of $7.5 million for the year ended December 31, 2016.
The Company followed the guidance in ASC 350-20-35 and performed the annual impairment test of goodwill as of October 1, 2016. In performing that test, it was noted that the carrying value of the Senior Care reporting unit exceeded its fair value. As a result, Step 2 was required to be performed. The implied fair value of goodwill was determined in the same manner as the amount of goodwill recognized in a business combination. We have determined the fair value of the reporting unit using the income and market approaches. We also determined the fair value of developed technology, domain names and customer relationships, using relevant market data. We recorded goodwill impairment of $4.0 million for the Senior Care reporting unit for the year ended December 31, 2016.
During 2015, it was determined that a triggering event had occurred in our former Insurance business unit. We recorded a $35.0 million charge for the impairment of goodwill within our Insurance segment resulting from the difference between the net book value of the business segment and the estimated fair value of the business. During the annual goodwill impairment testing, on October 1, 2015, we performed the assessment for all reporting units, including Step 2 testing for the Insurance business unit, and concluded that there was no impairment of goodwill including any further impairment of the Insurance business unit. During the fourth quarter 2015, the Insurance business was disposed and as such, the results of the business are presented as a discontinued operation for all periods presented.
During 2016, we acquired the NextAdvisor business, which is reported in our Credit Cards segment (see Note 12—Acquisitions).
Goodwill activity for the years ended December 31, 2016 and 2015 is shown below:
|
|
|
|
|
|
|
|
|
|
|
|
|
|
|
|
|
|
|
|
|
|
|
|
|
|
|
|
|
(In thousands) |
|
Credit Cards |
|
Banking |
|
Senior Care |
|
Total Company |
||||
|
Balance, January 1, 2015 |
|
$ |
383,878 |
|
$ |
138,127 |
|
$ |
23,767 |
|
$ |
545,772 |
|
Additions due to acquisitions |
|
|
- |
|
|
21,021 |
|
|
751 |
|
|
21,772 |
|
Balance, December 31, 2015 |
|
$ |
383,878 |
|
$ |
159,148 |
|
$ |
24,518 |
|
$ |
567,544 |
|
Additions due to acquisitions |
|
|
67,893 |
|
|
- |
|
|
- |
|
|
67,893 |
|
Impairment charges |
|
|
- |
|
|
(31,632) |
|
|
(4,000) |
|
|
(35,632) |
|
Balance, December 31, 2016 |
|
$ |
451,771 |
|
$ |
127,516 |
|
$ |
20,518 |
|
$ |
599,805 |
|
|
|
|
|
|
|
|
|
|
|
|
|
|
Intangible assets consist primarily of trademarks and domain names, customer relationships, affiliate relationships and developed technologies. Intangible assets are amortized over their estimated useful lives on both straight-line and accelerated bases.
Intangible assets subject to amortization were as follows as of December 31, 2016:
|
|
|
|
|
|
|
|
|
|
|
|
|
|
|
|
|
|
|
|
|
|
|
|
|
|
|
(In thousands) |
|
Cost |
|
Accumulated Amortization |
|
Net |
|
Weighted Average Amortization Period Years |
|||
|
Trademarks and domain names |
|
$ |
204,534 |
|
$ |
(84,494) |
|
$ |
120,040 |
|
16.5 |
|
Customer relationships |
|
|
157,648 |
|
|
(100,611) |
|
|
57,037 |
|
9.0 |
|
Affiliate relationships |
|
|
12,670 |
|
|
(6,922) |
|
|
5,748 |
|
10.3 |
|
Developed technologies |
|
|
18,167 |
|
|
(10,046) |
|
|
8,121 |
|
6.2 |
|
Non-compete |
|
|
1,431 |
|
|
(258) |
|
|
1,173 |
|
3.0 |
|
|
|
$ |
394,450 |
|
$ |
(202,331) |
|
$ |
192,119 |
|
12.8 |
The intangible asset impairment of $7.5 million, for Quizzle, is reflected in the table above, and consisted of approximately $7.0 million for developed technology, $410,000 for trademarks and domain names and $70,000 for customer relationships.
Intangible assets subject to amortization were as follows as of December 31, 2015:
|
|
|
|
|
|
|
|
|
|
|
|
|
|
(In thousands) |
|
Cost |
|
Accumulated Amortization |
|
Net |
|
Weighted Average Amortization Period Years |
|||
|
Trademarks and domain names |
|
$ |
199,461 |
|
$ |
(69,002) |
|
$ |
130,459 |
|
17.1 |
|
Customer relationships |
|
|
135,831 |
|
|
(84,183) |
|
|
51,648 |
|
9.1 |
|
Affiliate relationships |
|
|
12,670 |
|
|
(6,382) |
|
|
6,288 |
|
10.3 |
|
Developed technologies |
|
|
26,431 |
|
|
(9,060) |
|
|
17,371 |
|
7.6 |
|
|
|
$ |
374,393 |
|
$ |
(168,627) |
|
$ |
205,766 |
|
13.3 |
Amortization expense for the years ended December 31, 2016, 2015 and 2014 was approximately $35.9 million, $36.4 million and $30.7 million, respectively. Included in amortization expense for the year ended December 31, 2015 is an approximately $1.8 million charge to fully amortize certain domain names intangible assets that the Company determined were removed from service during the year.
Future amortization expense as of December 31, 2016 is expected to be:
|
|
|
|
|
|
|
|
|
|
|
|
|
|
|
|
|
|
|
|
|
|
Amortization |
|
|
(In thousands) |
|
|
|
|
Expense |
|
|
2017 |
|
|
|
|
$ |
34,534 |
|
2018 |
|
|
|
|
|
30,929 |
|
2019 |
|
|
|
|
|
22,277 |
|
2020 |
|
|
|
|
|
15,840 |
|
2021 |
|
|
|
|
|
13,446 |
|
Thereafter |
|
|
|
|
|
75,093 |
|
Total expected amortization expense for intangible assets |
|
|
|
|
$ |
192,119 |
NOTE 5 – EARNINGS PER SHARE
We compute basic earnings per share by dividing net income (loss) for the period by the weighted average number of shares outstanding for the period. Diluted earnings per share includes the effects of dilutive common stock equivalents, consisting of outstanding stock-based awards, in accordance with ASC 718, Compensation – Stock Compensation, to the extent the effect is not anti-dilutive, using the treasury stock method.
The following table presents the computation of basic and diluted earnings per share:
|
|
|
|
|
|
|
|
|
|
|
|
|
|
|
|
|
|
|
|
|
|
|
|
|
Year ended |
|||||||
|
|
|
December 31, |
|
December 31, |
|
December 31, |
|||
|
(In thousands, except share and per share data) |
|
2016 |
|
2015 |
|
2014 |
|||
|
Net (loss) income from continuing operations |
|
$ |
(34,038) |
|
$ |
16,842 |
|
$ |
7,019 |
|
Net loss from discontinued operation, net of income taxes |
|
|
(96) |
|
|
(30,188) |
|
|
(1,847) |
|
Net (loss) income |
|
$ |
(34,134) |
|
$ |
(13,346) |
|
$ |
5,172 |
|
|
|
|
|
|
|
|
|
|
|
|
Weighted average common shares outstanding for basic earnings (loss) per share |
|
|
89,181,386 |
|
|
97,637,936 |
|
|
100,399,458 |
|
Additional dilutive shares related to share based awards |
|
|
- |
|
|
2,085,596 |
|
|
2,017,815 |
|
Weighted average common shares outstanding for diluted earnings (loss) per share |
|
|
89,181,386 |
|
|
99,723,532 |
|
|
102,417,273 |
|
|
|
|
|
|
|
|
|
|
|
|
Basic net (loss) income per share: |
|
|
|
|
|
|
|
|
|
|
Continuing operations |
|
$ |
(0.38) |
|
$ |
0.17 |
|
$ |
0.07 |
|
Discontinued operation |
|
|
- |
|
|
(0.31) |
|
|
(0.02) |
|
Basic net (loss) income per share |
|
$ |
(0.38) |
|
$ |
(0.14) |
|
$ |
0.05 |
|
|
|
|
|
|
|
|
|
|
|
|
Diluted net (loss) income per share: |
|
|
|
|
|
|
|
|
|
|
Continuing operations |
|
$ |
(0.38) |
|
$ |
0.17 |
|
$ |
0.07 |
|
Discontinued operation |
|
|
- |
|
|
(0.30) |
|
|
(0.02) |
|
Diluted net (loss) income per share |
|
$ |
(0.38) |
|
$ |
(0.13) |
|
$ |
0.05 |
As we incurred a loss from continuing operations for the year ended December 31, 2016, all outstanding stock options, restricted stock awards and performance stock awards have an anti-dilutive effect and therefore are excluded from the computation of diluted weighted average shares outstanding for that period. Accordingly, basic and diluted weighted average shares outstanding are equal for such period. The following were excluded from the calculation of diluted earnings per share because their impact would have been anti-dilutive:
|
|
|
|
|
|
|
|
|
|
|
|
|
|
|
|
|
|
|
|
|
|
|
|
|
Year ended |
|||||||
|
|
|
December 31, |
|
December 31, |
|
December 31, |
|||
|
|
|
2016 |
|
2015 |
|
2014 |
|||
|
Restricted shares and restricted stock units |
|
|
1,710,678 |
|
|
1,355,614 |
|
|
- |
|
Performance shares and performance stock units |
|
|
195,682 |
|
|
1,658,379 |
|
|
1,020,720 |
|
Stock options |
|
|
2,173,021 |
|
|
2,471,302 |
|
|
733,960 |
|
|
|
|
|
|
|
|
|
|
|
The restricted and performance shares, and restricted and performance stock units discussed above include only share and stock unit awards granted and exclude awards for which the number of shares to be awarded or paid are not yet determinable.
NOTE 6 – SEGMENT INFORMATION, GEOGRAPHIC DATA AND CONCENTRATIONS
No single country outside of the U.S. accounted for more than 10% of total revenue during the years ended December 31, 2016, 2015 and 2014. There were two customers that accounted for approximately 25% and 17% of total revenues each during the year ended December 31, 2016. During the year ended December 31, 2015, there were two customers that accounted for approximately 20% and 16% of total revenues each. In each year, the revenues from these customers were within multiple reporting segments. There were two customers in our Credit Cards segment with accounts receivable balances that constituted 24% and 11% of our consolidated accounts receivable as of December 31, 2016. As of December 31, 2015, there were two customers in our Credit Cards segment with accounts receivable balances that constituted 35% and 14% of our consolidated accounts receivable.
Revenue related to the U.S. and international operations for the years ended December 31, are as follows:
|
|
|
|
|
|
|
|
|
|
|
|
|
|
|
|
|
|
|
|
|
|
|
|
|
Year ended |
|||||||
|
|
|
December 31, |
|
December 31, |
|
December 31, |
|||
|
(In thousands) |
|
2016 |
|
2015 |
|
2014 |
|||
|
USA |
|
$ |
431,617 |
|
$ |
368,424 |
|
$ |
347,370 |
|
International |
|
|
2,544 |
|
|
3,540 |
|
|
4,681 |
|
|
|
$ |
434,161 |
|
$ |
371,964 |
|
$ |
352,051 |
|
|
|
|
|
|
|
|
|
|
|
Long-lived assets, net related to the U.S. and international operations as of December 31, are as follows:
|
|
|
|
|
|
|
|
|
|
|
December 31, |
|
December 31, |
||
|
(In thousands) |
|
2016 |
|
2015 |
||
|
USA |
|
$ |
805,998 |
|
$ |
780,576 |
|
International |
|
|
1,366 |
|
|
2,923 |
|
|
|
$ |
807,364 |
|
$ |
783,499 |
Revenue generated through customer inquiry, display advertising and print publishing for the years ended December 31, was as follows:
|
|
|
|
|
|
|
|
|
|
|
|
|
|
|
|
|
|
|
|
|
|
|
|
|
Year ended |
|||||||
|
|
|
December 31, |
|
December 31, |
|
December 31, |
|||
|
(In thousands) |
|
2016 |
|
2015 |
|
2014 |
|||
|
Consumer inquiry, including affiliate and other |
|
$ |
412,166 |
|
$ |
334,899 |
|
$ |
308,640 |
|
Display advertising |
|
|
18,151 |
|
|
32,931 |
|
|
38,367 |
|
Print publishing |
|
|
3,844 |
|
|
4,134 |
|
|
5,044 |
|
|
|
$ |
434,161 |
|
$ |
371,964 |
|
$ |
352,051 |
|
|
|
|
|
|
|
|
|
|
|
The chief operating decision maker, the Company’s Chief Executive Officer, manages, assesses performance and allocates resources for the business based upon the separate financial information from the Company’s operating segments. In identifying its reportable segments, the Company also considered the nature of the services provided by its operating segments and other relevant factors. Senior Care does not meet the quantitative thresholds for a reportable segment, however management believes that information about the segment should be separately disclosed as it is useful to the readers of the financial statements.
In evaluating and assessing performance of the Company’s operating segments, and when allocating resources to business units needed in accomplishing its strategic goals, the assets of the business units are not a primary consideration of the chief operating decision maker.
The reportable segments presented below represent the Company’s operating segments for which separate financial information is available and utilized on a regular basis by its chief operating decision maker, the Company’s chief executive officer, to assess performance and allocate resources. Management evaluates the operating results of each of the Company’s operating segments based upon revenue and “Adjusted EBITDA”, which we define as income from continuing operations before depreciation and amortization; interest; income taxes; changes in fair value of contingent acquisition consideration; stock-based compensation and other items such as loss on extinguishment of debt, legal settlements, acquisition, disposition and related expenses; restructuring charges; any impairment charges; NextAdvisor contingent deferred compensation for the acquisition; costs related to the Restatement, the Internal Review, the SEC and DOJ investigations and related litigation and indemnification obligations; purchase accounting adjustments; and our operations in China as we are winding down and ceasing its operations. The Company’s presentation of Adjusted EBITDA, a non-GAAP measure, may not be comparable to similarly titled measures used by other companies.
|
|
|
|
|
|
|
|
|
|
|
|
|
|
|
|
|
|
|
|
|
|
|
|
|
|
|
|
|
|
|
|
|
|
|
|
|
|
|
|
|
|
|
Year ended December 31, |
||||||||||||||||
|
|
|
2016 |
|
2015 |
|
2014 |
||||||||||||
|
(In thousands) |
|
Revenue |
|
Adjusted EBITDA |
|
Revenue |
|
Adjusted EBITDA |
|
Revenue |
|
Adjusted EBITDA |
||||||
|
Credit Cards (A) |
|
$ |
314,853 |
|
$ |
117,612 |
|
$ |
241,854 |
|
$ |
113,644 |
|
$ |
226,869 |
|
$ |
92,227 |
|
Banking (B) |
|
|
101,440 |
|
|
24,166 |
|
|
109,677 |
|
|
33,070 |
|
|
118,465 |
|
|
44,854 |
|
Senior Care |
|
|
23,480 |
|
|
983 |
|
|
23,855 |
|
|
389 |
|
|
10,302 |
|
|
(2,581) |
|
Other |
|
|
(5,612) |
|
|
(27,964) |
|
|
(3,422) |
|
|
(19,980) |
|
|
(3,585) |
|
|
(16,700) |
|
Total Company |
|
$ |
434,161 |
|
|
114,797 |
|
$ |
371,964 |
|
|
127,123 |
|
$ |
352,051 |
|
|
117,800 |
|
|
|
|
|
|
|
|
|
|
|
|
|
|
|
|
|
|
|
|
|
Less: |
|
|
|
|
|
|
|
|
|
|
|
|
|
|
|
|
|
|
|
Interest and other expenses, net (C) |
|
|
|
|
|
19,677 |
|
|
|
|
|
22,279 |
|
|
|
|
|
20,816 |
|
Depreciation and amortization |
|
|
|
|
|
42,247 |
|
|
|
|
|
40,843 |
|
|
|
|
|
34,502 |
|
Changes in fair value of contingent acquisition consideration |
|
|
|
|
|
(6,481) |
|
|
|
|
|
(421) |
|
|
|
|
|
3,633 |
|
Stock-based compensation expense (D) |
|
|
|
|
|
19,159 |
|
|
|
|
|
19,417 |
|
|
|
|
|
13,870 |
|
Legal settlements |
|
|
|
|
|
5,345 |
|
|
|
|
|
3 |
|
|
|
|
|
1,403 |
|
Acquisition, disposition and related expenses |
|
|
|
|
|
1,811 |
|
|
|
|
|
569 |
|
|
|
|
|
3,590 |
|
Restructuring charge |
|
|
|
|
|
(117) |
|
|
|
|
|
5,616 |
|
|
|
|
|
- |
|
Impairment charges (E) |
|
|
|
|
|
43,110 |
|
|
|
|
|
- |
|
|
|
|
|
- |
|
Restatement-related expenses (F) |
|
|
|
|
|
7,853 |
|
|
|
|
|
11,432 |
|
|
|
|
|
23,586 |
|
NextAdvisor contingent deferred compensation (G) |
|
|
|
|
|
6,205 |
|
|
|
|
|
- |
|
|
|
|
|
- |
|
China operations (H) |
|
|
|
|
|
1,682 |
|
|
|
|
|
393 |
|
|
|
|
|
565 |
|
Impact of purchase accounting |
|
|
|
|
|
- |
|
|
|
|
|
35 |
|
|
|
|
|
556 |
|
(Loss) income before income taxes |
|
|
|
|
$ |
(25,694) |
|
|
|
|
$ |
26,957 |
|
|
|
|
$ |
15,279 |
|
|
|
|
|
|
|
|
|
|
|
|
|
|
|
|
|
|
|
|
__________
|
(A) |
Includes the results of NextAdvisor since its acquisition in June 2016. |
|
(B) |
During the third quarter 2016, management realigned its management reporting structure by integrating the Quizzle operations into the Banking segment. All segment results reported for the years ended December 31, 2016 and 2015 have been revised to reflect such change. (Quizzle was acquired in April 2015). |
|
(C) |
For the year ended December 31, 2015, includes a $703,000 charge for the exit of an office lease. |
|
(D) |
Excludes approximately $3.9 million and $3.2 million of stock based compensation costs for the years ended December 31, 2015 and 2014, respectively, related to the divestiture of our Insurance business during 2015. The costs related to our Insurance business are presented as a discontinued operation. |
|
(E) |
During the year ended December 31, 2016, $25.0 million, $6.6 million and $4.0 million was recorded for goodwill impairment to our Banking, pre-realigned Quizzle and Senior Care reporting units, respectively, and $7.5 million was recorded for intangible asset impairment to our pre-realigned Quizzle reporting unit. |
|
(F) |
Restatement-related expenses include expenses related to the Restatement, the Internal Review, the SEC and DOJ investigations and related litigation and indemnification obligations. |
|
(G) |
Represents contingent deferred compensation expense related to the NextAdvisor acquisition. |
|
(H) |
Represents the loss from the operations in China, and includes legal and other costs incurred to wind down those operations. The results of China were previously presented as a discontinued operation when it was actively marketed for sale. After the negotiations with the potential buyer did not result in a sale of the business, we initiated the process to wind down the operations. |
Segment revenues are recorded in accordance with our revenue recognition policy (see Note 2 – Summary of Significant Accounting Policies) and during the years ended December 31, 2016, 2015 and 2014, included $6.3 million, $4.9 million and $5.3 million, respectively, of intra-segment revenue which are eliminated within Other.
NOTE 7 – FAIR VALUE MEASUREMENT
The carrying amounts of cash, accounts receivable and accrued interest approximate estimated fair value. In measuring the fair value of our long term debt, we used Level 2 market information. These estimates require considerable judgment in interpreting market data, and changes in assumptions or estimation methods could significantly affect the fair value estimates.
The following table presents estimated fair value, and related carrying amounts, as of:
|
|
|
|
|
|
|
|
|
|
|
|
|
|
|
|
|
|
|
|
|
|
|
|
|
|
|
|
|
|
|
December 31, 2016 |
|
December 31, 2015 |
||||||||
|
(In thousands) |
|
Carrying Amount |
|
Estimated Fair Value |
|
Carrying Amount |
|
Estimated Fair Value |
||||
|
Financial liabilities: |
|
|
|
|
|
|
|
|
|
|
|
|
|
Long term debt (A) |
|
$ |
295,721 |
|
$ |
302,250 |
|
$ |
293,284 |
|
$ |
297,000 |
__________
(A)The carrying amount of long term debt is net of original issue discount and deferred financing fees.
We make recurring fair value measurements of our contingent acquisition consideration using Level 3 unobservable inputs. We recognize the fair value of contingent acquisition consideration based on its estimated fair value at the date of acquisition using discounted cash flows, Monte Carlo simulations or probability weighted-expected return model. Subsequent adjustments to the fair value are due to either the passage of time as we approach the payment date or changes to management’s estimates of the projected results of the acquired business. In determining the fair value of contingent acquisition consideration, we review current results of the acquired business along with projected results for the remaining earnout period, to calculate the expected contingent acquisition consideration to be paid using the agreed upon formula as laid out in the acquisition agreements. The fair value of the contingent acquisition consideration liability will be adjusted based on the change in fair value of contingent consideration resulting from the passage of time at the applicable discount rate, or changes in the forecasted results as we approach the payment dates of the contingent consideration absent any significant changes in assumptions related to the valuation or the probability of payment.
In addition, we make recurring fair value measurement of a contingent acquisition deferred compensation liability using Level 3 unobservable inputs. We recognize the fair value based on its estimated fair value at the beginning period date using discounted cash flows, Monte Carlo simulations or probability weighted-expected return model. Subsequent adjustments to the fair value are due to the passage of time as we approach the payment date or changes to management’s estimates of the projected performance target. In determining the fair value, we review current results along with projected results for the remaining earnout period to calculate the expected contingent acquisition deferred compensation to be paid using the agreed upon formula as laid out in the acquisition agreement. The fair value of the contingent acquisition deferred compensation liability will be adjusted based on the change in fair value resulting from the passage of time at the applicable discount rate, or changes in the forecasted results as we approach the payment dates of the contingent acquisition deferred compensation absent any significant changes in assumptions related to the valuation or the probability of payment.
The unobservable inputs used in determining the fair value of contingent acquisition consideration for earnout periods not yet completed include discount factors of 14% to 18% based on our weighted average cost of capital and projected results of the acquired businesses. In addition, we consider the cost of debt to be a significant input in the valuation of the fair value of the contingent acquisition deferred compensation and certain contingent acquisition consideration liabilities. We used 4.5% percent as our cost of debt in these valuations as of December 31, 2016. The fair value calculated as of December 31, 2016 is subject to sensitivity as it relates to the projected results of the acquired businesses, which are uncertain in nature. Each calculation is based on a separate formula and results that differ from our projections could impact the fair value significantly.
The following tables present our fair value measurements of our contingent acquisition consideration, contingent acquisition deferred compensation and the assets of our non-qualified deferred compensation plan as of December 31, 2016 and 2015 using the fair value hierarchy.
|
|
|
|
|
|
|
|
|
|
|
|
|
|
|
|
|
|
|
|
|
|
|
|
|
|
|
|
|
|
|
Fair Value Measurement at December 31, 2016 Using |
||||||||||
|
(In thousands) |
|
Quoted Prices in Active Markets for Identical Assets (Level 1) |
|
Significant Other Observable Inputs (Level 2) |
|
Significant Unobservable Inputs (Level 3) |
|
Total |
||||
|
Recurring fair value measurement: |
|
|
|
|
|
|
|
|
|
|
|
|
|
Assets: |
|
|
|
|
|
|
|
|
|
|
|
|
|
Investments of the non-qualified deferred compensation plan |
|
$ |
178 |
|
$ |
- |
|
$ |
- |
|
$ |
178 |
|
Total asset recurring fair value measurements |
|
$ |
178 |
|
$ |
- |
|
$ |
- |
|
$ |
178 |
|
|
|
|
|
|
|
|
|
|
|
|
|
|
|
Liabilities: |
|
|
|
|
|
|
|
|
|
|
|
|
|
Contingent acquisition deferred compensation |
|
$ |
- |
|
$ |
- |
|
$ |
869 |
|
$ |
869 |
|
Contingent acquisition consideration |
|
|
- |
|
|
- |
|
|
30,711 |
|
|
30,711 |
|
Total liabilities recurring fair value measurements |
|
$ |
- |
|
$ |
- |
|
$ |
31,580 |
|
$ |
31,580 |
|
|
|
|
|
|
|
|
|
|
|
|
|
|
|
|
|
|
|
|
|
|
|
|
|
|
|
|
|
|
|
|
|
|
|
|
|
|
|
|
|
|
|
|
|
Fair Value Measurement at December 31, 2015 Using |
||||||||||
|
(In thousands) |
|
Quoted Prices in Active Markets for Identical Assets (Level 1) |
|
Significant Other Observable Inputs (Level 2) |
|
Significant Unobservable Inputs (Level 3) |
|
Total |
||||
|
Recurring fair value measurement: |
|
|
|
|
|
|
|
|
|
|
|
|
|
|
|
|
|
|
|
|
|
|
|
|
|
|
|
Investments of the non-qualified deferred compensation plan |
|
$ |
173 |
|
$ |
- |
|
$ |
- |
|
$ |
173 |
|
Total asset recurring fair value measurements |
|
$ |
173 |
|
$ |
- |
|
$ |
- |
|
$ |
173 |
|
|
|
|
|
|
|
|
|
|
|
|
|
|
|
Liabilities: |
|
|
|
|
|
|
|
|
|
|
|
|
|
Contingent acquisition consideration |
|
$ |
- |
|
$ |
- |
|
$ |
9,107 |
|
$ |
9,107 |
|
Total liabilities recurring fair value measurements |
|
$ |
- |
|
$ |
- |
|
$ |
9,107 |
|
$ |
9,107 |
|
|
|
|
|
|
|
|
|
|
|
|
|
|
The following table sets forth a reconciliation of changes in the fair value of our contingent acquisition consideration Level 3 financial liabilities:
|
|
|
|
|
|
|
|
|
|
|
|
|
|
Year ended December 31, |
|||||||
|
(In thousands) |
|
2016 |
|
2015 |
|
2014 |
|||
|
Balance, January 1, |
|
$ |
9,107 |
|
$ |
19,028 |
|
$ |
38,762 |
|
Additions to Level 3 |
|
|
37,293 |
|
|
3,747 |
|
|
1,930 |
|
Transfers into Level 3 |
|
|
- |
|
|
- |
|
|
- |
|
Transfers out of Level 3 |
|
|
- |
|
|
- |
|
|
- |
|
Change in fair value |
|
|
(6,481) |
|
|
(421) |
|
|
3,633 |
|
Payments |
|
|
(9,208) |
|
|
(13,247) |
|
|
(25,297) |
|
Balance, December 31, |
|
$ |
30,711 |
|
$ |
9,107 |
|
$ |
19,028 |
The current portion of the contingent acquisition consideration liability is recorded in other current liabilities and the non-current portion is recorded in other liabilities. During the year ended December 31, 2016, the Company changed certain estimates of the projected results of acquired businesses that resulted in a decrease in the fair value of contingent acquisition consideration and a benefit to operating income of approximately $7.9 million. The Company also recorded an expense of approximately $1.5 million related to the passage of time. During the year ended December 31, 2015, the Company changed certain estimates of the projected results of acquired businesses that resulted in a decrease in the fair value of contingent acquisition consideration and a benefit to operating income of approximately $2.5 million. The Company also recorded an expense of approximately $2.1 million related to the passage of time. During the year ended December 31, 2014, the Company changed certain estimates of the projected results of acquired businesses that resulted in an increase in the fair value of contingent acquisition consideration and a charge to operating income of $530,000. The remaining $3.1 million recorded in the change in fair value of contingent acquisition consideration during the year ended December 31, 2014 related to the passage of time.
As of December 31, 2016, the possible contingent acquisition consideration payouts from our acquisitions range from zero to $164.1 million, depending on the achievement of certain targets by the acquired operations.
The following table sets forth a reconciliation of changes in the fair value of our contingent acquisition deferred compensation Level 3 financial liabilities:
|
|
|
|
|
|
|
|
|
|
|
|
|
|
Year ended December 31, |
|||||||
|
(In thousands) |
|
2016 |
|
2015 |
|
2014 |
|||
|
Balance, January 1, |
|
$ |
- |
|
$ |
- |
|
$ |
- |
|
Additions to Level 3 |
|
|
- |
|
|
- |
|
|
- |
|
Transfers into Level 3 |
|
|
- |
|
|
- |
|
|
- |
|
Transfers out of Level 3 |
|
|
- |
|
|
- |
|
|
- |
|
Change in fair value |
|
|
869 |
|
|
- |
|
|
- |
|
Payments |
|
|
- |
|
|
- |
|
|
- |
|
Balance, December 31, |
|
$ |
869 |
|
$ |
- |
|
$ |
- |
The current portion of the contingent acquisition deferred compensation liability is recorded in other current liabilities and the non-current portion is recorded in other liabilities. The fair value of the contingent acquisition deferred compensation is based on the achievement of certain Adjusted EBITDA targets and is tied to the participant’s employment. During the year ended December 31, 2016, we recorded an expense of $869,000 for the change in fair value of contingent acquisition deferred compensation, which consists of a $1.1 million increase related to the passage of time; partially offset by a decrease in the fair value of $255,000 due to the change certain estimates of the projected results. As of December 31, 2016, the possible contingent acquisition deferred compensation payout ranges from zero to $11.4 million, depending on the achievement of certain Adjusted EBITDA targets.
NOTE 8 – STOCK-BASED COMPENSATION
Our stock-based compensation program is a long-term retention program that is intended to attract, retain and provide incentives for directors, officers and employees in the form of non-qualified stock options, restricted stock and performance-based restricted shares or units. We typically settle stock-based awards with treasury shares.
In August 2015, the Company’s stockholders approved the 2015 Equity Compensation Plan (the “2015 Plan”), replacing the former 2011 Equity Compensation Plan (the “2011 Plan”), to grant stock-based awards for up to 8.0 million shares of our common stock. Under the 2015 Plan, the Compensation Committee of the Board of Directors or another Committee or delegate designated by the Board of Directors or Compensation Committee has the sole authority to determine who receives such grants, the type, size and timing of such grants, and to specify the terms of such awards. The purpose of the 2015 Plan is to attract and retain officers, employees and non-employees, to provide such persons incentives and rewards and to align the participants’ economic interests with that of our stockholders. As of December 31, 2016, approximately 6.2 million shares were available for future issuance under the 2015 plan. During the year ended December 31, 2016, there were no significant modifications to stock options or stock awards.
During the year ended December 31, 2015, the Company modified certain stock options and stock awards for approximately 40 individuals, granted in 2013, 2014 and 2015, related to the sale of its Insurance business and its restructuring initiatives. The modification resulted in an acceleration of the vesting periods of restricted and performance-based stock awards and an extension of the exercise period of the stock options. These modifications resulted in an additional expense of $9.7 million for the year ended December 31, 2015, of which, $6.3 million is recorded as a component of the net loss from discontinued operation and $3.4 million is recorded as a component of restructuring expense.
During the year ended December 31, 2014, the Company modified certain stock awards granted to an executive in 2011 and 2014. The modification resulted in an extension of the exercise period of current vested stock options and accelerated vesting of certain restricted stock grants. These modifications resulted in additional compensation expense of $147,000 for the year ended December 31, 2014.
The stock-based compensation expense for stock awards recognized in our consolidated statements of comprehensive income (loss) for the years ended December 31, 2016, 2015 and 2014 is as follows:
|
|
|
|
|
|
|
|
|
|
|
|
|
|
Year ended |
|||||||
|
|
|
December 31, |
|
December 31, |
|
December 31, |
|||
|
(In thousands) |
|
2016 |
|
2015 |
|
2014 |
|||
|
Cost of revenue |
|
$ |
1,890 |
|
$ |
1,392 |
|
$ |
1,275 |
|
Sales and marketing |
|
|
1,741 |
|
|
2,427 |
|
|
1,558 |
|
Product development and technology |
|
|
4,113 |
|
|
3,503 |
|
|
2,203 |
|
General and administrative |
|
|
11,415 |
|
|
12,095 |
|
|
8,834 |
|
Total stock-based compensation |
|
$ |
19,159 |
|
$ |
19,417 |
|
$ |
13,870 |
Stock compensation expense includes $1.3 million for the year ended December 31, 2016, related to performance-based restricted share grants that are classified as a liability until the number of shares is determinable. This amount is included in the performance-based restricted share expense discussed below. These grants vest on their determination date, ratably over three years. The stock-based compensation expense presented in the table above excludes approximately $3.9 million and $3.2 million for the years ended December 31, 2015 and 2014, respectively, related to our divestiture of the Insurance business in 2015. The costs related to the Insurance business are presented as a discontinued operation.
Restricted Stock
Restricted stock awards granted in 2016, 2015 and 2014 primarily vest in equal installments on the first, second and third anniversaries of the grant date subject to continued employment through the applicable vesting date. Restricted stock with one- or two-year cliff vesting terms were also issued during 2014. These restricted stock grants are valued based on the market price of the common stock on the date of grant. Compensation expense arising from restricted stock grants with cliff vesting is recognized using the straight line method over the requisite service period.
The following table summarizes restricted stock award activity for the years ended and grants outstanding as of December 31:
|
|
|
|
|
|
|
|
|
|
|
|
|
|
Weighted Average |
|
|
|
|
|
Number of |
|
Grant Date |
|
|
|
|
|
Shares |
|
Fair Value |
|
|
Balance, January 1, 2014 |
|
|
973,193 |
|
$ |
15.66 |
|
Granted |
|
|
1,688,632 |
|
|
13.98 |
|
Vested and released |
|
|
(336,395) |
|
|
15.39 |
|
Forfeited |
|
|
(163,048) |
|
|
15.50 |
|
Balance, December 31, 2014 |
|
|
2,162,382 |
|
|
14.40 |
|
Granted |
|
|
1,557,283 |
|
|
12.36 |
|
Vested and released |
|
|
(1,402,856) |
|
|
13.85 |
|
Forfeited |
|
|
(426,430) |
|
|
13.42 |
|
Balance, December 31, 2015 |
|
|
1,890,379 |
|
|
13.35 |
|
Granted |
|
|
78,646 |
|
|
11.82 |
|
Vested and released |
|
|
(828,802) |
|
|
13.53 |
|
Forfeited |
|
|
(101,939) |
|
|
12.23 |
|
Balance, December 31, 2016 |
|
|
1,038,284 |
|
$ |
12.86 |
Stock-based compensation expense for the years ended December 31, 2016, 2015 and 2014 included approximately $9.6 million, $14.2 million and $7.7 million related to restricted stock awards, respectively.
The total fair value of restricted stock awards that vested during the years ended December 31, 2016, 2015 and 2014 was $11.2 million, $19.4 million and $5.2 million, respectively.
As of December 31, 2016, there was $7.8 million of unrecognized compensation cost related to non-vested restricted stock awards, expected to be recognized over a weighted average period of approximately 0.8 years.
Restricted Stock Units
During the year ended December 31, 2016, restricted stock units were awarded that vest ratably over a three year period following the date of the grant.
|
|
|
|
|
|
|
|
|
|
|
|
|
|
|
|
|
|
|
|
|
|
Weighted Average |
|
|
|
|
|
Number of |
|
Grant Date |
|
|
|
|
|
Units |
|
Fair Value |
|
|
Balance, January 1, 2016 |
|
|
- |
|
$ |
- |
|
Granted |
|
|
2,581,647 |
|
|
8.27 |
|
Forfeited |
|
|
(183,598) |
|
|
8.31 |
|
Balance, December 31, 2016 |
|
|
2,398,049 |
|
$ |
8.27 |
|
|
|
|
|
|
|
|
Stock-based compensation expense related to restricted stock units for the year ended December 31, 2016 was approximately $4.8 million. As of December 31, 2016, there was unrecognized compensation cost related to non-vested restricted stock units of $15.0 million, net of forfeitures, which is expected to be recognized over an estimated weighted average period of 1.2 years.
Performance-Based Restricted Shares
During 2015, we granted performance-based restricted share awards that include a performance condition, with the number of shares ultimately issued determined based on the Company’s Adjusted EBITDA for the two years ending December 31, 2016. The granted amount represents the maximum amount of the award at 150% of the target and the total number of shares ultimately issued can range from 0% to 100% of the granted amount. No expense has been recognized for this 2015 award as the performance condition has not been met.
During 2014, we granted performance-based restricted share awards, which included a performance condition pursuant to which the number of shares ultimately issued were determined based on the Company’s aggregate performance for the two years ending December 31, 2015. Performance shares were also granted to Steven Barnhart, who was hired as an interim Chief Financial Officer of the Company during 2014, with a performance condition of being appointed Chief Financial Officer, which has been satisfied. Shares granted are to vest in five equal installments on each of the first five anniversaries of March 12, 2014, which is the date on which Mr. Barnhart was appointed Chief Financial Officer on a non-interim basis.
Stock-based compensation expense related to performance-based restricted shares for the years ended December 31, 2016 and 2015 was approximately $2.0 million and $2.3 million, respectively. We did not record stock-based compensation expense related to performance-based restricted shares during the year ended December 31, 2014. The total fair value of performance-based restricted share awards that vested during the years ended December 31, 2016 and 2015 was $1.5 million and $2.3 million, respectively. No shares vested during 2014. As of December 31, 2016, there was unrecognized compensation expense related to non-vested performance stock awards of $1.1 million, net of forfeitures, which is estimated to be recognized over a weighted average period of 1.2 years.
Performance-based shares activity and grants outstanding were as follows for the years ended and as of December 31:
|
|
|
|
|
|
|
|
|
|
|
|
|
|
Weighted Average |
|
|
|
|
|
Number of |
|
Grant Date |
|
|
|
|
|
Shares |
|
Fair Value |
|
|
Balance, January 1, 2014 |
|
|
419,500 |
|
$ |
14.77 |
|
Granted |
|
|
1,217,145 |
|
|
15.77 |
|
Vested/Earned |
|
|
- |
|
|
- |
|
Forfeited |
|
|
(196,425) |
|
|
16.06 |
|
Unearned |
|
|
(419,500) |
|
|
14.77 |
|
Balance, December 31, 2014 |
|
|
1,020,720 |
|
|
15.71 |
|
Granted |
|
|
1,394,288 |
|
|
12.73 |
|
Vested/Earned |
|
|
(152,082) |
|
|
15.06 |
|
Forfeited |
|
|
(528,506) |
|
|
14.41 |
|
Unearned |
|
|
(516,002) |
|
|
16.06 |
|
Balance, December 31, 2015 |
|
|
1,218,418 |
|
|
12.80 |
|
Granted |
|
|
- |
|
|
- |
|
Vested/Earned |
|
|
(97,614) |
|
|
15.33 |
|
Forfeited |
|
|
(95,134) |
|
|
13.22 |
|
Balance, December 31, 2016 |
|
|
1,025,670 |
|
$ |
12.52 |
|
|
|
|
|
|
|
|
Performance-Based Restricted Stock Units
During 2016, performance-based restricted stock units were awarded that vest based upon a performance factor, which is equal to a measure of the Company’s profitability over a 2 year period and multiplied by a total shareholder return factor achieved by the Company relative to a determined peer group, with 50% vesting on the determination date, which will be the later of (i) the date on which the audit of the Company’s consolidated financial statements for its fiscal year 2017 is completed and (ii) the date on which the final calculation of the relative total shareholder return factor is made by the Compensation Committee of the Board of Directors; and 50% on the third anniversary of the grant date. The granted amount represents the target amount of performance-based restricted stock units to be awarded. The amount awarded is determined based on the Company’s financial performance metric, Adjusted EBITDA. The total number of performance-based restricted stock units earned based on the financial performance metric can range from 0% to 150% of the target amount. The total shareholder return factor could further adjust the number of performance-based restricted stock units earned by a maximum increase or decrease of 25%.
Stock-based compensation expense related to the performance-based restricted stock units for the year ended December 31, 2016 was $1.9 million. As of December 31, 2016, there was unrecognized compensation expense related to non-vested performance-based restricted stock units of $3.8 million, net of forfeitures, which is expected to be recognized over an estimated weighted average period of 1.8 years.
The grant date fair value of performance-based restricted stock units incorporates a total-stockholders return metric, which is estimated using a Monte Carlo simulation model to estimate the Company’s ranking relative to an applicable stock index of peers. The weighted average assumptions used in the Monte Carlo simulation model to calculate the fair value of the Company’s performance-based restricted stock unit awards are outlined below.
|
|
|
|
|
|
|
|
|
|
|
|
|
|
|
|
|
|
|
|
|
|
|
|
|
Year ended December 31, 2016 |
|
|
|
|
|
|
|
|
Expected volatility of stock price |
|
|
56.35% |
|
|
|
|
|
|
|
Risk-free interest rate |
|
|
0.94% |
|
|
|
|
|
|
|
Valuation period |
|
|
2.06 years |
|
|
|
|
|
|
|
Dividend yield |
|
|
0.00% |
|
|
|
|
|
|
|
|
|
|
|
|
|
|
|
|
|
Performance-based restricted stock unit activity was as follows for the year ended December 31:
|
|
|
|
|
|
|
|
|
|
|
|
|
|
|
|
|
|
|
|
|
|
Weighted Average |
|
|
|
|
|
Number of |
|
Grant Date |
|
|
|
|
|
Units |
|
Fair Value |
|
|
Balance, January 1, 2016 |
|
|
- |
|
$ |
- |
|
Granted |
|
|
896,711 |
|
|
9.21 |
|
Forfeited |
|
|
(62,778) |
|
|
9.21 |
|
Balance, December 31, 2016 |
|
|
833,933 |
|
$ |
9.21 |
|
|
|
|
|
|
|
|
Stock Options
We use the Black-Scholes option pricing model to determine the fair value of our stock options. The determination of the fair value of the awards on the date of grant using an option-pricing model is affected by the price of our common stock, as well as assumptions regarding a number of complex and subjective variables, and is considered a Level 3 unobservable input. These variables include expected stock price volatility over the term of the awards, actual and projected employee stock option exercise behaviors, risk-free interest rates, expected dividends and the estimated forfeiture rate.
We estimated the expected term of outstanding stock options by considering the vesting term and the contractual term of the option, as well as the historical option exercise behavior of employees, as illustrated in ASC 718, Compensation—Stock Compensation. The estimated volatility of our common stock is determined based on facts and circumstances at the time of the grant, along with the historical trading volatility of our stock. For stock option grants issued prior to 2014, we used the simplified method to estimate the expected term for employee stock option grants and we previously estimated the volatility of our common stock by using an average of historical stock price volatility of publicly traded entities that are considered peers to Bankrate in accordance with ASC 718. We based the risk-free interest rate used in the option pricing model on U.S. Treasury constant maturity issues having remaining terms similar to the expected terms of the options. We do not anticipate paying any cash dividends in the foreseeable future and therefore use an expected dividend yield of zero in the option pricing model. We are required to estimate forfeitures at the time of grant and revise those estimates in subsequent periods if actual forfeitures differ from those estimates. We use historical data to estimate pre-vesting option forfeitures and record share-based compensation expense only for those awards that are expected to vest. All share-based payment awards are recognized on a straight-line basis over the requisite service periods, which is generally the vesting period. During the fourth quarter of 2016, we evaluated our forfeiture rate based on historical experience and updated the forfeiture rate from 8% to 12%. If factors change and we employ different assumptions for estimating share-based compensation expense in future periods or if we decide to use a different valuation model, the future periods may differ significantly from what we have recorded in the current period and could materially affect our operating income, net income and net income per share.
Stock options granted contained a contractual term of seven years. Stock option activity and grants outstanding were as follows for the years ended and as of December 31:
|
|
|
|
|
|
|
|
|
|
|
|
|
|
|
|
|
|
|
|
|
|
|
|
|
|
|
|
|
|
|
|
Number of |
|
Exercise Price |
|
Weighted Average |
|
Aggregate |
|||
|
|
|
|
Options |
|
Per Share |
|
Exercise Price |
|
Intrinsic Value |
|||
|
Balance, January 1, 2014 |
|
|
5,058,543 |
|
$ |
11.05 - 24.25 |
|
$ |
15.70 |
|
$ |
13,167,000 |
|
Granted |
|
|
- |
|
|
- |
|
|
- |
|
|
|
|
Exercised |
|
|
(1,520,938) |
|
|
11.05 - 18.08 |
|
|
15.01 |
|
|
|
|
Forfeited |
|
|
(174,866) |
|
|
14.32 - 23.71 |
|
|
16.79 |
|
|
|
|
Expired |
|
|
(537,030) |
|
|
14.32 - 23.71 |
|
|
15.53 |
|
|
|
|
Balance, December 31, 2014 |
|
|
2,825,709 |
|
|
11.05 - 24.25 |
|
|
16.04 |
|
|
85,250 |
|
Granted |
|
|
- |
|
|
- |
|
|
- |
|
|
|
|
Exercised |
|
|
(98,716) |
|
|
11.05 - 15.00 |
|
|
14.27 |
|
|
|
|
Forfeited |
|
|
(54,746) |
|
|
11.05 - 24.25 |
|
|
15.47 |
|
|
|
|
Expired |
|
|
(170,321) |
|
|
15.00 - 24.25 |
|
|
17.26 |
|
|
|
|
Balance, December 31, 2015 |
|
|
2,501,926 |
|
|
11.05 - 22.39 |
|
|
16.04 |
|
|
86,326 |
|
Granted |
|
|
- |
|
|
- |
|
|
- |
|
|
|
|
Forfeited |
|
|
- |
|
|
- |
|
|
- |
|
|
|
|
Expired |
|
|
(1,546,986) |
|
|
11.05 - 22.39 |
|
|
15.57 |
|
|
|
|
Balance, December 31, 2016 |
|
|
954,940 |
|
$ |
12.55 - 22.39 |
|
$ |
16.81 |
|
$ |
- |
The following table summarizes our options outstanding and options currently exercisable.
|
|
|
|
|
|
|
|
|
|
|
|
|
|
|
|
|
|
|
|
|
|
|
|
|
|
|
|
|
|
|
|
|
|
As of December 31, 2016 |
||||||||||
|
|
|
|
|
|
|
|
|
|
Weighted Average |
|
|
|
|
|
|
|
|
Number of |
|
|
Weighted Average |
|
Contractual Term |
|
|
Aggregate |
||
|
|
|
|
Options |
|
|
Exercise Price |
|
(in years) |
|
|
Intrinsic Value |
||
|
Options vested and expected to vest |
|
|
954,940 |
|
$ |
16.81 |
|
|
4.0 |
|
$ |
- |
|
|
Options exercisable |
|
|
902,845 |
|
|
16.60 |
|
|
4.0 |
|
|
- |
|
|
|
|
|
|
|
|
|
|
|
|
|
|
|
|
The aggregate intrinsic value of stock options outstanding in the table above is calculated as the difference between the closing price of Bankrate’s common stock on the last trading day of the reporting period ($11.05 at December 31, 2016) and the exercise price of the stock options multiplied by the number of shares underlying options with exercise prices less than the closing price on the last trading day of the reporting period. Stock compensation expense related to stock option awards for the year ended December 31, 2016, 2015 and 2014 was $800,000, $2.9 million and $6.2 million, respectively.
Pursuant to the income tax provisions of ASC 718, we follow the “long-haul method” of computing our hypothetical additional paid-in capital, or APIC, pool. Approximately 88,000 stock options vested during the year ended December 31, 2016. The intrinsic value of stock options exercised during the years ended December 31, 2015 and 2014 was $83,000 and $8.2 million, respectively.
As of December 31, 2016, approximately $400,000 of total unrecognized compensation costs, net of forfeitures, related to non-vested stock option awards is expected to be recognized over a weighted average period of 0.4 years.
NOTE 9 – INCOME TAXES
The Company files income tax returns in the U.S. and various state, local and foreign jurisdictions. Tax regulations within each jurisdiction are subject to the interpretation of the related tax laws and require significant judgment. With few exceptions, we are no longer subject to U.S. federal, state and local, and non-U.S. income tax examinations by tax authorities for the years before 2012. While we are currently under examination by various state and local tax authorities, we believe that there will be no material changes to the Company’s income tax liability as a result of these audits in the next twelve months.
The following is a summary of tax jurisdictions under audit:
|
|
|
|
|
|
|
Jurisdictions |
|
Tax Year(s) |
|
|
U.S. Federal |
|
2013, 2014 & 2015 |
|
|
New York State |
|
2012, 2013 & 2014 |
|
|
New York City |
|
2013 & 2014 |
|
|
Tennessee |
|
2011 & 2012 |
The components of income (loss) from continuing operations before income taxes were as follows:
|
|
|
|
|
|
|
|
|
|
|
|
|
|
|
|
|
|
|
|
|
|
Year ended December 31, |
|||||||
|
(In thousands) |
2016 |
|
2015 |
|
2014 |
|||
|
U.S. |
$ |
(23,807) |
|
$ |
28,961 |
|
$ |
17,867 |
|
International |
|
(1,887) |
|
|
(2,004) |
|
|
(2,588) |
|
Income (loss) from continuing operations |
$ |
(25,694) |
|
$ |
26,957 |
|
$ |
15,279 |
|
|
|
|
|
|
|
|
|
|
The components of the income tax expense (benefit) from continuing operations are as follows:
|
|
|
|
|
|
|
|
|
|
|
|
Year ended December 31, |
|||||||
|
(In thousands) |
2016 |
|
2015 |
|
2014 |
|||
|
Current: |
|
|
|
|
|
|
|
|
|
Federal |
$ |
9,127 |
|
$ |
25,428 |
|
$ |
9,752 |
|
State |
|
1,651 |
|
|
1,806 |
|
|
(1,155) |
|
Total current |
|
10,778 |
|
|
27,234 |
|
|
8,597 |
|
Deferred: |
|
|
|
|
|
|
|
|
|
Federal |
|
(1,161) |
|
|
(16,654) |
|
|
(2,306) |
|
State |
|
(1,273) |
|
|
(465) |
|
|
1,969 |
|
Total deferred |
|
(2,434) |
|
|
(17,119) |
|
|
(337) |
|
Total income tax expense |
$ |
8,344 |
|
$ |
10,115 |
|
$ |
8,260 |
The difference between income tax expense (benefit) computed at the statutory rate and the reported income tax (benefit) expense from continuing operations is as follows:
|
|
|
|
|
|
|
|
|
|
|
|
Year ended December 31, |
|||||||
|
(In thousands) |
2016 |
|
2015 |
|
2014 |
|||
|
Income taxes at statutory rate |
$ |
(8,993) |
|
$ |
9,434 |
|
$ |
5,348 |
|
State income taxes, net of federal benefit |
|
(1,028) |
|
|
1,534 |
|
|
1,727 |
|
Foreign losses |
|
101 |
|
|
134 |
|
|
342 |
|
Permanent items |
|
(442) |
|
|
(262) |
|
|
6,287 |
|
Goodwill impairment |
|
10,150 |
|
|
- |
|
|
- |
|
Adjustments to income tax payable |
|
- |
|
|
(256) |
|
|
(591) |
|
Uncertain tax positions |
|
1,637 |
|
|
(1,202) |
|
|
(8,441) |
|
Adjustment to deferred tax assets |
|
- |
|
|
1,685 |
|
|
488 |
|
Rate changes |
|
(658) |
|
|
(1,310) |
|
|
(647) |
|
IRS and state audits |
|
863 |
|
|
- |
|
|
407 |
|
Stock compensation |
|
6,066 |
|
|
920 |
|
|
1,975 |
|
State amended tax returns |
|
(734) |
|
|
(253) |
|
|
(684) |
|
IRC Sec. 481(a) adjustment |
|
- |
|
|
(886) |
|
|
916 |
|
Valuation allowance |
|
1,497 |
|
|
613 |
|
|
1,133 |
|
Other |
|
(115) |
|
|
(36) |
|
|
- |
|
|
$ |
8,344 |
|
$ |
10,115 |
|
$ |
8,260 |
The tax effects of temporary differences that give rise to significant portions of the deferred tax assets and liabilities consisted of the following:
|
|
|
|
|
|
|
|
|
December 31, |
|
December 31, |
||
|
(In thousands) |
2016 |
|
2015 |
||
|
Allowance for doubtful accounts |
$ |
48 |
|
$ |
56 |
|
Accrued expenses |
|
7,535 |
|
|
4,747 |
|
Prepaid expenses |
|
- |
|
|
(1,158) |
|
Intangibles acquired |
|
(76,230) |
|
|
(79,230) |
|
Depreciation and amortization |
|
44,461 |
|
|
39,567 |
|
Stock compensation |
|
8,383 |
|
|
13,777 |
|
Net operating loss carryforwards |
|
13,405 |
|
|
17,125 |
|
Capital loss carryforward |
|
11,125 |
|
|
11,522 |
|
Valuation allowance |
|
(16,514) |
|
|
(15,501) |
|
Accrued earnout contingencies |
|
2,669 |
|
|
1,543 |
|
Total noncurrent deferred tax liabilities |
|
(5,118) |
|
|
(7,552) |
|
Total net deferred tax liabilities |
$ |
(5,118) |
|
$ |
(7,552) |
Total deferred tax assets and total deferred tax liabilities components of net deferred tax liabilities are as follows:
|
|
|
|
|
|
|
|
|
December 31, |
|
December 31, |
||
|
(In thousands) |
2016 |
|
2015 |
||
|
Deferred tax assets: |
|
|
|
|
|
|
Total noncurrent deferred assets |
$ |
72,517 |
|
$ |
74,169 |
|
|
|
72,517 |
|
|
74,169 |
|
Deferred tax liabilities: |
|
|
|
|
|
|
Total noncurrent deferred liabilities |
$ |
(77,635) |
|
$ |
(81,721) |
|
|
|
(77,635) |
|
|
(81,721) |
|
Total net deferred tax liabilities |
$ |
(5,118) |
|
$ |
(7,552) |
As of December 31, 2016 and 2015, we had net operating loss carry forwards of $7.4 million and $11.8 million, respectively, tax effected for both years, for federal income tax purposes. The federal net operating loss carry forwards are subject to the limitations under Internal Revenue Code Section 382. In addition, as of December 31, 2016 and 2015, we had net operating loss carry forwards of $3.8 million and $3.0 million, tax effected, respectively, for state income tax purposes. These federal and state net operating loss carry forwards will begin to expire in varying amounts starting in 2021. As of December 31, 2016 and 2015, the Company had a valuation allowance of $3.2 million and $2.0 million tax effected, respectively, related to state net operating loss carry forwards. As of December 31, 2016 there is a full valuation allowance of our capital loss carryforward of $11.1 million. As of December 31, 2016 there is a full valuation allowance of our foreign net operating loss carry forwards of $2.2 million, tax effected. Total valuation allowance increased $1.0 million during 2016. All the valuation allowances will be reduced when, and if, the Company determines that there is positive evidence that the loss carry forwards will be realized.
We recognize the financial statement benefit of a tax position only after determining that the relevant tax authority would more likely than not sustain the position following an audit. For tax positions meeting the more likely than not threshold, the amount recognized in the consolidated financial statements is the largest benefit that has a greater than 50 percent likelihood of being realized upon ultimate settlement with the relevant tax authority.
As of December 31, 2016, 2015 and 2014, $3.5 million, $1.7 million and $5.2 million of our total net unrecognized tax benefits, including interest and penalties, is classified as other liabilities, and as of December 31, 2016 and 2015, $2.1 and $2.2 million, respectively, is classified as non-current deferred tax liabilities in the consolidated balance sheets.
A reconciliation of the change in beginning and ending amounts of unrecognized tax benefits is as follows:
|
|
|
|
|
|
|
|
|
|
|
|
Year ended December 31, |
|||||||
|
(In thousands) |
2016 |
|
2015 |
|
2014 |
|||
|
Unrecognized tax benefits, beginning balance |
$ |
3,917 |
|
$ |
5,087 |
|
$ |
12,914 |
|
Additions for prior year tax positions |
|
166 |
|
|
- |
|
|
1,725 |
|
Reductions for prior year tax positions |
|
(127) |
|
|
(1,126) |
|
|
(9,552) |
|
Reductions for lapse in statute |
|
- |
|
|
(277) |
|
|
- |
|
Reductions for settlements |
|
- |
|
|
- |
|
|
- |
|
Additions for current year tax positions |
|
1,495 |
|
|
233 |
|
|
- |
|
Unrecognized tax benefits, ending balance |
$ |
5,451 |
|
$ |
3,917 |
|
$ |
5,087 |
During the year ended December 31, 2016, the Company recorded a net increase to unrecognized tax benefits of approximately $1.5 million. During the year ended December 31, 2015, the Company recorded a net decrease to unrecognized tax benefits of approximately $1.2 million. During the year ended 2014, the Company recorded a net increase to unrecognized tax benefits of approximately $7.8 million. A liability for unrecognized tax benefits is recorded as either a current or non-current liability, depending on whether the Company will make payments in the next twelve months.
Substantially all of the unrecognized tax benefits balance, if recognized would affect the Company’s effective income tax rate.
We recognize accrued interest and penalties related to unrecognized tax benefits as a component of our income tax expense (benefit). Accrued interest and penalties included in unrecognized tax benefits during the years ended December 31, 2016, 2015 and 2014, were $104,000, ($33,000) and ($614,000), respectively. Total accrued interest and penalties related to unrecognized tax benefits as of December 31, 2016 and 2015 are $158,000 and $54,000, respectively.
NOTE 10 – COMMITMENTS AND CONTINGENCIES
Legal Proceedings
From time to time, the Company is party to litigation and regulatory matters and claims. The Company expenses legal fees as incurred. The Company records a provision for contingent losses when it is both probable that a liability will be incurred and the amount or range of the loss can be reasonably estimated. The results of complex proceedings and reviews are difficult to predict and the Company’s view of these matters may change in the future as events related thereto unfold. Except as otherwise stated, we have concluded that we cannot estimate the reasonably possible loss or range of loss, including reasonably possible losses in excess of amounts already accrued, for each matter disclosed below. An unfavorable outcome to any legal or regulatory matter, if material, could have an adverse effect on the Company’s operations or its financial position, liquidity or results of operations.
BanxCorp Litigation
In July 2007, BanxCorp, an online publisher of rate information provided by financial institutions with respect to various financial products, filed suit against the Company in the United States District Court for the District of New Jersey alleging violations of Federal and New Jersey State antitrust laws, including the Sherman Act and the Clayton Act. BanxCorp has alleged that it has been injured as a result of monopolistic and otherwise anticompetitive conduct on the part of the Company and is seeking approximately $180 million in compensatory damages, treble damages, and attorneys' fees and costs. In October 2012, BanxCorp filed a Seventh Amended Complaint, alleging violations of Section 2 of the Sherman Act, Section 7 of the Clayton Act and parallel provisions of New Jersey antitrust laws, and dropping its claims under Section 1 of the Sherman Act. Discovery closed on December 21, 2012 and both parties filed motions in the first quarter of 2013 seeking summary judgment that are pending before the court. The Company will continue to vigorously defend this lawsuit. The Company cannot presently estimate the amount of loss, if any, that would result from an adverse resolution of this matter.
Securities Litigation
In October 2014, a putative class action lawsuit was brought in federal court in the United States District Court for the Southern District of Florida against the Company, certain of its current and former officers and directors, and other defendants, which is captioned The City of Los Angeles v. Bankrate, Inc., et al., No. 14-CV-81323-DMM. On November 23, 2015, the District Court dismissed an amended complaint in its entirety without prejudice for failing to adequately plead material misrepresentations or omissions, scienter, or loss causation and damages. On December 8, 2015, Lead Plaintiff filed a Second Amended Complaint alleging that the Company’s 2012, 2013, and first half of 2014 financial statements improperly recognized revenues and expenses and therefore were materially false and misleading and caused damages. Plaintiffs sought relief (including damages and rescission or rescissionary damages) under the Securities Act of 1933 based on a March 2014 secondary offering and under the Securities Exchange Act of 1934 on behalf of a proposed class consisting of all persons, other than the defendants, who purchased the Company’s securities between August 1, 2012 and October 9, 2014, inclusive. On May 17, 2016, the Company announced a proposed agreement, subject to Court approval, to settle this private securities class action against all defendants. Under the settlement, Bankrate agreed to pay a total of $20 million in cash to a Settlement Fund to resolve all claims asserted on behalf of investors who purchased or otherwise acquired Bankrate stock between October 27, 2011 and October 9, 2014. The settlement further provided that Bankrate denies all claims of wrongdoing or liability. The court granted final approval of the settlement on February 6, 2017. The Company accrued the settlement amount as of June 30, 2016 and funded approximately $6.1 million to the settlement fund. Approximately $13.8 million of the settlement fund has been funded from insurance proceeds.
DOJ Investigation
As previously reported, the DOJ has informed the Company that it is investigating the matters that were the subject of the SEC investigation settled by the Company in 2015. It is not possible to predict when the DOJ investigation will be completed, the final outcome of the investigation, and what if any actions may be taken by the DOJ.
CFPB Investigation
The Company and certain of its employees have received Civil Investigative Demands (CIDs) from the CFPB to produce certain documents and answer questions relating to the Company’s quality control process for its online mortgage rate tables. The Company has cooperated in responding to the CIDs. In late 2015, the Company received a communication from the CFPB inviting the Company to respond to the CFPB’s identified issues in the form of a Notice of Opportunity to Respond and Advise during which the CFPB identified potential claims it might bring against the Company. In early 2016, the Company submitted a response that it believes addressed the CFPB’s issues with respect to the Company’s online mortgage rate tables and its quality control processes. We are unable to predict when the CFPB investigation will be completed or the final outcome of the investigation, and cannot presently estimate the amount of loss, if any, that would result from an adverse resolution of this matter.
In addition to the above, we are also involved in other litigation and regulatory matters and claims that arise in the ordinary course of business and although we cannot be certain of the outcome of any such litigation or claims, nor the amount of damages and exposure that we could incur, we currently believe that the final disposition of such matters will not have a material effect on our business, financial position, results of operations or cash flow. Regardless of the outcome, litigation and regulatory matters can have an adverse impact on us because of investigative, defense or settlement costs, diversion of management resources and other factors.
Leases
We lease office space in certain cities in the United States and the United Kingdom. These leases are accounted for as operating leases. Total rent expense for the years ended December 31, 2016, 2015 and 2014 was approximately $3.9 million, $3.5 million and $2.9 million, respectively.
We recognize rent expense for operating leases on a straight-line basis over the applicable lease term. Certain of our office facilities’ leases contain escalation clauses, step rent provisions, lease renewals and lease incentives, including periods of free rent and construction allowances from landlords to be applied against necessary leasehold improvements. These lease incentives are treated as components of deferred rent and amortized over the term of the lease as reductions to rent expense. The lease incentives are reflected as components of other current liabilities and other liabilities on the consolidated balance sheets. We consider lease renewals in the useful life of our leasehold improvements when such renewals are reasonably assured. We take these provisions into account when calculating minimum aggregate rental commitments under non-cancelable operating leases.
Future minimum lease payments under non-cancelable operating and capital leases and having initial lease terms in excess of one year as of December 31, 2016 were:
|
|
|
|
|
|
|
|
|
|
|
(In thousands) |
|
Operating leases |
|
|
Year ending December 31, |
|
|
|
|
2017 |
$ |
3,240 |
|
|
2018 |
|
3,593 |
|
|
2019 |
|
3,119 |
|
|
2020 |
|
2,828 |
|
|
2021 |
|
2,865 |
|
|
Thereafter |
|
13,434 |
|
|
Total minimum lease payments |
$ |
29,079 |
|
|
|
|
|
|
Other Commitments
We have executed employment agreements with 36 employees, including our President and Chief Executive Officer and other senior executives. Each employment agreement provides for a minimum annual base salary, an annual bonus contingent on our achieving certain performance criteria, and severance provisions ranging from six months to one year's annual base salary. Under the terms of the employment agreements, the individuals are entitled to receive minimum severance amounts of approximately $6.3 million in the aggregate as of December 31, 2016.
Defined Contribution Plan
We sponsor a defined contribution savings plan that provides eligible employees the ability to accumulate funds for retirement. We provide employer safe harbor contributions up to the maximum legally permitted amount per eligible participant, as specified by the IRS and our plan document. Our contributions to the plan were approximately $1.7 million, $1.4 million and $981,000 for the years ended December 31, 2016, 2015 and 2014, respectively.
NOTE 11 – DEBT
Senior Notes
The Company’s $300.0 million 6.125% senior unsecured notes due August 2018 (the “Senior Notes”) were issued in August 2013. Interest on the Senior Notes accrues daily on the outstanding principal amount thereof and is payable semi-annually, in arrears, on August 15 and February 15. On or after August 15, 2015, the Company may redeem some or all of the Senior Notes at a premium that will decrease over time as set forth in Bankrate, Inc.’s Indenture, dated as of August 7, 2013 (the “Senior Notes Indenture”). Additionally, if the Company experiences a Change of Control Triggering Event (as defined in the Senior Notes Indenture), the Company must offer to purchase all of the Senior Notes at a price in cash equal to 101% of the principal amount thereof, together with accrued and unpaid interest, if any, to the date of purchase. The Senior Notes Indenture contains covenants (including, but not limited to, covenants restricting the payment of dividends and incurrence of additional indebtedness) and events of default customary for transactions of this type and has no financial maintenance covenant. All obligations under the Senior Notes are guaranteed by the Guarantors (as defined below).
The following table presents interest expense, amortization of original issue discount and amortization of deferred financing costs, related to the Senior Notes:
|
|
|
|
|
|
|
|
|
|
|
|
|
|
|
|
|
|
|
|
|
|
|
|
|
|
|
|
Year ended |
|||||||
|
(in thousands) |
|
|
December 31, 2016 |
|
December 31, 2015 |
|
December 31, 2014 |
|||
|
Interest expense |
|
|
$ |
18,375 |
|
$ |
18,375 |
|
$ |
18,375 |
|
Original issue discount |
|
|
|
655 |
|
|
615 |
|
|
577 |
|
Deferred financing costs |
|
|
|
1,788 |
|
|
1,622 |
|
|
1,292 |
|
|
|
|
|
|
|
|
|
|
|
|
The following original issue discount and deferred financing costs related to the Senior Notes remain to be amortized:
|
|
|
|
|
|
|
|
|
|
|
|
|
|
|
|
|
|
|
(in thousands) |
|
|
December 31, 2016 |
|
December 31, 2015 |
||
|
Original issue discount |
|
|
$ |
1,133 |
|
$ |
1,788 |
|
Deferred financing costs |
|
|
|
3,147 |
|
|
4,928 |
|
|
|
|
|
|
|
|
|
The deferred financing costs balances at December 31, 2016 and 2015 include the consent consideration paid in 2015 and 2014, pursuant to the second and third supplemental indenture described below, which was recorded as deferred financing costs and is being amortized over the remaining term of the Senior Notes.
The Company had a balance of approximately $295.7 million and $293.3 million in Senior Notes, net of amortization, as of December 31, 2016 and 2015, respectively, recorded on the accompanying consolidated balance sheets.
The following table provides contractual maturities of the Company’s corporate debt at December 31, 2016:
|
|
|
|
|
|
|
|
|
|
|
|
|
|
|
|
|
|
|
(in thousands) |
|
|
|
|
|
|
Amount |
|
2017 |
|
|
|
|
|
$ |
- |
|
2018 |
|
|
|
|
|
|
295,721 |
|
2019 |
|
|
|
|
|
|
- |
|
2020 |
|
|
|
|
|
|
- |
|
2021 |
|
|
|
|
|
|
- |
|
Thereafter |
|
|
|
|
|
|
- |
|
|
|
|
|
|
|
$ |
295,721 |
|
|
|
|
|
|
|
|
|
As previously reported in the Company’s Current Report on Form 8-K dated November 14, 2014, pursuant to the Second Supplemental Indenture, dated as of November 14, 2014 (the “Second Supplemental Indenture”), by and among the Company, certain subsidiaries of the Company party thereto as guarantors and Wilmington Trust, National Association, as trustee, the Company obtained an extension of the time permitted to deliver the requisite financial information for the quarter ended September 30, 2014 and, subject to payment by the Company of an additional consent fee (as described in the Supplemental Indenture), for the year ended December 31, 2014. The Company paid this additional consent fee on March 31, 2015. In total, the Company paid $708,855 in consent fees to holders of the Senior Notes in connection with the execution and effectiveness of the Second Supplemental Indenture. As previously reported in the Company’s Current Report on Form 8-K dated May 15, 2015, pursuant to the Third Supplemental Indenture, dated as of May 11, 2015 (the “Third Supplemental Indenture”), by and among the Company, certain subsidiaries of the Company party thereto as guarantors and Wilmington Trust, National Association, as trustee, the Company obtained an extension of the time permitted to deliver the requisite financial information for the quarters ended September 30, 2014 and March 31, 2015 and for the year ended December 31, 2014. In total, the Company paid $374,000 in consent fees to holders of the Senior Notes in connection with the execution and effectiveness of the Third Supplemental Indenture.
Our Senior Notes Indenture and Revolving Credit Facility generally permit us to apply the net cash proceeds of approximately $130.0 million from the sale of our Insurance business to prepay outstanding debt and/or invest in assets useful to our business, in each case, within 365 days of our receipt of such net cash proceeds (subject, in the case of any investment, to a further 180-day extension under certain circumstances). If we do not apply such net cash proceeds in the manner and within the time period described above and the amount of unapplied net cash proceeds exceeds $10.0 million, we will be required to offer to purchase a portion of our outstanding Senior Notes using those unapplied net cash proceeds at an offer price equal to 100% of the principal amount of the Senior Notes, plus accrued and unpaid interest, if any, up to but not including, the date of purchase. As of December 31, 2016, it was determined that there were less than $10.0 million in unused net cash proceeds from the sale of our Insurance business that had not been applied as described above.
Revolving Credit Facility
In August 2013, the Company entered into a $70.0 million revolving facility (“Revolving Credit Facility”), maturing May 17, 2018, among the Company, as borrower, certain subsidiaries of the Company, as guarantors (the “Guarantors”), the lenders party thereto (the “Lenders”), Royal Bank of Canada, as administrative agent, and the other parties thereto. The proceeds of any loans made under the Revolving Credit Facility can be used for ongoing working capital requirements and other general corporate purposes, including the financing of capital expenditures and acquisitions.
Borrowings under the Revolving Credit Facility bear interest at a rate per annum equal to, at the Company’s option, either (i) an alternate base rate (as defined in the Revolving Credit Facility) or (ii) an adjusted LIBO rate (as defined in the Revolving Credit Facility), each calculated in a customary manner, plus applicable margin. The applicable margin is 3.00% per annum with respect to alternate base rate loans and 2.00% per annum with respect to adjusted LIBO rate loans. In addition to paying interest on the outstanding principal amount of borrowings under the Revolving Credit Facility, the Company must pay a commitment fee to the Lenders in respect of their average daily unused amount of revolving commitments at a rate that ranges from 0.375% to 0.500% per annum depending on the Company’s consolidated total leverage ratio. These commitment fees are recorded in interest expense. The Company may voluntarily prepay loans under the Revolving Credit Facility at any time without premium or penalty (subject to customary “breakage” fees in the case of Eurodollar rate loans).
The Revolving Credit Facility contains customary affirmative and negative covenants (including, but not limited to, covenants restricting the payment of dividends and incurrence of additional indebtedness) and events of default and requires the Company to comply with a maximum consolidated total leverage ratio of 4.00:1.00 as of the last day of any quarter only if the aggregate amount (without duplication) of letters of credit (other than letters of credit that are issued and not drawn to the extent such letters of credit are cash collateralized) and loans outstanding under the Revolving Credit Facility exceed, on a pro forma basis, 30% of the total revolving commitments of all Lenders at such time. The Company was in compliance with all required covenants as of December 31, 2016.
All obligations under the Revolving Credit Facility are guaranteed by the Guarantors and are secured, subject to certain exceptions, by first priority liens on the assets of the Company and the Guarantors.
Interest expense for the commitment fees and amortization of deferred financing costs related to the Revolving Credit Facility were as follows:
|
|
|
|
|
|
|
|
|
|
|
|
|
|
|
|
|
|
|
|
|
|
|
|
|
|
|
|
Year ended |
|||||||
|
(in thousands) |
|
|
December 31, 2016 |
|
December 31, 2015 |
|
December 31, 2014 |
|||
|
Interest expense |
|
|
$ |
341 |
|
$ |
298 |
|
$ |
353 |
|
Deferred financing costs |
|
|
|
339 |
|
|
339 |
|
|
339 |
|
|
|
|
|
|
|
|
|
|
|
|
The following deferred loan fees related to the Revolving Credit Facility remain to be amortized:
|
|
|
|
|
|
|
|
|
|
|
|
|
|
|
|
|
|
|
(in thousands) |
|
|
December 31, 2016 |
|
December 31, 2015 |
||
|
Deferred financing costs |
|
|
$ |
450 |
|
$ |
754 |
|
|
|
|
|
|
|
|
|
As of December 31, 2016, the Company had $69.4 million available capacity for borrowing under the Revolving Credit Facility and there were $593,000 in letters of credit issued against the facility.
On November 6, 2014, the Company announced it had obtained a waiver under the Revolving Credit Facility with respect to compliance with its obligation to deliver the requisite financial information thereunder for the quarter ended September 30, 2014. On March 24, 2015, the Company announced it had obtained a waiver under the Revolving Credit Facility with respect to compliance with its obligation to deliver the requisite financial information thereunder for the year ended December 31, 2014. On May 11, 2015, the Company announced it had obtained a waiver under the Revolving Credit Facility with respect to compliance with its obligation to deliver the requisite financial information thereunder for the quarter ended March 31, 2015. The Company did not pay a consent fee to the lenders under the Revolving Credit Facility in connection with any of the foregoing waivers.
NOTE 12 – ACQUISITIONS
Year Ended 2016
On June 17, 2016, we completed the acquisition of certain assets of Next Advisor, Inc. (the “Acquired NextAdvisor Business”), an online source of research and reviews of credit cards, personal finance and internet services. This acquisition was made to accelerate our business, broaden our reach and increase ways to engage consumers looking for credit cards. The results of operations of the Acquired NextAdvisor Business are being reported in our Credit Cards segment and are included in our consolidated results from the acquisition date. The acquisition is accounted for as a business combination. The acquisition accounting is preliminary and subject to change as third party valuations are not finalized.
The Company paid $63.4 million at closing, recorded $37.3 million of deferred contingent consideration, and placed $11.9 million into escrow as a deferred payment and to serve as recourse for indemnity obligations. An additional $1.3 million was paid to the seller subsequent to the closing date related to net working capital adjustments. The deferred payment is recorded in other current assets and is being amortized into compensation expense over the period earned. As of December 31, 2016, approximately $4.0 million was paid from escrow to the seller.
The transaction called for cash consideration as well as a series of contingent payments based on the achievement of Adjusted EBITDA targets. We have estimated contingent payments, which are classified as purchase consideration if made or due to the seller and as compensation if made to current employees. As part of the purchase price, the Company recorded a $37.3 million liability on the date of acquisition for the deferred contingent consideration due to seller based upon the net present value of the Company’s estimate of the future payments. Subsequent measurements are made using the same methodology. This fair value measurement represents a Level 3 measurement as it is based on significant inputs not observable in the market. Significant judgment is employed in determining the appropriateness of these assumptions as of the acquisition date. This contingent consideration has a maximum potential earnout of approximately $134.1 million if all related targets are achieved, and is payable in either cash or shares of the Company’s stock. Subsequent changes to the fair value of the contingent acquisition consideration are recorded as changes in fair value of contingent acquisition consideration; see Note 7 – Fair Value Measurement.
We recorded approximately $67.9 million in goodwill, which reflects the adjustments necessary to allocate the purchase price to the fair value of the assets acquired and the liabilities assumed and represents the expected future economic benefits from future growth arising from the Acquired NextAdvisor Business’s scale and expertise in driving traffic via sponsored content, benefits expected from using that expertise to drive traffic to other Bankrate-owned websites, and future economic benefits arising from other assets acquired that could not be individually identified and separately recognized. We expect goodwill will be deductible for income tax purposes. The valuations used to determine the preliminary estimated fair value of the intangible assets and the resulting goodwill in the purchase price allocation principally use the discounted cash flow methodology and were made concurrent with the effective date of the acquisition. Intangible assets including trademarks and internet domain name, customer relationships, and the non-compete covenant were valued using the income approach, and the developed technology was valued using cost methodology. Approximately $30.0 million was recorded as intangible assets with estimated weighted average useful lives of 7 years, consisting of customer relationships for $22.2 million, trademarks and internet domain name for $6.2 million, non-compete covenant for $1.4 million and developed technology for $150,000. The current assets and receivables acquired and the current liabilities assumed were valued at cost, which approximates fair value.
The following table presents the preliminary, estimated fair value of assets acquired and liabilities assumed at the acquisition date:
|
|
|
|
|
|
|
|
|
|
Acquisition Date |
|
|
(In thousands) |
Estimated Fair Value |
|
|
Prepaid expenses and other current assets |
$ |
43 |
|
Receivables |
|
8,409 |
|
Intangible assets |
|
30,018 |
|
Total identifiable assets acquired |
|
38,470 |
|
|
|
|
|
Current liabilities |
|
4,342 |
|
Total liabilities assumed |
|
4,342 |
|
Net assets acquired |
|
34,128 |
|
Goodwill |
|
67,893 |
|
Purchase price |
$ |
102,021 |
Included in the amounts and table above, are adjustments recorded subsequent to the acquisition for approximately $1.5 million, primarily for post-closing working capital adjustments and changes in the valuation of acquired assets.
The estimated weighted average amortization periods for intangible assets recorded in the acquisition are as follows:
|
|
|
|
|
|
|
Weighted Average |
|
|
|
Amortization Period |
|
|
|
(Years) |
|
Trademarks and domain names |
|
5.0 |
|
Customer relationships |
|
8.0 |
|
Developed technology |
|
2.0 |
|
Non-compete covenant |
|
3.0 |
The amounts of revenue, net income and adjusted EBITDA generated from the date of acquisition through December 31, 2016 by the Acquired NextAdvisor Business included in our consolidated statement of comprehensive income (loss) are approximately $29.1 million, $5.3 million and $7.8 million, respectively.
Unaudited pro forma revenue, net income, weighted average shares and net income (loss) of the Company, assuming the Acquired NextAdvisor Business occurred January 1, 2015, for the year ended December 31, 2016 and 2015:
|
|
|
|
|
|
|
|
|
|
|
Year ended |
||||
|
|
|
December 31, |
|
December 31, |
||
|
(In thousands, except share and per share data) |
|
2016 |
|
2015 |
||
|
Total revenue |
|
$ |
460,954 |
|
$ |
439,632 |
|
Net income (loss) |
|
$ |
(28,259) |
|
$ |
8,731 |
|
Weighted average shares: |
|
|
|
|
|
|
|
Basic |
|
|
89,531,542 |
|
|
97,988,092 |
|
Diluted |
|
|
89,531,542 |
|
|
100,073,688 |
|
Earnings (loss) per share: |
|
|
|
|
|
|
|
Basic |
|
$ |
(0.32) |
|
$ |
0.09 |
|
Diluted |
|
$ |
(0.32) |
|
$ |
0.09 |
|
|
|
|
|
|
|
|
The Acquired NextAdvisor Business results for 2015 included in the pro forma table above include a limited, one-time credit card marketing program benefit that was not expected to reoccur in 2016, and which was taken into account and discounted in the acquisition modeling.
Year Ended 2015
On April 1, 2015 we acquired Quizzle, LLC and during 2015 we also acquired certain assets and assumed certain liabilities of certain other entities. The acquisitions are not individually significant to the Company’s net assets and results of operations. These acquisitions had an aggregate purchase price of $40.3 million, including $6.9 million in fair value of deferred payments and $2.7 million in fair value of contingent acquisition consideration. The acquisitions were accounted for under purchase accounting and are included in our consolidated results from the acquisition dates. The financial results of the acquired businesses are immaterial individually and in aggregate to our net assets and results of operations. We recorded $21.8 million in goodwill and $19.2 million of intangible assets related to these acquisitions with estimated weighted average useful lives of 10 years, consisting of approximately $11.5 million of developed technologies, approximately $4.6 million of trademarks and domain names and approximately $3.1 million of customer relationships. We expect approximately $19.4 million of goodwill to be deductible for income tax purposes. During the year ended December 31, 2015, since each respective date of acquisition, these acquisitions contributed revenue of approximately $7.6 million.
During 2016, we recorded goodwill and intangible asset impairments to our pre-realigned Quizzle reporting unit. See Note 4 – Goodwill and Intangible Assets.
Year Ended 2014
Acquisition of Caring, Inc.
On May 1, 2014, we acquired Caring, Inc. for $53.7 million, net of cash acquired, and $4.3 million was placed in escrow to satisfy certain indemnification obligations of Caring’s shareholders. All escrow payments have been made. We recorded approximately $23.0 million in goodwill, which reflects the adjustments necessary to allocate the purchase price to the fair value of the assets acquired and the liabilities assumed. We expect goodwill will not be deductible for income tax purposes. Approximately $29.5 million was recorded as intangible assets with estimated weighted average useful lives of 9 years, consisting of an Internet domain name for $14.6 million, customer relationships for $9.9 million, and developed technologies for $5.0 million. Caring was a privately held company and the owner of Caring.com, a leading senior care resource for those seeking information and support as they care for aging family members and loved ones. This acquisition was made to complement our online publishing business and to enter a new product vertical. The results of operations of Caring are included in our consolidated results from the acquisition date. The acquisition is accounted for as a business combination.
During 2016, we recorded a goodwill impairment to our Senior Care reporting unit. See Note 4 – Goodwill and Intangible Assets.
Acquisition of Wallaby Financial Inc.
On December 1, 2014, we acquired Wallaby Financial Inc. for $10.0 million. The financial results of Wallaby are immaterial to our net assets and results of operations. The acquisition was accounted for as a purchase and included in our consolidated results from the acquisition date. We recorded $6.1 million in goodwill and $3.9 million in intangible assets related to the acquisition, consisting of $3.6 million of developed technologies and $250,000 of trademarks with estimated weighted average useful lives of 5 years. We expect goodwill will not be deductible for income tax purposes.
Other
During the year ended December 31, 2014, we acquired certain assets and assumed certain liabilities of a third party for a purchase price of approximately $9.9 million, including $1.9 million of contingent acquisition consideration. The acquisition is immaterial to our net assets and results of operations. The acquisition was accounted for as a purchase and is included in our consolidated results of operations from the acquisition date. We recorded $30,000 in goodwill and approximately $9.9 million in intangible assets with a weighted average useful life of 7 years, consisting of trademarks and domain names. We expect goodwill to be deductible for income tax purposes.
NOTE 13 – RESTRUCTURING
In 2015, management adopted a restructuring plan with respect to our corporate and banking segment finance operations aligned with our commitment to implement best practices, enhance internal controls and drive efficiency throughout the finance function by improving processes, separating corporate and business unit functions, and consolidating finance teams at a single location. During the same period, management also adopted a restructuring plan consisting of certain changes in corporate and business unit leadership in connection with further aligning Company leadership with our strategic initiatives. As part of this process, we formally communicated the termination of employment to approximately 15 employees, all of whom have been terminated. The costs associated with these initiatives primarily represented modifications of share based awards, severance, outplacement services and other costs associated with employee terminations, the majority of which have been settled in shares and cash. All restructuring costs were recorded as a Corporate expense, within the Other segment. As of December 31, 2016, no further liability remains related to this action.
|
|
|
|
|
|
|
|
|
|
Year ended |
|
|
|
December 31, 2016 |
|
|
(In thousands) |
|
|
|
Balance at January 1, 2015 |
$ |
- |
|
Restructuring charges |
|
5,616 |
|
Utilized |
|
(3,450) |
|
Balance at December 31, 2015 |
|
2,166 |
|
Restructuring charges and adjustments, net |
|
(117) |
|
Utilized |
|
(2,049) |
|
Balance at December 31, 2016 |
$ |
- |
|
|
|
|
NOTE 14 – DISCONTINUED OPERATION
In 2015 we sold our Insurance business, which constituted (i) all of the issued and outstanding capital stock of NetQuote Holdings, Inc. and (ii) all of the issued and outstanding limited liability interests of IQ Holdings, LLC, for a purchase price comprised of (i) $140.0 million in cash at closing, plus $200,000 for cash to remain at the Insurance business companies, and (ii) $23.1 million to be paid to us on the second anniversary of the closing date. The Insurance business comprised our Insurance reporting segment. The sale will allow us to focus on our core Credit Cards and Banking businesses and the growth opportunities in the Senior Care vertical. For the years ended December 31, 2015 and 2014, the results of this component have been classified as a discontinued operation through the date of sale. We realized a $9.1 million loss on the sale of the business ($8.6 million gain, net of tax), which is recognized in net loss from discontinued operation on the consolidated statement of comprehensive income (loss).
During the fourth quarter of 2015, we completed our analysis regarding being subject to sales taxes related to sourcing of certain revenue streams in one of its operating segments in certain state jurisdictions. For the year ended December 31, 2015, we recorded an $11.9 million charge within our Insurance business, which is presented as a discontinued operation in the consolidated financial statements. The majority of these sales taxes were paid as of December 31, 2015. We have indemnified the buyer of its Insurance business against this liability and as of December 31, 2015 had accrued approximately $1.9 million within other current liabilities for this sales tax liability.
During the year ended December 31, 2016, we incurred a $96,000 net loss in discontinued operation related to the previous disposal of the Insurance business. This activity primarily relates to legal and other post-closing expenses, partially offset by reimbursements from several states for previous sales tax remittances.
The following tables present the major classes of line items constituting pretax income (loss) of discontinued operation and reconcile to the net income (loss) of the discontinued operation that are presented in the consolidated statement of comprehensive income (loss):
|
|
|
|
|
|
|
|
|
|
|
|
|
|
|
|
|
|
|
|
|
|
|
Year ended December 31, |
|
|||||
|
|
|
|
|
|
|
|
|
|
|
(In thousands) |
|
2015 |
|
2014 |
|
|
||
|
Revenue |
|
$ |
176,184 |
|
$ |
194,639 |
|
|
|
|
|
|
|
|
|
|
|
|
|
Costs and expenses: |
|
|
|
|
|
|
|
|
|
Cost of revenue |
|
|
127,592 |
|
|
142,590 |
|
|
|
Other expenses |
|
|
101,425 |
|
|
54,521 |
|
|
|
Operating expenses |
|
|
229,017 |
|
|
197,111 |
|
|
|
Loss before taxes |
|
|
(52,833) |
|
|
(2,472) |
|
|
|
Income tax benefit |
|
|
(14,079) |
|
|
(625) |
|
|
|
Net loss from discontinued operation |
|
|
(38,754) |
|
|
(1,847) |
|
|
|
|
|
|
|
|
|
|
|
|
|
Loss on sale of discontinued operation |
|
|
(9,114) |
|
|
- |
|
|
|
Income tax benefit |
|
|
(17,680) |
|
|
- |
|
|
|
Net gain on sale of discontinued operation |
|
|
8,566 |
|
|
- |
|
|
|
Net loss on discontinued operation |
|
$ |
(30,188) |
|
$ |
(1,847) |
|
|
|
|
|
|
|
|
|
|
|
|
The following tables present the major cash flow components of discontinued operation:
|
|
|
|
|
|
|
|
|
|
|
|
|
|
|
|
|
|
|
|
|
Year ended December 31, |
|
||||
|
(In thousands) |
|
2015 |
|
2014 |
|
||
|
Depreciation |
|
$ |
4,314 |
|
$ |
3,452 |
|
|
Amortization |
|
|
20,727 |
|
|
21,035 |
|
|
Goodwill impairment |
|
|
35,000 |
|
|
- |
|
|
Stock compensation expense |
|
|
3,864 |
|
|
3,197 |
|
|
Capital expenditures |
|
|
5,328 |
|
|
5,134 |
|
|
|
|
|
|
|
|
|
|
NOTE 15 – QUARTERLY FINANCIAL DATA (unaudited)
Provided below are selected unaudited quarterly financial data for 2016 and 2015. The information has been derived from our unaudited condensed consolidated financial statements. In the opinion of management, the unaudited condensed consolidated financial statements have been prepared on a basis consistent with the consolidated financial statements which appear elsewhere in this Annual Report on Form 10-K and include all adjustments necessary for a fair statement of the financial position and results of operations for such unaudited periods. Historical results are not necessarily indicative of results to be expected in the future.
The earnings per share information is calculated independently for each quarter based on the weighted average common stock and common stock equivalents outstanding, which may fluctuate, based on factors such as the number of shares in a period that are issued, vest, or repurchased, our quarterly income levels and our stock’s market prices. Therefore, the sum of the quarters’ per share information may not equal the annual amount presented on the consolidated statements of operations.
|
|
|
|
|
|
|
|
|
|
|
|
|
|
|
|
|
|
|
|
|
|
|
|
|
|
|
|
|
|
|
|
|
|
|
|
|
|
|
|
|
|
|
|
|
|
|
|
|
|
|
|
Three months ended |
|
Three months ended |
||||||||||||||||||||
|
(In thousands) |
3/31/2016 (a) |
|
6/30/2016 (b)(g) |
|
9/30/2016 (c) |
|
12/31/2016 (d)(g) |
|
3/31/2015 |
|
6/30/2015 |
|
9/30/2015 (e) |
|
12/31/2015 (f) |
||||||||
|
Revenue |
$ |
93,478 |
|
$ |
98,302 |
|
$ |
128,798 |
|
$ |
113,583 |
|
$ |
89,226 |
|
$ |
89,333 |
|
$ |
99,659 |
|
$ |
93,746 |
|
Net income (loss) continuing operations |
$ |
722 |
|
$ |
(41,309) |
|
$ |
10,782 |
|
$ |
(4,233) |
|
$ |
4,382 |
|
$ |
2,112 |
|
$ |
5,665 |
|
$ |
4,683 |
|
Net income (loss) discontinued operation |
$ |
(439) |
|
$ |
353 |
|
$ |
(96) |
|
$ |
86 |
|
$ |
571 |
|
$ |
(1,792) |
|
$ |
(29,056) |
|
$ |
89 |
|
Net income (loss) |
$ |
283 |
|
$ |
(40,956) |
|
$ |
10,686 |
|
$ |
(4,147) |
|
$ |
4,953 |
|
$ |
320 |
|
$ |
(23,391) |
|
$ |
4,772 |
|
|
|
|
|
|
|
|
|
|
|
|
|
|
|
|
|
|
|
|
|
|
|
|
|
|
Basic and diluted net income (loss) per share: |
|
|
|
|
|
|
|
|
|
|
|
|
|
|
|
|
|
|
|
|
|
|
|
|
Net income (loss) continuing operations: |
|
|
|
|
|
|
|
|
|
|
|
|
|
|
|
|
|
|
|
|
|
|
|
|
Basic |
$ |
0.01 |
|
$ |
(0.47) |
|
$ |
0.12 |
|
$ |
(0.05) |
|
$ |
0.04 |
|
$ |
0.02 |
|
$ |
0.06 |
|
$ |
0.05 |
|
Diluted |
$ |
0.01 |
|
$ |
(0.47) |
|
$ |
0.12 |
|
$ |
(0.05) |
|
$ |
0.04 |
|
$ |
0.02 |
|
$ |
0.06 |
|
$ |
0.05 |
|
|
|
|
|
|
|
|
|
|
|
|
|
|
|
|
|
|
|
|
|
|
|
|
|
|
Net income (loss) discontinued operation |
|
|
|
|
|
|
|
|
|
|
|
|
|
|
|
|
|
|
|
|
|
|
|
|
Basic |
$ |
(0.01) |
|
$ |
0.00 |
|
$ |
(0.00) |
|
$ |
0.00 |
|
$ |
0.01 |
|
$ |
(0.02) |
|
$ |
(0.30) |
|
$ |
0.00 |
|
Diluted |
$ |
(0.01) |
|
$ |
0.00 |
|
$ |
(0.00) |
|
$ |
0.00 |
|
$ |
0.01 |
|
$ |
(0.02) |
|
$ |
(0.28) |
|
$ |
0.00 |
|
|
|
|
|
|
|
|
|
|
|
|
|
|
|
|
|
|
|
|
|
|
|
|
|
|
Net income (loss): |
|
|
|
|
|
|
|
|
|
|
|
|
|
|
|
|
|
|
|
|
|
|
|
|
Basic |
$ |
0.00 |
|
$ |
(0.47) |
|
$ |
0.12 |
|
$ |
(0.05) |
|
$ |
0.05 |
|
$ |
0.00 |
|
$ |
(0.24) |
|
$ |
0.05 |
|
Diluted |
$ |
0.00 |
|
$ |
(0.47) |
|
$ |
0.12 |
|
$ |
(0.05) |
|
$ |
0.05 |
|
$ |
0.00 |
|
$ |
(0.23) |
|
$ |
0.05 |
|
|
|
|
|
|
|
|
|
|
|
|
|
|
|
|
|
|
|
|
|
|
|
|
|
__________
|
(a) |
The first quarter 2016 includes an $851,000 insurance claim that was reimbursed for a previously settled and paid legal settlement. |
|
(b) |
Results for the second quarter 2016 include the NextAdvisor acquisition; a $20.0 million expense for a proposed settlement of the private securities class action lawsuit pending against the Company (approximately 70% of which to be funded by insurers); and a $25.0 million impairment of goodwill in our Banking reporting unit. |
|
(c) |
Results for the third quarter 2016 include a benefit of $13.8 million for insurance proceeds for the proposed settlement of the private securities class action lawsuit against the Company; a $4.2 million estimated impairment of goodwill in our Quizzle reporting unit; and an expense of $2.9 million for a change in estimate as part of the change in fair value of contingent acquisition consideration. |
|
(d) |
Results the fourth quarter 2016 include a $2.4 million impairment of goodwill and a $7.5 million impairment of intangible assets in our Quizzle reporting unit; a $4.0 million impairment of goodwill in our Senior Care reporting unit; and a benefit of $10.6 million for a change in estimate as part of the change in fair value of contingent acquisition consideration. |
|
(e) |
Results for the third quarter 2015 include a $35.0 million impairment of goodwill in the former Insurance reporting unit, which is classified as a discontinued operation. |
|
(f) |
During the fourth quarter 2015, we completed the sale of our Insurance business and recorded a loss on sale within loss on discontinued operation. |
|
(g) |
As we incurred a net loss from continuing operations for this period, all outstanding stock options, restricted and performance stock awards have an anti-dilutive effect and therefore are excluded from the computation of diluted weighted average shares outstanding. Accordingly, basic and dilutive weighted average shares outstanding are equal for such period. |
16
None
Evaluation of Disclosure Controls and Procedures
We have established disclosure controls and procedures to ensure that material information relating to the Company is made known to the officers who certify the Company’s financial reports and to other members of senior management and the board of directors.
Management, with the participation of our Chief Executive Officer and our Chief Financial Officer, evaluated the effectiveness of our disclosure controls and procedures as of December 31, 2016. The term “disclosure controls and procedures,” as defined in Rules 13a-15(e) and 15d-15(e) under the Securities Exchange Act of 1934, as amended, or the Exchange Act, means controls and other procedures of a company that are designed to ensure that information required to be disclosed by a company in the reports that it files or submits under the Exchange Act is recorded, processed, summarized and reported, within the time periods specified in the SEC’s rules and forms. Disclosure controls and procedures include, without limitation, controls and procedures designed to ensure that information required to be disclosed by a company in the reports that it files or submits under the Exchange Act is accumulated and communicated to the company’s management, including its principal executive and principal financial officers, as appropriate to allow timely decisions regarding required disclosure.
Management, including our Chief Executive Officer and Chief Financial Officer, does not expect our disclosure controls and procedures will prevent all errors and all fraud. A control system, no matter how well designed and operated, can provide only reasonable, not absolute, assurance that the objectives of the control system are met. Further, the design of a control system must reflect the fact that there are resource constraints, and the benefits of controls must be considered relative to their costs. Because of the inherent limitations in all control systems, no evaluation of internal controls can provide absolute assurance that all control issues and instances of fraud, if any, have been detected. Also, any evaluation of the effectiveness of controls in future periods are subject to the risk that those internal controls may become inadequate because of changes in business conditions, or that the degree of compliance with the policies or procedures may deteriorate.
Based on the evaluation of our disclosure controls and procedures as of December 31, 2016, our CEO and CFO concluded that our disclosure controls and procedures were not effective at a reasonable assurance level as of December 31, 2016 as a result of the material weakness in Company’s internal control described below.
Management’s Report on Internal Control over Financial Reporting
Our management is responsible for establishing and maintaining adequate internal control over financial reporting, as such term is defined in Rule 13a-15(f) of the Securities Exchange Act of 1934. Our management, including our CEO and CFO, assessed the effectiveness of Bankrate's internal control over financial reporting as of December 31, 2016 based on the framework in the 2013 Internal Control—Integrated Framework, issued by the Committee of Sponsoring Organizations of the Treadway Commission (COSO). Based on the results of the assessment, we concluded that there was a material weakness in the operating effectiveness of our internal control over financial reporting, as described below under “Description of material weakness”.
The scope of management’s assessment of the effectiveness of our internal controls over financial reporting included all of our consolidated operations except for the operations of NextAdvisor, which we acquired in the second quarter of 2016. NextAdvisor’s operations represented approximately 10% of our consolidated total assets and approximately 7% of our consolidated net revenues as of and for the year ended December 31, 2016.
Management has concluded that, notwithstanding the material weakness described below, the Company’s consolidated financial statements in this Form 10-K fairly present in all material respects our financial condition, results of operations and cash flows in conformity with GAAP.
The effectiveness of our internal control over financial reporting as of December 31, 2016 has been audited by Grant Thornton LLP, an independent registered public accounting firm as stated in their report which appears in Item 8 of this Annual Report on Form 10-K.
Description of material weakness. A material weakness is a deficiency, or combination of deficiencies, in internal control over financial reporting such that there is a reasonable possibility that a material misstatement of our annual or interim financial statements will not be prevented or detected on a timely basis.
In our Annual Reports on Form 10-K for the years ended December 31, 2014 and December 31, 2015, we identified certain deficiencies related to (1) our control environment and (2) our controls over certain of our accounting processes (our “Prior Material Weakness”). Following the end of the fourth quarter of 2016, we completed our testing of internal controls over financial reporting and determined that controls and procedures over the areas affected by the Prior Material Weakness were operating effectively. Management has therefore concluded that the Prior Material Weakness has been remediated as of December 31, 2016.
However, in connection with our acquisition accounting for our 2016 acquisition of the NextAdvisor business, and in our accounting for the impairment of finite lived assets in the 2016 fiscal year in our Quizzle business, management and our independent registered public accounting firm identified a material weakness in our internal controls. Specifically, information used for a key input in the valuation of the contingent consideration liability by a third party valuation specialist in connection with the NextAdvisor acquisition was not updated on a timely basis, which resulted from a control failure in the process for validating the key inputs. In addition, a calculation error was discovered in the valuation report prepared by a third party valuation specialist that was a key input in the valuation of the impairment of finite lived assets and goodwill of our Quizzle business. Following identification of these issues, management recorded the necessary adjustments and they are reflected in this Annual Report on Form 10-K. Although these errors did not result in a material misstatement of our current or prior period consolidated financial statements, the control deficiency around validating key inputs to the valuation reports created a reasonable possibility that a material misstatement of our financial statements would not have been prevented or detected on a timely basis. Accordingly, management has concluded that this control deficiency constitutes a material weakness.
Remediation. Following identification of this control deficiency, management is implementing modifications to better ensure that the Company has validated all inputs used for, and all calculations performed in, valuation reports prepared by third party valuation specialists. The material weakness in our internal control over financial reporting will not be considered remediated until these modifications are implemented, in operation for a sufficient period of time, tested, and concluded by management to be designed and operating effectively. In addition, as we continue to evaluate and work to improve our internal control over financial reporting, management may determine to take additional measures to address control deficiencies or determine to modify our remediation plan. Management will test and evaluate the implementation of these modifications during 2017 to ascertain whether they are designed and operating effectively to provide reasonable assurance that they will prevent or detect a material misstatement in the Company’s financial statements.
Changes in internal control over financial reporting
Other than changes related to completing the remediation actions outlined in our Annual Report on Form 10-K for the year ended December 31, 2015 under Item 9A, and subsequent Quarterly Reports under Item 4, for our Prior Material Weakness, there was no change in our internal control over financial reporting identified in connection with the evaluation required by Rule 13a-15(d) and 15d-15(d) of the Exchange Act that occurred during the quarter ended December 31, 2016 that has materially affected, or is reasonably likely to materially affect, our internal control over financial reporting.
17
|
PART III. |
The information required by this Item is incorporated by reference to the registrant’s proxy Statement for its 2017 Annual Meeting of Stockholders to be filed with the Securities and Exchange Commission within 120 days after the end of the fiscal year ended December 31, 2016.
The information required by this Item is incorporated by reference to the registrant’s proxy Statement for its 2017 Annual Meeting of Stockholders to be filed with the Securities and Exchange Commission within 120 days after the end of the fiscal year ended December 31, 2016.
|
Item 12. Security Ownership of Certain Beneficial Owners and Management and Related Stockholder Matters |
The information required by this Item is incorporated by reference to the registrant’s proxy Statement for its 2017 Annual Meeting of Stockholders to be filed with the Securities and Exchange Commission within 120 days after the end of the fiscal year ended December 31, 2016.
The information required by this Item is incorporated by reference to the registrant’s proxy Statement for its 2017 Annual Meeting of Stockholders to be filed with the Securities and Exchange Commission within 120 days after the end of the fiscal year ended December 31, 2016.
The information required by this Item is incorporated by reference to the registrant’s proxy Statement for its 2017 Annual Meeting of Stockholders to be filed with the Securities and Exchange Commission within 120 days after the end of the fiscal year ended December 31, 2016.
|
PART IV. |
Documents Filed as Part of This Report:
(1)Financial Statements.
See Index to Financial Statements under Item 8.
(2)Financial Statement Schedules.
All financial statement schedules have been omitted since the required information is not applicable or is included in the consolidated financial statements or notes thereto.
(3)Exhibits.
The exhibits to this report are listed below.
18
Pursuant to the requirements of Section 13 or 15(d) of the Securities Exchange Act of 1934, the registrant has duly caused this Annual Report on Form 10-K to be signed on its behalf by the undersigned, thereunto duly authorized, in the City of New York, State of New York.
Bankrate, Inc.
|
|
|
|
|||
|
Date: March 22, 2017 |
|
By: |
|
/s/ Steven D. Barnhart |
|
|
|
|
|
|
Steven D. Barnhart |
|
|
|
|
|
|
Senior Vice President and Chief Financial Officer |
|
Pursuant to the requirements of the Securities Exchange Act of 1934, this report has been signed below by the following persons in the capacities and on the dates indicated below.
|
|
|
|
|
|
|
Signature |
Title |
Date |
||
|
/s/ Kenneth S. Esterow Kenneth S. Esterow |
President, Chief Executive Officer and Director (Principal Executive Officer) |
March 22, 2017 |
||
|
/s/ Steven D. Barnhart Steven D. Barnhart |
Senior Vice President and Chief Financial Officer (Principal Financial Officer) |
March 22, 2017 |
||
|
/s/ Janet M. Gunzburg Janet M. Gunzburg |
Corporate Controller (Principal Accounting Officer) |
March 22, 2017 |
||
|
* Peter C. Morse |
Chairman of the Board and Director |
March 22, 2017 |
||
|
* Seth Brody |
Director |
March 22, 2017 |
||
|
* Michael J. Kelly |
Director |
March 22, 2017 |
||
|
* Sree Kotay |
Director |
March 22, 2017 |
||
|
* Christine Petersen |
Director |
March 22, 2017 |
||
|
* Richard J. Pinola |
Director |
March 22, 2017 |
||
|
* Mitch Truwit |
Director |
March 22, 2017 |
||
|
/s/ Steven D. Barnhart *Steven D. Barnhart Attorney-in-fact |
19
|
Exhibit Number |
Description |
||||
|
2.1 |
Equity Purchase Agreement, dated as of November 5, 2015 between Bankrate, Inc. and All Web Leads, Inc. (incorporated by reference to Exhibit 2.1 of the Company’s Annual Report on Form 10-K filed with the SEC on March 9, 2016) |
||||
|
2.2 |
Asset Purchase Agreement, dated as of May 5, 2016, by and among Bankrate, Inc., Next Advisor, Inc. and Robert E. Larson. (incorporated by reference to Exhibit 2.1 of the Company’s Current Report on Form 8-K filed with the SEC on June 23, 2016) |
||||
|
3.1 |
Second Amended and Restated Certificate of Incorporation of Bankrate, Inc. (incorporated by reference to the Company’s Registration Statement on Form S-8 (333-175000)) |
||||
|
3.2 |
Second Amended and Restated Bylaws of Bankrate, Inc. (incorporated by reference to the Company’s Registration Statement on Form S-8 (333-175000)) |
||||
|
4.1 |
Indenture, dated as of August 7, 2013, among the Company, the Guarantors and Wilmington Trust, National Association, as trustee (incorporated by reference to Exhibit 4.1 of the Company’s Current Report on Form 8-K filed with the SEC on August 13, 2013) |
||||
|
4.2 |
Form of common stock certificate of Bankrate, Inc. (incorporated by reference to Exhibit 4.7 of the Company’s Registration Statement on Form S-1 (333-173550)) |
||||
|
4.3 |
Form of VCOC Investors’ Rights Agreement (incorporated by reference to Exhibit 4.8 of the Company’s Registration Statement on Form S-1 (333-173550)) |
||||
|
4.4 |
Supplemental Indenture dated May 30, 2014 (incorporated by reference to Exhibit 4.1 of the Company’s Quarterly Report on Form 10-Q filed with the SEC on August 8, 2014) |
||||
|
4.5 |
Supplemental Indenture, dated as of November 14, 2014 among Bankrate, Inc., the guarantors party thereto and Wilmington Trust, National Association, as trustee, relating to the 6.125% Senior Notes due 2018 (incorporated by reference to Exhibit 4.1 of the Company’s Current Report on Form 8-K filed with the SEC on November 18, 2014) |
||||
|
4.6 |
Supplemental Indenture, dated as of May 11, 2015 among Bankrate, Inc., the guarantors party thereto and Wilmington Trust, National Association, as trustee, relating to the 6.125% Senior Notes due 2018. (incorporated by reference to Exhibit 4.1 of the Company’s Current Report on Form 8-K filed with the SEC on May 15, 2015) |
||||
|
10.1 |
Executive Agreement by and between Kenneth S. Esterow and Bankrate, Inc. (incorporated by reference to Exhibit 10.33 of Bankrate’s Current Report on Form 8-K filed with the SEC on September 6, 2013) |
||||
|
10.2 |
Amendment to Executive Agreement between Bankrate, Inc. and Kenneth S. Esterow, dated December 31, 2013 (incorporated by reference to Exhibit 10.15 to the Company’s Annual Report Form 10-K filed with the SEC on February 27, 2014) |
||||
|
10.3 |
Form of Stock Option Agreement (incorporated by reference to Exhibit 10.34 of the Company’s Quarterly Report on Form 10-Q filed with the SEC on November 7, 2013) |
||||
|
10.4 |
Form of Director Restricted Stock Agreement (incorporated by reference to Exhibit 10.11 of the Company’s Annual Report on Form 10-K filed with the SEC on June 18, 2015) |
||||
|
10.5 |
Fourth Amended and Restated Stockholders Agreement (incorporated by reference to the Company’s Registration Statement on Form S-1 (333-173550)). |
||||
|
10.6 |
Form of Lease Agreement between Echelon Holdings, Ltd. and Bankrate, Inc., dated March 14, 2013 (incorporated by reference to Exhibit 10.23 of the Company’s Quarterly Report on Form 10-Q filed with the SEC on August 8, 2013) |
||||
|
10.7 |
Bankrate, Inc. 2011 Equity Compensation Plan (incorporated by reference to the Company’s Registration Statement on Form S-8 (333-175000)) |
||||
|
10.8 |
Form of Director Indemnification Agreement between Bankrate, Inc., and members of the management (incorporated by reference to the Company’s Registration Statement on Form S-1 (333-173550)) |
||||
|
10.9 |
Revolving Credit Facility, dated as of August 7, 2013, among Bankrate, Inc., the Guarantors, the lenders party thereto, Royal Bank of Canada as administrative agent, and the other parties thereto (incorporated by reference to Exhibit 10.1 of the Company’s Current Report on Form 8-K filed with the SEC on August 13, 2013) |
||||
|
10.10 |
Letter Agreement, dated September 14, 2014, by and between Bankrate, Inc. and Steven D. Barnhart (incorporated by reference to Exhibit 10.1 of Company’s Current Report on Form 8-K filed with the SEC on September 15, 2014) |
||||
|
10.11 |
Executive Agreement between Bankrate, Inc. and Christopher Speltz, dated March 3, 2014 (incorporated by reference to Exhibit 10.2 of the Company’s Quarterly Report on Form 10-Q filed with the SEC on May 8, 2014) |
||||
|
10.12 |
Form of 2014 Restricted Stock Agreement (incorporated by reference to Exhibit 10.3 of the Company’s Quarterly Report on Form 10-Q filed with the SEC on May 8, 2014) |
||||
|
10.13 |
Form of 2014 Performance-Based Restricted Stock Agreement (incorporated by reference to Exhibit 10.4 of the Company’s Quarterly Report on Form 10-Q filed with the SEC on May 8, 2014) |
||||
|
10.14 |
Form of 2015 Restricted Stock Agreement (incorporated by reference to Exhibit 10.27 of the Company’s Annual Report on Form 10-K filed with the SEC on June 18, 2015) |
||||
|
10.15 |
Form of 2015 Performance-Based Restricted Stock Agreement (incorporated by reference to Exhibit 10.28 of the Company’s Annual Report on Form 10-K filed with the SEC on June 18, 2015) |
||||
|
10.16 |
Executive Agreement, dated March 12, 2015, between Steven D. Barnhart and Bankrate, Inc. (incorporated by reference to Exhibit 10.1 of Company’s Current Report on Form 8-K filed with the SEC on March 17, 2015) |
||||
|
10.17 |
Form of Lease Agreement between Broadway 52ND L.P. and Bankrate, Inc. dated March 15, 2016 |
||||
|
10.18 |
Form of Lease Agreement by and between 3801 PGA Acquisition Company and Bankrate, Inc., dated August 8, 2014 (incorporated by reference to Exhibit 10.31 of the Company’s Annual Report on Form 10-K filed with the SEC on June 18, 2015) |
||||
|
|
|
||||
|
10.19 |
Form of Bankrate, Inc. 2015 Equity Compensation Plan (incorporated by reference to the Company’s Registration Statement on Form S-8 filed with the SEC on August 26, 2015) |
||||
|
10.20 |
Bankrate, Inc. 2015 Short-Term Compensation Plan (incorporated by reference to Exhibit 10.2 of the Company’s Current Report on Form 8-K filed with the SEC on August 14, 2015) |
||||
|
10.21 |
Executive agreement between Bankrate, Inc. and Kenneth Scott Kim, dated September 14, 2015 (incorporated by reference to the Company’s September 30, 2015 Quarterly Report on Form 10-Q filed with the SEC on November 6, 2015) |
||||
|
10.22 |
Executive Employment Agreement, dated as of March 3, 2014, by and between Bankrate, Inc. and James R. Gilmartin |
||||
|
10.23 |
Letter Agreement, dated March 10, 2016, between Bankrate, Inc. and Ben Holding S.á r.l. (incorporated by reference to Exhibit 10.1 the Company’s Current Report on Form 10-Q filed with the SEC on May 9, 2016) |
||||
|
10.24 |
Form of 2016 Restricted Stock Unit Agreement (incorporated by reference to Exhibit 10.2 the Company’s Current Report on Form 10-Q filed with the SEC on May 9, 2016) |
||||
|
10.25 |
Form of 2016 Performance Share Unit Agreement (incorporated by reference to Exhibit 10.3 the Company’s Current Report on Form 10-Q filed with the SEC on May 9, 2016) |
||||
|
10.26 |
Registration Rights Agreement, dated as of June 17, 2016, by and between Bankrate, Inc. and Next Advisor, Inc. (incorporated by reference to Exhibit 10.1 the Company’s Current Report on Form 8-K filed with the SEC on June 23, 2016) |
||||
|
14.1 |
Code of Business Conduct and Ethics (incorporated by reference to the Company’s Current Report on Form 8-K filed with the SEC on January 22, 2016) |
||||
|
21.1 |
List of Subsidiaries of Bankrate, Inc. |
||||
|
23.1 |
Consent of Grant Thornton LLP |
||||
|
24.1 |
Power of Attorney |
||||
|
31.1 |
Certification of Chief Executive Officer, pursuant to Section 302 of the Sarbanes-Oxley Act of 2002 |
||||
|
31.2 |
Certification of Chief Financial Officer, pursuant to Section 302 of the Sarbanes-Oxley Act of 2002 |
||||
|
32.1 |
Certification of Chief Executive Officer, pursuant to 18 U.S.C. Section 1350, as Adopted pursuant to Section 906 of the Sarbanes-Oxley Act of 2002 |
||||
|
32.2 |
Certification of Chief Financial Officer, pursuant to 18 U.S.C. Section 1350, as Adopted pursuant to Section 906 of the Sarbanes-Oxley Act of 2002 |
||||
|
Ex. 101.INS |
XBRL Instance Document |
||||
|
Ex. 101.SCH |
XBRL Taxonomy Extension Schema Document |
||||
|
Ex. 101.CAL |
XBRL Taxonomy Extension Calculation Linkbase Document |
||||
|
Ex. 101.LAB |
XBRL Taxonomy Extension Label Linkbase Document |
||||
|
Ex. 101.PRE |
XBRL Taxonomy Extension Presentation Linkbase Document |
||||
|
Ex. 101.DEF |
XBRL Taxonomy Extension Definition Linkbase Document |
||||
20