Attached files
| file | filename |
|---|---|
| 8-K - 8-K - Zayo Group Holdings, Inc. | g8k_2017317.htm |
Exhibit 99.1
|
|
ELI Closing Invester Call Zayo Group Holdings, Inc. NYSE: ZAYO@ZayoGroup |

|
|
2 SafeHarbor Information contained in this presentation that is not historical by nature constitutes “forward-looking statements” which can be identified by the use of forward-looking terminology such as “believes,” “expects,” “plans,” “intends,” “estimates,” “projects,” “could,” “may,” “will,” “should,” or “anticipates” or the negatives thereof, other variations thereon or comparable terminology, or by discussions of strategy. No assurance can be given that future results expressed or implied by the forward-looking statements will be achieved and actual results may differ materially from those contemplated by the forward-looking statements. Such statements are based on management’s current expectations and beliefs and are subject to a number of risks and uncertainties that could cause actual results to differ materially from those expressed or implied by the forward-looking statements. These risks and uncertainties include, but are not limited to, those relating to Zayo Group Holdings, Inc.’s (“the Company” or “ZGH”) financial and operating prospects, current economic trends, future opportunities, ability to retain existing customers and attract new ones, outlook of customers, and strength of competition and pricing. In addition, there is risk and uncertainty in the Company’s acquisition strategy including our ability to integrate acquired companies and assets. Specifically there is a risk associated with our recent acquisitions, and the benefits thereof, including financial and operating results and synergy benefits that may be realized from these acquisitions and the timeframe for realizing these benefits. Other factors and risks that may affect our business and future financial results are detailed in the “Risk Factors” section of our Annual Report on Form 10-K filed with the Securities and Exchange Commission (“SEC”). We caution you not to place undue reliance on these forward-looking statements, which speak only as of their respective dates. We undertake no obligation to publicly update or revise forward-looking statements to reflect events or circumstances after releasing this supplemental information or to reflect the occurrence of unanticipated events, except as required by law. In addition to this presentation and our filings with the SEC, the Company provides a supplemental earnings presentation and a glossary of terms used throughout. All of which can be found under the investor section of the Company’s website at http://www.zayo.com/investors. |
|
|
Context ● ● ELI Transaction closed on March 1, 2017 Unlike Allstream, ELI was immediately integrated into Zayo’s operational performance ○ ○ ○ ○ Heavy geographic overlap Rapid collaboration on customer opportunities Quick progress on data, systems, and processes Day 1 organizational re-alignment ● Synergies will occur rapidly ○ ○ ○ ○ Revenue Network Operating Expense Capital Goal of this presentation is to provide transparency into near term post-synergy financial targets 3 |
|
|
As ELI is integrated, we will also: ● ● ● ● ● Advance our Communications Infrastructure strategy Finish Allstream and Viatel integrations Bolster sales resources by ~ Cement global-orientation of each Segment Retain emphasis on Measured Equity Value Creation ○ Reward pace (“Equity IRR”) of measured equity value creation, based on a constant EBITDA multiple Achieve through a combination of growth and cash flow generation ○ 4 |
|
|
Providing Dec17q Targets ● ● Traditionally, have not provided guidance Instead, have provided operational metrics with emphasis on leading indicators (e.g., Bookings and Net Installs) To achieve transparency in light of changes, will provide Dec17q targets, with updates in intervening quarters Post Dec17q, will return to solely providing operational metrics; targets will not be provided beyond Dec17q ● ● Achievement of targets is subject to execution risk and uncertainties 5 |
|
|
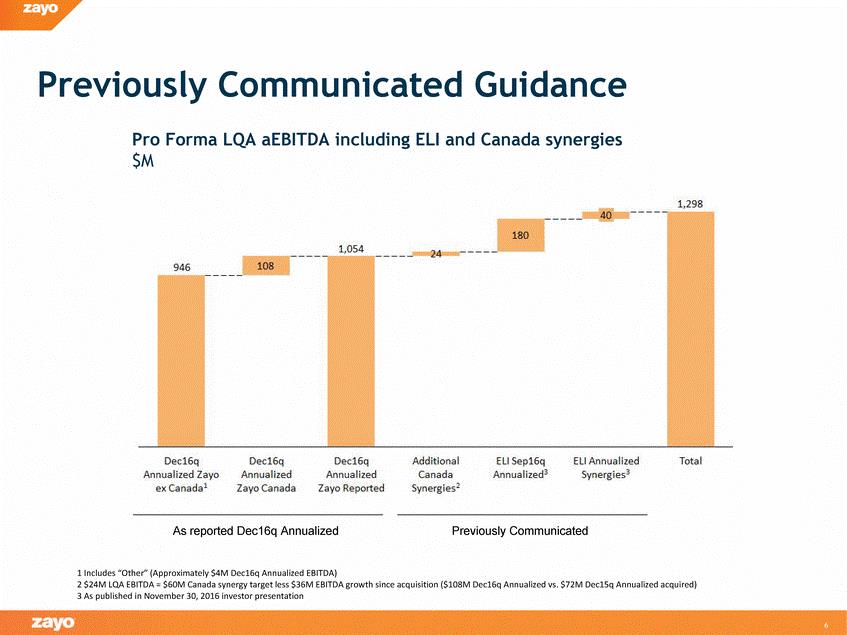
Previously Communicated Guidance Pro Forma LQA aEBITDA including ELI and Canada synergies $M 6 |
|
|
If most of the remaining synergies are achieved Dec17q, Annualized aEBITDA would be ~$1.3B by Pro Forma LQA aEBITDA including ELI and Canada synergies $M 7 |
|
|
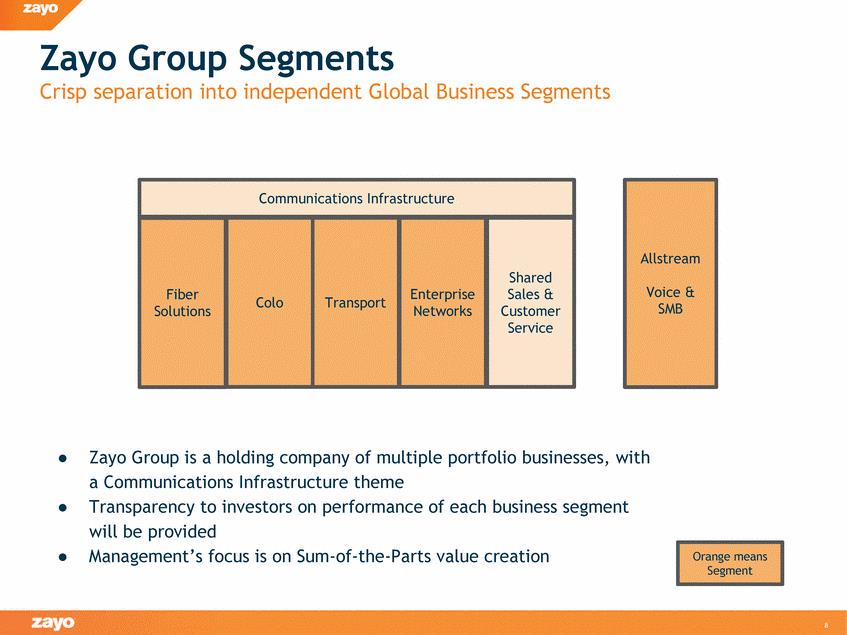
Zayo Group Segments Crisp separation into independent Global Business Segments SMB ● Zayo Group is a holding company of multiple portfolio businesses, with a Communications Infrastructure theme Transparency to investors on performance of each business segment will be provided Management’s focus is on Sum-of-the-Parts value creation ● ● 8 Orange means Segment Allstream Voice & Communications Infrastructure Fiber Solutions Colo Transport Enterprise Networks Shared Sales & Customer Service |
|
|
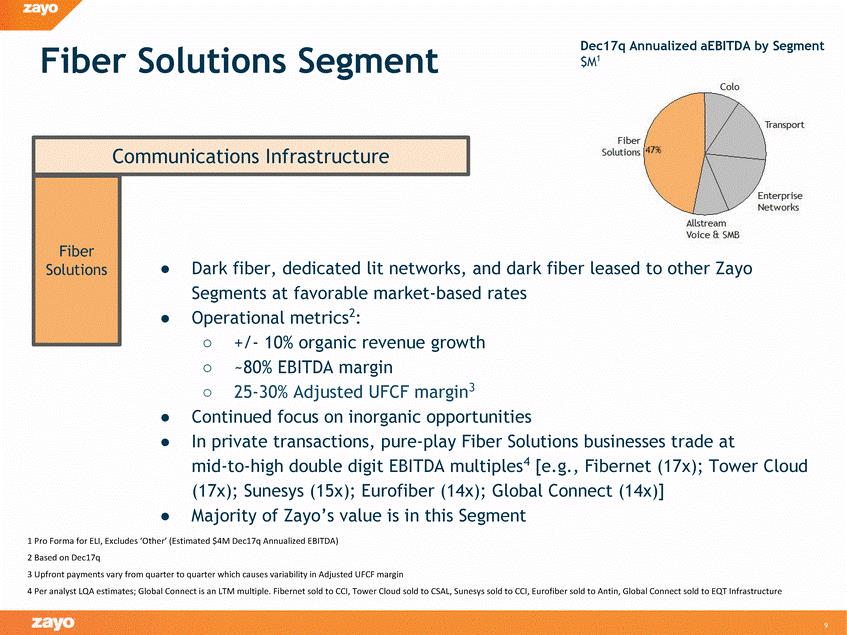
Dec17q Annualized aEBITDA by Segment Fiber Solutions Segment $M1 and dark fiber leased to other Zayo market-based rates ○ ○ ○ +/-10% organic revenue growth ~80% EBITDA margin 25-30% Adjusted UFCF margin3 ● ● Continued focus on inorganic opportunities In private transactions, pure-play Fiber Solutions businesses trade at mid-to-high double digit EBITDA multiples4 [e.g., Fibernet (17x); Tower Cloud (17x); Sunesys (15x); Eurofiber (14x); Global Connect (14x)] Majority of Zayo’s value is in this Segment ● 9 Communications Infrastructure Fiber Solutions ●Dark fiber, dedicated lit networks, Segments at favorable ●Operational metrics2: |
|
|
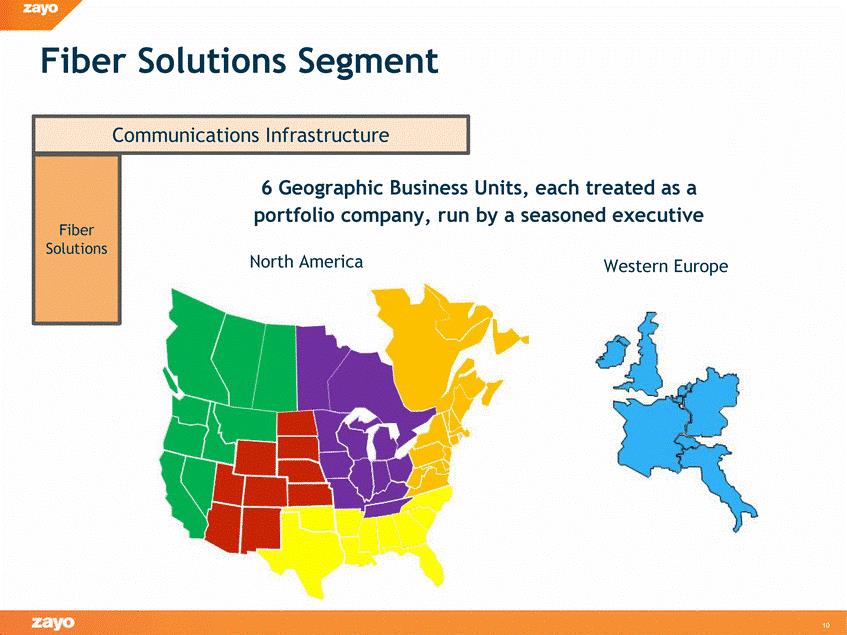
Fiber Solutions Segment Units, each treated as a by a seasoned executive Western Europe 10 Communications Infrastructure Fiber Solutions 6 Geographic Business portfolio company, run North America |
|
|
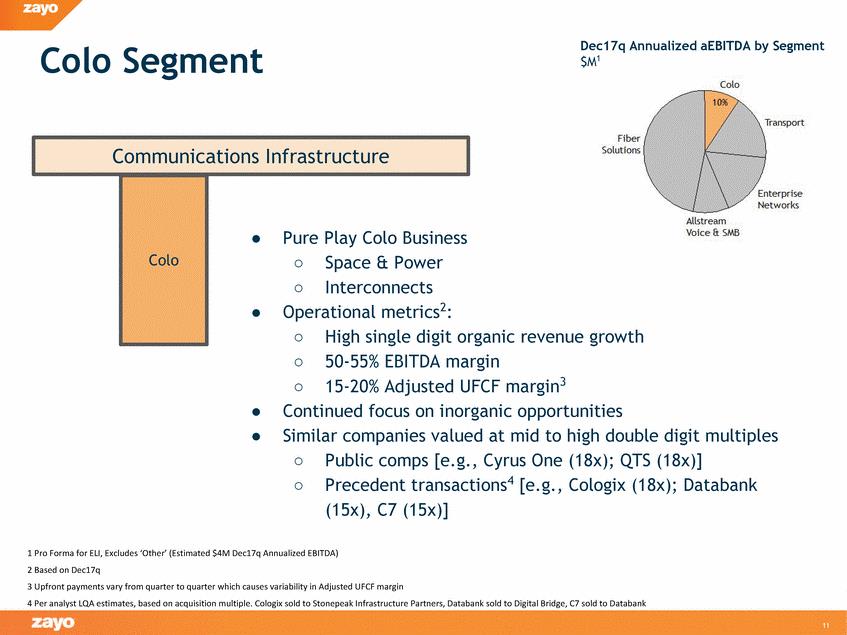
Dec17q Annualized aEBITDA by Segment Colo Segment $M1 organic revenue growth 50-55% EBITDA margin 15-20% Adjusted UFCF margin3 ○ ○ ● ● Continued focus on inorganic opportunities Similar companies valued at mid to high double digit multiples ○ ○ Public comps [e.g., Cyrus One (18x); QTS (18x)] Precedent transactions4 [e.g., Cologix (18x); Databank (15x), C7 (15x)] 11 Communications Infrastructure Colo ●Pure Play Colo Business ○Space & Power ○Interconnects ●Operational metrics2: ○High single digit |
|
|
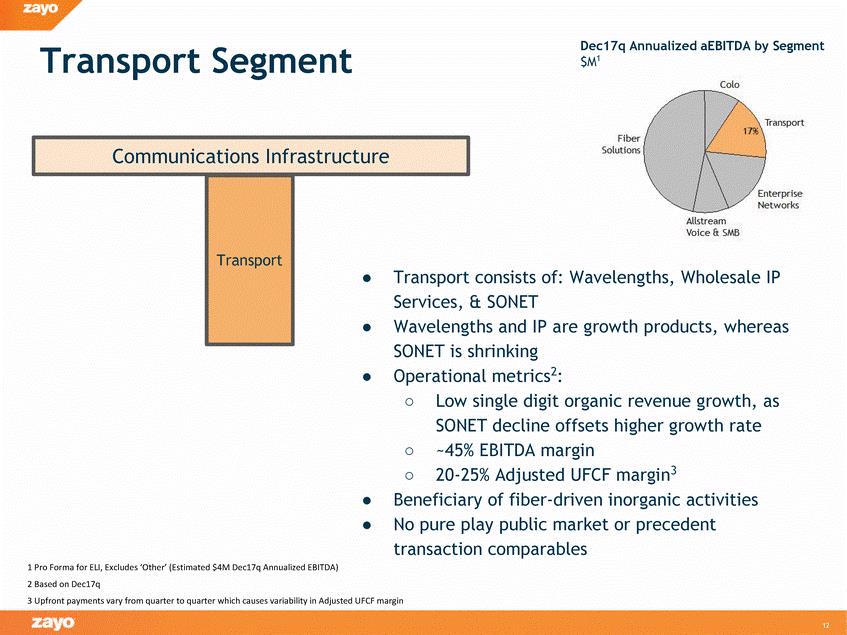
Dec17q Annualized aEBITDA by Segment $M1 Transport Segment consists of: Wavelengths, Wholesale IP & SONET ths and IP are growth products, whereas SONET is shrinking Operational metrics2: ● ○ Low single digit organic revenue growth, as SONET decline offsets higher growth rate ~45% EBITDA margin 20-25% Adjusted UFCF margin3 ○ ○ ● ● Beneficiary of fiber-driven inorganic activities No pure play public market or precedent transaction comparables 12 Communications Infrastructure Transport ●Transport Services, ●Waveleng |
|
|
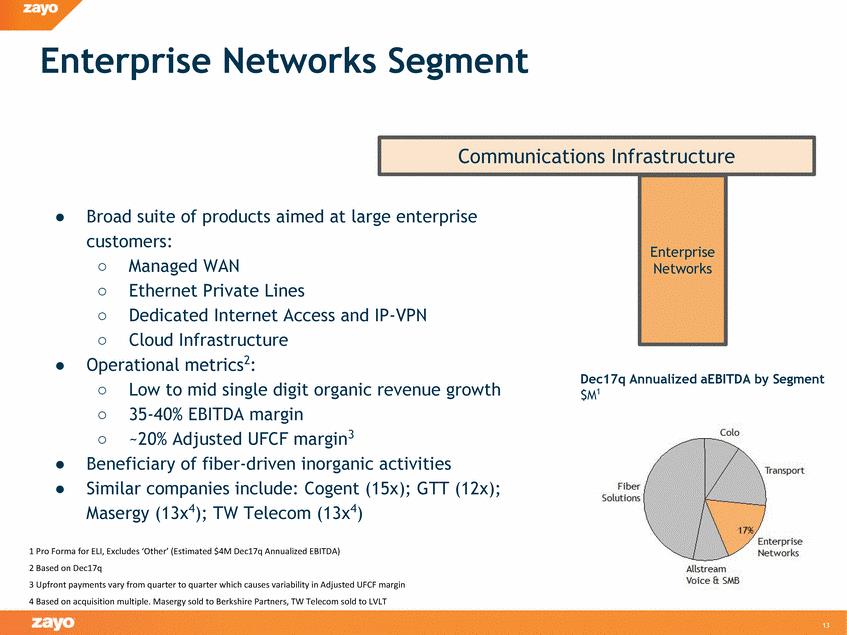
Enterprise Networks Segment ● Broad suite of products aimed at large enterprise customers: ○ ○ ○ ○ Managed WAN Ethernet Private Lines Dedicated Internet Access and IP-VPN Cloud Infrastructure Operational metrics2: ● Dec17q Annualized aEBITDA by Segment $M1 ○ ○ ○ Low to mid single digit organic revenue growth 35-40% EBITDA margin ~20% Adjusted UFCF margin3 ● ● Beneficiary of fiber-driven inorganic activities Similar companies include: Cogent (15x); GTT (12x); Masergy (13x4); TW Telecom (13x4) 13 Communications Infrastructure Enterprise Networks |
|
|
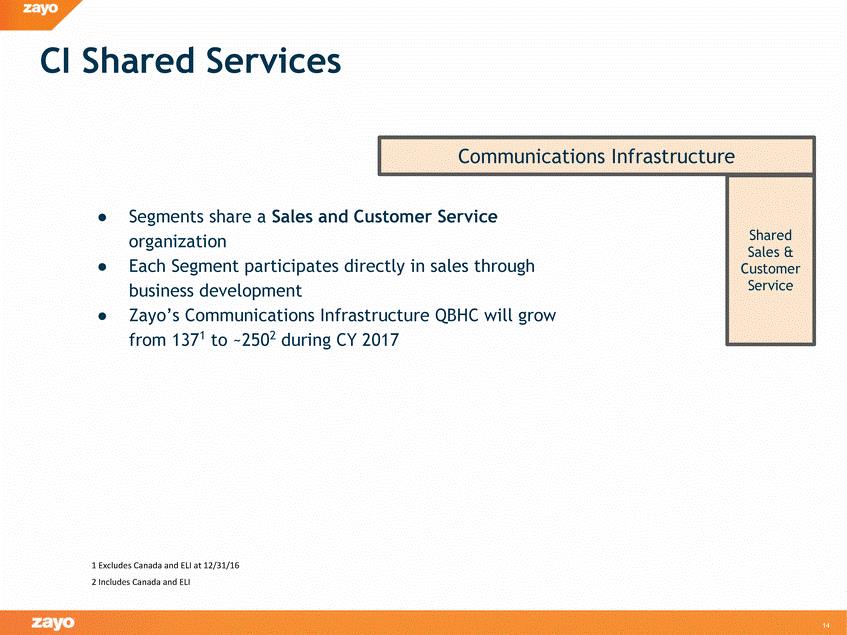
CI Shared Services ● Segments share a Sales and Customer Service organization ● Each Segment participates directly in sales through business development ● Zayo’s Communications Infrastructure QBHC will grow from 1371 to ~2502 during CY 2017 14 Communications Infrastructure Shared Sales & Customer Service |
|
|
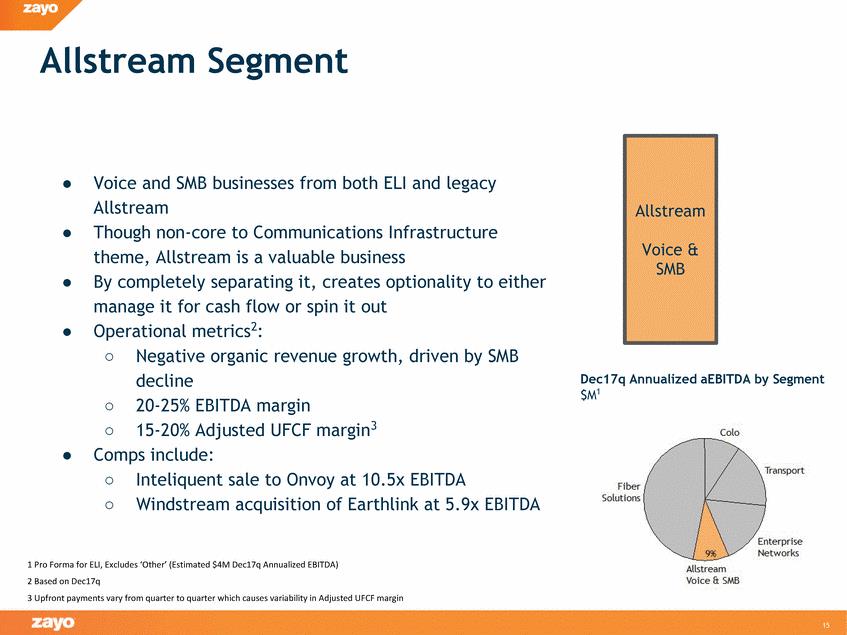
Allstream Segment ● Voice and SMB businesses from both ELI and legacy Allstream Though non-core to Communications Infrastructure theme, Allstream is a valuable business By completely separating it, creates optionality to either manage it for cash flow or spin it out Operational metrics2: ● ● ● ○ Negative organic revenue growth, driven by SMB decline 20-25% EBITDA margin 15-20% Adjusted UFCF margin3 Dec17q Annualized aEBITDA by Segment $M1 ○ ○ ● Comps include: ○ ○ Inteliquent sale to Onvoy at 10.5x EBITDA Windstream acquisition of Earthlink at 5.9x EBITDA 15 Allstream Voice & SMB |
|
|
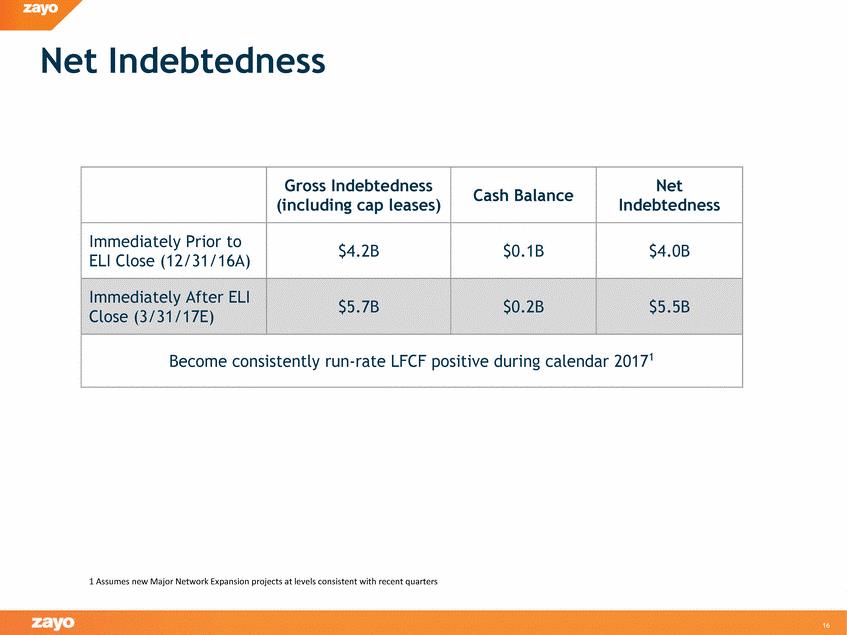
Net Indebtedness Indebtedness 16 Gross Indebtedness (including cap leases) Cash Balance Net Immediately Prior to ELI Close (12/31/16A) $4.2B $0.1B $4.0B Immediately After ELI Close (3/31/17E) $5.7B $0.2B $5.5B Become consistently run-rate LFCF positive during calendar 20171 |
|
|
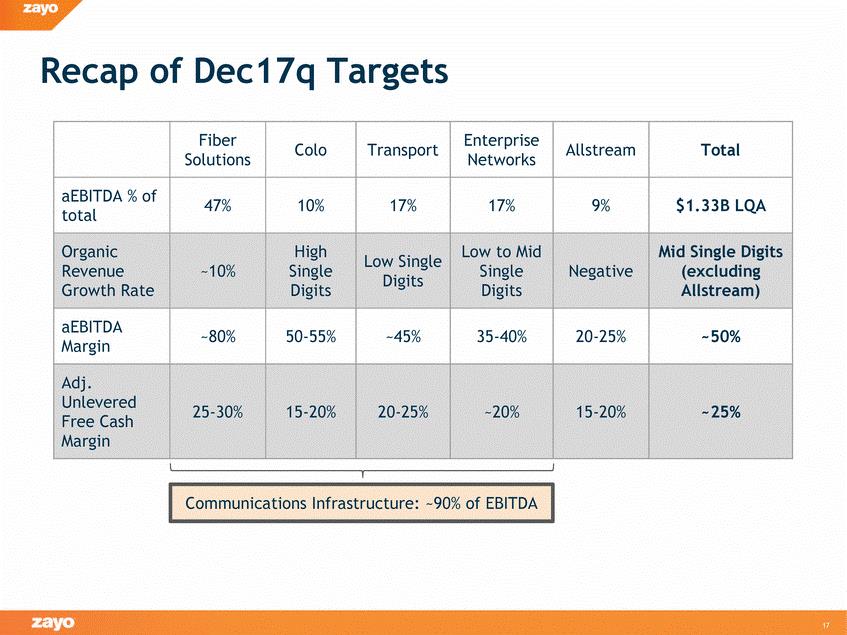
Recap of Dec17q Targets (excluding 17 Communications Infrastructure: ~90% of EBITDA Fiber Solutions Colo Transport Enterprise Networks Allstream Total aEBITDA % of total 47% 10% 17% 17% 9% $1.33B LQA Organic Revenue Growth Rate ~10% High Single Digits Low Single Digits Low to Mid Single Digits Negative Mid Single Digits Allstream) aEBITDA Margin ~80% 50-55% ~45% 35-40% 20-25% ~50% Adj. Unlevered Free Cash Margin 25-30% 15-20% 20-25% ~20% 15-20% ~25% |
|
|
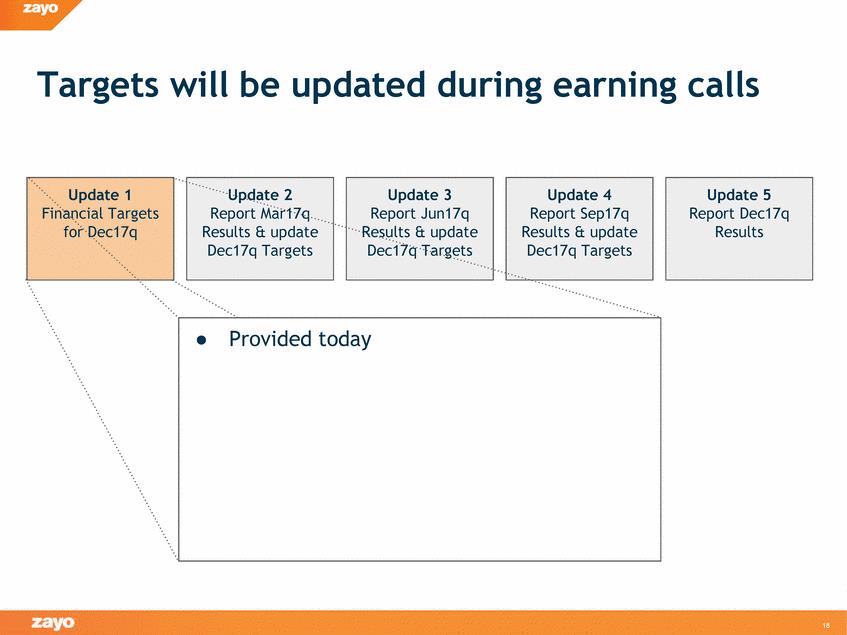
Targets will be updated during earning calls 18 ●Provided today Update 4 Report Sep17q Results & update Dec17q Targets Update 3 Report Jun17q Results & update Dec17q Targets Update 1 Financial Targets for Dec17q Update 2 Report Mar17q Results & update Dec17q Targets Update 5 Report Dec17q Results |
|
|
Temporary scale back in publication of quarterly Operational Metrics ● ● Unlike Allstream, ELI was immediately integrated into Zayo’s day-to-day operations Given March 1, 2017 ELI close date, it will be challenging to produce detailed and accurate operational metrics for Mar17q Expect to scale back the production of operational metrics in Mar17q reporting period Anticipate resuming publication of most metrics in Jun17q reporting period ● ● 19 |
|
|
Summary ● CY 2017 will be a year of substantial change, with EBITDA and Adjusted Unlevered Free Cash Flow expected to increase, driven by: ○ ○ Organic growth Progress on ELI, Allstream, Europe integrations ● Zayo Group is a holding company of multiple portfolio businesses, with a Communications Infrastructure theme ○ ○ Provide transparency to investors on performance of each unit Focus on Sum-of-the-Parts Value Creation ● Continued emphasis on Measured Equity Value Creation ○ Reward pace (“Equity IRR”) of measured equity value creation, based on a constant EBITDA multiple Achieve through a combination of growth and cash flow generation ○ 20 |
|
|
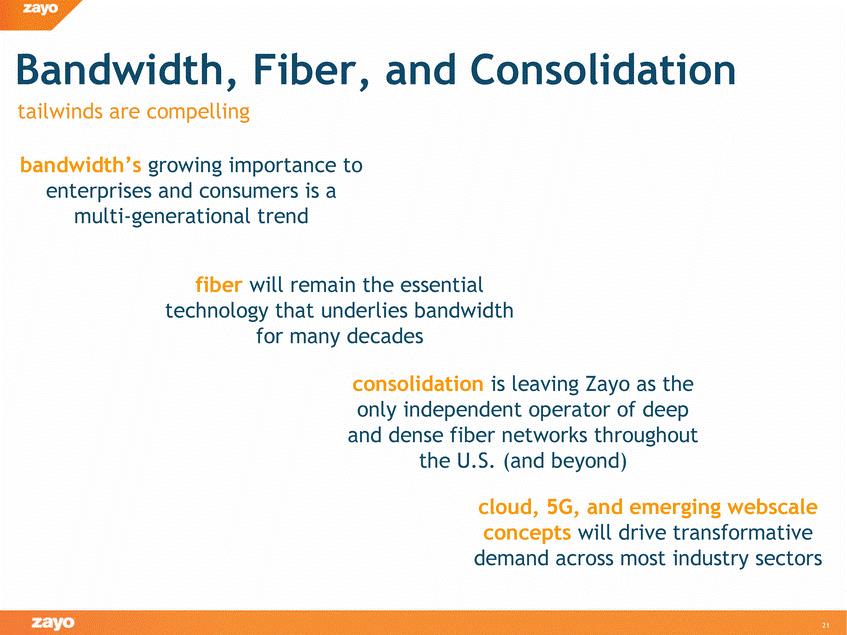
Bandwidth,Fiber, tailwinds are compelling and Consolidation bandwidth’s growing importance to enterprises and consumers is a multi-generational trend fiber will remain the essential technology that underlies bandwidth for many decades consolidation is leaving Zayo as the only independent operator of deep and dense fiber networks throughout the U.S. (and beyond) cloud, 5G, and emerging webscale concepts will drive transformative demand across most industry sectors 21 |
|
|
[LOGO] |

|
|
[LOGO] |

|
|
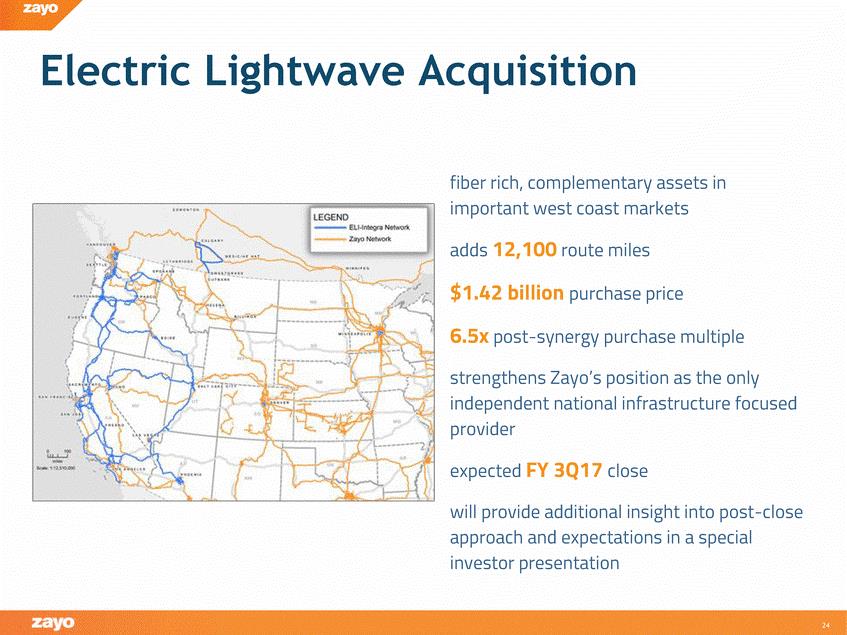
Electric Lightwave Acquisition fiber rich, complementary assets in important west coast markets adds 12,100 route miles $1.42 billion purchase price 6.5x post-synergy purchase multiple strengthens Zayo’s position as the only independent national infrastructure focused provider expected FY 3Q17 close will provide additional insight into post-close approach and expectations in a special investor presentation 24 |
|
|
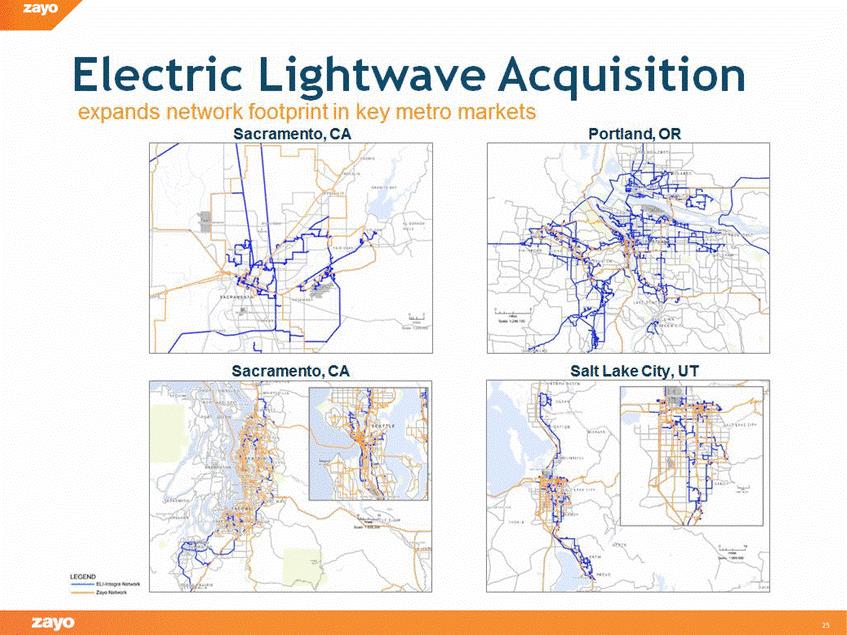
Electric Lightwave Acquisition e d e r o etr rke s Sacramento,CA |
|
|
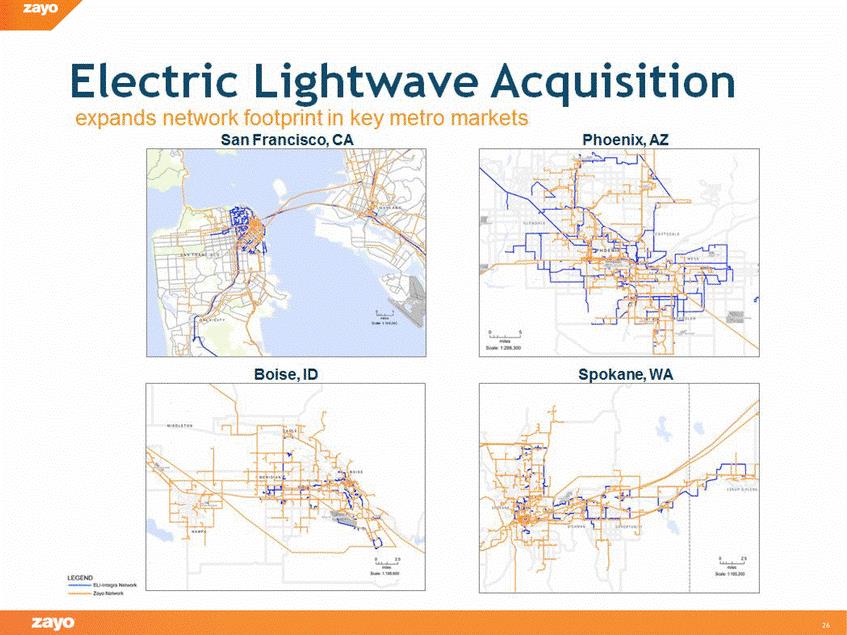
o,CA Phoenix,AZ Boise,ID S ·· okane,WA San Franc .isc |
|
|
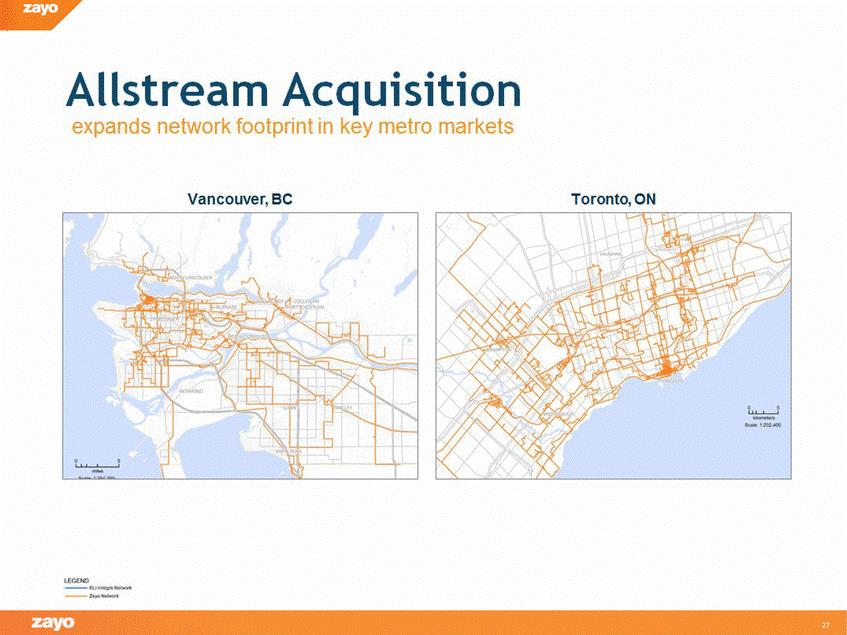
Allstream Acquisition exa d ne r fo p i e r arkets Vanc.ouver,BC |
|
|
Allstream Acquisition yetr e a ne r tp i in arke s Ottawa,ON Montreal,QC |
|
|
[LOGO] |

|
|
Presentation of Certain Consolidated Pro-forma Financial Data Acquisitions have been, and are expected to continue to be, a component of the Company’s strategy. In this presentation, the Company sets forth its pro-forma annualized revenue growth rate and pro-forma annualized Adjusted EBITDA growth rates for the current fiscal quarter. The adjustments reflected in our pro-forma amounts have not been prepared with a view towards complying with Article 11 of Regulation S-X. These pro-forma measures are intended to provide additional information regarding such rates of growth on a more comparable basis than would be provided without such pro-forma adjustments. Non-GAAP Financial Measures The Company provides financial measures that are not defined under generally accepted accounting principles in the United States, or GAAP, including Adjusted EBITDA, Adjusted EBITDA Margin, unlevered free cash flow, adjusted unlevered free cash flow, levered free cash flow, adjusted funds from operations, and net adjusted funds from operations. Adjusted EBITDA, as defined below and in our Segment Reporting note to our consolidated financial statements and notes thereto, is the primary measure used by our Chief Operating decision maker to evaluate segment operating performance. Adjusted EBITDA is defined as earnings/(loss) from continuing operations before interest, income taxes, depreciation, and amortization (“EBITDA”) adjusted to exclude acquisition or disposal-related transaction costs, losses on extinguishment of debt, stock-based compensation, unrealized foreign currency gains/ (losses) on intercompany loans, and non-cash income/(loss) on equity and cost method investments. Adjusted EBITDA Margin is defined as Adjusted EBITDA divided by revenue. Unlevered free cash flow is defined as Adjusted EBITDA minus purchases of property and equipment, net of stimulus grants. Adjusted unlevered free cash flow is defined as Adjusted EBITDA minus purchases of property and equipment, net of stimulus grants, plus additions to deferred revenue, less non-cash monthly amortized revenue. Levered free cash flow is defined as operating cash flow minus purchases of property and equipment, net of stimulus grants. Adjusted funds from operations (“AFFO”) is defined as earnings/(loss) from continuing operations before depreciation and amortization, unrealized foreign currency gains/(losses) on intercompany loans, stock-based compensation, acquisition or disposal-related transaction costs, losses on extinguishment of debt, non-cash income/(loss) on equity and cost investments, non-cash monthly amortized revenue, less cash payments related to maintenance capital expenditures. Net AFFO is defined as AFFO plus upfront customer payments from less than twelve month payback on net new sales less cash payments related to capital expenditures for (i) less than twelve month payback on net new sales and (ii) network capacity. These measures are not measurements of our financial performance under GAAP and should not be considered in isolation or as alternatives to net income, net cash flows provided by operating activities, total net cash flows or any other performance measures derived in accordance with GAAP or as alternatives to net cash flows from operating activities or total net cash flows as measures of our liquidity. We use Adjusted EBITDA to evaluate our operating performance. In addition to Adjusted EBITDA, management uses unlevered free cash flow, which measures the ability of Adjusted EBITDA to cover capital expenditures. Adjusted EBITDA is a performance rather than cash flow measure. Correlating our capital expenditures to our Adjusted EBITDA does not imply that we will be able to fund such capital expenditures solely with cash from operations. These metrics are among the primary measures used by management for planning and forecasting future periods. We believe the presentation of Adjusted EBITDA is relevant and useful for investors because it allows investors to view results in a manner similar to the method used by management and make it easier to compare our results with the results of other companies that have different financing and capital structures. We believe that the presentation of levered free cash flow is relevant and useful to investors because it provides a measure of cash available to pay the principal on our debt and pursue acquisitions of businesses or other strategic investments or uses of capital. We believe the presentation of AFFO and Net AFFO is useful to investors by providing measures presented by certain datacenter and cellular tower REITs (and some non-REITs) with which we are sometimes compared. 30 |
|
|
We also monitor Adjusted EBITDA because our subsidiaries have debt covenants that restrict their borrowing capacity that are based on a leverage ratio, which utilizes a modified EBITDA, as defined in our credit agreement and the indentures governing our notes. The modified EBITDA is consistent with our definition of Adjusted EBITDA; however, it includes the pro forma Adjusted EBITDA of and expected cost synergies from the companies acquired by us during the quarter for which the debt compliance certification is due. Adjusted EBITDA results, along with the quantitative and qualitative information, are also utilized by management and our Compensation Committee, as an input for determining incentive payments to employees. Adjusted EBITDA has limitations as an analytical tool and should not be considered in isolation from, or as a substitute for, analysis of our results of operations and operating cash flows as reported under GAAP. For example, Adjusted EBITDA: - does not reflect capital expenditures, or future requirements for capital and major maintenance expenditures or contractual commitments; - does not reflect changes in, or cash requirements for, our working capital needs; - does not reflect the interest expense, or the cash requirements necessary to service the interest payments, on our debt; and - does not reflect cash required to pay income taxes. Unlevered free cash flow and adjusted unlevered free cash flow have limitations as analytical tools and should not be considered in isolation from, or as a substitute for, analysis of our results as reported under GAAP. For example, unlevered free cash flow: - does not reflect changes in, or cash requirements for, our working capital needs; - does not reflect the interest expense, or the cash requirements necessary to service the interest payments, on our debt; and - does not reflect cash required to pay income taxes. Levered free cash flow, AFFO, and Net AFFO have limitations as an analytical tool and should not be considered in isolation from, or as a substitute for, analysis of our results as reported under GAAP. For example, levered free cash flow, AFFO, and Net AFFO: - does not reflect principal payments on debt; - does not reflect principal payments on capital lease obligations; - does not reflect dividend payments, if any; and - does not reflect the cost of acquisitions. Our computation of Adjusted EBITDA, unlevered free cash flow, adjusted unlevered free cash flow, levered free cash flow, AFFO, and Net AFFO may not be comparable to other similarly titled measures computed by other companies because all companies do not calculate these measures in the same fashion. Because we have acquired numerous entities since our inception and incurred transaction costs in connection with each acquisition, borrowed money in order to finance our operations and acquisitions, and used capital and intangible assets in our business, and because the payment of income taxes is necessary if we generate taxable income after the utilization of our net operating loss carryforwards, any measure that excludes these items has material limitations. As a result of these limitations, these measures should not be considered as a measure of discretionary cash available to us to invest in the growth of our business or as a measure of our liquidity. See “Reconciliation of Non-GAAP Financial Measures” for a quantitative reconciliation of Adjusted EBITDA, AFFO, and Net AFFO to net income/(loss) and for a quantitative reconciliation of unlevered free cash flow, adjusted unlevered free cash flow and levered free cash flow to net cash flows provided by operating activities. Annualized revenue and annualized Adjusted EBITDA are derived by multiplying the total revenue and Adjusted EBITDA, respectively, for the most recent quarterly period by four. Our computations of annualized revenue and annualized Adjusted EBITDA may not be representative of our actual annual results. Measures referred to as being calculated on a constant currency basis are intended to present the relevant information assuming a constant exchange rate between the two periods being compared. Such metrics are calculated by applying the currency exchange rates used in the preparation of the prior period financial results to the subsequent period results. Tables reconciling such non-GAAP measures are included in the Historical Financial Data & Reconciliations section of this presentation. A glossary of terms used throughout is available under the investor section of the Company’s website at http://www.zayo.com/investors. 31 |
|
|
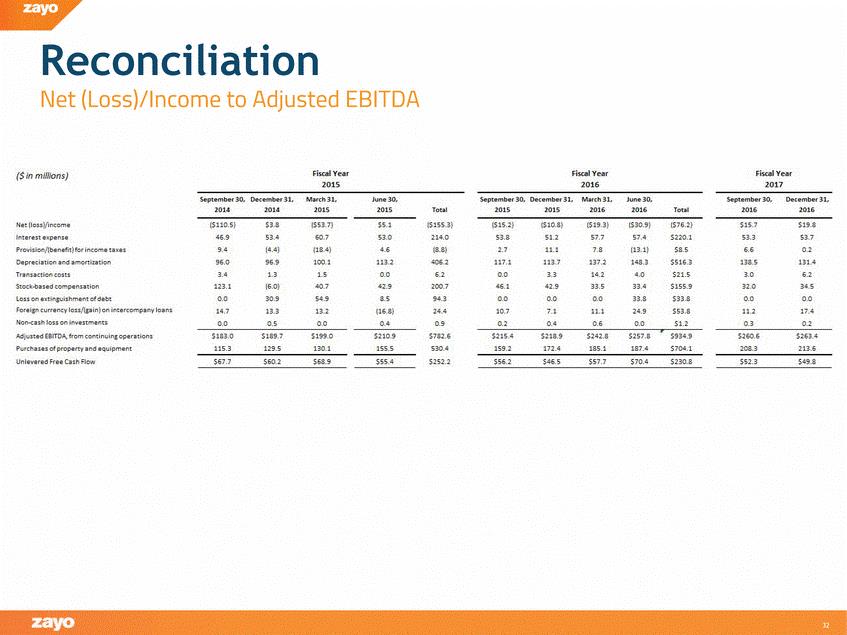
Reconciliation Net (Loss)/lncome to Adjusted EBITDA Flilsca'l Y•ea1 r Firs.cal Yea1r Fiscal Year 2017 ($in millions) 201.5. 2101.6 Se<ptellil'ber 30, OeDI!'m'beir 3.1,, M!a.rcJh3.1,, Jurte30,, 2015 Sept•em:b.er 30, 0BDI!'mbe<r3·1. M:;m:Jh3.1, 20116 u:ne30,, 20116 Se<ptembe-r 30,. 201;6 li>BDern'bter 3.1,, 2016 201A 2014 2015. Total1 2015. 2015. Total $1.91.8 53.7 0.2 131. 5.2 3 .s. 0.0 17.4 N'et (los.s/inoome ($110.5.1 46.9 9. 96.0 3.4 123..1 .0 1 .7 $3.8 53. ($5.3.71 60.7 (1S.4 100.1 1.5 .7 54.9' 1.3.2 $5.1 53.0 ..6 113.2 0.0 2.9 B.S. ($155.3j 21 [·8.81 6.2 6.2 .7 94.3 24. 0.9 $782.6 530.4 ($1S..21 53.8 2.7 117.1 0.0 6.1 0.0 1 .7 [$1 .81 51.2 11.1 113.7 3.3 2 .9 0.0 7.1 0.4 ($1.9.31 57.7 7.8 1.37.2 14.2 ($30.91 57. (13.11 148.3 4. 3·3.4 ($76.21 $22 .1 $15..7 Inter·e:st expe·ncSe· 53.3 [ . . I Provisi on/(l>e·n e.fitlfor i ncome taxe.s $.8.5 •6.6 Oe·pr.edation an d a mortization S6.9 1.3 [6.0) 3 .9 13.3. o.s. $5.16.3 138.5 3.0 3 2 .0 0.0 11.2 Tr.a n<Sactioncosts Stod::-b.asedcompe·n.sati·on $2.1.5 3·35 .0 $155.9 $33.8 $5.3.8 $1.2 Loss on ·E!!lttin,guish m ent o.f de·b.t 33·.·8 For·e·ign curr.ency I•DSs/[ga inlon i nte·room pa ny loa n.s 24.91 0.0 (1•6.81 11.1 .6 Non..c.a.sh l·o:sson i nve:Stments 0.4 0..2 AdjUiStBCI EBITOA,from conti nuin,g operations $1S3. 115.3 $189.7 $199. 1.30.1 $2.10.9 $215. 1591..2 $218.9 172..4 $ 242 .8 185.1 $ 2 5.7..S $91 34.9 $260.5 $253.4 Purcha.se:sofproperty a nd equipme·nt 1.2.95 l.S.S.S. Unl.everBd. Fr.e e• Cash Flow .$252 ..2 $5>6.2 $46.5 $57.7 $70. .8 $!i2.3 $491..8 $55.. ' $67.7 $1i0.2 :$68.9 208.3 .213. ·6 0.3· 0.2 |
|
|
Reconciliation Net (Loss)/lncome to Adjusted EBITDA ($in millions) Sept:e111i11 ber 3'0.., 2016 Deoen11 ber 3, 2016 !Exr·l u:di ng Zayo Canada 1CaMOIi.dla'lt·Bdl ZayoCarNld\a ElLI $1'91.3 $19.6 .:2 $ .:2 53.5 . 2 9.7 ($3. 13.5 .1 3:2.7 53.7 . 2 131. 6. Inte·r·e.st expee n.s.e Pr i!l.i.si n/(Deru ·fitfor i rt me ta xes. 1.7 3.7 eprBcia tion .a ru:f a m rti:z a ti n .s. Tra nsacti n costs St k-DasBd c mpenrsation 3 . 5 3 .. 5 1..& L ;5..5. n ingui:s.hme·nt fde·bt Foreign: cu rre·n lo.ssj(g.a i n n in.te·r m pa ny I a ns 17. 17.7 ( .3 rf n.-ca.sh l•os.s on inr'!l.e.stm ents 1 Other ts 5.:2 A-dj u.ste;d EBITDA Ann.u ali2lei:l' A-dju5ted EBITDA. 1The "other costs" add-back by Electric Lightwave is primarily associated with severance costs and other costs incurred related to an organizational restructuring. CansoIida'lt·ed l |

|
|
[LOGO] Thank You investors.Zayo.com |