Attached files
| file | filename |
|---|---|
| EX-32 - EX-32 - Zayo Group Holdings, Inc. | zayo-20180630xex32.htm |
| EX-31.2 - EX-31.2 - Zayo Group Holdings, Inc. | zayo-20180630ex312072bdc.htm |
| EX-31.1 - EX-31.1 - Zayo Group Holdings, Inc. | zayo-20180630ex3114a73c0.htm |
| EX-23.1 - EX-23.1 - Zayo Group Holdings, Inc. | zayo-20180630ex231597c75.htm |
| EX-21.1 - EX-21.1 - Zayo Group Holdings, Inc. | zayo-20180630ex211271697.htm |
UNITED STATES
SECURITIES AND EXCHANGE COMMISSION
WASHINGTON, D.C. 20549
FORM 10-K
☒ANNUAL REPORT PURSUANT TO SECTION 13 OR 15(d) OF THE SECURITIES EXCHANGE ACT OF 1934
For the fiscal year ended June 30, 2018
OR
☐TRANSITION REPORT PURSUANT TO SECTION 13 OR 15(d) OF THE SECURITIES EXCHANGE ACT OF 1934
Commission File Number: 001-36690
Zayo Group Holdings, Inc.
(Exact Name of Registrant as Specified in Its Charter)
|
|
|
|
DELAWARE |
26-1398293 |
|
(State or other jurisdiction of incorporation or organization) |
(I.R.S. Employer Identification No.) |
1821 30th Street, Unit A,
Boulder, CO 80301
(Address of Principal Executive Offices)
(303) 381-4683
(Registrant’s Telephone Number, Including Area Code)
Securities registered pursuant to Section 12(b) of the Act:
|
Title of Each Class |
Name of Exchange on Which Registered |
|
Common Stock, par value $0.001 per share |
New York Stock Exchange |
Securities registered pursuant to Section 12(g) of the Act:
None
Indicate by check mark if the registrant is a well-known seasoned issuer, as defined in Rule 405 of the Securities Act.
Yes ☒ No ☐
Indicate by check mark if the registrant is not required to file reports pursuant to Section 13 or 15(d) of the Act.
Yes ☐ No ☒
Indicate by check mark whether the registrant (1) has filed all reports required to be filed by Section 13 or 15(d) of the Securities Exchange Act of 1934 during the preceding 12 months (or for such shorter period that the registrant was required to file such reports), and (2) has been subject to such filing requirements for the past 90 days. Yes ☒ No ☐
Indicate by check mark whether the registrant has submitted electronically and posted on its corporate Web site, if any, every Interactive Data File required to be submitted and posted pursuant to Rule 405 of Regulation S-T (§232.405 of this chapter) during the preceding 12 months (or for such shorter period that the registrant was required to submit and post such files). Yes ☒ No ☐
Indicate by check mark if disclosure of delinquent filers pursuant to Item 405 of Regulation S-K (§ 229.405 of this chapter) is not contained herein, and will not be contained, to the best of registrant’s knowledge, in definitive proxy or information statements incorporated by reference in Part III of this Form 10-K or any amendment to this Form 10-K. ☐
Indicate by check mark whether the registrant is a large accelerated filer, an accelerated filer, a non-accelerated filer, a smaller reporting company, or an emerging growth company. See the definitions of “large accelerated filer,” “accelerated filer,” “smaller reporting company” and “emerging growth company” in Rule 12b-2 of the Exchange Act.
|
|
|
|
|
|
|
|
|
Large accelerated filer |
|
☒ |
|
Accelerated filer |
|
☐ |
|
|
|
|
|
|||
|
Non-accelerated filer |
|
☐ (Do not check if a smaller reporting company) |
|
Smaller reporting company |
|
☐ |
|
|
|
|
|
|
|
|
|
Emerging growth company |
|
☐ |
|
|
|
|
If an emerging growth company, indicate by check mark if the registrant has elected not to use the extended transition period for complying with any new or revised financial accounting standards provided pursuant to Section 13(a) of the Exchange Act. ¨☐
Indicate by check mark whether the registrant is a shell company (as defined in Rule 12b-2 of the Exchange Act). Yes ☐ No ☒
As of December 31, 2017, the aggregate market value of the registrant’s common stock held by non-affiliates of the registrant was approximately $7.7 billion based on the closing price as reported on the New York Stock Exchange.
As of August 20, 2018, the number of outstanding shares of common stock of Zayo Group Holdings, Inc. was 246,642,680 shares.
DOCUMENTS INCORPORATED BY REFERENCE
Portions of the registrant’s Definitive Proxy Statement for the 2018 Annual Meeting of Stockholders are incorporated by reference into Part III of this Form 10-K.
Our industry uses many terms and acronyms that may not be familiar to you. To assist you in reading this Annual Report on Form 10-K, we have provided definitions of some of these terms below.
Bandwidth infrastructure—Offerings of fiber and lit fiber (i.e., fiber that has been activated, or “lit”, by provider-supplied components) provisioned over the fiber network, mobile infrastructure connected to (or capable of being connected to) the fiber network, and data center based colocation and interconnection offerings. Lit fiber-based bandwidth infrastructure offerings include Wavelength, Ethernet, IP and SONET; fiber-based offerings that are not lit are sold as dark fiber capacity. Data center-based bandwidth infrastructure offerings include colocation (space and power) as well as interconnection within facilities.
Capacity—The information‑carrying ability of a lit fiber offering. Below is a list of some common units of capacity for various lit fiber offerings:
|
· |
1G, 2.5G, 10G, 40G and 100G—Data communication circuits capable of accommodating Wavelengths at 1G, 2.5G, 10G, 40G, and 100G, respectively. |
|
· |
10Mb and 100Mb—Data communication circuits capable of accommodating Ethernet communications at 10 Mb and 100 Mb, respectively. |
Carrier—A provider of communications services that commonly include voice, data, and Internet services.
Carrier hotel—A data center facility containing many carriers and other telecommunications service providers, all of which may be widely interconnected. These facilities generally have high‑capacity power service, backup batteries and generators, fuel storage, riser cable systems, large cooling capability, and advanced fire suppression systems.
Cellular tower—An outdoor structure primarily used to attach and house antennae used by wireless carriers to aggregate and transmit mobile voice and data.
CLEC—Competitive local exchange carrier; a local telecommunications provider licensed to compete with some or all of the offerings of the ILEC.
Colocation—The housing of telecommunications equipment, other communications equipment, servers and storage components within the same location. Operators of these colocation facilities typically also make available interconnection offerings to their tenants, enabling the tenants to cross connect with other customers located within the same facility and/or with bandwidth infrastructure providers.
Conduit—A pipe usually made of metal, ceramic, or plastic that protects underground fiber optic cables.
Cybersecurity— Preventative techniques used to protect the integrity of networks, programs and data from attack, damage, or unauthorized access.
Dark fiber—Fiber that has not yet been connected to telecommunications access components or optronics and, therefore, has not yet been activated or “lit” by the provider-supplied components.
Data center—A facility used to house computer systems, backup storage components, routers, servers and other Internet and other telecommunications equipment. Data centers generally have environmental controls (air conditioning, fire suppression, etc.), redundant/backup power supplies, redundant data communications connections, and high security.
DWDM—Dense Wavelength-division multiplexing. The term “dense” refers to the number of channels being multiplexed. A DWDM system typically has the capability to multiplex up to 40 Wavelength channels.
Ethernet—The standard local area network (LAN) protocol. Ethernet was originally specified as a standard for connection of components that share a company or home network, as well as to a cable modem or DSL modem for Internet access. Due to its ubiquity in the LAN, Ethernet has become a popular communication protocol in metropolitan, regional and long haul networks as well.
Fiber or fiber optic cables—Thin filaments of glass through which light beams travel over long distances.
i
Fiber miles—The number of route miles in a network multiplied by the number of fiber strands within each cable on that network. For example, if a ten‑mile network segment has a 144 count fiber installed, it would represent 10x144 or 1,440 fiber miles.
Fiber‑to‑the‑Tower or FTT—The connection of cellular tower sites to the wider terrestrial network via fiber connections.
G—Gigabits per second, a measure of telecommunications speed. One gigabit equals one billion bits of information.
ILEC—Incumbent local exchange carrier; a traditional telecommunications provider that, prior to the Telecommunications Act of 1996, had the exclusive right and responsibility for providing telecommunications offerings in its local service area, and in connection therewith typically built or acquired access to key elements of bandwidth infrastructure.
Interconnection—A connection between two customers who are located within a single data center or within a single colocation space using fiber and/or other means.
IP—Internet protocol; the network protocol used in accommodating movement of data over the Internet.
IRU and IRU contract—Indefeasible right of use. The exclusive, unrestricted, and indefeasible right to use one, a pair, or more strands of fiber of a fiber cable. IRU contracts are typically long‑term in nature (20 years) and may or may not contain restrictions on the use of the fiber by the lessee.
ISP—Internet service provider; provides retail access to the Internet for consumers and businesses.
Mb—Megabits per second; a measure of telecommunications speed. One megabit equals one million bits of information.
Meet‑Me Room—A physical location in a building, usually a carrier hotel or other data center, where voice carriers, Internet service providers, data service providers and others interconnect so that data can be passed between and among their respective networks. At any given colocation facility or data center, network owners may also be able to interconnect outside the Meet‑Me Room.
Mobile switching centers—Buildings where wireless carriers house their Internet routers and voice switching equipment.
Object-Based Storage— A cost effective data storage offering which manages data as objects and has the ability to store large volumes of unstructured data.
OC—Optical carrier level; a measure of the rate of optical telecommunications traffic. For example, OC‑3 corresponds to 155 Mb. See the definition of “Capacity,” above.
On‑net—Describes a location or offering that is directly and fully supported by the provider’s fiber (as opposed to another’s fiber or some other connection solution).
Optronics—Various types of components that are commonly used to light fiber, including components that are capable of providing Wavelength, Ethernet, IP, SONET, and other technology over fiber optic cable.
POP—Point‑of‑presence; a location in a building separate from colocation facilities and data centers that houses components used to provide access to telecommunications or bandwidth infrastructure.
Private cloud— A type of cloud computing that involves a distinct and secure cloud-based computing environment dedicated to a single organization.
Private line—A dedicated private bandwidth circuit that generally utilizes SONET, Ethernet and Wavelength technology used to connect various locations.
Route miles—The actual number of non‑overlapping miles that a fiber network traverses. Route miles are distinct from fiber miles (see the definition of “Fiber miles” above).
ii
Small cell—A location, other than a cellular tower or building, that is used to attach an antenna used by a wireless carriers to aggregate and transmit mobile voice and data. Typically, the location is a light pole, traffic light, or other small separate purpose structure.
SONET—Synchronous optical network; a network protocol traditionally used to support private line offerings. This protocol enables movement of voice, data and video at high speeds. Protected SONET networks provide for virtually instantaneous restoration of connectivity in the event of a fiber cut or component failure.
Switch—A component that selects the path that voice, data and Internet traffic take or use on a network.
Transport—A dedicated telecommunication method to connect data, Internet, voice, video or wireless traffic from one location to another.
Wavelength—A channel (or “lane”) of light that accommodates telecommunications traffic through the process of Wavelength‑division multiplexing. See also the definition of “DWDM”, above.
iii
Overview
Zayo Group Holdings, Inc. (the “Company”, “we” or “us”) is a large and fast growing provider of bandwidth infrastructure in the United States, Canada and Europe. Our products and offerings enable our customers’ mission-critical, high-bandwidth applications, such as cloud-based computing, video, mobile, social media, machine-to-machine connectivity, and other bandwidth-intensive applications. Key products include leased dark fiber, fiber to cellular towers and small cell sites, dedicated Wavelength connections, Ethernet, IP connectivity, cloud offerings and other high-bandwidth offerings. We provide access to our bandwidth infrastructure and other offerings over a unique set of dense metro, regional, and long-haul fiber network sections and through our interconnect-oriented data center facilities. Our fiber network sections and data center facilities are critical components of the overall physical network architecture of the Internet and private networks. Our customer base includes some of the largest and most sophisticated users of bandwidth infrastructure offerings, such as wireless service providers; telecommunications service providers; financial services companies; social networking, media, and web content companies; education, research, and healthcare institutions; and governmental agencies. We typically provide our bandwidth infrastructure offerings for a fixed monthly recurring access fee under contracts that vary between one and twenty years in length. We operate our business with a unique focus on capital allocation and financial performance with the ultimate goal of maximizing equity value for our stockholders. Our core values center on partnership, alignment, and transparency with our three primary constituent groups - employees, customers, and stockholders.
We were founded in 2007 with the investment thesis of building a bandwidth infrastructure platform to take advantage of the favorable Internet, data, and wireless growth trends driving the on-going demand for bandwidth infrastructure, and to be an active participant in the consolidation of the industry. The growth of cloud-based computing, video, mobile and social media applications, machine-to-machine connectivity, and other bandwidth-intensive applications continues to drive rapidly increasing consumption of bandwidth on a global basis. As an early believer in the enduring nature of these trends, we assembled our asset base and built a business model specifically to supply high-bandwidth infrastructure for connectivity to users whose businesses depend most on the continuous and growing demand for bandwidth. Typically, such users are given access to use our bandwidth infrastructure in return for an initial contract of at least one year, and generally with options for extensions. As a core tenet of our strategy for capitalizing on these industry trends, we have been a leading industry consolidator and have acquired 45 bandwidth infrastructure businesses and assets to date. Our owned, secure, and redundant fiber network and data centers serve as the foundation for our bandwidth solutions and allow us to offer customers dark fiber solutions, network connectivity and colocation and cloud infrastructure solutions. We believe the continuously growing demand for stable and secure bandwidth and infrastructure from users such as service providers, enterprises and consumers, combined with our unique and dense metro, regional, and long-haul network sections, position us as a mission-critical infrastructure supplier to the largest users of bandwidth.
Our network footprint includes both large and small metro geographies, the extended suburban regions of many cities, and the large rural, national and international links that connect our metro network sections. We believe that our network assets would be difficult to replicate given the geographic reach, network density, and capital investment required. As of June 30, 2018, our fiber network spans 128,910 route miles and 11,867,276 fiber miles (representing an average of 92 fibers per route), serves 403 geographic markets in the United States, Canada and Europe, and connects to approximately 35,000 buildings, including 1,185 data centers. We own fiber network sections in large metro areas, such as New York, Chicago, San Francisco, Paris, and London, as well as smaller metro areas, such as Allentown, Pennsylvania, Fargo, North Dakota, and Spokane, Washington. Our network sections allow our customers access to our high-bandwidth infrastructure solutions over redundant fiber facilities between and among key customer locations. We believe our ownership and the location and density of our expansive network footprint allow us to more competitively satisfy our target customers’ bandwidth infrastructure solutions at the local, regional, national, and international level relative to other regional bandwidth infrastructure providers or long-haul providers. We also provide our network-neutral colocation and interconnection offerings utilizing our own data centers located within major carrier hotels and other
1
strategic buildings in 50 locations throughout the United States, Canada and Europe and operate approximately 1,034,000 square feet of licensable colocation space.
The density and geographic reach of our network footprint allow us to provide tailored bandwidth infrastructure solutions on our own network (“on-net”) that address the current and future bandwidth needs of our customers. Our dense metro and regional network sections have high fiber counts that enable us to provide our dark fiber solutions, network connectivity and colocation and cloud infrastructure offerings. Our network sections are deep and scalable, meaning we have spare fiber, conduit access rights and/or rights of way rights that allow us to continue to add capacity to our network as our existing and new customers’ demand for our offerings increases. In addition, many of our core network technologies provide capacity through which we can continue to add dedicated Wavelengths to our network without consuming additional fiber. We also believe the density and diversity of our network provides a strong and growing competitive barrier to protect our existing revenue base. We believe our network provides significant opportunity to organically connect to new customer locations, data centers, towers, or small cell locations to help us achieve an attractive return on our capital deployed. Since our founding, we have assembled a large portfolio of fiber network sections and colocation assets through both acquisitions and customer demand-driven investments in infrastructure property and equipment. From our inception to date, we have completed acquisitions with an aggregate purchase consideration, net of cash acquired, totaling approximately $6.7 billion. For the period from July 1, 2015 through June 30, 2018, we also invested approximately $2.3 billion in capital expenditures, exclusive of acquisitions and stimulus grant reimbursements, primarily to expand the reach and capacity of our network. As of June 30, 2018, our total debt (including capital lease obligations and before any unamortized discounts, premiums and debt issuance costs) was $5,876.6 million and was primarily incurred in connection with acquisitions.
Our business model focuses on providing on-net bandwidth infrastructure solutions to our customers, which results in what we refer to as “infrastructure economics.” Infrastructure economics are characterized by attractive revenue visibility and strong margins coupled with operating leverage for new revenue, success-based capital investments with low maintenance capital needs, and the ability to generate significant cash flow over time. For the year ended June 30, 2018, approximately 90% of our revenue was recurring in nature. Our capital expenditure investments are primarily success-based, meaning that before we commit resources to expand our network, we have a signed customer contract that will provide us with an attractive return on the required capital investment. After committing capital to connect additional customer sites, our goal is to sell additional high-bandwidth connectivity on these new routes at a relatively low incremental cost, which further enhances the return we extract from our asset base. Finally, the combination of our scale and infrastructure economics results in the ability to generate meaningful free cash flow over time.
Our management is intensely focused on creating equity value for our stockholders. Our equity value creation philosophy includes regular and rigorous financial and operational measurement, financial transparency (both internally and externally), and clear alignment of interests among employees, management, and stockholders. Our real-time measurement and reporting system serves as the foundation for our decision making and our extensive financial and operational disclosure. We also believe in fostering an entrepreneurial culture that aligns the interests of our employees, management, and stockholders.
We are a Delaware corporation formed in 2007. As of June 30, 2018, we had 3,774 employees.
Our fiscal year ends June 30 each year, and we refer to the fiscal year ending June 30, 2019 as “Fiscal 2019”, the fiscal year ended June 30, 2018 as “Fiscal 2018”, the fiscal year ended June 30, 2017 as “Fiscal 2017” and the fiscal year ended June 30, 2016 as “Fiscal 2016.”
Bandwidth Infrastructure Industry
We are a provider of bandwidth infrastructure solutions, and our offerings are a critical component of the broader global communications industry. Bandwidth infrastructure, consisting primarily of fiber network sections and interconnect-oriented colocation facilities, plays a fundamental role in the communications value chain, similar to other types of infrastructure such as data centers and cellular towers. Bandwidth infrastructure assets are a critical resource, connecting data centers, cellular towers, and other carrier and private networks to support the substantial growth in global data, voice and video consumption by both business and individual consumers.
2
Industry History
Our industry has changed substantially over the years. The first phase of the bandwidth infrastructure industry occurred with the advent of the Internet and the ensuing dot com era in the late 1990s. This led to the first major wave of fiber network deployments as a number of companies of varying backgrounds and profiles invested billions of dollars in fiber network construction throughout the U.S., Canada and Europe. These fiber network developers included companies with national and international plans (e.g., Level 3 Communications, Qwest Communications, Williams Communications) and more regional plans (e.g., 360networks, Progress Telecom, OnFiber). Following these network builds, many of the fiber companies struggled in the early 2000s due to the lack of sufficient demand for their high-bandwidth offerings. Bandwidth demand during this timeframe was limited by the fact that many bandwidth-intensive applications (e.g., streaming video, cloud, mobile broadband, big data analytics, etc.) were either not yet contemplated or still very early in their life cycle. Instead, the majority of traffic at the time was low-bandwidth offerings such as voice and dial-up modem connections. In addition, the similarity of the fiber routes deployed resulted in significant overcapacity and associated pricing pressure, leaving both a “last mile” gap and heavy competition and overcapacity along these routes. These two primary factors combined to significantly limit the fiber network providers’ operating cash flows, resulting in the majority of these companies transitioning their business models, consolidating and/or seeking bankruptcy protection.
In the following years, a substantial expansion in computing power and bandwidth-intensive applications drove meaningful bandwidth traffic growth. This growth highlighted the need to address the “last mile” gap by bringing bandwidth capacity directly to both the consumer and business end user. The capacity and performance of the consumer last mile connection was primarily addressed by the expansion of cable networks and through mobile network development by wireless carriers (supported by cellular tower operators). The growing bandwidth demand of business end users was addressed by a number of focused fiber developers constructing new networks to directly connect to data centers, cellular towers, government facilities, schools, hospitals and other locations with high-bandwidth needs. These fiber network companies were generally local or regional in nature, and were most often either survivors of the initial fiber development wave, subsidiaries of a utility parent, or owned by entrepreneurs. This period is also noted for increased financial discipline following the large speculative capital deployments of the dot com era. This is the timeframe and industry environment in which our Company was founded.
The Industry Today
The acceleration in the development of bandwidth-intensive components and applications has resulted in a significant need to further fill in the “last mile” gap, leading to substantial capital investments in fiber networks by bandwidth infrastructure providers. Bandwidth infrastructure solutions support customer applications such as high definition television broadcasting and video; online streaming video; cloud applications replacing in-house enterprise software platforms; and explosive mobile data consumption (Cisco found that, in 2016, global mobile data traffic was equivalent to 18x the volume of global mobile traffic five years earlier in 2011). Companies whose services require large amounts of bandwidth and enterprises that consume large amounts of bandwidth are struggling to adapt to this rapidly evolving landscape, and the bandwidth infrastructure industry is growing in economic importance as it addresses this critical need. In addition to these demand trends, there has been significant consolidation in the bandwidth infrastructure industry, validating a core tenet of the Company’s founding investment thesis. Since inception we have made 45 acquisitions in the US, Europe and Canada with an aggregate purchase consideration, net of cash acquired, totaling approximately $6.7 billion.
Industry Participants
We view the participants in today’s communications industry in two distinct categories:
|
· |
Providers of Infrastructure. Companies that own and operate infrastructure assets that are used to market and deliver infrastructure offerings. We believe these assets would be difficult to replicate given the significant capital, time, permitting, and expertise required. Providers of infrastructure typically enjoy long-term customer contracts, a highly visible and recurring revenue base, and attractive margins. We further categorize these providers of infrastructure as follows: |
|
o |
Bandwidth Infrastructure Providers: Owners of bandwidth infrastructure assets comprised of fiber networks and interconnect-oriented colocation facilities. Bandwidth infrastructure |
3
offerings include dark fiber, lit fiber (Wavelengths, Ethernet, IP, and SONET), and colocation and interconnection offerings for the purpose of accommodating customers’ mission-critical traffic including data, voice, and video. |
|
o |
Data Center Providers: Owners of data center facilities that include raised floor, power and cooling infrastructure. These facilities house and support customer networking and computing equipment for carrier networks, enterprise cloud platforms, content distribution networks, and other mission-critical applications. |
|
o |
Cellular Tower Providers: Owners of cellular towers, the physical infrastructure upon which customer antennas and associated components are co-located for the wireless carrier industry. |
|
· |
Users of Infrastructure. Users of infrastructure may purchase infrastructure offerings either to provide value-added services to their customers or for their own private network requirements. We further categorize these users of infrastructure as follows: |
|
o |
Communications Service Providers. Communications service providers, such as wireless service providers, ILECs, CLECs, and ISPs, are companies that use infrastructure to package, market, and sell value-added communications services such as voice, Internet, data, video, wireless, and hosting solutions. |
|
o |
End Users. End users are public sector entities and private enterprises that use infrastructure for their own internal networks. Note that end users may also address their needs by purchasing value-added services from communications service providers. |
The Market Opportunity
The proliferation of smart devices and mobile broadband, real-time streaming video, social networks, online gaming, machine-to-machine connectivity, big data analytics, and cloud computing will continue to drive substantial demand for bandwidth infrastructure. Cisco estimates that mobile data traffic will grow at a compound annual growth rate of 47% from 2016 to 2021 and that IP traffic will grow at a compound annual growth rate of 24% from 2016 to 2021.
Communications service providers develop and deliver value-added solutions that are tailored to mass market residential and enterprise customers whose needs continue to grow and evolve as bandwidth trends expand. Given this rapid growth and the complexity and cost of building and maintaining networks, communications service providers are increasingly looking to bandwidth infrastructure providers to augment the reach and performance of their own networks and support the delivery of the solutions their customers demand. As this dynamic continues, bandwidth infrastructure providers will become further entrenched as mission-critical partners to the communications service providers.
Similarly, end users such as private enterprises (e.g., media/content providers, financial institutions, and hospital systems) and public sector entities (e.g., governmental agencies and school districts) have experienced significant growth and change in the role that bandwidth infrastructure plays within their organizations. As these needs continue to grow in both volume and criticality, end users will increasingly choose to directly procure bandwidth infrastructure solutions in order to gain more security, control and scale in their internal network operations. An example of this disintermediation is the trend of large school districts, adapting to e-education requirements, directly procuring dark fiber access as a replacement to more value-added solutions. We believe that, as these dynamics play out across all industries, the number of end users directly seeking access to bandwidth infrastructure will continue to expand.
By focusing on the reach, density, and performance of their physical networks, bandwidth infrastructure providers can deliver customized offerings to communications service providers and end users more quickly and with superior economics than these users could otherwise self-provide. Whether providing fiber connectivity to a wireless carrier’s towers to enable mobile broadband, supplying a national communications service provider with a metro fiber footprint in new markets, providing a lit bandwidth connection to multiple enterprise data centers for an industrial company, providing interconnection capabilities to a hosting company within a data center, or solving for the next society-impacting innovation, bandwidth infrastructure providers will continue to invest in and expand their infrastructure assets to meet this growing demand.
4
Given the natural economies of scale, there has been significant consolidation among bandwidth infrastructure providers, particularly in the U.S. We believe this consolidation trend will continue in the U.S. and is beginning in Europe and Canada. Combined with the barriers to new entrants, we foresee a decreasing number of bandwidth infrastructure providers against a backdrop of continued strong demand for their solutions.
Our Bandwidth Infrastructure Assets
Our bandwidth infrastructure assets consist of our fiber network (including the customer-accessed optronic components used to provide our lit offerings over our fiber network) and our data centers where we provide colocation and interconnection offerings.
Our Fiber Network
Our network footprint includes both large and small metro geographies, the extended suburban regions of many cities, and the large rural, national and international fiber links that connect our metro network sections. We believe that our network assets would be difficult to replicate given the geographic reach, network density, and capital investment required. Our fiber network spans over 128,910 route miles and 11,867,276 fiber miles (representing an average of 92 fibers per route), reaches approximately 403 geographic markets in the United States, Canada and Europe, and connects approximately 35,000 buildings, including 1,185 data centers. Our network allows our customers access to our high-bandwidth infrastructure solutions over redundant fiber facilities between and among key customer locations. We believe the location and density of our expansive network footprint allow us to more competitively satisfy our target customers’ bandwidth infrastructure needs at the local, regional, national, and international level relative to other regional bandwidth infrastructure solution providers or long-haul carriers. Our fiber network also has the following key attributes:
|
· |
Extensive Coverage. Our fiber network sections are located across large and small metro geographies, as well as the extended metro and suburban regions of many cities, and traverse large rural areas to connect metro markets. This network coverage allows us to address our target customers’ needs in a variety of geographies and for a variety of applications, all while remaining “on-net” and maintaining infrastructure economics. |
|
· |
Scalable Network Architecture. Our network is scalable, meaning we often have spare fiber, conduit access rights and/or rights of way that allow us to continue to add capacity to our network as our customers’ demand for our bandwidth infrastructure increases. In addition, the majority of our core fiber network segments utilize DWDM systems, nearly all of which have spare capacity through which we can continue to add dedicated Wavelengths to our network without consuming additional fiber. |
|
· |
Modern Fiber and Optronics. Our modern fiber network supports current generation optronic components including DWDM systems, carrier class Ethernet switches and IP routers. These customer-accessed components are used to provide our lit offerings. The vast majority of our network is capable of supporting next generation technologies with minimal capital investment. |
Metro Fiber Network Sections. We use our metro fiber network sections to provide access to bandwidth infrastructure within the metro markets where we operate. Our metro network sections are most commonly used in the following two scenarios: first, to provide connectivity between on-net buildings that are located in the same geographic market; second, to connect our on-net buildings within a metro market to another metro market via our regional and/or long-haul network sections. We continue to expand our metro fiber network sections within the metro geography and into the surrounding suburban areas as we extend to additional buildings to meet new demand on a success basis. Success-based expansion means that before we commit resources to expand our network, we have a signed customer contract that will provide us in most cases with an attractive return on required capital. In many of our metro markets, we have high count fiber cables (sometimes as many as 864 fibers per cable) and in some cases multiple spare conduits on our metro fiber routes. On individual segments where our fiber capacity becomes highly utilized, we seek to augment that capacity also on a success basis.
Regional and Long-haul Fiber Network Sections. We use our regional fiber network sections to provide bandwidth infrastructure connectivity between the metro markets where we operate. Our regional and long-haul network sections are most commonly used in the following three scenarios: first, to provide connectivity between on-net buildings that are located in different large markets (for example, between Chicago and New York); second, to connect
5
our on-net buildings in small and mid-sized markets back to major data centers, wireless switching centers, and carrier hotels in larger markets (for example, between Lima, Ohio and Cleveland, Ohio); third, occasionally our network sections provide connectivity between on-net buildings in two different small or mid-sized markets located in various parts of our regional network sections (for example, between Sioux Falls, South Dakota and Alexandria, Minnesota). We seek to continue to add new segments and markets to our regional and long-haul network sections on a success basis, supported by a customer contract. We have deployed current generation DWDM technologies across the majority of our regional and long-haul network sections, allowing a current maximum scaling to four terabytes (i.e. 4,000G) of bandwidth and the ability to add capacity as demand for bandwidth increases. We expect that as technology continues to advance, we will augment and invest in our regional and long-haul networks accordingly.
Fiber-to-the-Tower Network Sections. We operate fiber-to-the-tower network sections across our fiber network footprint and connect to wireless macro and small cell sites. These FTT network sections provide our customers with access to bandwidth infrastructure that offers significantly improved speed, scale, performance and reliability levels relative to legacy copper and microwave networks. Our FTT network sections are scalable, which means that we can quickly and easily increase the amount of bandwidth that we provide to each of the towers as our customers’ wireless data networks grow. Our FTT markets are generally in areas where we already have dense fiber network sections (either metro or regional), which affords us the ability to offer access to ring-protected mobile infrastructure. We are increasingly providing dark fiber solutions on our FTT network sections.
Through these fiber network sections, we provide connectivity to approximately 35,000 on-net buildings and are continually making success-based capital investments to increase our on-net building footprint. On-net buildings are buildings that are directly connected via fiber to our long-haul, regional, metro, and FTT network sections. Our customers generally purchase our bandwidth infrastructure offerings so they can transport their data, Internet, wireless and voice traffic between buildings directly connected to our network. The types of buildings connected to our network primarily consist of the following:
|
· |
Data Centers, Carrier Hotels and Central Offices. These buildings house multiple users of bandwidth infrastructure, serving as telecommunications and content exchange points. Our fiber network generally connects the most important of these buildings in the markets where we operate. We have over 1,800 of these types of facilities connected to our network. |
|
· |
Single-Tenant, High-Bandwidth Locations. Generally these are other telecom, media or Internet content buildings that house a single large user of bandwidth infrastructure. Examples of these buildings include video aggregation sites, mobile switching centers and carrier POPs. Our network is connected to these buildings only when the tenant is a customer. We currently have over 4,100 single-tenant, high-bandwidth locations on-net. |
|
· |
Cellular Towers. We connect to cellular towers and other locations that house wireless antennas. Typically, towers have multiple tenants, which provides us with the opportunity to provide our offerings to those additional tenants. |
|
· |
Enterprise Buildings. Our network extends to over 21,500 enterprise buildings. This grouping contains a mix of single-tenant and multi-tenant enterprise buildings and includes hospitals, corporate data centers, schools, government buildings, research centers and other key corporate locations that require access to bandwidth infrastructure. |
Our Data Centers
Many of our data center facilities are located in some of the most important carrier hotels in North America, including 60 Hudson Street and 111 8th Avenue in New York; 165 Halsey Street in Newark; 401 N. Broad Street in Philadelphia; 1 Summer Street in Boston; 1950 N. Stemmons Freeway and 2323 Bryan Street in Dallas; 2001 6th Street in Seattle; and 151 Front Street in Toronto. We have the exclusive right to operate and provide colocation and interconnection offerings in the Meet-Me Room at 60 Hudson Street. We also have colocation facilities located in Atlanta, Ashburn, Austin, Amsterdam, Chicago, Cleveland, Denver, Las Vegas, Los Angeles, McLean, Memphis, Miami, Minneapolis, Montreal, Nashville, Paris, Phoenix, San Diego, Santa Clara, Toronto and four additional locations in Europe. All of our facilities are network-neutral and have ample power to meet customer needs, backup power in the form of batteries and generators, air conditioning, modern fire suppression technology, 24/7 security monitoring, and
6
redundant cooling capabilities. We have long-term leases with the owners of each of the buildings where we provide colocation offerings. Our colocation facilities total approximately 1,034,000 square feet of licensable colocation space.
Underlying Rights
We have the necessary right-of-way agreements and other required rights, including state and federal government authorization, to allow us to maintain and expand our fiber network sections that are located on private property and public rights-of-way, including utility poles. When we expand our network, we obtain the necessary construction permits, license agreements, permits and franchise agreements. Certain of these permits, licenses and franchises are for a limited duration. When we need to use private property, our strategy is to obtain rights-of-way under long-term contracts.
Our Segments and Offerings
We provide high-bandwidth infrastructure products and solutions over our extensive metro, regional, and long-haul fiber networks sections and through our interconnect-oriented data center facilities. We provide our products and solutions through our six operating segments: Fiber Solutions, Transport, Enterprise Networks, Zayo Colocation (zColo), Allstream and Other. Across our segments, we operate individual Strategic Product Groups (“SPGs”). Each SPG has financial accountability and decision-making authority, which promotes agility in the fast-moving markets where we operate. Financial information for each of our operating segments and our domestic and foreign operations is contained in Note 16 – Segment Reporting to our consolidated financial statements.
Fiber Solutions. Through the Fiber Solutions segment, we provide access to raw bandwidth infrastructure to customers that require control of their internal networks. These solutions include dark fiber, dedicated lit network sections and mobile infrastructure (fiber-to-the-tower and small cell). Dark fiber is a physically separate and secure, private platform for dedicated bandwidth. We lease dark fiber pairs (usually 2 to 12 total fibers) to our customers, who “light” the fiber using their own optronics. Our mobile infrastructure solutions permit direct fiber connections to cell towers, small cells, hub sites, and mobile switching centers. Fiber Solutions customers include carriers and other communication service providers, Internet service providers, wireless service providers, major media and content companies, large enterprises, and other companies that have the expertise to run their own fiber optic networks or require interconnected technical space. The contract terms in the Fiber Solutions segment tend to range from three to twenty years.
Transport. The Transport segment provides access to lit bandwidth infrastructure solutions over our metro, regional, and long-haul fiber network sections. The segment uses customer-accessed optronics to light the fiber, and our customers pay for access based on the amount and type of bandwidth they require. Our offerings within this segment include Wavelengths, Ethernet, SONET and wholesale IP. We target customers who require a significant amount of bandwidth across their networks. Transport customers include carriers, content providers, financial services companies, healthcare, government entities, education institutions and other medium and large enterprises. The contract terms in this segment tend to range from two to five years. SPGs within the Transport segment include:
|
· |
Zayo Wavelength (“Waves”) Offerings. Through our Waves SPG, we provide access to lit bandwidth infrastructure to our customers by deploying optical Wavelength technology. The offerings are provided by using DWDM optronic components to “multiplex” multiple channels (i.e., Wavelengths) of dedicated capacity on a single fiber pair. Access capacity is provided at speeds of 1G, 2.5G, 10G, 40G, and 100G. Customers include carriers, financial services companies, healthcare, government institutions, education institutions and other enterprises. The contract terms for Wavelength offerings are typically between one and five years for a fixed recurring monthly fee and in some cases an additional upfront, non-recurring fee. |
|
· |
Zayo Ethernet Offerings. Our Ethernet SPG provides access to our lit bandwidth infrastructure to our customers by deploying Ethernet technology. Ethernet offerings are offered in metro markets as well as between metro areas (intercity) in point-to-point and multi-point configurations. Unlike data movement over a dedicated Wavelength network, information flow over Ethernet is transferred in a packet or frame across the network. The frame enables the data to navigate across a shared infrastructure in order to reach the customer required destination. Access capacity is provided in speeds ranging from 10Mb to 10G. Customers include carriers, financial services companies, healthcare, government institutions, education |
7
institutions and other enterprises. Contract terms in our Ethernet offerings typically range between one and five years for a fixed recurring monthly fee and in some cases an additional upfront, non-recurring fee. |
|
· |
Zayo SONET Offerings. Through our SONET SPG we provide access to lit bandwidth infrastructure to our customers by deploying SONET technology. SONET is a standardized time-division protocol that transfers multiple digital bit streams over optical fiber using lasers. SONET technology is often used to support private line technology. This protocol enables movement of voice, data and video at high speeds. SONET network sections are protected, which provides for virtually instantaneous restoration of connectivity in the event of a fiber cut or component failure. Access capacity is provided at speeds ranging from DS-1 (1.54Mb) to OC-192 (10G). Customers in this group are largely carriers. The contract terms for SONET offerings typically range between one and five years for a fixed recurring monthly fee and in some cases an additional upfront, non-recurring fee. SONET is generally a legacy product that is gradually being replaced by Ethernet, Wavelength and dark fiber solutions. As a result, the SONET SPG generally manages its business to maximize cash generation and deploys minimal growth capital. |
|
· |
Zayo Internet Protocol (“IP”) Transit Offerings. Through our IP Transit SPG we provide access to lit bandwidth infrastructure to our customers by deploying Internet Protocol technology. IP technology permits the flow of data across multiple circuits over a shared infrastructure from the customer source to the customer required destination. Information leaving the source is divided into multiple packets and each packet traverses the network utilizing the most efficient path and means available, as determined by a network of IP routers. Packets of information may utilize different physical circuits or paths in order to reach the destination, at which point the packets are reassembled to form the complete communication. The offerings are generally used to exchange communication on or access the public Internet. Access capacity is provided at speeds ranging from 10Mb to 100G on a single customer port interface. Customers include regional and International telecommunications and cable carriers, ISPs, enterprises, educational institutions and content companies. The contract terms for IP offerings typically range between one and three years for a fixed recurring monthly fee and in some cases a usage-based and/or an additional upfront, non-recurring fee. Pricing is generally a function of bandwidth capacity and the access required to accommodate traffic from the customer location to a public Internet exchange. |
Enterprise Networks. The Enterprise Networks segment provides connectivity and telecommunications solutions to medium and large enterprises. Our offerings within this segment include Internet, wide area networking products, managed products and cloud based computing and storage products. Solutions range from point-to-point data connections to multi-site managed networks to international outsourced IT infrastructure environments. The contract terms in the Enterprise Networks segment tend to range from one to five years. SPGs within the Enterprise Networks segment include:
|
· |
Wide Area Networks (“WAN”). Our WAN SPG provides access to lit bandwidth infrastructure to customers by deploying Internet Protocol and managed Wide Area Network technology. These offerings are generally used to exchange or access traffic on the public Internet and include Dedicated Internet Access, IP Virtual Private Networks (“VPN”) and Distributed Denial of Service mitigation. The contract terms typically range between one and five years for a fixed recurring monthly fee and in some cases an additional upfront, non-recurring fee. Pricing is generally a function of bandwidth capacity and the access required to accommodate traffic from customer location to an Internet gateway. |
|
· |
Zayo Cloud Services (“Cloud”). The Zayo Cloud Services SPG combines private cloud, public cloud and managed offerings in order to provide its customers secure infrastructure as a service (IaaS), which enables on-demand scaling and virtual computing in hybrid environments. |
|
· |
CloudLink: Connect to the cloud (“CloudLink”). CloudLink provides users private, secure, dedicated network connectivity to various cloud providers utilizing our fiber communications infrastructure. CloudLink is available across the entire product spectrum: Dark Fiber, Wavelengths, Ethernet, IP, and is optimized to leverage our software defined networking platform in order to expedite the provisioning process and enhance service management. |
8
Zayo Colocation (“zColo”). The Colocation segment provides data center infrastructure solutions to a broad range of enterprise, carrier, cloud, and content customers. Our offerings within this segment include the provision of colocation space, power and interconnection offerings in North America and Western Europe. Solutions range in size from single cabinet solutions to 1MW+ data center infrastructure environments. Our data centers also support a large component of networking components for the purpose of aggregating and accommodating customers’ data, voice, Internet, and video traffic. The contract terms in this segment tend to range from two to five years.
Allstream. The Allstream segment provides Cloud VoIP and Data Solutions. This includes a full range of local voice offerings allowing business customers to complete telephone calls in their local exchange, as well as make long distance, toll-free and related calls. Unified Communications is the integration of real-time communication services such as telephony (including Cloud-based IP telephony), instant messaging and video conferencing with non-real-time communication services, such as integrated voicemail and e-mail. Allstream also provides customers with comprehensive telecommunications services including Ethernet, and IP/MPLS VPN Solutions.
Other. The Other segment is primarily comprised of Zayo Professional Services (“ZPS”). ZPS provides network and technical resources to customers who wish to leverage our expertise in designing, acquiring and maintaining network sections. The contract terms typically run for one year for a fixed recurring monthly fee in the case of network and on an hourly basis for technical resources (usage revenue). ZPS also generates revenue via telecommunication equipment sales.
During Fiscal 2018, with the continued increase in our scope and scale, our chief operating decision maker ("CODM"), who is our Chief Executive Officer, implemented certain organizational changes to the management and operation of the business that directly impact how the CODM makes resource allocation decisions and manages the Company. The changes in structure had the impact of creating a new SPG and re-aligning an existing SPG among our reportable segments, as described below. The changes in structure also resulted in changes in how we measure the relative burden each segment bears of indirect and corporate related costs, and in adjustments to intercompany pricing which more closely align to third party pricing on the products and offerings which are exchanged between our SPGs.
Effective April 1, 2018 the Ethernet SPG, previously reported under our Enterprise Networks segment, is now reported under our Transport segment. Additionally, certain activities and operations of our legacy Waves, WAN, and Ethernet SPGs were combined to form a new SPG, CloudLink. These changes to our existing reportable segments (the “Realignment”) have been recast for all prior period financial and operating metrics presented in this Annual Report for comparability, such as;
|
· |
Certain activities and operations of our legacy Waves, WAN, and Ethernet SPGs, after giving effect to the Realignment, are now reported in a new SPG, CloudLink, under the Enterprise Networks segment; and |
|
· |
Our IP and Sonet SPGs, and the remaining activities and operations of our legacy Waves, and Ethernet SPGs (the activities and operations not related to CloudLink), after giving effect to the Realignment, are now reported under the Transport segment. |
For a discussion of certain geographic information regarding our revenue from external customers and long-lived assets and a discussion of financial information and operating segments, please see the notes to our consolidated financial statements appearing elsewhere in this Annual Report on Form 10-K.
Our Operations
Network Management and Operations
Our primary network operating center (“NOC”) is located in Tulsa, Oklahoma and provides 24 hours per day, 365 days per year monitoring and network surveillance. As part of our business continuity plan, our primary NOC is backed up by several regional operations centers located in Washington, D.C.; Allentown, Pennsylvania; and Butte, Montana. We continually monitor for, and proactively respond to, any events that negatively impact or interrupt the network access and services that we provide to our customers. Our NOC also responds to customer network inquiries via standard customer trouble ticket procedures. Our NOC coordinates and notifies our customers of maintenance activities and is the organization responsible for ensuring that we meet our access and service level agreements.
9
Information Technology
Our Information Technology systems have been designed and built specifically for the needs of a focused bandwidth infrastructure provider primarily leveraging the salesforce.com platform. This platform was adopted at our inception and has been enhanced over time to integrate all of our acquired companies and increase functionality in every area.
Our current systems’ capability is mature, and we view our application functionality as a competitive advantage in our industry. Our system is differentiated from the typical telecom industry technology solution consisting of separate and loosely integrated sales force automation, customer relationship management, mapping, inventory, financial, provisioning and other systems with multiple, sometimes conflicting databases.
We have also developed within our salesforce.com platform a proprietary capability we call Tranzact. Tranzact is a set of tools and processes designed to enhance the speed and simplicity of procuring bandwidth infrastructure solutions. We believe Tranzact will further increase our competitive advantage in delivering bandwidth infrastructure solutions.
We have a fully implemented business continuity and disaster recovery plan that provides near real-time data access from physically diverse data centers (Dallas and Washington, D.C.). We further protect our data with off-site data storage practices.
Our Sales and Marketing Organization
Our business primarily engages in direct sales through our sales organization, consisting of 303 sales representatives as of June 30, 2018. Each of these sales representatives is part of an enterprise or carrier focused sales team led by a sales director whose team is responsible for meeting a set of quarterly net install booking targets. The sales organization sells access and services across all our SPGs. The sales representatives are directly supported by sales management, engineering, solutions engineering and marketing staff.
The sales organization is organized into five “Mega-Vertical” sectors; Finance & Professional Services, Media Content & Commerce, Public Sector Health & Utilities, Cloud Software & Infrastructure and Carrier. Each of these channels maintains dedicated sales and solutions engineering support resources. We derive revenues from these sectors using a mix of Direct Sales, Inside Sales and Indirect Channels Partners. These sales channels operate across the US, Canada & Europe, with occasional customer visits to Asia & Central / South America.
Our direct sales force is compensated through a unique system relative to typical industry practices. Sales staff are compensated through salary and incentive compensation, which is comprised of cash and equity. Incentive compensation is achieved based upon the net present value (“NPV”) of the contracted access and services sold, the incremental revenue related to contracted access and services sold and the effective management of churn related to the accounts they manage. We believe that this compensation system best aligns the interests of our salespeople, management and our stockholders. It also is an example of the financial philosophy and culture that we have developed since our inception.
Separate from the sales groups, we have a Strategic Marketing group that is responsible for our digital programs and presence, field marketing and vertical strategy. Vertical strategy leads are dedicated to supporting each "Mega Vertical" and focus on understanding key trends, marketplace dynamics and articulating back to the business how we can best serve our customers communications infrastructure needs.
Our Customers
Our customers generally have a significant and growing need for the bandwidth infrastructure solutions that we offer. Our customer base consists of wireless service providers, carriers and other communication service providers, media and content companies (including cable and satellite video providers), and other bandwidth-intensive businesses in the education, healthcare, financial services, governmental and technology sectors. Our largest single customer, based on recurring revenue, accounted for approximately 8% of our revenue during the year ended June 30, 2018, and total revenues from our top ten customers accounted for approximately 29% of our revenue during the same period. These customers are multinational organizations with substantial liquidity and access to capital, and whose bandwidth needs are mission-critical to their own businesses and strategies. While these large customers generally have a finite set of master
10
contracts with us, they procure a large volume of individual access rights and services from us, each of which has its own access and service level agreement and term.
The majority of our customers sign Master Customer Agreements (“MCAs”) that contain standard terms and conditions including access and service level agreements, required response intervals, indemnification, default, force majeure, assignment and notification, limitation of liability, confidentiality and other key terms and conditions. Most MCAs also contain appendices that contain information that is specific to each of the access rights and services that we provide. The MCAs either have exhibits that contain customer orders or, alternatively, the terms for access and services ordered are set forth in a separate customer order. Each customer order sets forth the minimum contract duration, the monthly recurring charge, and the non-recurring charges.
Our Business Strategy
In pursuit of our mission, our Business Strategy includes the following key elements:
|
· |
Focus on Bandwidth Infrastructure. We expect that bandwidth needs for mobile applications, cloud-based computing, and machine-to-machine connectivity will continue to grow with the continued adoption of bandwidth-intensive devices, as well as the escalating demand for Internet-delivered video. We focus on providing high-bandwidth infrastructure solutions, which we believe are essential in the consumption and delivery of bandwidth-intensive applications and services by our customers, enterprise customers and communications service providers. We believe our disciplined approach to providing these critical access rights and to our targeted customers enables us to offer a high level of customer satisfaction, while at the same time being responsive to changes in the marketplace. |
|
· |
Target Large Consumers of Bandwidth. Our asset base and product suite are geared for large users of bandwidth with high connectivity requirements. The majority of our customers require more than 10G of bandwidth; many of our customers require multiple terabytes of bandwidth. Our revenue base is generally characterized by customers with a high bandwidth spend, consisting of a large number of individual access rights and services and increasing bandwidth infrastructure access and service demand. Tailoring our operations around these offerings, services and customers allows us to operate efficiently and meet these large consumers’ requirements for mission-critical infrastructure. |
|
· |
Leverage Our Extensive Asset Base by Selling Offerings on Our Network. Targeting our sales efforts to solutions that utilize our existing fiber network and data centers enables us to limit our reliance on third-party providers. We believe this in turn produces high incremental margins, which helps us expand consolidated margins, achieve attractive returns on the capital we invest, and realize significant levered free cash flow. We also believe this enables us to provide our customers with a superior level of customer satisfaction due to the relative ease in responding to customer inquiries over our one contiguous fiber network. Our existing network enables us to offer additional bandwidth access to our existing customers as their capacity needs grow. |
|
· |
Continue to Expand Our Infrastructure Assets. Our ability to rapidly add network capacity to meet the growing requirements of our customers is an important component of our value proposition. We will continue to seek opportunities to expand our network reach where supporting customer contracts provide an attractive return on our investment. The expansion of our network footprint also provides the ancillary benefit of bringing other potential customer locations within reach. We design our network with additional capacity so that increasing bandwidth capacity can be deployed economically and efficiently. Capital expenditures are primarily success-based. |
|
· |
Leverage Our Existing Relationships and Assets to Innovate. We believe we possess a unique set of assets and management systems designed to deliver customer solutions tailored to specific trends we observe in the marketplace. Our high-energy, entrepreneurial culture fosters employee innovation on an ongoing basis in response to specific customer requirements. Furthermore, we plan to continue to commit capital to new lines of infrastructure businesses that leverage our existing assets. For example, we are expanding into small cell infrastructure solutions provided to wireless services providers. These solutions entail us providing dark fiber and related offerings from a small cell location back to a mobile switching center. We provide access for the fiber-based transport over our existing and/or newly constructed fiber |
11
network sections. In addition, we provide network-neutral space and power for wireless service providers to co-locate their small cell antennas and ancillary equipment. |
|
· |
Intelligently Expand Through Acquisitions. We have made 45 acquisitions to date for an aggregate purchase price, net of cash, of $6.7 billion. We believe we have consistently demonstrated an ability to acquire and effectively integrate companies, realize cost synergies, and organically grow revenue post-acquisition. Acquisitions have the ability to increase the scale of our operations, which in turn affords us the ability to expand our operating leverage, extend our network reach, and broaden our customer base. We believe our ability to realize significant cost synergies through acquisitions provides us with a competitive advantage in future consolidation opportunities within our industry. We will continue to evaluate potential acquisition opportunities and are regularly involved in acquisition discussions. We will evaluate these opportunities based on a number of criteria, including expected return on capital, the quality of the infrastructure assets, the fit within our existing businesses, the opportunity to expand our network, and the opportunity to create value through the realization of cost synergies. |
Our Competitive Strengths
We believe the following are among our core competitive strengths and enable us to differentiate ourselves in the markets where we operate:
|
· |
Unique Bandwidth Infrastructure Assets. We believe replicating our extensive metro, regional, and long-haul fiber assets would be difficult given the significant capital, time, permitting, and expertise required. Our fiber spans 128,910 route miles and 11,867,276 fiber miles (representing an average of 403 geographic markets in the United States, Canada and Europe), and connects to approximately 35,000 buildings. The majority of the markets that we serve and buildings to which we connect have few other networks capable of providing similar high-bandwidth infrastructure and connectivity solutions, which we believe provides us with a sustainable competitive advantage in these markets, and positions us as a mission-critical infrastructure supplier to the largest users of bandwidth. We believe that the vast majority of customers using our network, including our lit bandwidth, fiber-to-the-tower, and dark fiber customers, choose our offerings due to the quality and reach of our network, and the ability our network gives us to innovate and scale with their growing bandwidth needs. Additionally, we operate 50 data center facilities, which are located in eleven of the most important carrier hotels in the U.S., Canada and France. This collective presence, combined with our high network density, creates a network effect that helps us retain existing customers and attract new customers. From July 1, 2015 through June 30, 2018, exclusive of acquisitions, we have invested approximately $2.3 billion of capital in our network, including expansion and maintenance expenditures. |
|
· |
Strong Revenue Growth, Visibility, and Durability. We have consistently grown our organic revenue, as gross installed revenue has exceeded churn processed in every quarter since we began reporting in March 2010. We believe our exposure to the enduring trend of increasing bandwidth consumption, combined with our focused execution, have allowed us to achieve this consistent growth. We typically provide access to our bandwidth infrastructure for a fixed monthly recurring fee under multi-year contracts. Our contract terms range from one year to twenty years. Our customers use our bandwidth infrastructure to support their mission-critical networks and applications. The switching costs and effort required to replace our solutions can be high, particularly for the solutions within our Fiber Solutions and Transport segments, given the criticality of our solutions and the potential cost and disruption. We believe that increasing bandwidth needs combined with the mission-critical nature of our solutions provided under multi-year contracts create strong revenue growth, visibility, and durability, which support our decision-making abilities and financial stability. We believe that our industry’s high barriers to entry, our economies of scale and scope and customer switching costs contribute to our strong financial performance. |
|
· |
Customer Service and Ability to Innovate for Our Customers. Our sales and product professionals work closely with potential and existing customers to design tailored high-bandwidth connectivity solutions across our SPGs to meet specific, varying, and evolving customer needs. We are focused on delivering high-quality, reliable access to our customers. We achieve this by leveraging our contiguous network to expand with our customers as they seek to build scale, coverage, and/or performance. Additionally, our |
12
focus on targeting the largest and most sophisticated users of bandwidth keeps our sales, engineering, and customer satisfaction organizations attuned to the latest technologies, architectures, and solutions that our customers may seek to implement. We believe our willingness to innovate for our customers and our dedication to customer satisfaction help establish our position as an important infrastructure supplier and allow us to attract new customers and businesses, sell an increasing amount of access rights and services to our existing customers, and reduce customer turnover. |
|
· |
Strategic, Operational and Financial Transparency Excellence. As part of our strategy to attract and retain the largest users of bandwidth infrastructure, we have completed and integrated 45 acquisitions to date. Our acquired assets have been combined to create a contiguous network with the ability to provision and maintain local, regional, national, or international high-bandwidth connections across our SPGs. Our entire network, sales and churn activity, installation pipeline, NPV commission plans, and all customer contracts are managed through an integrated operating and reporting platform, which gives management strong visibility into the business and improves our ability to drive return-maximizing decisions throughout the organization. Our focus on operational and financial transparency not only allows us to be very nimble in attacking various market opportunities, but also provides us the ability to deliver disclosure that our stockholders and other stakeholders can use to accurately judge management’s performance from a capital allocation, financial, and operational perspective. |
|
· |
Financially Focused and Entrepreneurial Culture. Virtually all operational and financial decisions we make are driven by the standard of maximizing the value of our enterprise. Our sales commission plans use an NPV-based approach with the goal of encouraging the proper behavior within our sales force, and our SPGs are held to group level equity internal rate of return (“IRR”) targets set by management. To align individual behaviors with stockholder objectives, equity compensation is used throughout the Company, and our compensation plans include a larger equity component than we believe is standard in our industry. In addition to striving for industry-leading operational and growth outcomes to drive value creation, we are prepared to use debt capacity to enhance stockholder returns, but not at the expense of other stakeholders and only at levels we believe are in the long-term interests of the Company, our customers, and our stockholders. Finally, our owners’ manual, mission, and investor transparency all serve to enhance cultural alignment across the Company and our stockholders. |
|
· |
Experienced Management with Unique Leadership Approach. We have assembled an experienced management team that we believe is well-qualified to lead our Company and execute our strategy. Our management team has substantial industry experience in managing and designing fiber network and network-neutral colocation and interconnection facilities and in selling and marketing bandwidth infrastructure. In addition, our management team has significant experience in acquiring and integrating bandwidth infrastructure and assets. Our management team is a cohesive unit with a common history that in many cases precedes the Company’s founding. We also believe that our approach to leadership - operationally, financially, culturally - is unique in our industry and differentiates us from our competitors. |
Our Competition
Fiber Solutions
Given the requirement to own the underlying bandwidth infrastructure assets (e.g., fiber networks) in order to provide dark fiber solutions, the competitive environment tends to be less intensive for these products and the barriers to entry are high. The degree of competition and parties in competition vary by physical infrastructure and by individual market and fiber route.
Competition in dark fiber solutions tends to be less intense than for lit bandwidth infrastructure solutions primarily because a provider must predominantly own and operate a high count fiber network covering a substantial portion of the geographical demand in order to compete for a customer’s business. The uniqueness, density and depth (i.e., high fiber count) of our metro, regional, and long-haul fiber network sections is therefore a key differentiating factor. In addition, given that providing dark fiber solutions often includes some degree of network expansion, dark fiber providers must also have internal project management expertise and access to capital to execute on the expansion aspect of the business. Due to the custom nature of most dark fiber opportunities, many larger lit bandwidth infrastructure providers do not actively market dark fiber as a product, even if they own fiber networks in the desired geographies. As a result,
13
competition is often more limited in the dark fiber market and highly dependent on the local (even sub-market) supply and demand environment. Given this dynamic and the generally longer contractual term of dark fiber solutions, dark fiber pricing tends to be more inflationary in nature.
Specific dark fiber competitors vary based on geography, and often a particular solution can be provided by only one to three providers that have sufficient fiber in place in the desired area or route. Historically, these competitors have fallen into two categories: first, privately owned regional bandwidth infrastructure providers with a similar degree of focus (e.g., Fiber Light) and second, single market dark fiber providers with market and fiber construction expertise (e.g., DQE Communications and Edison Carrier Solutions). More recently other multi-geography competitors have emerged due to acquisitions in the industry (e.g., Crown Castle and Uniti).
Competition in mobile infrastructure solutions tends to mirror dark fiber solutions because of the need to own and operate an expansive and deep metro fiber network in order to compete. Given the frequent need to expand upon an existing fiber footprint in order to reach additional cell towers and small cell locations, project management expertise and access to capital is also a key competitive factor. One additional criterion is that wireless carriers prefer to work with a more finite group of mobile infrastructure providers on either a metro or regional geographic basis. As a result, the competitive group tends to match that of dark fiber solutions, with the addition of two competitive groups: first, local cable providers and ILECs who will sometimes break from their retail and small enterprise core focus to compete for FTT business, often as a result of legacy copper or coaxial-based cable provided to these towers; second, microwave backhaul providers who focus on more remote or rural towers that have lesser bandwidth needs that they can serve with less capital-intensive (and less bandwidth-capable) microwave solutions at a lower total cost. Examples of these additional mobile infrastructure competitors are divisions of Comcast, CenturyLink, Crown Castle, Conterra and Mobilitie.
Transport
We believe that some of the key factors that influence our customers’ selection of us as their solution provider are our ability to provide on-net solutions that utilize our fiber network on an end-to-end basis, the availability of high capacity offerings (up to 100G or higher as optical technology advances), the uniqueness, quantity and latency of available intercity and metro routes, the peering capacity and reach of our IP network, the price of the offerings available, and the ongoing level of network availability provided.
Generally, price competition varies depending on the location of the customer’s selected endpoints and the uniqueness of network assets. We face direct price competition when there are other fiber-based providers who have intercity networks that leverage similar fiber routes with similar end to end route latency. Often a particular solution can be provided by only one to three providers that have comparable network reach in place. Typically, these competitors are publicly traded communications service providers that also provide bandwidth infrastructure such as Windstream, TeliaSonera, or Cogent Communications, or in certain geographies are privately-held companies such as EU Networks. We may also compete with large, well-capitalized ILECs that also provide bandwidth infrastructure, such as AT&T Inc. and CenturyLink, Inc., who have a well established and global IP offering. We believe that price competition will continue where our competitors have comparable existing fiber and optical networks. Some of our competitors have long-standing customer relationships, very large enterprise values, and significant access to capital.
Enterprise Networks
Enterprise Networks is focused on offering network connectivity, cloud and cyber security solutions to large multi-site enterprises. The competition is intense and varied for the enterprise IT business, and the specific competitors are based on each of the offering categories and geographies. Our key challenges range from aggressive pricing to an evolving competitive field with the completion of each new merger or acquisition.
From a network connectivity perspective, our competitors range from well-capitalized ILECs that also provide bandwidth infrastructure, such as AT&T Inc., CenturyLink, Inc., and Verizon Communications Inc., or publicly traded communications service providers that also provide bandwidth infrastructure, such as Cogent and Windstream. In some geographies, we also compete with Lightower, GTT and Comcast. For cloud services our competition also varies depending on the type of service. For example, we compete with Dell EMC, HPE and NetApp in the Private Cloud market but we compete with AWS and Rackspace and smaller cloud service providers for Object-Based Storage business. In the area of cybersecurity, the competitive field is vast and specialized and will vary depending on the
14
specific security need ranging from infrastructure security, endpoint security, application security, managed security to threat analysis and protection, Internet of Things and data security to name a few.
Many of our competitors in the enterprise market are well established with long-standing relationships, and we must compete in a variety of aspects as enterprise IT customers are tech savvy and well informed. As an example, purchasers of network solutions generally base their decisions on the best value, which includes price, route (diversity and latency), flexibility, and customer satisfaction responsiveness. Two of our key competitive challenges are brand recognition and product set awareness. However, we believe we are very competitive when we can communicate our capabilities that include our dense, global fiber network, our ability to implement complex and unique solutions and our focus on customer satisfaction at a price that meets the customer’s budget. With Enterprise Networks, we believe we can aggressively compete with the short list of single source global providers.
zColo
The market for our colocation and interconnection offerings is very competitive. We compete based on location, availability, quality of facility infrastructure, network carrier density, breadth of network connectivity options, type and quantity of customers in our data centers, and the overall geographic reach of our platform. We compete against both public colocation providers who have large enterprise values, and privately-held colocation providers who are well funded. Some of our competitors have long-standing customer relationships and significant access to capital, which may enable them to materially increase available data center space, and therefore lower overall market pricing for such solutions. A portion of our competitors operate at larger scale in the same markets as us; others compete cross regionally attracting a customer base that values and requires global reach and scale. We differentiate from our competitors by providing our customers with on-net access to our robust fiber network and by allowing spend portability between our entire portfolio of communications infrastructure solutions as their needs change.
These focused interconnection and colocation providers include: Equinix, Coresite, Cologix, Flexential, Digital Realty Trust Inc, and QTS Realty Trust Inc. These companies offer similar solutions and operate in similar markets to us. Our ability to compete is based on the strategic location of our assets, a highly complementary global fiber network, an aptitude for commercial flexibility in contracts, and a competency in the implementation of colocation and interconnection offerings.
Allstream
Allstream serves business customers throughout the United States and Canada. Its communications technologies and services include a range of scalable IP, cloud, voice and data solutions that help organizations communicate and collaborate more efficiently and profitably. Our largest competitors in Canada are the incumbent telecommunications companies Bell, TELUS and Rogers. Our largest U.S. competitors are Masergy, Comcast, WAVE, CenturyLink and Verizon. We also compete with other telecommunications companies, such as established cable and hydro companies, and smaller companies or re-sellers that have a more limited network.
Regulatory Matters
Our operations require that certain of our subsidiaries hold licenses, certificates, and/or other regulatory authorizations from the Federal Communications Commission (“FCC”), state Public Utilities Commissions (“PUCs”), European and Canadian telecommunications regulators (such as, Ofcom and ARCEP in Europe and CRTC in Canada) and other foreign regulators, all of which we have obtained and maintain in the normal course of our business. The FCC, State PUCs and foreign regulators generally have the power to modify or terminate a carrier’s authority to provide regulated wireline offerings for failure to comply with certain federal, state and foreign laws and regulations, and may impose fines or other penalties for violations of the same. The State PUCs typically have similar powers with respect to the intrastate offerings that we provide under their jurisdiction. In addition, we are required to submit periodic reports to the FCC, State PUCs, and foreign regulators documenting interstate, intrastate and foreign revenue, among other data, for fee assessments and general regulatory governance, and in some states are required to file tariffs of our rates, terms, and conditions of access and service. In order to engage in certain transactions in these jurisdictions, including changes of control, the encumbrance of certain assets, the issuance of securities, the incurrence of indebtedness, the guarantee of indebtedness of other entities, including subsidiaries of ours, and the transfer of our assets, we are required to provide notice and/or obtain prior approval from certain of these governmental agencies. The construction of additions to our current fiber network is also subject to certain governmental permitting and licensing requirements.
15
In addition, our business is subject to various other regulations at the federal, state, local and international levels. These regulations affect the way we can conduct our business and our costs of doing so. However, we believe, based on our examination of such existing and potential new regulations being considered in ongoing FCC and State PUC and European, Canadian and other foreign governmental proceedings, that such regulations will not have a significant impact on us.
Evaluation and Preparation for Potential Real Estate Investment Trust Conversion
On May 3, 2018, we announced that we completed the first phase of our investigation on the advisability and feasibility of a conversion to a real estate investment trust for U.S. federal income tax purposes (a “REIT”). We have begun the next phase of our evaluation and preparation for a potential conversion to a REIT. As part of these efforts, we have begun a direct dialogue with the U.S. Internal Revenue Service (“IRS”) in an effort to obtain clarity and support for our position, and we are seeking a private letter ruling (“PLR”) from the IRS. Also, we have begun to execute the organizational changes that are required to operate as a REIT, including the realignment of our business segments to clearly delineate the leasing of network assets from ancillary services and, in particular, the separation and potential divestiture or deconsolidation of our Allstream business segment. These organization changes do not result in any changes to our reportable segments.
If, following our current phase of evaluation and preparation, we make a definitive decision to convert to a REIT and are successful in qualifying for taxation as a REIT, we will generally be permitted to deduct from federal income taxes the dividends that we pay to our stockholders. The income represented by such dividends would not be subject to federal income taxation at the entity level but would be taxed, if at all, at the stockholder level. Nevertheless, the income of our domestic taxable REIT subsidiaries (each, a “TRS”), which will hold our U.S. operations that may not be REIT-compliant, will be subject, as applicable, to federal and state corporate income tax. Likewise, our foreign subsidiaries will continue to be subject to foreign income taxes in jurisdictions in which they hold assets or conduct operations, regardless of whether held or conducted through TRSs or through entities that are disregarded from us for U.S. federal income tax purposes. Also, we will be subject to a separate corporate income tax on any gains recognized during a specified period (generally 5 years) following the REIT conversion that are attributable to “built-in” gains with respect to the assets that we own on the date we convert to a REIT.
Our ability to qualify for taxation as a REIT will depend upon our continuing compliance following our REIT conversion with various requirements, including requirements related to the nature of our assets, the sources of our income and the distributions to our stockholders. If we fail to qualify for taxation as a REIT, we will be subject to federal income tax at regular corporate income tax rates. Even if we qualify for taxation as a REIT, we may be subject to certain federal, state, local and foreign taxes on our income and property. In particular, while state income tax regimes often parallel the federal income tax regime for REITs described above, many states do not completely follow federal rules and some may not follow them at all.
The current phase of our evaluation and preparation includes seeking a PLR from the IRS. We are requesting that our PLR address whether our revenues from dark and lit fiber satisfy applicable REIT income tests, and our ultimate decision to convert to a REIT may depend upon a favorable ruling from the IRS on this topic. We submitted a PLR request to the IRS in July 2018, but the IRS may not provide a response until 2019 or later or may not respond at all.
At this stage of our evaluation and preparation for a potential conversion to a REIT, we cannot accurately estimate the costs required to support any potential conversion, but we anticipate that our costs would include various administrative costs in addition to certain related tax liabilities.
Website Access and Important Investor Information
We file periodic reports, proxy statements, and other information with the Securities and Exchange Commission (the “SEC”). The public may read or copy any materials we file with, or furnish to, the SEC at the SEC’s Public Reference Room at 100 F Street, NE, Washington, DC 20549. The public may obtain information on the operation of the Public Reference Room by calling the SEC at 1-800-SEC-0330. The SEC maintains an Internet site (http://www.sec.gov) that contains reports, proxy and information statements, and other information regarding issuers that file electronically with the SEC.
16
Our website address is www.zayo.com, and we routinely post important investor information in the “Investors” section of our website at http://investors.zayo.com/. The information contained on, or that may be accessed through, our website is not part of this Annual Report on Form 10-K (this “Annual Report”). You may obtain free electronic copies of our annual reports on Form 10-K, quarterly reports on Form 10-Q, current reports on Form 8-K and all amendments to those reports in the “Investors” section of our website under the heading “SEC Filings”. These reports are made available on our website as soon as reasonably practicable after we electronically file them with the SEC.
We have adopted a written code of ethics applicable to our directors, officers and employees, including our principal executive officer and principal financial and accounting officers (or persons performing similar functions), in accordance with Section 406 of the Sarbanes-Oxley Act of 2002 and the rules of the SEC. In the event that we make any changes to, or provide any waivers from, the provisions of our code of ethics applicable to our executive officers and directors, we intend to disclose these events on our website or in a report on Form 8-K within four business days of such event. This code of ethics is available in the “Corporate Governance” section of our website at http://investors.zayo.com/corporate-governance.
Special Note Regarding Forward-Looking Statements
Information contained in this Annual Report that is not historical by nature constitutes “forward-looking statements” within the meaning of Section 27A of the Securities Act of 1933, Section 21E of the Securities Exchange Act of 1934 (the “Exchange Act”) and the Private Securities Litigation Reform Act of 1995. These forward-looking statements typically include words such as “believes,” “expects,” “plans,” “intends,” “estimates,” “projects,” “could,” “may,” “will,” “should,” or “anticipates” or the negatives thereof, other variations thereon or comparable terminology, or discuss strategy. No assurance can be given that future results expressed or implied by the forward-looking statements will be achieved, and actual results may differ materially from those contemplated by the forward-looking statements. Such statements are based on management’s current expectations and beliefs and are subject to a number of risks and uncertainties that could cause actual results to differ materially from those expressed or implied by the forward-looking statements. These risks and uncertainties include, but are not limited to, those relating to the Company’s financial and operating prospects, current economic trends, future opportunities (including our potential conversion to a real estate investment trust for U.S. federal income tax purposes), ability to retain existing customers and attract new ones, our acquisition strategy and ability to integrate acquired companies and assets and achieve our planned synergies, outlook of customers, reception of new products and technologies, and strength of competition and pricing. Other factors and risks that may affect our business and future financial results are detailed in our SEC filings, including but not limited to those described under “Item 1A. Risk Factors” and “Item 7. Management’s Discussion and Analysis of Financial Condition and Results of Operations” contained within this Annual Report. We caution you not to place undue reliance on these forward-looking statements, which speak only as of their respective dates. We undertake no obligation to publicly update or revise forward-looking statements to reflect events or circumstances after the date of this Annual Report or to reflect the occurrence of unanticipated events, except as may be required by law.
You should carefully consider the risks described below as well as the other information contained in this Annual Report. If any of the following risks or uncertainties actually occurs, our business, financial condition, results of operations, cash flow and prospects could be materially and adversely affected.
Risks Related to our Business
We have historically generated net losses since our inception and could incur losses in the future.
Prior to Fiscal 2017, we have historically generated net losses since our inception and could incur losses in the future. These net losses primarily have been driven by significant depreciation, amortization, interest expense, and stock-based compensation. During Fiscal 2018, we had depreciation and amortization expense of $747.4 million, stock-based compensation expense of $96.7 million, and interest expense of $299.8 million. At June 30, 2018, we had $5,876.6 million of total debt (including capital lease obligations and before any unamortized discounts, premiums and debt issuance costs). We cannot assure you that we will generate net income in the future.
17
Since our inception, we have used more cash than we have generated from operations, and we may continue to do so.
Since our inception, we have consistently consumed our entire positive cash flow generated from operating activities with our investing activities. Our investing activities have consisted principally of the acquisition of businesses as well as material additions to property and equipment. We have funded the excess of cash used in investing activities over cash provided by operating activities with proceeds from equity contributions and equity and debt issuances.
We intend to continue to invest in expanding our fiber network and our business and pursuing acquisitions that we believe provide an attractive return on our capital. These investments may continue to exceed the amount of cash flow available from operations after debt service requirements. To the extent that our investments exceed our cash flow from operations, we plan to rely on potential future debt or equity issuances, which could increase interest expense or dilute the interest of our stockholders, as well as cash on hand and borrowings under our revolving credit facility. We cannot assure you, however, that we will be able to obtain or continue to have access to sufficient capital on reasonable terms, or at all, to successfully grow our business.
Our revenue is relatively concentrated among a small number of customers, and the loss of any of these customers could significantly harm our business, financial condition, results of operations, and cash flows.
Our largest single customer, based on recurring revenue, accounted for approximately 8% of our revenue during Fiscal 2018, and total revenues from our top ten customers accounted for approximately 29% of our revenue during Fiscal 2018. We currently depend, and expect to continue to depend, upon a relatively small number of customers for a significant percentage of our revenue. Many of these customers are also competitors for some or all of our offerings. Our customer contracts typically have terms of one to twenty years. Our customers may elect not to renew these contracts. Furthermore, our customer contracts are terminable for cause if we breach a material provision of such contracts. We may face increased competition and pricing pressure as our customer contracts become subject to renewal. Our customers may negotiate renewal of their contracts at lower rates, for fewer offerings or for shorter terms. Many of our customers are in the telecommunications industry, which is undergoing consolidation. To the extent that two or more of our customers combine, they may be able to use their greater size to negotiate lower prices from us and may purchase fewer offerings from us, especially if their networks overlap. If we are unable to successfully renew our customer contracts on commercially acceptable terms, or if our customer contracts are terminated, our business could suffer.
We are also subject to credit risk associated with the concentration of our accounts receivable from our key customers. If one or more of these customers were to become bankrupt, insolvent or otherwise were unable to pay for the access rights or services provided by us, we may incur significant write-offs of accounts receivable or incur impairment charges.
We have numerous customer orders for network expansion to customer sites, including contracts with multiple national wireless carriers to build out our network to additional towers. If we are unable to satisfy new orders or build our network according to contractually specified deadlines, we may incur penalties or suffer the loss of revenue.
Our customers periodically review their telecommunication infrastructure requirements, and may adjust their plans for the purchase of additional access rights or services from us to fit changed market circumstances or strategic priorities. Any such adjustments may affect our sales of new contracts, or the renewal of existing ones, which could impact our revenue growth.
Future acquisitions are a component of our strategic plan, and will include integration and other risks that could harm our business.
We have grown rapidly and intend to continue to acquire complementary businesses and assets, and some of these acquisitions may be large or in new geographic areas where we do not currently operate. This exposes us to the risk that when we evaluate a potential acquisition target we over-estimate the target’s value and, as a result, pay too much for it. We also cannot be certain that we will be able to successfully integrate acquired assets or the operations of the acquired entity with our existing operations. Businesses and assets that we have acquired or may acquire in the future may be subject to unknown or contingent liabilities for which we may have limited or no recourse against the sellers. While we usually require the sellers to indemnify us with respect to breaches of representations and warranties that survive, such indemnification is often limited and subject to various materiality thresholds, a significant deductible or an aggregate cap
18
on losses. As a result, there is no guarantee that we will recover any amounts with respect to losses due to breaches by the sellers of their representations and warranties. In addition, the total amount of costs and expenses that we may incur with respect to liabilities associated with acquired properties and entities may exceed our expectations, which may adversely affect our operating results and financial condition.
We have previously engaged in and may continue to engage in acquisitions, such as the AboveNet, Allstream and Electric Lightwave acquisitions that are large or include products outside of the traditional communications infrastructure product base, which may present greater challenges to integrate than other acquisitions and may expose us to different or additional business risks. Difficulties with integration could cause material customer disruption and dissatisfaction, which could in turn increase churn and reduce new sales. Additionally, we may not be able to integrate acquired businesses in a manner that permits us to realize the cost synergies we anticipate in the time, manner, or amount we currently expect, or at all. Our actual cost synergies, cost savings, growth opportunities, and efficiency and operational benefits resulting from any acquisition may be lower and may take longer to realize than we currently expect. In addition, some recently acquired companies have had Adjusted EBITDA margins that were lower than ours, which had a negative impact on our overall Adjusted EBITDA margins. Future acquisitions may also have lower Adjusted EBITDA margins. In addition, as a result of our frequent acquisitions, research analysts’ valuation models may not take into account current acquisitions, or they may not correctly or timely include the effects of such acquisitions, which may cause our reported results to differ from their expectations.
We may incur additional debt to assist in the funding of these potential transactions, which may increase our leverage. Further, additional transactions could cause disruption of our ongoing business and divert management’s attention from the management of daily operations to the closing and integration of the acquired business. Acquisitions also involve other operational and financial risks such as:
|
· |
increased demand on our existing employees and management related to the increase in the size of the business and the possible distraction from our existing business due to the acquisition; |
|
· |
loss of key employees and salespeople of the acquired business; |
|
· |
liabilities of the acquired business, both unknown and known at the time of the consummation of the acquisition; |
|
· |
discovery that the financial statements we relied on to buy a business were incorrect; |
|
· |
expenses associated with the integration of the operations of the acquired business; |
|
· |
the possibility of future impairment, write-downs of goodwill and other intangibles associated with the acquired business; |
|
· |
finding that the offerings and operations of the acquired business do not meet the level of quality of those of our existing offerings and operations; and |
|
· |
determining that the internal controls of the acquired business were inadequate. |
We are growing rapidly and may not maintain or efficiently manage our growth.
We have rapidly grown our company through acquisitions of companies and assets as well as expansion of our own network and the acquisition of new users through our own sales efforts. We also intend to continue to grow our company, including through acquisitions, some of which may be large. Users can be reluctant to switch providers of bandwidth infrastructure because it can involve substantial expense and technical difficulty. That can make it harder for us to acquire new users through our own sales efforts. Our expansion may place strains on our management and our operational and financial infrastructure. Our ability to manage our growth will be particularly dependent upon our ability to:
|
· |
expand, develop, and retain qualified personnel; |
|
· |
maintain the quality of our offerings; |
|
· |
attract users to switch from their current providers to us in spite of the costs associated with switching providers; |
|
· |
maintain and enhance our system of internal controls to ensure timely and accurate reporting; and |
|
· |
expand our operational information systems in order to support our growth, including integrating new customers without disruption. |
19
If we fail to hire and retain qualified executives, managers and employees, our operating results could be harmed.
Our future success depends on our ability to identify, hire, train and retain executives, managers and employees with real estate, technological, engineering, operational, marketing, sales, administrative and managerial skills. There is a shortage of qualified personnel in several of these fields. We compete with several other companies for this limited pool of potential employees. As our industry increasingly becomes more competitive, it could become especially difficult to attract and retain top personnel with skills that are in high demand. In addition, subject to limited exceptions, none of the members of our management team and other key employees have long-term employment agreements. For all these reasons, there is no assurance that our efforts to recruit and retain qualified personnel will be successful.
We have agreements with customers that are dependent on government funding, which may not be available.
We have contracts with customers that include appropriations clauses that permit the customer to terminate the contract if expected government funding for the project to which the contract relates is unavailable. There is no assurance that the government funding will be available for these contracts and that they will not be terminated.
In recent years the portion of our revenue relating to government-funded programs such as the E-rate program, a program mandated by Congress in 1996 and implemented by the FCC in 1997 in order to make telecommunications and information access and services more affordable for schools and libraries in America, has increased. There can be no assurance that the E-rate program and other such programs will continue or will continue to be funded at current levels in the future.
Access and service level agreements in our customer agreements could subject us to liability or the loss of revenue.
Our contracts with customers typically contain access and service level guarantees (including network availability) and delivery date targets, which could enable customers to claim credits and, under certain conditions, terminate their agreements. Our inability to meet our access and service level guarantees could adversely affect our revenue. In Fiscal 2018, lost revenue from failure to meet access and service level guarantees was approximately $1.5 million. While we typically have carve-outs for force majeure events, many events, such as fiber cuts, equipment failure and third-party vendors being unable to meet their underlying commitments with us, could impact our ability to meet our access and service level agreements.
Any failure of our physical infrastructure or offerings could lead to significant costs and disruptions.
Our business depends on providing customers with highly reliable offerings. The offerings we provide are subject to failure resulting from numerous factors, including:
|
· |
human error; |
|
· |
power loss; |
|
· |
improper building maintenance by the landlords of the buildings in which our data centers are located; |
|
· |
physical or electronic security breaches; |
|
· |
fire, earthquake, hurricane, flood, and other natural disasters; |
|
· |
water damage; |
|
· |
the effect of war, terrorism, and any related conflicts or similar events worldwide; and |
|
· |
sabotage and vandalism. |
Problems within our network or our data centers, whether within our control or the control of our landlords or other third-party providers, could result in interruptions and/or component damage. As current and future customers increase their power usage in our facilities over time, the remaining available power for future customers could limit our ability to grow our business and increase occupancy rates or network density within our existing facilities. Accordingly, we may not be able to efficiently upgrade or change these systems to meet new demands without incurring significant costs that we may not be able to pass on to our customers. In the past, we have experienced disruptions in our network attributed to component failure and power outages. Although such disruptions have been remedied and the network has been stabilized, there can be no assurance that similar disruptions will not occur in the future. Given the access and service level agreement obligations we typically have in our customer contracts, such disruptions could result in customer credits; however, we cannot assume that our customers will accept these credits as compensation in the future, and we may face additional liability or loss of customers.
20
We use franchises, licenses, permits, rights-of-way, conduit leases, fiber agreements, and property leases, which could be canceled or not renewed.
We must maintain rights-of-way, franchises, and other permits from railroads, utilities, state highway authorities, local governments, transit authorities, and others to operate our owned fiber network. We cannot be certain that we will be successful in maintaining these rights-of-way agreements or obtaining future agreements on acceptable terms. Some of these agreements are short-term or revocable at will, and we cannot assure you that we will continue to have access to existing rights-of-way after they have expired or terminated. If a material portion of these agreements are terminated or are not renewed, we might be forced to abandon our network sections, which may result in impairment charges. In order to operate our network, we must also maintain fiber leases and IRU agreements that we have with public and private entities. There is no assurance that we will be able to renew those fiber routes on favorable terms, or at all. If we are unable to renew those fiber routes on favorable terms, we may face increased costs or reduced revenues.
In order to expand our network to new locations, we often need to obtain additional rights-of-way, franchises, and other permits. Our failure to obtain these rights in a prompt and cost-effective manner may prevent us from expanding our network, which may be necessary to meet our contractual obligations to our customers and could expose us to liabilities.
If we lose or are unable to renew key real property leases where we have located our POPs, it could adversely affect our offerings and increase our costs, as we would be required to restructure our network and move our POPs.
Our operations, financial performance and liquidity are materially reliant on key suppliers and vendors.
We depend on a limited number of suppliers and vendors for technology and services relating to our network infrastructure. To the extent that proprietary technology of a supplier is an integral component of our network, we may have limited flexibility to purchase key network components from alternative suppliers. We also rely on a limited number of software vendors to support our business management systems. In the event it becomes necessary to seek alternative suppliers and vendors, we may be unable to obtain satisfactory replacement supplies or services on economically attractive terms, on a timely basis, or at all, which could increase costs or cause disruptions in our solutions.
We are required to maintain, repair, upgrade, and replace our network and our facilities, the cost of which could materially impact our results and our failure to do so could irreparably harm our business.
Our business requires that we maintain, repair, upgrade, and periodically replace our facilities and portions of our network. This requires management time and capital expenditures. In the event that we fail to maintain, repair, upgrade, or replace essential portions of our network or facilities, it could lead to a material degradation in the level of access and service that we provide to our customers. Portions of our network can be damaged in a number of ways, including by other parties engaged in construction close to our network facilities. In the event of such damage, we will be required to incur expenses to repair the network. We could be subject to significant network repair and replacement expenses in the event a terrorist attack or a natural disaster damages our network. Further, the operation of our network requires the coordination and integration of sophisticated and highly specialized hardware and software. Our failure to maintain or properly operate this can lead to degradations to or interruptions of customer access and services. Our failure to provide proper or satisfactory access or services could result in claims from our customers, early termination of contracts, and damage to our reputation.
Our debt level could negatively impact our financial condition, results of operations, cash flows, and business prospects and could prevent us from fulfilling our obligations under our outstanding indebtedness. In the future, we may incur substantially more indebtedness, which could further increase the risks associated with our leverage.
As of June 30, 2018, our total debt (including capital lease obligations and before any unamortized discounts, premiums or debt issuance costs) was $5,876.6 million, primarily consisting of the following indebtedness incurred by our subsidiaries, Zayo Group, LLC (“ZGL”) and Zayo Capital, Inc. (“Zayo Capital”): $1,430.0 million of 6.00% senior unsecured notes due 2023 (the “2023 Unsecured Notes”), $900.0 million of 6.375% senior unsecured notes due 2025 (the “2025 Unsecured Notes”), $1,650.0 million of 5.75% senior unsecured notes due 2027 (the “2027 Unsecured Notes”, collectively with the 2023 and 2025 Unsecured Notes, the “Notes”), a $493.8 million senior secured term loan facility due 2021, a $1,269.3 million senior secured term loan facility due 2024 (the “Term Loan Facility”) and $133.5
21
million in capital lease obligations. In addition, ZGL and Zayo Capital have a $450.0 million senior secured revolving credit facility (the “Revolver,” and collectively with the Term Loan Facility, the “Credit Facility”), of which $441.9 million was available at June 30, 2018, subject to certain conditions. Subject to the limitations set forth in the indentures (the “Indentures”) governing the Notes and the agreement governing the Credit Facilities (the “Credit Agreement”), ZGL may incur additional indebtedness (including additional first lien obligations) in the future. If new indebtedness is added to our current levels of indebtedness, the related risks that we now face in light of our current debt level, including our possible inability to service our debt, could intensify. Our level of debt could have important consequences, including the following:
|
· |
making it more difficult for us to satisfy our obligations under our debt agreements; |
|
· |
requiring us to dedicate a substantial portion of our cash flow from operations to required payments on debt, thereby reducing the availability of cash flow for working capital, capital expenditures, and other general business activities; |
|
· |
limiting our ability to obtain additional financing in the future for working capital, capital expenditures, acquisitions, and general corporate and other activities; |
|
· |
limiting our flexibility in planning for, or reacting to, changes in our business and the industry in which we operate; |
|
· |
increasing our vulnerability to both general and industry-specific adverse economic conditions; |
|
· |
placing us at a competitive disadvantage relative to less leveraged competitors; and |
|
· |
preventing us from raising the funds necessary to repurchase the Notes tendered to ZGL upon the occurrence of certain changes of control, which would constitute a default under the Indentures. |
Cash payments for interest, net of capitalized interest, which are reflected in our cash flows from operating activities, during the year ended June 30, 2018 were $280.2 million, and represented 29% of our cash flows from operating activities. Cash payments related to principal payments on our debt obligations (including capital leases) during the year ended June 30, 2018 were $13.4 million (exclusive of our $310.7 million prepayment on our Term Loan Facility), which are reflected in our cash flows from financing activities, and represented 1.4% of our cash flows from operating activities during the period.
We may not be able to generate enough cash flow to meet our debt obligations.
Our future cash flow may be insufficient to meet our debt obligations and commitments. Any insufficiency could negatively impact our business. A range of economic, competitive, business, regulatory, and industry factors will affect our future financial performance, and, as a result, our ability to generate cash flow from operations and to pay our debt. Many of these factors, such as economic and financial conditions in our industry and the U.S. or the global economy, or competitive initiatives of our competitors, are beyond our control.
If we do not generate enough cash flow from operations to satisfy our debt obligations, we may have to undertake alternative financing plans, such as:
|
· |
reducing or delaying capital investments; |
|
· |
raising additional capital; |
|
· |
refinancing or restructuring our debt; and |
|
· |
selling assets. |
We cannot assure you that we would be able to implement alternative financing plans, if necessary, on commercially reasonable terms, or at all, or that implementing any such alternative financing plans would allow us to meet our debt obligations.
If ZGL is unable to meet its debt service obligations, it would be in default under the terms of the Indentures and the Credit Agreement, permitting acceleration of the amounts due on the Notes and under the Credit Agreement and eliminating our ability to draw on the Revolver. If the amounts outstanding under the Credit Facilities, the Notes, or other future indebtedness were to be accelerated, we could be forced to file for bankruptcy.
22
Our debt agreements contain restrictions on our ability to operate our business and to pursue our business strategies, and our failure to comply with these covenants could result in an acceleration of our indebtedness.
The Indentures and the Credit Agreement each contain, and agreements governing future debt issuances may contain, covenants that restrict ZGL’s ability to, among other things:
|
· |
incur additional indebtedness and issue preferred stock; |
|
· |
pay dividends or make other distributions with respect to any equity interests or make certain investments or other restricted payments; |
|
· |
create liens; |
|
· |
sell or otherwise dispose of assets, including capital stock of subsidiaries; |
|
· |
incur restrictions on the ability of its restricted subsidiaries to pay dividends or make other payments to it; |
|
· |
consolidate or merge with or into other companies or transfer all, or substantially all, of its assets; |
|
· |
engage in transactions with affiliates; |
|
· |
engage in business other than telecommunications; and |
|
· |
enter into sale and leaseback transactions. |
As a result of these covenants, we are limited in the manner in which we may conduct our business, and as a result we may be unable to engage in favorable business activities or finance future operations or capital needs. The ability to comply with some of the covenants and restrictions contained in the Indentures and the Credit Agreement may be affected by events beyond our control. If market or other economic conditions deteriorate, ZGL’s ability to comply with these covenants may be impaired.
In addition, the Credit Agreement requires ZGL to comply with a maximum secured leverage ratio at the end of any fiscal quarter in the event that usage of the Revolver exceeds 35% of the commitments thereunder. Our ability to comply with this ratio may be affected by events beyond our control. These restrictions limit our ability to plan for or react to market conditions, meet capital needs, or otherwise constrain our activities or business plans. They also may adversely affect our ability to finance our operations, enter into acquisitions, or engage in other business activities that would be in our interest.
A failure to comply with the covenants, ratios, or tests in the Indentures, the Credit Agreement or the agreement governing any future indebtedness could result in an event of default under the Indentures, the Credit Agreement or such agreement governing any future indebtedness, as applicable, which if not cured or waived could have a material adverse effect on our business, financial condition, and results of operations.
An event of default under the Indentures or the agreement governing any future indebtedness could lead to the acceleration of the obligations under the Notes or such future indebtedness, as applicable. An event of default under the Credit Agreement would allow the lenders to declare all borrowings outstanding to be due and payable or to terminate the ability to borrow under the Revolver. If the amounts outstanding under the Credit Facilities, the Notes or other future indebtedness were to be accelerated, we cannot assure that our assets would be sufficient to repay in full the money owed. In such a situation, we could be forced to file for bankruptcy.
Our future tax liabilities are not predictable or controllable. If we become subject to increased levels of taxation, our financial condition and operations could be negatively impacted.
We provide telecommunication infrastructure and related solutions in multiple jurisdictions across the United States, Canada and Europe and are, therefore, subject to multiple sets of complex and varying tax laws and rules. We cannot predict the amount of future tax liabilities to which we may become subject. Any increase in the amount of taxation incurred as a result of our operations or due to legislative or regulatory changes would be adverse to us. In addition, we may become subject to income tax audits by many tax jurisdictions throughout the world. It is possible that certain tax positions taken by us could result in tax liabilities for us. While we believe that our current provisions for taxes are reasonable and appropriate, we cannot assure you that these items will be settled for the amounts accrued or that we will not identify additional exposures in the future.
23
The Tax Cuts and Jobs Act will have a substantial impact on us.
On December 22, 2017, the Tax Cuts and Jobs Act (the "Act") was signed into law. The Act significantly changes U.S. tax law by reducing the U.S. corporate income tax rate and making certain changes to U.S. taxation of income earned by foreign subsidiaries, capital expenditures, interest expense and various other items. Although we generally believe the net impact of this Act will be favorable to us, the Act is quite complex and certain of its features are expected to adversely impact us. Our views on the Act’s ultimate impact on us are subject to change as we complete additional analysis, review regulations that will need to be adopted to implement the Act and monitor other future developments related to the Act’s adoption.
We cannot assure you whether, when or in what amounts we will be able to use our net operating losses, or when they will be depleted.
At June 30, 2018, we had approximately $1,917.2 million of U.S. federal net operating losses (“NOLs”), which relate primarily to prior acquisitions. Under certain circumstances, these NOLs can be used to offset our future U.S. federal taxable income. If we experience an “ownership change,” as defined in Section 382 of the Internal Revenue Code of 1986, as amended (the “Code”) and related Treasury regulations, at a time when our market capitalization is below a certain level, our ability to use the NOLs could be substantially limited. This limit could impact the timing of the usage of the NOLs, thus accelerating cash tax payments or causing NOLs to expire prior to their use, which could affect the ultimate realization of the NOLs.
Transactions that we enter into, as well as transactions by existing or future 5% stockholders that we do not participate in, could cause us to incur such an “ownership change.”
These limitations could cause us not to pursue otherwise favorable acquisitions and other transactions involving our capital stock, or could reduce the net benefits to be realized from any such transactions. Despite this, we expect to use substantially all of these NOLs and certain other deferred tax attributes as an offset to our future U.S. federal taxable income, although the timing of that use will depend upon our future earnings and future tax circumstances. If and when our NOLs are fully utilized, we expect that the amount of our cash flow dedicated to the payment of federal taxes will increase substantially, except to the extent that we convert to a REIT and are successful in qualifying for and maintaining taxation as a REIT.
We may be subject to interest rate risk and increasing interest rates may increase our interest expense.
Borrowings under each of the Credit Facilities bear, and our future indebtedness may bear, interest at variable rates and expose us to interest rate risk. If interest rates increase, our debt service obligations on the variable rate indebtedness would increase even though the amount borrowed remained the same, and our net income and cash available for servicing our indebtedness would decrease.
The international operations of our business expose us to risks that could materially and adversely affect the business.
We have operations and investments outside of the United States, as well as rights to undersea cable capacity extending to other countries, that expose us to risks inherent in international operations. These include:
|
· |
general economic, social and political conditions; |
|
· |
the difficulty of enforcing agreements and collecting receivables through certain foreign legal systems; |
|
· |
tax rates in some foreign countries may exceed those in the U.S.; |
|
· |
foreign currency exchange rates may fluctuate, which could adversely affect our results of operations and the value of our international assets and investments; |
|
· |
foreign earnings may be subject to withholding requirements or the imposition of tariffs, exchange controls or other restrictions; |
|
· |
difficulties and costs of compliance with foreign laws and regulations that impose restrictions on our investments and operations, with penalties for noncompliance, including loss of licenses and monetary fines; |
|
· |
difficulties in obtaining licenses or interconnection arrangements on acceptable terms, if at all; and |
24
|
· |
changes in U.S. laws and regulations relating to foreign trade and investment. |
We may as part of our expansion strategy increase our exposure to international investments and operations.
On June 23, 2016, the United Kingdom (“U.K.”) held a referendum in which voters approved an exit from the European Union (“E.U.”), commonly referred to as “Brexit.” As a result of the referendum, the British government has begun negotiating the terms of the U.K.’s future relationship with the E.U. Although it is unknown what those terms will be, it is possible that there will be increased regulatory complexities that may adversely affect our operations and financial results.
Our international operations are subject to the laws and regulations of the U.S. and many foreign countries, including the U.S. Foreign Corrupt Practices Act, the Canadian Corruption of Foreign Public Officials Act, U.K. Bribery Act and Privacy Laws.
We are subject to a variety of laws regarding our international operations, including the U.S. Foreign Corrupt Practices Act, the Canadian Corruption of Foreign Public Officials Act and the U.K. Bribery Act of 2010, and regulations issued by U.S. Customs and Border Protection, the U.S. Bureau of Industry and Security, the U.S. Treasury Department’s Office of Foreign Assets Control and various other foreign governmental agencies. We cannot predict the nature, scope or effect of future regulatory requirements to which our international operations might be subject or the manner in which existing laws might be administered or interpreted. Actual or alleged violations of these laws could lead to enforcement actions and financial penalties that could result in substantial costs.
The U.S. Foreign Corrupt Practices Act, the Canadian Corruption of Foreign Public Officials Act, the U.K. Bribery Act and similar anti-bribery laws in other jurisdictions generally prohibit companies and their intermediaries from making improper payments for the purpose of obtaining or retaining business. Recent years have seen a substantial increase in anti-bribery law enforcement activity with more frequent and aggressive investigations and enforcement proceedings by both the Department of Justice and the U.S. Securities and Exchange Commission, increased enforcement activity by non-U.S. regulators and increases in criminal and civil proceedings brought against companies and individuals. We have created and implemented a program for compliance with anti-bribery laws. Because our anti-bribery internal control policies and procedures have only recently been implemented, we may have increased exposure to reckless or criminal acts committed by our employees or third-party intermediaries. Violations of these anti-bribery laws may result in criminal or civil sanctions, which could have a material adverse effect on our business, financial condition, results of operations and liquidity.
Additionally, privacy requirements in the EU are stricter than in the US. These requirements include rules restricting the flow of data across borders, the General Data Protection Regulation and other data privacy requirements. These restrictions may cause companies to localize data, decline to make use of services provided by our customers in the US, and otherwise impact the use of our offerings. Notwithstanding the existence of programs such as the Privacy Shield program in place between the US and EU, European companies and individuals may be reluctant to use US companies, which could negatively impact our business.
Our international operations expose us to currency risk.
We conduct a portion of our business using the British Pound Sterling, Canadian Dollar and the Euro. Appreciation of the U.S. Dollar adversely affects our consolidated revenue. Since we tend to incur costs in the same currency in which those operations realize revenue, the effect on operating income and operating cash flow is largely mitigated. However, if the U.S. Dollar were to appreciate significantly, future revenues, operating income and operating cash flows could be materially affected.
We may be vulnerable to security breaches that could disrupt our operations and adversely affect our business.
Despite security measures and business continuity plans, our information technology networks and infrastructure may be vulnerable to damage, disruptions, or shutdowns due to unauthorized access, computer viruses, cyber-attacks, distributed denial of service, and other security breaches. An attack on or security breach of our network could result in interruption or cessation of access and services, our inability to meet our access and service level commitments, and potentially compromise customer data transmitted over our network. We cannot guarantee that our security measures will not be circumvented, resulting in network failures or interruptions that could impact our network availability and
25
have a material adverse effect on our business, financial condition, and results. We may be required to expend significant resources to protect against such threats. If an actual or perceived breach of our security occurs, the market perception of the effectiveness of our security measures could be harmed, and we could lose customers. Any such events could result in legal claims or penalties, disruption in operations, misappropriation of sensitive data, damage to our reputation, and/or costly response measures, which could adversely affect our business. Although we maintain insurance coverage that may, subject to policy terms and conditions (including self-insured deductibles, coverage restrictions and monetary coverage caps), cover certain aspects of our cyber risks, such insurance coverage may be unavailable or insufficient to cover our losses.
We may be subject to litigation that could have a substantial, adverse impact on our business
From time to time we are subject to litigation, including claims related to employment, commercial transactions, construction and real estate. Irrespective of its merits, litigation may be both lengthy and disruptive to our operations and could cause significant expenditure and diversion of management attention. While we do not view any of our current litigation to be material, current or future litigation could have a material adverse effect on our financial position and operating results, on the trading price of our securities and on our ability to access the capital markets.
If we are unable to renew collective bargaining agreements on satisfactory terms, or we experience strikes, work stoppages or labor unrest, our business could suffer.
Certain of the employees that we acquired in our Allstream acquisition are covered by collective bargaining agreements. There can be no assurance that such agreements will be renewed on terms favorable to us. If we are unable to renew such agreements on satisfactory terms, our labor costs could increase, which would affect our profit margins. Further, changes in governmental regulations relating to labor relations, or otherwise in our relationship with our employees, including our unionized employees, may result in strikes, lockouts or other work stoppages, any of which could have an adverse effect on our business, results of operations and financial condition.
Volatility in the equity markets, interest rates or other factors could substantially increase our pension costs.
We sponsor defined benefit pension plans for certain of our Canadian employees. The difference between plan obligations and assets, or the funded status of the plans, significantly affects the net periodic benefit costs of our pension plans and the ongoing funding requirements of those plans. Among other factors, changes in interest rates, mortality rates, early retirement rates, investment returns, minimum funding requirements and the market value of plan assets can affect the level of plan funding, cause volatility in the net periodic pension cost and increase our future funding requirements. Legislative and other governmental regulatory actions may also increase funding requirements for our pension plans’ benefits obligation.
A significant increase in our pension benefit obligations or funding requirements could have a negative impact on our ability to invest in the business and adversely affect our financial condition and results of operations.
Lapses in disclosure controls and procedures or internal control over financial reporting could materially and adversely affect our operations, profitability or reputation.
Management identified material weaknesses in our internal control over financial reporting in Fiscal 2016 that were remediated during Fiscal 2017. There can be no assurance that our disclosure controls and procedures will be effective in the future or that we will not experience a material weakness or significant deficiency in internal control over financial reporting. Any such lapses or deficiencies may materially and adversely affect our business, operating results or financial condition, may result in restatement of our consolidated financial statements, restrict our ability to access the capital markets, require us to expend significant resources to correct the lapses or deficiencies, expose us to regulatory or legal proceedings, including litigation brought by private individuals, subject us to fines, penalties or judgments, harm our reputation, or otherwise cause a decline in investor confidence and our stock price.
26
Risks Related to Our Industry
We could face increased competition from companies in the telecommunications and media industries that currently do not focus on bandwidth infrastructure.
Many of our competitors in the bandwidth infrastructure space are other focused bandwidth infrastructure providers that offer bandwidth infrastructure on a regional or local basis. In some cases, we also compete with communications service providers who also own certain infrastructure assets and make them available to customers as an infrastructure offering. These communication service providers include ILECs, such as AT&T, Verizon, and CenturyLink, and cable television companies, such as Comcast and Cox.
Some of these competitors have greater financial, managerial, sales and marketing, and research and development resources than we do and are able to promote their brands with significantly larger budgets. Most of them are also our customers. If ILECs and cable television companies focus on providing bandwidth infrastructure, it could have a material adverse effect on us. A few of these competitors also have significant fiber assets that they principally employ in the provision of their communications services. If any of these competitors with greater resources and/or significant fiber assets chose to focus those resources on bandwidth infrastructure, our ability to compete in the bandwidth infrastructure industry could be negatively impacted. To the extent that communication service providers, cable television companies, and other media companies choose to distribute their content over their own networks that could reduce demand for our offerings. Additionally, significant new entrants into the bandwidth infrastructure industry would increase supply, which could cause prices for our offerings to decline.
Consolidation among companies in the telecommunications and cable television industries could further strengthen our competitors and adversely impact our business.
The telecommunications and cable television industries are intensely competitive and continue to undergo significant consolidation. There are many reasons for consolidation in these industries, including the desire for communications and cable television companies to acquire network assets in regions where they currently have no or insufficient amounts of owned network infrastructure. The consolidation within the industry may cause customers to disconnect from us and move to their own networks, or consolidate buying with other bandwidth infrastructure providers. Additionally, consolidation in the industry could further strengthen our competitors, give them greater financial resources and geographic reach, and allow them to put additional pressure on prices for bandwidth infrastructure.
Certain of our offerings and facilities are subject to regulation that could change or otherwise impact us in an adverse manner.
Communications offerings and facilities are subject to domestic and international regulation at the federal, state, and local levels. These regulations affect our business and our existing and potential competitors. Our electronic communications offerings and electronic communications facilities in Europe, Canada and elsewhere are subject to regulatory oversight by national communications regulators, such as the United Kingdom’s Office of Communications (“Ofcom”) and France’s Autorité de Régulation des Communications Électroniques et des Postes (“ARCEP”). In addition, in the United States, both the FCC and the state public utility commissions or similar regulatory authorities (“State PUCs”) typically require us to maintain licenses, file periodic reports, pay various regulatory fees and assessments, and otherwise comply with their regulations. Similarly, in Canada, we are subject to the rules and oversight of the Canadian Radio-Television and Telecommunications Commission (“CRTC”), the Minister of Innovation Science and Economic Development, as well as the laws and regulations of other federal and provincial bodies. Such compliance can be costly and burdensome and may affect the way we conduct our business. Delays in receiving required regulatory approvals (including approvals relating to acquisitions, investments, or financing activities or for interconnection agreements with other carriers), the enactment of new and adverse international or domestic legislation or regulations (including those pertaining to broadband initiatives and net-neutrality), or the denial, modification or termination by a regulator of any approval or authorization, could have a material adverse effect on our business. Further, the current regulatory landscape is subject to change through judicial review of current legislation and rulemaking by the FCC, Ofcom, ARCEP, CRTC and other domestic, foreign, and international rulemaking bodies. These bodies regularly consider changes to their regulatory framework and fee and other obligations. Changes in current regulation or determinations that we have not complied with existing regulations and obligations may make it more difficult to obtain the approvals necessary to operate our business, significantly increase the regulatory fees and other assessments to which we are subject, subject us to potential enforcement proceedings or audits that could result in fines or other penalties
27
where noncompliance has occurred, or have other adverse effects on our future operations in the United States, Canada and/or Europe. Elimination or relaxation of regulatory rights and protections could harm our business, results of operations and financial condition. In Canada, ILECs had been mandated by the CRTC to provide access to its local loops to third party service providers, including Zayo, at regulated rates. On June 5, 2018, the CRTC granted forbearance from regulation of local loops to an ILEC from which we currently access unbundled local loops. We must now either obtain access to such local loops pursuant to commercial agreement with such ILEC or migrate the services to alternative sources. If we are unable to reach agreement with the ILEC, or reach agreement with alternative sources, or to reach agreements on economic terms, our business, results of operations and financial condition will be negatively impacted.
We may be liable for the material that content providers distribute over our network.
Although we believe our liability for third party information stored on or moved through our network is limited, the liability of private network operators is affected both by changing technology and evolving legal principles. As a private network provider, we could be exposed to legal claims relating to third party content stored or moved through our network. Such claims could involve, among others, allegations of defamation, invasion of privacy, copyright infringement, or aiding and abetting restricted activities such as online gambling or pornography. If we decide to implement additional measures to reduce our exposure to these risks, or if we are required to defend ourselves against these kinds of claims, our operating results and financial condition could be negatively affected.
Unfavorable general global economic conditions could negatively impact our operating results and financial condition.
Unfavorable general global economic conditions could negatively affect our business. Although it is difficult to predict the impact of general economic conditions on our business, these conditions could adversely affect the affordability of, and customer demand for, our offerings, and could cause customers to delay or forgo purchases of our offerings. One or more of these circumstances could cause our revenue to decline. Also, our customers may not be able to obtain adequate access to credit, which could affect their ability to purchase our offerings or make timely payments to us. The current economic conditions, including federal fiscal and monetary policy actions, may lead to inflationary conditions in our cost base, particularly in our lease and personnel related expenses. This could harm our margins and profitability if we are unable to increase prices or reduce costs sufficiently to offset the effects of inflation in our cost base. For these reasons, among others, if challenging economic conditions persist or worsen, our operating results and financial condition could be adversely affected.
Disruptions in the financial markets could affect our ability to obtain debt or equity financing or to refinance our existing indebtedness on reasonable terms or at all.
Disruptions in the financial markets could impact our ability to obtain debt or equity financing, or lines of credit, in the future as well as impact our ability to refinance our existing indebtedness on reasonable terms or at all, which could affect our strategic operations and our financial performance and force modifications to our operations.
Changes in our usage patterns or industry practice could result in increasing peering costs for our IP network.
Peering agreements with other ISPs have allowed us to access the Internet and exchange data with these providers. In most cases, we peer with these ISPs on a payment-free basis, referred to as settlement-free peering. We plan to continue to leverage this settlement-free peering. If other providers change the terms upon which they allow settlement-free peering or if changes in Internet usage patterns, including the ratio of inbound to outbound traffic, cause us to fall below the criteria that these providers use in allowing settlement-free peering, the costs of operating our Internet backbone will likely increase. Any increases in costs could have an adverse effect on our margins and our ability to compete in the IP market.
Terrorism and natural disasters could adversely impact our business.
The ongoing threat of terrorist activity and other acts of war or hostility have had, and may continue to have, an adverse effect on business, financial and general economic conditions. Effects from these events and any future terrorist activity, including cyber terrorism, may, in turn, increase our costs due to the need to provide enhanced security, which would adversely affect our business and results of operations. Terrorist activity could damage or destroy our Internet infrastructure and may adversely affect our ability to attract and retain customers, raise capital, and operate and maintain our network access points. We are particularly vulnerable to acts of terrorism because of our large data center presence in New York. We are also susceptible to other catastrophic events such as major natural disasters, extreme weather, fires, or
28
similar events that could affect our headquarters, our other offices, or our network, infrastructure, or equipment, all of which could adversely affect our business.
Rapid changes in technology could affect our ability to compete for business customers.
The technology used enable deliver communications services has changed rapidly in the past and will likely continue to do so in the future. If we are unable to keep up with such changes make available next generation technology, we may not be able to offer competitive offerings to our business customers. This could adversely affect our ability to compete for business customers, which, in turn, would adversely affect our results of operations and financial condition.
Risks Related to Ownership of Our Common Stock
Our stock price may be volatile or may decline regardless of our operating performance.
The market price of our common stock may fluctuate significantly in response to numerous factors, many of which are beyond our control. In addition to the other risk factors described herein, these factors include:
|
· |
actual or anticipated fluctuations in our revenue and other operating results; |
|
· |
announcements by us or our competitors of significant technical innovations, acquisitions, strategic partnerships, joint ventures or capital commitments; |
|
· |
changes in operating performance and stock market valuations of other companies in our industry; |
|
· |
the addition or loss of significant customers; |
|
· |
fluctuations in the trading volume of our common stock or the size of our public float; |
|
· |
announcements by us with regard to the effectiveness of our internal controls and our ability to accurately report our financial results; |
|
· |
price and volume fluctuations in the overall stock market, including as a result of trends in the economy as a whole; |
|
· |
general economic, legal, regulatory and market conditions unrelated to our performance; |
|
· |
lawsuits threatened or filed against us; and |
|
· |
other events or factors, including those resulting from war, incidents of terrorism or responses to these events. |
The stock markets have experienced extreme fluctuations in price and trading volume that have caused and will likely continue to cause the stock prices of many telecommunications companies to fluctuate in a manner unrelated or disproportionate to the operating performance of those companies. In the past, stockholders have instituted securities class action litigation following periods of declining stock prices. If we were to become involved in securities litigation, we could face substantial costs and be forced to divert resources and the attention of management from our business, which could adversely affect our business.
If securities or industry analysts do not continue to publish or publish inaccurate or unfavorable research about our business, our stock price and trading volume could decline.
The trading market for our common stock depends on the research and reports that securities or industry analysts publish about us or our business. Certain securities and industry analysts currently publish research reports with respect to our common stock and certain of our debt securities. If they fail to publish reports about us or our securities regularly, or otherwise cease to cover our Company, demand for our stock could decrease and the trading price of our stock could decline. A downgrade of our stock or the publication of inaccurate or unfavorable research about our business would likely cause our stock price to decline.
29
Sales of substantial amounts of our common stock in the public market, or the perception that they might occur, could reduce the price that our common stock might otherwise attain.
We cannot predict what effect, if any, future issuances by us of our common stock will have on the market price of our common stock. In addition, shares of our common stock that we issue in connection with an acquisition may not be subject to resale restrictions. The market price of our common stock could drop significantly if certain large holders of our common stock, or recipients of our common stock in connection with an acquisition, sell all or a significant portion of their shares of common stock or are perceived by the market as intending to sell these shares other than in an orderly manner. In addition, these sales could impair our ability to raise capital through the sale of additional common stock in the capital markets.
Delaware law and our amended and restated certificate of incorporation and bylaws contain provisions that could delay or discourage takeover attempts that our stockholders may consider favorable.
Provisions in our amended and restated certificate of incorporation and amended and restated bylaws may have the effect of delaying or preventing a change of control or changes in our management. These provisions include the following:
|
· |
our board of directors is divided into three classes serving staggered three-year terms; |
|
· |
our board of directors has the right to elect a director to fill a vacancy created by the expansion of the board of directors or due to the resignation or departure of an existing board member; |
|
· |
our directors are not elected by cumulative voting, which would allow less than a majority of stockholders to elect director candidates; |
|
· |
advance notice of nominations for election to the board of directors or for proposing matters that can be acted upon at a stockholders meeting is required; |
|
· |
our board of directors may alter our bylaws without obtaining stockholder approval; |
|
· |
our board of directors may issue, without stockholder approval, up to 50,000,000 shares of preferred stock with terms set by the board of directors, certain rights of which could be senior to those of our common stock; |
|
· |
stockholders do not have the right to call a special meeting of stockholders or to take action by written consent in lieu of a meeting; |
|
· |
approval of at least two-thirds of the shares outstanding and entitled to vote thereon is required to amend or repeal, or adopt any provision inconsistent with, our amended and restated bylaws or the provisions of our amended and restated certificate of incorporation regarding, among other items, the election and removal of directors; and |
|
· |
directors may be removed from office only for cause. |
We have elected not to be governed by the provisions of Section 203 of the Delaware General Corporation Law (the “DGCL”); however, our amended and restated certificate of incorporation includes similar provisions providing that we may not engage in certain “business combinations” with any “interested stockholder” for three years following the time that such stockholder became an interested stockholder, unless the business combination is approved in a prescribed manner. A “business combination” includes, among other things, a merger, asset or stock sale or other transaction resulting in a financial benefit to the interested stockholder. An “interested stockholder” is a person who, together with affiliates and associates, owns, or did own, within three years prior to the determination of interested stockholder status, 15% or more of a corporation’s voting stock. Pursuant to our amended and restated certificate of incorporation, the term “interested stockholder” does not include certain entities listed in our certificate of incorporation that were preferred equity holders of Communications Infrastructure Investments, LLC (“CII”) at the time of our IPO (the “Exempt Stockholders”), each of their respective affiliates, and any of their respective direct or indirect transferees and any group as to which such persons are a party.
These provisions may prohibit large stockholders (with the exception of the Exempt Stockholders described above), particularly those owning 15% or more of our outstanding voting stock, from merging or combining with us. These provisions in our amended and restated certificate of incorporation and our amended and restated bylaws and the
30
DGCL could discourage potential takeover attempts, could reduce the price that investors are willing to pay for shares of our common stock in the future and could potentially result in the market price of our common stock being lower than it otherwise would be.
In addition, our debt agreements may require very significant payments if we have a change of control, which reduces the possibility that such an event will occur.
Our directors, executive officers, holders of more than 5% of our common stock, together with their affiliates, continue to have substantial control over the company.
Our directors, executive officers, and holders of more than 5% of our common stock, together with their affiliates, beneficially owned, in the aggregate, approximately 21% of our outstanding common stock as of June 30, 2018. As a result, these stockholders, acting together, would have the ability to effectively control the outcome of matters submitted to our stockholders for approval, including the election of directors and any merger, consolidation or sale of all or substantially all of our assets. In addition, these stockholders, acting together, would have the ability to effectively control our management and affairs. Accordingly, this concentration of ownership might harm the market price of our common stock by:
|
· |
delaying, deferring or preventing a change in control; |
|
· |
impeding a merger, consolidation, takeover or other business combination involving us; or |
|
· |
discouraging a potential acquirer from making a tender offer or otherwise attempting to obtain control. |
Unless we convert to a REIT, we do not intend to pay dividends for the foreseeable future.
We have never declared or paid cash dividends on our common stock. ZGL’s ability to pay dividends to us is limited by the Credit Agreement and Indentures, which may in turn limit our ability to pay dividends on our common stock. Our ability to pay dividends may also be restricted by the terms of any future credit agreement or any future debt or preferred securities of ours or of our subsidiaries. Unless we convert to a REIT and are successful in qualifying for and maintaining taxation as a REIT, we currently intend to retain all available funds and any future earnings for use in the operation and expansion of our business, and therefore we do not anticipate declaring or paying any dividends in the foreseeable future. As a result, you may only receive a return on your investment in our common stock if the market price of our common stock increases. See “Risks Related to a possible REIT Conversion” for further information regarding REIT conversion.
Risks Related to a Possible REIT Conversion
Although we have completed the first phase of our investigation on the advisability and feasibility of a conversion to a real estate investment trust for U.S. federal income tax purposes (a “REIT”), we can provide no assurance that we will ultimately pursue a REIT conversion or whether any such conversion will be successful.
In May 2018, we announced that we completed the first phase of our investigation on the advisability and feasibility of a conversion to a REIT. In order to successfully convert to a REIT, there are significant implementation and operational complexities we would need to satisfy, including completing internal reorganizations and realignment of business segments, modifying accounting, financial systems and reporting, receiving stockholder approvals and making any required stockholder payouts, and possibly obtaining a private letter ruling, or PLR, from the Internal Revenue Service (“IRS”). The timing and outcome of many of these conditions are beyond our control. In particular, if a favorable PLR is necessary or desirable to effect our REIT conversion, we cannot provide assurance that the IRS will ultimately provide us with such a PLR or when it might do so.
At the conclusion of our investigation and preparations for converting to a REIT, our board of directors may decide not to convert to a REIT, or to delay such a conversion, if our board of directors determines in its sole discretion that a REIT conversion is not in the best interests of us or our stockholders or because it identifies alternatives that it believes could create stockholder value more effectively than conversion to a REIT. Thus, we can provide no assurance that we will ultimately pursue a REIT conversion or whether any such conversion will be successful.
31
If we convert to a REIT, we may, nevertheless, not qualify or remain qualified for taxation as a REIT.
If we convert to a REIT, we plan to operate in a manner consistent with the REIT qualification rules. However, we cannot provide assurance that we will, in fact, qualify for taxation as a REIT or that we will remain so qualified. Qualification for taxation as a REIT involves the application of highly technical and complex provisions of the U.S. Internal Revenue Code of 1986, as amended (the “Code”), to our operations as well as various factual determinations concerning matters and circumstances not entirely within our control. There are limited judicial or administrative interpretations of applicable REIT provisions. Changes in legislation, federal tax rules and interpretations thereof could also prevent us from remaining qualified for taxation as a REIT or realizing the benefits for us and our stockholders of qualifying for taxation as a REIT.
If we fail to qualify for taxation as a REIT in any taxable year after we convert to a REIT, and are not then entitled to relief under the Code, we will be subject to U.S. federal and state income tax on our taxable income at regular corporate income tax rates with respect to each such taxable year for which the statute of limitations remains open. In addition, we will be subject to monetary penalties for the failure. Failing to qualify for taxation as a REIT in any year following a REIT conversion would significantly reduce our net earnings and cash flow because of our additional tax liability and the penalties for the years involved, which could significantly impact our financial condition.
If we convert to a REIT, we may not realize the anticipated benefits to stockholders, including the achievement of significant tax savings for us and regular distributions to our stockholders.
If we convert to a REIT, we cannot provide assurance that our stockholders will experience benefits attributable to our qualification and taxation as a REIT, including our ability to reduce our corporate level federal and state income taxes through distributions to our stockholders and to make regular distributions to our stockholders. The realization of the anticipated benefits to our stockholders will depend on numerous factors, many of which are outside our control. In addition, future cash distributions to our stockholders will depend on our cash flows, as well as the impact of alternative, more attractive investments as compared to such distributions. Further, changes in legislation or the federal and state tax rules could adversely impact the benefits of qualifying for taxation as a REIT.
If we convert to a REIT, complying with REIT qualification requirements may limit our flexibility or cause us to forego otherwise attractive opportunities.
To qualify for taxation as a REIT, we must satisfy tests concerning, among other things, the sources of our income, the nature and diversification of our assets, the amounts we distribute to our stockholders and the ownership of our common stock. For example, under the Code, no more than 20% of the value of the assets of a REIT may be represented by securities of one or more of our TRSs, and similar rules apply to other nonqualifying assets. These limitations may affect our ability to make large investments in other non-REIT qualifying operations or assets. In addition, in order to maintain qualification for taxation as a REIT, we will be required to distribute at least 90% of our REIT taxable income annually, determined without regard to the dividends paid deduction and excluding any net capital gains. Even if we maintain qualification for taxation as a REIT, we will be subject to U.S. federal income tax at regular corporate income tax rates for our undistributed REIT taxable income, as well as U.S. federal income tax at regular corporate income tax rates for income recognized by our TRSs. Because of these distribution requirements, we will likely not be able to fund future capital needs and investments from operating cash flow. As such, compliance with REIT tests may hinder our ability to make certain attractive investments, including the purchase of significant nonqualifying assets and the material expansion of non-real estate activities.
If we convert to a REIT, we may restructure or issue debt or raise equity to satisfy conversion costs and the requirement that we distribute our accumulated earnings and profits.
Depending on the size and timing of any cash outlays and any required distribution of our accumulated earnings and profits associated with a possible conversion to a REIT, we may restructure or issue debt and/or issue equity to fund these disbursements, even if the then-prevailing market conditions are not favorable for these transactions. Whether we issue equity, at what price and amount and other terms of any such issuances will depend on many factors, including alternative sources of capital, our then existing leverage, our need for additional capital, market conditions and other factors beyond our control. If we raise additional funds through the issuance of equity securities or debt convertible into equity securities, the percentage of stock ownership by our existing stockholders may be reduced. In addition, new equity
32
securities or convertible debt securities could have rights, preferences, and privileges senior to those of our current stockholders, which could substantially decrease the value of our securities owned by them. Depending on the share price we are able to obtain, we may have to sell a significant number of shares in order to raise the capital we deem necessary to execute our long-term strategy, and our stockholders may experience dilution in the value of their shares as a result. Furthermore, satisfying any conversion costs and any required distribution of our accumulated earnings and profits may increase the financing we need to fund capital expenditures, future growth and expansion initiatives. As a result our indebtedness could increase. See “Risks Related to our Business” for further information regarding our substantial indebtedness.
There are uncertainties relating to the costs associated with implementing a possible REIT conversion.
Our estimates of any tax and other costs to convert to a REIT may not be accurate, and such costs may actually be higher than our estimates due to unanticipated outcomes in the process of obtaining a PLR, changes in our business support functions and support costs, the unsuccessful execution of internal planning, including restructurings and cost reduction initiatives, or other factors.
Restrictive loan covenants could prevent us from satisfying REIT distribution requirements.
If we convert to a REIT, restrictions in our credit facility and our indentures may prevent us from satisfying our REIT distribution requirements, which would prevent us from qualifying for taxation as a REIT. If we are unable to renegotiate our credit facility and our indentures to remove certain applicable restrictions and if these limits prevent us from distributing 100% of our REIT taxable income, we would be subject to federal corporate income tax, and potentially a nondeductible excise tax, on the retained amounts. See “Risks Related to our Business” for further information on our restrictive loan covenants.
We have no experience operating as a REIT, which may adversely affect our business, financial condition or results of operations if we convert to a REIT.
We have no experience operating as a REIT and our senior management has no experience operating a REIT. Our pre-REIT operating experience may not be sufficient to prepare us to operate successfully as a REIT. If we convert to a REIT, our inability to operate successfully as a REIT, including the failure to maintain our qualification for taxation as a REIT, could adversely affect our business, financial condition or results of operations.
ITEM 1B. UNRESOLVED STAFF COMMENTS
None.
Our principal properties are our fiber optic network and its component assets. We own a majority of the communications equipment required for operating the network and our business. As of June 30, 2018, we own or lease approximately 128,910 route miles or 11,867,276 fiber miles. We provide colocation and interconnection offerings utilizing our own data centers located within major carrier hotels and other strategic buildings in 50 locations throughout the United States, Canada and Europe. We generally do not own the buildings where we provide our colocation interconnection offerings; however, the zColo group manages approximately 1,034,000 square feet of licensable colocation space. See “Item 1. Business” for additional discussion related to our network and colocation properties.
We lease our corporate headquarters in Boulder, Colorado as well as regional offices and sales, administrative and other support offices. Our corporate headquarters located at located at 1821 30th Street, Unit A, Boulder, Colorado is approximately 42,000 square feet. We lease properties to locate the POPs necessary to operate our network. Office space is leased in the markets where we maintain our network and generally averages 17,000 square feet. Each of our business units utilize these facilities. The majority of our leases have renewal provisions at either fair market value or a stated escalation above the last year of the current term.
In the ordinary course of business, we are from time to time party to various litigation matters that we believe are incidental to the operation of our business. We record an appropriate provision when the occurrence of loss is probable
33
and can be reasonably estimated. We cannot estimate with certainty our ultimate legal and financial liability with respect to any such pending litigation matters, and it is possible one or more of them could have a material adverse effect on us. However, we believe that the outcome of any such pending litigation matters will not have a material adverse effect upon our results of operations, our consolidated financial condition, or our liquidity.
ITEM 4. MINE SAFETY DISCLOSURES
Not Applicable
34
ITEM 5. MARKET FOR REGISTRANT’S COMMON EQUITY, RELATED SHAREHOLDER MATTERS AND ISSUER PURCHASES OF EQUITY SECURITIES
Holders of Our Common Stock
Our common stock has traded on the New York Stock Exchange (“NYSE”) under the symbol “ZAYO” since October 17, 2014. The following table sets forth, for the periods indicated, the high and low sales prices per share of our common stock as reported on the NYSE.
|
Year Ended June 30, 2018 |
High |
Low |
||||||
|
First Quarter |
|
|
35.58 |
|
|
|
29.73 |
|
|
Second Quarter |
|
37.26 |
|
|
33.56 |
|
||
|
Third Quarter |
|
37.95 |
|
|
33.05 |
|
||
|
Fourth Quarter |
|
37.80 |
|
|
32.91 |
|
||
|
Year Ended June 30, 2017 |
High |
Low |
||||||
|
First Quarter |
|
|
30.59 |
|
|
|
27.16 |
|
|
Second Quarter |
|
35.65 |
|
|
29.48 |
|
||
|
Third Quarter |
|
34.42 |
|
|
29.30 |
|
||
|
Fourth Quarter |
|
35.49 |
|
|
30.65 |
|
||
On August 17, 2018, the closing price per share of our common stock on the NYSE was $37.85 per share, and there were approximately 141 stockholders of record of our common stock. The number of holders of record is based upon the actual number of holders registered at such date and does not include holders of shares in “street name” or persons, partnerships, associates, corporations or other entities in security position listings maintained by depositories.
Stock Performance Graph
The following graph illustrates the cumulative total stockholder return on our common stock from our IPO in October 2014 through June 30, 2018, compared to the S&P 500 TR Index and the NASDAQ Telecommunications Index. The comparison assumes a hypothetical investment in our common stock and in each of the foregoing indices of $100 at October 22, 2014, and assumes that all dividends were reinvested. Shareholder returns over the indicated period are based on historical data and should not be considered indicative of future shareholder returns. The graph and related disclosure in no way reflect our forecast of future financial performance.
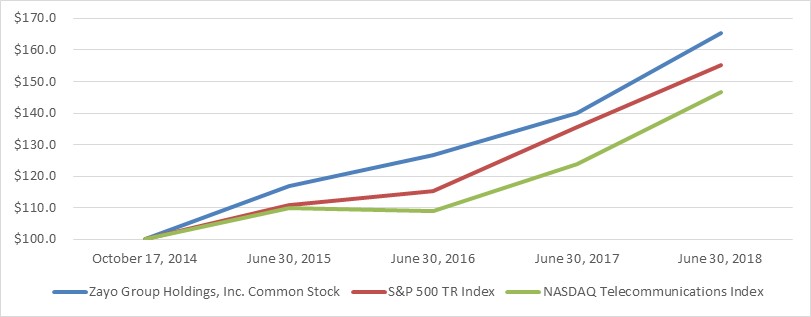
35
|
October 17, 2014 |
June 30, 2015 |
June 30, 2016 |
June 30, 2017 |
June 30, 2018 |
|
|
Zayo Group Holdings, Inc. Common Stock |
$100 |
$116.76 |
$126.71 |
$140.09 |
$165.23 |
|
S&P 500 TR Index |
$100 |
$110.85 |
$115.24 |
$135.70 |
$155.07 |
|
NASDAQ Telecommunications Index |
$100 |
$109.97 |
$108.86 |
$123.89 |
$146.54 |
The above performance graph shall not be deemed to be incorporated by reference by means of any general statement incorporating by reference this Annual Report on Form 10-K into any filing under the Securities Act of 1933, as amended, or the Securities Exchange Act of 1934, as amended, except to the extent that the Company specifically incorporates such information by reference, and shall not otherwise be deemed filed under such acts.
Dividend Policy
No dividends have been declared or paid on our shares of common stock. Unless we convert to a REIT and are successful in qualifying for and maintaining taxation as a REIT, we currently intend to retain all available funds and any future earnings for use in the operation and expansion of our business, and therefore we do not anticipate paying any cash dividends in the foreseeable future. Any future determination to pay dividends will be at the discretion of our board of directors and will depend upon our financial condition, results of operations, cash flows, capital requirements, and other factors that our board of directors deems relevant, including requirements necessary to qualify for and maintain taxation as a REIT if we convert to a REIT. We are a holding company, and substantially all of our operations are carried out by ZGL and its subsidiaries. ZGL’s ability to pay dividends to us is limited by the Credit Agreement and Indentures, which may in turn limit our ability to pay dividends on our common stock. Our ability to pay dividends may also be restricted by the terms of any future credit agreement or any future debt or preferred securities.
Issuer Purchases of Equity Securities
The following table presents our purchase of equity securities reportable during the three months ended June 30, 2018.
|
Period |
|
Total Number |
|
Average |
|
Total Number of |
|
Remaining Dollar Value of |
||
|
April 1 - April 30, 2018 |
|
— |
|
$ |
— |
|
— |
|
$ |
— |
|
May 1 - May 31, 2018 |
|
2,749,079 |
|
|
34.02 |
|
2,749,079 |
|
|
406,466,373 |
|
June 1 - June 30, 2018 |
|
— |
|
|
— |
|
— |
|
|
— |
|
Total |
|
2,749,079 |
|
$ |
34.02 |
|
2,749,079 |
|
$ |
406,466,373 |
|
(1) |
On May 7, 2018, our Board of Directors authorized a six-month share repurchase program for up to $500 million of our common stock from time to time using a variety of methods, including open market purchases, privately negotiated transactions and other means in accordance with federal securities laws. The authorization expires in November 2018, and may be suspended or discontinued at any time. |
36
ITEM 6. SELECTED FINANCIAL DATA
The following table presents selected historical consolidated financial information for Zayo Group Holdings, Inc. for the periods and as of the dates indicated. The selected historical consolidated financial information as of and for the years ended June 30, 2018, 2017, 2016, 2015, and 2014 is derived from, and qualified by reference to, our audited consolidated financial statements and should be read in conjunction with such audited consolidated financial statements and related notes and “Item 7: Management’s Discussion and Analysis of Financial Condition and Results of Operations” included elsewhere in this Annual Report. These historical results are not necessarily indicative of the results to be expected in the future.
|
|
|
Year Ended June 30, |
|||||||||||||
|
|
|
2018 |
|
2017 |
|
2016 |
|
2015 |
|
2014 |
|||||
|
|
|
(in millions, except for per share data) |
|||||||||||||
|
Consolidated Statements of Operations Data |
|
|
|
|
|
|
|
|
|
|
|
|
|
|
|
|
Revenue |
|
$ |
2,604.0 |
|
$ |
2,199.8 |
|
$ |
1,721.7 |
|
$ |
1,347.1 |
|
$ |
1,123.2 |
|
Operating costs and expenses |
|
|
2,179.1 |
|
|
1,826.0 |
|
|
1,481.4 |
|
|
1,178.1 |
|
|
1,067.1 |
|
Operating income |
|
|
424.9 |
|
|
373.8 |
|
|
240.3 |
|
|
169.0 |
|
|
56.1 |
|
Other expenses, net |
|
|
(296.9) |
|
|
(269.7) |
|
|
(308.0) |
|
|
(333.1) |
|
|
(200.4) |
|
Income/(loss) from continuing operations before income taxes |
|
|
128.0 |
|
|
104.1 |
|
|
(67.7) |
|
|
(164.1) |
|
|
(144.3) |
|
Provision/(benefit) for income taxes |
|
|
26.1 |
|
|
18.4 |
|
|
8.5 |
|
|
(8.8) |
|
|
37.3 |
|
Income/(loss) from continuing operations |
|
|
101.9 |
|
|
85.7 |
|
|
(76.2) |
|
|
(155.3) |
|
|
(181.6) |
|
Earnings from discontinued operations, net of income taxes |
|
|
— |
|
|
— |
|
|
— |
|
|
— |
|
|
2.3 |
|
Net income/(loss) |
|
$ |
101.9 |
|
$ |
85.7 |
|
$ |
(76.2) |
|
$ |
(155.3) |
|
$ |
(179.3) |
|
Weighted-average shares used to compute net loss per share: |
|
|
|
|
|
|
|
|
|
|
|
|
|
|
|
|
Basic |
|
|
247.3 |
|
|
243.9 |
|
|
243.3 |
|
|
235.4 |
|
|
223.0 |
|
Diluted |
|
|
248.5 |
|
|
246.8 |
|
|
243.3 |
|
|
235.4 |
|
|
223.0 |
|
Income/(loss) from continuing operations per share: |
|
|
|
|
|
|
|
|
|
|
|
|
|
|
|
|
Basic and diluted |
|
$ |
0.41 |
|
|
0.35 |
|
|
(0.31) |
|
|
(0.66) |
|
|
(0.81) |
|
Earnings from discontinued operations per share: |
|
|
|
|
|
|
|
|
|
|
|
|
|
|
|
|
Basic and diluted |
|
$ |
— |
|
|
— |
|
|
— |
|
|
— |
|
|
0.01 |
|
Net income/(loss) per share: |
|
|
|
|
|
|
|
|
|
|
|
|
|
|
|
|
Basic and diluted |
|
$ |
0.41 |
|
$ |
0.35 |
|
$ |
(0.31) |
|
$ |
(0.66) |
|
$ |
(0.80) |
|
Consolidated Balance Sheet Data (at period end): |
|
|
|
|
|
|
|
|
|
|
|
|
|
|
|
|
Cash and cash equivalents |
|
$ |
256.7 |
|
$ |
220.7 |
|
$ |
170.7 |
|
$ |
308.6 |
|
$ |
297.4 |
|
Property and equipment, net |
|
|
5,447.2 |
|
|
5,016.0 |
|
|
4,079.5 |
|
|
3,299.2 |
|
|
2,822.4 |
|
Total assets |
|
|
9,216.8 |
|
|
8,739.4 |
|
|
6,727.5 |
|
|
6,094.6 |
|
|
4,981.7 |
|
Long-term debt and capital lease obligations, including current portion |
|
|
5,828.6 |
|
|
5,639.3 |
|
|
4,136.0 |
|
|
3,701.4 |
|
|
3,179.0 |
|
Total stockholders' equity |
|
|
1,489.1 |
|
|
1,410.5 |
|
|
1,219.2 |
|
|
1,211.2 |
|
|
416.4 |
37
ITEM 7. MANAGEMENT’S DISCUSSION AND ANALYSIS OF FINANCIAL CONDITION AND RESULTS OF OPERATION
Information contained or incorporated by reference in this Annual Report on Form 10-K (this “Annual Report”), and in other filings by Zayo Group Holdings, Inc. (the “Company,” “we” or “us”) with the Securities and Exchange Commission (the “SEC”) that is not historical by nature constitutes “forward-looking statements” within the safe harbor provisions of the Private Securities Litigation Reform Act of 1995, and can be identified by the use of forward-looking terminology such as “believes,” “expects,” “plans,” “intends,” “estimates,” “projects,” “could,” “may,” “will,” “should,” or “anticipates,” or the negatives thereof, other variations thereon or comparable terminology, or by discussions of strategy. No assurance can be given that future results expressed or implied by the forward-looking statements will be achieved, and actual results may differ materially from those contemplated by the forward-looking statements. Such statements are based on our current expectations and beliefs and are subject to a number of risks and uncertainties that could cause actual results to differ materially from those expressed or implied by the forward-looking statements. These risks and uncertainties include, but are not limited to, those relating to our financial and operating prospects, current economic trends, future opportunities, ability to retain existing customers and attract new ones, our acquisition strategy and ability to integrate acquired companies and assets, outlook of customers, reception of new products and technologies, strength of competition and pricing, and potential organizational strategies that we may opt to pursue in the future. Other factors and risks that may affect our business and future financial results are detailed in our SEC filings, including, but not limited to, those described under “Item 1A: Risk Factors” and in this “Management’s Discussion and Analysis of Financial Condition and Results of Operations.” We caution you not to place undue reliance on these forward-looking statements, which speak only as of their respective dates. We undertake no obligation to publicly update or revise forward-looking statements to reflect events or circumstances after the date of this Annual Report or to reflect the occurrence of unanticipated events, except as may be required by law.
The following discussion and analysis should be read together with our audited consolidated financial statements and the related notes appearing elsewhere in this Annual Report.
Amounts presented in this Item 7 are rounded. As such, rounding differences could occur in period-over-period changes and percentages reported throughout this Item 7.
In May 2018, we announced that we completed the first phase of our investigation on the advisability and feasibility of a conversion to a real estate investment trust for U.S. federal income tax purposes (a “REIT”). Please see “Evaluation and Preparation for Potential REIT Conversion” in the below “Overview”.
Overview
Introduction
We are a large and fast growing provider of access to bandwidth infrastructure in the United States (“U.S.”), Europe and Canada. Our products and offerings enable our customers’ mission-critical, high-bandwidth applications, such as cloud-based computing, video, mobile, social media, machine-to-machine connectivity, and other bandwidth-intensive applications. Our key products and offerings include leased dark fiber, fiber to cellular towers and small cell sites, dedicated wavelength connections, Ethernet, IP connectivity, cloud-based computing and storage products and other high-bandwidth offerings. We provide access to our bandwidth infrastructure and other offerings over a unique set of dense metro, regional, and long-haul fiber network sections and through our interconnect-oriented data center facilities. Our fiber network sections and data center facilities are critical components of the overall physical network architecture of the Internet and private networks. Our customer base includes some of the largest and most sophisticated users of bandwidth infrastructure, such as wireless service carriers; telecommunications service carriers; financial services companies; social networking, media, and web content companies; education, research, and healthcare institutions; and governmental agencies. We typically provide customers with access to our bandwidth infrastructure solutions for a fixed monthly recurring fee under contracts that vary between one and twenty years in length. We operate our business with a unique focus on capital allocation and financial performance with the ultimate goal of maximizing equity value for our stockholders. Our core values center on partnership, alignment, and transparency with our three primary constituent groups – employees, customers, and stockholders.
On October 22, 2014, we completed an initial public offering (“IPO”) of shares of our common stock, which were listed on the New York Stock Exchange (“NYSE”) under the ticker symbol “ZAYO”. Prior to the IPO, we were a direct,
38
wholly owned subsidiary of Communications Infrastructure Investments, LLC ("CII"). Our primary operating subsidiary is Zayo Group, LLC, a Delaware limited liability company (“ZGL”), and we are headquartered in Boulder, Colorado.
Our fiscal year ends June 30 each year, and we refer to the fiscal year ended June 30, 2018 as “Fiscal 2018,” the fiscal year ended June 30, 2017 as “Fiscal 2017,” and the fiscal year ended June 30, 2016 as “Fiscal 2016.”
Reportable Segments and our Strategic Product Groups
We use the management approach to determine the segment financial information that should be disaggregated and presented. The management approach is based on the manner by which management has organized the segments within the Company for making operating decisions, allocating resources, and assessing performance. With the continued increase in our scope and scale, effective April 1, 2018, our chief operating decision maker ("CODM"), who is our Chief Executive Officer, implemented certain organizational changes to the management and operation of the business that directly impact how the CODM makes resource allocation decisions and manages the Company. The change in structure had the impact of re-aligning our existing Strategic Product Groups (“SPGs”) within our existing segments. The changes in structure also resulted in changes in how the Company measures the relative burden each segment bears of indirect and corporate related costs, and in adjustments to intercompany pricing which more closely align to third party pricing on the products and offerings which are exchanged between our SPGs. See footnote 16-Segment Reporting, in our consolidated financial statements for further description of the changes. Where practicable, changes to all prior period financial and operational metrics have been recasted in our Annual Report for comparability. We have six reportable segments as described below:
Fiber Solutions. Through the Fiber Solutions segment, we provide access to raw bandwidth infrastructure to customers that require control of their internal networks. These solutions include dark fiber, dedicated lit network sections and mobile infrastructure (fiber-to-the-tower and small cell). Dark fiber is a physically separate and secure, private platform for dedicated bandwidth. We lease dark fiber pairs (usually 2 to 12 total fibers) to our customers, who “light” the fiber using their own optronics. Our mobile infrastructure solutions permit direct fiber connections to cell towers, small cells, hub sites, and mobile switching centers. Fiber Solutions customers include carriers and other communication service providers, Internet service providers, wireless service providers, major media and content companies, large enterprises, and other companies that have the expertise to run their own fiber optic networks or require interconnected technical space. The contract terms in the Fiber Solutions segment tend to range from three to twenty years.
Transport. The Transport segment provides access to lit bandwidth infrastructure solutions over our metro, regional, and long-haul fiber network sections. The segment uses customer-accessed optronics to light the fiber, and our customers pay for access based on the amount and type of bandwidth they require. The offerings within this segment include Wavelengths, Ethernet, SONET, and wholesale IP. We target customers who require a significant amount of bandwidth across their networks. Transport customers include carriers, content providers, financial services companies, healthcare, government entities, education institutions and other medium and large enterprises. The contract terms in this segment tend to range from two to five years.
Enterprise Networks. The Enterprise Networks segment provides connectivity and lit bandwidth telecommunication solutions to medium and large enterprises. Our offerings within this segment include Internet, wide area networking products, managed products and cloud-based computing and storage products. Solutions range from point-to-point data connections to multi-site managed networks to international outsourced IT infrastructure environments. The contract terms in the Enterprise Networks segment tend to range from one to ten years.
Zayo Colocation (zColo). The Colocation segment provides data center infrastructure solutions to a broad range of enterprise, carrier, cloud, and content customers. Our offerings within this segment include the provision of colocation space, power and interconnection offerings in North America and Western Europe. Solutions range in size from single cabinet solutions to 1MW+ data center infrastructure environments. Our data centers also support a large component of networking components for the purpose of aggregating and accommodating customer’s data, voice, Internet, and video traffic. The contract terms in this segment tend to range from two to five years.
Allstream. The Allstream segment provides Cloud VoIP and Data Solutions. This includes a full range of local voice offerings allowing business customers to complete telephone calls in their local exchange, as
39
well as make long distance, toll-free and related calls. Unified Communications is the integration of real-time communication services such as telephony (including Cloud-based IP telephony), instant messaging and video conferencing with non-real-time communication services, such as integrated voicemail and e-mail. Allstream also provides customers with comprehensive telecommunications services including Ethernet, and IP/MPLS VPN Solutions.
Other. Our Other segment is primarily comprised of Zayo Professional Services (“ZPS”). ZPS provides network and technical resources to customers who wish to leverage our expertise in designing, acquiring and maintaining network sections. The contract terms typically run for one year for a fixed recurring monthly fee in the case of network and on an hourly basis for technical resources (usage revenue). ZPS also generates revenue via telecommunication equipment sales.
Evaluation and Preparation for Potential REIT Conversion
On May 3, 2018, we announced that we completed the first phase of our investigation on the advisability and feasibility of a conversion to a REIT. We have begun the next phase of our evaluation and preparation for a potential conversion to a REIT. As part of these efforts, we have begun a direct dialogue with the U.S. Internal Revenue Service (“IRS”) in an effort to obtain clarity and support for our position, and we are seeking a private letter ruling (“PLR”) from the IRS. Also, we have begun to execute the organizational changes that are required to operate as a REIT, including the realignment of our business segments to clearly delineate the leasing of network assets from ancillary services and, in particular, the separation and potential divestiture or deconsolidation of our Allstream business segment. These organization changes do not result in any changes to our reportable segments.
If, following our current phase of evaluation and preparation, we make a definitive decision to convert to a REIT and are successful in qualifying for taxation as a REIT, we will generally be permitted to deduct from federal income taxes the dividends that we pay to our stockholders. The income represented by such dividends would not be subject to federal income taxation at the entity level but would be taxed, if at all, at the stockholder level. Nevertheless, the income of our domestic taxable REIT subsidiaries (each, a “TRS”), which will hold our U.S. operations that may not be REIT-compliant, will be subject, as applicable, to federal and state corporate income tax. Likewise, our foreign subsidiaries will continue to be subject to foreign income taxes in jurisdictions in which they hold assets or conduct operations, regardless of whether held or conducted through TRSs or through entities that are disregarded from us for U.S. federal income tax purposes. Also, we will be subject to a separate corporate income tax on any gains recognized during a specified period (generally 5 years) following the REIT conversion that are attributable to “built-in” gains with respect to the assets that we own on the date we convert to a REIT.
Our ability to qualify for taxation as a REIT will depend upon our continuing compliance following our REIT conversion with various requirements, including requirements related to the nature of our assets, the sources of our income and the distributions to our stockholders. If we fail to qualify for taxation as a REIT, we will be subject to federal income tax at regular corporate income tax rates. Even if we qualify for taxation as a REIT, we may be subject to certain federal, state, local and foreign taxes on our income and property. In particular, while state income tax regimes often parallel the federal income tax regime for REITs described above, many states do not completely follow federal rules and some may not follow them at all.
The current phase of our evaluation and preparation currently includes seeking a PLR from the IRS. We are requesting that our PLR address whether our revenues from dark and lit fiber satisfy applicable REIT income tests, and our ultimate decision to convert to a REIT may depend upon a favorable ruling from the IRS on this topic. We submitted a PLR request to the IRS in July 2018, but the IRS may not provide a response until 2019 or later or may not respond at all.
At this stage of our evaluation and preparation for a potential conversion to a REIT, we cannot accurately estimate the costs required to support any potential conversion, but we anticipate that our costs would include various administrative costs in addition to certain related tax liabilities.
40
Factors Affecting Our Results of Operations
Business Acquisitions
We were founded in 2007 with the investment thesis of building a bandwidth infrastructure platform to take advantage of the favorable Internet, data, and wireless growth trends driving the ongoing demand for access to bandwidth infrastructure, and to be an active participant in the consolidation of the industry. These trends have continued in the years since our founding, despite volatile economic conditions, and we believe that we are well positioned to continue to capitalize on those trends. We have built a significant portion of our network and product offerings through 45 acquisitions through June 30, 2018.
As a result of the growth of our business from these acquisitions and the capital expenditures and increased debt used to fund those investing activities, our results of operations for the respective periods presented and discussed herein are not comparable.
Recent Acquisitions
Neutral Path Communications
On April 17, 2018, we acquired substantially all of the assets of Neutral Path Communications and Near North Partners (collectively, “Neutral Path”) for $33.3 million, which is net of cash acquired and also includes an estimate for a contingent payment based on sales performance through June 30, 2018. The purchase price is subject to net working capital and certain post-closing adjustments. As of June 30, 2018 $4.0 million of the purchase consideration is being held in escrow pending the expiration of the indemnification adjustment period. The all-cash acquisition was funded with cash on hand and was considered an asset purchase for U.S. federal income tax purposes.
Neutral Path is a long haul infrastructure provider, providing access to a fiber network in the Midwest. The transaction added 452 owned route miles, plus additional leased route miles, to our extensive North American network, including a unique high-count fiber route from Minneapolis to Omaha. The fiber footprint provides us with three owned diverse fiber routes out of Minneapolis, Chicago and Omaha.
The results of the acquired Neutral Path business are included in our operating results beginning April 17, 2018.
McLean Data Center
On April 4, 2018, we acquired McLean Data Center (“McLean”) a privately owned data center for an insignificant amount. The acquisition was considered an asset purchase for U.S. federal income tax purposes and a business combination for accounting purposes. The Company assumed an operating lease obligation and certain assets, such as cash, structural components, equipment and customer contracts equipment and customer contracts.
Spread Networks
On February 28, 2018, we acquired Spread Networks, LLC (“Spread Networks”), a privately-owned telecommunications provider that owns and operates a 825-mile, high-fiber count long haul route connecting New York and Chicago, for net purchase consideration of $130.5 million, net of cash acquired, subject to certain post-closing adjustments. As of June 30, 2018, $0.6 million of the purchase consideration is being held in escrow pending the expiration of the indemnification adjustment period. The all-cash acquisition was funded with cash on hand and was considered an asset purchase for U.S. federal income tax purposes.
The route connects 755 Secaucus Road in Secaucus, New Jersey and 1400 Federal Boulevard in Carteret, New Jersey to 350 Cermak Road in Chicago, Illinois, with additional connectivity to be enabled by Zayo’s existing network. Zayo plans to use the acquired assets to provide a low-latency wavelength route from Seattle to New York.
The results of the acquired Spread Networks business are included in our operating results beginning February 28, 2018.
41
Optic Zoo Networks
On January 18, 2018, we acquired Vancouver BC Canada-based Optic Zoo Networks for net purchase consideration of CAD $30.9 million (or $24.8 million), net of cash acquired, subject to certain post-closing adjustments. Optic Zoo Networks owns and provides access to high-capacity fiber in Vancouver. As of June 30, 2018, CAD $3.1 million (or $2.4 million), of the purchase consideration is being held in escrow pending the expiration of the indemnification adjustment period. The acquisition was funded with cash on hand and was considered a stock purchase for U.S. federal income tax purposes.
The transaction strengthens Zayo’s position in Vancouver and Western Canada, adding 103 route miles and more than 100 on-net buildings to Zayo’s Vancouver footprint.
The results of the acquired Optic Zoo Networks business are included in our operating results beginning January 18, 2018.
KIO Networks US Data Centers
On May 1, 2017, we completed the $11.9 million cash acquisition of Castle Access, Inc.’s (d/b/a “KIO Networks US”) San Diego, California data centers. The two data centers, located at 12270 World Trade Drive and 9606 Aero Drive, total more than 100,000 square feet of space and two megawatts (MW) of critical IT power, with additional power available. The acquisition was funded with cash on hand and was considered a stock purchase for U.S. federal income tax purposes.
The results of the acquired KIO Networks US business are included in our operating results beginning May 1, 2017.
Electric Lightwave Parent, Inc.
On March 1, 2017, we acquired Electric Lightwave Parent, Inc. (“Electric Lightwave”), an infrastructure and telecom provider serving 35 markets in the western U.S., for net purchase consideration of $1,426.6 million, net of cash acquired, subject to certain post-closing adjustments. The acquisition was funded through debt and cash on hand.
The acquisition added 8,100 route miles of long haul fiber and 4,000 miles of dense metro fiber across Denver, Minneapolis, Phoenix, Portland, Seattle, Sacramento, San Francisco, San Jose, Salt Lake City, Spokane and Boise, with on-net connectivity to more than 3,100 enterprise buildings and 100 data centers.
The results of the acquired Electric Lightwave business are included in our operating results beginning March 1, 2017.
Santa Clara Data Center
On October 3, 2016, we acquired a data center in Santa Clara, California (the “Santa Clara Data Center”), for net purchase consideration of $11.3 million. The net purchase consideration, which was valued using a discounted cash flow method, will be paid in ten quarterly payments of $1.3 million, beginning in the December 2016 quarter. As of June 30, 2018, the remaining consideration to be paid was $3.8 million.
The Santa Clara Data Center, located at 5101 Lafayette Street, includes 26,900 total square feet and three MW of critical IT power. The facility also includes high-efficiency power and cooling infrastructure, seismic reinforcement and proximity to our long haul dark fiber routes between San Francisco and Los Angeles.
The results of the acquired Santa Clara Data Center business are included in our operating results beginning October 3, 2016.
42
Summary of Business Acquisitions
The table below summarizes the dates and purchase prices (which are net of cash acquired and include assumption of debt and capital leases) of all acquisitions and asset purchases through June 30, 2018.
|
Acquisition |
|
Date |
|
Acquisition Cost |
|
|
|
|
|
|
(in millions) |
|
|
Memphis Networx |
|
July 31, 2007 |
|
$ |
9.2 |
|
PPL Telecom |
|
August 24,2007 |
|
|
46.3 |
|
Indiana Fiber Works |
|
September 28, 2007 |
|
|
22.6 |
|
Onvoy |
|
November 7, 2007 |
|
|
70.0 |
|
Voicepipe |
|
November 7, 2007 |
|
|
2.8 |
|
Citynet Fiber Networks |
|
February 15, 2008 |
|
|
99.2 |
|
Northwest Telephone |
|
May 30, 2008 |
|
|
5.2 |
|
CenturyTel Tri-State Markets |
|
July 22, 2008 |
|
|
2.7 |
|
Columbia Fiber Solutions |
|
September 30, 2008 |
|
|
12.1 |
|
CityNet Holdings Assets |
|
September 30, 2008 |
|
|
3.4 |
|
Adesta Assets |
|
September 30, 2008 |
|
|
6.4 |
|
Northwest Telephone California |
|
May 26, 2009 |
|
|
0.0 |
|
FiberNet |
|
September 9, 2009 |
|
|
96.6 |
|
AGL Networks |
|
July 1, 2010 |
|
|
73.7 |
|
Dolphini Assets |
|
September 20, 2010 |
|
|
0.2 |
|
American Fiber Systems |
|
October 1, 2010 |
|
|
114.1 |
|
360networks |
|
December 1, 2011 |
|
|
317.9 |
|
MarquisNet |
|
December 31, 2011 |
|
|
13.6 |
|
Arialink |
|
May 1 2012 |
|
|
17.1 |
|
AboveNet |
|
July 2, 2012 |
|
|
2,210.0 |
|
FiberGate |
|
August 31, 2012 |
|
|
118.3 |
|
USCarrier |
|
October 1, 2012 |
|
|
16.1 |
|
FTS |
|
December 14, 2012 |
|
|
109.7 |
|
Litecast |
|
December 31, 2012 |
|
|
22.2 |
|
Core NAP |
|
May 31, 2013 |
|
|
7.1 |
|
Corelink |
|
August 1, 2013 |
|
|
1.9 |
|
Access |
|
October 1, 2013 |
|
|
40.1 |
|
FiberLink |
|
October 2, 2013 |
|
|
43.1 |
|
CoreXchange |
|
March 4, 2014 |
|
|
17.2 |
|
Geo |
|
May 16, 2014 |
|
|
292.3 |
|
Neo |
|
July 1, 2014 |
|
|
73.9 |
|
Colo Facilities Atlanta |
|
July 1, 2014 |
|
|
51.9 |
|
IdeaTek Systems |
|
January 1, 2015 |
|
|
52.7 |
|
Latisys |
|
February 23, 2015 |
|
|
677.8 |
|
Viatel |
|
December 31, 2015 |
|
|
102.7 |
|
Stream Dallas Data Center |
|
December 31, 2015 |
|
|
16.6 |
|
Allstream |
|
January 15, 2016 |
|
|
297.6 |
|
Clearview |
|
April 1, 2016 |
|
|
18.3 |
|
Santa Clara Data Center |
|
October 3, 2016 |
|
|
11.3 |
|
Electric Lightwave |
|
March 1, 2017 |
|
|
1,426.6 |
|
KIO Networks US Data Centers |
|
May 1, 2017 |
|
|
11.9 |
|
Optic Zoo Networks |
|
January 18, 2018 |
|
|
24.8 |
|
Spread Networks |
|
February 28, 2018 |
|
|
130.5 |
|
McLean Data Center |
|
April 4, 2018 |
|
|
— |
|
Neutral Path Communications |
|
April 17, 2018 |
|
|
33.3 |
|
Less portion allocated to the discontinued operations of Onvoy, LLC |
|
|
|
|
(62.3) |
|
Total |
|
|
|
$ |
6,658.7 |
43
We completed each of the acquisitions described above, with the exception of Voicepipe and Corelink, with cash raised through combinations of equity issuances and the incurrence of debt. We acquired Voicepipe from certain existing CII equity holders in exchange for CII preferred units, and we acquired Corelink with a combination of cash and CII preferred units.
Substantial Indebtedness
As of June 30, 2018 and June 30, 2017, long-term debt was as follows:
|
|
|
Date of |
|
|
|
Outstanding as of |
||||||||
|
|
|
Issuance or most |
|
Maturity |
|
Interest |
|
Interest Rate |
|
June 30, 2018 |
|
June 30, |
||
|
|
|
|
|
|
|
|
|
|
|
(in millions) |
||||
|
Term Loan Facility due 2021 |
|
Jan 2017 |
|
Jan 2021 |
|
Monthly |
|
LIBOR +2.00% |
|
$ |
493.8 |
|
$ |
498.8 |
|
B-2 Term Loan Facility |
|
Feb 2018 |
|
Jan 2024 |
|
Monthly |
|
LIBOR +2.25% |
|
|
1,269.3 |
|
|
1,429.9 |
|
6.00% Senior Unsecured Notes |
|
Jan & Mar 2015 |
|
Apr 2023 |
|
Apr/Oct |
|
6.00% |
|
|
1,430.0 |
|
|
1,430.0 |
|
6.375% Senior Unsecured Notes |
|
May 2015 & Apr 2016 |
|
May 2025 |
|
May/Nov |
|
6.375% |
|
|
900.0 |
|
|
900.0 |
|
5.75% Senior Unsecured Notes |
|
Jan, Apr & Jul 2017 |
|
Jan 2027 |
|
Jan/Jul |
|
5.75% |
|
|
1,650.0 |
|
|
1,350.0 |
|
Total obligations |
|
|
|
|
|
|
|
|
|
|
5,743.1 |
|
|
5,608.7 |
|
Unamortized premium/(discounts), net |
|
|
|
|
|
|
|
|
|
|
11.6 |
|
|
(3.2) |
|
Unamortized debt issuance costs |
|
|
|
|
|
|
|
|
|
|
(59.6) |
|
|
(67.8) |
|
Carrying value of debt |
|
|
|
|
|
|
|
|
|
|
5,695.1 |
|
|
5,537.7 |
|
Less current portion |
|
|
|
|
|
|
|
|
|
|
(5.0) |
|
|
(5.0) |
|
Total long-term debt, less current portion |
|
|
|
|
|
|
|
|
|
$ |
5,690.1 |
|
$ |
5,532.7 |
The weighted average interest rates (including margins) on the Term Loan Facility were approximately 4.3% and 3.4% at June 30, 2018 and June 30, 2017, respectively. Interest rates on Company’s senior secured revolving credit facility (“the Revolver”) as of June 30, 2018 and June 30, 2017 remained consistent at approximately 3.8%. As of June 30, 2018, no amounts were outstanding under the Revolver. Standby letters of credit were outstanding in the amount of $8.1 million as of June 30, 2018, leaving $441.9 million available under the Revolver, subject to certain conditions.
Substantial Capital Expenditures
During Fiscal 2018, 2017, and 2016, we invested $789.9 million, $835.5 million, and $704.1 million, respectively, in capital expenditures primarily to expand our fiber network to support new customer contracts. We expect to continue to make significant capital expenditures in future periods.
Background for Review of Our Results of Operations
Revenue
Our revenue is comprised predominately of monthly recurring revenue (“MRR”). MRR is related to an ongoing offering that is generally fixed in price and paid by the customer on a monthly basis. We also report monthly amortized revenue (“MAR”), which represents the amortization of previously collected upfront charges to customers. Upfront charges are typically related to indefeasible rights of use (“IRUs”) structured as pre-payments rather than monthly recurring payments (though we structure IRUs as both prepaid and recurring, largely dependent on the customers’ preference) and installation fees. The last category of revenue we report is other revenue. Other revenue primarily includes credits and adjustments, termination revenue, construction contribution payments, and component sales.
Our consolidated reported revenue in any given period is a function of our beginning revenue under contract and the impact of organic growth and acquisition activity. Our organic activity is driven by net new sales (“bookings”), gross installed revenue (“installs”) and churn processed (“churn”) as further described below.
Net New Sales. Net new sales (“bookings”) represent the dollar amount of orders, to be recorded as MRR and MAR upon installation, in a period that have been signed by the customer and accepted by our product offering delivery organization. The dollar value of bookings is equal to the monthly recurring price that the customer will pay for the offerings and/or the monthly amortized amount of the revenue that we will recognize for those offerings. To the extent a booking is cancelled by the customer prior to the offerings being originated, it is
44
subtracted from the total bookings number in the period that it is cancelled. Bookings do not immediately impact revenue until the solutions are installed (gross installed revenue).
Gross Installed Revenue. Installs are the amount of MRR and MAR for offerings that have been installed, tested, accepted by the customer, and have been recognized in revenue during a given period. Installs include new offerings, price increases, and upgrades.
Churn Processed. Churn is any negative change to MRR and MAR. Churn includes disconnects, negative price changes, and disconnects associated with upgrades or replacement offerings. For each period presented, disconnects associated with attrition and upgrades or replacement offerings are the drivers of churn, accounting for more than 75% of negative changes in MRR and MAR, while price changes account for less than 25%. Monthly churn is also presented as a percentage of MRR and MAR (“churn percentage”).
Given the size and amount of acquisitions we have completed, we have estimated the revenue growth rate associated with our organic activity in each period reported. Our estimated organic growth rate is calculated as if acquisitions closed during the periods presented were closed on the first day of the earliest period presented within this Annual Report. In calculating this pro-forma growth figure, we add the revenue recorded by the acquired companies (including estimated purchase accounting adjustments) for the reporting periods prior to the date of inclusion in our results of operations, and then calculate the growth rate between the two reported periods. The estimated pro-forma revenue growth rates are not necessarily indicative of either future results of operations or results that might have been achieved had the acquisitions been consummated on the first day of the earliest period presented. As we conduct operations outside of the U.S. and have historically acquired companies with functional currencies other than the U.S. dollar (“USD”), the estimated pro-forma revenue growth rates may not adequately reflect operational performance as a result of changes in foreign currency exchange rates.
We have foreign subsidiaries that enter into contracts with customers and vendors in currencies other than the USD—principally the British pound sterling (“GBP”) and Canadian dollar (“CAD”) and to a lesser extent the Euro. Changes in foreign currency exchange rates impact our revenue and expenses each period. The comparisons excluding the impact of foreign currency exchange rates assume exchange rates remained constant at the comparative period rate.
Operating Costs and Expenses
Our operating costs and expenses consist of network expense (“Netex”), compensation and benefits, network operations expense (“Netops”), stock-based compensation expense, other expenses, and depreciation and amortization.
Netex consists of third-party network costs resulting from our leasing of certain network facilities, primarily leases of circuits and dark fiber, from third parties to augment our owned infrastructure, for which we are generally billed a fixed monthly fee. Netex also includes colocation facility costs for rent and license fees paid to the landlords of the buildings in which our colocation business operates, along with the utility costs to power those facilities. While increases in demand for our offerings will drive additional operating costs in our business, consistent with our strategy of leveraging our owned infrastructure assets, we expect to primarily utilize our existing network infrastructure or build new network infrastructure to meet the demand. In limited circumstances, we will augment our network with additional infrastructure or offerings from third-party providers. Third-party network costs include the upfront cost of the initial installation of such infrastructure. Such costs are included in operating costs in our condensed consolidated statements of operations over the respective contract period.
Compensation and benefits expenses include salaries, wages, incentive compensation and benefits. Employee-related costs that are directly associated with network construction and location installations (and development of business support systems) are capitalized and amortized to operating costs and expenses. Compensation and benefits expenses related to the departments attributed to generating revenue are included in our operating costs line item while compensation and benefits expenses related to the sales, product, and corporate departments are included in our selling, general and administrative expenses line item of our condensed consolidated statements of operations.
Netops expense includes all of the non-personnel related expenses of operating and maintaining our network infrastructure, including contracted maintenance fees, right-of-way costs, rent for cellular towers and other places where fiber is located, pole attachment fees, and relocation expenses. Such costs are included in operating costs in our condensed consolidated statements of operations.
45
Stock-based compensation expense is included, based on the responsibilities of the awarded recipient, in either our operating costs or selling, general and administrative expenses in our condensed consolidated statements of operations.
Other expenses include expenses such as property tax, franchise fees, colocation facility maintenance, travel, office expense and other administrative costs. Other expenses are included in both operating costs and selling, general and administrative expenses depending on their relationship to generating revenue or association with sales and administration.
Transaction costs include expenses associated with professional services (i.e. legal, accounting, regulatory, etc.) rendered in connection with acquisitions or disposals (including spin-offs), travel expense and severance expense incurred that are associated with acquisitions or disposals, and other direct expenses incurred that are associated with signed and/or closed acquisitions or disposals and unsuccessful acquisitions. Transaction costs are included in “Selling, general and administrative expenses” in the consolidated statements of operations.
Results of Operations
Refer to “Item 6. Selected Financial Data” for additional financial information for the indicated periods.
Year Ended June 30, 2018 Compared to the Year Ended June 30, 2017
Revenue
|
|
|
For the Year Ended June 30, |
|
||||||||||
|
|
|
2018 |
|
2017 |
|
|
$ Variance |
|
% Variance |
|
|||
|
|
|
|
(in millions) |
|
|||||||||
|
Segment and consolidated revenue: |
|
|
|
|
|
|
|
|
|
|
|
|
|
|
Fiber Solutions |
|
$ |
842.0 |
|
$ |
725.4 |
|
|
$ |
116.6 |
|
16 |
% |
|
Transport |
|
|
670.4 |
|
|
614.3 |
|
|
|
56.1 |
|
9 |
% |
|
Enterprise Networks |
|
|
350.4 |
|
|
310.2 |
|
|
|
40.2 |
|
13 |
% |
|
zColo |
|
|
238.2 |
|
|
214.0 |
|
|
|
24.2 |
|
11 |
% |
|
Allstream |
|
|
479.9 |
|
|
314.3 |
|
|
|
165.6 |
|
53 |
% |
|
Other |
|
|
23.1 |
|
|
21.6 |
|
|
|
1.5 |
|
7 |
% |
|
Consolidated |
|
$ |
2,604.0 |
|
$ |
2,199.8 |
|
|
$ |
404.2 |
|
18 |
% |
Our total revenue increased by $404.2 million, or 18%, to $2,604.0 million for the year ended June 30, 2018, from $2,199.8 million for the year ended June 30, 2017. The increase in revenue was driven by our Fiscal 2018 and 2017 acquisitions as well as organic growth.
We estimate that the period-over-period pro-forma organic revenue growth was approximately 1.3%. Our pro-forma revenue growth was primarily driven by installs that exceeded churn over the course of both periods as a result of the continued strong demand for bandwidth infrastructure access broadly across our network territory and our customer verticals partially offset by changes in exchange rates. The average exchange rate of the GBP against the USD strengthened by 6%, the average exchange rate of the Euro against the USD strengthened by 9%, and the average exchange rate of the CAD against the USD strengthened by 5% during the year ended June 30, 2018 as compared to the year ended June 30, 2017. Normalizing our estimated pro-forma organic revenue growth to exclude the impact of foreign currency exchange rate fluctuations, we estimate that Fiscal 2018 pro-forma organic revenue would have been negatively impacted by $32.3 million.
Additional underlying revenue drivers included:
|
· |
Bookings increased period-over-period from $26.9 million to $33.0 million in combined MRR and MAR, excluding Allstream. The total contract value associated with bookings for the year ended June 30, 2018 was approximately $2,016.0 million, excluding Allstream. |
|
· |
During the year ended June 30, 2018, the Company recognized net installs of $6.5 million as compared to $7.1 million during the year ended June 30, 2017, excluding Allstream. |
46
|
· |
Monthly churn percentage remained consistent between the two periods at 1.2%, excluding Allstream. |
Fiber Solutions. Revenue from our Fiber Solutions segment increased by $116.6 million, or 16%, to $842.0 million from $725.4 million, for the years ended June 30, 2018 and 2017, respectively. The increase was a result of both organic and acquisition related growth.
Transport. Revenue from our Transport segment increased by $56.1 million, or 9%, to $670.4 million from $614.3 million for the years ended June 30, 2018 and 2017, respectively. The increase was a result of both organic and acquisition related growth.
Enterprise Networks. Revenue from our Enterprise Networks segment increased by $40.2 million, or 13%, to $350.4 million from $310.2 million for the years ended June 30, 2018 and 2017. The increase was a result of both organic and acquisition related growth.
zColo. Revenue from our zColo segment increased by $24.2 million, or 11%, to $238.2 million from $214.0 million for the years ended June 30, 2018 and 2017. The increase was a result of both organic and acquisition related growth.
Allstream. Revenue from our Allstream segment increased by $165.6 million, or 53%, to $479.9 million from $314.3 million for the years ended June 30, 2018 and 2017. The increase was primarily a result of acquiring Electric Lightwave on March 1, 2017.
Other. Revenue from our Other segment increased by $1.5 million, or 7%, to $23.1 million from $21.6 million, for the years ended June 30, 2018 and 2017, respectively. The Other segment represented less than 1% of our total revenue during the year ended June 30, 2018.
The following table reflects the stratification of our revenues during these periods. The substantial majority of our revenue continued to come from recurring payments from customers under contractual arrangements.
|
|
|
For the Year Ended June 30, |
|
||||||||||
|
|
|
2018 |
|
|
2017 |
|
|||||||
|
|
|
|
(in millions) |
|
|||||||||
|
Monthly recurring revenue (1) |
|
$ |
2,337.9 |
|
|
90 |
% |
|
$ |
1,973.2 |
|
90 |
% |
|
Amortization of deferred revenue |
|
|
137.8 |
|
|
5 |
% |
|
|
117.6 |
|
5 |
% |
|
Usage revenue |
|
|
74.7 |
|
|
3 |
% |
|
|
72.1 |
|
3 |
% |
|
Other revenue (1) |
|
|
53.6 |
|
|
2 |
% |
|
|
36.9 |
|
2 |
% |
|
Total Revenue |
|
$ |
2,604.0 |
|
|
100 |
% |
|
$ |
2,199.8 |
|
100 |
% |
|
(1) |
Prior period amounts were reclassified for comparability with the 2018 presentation. |
Operating Costs and Expenses
|
|
|
For the Year Ended June 30, |
|
|||||||||
|
|
|
2018 |
|
2017 |
|
$ Variance |
|
% Variance |
|
|||
|
|
|
|
(in millions) |
|
||||||||
|
Segment and consolidated operating costs and expenses: |
|
|
|
|
|
|
|
|
|
|
|
|
|
Fiber Solutions |
|
$ |
551.7 |
|
$ |
560.3 |
|
$ |
(8.6) |
|
(2) |
% |
|
Transport |
|
|
636.9 |
|
|
558.4 |
|
|
78.5 |
|
14 |
% |
|
Enterprise Networks |
|
|
268.6 |
|
|
238.1 |
|
|
30.5 |
|
13 |
% |
|
zColo |
|
|
232.1 |
|
|
200.5 |
|
|
31.6 |
|
16 |
% |
|
Allstream |
|
|
467.2 |
|
|
249.7 |
|
|
217.5 |
|
87 |
% |
|
Other |
|
|
22.6 |
|
|
19.0 |
|
|
3.6 |
|
19 |
% |
|
Consolidated |
|
$ |
2,179.1 |
|
$ |
1,826.0 |
|
$ |
353.1 |
|
19 |
% |
Our operating costs increased by $353.1 million, or 19%, to $2,179.1 million for Fiscal 2018 from $1,826.0 million for Fiscal 2017. The increase in consolidated operating costs was primarily due to the impact from our Fiscal 2018 and 2017 acquisitions and the organic growth of our network footprint.
47
Fiber Solutions. Fiber Solutions operating costs decreased by $8.6 million, or 2%, to $551.7 million for Fiscal 2018 from $560.3 million for Fiscal 2017. The decrease in operating costs and expenses was primarily a result of a $19.7 million decrease in depreciation and amortization primarily as a result of a change in the estimated useful lives of fiber optic network assets from 20 years to 33 years, $8.8 million in Netex and Netops costs and $5.4 million in stock-based compensation, partially offset by increases of $15.3 million in compensation and benefits, $8.2 million in other operating costs and $1.8 million in transaction costs.
Transport. Transport operating costs increased by $78.5 million, or 14%, to $636.9 million for Fiscal 2018 from $558.4 million for Fiscal 2017. The increase in operating costs and expenses was primarily a result of increases in depreciation and amortization of $42.7 million, $39.9 million in Netex and Netops costs, $6.3 million in compensation and benefits and $2.6 million in other operating expenses as a result of Fiscal Year 2017 acquisitions and organic growth of our network, partially offset by decreases of $11.2 million in stock-based compensation and $1.8 million in transaction costs.
Enterprise Networks. Enterprise Networks operating costs increased by $30.5 million, or 13%, to $268.6 million for Fiscal 2018 from $238.1 million for Fiscal 2017. The increase in operating costs and expenses was primarily a result of increases in depreciation and amortization of $12.7 million, Netex and Netops costs of $16.5 million, $2.6 million in other operating expenses and $0.5 million in compensation and benefits as a result of acquisitions and organic growth of our network, partially offset by a decrease of $1.8 million in transaction costs.
zColo. zColo operating costs increased by $31.6 million, or 16%, to $232.1 million for Fiscal 2018 from $200.5 million for Fiscal 2017. The increase in operating costs and expenses was primarily a result of increases of $23.9 million in depreciation and amortization expense, $6.4 million in Netex and Netops costs, $2.7 million in other operating costs and $1.3 million in compensation and benefits, partially offset by a decrease of $2.7 million in stock-based compensation.
Allstream. Allstream operating costs increased by $217.5 million, or 87%, to $467.2 million for Fiscal 2018 from $249.7 million for Fiscal 2017. The increase in operating costs and expenses was primarily a result of increases in Netex and Netops of $103.7 million, depreciation and amortization of $79.5 million, compensation and benefits of $24.8 million and other operating expenses of $7.8 million as a result of acquisitions and organic growth of our network as well as stock based compensation of $1.7 million.
Other. Other operating costs increased by $3.6 million, or 19%, to $22.6 million for Fiscal 2018 from $19.0 million for Fiscal 2017. The increase was directly attributed to an increase in revenue associated with component sales.
The table below sets forth the components of our operating costs and expenses during the years ended June 30, 2018 and 2017:
|
|
|
For the Year Ended June 30, |
|
|||||||||
|
|
|
2018 |
|
2017 |
|
$ Variance |
|
% Variance |
|
|||
|
|
|
|
(in millions) |
|
||||||||
|
Netex |
|
$ |
522.0 |
|
$ |
418.8 |
|
$ |
103.2 |
|
25 |
% |
|
Compensation and benefits expenses |
|
|
323.5 |
|
|
273.6 |
|
|
49.9 |
|
18 |
% |
|
Network operations expense |
|
|
290.6 |
|
|
244.7 |
|
|
45.9 |
|
19 |
% |
|
Other expenses |
|
|
180.3 |
|
|
147.4 |
|
|
32.9 |
|
22 |
% |
|
Transaction costs |
|
|
18.6 |
|
|
20.5 |
|
|
(1.9) |
|
(9) |
% |
|
Stock-based compensation |
|
|
96.7 |
|
|
114.1 |
|
|
(17.4) |
|
(15) |
% |
|
Depreciation and amortization |
|
|
747.4 |
|
|
606.9 |
|
|
140.5 |
|
23 |
% |
|
Total operating costs and expenses |
|
$ |
2,179.1 |
|
$ |
1,826.0 |
|
$ |
353.1 |
|
19 |
% |
Netex. Our Netex increased by $103.2 million, or 25%, to $522.0 million for Fiscal 2018 from $418.8 million for Fiscal 2017. The increase in Netex was primarily due to our Fiscal 2018 and Fiscal 2017 acquisitions, partially offset by cost savings, as planned network related synergies were realized.
Compensation and Benefits Expenses. Compensation and benefits expenses increased by $49.9 million, or 18%, to $323.5 million for Fiscal 2018 from $273.6 million for Fiscal 2017.
48
The increase in compensation and benefits expenses reflected the increase in average headcount for Fiscal 2018 compared to Fiscal 2017 largely due to employees added through the ELI Acquisition in March 2017.
Network Operations Expenses. Network operations expenses increased by $45.9 million, or 19%, to $290.6 million for Fiscal 2018 from $244.7 million for Fiscal 2017. The increase principally reflected the organic and inorganic growth of our network assets and the related expenses of operating that expanded network. Our total network route miles increased approximately 4% to 128,910 miles at June 30, 2018 from 123,841 miles at June 30, 2017.
Other Expenses. Other expenses increased by $32.9 million, or 22%, to $180.3 million for Fiscal 2018, from $147.4 million for Fiscal 2017. The increase was primarily the result of additional expenses attributable to our Fiscal 2018 and 2018 acquisitions.
Transaction Costs. Transaction costs decreased by $1.9 million, or 9%, to $18.6 million for Fiscal 2018 from $20.5 million for Fiscal 2017. The transaction costs recorded during the periods relate to direct costs associated with our Fiscal 2018 and 2017 acquisitions.
Stock-Based Compensation. Stock-based compensation expense decreased by $17.4 million, or 15%, to $96.7 million for Fiscal 2018 from $114.1 million for Fiscal 2017. The decrease in stock-based compensation expense was primarily driven by the remaining tranches of our pre-IPO common unit grants becoming fully vested during our 2017 fiscal year and by a decrease in the number of Part B awards granted.
Depreciation and Amortization. Depreciation and amortization expense increased by $140.5 million, or 23%, to $747.4 million for Fiscal 2018 from $606.9 million for Fiscal 2017. The increase was primarily a result of depreciation related to increased capital expenditures and increased depreciation and amortization expense associated with our Fiscal 2018 and 2017 acquisitions, including $18.6 million resulting from recording revised fair value estimates of intangible assets and property and equipment associated with the Electric Lightwave acquisition, of which $6.2 million relates to previous reporting periods.
Total Other Expense, Net
The table below sets forth the components of our total other expense, net for the years ended June 30, 2018 and 2017.
|
|
|
For the Year Ended June 30, |
|
|||||||||
|
|
|
2018 |
|
2017 |
|
$ Variance |
|
% Variance |
|
|||
|
|
|
|
(in millions) |
|
||||||||
|
Interest expense |
|
$ |
(299.8) |
|
$ |
(241.5) |
|
$ |
(58.3) |
|
(24) |
% |
|
Loss on extinguishment of debt |
|
|
(4.9) |
|
|
(18.2) |
|
|
13.3 |
|
73 |
% |
|
Foreign currency gain/(loss) on intercompany loans |
|
|
5.4 |
|
|
(10.3) |
|
|
15.7 |
|
|
* |
|
Other income, net |
|
|
2.4 |
|
|
0.3 |
|
|
2.1 |
|
|
* |
|
Total other expenses, net |
|
$ |
(296.9) |
|
$ |
(269.7) |
|
$ |
(27.2) |
|
(10) |
% |
* Not meaningful
Interest expense. Interest expense increased by $58.3 million, or 24%, to $299.8 million from $241.5 million for the years ended June 30, 2018 and 2017, respectively. The increase was primarily a result of an increase in debt from the comparative period resulting from incremental debt raised to fund our acquisitions in addition to increasing LIBOR rates.
Loss on extinguishment of debt. Loss on extinguishment of debt was $4.9 million for the year ended June 30, 2018 as compared to $18.2 million for the year ended June 30, 2017. The Fiscal 2018 loss on extinguishment of debt includes a non-cash expense associated with the write-off of unamortized debt issuance costs and the issuance discounts on the portion of the Credit Agreement, as amended, that was deemed to have been extinguished as well as the portion
49
extinguished through early prepayment. The loss on extinguishment of debt also includes certain fees paid to third parties involved in the second repricing of the Credit Agreement. See Note 7 – Long-Term Debt.
Foreign currency gain/ (loss) on intercompany loans. We recorded a foreign currency gain on intercompany loans of $5.4 million for Fiscal 2018, compared to a $10.3 million loss for Fiscal 2017. We have intercompany loans between our U.S., UK and Canadian legal entities, which were established to fund our international acquisitions. As the loans are recorded as an intercompany receivable at our U.S. entities, strengthening of the USD over a foreign currency results in a foreign currency loss on intercompany loans and the weakening of the USD over a foreign currency results in a gain on intercompany loans. This non-cash gain was driven by the strengthening of the USD over the GBP period-over-period and the related impact on intercompany loans entered into by foreign subsidiaries with functional currency in GBP.
Provision for Income Taxes
Income tax expense increased over the prior year by $7.7 million, to an expense of $26.1 million for Fiscal 2018, from an expense of $18.4 million for Fiscal 2017. Our provision for income tax included both the current provision and a provision for deferred income tax expense resulting from timing differences between tax and financial reporting accounting bases.
On December 22, 2017, the U.S. federal government enacted a tax bill, H.R.1, An Act to Provide for Reconciliation Pursuant to Titles II and V of the Concurrent Resolution on the Budget for Fiscal Year 2018, previously known as Tax Cuts and Jobs Act of 2017 (“U.S. Tax Reform”). U.S. Tax Reform reduced the U.S. corporate tax rate from 35% to 21%, created a territorial tax system with a one-time mandatory repatriation tax on previously deferred foreign earnings, and changed business-related deductions and credits.
U.S. Tax Reform has a material impact on the comparison of our effective tax rate and the expected income tax expense at the statutory rate for Fiscal 2018 and increased the effective tax rate. The following table reconciles an expected tax provision based on a statutory federal tax rate applied to our earnings before income tax to our actual provision for income taxes:
|
|
|
For the Year Ended June 30, |
||||
|
|
|
2018 |
|
2017 |
||
|
|
|
|
(in millions) |
|||
|
Expected provision at the statutory rate |
|
$ |
35.9 |
|
$ |
36.4 |
|
Increase/(decrease) due to: |
|
|
|
|
|
|
|
Stock-based compensation |
|
|
3.8 |
|
|
(11.7) |
|
State income taxes, net of federal benefit |
|
|
3.2 |
|
|
2.9 |
|
Transaction costs not deductible for U.S. federal income tax purposes |
|
|
0.4 |
|
|
1.9 |
|
Change in statutory tax rate, non-U.S. |
|
|
7.4 |
|
|
(1.4) |
|
Change in valuation allowance |
|
|
(49.3) |
|
|
(10.2) |
|
State NOL expirations |
|
|
6.1 |
|
|
— |
|
U.S. Tax Reform |
|
|
24.8 |
|
|
— |
|
Foreign tax rate differential |
|
|
(2.4) |
|
|
(3.9) |
|
Other, net |
|
|
(3.8) |
|
|
4.4 |
|
Provision for income taxes |
|
$ |
26.1 |
|
$ |
18.4 |
Some U.S. Tax Reform provisions are effective for years beginning after December 31, 2017, which would be our fiscal-year ending on June 30, 2019, including the tax on global intangible low taxed income, Base Erosion and Anti-abuse Tax, interest expense limitations, and executive compensation limitations. We continue to evaluate these and other impacts of U.S. Tax Reform as more information and guidance becomes available.
50
Year Ended June 30, 2017 Compared to the Year Ended June 30, 2016
Revenue
|
|
|
For the Year Ended June 30, |
|
||||||||||
|
|
|
2017 |
|
2016 |
|
|
$ Variance |
|
% Variance |
|
|||
|
|
|
|
(in millions) |
|
|||||||||
|
Segment and consolidated revenue: |
|
|
|
|
|
|
|
|
|
|
|
|
|
|
Fiber Solutions |
|
$ |
725.4 |
|
$ |
648.8 |
|
|
$ |
76.6 |
|
12 |
% |
|
Transport |
|
|
614.3 |
|
|
522.6 |
|
|
|
91.7 |
|
18 |
% |
|
Enterprise Networks |
|
|
310.2 |
|
|
228.4 |
|
|
|
81.8 |
|
36 |
% |
|
zColo |
|
|
214.0 |
|
|
195.4 |
|
|
|
18.6 |
|
10 |
% |
|
Allstream |
|
|
314.3 |
|
|
106.2 |
|
|
|
208.1 |
|
|
* |
|
Other |
|
|
21.6 |
|
|
20.3 |
|
|
|
1.3 |
|
6 |
% |
|
Consolidated |
|
$ |
2,199.8 |
|
$ |
1,721.7 |
|
|
$ |
478.1 |
|
28 |
% |
* Not meaningful
Our total revenue increased by $478.1 million, or 28%, to $2,199.8 million for the year ended June 30, 2017, from $1,721.7 million for the year ended June 30, 2016. The increase in revenue was driven by our Fiscal 2016 and 2017 acquisitions as well as organic growth.
We estimate that the period-over-period pro-forma organic revenue declined by 0.9%. Our pro-forma revenue decline was primarily driven by declining revenue from the voice businesses acquired in our Fiscal 2016 and 2017 acquisitions. Offsetting this pro-forma decline was organic growth resulting from installs that exceeded churn over the course of both periods as a result of the continued strong demand for bandwidth infrastructure access broadly across our network territory and our customer verticals offset by changes in exchange rates. The average exchange rate of the GBP against the USD strengthened by 14.5%, the average exchange rate of the Euro against the USD strengthened by 1.8%, and the average exchange rate of the CAD against the USD strengthened by 0.3%. Normalizing our estimated pro-forma organic revenue growth to exclude the impact of foreign currency exchange rate fluctuations, we estimate that Fiscal 2018 pro-forma organic revenue would have been negatively impacted by $14.9 million.
Additional underlying revenue drivers included:
|
· |
Bookings increased period-over-period from $26.6 million to $26.9 million in combined MRR and MAR, excluding Allstream. The total contract value associated with bookings for the year ended June 30, 2017 was approximately $1,490.0 million, excluding Allstream. |
|
· |
During the year ended June 30, 2017, the Company recognized net installs of $7.1 million as compared to $9.0 million during the year ended June 30, 2016, excluding Allstream. |
|
· |
Monthly churn percentage between the two periods increased to 1.2% from 1.1%, excluding Allstream. |
Fiber Solutions. Revenue from our Fiber Solutions segment increased by $76.6 million, or 12%, to $725.4 million from $648.8 million, for the years ended June 30, 2017 and 2016, respectively. The increase was a result of both organic and acquisition related growth.
51
Transport. Revenue from our Transport segment increased by $91.7 million, or 18%, to $614.3 million from $522.6 million for the years ended June 30, 2017 and 2016, respectively. The increase was a result of both organic and acquisition related growth.
Enterprise Networks. Revenue from our Enterprise Networks segment increased by $81.8 million, or 36%, to $310.2 million from $228.4 million for the years ended June 30, 2017 and 2016, respectively. The increase was a result of both organic and acquisition related growth.
zColo. Revenue from our zColo segment increased by $18.6 million, or 10%, to $214.0 million from $195.4 million for the years ended June 30, 2017 and 2016, respectively. The increase was a result of both organic and acquisition related growth.
Allstream. Revenue from our Allstream segment increased by $208.1 million to $314.3 million from $106.2 million for the years ended June 30, 2017 and 2016. The increase was a result of acquiring the Allstream business on January 15, 2016 and Electric Lightwave on March 1, 2017.
Other. Revenue from our Other segment increased by $1.3 million, or 6%, to $21.6 million from $20.3 million, for the years ended June 30, 2017 and 2016, respectively. The Other segment represented approximately 1% of our total revenue during the year ended June 30, 2017.
The following table reflects the stratification of our revenues during these periods. The substantial majority of our revenue continued to come from recurring payments from customers under contractual arrangements.
|
|
|
For the Year Ended June 30, |
|
||||||||||
|
|
|
2017 |
|
|
2016 |
|
|||||||
|
|
|
|
(in millions) |
|
|||||||||
|
Monthly recurring revenue (1) |
|
$ |
1,973.2 |
|
|
90 |
% |
|
$ |
1,546.0 |
|
90 |
% |
|
Amortization of deferred revenue |
|
|
117.6 |
|
|
5 |
% |
|
|
92.5 |
|
5 |
% |
|
Usage revenue |
|
|
72.1 |
|
|
3 |
% |
|
|
45.9 |
|
3 |
% |
|
Other revenue (1) |
|
|
36.9 |
|
|
2 |
% |
|
|
37.3 |
|
2 |
% |
|
Total Revenue |
|
$ |
2,199.8 |
|
|
100 |
% |
|
$ |
1,721.7 |
|
100 |
% |
|
(1) |
2017 amounts were reclassified for comparability with the 2018 presentation. |
Operating Costs and Expenses
|
|
|
For the Year Ended June 30, |
|
|||||||||
|
|
|
2017 |
|
2016 |
|
$ Variance |
|
% Variance |
|
|||
|
|
|
(in millions) |
|
|||||||||
|
Segment and consolidated operating costs and expenses: |
|
|
|
|
|
|
|
|
|
|
|
|
|
Fiber Solutions |
|
$ |
560.3 |
|
$ |
474.0 |
|
$ |
86.3 |
|
18 |
% |
|
Transport |
|
|
558.4 |
|
|
492.1 |
|
|
66.3 |
|
13 |
% |
|
Enterprise Networks |
|
|
238.1 |
|
|
196.5 |
|
|
41.6 |
|
21 |
% |
|
zColo |
|
|
200.5 |
|
|
192.1 |
|
|
8.4 |
|
4 |
% |
|
Allstream |
|
|
249.7 |
|
|
108.5 |
|
|
141.2 |
|
|
* |
|
Other |
|
|
19.0 |
|
|
18.2 |
|
|
0.8 |
|
4 |
% |
|
Consolidated |
|
$ |
1,826.0 |
|
$ |
1,481.4 |
|
$ |
344.6 |
|
23 |
% |
* Not meaningful
Our operating costs increased by $344.6 million, or 23%, to $1,826.0 million for Fiscal 2017 from $1,481.4 million for Fiscal 2016. The increase in consolidated operating costs was primarily due to increased costs as a result of Fiscal 2017 and Fiscal 2016 acquisitions, and the organic growth of our network footprint, partially offset by a $41.8 million decrease in stock-based compensation.
Fiber Solutions. Fiber Solutions operating costs increased by $86.3 million, or 18%, to $560.3 million for Fiscal 2017 from $474.0 million for Fiscal 2016. The increase in operating costs and expenses was primarily a result of a $93.1
52
million increase in depreciation and amortization as well as our Fiscal 2017 and Fiscal 2016 acquisitions and additional costs associated with the organic growth of our network, partially offset by a $17.8 million decrease in stock-based compensation.
Transport. Transport operating costs increased by $66.3 million, or 13%, to $558.4 million for Fiscal 2017 from $492.1 million for Fiscal 2016. The increase in operating costs and expenses was primarily a result of our Fiscal 2017 and Fiscal 2016 acquisitions and organic growth of our network.
Enterprise Networks. Enterprise Networks operating costs increased by $41.6 million, or 21%, to $238.1 million for Fiscal 2017 from $196.5 million for Fiscal 2016. The increase in operating costs and expenses was primarily a result of Fiscal 2017 and 2016 acquisitions and organic growth of our network.
zColo. zColo operating costs increased by $8.4 million, or 4%, to $200.5 million for Fiscal 2017 from $192.1 million for Fiscal 2016. The increase in operating costs and expenses was primarily a result of Fiscal 2017 and 2016 acquisitions.
Allstream. Allstream operating costs increased by $141.2 million to $249.7 million for Fiscal 2017 from $108.5 million for Fiscal 2016. The increase in operating costs and expenses was primarily a result of acquiring the Allstream business on January 15, 2016 and Electric Lightwave on March 1, 2017.
Other. Other operating costs increased by $0.8 million, or 4%, to $19.0 million for Fiscal 2017 from $18.2 million for Fiscal 2016 as a result of increased revenue from equipment sales.
The table below sets forth the components of our operating costs and expenses during the years ended June 30, 2017 and 2016:
|
|
|
For the Year Ended June 30, |
|
|||||||||
|
|
|
2017 |
|
2016 |
|
$ Variance |
|
% Variance |
|
|||
|
|
|
(in millions) |
|
|||||||||
|
Netex |
|
$ |
418.8 |
|
$ |
283.0 |
|
$ |
135.8 |
|
48 |
% |
|
Compensation and benefits expenses |
|
|
273.6 |
|
|
216.8 |
|
|
56.8 |
|
26 |
% |
|
Network operations expense |
|
|
244.7 |
|
|
194.5 |
|
|
50.2 |
|
26 |
% |
|
Other expenses |
|
|
147.4 |
|
|
93.4 |
|
|
54.0 |
|
58 |
% |
|
Transaction costs |
|
|
20.5 |
|
|
21.5 |
|
|
(1.0) |
|
(5) |
% |
|
Stock-based compensation |
|
|
114.1 |
|
|
155.9 |
|
|
(41.8) |
|
(27) |
% |
|
Depreciation and amortization |
|
|
606.9 |
|
|
516.3 |
|
|
90.6 |
|
18 |
% |
|
Total operating costs and expenses |
|
$ |
1,826.0 |
|
$ |
1,481.4 |
|
$ |
344.6 |
|
23 |
% |
* Not meaningful
Netex. Our Netex increased by $135.8 million, or 48%, to $418.8 million for Fiscal 2017 from $283.0 million for Fiscal 2016. The increase in Netex was primarily due to our Fiscal 2017 and Fiscal 2016 acquisitions, partially offset by cost savings, as planned network related synergies were realized.
Compensation and Benefits Expenses. Compensation and benefits expenses increased by $56.8 million, or 26%, to $273.6 million for Fiscal 2017 from $216.8 million for Fiscal 2016.
The increase in compensation and benefits expenses reflected the increase in headcount from 3,224 for Fiscal 2016 to 3,794 for Fiscal 2017 to support our growing business, including employees retained from businesses acquired during Fiscal 2017 and 2016.
Network Operations Expenses. Network operations expenses increased by $50.2 million, or 26%, to $244.7 million for Fiscal 2017 from $194.5 million for Fiscal 2016. The increase principally reflected the organic and inorganic growth of our network assets and the related expenses of operating that expanded network. Our total network route miles increased approximately 10% to 123,841 miles at June 30, 2017 from 112,660 miles at June 30, 2016.
53
Other Expenses. Other expenses increased by $54.0 million, or 58%, to $147.4 million for Fiscal 2017, from $93.4 million for Fiscal 2016. The increase was primarily the result of additional expenses attributable to our Fiscal 2016 and 2017 acquisitions.
Transaction Costs. Transaction costs decreased by $1.0 million, or 5%, to $20.5 million for Fiscal 2017 from $21.5 million for Fiscal 2016. The transaction costs recorded during the periods relate to direct costs associated with completing our Fiscal 2017 and 2016 acquisitions.
Stock-Based Compensation. Stock-based compensation expense decreased by $41.8 million, or 27%, to $114.1 million for Fiscal 2017 from $155.9 million for Fiscal 2016. The decrease in stock-based compensation expense was primarily driven by the remaining tranches of our pre-IPO common unit grants of CII becoming fully vested in the quarter ended December 31, 2016.
Prior to our IPO, we recognized changes in the fair value of the CII common units through increases or decreases in stock-based compensation expense and adjustments to the related stock-based compensation liability. This liability was impacted by changes in the estimated value of the common units, number of vested common units, and distributions made to holders of the common units. In connection with our IPO, we re-measured the fair value of the common units at the offering date based on various projections involving future stock performance, vesting and forfeitures. The fair value of unvested common units on the offering date is recognized as stock-based compensation expense ratably over the remaining vesting period.
Depreciation and Amortization. Depreciation and amortization expense increased by $90.6 million, or 18%, to $606.9 million for Fiscal 2017 from $516.3 million for Fiscal 2016. The increase was primarily a result of depreciation related to increased capital expenditures and increased depreciation and amortization expense associated with our Fiscal 2016 and 2017 acquisitions.
Total Other Expense, Net
The table below sets forth the components of our total other expense, net for the years ended June 30, 2017 and 2016.
|
|
|
For the Year Ended June 30, |
|
|||||||||
|
|
|
2017 |
|
2016 |
|
$ Variance |
|
% Variance |
|
|||
|
|
|
|
(in millions) |
|
||||||||
|
Interest expense |
|
$ |
(241.5) |
|
$ |
(220.1) |
|
$ |
(21.4) |
|
(10) |
% |
|
Loss on extinguishment of debt |
|
|
(18.2) |
|
|
(33.8) |
|
|
15.6 |
|
46 |
% |
|
Foreign currency loss on intercompany loans |
|
|
(10.3) |
|
|
(53.8) |
|
|
43.5 |
|
81 |
% |
|
Other income/(expense), net |
|
|
0.3 |
|
|
(0.3) |
|
|
0.6 |
|
|
* |
|
Total other expenses, net |
|
$ |
(269.7) |
|
$ |
(308.0) |
|
$ |
38.3 |
|
12 |
% |
* Not meaningful
Interest expense. Interest expense increased by $21.4 million, or 10%, to $241.5 million from $220.1 million for the years ended June 30, 2017 and 2016, respectively. The increase was primarily a result of an increase in debt from the comparative period resulting from incremental debt raised to fund our acquisitions of Allstream and Electric Lightwave. Partially offsetting the increase in interest expense was a benefit resulting from downward repricing of the interest rates on our previous indebtedness.
Loss on extinguishment of debt. Loss on extinguishment of debt decreased to a $18.2 million loss for the year ended June 30, 2017 from a loss of $33.8 million for the year ended June 30, 2016. The $18.2 million loss on extinguishment of debt in Fiscal 2017 represents a non-cash expense associated with the write-off of unamortized debt issuance costs and the issuance discounts on the portion of the Credit Agreement, as further amended, which was deemed to have been extinguished as well as the portion extinguished through early prepayment. The loss on extinguishment of debt also includes certain fees paid to third parties involved in the Incremental Amendment. These expenses were recorded as a loss on extinguishment of debt during Fiscal 2017.
54
Foreign currency loss on intercompany loans. Foreign currency loss on intercompany loans decreased to $10.3 million loss for Fiscal 2017 from $53.8 million for Fiscal 2016. This non-cash loss was driven by the strengthening of the USD against the GBP period over period and the related impact on intercompany loans entered into by foreign subsidiaries in their functional currency.
Provision for Income Taxes
Income tax expense increased over the prior year by $9.9 million, to $18.4 million for Fiscal 2017, from $8.5 million for Fiscal 2016. Our provision for income tax included both the current provision and a provision for deferred income tax expense resulting from timing differences between tax and financial reporting accounting bases.
The tax rate for the year ended June 30, 2017 was lower than the statutory rate due to the positive impact of stock-based compensation expense related to excess tax benefit of vested RSUs and reversal of valuation allowances recorded on certain foreign subsidiaries.
The tax rate for the year ended June 30, 2017 was negatively impacted by stock-based compensation expense related to the common units of CII of $3.7 million. The quarter ended December 31, 2016, was the final period for stock-based compensation expense associated with the common units of CII.
The following table reconciles our expected tax provision based on the statutory U.S. federal income tax rate applied to our earnings before income tax to our actual provision for income taxes:
|
|
|
For the Year Ended June 30, |
||||
|
|
|
2017 |
|
2016 |
||
|
|
|
|
(in millions) |
|||
|
Expected provision/(benefit) at the statutory rate |
|
$ |
36.4 |
|
$ |
(23.8) |
|
Increase/(decrease) due to: |
|
|
|
|
|
|
|
Stock-based compensation |
|
|
(11.7) |
|
|
27.9 |
|
State income taxes, net of federal benefit |
|
|
2.9 |
|
|
(2.1) |
|
Transaction costs not deductible for U.S. federal income tax purposes |
|
|
1.9 |
|
|
1.5 |
|
Change in statutory tax rate |
|
|
(1.4) |
|
|
(3.6) |
|
Change in valuation allowance |
|
|
(10.2) |
|
|
2.8 |
|
Foreign tax rate differential |
|
|
(3.9) |
|
|
2.7 |
|
Other, net |
|
|
4.4 |
|
|
3.1 |
|
Provision/(benefit) for income taxes |
|
$ |
18.4 |
|
$ |
8.5 |
Adjusted EBITDA
We define Adjusted EBITDA as earnings/(loss) from operations before interest, income taxes, depreciation and amortization (“EBITDA”) adjusted to exclude acquisition or disposal-related transaction costs, losses on extinguishment of debt, stock-based compensation, unrealized foreign currency gains (losses) on intercompany loans, and non-cash income (loss) on equity and cost method investments. We use Adjusted EBITDA to evaluate operating performance, and this financial measure is among the primary measures used by management for planning and forecasting for future periods. We believe that the presentation of Adjusted EBITDA is relevant and useful for investors because it allows investors to view results in a manner similar to the method used by management and facilitates comparison of our results with the results of other companies that have different financing and capital structures.
We also monitor Adjusted EBITDA because our subsidiaries have debt covenants that restrict their borrowing capacity that are based on a leverage ratio, which utilizes a modified EBITDA, as defined in our Credit Agreement and the indentures governing our outstanding Notes. The modified EBITDA is consistent with our definition of Adjusted EBITDA; however, it includes the pro forma Adjusted EBITDA of and expected cost synergies from the companies acquired by us during the quarter for which the debt compliance certification is due.
Adjusted EBITDA results, along with other quantitative and qualitative information, are also utilized by management and our compensation committee for purposes of determining bonus payouts to employees.
55
Adjusted EBITDA has limitations as an analytical tool and should not be considered in isolation from, or as a substitute for, analysis of our results as reported under accounting principles generally accepted in the United States (“GAAP”). For example, Adjusted EBITDA:
|
· |
does not reflect capital expenditures, or future requirements for capital and major maintenance expenditures or contractual commitments; |
|
· |
does not reflect changes in, or cash requirements for, our working capital needs; |
|
· |
does not reflect the significant interest expense, or the cash requirements necessary to service the interest payments, on our debt; and |
|
· |
does not reflect cash required to pay income taxes. |
Our computation of Adjusted EBITDA may not be comparable to other similarly titled measures computed by other companies because all companies do not calculate Adjusted EBITDA in the same fashion.
Reconciliations from segment and consolidated Adjusted EBITDA to net income/(loss) are as follows:
|
|
|
For the year ended June 30, 2018 |
||||||||||||||||||||||
|
|
|
Fiber |
|
Transport |
|
Enterprise |
|
zColo |
|
Allstream |
|
Other |
|
Corp/ |
|
Total |
||||||||
|
|
|
|
(in millions) |
|||||||||||||||||||||
|
Segment and consolidated Adjusted EBITDA |
|
$ |
673.2 |
|
$ |
230.3 |
|
$ |
148.2 |
|
$ |
120.3 |
|
$ |
114.0 |
|
$ |
5.0 |
|
$ |
— |
|
$ |
1,291.0 |
|
Interest expense |
|
|
(166.0) |
|
|
(50.1) |
|
|
(29.3) |
|
|
(38.5) |
|
|
(16.1) |
|
|
— |
|
|
0.2 |
|
|
(299.8) |
|
Provision for income taxes |
|
|
— |
|
|
— |
|
|
— |
|
|
— |
|
|
22.8 |
|
|
— |
|
|
(48.9) |
|
|
(26.1) |
|
Depreciation and amortization expense |
|
|
(337.7) |
|
|
(167.4) |
|
|
(47.0) |
|
|
(101.7) |
|
|
(90.4) |
|
|
(1.8) |
|
|
(1.4) |
|
|
(747.4) |
|
Transaction costs |
|
|
(5.5) |
|
|
(3.7) |
|
|
(3.1) |
|
|
(1.2) |
|
|
(5.0) |
|
|
— |
|
|
(0.1) |
|
|
(18.6) |
|
Stock-based compensation |
|
|
(38.4) |
|
|
(25.6) |
|
|
(16.3) |
|
|
(11.2) |
|
|
(4.5) |
|
|
(0.7) |
|
|
— |
|
|
(96.7) |
|
Loss on extinguishment of debt |
|
|
— |
|
|
— |
|
|
— |
|
|
— |
|
|
— |
|
|
— |
|
|
(4.9) |
|
|
(4.9) |
|
Foreign currency gain on intercompany loans |
|
|
— |
|
|
— |
|
|
— |
|
|
— |
|
|
— |
|
|
— |
|
|
5.4 |
|
|
5.4 |
|
Non-cash loss on investments |
|
|
(0.9) |
|
|
0.1 |
|
|
— |
|
|
0.1 |
|
|
— |
|
|
(0.3) |
|
|
— |
|
|
(1.0) |
|
Net income/(loss) |
|
$ |
124.7 |
|
$ |
(16.4) |
|
$ |
52.5 |
|
$ |
(32.2) |
|
$ |
20.8 |
|
$ |
2.2 |
|
$ |
(49.7) |
|
$ |
101.9 |
|
|
|
For the year ended June 30, 2017 |
||||||||||||||||||||||
|
|
|
Fiber |
|
Transport |
|
Enterprise |
|
zColo |
|
Allstream |
|
Other |
|
Corp/ |
|
Total |
||||||||
|
|
|
(in millions) |
||||||||||||||||||||||
|
Segment and consolidated Adjusted EBITDA |
|
$ |
570.4 |
|
$ |
223.0 |
|
$ |
127.9 |
|
$ |
107.1 |
|
$ |
83.3 |
|
$ |
5.1 |
|
$ |
— |
|
$ |
1,116.8 |
|
Interest expense |
|
|
(135.6) |
|
|
(48.3) |
|
|
(19.1) |
|
|
(32.0) |
|
|
(7.1) |
|
|
— |
|
|
0.6 |
|
|
(241.5) |
|
Provision for income taxes |
|
|
— |
|
|
— |
|
|
— |
|
|
— |
|
|
— |
|
|
— |
|
|
(18.4) |
|
|
(18.4) |
|
Depreciation and amortization expense |
|
|
(357.4) |
|
|
(124.7) |
|
|
(34.3) |
|
|
(77.8) |
|
|
(10.9) |
|
|
(1.8) |
|
|
— |
|
|
(606.9) |
|
Transaction costs |
|
|
(3.7) |
|
|
(5.5) |
|
|
(4.9) |
|
|
(1.8) |
|
|
(4.6) |
|
|
— |
|
|
— |
|
|
(20.5) |
|
Stock-based compensation |
|
|
(43.8) |
|
|
(36.8) |
|
|
(16.3) |
|
|
(14.0) |
|
|
(2.8) |
|
|
(0.4) |
|
|
— |
|
|
(114.1) |
|
Loss on extinguishment of debt |
|
|
— |
|
|
— |
|
|
— |
|
|
— |
|
|
— |
|
|
— |
|
|
(18.2) |
|
|
(18.2) |
|
Foreign currency loss on intercompany loans |
|
|
— |
|
|
— |
|
|
(0.1) |
|
|
— |
|
|
— |
|
|
— |
|
|
(10.2) |
|
|
(10.3) |
|
Non-cash loss on investments |
|
|
(1.1) |
|
|
— |
|
|
— |
|
|
— |
|
|
— |
|
|
— |
|
|
(0.1) |
|
|
(1.2) |
|
Net income/(loss) |
|
$ |
28.8 |
|
$ |
7.7 |
|
$ |
53.2 |
|
$ |
(18.5) |
|
$ |
57.9 |
|
$ |
2.9 |
|
$ |
(46.3) |
|
$ |
85.7 |
56
|
|
|
For the year ended June 30, 2016 |
||||||||||||||||||||||
|
|
|
Fiber |
|
Transport |
|
Enterprise |
|
zColo |
|
Allstream |
|
Other |
|
Corp/ |
|
Total |
||||||||
|
|
|
(in millions) |
||||||||||||||||||||||
|
Segment and consolidated Adjusted EBITDA |
|
$ |
504.0 |
|
$ |
208.4 |
|
$ |
100.6 |
|
$ |
99.5 |
|
$ |
17.9 |
|
$ |
4.5 |
|
$ |
— |
|
$ |
934.9 |
|
Interest expense |
|
|
(129.5) |
|
|
(45.2) |
|
|
(17.1) |
|
|
(28.4) |
|
|
— |
|
|
— |
|
|
0.1 |
|
|
(220.1) |
|
Provision for income taxes |
|
|
— |
|
|
0.2 |
|
|
0.2 |
|
|
— |
|
|
(0.4) |
|
|
— |
|
|
(8.5) |
|
|
(8.5) |
|
Depreciation and amortization expense |
|
|
(264.3) |
|
|
(118.9) |
|
|
(41.3) |
|
|
(75.8) |
|
|
(14.1) |
|
|
(1.8) |
|
|
(0.1) |
|
|
(516.3) |
|
Transaction costs |
|
|
(3.1) |
|
|
(6.5) |
|
|
(5.2) |
|
|
(1.1) |
|
|
(5.6) |
|
|
— |
|
|
— |
|
|
(21.5) |
|
Stock-based compensation |
|
|
(61.6) |
|
|
(52.4) |
|
|
(22.0) |
|
|
(19.1) |
|
|
(0.4) |
|
|
(0.4) |
|
|
— |
|
|
(155.9) |
|
Loss on extinguishment of debt |
|
|
— |
|
|
— |
|
|
— |
|
|
— |
|
|
— |
|
|
— |
|
|
(33.8) |
|
|
(33.8) |
|
Foreign currency gain/(loss) on intercompany loans |
|
|
0.3 |
|
|
0.3 |
|
|
0.2 |
|
|
— |
|
|
0.3 |
|
|
— |
|
|
(54.9) |
|
|
(53.8) |
|
Non cash loss on investment |
|
|
(1.3) |
|
|
— |
|
|
— |
|
|
— |
|
|
— |
|
|
— |
|
|
0.1 |
|
|
(1.2) |
|
Net income/(loss) |
|
$ |
44.5 |
|
$ |
(14.1) |
|
$ |
15.4 |
|
$ |
(24.9) |
|
$ |
(2.3) |
|
$ |
2.3 |
|
$ |
(97.1) |
|
$ |
(76.2) |
Liquidity and Capital Resources
Our primary sources of liquidity have been cash provided by operations, equity offerings, and incurrence of debt. Our principal uses of cash have been for acquisitions, capital expenditures, working capital, and debt service requirements. We anticipate that our principal uses of cash in the future will be for acquisitions, capital expenditures, working capital, and debt service.
We have financial covenants under the indentures governing the 6.00% senior unsecured notes due 2023 (the “2023 Unsecured Notes”), the 6.375% senior unsecured notes due 2025 (the “2025 Unsecured Notes”) and the 5.75% Senior Notes due 2027 (the “2027 Unsecured Notes” and collectively with the 2023 and 2025 Unsecured Notes, the “Notes”) and our amended and restated credit agreement governing our senior secured term loan facility and revolving credit facility (the “Credit Agreement”) that, under certain circumstances, restrict our ability to incur additional indebtedness. The indentures governing the Notes limit any increase in ZGL’s secured indebtedness (other than certain forms of secured indebtedness expressly permitted under such indentures) to a pro forma secured debt ratio of 4.50 times ZGL’s previous quarter’s annualized modified EBITDA (as defined in the indentures), and limit ZGL’s incurrence of additional indebtedness to a total indebtedness ratio of 6.00 times the previous quarter’s annualized modified EBITDA. The Credit Agreement also contains a covenant, applicable only to the Revolver, that ZGL maintain a senior secured leverage ratio below 5.25:1.00 at any time when the aggregate principal amount of loans outstanding under the Revolver is greater than 35% of the commitments under the Revolver. The Credit Agreement also requires ZGL and its subsidiaries to comply with customary affirmative and negative covenants, including covenants restricting the ability of ZGL and its subsidiaries, subject to specified exceptions, to incur additional indebtedness, make additional guaranties, incur additional liens on assets, or dispose of assets, pay dividends, or make other distributions, voluntarily prepay certain other indebtedness, enter into transactions with affiliated persons, make investments and amend the terms of certain other indebtedness. The Credit Agreement contains customary events of default, including among others, non-payment of principal, interest, or other amounts when due, inaccuracy of representations and warranties, breach of covenants, cross default to certain other indebtedness, insolvency or inability to pay debts, bankruptcy, or a change of control.
As of June 30, 2018, we had $256.7 million in cash and cash equivalents and a working capital surplus of $12.6 million, of which $35.7 million relates to net assets held for sale. Cash and cash equivalents consist of amounts held in bank accounts and highly-liquid U.S. treasury money market funds. We have a current deferred revenue balance of $164.4 million that we will be recognizing as revenue over the next twelve months. The actual cash outflows associated with fulfilling this deferred revenue obligation during the next twelve months will be significantly less than the June 30, 2018 current deferred revenue balance. Additionally, as of June 30, 2018, we had $441.9 million available under our Revolver, subject to certain conditions. Accordingly, we believe that we have sufficient resources to fund our obligations and foreseeable liquidity requirements in the near term and for the foreseeable future.
Our capital expenditures decreased by $45.6 million, or 5%, during the year ended June 30, 2018 as compared to the year ended June 30, 2017, to $789.9 million from $835.5 million. Although we had a decrease in the period, we expect to continue to invest in our network for the foreseeable future. As of June 30, 2018, we were contractually committed for $509.4 million of capital expenditures for construction materials and purchases of property and equipment. A majority of these capital expenditure commitments are expected to be satisfied in the next twelve months.
57
These capital expenditures, however, are expected to primarily be success-based; that is, in most situations, we will not invest the capital until we have an executed customer contract that supports the investment.
As part of our corporate strategy, we continue to be regularly involved in discussions regarding potential acquisitions of companies and assets, some of which may be quite large. We expect to fund such acquisitions with cash from operations, debt issuances (including available borrowings under our $450.0 million Revolver), equity offerings, and available cash on hand. We regularly assess our projected capital requirements to fund future growth in our business, repay our debt obligations, and support our other general corporate and operational needs, and we regularly evaluate our opportunities to raise additional capital. As market conditions permit, we may refinance existing debt, issue new debt or equity securities through the capital markets, or obtain additional bank financing to fund our projected capital requirements or provide additional liquidity.
Cash Flows
We believe that our cash flows from operating activities, in addition to cash and cash equivalents currently on-hand, will be sufficient to fund our operating activities and capital expenditures for the foreseeable future, and in any event for at least the next 12 to 18 months. Given the generally volatile global economic climate, no assurance can be given that this will be the case.
We regularly consider acquisitions and additional strategic opportunities, including large acquisitions, which may require additional debt or equity financing.
The following table sets forth components of our cash flow for the years ended June 30, 2018, 2017 and 2016.
|
|
|
Year Ended June 30, |
|||||||
|
|
|
2018 |
|
2017 |
|
2016 |
|||
|
|
|
(in millions) |
|||||||
|
Net cash provided by operating activities |
|
$ |
971.1 |
|
$ |
909.8 |
|
$ |
714.0 |
|
Net cash used in investing activities |
|
$ |
(966.8) |
|
$ |
(2,270.3) |
|
$ |
(1,141.6) |
|
Net cash provided by financing activities |
|
$ |
35.6 |
|
$ |
1,411.3 |
|
$ |
291.7 |
Net Cash Flows Provided By Operating Activities
Net cash flows provided by operating activities increased by $61.3 million to $971.1 million from $909.8 million during the years ended June 30, 2018 and 2017, respectively.
Net cash flows provided by operating activities during the year ended June 30, 2018 include the net income of $101.9 million, plus the add backs of non-cash items deducted in the determination of net income, principally depreciation and amortization of $747.4 million, stock-based compensation expense of $96.7 million and the deferred income taxes of $25.0 million, partially offset by foreign currency gain on intercompany loans of $5.4 million. Additions to deferred revenue of $212.8 million during the period were largely offset by amortization of deferred revenue of $137.8 million. Cash flow during the period was reduced by the net change in working capital components of $90.3 million.
Net cash flows from operating activities during the year ended June 30, 2017 include the net income of $85.7 million, plus the add backs of non-cash items deducted in the determination of net income, principally depreciation and amortization of $606.9 million, stock-based compensation expense of $114.1 million, foreign currency loss on intercompany loans of $10.3 million, loss on extinguishment of debt of $18.2 million, non-cash interest expense of $9.6 million, and the deferred tax expense of $12.6 million. Also contributing to the cash provided by operating activities were additions to deferred revenue of $200.5 million, less amortization of deferred revenue of $117.6 million. Cash flow during the period was reduced by the net change in working capital components of $35.4 million.
The increase in net cash flows from operating activities during the year ended June 30, 2018 as compared to the year ended June 30, 2017 is primarily a result of additional earnings from organic growth and synergies realized from our Fiscal 2018 and Fiscal 2017 acquisitions.
Net cash flows from operating activities increased by $195.8 million to $909.8 million from $714.0 million during the years ended June 30, 2017 and 2016, respectively.
58
Net cash flows from operating activities during the year ended June 30, 2016 include the net loss of $76.2 million, plus the add backs of non-cash items deducted in the determination of net loss, principally depreciation and amortization of $516.3 million, stock-based compensation expense of $155.9 million, foreign currency loss on intercompany loans of $53.8 million and non-cash interest expense of $11.9 million, partially offset by the deferred tax benefit of $2.8 million. Also contributing to the cash provided by operating activities were additions to deferred revenue of $184.0 million, less amortization of deferred revenue of $111.5 million. Cash flow during the period was reduced by the net change in working capital components of $48.4 million.
The increase in net cash flows from operating activities during the year ended June 30, 2017 as compared to the year ended June 30, 2016 is primarily a result of additional earnings from organic growth and synergies realized from our Fiscal 2016 and Fiscal 2017 acquisitions.
Cash Flows Used In Investing Activities
We used cash in investing activities of $966.8 million, $2,270.3 million and $1,141.6 million during the years ended June 30, 2018, 2017 and 2016, respectively.
During the year ended June 30, 2018, our principal uses of cash for investing activities were $789.9 million in additions to property and equipment and $176.9 million in net cash paid for acquisitions.
During the year ended June 30, 2017, our principal uses of cash for investing activities were $835.5 million in additions to property and equipment and $1,434.8 million in net cash paid for acquisitions, largely driven by our acquisition of Electric Lightwave.
During the year ended June 30, 2016, our principal uses of cash for investing activities were $704.1 million in additions to property and equipment and $437.5 million in net cash paid for acquisitions.
Cash Flows Provided By Financing Activities
Our net cash provided by financing activities was $35.6 million, $1,411.3 million and $291.7 million during the years ended June 30, 2018, 2017 and 2016, respectively.
Our cash flows provided by financing activities during the year ended June 30, 2018 are primarily comprised of $462.8 million in debt proceeds, net of discounts, related to the issuance of $300 million incremental 5.75% Senior Unsecured Note due 2027 and an additional $150 million tranche of the Company’s existing term loan. These proceeds were partially offset by $310.7 million for the partial pre-payment of the Company’s term loan, $93.5 million cash paid for stock repurchases, $8.4 million in principal payments on capital lease obligations, $5.3 million related to payments for the Santa Clara acquisition financing arrangement and other, $5.0 million of scheduled principal payments on our term loan, and $4.3 million in payment of debt issuance costs.
Our cash flows provided by financing activities during the year ended June 30, 2017 are primarily comprised of $3,865.8 million in debt proceeds from the refinancing of our term loan and our $650 million Electric Lightwave Incremental Term Loan, net of discounts and our aggregate $1,350.0 million issuances of 2027 Unsecured Notes, net of premiums, partially offset by $2,408.8 million of principal payments and early pre-payment on long-term debt, $6.6 million in principal payments on capital lease obligations, and $35.4 million in payment of debt issuance costs.
Our cash flows provided by financing activities during the year ended June 30, 2016 are primarily comprised of $929.3 million in aggregate proceeds from our $400 million Incremental Amendment to our term loan facility and $550 million issuance of additional 2025 Unsecured Notes, net of discounts. These were partially offset by $81.1 million in common stock repurchases, $535.0 million of principal payments on long-term debt, $4.9 million in principal payments on capital lease obligations, and $4.2 million in payment of debt issuance costs.
Contractual Cash Obligations
The following table represents a summary of our estimated future payments under contractual cash obligations as of June 30, 2018 for continuing operations. Changes in our business needs, cancellation provisions, changing interest
59
rates and other factors may result in actual payments differing from these estimates. We cannot provide certainty regarding the timing and amounts of these future payments.
|
|
|
Total |
|
Less Than 1 Year |
|
1-3 Years |
|
3-5 Years |
|
More Than 5 Years |
|||||
|
|
|
(in millions) |
|||||||||||||
|
Long-term debt (principal and interest) |
|
$ |
7,783.9 |
|
$ |
319.8 |
|
$ |
1,106.9 |
|
$ |
2,017.9 |
|
$ |
4,339.3 |
|
Operating leases |
|
|
434.1 |
|
|
93.7 |
|
|
149.1 |
|
|
76.6 |
|
|
114.7 |
|
Obligations for capital expenditures |
|
|
509.4 |
|
|
509.4 |
|
|
— |
|
|
— |
|
|
— |
|
Other purchase obligations |
|
|
290.8 |
|
|
173.5 |
|
|
52.5 |
|
|
19.1 |
|
|
45.7 |
|
Capital leases (principal and interest) |
|
|
204.0 |
|
|
15.4 |
|
|
29.0 |
|
|
29.3 |
|
|
130.3 |
|
Total |
|
$ |
9,222.2 |
|
$ |
1,111.8 |
|
$ |
1,337.5 |
|
$ |
2,142.9 |
|
$ |
4,630.0 |
Our operating leases and obligations for capital expenditures include expected payments for our operating facilities, network costs and capacity, structural components, communications equipment, and maintenance obligations. Our obligations for capital expenditures are primarily success-based, meaning that before we commit resources to expand our network, we have a signed customer contract that will provide us with an attractive return on the required capital. The contractual long-term debt payments, above, include an estimate of future interest expense based on the interest rates in effect on our floating rate debt obligations as of the most recent balance sheet date.
Cash payments for interest, net of capitalized interest, which are reflected in our cash flows from operating activities, during the year ended June 30, 2018 were $280.2 million and represents 29% of our cash flows from operating activities. We also made cash payments related to principal payments on our long-term debt and capital lease obligations of $13.4 million (exclusive of payments of $310.7 million related to our July 2017 term loan partial repayment), which are reflected in our cash flows from financing activities, and represented 1.4% of our cash flows from operating activities during the period.
Off-Balance Sheet Arrangements
We do not have any special purpose or limited purpose entities that provide off-balance sheet financing, liquidity, or market or credit risk support and we do not engage in leasing, hedging, or other similar activities that expose us to any significant liabilities that are not (i) reflected on the face of the condensed consolidated financial statements, (ii) disclosed in Note 14-Commitments and Contingencies to the condensed consolidated financial statements, or in the Future Contractual Obligations table included above.
Recently Issued Accounting Pronouncements
In February 2018, the Financial Accounting Standards Board (FASB) issued Accounting Standards Update (“ASU”), Income Statement—Reporting Comprehensive Income (Topic 220): Reclassification of Certain Tax Effects from Accumulated Other Comprehensive Income (ASU 2018-02), which allows companies to reclassify the income tax effects resulting from tax bill, H.R.1, from accumulated other comprehensive income to retained earnings. The standard also requires certain new disclosures regardless of the election. The standard is effective for fiscal years, and interim periods within those fiscal years, beginning after December 15, 2018 (fiscal year ending June 30, 2020 “Fiscal 2020” for us), with early adoption permitted. We do not expect ASU 2018-02 to have a material impact on our consolidated financial statements.
In March 2017, the FASB issued ASU 2017-07, Compensation – Retirement Benefits (Topic 715): Improving the Presentation of Net Periodic Pension Cost and Net Periodic Postretirement Benefit Cost. This ASU requires an employer to report the service cost component of net periodic pension cost and net periodic postretirement cost in the same line item in the statement of operations as other compensation costs arising from services rendered by the related employees during the period. The other net cost components are required to be presented in the statement of operations separately from the service cost component and outside a subtotal of income from operations. Additionally, the line item used in the statement of operations to present the other net cost components must be disclosed in the notes to the financial statements. This ASU is effective for fiscal years beginning after December 15, 2017 (Fiscal 2019 for us), and interim periods within those fiscal years, and must be applied on a retrospective basis. We do not expect ASU 2017-07 to have a material impact on its consolidated financial statements.
60
In August 2016, the FASB issued ASU 2016-15, Statement of Cash Flows (Topic 230): Classifications of Certain Cash Receipts and Cash Payments. The new standard provides guidance for eight changes with respect to how cash receipts and cash payments are classified in the statement of cash flows, with the objective of reducing diversity in practice. The standard is effective for fiscal years, and interim periods within those fiscal years, beginning after December 31, 2017 (Fiscal 2019 for us), with early adoption permitted. We do not plan to early adopt, nor do we expect the adoption of this new standard to have a material impact on our consolidated financial statements.
On March 30, 2016, the FASB issued ASU 2016-09, Improvements to Employee Share-Based Payment Accounting, which is intended to improve the accounting for share-based payment transactions as part of the FASB’s simplification initiative. The ASU changes five aspects of the accounting for share-based payment award transactions that will affect public companies, including: (1) accounting for income taxes; (2) classification of excess tax benefits on the statement of cash flows; (3) forfeitures; (4) minimum statutory tax withholding requirements; and (5) classification of employee taxes paid on the statement of cash flows when an employer withholds shares for tax-withholding purposes. We early-adopted ASU 2016-09 effective July 1, 2016. Excess tax benefits for share-based payments are now recognized against income tax expense rather than additional paid-in capital and are included in operating cash flows rather than financing cash flows. The recognition of excess tax benefits has been applied prospectively and prior periods have not been adjusted. We had $15.6 million of excess tax benefits for the year ended June 30, 2017. In addition, we elected to change our accounting policy to account for forfeitures as they occur. The change was applied on a modified retrospective basis with a cumulative effect adjustment to accumulated deficit of $1.7 million as of July 1, 2016. Amendments related to minimum statutory tax withholding requirements and the classification of employee taxes paid on the statement of cash flows when an employer withholds shares for tax-withholding purposes have been adopted prospectively and did not have a material impact on the consolidated financial statements.
In February 2016, the FASB issued ASU 2016-02, Leases. The new guidance supersedes existing guidance on accounting for leases in Topic 840 and is intended to increase the transparency and comparability of accounting for lease transactions. ASU 2016-02 requires most leases to be recognized on the balance sheet. Lessees will need to recognize a right-of-use asset and a lease liability for virtually all leases. The liability will be equal to the present value of lease payments. The asset will be based on the liability, subject to adjustment, such as for initial direct costs. For income statement purposes, the FASB retained a dual model, requiring leases to be classified as either operating or finance. Lessor accounting remains similar to the current model, but updated to align with certain changes to the lessee model and the new revenue recognition standard (ASU 2014-09). The ASU will require both quantitative and qualitative disclosures regarding key information about leasing arrangements. The standard is effective for fiscal years, and interim periods within those fiscal years, beginning after December 15, 2018 (Fiscal 2020 for us). Early adoption is permitted. The standard must be adopted using a modified retrospective transition, and provides for certain practical expedients. Transition will require application of the new guidance at the beginning of the earliest comparative period presented. We established a project team and commenced an initial impact assessment process. To date, we have reviewed a sample of lessee and lessor arrangements and made preliminary assessments of the impact this standard will have on our consolidated financial statements. Although we are still assessing the impact of this standard, we expect the new guidance to significantly increase the reported assets and liabilities on our consolidated balance sheets. There are currently no plans to early adopt ASU 2016-02.
In May 2014, the FASB issued ASU 2014-09, Revenue from Contracts with Customers (“ASC 606”), which replaces numerous requirements in U.S. GAAP, including industry-specific requirements, and provides companies with a single revenue recognition model for recognizing revenue from certain contracts with customers. The core principle of the new standard is that a company should recognize revenue to depict the transfer of promised goods or services to customers in an amount that reflects the consideration to which the company expects to be entitled in exchange for those goods or services. In addition, the standard requires disclosure of the nature, amount, timing, and uncertainty of revenue and cash flows arising from contracts with customers and addressed accounting for costs to acquire and fulfill contracts. The standard will not impact the manner in which we account for revenue arrangements accounted for as leases. The standard will not impact the manner in which we account for revenue arrangements accounted for as leases. Effective July 1, 2018, we adopted the requirements of ASC 606 and will use the full retrospective transition method. The full retrospective transition method required us to restate each prior reporting period presented. We are the process of implementing internal controls and system functionality to enable the preparation of financial information post adoption.
The adoption of ASC 606 will have an impact on the manner in which we recognize revenue associated with dark fiber sales that include the transfer of title to certain network assets, which prior to ASC 606 have been considered a sale
61
of real estate or integral equipment. Until June 30, 2018, we have deferred the recognition of revenue on the sale of network infrastructure assets that were considered to be integral equipment if we has a substantial continuing involvement in the transferred asset. The consideration received in this type of arrangement has historically been amortized to revenue ratably over the period in which we have a substantial continuing involvement in the transferred asset. Under ASC 606 the asset transferred in this type of arrangement will be derecognized from the balance sheet and the amount of the transaction price attributable to the asset being sold will be recognized upon customer acceptance. This change will have an estimated impact of (decreasing)/ increasing the revenue as reported by us during the years ended June 30, 2018 and 2017 by ($1.5) million and $20.5 million, respectively. The retrospective adoption of ASC 606 will also result in increasing the previously reported operating costs during the year ended June 30, 2017 by $18.8 million, which represents the net book value of assets transferred to customers in these types of arrangements during Fiscal 2017.
The assets transferred in these real estate sales have historically been included in the caption “property and equipment, net” on our balance sheet. Upon the adoption of ASC 606, the net book value of these assets of $19.6 million will be removed from our condensed consolidated balance sheet. We will also derecognize from our June 30, 2018 balance sheet $1.5 million and $20.5 million in related deferred revenue, current and non-current, respectively, which represented the unamortized consideration received on these arrangements.
An additional impact from the adoption of ASC 606 will be the accounting for the incremental costs of acquiring new service contracts including certain compensation expense with internal sales representatives. Under ASC 606, we will capitalize these incremental costs of obtaining customer contracts and amortize the expense over the relevant contract term. In addition, we will assess our deferred contract cost asset for impairment on a periodic basis. Prior to the adoption of ASC 606, compensation paid to internal sales representatives for obtaining new service contracts has been expensed as incurred. We expect the impact of the retrospective adoption of ASC 606 will result in increasing the selling, general and administrative expenses as reported during the years ended June 30, 2018 and 2017 by $1.1 million and $0.2 million, respectively. Additionally, we expect an increase to the as reported caption titled “Other current assets” and “Other assets” on the consolidated balance sheet as of June 30, 2018 of $7.1 million and $5.7 million, respectively, to reflect the deferred cost of acquiring service contracts that will be recognized in future periods over the relevant contract term.
62
The table below presents the expected impact the full retrospective adoption of ASC 606 will have on our statement of operations for the years ended June 30, 2018 and 2017 and each of the quarters of Fiscal 2018:
|
|
|
Fiscal Year ended |
|
Quarter Ended (unaudited) |
||||||||||||||
|
|
|
June 30, |
|
June 30, |
|
September 30, |
|
December 31, |
|
March 31, |
|
June 30, |
||||||
|
Revenue |
|
$ |
(1.5) |
|
$ |
20.5 |
|
$ |
(0.4) |
|
$ |
(0.4) |
|
$ |
(0.4) |
|
$ |
(0.3) |
|
Operating costs |
|
|
— |
|
|
18.8 |
|
|
— |
|
|
— |
|
|
— |
|
|
— |
|
Selling, general and administrative expenses |
|
|
1.1 |
|
|
0.2 |
|
|
(0.2) |
|
|
0.6 |
|
|
(0.3) |
|
|
1.0 |
|
Depreciation and amortization |
|
|
(0.9) |
|
|
(0.7) |
|
|
(0.3) |
|
|
(0.3) |
|
|
(0.2) |
|
|
(0.1) |
|
Provision for income taxes |
|
|
(2.7) |
|
|
0.8 |
|
|
— |
|
|
(2.5) |
|
|
— |
|
|
(0.2) |
|
Net income |
|
|
1.0 |
|
|
1.4 |
|
|
0.1 |
|
|
1.8 |
|
|
0.1 |
|
|
(1.0) |
The table below presents the expected impact the full retrospective adoption of ASC 606 will have on our consolidated balance sheet for the year ended June 30, 2018:
|
|
|
As of June 30, 2018 |
|||||||
|
|
|
As Reported |
|
Effect of Adoption |
|
As Adjusted |
|||
|
Assets |
|
|
|
|
|
|
|
|
|
|
Other current assets |
|
$ |
22.6 |
|
$ |
7.1 |
|
$ |
29.7 |
|
Property and equipment, net |
|
$ |
5,447.2 |
|
$ |
(19.6) |
|
$ |
5,427.6 |
|
Other assets |
|
$ |
170.0 |
|
$ |
5.6 |
|
$ |
175.6 |
|
|
|
|
|
|
|
|
|
|
|
|
Liabilities |
|
|
|
|
|
|
|
|
|
|
Deferred revenue, current |
|
$ |
164.4 |
|
$ |
(1.5) |
|
$ |
162.9 |
|
Deferred revenue, non-current |
|
$ |
1,096.8 |
|
$ |
(20.5) |
|
$ |
1,076.3 |
|
Deferred income taxes, net |
|
$ |
143.2 |
|
$ |
3.9 |
|
$ |
147.1 |
|
|
|
|
|
|
|
|
|
|
|
|
Stockholders' equity |
|
|
|
|
|
|
|
|
|
|
Accumulated deficit |
|
$ |
(377.2) |
|
$ |
11.2 |
|
$ |
(366.0) |
Critical Accounting Policies and Estimates
This discussion and analysis of our financial condition and results of operations are based upon our consolidated financial statements, which have been prepared in accordance with GAAP. The preparation of these financial statements requires us to make estimates and judgments that affect the reported amounts of assets, liabilities, revenue, expenses and related disclosures. We base our estimates on historical results which form the basis for making judgments about the carrying values of assets and liabilities that are not readily apparent from other sources. We evaluate these estimates on an ongoing basis. Actual results may differ from these estimates under different assumptions or conditions.
We have accounting policies that involve estimates such as the allowance for doubtful accounts, revenue reserves, useful lives of long-lived assets, fair value of our restricted stock units issued as compensation, accruals for estimated tax and legal liabilities, accruals for exit activities associated with real estate leases, accruals for customer disputes and valuation allowance for deferred tax assets. We have identified the policies below, which require the most significant judgments and estimates to be made in the preparation of our consolidated financial statements, as critical to our business operations and an understanding of our results of operations.
Revenue
Revenue is recognized at the amount expected to be realized, which includes billing and performance adjustments. During each reporting period, we make estimates for potential future credits to be issued in respect of current revenue related to performance interruptions and customer disputes, which are recorded as a reduction in revenue. We analyze historical credit activity when evaluating our credit reserve requirements. We reserve for known performance interruptions as incurred. We review customer disputes and reserve for those we believe to be valid claims, which is recorded as a reduction of revenue. The determination of the customer dispute credit reserve involves significant judgment, estimations and assumptions.
63
We defer recognition of revenue until cash is collected on certain components of revenue, principally contract termination charges and late fees, as collectability is not reasonably assured until receipt of the cash based on our historical experience.
Stock-Based Compensation
We account for our stock-based compensation as either liability or equity awards based on the terms of the grant agreement. We account for forfeitures as they occur versus estimating forfeitures. We generally recognize stock-based awards to employees and independent directors based on their grant-date fair values, with no consideration for future forfeitures. We recognize the fair value of outstanding awards as a charge to operations over the vesting period.
In October 2014, our Board of Directors adopted the 2014 Performance Compensation Incentive Program (“PCIP”). The PCIP includes incentive cash compensation and equity (in the form of restricted stock units or “RSUs”). Grants of RSUs under the PCIP plan are made quarterly for all participants. The PCIP went into effect on October 16, 2014.
Under the Part B component of the PCIP, participants, who include members of our senior management team, are awarded quarterly grants of RSUs. The number of the RSUs earned by the participants is based on our stock price performance over a four fiscal quarter measurement period, and Part B RSUs cliff vest based upon continued employment at the end of the measurement period. The existence of a vesting provision that is associated with the performance of our stock price is a market condition, which affects the determination of the grant date fair value. Upon vesting, RSUs convert to shares of our common stock.
The grant date fair value of Part B awards issued during a given period are expensed over the performance period. The grant date fair value is estimated utilizing a Monte Carlo simulation, which uses randomly generated stock-price paths through a Geometric Brownian Motion stock price simulation. This simulation provides a stochastic projection of the ten-day average closing stock price ending on the vesting date (i.e., end of performance period), the total stock price performance over the performance period, and the number of common shares to be issued at the vesting date. Various assumptions are utilized in the valuation method, including the target stock price performance ranges and respective share payout percentages, our historical stock price performance and volatility, peer companies’ historical volatility and an appropriate risk-free rate. The aggregate future value of the grant under each simulation is calculated using the estimated per share value of the common stock at the end of the restriction period multiplied by the number of common shares projected to be granted at the vesting date. The present value of the aggregate grant is then calculated under each simulation resulting in a distribution of potential present values. The average of this present value distribution equals the fair value of the grant.
Property and Equipment
We record property and equipment acquired in connection with a business combination at their estimated fair values on the acquisition date. See “Critical Accounting Policies and Estimates: Acquisitions—Purchase Price Allocation.” Purchases of property and equipment are stated at cost, net of depreciation. Major improvements are capitalized, while expenditures for repairs and maintenance are expensed when incurred. Costs incurred prior to a capital project’s completion are reflected as construction-in-progress and are part of network infrastructure assets. Depreciation begins once the property and equipment is available and ready for use. Certain internal direct labor costs of constructing or installing property and equipment are capitalized. Capitalized direct labor reflects a portion of the salary and benefits of certain field engineers and other employees that are directly related to the construction and installation of network infrastructure assets. We have contracted with third party contractors for the construction and installation of the majority of our fiber network. Interest costs are capitalized for all assets that require a period of time to get them ready for their intended use. Depreciation and amortization is provided on a straight-line basis over the estimated useful lives of the assets, with the exception of leasehold improvements, which are amortized over the lesser of the estimated useful lives or the term of the lease.
We perform periodic internal reviews to estimate useful lives of our property and equipment. Due to rapid changes in technology and the competitive environment, selecting the estimated economic life of telecommunications property and equipment requires a significant amount of judgment. Our internal reviews primarily consider industry benchmarking but also consider input from our network personnel regarding actual usage, physical wear and tear, replacement history, and assumptions regarding the benefits and costs of implementing new technology that factor in the
64
need to meet our financial objectives. We completed a review in March 2018 and revised our estimated useful lives for fiber optic network assets, from its previous estimate of a range of fifteen years to twenty years to a revised estimate of thirty-three years, and revised our estimated useful lives for owned buildings from its historical estimate of thirty-nine years to a revised estimate of forty-five years. In determining the change in estimated useful lives, management, with input from its engineering team, utilized quantitative and qualitative analysis, including historical usage patterns and retirements, industry benchmarks and review of published data sources. The change in estimated useful lives of the fiber optic network assets and owned buildings was accounted for as a change in accounting estimate on a prospective basis effective March 1, 2018.
Estimated useful lives of our property and equipment in years are as follows:
|
|
|
|
Estimated |
|
|
|
|
(in years) |
|
Land |
|
|
N/A |
|
Buildings - leasehold and site improvements |
|
|
15 to 45 |
|
Furniture, fixtures and office equipment |
|
|
3 to 7 |
|
Computer hardware |
|
|
3 to 5 |
|
Software |
|
|
3 |
|
Machinery and equipment |
|
|
5 to 7 |
|
Fiber optic equipment |
|
|
8 |
|
Circuit switch equipment |
|
|
10 |
|
Packet switch equipment |
|
|
5 |
|
Fiber optic network |
|
|
33 |
|
Construction in progress |
|
|
N/A |
From time to time, we are required to replace or re-route existing fiber due to structural changes such as construction and highway expansions, which is defined as a “relocation.” In such instances, we fully depreciate the remaining carrying value of network infrastructure removed or rendered unusable, and capitalize the new fiber and associated construction costs of the relocation placed into service. To the extent that the relocation does not require the replacement of segments of our network, and only involves the act of moving our existing network infrastructure, as-is, to another location, the related costs are expensed as incurred.
We periodically evaluate the recoverability of our long-lived assets and evaluate such assets for impairment whenever events or circumstances indicate that the carrying amount of such assets may not be recoverable. Impairment is determined to exist if the estimated future undiscounted cash flows are less than the carrying value of such assets. We consider various factors to determine if an impairment test is necessary. The factors include: consideration of the overall economic climate, technological advances with respect to equipment, our strategy, and capital planning. Since our inception, no event has occurred nor has there been a change in the business environment that would trigger an impairment test for our property and equipment assets.
Income Taxes
We are required to estimate the amount of tax payable or refundable for the current year and the deferred tax assets and liabilities for the future tax consequences attributable to differences between the financial statement carrying amounts and income tax basis of assets and liabilities and the expected benefits of utilizing net operating loss and tax credit carryforwards, using enacted tax rates in effect for each taxing jurisdiction in which we operate for the year in which those temporary differences are expected to be recovered or settled. This process requires our management to make assessments regarding the timing and probability of the ultimate tax impact of such items.
65
Our deferred tax assets arise from a variety of sources, the most significant being tax losses that can be carried forward to be utilized against taxable income in future years, deferred revenue and expenses recognized in our statement of operations but disallowed in our tax return until the associated cash flow occurs.
We record a valuation allowance to reduce our deferred tax assets to the amount that is expected to be recognized. The amount of deferred tax assets recorded on our consolidated balance sheets is influenced by management’s assessment of our future taxable income with regard to relevant business plan forecasts, the reversal of deferred tax balances, and reasonable tax planning strategies. At each balance sheet date, existing assessments are reviewed and, if necessary, revised to reflect changed circumstances. In a situation where recent losses have been incurred, the relevant accounting standards require us to weigh the objective evidence of the recent losses more heavily than subject evidence of projected taxable income. It is reasonably possible that the Company may reverse the valuation allowance recorded on certain foreign subsidiaries’ deferred tax assets in the near future.
In connection with several of our acquisitions, we have acquired significant U.S. net operating loss carry forwards (“NOLs”). The Tax Reform Act of 1986 contains provisions that limit the utilization of NOLs if there has been an “ownership change” as described in Section 382 of the Code.
Upon acquiring a company that has NOLs, we prepare an assessment to determine if we have a legal right to use the acquired NOLs. In performing this assessment we follow the regulations within the Code Section 382: Net Operating Loss Carryovers Following Changes in Ownership. Any disallowed NOLs acquired are written off in purchase accounting.
A valuation allowance is required for deferred tax assets if, based on available evidence, it is more-likely-than-not that all or some portion of the asset will not be realized due to the inability to generate sufficient taxable income in the period and/or of the character necessary to utilize the benefit of the deferred tax asset. When evaluating whether it is more-likely-than-not that all or some portion of the deferred tax asset will not be realized, all available evidence, both positive and negative, that may affect the realizability of deferred tax assets is identified and considered in determining the appropriate amount of the valuation allowance. We continue to monitor our financial performance and other evidence each quarter to determine the appropriateness of our valuation allowance. If we are unable to meet our taxable income forecasts in future periods we may change our conclusion about the appropriateness of the valuation allowance, which could create a substantial income tax expense in our consolidated statement of operations in the period such change occurs.
As of June 30, 2018, we had a cumulative U.S. federal NOL carry forward balance of $1,917.2 million. During the year ending June 30, 2018, the Company generated approximately $245.5 million of NOL’s mostly due to accelerated tax depreciation as provided by U.S. Tax Reform. Our NOL carry forwards, if not utilized to reduce taxable income in future periods, will expire in various amounts beginning in 2019 and ending in 2037. As a result of Internal Revenue Service regulations, we are currently limited to utilizing a maximum of $1,356.2 million of acquired NOL carry forwards during Fiscal 2018. However, to the extent that we do not utilize $1,356.2 million of our acquired NOL carry forwards during a fiscal year, the difference between the $1,356.2 million maximum usage and the actual NOLs usage is carried over to the next calendar year. Of our $1,917.2 million NOL carry forwards balance, $1,482.5 million of these NOL carry forwards were acquired.
As of June 30, 2018, we had approximately $384.3 million of foreign jurisdiction net operating loss carry forwards, primarily in Canada, the United Kingdom and France. The majority of these foreign NOLs have a valuation allowance reducing the value of the corresponding deferred tax asset in the financial statements due to recent losses.
As of June 30, 2018, we had tax-effected state net operating loss carry forwards of approximately $53.9 million, which are subject to limitations on their utilization and have various expiration dates 2019 through 2037. The Company believes that only $51.6 million of this balance will be utilized.
Goodwill and Purchased Intangibles
Intangible assets arising from business combinations, such as acquired customer contracts and relationships (collectively “customer relationships”), are initially recorded at fair value. We amortize customer relationships primarily over an estimated life of ten to twenty years using the straight-line method, as this method approximates the timing in
66
which we expect to receive the benefit from the acquired customer relationship assets. Goodwill represents the excess of the purchase price over the fair value of the net identifiable assets acquired in a business combination.
We review goodwill and indefinite-lived intangible assets for impairment at least annually in April or whenever facts and circumstances indicate that their carrying amounts may not be recoverable.
Our goodwill impairment assessment begins with a qualitative assessment to determine whether it is more likely than not that the fair value of a reporting unit is less than its carrying value. The qualitative assessment includes consideration of the overall financial performance of the reporting units, macroeconomic conditions, industry and market considerations, cost factors, and other relevant entity- and reporting unit-specific events. The selection and assessment of qualitative factors used to determine whether it is more likely than not that the fair value of a reporting unit exceeds the carrying value involves significant judgments and estimates. If it is determined under the qualitative assessment that it is more likely than not that the fair value of a reporting unit is less than its carrying value, then we would recognize an impairment charge for the amount by which the reporting unit’s carrying amount exceeds that fair value, up to but not exceeding the reporting unit’s goodwill.
Our impairment assessment for indefinite-lived intangible assets involves comparing the estimated fair value of indefinite-lived intangible assets to their respective carrying values. To the extent the carrying value of indefinite-lived intangible assets exceeds the fair value, we will recognize an impairment loss for the difference.
Intangible assets with finite useful lives are amortized over their respective estimated useful lives and reviewed for impairment whenever events or changes in circumstances indicate that the carrying amount of the asset may not be recoverable. We recorded no impairment charges for goodwill or intangibles during the years ended June 30, 2018, 2017 and 2016.
Acquisitions – Purchase Price Allocation
The application of acquisition accounting requires that we make fair value determinations as of the applicable valuation date. In making these determinations, we are required to make estimates and assumptions that affect the recorded amounts, including, but not limited to, expected future cash flows, market comparables and discount rates, replacement costs of property and equipment and the amounts to be recovered in future periods from acquired deferred tax assets. To assist us in making these fair value determinations, we may engage third-party valuation specialists who generally assist us in the fair value determination of identifiable assets such as customer relationships, property and equipment and any other significant assets or liabilities. Our estimates in this area impact, among other items, the amount of depreciation and amortization and income tax expense or benefit that we report. Our estimates of fair value are based upon assumptions we believe to be reasonable, but which are inherently uncertain.
ITEM 7A. QUANTITATIVE AND QUALITATIVE DISCLOSURES ABOUT MARKET RISK
Our exposure to market risk consists of changes in interest rates from time to time and market risk arising from changes in foreign currency exchange rates that could impact our cash flows and earnings.
As of June 30, 2018, we had outstanding $1,430.0 million of 2023 Unsecured Notes, $900.0 million of 2025 Unsecured Notes, $1,650.0 million of 2027 Unsecured Notes, a balance of $493.8 million on our Term Loan Facility due 2021, a balance of $1,269.3 million on our Term Loan Facility due 2024, and $133.5 million of capital lease obligations. As of June 30, 2018, we had $441.9 million available for borrowing under our Revolver, subject to certain conditions.
Based on current market interest rates for debt of similar terms and average maturities and based on recent transactions, we estimate the fair value of our Notes to be $3,986.5 million as of June 30, 2018. Our 2023 Unsecured Notes, 2025 Unsecured Notes, and 2027 Unsecured Notes accrue interest at fixed rates of 6.00%, 6.375%, and 5.75% respectively.
Both our Revolver and our Term Loan Facility accrue interest at floating rates subject to certain conditions. The Company’s Term Loan Facility accrues interest at variable rates based upon the one month, three month or nine month LIBOR plus i) a spread of 2.0% on the Company’s $500.0 million tranche (which has a LIBOR floor of 0.0%) and ii) a spread of 2.25% on its B-2 Term Loan tranche (which has a LIBOR floor of 1.00%). Our Revolver accrues interest at variable rates based upon LIBOR plus a spread of 1.00% to 1.75% depending on our leverage ratio. As of June 30, 2018, the weighted average interest rates (including margin) on the Term Loan Facility and our Revolver were approximately
67
4.3% and 3.8%, respectively. A hypothetical increase in the applicable interest rate on our Term Loan Facility of one percentage point would increase our annualized interest expense on the Term Loan Facility by approximately 24% or $17.5 million, based on the applicable interest rate as of June 30, 2018. Historically, this impact was limited as a result of the applicable interest rate being below the minimum 1.0% LIBOR floor on our Term Loan Facility tranche that matures on January 19, 2024.
In August 2012, we entered into interest rate swap agreements with an aggregate notional value of $750.0 million and a maturity date of June 30, 2017. The contracts state that we pay a 1.67% fixed rate of interest for the term of the agreements, beginning June 30, 2013. The counterparties pay to us the greater of actual LIBOR or 1.25%. We entered into the swap arrangements to reduce the risk of increased interest costs associated with potential future increases in LIBOR rates. As of June 30, 2017, the interest rate swap agreements have expired and were not replaced.
We are exposed to the risk of changes in interest rates if it is necessary to seek additional funding to support the expansion of our business and to support acquisitions. The interest rate that we may be able to obtain on future debt financings will be dependent on market conditions.
We have exposure to market risk arising from foreign currency exchange rates. During the year ended June 30, 2018, our foreign activities accounted for approximately 23% of our consolidated revenue. We monitor foreign markets and our commitments in such markets to assess currency and other risks. A one percent change in foreign exchange rates would change consolidated revenue by approximately $5.9 million for the year ended June 30, 2018. To date, we have not entered into any hedging arrangement designed to limit exposure to foreign currencies. To the extent our level of foreign activities is expected to increase, through further acquisition and/or organic growth, we may determine that such hedging arrangements would be appropriate and will consider such arrangements to minimize our exposure to foreign exchange risk.
We do not have any material commodity price risk.
ITEM 8. FINANCIAL STATEMENTS AND SUPPLEMENTARY DATA
Reference is made to the information set forth beginning on page F-1.
ITEM 9. CHANGES IN AND DISAGREEMENTS WITH ACCOUNTANTS ON ACCOUNTING AND FINANCIAL DISCLOSURE
None.
ITEM 9A. CONTROLS AND PROCEDURES
Disclosure Controls and Procedures
We carried out an evaluation as of the last day of the period covered by this Annual Report on Form 10-K, under the supervision and with the participation of our management, including our Chief Executive Officer and Chief Financial Officer, of the effectiveness of the design and operation of our disclosure controls and procedures as defined in Rules 13a-15 of the Securities Exchange Act of 1934 (the “Exchange Act”). Disclosure controls and procedures include, without limitation, controls and procedures designed to ensure that information required to be disclosed by us in reports filed or submitted under the Exchange Act is recorded, processed and reported within the time periods specified by the Securities and Exchange Commission’s rules and forms. Such controls include those designed to ensure that information is accumulated and communicated to our management, including our Chief Executive Officer and Chief Financial Officer, as appropriate to allow timely decisions regarding required disclosure. Based on that evaluation, our Chief Executive Officer and Chief Financial Officer concluded that, as of June 30, 2018, our disclosure controls and procedures were effective.
Management’s Annual Report on Internal Control Over Financial Reporting
Our management is responsible for establishing and maintaining adequate internal control over financial reporting, as such term is defined in Exchange Act Rules 13a-15(f). Our internal control over financial reporting is a process
68
designed by management, under the supervision of our Chief Executive Officer and Chief Financial Officer and effected by our board of directors, management and other personnel, to provide reasonable assurance regarding the reliability of financial reporting and the preparation of financial statements for external purposes in accordance with accounting principles generally accepted in the United States of America. Because of its inherent limitations, internal control over financial reporting may not prevent or detect misstatements. Projections of any evaluation of effectiveness to future periods are subject to the risk that controls may become inadequate because of changes in conditions, or that the degree of compliance with the policies or procedures may deteriorate.
Our management, led by our Chief Executive Officer and Chief Financial Officer, assessed the effectiveness of internal control over financial reporting as of June 30, 2018, using the criteria set forth in Internal Control- Integrated Framework (2013) issued by the Committee of Sponsoring Organizations of the Treadway Commission (COSO 2013 Framework). Based on that evaluation, management concluded that the Company’s internal control over financial reporting was effective as of June 30, 2018.
KPMG LLP, the Company’s independent registered public accounting firm, has audited the Company’s internal control over financial reporting, as stated in their report, which is included herein.
Changes in Internal Controls over Financial Reporting
Management has evaluated, with the participation of our Chief Executive Officer and Chief Financial Officer, whether any changes in our internal control over financial reporting that occurred during our last fiscal year have materially affected, or are reasonably likely to materially affect, our internal control over financial reporting. Management continues to implement changes in the accounting and technology areas as a result of our Sarbanes Oxley compliance program. Such changes have included but are not limited to formalizing existing and establishing new internal controls, implementation of technology solutions, and hiring additional accounting and technology personnel.
Management implemented both a new enterprise resource planning system and a billing management system during the year ended June 30, 2018. The new systems are expected to enhance the overall system of internal control over financial reporting through further automation and integration of business processes and were not implemented in response to any identified deficiency or material weakness in the Company’s internal control over financial reporting. The implementations are significant in scale and complexity and significantly affect certain accounting functions. Both during the implementation of the two new systems, and afterwards, the Company modified certain of its internal controls to verify its controls were designed and operating effectively for all key financial reporting assertions.
Not applicable.
69
ITEM 10. DIRECTOR, EXECUTIVE OFFICERS AND CORPORATE GOVERNANCE
The information required by this Item 10 is incorporated by reference to the sections entitled “Proposal 1. Election of Directors,” “Corporate Governance,” “Executive Officers,” and “Section 16(a) Beneficial Ownership Reporting Compliance” in our definitive proxy statement for the 2018 Annual Meeting of Stockholders to be filed with the SEC.
ITEM 11. EXECUTIVE COMPENSATION
The information required by this Item 11 is incorporated by reference to the sections entitled “Compensation Discussion and Analysis” and “Compensation Committee Report” in our definitive proxy statement for the 2018 Annual Meeting of Stockholders to be filed with the SEC.
ITEM 12. SECURITY OWNERSHIP OF CERTAIN BENEFICIAL OWNERS AND MANAGEMENT AND RELATED STOCKHOLDER MATTERS
The information required by this Item 12 is incorporated by reference to the sections entitled “Security Ownership of Certain Beneficial Owners and Management” and “Equity Compensation Plan Information” in our definitive proxy statement for the 2018 Annual Meeting of Stockholders to be filed with the SEC.
ITEM 13. CERTAIN RELATIONSHIPS AND RELATED TRANSACTIONS AND DIRECTOR INDEPENDENCE
The information required by this Item 13 is incorporated by reference to the sections entitled “Certain Relationships and Related Party Transactions” and “Corporate Governance” in our definitive proxy statement for the 2018 Annual Meeting of Stockholders to be filed with the SEC.
ITEM 14. PRINCIPAL ACCOUNTING FEES AND SERVICES
The information required by this Item 14 is incorporated by reference to the section entitled “Proposal 2. Ratification of Appointment of Independent Registered Public Accounting Firm” in our definitive proxy statement for the 2018 Annual Meeting of Stockholders to be filed with the SEC.
70
ITEM 15. EXHIBITS AND FINANCIAL STATEMENT SCHEDULES
Documents Filed as Part of this Annual Report
1. Financial Statements
Schedules not indicated above have been omitted because of the absence of the condition under which they are required or because the information called for is shown in the consolidated financial statements or in the notes thereto.
2. Exhibits
The Exhibits required by this item are listed in the Exhibit Index. Each management contract and compensatory plan or arrangement is denoted with a “+” in the Exhibit Index.
Financial statements and financial statement schedules required to be filed for the registrant under Items 8 or 15 are set forth following the index page at page F-1. Exhibits filed as a part of this report are listed below. Exhibits incorporated by reference are indicated in parentheses.
71
|
Exhibit No. |
|
Description of Exhibit |
|
2.1** |
|
|
|
|
|
|
|
3.1** |
|
|
|
|
|
|
|
3.2** |
|
|
|
|
|
|
|
4.1** |
|
|
|
|
|
|
|
4.2** |
|
|
|
|
|
|
|
4.3** |
||
|
|
|
|
|
10.3**
|
|
|
|
|
|
|
|
10.4** |
|
|
|
|
|
|
|
10.5** |
|
|
|
|
|
|
|
10.6** |
|
|
|
|
|
|
|
10.7** |
|
72
|
10.8** |
|
|
|
|
|
|
|
10.9** |
|
|
|
|
|
|
|
10.10**+ |
|
|
|
|
|
|
|
10.11**+ |
|
|
|
|
|
|
|
10.12**+ |
|
|
|
|
|
|
|
10.13**+ |
|
|
|
|
|
|
|
10.14**+ |
|
|
|
|
|
|
|
10.15**+ |
|
|
|
|
|
|
|
10.16**+ |
|
|
|
10.17**+ |
|
|
|
|
|
|
|
10.18**+ |
|
|
|
|
|
|
|
21.1* |
|
|
|
|
|
|
|
23.1* |
|
|
|
|
|
|
|
31.1* |
|
|
|
|
|
|
|
31.2* |
||
|
|
|
|
|
32* |
|
|
|
|
|
|
|
101.INS* |
|
XBRL Instance Document |
|
|
|
|
|
101.SCH* |
|
XBRL Schema Document |
|
|
|
|
|
101.CAL* |
|
XBRL Calculation Linkbase Document |
|
|
|
|
73
|
101.DEF* |
|
XBRL Taxonomy Extension Definition Linkbase Document |
|
|
|
|
|
101.LAB* |
|
XBRL Label Linkbase Document |
|
|
|
|
|
101.PRE* |
|
XBRL Presentation Linkbase Document |
|
|
|
|
|
|
|
|
|
|
|
|
|
|
|
|
*Filed or furnished herewith
**Incorporated herein by reference
+Management contract and/or compensatory plan or arrangement
74
Pursuant to the requirements of Section 13 or 15(d) of the Securities Exchange Act of 1934, the registrant has duly caused this report to be signed on its behalf by the undersigned, thereunto duly authorized, this 24th day of August, 2018.
|
ZAYO GROUP HOLDINGS, INC. |
|
||
|
|
|
|
|
|
By: |
|
/s/ Matt Steinfort |
|
|
|
|
Matt Steinfort |
|
|
|
|
Chief Financial Officer |
|
Pursuant to the requirements of the Securities Exchange Act of 1934, this report has been signed below by the following persons on behalf of the registrant and in the capacities and on the dates indicated.
|
Signature |
|
Title |
|
Date |
|
|
|
|
|
|
|
/s/ Dan Caruso |
|
Chief Executive Officer, Director |
|
August 24, 2018 |
|
Dan Caruso |
|
(principal executive officer) |
|
|
|
|
|
|
|
|
|
/s/ Matt Steinfort |
|
Chief Financial Officer |
|
August 24, 2018 |
|
Matt Steinfort |
|
(principal financial and accounting officer) |
|
|
|
|
|
|
|
|
|
/s/ Philip Canfield |
|
Director |
|
August 24, 2018 |
|
Philip Canfield |
|
|
|
|
|
|
|
|
|
|
|
/s/ Rick Connor |
|
Director |
|
August 24, 2018 |
|
Rick Connor |
|
|
|
|
|
|
|
|
|
|
|
/s/ Don Gips |
|
Director |
|
August 24, 2018 |
|
Don Gips |
|
|
|
|
|
|
|
|
|
|
|
/s/ Steven Kaplan |
|
Director |
|
August 24, 2018 |
|
Steven Kaplan |
|
|
|
|
|
|
|
|
|
|
|
/s/ Cathy Morris |
|
Director |
|
August 24, 2018 |
|
Cathy Morris |
|
|
|
|
|
|
|
|
|
|
|
/s/ Nina Richardson |
Director |
August 24, 2018 |
||
|
Nina Richardson |
|
|
|
|
|
|
|
|
|
|
|
/s/ Linda Rottenberg |
|
Director |
|
August 24, 2018 |
|
Linda Rottenberg |
|
|
|
|
|
|
|
|
|
|
|
/s/ Emily White |
|
Director |
|
August 24, 2018 |
|
Emily White |
|
|
|
|
75
Report of Independent Registered Public Accounting Firm
To the Stockholders and Board of Directors
Zayo Group Holdings, Inc.:
Opinion on the Consolidated Financial Statements
We have audited the accompanying consolidated balance sheets of Zayo Group Holdings, Inc. and subsidiaries (the Company) as of June 30, 2018 and 2017, the related consolidated statements of operations, comprehensive income/(loss), stockholders’ equity, and cash flows for each of the years in the three‑year period ended June 30, 2018, and the related notes (collectively, the consolidated financial statements). In our opinion, the consolidated financial statements present fairly, in all material respects, the financial position of the Company as of June 30, 2018 and 2017, and the results of its operations and its cash flows for each of the years in the three‑year period ended June 30, 2018, in conformity with U.S. generally accepted accounting principles.
We also have audited, in accordance with the standards of the Public Company Accounting Oversight Board (United States) (PCAOB), the Company’s internal control over financial reporting as of June 30, 2018, based on criteria established in Internal Control – Integrated Framework (2013) issued by the Committee of Sponsoring Organizations of the Treadway Commission, and our report dated August 24, 2018 expressed an unqualified opinion on the effectiveness of the Company’s internal control over financial reporting.
Basis for Opinion
These consolidated financial statements are the responsibility of the Company’s management. Our responsibility is to express an opinion on these consolidated financial statements based on our audits. We are a public accounting firm registered with the PCAOB and are required to be independent with respect to the Company in accordance with the U.S. federal securities laws and the applicable rules and regulations of the Securities and Exchange Commission and the PCAOB.
We conducted our audits in accordance with the standards of the PCAOB. Those standards require that we plan and perform the audit to obtain reasonable assurance about whether the consolidated financial statements are free of material misstatement, whether due to error or fraud. Our audits included performing procedures to assess the risks of material misstatement of the consolidated financial statements, whether due to error or fraud, and performing procedures that respond to those risks. Such procedures included examining, on a test basis, evidence regarding the amounts and disclosures in the consolidated financial statements. Our audits also included evaluating the accounting principles used and significant estimates made by management, as well as evaluating the overall presentation of the consolidated financial statements. We believe that our audits provide a reasonable basis for our opinion.
We have served as the Company’s auditor since 2012.
/s/ KPMG LLP
Denver, Colorado
August 24, 2018
F-1
Report of Independent Registered Public Accounting Firm
To the Stockholders and Board of Directors
Zayo Group Holdings, Inc.:
Opinion on Internal Control Over Financial Reporting
We have audited Zayo Group Holdings, Inc. and subsidiaries’ (the Company) internal control over financial reporting as of June 30, 2018, based on criteria established in Internal Control – Integrated Framework (2013) issued by the Committee of Sponsoring Organizations of the Treadway Commission. In our opinion, the Company maintained, in all material respects, effective internal control over financial reporting as of June 30, 2018, based on criteria established in Internal Control – Integrated Framework (2013) issued by the Committee of Sponsoring Organizations of the Treadway Commission.
We also have audited, in accordance with the standards of the Public Company Accounting Oversight Board (United States) (PCAOB), the consolidated balance sheets of the Company as of June 30, 2018 and 2017, the related consolidated statements of operations, comprehensive income/(loss), stockholders’ equity, and cash flows for each of the years in the three-year period ended June 30, 2018, and the related notes (collectively, the consolidated financial statements), and our report dated August 24, 2018 expressed an unqualified opinion on those consolidated financial statements.
Basis for Opinion
The Company’s management is responsible for maintaining effective internal control over financial reporting and for its assessment of the effectiveness of internal control over financial reporting, included in the accompanying Management’s Annual Report on Internal Control Over Financial Reporting (Item 9A). Our responsibility is to express an opinion on the Company’s internal control over financial reporting based on our audit. We are a public accounting firm registered with the PCAOB and are required to be independent with respect to the Company in accordance with the U.S. federal securities laws and the applicable rules and regulations of the Securities and Exchange Commission and the PCAOB.
We conducted our audit in accordance with the standards of the PCAOB. Those standards require that we plan and perform the audit to obtain reasonable assurance about whether effective internal control over financial reporting was maintained in all material respects. Our audit of internal control over financial reporting included obtaining an understanding of internal control over financial reporting, assessing the risk that a material weakness exists, and testing and evaluating the design and operating effectiveness of internal control based on the assessed risk. Our audit also included performing such other procedures as we considered necessary in the circumstances. We believe that our audit provides a reasonable basis for our opinion.
Definition and Limitations of Internal Control Over Financial Reporting
A company’s internal control over financial reporting is a process designed to provide reasonable assurance regarding the reliability of financial reporting and the preparation of financial statements for external purposes in accordance with generally accepted accounting principles. A company’s internal control over financial reporting includes those policies and procedures that (1) pertain to the maintenance of records that, in reasonable detail, accurately and fairly reflect the transactions and dispositions of the assets of the company; (2) provide reasonable assurance that transactions are recorded as necessary to permit preparation of financial statements in accordance with generally accepted accounting principles, and that receipts and expenditures of the company are being made only in accordance with authorizations of management and directors of the company; and (3) provide reasonable assurance regarding prevention or timely detection of unauthorized acquisition, use, or disposition of the company’s assets that could have a material effect on the financial statements.
F-2
Because of its inherent limitations, internal control over financial reporting may not prevent or detect misstatements. Also, projections of any evaluation of effectiveness to future periods are subject to the risk that controls may become inadequate because of changes in conditions, or that the degree of compliance with the policies or procedures may deteriorate.
/s/ KPMG LLP
Denver, Colorado
August 24 2018
F-3
ZAYO GROUP HOLDINGS, INC. AND SUBSIDIARIES
(in millions, except share amounts)
|
|
|
June 30, |
|
June 30, |
||
|
|
|
2018 |
|
2017 |
||
|
Assets |
|
|
|
|
|
|
|
Current assets |
|
|
|
|
|
|
|
Cash and cash equivalents |
|
$ |
256.7 |
|
$ |
220.7 |
|
Trade receivables, net of allowance of $11.1 and $9.5 as of June 30, 2018 and June 30, 2017, respectively |
|
|
235.6 |
|
|
191.6 |
|
Prepaid expenses |
|
|
74.1 |
|
|
68.3 |
|
Other current assets |
|
|
22.6 |
|
|
34.0 |
|
Assets held for sale |
|
|
41.8 |
|
|
— |
|
Total current assets |
|
|
630.8 |
|
|
514.6 |
|
Property and equipment, net |
|
|
5,447.2 |
|
|
5,016.0 |
|
Intangible assets, net |
|
|
1,212.1 |
|
|
1,188.6 |
|
Goodwill |
|
|
1,719.1 |
|
|
1,840.2 |
|
Deferred income taxes, net |
|
|
37.6 |
|
|
38.3 |
|
Other assets |
|
|
170.0 |
|
|
141.7 |
|
Total assets |
|
$ |
9,216.8 |
|
$ |
8,739.4 |
|
Liabilities and stockholders' equity |
|
|
|
|
|
|
|
Current liabilities |
|
|
|
|
|
|
|
Accounts payable |
|
$ |
45.9 |
|
$ |
72.4 |
|
Accrued liabilities |
|
|
312.3 |
|
|
325.4 |
|
Accrued interest |
|
|
72.6 |
|
|
63.5 |
|
Current portion of long-term debt |
|
|
5.0 |
|
|
5.0 |
|
Capital lease obligations, current |
|
|
11.9 |
|
|
8.0 |
|
Deferred revenue, current |
|
|
164.4 |
|
|
146.0 |
|
Liabilities associated with assets held for sale |
|
|
6.1 |
|
|
— |
|
Total current liabilities |
|
|
618.2 |
|
|
620.3 |
|
Long-term debt, non-current |
|
|
5,690.1 |
|
|
5,532.7 |
|
Capital lease obligation, non-current |
|
|
121.6 |
|
|
93.6 |
|
Deferred revenue, non-current |
|
|
1,096.8 |
|
|
989.7 |
|
Deferred income taxes, net |
|
|
143.2 |
|
|
40.2 |
|
Other long-term liabilities |
|
|
57.8 |
|
|
52.4 |
|
Total liabilities |
|
|
7,727.7 |
|
|
7,328.9 |
|
Commitments and contingencies (Note 14) |
|
|
|
|
|
|
|
Stockholders' equity |
|
|
|
|
|
|
|
Preferred stock, $0.001 par value - 50,000,000 shares authorized; no shares issued and outstanding as of June 30, 2018 and June 30, 2017, respectively |
|
|
— |
|
|
— |
|
Common stock, $0.001 par value - 850,000,000 shares authorized; 246,631,241 and 246,471,551 shares issued and outstanding as of June 30, 2018 and June 30, 2017, respectively |
|
|
0.2 |
|
|
0.2 |
|
Additional paid-in capital |
|
|
1,881.6 |
|
|
1,884.0 |
|
Accumulated other comprehensive (loss)/income |
|
|
(15.5) |
|
|
5.4 |
|
Accumulated deficit |
|
|
(377.2) |
|
|
(479.1) |
|
Total stockholders' equity |
|
|
1,489.1 |
|
|
1,410.5 |
|
Total liabilities and stockholders' equity |
|
$ |
9,216.8 |
|
$ |
8,739.4 |
The accompanying notes are an integral part of these consolidated financial statements.
F-4
ZAYO GROUP HOLDINGS, INC. AND SUBSIDIARIES
CONSOLIDATED STATEMENTS OF OPERATIONS
(in millions, except per share data)
|
|
|
Year Ended June 30, |
|||||||
|
|
|
2018 |
|
2017 |
|
2016 |
|||
|
Revenue |
|
$ |
2,604.0 |
|
$ |
2,199.8 |
|
$ |
1,721.7 |
|
Operating costs and expenses |
|
|
|
|
|
|
|
|
|
|
Operating costs (excluding depreciation and amortization and including stock-based compensation—Note 11) |
|
|
941.9 |
|
|
782.9 |
|
|
578.7 |
|
Selling, general and administrative expenses (including stock-based compensation—Note 11) |
|
|
489.8 |
|
|
436.2 |
|
|
386.4 |
|
Depreciation and amortization |
|
|
747.4 |
|
|
606.9 |
|
|
516.3 |
|
Total operating costs and expenses |
|
|
2,179.1 |
|
|
1,826.0 |
|
|
1,481.4 |
|
Operating income |
|
|
424.9 |
|
|
373.8 |
|
|
240.3 |
|
Other expenses |
|
|
|
|
|
|
|
|
|
|
Interest expense |
|
|
(299.8) |
|
|
(241.5) |
|
|
(220.1) |
|
Loss on extinguishment of debt |
|
|
(4.9) |
|
|
(18.2) |
|
|
(33.8) |
|
Foreign currency gain/(loss) on intercompany loans |
|
|
5.4 |
|
|
(10.3) |
|
|
(53.8) |
|
Other income/(expense), net |
|
|
2.4 |
|
|
0.3 |
|
|
(0.3) |
|
Total other expenses, net |
|
|
(296.9) |
|
|
(269.7) |
|
|
(308.0) |
|
Income/(loss) from operations before income taxes |
|
|
128.0 |
|
|
104.1 |
|
|
(67.7) |
|
Provision for income taxes |
|
|
26.1 |
|
|
18.4 |
|
|
8.5 |
|
Net income/(loss) |
|
$ |
101.9 |
|
$ |
85.7 |
|
$ |
(76.2) |
|
Weighted-average shares used to compute net income/(loss) per share: |
|
|
|
|
|
|
|
|
|
|
Basic |
|
|
247.3 |
|
|
243.9 |
|
|
243.3 |
|
Diluted |
|
|
248.5 |
|
|
246.8 |
|
|
243.3 |
|
Net income/(loss) per share: |
|
|
|
|
|
|
|
|
|
|
Basic and diluted |
|
$ |
0.41 |
|
$ |
0.35 |
|
$ |
(0.31) |
The accompanying notes are an integral part of these consolidated financial statements.
F-5
ZAYO GROUP HOLDINGS, INC. AND SUBSIDIARIES
CONSOLIDATED STATEMENTS OF COMPREHENSIVE INCOME/(LOSS)
(in millions)
|
|
|
Year Ended June 30, |
|||||||
|
|
|
2018 |
|
2017 |
|
2016 |
|||
|
Net income/(loss) |
|
$ |
101.9 |
|
$ |
85.7 |
|
$ |
(76.2) |
|
Foreign currency translation adjustments, net of tax |
|
|
(7.4) |
|
|
2.1 |
|
|
12.4 |
|
Defined benefit pension plan adjustments, net of tax |
|
|
(13.5) |
|
|
(1.2) |
|
|
— |
|
Comprehensive income/(loss) |
|
$ |
81.0 |
|
$ |
86.6 |
|
$ |
(63.8) |
The accompanying notes are an integral part of these consolidated financial statements.
F-6
ZAYO GROUP HOLDINGS, INC. AND SUBSIDIARIES
CONSOLIDATED STATEMENTS OF STOCKHOLDERS’ EQUITY
(in millions, except share amounts)
|
|
|
Common |
|
Common |
|
Additional |
|
Accumulated |
|
Accumulated |
|
Total |
|||||
|
Balance at June 30, 2015 |
|
243,008,679 |
|
$ |
0.2 |
|
$ |
1,705.8 |
|
$ |
(7.9) |
|
$ |
(486.9) |
|
$ |
1,211.2 |
|
Stock-based compensation |
|
3,114,939 |
|
|
— |
|
|
152.9 |
|
|
— |
|
|
— |
|
|
152.9 |
|
Foreign currency translation adjustment |
|
— |
|
|
— |
|
|
— |
|
|
12.4 |
|
|
— |
|
|
12.4 |
|
Repurchase and retirement of common shares |
|
(3,474,120) |
|
|
— |
|
|
(81.1) |
|
|
— |
|
|
— |
|
|
(81.1) |
|
Net loss |
|
— |
|
|
— |
|
|
— |
|
|
— |
|
|
(76.2) |
|
|
(76.2) |
|
Balance at June 30, 2016 |
|
242,649,498 |
|
$ |
0.2 |
|
$ |
1,777.6 |
|
$ |
4.5 |
|
$ |
(563.1) |
|
$ |
1,219.2 |
|
Stock-based compensation |
|
3,822,053 |
|
|
— |
|
|
104.7 |
|
|
— |
|
|
— |
|
|
104.7 |
|
Cumulative effect adjustment resulting from adoption of ASU 2016-09 (Note 2) |
|
— |
|
|
— |
|
|
1.7 |
|
|
— |
|
|
(1.7) |
|
|
— |
|
Foreign currency translation adjustment |
|
— |
|
|
— |
|
|
— |
|
|
2.1 |
|
|
— |
|
|
2.1 |
|
Defined benefit pension plan adjustments |
|
— |
|
|
— |
|
|
— |
|
|
(1.2) |
|
|
— |
|
|
(1.2) |
|
Net income |
|
— |
|
|
— |
|
|
— |
|
|
— |
|
|
85.7 |
|
|
85.7 |
|
Balance at June 30, 2017 |
|
246,471,551 |
|
$ |
0.2 |
|
$ |
1,884.0 |
|
$ |
5.4 |
|
$ |
(479.1) |
|
$ |
1,410.5 |
|
Stock-based compensation |
|
2,908,769 |
|
|
— |
|
|
91.1 |
|
|
— |
|
|
— |
|
|
91.1 |
|
Foreign currency translation adjustment |
|
— |
|
|
— |
|
|
— |
|
|
(7.4) |
|
|
— |
|
|
(7.4) |
|
Repurchase and retirement of common shares |
|
(2,749,079) |
|
|
— |
|
|
(93.5) |
|
|
— |
|
|
— |
|
|
(93.5) |
|
Defined benefit pension plan adjustments |
|
— |
|
|
— |
|
|
— |
|
|
(13.5) |
|
|
— |
|
|
(13.5) |
|
Net income |
|
— |
|
|
— |
|
|
— |
|
|
— |
|
|
101.9 |
|
|
101.9 |
|
Balance at June 30, 2018 |
|
246,631,241 |
|
$ |
0.2 |
|
$ |
1,881.6 |
|
$ |
(15.5) |
|
$ |
(377.2) |
|
$ |
1,489.1 |
The accompanying notes are an integral part of these consolidated financial statements.
F-7
ZAYO GROUP HOLDINGS, INC. AND SUBSIDIARIES
CONSOLIDATED STATEMENTS OF CASH FLOWS
(in millions)
|
|
|
Year Ended June 30, |
|||||||
|
|
|
2018 |
|
2017 |
|
2016 |
|||
|
Cash flows from operating activities |
|
|
|
|
|
|
|
|
|
|
Net income/(loss) |
|
$ |
101.9 |
|
$ |
85.7 |
|
$ |
(76.2) |
|
Adjustments to reconcile net income/(loss) to net cash provided by operating activities |
|
|
|
|
|
|
|
|
|
|
Depreciation and amortization |
|
|
747.4 |
|
|
606.9 |
|
|
516.3 |
|
Loss on extinguishment of debt |
|
|
4.9 |
|
|
18.2 |
|
|
33.8 |
|
Non-cash interest expense |
|
|
9.8 |
|
|
9.6 |
|
|
11.9 |
|
Stock-based compensation |
|
|
96.7 |
|
|
114.1 |
|
|
155.9 |
|
Amortization of deferred revenue |
|
|
(137.8) |
|
|
(117.6) |
|
|
(111.5) |
|
Foreign currency (gain)/ loss on intercompany loans |
|
|
(5.4) |
|
|
10.3 |
|
|
53.8 |
|
Excess tax benefit from stock-based compensation |
|
|
— |
|
|
— |
|
|
(7.9) |
|
Deferred income taxes |
|
|
25.0 |
|
|
12.6 |
|
|
(2.8) |
|
Provision for bad debts |
|
|
5.1 |
|
|
3.7 |
|
|
3.9 |
|
Non-cash loss on investments |
|
|
1.0 |
|
|
1.2 |
|
|
1.2 |
|
Changes in operating assets and liabilities, net of acquisitions |
|
|
|
|
|
|
|
|
|
|
Trade receivables |
|
|
(48.1) |
|
|
(7.2) |
|
|
1.9 |
|
Accounts payable and accrued liabilities |
|
|
7.3 |
|
|
5.2 |
|
|
(36.0) |
|
Additions to deferred revenue |
|
|
212.8 |
|
|
200.5 |
|
|
184.0 |
|
Other assets and liabilities |
|
|
(49.5) |
|
|
(33.4) |
|
|
(14.3) |
|
Net cash provided by operating activities |
|
|
971.1 |
|
|
909.8 |
|
|
714.0 |
|
Cash flows from investing activities |
|
|
|
|
|
|
|
|
|
|
Purchases of property and equipment |
|
|
(789.9) |
|
|
(835.5) |
|
|
(704.1) |
|
Cash paid for acquisitions, net of cash acquired |
|
|
(176.9) |
|
|
(1,434.8) |
|
|
(437.5) |
|
Net cash used in investing activities |
|
|
(966.8) |
|
|
(2,270.3) |
|
|
(1,141.6) |
|
Cash flows from financing activities |
|
|
|
|
|
|
|
|
|
|
Proceeds from debt |
|
|
462.8 |
|
|
3,865.8 |
|
|
929.3 |
|
Principal payments on long-term debt |
|
|
(315.7) |
|
|
(2,408.8) |
|
|
(535.0) |
|
Payment of early redemption fees on debt extinguished |
|
|
— |
|
|
— |
|
|
(20.3) |
|
Principal payments on capital lease obligations |
|
|
(8.4) |
|
|
(6.6) |
|
|
(4.9) |
|
Payment of debt issue costs |
|
|
(4.3) |
|
|
(35.4) |
|
|
(4.2) |
|
Common stock repurchases |
|
|
(93.5) |
|
|
— |
|
|
(81.1) |
|
Excess tax benefit from stock-based compensation |
|
|
— |
|
|
— |
|
|
7.9 |
|
Cash paid for Santa Clara acquisition financing arrangement and other |
|
|
(5.3) |
|
|
(3.7) |
|
|
— |
|
Net cash provided by financing activities |
|
|
35.6 |
|
|
1,411.3 |
|
|
291.7 |
|
Net cash flows |
|
|
39.9 |
|
|
50.8 |
|
|
(135.9) |
|
Effect of changes in foreign exchange rates on cash |
|
|
(3.9) |
|
|
(0.8) |
|
|
(2.0) |
|
Net increase/(decrease) in cash and cash equivalents |
|
|
36.0 |
|
|
50.0 |
|
|
(137.9) |
|
Cash and cash equivalents, beginning of year |
|
|
220.7 |
|
|
170.7 |
|
|
308.6 |
|
Cash and cash equivalents, end of period |
|
$ |
256.7 |
|
$ |
220.7 |
|
$ |
170.7 |
|
Supplemental disclosure of non-cash investing and financing activities: |
|
|
|
|
|
|
|
|
|
|
Cash paid for interest, net of capitalized interest |
|
$ |
280.2 |
|
$ |
195.6 |
|
$ |
228.5 |
|
Cash paid for income taxes |
|
|
20.3 |
|
|
13.1 |
|
|
14.0 |
|
Non-cash purchases of equipment through capital leasing |
|
|
22.1 |
|
|
12.0 |
|
|
7.6 |
|
Non-cash purchases of equipment through nonmonetary exchange |
|
|
17.1 |
|
|
12.8 |
|
|
50.6 |
|
(Decrease)/Increase in accounts payable and accrued expenses for purchases of property and equipment |
|
|
(32.2) |
|
|
16.9 |
|
|
25.7 |
The accompanying notes are an integral part of these consolidated financial statements.
F-8
(1) ORGANIZATION AND DESCRIPTION OF BUSINESS
Business
Zayo Group Holdings, Inc., a Delaware corporation, was formed on November 13, 2007, and is the parent company of a number of subsidiaries engaged in providing access to bandwidth infrastructure. Zayo Group Holdings, Inc. and its subsidiaries are collectively referred to as “Zayo Group Holdings” or the “Company.” The Company’s primary operating subsidiary is Zayo Group, LLC (“ZGL”). Headquartered in Boulder, Colorado, the Company provides communication infrastructure solutions, including fiber and bandwidth connectivity, colocation and cloud infrastructure to businesses primarily in the United States (“U.S.”), Canada and Europe. The Company provides its products and offerings through six segments:
|
· |
Fiber Solutions, including dark fiber and mobile infrastructure solutions. |
|
· |
Transport, including Ethernet, wavelength, wholesale IP, and SONET solutions. |
|
· |
Enterprise Networks, including private lines, dedicated Internet and cloud-based computing and storage products. |
|
· |
Colocation, including provision of colocation space and power and interconnection offerings. |
|
· |
Allstream, including Cloud VoIP and Data Solutions. |
|
· |
Other offerings, including Zayo Professional Services (“ZPS”). |
The Company’s shares are listed on the New York Stock Exchange (NYSE) under the ticker symbol “ZAYO”.
(2) BASIS OF PRESENTATION AND SIGNIFICANT ACCOUNTING POLICIES
a. Basis of Presentation
The accompanying consolidated financial statements include all the accounts of the Company and its wholly-owned subsidiaries. All inter-company accounts and transactions have been eliminated in consolidation. The accompanying consolidated financial statements include the accounts of the Company and its wholly-owned subsidiaries and have been prepared in accordance with accounting principles generally accepted in the United States (“GAAP”) and pursuant to the rules and regulations of the Securities and Exchange Commission (the “SEC”) for annual reports on Form 10-K. In the opinion of management, all adjustments considered necessary for the fair presentation of financial position, results of operations and cash flows of the Company have been included herein. Unless otherwise noted, dollar amounts and disclosures throughout the Notes to the consolidated financial statements are presented in millions of dollars.
The Company’s fiscal year ends June 30 each year, and we refer to the fiscal year ending June 30, 2019 as “Fiscal 2019”, the fiscal year ended June 30, 2018 as “Fiscal 2018” and the fiscal year ended June 30, 2017 as “Fiscal 2017.”
b. Use of Estimates
The preparation of the Company’s consolidated financial statements in conformity with GAAP requires management to make estimates and assumptions that affect the reported amounts of assets and liabilities, and disclosures of contingent assets and liabilities at the date of the financial statements and the reported amounts of revenue and expense during the reporting period. Significant estimates are used when establishing allowances for doubtful accounts and accruals for billing disputes, determining useful lives for depreciation and amortization and accruals for exit activities associated with real estate leases, assessing the need for impairment charges (including those related to intangible assets and goodwill), determining the fair values of assets acquired and liabilities assumed in business combinations, accounting for income taxes and related valuation allowances against deferred tax assets, determining the defined benefit costs and defined benefit obligations related to post-employment benefits, determining the fair value of
F-9
plan assets related to post-employment benefits and estimating certain restricted stock unit grant fair values used to compute the stock-based compensation liability and expense. Management evaluates these estimates and judgments on an ongoing basis and makes estimates based on historical experience, current conditions, and various other assumptions that are believed to be reasonable under the circumstances. The results of these estimates form the basis for making judgments about the carrying values of assets and liabilities as well as identifying and assessing the accounting treatment with respect to commitments and contingencies. Actual results may differ from these estimates under different assumptions or conditions.
c. Net Income or Loss per Share
Basic income or loss per share attributable to the Company’s common shareholders is computed by dividing net income or loss attributable to common shareholders by the weighted average number of common shares outstanding for the period. Diluted income or loss per share attributable to common shareholders presents the dilutive effect, if any, on a per share basis of potential common shares (such as restricted stock units) as if they had been vested or converted during the periods presented. No such items were included in the computation of diluted loss per share for Fiscal 2016 because the Company incurred a net loss in the period and the effect of inclusion would have been anti-dilutive.
The Company’s computation of diluted income per share for Fiscal 2018 and 2017 included adjustments of 1.2 million and 2.9 million shares, respectively, to the weighted-average shares for the dilutive effect of the Part A and Part B units and related issuance of common shares upon vesting (calculated using the treasury method).
d. Foreign Currency Translation
For operations outside the U.S. that have functional currencies other than the U.S. dollar, assets and liabilities are translated to U.S. dollars at period-end exchange rates, and revenue, expenses and cash flows are translated using monthly average exchange rates during the year. Gains or losses resulting from currency translation are recorded as a component of accumulated other comprehensive income/(loss) in stockholders’ equity and in the consolidated statements of comprehensive income/(loss).
e. Cash and Cash Equivalents and Restricted Cash
The Company considers all highly liquid investments with original maturities of three months or less to be cash and cash equivalents. Cash equivalents are stated at cost, which approximates fair value. Restricted cash consists of cash balances held by various financial institutions as collateral for letters of credit and surety bonds. These balances are reclassified to cash and cash equivalents when the underlying obligation is satisfied, or in accordance with the governing agreement. Restricted cash balances expected to become unrestricted during the next twelve months are recorded as current assets. The Company had a non-current restricted cash balance of $4.6 million and $4.5 million as of June 30, 2018 and 2017, respectively.
f. Trade Receivables
Trade receivables are recorded at the invoiced amount and do not bear interest. The Company maintains an allowance for doubtful accounts for estimated losses inherent in its trade receivable portfolio. In establishing the required allowance, management considers historical losses adjusted to take into account current market conditions and the customer’s financial condition, and the age of receivables and current payment patterns. Account balances are charged off against the allowance after all means of collection have been exhausted and the potential for recovery is considered remote.
g. Property and Equipment
The Company’s property and equipment includes assets in service and under construction or development.
F-10
Property and equipment is recorded at historical cost or acquisition date fair value. Costs associated directly with network construction, network installations for customer access, and development of business support systems, including employee-related costs, are capitalized. Depreciation is calculated on a straight-line basis over the asset’s estimated useful life from the date placed into service or acquired. Management performs reviews to depreciable lives of its property and equipment on a periodic basis, which includes reviewing historical usage, with consideration given to technological changes, trends in the industry, and other economic factors that could impact the network architecture and asset utilization. In March 2018 management completed a review and revised its estimated useful lives for fiber optic network assets from its previous estimate of a range of fifteen years to twenty years to a revised estimate of thirty-three years and revised its estimated useful lives for owned buildings from its historical estimate of thirty-nine years to a revised estimate of forty-five years. In determining the change in estimated useful lives, the Company, with input from its engineering team, utilized quantitative and qualitative analysis, including historical usage patterns and retirements, industry benchmarks and review of published data sources. The change in estimated useful lives of the fiber optic network assets and owned buildings was accounted for as a change in accounting estimate on a prospective basis effective March 1, 2018. The effect of this change in estimate resulted in a reduction to depreciation expense for the year ended June 30, 2018 of $69.6 million, an increase to net income for the year ended June 30, 2018 of $55.4 million, and an increase to basic and diluted earnings per share for the year ended June 30, 2018 of $0.22.
Property and equipment acquired under capital leases is recorded at the lower of the fair value of the asset or the net present value of the minimum lease payments at the inception of the lease. Depreciation of property and equipment held under capital leases is included in depreciation and amortization expense, and is calculated on a straight-line basis over the estimated useful lives of the assets, or the related lease term, whichever is shorter.
Management reviews property and equipment for impairment whenever events or changes in circumstances indicate that the carrying value of its property and equipment may not be recoverable. An impairment loss is recognized when the assets’ carrying value exceeds both the assets’ estimated undiscounted future cash flows and the assets’ estimated fair value. Measurement of the impairment loss is then based on the estimated fair value of the assets. Considerable judgment is required to project such future cash flows and, if required, to estimate the fair value of the property and equipment and the resulting amount of the impairment. No impairment charges were recorded for property and equipment during the years ended June 30, 2018, 2017 or 2016, respectively.
The Company capitalizes interest for assets that require a period of time to get them ready for their intended use. The amount of interest capitalized is based on the Company’s weighted average effective interest rate for outstanding debt obligations during the respective accounting period.
h. Goodwill and Acquired Intangibles
Intangible assets arising from business combinations, such as acquired customer contracts and relationships, (collectively “customer relationships”), are initially recorded at fair value. The Company amortizes customer relationships primarily over an estimated life of 10 to 20 years using an amortization method that approximates the timing in which the Company expects to receive the benefit from the acquired customer relationship assets. Goodwill represents the excess of the purchase price over the fair value of the net identifiable assets acquired in a business combination.
Goodwill is reviewed for impairment at least annually in April, or more frequently if a triggering event occurs between impairment testing dates. The Company’s impairment assessment begins with a qualitative assessment to determine whether it is more likely than not that the fair value of a reporting unit is less than its carrying value. The qualitative assessment includes comparing the overall financial performance of the reporting units against the planned results used in the last quantitative goodwill impairment test. Additionally, each reporting unit’s fair value is assessed in light of certain events and circumstances, including macroeconomic conditions, industry and market considerations, cost factors, and other relevant entity- and reporting unit-specific events. The selection and assessment of qualitative factors used to determine whether it is more likely than not that the fair value of a reporting unit exceeds the carrying value involves significant judgments and estimates. If it is determined under the qualitative assessment that it is more likely
F-11
than not that the fair value of a reporting unit is less than its carrying value, then a single step test is performed to identify and measure impairment and if a reporting unit’s fair value is lower than its carrying value, the Company recognizes an impairment charge for the amount by which the reporting unit’s carrying amount exceeds its fair value, up to but not exceeding the reporting unit’s goodwill. The Company performed a qualitative assessment for the years ended June 30, 2018, 2017 and 2016, as well as upon the changes in reportable segments during Fiscal 2018 and 2017 (see Note 16- Segment Reporting), and determined it was more likely than not that the fair values of our reporting units are greater than their carrying amounts.
The Company reviews its indefinite-lived intangible assets for impairment at least annually in April. To the extent the carrying value of indefinite-lived intangible assets exceeds the fair value, the Company will recognize an impairment loss for the difference. The Company performed a qualitative assessment to determine whether it was more likely than not that the Company’s indefinite-lived intangible assets were impaired and concluded there was no indication of impairment for the years ended June 30, 2018, 2017 and 2016.
Intangible assets with finite useful lives are amortized over their respective estimated useful lives and reviewed for impairment whenever events or changes in circumstances indicate that the carrying amount of the asset may not be recoverable. No impairment charges were recorded for goodwill or intangible assets during the years ended June 30, 2018, 2017 or 2016, respectively.
i. Derivative Financial Instruments
Derivative instruments are recorded in the balance sheet as either assets or liabilities, measured at fair value. The Company has historically entered into interest rate swaps to convert a portion of its floating-rate debt to fixed-rate debt and has not applied hedge accounting; therefore, the changes in the fair value of the interest rate swaps are recognized in earnings as adjustments to interest expense. The principal objectives of the derivative instruments are to minimize the cash flow interest rate risks associated with financing activities. The Company does not use financial instruments for trading purposes. The Company utilized interest rate swap contracts in connection with debt instruments entered into during the July 2012 financing transactions. As of June 30, 2017, the Company’s interest rate swap contract had expired and was not replaced.
j. Revenue Recognition
The Company recognizes revenues derived from leasing fiber optic telecommunications infrastructure and the provision of telecommunications and colocation offerings when the offering has been provided and there is persuasive evidence of an arrangement, the fee is fixed or determinable, customer acceptance has been obtained with relevant contract terms, and collection of the receivable is reasonably assured. Taxes collected from customers and remitted to a governmental authority are reported on a net basis and are excluded from revenue.
Most revenue is billed in advance on a fixed-rate basis and the remainder is billed in arrears on a transactional basis determined by customer usage. The Company often bills customers for upfront charges, which are non-refundable. These charges relate to activation fees, installation charges or prepayments for future access and services and are influenced by various business factors including how the Company and customer agree to structure the payment terms. These upfront charges are deferred and recognized over the underlying contractual term. The Company also defers costs associated with customer activation and installation to the extent of upfront amounts received from customers, which are recognized as expense over the same period for which the associated revenue is recognized.
The Company typically records revenues from leases of dark fiber, including indefeasible rights-of-use (“IRU”) agreements, over the term that the customer is given exclusive access to the assets. Dark fiber IRU agreements generally require the customer to make a down payment upon the execution of the agreement with monthly IRU fees paid over the contract term; however, in some cases, the Company receives up to the entire lease payment at the inception of the lease and recognizes the revenue ratably over the lease term. Revenue related to professional services to provide network management and technical support is recognized as services are provided.
F-12
In determining the appropriate amount of revenue and related reserves to reflect in its consolidated financial statements, management evaluates payment history, credit ratings, customer financial performance, and historical or potential billing disputes and related estimates are based on these factors and assumptions.
k. Operating Costs and Expenses
The Company’s operating costs and expenses consist primarily of network expense (“Netex”), compensation and benefits, network operations expense (“Netops”), stock-based compensation, other expenses, and depreciation and amortization.
Netex consists of third-party network provider costs resulting from the leasing of certain network facilities, primarily leases of circuits and dark fiber, from carriers and other providers to augment the Company’s owned infrastructure, for which it is generally billed a fixed monthly fee. Netex also includes colocation facility costs for rent and license fees paid to the landlords of the buildings in which the Company’s colocation business operates, along with the utility costs to power those facilities.
Compensation and benefits expenses include salaries, wages, incentive compensation and benefits. Employee-related costs that are directly associated with network construction, network installations for customer access and development of business support systems are capitalized and amortized to operating costs and expenses over the customer life. Compensation and benefits expenses related to the departments attributed to generating revenue are included in “Operating costs” while compensation and benefits expenses related to the sales, product, and corporate departments are included in “Selling, general and administrative expenses” in the consolidated statements of operations.
Netops expense include all of the non-personnel related expenses of operating and maintaining the network infrastructure, including contracted maintenance fees, right-of-way costs, rent for cellular towers and other places where fiber is located, pole attachment fees, and relocation expenses. Netops expense is included in “Operating costs” in the consolidated statements of operations.
Stock-based compensation expense consists of the fair value of equity based awards granted to employees and independent directors recognized over their applicable vesting period. Stock-based compensation expense is included, based on the responsibilities of the awarded recipient, in either “Operating costs” or “Selling, general and administrative expenses” in the consolidated statements of operations. For additional information regarding our stock-based compensation expense, see (l.) – Stock-Based Compensation below and Note 11 – Stock-Based Compensation.
Other expenses include expenses such as property tax, franchise fees, and colocation facility maintenance, which relate to operating our network and are therefore included in “Operating costs” as well as travel, office expense and other administrative costs that are included in “Selling, general and administrative expenses”. Other expenses are included in either “Operating costs” or “Selling, general and administrative expenses” in the consolidated statement of operations depending on their relationship to generating revenue or association with sales and administration.
Transaction costs include expenses associated with professional services (i.e. legal, accounting, regulatory, etc.) rendered in connection with acquisitions or disposals (including spin-offs), travel expense and severance expense incurred that are associated with acquisitions or disposals, and other direct expenses incurred that are associated with signed and/or closed acquisitions or disposals and unsuccessful acquisitions. Transaction costs are included in “Selling, general and administrative expenses” in the consolidated statements of operations.
Related to Netex, the Company recognizes the cost of these facilities or services when it is incurred in accordance with contractual requirements. The Company routinely disputes incorrect billings. The most prevalent types of disputes include disputes for circuits that are not disconnected on a timely basis and usage bills with incorrect records. Depending on the type and complexity of the issues involved, it may take several quarters to resolve disputes.
In determining the amount of such operating expenses and related accrued liabilities to reflect in its consolidated financial statements, management considers the adequacy of documentation of disconnect notices, compliance with
F-13
prevailing contractual requirements for submitting such disconnect notices and disputes to the provider of the facilities, and compliance with its interconnection agreements with these providers. Significant judgment is required in estimating the ultimate outcome of the dispute resolution process, as well as any other costs that may be incurred to conclude the negotiations or settle any litigation.
l. Stock-Based Compensation
The Company maintains a compensation incentive plan for executives and employees. The plan includes incentive cash compensation (ICC) and equity (in the form of restricted stock units). Grants under the incentive plan are made quarterly for all participants. The Company recognizes all quarterly stock-based awards to employees and independent directors, based on their grant-date fair values, with no consideration for future forfeitures. The Company recognizes the fair value of outstanding awards as a charge to operations over the vesting period. The Company accounts for forfeitures as they occur.
The Company uses the straight-line method to recognize share-based compensation expense for outstanding share awards that do not contain a performance condition.
Determining the fair value of certain share-based awards at the grant date and subsequent reporting dates requires judgment. If actual results differ significantly from these estimates, stock-based compensation expense and the Company’s results of operations could be materially impacted.
For additional information regarding our stock-based compensation, see Note 11 – Stock-Based Compensation.
m. Legal Costs
Costs incurred to hire and retain external legal counsel to advise us on regulatory, litigation and other matters is expensed as the related services are received.
n. Income Taxes
The Company recognizes income taxes under the asset and liability method. Deferred tax assets and liabilities are recognized for the future tax consequences attributable to differences between the financial statement carrying amounts of existing assets and liabilities and their respective tax bases. Deferred tax assets and liabilities are measured using enacted tax rates expected to apply to taxable income in the years in which those temporary differences are expected to be recovered or settled. The effect on deferred tax assets and liabilities of a change in tax rates is recognized in earnings in the period that includes the enactment date.
Estimating the future tax benefit associated with deferred tax assets requires significant judgment. Deferred tax assets arise from a variety of sources, the most significant being: tax losses that can be carried forward to be utilized against taxable income in future years, deferred revenue, and expenses recognized in the Company’s financial statements but disallowed in the Company’s tax return until the associated cash flow occurs.
The Company records a valuation allowance to reduce its deferred tax assets to the amount that is expected to be recognized. The valuation allowance is established if, based on available evidence, it is more-likely-than-not that all or some portion of the asset will not be realized due to the inability to generate sufficient taxable income in the period and/or of the character necessary to utilize the benefit of the deferred tax asset. When evaluating whether it is more-likely-than-not that all or some portion of the deferred tax asset will not be realized, all available evidence, both positive and negative, that may affect the realizability of deferred tax assets is identified and considered in determining the appropriate amount of the valuation allowance. The Company continues to monitor its financial performance and other evidence each quarter to determine the appropriateness of the Company’s valuation allowance. At each balance sheet date, existing assessments are reviewed and, if necessary, revised to reflect changed circumstances.
F-14
The analysis of the Company’s ability to utilize its net operating loss carryforward (“NOL”) balance is based on the Company’s forecasted taxable income. The forecasted assumptions approximate the Company’s best estimates, including market growth rates, future pricing, market acceptance of the Company’s products and services, future expected capital investments and discount rates. If the Company is unable to meet its taxable income forecasts in future periods, the Company may change its conclusion about the appropriateness of the valuation allowance which could create a substantial income tax expense in the Company’s consolidated statement of operations in the period such change occurs.
Deferred tax liabilities related to investments in foreign subsidiaries and foreign corporate joint ventures that are essentially permanent in duration are not recognized until it becomes apparent that such amounts will reverse in the foreseeable future. All deferred tax assets and liabilities are presented as noncurrent. The Company records interest related to unrecognized tax benefits and penalties in the provision for income taxes.
o. Fair Value of Financial Instruments
Relevant accounting literature defines and establishes a framework for measuring fair value, and requires expanded disclosures about fair value measurements. It also emphasizes that fair value is a market-based measurement, not an entity-specific measurement, and defines fair value as the price that would be received to sell an asset or transfer a liability in an orderly transaction between market participants at the measurement date. Valuation techniques that may be used include the market approach (comparable market prices), the income approach (present value of future income or cash flow) and the cost approach (cost to replace the service capacity of an asset or replacement cost), which are each based upon observable and unobservable inputs. Observable inputs reflect market data obtained from independent sources, while unobservable inputs reflect the Company’s market assumptions.
Fair Value Hierarchy
A fair value hierarchy is established that requires an entity to maximize the use of observable inputs and minimize the use of unobservable inputs when measuring fair value. A financial instrument’s categorization within the fair value hierarchy is based upon the lowest level of input that is significant to the fair value measurement. The three levels of inputs that are used to measure fair value are:
Level 1
Inputs to the valuation methodology are unadjusted quoted prices for identical assets or liabilities in active markets that the Company has the ability to access.
Level 2
Inputs to the valuation methodology include:
|
· |
quoted prices for similar assets or liabilities in active markets; |
|
· |
quoted prices for identical or similar assets or liabilities in inactive markets; |
|
· |
inputs other than quoted prices that are observable for the asset or liability; and |
|
· |
inputs that are derived principally from or corroborated by observable market data by correlation or other means. |
If the asset or liability has a specified (contractual) term, the Level 2 input must be observable for substantially the full term of the asset or liability.
Level 3
Inputs to the valuation methodology are unobservable and significant to the fair value measurement.
F-15
The Company views fair value as the price that would be received from selling an asset or paid to transfer a liability in an orderly transaction between market participants at the measurement date. When determining the fair value measurements for assets and liabilities required to be recorded at fair value, management considers the principal or most advantageous market in which it would transact and considers assumptions that market participants would use when pricing the asset or liability, such as inherent risk, transfer restrictions, and risk of nonperformance.
p. Concentration of Credit Risk
Financial instruments that potentially subject the Company to concentration of credit risk consist principally of cash investments and accounts receivable. The Company’s cash and cash equivalents are primarily held in commercial bank accounts in the United States, Canada and Great Britain. The Company limits its cash investments to high-quality financial institutions in order to minimize its credit risk.
During the years ended June 30, 2018, 2017 and 2016, the Company had no single customer that exceeded 10% of total revenue. The Company’s trade receivables, which are unsecured, are geographically dispersed. As of June 30, 2018 and 2017, the Company had no single customer with a trade receivable balance that exceeded 10% of total receivables.
q. Employee Benefits
In connection with the Company’s acquisition of 100% of the equity interest in Allstream, Inc. and Allstream Fiber U.S. Inc. (together, the “Allstream Acquisition Entity” and such acquisition being the “Allstream Acquisition”) from Bell MTS on January 15, 2016, Bell MTS agreed to retain the Allstream Acquisition Entity’s former defined benefit pension obligations, and related pension plan assets, of retirees and other former employees of the Allstream Acquisition Entity. Bell MTS also agreed to reimburse the Allstream Acquisition Entity for certain solvency funding payments related to the pension obligations of active employees of the Allstream Acquisition Entity as of January 15, 2016. On October 31, 2017, Bell MTS transferred assets from the Allstream Acquisition Entity former defined benefit plans related to pre-closing service obligations for active employees to defined benefit pension plans of the Allstream Acquisition Entity created by the Company on January 15, 2016. Eligibility and the level of benefits for these plans varies depending on participants’ status, date of hire and or length of service. The Company recognizes the funded status of these defined benefit and post-retirement benefit (OPEB) plans as an asset or a liability on the consolidated balance sheet. Each year's actuarial gains or losses and prior period service costs are a component of other comprehensive income/(loss), which is then included in accumulated other comprehensive income. Pension and OPEB expenses are recognized over the period in which the employee renders service and becomes eligible to receive benefits. The pension and post-retirement accruals and valuations are dependent on assumptions to calculate those amounts. These assumptions include discount rates, long-term rate of return on plan assets, retirement rates, mortality rates and other factors. A change in any of the above assumptions would have an effect on the projected benefit obligation and pension expense. See Note 12 – Employee Benefits, for additional disclosure regarding the Company’s defined benefit pension plans and OPEBs. The Company’s policy is to fund the pension plans in accordance with applicable regulations. The OPEBs are not funded.
r. Condensed Financial Information of the Registrant
The restricted net assets of Zayo Group Holdings exceeds 25% of its consolidated net assets due to restrictions under the Credit Agreement and Notes (as defined in Note 7 – Long-term Debt). Zayo Group Holdings is a holding company with no assets or liabilities of its own or operations other than those of its subsidiary ZGL. Accordingly, the financial position, results of operations, comprehensive loss and cash flows of Zayo Group Holdings and ZGL are the same, except that at June 30, 2018 and 2017, Zayo Group Holdings had cash of $0.7 million, respectively. As such, the condensed financial information of Zayo Group Holdings is not presented as it is not meaningful.
F-16
s. Recently Issued Accounting Pronouncements
In February 2018, the Financial Accounting Standards Board (“FASB”) issued Accounting Standards Update (“ASU”), Income Statement—Reporting Comprehensive Income (Topic 220): Reclassification of Certain Tax Effects from Accumulated Other Comprehensive Income (ASU 2018-02), which allows companies to reclassify the income tax effects resulting from tax bill, H.R.1, from accumulated other comprehensive income to retained earnings. The standard also requires certain new disclosures regardless of the election. The standard is effective for fiscal years, and interim periods within those fiscal years, beginning after December 15, 2018 (fiscal year ending June 30, 2020 “Fiscal 2020” for the Company), with early adoption permitted. The Company does not expect ASU 2018-02 to have a material impact on its consolidated financial statements.
In March 2017, the FASB issued ASU 2017-07, Compensation – Retirement Benefits (Topic 715): Improving the Presentation of Net Periodic Pension Cost and Net Periodic Postretirement Benefit Cost. This ASU requires an employer to report the service cost component of net periodic pension cost and net periodic postretirement cost in the same line item in the statement of operations as other compensation costs arising from services rendered by the related employees during the period. The other net cost components are required to be presented in the statement of operations separately from the service cost component and outside a subtotal of income from operations. Additionally, the line item used in the statement of operations to present the other net cost components must be disclosed in the notes to the financial statements. This ASU is effective for fiscal years beginning after December 15, 2017 (Fiscal 2019 for the Company), and interim periods within those fiscal years, and must be applied on a retrospective basis. The Company does not expect ASU 2017-07 to have a material impact on its consolidated financial statements
In August 2016, the FASB issued ASU 2016-15, Statement of Cash Flows (Topic 230): Classifications of Certain Cash Receipts and Cash Payments. The new standard provides guidance for eight changes with respect to how cash receipts and cash payments are classified in the statement of cash flows, with the objective of reducing diversity in practice. The standard is effective for fiscal years, and interim periods within those fiscal years, beginning after December 31, 2017 (Fiscal 2019 for the Company), with early adoption permitted. The Company does not plan to early adopt, nor does it expect the adoption of this new standard to have a material impact on its consolidated financial statements.
On March 30, 2016, the FASB issued ASU 2016-09, Improvements to Employee Share-Based Payment Accounting, which is intended to improve the accounting for share-based payment transactions as part of the FASB’s simplification initiative. The ASU changes five aspects of the accounting for share-based payment award transactions that will affect public companies, including: (1) accounting for income taxes; (2) classification of excess tax benefits on the statement of cash flows; (3) forfeitures; (4) minimum statutory tax withholding requirements; and (5) classification of employee taxes paid on the statement of cash flows when an employer withholds shares for tax-withholding purposes. The Company early-adopted ASU 2016-09 effective July 1, 2016. Excess tax benefits for share-based payments are now recognized against income tax expense rather than additional paid-in capital and are included in operating cash flows rather than financing cash flows. The recognition of excess tax benefits have been applied prospectively and prior periods have not been adjusted. The Company had $15.6 million of excess tax benefits for the year ended June 30, 2017. In addition, the Company elected to change its accounting policy to account for forfeitures as they occur. The change was applied on a modified retrospective basis with a cumulative effect adjustment to accumulated deficit of $1.7 million as of July 1, 2016. Amendments related to minimum statutory tax withholding requirements and the classification of employee taxes paid on the statement of cash flows when an employer withholds shares for tax-withholding purposes have been adopted prospectively and did not have a material impact on the consolidated financial statements.
In February 2016, the FASB issued ASU 2016-02, Leases. The new guidance supersedes existing guidance on accounting for leases in Topic 840 and is intended to increase the transparency and comparability of accounting for lease transactions. ASU 2016-02 requires most leases to be recognized on the balance sheet. Lessees will need to recognize a right-of-use asset and a lease liability for virtually all leases. The liability will be equal to the present value of lease payments. The asset will be based on the liability, subject to adjustment, such as for initial direct costs. For income
F-17
statement purposes, the FASB retained a dual model, requiring leases to be classified as either operating or finance. Lessor accounting remains similar to the current model, but updated to align with certain changes to the lessee model and the new revenue recognition standard (ASU 2014-09). The ASU will require both quantitative and qualitative disclosures regarding key information about leasing arrangements. The standard is effective for fiscal years, and interim periods within those fiscal years, beginning after December 15, 2018 (Fiscal 2020 for the Company). Early adoption is permitted. The standard must be adopted using a modified retrospective transition, and provides for certain practical expedients. Transition will require application of the new guidance at the beginning of the earliest comparative period presented. The Company established a project team and commenced an initial impact assessment process. To date, the Company has reviewed a sample of lessee and lessor arrangements and made preliminary assessments of the impact this standard will have on the consolidated financial statements. Although it is still assessing the impact of this standard, the Company expects the new guidance to significantly increase the reported assets and liabilities on the consolidated balance sheets. There are currently no plans to early adopt ASU 2016-02.
In May 2014, the FASB issued ASU 2014-09, Revenue from Contracts with Customers (“ASC 606”), which replaces numerous requirements in U.S. GAAP, including industry-specific requirements, and provides companies with a single revenue recognition model for recognizing revenue from certain contracts with customers. The core principle of the new standard is that a company should recognize revenue to depict the transfer of promised goods or services to customers in an amount that reflects the consideration to which the company expects to be entitled in exchange for those goods or services. In addition, the standard requires disclosure of the nature, amount, timing, and uncertainty of revenue and cash flows arising from contracts with customers and addressed accounting for costs to acquire and fulfill contracts. The standard will not impact the manner in which the Company accounts for revenue arrangements accounted for as leases. Effective July 1, 2018, the Company will adopt the requirements of ASC 606 and will use the full retrospective transition method. The full retrospective transition method requires the Company to restate each prior reporting period presented. The Company is in the process of implementing internal controls and system functionality to enable the preparation of financial information post adoption.
The adoption of ASC 606 will have an impact on the manner in which the Company recognizes revenue associated with dark fiber sales that include the transfer of title to certain network assets, which prior to ASC 606 has been considered a sale of real estate or integral equipment. Until June 30, 2018, the Company has deferred the recognition of revenue on the sale of network infrastructure assets that were considered to be integral equipment if the Company has a substantial continuing involvement in the transferred asset. The consideration received in this type of arrangement has historically been amortized to revenue ratably over the period in which the Company has a substantial continuing involvement in the transferred asset. Under ASC 606 the asset transferred in this type of arrangement will be derecognized from the balance sheet and the amount of the transaction price attributable to the asset being sold will be recognized upon customer acceptance. This change will have an estimated impact of (decreasing)/ increasing the revenue as reported by the Company during the years ended June 30, 2018 and 2017 by ($1.5) million and $20.5 million, respectively. The retrospective adoption of ASC 606 will also result in increasing the previously reported operating costs during the year ended June 30, 2017 by $18.8 million which represents the net book value of assets transferred to customers in these types of arrangements during Fiscal 2017.
The assets transferred in these real estate sales have historically been included in the caption “property and equipment, net” on the Company’s balance sheet. Upon the adoption of ASC 606, the net book value of these assets of $19.6 million will be removed from the Company’s condensed consolidated balance sheet. The Company will also derecognize from its June 30, 2018 balance sheet $1.5 million and $20.5 million in related deferred revenue, current and non-current, respectively, which represented the unamortized consideration received on these arrangements.
An additional impact from the adoption of ASC 606 will be the accounting for the incremental costs of acquiring new service contracts including certain compensation expense with internal sales representatives. Under ASC 606, the Company will capitalize these incremental costs of obtaining customer contracts and amortize the expense over the relevant contract term. In addition, the Company will assess our deferred contract cost asset for impairment on a periodic basis. Prior to the adoption of ASC 606, compensation paid to internal sales representatives for obtaining new service
F-18
contracts have been expenses as incurred. The Company expects the impact of the retrospective adoption of ASC 606 will result in increasing the selling, general and administrative expenses as reported by the Company during the years ended June 30, 2018 and 2017 by $1.1 million and $0.2 million, respectively. Additionally, the Company expects an increase to the as reported caption titled “Other current assets” and “Other assets” on the consolidated balance sheet as of June 30, 2018 of $7.1 million and $5.7 million, respectively, to reflect the deferred cost of acquiring service contracts that will be recognized in future periods over the relevant contract term.
The table below presents the expected impact the full retrospective adoption of ASC 606 will have on the Company’s statement of operations for the years ended June 30, 2018 and 2017 and each of the quarters of Fiscal 2018:
|
|
|
Fiscal Year ended |
|
Quarter Ended (unaudited) |
||||||||||||||
|
|
|
June 30, |
|
June 30, |
|
September 30, |
|
December 31, |
|
March 31, |
|
June 30, |
||||||
|
Revenue |
|
$ |
(1.5) |
|
$ |
20.5 |
|
$ |
(0.4) |
|
$ |
(0.4) |
|
$ |
(0.4) |
|
$ |
(0.3) |
|
Operating costs |
|
|
— |
|
|
18.8 |
|
|
— |
|
|
— |
|
|
— |
|
|
— |
|
Selling, general and administrative expenses |
|
|
1.1 |
|
|
0.2 |
|
|
(0.2) |
|
|
0.6 |
|
|
(0.3) |
|
|
1.0 |
|
Depreciation and amortization |
|
|
(0.9) |
|
|
(0.7) |
|
|
(0.3) |
|
|
(0.3) |
|
|
(0.2) |
|
|
(0.1) |
|
Provision for income taxes |
|
|
(2.7) |
|
|
0.8 |
|
|
— |
|
|
(2.5) |
|
|
— |
|
|
(0.2) |
|
Net income |
|
|
1.0 |
|
|
1.4 |
|
|
0.1 |
|
|
1.8 |
|
|
0.1 |
|
|
(1.0) |
The table below presents the expected impact the full retrospective adoption of ASC 606 will have on the Company’s consolidated balance sheet for the year ended June 30, 2018:
|
|
|
As of June 30, 2018 |
|||||||
|
|
|
As Reported |
|
Effect of Adoption |
|
As Adjusted |
|||
|
Assets |
|
|
|
|
|
|
|
|
|
|
Other current assets |
|
$ |
22.6 |
|
$ |
7.1 |
|
$ |
29.7 |
|
Property and equipment, net |
|
$ |
5,447.2 |
|
$ |
(19.6) |
|
$ |
5,427.6 |
|
Other assets |
|
$ |
170.0 |
|
$ |
5.6 |
|
$ |
175.6 |
|
|
|
|
|
|
|
|
|
|
|
|
Liabilities |
|
|
|
|
|
|
|
|
|
|
Deferred revenue, current |
|
$ |
164.4 |
|
$ |
(1.5) |
|
$ |
162.9 |
|
Deferred revenue, non-current |
|
$ |
1,096.8 |
|
$ |
(20.5) |
|
$ |
1,076.3 |
|
Deferred income taxes, net |
|
$ |
143.2 |
|
$ |
3.9 |
|
$ |
147.1 |
|
|
|
|
|
|
|
|
|
|
|
|
Stockholders' equity |
|
|
|
|
|
|
|
|
|
|
Accumulated deficit |
|
$ |
(377.2) |
|
$ |
11.2 |
|
$ |
(366.0) |
(3) ACQUISITIONS AND DISPOSITIONS
Since inception through June 30, 2018, the Company has consummated 45 transactions accounted for as business combinations. The acquisitions were executed as part of the Company’s business strategy of expanding through acquisitions. The acquisitions of these businesses have allowed the Company to increase the scale at which it operates, which in turn affords the Company the ability to increase its operating leverage, extend its network reach, and broaden its customer base.
The accompanying consolidated financial statements include the operations of the acquired entities from their respective acquisition dates.
Acquisitions Completed During Fiscal 2018
Neutral Path Communications
On April 17, 2018, the Company acquired substantially all of the assets of Neutral Path Communications and Near North Partners (collectively, “Neutral Path”) for $33.3 million, which is net of cash acquired and also includes an
F-19
estimate for a contingent payment based on sales performance through June 30, 2018. The purchase price is subject to net working capital and certain post-closing adjustments. As of June 30, 2018, $4.0 million of the purchase consideration is being held in escrow pending the expiration of the indemnification adjustment period. The all-cash acquisition was funded with cash on hand and was considered an asset purchase for U.S. federal income tax purposes. Neutral Path is a long haul infrastructure provider, providing access to a fiber network in the Midwest. The transaction added owned plus additional leased route miles to the Company’s extensive North American network, including a unique high-count fiber route from Minneapolis to Omaha.
McLean Data Center
On April 4, 2018, the Company acquired McLean Data Center, a privately owned data center for an insignificant amount. The acquisition was considered an asset purchase for U.S. federal income tax purposes and a business combination for accounting purposes. The Company assumed an operating lease obligation and acquired certain assets, such as cash, structural components, equipment, and assumed customer contracts.
Spread Networks
On February 28, 2018, the Company acquired Spread Networks, LLC (“Spread Networks”), a privately owned telecommunications provider that owns and operates a high-fiber count long haul route connecting New York and Chicago, for net purchase consideration of $130.5 million, net of cash acquired, subject to certain post-closing adjustments. As of June 30, 2018, $0.6 million of the purchase consideration is being held in escrow pending the expiration of the indemnification adjustment period. The all-cash acquisition was funded with cash on hand and debt and was considered an asset purchase for U.S. federal income tax purposes. Additional connectivity of the route will be enabled by Zayo’s existing network.
Optic Zoo Networks
On January 18, 2018, the Company acquired Vancouver BC Canada-based Optic Zoo Networks for net purchase consideration of CAD $30.9 million (or $24.8 million), net of cash acquired, subject to certain post-closing adjustments. Optic Zoo Networks owns and provides access to high-capacity fiber in Vancouver, BC. As of June 30, 2018, CAD $3.1 million (or $2.4 million) of the purchase consideration is being held in escrow pending the expiration of the indemnification adjustment period. The acquisition was funded with cash on hand and was considered a stock purchase for U.S. federal income tax purposes.
Acquisitions Completed During Fiscal 2017
KIO Networks US Data Centers
On May 1, 2017, the Company completed the $11.9 million cash acquisition of Castle Access, Inc.’s (d/b/a “KIO Networks US”) San Diego, California data centers. The acquisition was funded with cash on hand and was considered a stock purchase for U.S. federal income tax purposes.
Electric Lightwave Parent, Inc.
On March 1, 2017, the Company acquired Electric Lightwave Parent, Inc. (“Electric Lightwave”), an infrastructure and telecommunications solutions provider serving markets in the western U.S., for net purchase consideration of $1,426.6 million, net of cash acquired, subject to certain post-closing adjustments. The acquisition was funded through debt (see Note 7 – Long-Term Debt) and cash on hand. The acquisition was considered a stock purchase for U.S. federal income tax purposes.
F-20
The acquisition added long haul fiber route miles and dense metro fiber across Denver, Minneapolis, Phoenix, Portland, Seattle, Sacramento, San Francisco, San Jose, Salt Lake City, Spokane and Boise, with on-net connectivity to enterprise buildings and data centers.
Santa Clara Data Center Acquisition
On October 3, 2016, the Company acquired a data center in Santa Clara, California (the “Santa Clara Data Center”) for net purchase consideration of $11.3 million. The net purchase consideration represents the net present value of ten quarterly payments of approximately $1.3 million beginning in the December 2016 quarter. As of June 30, 2018, the remaining cash consideration to be paid was $3.8 million. The acquisition was considered an asset purchase for U.S. federal income tax purposes. Payments made to the previous owners of the Santa Clara Data Center during the years ended June 30, 2018 and 2017 of $5.0 million and $3.7 million, respectively, representing the principal portion of the financing arrangement, are included in the consolidated statement of cash flows within financing activities.
Acquisitions Completed During Fiscal 2016
Clearview
On April 1, 2016, the Company acquired 100% of the equity interest in Clearview International, LLC (“Clearview”), a Texas based colocation and cloud infrastructure services provider for cash consideration of $18.3 million, subject to certain post-closing adjustments. The acquisition was funded with cash on hand and was considered an asset purchase for U.S. federal income tax purposes.
The acquisition consisted of two Texas data centers and added colocation space, as well as a set of hybrid cloud infrastructure services that complement the Company’s global cloud capabilities.
Allstream
On January 15, 2016, the Company acquired 100% of the equity interest in the Allstream Acquisition Entity from Manitoba Telecom Services Inc. (now known as “Bell MTS” as a result of its acquisition by BCE Inc.) for cash consideration of CAD $422.9 million (or $297.6 million), net of cash acquired, subject to certain post-closing adjustments. The consideration paid is net of $29.6 million of working capital and other liabilities assumed by the Company in the acquisition. The acquisition was funded with Incremental Term Loan proceeds (as defined in Note 7 – Long-Term Debt). The acquisition was considered a stock purchase for U.S. federal income tax purposes.
The acquisition added long-haul fiber connecting all major Canadian markets and metro fiber network connecting buildings concentrated in Canada’s top five metropolitan markets.
On October 31, 2017, Bell MTS transferred assets of CAD $117.9 million (or $91.6 million) from the Allstream Acquisition Entity’s former defined benefit pension plans related to pre-closing service obligations for active employees to defined benefit pension plans of the Allstream Acquisition Entity created by the Company on January 15, 2016. (Refer to Note 12 – Employee Benefits).
Viatel
On December 31, 2015, the Company completed the acquisition of a 100% interest in Viatel Infrastructure Europe Ltd., Viatel (UK) Limited, Viatel France SAS, Viatel Deutschland GmbH and Viatel Nederland BV (collectively, “Viatel”) for cash consideration of €92.9 million (or $101.2 million), net of cash acquired. The acquisition was funded with cash on hand. The acquisition was considered a stock purchase for U.S. federal income tax purposes. During the year ended June 30, 2017, the Company received a refund of the purchase price from escrow of $1.5 million. The refund is reflected as a cash inflow from investing activities on the consolidated statement of cash flows for the year ended June 30, 2017 within “Cash paid for acquisitions, net of cash acquired” caption.
F-21
Dallas Data Center Acquisition (“Dallas Data Center”)
On December 31, 2015, the Company acquired a data center located in Dallas, Texas for cash consideration of $16.6 million. The acquisition was funded with cash on hand and was considered an asset purchase for U.S. federal income tax purposes.
Acquisition Accounting
The Company initially recognizes the assets and liabilities acquired from the aforementioned acquisitions based on its preliminary estimates of their acquisition date fair values. As additional information becomes known concerning the acquired assets and assumed liabilities, management may make adjustments to the opening balance sheet of the acquired company up to the end of the measurement period, which is no longer than a one year period following the acquisition date. The determination of the fair values of the acquired assets and liabilities assumed (and the related determination of estimated lives of depreciable tangible and identifiable intangible assets) requires significant judgment. As of June 30, 2018, for the Optic Zoo Networks, Spread Networks, McLean Data Center, and Neutral Path acquisitions, the Company has not completed its fair value analysis and calculations in sufficient detail necessary to arrive at the final estimates of the fair value of certain working capital and non-working capital acquired assets and assumed liabilities, including the allocations to goodwill and intangible assets, property and equipment and resulting deferred taxes. All information presented with respect to certain working capital and non-working capital acquired assets and liabilities assumed as it relates to these acquisitions is preliminary and subject to revision pending the final fair value determination.
As a result of obtaining a final third-party valuation report for the Electric Lightwave acquisition in February 2018, the Company recorded final fair value estimates of Electric Lightwave’s customer relationship intangible asset and property and equipment. This resulted in increases of $103.9 million to intangible assets and $160.8 million to property and equipment, with a corresponding decrease to goodwill. These changes resulted in an increase in depreciation and amortization of $18.6 million, of which $6.2 million is related to periods prior to June 30, 2017. Additionally, the tax basis of assets was also updated during the year ended June 30, 2018 resulting in a deferred tax liability of $51.7 million compared to a deferred tax asset of $46.7 million as of June 30, 2017.
F-22
The table below reflects the Company's estimates of the acquisition date fair values of the assets acquired and liabilities assumed from its Fiscal 2018 acquisitions:
|
|
|
Neutral Path |
|
McLean Data Center |
|
Spread Networks |
|
Optic Zoo Networks |
||||
|
Acquisition date |
|
April 17, 2018 |
|
April 4, 2018 |
|
February 28, 2018 |
|
January 18, 2018 |
||||
|
|
|
(in millions) |
||||||||||
|
Cash |
|
$ |
0.7 |
|
$ |
9.2 |
|
$ |
1.5 |
|
$ |
1.4 |
|
Other current assets |
|
|
0.1 |
|
|
— |
|
|
5.9 |
|
|
0.4 |
|
Property and equipment |
|
|
10.6 |
|
|
0.6 |
|
|
144.7 |
|
|
13.6 |
|
Intangibles |
|
|
3.6 |
|
|
— |
|
|
9.3 |
|
|
2.8 |
|
Goodwill |
|
|
23.8 |
|
|
— |
|
|
13.0 |
|
|
10.6 |
|
Deferred tax assets |
|
|
1.5 |
|
|
— |
|
|
7.1 |
|
|
— |
|
Other assets |
|
|
— |
|
|
— |
|
|
1.4 |
|
|
0.2 |
|
Total assets acquired |
|
|
40.3 |
|
|
9.8 |
|
|
182.9 |
|
|
29.0 |
|
Current liabilities |
|
|
0.6 |
|
|
1.6 |
|
|
3.8 |
|
|
0.6 |
|
Deferred revenue |
|
|
5.7 |
|
|
— |
|
|
27.2 |
|
|
1.2 |
|
Deferred tax liability, net |
|
|
— |
|
|
— |
|
|
— |
|
|
1.0 |
|
Other liabilities |
|
|
— |
|
|
8.2 |
|
|
19.9 |
|
|
— |
|
Total liabilities assumed |
|
|
6.3 |
|
|
9.8 |
|
|
50.9 |
|
|
2.8 |
|
Net assets acquired |
|
|
34.0 |
|
|
— |
|
|
132.0 |
|
|
26.2 |
|
Less cash acquired |
|
|
(0.7) |
|
|
(9.2) |
|
|
(1.5) |
|
|
(1.4) |
|
Net consideration paid |
|
$ |
33.3 |
|
$ |
(9.2) |
|
$ |
130.5 |
|
$ |
24.8 |
F-23
The table below reflects the Company's estimates of the acquisition date fair values of the assets and liabilities assumed from its Fiscal 2017 acquisitions:
|
|
|
|
KIO Networks US Data Centers |
|
|
Electric Lightwave |
|
|
Santa Clara Data |
|
Acquisition date |
|
|
May 1, 2017 |
|
|
March 1, 2017 |
|
|
October 3, 2016 |
|
|
|
|
|
|
|
(in millions) |
|
|
|
|
Cash |
|
|
0.1 |
|
|
12.6 |
|
|
— |
|
Other current assets |
|
|
— |
|
|
55.0 |
|
|
— |
|
Property and equipment |
|
|
2.4 |
|
|
681.3 |
|
|
31.9 |
|
Deferred tax assets, net |
|
|
2.2 |
|
|
— |
|
|
— |
|
Intangibles |
|
|
6.4 |
|
|
416.1 |
|
|
6.0 |
|
Goodwill |
|
|
2.7 |
|
|
467.1 |
|
|
— |
|
Other assets |
|
|
0.5 |
|
|
1.7 |
|
|
— |
|
Total assets acquired |
|
|
14.3 |
|
|
1,633.8 |
|
|
37.9 |
|
Current liabilities |
|
|
1.8 |
|
|
61.7 |
|
|
— |
|
Capital lease obligations |
|
|
— |
|
|
— |
|
|
26.6 |
|
Deferred tax liabilities, net |
|
|
— |
|
|
51.7 |
|
|
— |
|
Deferred revenue |
|
|
0.5 |
|
|
80.0 |
|
|
— |
|
Other liabilities |
|
|
— |
|
|
1.2 |
|
|
— |
|
Total liabilities assumed |
|
|
2.3 |
|
|
194.6 |
|
|
26.6 |
|
Net assets acquired |
|
|
12.0 |
|
|
1,439.2 |
|
|
11.3 |
|
Less cash acquired |
|
|
(0.1) |
|
|
(12.6) |
|
|
— |
|
Total consideration paid/payable |
|
|
11.9 |
|
|
1,426.6 |
|
|
11.3 |
F-24
The table below reflects the Company's estimates of the acquisition date fair values of the assets and liabilities assumed from its Fiscal 2016 acquisitions:
|
|
|
Clearview |
|
Allstream |
|
Viatel |
|
Dallas Data |
||||
|
Acquisition date |
|
April 1, 2016 |
|
January 15, 2016 |
|
December 31, 2015 |
|
December 31, 2015 |
||||
|
|
|
|
(in millions) |
|||||||||
|
Cash |
|
$ |
— |
|
$ |
2.9 |
|
$ |
3.5 |
|
$ |
— |
|
Other current assets |
|
|
0.6 |
|
|
95.6 |
|
|
7.3 |
|
|
— |
|
Property and equipment |
|
|
17.1 |
|
|
266.3 |
|
|
174.0 |
|
|
12.2 |
|
Deferred tax assets, net |
|
|
0.2 |
|
|
3.8 |
|
|
— |
|
|
— |
|
Intangibles |
|
|
9.8 |
|
|
64.5 |
|
|
— |
|
|
4.4 |
|
Goodwill |
|
|
2.1 |
|
|
— |
|
|
9.5 |
|
|
— |
|
Other assets |
|
|
0.3 |
|
|
4.5 |
|
|
2.0 |
|
|
— |
|
Total assets acquired |
|
|
30.1 |
|
|
437.6 |
|
|
196.3 |
|
|
16.6 |
|
Current liabilities |
|
|
1.1 |
|
|
63.2 |
|
|
18.8 |
|
|
— |
|
Deferred revenue |
|
|
0.4 |
|
|
46.9 |
|
|
58.5 |
|
|
— |
|
Deferred tax liability, net |
|
|
— |
|
|
— |
|
|
8.6 |
|
|
— |
|
Other liabilities |
|
|
10.3 |
|
|
27.0 |
|
|
5.7 |
|
|
— |
|
Total liabilities assumed |
|
|
11.8 |
|
|
137.1 |
|
|
91.6 |
|
|
— |
|
Net assets acquired |
|
|
18.3 |
|
|
300.5 |
|
|
104.7 |
|
|
16.6 |
|
Less cash acquired |
|
|
— |
|
|
(2.9) |
|
|
(3.5) |
|
|
— |
|
Net consideration paid |
|
$ |
18.3 |
|
$ |
297.6 |
|
$ |
101.2 |
|
$ |
16.6 |
The goodwill arising from the Company’s acquisitions results from synergies, anticipated incremental sales to the acquired company customer base and economies-of-scale expected from the acquisitions. The Company has allocated the goodwill to the reporting units (in existence on the respective acquisition dates) that were expected to benefit from the acquired goodwill. The allocation was determined based on the excess of the estimated fair value of the reporting unit over the estimated fair value of the individual assets acquired and liabilities assumed that were assigned to the reporting units. See Note 5 – Goodwill for the allocation of the Company's acquired goodwill to each of its reporting units.
In the Company’s acquisitions, the Company acquired certain customer relationships. These relationships represent a valuable intangible asset, as the Company anticipates continued business from the acquired customer bases. The Company’s estimate of the fair value of the acquired customer relationships is generally based on a multi-period excess earnings valuation technique that utilizes Level 3 inputs.
Transaction Costs
Transaction costs include expenses associated with professional services (i.e., legal, accounting, regulatory, etc.) rendered in connection with signed and/or closed acquisitions or disposals, travel expense, severance expense incurred associated with acquisitions or disposals, and other direct expenses incurred that are associated with signed and/or closed acquisitions or disposals and unsuccessful acquisitions. The Company incurred transaction costs of $18.6 million, $20.5 million, and $21.5 million during the years ended June 30, 2018, 2017 and 2016, respectively. Transaction costs have been included in selling, general and administrative expenses in the consolidated statements of operations and in cash flows from operating activities in the consolidated statements of cash flows during these periods.
F-25
Pro-forma Financial Information (Unaudited)
The pro forma results presented below include the effects of the Company’s Fiscal 2018 and 2017 acquisitions as if the acquisitions occurred on July 1, 2016. The pro forma net income/(loss) for the years ended June 30, 2018 and 2017 includes the additional depreciation and amortization resulting from the adjustments to the value of property and equipment and intangible assets resulting from purchase accounting and adjustment to amortized revenue during Fiscal 2018 and 2017 as a result of the acquisition date valuation of assumed deferred revenue. The pro forma results also include interest expense associated with debt used to fund the acquisitions. The pro forma results do not include any anticipated synergies or other expected benefits of the acquisitions. The unaudited pro forma financial information is not necessarily indicative of either future results of operations or results that might have been achieved had the acquisitions been consummated as of July 1, 2016.
|
|
|
Year Ended June 30, |
||||
|
|
|
2018 |
|
2017 |
||
|
|
|
(in millions) |
||||
|
Revenue |
|
$ |
2,624.3 |
|
$ |
2,597.1 |
|
Net income/(loss) |
|
$ |
95.2 |
|
$ |
25.5 |
|
Net income/(loss) per share: |
|
|
|
|
|
|
|
Basic and diluted |
|
$ |
0.38 |
|
$ |
0.10 |
As a result of integrated reporting, it is impracticable to determine the amount of revenue and net income associated with each acquisition recognized in the post-acquisition period.
F-26
Scott-Rice Telephone Co.
On February 23, 2018, the Company announced that it has entered into an agreement to sell Scott-Rice Telephone Co. (“SRT”), a Minnesota incumbent local exchange carrier, for $42 million to Nuvera (formerly New Ulm Telecom, Inc.). The Company acquired SRT as part of its March 2017 purchase of Electric Lightwave and it is reported as part of the Allstream segment. Disposal groups to be sold are classified as held for sale in the period in which they meet all the held for sale criteria. SRT qualified as held-for-sale as of March 31, 2018. The Company concluded that SRT was not a significant disposal group and did not represent a strategic shift, and therefore was not classified as discontinued operations. The closing of the transaction occurred on July 31, 2018, refer to Note 18 – Subsequent Events. The following tables summarize the net assets and liabilities held for sale:
|
|
|
|
|
|
June 30, 2018 |
|
|
|
|
|
|
|
(in millions) |
|
|
Assets held for sale: |
|
|
|
|
|
|
|
Property and equipment, net |
|
|
|
|
$ |
35.7 |
|
Goodwill |
|
|
|
|
|
5.2 |
|
Other assets |
|
|
|
|
|
0.9 |
|
Total assets held for sale |
|
|
|
|
$ |
41.8 |
|
|
|
|
|
|
|
|
|
Liabilities associated with assets held for sale: |
|
|
|
|
|
|
|
Deferred tax liability, net |
|
|
|
|
$ |
5.1 |
|
Other liabilities |
|
|
|
|
|
1.0 |
|
Total liabilities associated with assets held for sale |
|
|
|
|
$ |
6.1 |
F-27
(4) PROPERTY AND EQUIPMENT
Property and equipment, including assets held under capital leases, was comprised of the following:
|
|
|
Estimated useful lives |
|
As of June 30, |
||||
|
|
|
(in years) |
|
2018 |
|
2017 |
||
|
|
|
|
|
|
(in millions) |
|||
|
Land |
|
N/A |
|
$ |
29.6 |
|
$ |
28.9 |
|
Buildings - leasehold and site improvements |
|
15 to 45 |
|
|
321.8 |
|
|
277.1 |
|
Furniture, fixtures and office equipment |
|
3 to 7 |
|
|
61.7 |
|
|
27.3 |
|
Computer hardware |
|
3 to 5 |
|
|
42.7 |
|
|
33.1 |
|
Software |
|
3 |
|
|
70.1 |
|
|
56.5 |
|
Components, machinery and equipment |
|
5 to 7 |
|
|
585.1 |
|
|
483.4 |
|
Fiber optic components and equipment(1) |
|
8 |
|
|
1,086.6 |
|
|
904.9 |
|
Circuit switch components and equipment |
|
10 |
|
|
399.4 |
|
|
337.6 |
|
Packet switch components and equipment(1) |
|
5 |
|
|
58.1 |
|
|
51.9 |
|
Fiber optic network |
|
33 |
|
|
4,954.9 |
|
|
4,110.3 |
|
Construction in progress |
|
N/A |
|
|
465.5 |
|
|
651.5 |
|
Total |
|
|
|
|
8,075.5 |
|
|
6,962.5 |
|
Less accumulated depreciation |
|
|
|
|
(2,592.6) |
|
|
(1,946.5) |
|
Less property and equipment held for sale(2) |
|
|
|
|
(35.7) |
|
|
— |
|
Property and equipment, net |
|
|
|
$ |
5,447.2 |
|
$ |
5,016.0 |
|
(1) |
Prior period amounts were reclassified for comparability with the 2018 presentation. |
|
(2) |
Property and equipment held for sale includes $35.7 million reported as assets held for sale in the Allstream segment. See Note 3—Acquisitions and Dispositions. |
Total depreciation expense, including depreciation of assets held under capital leases, for the years ended June 30, 2018, 2017 and 2016 was $650.2 million, $526.9 million and $440.5 million, respectively.
During the years ended June 30, 2018, 2017 and 2016, the Company capitalized interest in the amounts of $20.6 million, $18.8 million and $13.8 million, respectively. The Company capitalized $89.2 million, $79.9 million, and $64.5 million of direct labor costs to property and equipment accounts during the years ended June 30, 2018, 2017 and 2016, respectively.
(5) GOODWILL
The Company’s goodwill balance was $1,719.1 million and $1,840.2 million as of June 30, 2018 and 2017, respectively.
The Company’s reporting units are comprised of its strategic product groups (“SPG” or “SPGs”). Effective April 1, 2018, the Company implemented further organizational changes by creating two new reporting units: CloudLink Solutions (“CloudLink”) and Live Video Solutions (“Live Video”). In connection with the organizational change, goodwill was re-allocated to the Company’s SPGs on a relative fair value basis. The Company completed an assessment immediately prior to and after the organizational change at the SPG level and determined that it is more likely than not that the fair value of the Company’s reporting units is greater than their carrying amounts.
As of June 30, 2018, the Company’s SPGs were comprised of the following: Fiber Solutions, Zayo Wavelength Solutions (“Waves”), Zayo IP Transit Solutions (“IP Transit”), Zayo SONET Solutions (“SONET”), Zayo Ethernet Solutions (“Ethernet”), Live Video, Wide Area Networks (“WANs”, formerly Enterprise Private and Connectivity), Zayo Cloud Solutions (“Cloud”), Zayo Colocation (“zColo”), CloudLink, Allstream, and Other (primarily Zayo Professional Services).
F-28
The following reflects the changes in the carrying amount of goodwill during Fiscal 2018:
|
Product Group |
|
As of |
|
Reallocation among reporting units |
|
Adjustments to Fiscal 2017 |
|
Fiscal 2018 |
|
|
Foreign Currency Translation and Other (1) |
|
|
As of |
||||
|
|
|
(in millions) |
||||||||||||||||
|
Fiber Solutions |
|
|
633.9 |
|
|
— |
|
|
88.6 |
|
|
33.1 |
|
|
0.8 |
|
|
756.4 |
|
Waves |
|
|
247.4 |
|
|
(10.5) |
|
|
(56.3) |
|
|
13.6 |
|
|
0.6 |
|
|
194.8 |
|
Sonet |
|
|
52.0 |
|
|
— |
|
|
35.6 |
|
|
— |
|
|
— |
|
|
87.6 |
|
Ethernet |
|
|
359.5 |
|
|
(6.3) |
|
|
(249.8) |
|
|
0.7 |
|
|
0.1 |
|
|
104.2 |
|
Live Video |
|
|
— |
|
|
3.3 |
|
|
— |
|
|
— |
|
|
— |
|
|
3.3 |
|
WANs |
|
|
89.5 |
|
|
— |
|
|
89.7 |
|
|
— |
|
|
0.1 |
|
|
179.3 |
|
zColo |
|
|
256.3 |
|
|
— |
|
|
3.2 |
|
|
— |
|
|
0.6 |
|
|
260.1 |
|
Cloud |
|
|
69.5 |
|
|
— |
|
|
(4.2) |
|
|
— |
|
|
— |
|
|
65.3 |
|
Cloudlink |
|
|
— |
|
|
13.5 |
|
|
— |
|
|
— |
|
|
— |
|
|
13.5 |
|
Allstream |
|
|
116.5 |
|
|
— |
|
|
(72.3) |
|
|
— |
|
|
(5.2) |
|
|
39.0 |
|
Other |
|
|
15.6 |
|
|
— |
|
|
— |
|
|
— |
|
|
— |
|
|
15.6 |
|
Total |
|
$ |
1,840.2 |
|
$ |
— |
|
$ |
(165.5) |
|
$ |
47.4 |
|
$ |
(3.0) |
|
$ |
1,719.1 |
|
(1) |
Other includes $5.2 million reported as assets held for sale in the Allstream segment. See Note 3—Acquisitions and Dispositions. |
The following reflects the changes in the carrying amount of goodwill during Fiscal 2017:
|
Product Group |
|
As of |
|
Reallocation among reporting units |
|
Adjustments to |
|
|
Fiscal 2017 |
|
Foreign Currency |
|
|
As of |
||||
|
|
|
(in millions) |
|
|
|
|||||||||||||
|
Dark Fiber |
|
$ |
295.1 |
|
$ |
(295.1) |
|
$ |
— |
|
$ |
— |
|
$ |
— |
|
$ |
— |
|
Fiber Solutions |
|
|
— |
|
|
544.8 |
|
|
1.7 |
|
|
92.9 |
|
|
(5.5) |
|
|
633.9 |
|
Waves |
|
|
258.3 |
|
|
(104.0) |
|
|
(2.7) |
|
|
96.5 |
|
|
(0.7) |
|
|
247.4 |
|
Sonet |
|
|
51.3 |
|
|
0.7 |
|
|
— |
|
|
— |
|
|
— |
|
|
52.0 |
|
Ethernet |
|
|
104.3 |
|
|
(59.8) |
|
|
(0.5) |
|
|
315.3 |
|
|
0.2 |
|
|
359.5 |
|
IP |
|
|
87.5 |
|
|
(87.5) |
|
|
— |
|
|
— |
|
|
— |
|
|
— |
|
MIG |
|
|
73.6 |
|
|
(73.6) |
|
|
— |
|
|
— |
|
|
— |
|
|
— |
|
WANs |
|
|
— |
|
|
89.5 |
|
|
— |
|
|
— |
|
|
— |
|
|
89.5 |
|
zColo |
|
|
268.8 |
|
|
(15.0) |
|
|
(3.7) |
|
|
4.7 |
|
|
1.5 |
|
|
256.3 |
|
Cloud |
|
|
60.0 |
|
|
— |
|
|
(0.1) |
|
|
9.4 |
|
|
0.2 |
|
|
69.5 |
|
Allstream |
|
|
— |
|
|
— |
|
|
— |
|
|
116.5 |
|
|
— |
|
|
116.5 |
|
Other |
|
|
15.6 |
|
|
— |
|
|
— |
|
|
— |
|
|
— |
|
|
15.6 |
|
Total |
|
$ |
1,214.5 |
|
$ |
— |
|
$ |
(5.3) |
|
$ |
635.3 |
|
$ |
(4.3) |
|
$ |
1,840.2 |
F-29
(6) INTANGIBLE ASSETS
Identifiable intangible assets as of June 30, 2018 and 2017 were as follows:
|
|
|
Gross Carrying Amount |
|
Accumulated |
|
Net |
|||
|
|
|
(in millions) |
|||||||
|
June 30, 2018 |
|
|
|
|
|
|
|
|
|
|
Finite-Lived Intangible Assets |
|
|
|
|
|
|
|
|
|
|
Customer relationships |
|
$ |
1,597.0 |
|
$ |
(405.6) |
|
$ |
1,191.4 |
|
Underlying rights and other |
|
|
2.7 |
|
|
(0.6) |
|
|
2.1 |
|
Total |
|
|
1,599.7 |
|
|
(406.2) |
|
|
1,193.5 |
|
Indefinite-Lived Intangible Assets |
|
|
|
|
|
|
|
|
|
|
Certifications |
|
|
3.5 |
|
|
— |
|
|
3.5 |
|
Underlying rights and other |
|
|
15.1 |
|
|
— |
|
|
15.1 |
|
Total |
|
$ |
1,618.3 |
|
$ |
(406.2) |
|
$ |
1,212.1 |
|
June 30, 2017 |
|
|
|
|
|
|
|
|
|
|
Finite-Lived Intangible Assets |
|
|
|
|
|
|
|
|
|
|
Customer relationships |
|
$ |
1,477.7 |
|
$ |
(308.6) |
|
$ |
1,169.1 |
|
Underlying rights and other |
|
|
1.6 |
|
|
(0.4) |
|
|
1.2 |
|
Total |
|
|
1,479.3 |
|
|
(309.0) |
|
|
1,170.3 |
|
Indefinite-Lived Intangible Assets |
|
|
|
|
|
|
|
|
|
|
Certifications |
|
|
3.5 |
|
|
— |
|
|
3.5 |
|
Underlying rights and other |
|
|
14.8 |
|
|
— |
|
|
14.8 |
|
Total |
|
$ |
1,497.6 |
|
$ |
(309.0) |
|
$ |
1,188.6 |
The weighted average remaining amortization period for the Company’s customer relationships asset is 15.1 years. The Company has determined that certain underlying rights (including easements) and the certifications have indefinite lives. The amortization period for underlying rights (including easements) is 20 years. The amortization of intangible assets for the years ended June 30, 2018, 2017 and 2016 was $97.2 million, $80.0 million, and $75.8 million, respectively.
During the years ended June 30, 2018 and 2017, the Company wrote off nil and $0.3 million in fully amortized intangible assets, respectively. Estimated future amortization of finite-lived intangible assets is as follows:
|
|
|
|
|
|
June 30, |
|
(in millions) |
|
|
2019 |
$ |
94.6 | |
|
2020 |
|
|
89.5 |
|
2021 |
|
|
87.3 |
|
2022 |
|
|
85.3 |
|
2023 |
|
|
83.6 |
|
Thereafter |
|
|
753.2 |
|
Total |
|
$ |
1,193.5 |
In connection with the Company’s acquisition of the McLean Data Center, the Company assumed an operating lease at unfavorable terms when compared to prevailing market rates. As a result, the Company recorded an unfavorable lease obligation of $9.8 million, in other long-term liabilities, which will be amortized through the term of the lease which ends in March 2024. Amortization of the liability was $0.5 million for the year ended June 20, 2018. Estimated
F-30
future amortization of the lease liability is expected to be $1.6 million for the years ended June 30, 2019, 2020, 2021, 2022, and 2023, and $1.3 million for the year ended June 30, 2024.
(7) LONG-TERM DEBT
As of June 30, 2018 and 2017, long-term debt was as follows:
|
|
|
Date of |
|
|
|
Outstanding as of |
||||||||
|
|
|
Issuance or most |
|
Maturity |
|
Interest |
|
Interest Rate |
|
June 30, 2018 |
|
June 30, |
||
|
|
|
|
|
|
|
|
|
|
|
(in millions) |
||||
|
Term Loan Facility due 2021 |
|
Jan 2017 |
|
Jan 2021 |
|
Monthly |
|
LIBOR +2.00% |
|
$ |
493.8 |
|
$ |
498.8 |
|
B-2 Term Loan Facility |
|
Feb 2018 |
|
Jan 2024 |
|
Monthly |
|
LIBOR +2.25% |
|
|
1,269.3 |
|
|
1,429.9 |
|
6.00% Senior Unsecured Notes |
|
Jan & Mar 2015 |
|
Apr 2023 |
|
Apr/Oct |
|
6.00% |
|
|
1,430.0 |
|
|
1,430.0 |
|
6.375% Senior Unsecured Notes |
|
May 2015 & Apr 2016 |
|
May 2025 |
|
May/Nov |
|
6.375% |
|
|
900.0 |
|
|
900.0 |
|
5.75% Senior Unsecured Notes |
|
Jan, Apr & Jul 2017 |
|
Jan 2027 |
|
Jan/Jul |
|
5.75% |
|
|
1,650.0 |
|
|
1,350.0 |
|
Total obligations |
|
|
|
|
|
|
|
|
|
|
5,743.1 |
|
|
5,608.7 |
|
Unamortized premium/(discounts), net |
|
|
|
|
|
|
|
|
|
|
11.6 |
|
|
(3.2) |
|
Unamortized debt issuance costs |
|
|
|
|
|
|
|
|
|
|
(59.6) |
|
|
(67.8) |
|
Carrying value of debt |
|
|
|
|
|
|
|
|
|
|
5,695.1 |
|
|
5,537.7 |
|
Less current portion |
|
|
|
|
|
|
|
|
|
|
(5.0) |
|
|
(5.0) |
|
Total long-term debt, less current portion |
|
|
|
|
|
|
|
|
|
$ |
5,690.1 |
|
$ |
5,532.7 |
Term Loan Facility and Revolving Credit Facility
On May 6, 2015, ZGL and Zayo Capital, Inc. (“Zayo Capital”) entered into an Amendment and Restatement Agreement whereby the Credit Agreement (the “Credit Agreement”) governing their senior secured term loan facility (the “Term Loan Facility”) and $450.0 million senior secured revolving credit facility (the “Revolver”) was amended and restated in its entirety. The amended and restated Credit Agreement extended the maturity date of a portion of the outstanding term loans under the Term Loan Facility from July 2, 2019 to May 6, 2021. The terms of the Term Loan Facility require the Company to make quarterly principal payments of 25 basis points per quarter of the original loan amount (unless reduced by any prepayments), plus an annual payment of up to 50% of excess cash flow, as determined in accordance with the Credit Agreement (no such annual payment was required during Fiscal 2018, 2017 or 2016).
On January 15, 2016, ZGL and Zayo Capital entered into an Incremental Amendment (the “Amendment”) to the Credit Agreement. Under the terms of the Amendment, the portion of the Term Loan Facility due 2021 was increased by $400.0 million (the “Incremental Term Loan”). The additional amounts borrowed bear interest at LIBOR plus 3.5% with a minimum LIBOR rate of 1.0%. The $400.0 million add-on was priced at 99.0%. No other terms of the Credit Agreement were amended. The Incremental Term Loan proceeds were used to fund the Allstream Acquisition and for general corporate purposes.
On July 22, 2016, ZGL and Zayo Capital entered into a Repricing Amendment (the “Repricing Amendment”) to the Credit Agreement. Per the terms of the Repricing Amendment, the Incremental Term Loan was repriced at par and will bear interest at a rate of LIBOR plus 2.75%, with a minimum LIBOR rate of 1.0%, which represented a downward adjustment of 75 basis points. No other terms of the Credit Agreement were amended.
On January 19, 2017, ZGL and Zayo Capital entered into an Incremental Amendment No. 2 (the “Incremental Amendment”) to the Company’s Credit Agreement. Per the terms of the Incremental Amendment, the existing $1.85 billion of term loans under the Credit Agreement were repriced at 99.75% with one $500.0 million tranche that bears interest at a rate of LIBOR plus 2.0%, with a minimum LIBOR rate of 0.0% and a maturity date of four years from incurrence, which represents a downward adjustment of 75 basis points along with the lowering of the previous LIBOR floor, and a second $1.35 billion tranche (the “B-2 Term Loan” and along with the $500.0 million tranche, the “Refinancing Term Loans”) that bears interest at a rate of LIBOR plus 2.5%, with a minimum LIBOR rate of 1.0% and a maturity of seven years from incurrence, which represents a downward adjustment of 25 basis points. In addition, per
F-31
the terms of the Incremental Amendment, ZGL and Zayo Capital added a new $650.0 million term loan tranche under the Credit Agreement (the “Electric Lightwave Incremental Term Loan”) that bears interest at LIBOR plus 2.5%, with a minimum LIBOR rate of 1.0%, with a maturity of seven years from the closing date of the Incremental Amendment. In connection with the Incremental Amendment, the full $2,500.0 million Term Loan Facility, including the Refinancing Term Loans and the Electric Lightwave Incremental Term Loan, was re-issued at a price of 99.75%. No other material terms of the Credit Agreement with respect to the Refinancing Term Loans and the Electric Lightwave Incremental Term Loan were amended. On April 10, 2017, $570.1 million of the B-2 Term Loan and the Electric Lightwave Incremental Term Loan was repaid from proceeds of issuance of senior unsecured notes as further discussed below. Additionally, in July 2017, $310.7 million of the B-2 Term Loan was repaid from the proceeds of issuance of senior unsecured notes as further discussed below.
On July 20, 2017, ZGL and Zayo Capital entered into a second repricing (the “Repricing Amendment No. 2”) to the Credit Agreement. Per the terms of the Repricing Amendment No. 2, the outstanding balances of the B-2 Term Loan and Electric Lightwave Incremental Term Loan were repriced at par and will bear interest at a rate of LIBOR plus 2.25%, with a minimum LIBOR rate of 1.0%, which represented a downward adjustment of 25 basis points. No other terms of the Credit Agreement were amended.
In connection with the Repricing Amendment No. 2, the Company recognized an expense of $4.9 million during the year ended June 30, 2018 associated with debt extinguishment. The $4.9 million loss on extinguishment of debt primarily represents non-cash expenses associated with the write-off of unamortized debt issuance costs and the issuance discounts on the portion of the Credit Agreement, as further amended. The loss on extinguishment of debt also includes certain fees paid to third parties involved in the Repricing Amendment No. 2.
On December 22, 2017, ZGL and Zayo Capital entered into a third repricing amendment (the “Repricing Amendment No. 3”) to the Credit Agreement. Per the terms of the Repricing Amendment No. 3, the Revolver under the Credit Agreement was repriced and will bear interest at a rate of LIBOR plus 1.00% to LIBOR plus 1.75% per annum based on the Company’s leverage ratio, which represented a downward adjustment of 100 basis points. No other terms of the Credit Agreement were amended. The Revolver matures on April 17, 2020. The Credit Agreement also allows for letter of credit commitments of up to $50.0 million. The Revolver is subject to a fee per annum of 0.25% to 0.375% (based on ZGL’s current leverage ratio) of the weighted-average unused capacity, and the undrawn amount of outstanding letters of credit backed by the Revolver are subject to a 0.25% fee per annum. Outstanding letters of credit backed by the Revolver are subject to a fee of 1.00% to 1.75% per annum based upon ZGL’s leverage ratio.
On February 26, 2018, ZGL and Zayo Capital entered into an amendment (the “Incremental Amendment No. 3”) to the Credit Agreement. Per the terms of the Incremental Amendment No. 3, the Company added a new $150 million term loan tranche under the Credit Agreement (the “Incremental $150 Million Term Loan”). The Incremental $150 Million Term Loan will bear interest at LIBOR plus 2.25%, with a minimum LIBOR rate of 1.0%, with a maturity date of January 19, 2024, which is coterminous with the B-2 Term Loan. The Company intends to use the proceeds of the Incremental $150 Million Term Loan for general corporate purposes, including the funding of acquisitions permitted under the Credit Agreement. No other terms of the Credit Agreement were amended.
The weighted average interest rates (including margin) on the Term Loan Facility were approximately 4.3% and 3.4% at June 30, 2018 and 2017, respectively. Interest rates on the Revolver as of June 30, 2018 and 2017 remained consistent at approximately 3.8%.
As of June 30, 2018, no amounts were outstanding under the Revolver and $1,763.0 million in aggregate principal amount was outstanding under the Term Loan Facility. Standby letters of credit were outstanding in the amount of $8.1 million as of June 30, 2018, leaving $441.9 million available under the Revolver.
F-32
Senior Unsecured Notes
6.00% Senior Unsecured Notes due 2023
On January 23, 2015 and March 9, 2015, ZGL and Zayo Capital completed private offerings of aggregate principal amounts of $700.0 million and $730.0 million, respectively, of 6.00% senior unsecured notes due in 2023 (the “2023 Unsecured Notes”).
6.375% Senior Unsecured Notes due 2025
On April 14, 2016, ZGL and Zayo Capital completed a private offering of $550.0 million aggregate principal amount of 2025 Unsecured Notes (the “Incremental 2025 Notes”). The Incremental 2025 Notes were priced at 97.76% and were an additional issuance of the $350.0 million 6.375% senior unsecured notes due in 2025 that were originally issued on May 6, 2015 (the “2025 Notes” and together with the Incremental 2025 Notes, the “2025 Unsecured Notes”). The net proceeds from the Incremental 2025 Notes, plus cash on hand, were used to (i) redeem the then outstanding $325.6 million 10.125% senior unsecured notes due 2020, including the required $20.3 million make-whole premium and accrued interest, and (ii) repay $196.0 million of borrowings under the then outstanding secured Term Loan Facility.
5.75% Senior Unsecured Notes due 2027
On January 27, 2017, ZGL and Zayo Capital completed a private offering of $800.0 million aggregate principal amount of 5.75% senior unsecured notes due 2027 (the “January 2027 Notes”), which were issued at par. The net proceeds from the offering, along with the Electric Lightwave Incremental Term Loan discussed above, were used to fund the Electric Lightwave acquisition (see Note 3 – Acquisitions and Dispositions), which closed on March 1, 2017.
On April 10, 2017, the Company completed a private offering of $550.0 million aggregate principal amount of 5.75% senior unsecured notes due 2027 (the “Incremental 2027 Notes”). The Incremental 2027 Notes were an additional issuance of the January 2027 Notes and were priced at 104.0%. The net proceeds from the Incremental 2027 Notes were used to repay certain outstanding balances on the Company’s B-2 Term Loan.
On July 5, 2017, the Company completed a private offering of $300.0 million aggregate principal amount of 5.75% senior notes due 2027 (the “July Incremental 2027 Notes” and together with the Incremental 2027 Notes and the January 2027 Notes, the “2027 Unsecured Notes”). The July Incremental 2027 Notes were an additional issuance of the January 2027 Notes and Incremental 2027 Notes and were priced at 104.25%. The net proceeds of $310.7 million from the offering were used to further repay certain outstanding balances on the Company’s B-2 Term Loan.
Debt covenants
The indentures (the “Indentures”) governing the 2023 Unsecured Notes, the 2025 Unsecured Notes and the 2027 Unsecured Notes (collectively the “Notes”) contain covenants that, among other things, restrict the ability of ZGL and its subsidiaries to incur additional indebtedness and issue preferred stock, pay dividends or make other distributions with respect to any equity interests, make certain investments or other restricted payments, create liens, sell assets, incur restrictions on the ability of ZGL’s restricted subsidiaries to pay dividends or make other payments to ZGL, consolidate or merge with or into other companies or transfer all or substantially all of their assets, engage in transactions with affiliates, and enter into sale and leaseback transactions. The terms of the Indentures include customary events of default.
The Credit Agreement contains customary events of default, including among others, non-payment of principal, interest, or other amounts when due, inaccuracy of representations and warranties, breach of covenants, cross default to certain other indebtedness, insolvency or inability to pay debts, bankruptcy, or a change of control. The Credit Agreement also contains a covenant, applicable only to the Revolver, that ZGL maintain a senior secured leverage ratio below or equal to 5.25:1.00 at any time when the aggregate principal amount of loans outstanding under the Revolver is greater than 35% of the commitments under the Revolver. The Credit Agreement also requires ZGL and its subsidiaries to comply with customary affirmative and negative covenants, including covenants restricting the ability of ZGL and its
F-33
subsidiaries, subject to specified exceptions, to incur additional indebtedness, make additional guaranties, incur additional liens on assets, or dispose of assets, pay dividends, or make other distributions, voluntarily prepay certain other indebtedness, enter into transactions with affiliated persons, make investments and amend the terms of certain other indebtedness.
The Indentures limit any increase in ZGL’s secured indebtedness (other than certain forms of secured indebtedness expressly permitted under the indentures) to a pro forma secured debt ratio of 4.50 times ZGL’s previous quarter’s annualized modified EBITDA (as defined in the indentures), and limit ZGL’s incurrence of additional indebtedness to a total indebtedness ratio of 6.00 times the previous quarter’s annualized modified EBITDA.
The Company was in compliance with all covenants associated with its debt agreements as of June 30, 2018 and 2017.
Redemption rights
At any time prior to April 1, 2018 (for the 2023 Unsecured Notes), May 15, 2018 (for the 2025 Unsecured Notes), and January 15, 2022 (for the 2027 Unsecured Notes), the Company may redeem all or part of the applicable Notes at a redemption price equal to the sum of (i) 100% of the principal amount thereof, plus (ii) accrued interest and a “make-whole” premium, which is a lump sum payment derived from a formula based on the net present value of future coupon payments that will not be paid because of the early redemption.
On or after April 1, 2018 (for the 2023 Unsecured Notes), May 1, 2020 (for the 2025 Unsecured Notes), or January 15, 2022 (for the 2027 Unsecured Notes), the Company may redeem all or part of the applicable Notes, at the redemption prices (expressed as percentages of principal amount and set forth below), plus accrued and unpaid interest and additional interest, if any, thereon, to the applicable redemption date, subject to the rights of the holders of the Notes on the relevant record date to receive interest due on the relevant interest payment date, if redeemed during the 12-month period of the years indicated below:
|
|
|
|
Redemption Price |
|
|
Year |
|
|
(2023 Unsecured Notes) |
|
|
2018 |
|
|
104.500 |
% |
|
2019 |
|
|
103.000 |
% |
|
2020 |
|
|
101.500 |
% |
|
2021 and thereafter |
|
|
100.000 |
% |
|
|
|
|
Redemption Price |
|
|
Year |
|
|
(2025 Unsecured Notes) |
|
|
2020 |
|
|
103.188 |
% |
|
2021 |
|
|
102.125 |
% |
|
2022 |
|
|
101.063 |
% |
|
2023 and thereafter |
|
|
100.000 |
% |
|
|
|
|
Redemption Price |
|
|
Year |
|
|
(2027 Unsecured Notes) |
|
|
2022 |
|
|
102.875 |
% |
|
2023 |
|
|
101.917 |
% |
|
2024 |
|
|
100.958 |
% |
|
2025 and thereafter |
|
|
100.000 |
% |
The Company may purchase the Notes in open-market transactions, tender offers, or otherwise. The Company is not required to make any mandatory redemption or sinking fund payments with respect to the Notes.
F-34
Aggregate future contractual maturities of long-term debt (excluding issue discounts and premiums) were as follows as of June 30, 2018:
|
Year Ended June 30, |
|
|
|
|
|
|
(in millions) |
|
|
2019 |
|
$ |
5.0 |
|
2020 |
|
|
5.0 |
|
2021 |
|
|
483.8 |
|
2022 |
|
|
— |
|
2023 |
|
|
1,430.0 |
|
Thereafter |
|
|
3,819.3 |
|
Total |
|
$ |
5,743.1 |
Guarantees
The Notes are fully and unconditionally guaranteed, jointly and severally, on a senior unsecured basis by all of ZGL’s current and future domestic restricted subsidiaries. The Notes were co-issued with Zayo Capital, which does not have independent assets or operations.
The Term Loan Facility and Revolver are fully and unconditionally guaranteed, jointly and severally, on a senior secured basis by all of ZGL’s current and future domestic restricted subsidiaries.
Debt issuance costs
In connection with the Credit Agreement (and subsequent amendments thereto), and the various Notes offerings, the Company incurred debt issuance costs of $114.1 million (net of extinguishments). These costs are being amortized to interest expense over the respective terms of the underlying debt instruments using the effective interest method, unless extinguished earlier, at which time the related unamortized costs are to be immediately expensed.
Unamortized debt issuance costs of $3.0 million, $10.4 million and $11.4 million associated with the Company’s previous indebtedness were recorded as part of the loss on extinguishment of debt during the years ended June 30, 2018, 2017 and 2016, respectively.
The balance of debt issuance costs as of June 30, 2018 and 2017 was $59.6 million and $67.8 million, net of accumulated amortization of $54.5 million and $45.1 million, respectively. The amortization of debt issuance costs is included on the consolidated statements of cash flows within the caption “Non-cash interest expense” along with the amortization or accretion of the premium and discount on the Company’s indebtedness. Interest expense associated with the amortization of debt issuance costs was $9.5 million, $9.3 million and $10.0 million for the years ended June 30, 2018, 2017 and 2016, respectively.
Debt issuance costs are presented in the consolidated balance sheets as a reduction to “Long-term debt, non-current”.
F-35
(8) INCOME TAXES
The Company’s provision for income taxes from operations are summarized as follows:
|
|
|
June 30, |
|||||||
|
|
|
2018 |
|
2017 |
|
2016 |
|||
|
|
|
(in millions) |
|||||||
|
Current Income Taxes |
|
|
|
|
|
|
|
|
|
|
Federal |
|
$ |
(9.3) |
|
$ |
1.6 |
|
$ |
(1.3) |
|
State |
|
|
2.0 |
|
|
6.3 |
|
|
8.7 |
|
Foreign |
|
|
8.4 |
|
|
(2.1) |
|
|
3.9 |
|
Total |
|
$ |
1.1 |
|
$ |
5.8 |
|
$ |
11.3 |
|
Deferred Income Taxes |
|
|
|
|
|
|
|
|
|
|
Federal |
|
$ |
62.9 |
|
$ |
13.3 |
|
$ |
7.3 |
|
State |
|
|
4.1 |
|
|
2.4 |
|
|
(2.3) |
|
Foreign |
|
|
(42.0) |
|
|
(3.1) |
|
|
(7.8) |
|
Total |
|
|
25.0 |
|
|
12.6 |
|
|
(2.8) |
|
Total provision for income taxes |
|
$ |
26.1 |
|
$ |
18.4 |
|
$ |
8.5 |
The United States and foreign components of income/(loss) from operations before income taxes are as follows:
|
|
|
June 30, |
|||||||
|
|
|
2018 |
|
2017 |
|
2016 |
|||
|
|
|
(in millions) |
|||||||
|
United States |
|
$ |
71.0 |
|
$ |
66.6 |
|
$ |
(46.9) |
|
Foreign |
|
|
57.0 |
|
|
37.5 |
|
|
(20.8) |
|
Total |
|
$ |
128.0 |
|
$ |
104.1 |
|
$ |
(67.7) |
The Company’s effective income tax rate differs from what would be expected if the federal statutory rate were applied to earnings before income taxes primarily because of certain expenses that represent permanent differences between book and tax expenses and deductions, such as stock-based compensation expense.
F-36
A reconciliation of the actual income tax provision and the tax computed by applying the U.S. federal rate to the earnings before income taxes during the years ended June 30, 2018, 2017 and 2016 are as follows:
|
|
|
June 30, |
|||||||
|
|
|
2018 |
|
2017 |
|
2016 |
|||
|
|
|
(in millions) |
|||||||
|
Expected provision/(benefit) at the statutory rate |
|
$ |
35.9 |
|
$ |
36.4 |
|
$ |
(23.8) |
|
Increase/(decrease) due to: |
|
|
|
|
|
|
|
|
|
|
Stock-based compensation |
|
|
3.8 |
|
|
(11.7) |
|
|
27.9 |
|
State income taxes, net of federal benefit |
|
|
3.2 |
|
|
2.9 |
|
|
(2.1) |
|
Transaction costs not deductible for U.S. federal income tax purposes |
|
|
0.4 |
|
|
1.9 |
|
|
1.5 |
|
Change in statutory tax rate, non-U.S. |
|
|
7.4 |
|
|
(1.4) |
|
|
(3.6) |
|
Change in valuation allowance |
|
|
(49.3) |
|
|
(10.2) |
|
|
2.8 |
|
State NOL expirations |
|
|
6.1 |
|
|
— |
|
|
— |
|
U.S. Tax Reform |
|
|
24.8 |
|
|
— |
|
|
— |
|
Foreign tax rate differential |
|
|
(2.4) |
|
|
(3.9) |
|
|
2.7 |
|
Other, net |
|
|
(3.8) |
|
|
4.4 |
|
|
3.1 |
|
Provision for income taxes |
|
$ |
26.1 |
|
$ |
18.4 |
|
$ |
8.5 |
The effective tax rate for the year ended June 30, 2018 was positively impacted by reversing the valuation allowances on the deferred tax assets of certain foreign subsidiaries that have returned to profitability. The effective tax rate was negatively impacted by U.S. Tax Reform principally relating to the estimated income tax on the deemed repatriation of previously deferred foreign earnings.
On December 22, 2017, the U.S. federal government enacted a tax bill, H.R.1, An Act to Provide for Reconciliation Pursuant to Titles II and V of the Concurrent Resolution on the Budget for Fiscal Year 2018, previously known as Tax Cuts and Jobs Act of 2017 (“U.S. Tax Reform”). U.S. Tax Reform reduced the U.S. corporate tax rate from 35% to 21%, created a territorial tax system with a one-time mandatory repatriation tax on previously deferred foreign earnings, and changed business-related deductions and credits.
ASC 740, Income Taxes, requires companies to recognize the effect of tax law changes in the period of enactment. The SEC staff issued SAB 118, Income Tax Accounting Implications of the Tax Cuts and Jobs Act (“SAB 118”), which will allow registrants to record provisional amounts during a ‘measurement period’. SAB 118 allows a registrant to recognize provisional amounts when it does not have the necessary information available, prepared or analyzed(including computations) in reasonable detail to complete its accounting for the change in tax law. The measurement period ends when a registrant has obtained, prepared and analyzed the information necessary to finalize its accounting, but cannot extend beyond one year.
In accordance with SAB 118, the Company has recorded provisional tax expense each quarter as follows:
|
|
|
December 31, 2017 |
|
March 31, 2018 |
|
June 30, 2018 |
|
Total Tax Expense |
|
Deferred Tax Liability |
|
Tax Receivable |
||||||
|
Change in statutory rate, U.S. only |
|
$ |
1.4 |
|
$ |
0.2 |
|
$ |
(15.2) |
|
$ |
(13.6) |
|
$ |
(3.4) |
|
$ |
10.2 |
|
Changes to indefinite reinvestment assertion |
|
|
7.9 |
|
|
(0.4) |
|
|
(6.7) |
|
|
0.8 |
|
|
0.8 |
|
|
— |
|
Repatriation tax |
|
|
34.8 |
|
|
4.8 |
|
|
(2.0) |
|
|
37.6 |
|
|
37.6 |
|
|
— |
|
Net impacts of U.S. Tax Reform |
|
$ |
44.1 |
|
$ |
4.6 |
|
$ |
(23.9) |
|
$ |
24.8 |
|
$ |
35.0 |
|
$ |
10.2 |
The company continues to record provisional amounts during the measurement period. Management is in the process of obtaining and evaluating further information related to the provisional amounts estimated for items including
F-37
the mandatory repatriation amounts and impacts to deferred tax assets and liabilities. Management has made estimates as it anticipates additional guidance and legislative action from the U.S. Federal and State governments in addition to interpretations and guidance from the SEC and FASB regarding the application of U.S. Tax Reform. Future adjustments to the provisional numbers will be recorded as discrete adjustments to income tax expense in the period in which those adjustments become estimable and/or are finalized.
Other U.S. Tax Reform provisions are effective for years beginning after December 31, 2017, which would be the Company’s Fiscal 2019, including the tax on global intangible low taxed income, Base Erosion and Anti-abuse Tax, interest expense limitations, and executive compensation limitations. We continue to evaluate these and other impacts of U.S. Tax Reform as more information and guidance becomes available.
As of December 31, 2017, the Company has reversed its indefinite reinvestment assertion on all its foreign subsidiaries because the Company will be required to pay tax on all the accumulated undistributed earnings of its foreign subsidiaries. In accordance with SAB 118, the Company recorded a provisional amount of $0.8 million as a deferred tax liability for an estimate of the additional tax due upon actual repatriation.
|
|
|
Fiscal Year |
|||||||
|
U.S. Tax Rates |
|
|
2017 |
|
|
2018 |
|
|
2019 |
|
Federal rate |
|
|
35% |
|
|
28% |
|
|
21% |
|
Blended federal and state rates |
|
|
39% |
|
|
33% |
|
|
26% |
The Company files income tax returns in various federal, state, and local jurisdictions including the United States, Canada, United Kingdom and France. In the normal course of business, the company is subject to examination by taxing authorities throughout the world. With few exceptions, the company is no longer subject to income tax examinations by tax authorities in major tax jurisdictions for years before 2013.
The total amount of unrecognized tax benefits that, if recognized, would impact the effective income tax rate was $1.8 million and $0.2 million at June 30, 2018 and 2017, respectively because the uncertain tax positions are permanent differences. We recognize interest and penalties related to uncertain tax positions in income tax expense. We had accrued interest (presented before related tax benefits) of approximately $0.1 million and $0.1 million at June 30, 2018 and 2017, respectively. The Company expects $1.9 million could be settled within the next year.
|
|
|
Year Ended June 30, 2018 |
|
|
Balance at beginning of year |
|
$ |
0.2 |
|
Additions for current year tax positions |
|
|
1.2 |
|
Additions for prior year tax positions |
|
|
1.7 |
|
Reductions as a result of settlement with tax authority |
|
|
(0.1) |
|
Balance at end of year |
|
$ |
3.0 |
F-38
Deferred income taxes reflect the tax effects of temporary differences between the carrying amounts of assets and liabilities for financial reporting purposes and the amounts used for income tax purposes. The tax effect of temporary differences that give rise to significant portions of the deferred tax assets and deferred tax liabilities are as follows:
|
|
|
June 30, |
||||
|
|
|
2018 |
|
2017 |
||
|
|
|
(in millions) |
||||
|
Deferred income tax assets |
|
|
|
|
|
|
|
Net operating loss carry forwards |
|
$ |
545.2 |
|
$ |
715.2 |
|
Tax credit carry forwards |
|
|
17.9 |
|
|
22.6 |
|
Deferred revenue |
|
|
305.0 |
|
|
405.9 |
|
Accrued expenses |
|
|
41.4 |
|
|
40.0 |
|
Other liabilities |
|
|
2.3 |
|
|
17.4 |
|
Reserves against accounts receivable |
|
|
15.8 |
|
|
18.2 |
|
Deferred compensation |
|
|
11.2 |
|
|
20.3 |
|
Total deferred income tax assets |
|
|
938.8 |
|
|
1,239.6 |
|
Valuation allowance |
|
|
(72.9) |
|
|
(111.1) |
|
Net deferred tax assets |
|
|
865.9 |
|
|
1,128.5 |
|
Deferred income tax liabilities |
|
|
|
|
|
|
|
Property and equipment |
|
|
680.9 |
|
|
712.2 |
|
Intangible assets |
|
|
293.3 |
|
|
412.4 |
|
Debt issuance costs |
|
|
2.4 |
|
|
5.8 |
|
Total deferred income tax liabilities |
|
|
976.6 |
|
|
1,130.4 |
|
Less SRT deferred tax liabilities held for sale |
|
|
(5.1) |
|
|
— |
|
Net deferred income tax liabilities |
|
$ |
(105.6) |
|
$ |
(1.9) |
As of June 30, 2018, the Company had $1,917.2 million of U.S. federal net operating loss ("NOL") carry forwards. The Company generated approximately $245.5 million of NOL carry forwards during Fiscal 2018 mostly due to accelerated tax depreciation as provided by U.S. Tax Reform. The Company has completed several acquisitions in which it acquired net operating loss tax attributes as part of the purchase. These acquisitions, however, were considered a "change in ownership” within the meaning of Section 382 of the Internal Revenue Code and, as a result, such NOL carry forwards are subject to an annual limitation, reducing the amount available to offset income tax liabilities absent the limitation. Currently available U.S. federal NOL carry forwards as of June 30, 2018 are approximately $1,356.2 million. An additional $135.8 million will become available for use during fiscal year ended June 30, 2019. The Company's U.S. federal NOL carry forwards, if not utilized to reduce U.S. federal taxable income in future periods, will expire in various amounts beginning in 2019 and ending in 2037.
As of June 30, 2018, the Company had approximately $384.3 million of foreign jurisdiction net operating loss carry forwards, primarily in Canada, the United Kingdom and France. The majority of these foreign NOLs have a valuation allowance reducing the value of the corresponding deferred tax asset in the financial statements due to recent losses. It is reasonably possible that the Company may reverse the valuation allowance recorded on certain foreign subsidiaries’ deferred tax assets in the near future.
As of June 30, 2018, the Company had tax-effected state net operating loss carry forwards of approximately $53.9 million, which are subject to limitations on their utilization and have various expiration dates 2019 through 2037. The Company believes $51.6 million of this balance will be utilized and has provided a valuation allowance for the remainder.
Management believes it is more likely than not that it will utilize its net deferred tax assets to reduce or eliminate tax payments in future periods, with the exception of deferred tax assets related to certain foreign subsidiaries. The Company’s evaluation encompassed (i) a review of its recent history of taxable income for the past three years and (ii) a
F-39
review of internal financial forecasts demonstrating its expected ability to fully utilize its deferred tax assets prior to expiration.
(9) ACCRUED LIABILITIES
Accrued liabilities included in current liabilities consisted of the following. Prior year amounts in the table below have been conformed to current year presentation for comparability.
|
|
|
June 30, |
||||
|
|
|
2018 |
|
2017 |
||
|
|
|
|
(in millions) |
|||
|
Accrued compensation and benefits |
|
$ |
44.9 |
|
$ |
38.5 |
|
Accrued property and equipment purchases |
|
|
74.5 |
|
|
81.8 |
|
Network expense accruals(1) |
|
|
112.5 |
|
|
93.6 |
|
Other accrued taxes(1) |
|
|
11.8 |
|
|
23.1 |
|
Accrued professional fees |
|
|
4.3 |
|
|
3.9 |
|
Other accruals(1) |
|
|
65.0 |
|
|
84.5 |
|
Less liabilities held for sale(2) |
|
|
(0.7) |
|
|
- |
|
Total |
|
$ |
312.3 |
|
$ |
325.4 |
|
(1) |
Prior period amounts were reclassified for comparability with the 2018 presentation. |
|
(2) |
$0.7 million reported as liabilities associated with assets held for sale in the Allstream segment. See Note 3—Acquisitions and Dispositions. |
(10) EQUITY
On May 7, 2018, our Board of Directors authorized the repurchase of up to $500 million of our common stock from time to time using a variety of methods, including open market purchases, privately negotiated transactions and other means in accordance with federal securities laws. The authorization expires in November 2018, and may be suspended or discontinued at any time. During the year ended June 30, 2018, the Company repurchased 2,749,079 shares of its outstanding common stock at an average price of $34.02, or $93.5 million.
During the year ended June 30, 2016, the Company repurchased 3,474,120 shares of its outstanding common stock. This amount includes 3,103,350 shares repurchased at an average price of $23.07 per share, or $71.7 million, excluding commissions, under a $500 million, 6-month share repurchase program authorized by the Company’s Board of Directors on November 10, 2015. The 6-month share repurchase program expired in May 2016. The amounts included in the “Common stock repurchases” line in the consolidated statements of cash flows represents both shares authorized by the Board of Directors for repurchase under the publically announced authorization described above, as well as $9.4 million, or 370,770 shares, withheld from employees to cover tax withholding obligations on certain restricted stock units that vested during Fiscal 2016.
During the years ended June 30, 2018 and June 30, 2017, the Company recorded increases of $91.1 million and $104.7 million respectively, in additional paid-in capital associated with stock-based compensation expense related to the Company’s equity classified stock-based compensation awards. See Note 11 –Stock-based Compensation.
F-40
(11) STOCK-BASED COMPENSATION
The following tables summarize the Company’s stock-based compensation expense for liability and equity classified awards included in the consolidated statements of operations:
|
|
|
Year Ended June 30, |
|||||||
|
|
|
2018 |
|
2017 |
|
2016 |
|||
|
|
|
(in millions) |
|||||||
|
Included in: |
|
|
|
|
|
|
|
|
|
|
Operating costs |
|
$ |
9.9 |
|
$ |
11.3 |
|
$ |
17.4 |
|
Selling, general and administrative expenses |
|
|
86.8 |
|
|
102.8 |
|
|
138.5 |
|
Total stock-based compensation expense |
|
$ |
96.7 |
|
$ |
114.1 |
|
$ |
155.9 |
|
|
|
|
|
|
|
|
|
|
|
|
CII common and preferred units |
|
$ |
— |
|
$ |
10.1 |
|
$ |
73.0 |
|
Part A restricted stock units |
|
|
82.3 |
|
|
76.5 |
|
|
45.3 |
|
Part B restricted stock units |
|
|
12.4 |
|
|
26.0 |
|
|
36.5 |
|
Part C restricted stock units |
|
|
2.0 |
|
|
1.5 |
|
|
1.1 |
|
Total stock-based compensation expense |
|
$ |
96.7 |
|
$ |
114.1 |
|
$ |
155.9 |
CII Common and Preferred Units
Prior to the Company’s IPO, the Company was given authorization by Communications Infrastructure Investments, LLC (“CII”) to award 625,000,000 of CII’s common units as profits interests to employees, directors, and affiliates of the Company. The common units were historically considered to be stock-based compensation with terms that required the awards to be classified as liabilities due to cash settlement features. The vested portion of the awards was reported as a liability and the fair value was re-measured at each reporting date until the date of settlement, with a corresponding charge (or credit) to stock-based compensation expense. On December 31, 2016, the CII common units became fully vested and as such there is no remaining unrecognized compensation cost associated with CII common units for any period subsequent to December 31, 2016.
The value of the CII common units was derived from the value of CII’s investments in the Company and Onvoy, LLC and its subsidiaries (“OVS”), a company that provided voice and managed services which the Company spun off during the year ended June 30, 2014. As the value derived from each of these investments was separately determinable and there was a plan in place to distribute the value associated with the investment in Company shares separate from the value derived from OVS, the two components were accounted for separately. The OVS component of the CII awards was adjusted to fair value each reporting period. On December 31, 2015, CII entered into an agreement to sell OVS to a third party. The sale was completed in May 2016. Based on the sale price, the estimated fair value of OVS awards was increased, resulting in an increase to stock based compensation expense and corresponding increase to additional paid-in capital of $12.9 million for the year ended June 30, 2016. Proceeds from the sale to be distributed to the Company’s employees was paid by CII.
During the years ended June 30, 2018, 2017 and 2016, the Company recognized nil, $10.1 million and $73.0 million, respectively, of stock-based compensation expense related to vesting of CII common and preferred units.
Performance Compensation Incentive Program
During October 2014, the Company adopted the 2014 Performance Compensation Incentive Program (“PCIP”). The PCIP includes incentive cash compensation and equity (in the form of RSUs). Grants under the PCIP RSU plans are made quarterly for all participants. The PCIP was effective on October 16, 2014 and will remain in effect for a period of 10 years (or through October 16, 2024) unless it is earlier terminated by the Company’s Board of Directors.
F-41
The PCIP has the following components:
Part A
Under Part A of the PCIP, certain full-time employees, including the Company’s executives, are eligible to earn quarterly awards of RSUs. Each participant in Part A of the PCIP will have an RSU annual award target value, which will be allocated to each fiscal quarter. The final Part A value awarded to a participant for any fiscal quarter is determined by the Compensation Committee of the Board of Directors subsequent to the end of the respective performance period taking into account the Company’s measured value creation for the quarter, as well as such other subjective factors that it deems relevant (including group and individual level performance factors). The number of Part A RSUs granted will be calculated based on the final award value determined by the Compensation Committee divided by the average closing price of the Company’s common stock over the last ten trading days of the respective performance period. Part A RSUs will vest assuming continuous employment fifteen months subsequent to the end of the performance period (for awards relating to periods through June 30, 2017) or twelve months subsequent to the end of the performance period (for awards relating to periods subsequent to June 30, 2017). Upon vesting, the RSUs convert to an equal number of shares of the Company’s common stock. Additionally, under Part A of the PCIP, awards may be granted to certain employees upon commencement of their employment with the Company.
During the years ended June 30, 2018, 2017 and 2016, the Company recognized $82.3 million, $76.5 million and $45.3 million, respectively, of compensation expense associated with Part A awards. The June 2018 and June 2017 quarterly awards were recorded as liabilities totaling $5.7 million and $5.5 million as of June 30, 2018 and 2017, respectively, as the awards represent an obligation denominated in a fixed dollar amount to be settled in a variable number of shares during the subsequent quarter. The quarterly stock-based compensation liability is included in “Accrued liabilities” in the accompanying consolidated balance sheets. Upon the issuance of the RSUs, the liability is re-measured and then reclassified to additional paid-in capital, with a corresponding charge (or credit) to stock based compensation expense. The value of the remaining unvested RSUs is expensed ratably through the vesting date. At June 30, 2018, the remaining unrecognized compensation cost to be expensed over the remaining vesting period for Part A awards is $32.6 million.
The following table summarizes the Company’s Part A RSU activity for the years ended June 2018, 2017 and 2016:
|
|
|
|
Number of Part A |
|
Weighted average |
|
|
Weighted average |
|
|
Outstanding at July 1, 2015 |
|
|
933,217 |
|
$ |
26.25 |
|
|
7.1 |
|
Granted |
|
|
2,190,785 |
|
|
26.04 |
|
|
|
|
Vested |
|
|
(852,853) |
|
|
26.14 |
|
|
|
|
Forfeited |
|
|
(101,248) |
|
|
n/a |
|
|
|
|
Outstanding at July 1, 2016 |
|
|
2,169,901 |
|
$ |
26.04 |
|
|
7.9 |
|
Granted |
|
|
2,678,503 |
|
|
31.64 |
|
|
|
|
Vested |
|
|
(2,080,685) |
|
|
26.03 |
|
|
|
|
Forfeited |
|
|
(403,333) |
|
|
n/a |
|
|
|
|
Outstanding at July 1, 2017 |
|
|
2,364,386 |
|
$ |
31.63 |
|
|
7.1 |
|
Granted |
|
|
2,664,538 |
|
|
35.08 |
|
|
|
|
Vested |
|
|
(2,651,798) |
|
|
31.55 |
|
|
|
|
Forfeited |
|
|
(323,389) |
|
|
n/a |
|
|
|
|
Outstanding at June 30, 2018 |
|
|
2,053,737 |
|
$ |
35.08 |
|
|
6.4 |
F-42
Part B
Under Part B of the PCIP, participants, including the Company’s executives, are awarded quarterly grants of RSUs. The number of the RSUs earned by the participants is based on the Company’s stock price performance over a performance period of one year with the starting price being the average closing price over the last ten trading days of the quarter immediately prior to the date of grant and the vesting date. The RSUs vest assuming continuous employment through the end of the measurement period, twelve months after the beginning of the performance period (for awards vesting on or prior to June 30, 2018) or fifteen months after the beginning of the performance period (for awards vesting after June 30, 2018). The existence of a vesting provision that is associated with the performance of the Company’s stock price is a market condition, which affects the determination of the grant date fair value. Upon vesting, RSUs earned convert to an equal number of shares of the Company’s common stock.
The following table summarizes the Company’s Part B RSU activity for the years ended June 2018, 2017 and 2016:
|
|
|
|
Number of Part B |
|
Weighted average |
|
|
Weighted average |
|
|
Outstanding at July 1, 2015 |
|
|
1,249,873 |
|
$ |
42.90 |
|
|
5.5 |
|
Granted |
|
|
1,152,176 |
|
|
26.80 |
|
|
|
|
Vested |
|
|
(1,463,893) |
|
|
38.70 |
|
|
|
|
Forfeited |
|
|
(77,220) |
|
|
n/a |
|
|
|
|
Outstanding at July 1, 2016 |
|
|
860,936 |
|
$ |
29.50 |
|
|
6.2 |
|
Granted |
|
|
715,564 |
|
|
45.56 |
|
|
|
|
Vested |
|
|
(793,478) |
|
|
32.58 |
|
|
|
|
Forfeited |
|
|
(371,049) |
|
|
n/a |
|
|
|
|
Outstanding at July 1, 2017 |
|
|
411,973 |
|
$ |
42.86 |
|
|
6.1 |
|
Granted |
|
|
401,857 |
|
|
41.60 |
|
|
|
|
Vested |
|
|
(468,698) |
|
|
39.01 |
|
|
|
|
Forfeited |
|
|
(159,357) |
|
|
n/a |
|
|
|
|
Outstanding at June 30, 2018 |
|
|
185,775 |
|
$ |
57.19 |
|
|
8.9 |
The table below reflects the total Part B RSUs granted during each period presented, the maximum eligible shares of the Company’s common stock that the respective Part B RSU grant could be converted into shares of the Company’s common stock, and the grant date fair value per Part B RSU during the period indicated. The table below also reflects the units converted to the Company’s common stock at a vesting date that is subsequent to the period indicated for those RSUs granted during the period indicated:
|
|
|
During the three months ended |
||||||||||
|
|
|
June 30, |
|
March 31, |
|
December 31, |
|
September 30, 2017 |
||||
|
Part B RSUs granted |
|
|
78,123 |
|
|
77,218 |
|
|
82,556 |
|
|
163,960 |
|
Maximum eligible shares of the Company's common stock |
|
|
539,049 |
|
|
532,804 |
|
|
569,636 |
|
|
590,256 |
|
Grant date fair value per Part B RSU |
|
$ |
74.44 |
|
$ |
52.47 |
|
$ |
45.10 |
|
$ |
19.06 |
|
Units converted to Company's common stock at vesting date |
|
|
n/a |
|
|
n/a |
|
|
n/a |
|
|
n/a |
F-43
|
|
|
During the three months ended |
||||||||||
|
|
|
June 30, |
|
March 31, |
|
December 31, |
|
September 30, |
||||
|
Part B RSUs granted |
|
|
152,808 |
|
|
171,316 |
|
|
191,015 |
|
|
200,425 |
|
Maximum eligible shares of the Company's common stock |
|
|
550,109 |
|
|
880,564 |
|
|
981,817 |
|
|
1,030,185 |
|
Grant date fair value per Part B RSU |
|
$ |
26.52 |
|
$ |
27.39 |
|
$ |
75.56 |
|
$ |
47.00 |
|
Units converted to Company's common stock at vesting date |
|
|
54,671 |
|
|
41,368 |
|
|
102,511 |
|
|
99,508 |
During the years ended June 30, 2018, 2017 and 2016, the Company recognized stock-based compensation expense of $12.4 million, $26.0 million and $36.5 million related to Part B awards, respectively.
The grant date fair value of Part B RSU grants is estimated utilizing a Monte Carlo simulation. This simulation estimates the ten-day average closing stock price ending on the vesting date, the stock price performance over the performance period, and the number of common shares to be issued at the vesting date. Various assumptions are utilized in the valuation method, including the target stock price performance ranges and respective share payout percentages, the Company’s historical stock price performance and volatility, peer companies’ historical volatility and an appropriate risk-free rate. The aggregate future value of the grant under each simulation is calculated using the estimated per share value of the common stock at the end of the vesting period multiplied by the number of common shares projected to be granted at the vesting date. The present value of the aggregate grant is then calculated under each of the simulations, resulting in a distribution of potential present values. The fair value of the grant is then calculated based on the average of the potential present values. The remaining unrecognized compensation cost associated with Part B RSU grants is $6.8 million at June 30, 2018.
Part C
Under Part C of the PCIP, independent directors of the Company are eligible to receive quarterly awards of RSUs. Independent directors electing to receive a portion of their annual director fees in the form of RSUs are granted a set dollar amount of Part C RSUs each quarter. The quantity of Part C RSUs granted is based on the average closing price of the Company’s common stock over the last ten trading days of the quarter ended immediately prior to the grant date and vest at the end of each quarter for which the grant was made. During the years ended June 30, 2018, 2017 and 2016, the Company’s independent directors were granted 58,421, 47,420 and 41,793 Part C RSUs, respectively. During the years ended June 30, 2018, 2017 and 2016, the Company recognized $2.0 million, $1.5 million and $1.1 million of compensation expense associated with the Part C RSUs, respectively.
(12) EMPLOYEE BENEFITS
In connection with the Allstream Acquisition on January 15, 2016 (see Note 3 – Acquisitions and Dispositions), Bell MTS agreed to retain the Allstream Acquisition Entity’s former defined benefit pension obligations, and related pension plan assets, of retirees and other former employees of the Allstream Acquisition Entity and also agreed to reimburse the Allstream Acquisition Entity for certain solvency funding payments related to the pension obligations of active employees of the Allstream Acquisition Entity as of January 15, 2016. On October 31, 2017, Bell MTS transferred assets of CAD $117.9 million (or $91.6 million) from the Allstream Acquisition Entity’s former defined benefit pension plans related to pre-closing service obligations for active employees to defined benefit pension plans of the Allstream Acquisition Entity created by the Company on January 15, 2016. The assets were transferred on a fully funded basis calculated on a solvency basis, however on a GAAP basis, the plans are underfunded. Upon transfer, a prior period service cost was recognized in other comprehensive income for the underfunded amount, consistent with the Company’s accounting policies. The Company became responsible for accruing post-acquisition liabilities related to these plans as of the Allstream Acquisition date of January 15, 2016. The Company also sponsors an OPEB for certain former employees of the Allstream Acquisition Entity, which provides health care and life insurance benefits for certain eligible retirees. These OPEB plans are not funded. Benefits are paid directly to the participants of these plans.
F-44
The Company uses a June 30 annual measurement date for its defined benefit and postretirement benefit plans. Upon the transfer of the pre-closing service obligation, a measurement was obtained. No comparative period figures were disclosed in the tables or notes below, as the amounts for employee benefits were not material for those periods.
Defined benefit plans
The Company maintains defined benefit pension plans that provide pension benefits for certain former employees of the Allstream Acquisition Entity. Benefits are based on the employee’s length of service and average rate of pay during the highest paid consecutive three years of service. The Company is responsible for adequately funding the pension plans. Contributions are made based on various actuarial cost methods permitted by pension regulatory bodies. Contributions reflect actuarial assumptions about future investment returns, salary projections, future service and life expectancy.
The following tables provide a reconciliation of the changes in the benefit obligations, fair value of plan assets and the unfunded status for the Company’s defined benefit pension and OPEB, where applicable:
|
|
|
Pension Plans |
|
|
|
|
(in millions) |
|
|
Change in projected benefit obligation for defined benefit pension plans: |
|
|
|
|
Projected benefit obligation at July 1, 2017 |
|
$ |
6.7 |
|
Service cost |
|
|
2.7 |
|
Interest cost |
|
|
2.5 |
|
Actuarial loss (gain) |
|
|
9.3 |
|
Participant contributions |
|
|
0.6 |
|
Benefits paid from plan assets |
|
|
(3.3) |
|
Acquisition transfer |
|
|
97.6 |
|
Settlements |
|
|
(2.5) |
|
Foreign currency exchange rate changes |
|
|
(0.1) |
|
Projected benefit obligation at June 30, 2018 |
$ |
113.5 |
|
|
|
|
OPEB Plans |
|
|
|
|
(in millions) |
|
|
Change in projected benefit obligation for OPEB plans: |
|
|
|
|
Projected benefit obligation at July 1, 2017 |
|
$ |
9.9 |
|
Service cost |
|
|
0.1 |
|
Interest cost |
|
|
0.3 |
|
Actuarial loss (gain) |
|
|
0.4 |
|
Benefits paid by Company |
|
|
(0.6) |
|
Foreign currency exchange rate changes |
|
|
(0.1) |
|
Projected benefit obligation at June 30, 2018 |
$ |
10.0 |
|
F-45
The accumulated benefit obligation of the defined benefit plan and OPEB at June 30, 2018 are $103.9 million and $10.0 million, respectively.
|
|
|
Pension Plans |
|
|
|
|
(in millions) |
|
|
Change in pension plan assets: |
|
|
|
|
Fair value of plan assets at July 1, 2017 |
|
$ |
3.7 |
|
Acquisition transfer |
|
|
89.8 |
|
Return on plan assets |
|
|
2.4 |
|
Employer contributions |
|
|
2.9 |
|
Participant contributions |
|
|
0.6 |
|
Benefits paid from plan assets |
|
|
(3.3) |
|
Settlements |
|
|
(2.6) |
|
Fair value of pension plan assets at June 30, 2018 |
|
$ |
93.5 |
The unfunded status of the projected benefit obligation at June 30, 2018 was $20.0 million, which was recorded as other long-term liabilities.
|
|
|
Pension Plans |
|
|
|
|
As of June 30, 2018 |
|
|
|
|
(in millions) |
|
|
Projected benefit obligation |
|
$ |
113.5 |
|
Fair value of plan assets |
|
|
93.5 |
|
Unfunded status |
|
|
20.0 |
|
Current portion of unfunded status |
|
$ |
— |
|
Non-current portion of unfunded status |
|
$ |
20.0 |
F-46
The following table provides information regarding change in amounts from June 30, 2017 in accumulated other comprehensive loss (“AOCI”) that have not yet been recognized as components of net periodic benefit cost at June 30, 2018:
|
|
|
As of June 30, 2017 |
|
Recognition of Net Periodic Benefits Expense |
|
Deferrals |
|
Net Change in AOCI |
|
As of June 30, 2018 |
|||||
|
|
|
(in millions) |
|||||||||||||
|
Accumulated other comprehensive loss: |
|
|
|
|
|
|
|
|
|
|
|
|
|
|
|
|
Pension plans: |
|
|
|
|
|
|
|
|
|
|
|
|
|
|
|
|
Net actuarial (loss)/gain |
|
$ |
— |
|
$ |
— |
|
$ |
(11.2) |
|
$ |
(11.2) |
|
$ |
(11.2) |
|
Prior service benefit/(cost) |
|
|
— |
|
|
0.4 |
|
|
(7.8) |
|
|
(7.4) |
|
|
(7.4) |
|
Deferred income tax benefit/(expense) |
|
|
— |
|
|
(0.1) |
|
|
5.6 |
|
|
5.5 |
|
|
5.5 |
|
Total pension plans |
|
|
— |
|
|
0.3 |
|
|
(13.4) |
|
|
(13.1) |
|
|
(13.1) |
|
|
|
|
|
|
|
|
|
|
|
|
|
|
|
|
|
|
OPEB plans: |
|
|
|
|
|
|
|
|
|
|
|
|
|
|
|
|
Net actuarial (loss)/gain |
|
|
(1.2) |
|
|
— |
|
|
(0.4) |
|
|
(0.4) |
|
|
(1.6) |
|
Prior service (cost)/benefit |
|
|
— |
|
|
— |
|
|
— |
|
|
— |
|
|
— |
|
Deferred income tax benefit/(expense) |
|
|
0.4 |
|
|
— |
|
|
— |
|
|
— |
|
|
0.4 |
|
Total OPEB plans |
|
|
(0.8) |
|
|
— |
|
|
(0.4) |
|
|
(0.4) |
|
|
(1.2) |
|
Total accumulated other comprehensive loss |
|
$ |
(0.8) |
|
$ |
0.3 |
|
$ |
(13.8) |
|
$ |
(13.5) |
|
$ |
(14.3) |
There have been no material amounts reclassified from AOCI during the period.
The following table presents the expected amortization amounts during next fiscal year for the defined benefit pension plans:
|
|
|
Pension Plans |
|
|
|
|
(in millions) |
|
|
Amortization of net prior service cost/(benefit) |
|
$ |
0.7 |
|
Total expected amortization amounts during fiscal year 2019 |
|
$ |
0.7 |
The expected benefit payments for the Company’s defined benefit pension and OPEB plans for the years indicated are as follows:
|
|
|
Pension Plans |
|
OPEB Plans |
||
|
|
|
(in millions) |
||||
|
Year ended June 30, |
|
|
|
|
|
|
|
2019 |
|
$ |
2.2 |
|
$ |
0.5 |
|
2020 |
|
|
2.4 |
|
|
0.5 |
|
2021 |
|
|
2.7 |
|
|
0.5 |
|
2022 |
|
|
2.9 |
|
|
0.5 |
|
2023 |
|
|
3.1 |
|
|
0.5 |
|
2024-2028 |
|
|
19.0 |
|
|
2.3 |
F-47
The following table presents the expected contributions during next fiscal year for the defined benefit pension and OPEB plans:
|
|
|
Pension Plans |
|
OPEB Plans |
||
|
|
|
(in millions) |
||||
|
Employer |
|
$ |
2.9 |
|
$ |
0.5 |
|
Plan participants |
|
|
0.5 |
|
|
— |
|
Total expected contributions during fiscal year 2019 |
|
$ |
3.4 |
|
$ |
0.5 |
Net periodic (benefit) cost of the defined benefit pension and OPEB is included in selling, general and administrative expenses in the accompanying condensed consolidated statements of operations includes the following components:
|
|
|
|
|
|
|
|
Pension Plans |
|
|
|
|
Year ended June 30, 2018 |
|
|
|
|
( in millions) |
|
|
Service cost |
|
$ |
2.7 |
|
Interest cost |
|
|
2.5 |
|
Expected return on plan assets |
|
|
(3.8) |
|
Amortization of service cost from earlier periods |
|
|
0.4 |
|
Cost of settlements |
|
|
0.2 |
|
Net periodic pension benefit cost |
|
$ |
2.0 |
|
|
|
OPEB Plans |
|
|
|
|
Year ended June 30, 2018 |
|
|
|
|
(in millions) |
|
|
Service cost |
|
$ |
0.1 |
|
Interest cost |
|
|
0.3 |
|
Net periodic pension benefit cost |
|
$ |
0.4 |
The following tables present the assumptions used in determining benefit obligations of the defined benefit pension and OPEB plans:
|
|
|
Pension Plans |
|
OPEB Plans |
||
|
Actuarial assumptions: |
|
|
|
|
|
|
|
Discount rate |
|
|
3.25% |
|
|
3.25% |
|
Price inflation |
|
|
1.75% |
|
|
N/A |
|
Expected long-term rate of return on plan assets |
|
|
5.7% |
|
|
N/A |
|
Rate of compensation increase |
|
|
2.5% |
|
|
N/A |
The discount rates utilized reflect the average yield on high quality corporate bonds of similar duration to the plans’ liabilities. The discount rate used to calculate the employee future benefits obligation is determined at each year end by referring to the most recently available market interest rates based on “AA”-rated corporate bond yields reflecting the duration of the employee future benefit plans. Under the yield curve approach, expected future benefit payments for each plan are discounted by a rate on a third-party bond yield curve corresponding to each duration. The yield curve is based on “AA” long-term corporate bonds. A single discount rate is calculated that would yield the same present value as the sum of the discounted cash flows.
F-48
The expected return on assets assumption for the plans is determined as the estimate of future experience for trust asset returns, reflecting the plans’ current asset allocation and any expected changes during the current plan year, current market conditions and expectations for future market conditions.
The investment objective of the defined benefit pension plans is to provide a risk-adjusted return that will ensure the payment of benefits while protecting against the risk of substantial investment losses. Correlations among the asset classes are used to identify an asset mix that the Company believes will provide the most attractive returns. Long-term return forecasts for each asset class using historical data and other qualitative considerations to adjust for projected economic forecasts are used to set the expected rate of return for the entire portfolio.
The defined benefit pension plan utilizes various investment securities. Generally, investment securities are exposed to various risks, such as interest rate risks, credit risk, and overall market volatility. Due to the level of risk associated with certain investment securities, it is reasonably possible that changes in the values of investment securities will occur and that such changes could materially affect the amounts reported.
The following table presents the Company’s target for the allocation of invested defined benefit pension plan assets at June 30, 2018:
|
|
|
As of June 30, 2018 |
|
|
Fixed income |
|
|
40% |
|
Equities |
|
|
55% |
|
Other |
|
|
5% |
|
Total |
|
|
100% |
The plans assets are invested in various fund categories utilizing multiple strategies and investment managers. Interests in funds are valued using the net asset value ("NAV") per unit of each fund. The NAV reported by the fund manager is based on the market value of the underlying investments owned by each fund, minus its liabilities, divided by the number of shares outstanding. These funds can be redeemed at NAV, generally at any time. As the funds do not publish publicly available prices, the NAV practical expedient is the most appropriate fair value classification for the plan asset investments. The value associated with these investments is disclosed in the reconciliation of the total investments measured at fair value shown below.
The table below presents the fair value of plan assets valued at NAV by category for the pension and OPEB plans at June 30, 2018.
|
|
|
As of June 30, 2018 |
|
|
|
|
(in millions) |
|
|
Fixed income |
|
$ |
33.1 |
|
Equities |
|
|
55.2 |
|
Other |
|
|
5.2 |
|
Total |
|
$ |
93.5 |
Fixed income – Fixed income represents investments in commingled bond funds comprised of Canadian government, corporate bonds, and mortgage-backed securities.
Equities – Equities represent investments in commingled equities funds comprised of investments in U.S., Canadian and global equities.
Other – Other investments are comprised of investments in commingled real estate funds.
F-49
(13) FAIR VALUE MEASUREMENTS
The Company’s financial instruments consist of cash and cash equivalents, restricted cash, trade receivables, accounts payable, long-term debt, certain post-employment plans and stock-based compensation liability. The carrying values of cash and cash equivalents, restricted cash, trade receivables, and accounts payable approximated their fair values at June 30, 2018 and 2017, due to the short maturity of these instruments.
The carrying value of the Company’s Notes, excluding debt issuance costs, reflects the original amounts borrowed, inclusive of net unamortized premium, and was $4,003.4 million and $3,692.8 million as of June 30, 2018 and 2017, respectively. Based on market interest rates for debt of similar terms and average maturities, the fair value of the Company's Notes as of June 30, 2018 and 2017 was estimated to be $3,986.5 million and $3,895.7 million, respectively. The Company’s fair value estimates associated with its Note obligations were derived utilizing Level 2 inputs – quoted prices for similar instruments in active markets.
The carrying value of the Company’s Term Loan Facility, excluding debt issuance costs, reflects the original amounts borrowed, inclusive of unamortized discounts, and was $1,751.3 million and $1,912.7 million as of June 30, 2018 and 2017, respectively. The Company’s Term Loan Facility accrues interest at variable rates based upon the one-month, three-month or nine-month LIBOR plus i) a spread of 2.0% on the Company’s $500.0 million tranche (which has a LIBOR floor of 0.0%) and ii) a spread of 2.25% on its B-2 Term Loan tranche (which has a LIBOR floor of 1.00%). Based on market interest rates for debt of similar terms and average maturities, the fair value of the Company’s Term Loan Facility as of June 30, 2018 and June 30, 2017 was estimated to be $1,772.3 million and $1,930.5 million, respectively. The Company’s fair value estimates associated with its Term Loan Facility obligations were derived utilizing Level 2 inputs—quoted prices for similar instruments in active markets. A hypothetical increase in the applicable interest rate on the Company’s Term Loan Facility of one percentage point above the 1.0% LIBOR floor would increase the Company’s annual interest expense by approximately $17.6 million.
As of June 30, 2018 and 2017, there was no balance outstanding under the Company's Revolver.
(14) COMMITMENTS AND CONTINGENCIES
Capital Leases
Future contractual payments under the terms of the Company’s capital lease obligations were as follows:
|
Year Ended June 30, |
|
|
|
|
|
|
(in millions) |
|
|
2019 |
|
$ |
15.4 |
|
2020 |
|
|
14.5 |
|
2021 |
|
|
14.5 |
|
2022 |
|
|
14.6 |
|
2023 |
|
|
14.7 |
|
Thereafter |
|
|
130.3 |
|
Total minimum lease payments |
|
|
204.0 |
|
Less amounts representing interest |
|
|
(70.5) |
|
Less current portion |
|
|
(11.9) |
|
Capital lease obligations, non-current |
|
$ |
121.6 |
Operating Leases
The Company leases office space, warehouse space, network assets, switching and transport sites, points of presence, components and equipment under non-cancelable operating leases. Lease expense was $156.4 million, $68.8 million and $53.1 million for the years ended June 30, 2018, 2017 and 2016, respectively. Additionally, the Company
F-50
recognized expense related to right-of way, pole attachment and other fees for access of $43.4 million, $65.1 million, and $48.9 million for the years ended June 30, 2018, 2017 and 2016, respectively.
For scheduled rent escalation clauses during the lease terms or for rental payments commencing at a date other than the date of initial occupancy, the Company records minimum rental expenses on a straight-line basis over the terms of the leases. When the straight-line expense recorded exceeds the cash outflows during the respective period, the Company records a deferred lease obligation on the consolidated balance sheets and amortizes the deferred rent over the terms of the respective leases.
Minimum contractual lease payments due under the Company’s long-term operating leases are as follows:
|
Year Ended June 30, |
|
|
|
|
|
|
(in millions) |
|
|
2019 |
|
$ |
93.7 |
|
2020 |
|
|
82.4 |
|
2021 |
|
|
66.7 |
|
2022 |
|
|
43.6 |
|
2023 |
|
|
33.0 |
|
Thereafter |
|
|
114.7 |
|
|
|
$ |
434.1 |
Obligations for Capital Expenditure
At June 30, 2018, the Company was contractually committed for $509.4 million of capital expenditures for construction materials and purchases of property and equipment. A majority of these obligations are expected to be satisfied in the next twelve months. These obligations are primarily success based; that is, the Company has executed customer contracts that support the future capital expenditures.
Outstanding Letters of Credit
As of June 30, 2018, the Company had $8.1 million in outstanding letters of credit, which were primarily entered into in connection with various lease agreements. Additionally, as of June 30, 2018, Zayo Canada, Inc., a subsidiary of the Company, had CAD $3.4 million (or $2.6 million) in letters of credit, under a CAD $5.0 million (or $3.8 million) unsecured credit agreement.
Contingencies
In the normal course of business, the Company is party to various outstanding legal proceedings, asserted and unasserted claims, and disputes. In the opinion of management, the ultimate disposition of these matters, both asserted and unasserted, will not have a material adverse effect on the Company’s financial condition, results of operations, or cash flows.
(15) RELATED-PARTY TRANSACTIONS
In May 2016, CII sold Onvoy, LLC and its subsidiaries (“OVS”), a company that provided voice and managed offerings that the Company spun off during the year ended June 30, 2014, to an entity that had a material ownership interest in the Company during Fiscal 2018 and which shares a board member with the Company. The Company continues to have ongoing contractual relationships with Inteliquent, Inc., successor by merger to OVS (“Inteliquent”), whereby the Company provides Inteliquent and its subsidiaries with bandwidth access and Inteliquent provides the Company and its subsidiaries with voice offerings. The contractual relationships are based on agreements that were entered into at estimated market rates.
F-51
The following table represents the revenue and expense transactions the Company recorded with Inteliquent for the periods presented:
|
|
|
Year Ended June 30, |
|||||||
|
|
|
2018 |
|
2017 |
|
2016 |
|||
|
|
|
(in millions) |
|||||||
|
Revenues |
|
$ |
7.4 |
|
$ |
7.5 |
|
$ |
6.6 |
|
Operating costs |
|
$ |
2.7 |
|
$ |
2.0 |
|
$ |
2.1 |
As of June 30, 2018 and June 30, 2017, the Company had $0.4 million and $0.5 million, respectively, due from Inteliquent.
Dan Caruso, the Company’s Chief Executive Officer and Chairman of the Board is a party to an aircraft charter (or membership) agreement through his affiliate, Bear Equity LLC, for business and personal travel. Under the terms of the charter agreement, all fees for the use of the aircraft are effectively variable in nature. For his business travel on behalf of the Company, Mr. Caruso is reimbursed for his use of the aircraft subject to an annual maximum reimbursement threshold approved by the Company's Nominating and Governance Committee. During the years ended June 30, 2018, 2017 and 2016, respectively, the Company reimbursed Mr. Caruso $0.7 million, $0.8 million and $0.5 million for his business use of the aircraft.
(16) SEGMENT REPORTING
The Company uses the management approach to determine the segment financial information that should be disaggregated and presented separately in the Company's notes to its consolidated financial statements. The management approach is based on the manner by which management has organized the segments within the Company for making operating decisions, allocating resources, and assessing performance.
As the Company has increased in scope and scale, it has developed its management and reporting structure to support this growth. The Company’s bandwidth infrastructure, colocation and connectivity offerings are comprised of various related product groups generally defined around the type of offering to which the customer is licensing access, referred to as SPGs. Each SPG is responsible for the revenue, costs and associated capital expenditures of its respective solutions. The SPGs enable licensing and sales, make pricing and product decisions, engineer networks and deliver solutions to customers, and support customers for specific telecom and Internet infrastructure requirements.
During fiscal 2018, with the continued increase in our scope and scale, the Company’s chief operating decision maker ("CODM"), who is the Company’s Chief Executive Officer, implemented certain organizational changes to the management and operation of the business that directly impact how the CODM makes resource allocation decisions and manages the Company. The changes in structure had the impact of creating two new SPGs and re-aligning an existing SPG among the Company’s reportable segments. The changes in structure also resulted in changes in how the Company measures the relative burden each segment bears of indirect and corporate related costs.
Effective April 1, 2018 the Company’s Ethernet SPG, previously reported under our Enterprise Networks segment, is now reported under the Company’s Transport segment. Additionally, certain activities and operations of the legacy Waves, WAN, and Ethernet SPGs were combined to form a new SPG, CloudLink. These changes to the existing reportable segments (the “Realignment”) have been recast for all prior period financial and operating metrics presented in this Annual Report for comparability, such as;
|
· |
Certain activities and operations of the legacy Waves, WAN, and Ethernet SPGs, after giving effect to the Realignment, are now reported in a new SPG, CloudLink, under the Enterprise Networks segment; and |
F-52
|
· |
The wholesale IP services and Sonet SPGs, and the remaining activities and operations of the legacy Waves and Ethernet SPGs (the activities and operations not related to CloudLink), after giving effect to the Realignment, are now reported under the Transport segment. |
In addition to the changes in structure, the Company also adjusted intercompany pricing methodologies to more closely align to third party pricing on the products and offerings which are exchanged between our SPGs. However, it was not practicable to retrospectively present the impact of this change for all historical periods presented.
The Company’s segments are further described below:
Fiber Solutions. The Fiber Solutions segment offers access to raw bandwidth infrastructure to customers that require control of their internal networks. These solutions include dark fiber, dedicated lit network sections and mobile infrastructure (fiber-to-the-tower and small cell). Dark fiber is a physically separate and secure, private platform for dedicated bandwidth. The Company leases dark fiber pairs (usually 2 to 12 total fibers) to customers, who “light” the fiber using their own optronics. The Company’s mobile infrastructure solutions permit direct fiber connections to cell towers, small cells, hub sites, and mobile switching centers. Fiber Solutions customers include carriers and other communication service providers, Internet service providers, wireless service providers, major media and content companies, large enterprises, and other companies that have the expertise to run their own fiber optic networks or require interconnected technical space. The contract terms in the Fiber Solutions segment tend to range from three to twenty years.
Transport. The Transport segment provides access to lit bandwidth infrastructure solutions over metro, regional, and long-haul fiber network sections. The segment uses customer-accessed optronics to light the fiber, and our customers pay for access based on the amount and type of bandwidth they require. The activities within this segment include Wavelengths, Ethernet, SONET, and wholesale IP offerings. The Company targets customers who require a minimum of 10G of bandwidth across their networks. Transport customers include carriers, content providers, financial services companies, healthcare, government entities, education institutions and other medium and large enterprises. The contract terms in this segment tend to range from two to five years.
Enterprise Networks. The Enterprise Networks segment provides connectivity and telecommunications solutions to medium and large enterprises. The activities within this segment include Internet, wide area networking products, managed products and cloud based computing and storage offerings. Solutions range from point-to-point data connections to multi-site managed networks to international outsourced IT infrastructure environments. The contract terms in the Enterprise Networks segment tend to range from one to ten years.
Zayo Colocation (“zColo”). The Colocation segment provides data center infrastructure solutions to a broad range of enterprise, carrier, cloud, and content customers. The activities within this segment include the provision of colocation space, power and interconnection offerings in North America and Western Europe. Solutions range in size from single cabinet solutions to 1MW+ data center infrastructure environments. The Company’s data centers also support a large component of networking components for the purpose of aggregating and accommodating customers’ data, voice, Internet, and video traffic. The contract terms in this segment tend to range from two to five years.
Allstream. The Allstream segment provides Cloud VoIP and Data Solutions. This includes a full range of local voice offerings allowing business customers to complete telephone calls in their local exchange, as well as make long distance, toll-free and related calls. Unified Communications is the integration of real-time communication services such as telephony (including Cloud-based IP telephony), instant messaging and video conferencing with non-real-time communication services, such as integrated voicemail and e-mail. Allstream also provides customers with comprehensive telecommunications services including Ethernet, and IP/MPLS VPN Solutions.
F-53
Other. The Other segment is primarily comprised of Zayo Professional Services (“ZPS”). ZPS provides network and technical resources to customers who wish to leverage the Company’s expertise in designing, acquiring and maintaining a network. The contract terms typically run for one year for a fixed recurring monthly fee in the case of network and on an hourly basis for technical resources (usage revenue). ZPS also generates revenue via telecommunication equipment sales.
The results of operations for each segment include an allocation of certain indirect costs and corporate related costs, including overhead and third party-financed debt. The allocation is based on a percentage that represents management’s estimate of the relative burden each segment bears of indirect and corporate costs. Management has evaluated the allocation methods utilized to allocate these costs and determined they are systematic, rational and consistently applied. Identifiable assets for each reportable segment are reconciled to total consolidated assets including unallocated corporate assets and intersegment eliminations. Unallocated corporate assets consist primarily of cash and deferred taxes.
In connection with the Company’s acquisition of Electric Lightwave the Company acquired certain customer contracts that included the bundled provision of VoIP and data connectivity services. This bundled package was historically managed and reported as revenue by the Enterprise Networks segment. Subsequent to June 30, 2018, operational changes were made which resulted in the management of these bundled contract to be provided by the Allstream segment and as such the revenue associated with these contracts will now be reported as revenue of the Allstream segment. The Enterprise Networks segment continues to own the infrastructure and equipment that supports these contracts and as such the segments entered into an intercompany agreement for the continued use of these assets which will result in the recognition of intercompany expense and revenue at the Allstream and Enterprise Networks segments, respectively. This intercompany charge will be eliminated in the consolidated revenue and Adjusted EBITDA amounts to be disclosed in the “corporate and eliminations column”. Starting with the quarter ending September 30, 2018, the Company will recast it’s prior period financial and operating metrics presented in previous filings to reflect the financial results of the Company’s segments as if these bundled contracts were managed by Allstream and the related intercompany agreement was in place effective with the March 1, 2017 acquisition of Electric Lightwave. The change will not have an impact on consolidated revenues or EBITDA.
Segment Adjusted EBITDA
Segment Adjusted EBITDA is the primary measure used by the Company’s CODM to evaluate segment operating performance.
The Company defines Segment Adjusted EBITDA as earnings/(loss) from operations before interest, income taxes, depreciation and amortization (“EBITDA”) adjusted to exclude acquisition or disposal-related transaction costs, losses on extinguishment of debt, stock-based compensation, unrealized foreign currency gains/(losses) on intercompany loans, and non-cash income/(loss) on equity and cost method investments. The Company uses Segment Adjusted EBITDA to evaluate operating performance, and this financial measure is among the primary measures used by management for planning and forecasting of future periods. The Company believes that the presentation of Segment Adjusted EBITDA is relevant and useful for investors because it allows investors to view results in a manner similar to the method used by management and facilitates comparison of the Company’s results with the results of other companies that have different financing and capital structures.
Segment Adjusted EBITDA results, along with other quantitative and qualitative information, are also utilized by the Company and its Compensation Committee for purposes of determining bonus payouts to employees.
F-54
Segment Adjusted EBITDA has limitations as an analytical tool and should not be considered in isolation from, or as a substitute for, analysis of the Company’s results from operations and operating cash flows as reported under GAAP. For example, Segment Adjusted EBITDA:
|
· |
does not reflect capital expenditures, or future requirements for capital and major maintenance expenditures or contractual commitments; |
|
· |
does not reflect changes in, or cash requirements for, working capital needs; |
|
· |
does not reflect the significant interest expense, or the cash requirements necessary to service the interest payments, on the Company’s debt; and |
|
· |
does not reflect cash required to pay income taxes. |
The Company’s computation of Segment Adjusted EBITDA may not be comparable to other similarly titled measures computed by other companies because all companies do not calculate segment Adjusted EBITDA in the same fashion.
|
|
|
For the year ended June 30, 2018 |
||||||||||||||||||||||
|
|
|
Fiber |
|
Transport |
|
Enterprise Networks |
|
zColo |
|
|
Allstream |
|
Other |
|
Corp/ |
|
Total |
|||||||
|
|
|
(in millions) |
||||||||||||||||||||||
|
Revenue from external customers |
|
$ |
842.0 |
|
$ |
670.4 |
|
$ |
350.4 |
|
$ |
238.2 |
|
$ |
479.9 |
|
$ |
23.1 |
|
$ |
— |
|
$ |
2,604.0 |
|
Segment Adjusted EBITDA |
|
|
673.2 |
|
|
230.3 |
|
|
148.2 |
|
|
120.3 |
|
|
114.0 |
|
|
5.0 |
|
|
— |
|
|
1,291.0 |
|
Total assets |
|
|
4,956.9 |
|
|
1,864.6 |
|
|
752.0 |
|
|
1,032.4 |
|
|
461.8 |
|
|
33.3 |
|
|
115.8 |
|
|
9,216.8 |
|
Capital expenditures |
|
|
443.3 |
|
|
183.1 |
|
|
50.0 |
|
|
99.9 |
|
|
13.6 |
|
|
— |
|
|
— |
|
|
789.9 |
|
|
|
For the year ended June 30, 2017 |
||||||||||||||||||||||
|
|
|
Fiber |
|
Transport |
|
Enterprise Networks |
|
zColo |
|
|
Allstream |
|
Other |
|
Corp/ |
|
Total |
|||||||
|
|
|
(in millions) |
||||||||||||||||||||||
|
Revenue from external customers |
|
$ |
725.4 |
|
$ |
614.3 |
|
$ |
310.2 |
|
$ |
214.0 |
|
$ |
314.3 |
|
$ |
21.6 |
|
$ |
— |
|
$ |
2,199.8 |
|
Segment Adjusted EBITDA |
|
|
570.4 |
|
|
223.0 |
|
|
127.9 |
|
|
107.1 |
|
|
83.3 |
|
|
5.1 |
|
|
— |
|
|
1,116.8 |
|
Total assets |
|
|
4,504.6 |
|
|
2,018.3 |
|
|
597.4 |
|
|
994.4 |
|
|
406.2 |
|
|
33.2 |
|
|
185.3 |
|
|
8,739.4 |
|
Capital expenditures |
|
|
499.1 |
|
|
189.6 |
|
|
46.8 |
|
|
91.5 |
|
|
8.5 |
|
|
— |
|
|
— |
|
|
835.5 |
|
|
|
For the year ended June 30, 2016 |
||||||||||||||||||||||
|
|
|
Fiber |
|
Transport |
|
Enterprise Networks |
|
zColo |
|
|
Allstream |
|
Other |
|
Corp/ |
|
Total |
|||||||
|
|
|
(in millions) |
||||||||||||||||||||||
|
Revenue from external customers |
|
$ |
648.8 |
|
$ |
522.6 |
|
$ |
228.4 |
|
$ |
195.4 |
|
$ |
106.2 |
|
$ |
20.3 |
|
$ |
— |
|
$ |
1,721.7 |
|
Segment Adjusted EBITDA |
|
|
504.0 |
|
|
208.4 |
|
|
100.6 |
|
|
99.5 |
|
|
17.9 |
|
|
4.5 |
|
|
— |
|
|
934.9 |
|
Capital expenditures |
|
|
421.4 |
|
|
160.6 |
|
|
50.5 |
|
|
66.3 |
|
|
5.3 |
|
|
— |
|
|
— |
|
|
704.1 |
F-55
As discussed above, it was not practicable to retrospectively present the impact of intercompany pricing changes for all historical periods presented. Management estimates the intercompany pricing changes had the following impacts to Segment Adjusted EBITDA during the three months ended June 30, 2018.
|
|
|
For the three months ended June 30, 2018 |
|
||||||||||||||||||||||
|
|
|
Fiber |
|
Transport |
|
Enterprise Networks |
|
zColo |
|
|
Allstream |
|
Other |
|
Corp/ |
|
Total |
||||||||
|
|
|
(in millions) |
|
||||||||||||||||||||||
|
Impact of pricing changes |
|
$ |
— |
|
$ |
(1.8) |
|
$ |
2.7 |
|
$ |
0.1 |
|
$ |
(1.0) |
|
$ |
— |
|
$ |
— |
|
$ |
— |
|
Reconciliation from Total Segment Adjusted EBITDA to income/(loss) from operations before income taxes
|
|
|
For the year ended June 30, |
|||||||
|
|
|
2018 |
|
2017 |
|
2016 |
|||
|
|
|
|
|
|
|
|
|||
|
Total Segment Adjusted EBITDA |
|
$ |
1,291.0 |
|
$ |
1,116.8 |
|
$ |
934.9 |
|
Interest expense |
|
|
(299.8) |
|
|
(241.5) |
|
|
(220.1) |
|
Depreciation and amortization |
|
|
(747.4) |
|
|
(606.9) |
|
|
(516.3) |
|
Transaction costs |
|
|
(18.6) |
|
|
(20.5) |
|
|
(21.5) |
|
Stock-based compensation |
|
|
(96.7) |
|
|
(114.1) |
|
|
(155.9) |
|
Loss on extinguishment of debt |
|
|
(4.9) |
|
|
(18.2) |
|
|
(33.8) |
|
Foreign currency gain/(loss) on intercompany loans |
|
|
5.4 |
|
|
(10.3) |
|
|
(53.8) |
|
Non-cash loss on investments |
|
|
(1.0) |
|
|
(1.2) |
|
|
(1.2) |
|
Income/(loss) from operations before income taxes |
|
$ |
128.0 |
|
$ |
104.1 |
|
$ |
(67.7) |
The following is a summary of geographical information:
|
|
|
For the year ended June 30, |
|||||||
|
|
|
2018 |
|
2017 |
|
2016 |
|||
|
Revenue from external customers: |
|
|
|
|
|
|
|
|
|
|
United States |
|
$ |
2,017.4 |
|
$ |
1,610.0 |
|
$ |
1,334.1 |
|
Europe |
|
|
199.4 |
|
|
176.5 |
|
|
174.1 |
|
Canada |
|
|
384.2 |
|
|
412.0 |
|
|
213.3 |
|
Other |
|
|
3.0 |
|
|
1.3 |
|
|
0.2 |
|
Total Revenue |
|
$ |
2,604.0 |
|
$ |
2,199.8 |
|
$ |
1,721.7 |
|
Long-lived assets: |
|
|
|
|
|
|
|
|
|
|
United States |
|
$ |
5,929.5 |
|
$ |
5,504.7 |
|
$ |
4,236.1 |
|
Europe |
|
|
537.2 |
|
|
521.3 |
|
|
527.8 |
|
Canada |
|
|
381.7 |
|
|
335.8 |
|
|
326.4 |
|
Other |
|
|
18.5 |
|
|
22.8 |
|
|
25.6 |
|
Total Long-lived assets |
|
$ |
6,866.9 |
|
$ |
6,384.6 |
|
$ |
5,115.9 |
The Company includes all non-current assets, except for goodwill and assets of discontinued operations or assets held for sale, in its long-lived assets.
F-56
(17) QUARTERLY FINANCIAL DATA (UNAUDITED)
The following table presents the unaudited quarterly results for the year ended June 30, 2018:
|
|
|
2018 Quarter Ended |
|||||||||||||
|
|
|
September 30 |
|
December 31(1) |
|
March 31(2) |
|
June 30(3) |
|
Total |
|||||
|
|
|
(in millions) |
|||||||||||||
|
Revenue |
|
$ |
643.5 |
|
$ |
653.5 |
|
$ |
649.4 |
|
$ |
657.6 |
|
$ |
2,604.0 |
|
Operating costs and expenses |
|
|
|
|
|
|
|
|
|
|
|
|
|
|
|
|
Operating costs (excluding depreciation and amortization and including stock-based compensation) |
|
|
235.7 |
|
|
232.0 |
|
|
234.9 |
|
|
239.3 |
|
|
941.9 |
|
Selling, general and administrative expenses (including stock-based compensation) |
|
|
128.3 |
|
|
121.6 |
|
|
118.0 |
|
|
121.9 |
|
|
489.8 |
|
Depreciation and amortization |
|
|
184.1 |
|
|
195.9 |
|
|
191.2 |
|
|
176.2 |
|
|
747.4 |
|
Total operating costs and expenses |
|
|
548.1 |
|
|
549.5 |
|
|
544.1 |
|
|
537.4 |
|
|
2,179.1 |
|
Operating income |
|
|
95.4 |
|
|
104.0 |
|
|
105.3 |
|
|
120.2 |
|
|
424.9 |
|
Other expenses |
|
|
|
|
|
|
|
|
|
|
|
|
|
|
|
|
Interest expense |
|
|
(73.6) |
|
|
(73.1) |
|
|
(75.3) |
|
|
(77.8) |
|
|
(299.8) |
|
Loss on extinguishment of debt |
|
|
(4.9) |
|
|
— |
|
|
— |
|
|
— |
|
|
(4.9) |
|
Foreign currency gain/(loss) on intercompany loans |
|
|
10.8 |
|
|
3.1 |
|
|
13.9 |
|
|
(22.4) |
|
|
5.4 |
|
Other income, net |
|
|
0.9 |
|
|
0.4 |
|
|
0.4 |
|
|
0.7 |
|
|
2.4 |
|
Total other expenses, net |
|
|
(66.8) |
|
|
(69.6) |
|
|
(61.0) |
|
|
(99.5) |
|
|
(296.9) |
|
Income from operations before income taxes |
|
|
28.6 |
|
|
34.4 |
|
|
44.3 |
|
|
20.7 |
|
|
128.0 |
|
Provision for income taxes |
|
|
5.4 |
|
|
22.9 |
|
|
20.9 |
|
|
(23.1) |
|
|
26.1 |
|
Net income |
|
$ |
23.2 |
|
$ |
11.5 |
|
$ |
23.4 |
|
$ |
43.8 |
|
$ |
101.9 |
|
|
|
|
|
|
|
|
|
|
|
|
|
|
|
|
|
|
Net income per share(4): |
|
|
|
|
|
|
|
|
|
|
|
|
|
|
|
|
Basic and diluted |
|
$ |
0.09 |
|
$ |
0.05 |
|
$ |
0.09 |
|
$ |
0.18 |
|
$ |
0.41 |
|
|
|
|
|
|
|
|
|
|
|
|
|
|
|
|
|
|
(1) |
The Company recorded a provisional tax expense in the quarter ending December 31, 2017 of $44.1 million to record the impact of U.S. Tax Reform. |
|
(2) |
The Company recorded a provisional tax expense in the quarter ending March 31, 2018 of $4.6 million to record the impact of U.S. Tax Reform. |
|
(3) |
The Company recorded a provisional tax benefit in the quarter ending June 30, 2018 of $(23.9) million to record the impact of U.S. Tax Reform |
|
(4) |
The total earnings per share for the quarters may not equal earnings per share for the respective years because the per share amounts for each quarter and for each year are computed based on their respective discrete periods. |
F-57
The following table presents the unaudited quarterly results for the year ended June 30, 2017:
|
|
|
2017 Quarter Ended |
|||||||||||||
|
|
|
September 30 |
|
December 31 |
|
March 31 (1) (2) |
|
June 30 (2) |
|
Total |
|||||
|
|
|
(in millions) |
|||||||||||||
|
Revenue |
|
$ |
504.9 |
|
$ |
506.7 |
|
$ |
550.2 |
|
$ |
638.0 |
|
$ |
2,199.8 |
|
Operating costs and expenses |
|
|
|
|
|
|
|
|
|
|
|
|
|
|
|
|
Operating costs (excluding depreciation and amortization and including stock-based compensation) |
|
|
173.8 |
|
|
179.9 |
|
|
195.0 |
|
|
234.2 |
|
|
782.9 |
|
Selling, general and administrative expenses (including stock-based compensation) |
|
|
105.6 |
|
|
104.7 |
|
|
108.8 |
|
|
117.1 |
|
|
436.2 |
|
Depreciation and amortization |
|
|
138.5 |
|
|
131.4 |
|
|
155.7 |
|
|
181.3 |
|
|
606.9 |
|
Total operating costs and expenses |
|
|
417.9 |
|
|
416.0 |
|
|
459.5 |
|
|
532.6 |
|
|
1,826.0 |
|
Operating income |
|
|
87.0 |
|
|
90.7 |
|
|
90.7 |
|
|
105.4 |
|
|
373.8 |
|
Other expenses |
|
|
|
|
|
|
|
|
|
|
|
|
|
|
|
|
Interest expense |
|
|
(53.3) |
|
|
(53.7) |
|
|
(63.0) |
|
|
(71.5) |
|
|
(241.5) |
|
Loss on extinguishment of debt |
|
|
— |
|
|
— |
|
|
(4.5) |
|
|
(13.7) |
|
|
(18.2) |
|
Foreign currency gain/(loss) on intercompany loans |
|
|
(11.2) |
|
|
(17.4) |
|
|
3.9 |
|
|
14.4 |
|
|
(10.3) |
|
Other (expense)/income, net |
|
|
(0.2) |
|
|
0.4 |
|
|
0.5 |
|
|
(0.4) |
|
|
0.3 |
|
Total other expenses, net |
|
|
(64.7) |
|
|
(70.7) |
|
|
(63.1) |
|
|
(71.2) |
|
|
(269.7) |
|
Income from operations before income taxes |
|
|
22.3 |
|
|
20.0 |
|
|
27.6 |
|
|
34.2 |
|
|
104.1 |
|
Provision for income taxes |
|
|
6.6 |
|
|
0.2 |
|
|
0.6 |
|
|
11.0 |
|
|
18.4 |
|
Net income |
|
$ |
15.7 |
|
$ |
19.8 |
|
$ |
27.0 |
|
$ |
23.2 |
|
$ |
85.7 |
|
|
|
|
|
|
|
|
|
|
|
|
|
|
|
|
|
|
Net income per share(3): |
|
|
|
|
|
|
|
|
|
|
|
|
|
|
|
|
Basic and diluted |
|
$ |
0.06 |
|
$ |
0.08 |
|
$ |
0.11 |
|
$ |
0.09 |
|
$ |
0.35 |
|
|
|
|
|
|
|
|
|
|
|
|
|
|
|
|
|
|
(1) |
The Company realized an increase in revenue and operating expenses beginning March 1, 2017 as a result of the acquisition of Electric Lightwave. |
|
(2) |
The Company recognized a loss on debt extinguishment associated with the write-off of unamortized debt issuance costs in the third and fourth quarters. See Note 7 – Long Term Debt. |
|
(3) |
The total earnings per share for the quarters may not equal earnings per share for the respective years because the per share amounts for each quarter and for each year are computed based on their respective discrete periods. |
F-58
(18) SUBSEQUENT EVENTS
Scott-Rice Telephone
On July 31, 2018, the Company closed the sale of SRT for $42 million to Nuvera. SRT had a net loss before taxes of $1.6 million for the year ended June 30, 2018. Due to the timing of the transaction, the initial accounting for the sale, including the measurement of the Company’s gain or loss, has not yet been determined.
Potential REIT Conversion
On May 3, 2018, the Company announced that it completed the first phase of its investigation on the advisability and feasibility of a conversion to a real estate investment trust for U.S. federal income tax purposes (a “REIT”). The Company has begun the next phase of its evaluation and preparation for a potential conversion to a REIT. As part of these efforts, the Company has begun a direct dialogue with the U.S. Internal Revenue Service (“IRS”) in an effort to obtain clarity and support for its position, and is seeking a private letter ruling (“PLR”) from the IRS. The Company’s ability to qualify for taxation as a REIT will depend upon its continuing compliance following REIT conversion with various requirements, including requirements related to the nature of its assets, the sources of its income and the distributions to its stockholders.
The Company is requesting that its PLR address whether its revenues from dark and lit fiber satisfy applicable REIT income tests, and the Company’s ultimate decision to convert to a REIT may depend upon a favorable ruling from the IRS on this topic. The Company submitted a PLR request to the IRS in July 2018, but the IRS may not provide a response until 2019 or later or may not respond at all.
F-59