Attached files
| file | filename |
|---|---|
| EX-32.1 - EX-32.1 - Smart & Final Stores, Inc. | a2231069zex-32_1.htm |
| EX-31.2 - EX-31.2 - Smart & Final Stores, Inc. | a2231069zex-31_2.htm |
| EX-31.1 - EX-31.1 - Smart & Final Stores, Inc. | a2231069zex-31_1.htm |
| EX-23.1 - EX-23.1 - Smart & Final Stores, Inc. | a2231069zex-23_1.htm |
| EX-21.1 - EX-21.1 - Smart & Final Stores, Inc. | a2231069zex-21_1.htm |
| EX-10.20 - EX-10.20 - Smart & Final Stores, Inc. | a2231069zex-10_20.htm |
| EX-10.19 - EX-10.19 - Smart & Final Stores, Inc. | a2231069zex-10_19.htm |
Use these links to rapidly review the document
TABLE OF CONTENTS
TABLE OF CONTENTS
UNITED STATES
SECURITIES AND EXCHANGE COMMISSION
Washington, D.C. 20549
FORM 10-K
| (Mark One) | ||
ý |
ANNUAL REPORT PURSUANT TO SECTION 13 OR 15(d) OF THE SECURITIES EXCHANGE ACT OF 1934 |
|
For the fiscal year ended January 1, 2017 |
||
OR |
||
o |
TRANSITION REPORT PURSUANT TO SECTION 13 OR 15(d) OF THE SECURITIES EXCHANGE ACT OF 1934 |
|
For the transition period from to |
||
Commission file number: 001-36626
Smart & Final Stores, Inc.
(Exact name of registrant as specified in its charter)
| Delaware (state or other jurisdiction of Incorporation or organization) |
80-0862253 (I.R.S. Employer Identification No.) |
|
600 Citadel Drive Commerce, California (Address of principal executive offices) |
90040 (Zip Code) |
Registrant's telephone number, including area code: (323) 869-7500
Securities registered pursuant to section 12(b) of the Act:
| Title of each class | Name of each exchange on which registered | |
|---|---|---|
| common stock, par value $0.001 per share | New York Stock Exchange |
Securities registered pursuant to section 12(g) of the Act: None
Indicate by check mark if the registrant is a well-known seasoned issuer, as defined in Rule 405 of the Securities Act. Yes o No ý
Indicate by check mark if the registrant is not required to file reports pursuant to Section 13 or 15(d) of the Act. Yes o No ý
Indicate by check mark whether the registrant (1) has filed all reports required to be filed by Section 13 or 15(d) of the Securities Exchange Act of 1934 during the preceding 12 months (or for such shorter period that the registrant was required to file such reports), and (2) has been subject to such filing requirements for the past 90 days. Yes ý No o
Indicate by check mark whether the registrant has submitted electronically and posted on its corporate Web site, if any, every Interactive Data File required to be submitted and posted pursuant to Rule 405 of Regulation S-T (§232.405 of this chapter) during the preceding 12 months (or for such shorter period that the registrant was required to submit and post such files). Yes ý No o
Indicate by check mark if disclosure of delinquent filers pursuant to Item 405 of Regulation S-K (229.405 of this chapter) is not contained herein, and will not be contained, to the best of registrant's knowledge, in definitive proxy or information statements incorporated by reference in Part III of this Form 10-K or any amendment to this Form 10-K. o
Indicate by check mark whether the registrant is a large accelerated filer, an accelerated filer, or a non-accelerated filer. See definition of "accelerated filer and large accelerated filer" in Rule 12b-2 of the Exchange Act. (Check one):
| Large accelerated filer o | Accelerated filer ý | Non-accelerated filer o (Do not check if a smaller reporting company) |
Smaller reporting company o |
Indicate by check mark whether the registrant is a shell company (as defined in Rule 12b-2 of the Act). Yes o No ý
The aggregate market value of the registrant's voting and non-voting common equity held by non-affiliates as of June 19, 2016 was approximately $451,196,151.
Indicate the number of shares outstanding of each of the registrant's classes of common stock, as of the latest practicable date.
| Class | Outstanding at March 14, 2017 | |
|---|---|---|
| common stock, $0.001 par value | 73,036,424 |
Documents Incorporated by Reference:
Portions of the registrant's definitive Proxy Statement for its 2017 Annual Meeting of Stockholders are incorporated by reference in Part III of this Annual Report on Form 10-K where indicated. Such Proxy Statement will be filed with the Securities and Exchange Commission within 120 days after the end of the registrant's fiscal year ended January 1, 2017.
2
The discussion in this Annual Report on Form 10-K (this "Annual Report"), including under Items 1, 1A, 2, 3, 7 and 7A hereof, contains forward-looking statements within the meaning of federal securities laws. All statements other than statements of historical fact contained in this Annual Report, including statements regarding Smart & Final Stores, Inc.'s and its subsidiaries' (the "Company," "we," "us" and "our") future operating results and financial position, business strategy and plans and objectives of management for future operations, are forward-looking statements. In many cases, you can identify forward-looking statements by terms such as "may," "should," "expects," "plans," "anticipates," "could," "intends," "target," "projects," "contemplates," "believes," "estimates," "predicts," "potential" or "continue" or the negative of these terms or other similar expressions.
The forward-looking statements contained in this Annual Report reflect our views as of the date hereof about future events and are subject to risks, uncertainties, assumptions and changes in circumstances that may cause our actual results, performance or achievements to differ significantly from those expressed or implied in any forward-looking statement. Although we believe that the expectations reflected in the forward-looking statements in this Annual Report are reasonable, we cannot guarantee future events, results, performance or achievements. A number of important factors could cause actual results to differ materially from those indicated by the forward-looking statements in this Annual Report, including, without limitation, those factors described in Item 1A, "Risk Factors" of Part I and Item 7, "Management's Discussion and Analysis of Financial Condition and Results of Operations" of Part II. Some of the key factors that could cause actual results to differ from our expectations include the following:
- •
- competition in our industry is intense and our failure to compete successfully may adversely affect our sales, financial condition and
operating results;
- •
- our continued growth depends on new store openings and our failure to successfully open new stores or successfully manage the potential
difficulties associated with store growth could adversely affect our business and stock price;
- •
- our failure to successfully operate store properties acquired from Haggen could adversely affect our business and operating results;
- •
- real or perceived quality or food safety concerns could adversely affect our business, operating results and reputation;
- •
- we may be unable to maintain or increase comparable store sales, which could adversely affect our business and stock price;
- •
- inflation and deflation can impact our net sales, inventory, costs of goods sold and gross margin and operating leverage;
- •
- the current geographic concentration of our stores and our net sales creates an exposure to local or regional downturns or catastrophic
occurrences;
- •
- disruption of significant supplier relationships could adversely affect our business;
- •
- any significant interruption in the operations of our distribution centers or common carriers could disrupt our ability to deliver our products
in a timely manner;
- •
- our failure to comply with laws, rules and regulations affecting us and our industry could adversely affect our financial condition and
operating results;
- •
- disruptions to or security breaches involving our information technology systems could harm our ability to run our business;
3
- •
- we have significant debt service obligations and may incur additional indebtedness in the future, which could adversely affect our financial
condition and operating results and our ability to react to changes to our business; and
- •
- covenants in our debt agreements restrict our operational flexibility.
Readers are urged to consider these factors carefully in evaluating the forward-looking statements in this Annual Report and are cautioned not to place undue reliance on these forward-looking statements. All of the forward-looking statements in this Annual Report are based on information available to us on the date hereof. We undertake no obligation to publicly update or revise any forward-looking statement, whether as a result of new information, future events or otherwise, except as otherwise required by law.
4
Who We Are
We are a growth and value-oriented food retailer serving a diverse demographic of household and business customers through two complementary and highly productive store banners. Our Smart & Final stores focus on both household and business customers, and our Cash & Carry stores focus primarily on business customers. As of January 1, 2017, we operated 305 convenient, non-membership, smaller-box, warehouse-style stores throughout the Western United States, with an additional 15 stores in Northwestern Mexico operated through a joint venture. We have a differentiated merchandising strategy that emphasizes high quality perishables, a wide selection of private label products, products tailored to business and foodservice customers and products offered in a broad range of product sizes, all at "everyday low prices."
As of January 1, 2017, we operated 246 Smart & Final stores in California, Arizona and Nevada, which offer extensive selections of fresh perishables and everyday grocery items, together with a targeted selection of foodservice, packaging and janitorial products, under both national and private label brands. Customers can choose from a broad range of product sizes, including an assortment of standard-sized products typically found at conventional grocers, and a large selection of larger sized offerings (including uniquely sized national brand products) more typical of warehouse club stores. Pricing in our Smart & Final stores is targeted to be substantially lower than that of conventional grocers and competitive with that of large discount store operators and warehouse clubs. We believe we offer higher quality produce at lower prices than large discounters. We also believe our Smart & Final stores provide a better everyday value to household and business customers than typical warehouse clubs by offering greater product selection at competitive prices, and with no membership fee requirement, in a convenient easy-to-shop format.
Within the Smart & Final banner we operate both Extra! and legacy Smart & Final stores. Eight years ago, we launched a transformational initiative to convert our larger legacy Smart & Final stores to our Extra! format. With a larger store footprint and an expanded merchandise selection, our Extra! format offers a one-stop shopping experience with approximately 16,400 SKUs, approximately 4,300 more SKUs than our legacy Smart & Final stores, with an emphasis on perishables and household items. As of January 1, 2017, we operated 172 Extra! stores of which 94 represent conversions or relocations of legacy Smart & Final stores and 78 represent new store openings. In recent years we have significantly increased the number of Extra! stores, facilitated, in-part, by our acquisition of a dedicated perishables warehouse, and further supported by our continued investments in distribution capabilities and in-store merchandising. The continued development of our Extra! store format, through additional new store openings and conversions and relocations of legacy Smart & Final stores, is the cornerstone of our growth strategy.
As of January 1, 2017, we also operated 59 Cash & Carry stores focused primarily on restaurants, caterers and a wide range of other foodservice businesses such as food trucks and coffee houses. We offer customers the opportunity to shop for their everyday foodservice needs in a convenient, no-frills warehouse shopping environment. These stores are located in Washington, Oregon, Northern California, Idaho, Nevada and Utah. Pricing in our Cash & Carry stores is targeted to be substantially lower than that of our foodservice delivery competitors, with greater price transparency to customers and with no minimum order size. Pricing is also competitive with typical warehouse clubs, with no membership fee requirement.
We believe that our "everyday low prices," unique merchandising strategy and convenient locations enable us to offer a differentiated food shopping experience with broad appeal to a diverse customer demographic.
5
Corporate History and Structure
Smart & Final is one of the longest continuously operated food retailers in the United States and has become an iconic brand name in the markets we serve. We were founded in Los Angeles in 1871 as Hellman-Haas Grocery Company, a wholesale grocery supplier to businesses. We changed our name to Smart & Final Wholesale Grocers in the early 1900s after a merger with Santa Ana Grocery Company, a wholesale grocery supplier founded by J.S. Smart and H.D. Final. In the years that followed, we expanded the Smart & Final banner throughout California and into Nevada and Arizona. In 1998, we acquired the Portland, Oregon-based Cash & Carry store chain. Since the Cash & Carry acquisition, we have operated as a multi-banner food retailer.
We were formed as a Delaware corporation on October 5, 2012 under the name SF CC Holdings, Inc., and we changed our name to Smart & Final Stores, Inc. on June 16, 2014. We were formed by funds affiliated with Ares Management, L.P. ("Ares Management") and, on November 15, 2012 we acquired all of the outstanding stock of Smart & Final Holdings Corp., the former ultimate parent company of all of our operating subsidiaries (the "Ares Acquisition"). In connection with the Ares Acquisition, each of Ares Corporate Opportunities Fund III, L.P. and Ares Corporate Opportunities Fund IV, L.P. (together, "Ares") made an equity contribution to us in exchange for shares of our common stock.
We are a holding company and all of our operations are conducted through our operating subsidiaries, primarily Smart & Final Stores LLC and Cash & Carry Stores LLC (a direct wholly owned subsidiary of Smart & Final Stores LLC).
Our Industry
Our Smart & Final stores operate in the U.S. food retail industry, which includes a variety of distribution channels, including conventional grocers, mass merchandisers, warehouse clubs, discounters, online retailers and other specialty stores. We believe that customers are increasingly attracted to alternative store formats, and that conventional grocers are losing market share as a result.
Our Cash & Carry stores operate in the U.S. foodservice supply industry, which includes a variety of distribution channels, including warehouse clubs, foodservice delivery companies, online retailers and other specialty stores. The U.S. foodservice market continued to benefit from increased consumer spending on food-away-from-home, and accounted for 43% of total food expenditures in 2015, according to the Bureau of Labor Statistics.
What Makes Us Different
We believe that the following competitive strengths position us for continuing growth as food shoppers increasingly focus on value and convenience:
Unique platform that appeals to household and business customers. We serve a diverse demographic of customers including households, businesses and community groups through our complementary Smart & Final and Cash & Carry banners. We offer a differentiated, highly convenient shopping experience with an emphasis on quality and value. We provide an easy-to-shop, no-frills, in-store environment in a smaller physical footprint compared to typical warehouse clubs, but with a greater SKU selection, which both simplifies and expedites our customers' shopping experience.
Sales at our Smart & Final stores benefit from a large base of diverse business customers. Our internal surveys indicate that our business customers typically shop Smart & Final for both their household and business needs and account for approximately 30% of our Smart & Final sales. On average, these business customers spend approximately twice as much per visit (including purchases of household SKUs) as our typical household customers. We believe our household customers enjoy "shopping with the pros" because it reinforces the perception of value, quality and selection. At Cash &
6
Carry , we believe our business customers appreciate our accessible locations and consistent shopping experience, where they shop for both everyday and supplemental business needs.
Distinctive and value-focused merchandise offering, delivered through two store banners. Our Smart & Final stores feature a comprehensive grocery offering at "everyday low prices," including high quality perishables, extensive selections of private label and national brand products and a large selection of club-pack sizes (over 3,000 SKUs). With approximately 16,400 SKUs in our Extra! stores and approximately 12,100 SKUs in our legacy Smart & Final stores, each of our Smart & Final store formats offers a wider variety of products than typical warehouse clubs. Pricing in our Smart & Final stores is targeted to be substantially lower than that of conventional grocers and competitive with that of large discounters and warehouse clubs. We believe we offer higher quality produce at lower prices than large discounters. Unlike warehouse clubs, we do not require customers to pay a membership fee. Our differentiated merchandising strategy also includes established private label brands and an extensive portfolio of national brand products in a broad range of product sizes. In fiscal year 2016, sales of private label items were approximately 28% of Smart & Final banner sales, and based on internal surveys commissioned by us, we estimate that approximately 39% of Smart & Final banner sales were from products or sizes (including both national brand and private label products) that are not typically found at conventional grocers.
Our Cash & Carry stores offer customers a wide variety of approximately 8,500 key SKUs targeted to core foodservice needs, including an extensive selection of high quality perishables (approximately 46% of Cash & Carry banner sales in fiscal year 2016), national brand and private label grocery products, and related foodservice equipment and supplies. Our prices are targeted to be substantially lower than those of foodservice delivery companies and competitive with those of warehouse clubs. Our Cash & Carry stores do not require payment of a membership fee or minimum purchase amounts. We believe Cash & Carry customers value our low prices, extensive selection, price transparency and the ability to hand-select perishable products. In addition, we believe our customers value the convenience of being able to shop at times that are most suitable for their businesses, as opposed to receiving deliveries on a distributor's schedule. Our business customers also frequently utilize Cash & Carry as a convenient source for basic supplies or "fill-in" products that were either omitted from their regular foodservice delivery or of insufficient quantity and/or quality.
Across both our Smart & Final and Cash & Carry banners, we believe our differentiated merchandising strategy and consistent focus on delivering value has enabled us to generate loyalty, referrals and repeat business.
Well-positioned store base and flexible real estate strategy. As of January 1, 2017, we operated 305 stores across seven contiguous states in the Western U.S., including 243 stores in the large and growing California market. Our long operating history has enabled us to establish a store footprint that would be difficult to replicate, and has provided us with deep institutional knowledge of the local real estate markets in which we operate.
We have a flexible real estate strategy, which we believe enables our stores to achieve strong performance in a range of locations. Our store model is adaptable to a wide variety of potential sites, including new developments, "second use" spaces previously occupied by other retailers and conversions of non-retail sites to retail use. In addition, our stores appeal to a broad spectrum of customers in the markets we serve, which are generally characterized by ethnically and socio-economically diverse populations. This broad appeal enables us to perform profitably in a range of urban and suburban locations, however we typically target trade areas with higher concentrations of businesses.
Passionate and experienced management team. We are led by a passionate executive team with extensive food retail experience and a long history of operational excellence complemented by a
7
seasoned team of store managers and senior merchants. We believe our management's experience will enable us to continue to grow our store base while improving operations and driving efficiencies through a strong focus on selling high quality products at "everyday low prices."
Our Stores, Operations and Staff
All of our stores are designed for convenience and are clean, organized and clutter-free. Our concrete floors, bright lights, high ceilings and wide shopping aisles highlight our warehouse-style format and our focus on efficiency and value.
Typical Smart & Final customers drive a short distance from their homes and businesses and park in lots directly outside our stores. Customers are able to move quickly and deliberately through our departments and aisles. Within each of our store formats, our products are organized by product category. Our high quality produce is arranged in farmer's market-style displays, and our other household and business items are organized on shelves that run from the floor to approximately eye level. Typically, bulk-sized products are stocked on floor-level shelves, club-pack sized products on middle shelves and single-unit items on eye-level shelves. Discounted products, such as products subject to our "buy more, save more" discounts, are marked with bright, clear signage.
Typical Cash & Carry customers visit our stores en route to or from their businesses to complete comprehensive shopping trips, or to satisfy "fill-in" needs during the business day. As with our Smart & Final stores, customers can move quickly and deliberately through our departments and aisles, typically loading their products onto low, flatbed-style carts to accommodate full case offerings and large "sub-primal cuts" of meat. Our products are organized by product category, and customers can select their products, including high quality perishables, directly from our displays. Our checkout displays are open and do not require our customers to unload their products onto conveyors; instead, our employees use hand-held scanners to quickly scan products to help make our customers' shopping experience as efficient as possible.
As of January 1, 2017, we operated 305 stores across the Western United States, including 246 Smart & Final stores in California, Arizona and Nevada and 59 Cash & Carry stores in Washington, Oregon, Northern California, Idaho, Nevada and Utah. In addition, 15 legacy Smart & Final stores are operated by a joint venture in Northwestern Mexico. Our stores are located primarily in areas with higher concentrations of businesses in both smaller and mid-sized shopping centers and at stand-alone sites.
We believe our customer service orientation, together with our focus on value pricing and shopping convenience, help us to encourage more frequent store visits than warehouse clubs and a higher average purchase size than conventional grocers. Management in our Smart & Final stores is knowledgeable about the needs of both household and business customers, and we emphasize cross-functional training to enhance our ability to serve our customers' needs. Management and employees in our Cash & Carry stores are also focused on customer service, and our more focused business and foodservice customer target allows for a higher level of specialized product knowledge to respond to our customers' needs.
Our culture emphasizes teamwork, accountability, integrity and respect, all of which we believe contribute to our growth and success. Our training programs encompass all levels of store operations, from entry level through management, and emphasize merchandising techniques, management and leadership skills and customer service goals to ensure top employee quality and productivity. We reward superior performance and motivate employees with incentive pay programs. We believe that well trained and motivated employees contribute to our consistently high service standards, which helps us maintain our existing stores and successfully open new stores with an extension of our operating culture. We believe we are an attractive place to work with significant career growth opportunities for our employees. To support career growth, we actively promote and financially support continuing
8
education among our staff. We offer competitive wages and benefits, and believe active, educated and dedicated employees contribute to customer satisfaction.
Our Products and Pricing
We have a differentiated merchandising strategy that emphasizes high quality perishables and a wide selection of quality private label products and national brands, all offered in a broad range of product sizes. We believe that our merchandising strategy results in an appealing and hard-to-match store experience. We have a commitment to "everyday low prices," which helps to position both our Smart & Final and Cash & Carry stores as top of mind destinations for our customers.
The merchandise mix as a percentage of sales at our legacy Smart & Final, Extra! and Cash & Carry stores, respectively, for fiscal year 2016 was as follows:
| |
Smart & Final | |
||||||||
|---|---|---|---|---|---|---|---|---|---|---|
| |
Cash & Carry | |||||||||
| |
Extra! | Legacy | ||||||||
Perishables |
37 | % | 29 | % | 46 | % | ||||
Grocery |
34 | % | 36 | % | 34 | % | ||||
Beverage |
16 | % | 17 | % | 4 | % | ||||
Paper and Packaging |
8 | % | 11 | % | 11 | % | ||||
Restaurant Equipment and Janitorial Supplies |
5 | % | 7 | % | 5 | % | ||||
Smart & Final Store Products
We offer an extensive portfolio of private label product and national brand SKUs in our Smart & Final stores, including national brand SKUs that we believe household customers purchase most frequently. Our product selection is designed to meet the regular shopping needs of household customers and higher frequency purchases by business customers, including basic grocery, produce, dairy, meat, beverage, foodservice, packaging and janitorial items. Customers can choose from a broad range of product sizes, including an assortment of standard-sized products typically found at conventional grocers, and a large selection of bulk-size offerings (including uniquely sized national brand products) more typical of larger-box warehouse clubs at prices that are designed to provide significant savings.
Our Smart & Final stores feature the following departments:
Produce. We offer a broad selection of fresh, high quality fruits and vegetables arranged in farmer's market-style displays and in value-focused multi-packs. We also offer packaged produce items such as salad mixes under both national brands and our Sun Harvest® private label brand. In selected stores, our produce department also includes a range of key organic produce SKUs.
Meat and Deli. We offer an extensive selection of quality beef, poultry, pork and seafood products, under various national brands and our private label brand, Cattlemen's Finest®. Our meat selection comes in a variety of cut sizes, including individual cuts and hard-to-find large "sub-primal cuts" targeted to our foodservice customers but also enjoyed by our household customers. In addition, our deli department offers an assortment of oven-roasted chicken, salads and other fresh and appetizing meal solutions.
Dairy and Cheese. We offer an expansive selection of milk, yogurt, fresh cheeses, ice cream and other dairy products sold under national brands and our signature private label brand First Street®, Sun Harvest® and Simply Value® labels.
9
Grocery. We offer an extensive selection of everyday grocery items, including pastas, rice, breads, canned fruits and vegetables, cookies, crackers, spices and oils. Customers can choose from a broad range of product sizes, including single units, club-packs and bulk foods. We sell grocery products under national brands and a variety of our private label brands, including First Street®, La Romanella®, Montecito®, Tradewinds®, Sun Harvest® natural and organic products, and Simply Value®. We also offer a selection of personal care items under national brands and our Iris® private label.
Beverage. We offer a wide variety of beverage products, including hot beverage items, bottled waters, juices, sports and energy drinks, carbonated soft drinks and, in most of our stores, beer, wine and spirits. We sell products under national brands, and under our Ambiance® and our First Street® private label brands.
Paper and Packaging. We offer a wide selection of packaging, disposable table top and take out products, including paper bags, butcher paper, aluminum pans and trays, plastic cups, table coverings, party favors and other disposable food containers. Our products are sold under national brands and our private label brands, First Street® and Simply Value®.
Restaurant Equipment and Janitorial Supplies. We offer a large selection of restaurant equipment, including cookware, utensils, chafing dishes and supplies. We also offer an extensive assortment of janitorial products, including mops, brooms and other cleaning supplies. We offer products under national brands and our private labels First Street® and Simply Value®.
Cash & Carry Store Products
We offer a wide variety of SKUs in our Cash & Carry stores, which are tailored to the core needs of foodservice businesses such as restaurants, caterers and other foodservice providers, as well as businesses and community organizations.
Our Cash & Carry stores feature the following departments:
Produce. We offer a broad selection of fresh, high quality fruits and vegetables arranged in large walk-in refrigerated boxes, which accommodate large rolling carts. We believe our customers value the ability to hand-select their produce, a feature that is generally not available from foodservice delivery companies.
Meat and Deli. We offer an extensive selection of quality beef and pork products. Our meat selection is also presented in large walk-in refrigerators and comes in a variety of cut sizes, including individual cuts and large "sub-primal cuts." We believe our customers value the ability to hand-select their meat products to accommodate specific recipes or presentations. We also offer a full line of frozen portion control products, which enable foodservice users to control their menu costs. In addition, our deli department offers an assortment of deli meats and prepared products in bulk sizes.
Dairy and Cheese. We offer an expansive selection of fresh cheeses and other dairy products under national brands and our signature private label brand First Street®.
Grocery. We offer an extensive selection of dry grocery items, including flour, sugar, spices, rice, canned fruit and vegetables, sauces and dressings. Customers can choose from a broad range of product sizes, including case quantities and single units. We sell grocery products under national brands and a variety of private label brands, including First Street®, La Romanella®, Montecito®, Simply Value® and Tradewinds®.
Beverage. We offer a wide variety of hot and cold beverages, including bottled waters, juices, sodas, sports and energy drinks and other items used in the foodservice industry, including flavored coffee syrups, syrup refills for soda fountains and bar supplies. We offer products under national brands and our private label brands Ambiance® and First Street®.
10
Paper and Packaging. We offer a wide selection of packaging, disposable table top and take out products, including paper bags, butcher paper, aluminum pans and trays, plastic cups, table coverings, party favors and other disposable food containers. Our products are sold under national brands and our private label brands First Street® and Simply Value®.
Restaurant Equipment and Janitorial Supplies. We offer a large selection of restaurant equipment, including cookware, utensils, chafing dishes and bar and beverage supplies. We also offer an extensive assortment of janitorial products, including mops, brooms and other cleaning supplies. We offer products under national brands and our private labels First Street® and Simply Value®.
Our Cash & Carry stores offer a flexible mix of "case quantity" or single-unit purchases to provide a strong differentiation to our foodservice delivery competitors, which typically offer "case quantity" only. Because typical Cash & Carry customers purchase ingredients for further processing into finished meals, our customers frequently purchase the same items but may need varying quantities of individual SKUs.
Private Label Products
Our private label products are developed to provide our customers with a wide range of merchandise unique to our stores. We seek to provide quality that is equal to or better than the national brand equivalents at a lower price point. We offer private label products across a broad array of categories with over 3,000 SKUs, with our First Street label representing approximately 78% of private label sales in fiscal year 2016. We believe our ability to develop and competitively source quality private label products are important elements of our product offering. Private label products represented 28.1% of net sales at our Smart & Final stores and 15.3% of net sales at our Cash & Carry stores for fiscal year 2016. This compares to 29.6% and 15.1%, respectively, for fiscal year 2015.
We have a dedicated in-house product development team that focuses on continuing the growth of our private label brands, which seeks to ensure that we have the right products at the right quality and cost. We have invested in strengthening and enhancing our private label brands over the last several years to meet the needs of both our household and business customers.
Pricing
We believe our Smart & Final stores maintain a price position that is competitive with other value retailers. Pricing in our Smart & Final stores is targeted to be substantially lower than that of conventional grocers and competitive with that of large discounters and warehouse clubs. We believe we offer higher quality produce at lower prices than large discounters. We conduct regular price surveys of our major competitors, and strive to maintain pricing that is competitive with that of warehouse clubs and discounters, and utilize more aggressive pricing on high quality produce items to build higher frequency customer visits. We also believe our Smart & Final stores provide a better everyday value to household and business customers than typical warehouse clubs by offering greater product selection at competitive prices, and with no membership fee requirement, in a convenient easy-to-shop format.
Our Cash & Carry store pricing is targeted to be significantly lower than foodservice delivery companies, with greater price transparency to customers and no minimum order size. Our foodservice direct delivery competitors typically adjust their customer-level pricing to account for their higher cost structures, which includes delivery costs. Pricing is also competitive with typical warehouse clubs, with no membership fee requirement. We seek to price our products competitively with our store-based competition to encourage our target customers to purchase a larger portion of their needs from our stores. We conduct regular price surveys of our principal store-based competition, which includes warehouse clubs and warehouse-style foodservice retailers.
11
Marketing and Advertising
Our store banners maintain separate marketing and advertising programs directed to their primary target customers. Our Extra! and legacy Smart & Final stores share a common marketing and advertising platform, with separate versions of advertising depending on the type and location of stores. In both our store banners, our primary advertising approach is an item-and-price message designed to reinforce the breadth of our product selection and value-price positioning of our stores.
For our Smart & Final stores, we advertise primarily through distribution of a weekly print circular, targeted to reach potential customers at a sub-Zip Code level based on defined trade areas for each store. We produce separate versions of the circular for stores in different geographic areas and competitive regions, for newly opened or remodeled stores and for special promotional purposes. In addition to the weekly circular, we utilize a supplemental bi-monthly distribution of a separate printed circular targeted to business customers. This business circular contains key business SKUs and pricing and is focused on high volume, price sensitive items for foodservice and other business customers. We also have an in-store marketing program that includes a "tag and sign" program, special signage for "buy more, save more" discounts and aisle banners. In addition, we maintain our website, www.smartandfinal.com, on which we offer or advertise special deals and coupons. To support our market positioning and drive visits to Smart & Final stores, we utilize radio and television advertising around major food holidays and we are expanding our digital and social media presence.
For new stores, conversions of legacy Smart & Final stores to Extra! stores and store relocations, we organize special grand opening event periods. Grand openings typically include a community reception and special promotional pricing for a defined period following the store opening. We believe our grand opening events help to familiarize the community in our trade area with the differentiated offering and pricing of our Extra! stores.
For our Cash & Carry stores, our primary advertising is through bi-weekly mail distributions of "Hot Sheets" to potential key foodservice customers which include pricing specials on key foodservice items. The distribution is targeted to customers identified by business type and proximity to our Cash & Carry stores. We also direct mail themed flyers to potential customers for special events and distribute flyers in our Cash & Carry stores to target purchasers of specific products. On our website, www.smartfoodservice.com, we offer vendor promotions, industry information, videos from successful customers and a catalog to create shopping lists.
The inclusion of our website addresses in this Annual Report does not include or incorporate by reference the information on or accessible through our websites into this Annual Report.
Product Sourcing and Distribution
Product Sourcing
We manage the buying of, and set the standards for, the products we sell, and we source our products from over 1,400 vendors and suppliers. We believe our scale generates cost savings, which is reflected in our commitment to "everyday low prices" in all our stores. We have many long-term relationships with both national brand and private label suppliers, and believe that our supplier relationships are strong.
Our strong supplier relationships support our differentiated merchandising strategy. Many of our national brand and private label vendors supply us with club-pack and bulk-size SKUs that they do not offer to conventional grocers, in addition to the single-unit products we offer that are not sold by warehouse clubs. These products enable us to provide a broader range of product sizes than our competitors, and are designed to provide significant savings for our customers. Our Smart & Final stores purchase products from a network of national brand companies, regional and local brands and
12
strategically sourced private label suppliers. We seek to obtain high quality products at acquisition costs that allow us to maintain our pricing objectives.
We strive to maintain close working relationships with our major suppliers to reduce product and distribution costs, and we believe that our sales growth presents unique opportunities to achieve continuing synergies. Our Smart & Final stores are not dependent on any individual supplier, and no product supplier represented more than 2% of our Smart & Final banner cost of sales during fiscal year 2016.
For our 59 Cash & Carry stores we employ a hybrid purchasing model to achieve operational efficiency. Cash & Carry management specifies all the products for our stores, and we operate under an agreement with Unified Grocers, Inc. ("Unified Grocers"), a regional grocery cooperative, whereby Unified Grocers acts as our primary purchasing and warehouse supplier for primary grocery and perishable products. Where applicable, Unified Grocers purchases products and maintains inventory in its warehouse facilities, filling orders from Cash & Carry stores as needed. This arrangement leverages the purchasing ability of Unified Grocers and allows our Cash & Carry stores to shift maintenance of warehouse inventories to a third party. Approximately 82.0% and 81.3% of our product requirements (measured at cost) for our Cash & Carry stores for each of fiscal year 2015 and 2016 were made through our relationship with Unified Grocers. Based on Unified Grocer's disclosure in its public filings, we accounted for approximately 17% of Unified Grocer's total net sales for the fifty-two week period ended October 1, 2016.
Our Cash & Carry stores also purchase certain products through agreements with two other suppliers on a more traditional supplier basis. We believe that these relationships could be replicated at similar economics.
Product Distribution
We support our Smart & Final stores in California, Arizona and Nevada through a network of Company-controlled distribution facilities. These include Company leased-and-operated facilities, dedicated leased facilities operated by third-party logistics companies and shared third-party operations. Approximately 64% of Smart & Final store SKUs, including approximately 66% of perishable products in our California stores, are supplied from our Company-operated 445,000 square foot dry goods distribution center in Commerce, California and our Company-operated 241,000 square foot perishables warehouse in Riverside, California. The balance of our products (including frozen goods, deli and selected dry grocery) are supplied by third party-operated distribution centers or manufacturers' direct store delivery systems. By design, our network of distribution centers and third party operations has a flexible capacity to support our anticipated growth.
Deliveries to our stores from Company-controlled warehouses are made by a fleet of Company-owned and leased trucks, supplemented by third-party transportation providers. Deliveries of direct store delivered products are made by the respective product suppliers. We periodically evaluate the relative costs of maintaining products within our distribution system or provided through direct store delivery to maintain competitive product acquisition costs.
Our Cash & Carry stores are primarily served through a contract service agreement with Unified Grocers. Unified Grocers maintains four primary distribution centers in the Western United States, and we primarily supplied from Unified Grocers' Portland, Oregon and Seattle, Washington facilities.
By design, our network of distribution centers and third party operations has a flexible capacity to support our anticipated growth.
13
Store Selection and Economics
We believe we have substantial opportunities for new store growth in our Extra! format. We have identified near-term opportunities for growth within our existing market areas, and longer-term opportunities in adjacent markets. We believe our flexible approach to the size of our stores and ability to utilize a wide variety of existing real estate provides us with flexibility in site selection, including entering into new developments, "second use" store spaces formerly operated by other retailers such as conventional grocers, office supply stores and electronics retailers and conversion of non-retail store sites to retail store use. We believe our value positioning allows us to serve a diverse demographic of customers which in turn allows us flexibility in selecting new sites.
We have a rigorous process for new store site selection, which includes in-depth analysis of area demographics, competition, growth potential, traffic patterns, grocery spend and other key criteria. We have a dedicated, experienced sourcing and development real estate team, overseen by members of our senior management, including our Chief Executive Officer and Chief Financial Officer. Members of our senior management also conduct an on-site inspection prior to approving any new location.
We currently expect to open approximately 15 new Extra! stores in fiscal year 2017 and plan to continue opening additional new stores for the foreseeable future. We also plan to opportunistically grow our Cash & Carry store base. We expect to open four new Cash & Carry stores in fiscal year 2017, and continue opening additional new stores for the foreseeable future.
Customers
In both store banners, our typical customers seek a mix of national brand and private label products, sold at "everyday low prices" at convenient, easy-to-shop locations. We believe our customers are initially attracted to our stores by our compelling value proposition, broad selection of household and business products and shopping convenience. We also believe that our customer service and unique brand name and private label products are key factors in customer retention.
Our Smart & Final stores target both household and business customers, who represented 71% and 29%, respectively, of banner sales for fiscal year 2016. We believe that while sales to our Smart & Final banner's business customers, including restaurant owners, caterers, institutional consumers, offices and community organizations, are less than sales to household customers, business customers provide an important point of differentiation in the product mix of our stores. The resulting product mix establishes an environment whereby both household and business customers have the opportunity to purchase SKUs from a distinctive merchandising offering, fulfilling a larger fraction of customer needs.
Our Cash & Carry stores primarily target business customers, including restaurants, caterers and a wide range of other foodservice providers. We believe that business customers represented an estimated 90% of our banner sales for fiscal year 2016, and for many of these customers we represented a primary source of supply. While not a primary customer target, our Cash & Carry stores also serve household customers, which represented an estimated 10% of our banner sales for fiscal year 2016. We believe our Cash & Carry banner customers enjoy our "everyday low prices," our extensive SKU selection, our price transparency, the opportunity to purchase larger quantities at "case discount" prices and our accessible locations.
Mexico
We are party to a joint venture agreement in connection with the operation of 15 Smart & Final stores in Northwestern Mexico as of January 1, 2017. We have a 50% interest in the joint venture which we account for using the equity method of accounting. Our joint venture partner, Grupo Calimax S. A. de C.V., operates a chain of unaffiliated grocery stores across Northwestern Mexico. These Smart & Final joint venture stores are operated under in a style similar to our legacy Smart & Final
14
format stores. We are party to a product supply agreement with the joint venture, pursuant to which we provide certain products to its stores, principally private label products.
Segments
For revenue and other financial information for our two operating segments, see Note 14, Segment Information, to our audited consolidated financial statements, which are included elsewhere in this Annual Report.
Competition
The food retail and foodservice industries are large, competitive and highly fragmented. See "Risk Factors—Competition in our industry is intense and our failure to compete successfully may adversely affect our sales, financial condition and operating results."
Our principal competitors include conventional grocers such as Albertson's, Kroger and Safeway, discounters and warehouse clubs such as Costco, mass merchandisers such as Walmart and Target, foodservice delivery companies such as Sysco and US Foods, as well as online retailers and other specialty stores. Each of these companies competes with us on one or more elements of price, product selection, product quality, convenience, customer service, store format and location, or any combination of these factors. Some of our competitors may have greater financial or marketing resources than we do and may be able to devote greater resources to sourcing, promoting and selling their products. These competitors could use these advantages to take certain measures, including reducing prices, that could adversely affect our competitive position, business, financial condition and operating results.
Seasonality
Sales in our business reflect modest seasonality. Our average weekly sales fluctuate throughout the year and are typically highest in our second and third fiscal quarters.
Insurance and Risk Management
We use a combination of insurance and self-insurance plans to provide for the potential liabilities for workers' compensation, general liability (including, in connection with legal proceedings described under "Risk Factors—Legal proceedings could adversely affect our business, financial condition and operating results"), property insurance, director and officers' liability insurance, vehicle liability and employee health-care benefits. Liabilities associated with the risks that are retained by us are estimated, in part, by considering historical claims experience, demographic factors, severity factors and other actuarial assumptions. Where we have retained risk through self-insurance or similar arrangements, we utilize third-party actuarial firms to assist management in assessing the financial impact of risk retention. Our results could be adversely affected by claims and other expenses related to such plans and policies if future occurrences and claims differ from these assumptions and historical trends.
Trademarks and Other Intellectual Property
We believe that our intellectual property has substantial value and has contributed to the success of our business. In particular, our trademarks, including our registered Smart & Final ®, Smart & Final Extra!®, Cash & Carry Smart Foodservice®, Ambiance®, Cattleman's Finest®, First Street®, Iris®, La Romanella®, Montecito®, Simply Value®, Sun Harvest® and Tradewinds® trademarks, are valuable assets that we believe reinforce our customers' favorable perception of our stores. In addition to our trademarks, we believe that our trade dress, which includes the arrangement, color scheme and other physical characteristics of our stores and product displays, is a large part of the atmosphere we create in our stores and enables customers to distinguish our stores and products from those of our competitors. For certain risks related to our trademarks and other intellectual property, see "Risk Factors—We may be unable to adequately protect our intellectual property rights, which could harm our business, financial condition and operating results."
15
Information Technology Systems
We have made significant investments in information technology infrastructure, including purchasing, receiving, inventory, point of sale, warehousing, distribution, accounting, reporting and financial systems. We also maintain modern supply chain systems allowing for operating efficiencies and scalability to support our continued growth. All of our stores operate under one integrated information technology platform, and we plan to continue to invest in information technology to further enhance our technological infrastructure.
Regulatory Compliance
We are subject to regulations enacted by federal, state and local regulatory agencies, including the U.S. Food and Drug Administration and U.S. Department of Agriculture. These regulations include, but are not limited to, trade practices, pricing practices, labor, health, safety, transportation, environmental protection, including hazardous waste disposal and regulations related to the sale and distribution of alcoholic beverages, tobacco products, milk, agricultural products, meat products and other food products. Compliance with these regulations has not historically had a material effect on our financial condition or operating results.
Employees
As of January 1, 2017, we had 11,949 total employees, including 3,180 full-time and 8,769 part-time employees. Of this aggregate employee total 10,067 were employed in our Smart & Final stores, 705 were employed in our Cash & Carry stores, 717 were employed in our warehouses and distribution centers and 460 were employed in our corporate offices and store-support roles. As of January 1 2017, 214 Cash & Carry store employees were members of the International Brotherhood of Teamsters (the "Teamsters") and covered by a collective bargaining agreement. We consider relations with our employees to be good.
Corporate Information
Our principal executive offices are located at 600 Citadel Drive, Commerce, California 90040 and our telephone number is (323) 869-7500. Our website address is www.smartandfinal.com. The information on or accessible through our website is not incorporated by reference into this Annual Report or in any other report or document we file with the Securities and Exchange Commission.
Certain factors could have a material adverse effect on our business, financial condition, operating results or prospects.You should carefully consider the risks and uncertainties described below, together with all of the other information in this Annual Report, including our consolidated financial statements and related notes. Any of the following risks could adversely affect our business, financial condition, operating results or prospects and cause the value of our common stock to decline, which could cause you to lose all or part of your investment.
Competition in our industry is intense and our failure to compete successfully may adversely affect our sales, financial condition and operating results.
We operate in the highly competitive food retail and foodservice industries. We compete on a combination of factors, including price, product selection, product quality, convenience, customer service, store format and location.
Price is a significant driver of consumer choice in our industry. We expect our competitors to continue to apply pricing pressures, which may have an adverse effect on our ability to maintain profit
16
margins and sales levels. We establish our consumer prices based on a number of factors, including surveys of prices of certain of our competitors. If our competitors change their cost structures such that we are unable to effectively compete on the basis of price, our financial condition and operating results could be adversely affected. Consumer choice is also driven by product selection and quality, and our success depends, in part, on our ability to identify market trends and offer products that appeal to our customers' preferences. Failure to identify such trends, offer such products or to accurately forecast changing customer preferences could lead to a decrease in the number of customer transactions at our stores and a decrease in the amount customers spend when they visit our stores.
We attempt to create a convenient and appealing shopping experience for our customers in terms of customer service, store format and location. If we are unable to provide a convenient and appealing shopping experience, our sales, profit margins and market share may decrease, resulting in an adverse effect on our financial condition and operating results. Some of our competitors are aggressively expanding their number of stores within our primary market areas. As our competitors open stores within close proximity to our stores, our financial condition and operating results may be adversely affected through a loss of sales, decrease in market share or greater operating costs.
Our principal competitors include conventional grocers such as Albertson's and Kroger, discounters and warehouse clubs such as Costco, mass merchandisers such as Walmart and Target, foodservice delivery companies such as Sysco, US Foods, and Performance Food Group, as well as online retailers and other specialty stores. Some of our competitors may have greater financial or marketing resources than we do and may be able to devote greater resources to sourcing, promoting and selling their products. Also, some of our competitors do not have unionized work forces, which may result in lower labor and benefit costs. These competitors could use these advantages to take certain measures, including reducing prices, that could adversely affect our competitive position, business, financial condition and operating results.
Further, over the last several decades, the retail supermarket and foodservice industries have undergone significant changes. Companies such as Walmart, Costco and Aldi have developed lower cost structures than conventional grocers to provide their customers with an "everyday low price" offering. In addition, wholesale outlets such as Restaurant Depot offer an additional low-cost option in the markets they serve. To the extent more of our competitors adopt an "everyday low price" strategy, we could be pressured to lower our prices, which would require us to achieve additional cost savings to offset these reductions. We may be unable to change our cost structure and pricing practices rapidly enough to successfully compete in that environment.
Our continued growth depends on new store openings and our failure to successfully open new stores or successfully manage the potential difficulties associated with store growth could adversely affect our business and stock price.
Our continued growth depends, in part, on our ability to open new stores and to operate those stores successfully. Successful execution of our growth strategy depends upon a number of factors, many of which are beyond our control, including our ability to effectively find suitable sites for new stores, negotiate and execute leases on acceptable terms, secure and manage the inventory necessary for the launch and operation of our new stores, hire, train and retain skilled store personnel, promote and market new stores and address competitive merchandising, distribution and other challenges encountered in connection with expansion into new geographic areas and markets. Delays or failures in opening new stores, or achieving lower than expected sales in new stores, could adversely affect our growth.
Although we believe that the U.S. market can support additional Extra! and Cash & Carry stores, we cannot assure you when or whether we will open any new stores. We may not have the level of cash flow or financing necessary to execute our additional store growth. If and when such store openings
17
occur, we cannot assure you that these new stores will be successful or result in greater sales and profitability.
Additionally, our growth will place increased demands on our operational, managerial and administrative resources. These increased demands could cause us to operate our existing business less effectively, which in turn could adversely affect the financial condition and operating results of our existing stores. Also, new store openings in markets where we have existing stores may result in reduced sales volumes at those existing stores. We may also be unable to successfully manage the potential difficulties associated with store growth, including capturing efficiencies of scale, improving our systems, continuing cost discipline and maintaining appropriate store labor levels and disciplined product and real estate selection, which may result in stagnation or decline in our operating margins. If we experience such a decline in financial condition and operating results as a result of such difficulties, we may slow or discontinue store openings or we may close stores that we are unable to operate profitably.
Some of our new stores may be located in areas where we have little experience or where we lack brand recognition. Those markets may have different competitive conditions, market conditions, consumer tastes and discretionary spending patterns than our existing markets, which may cause these new stores to be less successful than stores in our existing markets. If we fail to successfully execute our growth strategy, including by opening new stores, our financial condition and operating results may be adversely affected.
Our continued growth also depends, in part, on our ability to successfully expand or convert certain of our legacy Smart & Final stores to our Extra! format, and to relocate certain of our Smart & Final stores to new locations as Extra! stores. If we fail to successfully identify the Smart & Final stores suitable for expansion, conversion or relocation, or fail to manage such projects in a cost-effective manner, our financial condition and operating results may be adversely affected.
Our new stores may adversely affect our operating results in the short term and may not achieve sales and operating levels consistent with our more mature stores on a timely basis or at all.
We are actively pursuing new store growth and plan to continue doing so in the future. We cannot assure you that our new store openings will be successful or reach the sales and profitability levels of our existing stores. New store openings may adversely affect our financial condition and operating results in the short term due to the effect of opening costs and lower sales and contribution to overall profitability during the initial period following opening. New stores build their sales volume and their customer base over time and, as a result, generally have lower margins and higher operating expenses, as a percentage of net sales, than our more mature stores. New stores may not achieve sustained sales and operating levels consistent with our more mature store base on a timely basis or at all, which may adversely affect our long- term financial condition and operating results.
In addition, we may not be able to successfully integrate new stores into our existing store base and those new stores may not be as profitable as our existing stores. Further, we have historically experienced, and expect to experience in the future, some sales volume transfer from our existing stores to our new stores as some of our existing customers switch to new, closer locations. If our new stores are less profitable than our existing stores, or if we experience sales volume transfer from our existing stores, our financial condition and operating results may be adversely affected.
We may be unable to maintain or increase comparable store sales, which could adversely affect our business and stock price.
We may not be able to maintain or increase the levels of comparable store sales that we have experienced in the past. Our comparable store sales growth could be lower than our historical average for many reasons, including:
- •
- general economic conditions;
- •
- the effect of new and acquired stores entering into the comparable store base;
18
- •
- the opening of new stores that cannibalize store sales in existing markets;
- •
- increased competitive activity;
- •
- price changes in response to competitive factors;
- •
- supply shortages;
- •
- consumer preferences, buying trends and spending levels;
- •
- product price deflation;
- •
- cycling against any year of above-average sales results;
- •
- our ability to provide product offerings that generate new and repeat visits to our stores; and
- •
- the level of customer service that we provide in our stores.
These factors may cause our comparable store sales results to be materially lower than in recent periods, which could harm our business and result in a decline in the price of our common stock.
Our plans to convert, expand or remodel certain of our existing stores and build new stores in our current markets could require us to spend capital, which must be allocated among various projects. Failure to use our capital efficiently could adversely affect our financial condition and operating results.
Since August 2008, we have converted 94 Smart & Final stores to our Extra! format through a combination of store conversions, expansions and relocations. Our recent conversions and relocations have been completed for a net cash investment ranging from $2.5 million to $3.4 million. We intend to convert, expand or relocate additional stores over the next several years. However, we cannot assure you that our future activity will require similar levels of investment, reach the sales and profitability levels of our Smart & Final or Extra! stores or be completed at all. If any of these initiatives prove to be unsuccessful, we may experience reduced profitability and could be required to delay, significantly curtail or eliminate planned new store openings, conversions, expansions or remodels.
Perishable products make up a significant portion of our sales, and ordering errors or product supply disruptions may adversely affect our financial condition and operating results.
We could suffer significant inventory losses in the event of the loss of a major supplier, disruption of our supply chain, extended power outages, natural disasters or other catastrophic occurrences. We have a significant focus on perishable products, sales of which accounted for approximately 37% of our net sales for each of our fiscal years 2015 and 2016, and rely on various suppliers to provide and deliver our perishable product inventory on a continuous basis. Adverse weather conditions and natural disasters can lower crop yields and reduce crop size and quality, which in turn could reduce the available supply or increase the price of fresh produce.
While we have implemented certain systems to ensure our ordering is in line with demand, we cannot assure you that our ordering systems will always work efficiently, in particular in connection with the opening of new stores, which have limited or no ordering history. If we over-order, we may suffer inventory losses, which would adversely affect our financial condition and operating results.
Our private label products expose us to various risks.
We expect to continue to grow our exclusive private label products within many product categories. We have invested in our development and procurement resources and marketing efforts relating to these private label products. If we cannot anticipate, identify and react to changing consumer preferences relating to our private label products in a timely manner, or if our profit margins or sales
19
levels from such products decline, then our financial condition and operating results may be adversely affected.
Our private label products also subject us to certain specific risks in addition to those discussed elsewhere in this section, such as:
- •
- mandatory or voluntary product recalls;
- •
- infringements of our proprietary rights (including counterfeit or otherwise unauthorized goods);
- •
- claims related to the proprietary rights of third parties;
- •
- adverse publicity about the quality, safety or integrity of our products;
- •
- claims related to false advertising; and
- •
- other risks generally encountered by entities that source, sell and market private label products for retail.
An increase in sales of our private label products may also adversely affect sales of our suppliers' products, which may, in turn, adversely affect our relationship with our suppliers. Our failure to adequately address some or all of these risks could have a material adverse effect on our business, financial condition and operating results.
Real or perceived quality or food safety concerns could adversely affect our business, operating results and reputation.
Brand value is based in large part on perceptions of subjective qualities, and even isolated incidents can erode trust and confidence, particularly if they result in governmental investigations, litigation or adverse publicity, especially in social media outlets, all of which can adversely affect these perceptions and lead to adverse effects on our business, operating results and reputation. We believe our customers hold us to a high food safety standard. Real or perceived concerns regarding the safety of our food products or the safety and quality of our food supply chain, whether or not ultimately based on fact and whether or not involving products sold at our stores, could cause consumers to avoid shopping with us, and could adversely affect our financial condition and operating results, even if the basis for the concern is outside of our control. Any lost confidence on the part of consumers would be difficult and costly to reestablish.
Products we sell could cause unexpected side effects, illness, injury or death that could result in the discontinuance of such products or expose us to litigation, either of which could result in unexpected costs and damage to our reputation.
There is increasing governmental scrutiny and public awareness of food safety. Unexpected side effects, illness, injury or death caused by products we sell could result in the discontinuance of sales of these products or prevent us from achieving market acceptance of the affected products. Such side effects, illnesses, injuries and deaths could also expose us to product liability or negligence lawsuits. Any claims brought against us may exceed our existing or future insurance policy coverage or limits. Any judgment against us that is in excess of our policy limits would have to be paid from our cash reserves, which would reduce our capital resources. Also, we may not have sufficient capital resources to pay a judgment, in which case our creditors could levy against our assets. The real or perceived sale of contaminated or harmful products would cause negative publicity regarding our company, brand or products, which could in turn harm our reputation and net sales and adversely affect our business, financial condition and operating results.
20
If we fail to maintain our reputation and the value of our brand, our sales may decline.
We believe our continued success depends on our ability to maintain and grow the value of our Smart & Final, Extra! and Cash & Carry brands. Maintaining, promoting and positioning our brands and reputation will depend largely on the success of our marketing and merchandising efforts and our ability to provide a consistent, high quality customer experience. Brand value is based in large part on perceptions of subjective qualities, and even isolated incidents can erode trust and confidence, particularly if they result in governmental investigations, litigation or adverse publicity. Our brands could be adversely affected if we fail to achieve these objectives or if our public image or reputation were to be tarnished by negative publicity.
The current geographic concentration of our stores and net sales creates an exposure to local or regional downturns or catastrophic occurrences.
As of January 1, 2017, we operated 230 Smart & Final stores in California, representing 93% of our total Smart & Final stores and accounting for 95% of Smart & Final banner sales in fiscal year 2016. Also, as of January 1, 2017, we operated 44 Cash & Carry stores in the Pacific Northwest (Washington, Oregon and Idaho), representing 75% of our total Cash & Carry stores and accounting for 77% of Cash & Carry banner sales in fiscal year 2016. In addition, we source a significant portion of our produce from California.
As a result, our business is currently more susceptible to regional conditions than the operations of more geographically diversified competitors and we are vulnerable to economic downturns in those regions. Any unforeseen events or circumstances that adversely affect the areas in which we have stores or from which we obtain products, particularly in California and the Pacific Northwest, could adversely affect our financial condition and operating results. These factors include, among other things, changes in demographics, population, employee bases and economic conditions, wage increases, severe weather conditions, power outages and other catastrophic occurrences. Such conditions may result in reduced customer traffic and spending in our stores, physical damage to our stores, loss of inventory, closure of one or more of our stores, inadequate work force in our markets, temporary disruption in the supply of products, delays in the delivery of goods to our stores and a reduction in the availability of products in our stores. Any of these factors may disrupt our business and adversely affect our financial condition and operating results.
Disruption of supplier relationships could adversely affect our business.
We source our products from over 1,400 vendors and suppliers. The cancellation of our distribution arrangement with or the disruption, delay or inability of any of these vendors or suppliers to deliver products to our stores could cause operational disruptions or delays or increased or unexpected costs including, among others, costs associated with finding alternative vendors or suppliers and obtaining inventory that meets our and our customers' standards.
As an example, Unified Grocers is the primary supplier of dry grocery and perishable products to our Cash & Carry stores, accounting for approximately 82% of our product requirements (measured at cost) for our Cash & Carry stores for fiscal year 2016 and 18% of our total Company product requirements (measured at cost) for fiscal year 2016. Since 1998, we have operated under a distribution arrangement with Unified Grocers. If our distribution arrangement with Unified Grocers was cancelled or Unified Grocers was unwilling or unable to supply our stores with dry grocery or perishable products, we could experience disruptions to our operations and incur unexpected expenses associated with finding one or more alternative suppliers or utilizing our own infrastructure to replace the products provided to and services performed for us by Unified Grocers.
21
Changes in commodity prices and availability may affect our financial condition and operating results.
Many products we sell include ingredients such as wheat, corn, oils, milk, sugar, cocoa and other commodities. Commodity prices worldwide are subject to significant price fluctuations. Any increase in commodity prices may cause our suppliers to seek price increases from us and price decreases may result in our competitors reducing retail prices on items containing such ingredients. We cannot assure you that we will be able to mitigate supplier efforts to increase our costs or competitive responses to decreasing prices, either in whole or in part. In the event we are unable to continue mitigating potential supplier price increases, we may consider raising our prices and our customers may be deterred by any such price increases. In addition, we may lower our retail prices in response to lower commodity costs or competitive conditions. Our financial condition and operating results may be adversely affected either through increased costs to us or lower prices and loss of customers due to competitive conditions, which may affect gross margins, or through reduced sales as a result of a decline in the number and average size of customer transactions.
While management believes that these commodities are not currently in short supply and all are readily available from our current independent suppliers, an interruption in the supply chains of or volatility in the markets for any of these commodities could have an adverse effect on their overall supply and impede our ability or that of our suppliers to obtain products containing these commodities. Such a decrease in their availability to us or our suppliers, whether as a result of increased prices or otherwise, could adversely affect our financial condition and operating results.
Any significant interruption in the operations of our distribution centers or common carriers could disrupt our ability to deliver our products in a timely manner.
We distribute our products through seven distribution centers in California. The operations of five of these distribution centers are outsourced to third parties. See "Item 2—Properties." We also maintain relationships with numerous common carriers. Any significant interruption in the operation of our distribution center infrastructure, such as disruptions due to fire, severe weather or other catastrophic events, power outages, labor disagreements or shipping problems, or any disruption or cancellation of our contractual relationships with the third party operators of our distribution centers, could adversely affect our ability to distribute products to our stores. Such interruptions could result in lost sales and a loss of customer loyalty to our brands. While we maintain business interruption and property insurance, if the operation of our distribution centers were interrupted for any reason causing delays in shipment of products to our stores, our insurance may not be sufficient to cover losses we experience, which could adversely affect our business, financial condition and operating results.
We rely on common carriers, including rail and trucking, to transport products from our suppliers to our central distribution centers and from these centers to our stores. A disruption in the services of common carriers due to weather, employee strikes, increases in fuel costs or other unforeseen events, or any disruption or cancellation of our contractual relationships with our common carriers, could affect our ability to maintain sufficient quantities of inventory in our stores.
Our failure to comply with laws, rules and regulations affecting us and our industry could adversely affect our financial condition and operating results.
We are subject to numerous federal, state and local laws, rules and regulations that affect our business, such as those affecting food manufacturing, food and drug distribution, retailing, labor and employment and environmental practices, including hazardous waste disposal, accounting standards and taxation requirements. We must also comply with numerous provisions regulating, among other things, health and sanitation standards, food labeling and safety, equal employment opportunity, minimum wages and licensing for the sale of food, drugs and alcoholic beverages. Our ongoing efforts related to compliance with such laws, rules and regulations, including with respect to implementation of
22
immigration legislation, recently enacted food safety and health care reform legislation, new mandates, fees and taxes and stricter regulatory oversight, create uncertainty about the probability and effect of future regulatory changes and can significantly affect our operations and compliance costs. We cannot predict future laws, rules and regulations or the effect they will have on our financial condition and operating results, but in any event, additional record keeping, increased costs of recruiting, training and retaining employees, expanded documentation of the properties of certain products, and expanded or different labeling required by such laws, rules and regulations, could significantly increase our costs of doing business could adversely affect our business, financial condition and operating results.
As is common in our industry, we rely on our suppliers, including suppliers of our private label products, to ensure that the products they sell to us comply with all applicable regulatory and legislative requirements. In general, we seek certifications of compliance, representations and warranties, indemnification and/or insurance from our suppliers. However, even with adequate insurance and indemnification, any claims of non-compliance could significantly damage our reputation and consumer confidence in our products. In order to comply with applicable statutes and regulations, our suppliers have from time to time recalled, reformulated, eliminated or relabeled certain of their products.
In addition, many of our customers rely on food stamps and other governmental assistance programs to supplement their grocery-shopping budgets. As a result, any change in the ability of our customers to obtain food stamps and other governmental assistance could adversely affect our business, financial condition and operating results.
General economic conditions that affect consumer spending could adversely affect our business, financial condition and operating results.
The food retail and foodservice industries are sensitive to changes in general economic conditions. Recessionary economic cycles, increases in interest rates, higher prices for commodities, fuel and other energy, inflation, high levels of unemployment and consumer debt, depressed home values, high tax rates and other economic factors that affect consumer spending and confidence or buying habits may adversely affect the demand for products we sell in our stores. In recent years, the U.S. economy has experienced volatility due to uncertainties related to energy prices, credit availability, difficulties in the banking and financial services sectors, fluctuations in home values and retirement accounts, high unemployment and falling consumer confidence. As a result, consumers could shift their spending to lower-priced competition, such as warehouse membership clubs, dollar stores or extreme value formats. In addition, inflation or deflation could affect our business. Food deflation could reduce sales growth and profit margins, while food inflation, combined with reduced consumer spending, could reduce gross profit margins. As a result of any of these factors, our business, financial condition and operating results could be adversely affected.
A widespread health epidemic could adversely affect our business.
Our business could be severely affected by a widespread regional, national or global health epidemic. A widespread health epidemic may cause customers to avoid public gathering places such as our stores or otherwise change their shopping behaviors. Additionally, a widespread health epidemic could adversely affect our business by disrupting production and delivery of products to our stores and by affecting our ability to appropriately staff our stores.
If we are unable to attract, train and retain, or maintain satisfactory relations with, our employees we may not be able to grow or successfully operate our business.
The food retail and foodservice industries are labor intensive. Our continued success is dependent in part upon our ability to attract, train and retain qualified employees who understand and appreciate our culture and can represent our brands effectively and establish credibility with our business partners
23
and customers. We face intense competition for qualified employees, many of whom are subject to offers from competing employers. Our ability to meet our labor needs, while controlling wage and labor-related costs, is subject to numerous external factors, including the availability of a sufficient number of qualified persons in the work force in the markets in which we operate, unemployment levels within those markets, unionization of the available work force, prevailing wage rates, changing demographics, health and other insurance costs and changes in employment legislation. If we fail to maintain competitive wages, the quality of our workforce could decline and cause our customer service to suffer. However, increasing our wages could cause our profit margins to decrease. If we are unable to hire and retain employees capable of meeting our business needs and expectations, our business and brand images may be impaired. Any failure to meet our staffing needs or any material increase in turnover rates of our employees or employee wages may adversely affect our business, financial condition and operating results.
As of January 1, 2017, we had 11,949 employees. 214 of our employees, all of whom work in certain Cash & Carry stores, are members of the Teamsters and are covered by a collective bargaining agreement. We may experience pressure from labor unions or become the target of campaigns similar to those faced by our competitors. The unionization of a more significant portion of our workforce, particularly at our Company-operated distribution centers and Smart & Final stores, could increase the overall costs at the affected locations and adversely affect our flexibility to run our business competitively and otherwise adversely affect our business, financial condition and operating results.
Labor relations issues arise from time to time, including issues in connection with union efforts to represent employees at our stores and distribution centers, and with the negotiation of new collective bargaining agreements. If we fail to maintain satisfactory relations with our employees or with the Teamsters, we may experience labor strikes, work stoppages or other labor disputes. Negotiation of collective bargaining agreements also could result in higher ongoing labor costs. Also, our recruiting and retention efforts and efforts to increase productivity may not be successful and there may be a shortage of qualified employees in future periods. Any such shortage would decrease our ability to effectively serve our customers. Such a shortage would also likely lead to higher wages for employees and a corresponding reduction in our operating results.
We have obligations under our defined benefit employee pension plans and may be required to make plan contributions in excess of our current estimates.
We sponsor one single-employer qualified defined benefit pension plan (the "Single-Employer Plan"), which, with limited exceptions, was frozen in 2008 with respect to new participants. In addition, we participate through our Cash & Carry operations in one multiemployer qualified defined benefit pension plan, the Western Conference of Teamsters Pension Plan (the "Multiemployer Plan"), on behalf of our union-affiliated employees, and we are required to make contributions to this plan under our collective bargaining agreement. Neither the Single-Employer Plan nor the Multiemployer Plan are fully funded based on standards provided by the Pension Benefit Guaranty Corporation (the "PBGC"), in part due to increases in the costs of benefits provided or paid under the plans as well as lower returns on plan assets. Our funding requirements vary based upon plan asset performance, interest rates and actuarial assumptions. Poorer than assumed asset performance and continuing low interest rates may result in increased future funding contributions by us and, with respect to the Multiemployer Plan, other participating employers.
Going forward, our required contributions to the Multiemployer Plan could also increase as a result of many factors, including the outcome of collective bargaining with the Teamsters, actions taken by the trustee that manages the plan, government regulations, the actual return on assets held in the plan and the payment of a withdrawal liability if we choose to exit the plan. Our risk of future increased payments may be greater if other participating employers withdraw from the Multiemployer
24
Plan and are not able to pay the total liability assessed as a result of such withdrawal or if the pension plan adopts surcharges and/or increased pension contributions as part of a rehabilitation plan.
Pursuant to the Employee Retirement Income Security Act of 1974, as amended ("ERISA"), the PBGC has the right, subject to satisfaction of certain statutory requirements, to involuntarily terminate the pension plans described above (thus accelerating funding obligations) or enter into an alternative arrangement with us to prevent such termination. We expect to fund certain excess contributions to the Single-Employer Plan through plan year 2018 under the terms of an agreement with the PBGC that we entered into in connection with the Ares Acquisition. The amounts and timing of the remaining contributions we expect to make to the pension plans described above reflect a number of actuarial and other estimates and assumptions with respect to our expected plan funding obligations. The actual amounts and timing of these contributions will depend upon a number of factors and the actual amounts and timing of our future plan funding contributions may differ materially from those presented in this Annual Report.
The minimum wage and cost of providing employee benefits continues to increase and is subject to factors outside of our control.
Certain of our employees are paid at rates related to the federal minimum wage. Many of our stores are located in states, including California, where the minimum wage is greater than the federal minimum wage and receive compensation equal to that state's minimum wage. The California minimum wage increased to $10.50 per hour effective January 1, 2017. Moreover, municipalities may set minimum wages above the applicable state standards. Any further increases in the federal minimum wage or the enactment of additional state or local minimum wage increases could increase our labor costs.
We provide health benefits to substantially all of our full-time employees and to certain part-time employees depending on average hours worked. Though employees generally pay a portion of the cost of such benefits, our cost of providing these benefits has increased steadily over the last several years. We anticipate future increases in the cost of health benefits, partly, but not entirely, as a result of the implementation of the Patient Protection and Affordable Care Act enacted in 2010 (the "ACA"), as well as other healthcare reform legislation which may be enacted by Congress and state legislatures, including modification to or the repeal of the ACA. Due to provisions requiring phasing-in over time, changes to our healthcare costs structure could have a significant, negative impact on our future business. If the ACA is repealed or modified or if new legislation is passed, such action could significantly increase costs of the healthcare benefits provided to our employees, the ultimate costs of which and the potentially adverse impact to the Company and its employees cannot be quantified at this time. If we are unable to control healthcare and pension costs, we may experience increased operating costs, which may adversely affect our financial condition and operating results.
The loss of any of our executive officers could adversely affect our business.
We are dependent upon each of our executive officers listed under "Management—Executive Officers." Losing the services of any or a significant number of such individuals could adversely affect our business, as we may not be able to find suitable individuals to replace them on a timely basis, if at all. In addition, any such departure could be viewed negatively by investors and analysts, which may cause our stock price to decline. We do not maintain key person insurance on any employee, though we are the beneficiary of life insurance policies on certain members of management for the primary purpose of funding our obligations under our non-qualified benefit plan.
25
Energy costs are an increasingly significant component of our operating expenses and increasing energy costs, unless offset by more efficient usage or other operational responses, may affect our financial condition and operating results.
We use natural gas, water, sewer and electricity in our stores and gasoline and diesel in trucks that deliver products to our stores. We may also be required to pay certain adjustments or other amounts pursuant to our supply and delivery contracts in connection with increases in fuel prices. Increases in energy costs, whether driven by increased demand, decreased or disrupted supply or an anticipation of any such events will increase the costs of operating our stores. We may not be able to recover these increased costs by raising prices charged to our customers. Any such increased prices may also exacerbate the risk of customers choosing lower-cost alternatives. In addition, if we are unsuccessful in attempts to protect against these increases in energy costs through long-term energy contracts, improved energy procurement, improved efficiency and other operational improvements, the overall costs of operating our stores will increase, which could adversely affect our financial condition and operating results.
Disruptions to or security breaches involving our information technology systems could harm our ability to run our business.
In connection with payment card sales and other transactions, including bank cards, debit cards, credit cards and other merchant cards, we process and transmit confidential banking and payment card information. Additionally, as part of our normal business activities, we collect and store sensitive personal information related to our employees, and in some circumstances customers, vendors and other parties. Despite our security measures, our information technology and infrastructure may be vulnerable to criminal cyber-attacks or security incidents due to employee error, malfeasance or other vulnerabilities. Any such incident could compromise our networks and the information stored there could be accessed, publicly disclosed, lost or stolen. Third parties may have the technology and know-how to breach the security of this information, and our security measures and those of our banks, merchant card processing and other technology vendors may not effectively prohibit others from obtaining improper access to this information. The techniques used by criminals to obtain unauthorized access to sensitive data change frequently and often are not recognized until launched against a target; accordingly, we may be unable to anticipate these techniques or implement adequate preventative measures. Any security breach could expose us to risks of data loss or impairment, regulatory and law enforcement investigations, litigation and liability and could seriously disrupt our operations and any resulting negative publicity could significantly harm our reputation and relationships with our customers and adversely affect our business, financial condition and operating results.
Furthermore, our systems and operations, and those of our third party Internet and other systems service providers, are vulnerable to damage or interruption from natural disasters and other catastrophic events, power outages, server failures, telecommunications and Internet service failures, computer viruses and denial-of-service attacks, physical or electronic breaches, sabotage, human errors and similar events. Any of these events could lead to system interruptions, processing, distribution, communication and order fulfillment delays and loss of critical data for us or our Internet and other systems service providers or suppliers, and could have an adverse effect on our business, financial condition and operating results. Because we are dependent on third-party service providers for the implementation and maintenance of certain aspects of our systems and operations and because some of the causes of system interruptions may be outside of our control, we may not be able to remedy such interruptions in a timely manner, if at all, and any system disruptions could adversely affect our business, financial condition and operating results.
26
We need to comply with credit and debit card security regulations.
As a merchant that processes credit and debit card payments from customers, we are required to comply with the Payment Card Industry Data Security Standards and other requirements imposed on us for the protection and security of our customers' credit and debit card information. If we are unable to remain compliant with these standards and requirements, our business and operations could be adversely affected because we could incur significant fines or penalties from payment card companies or be prevented in the future from accepting customer payments by means of a credit or debit card. We also may need to expend significant management and financial resources to become or remain compliant with these requirements, which could divert these resources from other initiatives and adversely affect our business, financial condition and operating results.
Legal proceedings could adversely affect our business, financial condition and operating results.
Our operations, which are characterized by a high volume of customer traffic and by transactions involving a wide variety of product selections, carry a higher exposure to consumer litigation risk when compared to the operations of companies operating in some other industries. Consequently, we may be a party to individual personal injury, product liability, intellectual property, employment-related and other legal actions in the ordinary course of our business, including litigation arising from food-related illness. The outcome of litigation, particularly class action lawsuits, is difficult to assess or quantify. Plaintiffs in these types of lawsuits may seek recovery of very large or indeterminate amounts, and the magnitude of the potential loss relating to such lawsuits may remain unknown for substantial periods of time. While we maintain insurance, insurance coverage may not be adequate or available and the cost to defend against future litigation may be significant. There may also be adverse publicity associated with litigation that may decrease consumer confidence in our business, regardless of whether the allegations are valid or whether we are ultimately found liable. As a result, litigation may adversely affect our business, financial condition and operating results.
In addition, we believe there is a growing number of employment (including "wage-and-hour"), health, environmental and other lawsuits against companies in our industry, especially in California. State, federal and local laws and regulations regarding employment (including minimum wage requirements), health and the environment change frequently and the ultimate cost of compliance cannot be precisely estimated. Any changes in laws or regulations, or the imposition or enforcement of new laws or regulations, including legislation that impacts employment, health, the environment, labor or trade, could adversely affect our business, financial condition and operating results.
We may be unable to adequately protect our intellectual property rights, which could harm our business, financial condition and operating results.
Our trademarks, service marks, copyrights, patents, trade secrets, domain names and other intellectual property are valuable assets that are critical to our success. The unauthorized reproduction or other misappropriation of our intellectual property could diminish the value of our brands or goodwill and cause a decline in our net sales. Any infringement or other intellectual property claim made against us, whether or not it has merit, could be time- consuming, result in costly litigation, cause product delays or require us to enter into royalty or licensing agreements. As a result, any such claim could have a material adverse effect on our business, financial condition and operating results.
Claims under our insurance plans and policies may differ from our estimates, which could adversely affect our operating results.
We use a combination of insurance and self-insurance plans to provide for the potential liabilities for workers' compensation, general liability (including, in connection with legal proceedings described above under "Risk Factors—Legal proceedings could adversely affect our business, financial condition
27
and operating results"), property insurance, director and officers' liability insurance, vehicle liability and employee health-care benefits. Liabilities associated with the risks that are retained by us are estimated, in part, by considering historical claims experience, demographic factors, severity factors and other actuarial assumptions. Our results could be adversely affected by claims and other expenses related to such plans and policies if future occurrences and claims differ from these assumptions and historical trends.
Changes in accounting standards may adversely affect reporting of our financial condition and operating results.
New accounting rules or regulations and varying interpretations of existing accounting rules or regulations have occurred and may occur in the future. A change in accounting rules or regulations may even affect our reporting of transactions completed before the change is effective, and future changes to accounting rules or regulations or the questioning of current accounting practices may adversely affect our results of operations. The Financial Accounting Standards Board (the "FASB") is focusing on several broad-based convergence projects, including accounting standards for revenue, financial instruments and leases. See Note 2 Summary of Significant Accounting Policies—Recently Issued Accounting Pronouncements to our accompanying audited consolidated financial statements contained elsewhere in this Annual Report on Form 10-K. In August 2010, the FASB issued an exposure draft outlining proposed changes to current lease accounting under accounting principles generally accepted in the United States of America ("U.S. GAAP") in FASB Accounting Standards Codification 840, "Leases." In July 2011, the FASB made the decision to issue a revised exposure draft, which was issued in May 2013. On February 25, 2016, the FASB issued final guidance on lease accounting, which will be effective for us in 2019. The new guidance requires lessees to put most leases on their balance sheets but recognize expenses on their income statements in a manner that is largely similar to current accounting. The guidance also eliminates real estate-specific provisions for all entities. Currently, substantially all of our leased properties are accounted for as operating leases with limited related assets and liabilities recorded on our balance sheet. The new accounting standard, as currently issued, would treat each lease as creating an asset and a liability and require the capitalization of such leases on the balance sheet. While this change would not impact the cash flow related to our store leases, we would expect our assets and liabilities to increase relative to the current presentation, which may impact our ability to raise additional financing from banks or other sources in the future. The guidance as issued may also affect the future reporting of our results from operations as both income and expense on leases previously accounted for as operating leases may be front-end loaded as compared to the existing accounting requirements. However, even if the new guidance is adopted as issued, certain incurrence ratios and other provisions under the credit agreements governing our credit facilities permit us to account for leases in accordance with the existing accounting requirements. As a result, our ability to incur additional debt or otherwise comply with such covenants may not directly correlate to our financial condition or results from operations as each would be reported under U.S. GAAP as so amended.
Our high level of fixed lease obligations could adversely affect our financial condition and operating results.
Our high level of fixed lease obligations will require us to use a significant portion of cash generated by our operations to satisfy these obligations and could adversely affect our ability to obtain future financing to support our growth or other operational investments. We will require substantial cash flows from operations to make our payments under our operating leases, which in some cases provide for periodic adjustments in our rent rates. If we are not able to make the required payments under the leases, the lenders to or owners of the relevant stores, distribution centers or administrative offices may, among other things, repossess those assets, which could adversely affect our ability to conduct our operations. In addition, our failure to make payments under our operating leases could trigger defaults under other leases or under agreements governing our indebtedness, which could cause the counterparties under those agreements to accelerate the obligations due thereunder.
28
Our lease obligations may require us to continue paying rent for store locations that we no longer operate.
We are subject to risks associated with our current and future store, distribution center and administrative office real estate leases. We generally cannot cancel our leases, so if we decide to close or relocate a location, we may nonetheless be committed to perform our obligations under the applicable lease, including paying the base rent for the remaining lease term. In addition, as our leases expire, we may fail to negotiate renewals, either on commercially acceptable terms or at all, which could adversely affect our business, financial condition and operating results.
The joint venture in Northwestern Mexico subject us to risks associated with the legislative, judicial, accounting, regulatory, political, economic and other risks and conditions specific to that country, which could adversely affect our business, financial condition and operating results.
We currently participate through one of our wholly owned subsidiaries in the operation of 15 Smart & Final stores in Northwestern Mexico through a joint venture. For fiscal years 2015 and 2016, our Mexican operations generated approximately 2.3% and 16.3%, respectively, of our income from continuing operations. Our future operating results in Mexico could be adversely affected by a variety of factors, most of which are beyond our control. These factors include political conditions and instability, economic conditions, legal and regulatory constraints, anti-money laundering laws and regulations, trade policies, currency regulations and other matters in this region, now or in the future. Foreign currency exchange rates and fluctuations may have an effect on our future costs or on future cash flows from our Mexican operations and could adversely affect our financial condition and operating results. Moreover, the economy in Mexico has in the past suffered from high rates of inflation and currency devaluations, which, if they occur again, could adversely affect our financial condition and operating results. Other factors that may affect, and additional risks inherent in, our Mexican operations include:
- •
- foreign trade, monetary and fiscal policies both of the U.S. and of Mexico, including such policies with respect to each other, which are
subject to uncertainty in connection with the transition of a new presidential administration in the United States;
- •
- laws, regulations and other activities of foreign governments, agencies and similar organizations;
- •
- risks associated with having facilities located in a country that has historically been less stable than the U.S.;
- •
- costs and difficulties of managing international operations; and
- •
- adverse tax consequences and greater difficulty in enforcing intellectual property rights in Mexico.
The various risks inherent in doing business in the U.S. generally also exist when doing business outside of the United States and may be exaggerated by the difficulty of doing business in numerous sovereign jurisdictions due to differences in culture, laws and regulations.
In Mexico, our associates, contractors or agents could, in contravention of our policies, engage in business practices prohibited by U.S. laws and regulations applicable to us, such as the Foreign Corrupt Practices Act, and we are subject to the risk that one or more of our associates, contractors or agents, including those based in or from countries where practices that violate such U.S. laws and regulations or the laws and regulations of other countries may be customary, will engage in business practices that are prohibited by our policies, circumvent our compliance programs and, by doing so, violate such laws and regulations. Any such violations, even if prohibited by our internal policies, could adversely affect our business, financial condition and operating results.
We also license certain of our trademarks to our Mexico joint venture for use in connection with operating the Smart & Final brand in Mexico. If the licensee fails to maintain the quality of the goods
29
and services used in connection with these trademarks, our rights to and the value of this and similar trademarks could potentially be harmed. Also, negative publicity relating to the licensee could also be incorrectly associated with us, which could harm our business.
We have significant debt service obligations and may incur additional indebtedness in the future, which could adversely affect our financial condition and operating results and our ability to react to changes to our business.
As of January 1, 2017, we had outstanding indebtedness of approximately $616.6 million (net of debt issuance costs) under our first lien term loan facility (the "Term Loan Facility") and outstanding borrowings of approximately $62.4 million (net of debt issuance costs) under our asset-based lending facility (the "Revolving Credit Facility" and, together with the Term Loan Facility, the "Credit Facilities"). Our existing indebtedness and any additional indebtedness we may incur in the future could require us to divert funds identified for other purposes for debt service and impair our liquidity position. If we cannot generate sufficient cash flow from operations to service our debt, we may need to refinance our debt, dispose of assets or issue equity to obtain necessary funds. We do not know whether we will be able to take any of such actions on a timely basis, on terms satisfactory to us or at all.
The fact that a substantial portion of our cash flow from operations could be needed to make payments on our indebtedness could have important consequences, including the following:
- •
- reducing our ability to execute our growth strategy, including new store development;
- •
- affecting our ability to continue to execute our operational strategies in existing stores;
- •
- increasing our vulnerability to general adverse economic and industry conditions or increased interests rates;
- •
- reducing the availability of our cash flow for other purposes;
- •
- limiting our flexibility in planning for or reacting to changes in our business and the market in which we operate, which would place us at a
competitive disadvantage compared to our competitors that may have less debt;
- •
- limiting our ability to borrow additional funds for working capital, new store growth, capital expenditures and other investments; and
- •
- failing to comply with the covenants in our debt agreements could result in all of our indebtedness becoming immediately due and payable.
Our ability to obtain necessary funds through borrowing will depend on our ability to generate cash flow from operations. Our ability to generate cash is subject to general economic, financial, competitive, legislative, regulatory and other factors that are beyond our control. If our business does not generate sufficient cash flow from operations or if future borrowings are not available to us under the Credit Facilities or otherwise in amounts sufficient to enable us to fund our liquidity needs, our financial condition and operating results may be adversely affected. Our inability to make scheduled payments on our debt obligations in the future would require us to refinance all or a portion of our indebtedness on or before maturity, sell assets, delay capital expenditures or seek additional equity investment.
30
Covenants in our debt agreements restrict our operational flexibility.
The agreements governing the Credit Facilities contain usual and customary restrictive covenants relating to our management and the operation of our business, including restrictions on the ability of certain of our domestic direct and indirect subsidiaries to:
- •
- incur or guarantee additional indebtedness;
- •
- incur or permit to exist certain liens;
- •
- enter into certain sale and lease-back transactions;
- •
- make certain investments, loans and advances;
- •
- effect certain mergers, consolidations, asset sales and acquisitions;
- •
- pay dividends on, or redeem or repurchase, capital stock, enter into transactions with affiliates, materially change their respective
businesses; and
- •
- repay or modify certain other agreements with respect to other material indebtedness or modify their respective organizational documents.
In addition, the Credit Facilities place certain restrictions on SF CC Intermediate Holdings, Inc., a direct wholly owned subsidiary of Smart & Final Stores, Inc. and a guarantor under the Credit Facilities ("Intermediate Holdings"), with respect to the incurrence or creation of additional liens on the equity interests of certain subsidiaries, the preservation of its corporate existence and the maintenance of its passive holding company status.
The Revolving Credit Facility includes a "springing" financial maintenance covenant, applicable when availability under the Revolving Credit Facility has fallen below a threshold level and for a specified period of time thereafter. At any time when the financial maintenance covenant is applicable, Smart & Final Stores LLC, the borrower under the Credit Facilities, is required to maintain a fixed charge coverage ratio of not less than 1.0 to 1.0. Our ability to satisfy the financial maintenance covenant under the Revolving Credit Facility, if applicable, could be affected by events beyond our control. Failure to comply with any of the covenants under either of the Credit Facilities could result in a default under the same and a cross-default from one Credit Facility to the other, which could cause our lenders to accelerate the timing of payments and exercise their lien on substantially all of our assets, which would adversely affect our business, financial condition and operating results.
Variable rate indebtedness subjects us to interest rate risk, which could cause our debt service obligations to increase significantly.
Our borrowings under the Credit Facilities bear interest at variable rates and expose us to interest rate risk. If interest rates increase, our debt service obligations on the variable rate indebtedness would increase even though the amount borrowed remains the same and our net income would decrease. A hypothetical 0.50% increase in LIBOR rates applicable to borrowings as of January 1, 2017 under the Term Loan Facility would increase interest expense by approximately $0.5 million per year related to such debt, and a hypothetical 0.50% increase in LIBOR rates applicable to borrowings under the Revolving Credit Facility as of January 1, 2017 would increase interest expense related to such debt by approximately $0.8 million per year, assuming the Revolving Credit Facility is fully borrowed.
Our ability to raise capital in the future may be limited.
Our business and operations may consume resources faster than we anticipate. To support our growth strategy, we must have sufficient capital to continue to make significant investments in our new and existing stores and advertising. We cannot assure you that cash generated by our operations will be sufficient to allow us to fund such expansion. In the future, we may need to raise additional funds
31
through credit, the issuance of new equity or debt securities or a combination of both. Additional financing may not be available on favorable terms or at all. If adequate funds are not available on acceptable terms, we may be unable to fund our capital requirements. If we obtain credit or issue new debt securities, the debt holders would have rights senior to holders of our common stock to make claims on our assets and the terms of any debt could restrict our operations, including our ability to pay dividends on our common stock. If we issue additional equity securities, existing stockholders will experience dilution and the new equity securities could have rights senior to those of our common stock. Because our decision to obtain credit or issue securities in any future offering will depend on market conditions and other factors beyond our control, we cannot predict or estimate the amount, timing or nature of such transactions. Thus, stockholders bear the risk of our future indebtedness or securities offerings reducing the market price of our common stock and/or diluting stockholders' interest.
In addition, the credit and securities markets and the financial services industry in the past decade have experienced disruption characterized by the bankruptcy, failure, collapse or sale of various financial institutions, increased volatility in securities prices, diminished liquidity and credit availability and intervention from the U.S. and other governments. The cost and availability of credit has been and may continue to be adversely affected by these conditions. We cannot be certain that funding for our capital needs will be available from our existing financial institutions and the credit and securities markets if needed, and if available, to the extent required, and on acceptable terms.
The Term Loan Facility matures on November 15, 2022, and the Revolving Credit Facility matures on the earlier of (a) July 19, 2021 and (b) to the extent the Term Loan Facility (and any refinancing of the Term Loan Facility) has not been paid in full, the date that is 60 days prior to the earliest scheduled maturity date of the Term Loan Facility (or such refinancing of the Term Loan Facility). If we cannot renew or refinance the Credit Facilities upon their respective maturities or, more generally, obtain funding when needed, in each case on acceptable terms, we may be unable to continue our current rate of growth and store expansion, which may have an adverse effect on our sales and operating results.
If our goodwill becomes impaired, we may be required to record a significant charge to earnings.
We have a significant amount of goodwill. As of January 1, 2017, we had goodwill of approximately $611.2 million, which represented approximately 31.3% of our total assets as of such date. Goodwill is reviewed for impairment on an annual basis in the fourth fiscal quarter or whenever events occur or circumstances change that would more likely than not reduce the fair value of our reporting unit below its carrying amount. Fair value is determined based on the discounted cash flows and comparable market values of our two reporting units (our Smart & Final stores and our Cash & Carry stores). If the fair value of the reporting unit is less than its carrying value, the fair value of the implied goodwill is calculated as the difference between the fair value of our reporting unit and the fair value of the underlying assets and liabilities, excluding goodwill. In the event an impairment to goodwill is identified, an immediate non-cash charge to earnings in an amount equal to the excess of the carrying value over the implied fair value would be recorded, which would adversely affect our operating results. See "Management's Discussion and Analysis of Financial Condition and Operating Results—Critical Accounting Estimates—Goodwill and Intangible Assets."
Determining market values using a discounted cash flow method requires that we make significant estimates and assumptions, including long-term projections of cash flows, market conditions and appropriate market rates. Our judgments are based on historical experience, current market trends and other information. In estimating future cash flows, we rely on internally generated forecasts for operating profits and cash flows, including capital expenditures. Based on our annual impairment test during fiscal years 2016, 2015 and 2014, no goodwill impairment charge was required to be recorded. Changes in estimates of future cash flows caused by items such as unforeseen events or changes in
32
market conditions could adversely affect our reporting units' respective fair values and result in an impairment charge. Factors that could cause us to change our estimates of future cash flows include a prolonged economic crisis, successful efforts by our competitors to gain market share in our core markets, our inability to compete effectively with other retailers or our inability to maintain price competitiveness. An impairment of a significant portion of our goodwill could adversely affect our financial condition and operating results.
Item 1B. Unresolved Staff Comments.
None.
As of January 1, 2017, we operated 305 stores in seven Western U.S. states, with an additional 15 stores in Northwestern Mexico in a joint venture, as shown in the chart below:
| |
Smart & Final | |
|
|||||||||||||
|---|---|---|---|---|---|---|---|---|---|---|---|---|---|---|---|---|
| |
Cash & Carry |
|
||||||||||||||
State/Country
|
Extra! | Legacy | Total | Total | ||||||||||||
California |
164 | 66 | 230 | 13 | 243 | |||||||||||
Washington |
— | — | — | 22 | 22 | |||||||||||
Oregon |
— | — | — | 19 | 19 | |||||||||||
Arizona |
4 | 4 | 8 | — | 8 | |||||||||||
Nevada |
4 | 4 | 8 | 1 | 9 | |||||||||||
Idaho |
— | — | — | 3 | 3 | |||||||||||
Utah |
— | — | — | 1 | 1 | |||||||||||
| | | | | | | | | | | | | | | | | |
Subtotal: |
172 | 74 | 246 | 59 | 305 | |||||||||||
Mexico |
— | 15 | 15 | — | 15 | |||||||||||
| | | | | | | | | | | | | | | | | |
Total: |
172 | 89 | 261 | 59 | 320 | |||||||||||
We lease substantially all of our stores from unaffiliated third parties. We believe that leasing our stores allows us to deploy capital in a more focused manner on store operations, and that the resulting cost of leased occupancy is comparable to the economic cost of owned stores. Our typical store lease has an initial 15 to 20 year term with renewal options of 5 to 15 years. For stores with expiring leases, we expect that we will be able to renegotiate these leases or relocate our stores as necessary on acceptable terms. We believe our portfolio of long-term leases is a valuable asset supporting our retail operations, but we do not believe that any individual store property is material to our financial condition or operating results.
33
As of January 1, 2017, we leased five distribution centers and our corporate office in Commerce, California from unaffiliated third parties. Our other two distribution centers are owned or leased by third parties. Information about such facilities is set forth in the table below:
Facility
|
Location | Square Footage* | Owned/Leased | Operated By | ||||||
|---|---|---|---|---|---|---|---|---|---|---|
Distribution Center |
Commerce, CA | 445,000 | Leased | Company | ||||||
Distribution Center |
Riverside, CA | 241,000 | Leased | Company | ||||||
Distribution Center |
Fontana, CA | 349,000 | Leased | Third Party | ||||||
Distribution Center |
Brea, CA | 100,000 | N/A | ** | Third Party | |||||
Distribution Center |
Chino, CA | 102,000 | Leased | Third Party | ||||||
Distribution Center |
Tracy, CA | 151,000 | Leased | Third Party | ||||||
Distribution Center |
Turlock, CA | 75,000 | N/A | ** | Third Party | |||||
Corporate Office |
Commerce, CA | 81,000 | Leased | Company | ||||||
| | | | | | | | | | | |
Total Square Footage: |
1,544,000 | |||||||||
- *
- Rounded
to the nearest 1,000 square feet
- **
- Properties owned or leased by a third party
34
On February 11, 2016, we received a subpoena from the District Attorney for the County of Yolo, California, seeking information concerning our handling, disposal and reverse logistics of potential hazardous waste at our stores and distribution centers in California. We have provided information and are cooperating with the authorities from multiple counties in California in connection with this ongoing matter. In the fourth quarter of 2016, we recorded a loss related to this matter in an amount considered to be immaterial. At this time, we cannot reasonably estimate possible additional loss or range of additional loss that may arise from this matter or whether this matter will have a material impact on our financial condition or operating results.
We are engaged in various other legal actions, claims and proceedings in the ordinary course of business, including claims related to employment related matters, breach of contracts, products liabilities and intellectual property matters resulting from our business activities. We do not believe that the ultimate determination of these actions, claims and proceedings will either individually or in the aggregate have a material adverse effect on our consolidated results of operations or financial position.
Item 4. Mine Safety Disclosures.
Not applicable.
35
Item 5. Market for Registrant's Common Equity, Related Stockholder Matters and Issuer Purchases of Equity Securities.
Market Information
Our common stock began trading publicly on the NYSE under the symbol "SFS" on September 24, 2014. As of January 1, 2017, there were approximately 485 registered holders of our common stock and the closing price per share of the common stock as listed on the NYSE composite tape was $14.10. The following table sets forth the high and low sales prices of our common stock as reported on the NYSE composite tape for the periods indicated.
| |
High | Low | |||||
|---|---|---|---|---|---|---|---|
First Quarter of 2016 |
$ | 18.67 | $ | 14.84 | |||
Second Quarter of 2016 |
16.68 | 13.31 | |||||
Third Quarter of 2016 |
16.16 | 12.16 | |||||
Fourth Quarter of 2016 |
15.10 | 11.55 | |||||
| |
High | Low | |||||
|---|---|---|---|---|---|---|---|
First Quarter of 2015 |
$ | 18.73 | $ | 14.54 | |||
Second Quarter of 2015 |
19.84 | 16.58 | |||||
Third Quarter of 2015 |
18.80 | 14.76 | |||||
Fourth Quarter of 2015 |
18.59 | 13.84 | |||||
Dividends
We have no current plans to pay dividends on our common stock. Any decision to declare and pay dividends in the future will be made at the sole discretion of our Board of Directors and will depend on, among other things, our results of operations, cash requirements, financial condition, contractual restrictions and other factors that our Board of Directors may deem relevant. Our Term Loan Facility contains covenants that would restrict our ability to pay cash dividends.
We did not declare or pay any dividends on our common stock during the year ended January 1, 2017.
Issuer Purchases of Equity Securities
The following table provides information about our stock repurchases activities during the fourth quarter of fiscal year 2016.
Period (1)
|
Total Number of Shares Purchased |
Average Price Paid per Share(2) |
Total Number of Shares Purchased as Part of Publicly Announced Plans or Programs(3) |
Maximum Dollar Value of Shares that May Yet be Purchased Under the Plan or Program (in thousands)(4) |
|||||||||
|---|---|---|---|---|---|---|---|---|---|---|---|---|---|
October 10 to November 6, 2016 |
308,474 | $ | 13.03 | 308,474 | $ | 15,016 | |||||||
November 7 to December 4, 2016 |
1,218 | 13.45 | — | 15,016 | |||||||||
December 5, 2016 to January 1, 2017 |
107,819 | 13.96 | 107,819 | 13,513 | |||||||||
| | | | | | | | | | | | | | |
Total |
417,511 | $ | 13.27 | 416,293 | |||||||||
- (1)
- Periodic information is presented by reference to our fiscal periods during the fourth quarter of fiscal year 2016.
36
- (2)
- Average
price per share includes related expense.
- (3)
- During
the twelve weeks ended January 1, 2017, 1,218 shares of common stock were surrendered to the Company by participants under our long-term incentive
plans to satisfy tax withholding obligations in connection with the vesting of 3,221 shares of restricted stock.
- (4)
- In the third quarter 2016, our Board of Directors authorized a program to repurchase up to $25 million of shares of our common stock. Repurchases under the share repurchase program commenced on September 19, 2016 and may occur through August 31, 2017. The specific timing and amount of the repurchases will be dependent on market conditions, applicable laws and other factors. In connection with the share repurchase program, we may acquire shares in open market transactions or privately negotiated transactions.
Recent Sales of Unregistered Securities
During the year ended January 1, 2017, we did not sell any equity securities that were not registered under the Securities Act.
Stock Performance Graph
The line graph below compares the cumulative total stockholder return on our common stock with the S&P Retail Index ("RLX") and the S&P 500 Index ("SPI") for the period from the completion of our initial public offering (the "IPO") on September 24, 2014 through January 1, 2017. The graph assumes an investment of $100 made at the closing of trading on September 24, 2014 in (i) our common stock, (ii) the stocks comprising the RLX and (iii) the stocks comprising the SPI. All values assume reinvestment of the full amount of all dividends, if any, into additional shares of the same class of equity securities at the frequency with which dividends were paid on such securities during the applicable time period. The stock price performance included in the line graph below is not necessarily indicative of future stock price performance.
37
Comparison of 27 Month Cumulative Total Return*
Among Smart & Final Stores, Inc., the S&P Retail Index and the S&P 500 Index
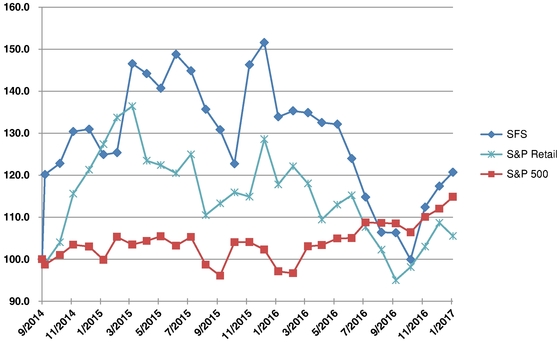
- *
- Total assumes $100 invested on September 24, 2014 in common stock or index with reinvestment of dividends.
This performance graph shall not be deemed "soliciting material" or to be "filed" with the SEC for purposes of Section 18 of the Exchange Act or otherwise subject to the liabilities under that section, and shall not be deemed to be incorporated by reference into any filing of Smart & Final Stores, Inc. under the Securities Act or the Exchange Act.
Item 6. Selected Financial Data.
The following table sets forth our selected historical consolidated financial information and other data for the periods and dates indicated, and should be read together with "Risk Factors," "Management's Discussion and Analysis of Financial Condition and Results of Operations" and our audited consolidated financial statements and related notes to consolidated financial statements contained elsewhere in this Annual Report. Our historical results are not necessarily indicative of our financial condition or operating results to be expected in the future.
In connection with the Ares Acquisition, as a result of the application of business combination accounting, the assets and liabilities of the Company were adjusted to their estimated fair values as of the closing date of the Ares Acquisition. We refer to the Company prior to the Ares Acquisition as the "Predecessor." The periods prior to the Ares Acquisition are referred to as the "Predecessor periods" and the periods following the Ares Acquisition are referred to as the "Successor periods." Our fiscal
38
year 2012 is therefore divided into a Predecessor period from January 2, 2012 through November 14, 2012 and a Successor period from November 15, 2012 through December 30, 2012.
| |
Successor(1) | |
Predecessor | ||||||||||||||||||
|---|---|---|---|---|---|---|---|---|---|---|---|---|---|---|---|---|---|---|---|---|---|
| |
|
|
|
|
Period From November 15, 2012 Through December 30, 2012 |
|
Period From January 2, 2012 Through November 14, 2012 |
||||||||||||||
| |
Fiscal Year 2016 |
Fiscal Year 2015 |
Fiscal Year 2014 |
Fiscal Year 2013 |
|
||||||||||||||||
| |
|
||||||||||||||||||||
| |
|
||||||||||||||||||||
Consolidated Statement of Operations Data: |
|||||||||||||||||||||
Net sales |
$ | 4,341,795 | 3,970,980 | $ | 3,534,244 | $ | 3,210,293 | $ | 378,550 | $ | 2,664,162 | ||||||||||
Cost of sales, buying and occupancy |
3,712,291 | 3,372,120 | 3,006,955 | 2,736,357 | 333,787 | 2,265,154 | |||||||||||||||
| | | | | | | | | | | | | | | | | | | | | | |
Gross margin |
629,504 | 598,860 | 527,289 | 473,936 | 44,763 | 399,008 | |||||||||||||||
Operating and administrative expenses |
582,486 | 503,995 | 438,528 | 387,133 | 51,727 | 355,681 | |||||||||||||||
Income (loss) on property sales |
— | — | — | — | 5 | (8,818 | ) | ||||||||||||||
| | | | | | | | | | | | | | | | | | | | | | |
Income (loss) from operations |
47,018 | 94,865 | 88,761 | 86,803 | (6,959 | ) | 34,509 | ||||||||||||||
Interest expense, net |
32,654 | 32,687 | 37,602 | 50,365 | 7,133 | 20,761 | |||||||||||||||
(Loss) on early extinguishment of debt(2) |
(4,978 | ) | (2,192 | ) | (2,224 | ) | (24,487 | ) | — | — | |||||||||||
Equity in earnings of joint venture |
1,525 | 1,378 | 1,037 | 1,649 | — | 820 | |||||||||||||||
| | | | | | | | | | | | | | | | | | | | | | |
Income (loss) from continuing operations before income taxes |
10,911 | 61,364 | 49,972 | 13,600 | (14,092 | ) | 14,568 | ||||||||||||||
Income tax (provision) benefit |
2,037 | (23,102 | ) | (16,854 | ) | (5,429 | ) | 4,804 | (244 | ) | |||||||||||
| | | | | | | | | | | | | | | | | | | | | | |
Net income (loss) |
$ | 12,948 | 38,262 | $ | 33,118 | $ | 8,171 | $ | (9,288 | ) | $ | 14,324 | |||||||||
| | | | | | | | | | | | | | | | | | | | | | |
| | | | | | | | | | | | | | | | | | | | | | |
| | | | | | | | | | | | | | | | | | | | | | |
Per Share Data: |
|||||||||||||||||||||
Basic earnings (loss) per share |
$ | 0.18 | 0.52 | $ | 0.54 | $ | 0.14 | $ | (0.16 | ) | $ | 1.07 | |||||||||
Diluted earnings (loss) per share |
$ | 0.17 | 0.50 | $ | 0.52 | $ | 0.14 | $ | (0.16 | ) | $ | 1.03 | |||||||||
Weighted average shares outstanding—basic |
72,727,071 | 73,121,964 | 61,455,584 | 57,030,099 | 56,848,190 | 13,363,635 | |||||||||||||||
Weighted average shares outstanding—diluted |
78,026,159 | 77,141,621 | 63,841,118 | 59,387,487 | 56,848,190 | 13,927,566 | |||||||||||||||
Selected Operating Data: |
|||||||||||||||||||||
Comparable store sales growth(3) |
(0.5 | )% | 4.5 | % | 6.3 | % | 4.0 | % | 5.3 | % | 6.9 | % | |||||||||
Smart & Final banner |
(0.6 | )% | 4.4 | % | 5.0 | % | 3.4 | % | 5.2 | % | 7.3 | % | |||||||||
Cash & Carry banner |
(0.3 | )% | 4.5 | % | 10.0 | % | 6.1 | % | 5.5 | % | 5.4 | % | |||||||||
Stores at end of period |
305 | 276 | 254 | 240 | 235 | 236 | |||||||||||||||
Smart & Final banner |
246 | 221 | 201 | 188 | 183 | 184 | |||||||||||||||
Extra! format |
172 | 127 | 98 | 69 | 56 | 56 | |||||||||||||||
Cash & Carry banner |
59 | 55 | 53 | 52 | 52 | 52 | |||||||||||||||
Square feet at end of period |
7,260,880 | 6,034,336 | 5,342,915 | 4,899,403 | 4,756,165 | 4,774,486 | |||||||||||||||
Average store size at end of period(4) |
23,806 | 21,864 | 21,035 | 20,414 | 20,239 | 20,231 | |||||||||||||||
Consolidated Balance Sheet Data: |
|||||||||||||||||||||
Cash and cash equivalents |
$ | 54,235 | 59,327 | $ | 106,847 | $ | 53,699 | $ | 35,987 | $ | 92,676 | ||||||||||
Total assets |
1,952,419 | 1,817,081 | 1,729,292 | 1,599,541 | 1,572,914 | 1,049,039 | |||||||||||||||
Long-term debt (including debt discount) |
616,588 | 586,956 | 588,117 | 706,191 | 704,734 | 304,074 | |||||||||||||||
Total stockholders' equity |
552,249 | 566,571 | 517,208 | 341,859 | 307,023 | 287,076 | |||||||||||||||
- (1)
- All
of the earnings per share data, share numbers, share prices and exercise prices have been adjusted on a retroactive basis for the Successor periods to reflect
the 190-for-one stock split effected on September 19, 2014.
- (2)
- In
the third quarter of fiscal year 2016, we recognized a loss on early extinguishment of debt of $5.0 million in connection with an amendment to our Term
Loan Facility and the write-off of unamortized debt discount and debt issuance costs. In the second quarter of fiscal year 2015, we recognized a loss on early extinguishment of debt of
$2.2 million in connection with an amendment to our Term Loan Facility and the write-off of unamortized debt discount and debt issuance costs. In the third quarter of fiscal year 2014, we
recognized a loss on early extinguishment of debt of $2.2 million in connection with the use of the net proceeds of the IPO to repay a portion of our outstanding debt. In the second and fourth
quarters of fiscal year 2013, we recognized a loss on early extinguishment of debt of $24.5 million in the aggregate in connection with a repricing amendment to the Term Loan Facility.
- (3)
- For
more information regarding our calculation of comparable store sales growth, see "Management's Discussion and Analysis of Financial Condition and Results of
Operations—Components of Results of Operations—Net Sales" on page 46 of this Annual Report.
- (4)
- Average store size is calculated as the gross square feet divided by the stores open at the end of the period presented.
39
Item 7. Management's Discussion and Analysis of Financial Condition and Results of Operations.
You should read the following discussion and analysis of our financial condition and results of operations together with "Selected Financial Data," and the consolidated financial statements and related notes that are included elsewhere in this Annual Report. This discussion contains forward-looking statements based upon current expectations that involve risks and uncertainties. Our actual results may differ materially from those anticipated in these forward-looking statements as a result of various factors, including those set forth under "Risk Factors" or in other parts of this Annual Report. Please also see the section entitled "Forward-Looking Statements."
Business Overview
We are a high-growth, value-oriented food retailer serving a diverse demographic of household and business customers through two complementary and highly productive store banners: Smart & Final and Cash & Carry. As of January 1, 2017, we operated 305 non-membership, warehouse-style stores throughout the Western United States, with an additional 15 stores in Northwestern Mexico in a joint venture. We have a differentiated merchandising strategy that emphasizes high quality perishables, a wide selection of private label products, products tailored to business and foodservice customers and products offered in a broad range of sizes.
We consider each of our store banners to be an operating segment, and have concluded that presenting disaggregated information for our two operating segments provides meaningful information because of differences in their respective economic characteristics and customer bases. For the fifty-two weeks ended January 1, 2017, our Smart & Final and Cash & Carry segments represented approximately 78.3% and 21.7%, respectively, of our consolidated sales, compared to 76.5% and 23.5%, respectively, for the fifty-three weeks ended January 3, 2016.
Our Smart & Final segment is based in Commerce, California and includes, as of January 1, 2017, 74 legacy Smart & Final stores and 172 Extra! format stores, which focus on household and business customers and are located in California, Arizona and Nevada. Our Smart & Final stores offer extensive selections of fresh perishables and everyday grocery items, together with a targeted selection of foodservice, packaging and janitorial products, under both national and private label brands. Our Extra! store format offers a one-stop shopping experience with a more expansive selection of items than our legacy Smart & Final stores and an emphasis on perishables and household items. The continued development of our Extra! store format, through additional new store openings and conversions and relocations of legacy Smart & Final stores, is the cornerstone of our growth strategy.
Our Cash & Carry segment is based in Portland, Oregon and includes, as of January 1, 2017, 59 Cash & Carry stores, which focus primarily on business customers and are located in Washington, Oregon, Northern California, Utah, Idaho and Nevada. Our Cash & Carry stores offer a wide variety of SKUs tailored to the core needs of foodservice customers such as restaurants, caterers and a wide range of other foodservice businesses in a flexible mix of "case quantity" or single unit purchases.
Outlook
We plan to expand our store footprint, primarily through opening new Extra! stores in existing and adjacent markets, and over time by entering new markets. We believe we have a scalable operating infrastructure to support our anticipated growth which, together with our flexible real estate strategy and advanced distribution capabilities, position us to capitalize on our growth opportunities. We plan to opportunistically continue converting our larger legacy Smart & Final stores to our Extra! format and investing in our legacy Smart & Final stores that are not candidates for conversion to the Extra! format by completing major remodel projects and targeted relocations. We also plan to grow our Cash & Carry store footprint.
40
In addition, we plan to leverage our significant investments in management, information technology systems, infrastructure and marketing to grow our comparable store sales and enhance our operating margins through execution of a number of key initiatives, including initiatives to increase net sales of perishable products in our Smart & Final stores, to increase net sales of private label products in our Smart & Final and Cash & Carry stores, and to expand our marketing programs in our Smart & Final and Cash & Carry stores. We expect each of these key initiatives, if successful, to generate increased comparable store sales and also expect our initiative to increase net sales of private label products to enhance our operating margins, as private label products have historically generated higher gross margins relative to national branded products.
Factors Affecting Our Results of Operations
Store Openings
We expect that a primary driver of our growth in sales and gross margin will be the continued development of our Extra! format stores through new store openings, conversions and relocations. We also plan to opportunistically open new Cash & Carry stores, which will further amplify sales and gross margin. Our results of operations have been and will continue to be materially affected by the timing and number of new store openings, including conversions and relocations of legacy Smart & Final stores to the Extra! format, and the amount of associated costs. For example, we typically incur higher than normal employee costs at the time of a new store opening, conversion or relocation associated with set-up and other related costs. Also, our operating margins are typically negatively affected by promotional discounts and other marketing costs associated with new store openings, conversions and relocations, as well as higher inventory markdowns and costs related to hiring and training new employees in new stores. Additionally, promotional activities may result in higher than normalized sales in the first several weeks following a new store opening. Our new Extra! and Cash & Carry stores typically build a customer base over time and reach a mature sales growth rate in the third and fourth year after opening, respectively. As a result, our new stores generally have lower margins and higher operating expenses, as a percentage of sales, than our more mature stores.
Based on our experience, we expect that certain of our new Extra! stores will impact sales at our existing stores in close proximity in the short term. However, we believe that over the longer term any such sales impact will be more than offset by future sales growth and expanded market share.
Developments in Competitive Landscape
We operate in the highly competitive food retail and foodservices industries. We compete on a combination of factors, including price, product selection, product quality, convenience, customer service, store format and location. Our principal competitors include conventional grocers such as Albertsons and Kroger, discounters and warehouse clubs such as Costco, mass merchandisers such as Walmart and Target, foodservice delivery companies such as Sysco and US Foods, as well as online retailers and other specialty stores. Some of our competitors may have greater financial or marketing resources than we do and may be able to devote greater resources to sourcing, promoting and selling their products. These competitors could use these advantages to take certain measures, including reducing prices that could adversely affect our competitive position, business, financial condition and operating results.
Pricing Strategy and Investments in "Everyday Low Prices"
We have a commitment to "everyday low prices," which we believe positions both our Smart & Final and Cash & Carry stores as top of mind destinations for our target customers. Pricing in our Smart & Final stores is targeted to be substantially lower than that of conventional grocers and competitive with that of large discounters and warehouse clubs, with no membership fee requirement.
41
Pricing in our Cash & Carry stores is targeted to be substantially lower than our foodservice delivery competitors, with no membership fee requirement and greater price transparency to customers and no minimum order size, and competitive with typical warehouse clubs.
Our pricing strategy is geared toward optimizing the pricing and promotional activities across our mix of higher-margin perishable items and everyday value-oriented traditional grocery items. This strategy involves determining prices that will improve our operating margins based upon our analysis of how demand varies at different price levels as well as our costs and inventory levels.
Private Label Offerings
Private label products are key components of our pricing and merchandising strategy, as we believe they build and deepen customer loyalty, enhance our value proposition, generate higher gross margins relative to national brands and improve the breadth and selection of our product offering. We believe that a strong private label offering has become an increasingly important competitive advantage in the food retail and foodservices industries.
As of January 1, 2017, for fiscal year 2016, we had a portfolio of approximately 3,000 private label items, which represented 28.1% of our Smart & Final banner sales. Typically, our private label products generate a higher gross margin as a percentage of sales as compared to a comparable national brand product.
General Economic Conditions and Changes in Consumer Behavior
The overall economic environment in the markets we serve, particularly California, and related changes in consumer behavior, have a significant impact on our business and results of operations. In general, positive conditions in the broader economy promote customer spending in our stores, while economic weakness results in reduced customer spending. Macroeconomic factors that can affect customer spending patterns, and thereby our results of operations, include employment rates, business conditions, changes in the housing market, the availability of consumer credit, interest rates, tax rates and fuel and energy costs.
Infrastructure Investment
Our historical results of operations reflect the impact of our ongoing investments in infrastructure to support our growth. We have made significant investments in senior management, information technology systems, supply chain systems and marketing. These investments include significant additions to our personnel, including experienced industry executives and management and merchandising teams to support our long-term growth objectives. We plan on continuing to make targeted investments in our infrastructure as necessary to support our growth.
Inflation and Deflation Trends
Inflation and deflation can impact our financial performance. During inflationary periods, our results of operations can be positively impacted as we sell lower-priced inventory in a higher price environment. In contrast, food deflation could negatively impact our results of operations by reducing sales growth and earnings if our competitors react by lowering their retail pricing. The short-term impact of inflation and deflation is largely dependent on whether or not we pass the effects through to our customers, which is subject to competitive market conditions. In recent inflationary periods, we have generally been able to pass through most cost increases. Food inflation rose sharply in the first half of 2014, but moderated in the third quarter of 2014. Beginning in the second quarter of 2015 and continuing throughout 2016, we experienced deflation in certain food and non-food commodities. Market dynamics have caused us to pass cost decreases through to customers, which has negatively impacted sales growth and income from operations in certain categories, primarily in proteins, but also
42
in high volume categories like cheese and fresh produce. We expect deflationary pressures to continue into the first half of 2017, with deflation easing as we move into the second half of the year.
Components of Results of Operations
Net Sales
We recognize revenue from the sale of products at the point of sale. Discounts provided to customers at the time of sale are recognized as a reduction in sales as the products are sold. Sales tax collections are presented in the statement of operations and comprehensive (loss) income on a net basis and, accordingly, are excluded from reported sales revenues. Proceeds from the sale of our Smart & Final gift cards are recorded as a liability at the time of sale, and recognized as sales when they are redeemed by the customer. Our Smart & Final gift cards do not have an expiration date.
We regularly review and monitor comparable store sales growth to evaluate and identify trends in our sales performance. With respect to any fiscal period during any year, comparable store sales include sales for stores operating both during such fiscal period in such year and in the same fiscal period of the previous year. Sales from a store will be included in the calculation of comparable store sales after the 60th full week of operations, and sales from a store are also included in the calculation of comparable store sales if (i) the store has been physically relocated, (ii) the selling square footage has been increased or decreased or (iii) the store has been converted to a new format within a store banner (e.g., from a legacy Smart & Final store to the Extra! format). However, sales from an existing store will not be included in the calculation of comparable store sales if the store has been converted to a different store banner (e.g., from Smart & Final to Cash & Carry).
Cost of Sales, Buying and Occupancy and Gross Margin
The major categories of costs included in cost of sales, buying and occupancy are cost of goods sold, distribution costs, costs of our buying department and store occupancy costs, net of earned vendor rebates and other allowances. Distribution costs consist of all warehouse receiving and inspection costs, warehousing costs, all transportation costs associated with shipping goods from our warehouses to our stores, and other costs of our distribution network. Store occupancy costs include store rental, common area maintenance, property taxes, property insurance, and depreciation.
Gross margin represents sales less cost of sales, buying and occupancy. Our gross margin may not be comparable to other retailers, since not all retailers include all of the costs related to their distribution network in cost of sales like we do. Some retailers exclude a portion of these costs (e.g., store occupancy and buying department costs) from cost of sales and include them in selling, general and administrative expenses.
Our cost of sales, buying and occupancy expense and gross margin are correlated to sales volumes. As sales increase, gross margin is affected by the relative mix of products sold, pricing strategies, inventory shrinkage and improved leverage of fixed costs.
Operating and Administrative Expenses
Operating and administrative expenses include direct store-level expenses associated with displaying and selling our products at the store level, including salaries and benefits for our store work force, fringe benefits, store supplies, advertising and marketing and other store-specific costs. Operating and administrative expenses also consist of store overhead costs and corporate administrative costs including salaries and benefits costs, share-based compensation, corporate occupancy costs, amortization expense, and other expenses associated with being a public company.
43
We expect that our operating and administrative expenses will increase in future periods resulting from our store development program, including the growth in the number of our stores and as a result of additional legal, accounting, insurance and other expenses associated with being a public company.
Income Tax Provision
We are subject to federal income tax as well as state income tax in various jurisdictions of the United States in which we conduct business. Income taxes are accounted for under the asset and liability method.
Equity in Earnings of Mexico Joint Venture
Our wholly owned subsidiary, Smart & Final de Mexico S.A. de C.V., is a Mexican holding company that owns a 50% interest in a joint venture. The remaining 50% of the joint venture is owned by Grupo Calimax S.A. de C.V., an entity comprising the investment interests of a family group who are also the owners of the Calimax grocery store chain in Mexico. As of January 1, 2017, this joint venture operated 15 Smart & Final stores in Northwestern Mexico, which are similar in concept to our legacy Smart & Final stores. This joint venture operates as a Mexican domestic corporation under the name Smart & Final del Noroeste, S.A. de C.V. Our interest in this joint venture is not consolidated and is reported using the equity method of accounting.
Factors Affecting Comparability of Results of Operations
Additional Week in Fiscal Year 2015
Fiscal year 2015 consisted of 53 weeks. The 53rd week resulted in additional sales and expenses as further discussed in "—Fiscal Year 2016 Compared to Fiscal Year 2015" and "—Fiscal Year 2015 Compared to Fiscal Year 2014" below.
Term Loan Facility
Our interest expense in any particular period is impacted by our overall level of indebtedness during that period and by changes in the applicable interest rates on such indebtedness. In connection with the Ares Acquisition, we entered into the Term Loan Facility, a second lien term loan facility (the "Second Lien Term Loan Facility") consisting of $195.0 million of term indebtedness and our $150.0 million Revolving Credit Facility. On December 19, 2013, the Company repaid the Second Lien Term Loan Facility in full.
On September 29, 2014, we used the net proceeds from the IPO to repay borrowings of approximately $115.5 million under the Term Loan Facility. Consequently, we recorded a loss on the early extinguishment of debt of $2.2 million related to the write-off of unamortized debt discount and deferred financing costs during the third quarter of fiscal year 2014. Quarterly amortization of the principal amount is no longer required.
During the second quarter of fiscal year 2015, we amended the Term Loan Facility to, among other things, decrease the applicable margin from 3.75% to 3.25% and reduce the Adjusted LIBOR floor rate from 1.00% to 0.75%. We recorded a $2.2 million loss on the early extinguishment of debt in the second quarter of fiscal year 2015. We also amended our Interest Rate Swap Agreement, effective June 30, 2015, to fix the LIBOR component of interest under the Term Loan Facility at 1.47675% and to mirror the Term Loan Facility's floor rate of 0.75%.
During the third quarter of fiscal year 2016, we amended the Term Loan Facility to increase the size of the Term Loan Facility by $30.1 million and to extend the original November 15, 2019 maturity date to November 15, 2022. Additionally, in connection with such amendment, the Eurocurrency Borrowings applicable margin was increased from 3.25% to 3.50%. We recorded a $5.0 million loss on
44
the early extinguishment of debt in the third quarter of fiscal year 2016. We also amended our Revolving Credit Facility to increase the committed amount to $200 million and extend the November 15, 2017 maturity date to the earlier of (a) July 19, 2021 and (b) to the extent the Term Loan Facility (and any refinancing of the Term Loan Facility) has not been paid in full, the date that is 60 days prior to the earliest scheduled maturity date of the Term Loan Facility (or such refinancing of the Term Loan Facility). We also reduced the applicable margin ranges with respect to (i) alternate base rate loans to 0.25% to 0.50% from 0.25% to 0.75% and(ii) LIBOR rate loans to 1.25% to 1.50% from 1.25% to 1.75%.
Initial Public Offering and Secondary Public Offering
On September 29, 2014, we completed an initial public offering of our common stock, pursuant to which we sold an aggregate of 15,467,500 shares of common stock, after giving effect to the underwriters' exercise in full of their option to purchase additional shares, at a price of $12.00 per share. We received aggregate net proceeds of $167.7 million after deducting underwriting discounts and commissions and other offering expenses. We used the net proceeds to repay borrowings of $115.5 million under the Term Loan Facility and the remainder to fund growth initiatives and for general corporate purposes.
On April 24, 2015, certain of our stockholders completed a secondary public offering of 10,900,000 shares of common stock. We did not sell any shares in the secondary public offering.
Basis of Presentation
Our fiscal year is the 52- or 53-week period ending on the Sunday closest to December 31. Each of our 52-week fiscal years consists of twelve-week periods in the first, second and fourth quarters of the fiscal year and a sixteen-week period in the third quarter. Our last completed fiscal year ended on January 1, 2017 and was a 52-week period ("Fiscal Year 2016"). Our fiscal year ended on January 3, 2016 was a 53-week period ("Fiscal Year 2015") and our fiscal year ended on December 28, 2014 was a 52-week period ("Fiscal Year 2014").
All of the earnings per share data, share numbers, share prices, and exercise prices have been adjusted on a retroactive basis for all periods to reflect the 190-for-one stock split effected on September 19, 2014.
45
Results of Operations
The following table contains results of operations for fiscal years 2016, 2015 and 2014.
Dollars in thousands, except per share data
|
Fiscal Year 2016 |
Fiscal Year 2015 |
Fiscal Year 2014 |
|||||||
|---|---|---|---|---|---|---|---|---|---|---|
Net sales |
$ | 4,341,795 | $ | 3,970,980 | $ | 3,534,244 | ||||
Cost of sales, buying and occupancy |
3,712,291 | 3,372,120 | 3,006,955 | |||||||
| | | | | | | | | | | |
Gross margin |
629,504 | 598,860 | 527,289 | |||||||
Operating and administrative expenses |
582,486 | 503,995 | 438,528 | |||||||
| | | | | | | | | | | |
Income from operations |
47,018 | 94,865 | 88,761 | |||||||
Interest expense, net |
32,654 | 32,687 | 37,602 | |||||||
Loss on early extinguishment of debt |
(4,978 | ) | (2,192 | ) | (2,224 | ) | ||||
Equity in earnings of joint venture |
1,525 | 1,378 | 1,037 | |||||||
| | | | | | | | | | | |
Income from operations before income taxes |
10,911 | 61,364 | 49,972 | |||||||
Income tax benefit (provision) |
2,037 | (23,102 | ) | (16,854 | ) | |||||
| | | | | | | | | | | |
Net income |
$ | 12,948 | $ | 38,262 | $ | 33,118 | ||||
| | | | | | | | | | | |
| | | | | | | | | | | |
| | | | | | | | | | | |
Earnings per share: |
||||||||||
Net income per share—Basic |
$ | 0.18 | $ | 0.52 | $ | 0.54 | ||||
Net income per share—Diluted |
$ | 0.17 | $ | 0.50 | $ | 0.52 | ||||
The table below sets forth the components of our consolidated statements of operations as a percentage of sales.
| |
Fiscal Year 2016 |
Fiscal Year 2015 |
Fiscal Year 2014 |
|||||||
|---|---|---|---|---|---|---|---|---|---|---|
Net sales |
100.0 | % | 100.0 | % | 100.0 | % | ||||
Cost of sales, buying and occupancy |
85.5 | % | 84.9 | % | 85.1 | % | ||||
| | | | | | | | | | | |
Gross margin |
14.5 | % | 15.1 | % | 14.9 | % | ||||
Operating and administrative expenses |
13.4 | % | 12.7 | % | 12.4 | % | ||||
| | | | | | | | | | | |
Income from operations |
1.1 | % | 2.4 | % | 2.5 | % | ||||
Interest expense, net |
0.7 | % | 0.8 | % | 1.1 | % | ||||
Loss on early extinguishment of debt |
–0.1 | % | –0.1 | % | –0.1 | % | ||||
Equity in earnings of joint venture |
0.0 | % | 0.0 | % | 0.0 | % | ||||
| | | | | | | | | | | |
Income from operations before income taxes |
0.3 | % | 1.5 | % | 1.4 | % | ||||
Income tax benefit (provision) |
0.0 | % | –0.6 | % | –0.5 | % | ||||
| | | | | | | | | | | |
Net income |
0.3 | % | 1.0 | % | 0.9 | % | ||||
| | | | | | | | | | | |
| | | | | | | | | | | |
| | | | | | | | | | | |
Fiscal Year 2016 Compared to Fiscal Year 2015
Net Sales
Net sales for fiscal year 2016 increased $370.8 million, or 9.3%, to $4,341.8 million as compared to $3,971.0 million for fiscal year 2015. The increase in net sales was primarily attributable to the opening of 33 new Extra! stores and four new Cash & Carry stores in fiscal year 2016, as well as the opening of 20 new Extra! stores and two new Cash & Carry stores fiscal year 2015. Non-comparable stores contributed $391.6 million, net of a decrease of approximately $70 million due to the extra week in fiscal year 2015. This net increase was partially offset by a comparable store sales decline of $20.8 million in our store banners.
46
Comparable store sales for fiscal year 2016 decreased 0.5% as compared to fiscal year 2015. This decrease in comparable store sales was attributable to a decrease of 1.3% in comparable average transaction size, partially offset by an increase in comparable transaction counts of 0.8%.
Net sales for our Smart & Final segment increased $363.8 million, or 12.0%, to $3,400.8 million as compared to $3,037.0 million for fiscal year 2015. Of this increase in net sales, $382.0 million, net of a decrease of approximately $54 million due to the extra week in fiscal year 2015, was primarily attributable to the 33 new Extra! stores opened in 2016 and 20 new Extra! stores opened in 2015. Comparable store sales for fiscal year 2016 for our Smart & Final segment decreased 0.6% as compared to fiscal year 2015, driven by a 0.9% increase in comparable transaction counts offset by a 1.5% decrease in comparable average transaction size.
Net sales for our Cash & Carry segment increased $7.0 million, or 0.8%, to $941.0 million as compared to $934.0 million for fiscal year 2015. Of this increase in net sales, $9.8 million, net of a decrease of approximately $16 million due to the extra week in fiscal year 2015, was primarily attributable to the four new Cash & Carry stores opened in 2016 and the two new Cash & Carry stores opened in 2015. Comparable store sales for fiscal year 2016 for our Cash & Carry segment decreased 0.3% as compared to fiscal year 2015, driven by flat comparable transaction counts and a 0.3% decrease in comparable average transaction size.
Gross Margin
Gross margin for fiscal year 2016 increased $30.6 million, or 5.1%, to $629.5 million as compared to $598.9 million in fiscal year 2015. As a percentage of sales, gross margin for fiscal year 2016 was 14.5% as compared to 15.1% in fiscal year 2015. The increase in gross margin attributable to increased sales was $55.9 million partially offset by a decrease in gross margin rate which decreased gross margin by $25.3 million. Compared to fiscal year 2015, gross margin as a percentage of sales for fiscal year 2016 included higher merchandise product margin rates (including the effect of inventory losses) as a percentage of sales (accounting for an increase of 0.21%, including a 0.50% increase in our Smart & Final segment partially offset by a 0.29% decrease in our Cash & Carry segment) offset by higher store occupancy costs as a percentage of sales (accounting for a 0.78% increase, including a 0.77% increase in our Smart & Final segment and a 0.01% increase in our Cash & Carry segment). The increase in store occupancy costs in our Smart & Final segment was primarily due to increased building rent and depreciation costs related to our new store leases and capital spending for new and relocated stores. Warehouse and transportation costs as a percentage of sales were flat (including a 0.04% increase in our Smart & Final segment offset by a 0.04% decrease in our Cash & Carry segment). The impact of one less week in fiscal year 2016 on gross margin rate was insignificant.
Operating and Administrative Expenses
Operating and administrative expenses for fiscal year 2016 were $582.5 million as compared to $504.0 million in fiscal year 2015. As a percentage of sales, operating and administrative expenses for fiscal year 2016 were 13.4% as compared to 12.7% in fiscal year 2015. The increase in operating and administrative expenses was primarily due to $42.2 million of increased wages, fringe benefits and incentive bonus costs, $24.9 million of increased other store direct expenses, $6.2 million of increased marketing costs in support of our new store openings and other marketing initiatives, $6.0 million of costs associated with store closures and asset impairment charges, and $4.1 million of other costs. Partially offsetting these increases was $2.4 million of decreased public company costs, a $1.3 million gain associated with the death benefit on a company-owned life insurance policy that supports our deferred compensation program and a $1.0 million decrease in expense associated with changes in cash surrender values on company owned life insurance policies and other expenses of our supplemental executive retirement plan. As a percentage of sales, operating and administrative expenses for fiscal year 2016 increased 0.7% to 13.4% as compared to fiscal year 2015. Approximately 0.30% of the
47
increase in operating and administrative expenses as a percentage of sales was due to increased wages, fringe benefits and incentive bonus costs (including 0.43% increase in our Smart & Final segment partially offset by a 0.09% decrease in our Cash & Carry segment), 0.34% of the increase was due to increased other store direct expenses primarily in our Smart & Final segment, 0.06% of the increase was due to higher marketing costs (including 0.05% in our Smart & Final segment and 0.01% in our Cash & Carry segment), 0.14% of the increase was due to costs associated with store closures and asset impairment charges, and 0.04% of the increase was due to other cost increases. Partially offsetting these increases was a decrease in public company costs of 0.07%, a gain associated with the death benefit on a company-owned life insurance policy of 0.03%, and a decrease of 0.03% was due to changes in cash surrender values on company owned life insurance policies and other expenses of our supplemental executive retirement plan. The impact of the one less week in fiscal year 2016 on operating and administrative expense rate was insignificant.
Interest Expense, Net
Interest expense for each of fiscal years 2016 and 2015 was $32.7 million. As a percentage of sales, interest expense was 0.7% for fiscal years 2016 and 0.8% for fiscal year 2015.
Loss on Early Extinguishment of Debt
We recorded a $5.0 million loss on the early extinguishment of debt in fiscal year 2016 and $2.2 million fiscal year 2015. The loss in fiscal year 2016 was related to the amendment to our Term Loan Facility in the third quarter to increase the Eurocurrency Borrowings applicable margin from 3.25% to 3.50%. Additionally, we increased the size of the Term Loan Facility by $30.1 million and extended the original November 15, 2019 maturity date to November 15, 2022. Costs associated with such loss were related to fees paid in connection with the amendment and the write-off of unamortized debt discount and debt issuance costs. The loss in fiscal year 2015 was related to the amendment of our Term Loan Facility in the second quarter to decrease the applicable margin from 3.75% to 3.25%. Costs associated with such loss were related to fees and the write-off of unamortized debt discount and deferred financing costs.
Income Tax Benefit (Provision)
Our income tax benefit for fiscal year 2016 was $2.0 million as compared to an income tax provision of $23.1 million in fiscal year 2015. Our effective income tax rate, excluding the equity in earnings of our joint venture, for fiscal year 2016 was a benefit of 21.7% as compared to an income tax provision rate of 38.5% in fiscal year 2015. Significant factors reducing the income tax provision in fiscal year 2016 include excess tax benefits from the early adoption of ASU 2016-09, reversal of an uncertain tax liability related to the successful resolution of the 2012/2013 Internal Revenue Service audit and an increase in tax credits relating to the Work Opportunity Tax Credit.
Equity in Earnings of Joint Venture
Equity in earnings of our joint venture for fiscal year 2016 was $1.5 million as compared to $1.4 million in fiscal year 2015.
Fiscal Year 2015 Compared to Fiscal Year 2014
Net Sales
Net sales for fiscal year 2015 increased $436.7 million, or 12.4%, to $3,971.0 million as compared to $3,534.2 million for fiscal year 2014. The increase in net sales attributable to comparable store sales growth of $154.6 million in our store banners, and $208.8 million was primarily attributable to the opening of 20 new Extra! stores and two new Cash & Carry stores in fiscal year 2015 compared to 13 new Extra! stores and one new Cash & Carry store in fiscal year 2014. The remaining increase in net sales of $73.3 million was attributable to the additional week in fiscal year 2015.
48
Comparable store sales for fiscal year 2015 increased 4.5% as compared to fiscal year 2014. This increase in comparable store sales was attributable to an increase in comparable transaction counts of 4.4% and an increase of 0.1% in comparable average transaction size.
Net sales for our Smart & Final segment increased $368.0 million, or 13.8%, to $3,036.9 million as compared to $2,668.9 million for fiscal year 2014. Of this increase in net sales, $58.0 million was attributable to the additional week in fiscal year 2015. Comparable store sales for fiscal year 2015 for our Smart & Final segment increased 4.4% as compared to fiscal year 2014, driven by a 4.6% increase in comparable transaction counts partially offset by a 0.1% decrease in comparable average transaction size.
Net sales for our Cash & Carry segment increased $68.7 million, or 7.9%, to $934.0 million as compared to $865.3 million for fiscal year 2014. Of this increase in net sales, $15.3 million was attributable to the additional week in fiscal year 2015. Comparable store sales for fiscal year 2015 for our Cash & Carry segment increased 4.5% as compared to fiscal year 2013, driven by a 2.9% increase in comparable transaction counts and a 1.6% increase in comparable average transaction size.
Gross Margin
Gross margin for fiscal year 2015 increased $71.6 million, or 13.6%, to $598.9 million as compared to $527.3 million in fiscal year 2014. As a percentage of sales, gross margin for fiscal year 2015 was 15.1% as compared to 14.9% in fiscal year 2014. The increase in gross margin attributable to increased sales was $65.2 million and the increase in gross margin attributable to increased gross margin rate was $6.4 million. Compared to fiscal year 2014, gross margin as a percentage of sales for fiscal year 2015 included lower warehouse and transportation costs as a percentage of sales (accounting for an 0.06% increase, including a 0.01% increase in our Smart & Final segment and a 0.05% increase in our Cash & Carry segment), and higher merchandise product margin rates (including the effect of inventory losses) as a percentage of sales (accounting for an increase of 0.22%, including a 0.34% increase in our Smart & Final segment partially offset by a 0.12% decrease in our Cash & Carry segment) partially offset by higher store occupancy costs as a percentage of sales (accounting for a 0.10% decrease, including a 0.13% decrease in our Smart & Final segment partially offset by a 0.03% increase in our Cash & Carry segment). The increase in store occupancy costs in our Smart & Final segment was primarily due to increased building rent and depreciation costs related to our new store leases and capital spending for new and relocated stores. The impact of the additional week in 2015 on gross margin rate was insignificant.
Operating and Administrative Expenses
Operating and administrative expenses for fiscal year 2015 were $504.0 million as compared to $438.5 million in fiscal year 2014. As a percentage of sales, operating and administrative expenses for fiscal year 2015 were 12.7% as compared to 12.4% in fiscal year 2014. The increase in operating and administrative expenses was primarily due to $37.8 million of increased wages, fringe benefits and incentive bonus costs, $5.4 million of increased marketing costs in support of our increased sales and other marketing initiatives, $16.0 million of increased other store direct expenses, $2.5 million of increased public company costs, and $1.1 million of increased expense associated with decreased cash surrender values on company owned life insurance policies and other expenses of our supplemental executive retirement plan. The increase in operating and administrative expenses for fiscal year 2015 was partially offset by a $1.3 million decrease in share-based compensation expense associated with our equity compensation program. Fiscal year 2014 included a $3.3 million reversal of an executive compensation reserve that was no longer necessary, and a $0.9 million gain associated with the death benefit on a company- owned life insurance policy that supports our deferred compensation program which were partially offset by $1.7 million of consulting costs associated with our long-range store development planning (including remodels of our legacy Smart & Final stores and conversions to our
49
Extra! format). As a percentage of sales, operating and administrative expenses for fiscal year 2015 increased 0.3% to 12.7% as compared to fiscal year 2014. Approximately 0.10% of the increase in operating and administrative expenses as a percentage of sales was due to increased wages, fringe benefits and incentive bonus costs (including 0.19% increase in our Smart & Final segment partially offset by a 0.02% decrease in our Cash & Carry segment), 0.04% of the increase was due to higher marketing costs (including 0.03% in our Smart & Final segment and 0.01% in our Cash & Carry segment), 0.11% of the increase was due to increased other store direct expenses primarily in our Smart & Final segment, 0.05% of the increase was due to increased public company costs, and 0.02% was due to decreases in cash surrender values on company owned life insurance policies and other expenses of our supplemental executive retirement plan. These increases, as a percentage of sales, were partially offset by a 0.07% decrease in share-based compensation expense associated with our equity compensation program. Other items included in our fiscal year 2014 results that were not in our fiscal year 2015 results included 0.09% increase due to the reversal of an executive compensation reserve that was no longer necessary, and a 0.02% increase due to the gain associated with the death benefit on a company owned life insurance policy that supports our deferred compensation program, which were partially offset by a 0.05% decrease in consulting costs associated with our long-range store development planning. The impact of the additional week in 2015 on operating and administrative expenses was insignificant.
Interest Expense, Net
Interest expense for fiscal year 2015 was $32.7 million as compared to $37.6 million in fiscal year 2014. As a percentage of sales, interest expense for fiscal year 2015 was 0.8% as compared to 1.1% for fiscal year 2014. The decrease in interest expense was primarily due to a lower average debt outstanding and a lower average interest rate under our Term Loan Facility.
Loss on Early Extinguishment of Debt
We recorded a $2.2 million loss on the early extinguishment of debt in both fiscal year 2015 and fiscal year 2014. The loss in fiscal year 2015 was related to the amendment of our Term Loan Facility in the second quarter to decrease the applicable margin from 3.75% to 3.25%. Costs associated with such loss were related to fees and the write-off of unamortized debt discount and deferred financing costs. The loss for fiscal year 2014 was the result of our use of the net proceeds from the IPO to repay borrowings of approximately $115.5 million under the Term Loan Facility. Consequently, we recorded a loss on the early extinguishment of debt of $2.2 million related to the write-off of unamortized debt discount and deferred financing costs during the third quarter of fiscal year 2014.
Income Tax Provision
Our income tax provision for fiscal year 2015 was $23.1 million as compared to $16.9 million in fiscal year 2014. The effective income tax rate, excluding the equity in earnings of our joint venture, for fiscal year 2015 was 38.5% as compared to 34.4% in fiscal year 2014.
Equity in Earnings of Joint Venture
Equity in earnings of our joint venture for fiscal year 2015 was $1.4 million as compared to $1.0 million in fiscal year 2014.
Liquidity and Capital Resources
Historically, our primary source of liquidity has been cash flows from operations. Additionally, we have the availability to make borrowings under the Credit Facilities. Our primary uses of cash are for purchases of inventory, operating expenses, capital expenditures primarily for opening, converting or
50
remodeling stores and debt service. We believe that our existing cash and cash equivalents, cash anticipated to be generated by operating activities, and borrowings under the Credit Facilities will be sufficient to meet our anticipated cash needs for at least the next twelve months. As of January 1, 2017, we had $64.0 million drawn under our Revolving Credit Facility and $54.2 million of cash and cash equivalents.
The following table sets forth the major sources and uses of cash for each of the periods set forth below, as well as our cash and cash equivalents at the end of each period.
(dollars in thousands)
|
Fiscal Year 2016 |
Fiscal Year 2015 |
Fiscal Year 2014 |
|||||||
|---|---|---|---|---|---|---|---|---|---|---|
Cash and cash equivalents at end of period |
$ | 54,235 | $ | 59,327 | $ | 106,847 | ||||
Cash provided by operating activities |
97,093 | 145,391 | 125,337 | |||||||
Cash used in investing activities |
(153,252 | ) | (196,616 | ) | (117,370 | ) | ||||
Cash provided by financing activities |
51,067 | 3,705 | 45,181 | |||||||
Fiscal Year 2016 Compared to Fiscal Year 2015
Operating Activities
Cash flows from operating activities consist of net income adjusted for non-cash items including depreciation and amortization, deferred taxes and the effect of working capital changes. The increase or decrease in cash provided by operating activities reflects our operating performance before non-cash expenses and charges and including the timing of receipts and disbursements.
Cash provided by operating activities for fiscal year 2016 decreased $48.3 million to $97.1 million as compared to $145.4 million for fiscal year 2015. This decrease was primarily attributable to lower net income and increased working capital. During fiscal year 2016, we made cash interest payments of $29.8 million and cash pension contributions of $8.8 million, as compared to cash interest payments of $29.5 million and cash pension contributions of $8.2 million during fiscal year 2015.
Investing Activities
Cash used in investing activities decreased $43.3 million to $153.3 million for fiscal year 2016 as compared to $196.6 million in fiscal year 2015. This decrease was primarily attributable to a $64.2 million reduction in payments for assets acquired in the Haggen Transaction partially offset by a $14.2 million increase in capital expenditures for property, plant and equipment, including capitalized software, largely as a result of increased investment in store construction and equipment under our plans to accelerate openings of new Extra! stores and convert legacy stores to the Extra! format, a $5.8 million reduction in proceeds on sale of assets and a $0.7 million increase in other investments.
Financing Activities
Cash provided by financing activities increased $47.4 million to $51.1 million for fiscal year 2016 as compared to $3.7 million for fiscal year 2015. This increase was primarily attributable to the $76.9 million of net borrowings on our Term Loan Facility and Revolving Credit Facility, net of loan fees paid, and $3.9 million of proceeds received from stock option exercises, partially offset by $33.4 million of stock repurchases.
At January 1, 2017, we had cash and cash equivalents of $54.2 million, stockholders' equity of $552.2 million and debt, net of debt discount and debt issuance costs of $678.9 million. At January 1, 2017, we had working capital of $33.2 million as compared to $63.2 million at January 3, 2016. This decrease in working capital was primarily due to expenditures related to the acquisition of the 33 store leases and related assets from Haggen in fiscal year 2015.
51
Fiscal Year 2015 Compared to Fiscal Year 2014
Operating Activities
Cash flows from operating activities consist of net income adjusted for non-cash items including depreciation and amortization, deferred taxes and the effect of working capital changes. The increase or decrease in cash provided by operating activities reflects our operating performance before non-cash expenses and charges and including the timing of receipts and disbursements.
Cash provided by operating activities for fiscal year 2015 increased $20.1 million to $145.4 million as compared to $125.3 million for fiscal year 2014. This increase was primarily attributable to higher net income and improved working capital including lower cash interest payments and lower cash pension contributions. During fiscal year 2015, we made cash interest payments of $29.5 million and cash pension contributions of $8.2 million, as compared to cash interest payments of $41.3 million and cash pension contributions of $10.8 million during fiscal year 2014.
Investing Activities
Cash used in investing activities increased $79.2 million to $196.6 million for fiscal year 2015 as compared to $117.4 million in fiscal year 2014. This increase was primarily attributable to the $66.4 million of cash paid in fiscal year 2015 for the acquisition of 33 store leases and related assets from Haggen in connection with the Haggen Transaction and a $19.6 million increase in capital expenditures for property, plant and equipment, including capitalized software, largely as a result of increased investment in store construction and equipment under our plan to accelerate openings of new Extra! stores and conversions of legacy stores to the Extra! format.
Financing Activities
Cash provided by financing activities decreased $41.5 million to $3.7 million for fiscal year 2015 as compared to $45.2 million for fiscal year 2014. This decrease was primarily attributable to the $168.3 million of net proceeds received from the IPO in fiscal year 2014, partially offset by $120.1 million in net payments on our Term Loan Facility and $2.7 million of cash used for employee withholding taxes related to the net settlement of an option exercise in fiscal year 2014.
At January 3, 2016, we had cash and cash equivalents of $59.3 million, stockholders' equity of $566.6 million and debt, net of debt discount and debt issuance costs, of $590.9 million. At January 3, 2016, we had working capital of $62.1 million as compared to $116.7 million at December 28, 2014. This decrease in working capital was primarily due to increased borrowing on our Revolving Credit Facility, partially offset by increased inventory and prepaid expenses net of increased accounts payable and accrued liabilities in support of our store growth initiative.
Capital Expenditure and Other Capital Requirements
Our primary uses of capital are to finance store development costs for buildings, leasehold improvements, equipment and initial set-up expenditures for new, relocated, converted and remodeled stores, investment in our distribution network, investment in information systems hardware and capitalized software, as well as general working capital requirements.
During fiscal year 2016, we opened 33 new Extra! stores (including 29 stores acquired in connection with the Haggen Transaction), as well as four new Cash & Carry stores. We currently plan to open an additional 15 new Extra! stores and four new Cash & Carry stores in fiscal year 2017. We estimate that the capital expenditure requirement for improvements and equipment for a new Extra! store averages $2.2 million. We estimate that the average capital expenditure requirement for a typical new Cash & Carry store is $1.6 million.
52
During fiscal year 2016, we converted six legacy Smart & Final stores to our Extra! format (including four stores acquired in connection with the Haggen Transaction) and relocated six legacy Smart & Final stores to new Extra! locations. We plan to continue converting legacy Smart & Final stores to our Extra! format, including through relocations. In fiscal year 2017, we plan to relocate three legacy Smart & Final stores to new Extra! locations and convert four legacy Smart & Final stores to the Extra! format. We estimate that the average capital expenditure requirement for a typical Extra! conversion is $2.9 million.
During fiscal year 2015, we paid $66.4 million in cash to acquire 33 store leases and related assets from Haggen. During fiscal year 2016, we converted, remodeled and opened these stores as new Extra! locations. We estimate that the average additional capital expenditure requirement to remodel and convert these acquired properties into Extra! stores was $1.8 million. In addition, these stores required capital for inventory, operational needs and cash pre-opening expenses.
We plan to continue investing in our legacy Smart & Final and older Extra! stores with store remodels. During fiscal year 2016, we remodeled two of our legacy Smart & Final stores. In fiscal year 2017, we plan to remodel two of our legacy Smart & Final stores. We estimate that the average capital expenditure requirement for a typical legacy Smart & Final format remodel is $0.7 million. During fiscal year 2016, we remodeled seven of our older Extra! stores and plan to remodel seven older Extra! stores in fiscal year 2017. We estimate that the average capital expenditure requirement for a typical Extra! format remodel is $1.8 million.
For fiscal year 2016, total capital expenditures, including property, plant and equipment and capitalized software, were $151.2 million net of tenant improvement allowances. We estimate total capital expenditures to be $134 million for fiscal year 2017, net of tenant improvement allowances. However, our capital program plans are subject to change upon our further review and we cannot assure you that these estimates will be realized.
We typically enter into lease arrangements for our store properties. From time to time we may purchase a property or leasehold interest for an additional capital investment, depending on the property location and market value. Working capital investment related to a new store is approximately $0.3 million and primarily relates to inventory net of trade vendor accounts payable.
We have various retirement plans which subject us to certain funding obligations. Our noncontributory defined benefit retirement plan covered substantially all of our full time employees prior to June 1, 2008. We froze the accruing of future benefits under this plan effective June 1, 2008, with the exception of approximately 450 hourly paid employees in our distribution and transportation operations. Changes in the benefit plan assumptions as well as the funded status of the plan impact the funding and expense levels for future periods. We made cash contributions of $8.8 million in fiscal year 2016 and $8.2 million in fiscal year 2015. During fiscal year 2017, we plan to fund the total minimum required contribution of $11.7 million.
We expect to fund our capital expenditures and other cash requirements with cash on hand, cash generated from operating activities and, if required, additional borrowings under the Credit Facilities. We believe that our sources of funds are adequate to provide for our working capital, capital expenditures and debt service requirements for the foreseeable future, including investments made, and expenses incurred, in connection with opening new stores or converting or relocating existing stores in accordance with our growth strategy. Our ability to continue to fund these items may be affected by general economic, competitive and other factors, many of which are outside of our control. If our future cash flow from operations and other capital resources are insufficient to fund our liquidity needs, we may be forced to reduce or delay our expected new store openings or store conversions and relocations, sell assets, obtain additional debt or equity capital or refinance all or a portion of our outstanding debt. Alternatively, we may elect to pursue additional expansion opportunities that could require additional debt or equity financing. There can be no assurance that equity or debt financing
53
would be available to us when we need it or, if available, that the terms will be satisfactory to us and not dilutive to our then-current stockholders.
Credit Facilities
We have two arrangements governing our material outstanding indebtedness: our Term Loan Facility and our Revolving Credit Facility.
As of January 1, 2017, the aggregate principal balance of amounts outstanding under our Term Loan Facility net of discount on debt issuance and debt issuance costs was $616.6 million. The term loans incurred under our Term Loan Facility have a maturity date of November 15, 2022. There is no required quarterly amortization of the principal amount. Smart & Final Stores LLC may prepay the Term Loans, in whole or in part, at any time. Mandatory prepayments are required in the amount of (i) the net proceeds of a sale of assets, subject to the priority of the Revolving Credit Facility Collateral (as defined below), (ii) the net proceeds of the incurrence of indebtedness to the extent such indebtedness is not permitted under the terms of the Term Loan Facility and (iii) a percentage of annual "excess cash flow," as adjusted by voluntary prepayments.
The Revolving Credit Facility provides for up to $200.0 million of borrowings (including up to $65.0 million for the issuance of letters of credit), subject to certain borrowing base limitations. Subject to certain conditions, we may increase the commitments under the Revolving Credit Facility by up to $100.0 million. The Revolving Credit Facility has a maturity date of July 19, 2021. As of January 1, 2017, we had $64.0 million outstanding borrowings under the Revolving Credit Facility and outstanding letters of credit were $29.9 million. After giving effect to borrowings under the Revolving Credit Facility and outstanding letters of credit, we had $103.0 million of availability under the Revolving Credit Facility as of January 1, 2017.
Collateral
All obligations under the Term Loan Facility are guaranteed by Intermediate Holdings and certain of its current and future domestic direct and indirect subsidiaries. In addition, the obligations under the Term Loan Facility are secured by (x) a first-priority security interest in substantially all of the property and assets of, as well as the equity interests owned by, Smart & Final Stores LLC and Intermediate Holdings and the other guarantors (other than Revolving Credit Facility Collateral (as defined below)) and (y) a second-priority security interest in the Revolving Credit Facility Collateral.
All obligations under the Revolving Credit Facility are guaranteed by Intermediate Holdings and certain of Intermediate Holdings' current and future domestic direct and indirect subsidiaries. In addition, the obligations under the Revolving Credit Facility are secured by (i) a first-priority security interest in the accounts receivable, inventory, cash and cash equivalents, and related assets, of Smart & Final Stores LLC and Intermediate Holdings and the other guarantors (the "Revolving Credit Facility Collateral") and (ii) a second-priority security interest in substantially all of the other property and assets of, as well as the equity interests owned by, Smart & Final Stores LLC and Intermediate Holdings and the other guarantors.
Covenants
The Term Loan Facility has no financial maintenance covenants.
The Revolving Credit Facility includes a "springing" financial maintenance covenant, applicable when a covenant trigger event has occurred and is continuing. If such a covenant trigger event has occurred and is continuing, Smart & Final Stores LLC is required to maintain a fixed charge coverage ratio of not less than 1.0 to 1.0. A covenant trigger event shall have occurred any time that availability under the Revolving Credit Facility is less than the greater of (i) $12.5 million and (ii) 10.0% of the
54
line cap (the lesser of the aggregate commitments under the Revolving Credit Facility and the borrowing base then in effect) (the "Trigger Threshold"). Once commenced, a covenant trigger event shall be deemed to continue until such time as availability equals or exceeds the Trigger Threshold for 20 consecutive days. As of January 1, 2017, no trigger event has occurred.
Contractual Obligations
The following table sets forth our future payments due by period of our contractual obligations as of January 1, 2017, in thousands:
| |
Total | Less than one year |
1 - 3 Years | 3 - 5 Years | Thereafter | |||||||||||
|---|---|---|---|---|---|---|---|---|---|---|---|---|---|---|---|---|
Long-term debt |
$ | 689,000 | $ | 64,000 | $ | — | $ | — | $ | 625,000 | ||||||
Interest on long-term debt |
205,656 | 30,446 | 61,161 | 74,000 | 40,049 | |||||||||||
Operating leases |
1,436,506 | 129,841 | 246,118 | 220,544 | 840,003 | |||||||||||
| | | | | | | | | | | | | | | | | |
Total contractual obligations |
$ | 2,331,162 | $ | 224,287 | $ | 307,279 | $ | 294,544 | $ | 1,505,052 | ||||||
| | | | | | | | | | | | | | | | | |
| | | | | | | | | | | | | | | | | |
| | | | | | | | | | | | | | | | | |
The primary changes in our contractual obligations as of January 1, 2017 as compared to our contractual obligations as of January 3, 2016 relate to additional operating leases entered into during fiscal year 2016 primarily related to our new store growth, including leases acquired in connection with the Haggen Transaction. Additionally, during fiscal year 2016 we increased the size of the Term Loan Facility by $30.1 million and increased our borrowings on our Revolving Credit Facility by $59.0 million.
The interest payments on our Term Loan Facility outstanding as of January 1, 2017 incorporate the effect of the interest rate swap, which effectively converts the variable rate of the Term Loan Facility to a fixed rate. The five-year interest rate swap fixed the LIBOR component of interest at 1.47675% on a variable notional amount through March 29, 2018. See Note 4, Debt, and Note 5, Derivative Financial Instruments, for additional information on our interest requirements and interest rate swap contract.
Purchase orders or contracts for the purchase of goods for resale in our stores and other goods and services are not included in the table above. We are not able to reasonably determine the aggregate amount of such purchase orders that may constitute established contractual obligations, as purchase orders may represent individual authorizations to purchase rather than binding agreements. Other than with respect to Unified Grocers (as described immediately below), we do not have significant agreements for the purchase of goods for resale in our stores or other goods and services that exceed our expected requirements or that are not cancelable on short notice.
We have a contractual obligation under our supply agreement with Unified Grocers to purchase a minimum amount of food and related items during any twelve-month period covered by the agreement. This contractual obligation does not exceed our expected requirements over any twelve-month period covered by the agreement. This agreement expires in December 2018. The related amounts are not included in the above table.
The table above also excludes funding of pension and other postretirement benefit and postemployment obligations. See Note 8, Retirement Benefit Plans and Postretirement and Postemployment Benefit Obligations, to our audited consolidated financial statements for additional information on funding of our plans.
We also have asset retirement obligations with respect to owned or leased properties. Due to the nature of our business, such asset retirement obligation is immaterial.
Off Balance Sheet Arrangements
As of January 1, 2017, we had no off-balance sheet arrangements.
55
Multi-employer Pension Plan
The Company participates in and contributes to a multi-employer pension plan on behalf of union employees in our Cash & Carry operations. At the end of fiscal year 2016 and fiscal year 2015, there were 214 and 206 union employees covered under this plan, respectively. Our employer contributions and corresponding pension expense for this plan was $1.4 million for fiscal year 2016 and $1.4 million for fiscal year 2015.
We participate in this multi-employer pension plan pursuant to a collective bargaining agreement with the Western Conference of Teamsters (the "Teamsters Plan"). The Teamsters Plan provides and maintains retirement, death and termination benefits for employees in collective bargaining units represented by local unions affiliated with the Western Conference of Teamsters. The Teamsters Plan is subject to the provisions of ERISA, as amended.
The Western Conference of Teamsters Pension Agreement and Declaration of Trust dated April 26, 1955, pursuant to which the Teamsters Plan was established, provides that the trustees of the Teamsters Plan shall establish and adjust the levels of prospective plan benefits so that employer contributions received by the Teamsters Plan will always meet the minimum funding standards of Section 302 of ERISA and Section 412 of the Internal Revenue Code of 1986. The trustees have established a funding policy that specifies funding targets that may result in more rapid funding than prescribed by the minimum funding standards and that provides for benefit adjustments based on specified funding targets. The Teamsters Plan's actuary has advised us that the minimum funding requirements of ERISA are being met as of January 1, 2016 (based on the most recent information available).
As of December 31, 2015, the Teamsters Plan actuarial present value of accumulated plan benefits was $41,074.2 million and the actuarial value of assets for funding the standard account was $37,692.7 million, resulting in a funded percentage of 91.7%. The Teamsters Plan covered approximately 563,000 participants as of December 31, 2015. Approximately 1,500 employers participate in the Teamsters Plan and total employer contributions for the plan year ended December 31, 2015 totaled $1,577.4 million.
Impact of Inflation and Deflation
Our primary costs, merchandise and labor, as well as utility and transportation costs are affected by a number of factors that are beyond our control, including inflation and deflation. Inflation and deflation in the price of merchandise we sell, as well as fuel and other commodities employed in the course of our business, may periodically affect our sales and gross margin. As is common practice within the food industry, we have generally been able to manage the short-term impact of inflation and deflation and maintain margins by adjusting selling prices and through procurement and supply chain efficiencies. Food inflation and deflation is affected by a variety of factors and our determination of whether to pass on the effects of inflation or deflation to our customers is made in conjunction with our overall pricing and marketing strategies. Although we may experience periodic effects on sales, operating margins and gross margin as a result of changing prices, we do not expect the effect of inflation or deflation to have a material impact on our ability to execute our long-term business strategy.
Beginning in the second quarter of fiscal year 2015 and continuing through the end of fiscal year 2016, we experienced deflation in certain food and non-food commodities. Market dynamics caused us to pass cost decreases through to customers, which negatively impacted our sales growth. We estimate that the applicable deflation rate for fiscal year 2016 was approximately 1.7% and we currently anticipate that the deflation rate will be approximately 0.2% for fiscal year 2017.
56
Critical Accounting Estimates
The preparation of financial statements in conformity with U.S. GAAP requires management to make estimates and assumptions that affect the reported assets, liabilities, sales and expenses in the accompanying financial statements. Critical accounting estimates are those that require the most subjective and complex judgments, often employing the use of estimates about the effect of matters that are inherently uncertain. These critical accounting estimates, under different conditions or using different assumptions or estimates, could show materially different results on our financial condition and results of operations. The following are considered our most critical accounting estimates that, under different conditions or using different assumptions or estimates, could show materially different results on our financial condition and results of operations.
Share-Based Compensation
We account for share-based compensation in accordance with Accounting Standards Codification ("ASC") 718, Compensation—Stock Compensation ("ASC 718"). ASC 718 requires all share-based payments to be recognized in the statements of operations and comprehensive (loss) income as compensation expense based on their fair values over the requisite service period of the award, taking into consideration estimated forfeiture rates.
We use the Black-Scholes-Merton option-pricing model to estimate the fair value of the options on the date of each grant. The Black-Scholes-Merton option-pricing model utilizes highly subjective and complex assumptions to determine the fair value of share-based compensation, including the option's expected term and price volatility of the underlying stock. The methods used to develop our assumptions are discussed further in Note 12, Share-Based Compensation, in the accompanying notes to our audited consolidated financial statements.
Given the absence of a public trading market for our common stock prior to the IPO, the fair value of the common stock underlying our share-based awards was determined by our Board of Directors, with input from management and, in some cases, a contemporaneous valuation report prepared by an unrelated nationally recognized third-party valuation specialist, in each case using the income and market valuation approach. We believe that our Board of Directors had the relevant experience and expertise to determine the fair value of our common stock. In accordance with the American Institute of Certified Public Accountants Accounting and Valuation Guide: Valuation of Privately-Held-Company Equity Securities Issued as Compensation, our Board of Directors exercised reasonable judgment and considered numerous objective and subjective factors to determine the best estimate of the fair value of our common stock. These estimates are no longer necessary to determine the fair value of new awards now that the underlying shares are publicly traded.
In addition to assumptions used in the Black-Scholes-Merton option pricing model, we must also estimate a forfeiture rate to calculate the share-based compensation cost for our awards. Our forfeiture rate is based on an analysis of our actual historical forfeitures and consideration of future expected forfeiture rates.
The assumptions referred to above represent management's best estimates. These estimates involve inherent uncertainties and the application of management's judgment. If these assumptions change and different factors are used, our share-based compensation expense could be materially different in the future. We do not believe there is a reasonable likelihood that changes in the assumptions used in our estimates will have a material effect on our financial condition or results of operations in future periods. Changes in future share-based compensation expense related to these awards may result from changes in forfeiture rates. However, we do not believe there is a reasonable likelihood that such changes will be material.
57
We recognize compensation cost for graded vesting awards as if they were granted in multiple awards. We believe the use of this "multiple award" method is preferable because a stock option grant with graded vesting is effectively a series of individual grants that vests over various periods. Management also believes that this provides for better matching of compensation costs with the associated services rendered throughout the applicable vesting periods.
Inventories
Inventories consist of merchandise purchased for resale which is stated at the lower of the weighted-average cost (which approximates first-in, first-out ("FIFO")) or market. We provide for estimated inventory losses between physical inventory counts at our stores based upon historical inventory losses as a percentage of sales. Physical inventory counts are conducted on a recurring and frequent basis throughout the year. The provision for inventory loss is adjusted periodically to reflect updated trends of actual physical inventory count results. Historically, our actual physical inventory count results have shown our estimates to be materially reliable. We do not believe there is a reasonable likelihood that changes in our estimates will have a material effect on our financial condition or results of operations in future periods.
The proper valuation of inventory also requires us to estimate the net realizable value of our slow-moving inventory at the end of each period. We base net realizable values upon many factors, including historical recovery rates, the aging of inventories on hand, the inventory movement of specific products and the current economic conditions. When we have determined inventory to be slow-moving, the inventory is reduced to its net realizable value by recording an obsolescence valuation allowance. We believe these risks are largely mitigated because our inventory typically turns on average in less than three months.
With regard to the proper valuation of inventories, we review our valuation methodologies on a recurring basis and make refinements where the facts and circumstances dictate.
Goodwill and Intangible Assets
We account for goodwill and identified intangible assets in accordance with ASC 350, Intangibles—Goodwill and Other. Goodwill and identifiable intangible assets with indefinite lives are not amortized, but instead are evaluated on an annual basis for impairment, or more frequently if events or changes in circumstances indicate that the asset might be impaired.
We evaluate goodwill for impairment by comparing the fair value of each reporting unit to its carrying value including the associated goodwill. We have designated our reporting units to be our Smart & Final banner and our Cash & Carry banner. We determine the fair value of the reporting units using the income approach methodology of valuation that includes the discounted cash flow method as well as other generally accepted valuation methodologies.
Our detailed impairment analysis involves the use of both a market value method and discounted projected future cash flow models. Significant management judgment is necessary to evaluate the impact of operating and macroeconomic changes on existing and forecasted results. Determining market values using a discounted cash flow method requires that we make significant estimates and assumptions, including long-term projections of cash flows, market conditions and appropriate market rates. Our judgments are based on historical experience, current market trends and other information. In estimating future cash flows, we rely on internally generated forecasts for operating profits and cash flows, including capital expenditures. Critical assumptions include projected comparable store sales growth, timing and number of new store openings, operating profit rates, general and administrative expenses, direct store expenses, capital expenditures, discount rates, royalty rates and terminal growth rates. We determine discount rates based on the weighted average cost of capital of a market participant. Such estimates are derived from our analysis of peer companies and consider the industry
58
weighted average return on debt and equity from a market participant perspective. We also use comparable market earnings multiple data and our market capitalization to corroborate our reporting unit valuation. Factors that could cause us to change our estimates of future cash flows include a prolonged economic crisis, successful efforts by our competitors to gain market share in our core markets, our inability to compete effectively with other retailers or our inability to maintain price competitiveness. In the fourth quarter of fiscal year 2016, we completed our quantitative assessment of any potential goodwill impairment and concluded that there were no indications of impairment as of January 1, 2017. Our quantitative assessment of potential goodwill impairment concluded that the fair value of the Smart & Final banner and Cash Carry banner each exceeded their respective carrying value, by over 50%. Based on this excess of fair value over carrying value, we believe that reasonable variations in the estimates and assumptions used in our impairment analysis would not result in an indication that the reporting unit's goodwill may be impaired.
If the fair value of the reporting unit exceeds the carrying value of the net assets, including goodwill assigned to that unit, goodwill is not impaired. If the carrying value of the reporting unit's net assets, including goodwill, exceeds the fair value of the reporting unit, we are required to perform a second step, as this is an indication that the reporting unit's goodwill may be impaired. In this step, we compare the implied fair value of the reporting unit's goodwill with the carrying amount of the reporting unit's goodwill. The implied fair value of goodwill is determined by allocating the fair value of the reporting unit to all of the assets and liabilities of the reporting unit in a manner similar to a purchase price allocation. The residual fair value after this allocation is the implied fair value of the reporting unit goodwill.
If the carrying amount of a reporting unit's goodwill exceeds its implied value, then an impairment of goodwill has occurred and we would recognize an impairment charge for the difference between the carrying amount and the implied fair value of goodwill.
We evaluate our indefinite-lived intangible assets associated with trade names using a two-step approach. The first step screens for potential impairment by comparing the fair value of each trade name with its carrying value. The second step measures the amount of impairment. We determine the fair value of the indefinite-lived trade names using a "relief from royalty payments" methodology. This methodology involves estimating reasonable royalty rates for each trade name and applying these royalty rates to a revenue stream and discounting the resulting cash flows to determine fair value. In the periods presented, we did not recognize any indefinite-lived trade name impairment loss as a result of such evaluation.
Finite-lived intangible assets, like other long-lived assets as required by ASC 360 (as defined below), are subject to review for impairment whenever events or changes in circumstances indicate that the carrying amount of the finite-lived intangible asset may not be recoverable. Impairment is recognized to the extent the sum of the discounted estimated future cash flows from the use of the finite-lived intangible asset is less than the carrying value.
Impairments of Long-Lived Assets
In accordance with ASC 360, Property, Plant, and Equipment , ("ASC 360"), we assess our long-lived assets, including property, plant and equipment and assets under capital leases for impairment whenever events or changes in circumstances indicate that the carrying amount of an asset may not be recoverable. We believe that impairment assessment of long-lived assets is critical to the financial statements because the recoverability of the amounts, or lack thereof, could significantly affect our results of operations. Determining whether an impairment has occurred typically requires various estimates and assumptions, including determining which cash flows are directly related to the potentially impaired asset, the useful life over which cash flows will occur, amount of such cash flows, and the asset's residual value, if any. In turn, measurement of an impairment loss requires a
59
determination of fair value, which is based on the best information available. We use internal discounted cash flow estimates and independent appraisals as appropriate to determine fair value. We derive the required cash flow estimates from our historical experience and our internal business plans and apply an appropriate discount rate. We group and evaluate long-lived assets for impairment at the individual store level, which is the lowest level at which individual identifiable cash flows are available. We regularly review our stores' operating performance for indicators of impairment, which include a significant underperformance relative to expected historical or projected future results of operations or a significant negative industry or economic trend.
Recoverability of assets to be held and used is measured by a comparison of the carrying amount of an asset to the future undiscounted cash flows expected to be generated by the asset. If the carrying amount of an asset exceeds its future undiscounted cash flows, an impairment charge is recognized equal to the excess of the carrying value over the estimated fair value of the asset. We measure the fair value of our long-lived assets on a nonrecurring basis using Level 3 inputs as defined in the fair value hierarchy.
Capitalized software costs are subject to review for impairment whenever events or changes in circumstances indicate that the carrying amount of the capitalized software may not be recoverable, whether it is in use or under development. Impairment is recognized to the extent the sum of the future discounted cash flows from the use of the capitalized software is less than the carrying value.
Application of alternative assumptions, such as changes in estimates of future cash flows, could produce significantly different results. Because of the significance of the judgments and estimation processes, it is likely that materially different amounts could be recorded if we used different assumptions or if the underlying circumstances were to change. We recorded a pre-tax impairment loss related to property, plant and equipment of $1.2 million, $1.4 million and $0.7 million for our fiscal years ended January 1, 2017, January 3, 2016 and December 28, 2014, respectively, and a pre-tax impairment loss related to capitalized software of $0.1 million in our fiscal year ended January 1, 2017 and $0.3 million in our fiscal year ended December 28, 2014, as discussed further in Note 2, Summary of Significant Accounting Policies, in the accompanying notes to our audited consolidated financial statements.
Income Taxes
Our income tax expense, deferred tax assets and liabilities, and liabilities for unrecognized tax benefits reflect management's best estimate of current and future taxes to be paid. We are subject to income taxes in the United States and Mexico.
Income taxes are accounted for under the balance sheet model for recording current and deferred taxes. Deferred tax assets and liabilities are measured using currently enacted tax rates expected to apply to taxable income in the years in which those temporary differences are expected to be recovered or settled. The effect on deferred tax assets and liabilities for a change in tax rates is recognized in income in the period that includes the enactment date. Under applicable accounting guidance, we are required to evaluate the realizability of our deferred tax assets. The realization of our deferred tax assets is dependent upon all available evidence, both positive and negative, including reversals of deferred tax liabilities, projected future taxable income, tax-planning strategies and results of recent operations. The assumptions about future taxable income require the use of significant judgment and are consistent with the plans and estimates we are using to manage our underlying businesses. We consider objective historical evidence when evaluation future taxable income, including three years of cumulative operation income(loss). Applicable accounting guidance requires that we recognize a valuation allowance when it is more likely than not that all or a portion or all of a deferred tax asset will not be realized due to the inability to generate sufficient taxable income in future periods.
60
Accordingly, significant accounting judgment is required in our assessment of deferred tax assets and valuation allowances when determining the provision for income taxes and related accruals.
The calculation of our tax liabilities involves uncertainties in the application of complex tax laws and regulations in different jurisdictions. A tax benefit from an uncertain tax position may be recognized when it is more likely than not that the position will be sustained upon examination, which includes resolution of any related appeals or litigation processes, on the basis of the technical merits.
We record unrecognized tax benefits as liabilities and adjust these liabilities when our judgment changes as a result of the evaluation of new information not previously available. Because of the complexity of some of these uncertainties, the ultimate resolution may result in a payment that is materially different from our estimates of unrecognized tax benefit liabilities. These differences will be reflected as increases or decreased to income tax expense in the period in which new information is available.
We consider the earnings of certain non-U.S. subsidiaries to be indefinitely invested outside the United States on the basis of estimates that future cash generation will be sufficient to meet future cash needs and our specific plans for reinvestment of those non-U.S. subsidiary earnings. We have not recorded a deferred tax liability related to the U.S. federal and state income taxes and foreign withholding taxes on approximately $6.4 million of undistributed earnings of foreign subsidiaries indefinitely invested outside the United States. If we decide to repatriate foreign earnings, we would need to adjust our income tax provision in the period we determined such earnings will no longer be indefinitely invested outside the United States.
Self-Insurance
We have various insurance programs related to our risks and costs associated with workers' compensation and general liability claims. We have elected to purchase third-party insurance to cover the risk in excess of certain dollar limits established for each respective program.
We have recorded self-insurance accruals of $51.7 million and $36.2 million as of January 1, 2017 and January 3, 2016, respectively related to our workers' compensation and general liability programs. Included in this aggregate accrual are amounts of $11.7 million as of January 1, 2017 related to the risk in excess of certain dollar limits related to our workers compensation California self-insured program and our general liability program. We have also recorded a corresponding insurance recovery receivable of $11.7 million as of January 1, 2017 from our third-party insurance carriers related to the risk in excess of certain dollar limits related to our workers compensation California self-insured program and our general liability program.
We establish estimated accruals for our insurance programs based on certain factors, including available claims data, historical trends and experience, as well as projected ultimate costs of the claims. These accruals are based on estimates prepared with the assistance of outside actuaries, and the ultimate cost of these claims may vary from initial estimates and established accruals. We believe that the use of actuarial studies to determine self-insurance accruals represents a consistent method of measuring these subjective estimates. The actuaries periodically update their estimates and we record such adjustments in the period in which such determination is made. The inherent uncertainty of future loss projections could cause actual claims to differ from our estimates. Because of the significance of the judgments and estimation processes, it is likely that materially different amounts could be recorded if we used different assumptions or if the underlying circumstances were to change. For example, a 5% change in our self-insured liabilities at January 1, 2017, excluding the risk in excess of certain dollar limits related to self-insured program with our third-party insurance carriers, would have affected pre-tax income by approximately $2.0 million for fiscal year 2016. Historically, periodic adjustments to our estimates have not been material.
61
Closed Store Reserve
We maintain reserves for costs associated with closures of operating stores and other properties that are no longer being utilized in current operations. In the event a leased store is closed before the expiration of the associated lease, the discounted remaining lease obligation less estimated sublease rental income, asset impairment charges related to improvements and fixtures, inventory write-downs and other miscellaneous closing costs associated with the disposal activity are recognized when the store closes. Adjustments to closed store liabilities primarily relate to changes in subtenant income and actual exit costs differing from original estimates. Adjustments are made for changes in estimates in the period in which the change becomes known.
Adjustments to closed stores and other properties reserves primarily relate to changes in estimated timing and amounts of subtenant income or actual exit costs differing from original estimates. Adjustments are made for changes in estimates in the period in which the changes become known. Because of the significance of the judgments and estimation processes, it is likely that materially different amounts could be recorded if we used different assumptions or if the underlying circumstances were to change. For example, a 5% change in our closed stores and other properties reserves at January 1, 2017 would have affected pre-tax income by approximately $0.4 million for fiscal year 2016.
Retirement Benefit Plans and Postretirement Benefit Plans
Certain of our employees are covered by a funded noncontributory qualified defined benefit pension plan. U.S. GAAP requires that we measure the benefit obligations and fair value of plan assets that determine our plans' funded status as of our fiscal year end date.
The determination of our obligation and expense for retirement benefit plans and postretirement benefit plans is dependent, in part, on our selection of certain assumptions used by us and our actuaries in calculating such amounts. Those assumptions are described in Note 8, Retirement Benefit Plans and Postretirement and Postemployment Benefit Obligations, in the accompanying notes to our audited consolidated financial statements. Pension assumptions are significant inputs to the actuarial models that measure pension benefit obligations and related effects on operations. Three assumptions, among others—discount rate, expected long-term return on plan assets and rate of compensation increases—are important elements of plan expense and asset/liability measurement. We evaluate these critical assumptions at least annually. We periodically evaluate other assumptions involving demographic factors, such as retirement age, mortality and turnover, and update them to reflect our experience and expectations for the future. In 2014, the Society of Actuaries released revised mortality scales, which update life expectancy assumptions. In consideration of these scales, we modified the mortality assumptions used in determining our retirement benefit plans and postretirement benefit plans as of December 28, 2014. The impact of these new mortality assumptions resulted in an increase to our pension, supplemental executive retirement plan ("SERP") and postretirement benefit plan obligations and an increase in future related expense. In 2015, the Society of Actuaries released a further update to these mortality scales, which was used in determining our retirement benefit plans and postretirement benefit plan as of January 3, 2016. The impact of these updated mortality assumptions resulted in a slight decrease to our pension, SERP and postretirement benefit plan obligations and a slight decrease in future related expense. In 2016, the Society of Actuaries released a further update to these mortality scales, which was used in determining our retirement benefit plans and postretirement benefit plan as of January 1, 2017. The impact of these updated mortality assumptions resulted in a slight decrease to our pension, SERP and postretirement benefit plan obligations and a slight decrease in future related expense. Actual results in any given year will often differ from actuarial assumptions because of economic and other factors.
62
In accordance with U.S. GAAP, the amount by which actual results differ from the actuarial assumptions is accumulated and amortized over future periods and, therefore, affects recognized expense in such future periods. While we believe our assumptions are appropriate, significant differences in actual results or significant changes in our assumptions may materially affect our pension and other postretirement obligations and future expenses.
We determine the discount rate using current investment yields on high quality fixed income investments. The discount rate assumption used to determine the year-end projected benefit obligation is increased or decreased to be consistent with the change in yield rates for high quality fixed-income investments for the expected period to maturity of the pension benefits. A lower discount rate increases the present value of benefit obligations and increases pension expense. The discount rate used to determine benefit obligations for our defined benefit pension plan as of January 1, 2017 was 4.30%. The discount rate used to determine benefit obligations under our SERP as of January 1, 2017 was 3.55%. The discount rate used to determine benefit obligations under our postretirement benefit plan as of January 1, 2017 was 4.20%.
We determine the expected long-term rate of return on plan assets for our defined benefit pension plan using an allocation approach that considers diversification and rebalancing for a portfolio of assets invested over a long-term time horizon. The approach relies on the historical returns of the plan's portfolio as well as relationships between equities and fixed income investments, consistent with the widely accepted capital market principle that a diversified portfolio with a larger allocation to equity investments have historically generated a greater long term return. For fiscal year 2016, the Company's assumed rate of return for our defined benefit pension plan was 6.75%.
Sensitivity to changes in the major assumptions for our benefit plans are as follows (dollars in thousands):
Assumption
|
Change | Projected benefit obligation (decrease)increase |
Expense (decrease) increase |
||||
|---|---|---|---|---|---|---|---|
Defined benefit pension plan: |
|||||||
Discount rate |
+/– 50 bps | $(18,357)/$20,967 | $31/$301 | ||||
Expected long-term return on plan assets |
+/– 50 bps | — | (734)734 | ||||
SERP: |
|||||||
Discount rate |
+/– 50 bps | (1,305)/1,404 | 101/(111) | ||||
Postretirement benefit plan: |
|||||||
Discount rate |
+/– 50 bps | (1,010)/1,123 | (113)/18 | ||||
Vendor Rebates and Other Allowances
As a component of our consolidated procurement program and consistent with standard practices in the retail industry, we frequently enter into contracts with vendors that provide for payments of rebates or other allowances. These rebates and allowances are primarily comprised of volume or purchase-based incentives, advertising allowances and promotional discounts. The purpose of these incentives and allowances is generally to help defray the costs we incur for stocking, advertising, promoting and selling the vendor's products.
As prescribed by U.S. GAAP, these vendor payments are reflected in the carrying value of the inventory when earned or as progress is made toward earning the rebate or allowance and as a component of cost of sales as the inventory is sold. Certain of these vendor contracts provide for rebates and other allowances that are contingent upon us meeting specified performance measures such as a cumulative level of purchases over a specified period of time. Such contingent rebates and other allowances are given accounting recognition at the point at which achievement of the specified performance measures are deemed to be probable and reasonably estimable. We review the relevant or
63
significant factors affecting proper performance measures, rebates and other allowances on a recurring basis and make adjustments where the facts and circumstances dictate. We do not believe there is a reasonable likelihood that changes in the assumptions used in our estimate will have a material effect on our financial condition or results of our operations in future periods.
Recently Issued Accounting Pronouncements
See Note 2, Summary of Significant Accounting Policies, to our accompanying audited consolidated financial statements contained elsewhere in this Annual Report on Form 10-K. We have determined that all other recently issued accounting standards will not have a material impact on our financial statements, or do not apply to our operations.
Item 7A. Quantitative and Qualitative Disclosures About Market Risk.
Market risk represents the risk of changes in the value of market risk sensitive instruments caused by fluctuations in interest rates, foreign exchange rates and commodity prices. Changes in these factors could cause fluctuations in the results of our operations and cash flows. In the ordinary course of business, we are primarily exposed to foreign currency and interest rate risks. We do not use derivative financial instruments in connection with these commodity market risks.
Commodity Risk
We are subject to volatility in food costs as a result of market risk associated with commodity prices. Although we typically are able to mitigate these cost increases, our ability to continue to do so, either in whole or in part, may be limited by the competitive environment we operate in.
Interest Rate Market Risk
Based on our variable rate debt balance as of January 1, 2017, a 1% increase in interest rates would have increased our annual interest cost by approximately $1.5 million. This impact reflects any offset from our current hedging activities. If the interest rate were to decrease 1%, this would decrease our annual interest cost by approximately $0.7 million.
Foreign Currency Exchange Rate Market Risk
We are exposed to market risks relating to fluctuations in foreign exchange rates between the U.S. dollar and other foreign currencies, primarily the Mexican Peso. Our exposure to foreign currency risk is limited to our operations in Mexico and the equity earnings of our joint venture. Such exposure is primarily related to our $14.4 million equity investment in the Mexico joint venture. The remainder of our business is conducted in U.S. dollars and thus is not exposed to fluctuation in foreign currency. We do not hedge our foreign currency exposure and therefore are not exposed to such hedging risk.
64
Item 8. Financial Statements and Supplementary Data.
| |
Page | |||
|---|---|---|---|---|
Report of Independent Registered Public Accounting Firm |
66 | |||
Report of Independent Registered Public Accounting Firm on Internal Control over Financial Reporting |
67 | |||
Consolidated Balance Sheets |
||||
As of January 1, 2017 and January 3, 2016 |
68 | |||
Consolidated Statements of Operations and Comprehensive Income (Loss) |
||||
For the years ended January 1, 2017, January 3, 2016 and December 28, 2014 |
69 | |||
Consolidated Statements of Stockholders' Equity |
||||
For the years ended January 1, 2017, January 3, 2016 and December 28, 2014 |
70 | |||
Consolidated Statements of Cash Flows |
||||
For the years ended January 1, 2017, January 3, 2016 and December 28, 2014 |
71 | |||
Notes to Consolidated Financial Statements |
72 | |||
Schedule I—Condensed Information of the Registrant |
130 | |||
Schedule II—Valuation and Qualifying Accounts |
134 | |||
65
Report of Independent Registered Public Accounting Firm
The
Board of Directors and Stockholders of
Smart & Final Stores, Inc. and Subsidiaries
We have audited the accompanying consolidated balance sheets of Smart & Final Stores, Inc. and Subsidiaries as of January 1, 2017 and January 3, 2016, and the related consolidated statements of operations and comprehensive income (loss), stockholders' equity, and cash flows for each of the three years in the period ended January 1, 2017. Our audits also included the financial statement schedules listed in the index at item 15. These consolidated financial statements and schedules are the responsibility of the Company's management. Our responsibility is to express an opinion on these financial statements and schedules based on our audits.
We conducted our audits in accordance with the standards of the Public Company Accounting Oversight Board (United States). Those standards require that we plan and perform the audit to obtain reasonable assurance about whether the financial statements are free of material misstatement. An audit includes examining, on a test basis, evidence supporting the amounts and disclosures in the financial statements. An audit also includes assessing the accounting principles used and significant estimates made by management, as well as evaluating the overall financial statement presentation. We believe that our audits provide a reasonable basis for our opinion.
In our opinion, the consolidated financial statements referred to above present fairly, in all material respects, the consolidated financial position of Smart & Final Stores, Inc. and Subsidiaries at January 1, 2017 and January 3, 2016, and the consolidated results of their operations and their cash flows for each of the three years in the period ended January 1, 2017, in conformity with U.S. generally accepted accounting principles. Also, in our opinion, the related financial statement schedules, when considered in relation to the basic financial statements taken as a whole, presents fairly in all material respects the information set forth herein.
We also have audited, in accordance with the standards of the Public Company Accounting Oversight Board (United States), Smart & Final Stores, Inc. and Subsidiaries' internal control over financial reporting as of January 1, 2017, based on criteria established in Internal Control—Integrated Framework issued by the Committee of Sponsoring Organizations of the Treadway Commission (2013 framework) and our report dated March 16, 2017 expressed an unqualified opinion thereon.
/s/ Ernst & Young LLP
Los
Angeles, California
March 16, 2017
66
Report of Independent Registered Public Accounting Firm
The
Board of Directors and Stockholders of
Smart & Final Stores, Inc. and Subsidiaries
We have audited Smart & Final Stores, Inc. and Subsidiaries' internal control over financial reporting as of January 1, 2017, based on criteria established in Internal Control—Integrated Framework issued by the Committee of Sponsoring Organizations of the Treadway Commission (2013 framework) (the COSO criteria). Smart & Final Stores, Inc. and Subsidiaries' management is responsible for maintaining effective internal control over financial reporting, and for its assessment of the effectiveness of internal control over financial reporting included in the accompanying Management's Report on Internal Control Over Financial Reporting. Our responsibility is to express an opinion on the Company's internal control over financial reporting based on our audit.
We conducted our audit in accordance with the standards of the Public Company Accounting Oversight Board (United States). Those standards require that we plan and perform the audit to obtain reasonable assurance about whether effective internal control over financial reporting was maintained in all material respects. Our audit included obtaining an understanding of internal control over financial reporting, assessing the risk that a material weakness exists, testing and evaluating the design and operating effectiveness of internal control based on the assessed risk, and performing such other procedures as we considered necessary in the circumstances. We believe that our audit provides a reasonable basis for our opinion.
A company's internal control over financial reporting is a process designed to provide reasonable assurance regarding the reliability of financial reporting and the preparation of financial statements for external purposes in accordance with generally accepted accounting principles. A company's internal control over financial reporting includes those policies and procedures that (1) pertain to the maintenance of records that, in reasonable detail, accurately and fairly reflect the transactions and dispositions of the assets of the company; (2) provide reasonable assurance that transactions are recorded as necessary to permit preparation of financial statements in accordance with generally accepted accounting principles, and that receipts and expenditures of the company are being made only in accordance with authorizations of management and directors of the company; and (3) provide reasonable assurance regarding prevention or timely detection of unauthorized acquisition, use or disposition of the company's assets that could have a material effect on the financial statements.
Because of its inherent limitations, internal control over financial reporting may not prevent or detect misstatements. Also, projections of any evaluation of effectiveness to future periods are subject to the risk that controls may become inadequate because of changes in conditions, or that the degree of compliance with the policies or procedures may deteriorate.
In our opinion, Smart & Final Stores, Inc. and Subsidiaries maintained, in all material respects, effective internal control over financial reporting as of January 1, 2017, based on the COSO criteria.
We also have audited, in accordance with the standards of the Public Company Accounting Oversight Board (United States), the consolidated balance sheets of Smart & Final Stores, Inc. and Subsidiaries as of January 1, 2017 and January 3, 2016, and the related consolidated statements of operations and comprehensive income (loss), stockholders' equity and cash flows for each of the three years in the period ended January 1, 2017 of Smart & Final Stores, Inc. and Subsidiaries and our report dated March 16, 2017 expressed an unqualified opinion thereon.
/s/ Ernst & Young LLP
Los
Angeles, California
March 16, 2017
67
Smart & Final Stores, Inc. and Subsidiaries
Consolidated Balance Sheets
(In Thousands, Except Share and Per Share Amounts)
| |
January 1, 2017 |
January 3, 2016 |
|||||
|---|---|---|---|---|---|---|---|
Assets |
|||||||
Current assets: |
|||||||
Cash and cash equivalents |
$ | 54,235 | $ | 59,327 | |||
Accounts receivable, less allowances of $434 and $454 at January 1, 2017 and January 3, 2016, respectively |
31,809 | 27,304 | |||||
Inventories |
278,718 | 234,289 | |||||
Prepaid expenses and other current assets |
48,769 | 29,072 | |||||
Deferred income taxes |
22,105 | 22,471 | |||||
| | | | | | | | |
Total current assets |
435,636 | 372,463 | |||||
Property, plant, and equipment: |
|||||||
Land |
9,106 | 10,940 | |||||
Buildings and improvements |
17,351 | 20,441 | |||||
Leasehold improvements |
301,522 | 237,820 | |||||
Fixtures and equipment |
353,764 | 266,080 | |||||
Construction in progress |
12,110 | 19,501 | |||||
| | | | | | | | |
|
693,853 | 554,782 | |||||
Less accumulated depreciation and amortization |
249,251 | 174,906 | |||||
| | | | | | | | |
|
444,602 | 379,876 | |||||
Capitalized software, net of accumulated amortization of $13,293 and $12,356 at January 1, 2017 and January 3, 2016, respectively |
10,392 |
11,365 |
|||||
Other intangible assets, net |
369,519 | 376,122 | |||||
Goodwill |
611,242 | 611,242 | |||||
Equity investment in joint venture |
14,366 | 12,763 | |||||
Other assets |
66,662 | 53,250 | |||||
| | | | | | | | |
Total assets |
$ | 1,952,419 | $ | 1,817,081 | |||
| | | | | | | | |
| | | | | | | | |
| | | | | | | | |
Liabilities and stockholders' equity |
|||||||
Current liabilities: |
|||||||
Accounts payable |
$ | 225,227 | $ | 194,149 | |||
Accrued salaries and wages |
31,933 | 33,859 | |||||
Accrued expenses |
82,925 | 77,374 | |||||
Current portion of debt, less debt issuance costs |
62,352 | 3,904 | |||||
| | | | | | | | |
Total current liabilities |
402,437 | 309,286 | |||||
Long-term debt, less debt issuance costs |
616,588 |
586,956 |
|||||
Deferred income taxes |
129,902 | 128,752 | |||||
Postretirement and postemployment benefits |
121,409 | 117,417 | |||||
Other long-term liabilities |
129,834 | 108,099 | |||||
Commitments and contingencies |
|||||||
Stockholders' equity: |
|||||||
Preferred stock, $0.001 par value; |
|||||||
Authorized shares—10,000,000 |
|||||||
Issued and outstanding shares—none |
— | — | |||||
Common stock, $0.001 par value; |
|||||||
Authorized shares—340,000,000 |
|||||||
Issued and outstanding shares—72,930,653 and 73,789,608 at January 1, 2017 and January 3, 2016, respectively |
73 | 74 | |||||
Additional paid-in capital |
500,666 | 502,304 | |||||
Retained earnings |
65,093 | 70,181 | |||||
Accumulated other comprehensive loss |
(13,583 | ) | (5,988 | ) | |||
| | | | | | | | |
Total stockholders' equity |
552,249 | 566,571 | |||||
| | | | | | | | |
Total liabilities and stockholders' equity |
$ | 1,952,419 | $ | 1,817,081 | |||
| | | | | | | | |
| | | | | | | | |
| | | | | | | | |
See notes to consolidated financial statements.
68
Smart & Final Stores, Inc. and Subsidiaries
Consolidated Statements of Operations and Comprehensive Income (Loss)
(In Thousands, Except Share and Per Share Amounts)
| |
Fiscal Year 2016 |
Fiscal Year 2015 |
Fiscal Year 2014 |
|||||||
|---|---|---|---|---|---|---|---|---|---|---|
Net sales |
$ | 4,341,795 | $ | 3,970,980 | $ | 3,534,244 | ||||
Cost of sales, buying and occupancy |
3,712,291 | 3,372,120 | 3,006,955 | |||||||
| | | | | | | | | | | |
Gross margin |
629,504 | 598,860 | 527,289 | |||||||
Operating and administrative expenses |
582,486 | 503,995 | 438,528 | |||||||
| | | | | | | | | | | |
Income from operations |
47,018 | 94,865 | 88,761 | |||||||
Interest expense, net |
32,654 | 32,687 | 37,602 | |||||||
Loss on early extinguishment of debt |
4,978 | 2,192 | 2,224 | |||||||
Equity in earnings of joint venture |
1,525 | 1,378 | 1,037 | |||||||
| | | | | | | | | | | |
Income before income taxes |
10,911 | 61,364 | 49,972 | |||||||
Income tax benefit (provision) |
2,037 | (23,102 | ) | (16,854 | ) | |||||
| | | | | | | | | | | |
Net income |
$ | 12,948 | $ | 38,262 | $ | 33,118 | ||||
| | | | | | | | | | | |
| | | | | | | | | | | |
| | | | | | | | | | | |
Basic earnings per share |
$ | 0.18 | $ | 0.52 | $ | 0.54 | ||||
Diluted earnings per share |
$ | 0.17 | $ | 0.50 | $ | 0.52 | ||||
Weighted average shares outstanding: |
||||||||||
Basic |
72,727,071 | 73,121,964 | 61,455,584 | |||||||
Diluted |
78,026,159 | 77,141,621 | 63,841,118 | |||||||
Comprehensive income: |
||||||||||
Net income |
$ | 12,948 | $ | 38,262 | $ | 33,118 | ||||
Minimum pension, SERP and postretirement benefit plan obligation adjustment, net of tax (benefit) expense of $(4,908), $640, $(21,744), respectively |
(7,332 | ) | 956 | (32,480 | ) | |||||
Derivative instruments: |
||||||||||
Gain (loss), net of income tax expense (benefit) of $230, $(917) and $(1,670), respectively |
345 | (1,375 | ) | (2,504 | ) | |||||
Reclassification adjustments, net of income tax expense (benefit) of $10, $(21) and $6, respectively |
15 | (32 | ) | 9 | ||||||
Foreign currency translation |
(623 | ) | (1,120 | ) | (426 | ) | ||||
| | | | | | | | | | | |
Other comprehensive loss |
(7,595 | ) | (1,571 | ) | (35,401 | ) | ||||
| | | | | | | | | | | |
Comprehensive income (loss) |
$ | 5,353 | $ | 36,691 | $ | (2,283 | ) | |||
| | | | | | | | | | | |
| | | | | | | | | | | |
| | | | | | | | | | | |
See notes to consolidated financial statements.
69
Smart & Final Stores, Inc. and Subsidiaries
Consolidated Statements of Stockholders' Equity
(In Thousands, Except Share Amounts)
| |
Common Stock | |
|
|
|
||||||||||||||
|---|---|---|---|---|---|---|---|---|---|---|---|---|---|---|---|---|---|---|---|
| |
|
|
Accumulated Other Comprehensive Income (Loss) |
|
|||||||||||||||
| |
Number of Shares |
Amount | Additional Paid-In Capital |
Retained Earnings (Deficit) |
Total | ||||||||||||||
Balance at December 29, 2013 |
57,171,190 | $ | 57 | $ | 311,935 | $ | (1,117 | ) | $ | 30,984 | $ | 341,859 | |||||||
Issuance of common stock in IPO, net of issuance costs of $5,368 |
15,467,500 | 15 | 167,697 | — | — | 167,712 | |||||||||||||
Issuance of common stock, other |
9,500 | — | 79 | — | — | 79 | |||||||||||||
Issuance of restricted stock awards |
681,028 | 1 | (1 | ) | — | — | — | ||||||||||||
Share-based compensation |
— | — | 11,329 | — | — | 11,329 | |||||||||||||
Excess tax benefit for exercise of stock options |
— | — | 728 | — | — | 728 | |||||||||||||
Stock option exercise, net of 498,560 shares net settled |
426,170 | 1 | (2,217 | ) | — | — | (2,216 | ) | |||||||||||
Net income |
— | — | — | 33,118 | — | 33,118 | |||||||||||||
Other comprehensive loss |
— | — | — | — | (35,401 | ) | (35,401 | ) | |||||||||||
| | | | | | | | | | | | | | | | | | | | |
Balance at December 28, 2014 |
73,755,388 | $ | 74 | $ | 489,550 | $ | 32,001 | $ | (4,417 | ) | $ | 517,208 | |||||||
| | | | | | | | | | | | | | | | | | | | |
| | | | | | | | | | | | | | | | | | | | |
| | | | | | | | | | | | | | | | | | | | |
Issuance of restricted stock awards |
29,662 | — | — | — | — | — | |||||||||||||
Forfeiture of restricted stock awards |
(29,058 | ) | — | — | — | — | — | ||||||||||||
Share-based compensation |
— | — | 10,003 | — | — | 10,003 | |||||||||||||
Excess tax benefit for exercise of stock-based compensation awards |
— | — | 358 | — | — | 358 | |||||||||||||
Stock option exercises |
85,286 | — | 719 | — | — | 719 | |||||||||||||
Vested restricted stock awards withheld on net share settlement |
(44,284 | ) | — | (694 | ) | — | — | (694 | ) | ||||||||||
Tax benefit of IPO transaction costs |
— | — | 2,415 | — | — | 2,415 | |||||||||||||
Net income |
— | — | — | 38,262 | — | 38,262 | |||||||||||||
Stock repurchases |
(7,386 | ) | — | (47 | ) | (82 | ) | — | (129 | ) | |||||||||
Other comprehensive loss |
— | — | — | — | (1,571 | ) | (1,571 | ) | |||||||||||
| | | | | | | | | | | | | | | | | | | | |
Balance at January 3, 2016 |
73,789,608 | $ | 74 | $ | 502,304 | $ | 70,181 | $ | (5,988 | ) | $ | 566,571 | |||||||
| | | | | | | | | | | | | | | | | | | | |
| | | | | | | | | | | | | | | | | | | | |
| | | | | | | | | | | | | | | | | | | | |
Issuance of restricted stock awards |
413,330 | — | — | — | — | — | |||||||||||||
Forfeiture of restricted stock awards |
(19,153 | ) | — | — | — | — | — | ||||||||||||
Share-based compensation |
— | — | 9,803 | — | — | 9,803 | |||||||||||||
Stock option exercises |
1,196,162 | 1 | 4,666 | — | — | 4,667 | |||||||||||||
Vested restricted stock awards withheld on net share settlement |
(50,773 | ) | — | (669 | ) | — | — | (669 | ) | ||||||||||
Net income |
— | — | — | 12,948 | — | 12,948 | |||||||||||||
Stock repurchases |
(2,398,521 | ) | (2 | ) | (15,438 | ) | (18,036 | ) | — | (33,476 | ) | ||||||||
Other comprehensive loss |
— | — | — | — | (7,595 | ) | (7,595 | ) | |||||||||||
| | | | | | | | | | | | | | | | | | | | |
Balance at January 1, 2017 |
72,930,653 | $ | 73 | $ | 500,666 | $ | 65,093 | $ | (13,583 | ) | $ | 552,249 | |||||||
| | | | | | | | | | | | | | | | | | | | |
| | | | | | | | | | | | | | | | | | | | |
| | | | | | | | | | | | | | | | | | | | |
See notes to consolidated financial statements.
70
Smart & Final Stores, Inc. and Subsidiaries
Consolidated Statements of Cash Flows
(In Thousands)
| |
Fiscal Year 2016 |
Fiscal Year 2015 |
Fiscal Year 2014 |
|||||||
|---|---|---|---|---|---|---|---|---|---|---|
Operating activities |
||||||||||
Net income |
$ | 12,948 | $ | 38,262 | $ | 33,118 | ||||
Adjustments to reconcile net income to net cash provided by operating activities: |
||||||||||
Depreciation |
51,385 | 38,585 | 35,565 | |||||||
Amortization |
35,630 | 30,181 | 28,629 | |||||||
Amortization of debt discount and debt issuance costs |
2,511 | 2,780 | 3,275 | |||||||
Share-based compensation |
9,803 | 10,003 | 11,329 | |||||||
Excess tax benefits related to share-based payments |
— | (358 | ) | (728 | ) | |||||
Deferred income taxes |
(1,469 | ) | 3,325 | (3,826 | ) | |||||
Dividend from joint venture |
769 | — | — | |||||||
Equity in earnings of joint venture |
(1,525 | ) | (1,378 | ) | (1,037 | ) | ||||
Loss (gain) on disposal of property, plant, and equipment |
282 | (40 | ) | (30 | ) | |||||
Asset impairment |
1,323 | 1,413 | 988 | |||||||
Loss on early extinguishment of debt |
4,978 | 2,192 | 2,224 | |||||||
Changes in operating assets and liabilities: |
||||||||||
Accounts receivable, net |
(2,726 | ) | (3,637 | ) | (2,931 | ) | ||||
Inventories |
(44,429 | ) | (10,885 | ) | (13,902 | ) | ||||
Prepaid expenses and other assets |
(23,962 | ) | (1,202 | ) | (8,074 | ) | ||||
Accounts payable |
31,078 | 9,252 | 31,253 | |||||||
Accrued salaries and wages |
(1,926 | ) | 5,277 | 6,245 | ||||||
Other accrued liabilities |
22,423 | 21,621 | 3,239 | |||||||
| | | | | | | | | | | |
Net cash provided by operating activities |
97,093 | 145,391 | 125,337 | |||||||
Investing activities |
||||||||||
Purchases of property, plant, and equipment |
(148,043 | ) | (132,738 | ) | (114,933 | ) | ||||
Proceeds from disposal of property, plant, and equipment |
2,265 | 8,104 | 95 | |||||||
Assets acquired in Haggen Transaction |
(2,257 | ) | (66,440 | ) | — | |||||
Investment in capitalized software |
(3,193 | ) | (4,265 | ) | (2,466 | ) | ||||
Purchase of intangible asset |
— | — | (100 | ) | ||||||
Other |
(2,024 | ) | (1,277 | ) | 34 | |||||
| | | | | | | | | | | |
Net cash used in investing activities |
(153,252 | ) | (196,616 | ) | (117,370 | ) | ||||
Financing activities |
||||||||||
Issuance of common stock in IPO |
— | — | 173,080 | |||||||
Issuance of common stock, other |
— | — | 79 | |||||||
Proceeds from exercise of stock options |
4,667 | 719 | 450 | |||||||
Payment of minimum withholding taxes on net share settlement of share-based compensation awards |
(669 | ) | (694 | ) | (2,667 | ) | ||||
Fees paid in conjunction with debt financing |
(8,500 | ) | (1,335 | ) | (315 | ) | ||||
Borrowings on bank line of credit |
97,000 | 15,000 | — | |||||||
Payments on bank line of credit |
(38,000 | ) | (10,000 | ) | — | |||||
Issuance of bank debt, net of issuance costs |
30,093 | — | — | |||||||
Payments on bank debt |
— | — | (120,880 | ) | ||||||
Payments of public offering issuance costs |
— | (214 | ) | (5,046 | ) | |||||
Excess tax benefits related to share-based payments |
— | 358 | 728 | |||||||
Stock repurchases |
(33,524 | ) | (129 | ) | — | |||||
Contingent consideration related to acquisition of Smart & Final Holdings Corp. |
— | — | (248 | ) | ||||||
| | | | | | | | | | | |
Net cash provided by financing activities |
51,067 | 3,705 | 45,181 | |||||||
| | | | | | | | | | | |
Net (decrease) increase in cash and cash equivalents |
(5,092 | ) | (47,520 | ) | 53,148 | |||||
Cash and cash equivalents at beginning of period |
59,327 | 106,847 | 53,699 | |||||||
| | | | | | | | | | | |
Cash and cash equivalents at end of period |
$ | 54,235 | $ | 59,327 | $ | 106,847 | ||||
| | | | | | | | | | | |
| | | | | | | | | | | |
| | | | | | | | | | | |
Cash paid during the period for: |
||||||||||
Interest |
$ | 29,750 | $ | 29,462 | $ | 41,290 | ||||
| | | | | | | | | | | |
| | | | | | | | | | | |
| | | | | | | | | | | |
Income taxes |
10,448 | $ | 23,729 | $ | 25,372 | |||||
| | | | | | | | | | | |
| | | | | | | | | | | |
| | | | | | | | | | | |
Non-cash investing and financing activities |
||||||||||
Software development costs incurred but not paid |
$ | 24 | $ | 310 | $ | 419 | ||||
| | | | | | | | | | | |
| | | | | | | | | | | |
| | | | | | | | | | | |
Construction in progress costs incurred but not paid |
$ | 12,070 | $ | 8,534 | $ | 8,101 | ||||
| | | | | | | | | | | |
| | | | | | | | | | | |
| | | | | | | | | | | |
See notes to consolidated financial statements.
71
Smart & Final Stores, Inc. and Subsidiaries
Notes to Consolidated Financial Statements
January 1, 2017
1. Description of Business and Basis of Presentation
Business
Smart & Final Stores, Inc., a Delaware corporation ("SFSI" or the "Successor" and, collectively with its wholly owned subsidiaries, the "Company"), is engaged primarily in the business of selling fresh perishables and everyday grocery items, together with foodservice, packaging and janitorial products. The Company operates non-membership, warehouse-style stores offering products in a range of product sizes.
SFSI was formed in connection with the acquisition of the "Smart & Final" and "Cash & Carry" store businesses through the purchase of all of the outstanding common stock of Smart & Final Holdings Corp., a Delaware corporation (the "Predecessor" or "SFHC"), on November 15, 2012. The principal acquiring entities were affiliates of Ares Management, L.P. ("Ares"), and the acquisition is referred to as the "Ares Acquisition."
The Company operates non-membership warehouse-style grocery stores under the "Smart & Final" banner in California, Arizona, and Nevada. These stores are operated through the Company's principal subsidiary, Smart & Final Stores LLC, a California limited liability company and an indirect wholly owned subsidiary of SFSI ("Smart & Final Stores"), and other related entities. Beginning in 2008, the Company began opening an expanded Smart & Final store format named "Smart & Final Extra!" ("Extra!"). At January 1, 2017, the Company operated 246 stores, including 172 Extra! format stores, under the "Smart & Final" banner.
The Company also operates non-membership warehouse-style grocery stores in Washington, Oregon, California, Idaho, Utah, and Nevada under the "Cash & Carry" banner. At January 1, 2017, the Company operated 59 "Cash & Carry" stores.
The Company classifies its operations into two reportable segments: "Smart & Final" and "Cash and Carry." For additional information on these segments, see Note 14, Segment Information.
The Company's wholly owned subsidiary, Smart & Final de Mexico S.A. de C.V. ("SF Mexico"), is a Mexican holding company that owns 50% of a joint venture. The other 50% of the joint venture is owned by Grupo Calimax S.A. de C.V., an entity comprising the investment interests of a family group which is also the owner of the Calimax grocery store chain in Mexico. At January 1, 2017, this joint venture operated 15 "Smart & Final" format stores in Northwestern Mexico, similar in concept to the Company's U.S. "Smart & Final" stores. This joint venture operates the Mexico stores as a Mexican domestic corporation under the name Smart & Final del Noroeste, S.A. de C.V. ("SFDN").
The Company's 50% joint venture interest is accounted for by the equity method of accounting. The investment in SFDN at each reporting fiscal year-end is reported in the consolidated balance sheets under "Equity investment in joint venture." The carrying value of the investment as of January 1, 2017 and January 3, 2016 represents undistributed earnings of the joint venture and an $8.0 million fair value purchase accounting adjustment recorded as a result of the Ares Acquisition. The "Retained earnings" on SFSI's consolidated balance sheets included earnings of SFDN of $1.5 million and $1.4 million at January 1, 2017 and January 3, 2016, respectively. As of December 30, 2012, SFDN has declared dividends of $15.4 million, representing earnings through 2011. Of the $15.4 million declared dividends, SFDN paid $0.8 million during the year ended January 1, 2017, $0.6 million during the year ended December 29, 2013 and $11.6 million during the period January 2,
72
Smart & Final Stores, Inc. and Subsidiaries
Notes to Consolidated Financial Statements (Continued)
January 1, 2017
1. Description of Business and Basis of Presentation (Continued)
2012 through November 14, 2012. At the end of fiscal years 2016 and 2015, the Company revalued the dividend receivable due to exchange rate fluctuations and recorded exchange losses of $0.4 million and $0.4 million, respectively. The undistributed earnings after 2011 are considered retained indefinitely for reinvestment and, accordingly, no provision is made for U.S. federal and state income taxes and foreign income taxes. See Note 9, Income Taxes.
Secondary Public Offering
On April 24, 2015, certain of the Company's stockholders completed a secondary public offering (the "Secondary Offering") of 10,900,000 shares of Common Stock. The Company did not sell any shares in the Secondary Offering and did not receive any proceeds from the sales of shares by the selling stockholders. Following the Secondary Offering, affiliates of Ares held approximately 60% of the Company's issued and outstanding shares of Common Stock. See Note 16, Stockholders' Equity.
Basis of Presentation
The accompanying consolidated financial statements present the financial position, and results of operations and cash flows of SFSI as of January 1, 2017 and January 3, 2016, and for the years ended January 1, 2017, January 3, 2016 and December 28, 2014.
The consolidated financial statements include the accounts of the Company and have been prepared in accordance with U.S. GAAP. All significant intercompany accounts and transactions have been eliminated in consolidation.
On September 19, 2014, SFSI's board of directors and stockholders approved a 190-for-one stock split on Common Stock. The accompanying consolidated financial statements and notes thereto give retroactive effect to the stock split for all periods presented.
2. Summary of Significant Accounting Policies
Fiscal Years
The Company's fiscal year is the 52- or 53-week period that ends on the Sunday closest to December 31. Fiscal years 2016, 2015, and 2014 ended on January 1, 2017, January 3, 2016 and December 28, 2014, respectively. Each fiscal year typically consists of twelve-week periods in the first, second and fourth quarters and a sixteen-week period in the third quarter. Fiscal years 2016 and 2014 are 52-week fiscal years. Fiscal year 2015 is a 53-week fiscal year and the fourth quarter consisted of a thirteen-week period, ending on January 3, 2016.
Cash and Cash Equivalents
The Company considers all highly liquid instruments purchased with an original maturity of three months or less to be cash equivalents. All credit card, debit card and electronic benefits transfer transactions that process in less than seven days are classified as cash equivalents. The amounts due from banks for these transactions classified as cash equivalents was $28.0 million and $32.2 million as of January 1, 2017 and January 3, 2016, respectively. The carrying amount of cash equivalents is
73
Smart & Final Stores, Inc. and Subsidiaries
Notes to Consolidated Financial Statements (Continued)
January 1, 2017
2. Summary of Significant Accounting Policies (Continued)
approximately the same as their respective fair values due to the short-term maturity of these instruments.
Accounts Receivable, Net
Accounts receivable generally represent billings to customers, billings to vendors for earned rebates and allowances, receivables from SFDN, and other items. The receivable from SFDN primarily relates to billings for the shipment of inventory product to SFDN. The following table sets forth the major components of accounts receivable for each fiscal year-end (in thousands):
| |
January 1, 2017 |
January 3, 2016 |
|||||
|---|---|---|---|---|---|---|---|
Trade |
$ | 2,973 | $ | 3,231 | |||
Vendor |
20,884 | 16,947 | |||||
SFDN |
1,237 | 1,792 | |||||
Other |
6,715 | 5,334 | |||||
| | | | | | | | |
Total |
$ | 31,809 | $ | 27,304 | |||
| | | | | | | | |
| | | | | | | | |
| | | | | | | | |
The Company evaluates the collectability of accounts receivable and determines the appropriate reserve for doubtful accounts based on analysis of historical trends of write-offs and recoveries on various levels of aged receivables. When the Company becomes aware of the deteriorated collectability of a specific account, additional reserves are made to reduce the net recognized receivable to the amount reasonably expected to be collectible or zero. When the specific account is determined to be uncollectible, the net recognized receivable is written off in its entirety against such reserves.
The Company is exposed to credit risk on trade accounts receivable. The Company provides credit to certain trade customers in the ordinary course of business and performs ongoing credit evaluations. Concentrations of credit risk with respect to trade accounts receivable are limited due to the number of customers comprising the Company's customer base. The Company currently believes the allowance for doubtful accounts is sufficient to cover customer credit risks.
Inventories
Inventories consist of merchandise purchased for resale which is stated at the weighted-average cost (which approximates first-in, first-out ("FIFO")) or market. The Company provides for estimated inventory losses between physical inventory counts at its stores based upon historical inventory losses as a percentage of sales. The provision is adjusted periodically to reflect updated trends of actual physical inventory count results. The Company had reserves for inventory losses and slow-moving inventory of $9.7 million and $7.0 million as of January 1, 2017 and January 3, 2016, respectively.
Prepaid Expenses and Other Current Assets
Prepaid expenses and other current assets include primarily prepaid rent, insurance, property taxes, income taxes receivable and other current assets. As of January 1, 2017 and January 3, 2016, prepaid expenses and other current assets included $28.7 million and $11.8 million of income taxes receivable, respectively.
74
Smart & Final Stores, Inc. and Subsidiaries
Notes to Consolidated Financial Statements (Continued)
January 1, 2017
2. Summary of Significant Accounting Policies (Continued)
Property, Plant, and Equipment
Property, plant, and equipment is stated at cost or estimated fair value based on purchase accounting and depreciated or amortized using the straight-line method. Leased property meeting certain criteria is capitalized and the amortization is based on the straight-line method over the term of the lease.
The estimated useful lives are as follows:
| Buildings and improvements | 20 - 25 years | |
| Fixtures and equipment | 3 - 10 years | |
| Leasehold improvements | Lesser of lease term or useful life of improvement |
Costs of normal maintenance and repairs and minor replacements are charged to expense when incurred. Major replacements, remodeling or betterments of properties are capitalized. When assets are sold or otherwise disposed of, the costs and related accumulated depreciation and amortization are removed from the accounts, and any resulting gain or loss is included in the consolidated statements of operations and comprehensive income (loss).
Included in property, plant, and equipment are costs associated with the selection and procurement of real estate sites of $3.1 million and $3.0 million at January 1, 2017 and January 3, 2016, respectively. These costs are amortized over the remaining lease term of the successful sites with which they are associated.
In accordance with Accounting Standards Codification ("ASC") 360, Property, Plant, and Equipment ("ASC 360"), the Company reviews its long-lived assets, including property, plant and equipment for impairment whenever events or changes in circumstances indicate that the carrying amount of an asset may not be recoverable. The Company groups and evaluates long-lived assets for impairment at the individual store level, which is the lowest level at which individual cash flows can be identified. The Company regularly reviews its stores' operating performance for indicators of impairment. Factors it considers important that could trigger an impairment review include a significant underperformance relative to expected historical or projected future operating results, a significant change in the manner of the use of the asset or a significant negative industry or economic trend. Recoverability of assets to be held and used is measured by a comparison of the carrying amount of an asset to estimated undiscounted future cash flows expected to be generated by the asset. If the carrying amount of an asset exceeds its estimated future cash flows, an impairment charge is recognized to the extent the sum of the estimated discounted future cash flows from the use of the asset is less than the carrying value. The Company measured the fair value of its long-lived assets on a nonrecurring basis using Level 3 inputs as defined in the fair value hierarchy. See Note 6, Fair Value Measurements. As a result of such reviews, the Company recorded a pre-tax impairment loss of $1.2 million, $1.4 million and $0.7 million for the years ended January 1, 2017, January 3, 2016 and December 28, 2014, respectively, in the Smart & Final segment. The impairment losses were reported within "Operating and administrative expenses" on the Company's consolidated statements of operations and comprehensive income (loss).
75
Smart & Final Stores, Inc. and Subsidiaries
Notes to Consolidated Financial Statements (Continued)
January 1, 2017
2. Summary of Significant Accounting Policies (Continued)
Capitalized Software
Capitalized software costs are comprised of third-party purchased software costs, capitalized costs associated with internally developed software including internal direct labor costs, and installation costs. Such capitalized costs are amortized over the period that the benefits of the software are fully realizable and enhance the operations of the business, ranging from three to seven years, using the straight-line method.
Capitalized software costs, like other long-lived assets as required by ASC 360, are subject to review for impairment whenever events or changes in circumstances indicate that the carrying amount of the capitalized software may not be recoverable, whether it is in use or under development. Impairment is recognized to the extent the sum of the estimated discounted future cash flows from the use of the capitalized software is less than the carrying value. As a result of such reviews, the Company recorded a pre-tax impairment loss of $0.1 million and $0.3 million in each of the years ended January 1, 2017 and December 28, 2014, in the Smart & Final segment, which was reported within "Operating and administrative expenses" on the Company's consolidated statements of operations and comprehensive income (loss). The Company did not report any impairment loss for the year ended January 3, 2016.
Goodwill and Intangible Assets
In connection with the Ares Acquisition, the intangible assets were adjusted and recorded at fair market value in accordance with ASC Topic 805, Business Combinations ("ASC 805").
During the year ended December 28, 2014, the Company acquired the Sun Harvest trademark. A fee incurred to acquire the trademark of $0.1 million was capitalized as Signature brands and is amortized over a term of 5 years.
During the fourth quarter of 2015, the Company acquired certain assets, including 33 store leases and related fixtures, equipment and liquor licenses, of Haggen Operations Holdings, LLC and Haggen Opco South, LLC (together, "Haggen"). The Company recorded leasehold interests at fair value as of the acquisition dates. Acquired leasehold interests are finite lived intangible assets amortized straight-line over their estimated useful benefit period which is typically the lease term. During the year ended January 1, 2017, leasehold interests was increased for additional acquisition-related transaction costs and adjustments of $0.4 million. Amortization expense reported within "Cost of sales, buying and occupancy" on the Company's consolidated statements of operations and comprehensive income (loss) was $3.6 million and $0.2 million for the year ended January 1, 2017 and January 3, 2016, respectively.
76
Smart & Final Stores, Inc. and Subsidiaries
Notes to Consolidated Financial Statements (Continued)
January 1, 2017
2. Summary of Significant Accounting Policies (Continued)
The following table summarizes the components of other intangible assets, net at January 1, 2017 (in thousands):
| |
Fair Value at Acquisition |
Accumulated Amortization |
Net Book Value |
|||||||
|---|---|---|---|---|---|---|---|---|---|---|
January 1, 2017 |
||||||||||
Indefinite-lived intangible assets: |
||||||||||
Trade names |
$ | 265,000 | $ | — | $ | 265,000 | ||||
Finite-lived intangible assets: |
||||||||||
Signature brands |
67,100 | (13,886 | ) | 53,214 | ||||||
Leasehold interests |
55,129 | (3,824 | ) | 51,305 | ||||||
| | | | | | | | | | | |
Total finite-lived intangible assets |
123,229 | (18,710 | ) | 104,519 | ||||||
| | | | | | | | | | | |
Total intangible assets |
$ | 388,229 | $ | (18,710 | ) | $ | 369,519 | |||
| | | | | | | | | | | |
| | | | | | | | | | | |
| | | | | | | | | | | |
The following table summarizes the components of other intangible assets, net at January 3, 2016 (in thousands):
| |
Fair Value at Acquisition |
Accumulated Amortization |
Net Book Value |
|||||||
|---|---|---|---|---|---|---|---|---|---|---|
January 3, 2016 |
||||||||||
Indefinite-lived intangible assets: |
||||||||||
Trade names |
$ | 265,000 | $ | — | $ | 265,000 | ||||
Finite-lived intangible assets: |
||||||||||
Signature brands |
67,100 | (10,528 | ) | 56,572 | ||||||
Leasehold interests |
54,750 | (200 | ) | 54,550 | ||||||
| | | | | | | | | | | |
Total finite-lived intangible assets |
122,850 | (11,728 | ) | 111,122 | ||||||
| | | | | | | | | | | |
Total intangible assets |
$ | 387,850 | $ | (11,728 | ) | $ | 376,122 | |||
| | | | | | | | | | | |
| | | | | | | | | | | |
| | | | | | | | | | | |
The recorded fair market value for each of the trade names was determined by estimating the amount of royalty income that could be generated from the trade name if it was licensed to a third-party owner and discounting the resulting cash flows using the weighted-average cost of capital for each respective trade name.
The finite-lived intangible assets are amortized over their estimated useful benefit period and have the following weighted-average amortization periods:
| Signature brands | 20 years | |
| Leasehold interests | 24 years |
77
Smart & Final Stores, Inc. and Subsidiaries
Notes to Consolidated Financial Statements (Continued)
January 1, 2017
2. Summary of Significant Accounting Policies (Continued)
Signature brands are amortized on a straight-line basis. Amortization expense reported within "Operating and administrative expenses" on the Company's consolidated statements of operations and comprehensive income (loss) was $3.4 million, $3.7 million and $3.7 million for the years ended January 1, 2017, January 3, 2016 and December 28, 2014, respectively.
Amortization of the finite-lived intangible assets over the next five fiscal years is as follows (in thousands):
2017 |
$ | 6,982 | ||
2018 |
6,982 | |||
2019 |
6,976 | |||
2020 |
7,094 | |||
2021 |
6,761 | |||
Thereafter |
69,724 | |||
| | | | | |
|
$ | 104,519 | ||
| | | | | |
| | | | | |
| | | | | |
In accordance with ASC 350, Intangibles—Goodwill and Other ("ASC 350"), goodwill and intangible assets with indefinite lives are evaluated on an annual basis for impairment during the fourth quarter, or more frequently if events or changes in circumstances indicate that the asset might be impaired. The annual evaluation of impairment for fiscal year 2016 was performed as of December 4, 2016. The Company evaluates goodwill for impairment by comparing the fair value of each reporting unit to its carrying value including the associated goodwill. The Company has designated its reporting units to be its Smart & Final stores and Cash & Carry stores. The Company determines the fair value of the reporting units using the income approach methodology of valuation that includes the discounted cash flow method as well as other generally accepted valuation methodologies. If the fair value of the reporting unit exceeds the carrying value of the net assets, including goodwill assigned to that unit, goodwill is not impaired. If the carrying value of the reporting unit's net assets, including goodwill, exceeds the fair value of the reporting unit, then the Company determines the implied fair value of the reporting unit's goodwill. If the carrying value of a reporting unit's goodwill exceeds its implied value, then an impairment of goodwill has occurred and the Company would recognize an impairment charge for the difference between the carrying amount and the implied fair value of goodwill. For the years ended January 1, 2017, January 3, 2016 and December 28, 2014, the Company did not recognize any goodwill impairment loss as a result of such evaluation.
The Company evaluates its indefinite-lived intangible assets associated with trade names by comparing the fair value of each trade name with its carrying value. The Company determines the fair value of the indefinite-lived trade names using a "relief from royalty payments" methodology. This methodology involves estimating reasonable royalty rates for each trade name and applying these royalty rates to a revenue stream and discounting the resulting cash flows to determine fair value. For the years ended January 1, 2017, January 3, 2016 and December 28, 2014, the Company did not recognize any indefinite-lived trade name impairment loss as a result of such evaluation.
Finite-lived intangible assets, like other long-lived assets as required by ASC 360, are subject to review for impairment whenever events or changes in circumstances indicate that the carrying amount of the finite-lived intangible asset may not be recoverable. Impairment is recognized to the extent the
78
Smart & Final Stores, Inc. and Subsidiaries
Notes to Consolidated Financial Statements (Continued)
January 1, 2017
2. Summary of Significant Accounting Policies (Continued)
sum of the discounted estimated future cash flows from the use of the finite-lived intangible asset is less than the carrying value. The Company did not recognize any impairment loss as a result of such evaluation during any of the periods presented.
Purchase Accounting
The Company evaluates whether a transaction or other event meets the definition of a business combination. A business consists of inputs and processes that have the ability to create outputs. Business combinations are accounted for using the acquisition method of accounting. Under the acquisition method, tangible and intangible assets acquired and liabilities assumed are recorded at their respective fair values as of the acquisition date in our consolidated financial statements. The excess of the fair value of consideration transferred over the fair value of the net assets acquired, if any, is recorded as goodwill. For the Ares Acquisition, the excess of the purchase price over the sum of the amounts assigned to the tangible and intangible net assets acquired of $611.2 million was recorded as goodwill. The intangible assets recorded related to the Ares Acquisition are not expected to be deductible for tax purposes as the acquisition of the Predecessor was a stock purchase. See Note 3, Ares Acquisition.
An acquired group of assets that do not meet the definition of a business are accounted for as an asset acquisition. Asset acquisitions are accounted for using a cost accumulation approach, whereby the total consideration paid is allocated to the individual assets acquired and liabilities assumed on a relative fair value basis. See Note 19, Haggen Transaction.
These estimates of fair values, the allocation of the purchase price and other factors are subject to significant judgments and the use of estimates. The inputs used in the fair value analysis fall within Level 3 of the fair value hierarchy due to the use of significant unobservable inputs to determine fair value. See Note 6, Fair Value Measurements.
Other Assets
Other assets primarily consist of assets held in trusts for certain retirement plans (see Note 8, Retirement Benefit Plans and Postretirement and Postemployment Benefit Obligations), insurance recovery receivables related to self-insurance, liquor licenses and other miscellaneous assets. As of January 1, 2017 and January 3, 2016, other assets included a dividend receivable from SFDN to SF Mexico of $1.3 million and $2.4 million, respectively.
Accounts Payable
The Company's banking arrangements provide for the daily replenishment and limited monthly advanced payments of vendor payable accounts as checks are presented or payments are demanded. The checks and the advanced payments outstanding in these bank accounts were $56.7 million and $38.0 million at January 1, 2017 and January 3, 2016, respectively, and are included in "Accounts payable" in the consolidated balance sheets.
79
Smart & Final Stores, Inc. and Subsidiaries
Notes to Consolidated Financial Statements (Continued)
January 1, 2017
2. Summary of Significant Accounting Policies (Continued)
Other Long-Term Liabilities
Other long-term liabilities include primarily general liabilities, workers' compensation liabilities, liabilities for deferred compensation plan, leasehold interests and other miscellaneous long-term liabilities. As a result of the Ares Acquisition, leasehold interests were adjusted and recorded at fair market value in accordance with ASC 805. At November 15, 2012, the fair value of the lease obligations was $9.8 million. As of January 1, 2017 and January 3, 2016, leasehold interests, related to Ares Acquisition, of $6.6 million and $7.6 million, net of accumulated amortization of $3.2 million and $2.2 million, respectively, are included in other long-term liabilities. These leasehold interests are amortized over their estimated useful benefit periods, which is typically the lease term. The weighted-average amortization period is 14 years.
Lease Accounting
Certain of the Company's operating leases provide for minimum annual payments that increase over the life of the lease. The aggregate minimum annual payments are charged to expense on a straight-line basis beginning when the Company takes possession of the property and extending over the term of the related lease. The amount by which straight-line rent expense exceeds actual lease payment requirements in the early years of the leases is accrued as deferred minimum rent and reduced in later years when the actual cash payment requirements exceed the straight-line expense. ASC 410, Asset Retirement and Environmental Obligations ("ASC 410"), requires an entity to recognize a liability for the fair value of a conditional asset retirement obligation if the fair value of the liability can be reasonably estimated. Due to the nature of the Company's business, its asset retirement obligation with respect to owned or leased properties is not significant.
Store Opening and Closing Costs
New store opening costs consisting primarily of rent, store payroll and general operating costs are charged to expense as incurred prior to the store opening.
In the event a leased store is closed before the expiration of the associated lease, the discounted remaining lease obligation less estimated sublease rental income, asset impairment charges related to improvements and fixtures, inventory write-downs and other miscellaneous closing costs associated with the disposal activity are recognized when the store closes.
During the year ended January 1, 2017, the Company closed eight operating stores, resulting in an asset impairment loss of $0.7 million and lease obligation expense of $2.9 million, which were reported within "Operating and administrative expenses" on the accompanying consolidated statements of operations and comprehensive income.
Share-Based Compensation
The Company accounts for share-based compensation in accordance with ASC 718, Compensation—Stock Compensation ("ASC 718"). ASC 718 requires all share-based payments to be recognized in the statements of operations and comprehensive income as compensation expense based on the fair value of an award over its requisite service period, taking into consideration estimated forfeiture rates.
80
Smart & Final Stores, Inc. and Subsidiaries
Notes to Consolidated Financial Statements (Continued)
January 1, 2017
2. Summary of Significant Accounting Policies (Continued)
Under the fair value recognition provisions of ASC 718, the Company measures share-based compensation cost at the grant date based on the fair value of the award and recognizes share-based compensation cost as an expense over the award's vesting period. As share-based compensation expense recognized in the consolidated statements of operations and comprehensive income (loss) of the Company is based on awards ultimately expected to vest, the amount of expense has been reduced for estimated forfeitures. The Company's forfeiture rate assumption used in determining its share-based compensation expense is estimated primarily based upon historical data. The actual forfeiture rate could differ from these estimates.
The Company uses the Black-Scholes-Merton option-pricing model to determine the grant date fair value for each stock option grant. The Black-Scholes-Merton option-pricing model requires extensive use of subjective assumptions. Application of alternative assumptions could produce significantly different estimates of the fair value of share-based compensation and, consequently, the related amounts recognized in the Company's consolidated statements of operations and comprehensive income (loss). The Company recognizes compensation cost for graded vesting awards as if they were granted in multiple awards. Management believes the use of this "multiple award" method is preferable because a stock option grant with graded vesting is effectively a series of individual grants that vest over various periods and management believes that this method provides for better matching of compensation costs with the associated services rendered throughout the applicable vesting periods.
With certain exceptions, stock options granted after the Ares Acquisition and prior to the closing of the IPO gave the Company repurchase rights. As a result of the Company's ability to exercise such repurchase rights and the underlying provisions of such repurchase rights, the Company did not record any share-based compensation expense related to these grants prior to the closing of the IPO. See Note 12, Share-Based Compensation.
Significant Accounting Estimates
The preparation of financial statements in conformity with U.S. GAAP requires management to make estimates and assumptions. Such estimates and assumptions could affect the reported amounts of assets and liabilities and the disclosure of contingent assets and liabilities at the date of the financial statements and the reported amounts of revenues and expenses during the reporting period. Actual results could differ from those estimates.
Revenue Recognition
Revenues from the sale of products are recognized at the point of sale. Discounts provided to customers at the time of sale are recognized as a reduction in sales as the products are sold. Returns are also recognized as a reduction in sales and are immaterial in relation to total sales. The Company collects sales tax on taxable products purchased by its customers and remits such collections to the appropriate taxing authority in accordance with local laws. Sales tax collections are presented in the consolidated statements of operations and comprehensive income (loss) on a net basis and, accordingly, are excluded from reported revenues.
Proceeds from the sale of the Company's Smart & Final gift cards are recorded as a liability at the time of sale, and recognized as sales when they are redeemed by the customer. The Smart & Final gift
81
Smart & Final Stores, Inc. and Subsidiaries
Notes to Consolidated Financial Statements (Continued)
January 1, 2017
2. Summary of Significant Accounting Policies (Continued)
cards do not have an expiration date and the Company is not required to escheat the value of unredeemed gift cards in the applicable jurisdictions. The Company has determined a gift card breakage rate based upon historical redemption patterns. Estimated breakage amounts are accounted for under the redemption recognition method, which results in recognition of estimated breakage income in proportion to actual gift card redemptions.
Cost of Sales, Buying and Occupancy
The major categories of costs included in cost of sales, buying and occupancy are cost of goods, distribution costs, costs of the Company's buying department and store occupancy costs, net of earned vendor rebates and other allowances. Distribution costs consist of all warehouse receiving and inspection costs, warehousing costs, all transportation costs associated with shipping goods from the Company's warehouses to its stores, and other costs of its distribution network. The Company does not exclude any material portion of these costs from cost of sales.
Vendor Rebates and Other Allowances
As a component of the Company's consolidated procurement program, the Company frequently enters into contracts with vendors that provide for payments of rebates or other allowances. As prescribed by ASC 605, Revenue Recognition , these vendor payments are reflected in the carrying value of the inventory when earned or as progress is made toward earning the rebate or allowance and as a component of cost of sales as the inventory is sold. Certain of these vendor contracts provide for rebates and other allowances that are contingent upon the Company meeting specified performance measures such as a cumulative level of purchases over a specified period of time. Such contingent rebates and other allowances are given accounting recognition at the point at which achievement of the specified performance measures are deemed to be probable and reasonably estimable.
Operating and Administrative Expenses
The major categories of operating and administrative expenses include store direct expenses associated with displaying and selling at the store level, primarily labor and related fringe benefit costs, advertising and marketing costs, overhead costs and corporate office costs.
The Company charges to expense the costs of advertising as incurred. Total advertising expense reported within "Operating and administrative expenses" on the Company's consolidated statements of operations and comprehensive income (loss) was $44.3 million, $37.9 million, and $32.0 million for the years ended January 1, 2017, January 3, 2016 and December 28, 2014, respectively.
Income Taxes
The Company accounts for income taxes in accordance with ASC 740, Income Taxes ("ASC 740"). In accordance with ASC 740, the Company recognizes deferred tax assets and liabilities based on the liability method, which requires an adjustment to the deferred tax asset or liability to reflect income tax rates currently in effect. When income tax rates increase or decrease, a corresponding adjustment to income tax expense is recorded by applying the rate change to the cumulative temporary differences. ASC 740 prescribes the recognition threshold and measurement principles for financial statement
82
Smart & Final Stores, Inc. and Subsidiaries
Notes to Consolidated Financial Statements (Continued)
January 1, 2017
2. Summary of Significant Accounting Policies (Continued)
disclosure of tax positions taken or expected to be taken on a tax return. ASC 740 requires the Company to determine whether it is "more likely than not" that a tax position will be sustained upon examination by the appropriate taxing authorities before any part of the benefit can be recognized. Additionally, ASC 740 provides guidance on recognition measurement, derecognition, classification, related interest and penalties, accounting in interim periods, disclosure and transition.
On March 30, 2016, the FASB issued Accounting Standards Update ("ASU") No. 2016-09, Compensation-Stock Compensation (Topic 718): Improvements to Employee Share-Based Payment Accounting ("ASU 2016-09"). ASU 2016-09 simplifies several aspects of the accounting for employee share-based payment transactions including the accounting for income taxes, forfeitures and statutory tax withholding requirements. Under the new guidance, companies will no longer record excess tax benefits and certain tax deficiencies in additional paid-in capital ("APIC"). Instead, they will record all excess tax benefits and tax deficiencies as income tax expense or benefit in the income statement, and APIC pools will be eliminated. ASU 2016-09 also will allow an employer to make a policy election to account for forfeitures as they occur and to repurchase more of an employee's shares than it can today for tax withholding purposes without triggering liability accounting. The new standard also amends the presentation of employee share-based payment-related items in the statement of cash flows by requiring that excess income tax benefits and deficiencies be classified in cash flows from operating activities (which the Company previously included in cash flows from financing activities), and that cash paid to taxing authorities arising from the withholding of shares from employees be classified in cash flows from financing activities (which is consistent with the Company's past practice). ASU 2016-09 is effective for annual reporting periods beginning after December 15, 2016. Early adoption is permitted in any annual or interim period for which financial statements have not been issued, but all of the guidance must be adopted in the same period. The Company elected early adoption of ASU 2016-09 in the second quarter of 2016. As a result of the adoption of ASU 2016-09, in the second quarter of 2016, the Company recognized excess tax benefits as income tax benefit. There was no change to retained earnings with respect to excess tax benefits. The treatment of forfeitures has not changed as the Company has elected to continue its current practice of estimating the number of forfeitures. As such, the adoption of ASU 2016-09 had no cumulative effect on retained earnings. With the adoption of ASU 2016-09, the Company has elected to present the cash flow statement on a prospective transition method and no prior periods have been adjusted.
Foreign Currency Translations
The Company's joint venture in Mexico uses the Mexican Peso as its functional currency. The joint venture's assets and liabilities are translated into U.S. dollars at the exchange rates prevailing at the balance sheet dates. Revenue and expense accounts are translated into U.S. dollars at average exchange rates during the year. Foreign exchange translation adjustments are included in "Accumulated other comprehensive income (loss)," which is reflected as a separate component of stockholders' equity, in the accompanying consolidated balance sheets.
Derivative Financial Instruments
The Company uses interest rate swaps to manage its exposure to adverse fluctuations in interest rates. The contracts are accounted for in accordance with ASC 815, Derivatives and Hedging
83
Smart & Final Stores, Inc. and Subsidiaries
Notes to Consolidated Financial Statements (Continued)
January 1, 2017
2. Summary of Significant Accounting Policies (Continued)
("ASC 815"). ASC 815 requires every derivative instrument to be recorded in the Company's consolidated balance sheets as either an asset or liability measured at its fair value. The Company designates its interest rate swaps as cash flow hedges and formally documents its hedge relationships, including identification of the hedging instruments and the hedged items, as well as its risk management objectives and strategies for undertaking the hedge transaction. Accordingly, changes in estimated fair value related to the interest rate swaps are recognized in "Accumulated other comprehensive income (loss)" in the consolidated statements of stockholders' equity and recognized in the consolidated statements of operations and comprehensive income (loss) when the hedged items affect earnings. See Note 5, Derivative Financial Instruments.
Debt Discount and Deferred Financing Costs
Costs incurred in connection with the placement of long-term debt paid directly to the Company's lenders are treated as a debt discount. Costs incurred in connection with the placement of long-term debt paid to third parties are treated as debt issuance costs and are amortized to interest expense over the term of the related debt using the effective interest method.
On November 15, 2012, debt issuance costs and fees paid to the lenders related to the Ares Acquisition, totaling $17.5 million, were recorded as a reduction to debt and are amortized to interest expense over the terms of the underlying debt instruments using the effective interest method. At January 1, 2017 and January 3, 2016, the debt discount was $5.7 million and $4.8 million, respectively (net of accumulated amortization of $6.0 million and $4.9 million, respectively). See Note 4, Debt.
On November 15, 2012, debt issuance costs and fees paid to parties other than the lenders related to the Ares Acquisition, totaling $17.2 million, have been capitalized and are amortized to interest expense over the terms of the underlying debt instruments using the effective interest method. At January 1, 2017 and January 3, 2016, these debt issuance costs were $4.4 million and $4.2 million, respectively (net of accumulated amortization of $7.5 million and $6.0 million, respectively).
Effective beginning January 4, 2016, the Company adopted ASU No. 2015-03, Imputation of Interest (Subtopic 835-30): Simplifying the Presentation of Debt Issuance Costs ("ASU 2015-03"). As a result of the adoption of ASU 2015-03, the Company presented capitalized debt issuance costs in its consolidated balance sheets as a direct reduction to debt and the new guidance was retrospectively applied to all prior periods presented in its consolidated balance sheets. Prior to the adoption of ASU 2015-03, deferred financing costs were presented as an asset in the Company's consolidated balance sheets.
Self-Insurance
The Company has various insurance programs related to its risks and costs associated with workers' compensation and general liability claims. The Company has elected to purchase third-party insurance to cover the risk in excess of certain dollar limits established for each respective program.
84
Smart & Final Stores, Inc. and Subsidiaries
Notes to Consolidated Financial Statements (Continued)
January 1, 2017
2. Summary of Significant Accounting Policies (Continued)
The Company has recorded self-insurance accruals of $51.7 million and $36.2 million as of January 1, 2017 and January 3, 2016, respectively related to its workers' compensation and general liability programs. Included in this aggregate accrual are amounts of $11.7 million as of January 1, 2017 related to the risk in excess of certain dollar limits related to the Company's workers compensation California self-insured program and its general liability program. The Company has also recorded a corresponding insurance recovery receivable of $11.7 million as of January 1, 2017 from its third-party insurance carriers related to the risk in excess of certain dollar limits related to its workers compensation California self-insured program and its general liability program.
The Company establishes estimated accruals for its insurance programs based on available claims data, historical trends and experience, and projected ultimate costs of the claims. These accruals are based on estimates prepared with the assistance of outside actuaries and consultants, and the ultimate cost of these claims may vary from initial estimates and established accruals. The actuaries periodically update their estimates and the Company records such adjustments in the period in which such determination is made.
The accrued obligation for these self-insurance programs and the corresponding insurance recovery receivable are included in "Other long-term liabilities" and "Other assets", respectively, in the consolidated balance sheets.
Fair Value of Financial Instruments
The Company's financial instruments recorded in the consolidated balance sheets include cash and cash equivalents, accounts receivable, derivatives, investments in affiliates, accounts payable, accrued expenses and long-term variable rate debt. The carrying amounts of cash and cash equivalents, accounts receivable, derivatives, equity investment in joint venture, accounts payable and accrued expenses approximate fair value.
The Company's debt is not listed or traded on an established market. For the purpose of determining the fair value of the Company's first lien term loan facility (as amended, the "Term Loan Facility"), the administrative agent has provided to the Company the fair value of the Term Loan Facility based upon orderly trading activity and related closing prices for actual trades of the Term Loan Facility as well as indications of interest by prospective buyers and sellers and related bid/ask prices. As of January 1, 2017, the carrying value of the Term Loan Facility approximates fair value based upon valuations received from the administrative agent, which reflected a pricing valuation of 99.75% of carrying value. The carrying value of the Term Loan Facility was $625.0 million, compared to an indicated fair value of $623.4 million as of January 1, 2017. The Company's estimates of the fair value of long-term debt were classified as Level 2 in the fair value hierarchy.
The Company's consolidated financial statements reflect its investment in Sprouts Farmers Market, Inc. ("Sprouts") through the Company's supplemental deferred compensation plan. The investment is presented at fair market value.
Accounting for Retirement Benefit Plans
The Company accounts for its retirement benefit plans and postretirement and postemployment benefit obligations in accordance with ASC 715, Compensation—Retirement Benefits ("ASC 715").
85
Smart & Final Stores, Inc. and Subsidiaries
Notes to Consolidated Financial Statements (Continued)
January 1, 2017
2. Summary of Significant Accounting Policies (Continued)
ASC 715 requires the Company to recognize the overfunded or underfunded status of a defined benefit plan, measured as the difference between the fair value of plan assets and the plan's benefit obligation, as an asset or liability in its consolidated balance sheets and to recognize changes to that funded status in the year in which the changes occur through accumulated other comprehensive income (loss). See Note 8, Retirement Benefit Plans and Postretirement and Postemployment Benefit Obligations. ASC 715 also requires measurement of the funded status of a plan as of the Company's consolidated balance sheet dates.
Earnings per Share
Basic earnings per share is calculated by dividing net income by the weighted average number of shares outstanding during the fiscal period.
Diluted earnings per share is calculated by dividing net income by the weighted average number of shares outstanding, plus, where applicable, shares that would have been outstanding related to dilutive stock options and unvested restricted stock.
Reclassifications
Certain reclassifications were made to the prior period financial statements to conform to current period presentation. See Note 2, Significant Accounting Policies—Debt Discount and Debt Issuance Costs.
Recently Issued Accounting Pronouncements
In May 2014, the FASB issued ASU No. 2014-09, Revenue from Contracts with Customers (Topic 606) ("ASU 2014-09"). ASU 2014-09 is a comprehensive new revenue recognition model that requires an entity to recognize revenue to depict the transfer of goods or services to a customer at an amount that reflects the consideration it expects to receive in exchange for those goods or services. ASU 2014-09 also requires expanded disclosures about revenue recognition. In adopting ASU 2014-09, entities may use either a full retrospective or a modified retrospective approach. ASU 2014-09 was to be effective for the first interim period within annual reporting periods beginning after December 15, 2016, and early adoption is not permitted. In August 2015, the FASB issued ASU No. 2015-14, Revenue from Contracts with Customers: Deferral of the Effective Date, which defers the effective date of ASU 2014-09 for all entities by one year. During 2016, the FASB issued additional clarification guidance on the new revenue recognition standard which also included certain scope improvements and practical expedients.
Because the standard will impact various business processes, systems and controls of the Company, a project team has been formed to evaluate and guide the implementation. To date, the Company has performed a preliminary detailed review of key contracts and comparing historical accounting policies and practices to the new standard, including principal versus agent considerations as amended through ASU 2016-08, Principal Versus Agent Considerations (Reporting Revenue Gross Versus Net) ("ASU 2016-08"). The Company's operations are primarily engaged in the business of selling fresh perishables and everyday grocery items, together with foodservice, packaging and janitorial products. Revenues from the sale of such products are recognized at the point of sale. The Company is
86
Smart & Final Stores, Inc. and Subsidiaries
Notes to Consolidated Financial Statements (Continued)
January 1, 2017
2. Summary of Significant Accounting Policies (Continued)
continuing to evaluate the impact ASU 2014-09, ASU 2016-08 and other amendments and related interpretive guidance will have on our consolidated financial statements. The Company currently anticipates utilizing the modified retrospective method of adoption allowed by the standard, and plans to adopt the standard as of January 1, 2018.
In July 2015, the FASB issued ASU No. 2015-11, Inventory (Topic 330): Simplifying the Measurement of Inventory ("ASU 2015-11"). The amendments in ASU 2015-11 do not apply to inventory that is measured using last-in, first-out ("LIFO") or the retail inventory method. The amendments apply to all other inventory, which includes inventory that is measured using FIFO or average cost. An entity should measure inventory within the scope of ASU 2015-11 at the lower of cost and net realizable value. Net realizable value is the estimated selling prices in the ordinary course of business, less reasonably predictable costs of completion, disposal, and transportation. Subsequent measurement is unchanged for inventory measured using LIFO or the retail inventory method. For public business entities, the amendments in ASU 2015-11 are effective for fiscal years beginning after December 15, 2016, including interim periods within those fiscal years. The Company does not expect the adoption of ASU 2015-11 will have a material impact on the Company's consolidated financial statements.
In November 2015, the FASB issued ASU No. 2015-17, Balance Sheet Classification of Deferred Taxes ("ASU 2015-17"), which requires entities to present deferred tax assets and deferred tax liabilities as noncurrent in a classified balance sheet. ASU 2015-17 simplifies the current guidance in ASC Topic 740, Income Taxes, which requires entities to separately present deferred tax assets and liabilities as current and noncurrent in a classified balance sheet. ASU 2015-17 is effective for fiscal years beginning after December 15, 2016, and interim periods within those annual periods. Although early adoption is permitted for all entities as of the beginning of an interim or annual reporting period, the Company decided not to early adopt ASU 2015-17. The Company does not expect the adoption of ASU 2015-17 will have a material impact on the Company's consolidated financial statements.
In January 2016, the FASB issued ASU No. 2016-01, Financial Instruments—Overall (Subtopic 825-10): Recognition and Measurement of Financial Assets and Financial Liabilities ("ASU 2016-01"). The amendments in ASU 2016-01 require an entity to measure equity investments that do not result in consolidation and are not accounted for under the equity method at fair value with changes in fair value recognized in net income. The amendments also require an entity to present separately in other comprehensive income the portion of the total change in the fair value of a liability resulting from a change in the instrument-specific credit risk when the entity has elected to measure the liability at fair value in accordance with the fair value option for financial instruments. The requirement to disclose the method(s) and significant assumptions used to estimate the fair value for financial instruments measured at amortized cost on the balance sheet has been eliminated by the amendments. ASU 2016-01 is effective for fiscal years beginning after December 15, 2017, including interim periods within those fiscal years. The Company does not expect the adoption of ASU 2016-01 will have a material impact on the Company's consolidated financial statements.
In February 2016, the FASB issued ASU No. 2016-02, Leases (Topic 842) ("ASU 2016-02"). ASU 2016-02 will require organizations that lease assets, referred to as "lessees", to recognize on the balance sheet the assets and liabilities for the rights and obligations created by those leases. A lessee will be required to recognize assets and liabilities for leases with lease terms of more than 12 months. Consistent with current GAAP, the recognition, measurement and presentation of expenses and cash
87
Smart & Final Stores, Inc. and Subsidiaries
Notes to Consolidated Financial Statements (Continued)
January 1, 2017
2. Summary of Significant Accounting Policies (Continued)
flows arising from a lease by a lessee primarily will depend on its classification as a finance or operating lease. However, unlike current GAAP, which requires only capital leases to be recognized on the balance sheet, ASU 2016-02 will require both types of leases to be recognized on the balance sheet. As a result, lessees will be required to put most leases on their balance sheets while recognizing expense on their income statements in a manner similar to current accounting. ASU 2016-02 is effective for fiscal years beginning after December 15, 2018, including interim periods within those fiscal years. ASU 2016-02 also may require additional disclosures, including qualitative and quantitative requirements, providing additional information about the amounts recorded in the financial statements. The Company is currently evaluating this guidance and the impact it will have on its consolidated financial statements.
On March 9, 2016, the FASB issued ASU No. 2016-04, Liabilities—Extinguishments of Liabilities (Subtopic 405-20): Recognition of Breakage for Certain Prepaid Stored-Value Products ("ASU 2016-04"). ASU 2016-04 requires issuers of prepaid stored-value products redeemable for goods, services or cash at third-party merchants to derecognize liabilities related to those products for breakage, or the value of prepaid stored-value products that is not redeemed by consumers for goods, services or cash. An entity that expects to be entitled to a breakage amount for a liability resulting from the sale of a prepaid stored-value product within the scope of ASU 2016-04 is required to derecognize the liability related to expected breakage in proportion to the pattern of rights expected to be exercised by the consumer only if it is probable that a significant reversal of the recognized breakage amount will not occur. If an entity does not expect to be entitled to a breakage amount, it is required to derecognize the related liability when the likelihood of a consumer exercising its remaining rights becomes remote. Entities will apply the guidance using either a modified retrospective approach with a cumulative-effect adjustment to retained earnings as of the beginning of the period of adoption or a full retrospective approach. The guidance is for fiscal years beginning after December 15, 2017, and interim periods within those fiscal years. Early adoption is permitted. The Company does not expect the adoption of ASU 2016-04 will have a material impact on the Company's consolidated financial statements.
In June 2016, the FASB issued ASU No. 2016-13, Financial Instruments—Credit Losses (Topic 326): Measurement of Credit Losses on Financial Instruments ("ASU 2016-13"). ASU 2016-13 replaces the incurred loss impairment methodology under current GAAP. The new guidance requires immediate recognition of estimated credit losses expected to occur for most financial assets and certain other instruments. For available-for-sale debt securities with unrealized losses, the losses will be recognized as allowances rather than reductions in the amortized cost of the securities. It is effective for annual reporting periods beginning after December 15, 2019 and interim periods within those annual periods. Early adoption for annual reporting periods beginning after December 15, 2018 is permitted. Entities will apply the standard's provisions as a cumulative-effect adjustment to retained earnings as of the beginning of the first effective reporting period. The Company is currently evaluating this guidance and the impact it will have on its consolidated financial statements.
In August 2016, the FASB issued ASU 2016-15, Statement of Cash Flows (Topic 230): Classification of Certain Cash Receipts and Cash Payments ("ASU 2016-15"). ASU 2016-15 is intended to reduce diversity in practice of how certain transactions are classified in the statement of cash flows. ASU 2016-15 addresses the classification of various transactions, including, among other things, debt prepayment or debt extinguishment costs, settlement of zero-coupon debt instruments, contingent
88
Smart & Final Stores, Inc. and Subsidiaries
Notes to Consolidated Financial Statements (Continued)
January 1, 2017
2. Summary of Significant Accounting Policies (Continued)
consideration payments made after a business combination, distributions received from equity method investments, and beneficial interests in securitization transactions. ASU 2016-15 is effective for public entities for fiscal years beginning after December 15, 2017, including interim periods within those fiscal years. Early adoption is permitted, including adoption in an interim period. The Company does not expect the adoption of ASU 2016-15 will have a material impact on the Company's consolidated financial statements.
In October 2016, the FASB issued ASU 2016-16, Income Taxes (Topic 740): Intra-Entity Transfers of Assets Other Than Inventory ("ASU 2016-16"). ASU 2016-16 is intended to simplify the accounting for income taxes related to intra-entity asset transfers. It allows an entity to recognize the tax expense from the sale of an asset in the seller's tax jurisdiction when the transfer occurs, even though the pre-tax effects of that transaction are eliminated in consolidation. ASU 2016-16 is effective for public entities for fiscal years beginning after December 15, 2017, including interim periods within those fiscal years. Early adoption is permitted only in the first quarter of 2017. The Company is currently evaluating this guidance and the impact it will have on its consolidated financial statements.
In November 2016, the FASB issued ASU 2016-18, Statement of Cash Flows (Topic 230): Restricted Cash (a consensus of the FASB Emerging Issues Task Force) ("ASU 2016-18"). ASU 2016-18 provides specific guidance on the classification and presentation of changes in restricted cash on the statement of cash flows. This guidance is effective for interim and annual reporting periods beginning after December 15, 2017, and early adoption is permitted. The adoption of this guidance requires a retrospective transition method to each period presented. The Company does not expect the adoption of ASU 2016-18 will have a material impact on the Company's consolidated financial statements.
In December 2016, the FASB issued ASU 2016-20, Technical Corrections and Improvements to Topic 606, Revenue from Contracts with Customers ("ASU 2016-20"). ASU 2016-20 addresses various technical corrections and improvements to Topic 606 and other Topics amended by ASU 2014-09. This guidance is effective for interim and annual reporting periods beginning after December 15, 2017. This guidance must be applied prospectively to transactions occurring within the period of adoption. The Company is currently evaluating the impact of this guidance on its consolidated financial statements.
In January 2017, the FASB issued ASU 2017-01, Business Combinations (Topic 805): Clarifying the Definition of a Business ("ASU 2017-01"). ASU 2017-01 narrows the definition of a "business". This standard provides guidance to assist entities with evaluating when a set of transferred assets and activities is a business. This guidance is effective for interim and annual reporting periods beginning after December 15, 2017. This guidance must be applied prospectively to transactions occurring within the period of adoption. The Company does not expect the adoption of ASU 2017-01 will have a material impact on the Company's consolidated financial statements.
In January 2017, the FASB issued ASU 2017-04, Intangibles-Goodwill and Other (Topic 350): Simplifying the Test for Goodwill Impairment ("ASU 2017-04"). ASU 2017-04 eliminates Step 2 from the goodwill impairment test, instead requiring an entity to recognize a goodwill impairment charge for the amount by which the goodwill carrying amount exceeds the reporting unit's fair value. This guidance is effective for interim and annual goodwill impairment tests in fiscal years beginning after December 15, 2019, and early adoption is permitted for interim or annual goodwill impairment tests performed on testing dates after January 1, 2017. This guidance must be applied on a prospective basis. The
89
Smart & Final Stores, Inc. and Subsidiaries
Notes to Consolidated Financial Statements (Continued)
January 1, 2017
2. Summary of Significant Accounting Policies (Continued)
Company does not expect the adoption of ASU 2017-04 will have a material impact on the Company's consolidated financial statements.
3. Ares Acquisition
On November 15, 2012, pursuant to the Purchase and Sale Agreement (the "Acquisition Agreement") dated as of October 9, 2012, among the stockholders of the Predecessor (the "Sellers") and affiliates of Ares (the "Buyers"), the Ares Acquisition was consummated. Upon completion of the Ares Acquisition, each share of common stock of the Predecessor was cancelled and converted into the right to receive cash for aggregate cash consideration of approximately $669.5 million. In addition, payments in satisfaction of Predecessor stock options aggregated $54.2 million.
The Ares Acquisition was financed by:
- •
- Borrowings consisting of (i) a $525.0 million, 7-year Term Loan Facility; (ii) a $195.0 million, 8-year second lien
term loan credit facility (the "Second Lien Term Loan Facility"); (iii) a $150.0 million, 5-year asset-based revolving credit facility (the "Revolving Credit Facility"), which was drawn
for $10.0 million at closing of the Ares Acquisition, (see Note 4, Debt); and
- •
- Equity investment of $290.0 million from affiliates of Ares, $9.2 million from certain management employees of the Predecessor and $10.9 million from the management equity rollover.
The Acquisition Agreement further provided that any income tax refunds or credits actually received by the Company relating to the Predecessor tax periods or any benefit of any overpayment of income taxes relating to the Predecessor tax periods that is applied to a Successor taxable period would inure to the benefit of the Sellers. During the years ended December 28, 2014 and December 29, 2013, the Company paid a total of $0.2 million and $16.7 million, respectively, to the Sellers related to the Predecessor tax periods. No payment was made during the years ended January 1, 2017 and January 3, 2016. As of January 1, 2017, the Company has a payable to the Sellers of $2.5 million.
90
Smart & Final Stores, Inc. and Subsidiaries
Notes to Consolidated Financial Statements (Continued)
January 1, 2017
4. Debt
Current portion of debt at January 1, 2017 and January 3, 2016 was as follows (in thousands):
| |
January 1, 2017 |
January 3, 2016 |
|||||
|---|---|---|---|---|---|---|---|
Revolving Credit Facility |
$ | 64,000 | $ | 5,000 | |||
Less: |
|||||||
Debt issuance costs |
(1,648 | ) | (1,096 | ) | |||
| | | | | | | | |
Total current portion of debt |
$ | 62,352 | $ | 3,904 | |||
| | | | | | | | |
| | | | | | | | |
| | | | | | | | |
Long-term debt at January 1, 2017 and January 3, 2016 was as follows (in thousands):
| |
January 1, 2017 |
January 3, 2016 |
|||||
|---|---|---|---|---|---|---|---|
Term Loan Facility |
$ | 625,000 | $ | 594,907 | |||
Less: |
|||||||
Debt issuance costs |
(2,709 | ) | (3,112 | ) | |||
Discount on debt issuance |
(5,703 | ) | (4,839 | ) | |||
| | | | | | | | |
Total long-term debt |
$ | 616,588 | $ | 586,956 | |||
| | | | | | | | |
| | | | | | | | |
| | | | | | | | |
In conjunction with the Ares Acquisition, Smart & Final Stores LLC ("Smart & Final Stores") entered into three financing arrangements effective November 15, 2012, including two term loan agreements: the Term Loan Facility and a second lien term loan facility (the "Second Lien Term Loan Facility") and an asset-based lending facility (the "Revolving Credit Facility").
The Term Loan Facility originally had a term of seven years and originally provided financing of up to a maximum of $525.0 million in term loans. At November 15, 2012, the Term Loan Facility was drawn to provide $525.0 million in gross proceeds as a part of the funding for the Ares Acquisition.
All obligations under the Term Loan Facility are secured by (1) a first- priority security interest in substantially all of the property and assets of, as well as the equity interests owned by, Smart & Final Stores and SF CC Intermediate Holdings, Inc., a direct wholly owned subsidiary of SFSI ("Intermediate Holdings"), and the other guarantors, with certain exceptions, and (2) a second-priority security interest in the Revolving Credit Facility collateral.
Initially, borrowings under the Term Loan Facility bore interest at an applicable margin of 3.50% plus, at Smart & Final Stores' option, a fluctuating rate equal to the highest of (1) the federal funds rate plus 0.50%, (2) a rate of interest published by The Wall Street Journal as the "Prime Rate," and (3) a LIBOR loan rate based on LIBOR plus 1.00% (the "ABR Borrowings"). Eurocurrency Borrowings (as defined in the credit agreement governing the Term Loan Facility) bore interest at the adjusted LIBOR rate, which is the greater of (a) the LIBOR rate in effect for the applicable interest period divided by one, minus the Statutory Reserves (as defined in the credit agreement governing the Term Loan Facility) applicable to such Eurocurrency Borrowing, if any, and (b) 1.25% plus the applicable Eurocurrency (as defined in the credit agreement governing the Term Loan Facility) loan rate margin of 4.50%.
91
Smart & Final Stores, Inc. and Subsidiaries
Notes to Consolidated Financial Statements (Continued)
January 1, 2017
4. Debt (Continued)
The Term Loan Facility contains a provision for quarterly amortization of principal in the amount of 0.25% of the aggregate principal amount of the term loans outstanding under the Term Loan Facility beginning March 31, 2013. As a result of prior prepayments, quarterly amortization of the principal amount is no longer required. The Term Loan Facility may be prepaid, in whole or in part, at any time but Smart & Final Stores must pay a prepayment premium of 1.00% of the principal amount of the term loans so prepaid if the prepayment occurs as a result of a repricing transaction and is effective prior to March 21, 2017. Mandatory prepayments are required (i) in the amount of the net proceeds of a sale of assets, subject to the priority of the Revolving Credit Facility collateral, and (ii) in the amount of certain excess cash flows, adjusted by any voluntary prepayments. The Term Loan Facility has no financial covenant requirements. The Term Loan Facility contains covenants that would restrict our ability to pay cash dividends.
The Second Lien Term Loan Facility had a term of eight years and provided $195.0 million in gross proceeds at November 15, 2012. On December 19, 2013, the Company paid off the Second Lien Term Loan Facility.
On September 29, 2014, the Company used the net proceeds from the IPO to repay borrowings of approximately $115.5 million under the Term Loan Facility. Consequently, the Company recorded a loss on the early extinguishment of debt of $2.2 million related to the write-off of unamortized debt discount and deferred financing costs during the year ended December 28, 2014. Quarterly amortization of the principal amount is no longer required as a result of this prepayment.
During the year ended December 28, 2014, the Company made principal amortization payments of $5.4 million.
During the second quarter of 2015, the Company amended the Term Loan Facility to reduce (i) the ABR Borrowings applicable margin from 2.75% to 2.25%, (ii) the Eurocurrency Borrowings applicable margin from 3.75% to 3.25% and (iii) the Adjusted LIBOR floor rate from 1.00% to 0.75% (the "Third Amendment"). The November 15, 2019 maturity date remained unchanged. Consequently, during the second quarter of 2015, the Company recorded a loss on the early extinguishment of debt of $2.2 million related to fees and the write-off of unamortized debt discount and deferred financing costs. The Company incurred $1.1 million of fees in connection with the Third Amendment. Approximately $0.1 million of these fees were recorded as deferred financing costs and are being amortized over the remaining term of the Term Loan Facility.
During the third quarter of 2016, the Company amended the Term Loan Facility (the "Fourth Amendment") to increase the size of the Term Loan Facility by $30.1 million, from $594.9 million to $625.0 million, and to extend the original November 15, 2019 maturity date to November 15, 2022. Additionally, in connection with the Fourth Amendment, the Eurocurrency Borrowings applicable margin increased from 3.25% to 3.50%. Consequently, during the third quarter of 2016, the Company recorded a loss on the early extinguishment of debt of $5.0 million including $2.6 million of fees paid in connection with the amendment and the write-off of $2.4 million of unamortized debt discount and debt issuance costs. The Company incurred $7.2 million of fees in connection with the Fourth Amendment. Approximately $1.2 million of these fees were recorded as debt issuance costs and approximately $3.4 million of these fees were recorded as debt discount. They are both amortized over the remaining term of the Term Loan Facility. As of January 1, 2017 and January 3, 2016, the
92
Smart & Final Stores, Inc. and Subsidiaries
Notes to Consolidated Financial Statements (Continued)
January 1, 2017
4. Debt (Continued)
weighted-average interest rate on the amount outstanding under the Term Loan Facility was 4.41% and 4.00%, respectively.
The Revolving Credit Facility originally provided financing of up to $150.0 million (including up to $50.0 million for the issuance of letters of credit) subject to a borrowing base, for a term of five years. The borrowing base is a formula based on certain eligible inventory and receivables, minus certain reserves.
All obligations under the Revolving Credit Facility are secured by (1) a first-priority security interest in the accounts receivable, inventory, cash and cash equivalents, and related assets of Smart & Final Stores and Intermediate Holdings and the other guarantors under the facility, and (2) a second- priority security interest in substantially all of the other property and assets of, as well as the equity interests owned by, Smart & Final Stores and Intermediate Holdings and the other guarantors under the facility.
Borrowings under the Revolving Credit Facility bear interest at an applicable margin plus, at Smart & Final Stores' option, a fluctuating rate equal to either (1) adjusted LIBOR (defined as a rate equal to the LIBOR rate in effect for the applicable interest period, as adjusted for statutory reserves) or (2) the alternate base rate (defined as a fluctuating rate equal to the highest of (x) the federal funds effective rate plus 0.50%, (y) the interest rate announced by the administrative agent as its "Prime Rate" and (z) the adjusted LIBOR rate for an interest period of one month plus 1.00%). The applicable margin is determined by a pricing grid based on the facility availability.
During the third quarter of 2016, the Company amended the Revolving Credit Facility (the "Second Amendment") to increase the committed amount to $200.0 million. Additionally, the maturity date was extended from November 15, 2017 to the earlier of (a) July 19, 2021 and (b) to the extent the Term Loan Facility (and any refinancing of the Term Loan Facility) has not been paid in full, the date that is 60 days prior to the earliest scheduled maturity date of the Term Loan Facility (or such refinancing of the Term Loan Facility). In addition, the applicable margin ranges were reduced with respect to (i) alternate base rate loans to 0.25% to 0.50% from 0.25% to 0.75% and (ii) LIBOR rate loans to 1.25% to 1.50% from 1.25% to 1.75%. The Company incurred $1.0 million of fees in connection with the Second Amendment. All of these fees were recorded as debt issuance costs and amortized over the remaining term of the Revolving Credit Facility.
At January 1, 2017 and January 3, 2016, the alternate base rate was 3.75% and 3.50%, respectively and the applicable margin for alternate base rate loans was 0.25%, for a total rate of 4.00% and 3.75%, respectively. The calculated borrowing base of the Revolving Credit Facility was $196.9 million and $175.1 million at January 1, 2017 and January 3, 2016, respectively. As of January 1, 2017 and January 3, 2016, the amount outstanding under the Revolving Credit Facility was $64.0 million and $5.0 million, respectively.
The Revolving Credit Facility also provides for a $65.0 million sub-limit for letters of credit, of which the Company had $29.9 million and $25.1 million outstanding as of January 1, 2017 and January 3, 2016, respectively. As of January 1, 2017 and January 3, 2016, the amount available for borrowing under the Revolving Credit Facility was $103.0 million and $119.9 million, respectively. The Revolving Credit Facility does not include financial covenant requirements unless a defined covenant
93
Smart & Final Stores, Inc. and Subsidiaries
Notes to Consolidated Financial Statements (Continued)
January 1, 2017
4. Debt (Continued)
trigger event has occurred and is continuing. As of January 1, 2017 and January 3, 2016, no trigger event had occurred.
Aggregate future principal payments of the Company's debt are as follows (in thousands):
Fiscal Year: |
||||
2017 |
$ | 64,000 | ||
2018 |
— | |||
2019 |
— | |||
2020 |
— | |||
2021 |
— | |||
Thereafter |
625,000 | |||
| | | | | |
Total |
$ | 689,000 | ||
| | | | | |
| | | | | |
| | | | | |
5. Derivative Financial Instruments
On April 15, 2013, the Company entered into a five-year interest rate swap agreement (the "Swap") to fix the LIBOR component of interest under the Term Loan Facility at 1.7325% on a variable notional amount starting at $422.7 million and declining to $359.7 million for the period from September 30, 2014 through March 29, 2018. The Swap has been designated as a cash flow hedge against LIBOR interest rate movements and formally assessed, both at inception and at least quarterly thereafter, as to whether it was effective in offsetting changes in cash flows of the hedged item. The portion of the change in fair value attributable to hedge ineffectiveness was recorded in "Interest expense, net" in the consolidated statements of operations and comprehensive income (loss). The portion of the change in fair value attributable to hedge effectiveness, net of income tax effects, was recorded to "Accumulated other comprehensive income (loss)" in the consolidated statements of stockholders' equity.
On May 30, 2013, the Company entered into an amendment to the Swap to change the fixed LIBOR component to 1.5995% and the floor rate to 1.00%.
On May 12, 2015, the Company entered into a second amendment to the Swap to change the fixed LIBOR component to 1.47675% and the floor rate to 0.75% on a variable notional amount starting at $410.9 million for the period from June 30, 2015 through March 29, 2018.
As of January 1, 2017 and January 3, 2016, the fair value carrying amount of the Company's interest rate swaps are recorded as follows (in thousands):
| |
January 1, 2017 |
January 3, 2016 |
|||||
|---|---|---|---|---|---|---|---|
Other assets |
$ | 83 | $ | 542 | |||
Accrued expenses |
(1,144 | ) | (2,177 | ) | |||
| | | | | | | | |
Total derivatives designated as hedging instruments |
$ | (1,061 | ) | $ | (1,635 | ) | |
| | | | | | | | |
| | | | | | | | |
| | | | | | | | |
94
Smart & Final Stores, Inc. and Subsidiaries
Notes to Consolidated Financial Statements (Continued)
January 1, 2017
5. Derivative Financial Instruments (Continued)
The following tables summarize the loss recognized in accumulated other comprehensive income ("AOCI") and the amount of gain reclassified from AOCI into earnings for the year ended January 1, 2017 (in thousands):
| |
Amount of Loss Recognized in AOCI on Derivative, Net of Tax (Effective Portion) |
Amount of Loss Recognized in Earnings on Derivative, Net of Tax (Ineffective Portion) |
|||||
|---|---|---|---|---|---|---|---|
Interest rate swaps |
$ | 360 | $ | 15 | |||
6. Fair Value Measurements
The Company applies the provisions of ASC 820, Fair Value Measurements and Disclosures ("ASC 820"), for its financial and nonfinancial assets and liabilities. ASC 820 defines fair value as the price that would be received to sell an asset or paid to transfer a liability in an orderly transaction between market participants at the measurement date. ASC 820 establishes a fair value hierarchy, which prioritizes the inputs used in measuring fair value into three broad levels as follows:
Level 1—Quoted prices for identical instruments in active markets
Level 2—Quoted prices for similar instruments in active markets; quoted prices for identical or similar instruments in markets that are not active; and model-derived valuations in which all significant inputs and significant value drivers are observable in active markets
Level 3—Valuations derived from valuation techniques in which one or more significant inputs or significant value drivers are unobservable
95
Smart & Final Stores, Inc. and Subsidiaries
Notes to Consolidated Financial Statements (Continued)
January 1, 2017
6. Fair Value Measurements (Continued)
The Company's assets and liabilities measured at fair value on a recurring basis are summarized in the following table by the type of inputs applicable to the fair value measurements (in thousands):
| |
Fair Value Measurement at January 1, 2017 | ||||||||||||
|---|---|---|---|---|---|---|---|---|---|---|---|---|---|
Description
|
Total as of January 1, 2017 |
Quoted Prices in Active Markets for Identical Assets (Level 1) |
Significant Other Observable Inputs (Level 2) |
Significant Unobservable Inputs (Level 3) |
|||||||||
Financial assets |
|||||||||||||
Other assets—cash and cash equivalents that fund supplemental executive retirement plan and deferred compensation plan |
$ | 3,192 | $ | 3,192 | $ | — | $ | — | |||||
Other assets—assets that fund supplemental executive retirement plan |
3,303 | 3,303 | — | — | |||||||||
Other assets—deferred compensation plan investment in Sprouts |
2,413 | 2,413 | — | — | |||||||||
Financial liabilities |
|||||||||||||
Derivatives |
(1,061 | ) | — | (1,061 | ) | — | |||||||
Other long-term liabilities—deferred compensation plan |
(17,723 | ) | (1,915 | ) | (15,808 | ) | — | ||||||
| | | | | | | | | | | | | | |
Total |
$ | (9,876 | ) | $ | 6,993 | $ | (16,869 | ) | $ | — | |||
| | | | | | | | | | | | | | |
| | | | | | | | | | | | | | |
| | | | | | | | | | | | | | |
Level 1 Investments include money market funds of $3.2 million, market index funds of $3.3 million and an investment in Sprouts of $2.4 million with the corresponding deferred compensation liabilities of $1.9 million. The fair values of these investments are based on quoted market prices in an active market.
Level 2 Liabilities include $15.8 million of deferred compensation liabilities, the fair value of which is based on quoted prices of similar assets traded in active markets, and $1.1 million of derivatives, which are interest rate hedges. The fair values of the derivatives are determined based primarily on a
96
Smart & Final Stores, Inc. and Subsidiaries
Notes to Consolidated Financial Statements (Continued)
January 1, 2017
6. Fair Value Measurements (Continued)
third-party pricing model that applies observable credit spreads to each exposure to calculate a credit risk adjustment and the inputs are changed only when corroborated by observable market data.
| |
Fair Value Measurement at January 3, 2016 | ||||||||||||
|---|---|---|---|---|---|---|---|---|---|---|---|---|---|
Description
|
Total as of January 3, 2016 |
Quoted Prices in Active Markets for Identical Assets (Level 1) |
Significant Other Observable Inputs (Level 2) |
Significant Unobservable Inputs (Level 3) |
|||||||||
Financial assets |
|||||||||||||
Other assets—cash and cash equivalents that fund supplemental executive retirement plan and deferred compensation plan |
$ | 2,027 | $ | 2,027 | $ | — | $ | — | |||||
Other assets—assets that fund supplemental executive retirement plan |
2,643 | 2,643 | — | — | |||||||||
Other assets—deferred compensation plan investment in Sprouts |
4,787 | 4,787 | — | — | |||||||||
Financial liabilities |
|||||||||||||
Derivatives |
(1,635 | ) | — | (1,635 | ) | — | |||||||
Other long-term liabilities—deferred compensation plan |
(21,401 | ) | (4,787 | ) | (16,614 | ) | — | ||||||
| | | | | | | | | | | | | | |
Total |
$ | (13,579 | ) | $ | 4,670 | $ | (18,249 | ) | $ | — | |||
| | | | | | | | | | | | | | |
| | | | | | | | | | | | | | |
| | | | | | | | | | | | | | |
Level 1 Investments include money market funds of $2.0 million, market index funds of $2.6 million and an investment in Sprouts of $4.8 million with the corresponding deferred compensation liabilities of $4.8 million. The fair values of these investments are based on quoted market prices in an active market.
Level 2 Liabilities include $16.6 million of deferred compensation liabilities, the fair value of which is based on quoted prices of similar assets traded in active markets, and $1.6 million of derivatives, which are interest rate hedges. The fair values of the derivatives are determined based primarily on third-party pricing model that applies observable credit spreads to each exposure to calculate a credit risk adjustment and the inputs are changed only when corroborated by observable market data.
Certain assets are measured at fair value on a nonrecurring basis, which means the assets are not measured at fair value on an ongoing basis but, rather, are subject to fair value adjustments only in certain circumstances (for example, when there is evidence of impairment). See Note 2, Summary of Significant Accounting Policies—Property, Plant and Equipment, Capitalized Software and Goodwill and Intangible Assets. The fair value measurements were determined using available market capitalization rates and public comparable store sales data at the measurement dates. The Company classifies the measurements as Level 3.
97
Smart & Final Stores, Inc. and Subsidiaries
Notes to Consolidated Financial Statements (Continued)
January 1, 2017
7. Lease Obligations
The principal real and personal properties leased by the Company include store, office and warehouse buildings and delivery and computer equipment. As of January 1, 2017, 293 of the Company's operating stores are leased directly from third-party lessors and eight stores were on real property that is ground leased from third-party lessors. These leases had an average remaining lease term of approximately 8.91 years as of January 1, 2017. These leases generally contain renewal options, at the Company's election, and require the Company to pay costs such as real estate taxes and common area maintenance. Certain leases include rent escalation clauses or provide for rental payments in excess of the minimum based upon the store's sales levels.
Lease expense for operating leases reported within "Cost of sales, buying and occupancy" on the Company's consolidated statements of operations and comprehensive income (loss) was $123.1 million, $98.3 million, and $85.5 million for the years ended January 1, 2017, January 3, 2016 and December 28, 2014, respectively. All lease expenses were paid to third-party lessors.
Aggregate minimum future lease payments for real property, including sale leaseback store properties, as well as equipment and other property at January 1, 2017, are as follows (in thousands):
| |
Operating Leases |
|||
|---|---|---|---|---|
Fiscal Year: |
||||
2017 |
$ | 129,841 | ||
2018 |
126,614 | |||
2019 |
119,504 | |||
2020 |
115,039 | |||
2021 |
105,505 | |||
Thereafter |
840,003 | |||
| | | | | |
Future minimum lease payments |
$ | 1,436,506 | ||
| | | | | |
| | | | | |
| | | | | |
The Company has subtenant agreements under which it will receive rent as follows (in thousands):
2017 |
$ | 2,141 | ||
2018 |
1,484 | |||
2019 |
1,225 | |||
2020 |
841 | |||
2021 |
718 | |||
Thereafter |
1,600 | |||
| | | | | |
Future minimum subtenant rent |
$ | 8,009 | ||
| | | | | |
| | | | | |
| | | | | |
During the fourth quarter of 2011, the Predecessor sold 39 store properties and one warehouse distribution facility to three different buyers. Concurrent with the sales, the Predecessor entered into 20-year operating leases with two options to extend the term for a period of 10 years each for three store properties sold, 20-year operating leases with six options to extend the term for a period of five years each for 36 store properties sold, and a 10-year operating lease with four options to extend the term for a period of five years each for one warehouse distribution facility sold. The transactions were
98
Smart & Final Stores, Inc. and Subsidiaries
Notes to Consolidated Financial Statements (Continued)
January 1, 2017
7. Lease Obligations (Continued)
accounted for as sale and leaseback. During the second quarter of 2012, three additional store properties were sold. Concurrent with the sales, the Predecessor entered into 25-year operating leases with five options to extend the term for a period of five years. The transactions were also accounted for as sale and leaseback. These leases require the Company to pay costs such as real estate taxes and repair and maintenance. Certain leases include rent escalation clauses. During 2015, two store properties were sold to two different buyers. Concurrent with the sales, the Company entered into 20-year operating leases with two options to extend the term for a period of five years, and one final extension of 59 months.
The future minimum lease payments under the terms of the related lease agreements at January 1, 2017, are as follows (in thousands):
| |
Operating Leases |
|||
|---|---|---|---|---|
Fiscal Year: |
||||
2017 |
$ | 17,814 | ||
2018 |
17,850 | |||
2019 |
17,985 | |||
2020 |
18,088 | |||
2021 |
18,135 | |||
Thereafter |
166,571 | |||
| | | | | |
Future minimum lease payments |
$ | 256,443 | ||
| | | | | |
| | | | | |
| | | | | |
8. Retirement Benefit Plans and Postretirement and Postemployment Benefit Obligations
Defined Benefit Retirement Plan
The Company has a funded noncontributory qualified defined benefit retirement plan (the "Single-Employer Plan") that, prior to June 1, 2008, covered substantially all full-time employees following a vesting period of five years of service (the "Pension Participants") and provided defined benefits based on years of service and final average salary. The Predecessor froze the accruing of future benefits for the Pension Participants (the "Frozen Pension Participants") effective June 1, 2008, with the exception of approximately 450 hourly paid employees in the Company's distribution and transportation operations who remain eligible for pension benefits under the prior terms (the "Active Pension Participants"). No new employees are eligible for participation in the Single Employer Plan after June 1, 2008, with the exception of new hires in the Company's eligible distribution and transportation operations. Frozen Pension Participants will continue to accrue service for vesting purposes only and future payments from the Single-Employer Plan will be in accordance with the Single-Employer Plan's retirement payment provisions. The Company funds the Single-Employer Plan with annual contributions as required by the Employee Retirement Income Security Act of 1974, as amended ("ERISA"). The Company uses a measurement date of December 31 for the Single-Employer Plan. In 2016, the Society of Actuaries released updated mortality scales. In consideration of these scales, the Company modified the mortality assumptions used in determining its defined benefit retirement plan obligation as of January 1, 2017. The impact of these new mortality assumptions has resulted in a
99
Smart & Final Stores, Inc. and Subsidiaries
Notes to Consolidated Financial Statements (Continued)
January 1, 2017
8. Retirement Benefit Plans and Postretirement and Postemployment Benefit Obligations (Continued)
decrease to the Company's defined benefit retirement plan obligation and a decrease in future related expense.
As of January 1, 2017, the funded status of the accumulated benefit obligation was 66.9%. The Company expects to fund a minimum required contribution of $11.7 million during fiscal year 2017.
The following tables set forth the changes in benefit obligation and plan assets of this plan for the periods below (in thousands):
| |
Fiscal Year 2016 |
Fiscal Year 2015 |
|||||
|---|---|---|---|---|---|---|---|
Change in Benefit Obligation |
|||||||
Benefit obligation, beginning of period |
$ | (205,393 | ) | $ | (214,216 | ) | |
Service cost |
(1,483 | ) | (1,507 | ) | |||
Interest cost |
(9,470 | ) | (9,115 | ) | |||
Actuarial (loss) gain |
(10,254 | ) | 15,216 | ||||
Benefits paid |
4,742 | 4,229 | |||||
| | | | | | | | |
Benefit obligation, end of period |
$ | (221,858 | ) | $ | (205,393 | ) | |
| | | | | | | | |
| | | | | | | | |
| | | | | | | | |
| |
Fiscal Year 2016 |
Fiscal Year 2015 |
|||||
|---|---|---|---|---|---|---|---|
Change in Plan Assets |
|||||||
Fair value of plan assets, beginning of period |
$ | 132,793 | $ | 133,883 | |||
Actual return of plan assets, net of expenses |
7,632 | (5,041 | ) | ||||
Employer contribution |
8,810 | 8,180 | |||||
Benefits paid |
(4,742 | ) | (4,229 | ) | |||
| | | | | | | | |
Fair value of plan assets, end of period |
144,493 | 132,793 | |||||
| | | | | | | | |
Funded status |
(77,365 | ) | (72,600 | ) | |||
| | | | | | | | |
Net amount recognized |
$ | (77,365 | ) | $ | (72,600 | ) | |
| | | | | | | | |
| | | | | | | | |
| | | | | | | | |
Amounts before income tax effect recognized in the consolidated balance sheets consist of the following (in thousands):
| |
January 1, 2017 |
January 3, 2016 |
|||||
|---|---|---|---|---|---|---|---|
Postretirement and postemployment benefits |
$ | (77,365 | ) | $ | (72,600 | ) | |
| | | | | | | | |
Net amount recognized |
$ | (77,365 | ) | $ | (72,600 | ) | |
| | | | | | | | |
| | | | | | | | |
| | | | | | | | |
100
Smart & Final Stores, Inc. and Subsidiaries
Notes to Consolidated Financial Statements (Continued)
January 1, 2017
8. Retirement Benefit Plans and Postretirement and Postemployment Benefit Obligations (Continued)
Amounts before income tax effect recognized in accumulated other comprehensive loss consist of the following (in thousands):
| |
January 1, 2017 |
January 3, 2016 |
|||||
|---|---|---|---|---|---|---|---|
Net actuarial loss |
$ | (17,269 | ) | $ | (5,253 | ) | |
| | | | | | | | |
Accumulated other comprehensive loss |
$ | (17,269 | ) | $ | (5,253 | ) | |
| | | | | | | | |
| | | | | | | | |
| | | | | | | | |
During 2017, no accumulated other comprehensive loss is expected to be recognized as a component of net periodic benefit cost.
The following table shows the projected benefit obligation, the accumulated benefit obligation and the plan assets, in dollar amounts and as a percentage of the projected benefit obligation and the accumulated benefit obligation, respectively, as of each fiscal year-end (dollar amounts in thousands):
| |
January 1, 2017 |
January 3, 2016 |
|||||
|---|---|---|---|---|---|---|---|
Projected benefit obligation |
$ | 221,858 | $ | 205,393 | |||
Accumulated benefit obligation |
215,953 | 201,466 | |||||
Fair value of plan assets |
144,493 | 132,793 | |||||
Fair value of plan assets as a percentage of the projected benefit obligation |
65.1 | % | 64.7 | % | |||
Fair value of plan assets as a percentage of the accumulated benefit obligation |
66.9 | % | 65.9 | % | |||
The components included in the net periodic benefit cost and the increase in minimum liability included in other comprehensive (loss) income for the periods indicated are as follows (in thousands):
| |
Fiscal Year 2016 |
Fiscal Year 2015 |
Fiscal Year 2014 |
|||||||
|---|---|---|---|---|---|---|---|---|---|---|
Service cost component |
$ | 1,483 | $ | 1,507 | $ | 1,099 | ||||
Interest cost component |
9,470 | 9,115 | 8,480 | |||||||
Expected return on plan assets |
(9,394 | ) | (9,775 | ) | (9,105 | ) | ||||
Amortization of net actuarial gain |
— | — | (699 | ) | ||||||
| | | | | | | | | | | |
Net periodic benefit cost |
$ | 1,559 | $ | 847 | $ | (225 | ) | |||
| | | | | | | | | | | |
| | | | | | | | | | | |
| | | | | | | | | | | |
As a result of the Predecessor freezing plan benefits for substantially all of the Pension Participants effective June 1, 2008, the amortization of the unrecognized net actuarial loss (in excess of 10% of the greater of the projected benefit obligation or the fair value of plan assets) has been amortized on a straight-line basis over the expected average future lifetime of inactive participants expected to benefit under the plan.
101
Smart & Final Stores, Inc. and Subsidiaries
Notes to Consolidated Financial Statements (Continued)
January 1, 2017
8. Retirement Benefit Plans and Postretirement and Postemployment Benefit Obligations (Continued)
The weighted-average assumptions used to determine benefit obligations for this plan at fiscal year-end were as follows:
| |
January 1, 2017 |
January 3, 2016 |
|||||
|---|---|---|---|---|---|---|---|
Discount rate |
4.30 | % | 4.60 | % | |||
Rate of compensation increase |
3.00 | 2.50 | |||||
The Company determines the discount rate assumption based on the internal rate of return for a portfolio of high quality bonds, with a minimum rating of Moody's AA Corporate and with maturities that are consistent with the projected future cash flow obligations.
The weighted-average assumptions used to determine net periodic benefit cost for each of the periods indicated were as follows:
| |
Fiscal Year 2016 |
Fiscal Year 2015 |
Fiscal Year 2014 |
|||||||
|---|---|---|---|---|---|---|---|---|---|---|
Discount rate |
4.60 | % | 4.25 | % | 5.15 | % | ||||
Expected long-term return on plan assets |
7.00 | 7.25 | 7.25 | |||||||
Rate of compensation increase |
2.50 | 2.50 | 2.50 | |||||||
The Company determines the expected long-term rate of return on plan assets based upon recommendations from its pension plan's investment advisors and using an allocation approach that considers diversification and rebalancing for a portfolio of assets invested over a long-term time horizon. The approach relies on the historical returns of the plan's portfolio and relationships between equities and fixed income investments, consistent with the widely accepted capital market principle that a diversified portfolio with a larger allocation to equity investments can generate a greater return over the long run. Additionally, the Company monitors the mix of investments in its portfolio to ensure alignment with its expected long-term pension obligations. The Company reviews the expected long-term rate of return annually, and revise it as appropriate.
Plan assets are managed by outside investment managers and rebalanced among managers periodically at the Company's direction to realign assets to the target allocation. The managers allocate assets to individual investments within guidelines specified by the Company. The Company's strategy with respect to the plan asset investments has been to allocate a larger proportion to equities to achieve returns that sufficiently grow assets to cover the benefit obligations within acceptable risk parameters.
102
Smart & Final Stores, Inc. and Subsidiaries
Notes to Consolidated Financial Statements (Continued)
January 1, 2017
8. Retirement Benefit Plans and Postretirement and Postemployment Benefit Obligations (Continued)
The plan asset allocation at the end of 2016 and 2015, and target allocation for 2017, in percentages, by asset category are as follows:
| |
Target Allocation 2017 |
January 1, 2017 |
January 3, 2016 |
|||||||
|---|---|---|---|---|---|---|---|---|---|---|
Equity securities |
60 | % | 60 | % | 62 | % | ||||
Debt securities |
37 | 34 | 34 | |||||||
Cash and cash equivalents |
3 | 6 | 4 | |||||||
| | | | | | | | | | | |
Total |
100 | % | 100 | % | 100 | % | ||||
| | | | | | | | | | | |
| | | | | | | | | | | |
| | | | | | | | | | | |
The following table summarizes plan assets measured at fair value on January 1, 2017 and January 3, 2016 respectively (in thousands):
January 1, 2017
|
Total | Quoted Prices in Active Markets for Identical Assets (Level 1) |
Significant Observable Inputs (Level 2) |
Significant Unobservable Inputs (Level 3) |
|||||||||
|---|---|---|---|---|---|---|---|---|---|---|---|---|---|
Asset category |
|||||||||||||
Equity securities(1) |
$ | 87,198 | $ | 62,655 | $ | 24,543 | $ | — | |||||
Debt securities(2) |
48,927 | 29,159 | 19,319 | 449 | |||||||||
Cash and cash equivalents(3) |
8,368 | 8,368 | — | — | |||||||||
| | | | | | | | | | | | | | |
Total |
$ | 144,493 | $ | 100,182 | $ | 43,862 | $ | 449 | |||||
| | | | | | | | | | | | | | |
| | | | | | | | | | | | | | |
| | | | | | | | | | | | | | |
January 3, 2016
|
Total | Quoted Prices in Active Markets for Identical Assets (Level 1) |
Significant Observable Inputs (Level 2) |
Significant Unobservable Inputs (Level 3) |
|||||||||
|---|---|---|---|---|---|---|---|---|---|---|---|---|---|
Asset category |
|||||||||||||
Equity securities(1) |
$ | 82,286 | $ | 62,541 | $ | 19,745 | $ | — | |||||
Debt securities(2) |
45,527 | 26,501 | 18,554 | 472 | |||||||||
Cash and cash equivalents(3) |
4,980 | 4,980 | — | — | |||||||||
| | | | | | | | | | | | | | |
Total |
$ | 132,793 | $ | 94,022 | $ | 38,299 | $ | 472 | |||||
| | | | | | | | | | | | | | |
| | | | | | | | | | | | | | |
| | | | | | | | | | | | | | |
- (1)
- Equity securities include U.S. and foreign exchange traded common and preferred stocks and mutual funds. Common and preferred shares issued by U.S. and non-U.S. corporations are traded actively on exchanges and price quotes for these shares are readily available. Holdings of corporate stock are categorized as Level 1 investments. The securities categorized as Level 2 investments are American Depository Receipts. While these securities are traded in an active market, the trustee uses several observable market based inputs, such as exchange rates, to obtain the pricing of the securities.
103
Smart & Final Stores, Inc. and Subsidiaries
Notes to Consolidated Financial Statements (Continued)
January 1, 2017
8. Retirement Benefit Plans and Postretirement and Postemployment Benefit Obligations (Continued)
- (2)
- Debt
securities include the debt of the U.S. Treasury and U.S. and foreign corporate issuers. U.S. Treasury notes and bonds are actively traded and price quotes for
these securities are readily available. Holdings of U.S. Treasury notes and bonds are categorized as Level 1 investments. Corporate bond securities of U.S. and foreign corporate issuers are
valued by independent pricing sources using a variety of market sources and observed market movements. Holdings of U.S. and foreign corporate issuers' debt securities are categorized as Level 2
investments. Infrequently traded corporate bonds and asset-backed securities, requiring valuation using observable as well as unobservable inputs, such as the estimation of the market manager for the
security, are categorized as Level 3 investments.
- (3)
- Cash and cash equivalents include short-term U.S. government investment notes, short-term money market mutual funds, accrued income and cash held on account. Cash held on account and short- term U.S. government investment notes (including accrued income thereon) for which there is an active market and daily pricing for the security are categorized as Level 1 investments.
| |
Fair Value Measurements Using Significant Unobservable Inputs (Level 3) |
|||
|---|---|---|---|---|
Ending balance at January 3, 2016 |
$ | 472 | ||
Actual return on plan assets: |
||||
Assets held at end of year |
(5 | ) | ||
Assets sold during the year |
— | |||
Purchases, sales and settlements |
(18 | ) | ||
Transfers in and/or out of Level 3 |
— | |||
| | | | | |
Ending balance at January 1, 2017 |
$ | 449 | ||
| | | | | |
| | | | | |
| | | | | |
| |
Fair Value Measurements Using Significant Unobservable Inputs (Level 3) |
|||
|---|---|---|---|---|
Ending balance at December 28, 2014 |
$ | 445 | ||
Actual return on plan assets: |
||||
Assets held at end of year |
40 | |||
Assets sold during the year |
— | |||
Purchases, sales and settlements |
(13 | ) | ||
Transfers in and/or out of Level 3 |
— | |||
| | | | | |
Ending balance at January 3, 2016 |
$ | 472 | ||
| | | | | |
| | | | | |
| | | | | |
The Company seeks to maximize medium- to long-term returns of overall pension plan assets with reasonable levels of investment risk. One element of controlling overall investment risk is through
104
Smart & Final Stores, Inc. and Subsidiaries
Notes to Consolidated Financial Statements (Continued)
January 1, 2017
8. Retirement Benefit Plans and Postretirement and Postemployment Benefit Obligations (Continued)
diversification of asset allocation, among domestic and international equity and debt instruments. The plan's equity investments include foreign and domestic exchange traded equities across a range of industries and countries, but primarily in the domestic markets. The plan's debt securities are primarily invested in government and corporate issuers primarily in the domestic market.
The following benefit payments, which reflect expected future service, as appropriate, are expected to be paid (in thousands):
2017 |
$ | 6,169 | ||
2018 |
6,669 | |||
2019 |
7,232 | |||
2020 |
7,548 | |||
2021 |
8,162 | |||
2022 - 2026 |
48,864 |
Multi-employer Pension Plan
The Company participates in and contributes to a multi-employer pension plan on behalf of union employees in its Cash & Carry operations. At January 1, 2017 and January 3, 2016, there were 214 and 206 union employees covered under this plan, respectively. The Company's employer contributions and corresponding pension expense for this plan were $1.4 million, $1.4 million and $1.3 million for the years ended January 1, 2017, January 3, 2016 and December 28, 2014, respectively.
The multi-employer plan is the Western Conference of Teamsters Pension Plan (the "Teamsters Plan"), which was established pursuant to the Western Conference of Teamsters Pension Agreement and Declaration of Trust dated April 26, 1955 ("Trust Agreement"). The Teamsters Plan (EIN 91-6145047; Plan Number 001) provides and maintains retirement, death and termination benefits for employees in collective bargaining units represented by local unions affiliated with the Western Conference of Teamsters. The Teamsters Plan is subject to the provisions of ERISA, as amended.
The Trust Agreement provides that the trustees of the Teamsters Plan shall establish and adjust the levels of prospective plan benefits so that employer contributions received by the Teamsters Plan will always meet the minimum funding standards of Section 302 of ERISA and Section 412 of the Internal Revenue Code of 1986. The trustees have established a funding policy that specifies funding targets that may result in more rapid funding than prescribed by the minimum funding standards and that provides for benefit adjustments based on specified funding targets. The Teamsters Plan's actuary has advised the Company that the minimum funding requirements of ERISA are being met as of January 1, 2016 (based on the most recent information available).
As of January 1, 2016, the Teamsters Plan actuarial present value of accumulated plan benefits was $41,074.2 million and the actuarial value of assets for funding the standard account was $37,692.7 million, resulting in a funded percentage of 91.7%. The Teamsters Plan covered approximately 563,000 participants as of December 31, 2015. Approximately 1,500 employers participate in the Teamsters Plan and total employer contributions for the plan year ended December 31, 2015, aggregated $1,596.4 million.
105
Smart & Final Stores, Inc. and Subsidiaries
Notes to Consolidated Financial Statements (Continued)
January 1, 2017
8. Retirement Benefit Plans and Postretirement and Postemployment Benefit Obligations (Continued)
Defined Contribution Plan
The Company offers all qualified employees the opportunity to participate in a defined contribution plan, which is qualified under the requirements of Section 401(k) of the Internal Revenue Code of 1986, as amended. The Smart & Final 401(k) Savings Plan (the "S&F Savings Plan") covers all of the Company's employees who have completed at least three months of service. The Company automatically enrolls newly eligible employees into the S&F Savings Plan at 5% of their eligible compensation unless they choose to opt out of such enrollment. The S&F Savings Plan allowed participants to contribute up to 100% of their eligible compensation, not exceeding $18,000 for participants under the age of 50 or $24,000 for employees at the age of 50 or over for 2016 and 2015, respectively. For Frozen Pension Participants, the Company matched 50% of each dollar contributed up to 6% of the participant's eligible compensation during 2016 and 2015. For Active Pension Participants, the Company matched 33% of each dollar contributed up to 6% of the participant's eligible compensation during 2016 and 2015. Contributions made to the S&F Savings Plan were $6.4 million, $5.4 million and $4.4 million for the years ended January 1, 2017, January 3, 2016 and December 28, 2014, respectively.
Deferred Compensation Plan
The Company maintains a contributory, nonqualified deferred compensation plan which, for each year, permits key employees and members of our board of directors to elect to defer up to 100% of their compensation for such year until retirement. The retirement benefit to be provided under the plan is a function of the participant's deferred compensation and earnings thereupon. The plan is designed to primarily fund the retirement benefit liability through maintenance of certain investments, including participant cash deferrals. The liability to the deferred compensation plan participants was $17.8 million and $21.5 million at January 1, 2017 and January 3, 2016, respectively, and is included in "Other long-term liabilities" in the consolidated balance sheets. The Company has certain investments, including corporate-owned life insurance policies, which had a market value that offset the participant liabilities at each of these measurement dates.
Supplemental Executive Retirement Plan
The Company maintains a noncontributory, nonqualified defined benefit supplemental executive retirement plan (the "SERP"), which provides supplemental income payments for certain current and former corporate officers in retirement. No new participants are eligible for participation and service and compensation accruals were frozen effective June 1, 2008. Accordingly, the retirement benefit for SERP participants who remained employed by the Company was frozen, and future service or compensation increases will not adjust the SERP benefit amount. In 2016, the Society of Actuaries released revised mortality scales. In consideration of these scales, the Company modified the mortality assumptions used in determining its SERP obligation as of January 1, 2017. The impact of these new mortality assumptions has resulted in a decrease to the Company's SERP obligation and a decrease in future related expense.
The liability to SERP participants was $31.7 million and $32.3 million at January 1, 2017 and January 3, 2016, respectively, and is included in "Post-retirement and post-employment benefits" in the Company's consolidated balance sheets. The Company uses a measurement date of December 31 for
106
Smart & Final Stores, Inc. and Subsidiaries
Notes to Consolidated Financial Statements (Continued)
January 1, 2017
8. Retirement Benefit Plans and Postretirement and Postemployment Benefit Obligations (Continued)
the SERP. To provide partial funding for the SERP, the Company invests in corporate-owned life insurance policies. The cash surrender value of these policies was $19.6 million and $19.2 million at January 1, 2017 and January 3, 2016, respectively, and is included in "Other assets" in the Company's consolidated balance sheets.
The following tables set forth the changes in benefit obligation and plan assets for each of the periods indicated (in thousands):
| |
Fiscal Year 2016 |
Fiscal Year 2015 |
|||||
|---|---|---|---|---|---|---|---|
Benefit obligation, beginning of period |
$ | (32,331 | ) | $ | (33,145 | ) | |
Interest cost |
(1,158 | ) | (1,101 | ) | |||
Actuarial loss |
(240 | ) | (153 | ) | |||
Benefits paid |
2,008 | 2,068 | |||||
| | | | | | | | |
Benefit obligation, end of period |
(31,721 | ) | (32,331 | ) | |||
| | | | | | | | |
Employer contribution |
2,008 | 2,068 | |||||
Benefits paid |
(2,008 | ) | (2,068 | ) | |||
| | | | | | | | |
Fair value of plan assets, end of period |
— | — | |||||
| | | | | | | | |
Funded status |
(31,721 | ) | (32,331 | ) | |||
Unrecognized net actuarial loss |
1,468 | 1,228 | |||||
| | | | | | | | |
Accrued benefit cost |
$ | (30,253 | ) | $ | (31,103 | ) | |
| | | | | | | | |
| | | | | | | | |
| | | | | | | | |
Amounts before income tax effect recognized in the consolidated balance sheets consist of the following (in thousands):
| |
January 1, 2017 |
January 3, 2016 |
|||||
|---|---|---|---|---|---|---|---|
Other accrued liabilities |
$ | (2,037 | ) | $ | (1,906 | ) | |
Postretirement and postemployment benefits |
(29,684 | ) | (30,425 | ) | |||
| | | | | | | | |
Net amount recognized |
$ | (31,721 | ) | $ | (32,331 | ) | |
| | | | | | | | |
| | | | | | | | |
| | | | | | | | |
Amounts before income tax effect recognized in accumulated other comprehensive income (loss) consist of the following (in thousands):
| |
January 1, 2017 |
January 3, 2016 |
|||||
|---|---|---|---|---|---|---|---|
Net actuarial loss |
$ | (1,468 | ) | $ | (1,228 | ) | |
| | | | | | | | |
Accumulated other comprehensive loss |
$ | (1,468 | ) | $ | (1,228 | ) | |
| | | | | | | | |
| | | | | | | | |
| | | | | | | | |
107
Smart & Final Stores, Inc. and Subsidiaries
Notes to Consolidated Financial Statements (Continued)
January 1, 2017
8. Retirement Benefit Plans and Postretirement and Postemployment Benefit Obligations (Continued)
During 2017, no accumulated other comprehensive loss is expected to be recognized as a component of net periodic benefit cost.
The projected benefit obligation for this plan was $31.7 million and $32.3 million at January 1, 2017 and January 3, 2016, respectively.
The components included in the net periodic benefit cost for each of the periods indicated are as follows (in thousands):
| |
Fiscal Year 2016 |
Fiscal Year 2015 |
Fiscal Year 2014 |
|||||||
|---|---|---|---|---|---|---|---|---|---|---|
Interest cost component |
$ | 1,158 | $ | 1,101 | $ | 1,200 | ||||
| | | | | | | | | | | |
Net periodic benefit cost |
$ | 1,158 | $ | 1,101 | $ | 1,200 | ||||
| | | | | | | | | | | |
| | | | | | | | | | | |
| | | | | | | | | | | |
The weighted-average assumptions used to determine benefit obligations at the fiscal year ends indicated are as follows:
| |
January 1, 2017 |
January 3, 2016 |
|||||
|---|---|---|---|---|---|---|---|
Discount rate |
3.55 | % | 3.69 | % | |||
Rate of compensation increase |
N/A | N/A | |||||
The weighted-average assumptions used to determine net periodic benefit cost for each of the periods indicated are as follows:
| |
Fiscal Year 2016 |
Fiscal Year 2015 |
Fiscal Year 2014 |
|||||||
|---|---|---|---|---|---|---|---|---|---|---|
Discount rate |
3.69 | % | 3.42 | % | 4.14 | % | ||||
Rate of compensation increase |
N/A | N/A | N/A | |||||||
The following benefit payments, which reflect expected future service, as appropriate, are expected to be paid (in thousands):
Fiscal Year: |
||||
2017 |
$ | 2,008 | ||
2018 |
2,080 | |||
2019 |
2,080 | |||
2020 |
2,292 | |||
2021 |
2,578 | |||
2022 - 2026 |
11,735 |
Postretirement and Postemployment Benefit Obligations
The Company provides health care benefits for certain retired employees. Prior to June 1, 2008, substantially all full-time employees could become eligible for such benefits if they reached retirement age while still working for the Company. The Company froze the accruing of benefits for eligible
108
Smart & Final Stores, Inc. and Subsidiaries
Notes to Consolidated Financial Statements (Continued)
January 1, 2017
8. Retirement Benefit Plans and Postretirement and Postemployment Benefit Obligations (Continued)
participants effective June 1, 2008. Participants who were eligible for a retiree medical benefit and retired prior to June 1, 2009 continued to be eligible for retiree medical coverage. The Company retains the right to make further amendments to the benefit formula and eligibility requirements. This postretirement health care plan is contributory with participants' contributions adjusted annually. The plan limits benefits to the lesser of the actual cost for the medical coverage selected or a defined dollar benefit based on years of service, applicable to eligible retirees. The Company uses a measurement date of December 31 for this health care plan. In 2016, the Society of Actuaries released revised mortality tables. In consideration of these tables, the Company modified the mortality assumptions used in determining its postretirement health care plan obligation as of January 1, 2017. The impact of these new mortality assumptions has resulted in a decrease to the Company's postretirement health care plan obligation and a decrease in future related expense.
The reconciliation of benefit obligation and plan assets for 2016 and 2015 are aggregated as follows (in thousands):
| |
Fiscal Year 2016 |
Fiscal Year 2015 |
|||||
|---|---|---|---|---|---|---|---|
Change in Benefit Obligation |
|||||||
Benefit obligation, beginning of period |
$ | (14,827 | ) | $ | (15,824 | ) | |
Service cost |
(380 | ) | (389 | ) | |||
Interest cost |
(634 | ) | (633 | ) | |||
Plan participants' contributions |
(482 | ) | (418 | ) | |||
Actuarial gain (loss) |
60 | 1,348 | |||||
Benefits paid |
1,383 | 1,089 | |||||
| | | | | | | | |
Benefit obligation, end of period |
(14,880 | ) | (14,827 | ) | |||
| | | | | | | | |
Change in Plan Assets |
|||||||
Employer contribution |
901 | 671 | |||||
Plan participants' contributions |
482 | 418 | |||||
Benefits paid |
(1,383 | ) | (1,089 | ) | |||
| | | | | | | | |
Fair value of plan assets, end of period |
— | — | |||||
| | | | | | | | |
Funded status |
(14,880 | ) | (14,827 | ) | |||
| | | | | | | | |
Net amount recognized |
$ | (14,880 | ) | $ | (14,827 | ) | |
| | | | | | | | |
| | | | | | | | |
| | | | | | | | |
Amounts before income tax effect recognized in the consolidated balance sheets consist of the following (in thousands):
| |
January 1, 2017 |
January 3, 2016 |
|||||
|---|---|---|---|---|---|---|---|
Other accrued liabilities |
$ | (936 | ) | $ | (860 | ) | |
Postretirement and postemployment benefits |
(13,944 | ) | (13,967 | ) | |||
| | | | | | | | |
Net amount recognized |
$ | (14,880 | ) | $ | (14,827 | ) | |
| | | | | | | | |
| | | | | | | | |
| | | | | | | | |
109
Smart & Final Stores, Inc. and Subsidiaries
Notes to Consolidated Financial Statements (Continued)
January 1, 2017
8. Retirement Benefit Plans and Postretirement and Postemployment Benefit Obligations (Continued)
Amounts before income tax effect recognized in accumulated other comprehensive income (loss) consist of the following (in thousands):
| |
January 1, 2017 |
January 3, 2016 |
|||||
|---|---|---|---|---|---|---|---|
Net actuarial gain |
$ | 1,487 | $ | 1,471 | |||
| | | | | | | | |
Accumulated other comprehensive income |
$ | 1,487 | $ | 1,471 | |||
| | | | | | | | |
| | | | | | | | |
| | | | | | | | |
During 2017, no accumulated other comprehensive income is expected to be recognized as a component of net periodic benefit cost.
The components included in the postretirement benefit cost for each of the periods indicated are as follows (in thousands):
| |
Fiscal Year 2016 |
Fiscal Year 2015 |
Fiscal Year 2014 |
|||||||
|---|---|---|---|---|---|---|---|---|---|---|
Service cost component |
$ | 380 | $ | 389 | $ | 314 | ||||
Interest cost component |
634 | 633 | 652 | |||||||
Amortization of net actuarial gain |
— | (65 | ) | |||||||
| | | | | | | | | | | |
Net periodic benefit cost |
$ | 1,014 | $ | 1,022 | $ | 901 | ||||
| | | | | | | | | | | |
| | | | | | | | | | | |
| | | | | | | | | | | |
The weighted-average discount rate used to determine benefit obligations for this plan was 4.20% and 4.40% for the years ended January 1, 2017 and January 3, 2016, respectively.
The weighted-average discount rate used to determine net periodic benefit cost was 4.40%, 4.10% and 4.80% for the years ended January 1, 2017, January 3, 2016 and December 28, 2014, respectively.
For measurement purposes, the Company used the following assumptions in regard to health care cost trends:
| |
2016 | 2015 | 2014 | |||||||
|---|---|---|---|---|---|---|---|---|---|---|
Health care cost trend rate assumed for next year |
7.00 | % | 7.50 | % | 8.00 | % | ||||
Rate to which the cost trend rate is assumed to decline (ultimate trend rate) |
5.00 | % | 5.00 | % | 5.00 | % | ||||
Year that the rate reaches the ultimate trend rate |
2022 | 2020 | 2020 | |||||||
The annual rate of health care cost of covered claims is assumed to be 7.00% for 2017 and 2018 and assumed to decrease by 0.50% per year beginning in 2019 until an ultimate trend rate of 5.00% is reached in 2022 and to remain at that level thereafter.
110
Smart & Final Stores, Inc. and Subsidiaries
Notes to Consolidated Financial Statements (Continued)
January 1, 2017
8. Retirement Benefit Plans and Postretirement and Postemployment Benefit Obligations (Continued)
The Company offers a defined dollar benefit plan providing a maximum fixed dollar amount of coverage that does not increase with medical inflation. A one-percentage-point change in the assumed health care cost trend rates would have the following effects (in thousands):
| |
1-Percentage Point Increase |
1-Percentage Point Decrease |
|||||
|---|---|---|---|---|---|---|---|
Effect on total service and interest cost components of net periodic expense |
$ | 4 | $ | (6 | ) | ||
Effect on accumulated postretirement benefit obligation |
70 | (98 | ) | ||||
The following benefit payments, which reflect expected future service, as appropriate, are expected to be paid (in thousands):
Fiscal Year: |
||||
2017 |
$ | 697 | ||
2018 |
736 | |||
2019 |
790 | |||
2020 |
819 | |||
2021 |
864 | |||
2022 - 2026 |
4,763 |
9. Income Taxes
Deferred income taxes reflect the net tax effects of temporary differences between the carrying amounts of assets and liabilities for financial reporting purposes and the amounts used for income tax
111
Smart & Final Stores, Inc. and Subsidiaries
Notes to Consolidated Financial Statements (Continued)
January 1, 2017
9. Income Taxes (Continued)
purposes. The significant components of the Company's deferred tax assets and liabilities are as follows (in thousands):
| |
January 1, 2017 |
January 3, 2016 |
|||||
|---|---|---|---|---|---|---|---|
Deferred tax assets: |
|||||||
Employee benefits, including postretirement reserves |
$ | 37,437 | $ | 36,420 | |||
Net operating loss and tax credit carryforwards |
7,783 | 6,485 | |||||
Operating reserves and accruals |
42,752 | 33,848 | |||||
Inventories |
3,929 | 3,374 | |||||
Other |
(2,517 | ) | 246 | ||||
| | | | | | | | |
Total gross deferred tax assets |
89,384 | 80,373 | |||||
Valuation allowance |
(1,501 | ) | (1,306 | ) | |||
| | | | | | | | |
Total deferred tax assets |
87,883 | 79,067 | |||||
Deferred tax liabilities: |
|||||||
Depreciation and amortization |
(63,092 | ) | (51,759 | ) | |||
Intangible assets |
(132,588 | ) | (133,589 | ) | |||
| | | | | | | | |
Total deferred tax liabilities |
(195,680 | ) | (185,348 | ) | |||
| | | | | | | | |
Net deferred tax liabilities |
$ | (107,797 | ) | $ | (106,281 | ) | |
| | | | | | | | |
| | | | | | | | |
| | | | | | | | |
The effective tax rate was –18.7% for the year ended January 1, 2017, 37.6% for the year ended January 3, 2016, and 33.7% for the year ended December 28, 2014. Reconciliation between the federal statutory income tax rate of 35% and the effective tax rate for each year is as follows (in thousands):
| |
Fiscal Year 2016 |
Fiscal Year 2015 |
Fiscal Year 2014 |
|||||||
|---|---|---|---|---|---|---|---|---|---|---|
Income tax at federal statutory rate |
$ | 3,819 | $ | 21,477 | $ | 17,490 | ||||
Equity earnings not subject to U.S. tax |
(534 | ) | (482 | ) | (363 | ) | ||||
State income taxes, net of federal tax benefit |
(276 | ) | 2,457 | 1,570 | ||||||
Federal tax credits |
(714 | ) | (448 | ) | (692 | ) | ||||
Foreign taxes, net of credits |
16 | (21 | ) | 134 | ||||||
State EZ credits |
— | 202 | (302 | ) | ||||||
Insurance Proceeds & Cash Surrender Value |
(745 | ) | 288 | (296 | ) | |||||
Permanent re-investment in foreign operations |
— | (202 | ) | — | ||||||
Excess Tax Benefit—Share Based Comp |
(3,061 | ) | — | — | ||||||
Uncertain Tax Positions |
(1,657 | ) | — | — | ||||||
Debt Issuance Costs |
582 | — | — | |||||||
Other items, net |
533 | (169 | ) | (687 | ) | |||||
| | | | | | | | | | | |
Income tax (benefit) provision |
$ | (2,037 | ) | $ | 23,102 | $ | 16,854 | |||
| | | | | | | | | | | |
| | | | | | | | | | | |
| | | | | | | | | | | |
The adoption of ASU 2016-09 significantly impacts both the timing and method of how the tax effects of share-based awards are recognized. ASU 2016-09 requires the income tax effects to be recognized in the provision for income taxes when the awards vest or are settled whereas previously
112
Smart & Final Stores, Inc. and Subsidiaries
Notes to Consolidated Financial Statements (Continued)
January 1, 2017
9. Income Taxes (Continued)
such income tax benefits were recognized as part of additional paid-in capital and could not be recognized until they were realized through a reduction in income taxes payable. These combined effects had the impact of decreasing the Company's provision for income taxes by $3.1 million and the Company's effective tax rate by 28% in 2016. Excluding the adoption of ASU 2016-09, the Company's provision for income taxes and effective tax rate in fiscal year 2016 would have been $1.02 million and 9%, respectively.
The significant components of the provision for income taxes are as follows (in thousands):
| |
Fiscal Year 2016 |
Fiscal Year 2015 |
Fiscal Year 2014 |
|||||||
|---|---|---|---|---|---|---|---|---|---|---|
Current: |
||||||||||
Federal |
$ | (2,173 | ) | $ | 14,352 | $ | 17,350 | |||
State |
1,337 | 5,176 | 3,126 | |||||||
Foreign |
268 | 249 | 204 | |||||||
| | | | | | | | | | | |
|
(568 | ) | 19,777 | 20,680 | ||||||
Deferred: |
||||||||||
Federal |
(276 | ) | 3,897 | (2,650 | ) | |||||
State |
(1,193 | ) | (572 | ) | (1,176 | ) | ||||
| | | | | | | | | | | |
|
(1,469 | ) | 3,325 | (3,826 | ) | |||||
| | | | | | | | | | | |
Total income tax provision |
$ | (2,037 | ) | $ | 23,102 | $ | 16,854 | |||
| | | | | | | | | | | |
| | | | | | | | | | | |
| | | | | | | | | | | |
At January 1, 2017, the Company had no federal net operating loss carryforwards, and approximately $16.0 million (gross) of net operating loss carryforwards for state income tax purposes, which begin to expire in 2017.
The total tax credits available were $4.6 million at January 1, 2017. These tax credits primarily include California state tax incentive programs designed to encourage employers hiring from targeted groups. The California state tax credits will begin to expire in 2024.
In assessing the realizability of deferred tax assets included in the consolidated balance sheets, management considers whether it is more likely than not that some portion or all of the tax assets will not be realized. The ultimate realization of deferred tax assets is dependent upon the generation of future taxable income during the periods in which those temporary differences become deductible. Management considers the scheduled reversal of deferred tax liabilities, projected future taxable income and tax planning strategies in making this assessment. In accordance with this policy and the requirements of ASC 740, a valuation allowance of $1.5 million is retained against certain California tax credits and certain California and Florida net operating loss carryforwards. The net change during the year in total valuation allowance was approximately $0.2 million.
The Company has not recorded U.S. income tax expense for the undistributed earnings pertaining to the 2012 to 2016 SFDN operations. As of January 1, 2017 and January 3, 2016, the undistributed earnings were $6.4 million and $4.9 million, respectively. The Company intends to leave the 2012 to 2016 undistributed income permanently reinvested offshore. The amount of earnings designated as
113
Smart & Final Stores, Inc. and Subsidiaries
Notes to Consolidated Financial Statements (Continued)
January 1, 2017
9. Income Taxes (Continued)
indefinitely reinvested offshore is based upon the actual deployment of such earnings in offshore assets and expectations of the future cash needs of the U.S. and foreign entities.
In July 2006, the FASB issued further guidance to clarify the accounting for income taxes by prescribing the minimum recognition threshold a tax position is required to meet before being recognized in the financial statements. It also provides guidance on derecognition, measurement, classification, interest and penalties, accounting in interim periods, disclosure and transition and applies to all tax positions related to income taxes. A reconciliation of the beginning and ending amount of unrecognized tax benefits, including accrued interest and penalties, is as follows (in thousands):
| |
Fiscal Year 2016 |
Fiscal Year 2015 |
|||||
|---|---|---|---|---|---|---|---|
Balance at beginning of fiscal year |
$ | 2,569 | $ | 1,675 | |||
Additions based on tax positions related to current period |
— | — | |||||
Additions based on tax positions related to prior periods |
715 | ||||||
Accrued interest and penalty |
73 | 179 | |||||
Reductions due to lapse of the applicable statute of limitations |
(1,801 | ) | — | ||||
| | | | | | | | |
Balance at end of fiscal year |
$ | 841 | $ | 2,569 | |||
| | | | | | | | |
| | | | | | | | |
| | | | | | | | |
As of January 1, 2017 and January 3, 2016, the total amounts of unrecognized tax benefits were $0.8 million and $2.6 million, respectively. If the entire liability were recognized, only $0.1 million would affect the effective tax rate.
The Company does not anticipate any of its unrecognized tax benefits, as disclosed above, to be settled in the next 12 months. The Company's policy is to accrue any interest and penalties related to unrecognized tax benefits in its income tax expense. For the year ended January 1, 2017, approximately $73,000 was recorded as interest and penalties. For the year ended January 3, 2016, approximately $154,000 was recorded as interest and penalties.
As of January 1, 2017, the Company's federal tax returns for the periods ended December 30, 2012 and December 29, 2013 were under examination by the Internal Revenue Service (the "IRS"). The Company was advised that the IRS field examination team has accepted the Company's tax positions and is currently preparing its final report on the 2012/2013 examination to send to the congressional Joint Committee on Taxation for review. On February 14, 2017, the Company was advised that the congressional Joint Committee on Taxation completed its review of the audit findings and took no exceptions to the conclusions reached by the IRS. The audit resulted in a refund of approximately $5.7 million.
The Company or one of its subsidiaries files income tax returns in the U.S. federal jurisdiction, various U.S. state jurisdictions and Mexico. The Company is no longer subject to U.S. federal, state and local, or non-U.S. income tax examinations by tax authorities for years before 2011.
The tax years which remain subject to examination or are being examined by major tax jurisdictions as of January 1, 2017 include fiscal years 2012 through 2016 for state purposes and 2012 through 2016 for federal purposes.
114
Smart & Final Stores, Inc. and Subsidiaries
Notes to Consolidated Financial Statements (Continued)
January 1, 2017
10. Related Party Transactions
As of January 1, 2017 and January 3, 2016, funds affiliated with Ares hold 1.1% and 9.9% of the outstanding loans under the Term Loan Facility, respectively, and receive payments representing their pro rata portion of such loans. In connection with the Ares Acquisition, on November 15, 2012, we entered into Management Services Agreements with certain affiliates of Ares Management (the "Management Services Agreements"). Each Management Services Agreement provides for reimbursement of the applicable manager's and its affiliates' out-of-pocket expenses in connection with the management services. During the years ended January 1, 2017, January 3, 2016 and December 28, 2014, fees and other expenses paid to Ares were $0.2 million, $0.3 million and $0.1 million, respectively.
11. Employment Agreements
Effective with the Ares Acquisition on November 15, 2012, SFSI entered into an employment agreement with David G. Hirz (the "2012 Hirz Agreement") and a Fair Competition Agreement wherein Mr. Hirz agreed to various non-competition and non-solicitation covenants. In connection with the IPO, SFSI entered into a new employment agreement with David G. Hirz (the "2014 Hirz Agreement").
On July 20, 2016, SFSI entered into an amended and restated employment agreement with David G. Hirz which agreement replaces and supersedes all prior employment agreements between the Company and Mr. Hirz (the "2016 Hirz Agreement"). The 2016 Hirz Agreement provides, among other provisions, for Mr. Hirz to: (a) serve as the Chief Executive Officer and President of the Company for a three-year term with automatic one-year renewals, (b) be nominated to serve as a director on SFSI's board of directors for so long as he remains employed by the Company, (c) be compensated through base salary, bonus, benefits and expense reimbursement, (d) be considered for annual grant of equity awards on terms determined by the SFSI's board of directors or the Compensation Committee of such board (the "Compensation Committee"), and (e) have his existing option and restricted stock agreements amended to reflect various changes resulting from a termination event.
12. Share-Based Compensation
2014 Incentive Plan
Effective September 23, 2014, and in connection with the IPO, SFSI adopted the Smart & Final Stores, Inc. 2014 Stock Incentive Plan (the "2014 Incentive Plan"), which provides for the issuance of equity-based incentive awards not to exceed 5,500,000 shares of Common Stock to eligible employees, consultants and non-employee directors in the form of stock options, restricted stock, other stock-based awards and performance-based cash awards. In addition, a number of shares of Common Stock equal to the number of shares of Common Stock underlying stock options that were previously issued under the 2012 Incentive Plan (as defined below) and that expire, terminate or are cancelled for any reason without being exercised in full will be available for issuance under the 2014 Incentive Plan.
Effective September 23, 2014, SFSI's board of directors and the Compensation Committee of SFSI's board of directors (the "Compensation Committee") granted 458,645 shares of restricted stock to eligible employees under the 2014 Incentive Plan. These grants were awards with time-based vesting
115
Smart & Final Stores, Inc. and Subsidiaries
Notes to Consolidated Financial Statements (Continued)
January 1, 2017
12. Share-Based Compensation (Continued)
terms, and generally vest over four years, subject to continuous employment. The grant date fair value was $12.00 per share of restricted stock based on the price of Common Stock sold in the IPO. During the year ended January 3, 2016, SFSI's board of directors and the Compensation Committee granted a total of 29,662 shares of restricted stock to eligible employees and directors under the 2014 Incentive Plan. These grants were awards with time-based vesting terms. Certain of these grants are awards that vest over three years and certain of these grants are awards that vest over four years, and each is subject to continuous employment or service. During the year ended January 3, 2016, there were 44,284 shares of restricted stock retained by the Company to fund the grantee's income tax obligations in connection with the vesting of such awards. During the year ended January 1, 2017, 413,330 shares of restricted stock were granted to certain management employees and non-employee directors under the 2014 Incentive Plan. These awards have time-based vesting terms subject to continuous employment or service with the Company. Except for the shares granted to non-employee directors, which vest in equal installments of 25% over a four-year period from the grant date, these grants vest in equal installments of 331/3% each year over a three-year period from the grant date. During the year ended January 1, 2017, 50,773 shares of restricted stock were surrendered to the Company to cover the grantee's minimum income tax obligations in connection with the vesting of restricted stock awards.
Effective September 23, 2014, SFSI's board of directors and the Compensation Committee also granted stock options to purchase up to a total of 1,543,592 shares of Common Stock to certain management employees and non-employee directors under the 2014 Incentive Plan. The stock options have time-based vesting terms. These stock options collectively with the stock options to purchase up to 6,335,550 shares of Common Stock described below under "2012 Incentive Plan," are referred to herein as the "Time-Based Options." Of the Time-Based Options granted on September 23, 2014, stock options to purchase up to 638,889 shares of Common Stock vest over a five-year period from the grant date, with 10% vesting on the first and second anniversaries of the grant date, 20% vesting on the third and fourth anniversaries of the grant date and 40% vesting on the fifth anniversary of the grant date, and stock options to purchase up to 524,999 shares of Common Stock vest over a five-year period from the grant date with 20% vesting at the end of each year. The majority of the Time-Based Options granted under the 2014 Incentive Plan (to purchase up to 379,704 shares of Common Stock) vest over a four-year period from the grant date with 25% vesting at the end of each year. During the year ended January 3, 2016, SFSI's board of directors granted stock options to purchase up to a total of 28,294 shares of Common Stock which vest over a four-year period from the grant date with 25% vesting at the end of each year. All of the Time-Based Options granted have a 10-year term and are subject to continuous employment or service. During the year ended January 1, 2017, stock options to purchase up to 589,074 shares of Common Stock were granted to certain management employees under the 2014 Incentive Plan. These awards vest in equal installments of 25% each year over a four-year period from the grant date subject to continuous employment with the Company.
On September 22, 2014, stock options to purchase up to an aggregate 821,370 shares of Common Stock previously granted on May 30, 2014 and June 6, 2014 under the 2012 Incentive Plan were cancelled and new grants of stock options to purchase up to 598,987 shares of Common Stock and 222,383 shares of restricted stock were granted to the same individuals under the 2014 Incentive Plan. These grants were awards with time-based vesting terms, and vest over various years from grant date with various percentages vesting on each anniversary of the original grant dates through May 30, 2019. These grants under the 2014 Incentive Plan are in addition to the aforementioned grants of
116
Smart & Final Stores, Inc. and Subsidiaries
Notes to Consolidated Financial Statements (Continued)
January 1, 2017
12. Share-Based Compensation (Continued)
458,645 shares of restricted stock and aforementioned grants of stock options to purchase up to 1,543,592 shares of Common Stock.
The following table summarizes the restricted stock award activity under the 2014 Incentive Plan for the year ended January 1, 2017:
| |
Shares | Weighted Average Grant Date Fair Value |
|||||
|---|---|---|---|---|---|---|---|
Outstanding at December 28, 2014 |
681,028 | $ | 10.89 | ||||
Granted |
29,662 | 16.01 | |||||
Forfeited |
(29,058 | ) | 12.00 | ||||
Vested |
(122,496 | ) | 12.00 | ||||
| | | | | | | | |
Outstanding at January 3, 2016 |
559,136 | $ | 10.86 | ||||
Granted |
413,330 | 15.55 | |||||
Forfeited |
(19,153 | ) | 13.70 | ||||
Vested |
(127,386 | ) | 12.28 | ||||
| | | | | | | | |
Outstanding at January 1, 2017 |
825,927 | $ | 12.92 | ||||
| | | | | | | | |
Exercisable at January 1, 2017 |
— | — | |||||
| | | | | | | | |
| | | | | | | | |
| | | | | | | | |
The Company recorded share-based compensation expense related to the restricted stock awards of $4.5 million, $3.2 million and $0.9 million for the years ended January 1, 2017, January 3, 2016 and December 28, 2014, respectively. As of January 1, 2017, the unrecognized compensation cost was $4.8 million and related weighted-average period over which Time-Based Option expense was expected to be recognized was approximately 1.55 years.
117
Smart & Final Stores, Inc. and Subsidiaries
Notes to Consolidated Financial Statements (Continued)
January 1, 2017
12. Share-Based Compensation (Continued)
The following table summarizes the Time-Based Option activity under the 2014 Incentive Plan for the year ended January 1, 2017 (dollars in thousands except weighted average exercise price):
| |
Shares | Weighted- Average Exercise Price |
Weighted- Average Remaining Contractual Term |
Aggregate Intrinsic Value |
||||||||
|---|---|---|---|---|---|---|---|---|---|---|---|---|
Outstanding at December 28, 2014 |
2,131,468 | $ | 12.00 | 9.75 years | ||||||||
Granted |
28,294 | 16.43 | ||||||||||
Forfeited |
(36,612 | ) | 12.00 | |||||||||
Exercised |
(29,232 | ) | 12.00 | |||||||||
| | | | | | | | | | | | | |
Outstanding at January 3, 2016 |
2,093,918 | $ | 12.06 | 8.74 years | $ | 12,878 | ||||||
Granted |
589,074 | 15.63 | ||||||||||
Forfeited |
(67,247 | ) | 12.43 | |||||||||
Exercised |
(37,037 | ) | 12.00 | |||||||||
| | | | | | | | | | | | | |
Outstanding at January 1, 2017 |
2,578,708 | 12.87 | 8.10 years | $ | 4,137 | |||||||
| | | | | | | | | | | | | |
| | | | | | | | | | | | | |
| | | | | | | | | | | | | |
Exercisable at January 1, 2017 |
552,675 | $ | 12.06 | 7.73 years | $ | 1,146 | ||||||
| | | | | | | | | | | | | |
| | | | | | | | | | | | | |
| | | | | | | | | | | | | |
Expected to vest after January 1, 2017 |
1,974,031 | $ | 13.04 | 8.18 years | $ | 2,964 | ||||||
| | | | | | | | | | | | | |
| | | | | | | | | | | | | |
| | | | | | | | | | | | | |
Aggregate intrinsic value represents the difference between the closing stock price of our common stock and the exercise price of outstanding, in-the-money options. Our closing stock price as reported on NYSE as of December 30, 2016 (the last trading day of fiscal year 2016) was $14.10.
The fair value of the Time-Based Options was estimated on the date of grant using the Black-Scholes-Merton option-pricing model based on the assumptions in the following table:
| |
Fiscal Year 2016 |
Fiscal Year 2015 |
||
|---|---|---|---|---|
Dividend yield |
0% | 0% | ||
Expected volatility |
33.75% | 34.26% | ||
Risk-free interest rates |
1.36% | 1.80% | ||
Expected terms |
6.23 years | 6.26 years | ||
Weighted-average fair value of options granted |
$5.51 | $6.06 |
The expected volatility for all Time-Based Options was based on utilizing comparable peer group share price volatility adjusted for the Company's debt to equity leverage, including the effect of the Ares Acquisition. The risk-free interest rate was based on the traded zero-coupon U.S. Treasury bond with a term equal to the grant's expected life. The term of the Time-Based Options was derived based on the "simplified method" calculation. The simplified method allows companies that do not have sufficient historical experience to provide a reasonable basis for an estimate to instead estimate the expected term of a "plain vanilla" option by averaging the time to vesting and the full term of the option. ("Plain vanilla" options are options with the following characteristics: (1) the options are granted at-the-money; (2) exercisability is conditional only upon performing service through the vesting date; (3) if an employee terminates service prior to vesting, the employee would forfeit the options;
118
Smart & Final Stores, Inc. and Subsidiaries
Notes to Consolidated Financial Statements (Continued)
January 1, 2017
12. Share-Based Compensation (Continued)
(4) if an employee terminates service after vesting, the employee would have a limited time to exercise the options; and (5) the options are nontransferable and non-hedgeable.) The Company periodically evaluates the applicability of using the simplified method with respect to the characteristics noted above with respect to its options and will continue to so evaluate as the Company gains historical experience. The estimated forfeiture rate of 5.0% was based on projected forfeitures primarily based on the historical experience of the Company.
The Company recorded share-based compensation expense for Time-Based Options granted under the 2014 Incentive Plan of $3.3 million, $3.2 million and $1.0 million for the years ended January 1, 2017, January 3, 2016 and December 28, 2014, respectively. As of January 1, 2017, the unrecognized compensation cost was $4.3 million and related weighted-average period over which Time-Based Option expense was expected to be recognized was approximately 2.03 years.
2012 Incentive Plan
Effective November 15, 2012, SFSI adopted the SF CC Holdings, Inc. 2012 Stock Incentive Plan (the "2012 Incentive Plan"), which provides for the issuance of equity-based incentive awards not to exceed 11,400,000 shares of Common Stock. Effective upon closing of the IPO, no new awards may be granted under the 2012 Incentive Plan.
The following table summarizes the Time-Based Option activity under the 2012 Incentive Plan for the years ended January 1, 2017 and January 3, 2016 (dollars in thousands except weighted average exercise price):
| |
Shares | Weighted-Average Exercise Price |
Weighted-Average Remaining Contractual Term |
Aggregate Intrinsic Value |
||||||||
|---|---|---|---|---|---|---|---|---|---|---|---|---|
Outstanding at December 28, 2014 |
5,354,200 | $ | 6.58 | 8.11 years | ||||||||
Granted |
— | — | ||||||||||
Forfeited |
(44,536 | ) | 6.58 | |||||||||
Exercised |
(56,054 | ) | 6.56 | |||||||||
Cancelled |
— | — | ||||||||||
Expired |
— | — | ||||||||||
| | | | | | | | | | | | | |
Outstanding at January 3, 2016 |
5,253,610 | 6.59 | 7.09 years | $ | 61,072 | |||||||
Granted |
— | — | ||||||||||
Forfeited |
(60,496 | ) | 6.59 | |||||||||
Exercised |
(393,528 | ) | 6.66 | |||||||||
Cancelled |
— | |||||||||||
Expired |
— | |||||||||||
| | | | | | | | | | | | | |
Outstanding at January 1, 2017 |
4,799,586 | 6.58 | 6.10 years | $ | 36,099 | |||||||
| | | | | | | | | | | | | |
| | | | | | | | | | | | | |
| | | | | | | | | | | | | |
Exercisable at January 1, 2017 |
3,751,470 | 6.58 | 6.09 years | $ | 28,222 | |||||||
| | | | | | | | | | | | | |
| | | | | | | | | | | | | |
| | | | | | | | | | | | | |
Expected to vest after January 1, 2017 |
1,043,398 | 6.59 | 6.11 years | $ | 7,841 | |||||||
| | | | | | | | | | | | | |
| | | | | | | | | | | | | |
| | | | | | | | | | | | | |
119
Smart & Final Stores, Inc. and Subsidiaries
Notes to Consolidated Financial Statements (Continued)
January 1, 2017
12. Share-Based Compensation (Continued)
The Company recorded share-based compensation expense for Time-Based Options granted under the 2012 Incentive Plan of $2.0 million, $3.6 million and $9.5 million for the years ended January 1, 2017, January 3, 2016 and December 28, 2014, respectively. As of January 1, 2017, the unrecognized compensation cost was $0.8 million and related weighted-average period over which Time-Based Option expense was expected to be recognized was approximately 0.88 years.
In connection with the Ares Acquisition on November 15, 2012, certain stock options to purchase shares of common stock of the Predecessor were converted into 3,625,580 stock options to purchase Common Stock (the "Rollover Options"). In the event of a participant's termination of employment for cause or upon discovery that the participant engaged in detrimental activity, if the Company elected to exercise its repurchase right, it was required to do so within a 180-day period commencing on the later of (i) the date of termination and (ii) the date on which such Rollover Option was exercised. In the event of a participant's termination of employment for any other reason, the repurchase right was required to be exercised by the Company during the 90-day period following the date of termination.
The following table summarizes the Rollover Option activity for the years ended January 1, 2017 and January 3, 2016 (dollars in thousands except weighted average exercise price):
| |
Shares | Weighted-Average Exercise Price |
Weighted-Average Remaining Contractual Term |
Aggregate Intrinsic Value |
||||||||
|---|---|---|---|---|---|---|---|---|---|---|---|---|
Outstanding at December 28, 2014 |
2,700,850 | $ | 2.26 | 3.07 years | ||||||||
Granted |
— | — | ||||||||||
Forfeited |
— | — | ||||||||||
Exercised |
— | — | ||||||||||
Cancelled |
— | — | ||||||||||
Expired |
— | — | ||||||||||
| | | | | | | | | | | | | |
Outstanding at January 3, 2016 |
2,700,850 | 2.26 | 2.05 years | $ | 43,078 | |||||||
Granted |
— | — | ||||||||||
Forfeited |
— | — | ||||||||||
Exercised |
(765,597 | ) | 2.09 | |||||||||
Cancelled |
— | |||||||||||
Expired |
— | |||||||||||
| | | | | | | | | | | | | |
Outstanding at January 1, 2017 |
1,935,253 | 2.33 | 1.37 years | $ | 22,783 | |||||||
| | | | | | | | | | | | | |
| | | | | | | | | | | | | |
| | | | | | | | | | | | | |
Exercisable at January 1, 2017 |
1,935,253 | 2.33 | 1.37 years | $ | 22,783 | |||||||
| | | | | | | | | | | | | |
| | | | | | | | | | | | | |
| | | | | | | | | | | | | |
120
Smart & Final Stores, Inc. and Subsidiaries
Notes to Consolidated Financial Statements (Continued)
January 1, 2017
13. Accumulated Other Comprehensive Income (Loss)
The following table represents the changes in AOCI by each component for the years ended January 1, 2017 and January 3, 2016, net of tax:
| (in thousands) |
Defined Benefit Retirement Plan |
Cash Flow Hedging Activity |
Foreign Currency Translation |
Total | |||||||||
|---|---|---|---|---|---|---|---|---|---|---|---|---|---|
Balance at December 28, 2014 |
$ | (3,956 | ) | $ | 385 | $ | (846 | ) | $ | (4,417 | ) | ||
OCI before reclassification |
956 | (1,375 | ) | (1,120 | ) | (1,539 | ) | ||||||
Amounts reclassified out of AOCI |
— | (32 | ) | — | (32 | ) | |||||||
| | | | | | | | | | | | | | |
Net fiscal year 2015 OCI |
956 | (1,407 | ) | (1,120 | ) | (1,571 | ) | ||||||
| | | | | | | | | | | | | | |
Balance at January 3, 2016 |
$ | (3,000 | ) | $ | (1,022 | ) | $ | (1,966 | ) | $ | (5,988 | ) | |
OCI before reclassification |
(7,332 | ) | 345 | (623 | ) | (7,610 | ) | ||||||
Amounts reclassified out of AOCI |
— | 15 | — | 15 | |||||||||
| | | | | | | | | | | | | | |
Net fiscal year 2016 OCI |
(7,332 | ) | 360 | (623 | ) | (7,595 | ) | ||||||
| | | | | | | | | | | | | | |
Balance at January 1, 2017 |
$ | (10,332 | ) | $ | (662 | ) | $ | (2,589 | ) | $ | (13,583 | ) | |
| | | | | | | | | | | | | | |
| | | | | | | | | | | | | | |
| | | | | | | | | | | | | | |
The following table represents the items reclassified out of each component of AOCI and the related tax effects for the year ended January 1, 2017:
Details about AOCI Components (in thousands)
|
Amount Reclassified from AOCI |
Location within Statement of Operations and Comprehensive Income (Loss) |
|||
|---|---|---|---|---|---|
Gains (losses) on cash flow hedges |
|||||
Interest rate swaps |
$ | 25 | Interest income (expense) | ||
| | | | | | |
|
25 | Total before income tax | |||
|
(10 | ) | Income tax (provision) benefit | ||
| | | | | | |
|
$ | 15 | Reclassification of adjustments, net of tax | ||
| | | | | | |
| | | | | | |
| | | | | | |
Total reclassifications for the year |
$ | 15 | Total reclassifications, net of tax | ||
| | | | | | |
| | | | | | |
| | | | | | |
The following table represents the items reclassified out of each component of AOCI and the related tax effects for the year ended January 3, 2016:
Details about AOCI Components (in thousands)
|
Amount Reclassified from AOCI |
Location within Statement of Operations and Comprehensive Income (Loss) |
|||
|---|---|---|---|---|---|
Gains (losses) on cash flow hedges |
|||||
Interest rate swaps |
$ | (53 | ) | Interest income (expense) | |
| | | | | | |
|
(53 | ) | Total before income tax | ||
|
21 | Income tax (provision) benefit | |||
| | | | | | |
|
$ | (32 | ) | Reclassification of adjustments, net of tax | |
| | | | | | |
| | | | | | |
| | | | | | |
Total reclassifications for the year |
$ | (32 | ) | Total reclassifications, net of tax | |
| | | | | | |
| | | | | | |
| | | | | | |
121
Smart & Final Stores, Inc. and Subsidiaries
Notes to Consolidated Financial Statements (Continued)
January 1, 2017
14. Segment Information
The Company is a value-oriented retailer serving a diverse demographic of household and business customers through two complementary store banners. The "Smart & Final" business focuses on both household and business customers, and the "Cash & Carry" business focuses primarily on restaurants, caterers and a wide range of other foodservice businesses. The Company's chief operating decision maker ("CODM") regularly reviews the operating performance of each of the store banners including measures of performance based on income (loss) from operations. The Company considers each of the store banners to be an operating segment and has further concluded that presenting disaggregated information of these two operating segments provides meaningful information as certain economic characteristics are dissimilar as well as the characteristics of the customer base served.
The "Corporate/Other" category is comprised primarily of corporate overhead support expenses and administrative expenses incidental to the activities of the reportable segments, interest expense and other costs associated with the Company's debt obligations, equity earnings in its joint venture, and income taxes.
For the year ended January 1, 2017, the operating information and total assets for the reportable segments are shown as follows (in thousands):
| |
Smart & Final | Cash & Carry | Corporate/ Other |
Consolidated | |||||||||
|---|---|---|---|---|---|---|---|---|---|---|---|---|---|
Net sales |
$ | 3,400,755 | $ | 941,040 | $ | — | $ | 4,341,795 | |||||
Cost of sales, distribution and store occupancy |
2,894,222 | 808,258 | 9,811 | 3,712,291 | |||||||||
Operating and administrative expenses |
444,318 | 66,688 | 71,480 | 582,486 | |||||||||
| | | | | | | | | | | | | | |
Income (loss) from operations |
$ | 62,215 | $ | 66,094 | $ | (81,291 | ) | $ | 47,018 | ||||
| | | | | | | | | | | | | | |
| | | | | | | | | | | | | | |
| | | | | | | | | | | | | | |
As of January 1, 2017 |
|||||||||||||
Total assets |
$ | 1,875,954 | $ | 347,646 | $ | (271,181 | ) | $ | 1,952,419 | ||||
| | | | | | | | | | | | | | |
| | | | | | | | | | | | | | |
| | | | | | | | | | | | | | |
Intercompany receivable (payable) |
$ | 353,721 | $ | 1,458 | $ | (355,179 | ) | $ | — | ||||
| | | | | | | | | | | | | | |
| | | | | | | | | | | | | | |
| | | | | | | | | | | | | | |
Investment in joint venture |
$ | — | $ | — | $ | 14,366 | $ | 14,366 | |||||
| | | | | | | | | | | | | | |
| | | | | | | | | | | | | | |
| | | | | | | | | | | | | | |
Goodwill |
$ | 406,662 | $ | 204,580 | $ | — | $ | 611,242 | |||||
| | | | | | | | | | | | | | |
| | | | | | | | | | | | | | |
| | | | | | | | | | | | | | |
Fiscal year ended January 1, 2017 |
|||||||||||||
Capital expenditures |
$ | 135,677 | $ | 10,074 | $ | 5,485 | $ | 151,236 | |||||
| | | | | | | | | | | | | | |
| | | | | | | | | | | | | | |
| | | | | | | | | | | | | | |
Assets acquired in Haggen Transaction |
$ | 2,257 | $ | — | $ | — | $ | 2,257 | |||||
| | | | | | | | | | | | | | |
| | | | | | | | | | | | | | |
| | | | | | | | | | | | | | |
Depreciation and amortization |
$ | 74,609 | $ | 3,958 | $ | 8,448 | $ | 87,015 | |||||
| | | | | | | | | | | | | | |
| | | | | | | | | | | | | | |
| | | | | | | | | | | | | | |
122
Smart & Final Stores, Inc. and Subsidiaries
Notes to Consolidated Financial Statements (Continued)
January 1, 2017
14. Segment Information (Continued)
For the year ended January 3, 2016, the operating information and total assets for the reportable segments are shown as follows (in thousands):
| |
Smart & Final | Cash & Carry | Corporate/ Other |
Consolidated | |||||||||
|---|---|---|---|---|---|---|---|---|---|---|---|---|---|
Net sales |
$ | 3,036,949 | $ | 934,031 | $ | — | $ | 3,970,980 | |||||
Cost of sales, distribution and store occupancy |
2,561,035 | 802,115 | 8,970 | 3,372,120 | |||||||||
Operating and administrative expenses |
372,011 | 64,368 | 67,616 | 503,995 | |||||||||
| | | | | | | | | | | | | | |
Income (loss) from operations |
$ | 103,903 | $ | 67,548 | $ | (76,586 | ) | $ | 94,865 | ||||
| | | | | | | | | | | | | | |
| | | | | | | | | | | | | | |
| | | | | | | | | | | | | | |
As of January 3, 2016 |
|||||||||||||
Total assets |
$ | 1,615,564 | $ | 314,549 | $ | (108,824 | ) | $ | 1,821,289 | ||||
| | | | | | | | | | | | | | |
| | | | | | | | | | | | | | |
| | | | | | | | | | | | | | |
Intercompany receivable (payable) |
$ | 205,705 | $ | (24,342 | ) | $ | (181,363 | ) | $ | — | |||
| | | | | | | | | | | | | | |
| | | | | | | | | | | | | | |
| | | | | | | | | | | | | | |
Investment in joint venture |
$ | — | $ | — | $ | 12,763 | $ | 12,763 | |||||
| | | | | | | | | | | | | | |
| | | | | | | | | | | | | | |
| | | | | | | | | | | | | | |
Goodwill |
$ | 406,662 | $ | 204,580 | $ | — | $ | 611,242 | |||||
| | | | | | | | | | | | | | |
| | | | | | | | | | | | | | |
| | | | | | | | | | | | | | |
Fiscal year ended January 3, 2016 |
|||||||||||||
Capital expenditures |
$ | 122,808 | $ | 7,616 | $ | 6,579 | $ | 137,003 | |||||
| | | | | | | | | | | | | | |
| | | | | | | | | | | | | | |
| | | | | | | | | | | | | | |
Assets acquired in Haggen Transaction |
$ | 66,440 | $ | — | $ | — | $ | 66,440 | |||||
| | | | | | | | | | | | | | |
| | | | | | | | | | | | | | |
| | | | | | | | | | | | | | |
Depreciation and amortization |
$ | 56,936 | $ | 3,351 | $ | 8,479 | $ | 68,766 | |||||
| | | | | | | | | | | | | | |
| | | | | | | | | | | | | | |
| | | | | | | | | | | | | | |
For the year ended December 28, 2014, the operating information and total assets for the reportable segments are shown as follows (in thousands):
| |
Smart & Final | Cash & Carry | Corporate/ Other |
Consolidated | |||||||||
|---|---|---|---|---|---|---|---|---|---|---|---|---|---|
Net sales |
$ | 2,668,933 | $ | 865,311 | $ | — | $ | 3,534,244 | |||||
Cost of sales, distribution and store occupancy |
2,252,698 | 746,102 | 8,155 | 3,006,955 | |||||||||
Operating and administrative expenses |
319,864 | 57,963 | 60,701 | 438,528 | |||||||||
| | | | | | | | | | | | | | |
Income (loss) from operations |
$ | 96,371 | $ | 61,246 | $ | (68,856 | ) | $ | 88,761 | ||||
| | | | | | | | | | | | | | |
| | | | | | | | | | | | | | |
| | | | | | | | | | | | | | |
As of December 28, 2014 |
|||||||||||||
Total assets |
$ | 1,581,414 | $ | 262,660 | $ | (114,782 | ) | $ | 1,729,292 | ||||
| | | | | | | | | | | | | | |
| | | | | | | | | | | | | | |
| | | | | | | | | | | | | | |
Intercompany receivable (payable) |
$ | 256,743 | $ | (69,539 | ) | $ | (187,204 | ) | $ | — | |||
| | | | | | | | | | | | | | |
| | | | | | | | | | | | | | |
| | | | | | | | | | | | | | |
Investment in joint venture |
$ | — | $ | — | $ | 11,924 | $ | 11,924 | |||||
| | | | | | | | | | | | | | |
| | | | | | | | | | | | | | |
| | | | | | | | | | | | | | |
Goodwill |
$ | 406,662 | $ | 204,580 | $ | — | $ | 611,242 | |||||
| | | | | | | | | | | | | | |
| | | | | | | | | | | | | | |
| | | | | | | | | | | | | | |
Fiscal year ended December 28, 2014 |
|||||||||||||
Total capital expenditures |
$ | 106,528 | $ | 5,229 | $ | 5,642 | $ | 117,399 | |||||
| | | | | | | | | | | | | | |
| | | | | | | | | | | | | | |
| | | | | | | | | | | | | | |
Depreciation and amortization |
$ | 50,405 | $ | 3,659 | $ | 10,130 | $ | 64,194 | |||||
| | | | | | | | | | | | | | |
| | | | | | | | | | | | | | |
| | | | | | | | | | | | | | |
123
Smart & Final Stores, Inc. and Subsidiaries
Notes to Consolidated Financial Statements (Continued)
January 1, 2017
14. Segment Information (Continued)
The Company categorizes its products into two groups: perishable and non-perishable products. Perishable product categories include fresh produce and floral, meat and seafood dairy and cheese, service deli, and bulk foods. Non-perishable product categories include grocery, foodservice, packaging, beverage, frozen, and restaurant equipment and janitorial supplies. The following is a breakdown of the Company's total consolidated sales by perishable and non-perishable sales mix:
| |
2016 | 2015 | 2014 | |||||||
|---|---|---|---|---|---|---|---|---|---|---|
Perishables |
37.0 | % | 36.8 | % | 36.0 | % | ||||
Non-perishables |
63.0 | 63.2 | 64.0 | |||||||
| | | | | | | | | | | |
Total |
100 | % | 100 | % | 100 | % | ||||
| | | | | | | | | | | |
| | | | | | | | | | | |
| | | | | | | | | | | |
15. Commitments and Contingencies
Legal Actions
On February 11, 2016, the Company received a subpoena from the District Attorney for the County of Yolo, California, seeking information concerning its handling, disposal and reverse logistics of potential hazardous waste at its stores and distribution centers in California. The Company has provided information and is cooperating with the authorities from multiple counties in California in connection with this ongoing matter. In the fourth quarter of 2016, the Company recorded a loss related to this matter in an amount considered to be immaterial. At this time, the Company cannot reasonably estimate possible additional loss or range of additional loss that may arise from this matter or whether this matter will have a material impact on its financial condition or operating results.
The Company is engaged in various other legal actions, claims and proceedings in the ordinary course of business, including claims related to employment related matters, breach of contracts, products liabilities and intellectual property matters resulting from its business activities. The Company does not believe that the ultimate determination of these actions, claims and proceedings will either individually or in the aggregate have a material adverse effect on its consolidated results of operations or financial position.
16. Stockholders' Equity
On April 24, 2015, certain of the Company's stockholders completed the Secondary Offering. The Company did not sell any shares in the Secondary Offering and did not receive any proceeds from the sales of shares by the selling stockholders. Following the Secondary Offering, affiliates of Ares held approximately 60% of the Company's issued and outstanding shares of Common Stock. In accordance with the Registration Rights Agreement among SFSI and its pre-IPO stockholders the selling shareholders paid the underwriting discounts and commissions from their transaction proceeds and the Company incurred approximately $0.9 million of other offering expenses in connection with the Secondary Offering.
124
Smart & Final Stores, Inc. and Subsidiaries
Notes to Consolidated Financial Statements (Continued)
January 1, 2017
17. Earnings Per Share
Basic earnings per share represents net income for the period shares of Common Stock were outstanding, divided by the weighted average number of shares of Common Stock outstanding for the applicable period. Diluted earnings per share represents net income divided by the weighted average number of shares of Common Stock outstanding for the applicable period, inclusive of the effect of dilutive securities such as outstanding stock options.
A reconciliation of the numerators and denominators of the basic and diluted earnings per share calculations is as follows (in thousands, except per share amounts):
| |
Fiscal Year 2016 |
Fiscal Year 2015 |
Fiscal Year 2014 |
|||||||
|---|---|---|---|---|---|---|---|---|---|---|
Net income |
$ | 12,948 | $ | 38,262 | $ | 33,118 | ||||
Weighted average shares outstanding for basic EPS |
72,727,071 | 73,121,964 | 61,455,584 | |||||||
Effect of dilutive securities: |
||||||||||
Assumed exercise of time-based options and vesting of restricted stock |
5,299,088 | 4,019,657 | 2,385,534 | |||||||
Weighted average shares and share equivalents outstanding for diluted EPS |
78,026,159 | 77,141,621 | 63,841,118 | |||||||
Basic earnings per share: |
$ | 0.18 | $ | 0.52 | $ | 0.54 | ||||
Diluted earnings per share: |
$ | 0.17 | $ | 0.50 | $ | 0.52 | ||||
Potentially dilutive securities representing 923,668, 22,158 and 1,596,950 shares of Common Stock for the year ended January 1, 2017, January 3, 2016 and December 28, 2014, respectively, were excluded from the computation of diluted earnings per share because their effect would have been antidilutive.
The Company elected early adoption of ASU 2016-09 in the second quarter of 2016. Under the new guidance, the Company no longer records excess tax benefits in additional paid-in capital (APIC). Instead, the Company recognizes all excess tax benefits ("windfalls") as income tax expense or benefit in the income statement. As a result of including income tax effects from windfalls in income tax expense, the calculation of both basic and diluted earnings per share was affected. Under the treasury stock method used to calculate diluted earnings per share, windfalls are included in the proceeds assumed to be used to purchase shares. Under the new guidance, windfalls are recognized in net income and thus no longer included in assumed proceeds under the treasury stock method. In effect, fewer shares are assumed to be repurchased. This generally increases the dilutive effect of share options and restricted stock.
18. Equity Method Investment
SFSI's wholly owned subsidiary, SF Mexico, is a Mexican holding company that owns 50 percent of SFDN. The other 50 percent of the joint venture is owned by Grupo Calimax S.A. de C.V., an entity comprising the investment interests of a family group who are also the owners of the Calimax grocery store chain in Mexico. At January 1, 2017, this joint venture operated 15 "Smart & Final" format stores in northwestern Mexico, similar in concept to the Company's U.S. stores. This joint venture operates the Mexico stores as a Mexican domestic corporation under the name Smart & Final del
125
Smart & Final Stores, Inc. and Subsidiaries
Notes to Consolidated Financial Statements (Continued)
January 1, 2017
18. Equity Method Investment (Continued)
Noroeste, S.A. de C.V.. The Company's equity method investment in SFDN is approximately $14.4 million and $12.8 million at January 1, 2017 and January 3, 2016, respectively, which is included in "Equity investment in joint venture" in the consolidated balance sheets. Summarized financial information for SFDN is as follows (in thousands):
| |
2016 | 2015 | |||||
|---|---|---|---|---|---|---|---|
Current assets |
$ | 13,148 | $ | 15,943 | |||
Noncurrent assets |
12,211 | 12,028 | |||||
Current liabilities |
9,994 | 13,223 | |||||
Noncurrent liabilities |
2,579 | 5,167 | |||||
| |
Fiscal Year 2016 |
Fiscal Year 2015 |
Fiscal Year 2014 |
|||||||
|---|---|---|---|---|---|---|---|---|---|---|
Sales |
$ | 81,775 | $ | 80,775 | $ | 80,667 | ||||
Gross profit |
14,989 | 15,284 | 14,574 | |||||||
Income from continuing operations |
3,050 | 2,748 | 2,074 | |||||||
Net income |
3,050 | 2,748 | 2,074 | |||||||
Undistributed earnings of SFDN included in the Company's retained earnings were $6.4 million and $4.9 million as of January 1, 2017 and January 3, 2016, respectively.
19. Haggen Transaction
On October 2, 2015, Smart & Final Stores entered into an Asset Purchase Agreement with Haggen whereby Smart & Final Stores agreed to become a "stalking horse bidder" to acquire certain assets, including 28 store leases and related assets, of Haggen. On November 24, 2015 and December 22, 2015, Smart & Final Stores entered into additional Asset Purchase Agreements to acquire five more store leases and related assets of Haggen (all collectively, the "Asset Purchase Agreements" and the transactions, collectively, the "Haggen Transaction"). The initial purchase price for all 33 store leases and related assets was $67.9 million, subject to certain adjustments. The Haggen Transaction closed in December 2015. During the year ended January 1, 2017, the purchase price was increased for additional acquisition-related transaction costs and adjustments of $0.5 million.
The aggregate consideration paid in the Haggen Transaction was as follows (in thousands):
Aggregate purchase price (excluding adjustments) |
$ | 67,827 | ||
Less closing adjustments |
(3,449 | ) | ||
| | | | | |
Cash paid pursuant to the Asset Purchase Agreements |
64,378 | |||
Acquisition related costs |
4,035 | |||
| | | | | |
Total consideration paid |
$ | 68,413 | ||
| | | | | |
| | | | | |
| | | | | |
The cash consideration paid at the closing of the Haggen Transaction was based in part on estimated closing adjustments, including an estimated adjustment (i) related to repairs to roof, building structure and mechanical systems (including HVAC, plumbing and electrical but excluding refrigeration systems) and (ii) reasonably required to bring the properties into compliance with laws applicable to
126
Smart & Final Stores, Inc. and Subsidiaries
Notes to Consolidated Financial Statements (Continued)
January 1, 2017
19. Haggen Transaction (Continued)
conducting a retail grocery business (the "Property Condition Adjustment"). The Property Condition Adjustment, which resulted in a reduction of $3.4 million to the total cash purchase price, is subject to certain caps and floors per property and is subject to adjustment, in each case as set forth in the applicable Asset Purchase Agreement. Any adjustment to the purchase price resulting from final agreement by the parties will be accounted for as an adjustment to the cost of the assets acquired and allocated based on their initial relative fair values.
Furthermore, direct acquisition-related transaction costs totaling $4.0 million, including success, consulting, legal and accounting fees were capitalized in the periods incurred and included in the total cost of acquiring the assets.
Pursuant to the Asset Purchase Agreements, the Company acquired certain leasehold interests in California, as well as associated improvements, fixtures, equipment, permits and licenses of Haggen. Haggen retained inventory, pharmacy assets, prescription files and certain other assets with respect to each of the stores. Prior to closing of the transaction, store operations were ceased and no customer base, employee base, market distribution system, operating rights (other than liquor licenses), physical facilities (other than the store lease and related fixed assets/equipment), or processes were acquired for value. As of the end of the second quarter of 2016, the Company had reopened the 33 stores under its Extra! store format. The Haggen Transaction did not meet the definition of a business acquisition and was accounted for as an asset acquisition using a cost accumulation approach. The total consideration paid was allocated to the individual assets acquired and liabilities assumed on a relative fair value basis. The determination of fair value used to allocate the total consideration paid is based on various factors including quoted market prices, expected future cash flows, current replacement costs, market rate assumptions, useful lives and appropriate discount and growth rates.
The total cost allocated to the assets acquired is as follows (in thousands):
Leasehold interests |
$ | 55,129 | ||
Fixtures and equipment |
11,281 | |||
Transferrable liquor licenses |
2,003 | |||
| | | | | |
Total cost of net assets acquired |
$ | 68,413 | ||
| | | | | |
| | | | | |
| | | | | |
Acquired leasehold interests are finite-lived intangible assets amortized over their estimated useful benefit period which is typically the lease term. Fixtures and equipment are finite-lived tangible assets which are depreciated or amortized over their estimated useful lives. Transferrable liquor licenses are indefinite-lived intangible assets which are evaluated for impairment annually, or more frequently if events or changes in circumstances indicate that the asset might be impaired. See Note 2, Significant Accounting Policies. The transaction has been treated as an asset acquisition for tax purposes.
20. Share Repurchase Program
On August 31, 2015, SFSI's board of directors authorized a share repurchase program of up to $25.0 million, inclusive of commissions, for repurchase of shares of Common Stock, to be financed from cash on hand and executed over a period of time. Repurchases under this share repurchase program commenced on November 20, 2015 and concluded on August 30, 2016.
127
Smart & Final Stores, Inc. and Subsidiaries
Notes to Consolidated Financial Statements (Continued)
January 1, 2017
20. Share Repurchase Program (Continued)
During the third quarter of 2016, SFSI's board of directors authorized an additional share repurchase program to repurchase up to $25.0 million, inclusive of commissions, of shares of Common Stock. Repurchases under this share repurchase program commenced on September 19, 2016 and may occur through August 31, 2017.
The specific timing and amount of the repurchases will be dependent on market conditions, applicable laws and other factors. In connection with the share repurchase program, the Company may acquire shares in open market transactions (including pursuant to plans adopted in accordance with Rule 10b5-1 of the Securities Exchange Act of 1934, as amended) or privately negotiated transactions.
During the year ended January 1, 2017, the Company repurchased 2,398,521 shares of Common Stock through open market purchases for an aggregate cost of $33.5 million. The repurchased shares are no longer deemed issued and outstanding.
21. Quarterly Information (Unaudited)
The following is a summary of the unaudited quarterly financial information for fiscal year 2016 and fiscal year 2015 (in thousands, except per share data):
Smart & Final Stores, Inc. and Subsidiaries
Summary of Quarterly Results of Operations
(Dollars in thousands, except per share amounts)
| |
Fiscal Year 2016 | ||||||||||||
|---|---|---|---|---|---|---|---|---|---|---|---|---|---|
| |
Twelve Weeks Ended March 27, 2016 |
Twelve Weeks Ended June 19, 2016 |
Sixteen Weeks Ended October 9, 2016 |
Twelve Weeks Ended January 1, 2017 |
|||||||||
| |
(Unaudited) |
(Unaudited) |
(Unaudited) |
(Unaudited) |
|||||||||
Net sales |
$ | 908,453 | $ | 1,038,281 | $ | 1,394,429 | $ | 1,000,632 | |||||
Cost of sales, buying and occupancy |
|||||||||||||
|
780,102 | 881,067 | 1,191,400 | 859,722 | |||||||||
| | | | | | | | | | | | | | |
Gross margin |
128,351 | 157,214 | 203,029 | 140,910 | |||||||||
Operating and administrative expenses |
125,082 | 138,819 | 183,402 | 135,183 | |||||||||
| | | | | | | | | | | | | | |
Income from operations |
3,269 | 18,395 | 19,627 | 5,727 | |||||||||
Interest expense, net |
7,311 | 7,441 | 9,977 | 7,925 | |||||||||
Loss on early extinguishment of debt |
— | — | 4,978 | — | |||||||||
Equity in earnings of joint venture |
444 | 284 | 502 | 295 | |||||||||
| | | | | | | | | | | | | | |
(Loss) income before income taxes |
(3,598 | ) | 11,238 | 5,174 | (1,903 | ) | |||||||
Income tax benefit (provision) |
1,960 | (3,432 | ) | 1,859 | 1,650 | ||||||||
| | | | | | | | | | | | | | |
Net (loss) income |
$ | (1,638 | ) | $ | 7,806 | $ | 7,033 | $ | (253 | ) | |||
| | | | | | | | | | | | | | |
| | | | | | | | | | | | | | |
| | | | | | | | | | | | | | |
Basic (loss) earnings per share(a) |
$ | (0.02 | ) | $ | 0.11 | $ | 0.10 | $ | 0.00 | ||||
Diluted (loss) earnings per share(a) |
$ | (0.02 | ) | $ | 0.10 | $ | 0.09 | $ | 0.00 | ||||
Weighted average shares outstanding: |
|||||||||||||
Basic |
73,189,149 | 73,197,064 | 72,601,724 | 71,962,127 | |||||||||
Diluted |
73,189,149 | 78,907,184 | 77,705,917 | 71,962,127 | |||||||||
128
Smart & Final Stores, Inc. and Subsidiaries
Notes to Consolidated Financial Statements (Continued)
January 1, 2017
21. Quarterly Information (Unaudited) (Continued)
| |
Fiscal Year 2015 | ||||||||||||
|---|---|---|---|---|---|---|---|---|---|---|---|---|---|
| |
Twelve Weeks Ended March 22, 2015 |
Twelve Weeks Ended June 14, 2015 |
Sixteen Weeks Ended October 4, 2015 |
Thirteen Weeks Ended January 3, 2016 |
|||||||||
| |
(Unaudited) |
(Unaudited) |
(Unaudited) |
(Unaudited) |
|||||||||
Net sales |
$ | 822,170 | $ | 905,121 | $ | 1,246,063 | $ | 997,626 | |||||
Cost of sales, buying and occupancy |
700,005 | 763,538 | 1,058,824 | 849,753 | |||||||||
| | | | | | | | | | | | | | |
Gross margin |
122,165 | 141,583 | 187,239 | 147,873 | |||||||||
Operating and administrative expenses |
106,951 | 114,131 | 157,040 | 125,873 | |||||||||
| | | | | | | | | | | | | | |
Income from operations |
15,214 | 27,452 | 30,199 | 22,000 | |||||||||
Interest expense, net |
7,998 | 7,676 | 9,333 | 7,680 | |||||||||
Loss on early extinguishment of debt |
— | 2,192 | — | — | |||||||||
Equity in earnings of joint venture |
515 | 392 | 138 | 333 | |||||||||
| | | | | | | | | | | | | | |
Income before income taxes |
7,731 | 17,976 | 21,004 | 14,653 | |||||||||
Income tax provision |
(2,848 | ) | (6,938 | ) | (8,624 | ) | (4,692 | ) | |||||
| | | | | | | | | | | | | | |
Net income |
$ | 4,883 | $ | 11,038 | $ | 12,380 | $ | 9,961 | |||||
| | | | | | | | | | | | | | |
| | | | | | | | | | | | | | |
| | | | | | | | | | | | | | |
Basic earnings per share(a) |
$ | 0.07 | $ | 0.15 | $ | 0.17 | $ | 0.14 | |||||
Diluted earnings per share(a) |
$ | 0.06 | $ | 0.14 | $ | 0.16 | $ | 0.13 | |||||
Weighted average shares outstanding: |
|||||||||||||
Basic |
73,084,282 | 73,090,917 | 73,116,746 | 73,191,829 | |||||||||
Diluted |
76,654,281 | 76,893,066 | 77,404,466 | 77,497,406 | |||||||||
- (a)
- Per share amounts for the quarters and full fiscal years have been calculated separately. Accordingly, weighted quarterly amounts may not add to the fiscal year amounts because of differences in the average common shares outstanding during each period.
129
SCHEDULE I—CONDENSED FINANCIAL INFORMATION OF THE REGISTRANT
Smart & Final Stores, Inc. (Parent Company Only)
CONDENSED BALANCE SHEETS
(Amounts in thousands, except share amounts)
| |
January 1, 2017 |
January 3, 2016 |
|||||
|---|---|---|---|---|---|---|---|
Assets |
|||||||
Current assets: |
|||||||
Cash and cash equivalents |
$ |
23 |
$ |
921 |
|||
Intercompany receivable |
40,986 | 197,109 | |||||
Prepaid expenses |
— | 108 | |||||
Intercompany note |
1,406 | 9,000 | |||||
| | | | | | | | |
Total current assets |
42,415 | 207,138 | |||||
Investment in subsidiaries |
537,064 | 382,740 | |||||
| | | | | | | | |
Total assets |
$ | 579,479 | $ | 589,878 | |||
| | | | | | | | |
| | | | | | | | |
| | | | | | | | |
Liabilities and stockholders' equity |
|||||||
Current liabilities: |
|||||||
Accrued expenses |
$ |
485 |
$ |
432 |
|||
Intercompany payable |
26,745 | 22,875 | |||||
| | | | | | | | |
Total current liabilities |
27,230 | 23,307 | |||||
Commitments and contingencies |
|||||||
Stockholders' equity: |
|||||||
Issued and outstanding shares—72,930,653 and 73,789,608 at January 1, 2017 and January 3, 2016, respectively |
73 | 74 | |||||
Additional paid-in capital |
500,666 | 502,304 | |||||
Retained earnings |
65,093 | 70,181 | |||||
Accumulated other comprehensive loss |
(13,583 | ) | (5,988 | ) | |||
| | | | | | | | |
Total stockholders' equity |
552,249 | 566,571 | |||||
| | | | | | | | |
Total liabilities and stockholders' equity |
$ | 579,479 | $ | 589,878 | |||
| | | | | | | | |
| | | | | | | | |
| | | | | | | | |
See accompanying notes.
130
CONDENSED STATEMENTS OF OPERATIONS AND COMPREHENSIVE INCOME (LOSS)
(Amounts in thousands)
| |
Fiscal Year 2016 |
Fiscal Year 2015 |
Fiscal Year 2014 |
|||||||
|---|---|---|---|---|---|---|---|---|---|---|
Operating and administrative expenses |
$ | 12,903 | $ | 14,182 | $ | 15,892 | ||||
| | | | | | | | | | | |
Loss from operations |
(12,903 | ) | (14,182 | ) | (15,892 | ) | ||||
Intercompany interest income, net |
32 | — | — | |||||||
| | | | | | | | | | | |
Loss before income taxes |
(12,871 | ) | (14,182 | ) | (15,892 | ) | ||||
Income tax benefit |
8,584 | 5,588 | 6,268 | |||||||
| | | | | | | | | | | |
Loss before equity in net income of subsidiaries |
(4,287 | ) | (8,594 | ) | (9,624 | ) | ||||
Equity in net income of subsidiaries, net of tax |
17,235 | 46,856 | 42,742 | |||||||
| | | | | | | | | | | |
Net income |
12,948 | 38,262 | 33,118 | |||||||
Minimum pension obligation adjustment, net of income tax (benefit) expense of $(4,908), $640 and $(21,744), respectively |
(7,332 | ) | 956 | (32,480 | ) | |||||
Derivative instruments: |
||||||||||
Gain (loss), net of income tax (benefit) expense of $(230), $(917) and $(1,670), respectively |
345 | (1,375 | ) | (2,504 | ) | |||||
Reclassification adjustments, net of income tax expense (benefit) of $(10), $(21) and $6, respectively |
15 | (32 | ) | 9 | ||||||
Foreign currency translation |
(623 | ) | (1,120 | ) | (426 | ) | ||||
| | | | | | | | | | | |
Other comprehensive loss |
(7,595 | ) | (1,571 | ) | (35,401 | ) | ||||
| | | | | | | | | | | |
Comprehensive income (loss) |
$ | 5,353 | $ | 36,691 | $ | (2,283 | ) | |||
| | | | | | | | | | | |
| | | | | | | | | | | |
| | | | | | | | | | | |
See accompanying notes.
131
CONDENSED STATEMENTS OF CASH FLOWS
(Amounts in thousands)
| |
Fiscal Year 2016 |
Fiscal Year 2015 |
|||||
|---|---|---|---|---|---|---|---|
Operating activities |
|||||||
Net cash used in operating activities |
$ |
(3,966 |
) |
$ |
(169 |
) |
|
Investing activities |
|||||||
Dividend received from subsidiary |
25,000 | 10,000 | |||||
Issuance of note to subsidiary |
(8,000 | ) | (9,000 | ) | |||
Payments received from subsidiaries on note |
15,594 | — | |||||
| | | | | | | | |
Net cash provided by investing activities |
32,594 | 1,000 | |||||
Financing activities |
|||||||
Proceeds from exercise of stock options |
4,667 | 719 | |||||
Payment of minimum withholding taxes on net share settlement of stock option exercise |
(669 | ) | (694 | ) | |||
Payments of public offering issuance costs |
— | (214 | ) | ||||
Excess tax benefits related to share-based payments |
— | 358 | |||||
Stock repurchases |
(33,524 | ) | (129 | ) | |||
| | | | | | | | |
Net cash (used in) provided by financing activities |
(29,526 | ) | 40 | ||||
| | | | | | | | |
Net (decrease) increase in cash and cash equivalents |
(898 | ) | 871 | ||||
Cash and cash equivalents at beginning of period |
921 | 50 | |||||
| | | | | | | | |
Cash and cash equivalents at end of period |
$ | 23 | $ | 921 | |||
| | | | | | | | |
| | | | | | | | |
| | | | | | | | |
See accompanying notes.
132
SCHEDULE I—CONDENSED FINANCIAL INFORMATION OF THE REGISTRANT
Smart & Final Stores, Inc. (Parent Company Only)
Notes to Condensed Financial Information
Note 1: Basis of presentation
Smart & Final Stores, Inc. (the "Parent Company") is a holding company with no material operations of its own and conducts substantially all of its activities through its direct wholly owned subsidiary, SF CC Intermediate Holdings, Inc. and its subsidiaries and affiliate. The Parent Company was incorporated in October 2012 and became the ultimate parent company of our business in November 2012, pursuant to the acquisition by Ares Management LLC ("Ares Management") on November 15, 2012 (the "Ares Acquisition").
The accompanying condensed financial information includes the accounts of the Parent Company and, on an equity basis, its direct and indirect subsidiaries and affiliate. Accordingly, this condensed financial information has been presented on a "parent-only" basis. Under a parent-only presentation, the Parent Company's investment in subsidiaries is presented under the equity method of accounting.
This parent-only condensed financial information should be read in conjunction with the consolidated financial statements of Smart & Final Stores, Inc. and Subsidiaries (the "Company") included elsewhere herein.
Note 2: Guarantees and restrictions
Smart & Final Stores LLC, a subsidiary of the Company, had $594.9 million of principal amount of long-term debt outstanding under the First Lien Term Loan Facility as of January 3, 2016. Under the terms of the First Lien Term Loan Credit Agreement dated November 15, 2012 (the "Agreement"), SF CC Intermediate Holdings, Inc. guaranteed the payment of all principal and interest. During the third quarter of 2016, the Company amended the First Lien Term Loan Facility (the "Fourth Amendment") to increase the size of the First Lien Term Loan Facility by $30.1 million, from $594.9 million to $625.0 million, and to extend the original November 15, 2019 maturity date to November 15, 2022. Additionally, in connection with the Fourth Amendment, the Eurocurrency Borrowings applicable margin was increased from 3.25% to 3.50%. The debt includes restrictions on the ability of Smart & Final Stores LLC and its subsidiaries to incur additional liens and indebtedness, make investments, loans and advances, pay dividends and enter into sale and lease back transactions, among other restrictions. The restricted net assets of the Company's consolidated subsidiaries is approximately $402.0 million as of January 1, 2017.
133
SMART & FINAL STORES, INC. AND SUBSIDIARIES
SCHEDULE II—VALUATION AND QUALIFYING ACCOUNTS
(In thousands)
| |
Balance as of Beginning of Period |
Charged to Costs and Expenses |
Deductions | Other Changes |
Balance as of End of Period |
|||||||||||
|---|---|---|---|---|---|---|---|---|---|---|---|---|---|---|---|---|
Year ended January 1, 2017 |
||||||||||||||||
Allowance for doubtful accounts |
$ | 454 | $ | — | $ | (22 | ) | $ | 2 | $ | 434 | |||||
Valuation allowance for deferred tax assets |
1,306 | 195 | — | — | 1,501 | |||||||||||
| | | | | | | | | | | | | | | | | |
|
$ | 1,760 | $ | 195 | $ | (22 | ) | $ | 2 | $ | 1,935 | |||||
| | | | | | | | | | | | | | | | | |
| | | | | | | | | | | | | | | | | |
| | | | | | | | | | | | | | | | | |
| |
Balance as of Beginning of Period |
Charged to Costs and Expenses |
Deductions | Other Changes |
Balance as of End of Period |
|||||||||||
|---|---|---|---|---|---|---|---|---|---|---|---|---|---|---|---|---|
Year ended January 3, 2016 |
||||||||||||||||
Allowance for doubtful accounts |
$ | 787 | $ | (298 | ) | $ | (27 | ) | $ | (8 | ) | $ | 454 | |||
Valuation allowance for deferred tax assets |
1,014 | 292 | — | — | 1,306 | |||||||||||
| | | | | | | | | | | | | | | | | |
|
$ | 1,801 | $ | (6 | ) | $ | (27 | ) | $ | (8 | ) | $ | 1,760 | |||
| | | | | | | | | | | | | | | | | |
| | | | | | | | | | | | | | | | | |
| | | | | | | | | | | | | | | | | |
| |
Balance as of Beginning of Period |
Charged to Costs and Expenses |
Deductions | Other Changes |
Balance as of End of Period |
|||||||||||
|---|---|---|---|---|---|---|---|---|---|---|---|---|---|---|---|---|
Year ended December 28, 2014 |
||||||||||||||||
Allowance for doubtful accounts |
$ | 766 | $ | 29 | $ | (10 | ) | $ | 2 | $ | 787 | |||||
Valuation allowance for deferred tax assets |
1,014 | — | — | — | 1,014 | |||||||||||
| | | | | | | | | | | | | | | | | |
|
$ | 1,780 | $ | 29 | $ | (10 | ) | $ | 2 | $ | 1,801 | |||||
| | | | | | | | | | | | | | | | | |
| | | | | | | | | | | | | | | | | |
| | | | | | | | | | | | | | | | | |
134
Item 9. Changes in and Disagreements With Accountants on Accounting and Financial Disclosure.
None.
Item 9A. Controls and Procedures.
Evaluation of Disclosure Controls and Procedures
Our management, with the participation of our Chief Executive Officer ("CEO") and Chief Financial Officer ("CFO"), has evaluated the effectiveness of our disclosure controls and procedures (as such term is defined in Rules 13a-15(e) and 15d-15(e) under the Securities Exchange Act of 1934, as amended (the "Exchange Act")) as of the end of the period covered by this report. Disclosure controls and procedures are designed to provide reasonable assurance that the information required to be disclosed in the reports that we file or submit under the Exchange Act has been appropriately recorded, processed, summarized and reported on a timely basis and are effective in ensuring that such information is accumulated and communicated to the Company's management, including our CEO and CFO, as appropriate to allow timely decisions regarding required disclosure. Based on such evaluation, our CEO and CFO have concluded that, as of January 1, 2017 our disclosure controls and procedures are effective.
Management's Report on Internal Control Over Financial Reporting
Our management is responsible for establishing and maintaining an adequate system of internal control over financial reporting (as defined in Rules 13a15(f) and 15d-15(f) under the Securities Exchange Act of 1934, as amended), pursuant to Rule 13a-15(c) of the Securities Exchange Act of 1934, as amended. Our internal control over financial reporting is designed to provide reasonable assurance regarding the reliability of financial reporting and the preparation of financial statements for external purposes in accordance with accounting principles generally accepted in the United States.
A company's internal control over financial reporting includes policies and procedures that: (i) pertain to the maintenance of records that, in reasonable detail, accurately and fairly reflect the transactions and dispositions of the assets of the company, (ii) provide reasonable assurance that transactions are recorded as necessary to permit preparation of financial statements in accordance with accounting principles generally accepted in the United States, and that receipts and expenditures of the company are being made only in accordance with authorizations of management and directors of the company, and (iii) provide reasonable assurance regarding prevention or timely detection of unauthorized acquisition, use or disposition of the company's assets that could have a material effect on the financial statements.
Because of its inherent limitations, internal control over financial reporting may not prevent or detect misstatements. Therefore, even those systems determined to be effective can provide only reasonable assurance with respect to financial statement preparation and presentation.
Under the supervision and with the participation of our management, we assessed the effectiveness of our internal control over financial reporting as of January 1, 2017, using the criteria set forth by the Committee of Sponsoring Organizations of the Treadway Commission (COSO) in Internal Control—Integrated Framework (2013). Based on its assessment, management has concluded that our internal control over financial reporting was effective as of January 1, 2017. The effectiveness of the Company's internal control over financial reporting has been audited by Ernst & Young LLP, an independent registered public accounting firm, as stated in their report, which can be found in Item 8 of this Report.
135
Changes in Internal Control Over Financial Reporting
There has been no change in our internal control over financial reporting (as defined in Rules 13a-15(f) or 15d-15(f) of the Exchange Act) during our fourth quarter ended January 1, 2017 that has materially affected or is reasonably likely to materially affect our internal control over financial reporting.
None.
136
Item 10. Directors, Executive Officers and Corporate Governance.
The information required by this item will be contained in our definitive Proxy Statement in connection with our 2017 Annual Meeting of Stockholders, which will be filed with the Securities and Exchange Commission within 120 days after the end of our fiscal year ended January 1, 2017 (the "Proxy Statement"), and is incorporated herein by reference.
Item 11. Executive Compensation.
The information required by this Item will be set forth in the Proxy Statement and is incorporated herein by reference, under the captions "Director Compensation," "Executive Compensation" and "Compensation Discussion and Analysis;" provided, however, that the subsection entitled "Executive Compensation—Compensation Committee Report" shall not be deemed to be incorporated by reference.
Item 12. Security Ownership of Certain Beneficial Owners and Management and Related Stockholder Matters.
Securities Authorized for Issuance under Equity Compensation Plans
The following table sets forth information regarding outstanding stock option awards, and shares remaining available for future issuance, under each of the SF CC Holdings, Inc. 2012 Stock Incentive Plan (the "2012 Incentive Plan") and the Smart & Final Stores, Inc. 2014 Stock Incentive Plan (the "2014 Incentive Plan") as of January 1, 2017, the last day of our fiscal year:
Plan Category(1)
|
Number of Securities to Be Issued upon Exercise of Outstanding Options, Warrants and Rights |
Weighted Average Exercise Price of Outstanding Options, Warrants and Rights |
Number of Securities Remaining Available for Future Issuance under Equity Compensation Plans |
|||||||
|---|---|---|---|---|---|---|---|---|---|---|
2012 Incentive Plan |
6,734,839 | $ | 5.36 | 2,838,220 | ||||||
2014 Incentive Plan |
2,691,784 | $ | 12.87 | 1,929,345 | (2) | |||||
| | | | | | | | | | | |
Total |
9,426,623 | $ | 7.44 | 4,767,565 | ||||||
| | | | | | | | | | | |
| | | | | | | | | | | |
| | | | | | | | | | | |
- (1)
- The
2012 Incentive Plan and the 2014 Incentive Plan are the only equity compensation plans that we have adopted, and each of the 2012 Incentive Plan and the 2014
Incentive Plan has been approved by our stockholders.
- (2)
- If any award granted under the 2012 Incentive Plan is canceled, expires or terminates unexercised for any reason, the number of shares underlying such award will be available for grant under the 2014 Incentive Plan.
Additional information required by this Item will be set forth in the Proxy Statement and is incorporated herein by reference.
Item 13. Certain Relationships and Related Transactions, and Director Independence.
The information required by this Item will be set forth in the Proxy Statement and is incorporated herein by reference, under the captions "Certain Relationships and Related Transactions," and "Other Board Information—Director Independence."
137
Item 14. Principal Accounting Fees and Services.
The information required by this Item will be set forth in the Proxy Statement and is incorporated herein by reference.
Item 15. Exhibits, Financial Statement Schedules.
- (a)
- Documents filed as part of this Annual Report:
- (1)
- Financial statements filed in Part II, Item 8 of this Annual Report:
- •
- Report of Independent Registered Public Accounting Firm
- •
- Consolidated Balance Sheets
As of January 1, 2017 and January 3, 2016
- •
- Consolidated Statements of Operation and Comprehensive Income (Loss)
For the years ended January 1, 2017, January 3, 2016 and December 28, 2014
- •
- Consolidated Statements of Stockholders' Equity
For the years ended January 1, 2017, January 3, 2016 and December 28, 2014
- •
- Consolidated Statements of Cash Flows
For the years ended January 1, 2017, January 3, 2016 and December 28, 2014
- •
- Notes to Consolidated Financial Statements
- (2)
- Financial statement schedules as filed in Part II, Item 8 of this Annual Report:
SCHEDULE I—Condensed Information of the Registrant
Smart & Final Stores, Inc. (Parent Company Only)
SCHEDULE II—Valuation and Qualifying Accounts
Smart & Final
Stores, Inc. and Subsidiaries
Valuation and Qualifying Accounts
- (3)
- Exhibits:
| 3.1 | Second Amended and Restated Certificate of Incorporation of Smart & Final Stores, Inc.(1) | ||
3.2 |
Second Amended and Restated Bylaws of Smart & Final Stores, Inc.(1) |
||
4.1 |
Specimen Common Stock Certificate.(2) |
||
10.1 |
SF CC Holdings, Inc. 2012 Stock Incentive Plan.(3) |
||
10.2 |
Form of Non-Qualified Stock Option Agreement pursuant to the SF CC Holdings, Inc. 2012 Stock Incentive Plan.(3) |
||
10.3.1 |
Non-Qualified Stock Option Agreement Pursuant to the SF CC Holdings, Inc. 2012 Stock Incentive Plan, Co-Invest Option (Award No. 12-001), dated as of February 3, 2014, by and between Smart & Final Holdings, Inc. and David G. Hirz.(3) |
138
| 10.3.2 | Non-Qualified Stock Option Agreement Pursuant to the SF CC Holdings, Inc. 2012 Stock Incentive Plan, Co-Invest Option (Award No. 12-002), dated as of February 3, 2014, by and between Smart & Final Holdings, Inc. and David G. Hirz.(3) | ||
10.3.3 |
Third Amendment to Non-Qualified Stock Option Agreement Pursuant to the SF CC Holdings, Inc. 2012 Stock Incentive Plan effective July 20, 2016 (David G. Hirz).(4) |
||
10.4 |
Amended and Restated Employment Agreement, dated as of July 20, 2016, by and among Smart & Final Stores, Inc. and David G. Hirz.(7) |
||
10.5 |
Form of Indemnification Agreement.(8) |
||
10.6.1 |
Revolving Credit Agreement, dated as of November 15, 2012, among SF CC Intermediate Holdings, Inc., Smart & Final Inc., Smart & Final Stores LLC, the Co-Borrowers party thereto on the Closing Date and each Subsidiary of the Borrower that becomes a party thereto as a Co-Borrower pursuant to Section 5.13 thereof, the Lenders party thereto from time to time and Bank of America, N.A., as administrative agent, collateral agent, Swingline Lender, and as issuing bank.(3) |
||
10.6.2 |
Amendment No. 1 to Credit Agreement, dated as of December 19, 2013, among SF CC Intermediate Holdings, Inc., Smart & Final LLC, Smart & Final Stores LLC, the Co-Borrowers, the subsidiaries of the Borrower listed on the signature pages thereto as Guarantors, Bank of America, N.A., as administrative agent for the lenders, collateral agent, Swingline Lender, and as issuing bank and the Consenting Lenders.(3) |
||
10.6.3 |
Amendment No. 2 to the Credit Agreement, dated as of July 19, 2016, among SF CC Intermediate Holdings, Inc., Smart & Final LLC, Smart & Final Stores LLC, the Co-Borrowers party thereto, the Lenders party thereto and Bank of America, N.A., as administrative agent, collateral agent, Swingline Lender, and as issuing bank.(4) |
||
10.7.1 |
First Lien Term Loan Credit Agreement, dated as of November 15, 2012, among SF CC Intermediate Holdings, Inc., Smart & Final, Inc., the Lenders party thereto from time to time and Morgan Stanley Senior Funding, Inc., as administrative agent and as collateral agent.(3) |
||
10.7.2 |
Amendment No. 1 to Credit Agreement, dated as of May 29, 2013, by and among SF CC Intermediate Holdings, Inc., Smart & Final Stores LLC, the other Loan Parties listed on the signature pages thereto, Morgan Stanley Senior Funding, Inc., as administrative agent and collateral agent for the lenders under the Credit Agreement, joint lead arranger and joint book-runner, Deutsche Bank Securities Inc., as co-documentation agent, syndication agent, joint lead arranger and joint book-runner, Merrill Lynch, Pierce, Fenner & Smith Incorporated, as joint lead arranger and joint book-runner, Credit Suisse Securities (USA) LLC, as joint lead arranger and joint book-runner, Credit Suisse AG, as co-documentation agent and each of the undersigned banks and other financial institutions party thereto as lenders and the other Required Lenders party thereto.(3) |
139
| 10.7.3 | Amendment No. 2 to Credit Agreement and Incremental Facility Amendment, dated as of December 19, 2013, by and among SF CC Intermediate Holdings, Inc., Smart & Final Stores LLC, the subsidiaries of the Borrower listed on the signature pages thereto, Morgan Stanley Senior Funding, Inc., as administrative agent for the lenders under the Credit Agreement, as collateral agent for the lenders under the Credit Agreement and as joint lead arranger and joint book-runner, Deutsche Bank Securities Inc., as co-documentation agent, syndication agent, joint lead arranger and joint book-runner, Merrill Lynch, Pierce, Fenner & Smith Incorporated, as joint lead arranger and joint book-runner, Credit Suisse Securities (USA) LLC, as joint lead arranger and joint book-runner, Credit Suisse AG, as co-documentation agent, the Consenting Lenders, and the banks and other financial institutions that are parties thereto as Additional Lenders.(3) | ||
10.7.4 |
Amendment No.3 to Credit Agreement, dated as of May 12, 2015, by and among SF CC Intermediate Holdings, Inc., Smart & Final Stores LLC, the subsidiaries of the Borrower listed on the signature pages thereto, Morgan Stanley Senior Funding, Inc., as administrative agent for the lenders under the Credit Agreement, as collateral agent for the lenders under the Credit Agreement and as joint lead arranger and joint book-runner. Deutsche Bank Securities Inc., as co-documentation agent, syndication agent, joint lead arranger and joint book-runner, Merrill Lynch, Pierce, Fenner & Smith Incorporated, as joint lead arranger and joint book-runner, Credit Suisse Securities (USA) LLC, as joint lead arranger and joint book-runner, Credit Suisse AG, as co-documentation agent, the Consenting Lenders, and the banks and other financial institutions that are parties thereto as Additional Lenders.(5) |
||
10.7.5 |
Amendment No. 4 to Credit Agreement, dated as of September 21, 2016, by and among SF CC Intermediate Holdings, Inc., Smart & Final Stores LLC, the subsidiaries of the Borrower listed on the signature page thereto, Morgan Stanley Senior Funding, Inc., as administrative agent for the lenders under the Credit Agreement, and the Consenting Lenders.(6) |
||
10.8 |
Guarantee and Collateral Agreement, dated as of November 15, 2012, among SF CC Intermediate Holdings, Inc., Smart & Final Stores LLC, each other Subsidiary of Parent identified therein and Morgan Stanley Senior Funding, Inc., as administrative agent and as collateral agent for the Secured Parties.(3) |
||
10.9 |
ABL Guarantee and Collateral Agreement, dated as of November 15, 2012, among SF CC Intermediate Holdings, Inc., Smart & Final Stores LLC, each other Subsidiary of Parent identified therein and Bank of America, N.A., as administrative agent and as collateral agent for the Secured Parties.(3) |
||
10.10.1 |
Joint Venture Agreement, dated as of December 15, 1992, by and between Treviño Hernandez, S. de R.L. de C.V. and Smart & Final, Inc.(3) |
||
10.10.2 |
Product Sales Agreement, dated as of June 12, 2012, by and between Smart & Final Stores LLC and Smart & Final del Noroeste, S.A. de C.V.(3) |
||
10.10.3 |
Trademark Authorized User Agreement, dated as of June 12, 2012, by and between Smart & Final, Inc. and Smart & Final del Noroeste, S.A. de C.V.(3) |
||
10.11 |
Smart & Final Stores, Inc. 2014 Stock Incentive Plan.(1) |
||
10.12 |
Form of Non-Qualified Stock Option Agreement pursuant to the Smart & Final Stores, Inc. 2014 Stock Incentive Plan.(8) |
140
| 10.13.1 | Non-Qualified Stock Option Agreement Pursuant to the Smart & Final Stores, Inc. 2014 Stock Incentive Plan, dated as of September 23, 2014, by and between Smart & Final Stores, Inc. and David G. Hirz.(7) | ||
10.13.2 |
Amendment to Non-Qualified Stock Option Agreement Pursuant to the Smart & Final Stores, Inc. 2014 Stock Incentive Plan, effective July 20, 2016 (David G. Hirz).(4) |
||
10.13.3 |
Amendment to Non-Qualified Stock Option Agreement Pursuant to the Smart & Final Stores, Inc. 2014 Stock Incentive Plan, effective July 20, 2016 (David G. Hirz).(4) |
||
10.13.4 |
Non-Qualified Stock Option Agreement Pursuant to the Smart & Final Stores, Inc. 2014 Stock Incentive Plan, effective September 23, 2014, by and between Smart & Final Stores, Inc. and Richard N. Phegley.(7) |
||
10.13.5 |
Amendment to Non-Qualified Stock Option Agreement Pursuant to the Smart & Final Stores, Inc. 2014 Stock Incentive Plan, effective April 21, 2016 (Martin J. Trtek).(9) |
||
10.14 |
Registration Rights Agreement, dated as of September 29, 2014, by and among Smart & Final Stores, Inc., Ares Corporate Opportunities Fund III, L.P., Ares Corporate Opportunities Fund IV, L.P. and the other stockholders party thereto.(7) |
||
10.15 |
Form of Restricted Stock Agreement pursuant to the Smart & Final Stores, Inc. 2014 Stock Incentive Plan.(8) |
||
10.16 |
Restricted Stock Agreement Pursuant to the Smart & Final Stores, Inc. 2014 Stock Incentive Plan, dated as of September 23, 2014, by and between Smart & Final Stores, Inc. and Richard N. Phegley.(7) |
||
10.17 |
Amendment to Restricted Stock Agreement Pursuant to the Smart & Final Stores, Inc. 2014 Stock Incentive Plan, effective July 20, 2016 (David G. Hirz).(4) |
||
10.18 |
Offer letter, effective January 27, 2014, by and between Smart & Final Stores LLC and Eleanor Hong.(7) |
||
10.19 |
Advisory Agreement, dated as of January 8, 2017, by and between Cash & Carry Stores LLC and Martin J. Trtek.* |
||
10.20 |
Executive Severance Plan, effective July 30, 2009, by and among Smart & Final Stores, Inc. and the Eligible Employees.* |
||
21.1 |
List of subsidiaries.* |
||
23.1 |
Consent of Ernst & Young LLP, independent registered accounting firm.* |
||
31.1 |
Certification of Principal Executive Officer pursuant to Section 302 of the Sarbanes-Oxley Act of 2002.* |
||
31.2 |
Certification of Principal Financial Officer pursuant to Section 302 of the Sarbanes-Oxley Act of 2002.* |
||
32.1 |
Certification of CEO and CFO Pursuant to 18 U.S.C. Section 1350, as Adopted Pursuant to Section 906 of the Sarbanes-Oxley Act of 2002.* |
||
101.INS |
XBRL Instance Document |
||
101.SCH |
XBRL Taxonomy Extension Schema Document |
||
101.CAL |
XBRL Taxonomy Extension Calculation Linkbase Document |
||
101.DEF |
XBRL Taxonomy Extension Definition Linkbase Document |
141
| 101.LAB | XBRL Taxonomy Extension Label Linkbase Document | ||
101.PRE |
XBRL Taxonomy Extension Presentation Linkbase Document |
- *
- Filed
herewith.
- (1)
- Filed
as an exhibit to Amendment No. 5 to the Registrant's Registration Statement on Form S-1 (File No. 333- 196931) filed with the SEC on
September 22, 2014, and incorporated herein by reference.
- (2)
- Filed
as an exhibit to Amendment No. 4 to the Registrant's Registration Statement on Form S-1 (File No. 333-196931) filed with the SEC on
September 11, 2014, and incorporated herein by reference.
- (3)
- Filed
as an exhibit to Amendment No. 1 to the Registrant's Registration Statement on Form S-1 (File No. 333-196931) filed with the SEC on
July 31, 2014, and incorporated herein by reference.
- (4)
- Filed
as an exhibit to the Registrant's Quarterly Report on Form 10-Q filed with the SEC on July 29, 2016 and incorporated herein by reference.
- (5)
- Filed
as an exhibit to the Registrant's Quarterly Report on Form 10-Q filed with the SEC on July 23, 2015 and incorporated herein by reference.
- (6)
- Filed
as an exhibit to the Registrant's Quarterly Report on Form 10-Q filed with the SEC on November 17, 2016 and incorporated herein by reference.
- (7)
- Filed
as an exhibit to the Registrant's Annual Report on Form 10-K filed with the SEC on March 24, 2015, and incorporated herein by reference.
- (8)
- Filed
as an exhibit to Amendment No. 3 to the Registrant's Registration Statement on Form S-1 (File No. 333-196931) filed with the SEC on
September 8, 2014, and incorporated herein by reference.
- (9)
- Filed as an exhibit to the Registrant's Quarterly Report on Form 10-Q filed with the SEC on May 4, 2016 and incorporated herein by reference.
None.
142
Pursuant to the requirements of Section 13 or 15(d) of the Securities Exchange Act of 1934, the registrant has duly caused this report to be signed on its behalf by the undersigned, thereunto duly authorized.
| SMART & FINAL STORES, INC. | ||||
By: |
/s/ DAVID G. HIRZ David G. Hirz President, Chief Executive Officer and Director Date: March 13, 2017 |
|||
Pursuant to the requirements of the Securities Exchange Act of 1934, this report has been signed below by the following persons on behalf of the registrant and in the capacities and on the dates indicated.
|
By: | /s/ DAVID G. HIRZ David G. Hirz President, Chief Executive Officer and Director (principal executive officer) Date: March 13, 2017 |
||
|
By: |
/s/ RICHARD N. PHEGLEY |
||
|
By: |
/s/ RICHARD A. LINK |
||
|
By: |
/s/ DAVID B. KAPLAN |
||
|
By: |
/s/ NORMAN H. AXELROD |
143
|
By: |
/s/ ANDREW A. GIANCAMILLI |
||
|
By: |
/s/ DENNIS T. GIES |
||
|
By: |
/s/ PAUL N. HOPKINS |
||
|
By: |
/s/ ELAINE K. RUBIN |
||
|
By: |
/s/ JOSEPH S. TESORIERO |
||
|
By: |
/s/ KENNETH I. TUCHMAN |
144