Attached files
| file | filename |
|---|---|
| EX-99.3 - EXHIBIT 99.3 - TPI COMPOSITES, INC | exh_993.htm |
| EX-99.1 - EXHIBIT 99.1 - TPI COMPOSITES, INC | exh_991.htm |
| 8-K - FORM 8-K - TPI COMPOSITES, INC | f8k_031617.htm |
EXHIBIT 99.2

Q4 2016 Earnings Call March 17 , 2017
March 17 , 2017 2 Legal Disclaimer This presentation contains forward - looking statements within the meaning of the federal securities laws . All statements other than statements of historical facts contained in this presentation, including statements regarding our future results of operations and financial position, business strategy and plans and objectives of management for future operations, are forward - looking statements . In many cases, you can identify forward - looking statements by terms such as “may,” “should,” “expects,” “plans,” “anticipates,” “could,” “intends,” “target,” “projects,” “contemplates,” “believes,” “estimates,” “predicts,” “potential” or “continue” or the negative of these terms or other similar words . Forward - looking statements contained in this presentation include, but are not limited to, statements about (i) growth of the wind energy market and our addressable market ; (ii) the potential impact of GE’s pending acquisition of LM Wind Power upon our business ; (iii) our future financial performance, including our net sales, cost of goods sold, gross profit or gross margin, operating expenses, ability to generate positive cash flow, and ability to achieve or maintain profitability ; (iv) the sufficiency of our cash and cash equivalents to meet our liquidity needs ; (v) our ability to attract and retain customers for our products, and to optimize product pricing ; (vi) competition from other wind blade manufacturers ; (vii) the discovery of defects in our products ; (viii) our ability to successfully expand in our existing markets and into new international markets ; (ix) worldwide economic conditions and their impact on customer demand ; (x) our ability to effectively manage our growth strategy and future expenses ; (xi) our ability to maintain, protect and enhance our intellectual property ; (xii) our ability to comply with existing, modified or new laws and regulations applying to our business ; and (xiii) the attraction and retention of qualified employees and key personnel . These forward - looking statements are only predictions . These statements relate to future events or our future financial performance and involve known and unknown risks, uncertainties and other important factors that may cause our actual results, levels of activity, performance or achievements to materially differ from any future results, levels of activity, performance or achievements expressed or implied by these forward - looking statements . Because forward - looking statements are inherently subject to risks and uncertainties, some of which cannot be predicted or quantified, you should not rely on these forward - looking statements as guarantees of future events . Further information on the factors, risks and uncertainties that could affect our financial results and the forward - looking statements in this presentation are included in our filings with the Securities and Exchange Commission and will be included in subsequent periodic and current reports we make with the Securities and Exchange Commission from time to time, including in our Annual Report on Form 10 - K for the year ended December 31 , 2016 . The forward - looking statements in this presentation represent our views as of the date of this presentation . We anticipate that subsequent events and developments will cause our views to change . However, while we may elect to update these forward - looking statements at some point in the future, we undertake no obligation to update any forward - looking statement to reflect events or developments after the date on which the statement is made or to reflect the occurrence of unanticipated events except to the extent required by applicable law . You should, therefore, not rely on these forward - looking statements as representing our views as of any date after the date of this presentation . Our forward - looking statements do not reflect the potential impact of any future acquisitions, mergers, dispositions, joint ventures, or investments we may make . This presentation includes unaudited non - GAAP financial measures including total billings , EBITDA, adjusted EBITDA , net debt and free cash flow . We define total billings as the total amounts we have invoiced our customers for products and services for which we are entitled to payment under the terms of our long term supply agreements or other contractual agreements . We define EBITDA as net income (loss) attributable to the Company plus interest expense ( including losses on the extinguishment of debt and net of interest income), income taxes and depreciation and amortization . We define Adjusted EBITDA as EBITDA plus any share - based compensation expense, plus or minus any gains or losses from foreign currency remeasurement . We define net debt as the total principal amount of debt outstanding less unrestricted cash and equivalents . We define free cash flow as net cash flow generated from operating activities less capital expenditures . We present non - GAAP measures when we believe that the additional information is useful and meaningful to investors . Non - GAAP financial measures do not have any standardized meaning and are therefore unlikely to be comparable to similar measures presented by other companies . The presentation of non - GAAP financial measures is not intended to be a substitute for, and should not be considered in isolation from, the financial measures reported in accordance with GAAP . See the appendix for the reconciliations of certain non - GAAP financial measures to the comparable GAAP measures . This presentation also contains estimates and other information concerning our industry that are based on industry publications, surveys and forecasts . This information involves a number of assumptions and limitations, and we have not independently verified the accuracy or completeness of the information .
March 17 , 2017 3 Agenda • 2016 Highlights • Industry Update • Q4 and Full Year 2016 Financial Highlights • Guidance for 2017 • Q&A • Appendix - Non - GAAP Information
March 17 , 2017 4 2016 Highlights

March 17 , 2017 5 2016 Highlights Operating results and year - over - year increases compared to the fourth quarter 2015 and full year 2015 • Net sales were up 28. 9 % for the year • Total billings were up 27.4% to $ 764.4 million for the year ahead our guided range of $750 to $760 million. • Net income for the year increased to $13.8 million versus $7.7 million in 2015 • Adjusted EBITDA for the year increased to $66.2 million • Adjusted EBITDA margin for the year was up 210bps to 8.8 % Signed an agreement to build composite bus bodies for Proterra, a leading supplier of zero - emission electric buses 2016 Highlights and Recent Company News $586 $755 $179 $186 $0 $200 $400 $600 $800 2015 2016 Q4'15 Q4'16 GAAP Net Sales ($ in millions) Sets 1,609 2,154 527 541 Est. MW 3,595 4,920 1,191 1,234 Dedicated lines (1) 34 44 34 44 Lines installed (2) 30 33 30 33 (1) Number of manufacturing lines dedicated to our customers under long - term supply agreements (2) Number of manufacturing lines installed that are either in operation , startup or transition

March 17 , 2017 6 Existing Contracts Provide for up to $ 3.9 Billion in Revenue through 2023 2017 2018 2019 2020 2021 2022 2023 Iowa Turkey Mexico China Note: Our contracts with some of our customers are subject to termination or reduction on short notice, generally with substantial penalties, and contain liquidated damages pr ovisions, which may require us to make unanticipated payments to our customers or our customers to make payments to us. (1) As of March 16 , 2017. The chart depicts the term of the longest contract in each location. Long - term supply agreements provide for estimated minimum aggregate volume commitments from our customers of $2.6 billion and encourage our customers to purchase additional volume up to, in the aggregate, an estimated total contract value of up to $ 3.9 billion through the end of 2023 (1) Long - term Supply Agreements

March 17 , 2017 7 Source: Lazard Levelized Cost of Energy Analysis (version 10.0). Declining LCOE Allows Wind Energy to be More Competitive with Conventional Power Generation Global Onshore Wind LCOE Over Time ($/MWh) $169 $148 $92 $95 $95 $81 $77 $62 $101 $99 $50 $48 $45 $37 $32 $32 $0 $63 $125 $188 $250 2009 2010 2011 2012 2013 2014 2015 2016 Onshore wind LCOE Mean Onshore wind LCOE Range Unsubsidized Levelized Cost of Power Generation Ranges by Technology ($/MWh)
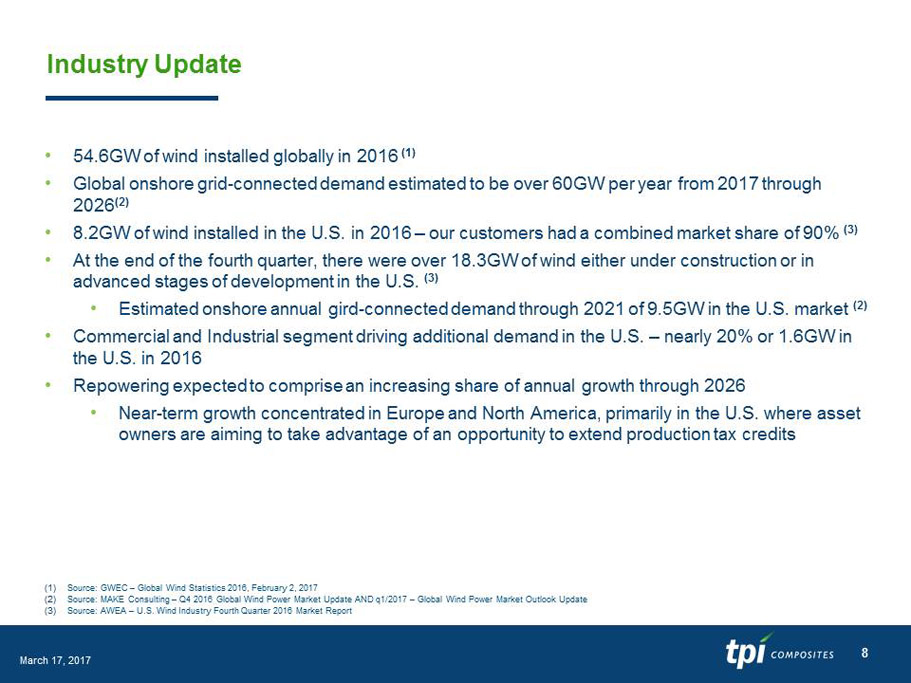
March 17 , 2017 8 Industry Update • 5 4.6 GW of wind installed globally in 2016 ( 1) • Global onshore grid - connected demand estimated to be over 60 GW per year from 2017 through 202 6 ( 2 ) • 8.2GW of wind installed in the U.S. in 2016 – our customers had a combined market share of 90 % (3) • At the end of the fourth quarter, there were over 18.3GW of wind either under construction or in advanced stages of development in the U.S. (3 ) • Estimated onshore annual gird - connected demand through 2021 of 9.5GW in the U.S. market ( 2) • Commercial and Industrial segment driving additional demand in the U.S. – nearly 20% or 1.6GW in the U.S. in 2016 • Repowering expected to comprise an increasing share of annual growth through 2026 • Near - term growth concentrated in Europe and North America, primarily in the U.S. where asset owners are aiming to take advantage of an opportunity to extend production tax credits (1) Source: GWEC – Global Wind Statistics 2016, February 2, 2017 (2) Source: MAKE Consulting – Q4 2016 Global Wind Power Market Update AND q1/2017 – Global Wind Power Market Outlook Update (3) Source: AWEA – U.S. Wind Industry Fourth Quarter 2016 Market Report

March 17 , 2017 9 Q4 and Full Year 2016 Financial Highlights
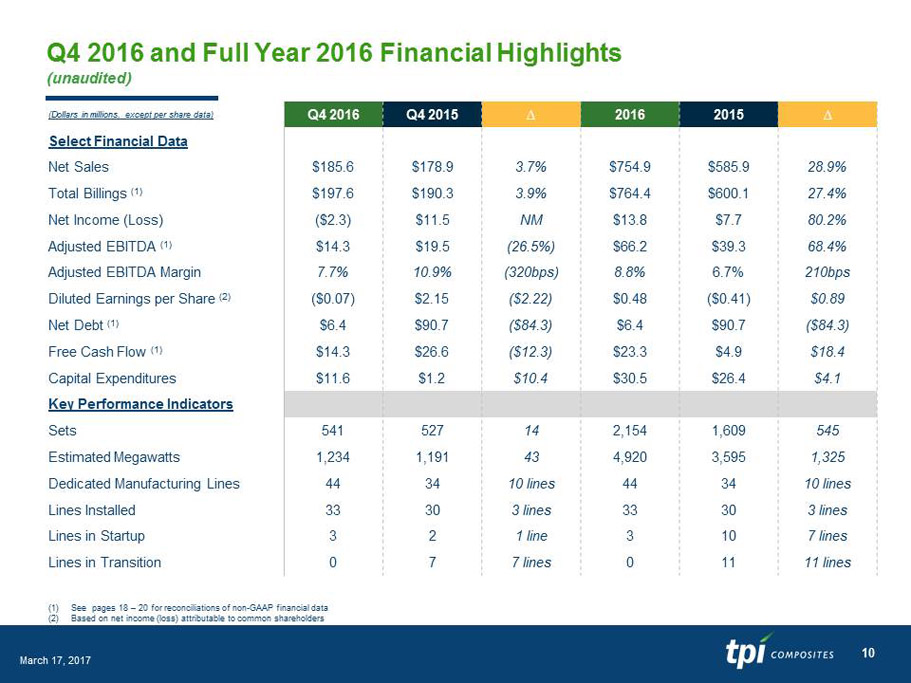
March 17 , 2017 10 Q4 2016 and Full Year 2016 Financial Highlights (unaudited) (Dollars in millions, except per share data) Q4 2016 Q4 2015 ∆ 2016 2015 ∆ Select Financial Data Net Sales $185.6 $178.9 3.7% $754.9 $585.9 28. 9 % Total Billings (1) $197.6 $190.3 3.9% $764.4 $600.1 27.4% Net Income (Loss) ($2.3) $11.5 NM $13.8 $7.7 80.2% Adjusted EBITDA (1) $14.3 $19.5 ( 26. 5 %) $66.2 $39.3 68.4% Adjusted EBITDA Margin 7.7% 10.9% (320bps) 8.8% 6.7% 210bps Diluted Earnings per Share ( 2) ($ 0. 0 7 ) $2.15 ($2.22) $0.48 ($0.41) $0.89 Net Debt (1) $6.4 $90.7 ( $84.3 ) $6.4 $90.7 ( $84.3 ) Free Cash Flow (1) $14.3 $26.6 ($12.3) $23.3 $4.9 $18.4 Capital Expenditures $11.6 $1.2 $10.4 $30.5 $26.4 $4.1 Key Performance Indicators Sets 541 527 14 2,154 1,609 545 Estimated Megawatts 1,234 1,191 43 4,920 3,595 1,325 Dedicated Manufacturing Lines 44 34 10 lines 44 34 10 lines Lines Installed 33 30 3 lines 33 30 3 lines Lines in Startup 3 2 1 line 3 10 7 lines Lines in Transition 0 7 7 lines 0 11 11 lines (1) See pages 1 8 – 2 0 for reconciliations of non - GAAP financial data (2) Based on n et income (loss) attributable to common shareholders

March 17 , 2017 11 Income Statement Summary (unaudited) (1) See pages 18 – 20 for reconciliations of Non - GAAP financial data 2016 2015 $ % 2016 2015 $ % (in thousands, except per share amounts) Net sales 754,877$ 585,852$ 169,025$ 28.9% 185,574$ 178,946$ 6,628$ 3.7% Gross profit 77,005$ 41,745$ 35,260$ 84.5% 19,047$ 21,209$ (2,162)$ -10.2% Gross profit % 10.2% 7.1% 310 bps 10.3% 11.9% -160 bps General and administrative expenses 33,892$ 14,126$ 19,766$ 139.9% 9,738$ 4,596$ 5,142$ 111.9% General and administrative expenses % 4.5% 2.4% 210 bps 5.2% 2.6% 260 bps Income from operations 43,113$ 27,619$ 15,494$ 56.1% 9,309$ 16,613$ (7,304)$ -44.0% Income before income taxes 20,837$ 11,659$ 9,178$ 78.7% 174$ 12,719$ (12,545)$ -98.6% Net income (loss) 13,842$ 7,682$ 6,160$ 80.2% (2,256)$ 11,476$ (13,732)$ -119.7% Net income attributable to preferred shareholders 5,471$ 9,423$ (3,952)$ -41.9% -$ 2,356$ (2,356)$ -100.0% Net income (loss) attributable to common shareholders 8,371$ (1,741)$ 10,112$ NM (2,256)$ 9,120$ (11,376)$ -124.7% Weighted-average common shares outstanding: Basic 17,530 4,238 33,737 4,238 Diluted 17,616 4,238 33,737 4,244 Net income (loss) per common share: Basic 0.48$ (0.41)$ 0.89$ (0.07)$ 2.15$ (2.22)$ Diluted 0.48$ (0.41)$ 0.89$ (0.07)$ 2.15$ (2.22)$ Non-GAAP Metrics Total billings (1) 764,424$ 600,107$ 164,317$ 27.4% 197,645$ 190,270$ 7,375$ 3.9% EBITDA (1) 55,491$ 37,479$ 18,012$ 48.1% 12,492$ 19,323$ (6,831)$ -35.4% EBITDA margin 7.4% 6.4% 100 bps 6.7% 10.8% -410 bps Adjusted EBITDA (1) 66,150$ 39,281$ 26,869$ 68.4% 14,334$ 19,504$ (5,170)$ -26.5% Adjusted EBITDA margin 8.8% 6.7% 210 bps 7.7% 10.9% -320 bps Year Ended December 31, Change Three Months Ended December 31, Change
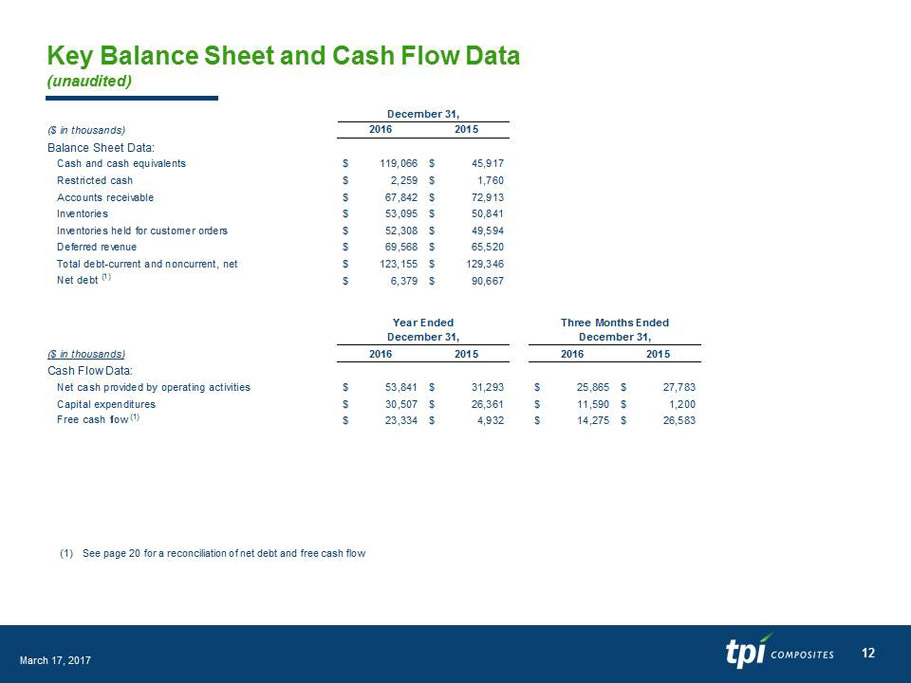
March 17 , 2017 12 Key Balance Sheet and Cash Flow Data (unaudited) (1) See page 20 for a reconciliation of net debt and free cash flow ($ in thousands) 2016 2015 Balance Sheet Data: Cash and cash equivalents 119,066$ 45,917$ Restricted cash 2,259$ 1,760$ Accounts receivable 67,842$ 72,913$ Inventories 53,095$ 50,841$ Inventories held for customer orders 52,308$ 49,594$ Deferred revenue 69,568$ 65,520$ Total debt-current and noncurrent, net 123,155$ 129,346$ Net debt (1) 6,379$ 90,667$ ($ in thousands) 2016 2015 2016 2015 Cash Flow Data: Net cash provided by operating activities 53,841$ 31,293$ 25,865$ 27,783$ Capital expenditures 30,507$ 26,361$ 11,590$ 1,200$ Free cash flow (1) 23,334$ 4,932$ 14,275$ 26,583$ December 31, Year Ended December 31, Three Months Ended December 31,

March 17 , 2017 13 $8 $14 $39 $66 $20 $14 2013 2014 2015 2016 Q4'15 Q4'16 $221 $363 $600 $764 $190 $198 2013 2014 2015 2016 Q4'15 Q4'16 648 966 1,609 2,154 527 541 2013 2014 2015 2016 Q4'15 Q4'16 Strong Financial Performance Trend Continues (unaudited) Note: Dollars in millions Net Sales Total Billings Estimated MW 1,173 2,029 3,595 $215 $321 $586 $755 $179 $186 2013 2014 2015 2016 Q4'15 Q4'16 Adjusted EBITDA Volume (# Sets) 4,920 1,234 1,191 Adjusted EBITDA Margin 3.9% 4.2% 6.7% 8.8% 7.7% 10.9%
March 17 , 2017 14 2017 Guidance

March 17 , 2017 15 Guidance for 2017 (1) We have not reconciled our expected Total billings to expected net sales as calculated under GAAP because we have not yet finalized calculations necessary to provide the reconciliation, including expected change in deferred revenue, and as such the reconciliation is not possible wit hou t unreasonable efforts. Total Billings (1) $ 930M to $ 950M Sets 2,800 to 2,900 Average Selling Price per Blade $ 10 5 K to $110K Estimated Megawatts 6,350 to 6,600 Dedicated Manufacturing Lines at Year - end 2017 52 to 56 Total Lines Installed and in Operation during 2017 40 Lines in Transition 5 Lines in Startup 15 Startup and Transition Costs $ 30M to $ 40M Capital Expenditures $ 7 5 M to $ 85M Effective Tax Rate 20% to 25% Depreciation and Amortization $ 23M to $ 25M Interest Expense $ 11M to $ 12M Income Tax Expense $ 8M to $ 10M Share - based Compensation $9.5M to $10.5M

March 17 , 2017 16 Q&A

March 17 , 2017 17 Appendix - Non - GAAP Information This presentation includes unaudited non - GAAP financial measures including total billings, EBITDA, adjusted EBITDA, net debt and free cash flow . We define total billings as the total amounts we have invoiced our customers for products and services for which we are entitled to payment under the terms of our long - term supply agreements or other contractual agreements . We define EBITDA as net income (loss) attributable to the Company plus interest expense ( including losses on the extinguishment of debt and net of interest income ), income taxes, and depreciation and amortization . We define adjusted EBITDA as EBITDA plus any share - based compensation expense, plus or minus any gains or losses from foreign currency remeasurement . We define net debt as the total principal amount of debt outstanding less unrestricted cash and equivalents . We define free cash flow as net cash flow generated from operating activities less capital expenditures . We present non - GAAP measures when we believe that the additional information is useful and meaningful to investors . Non - GAAP financial measures do not have any standardized meaning and are therefore unlikely to be comparable to similar measures presented by other companies . The presentation of non - GAAP financial measures is not intended to be a substitute for, and should not be considered in isolation from, the financial measures reported in accordance with GAAP . See below for a reconciliation of certain non - GAAP financial measures to the comparable GAAP measures .
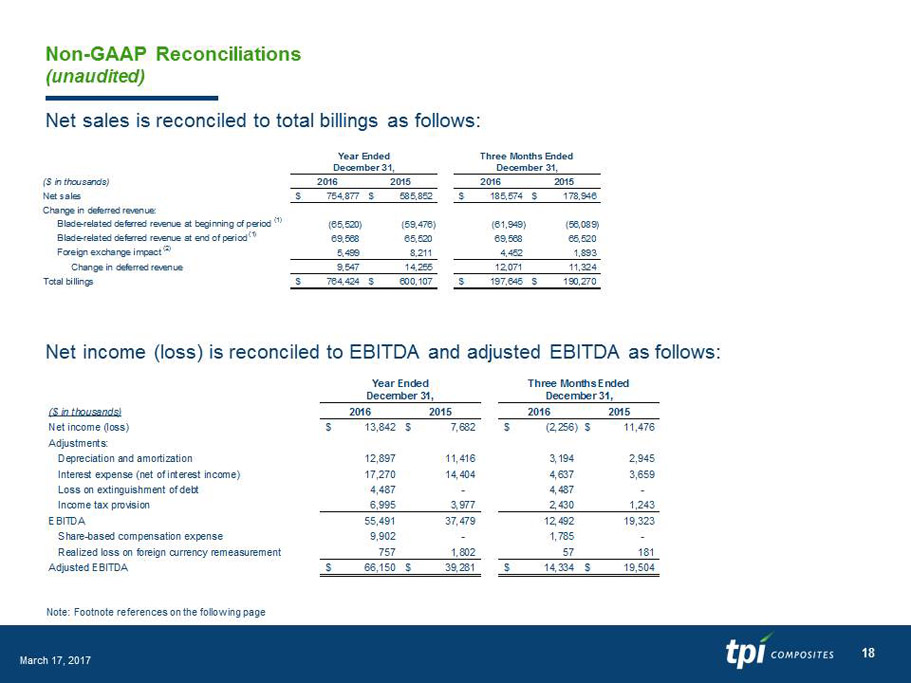
March 17 , 2017 18 Non - GAAP Reconciliations (unaudited) Note: Footnote references on the following page Net sales is reconciled to total billings as follows: Net income (loss) is reconciled to EBITDA and adjusted EBITDA as follows: ($ in thousands) 2016 2015 2016 2015 Net sales 754,877$ 585,852$ 185,574$ 178,946$ Change in deferred revenue: Blade-related deferred revenue at beginning of period (1) (65,520) (59,476) (61,949) (56,089) Blade-related deferred revenue at end of period (1) 69,568 65,520 69,568 65,520 Foreign exchange impact (2) 5,499 8,211 4,452 1,893 Change in deferred revenue 9,547 14,255 12,071 11,324 Total billings 764,424$ 600,107$ 197,645$ 190,270$ Three Months Ended December 31, Year Ended December 31, ($ in thousands) 2016 2015 2016 2015 Net income (loss) 13,842$ 7,682$ (2,256)$ 11,476$ Adjustments: Depreciation and amortization 12,897 11,416 3,194 2,945 Interest expense (net of interest income) 17,270 14,404 4,637 3,659 Loss on extinguishment of debt 4,487 - 4,487 - Income tax provision 6,995 3,977 2,430 1,243 EBITDA 55,491 37,479 12,492 19,323 Share-based compensation expense 9,902 - 1,785 - Realized loss on foreign currency remeasurement 757 1,802 57 181 Adjusted EBITDA 66,150$ 39,281$ 14,334$ 19,504$ Three Months Ended December 31, Year Ended December 31,

March 17 , 2017 19 Non - GAAP Reconciliations (continued) (unaudited) (1) Total billings is reconciled using the blade - related deferred revenue amounts at the beginning and the end of the period as follows : (2) Represents the effect of the difference in the exchange rate used by our various foreign subsidiaries on the invoice date versus the exchange rate used at the period - end balance sheet date. ($ in thousands) 2016 2015 2016 2015 Blade-related deferred revenue at beginning of period 65,520$ 59,476$ 61,949$ 56,089$ Non-blade related deferred revenue at beginning of period - - - - Total current and noncurrent deferred revenue at beginning of period 65,520$ 59,476$ 61,949$ 56,089$ Blade-related deferred revenue at end of period 69,568$ 65,520$ 69,568$ 65,520$ Non-blade related deferred revenue at end of period - - - - Total current and noncurrent deferred revenue at end of period 69,568$ 65,520$ 69,568$ 65,520$ Three Months Ended December 31, Year Ended December 31,

March 17 , 2017 20 Non - GAAP Reconciliations (continued) (unaudited) Net debt is reconciled as follows: Free cash flow is reconciled as follows: ($ in thousands) 2016 2015 Total debt, net of debt issuance costs and discount 123,155$ 129,346$ Add debt issuance costs 2,290 4,220 Add discount on debt - 3,018 Less cash and cash equivalents (119,066) (45,917) Net debt 6,379$ 90,667$ December 31, ($ in thousands) 2016 2015 2016 2015 Net cash provided by operating activities 53,841$ 31,293$ 25,865$ 27,783$ Less capital expenditures (30,507) (26,361) (11,590) (1,200) Free cash flow 23,334$ 4,932$ 14,275$ 26,583$ Three Months Ended December 31, Year Ended December 31,

21