Attached files
|
Ohio Valley Banc Corp
|
|
Annual Report 2016
|
|
Community
FIRST
|
|
A Message
from
Management
|
Dear Neighbors and Friends,
IMPACT!
The people of YOUR company strove to make a direct and positive impact on their communities in 2016. Together, we expanded our reach with the addition of John Jones and the Milton Banking Company Division. With the merger, we added an experienced crew of community bankers and two new market areas. The bank's assets as of end of year stand proud at approximately $950 million.
And as we grew, we kept loyal to our roots by donating more than $440,000 to local organizations. Fortunately, we weren't satisfied with just handing over checks. We rolled up our sleeves and pitched in with over 2,600 volunteer hours clocked. We did the things that make this place a little more special like building homes with Habitat for Humanity, cleaning and making repairs at Field of Hope, gathering supplies to help those displaced by the flooding in West Virginia, and brightening faces at local senior centers.
We think Donna Casey of Apple Grove said it best. "A bank that is friendly and helpful. OVB not only takes care of its customers, but helps in their communities..."
We think Donna Casey of Apple Grove said it best. "A bank that is friendly and helpful. OVB not only takes care of its customers, but helps in their communities..."
"Community First" isn't just something we say. We put community at the heart of all that we do. Now others are starting to take notice and join the call.
In March 2016, Brent Eastman joined our Board of Directors. Mr. Eastman is President and Co-Owner of Ohio Valley Supermarkets. You may recall that his father, Bob Eastman, dedicated many years to the very same board.
Our newest director brought with him the business knowledge that was passed to him by his father and enhances it with his own penchant for modern tactics in marketing and strategy. And while it's true that he is an outstanding local business leader, he also serves as a role model to our employees by example. His own devoted service to the Gallia County Agricultural Society and Gallia County Jr. Fair Board sets the bar for our bankers as they strive to do more for their hometowns.
As we close the books on 2016, join us in saying "Congratulations" to the friendly professionals at Loan Central who in 2016 celebrated 20 years in business. We also honor the bankers of the OVB Main Office on the office's 55th anniversary as well as the OVB Jackson Pike Office on their 40th anniversary and our OVB Jackson and OVB Waverly offices on their respective 25th anniversaries. Special mention goes out to OVB Barboursville and the OVB Athens Loan Office upon completion of their first full year.
We look forward to 2017, Ohio Valley Bank's 145th year in business. We also thank you, our shareholders, for your timeless support of this American success story.
Sincerely,
|
Jeffrey E. Smith
|
Thomas E. Wiseman
|
|
Chairman of the Board
|
President and CEO
|
|
Ohio Valley Banc Corp.
|
Ohio Valley Banc Corp.
|
1
Merger
A NEW PARTNER…
On Friday, August 5, 2016, the Milton Banking Company
merged with Ohio Valley Bank, becoming a new division
of OVB. Over the weekend, MBC accounts and loans
were converted to Ohio Valley Bank's computer systems.
Pictured above are a few of the 52 employees
who in just 3 days put in 755 hours to
make the switchover happen as seamlessly as
possible so that it was business as usual by
Monday morning.
To put that in perspective, if one person did
that work alone, he or she would have to
work full-time for 19 weeks (roughly five months)
to achieve what we did as a team in one weekend!
John Jones and Tom Wiseman (pictured right)
were interviewed by University of Rio Grande
President Dr. Michelle Johnston about the
experience. You can find the interview on
the Rio Grande Cable Access channel on YouTube.
2
...A CONTINUING MISSION
"Perhaps the biggest change is
that we will have access to the
resources of Ohio Valley Bank,
allowing us more time
for community service,
more options for lending, and
more internet banking
functionality,"
|
-John Jones to his customers
|
|
just prior to the merger
|
3
2016 Year in Review by the Numbers
|
$441,438
|
Dollars given to local charities, schools, and
organizations through donations and sponsorships.
|
|
|
|
|
2,625.5
|
Hours Ohio Valley Bank and Loan Central
employees actively volunteered in their communities during bank hours.
|
|
|
|
|
940,322
|
Transactions conducted at Ohio Valley Bank offices.
|
| $4,096,380.31 | Deposited via OVB Mobile Deposit with cell phones and tablets. |
|
|
|
| 154,735 | Secure statements and notices delivered electronically. |
| 5 | New, conveniently located offices as part of the Milton Banking Company Division. |
4
|
4,744
|
Times customers trusted
Loan Central with their tax needs.
|
|
|
|
|
$284,552.03
|
Paid in rewards to customers using their
OVB Credit Card for purchases.
|
|
|
|
|
$686,069.19
|
Cash back earned by OVB Rewards Checking
accountholders.
|
| 92,000 | Bills paid via free OVB Online Bill Pay |
|
|
|
| 20 | Locally themed debit cards that give back
to the community.
|
| 4 in every 5 |
Ohio Valley Bank customers say they are extremely likely to recommend
OVB to a friend, according to customer surveys.
|
5
|
OVBC DIRECTORS
Jeffrey E. Smith
Chairman, Ohio Valley Banc Corp. and Ohio Valley Bank
Thomas E. Wiseman
President & CEO, Ohio Valley Banc Corp. and Ohio Valley Bank
David W. Thomas, Lead Director
Former Chief Examiner, Ohio Division of Financial Institutions
bank supervision and regulation
Steven B. Chapman
Retired Certified Public Accountant
Anna P. Barnitz
Treasurer & CFO, Bob's Market & Greenhouses, Inc.
wholesale horticultural products and retail landscaping stores
Brent A. Saunders
Chairman of the Board, Holzer Health System
Attorney, Halliday, Sheets & Saunders
healthcare
Harold A. Howe
Self-employed, Real Estate Investment and Rental Property
Brent R. Eastman
President and Co-owner, Ohio Valley Supermarkets
Partner, Eastman Enterprises
John G. Jones
President, MBC, Ohio Valley Bank
Kimberly A. Canady, JD
Owner, Canady Farms, LLC
agricultural products and agronomy services
Edward J. Robbins
President & CEO, Ohio Valley Veneer, Inc.
wood harvesting, processing and manufacturing of dry lumber & flooring in Ohio, Kentucky, and Tennessee
|
OVBC OFFICERS
EXECUTIVE OFFICERS
Jeffrey E. Smith, Chairman of the Board
Thomas E. Wiseman, President and Chief Executive Officer
Larry E. Miller, II, Chief Operating Officer and Secretary
Katrinka V. Hart-Harris, Senior Vice President
Scott W. Shockey, Senior Vice President & Chief Financial Officer
Bryan F. Stepp, Vice President
Mario P. Liberatore, Vice President
Cherie A. Elliott, Vice President
Jennifer L. Osborne, Vice President
Tom R. Shepherd, Vice President
Frank W. Davison, Vice President
Bryan W. Martin, Vice President
David K. Nadler, Vice President
Ryan J. Jones, Vice President
Paula W. Clay, Assistant Secretary
Cindy H. Johnston, Assistant Secretary
LOAN CENTRAL OFFICERS
Larry E. Miller, II Chairman of the Board Cherie A. Elliott President
Timothy R. Brumfield Vice President & Secretary
Manager, Gallipolis Office
John J. Holtzapfel Compliance Officer & Manager, Wheelersburg Office
T. Joe Wilson Manager, Waverly Office
Joseph I. Jones Manager, South Point Office
Deborah G. Moore Manager, Jackson Office
Gregory G. Kauffman Manager, Chillicothe Office
WEST VIRGINIA ADVISORY BOARD
Mario P. Liberatore Stephen L. Johnson
Richard L. Handley E. Allen Bell
Trenton M. Stover John A. Myers
|
|
OHIO VALLEY BANK DIRECTORS
Jeffrey E. Smith
Thomas E. Wiseman
David W. Thomas
Harold A. Howe
Steven B. Chapman
DIRECTORS EMERITUS
W. Lowell Call
James L. Dailey
Robert E. Daniel
Barney A. Molnar
|
Anna P. Barnitz
Brent A. Saunders
Brent R. Eastman
John G. Jones
Kimberly A. Canady, JD
Edward J. Robbins
C. Leon Saunders
Wendell B. Thomas
Lannes C. Williamson
|
6
|
OHIO VALLEY BANK OFFICERS
EXECUTIVE OFFICERS
Jeffrey E. Smith
Thomas E. Wiseman
Larry E. Miller, II
Katrinka V. Hart-Harris
Scott W. Shockey
Chief Financial Officer
Mario P. Liberatore
John G. Jones
SENIOR VICE PRESIDENTS
Jennifer L. Osborne
Tom R. Shepherd
Bryan F. Stepp
Frank W. Davison
Bryan W. Martin
David K. Nadler
Ryan J. Jones
VICE PRESIDENTS
Richard D. Scott
Patrick H. Tackett
Marilyn E. Kearns
Fred K. Mavis Business
Rick A. Swain
Bryna S. Butler
Tamela D. LeMaster
Christopher L. Preston
Gregory A. Phillips
Diana L. Parks
John A. Anderson
Kyla R. Carpenter
Allen W. Elliott
E. Kate Cox
Brian E. Hall
Daniel T. Roush
Gary L. Crabtree
Adam D. Massie
Shawn R. Siders
Jay D. Miller
|
Chairman of the Board
President and Chief Executive Officer
Chief Operating Officer and Secretary
Executive Vice President, Director of
WV Operations & Special Projects
Executive Vice President,
Chief Financial Officer
President, OVB West Virginia
President, MBC
SENIOR VICE PRESIDENTS
Retail Lending
Chief Deposit Officer
Chief Lending Officer
Financial Bank Group
Chief Administrative Officer
Chief Risk/Credit Officer
Chief Operating Officer - MBC
VICE PRESIDENTS
Trust
Corporate Banking
Director of Human Resources
Business Development Officer
Western Division Branch Manager
Corporate Communications
Branch Administration/CRM
Branch Administration
Business Development
Consumer Lending
Internal Audit Liaison
Loan Operations
Director of Marketing
Director of Customer Support
Director of Cultural Enhancement
Corporate Banking
Senior Compliance Officer
Lender/Business Development Officer
Lender/Business Development Officer
Senior Credit Officer
Business Development Officer
|
VICE PRESIDENTS
Melissa P. Wooten
Christopher S. Petro
Kimberly R. Williams
Paula W. Clay
Cindy H. Johnston
Joe J. Wyant
Brenda G. Henson
Gabriel U. Stewart
Randall L. Hammond
Barbara A. Patrick
Richard P. Speirs
Lori A. Edwards
Raymond G. Polcyn
Stephanie L. Stover
Brandon O. Huff
Anita M. Good
Angela S. Kinnaird
Laura F. Conger
Lonnie L. Hunt
Ruth R. Murphy
Terri M. Camden
Shelly N. Boothe
ASSISTANT CASHIERS
Lois J. Scherer
Linda K. Roe
Glen P. Arrowood, II
Michelle L. Hammond
Patricia G. Hapney
Anthony W. Staley
Jon C. Jones
Daniel F. Short
Pamela K. Smith
William F. Richards
|
Shareholder Relations Manager & Trust Officer
Comptroller
Systems Officer
Assistant Secretary
Assistant Secretary
Region Manager Jackson County
Manager Deposit Services
Chief Information Security Officer
Security Officer/Loss Prevention
BSA Officer/Loss Prevention
Facilities Manager
Secondary Market Manager
Manager of Loan Production Office
Retail Lending Operations Manager
Systems Administrator
Regional Branch Administrator
Customer Support Manager
Mortgage Loan Processing Clerk
Lender/Business Development Officer
Lender/Business Development Officer
Human Resources Officer
Business Development Officer
EFT Officer
Lead Cultural Engineer & Talent Development Specialist
Manager of Indirect Lending
Escrow Supervisor/Lead Mortgage Loan Documentation Clerk
Retail Lending & Personal Banker
Product Development Business Sales & Support
Western Cabell Region Manager
Meigs Region Manager
Eastern Cabell Region Manager
Advertising Manager
|
7
|
OHIO VALLEY BANK
Athens, Ohio
Loan Office - 2097 East State St. Suite C
Gallia County, Ohio
Main Office - 420 Third Ave.
Mini Bank - 437 Fourth Ave.
Inside Walmart - 2145 Eastern Ave.
Jackson Pike - 3035 State Route 160
Inside Holzer - 100 Jackson Pike
Loan Office - Walmart Plaza, 2145 Eastern Ave.
Rio Grande - 27 North College Ave.
Jackson County, Ohio
Upper Main - 740 East Main St.
Downtown - 400 East Main St.
Oak Hill - 116 Jackson St.
Wellston - 123 South Ohio Ave.
Mt. Sterling, Ohio
255 Yankeetown St.
New Holland, Ohio
25 North Main St.
Pomeroy, Ohio
Inside Save-a-Lot - 700 W. Main St.
Waverly, Ohio
507 West Emmitt Ave.
Barboursville, West Virginia
6431 East State Route 60
Milton, West Virginia
280 East Main St.
Point Pleasant, West Virginia
328 Viand St.
|
LOAN CENTRAL
Chillicothe, Ohio
1080 N. Bridge Street, Unit 43
Gallipolis, Ohio
2145 Eastern Avenue
Jackson, Ohio
345 Main Street
South Point, Ohio
348 County Road 410
Waverly, Ohio
505 West Emmitt Avenue
Wheelersburg, Ohio
326 Center Street
|
8
ohio valley banc corp.
annual report 2016
financials
SELECTED FINANCIAL DATA
|
|
Years Ended December 31
|
|||||||||||||||||||
|
|
2016
|
2015
|
2014
|
2013
|
2012
|
|||||||||||||||
|
(dollars in thousands, except share and per share data)
|
||||||||||||||||||||
|
|
||||||||||||||||||||
|
SUMMARY OF OPERATIONS:
|
||||||||||||||||||||
|
|
||||||||||||||||||||
|
Total interest income
|
$
|
39,348
|
$
|
36,334
|
$
|
36,355
|
$
|
35,958
|
$
|
39,001
|
||||||||||
|
Total interest expense
|
3,022
|
2,839
|
2,875
|
3,573
|
6,346
|
|||||||||||||||
|
Net interest income
|
36,326
|
33,495
|
33,480
|
32,385
|
32,655
|
|||||||||||||||
|
Provision for loan losses
|
2,826
|
1,090
|
2,787
|
477
|
1,583
|
|||||||||||||||
|
Total other income
|
8,239
|
8,597
|
9,793
|
8,518
|
8,483
|
|||||||||||||||
|
Total other expenses
|
32,899
|
29,619
|
29,293
|
29,375
|
29,741
|
|||||||||||||||
|
Income before income taxes
|
8,840
|
11,383
|
11,193
|
11,051
|
9,814
|
|||||||||||||||
|
Income taxes
|
1,920
|
2,809
|
3,120
|
2,939
|
2,762
|
|||||||||||||||
|
Net income
|
6,920
|
8,574
|
8,073
|
8,112
|
7,052
|
|||||||||||||||
|
|
||||||||||||||||||||
|
PER SHARE DATA:
|
||||||||||||||||||||
|
|
||||||||||||||||||||
|
Earnings per share
|
$
|
1.59
|
$
|
2.08
|
$
|
1.97
|
$
|
2.00
|
$
|
1.75
|
||||||||||
|
Cash dividends declared per share
|
$
|
0.82
|
$
|
0.89
|
$
|
0.84
|
$
|
0.73
|
$
|
1.09
|
||||||||||
|
Book value per share
|
$
|
22.40
|
$
|
21.97
|
$
|
20.94
|
$
|
19.62
|
$
|
18.66
|
||||||||||
|
Weighted average number of common shares outstanding
|
4,351,748
|
4,117,675
|
4,099,194
|
4,064,083
|
4,030,322
|
|||||||||||||||
|
|
||||||||||||||||||||
|
AVERAGE BALANCE SUMMARY:
|
||||||||||||||||||||
|
|
||||||||||||||||||||
|
Total loans
|
$
|
644,690
|
$
|
589,953
|
$
|
581,690
|
$
|
555,314
|
$
|
570,166
|
||||||||||
|
Securities(1)
|
196,389
|
188,754
|
170,314
|
175,809
|
202,413
|
|||||||||||||||
|
Deposits
|
749,054
|
694,218
|
673,410
|
664,061
|
705,111
|
|||||||||||||||
|
Other borrowed funds(2)
|
39,553
|
32,878
|
31,225
|
26,572
|
33,538
|
|||||||||||||||
|
Shareholders' equity
|
98,133
|
88,720
|
83,887
|
77,989
|
74,031
|
|||||||||||||||
|
Total assets
|
899,209
|
828,444
|
799,448
|
779,113
|
822,573
|
|||||||||||||||
|
|
||||||||||||||||||||
|
PERIOD END BALANCES:
|
||||||||||||||||||||
|
|
||||||||||||||||||||
|
Total loans
|
$
|
734,901
|
$
|
585,752
|
$
|
594,768
|
$
|
566,319
|
$
|
558,288
|
||||||||||
|
Securities(1)
|
151,985
|
155,900
|
137,274
|
133,173
|
159,791
|
|||||||||||||||
|
Deposits
|
790,452
|
660,746
|
646,830
|
628,877
|
655,064
|
|||||||||||||||
|
Shareholders' equity
|
104,528
|
90,470
|
86,216
|
80,419
|
75,820
|
|||||||||||||||
|
Total assets
|
954,640
|
796,285
|
778,668
|
747,368
|
769,223
|
|||||||||||||||
|
|
||||||||||||||||||||
|
KEY RATIOS:
|
||||||||||||||||||||
|
|
||||||||||||||||||||
|
Return on average assets
|
0.77
|
%
|
1.03
|
%
|
1.01
|
%
|
1.04
|
%
|
0.86
|
%
|
||||||||||
|
Return on average equity
|
7.05
|
%
|
9.66
|
%
|
9.62
|
%
|
10.40
|
%
|
9.53
|
%
|
||||||||||
|
Dividend payout ratio
|
51.79
|
%
|
42.74
|
%
|
42.62
|
%
|
36.56
|
%
|
62.29
|
%
|
||||||||||
|
Average equity to average assets
|
10.91
|
%
|
10.71
|
%
|
10.49
|
%
|
10.01
|
%
|
9.00
|
%
|
||||||||||
(1) Securities include interest-bearing deposits with banks and restricted investments in bank stocks.
(2) Other borrowed funds include subordinated debentures.
9
CONSOLIDATED STATEMENTS OF CONDITION
|
|
As of December 31
|
|||||||
|
|
2016
|
2015
|
||||||
|
(dollars in thousands, except share and per share data)
|
||||||||
|
|
||||||||
|
Assets
|
||||||||
|
|
||||||||
|
Cash and noninterest-bearing deposits with banks
|
$
|
12,512
|
$
|
9,475
|
||||
|
Interest-bearing deposits with banks
|
27,654
|
36,055
|
||||||
|
Total cash and cash equivalents
|
40,166
|
45,530
|
||||||
|
|
||||||||
|
Certificates of deposit in financial institutions
|
1,670
|
1,715
|
||||||
|
Securities available for sale
|
96,490
|
91,651
|
||||||
|
Securities held to maturity (estimated fair value: 2016 - $19,171; 2015 - $20,790)
|
18,665
|
19,903
|
||||||
|
Restricted investments in bank stocks
|
7,506
|
6,576
|
||||||
|
|
||||||||
|
Total loans
|
734,901
|
585,752
|
||||||
|
Less: Allowance for loan losses
|
(7,699
|
)
|
(6,648
|
)
|
||||
|
Net loans
|
727,202
|
579,104
|
||||||
|
|
||||||||
|
Premises and equipment, net
|
12,783
|
10,404
|
||||||
|
Other real estate owned
|
2,129
|
2,358
|
||||||
|
Accrued interest receivable
|
2,315
|
1,819
|
||||||
|
Goodwill
|
7,801
|
1,267
|
||||||
|
Other intangible assets, net
|
670
|
----
|
||||||
|
Bank owned life insurance and annuity assets
|
29,349
|
28,352
|
||||||
|
Other assets
|
7,894
|
7,606
|
||||||
|
Total assets
|
$
|
954,640
|
$
|
796,285
|
||||
|
|
||||||||
|
Liabilities
|
||||||||
|
|
||||||||
|
Noninterest-bearing deposits
|
$
|
209,576
|
$
|
176,499
|
||||
|
Interest-bearing deposits
|
580,876
|
484,247
|
||||||
|
Total deposits
|
790,452
|
660,746
|
||||||
|
|
||||||||
|
Other borrowed funds
|
37,085
|
23,946
|
||||||
|
Subordinated debentures
|
8,500
|
8,500
|
||||||
|
Accrued liabilities
|
14,075
|
12,623
|
||||||
|
Total liabilities
|
850,112
|
705,815
|
||||||
|
|
||||||||
|
Commitments and Contingent Liabilities (See Note L)
|
----
|
----
|
||||||
|
|
||||||||
|
Shareholders' Equity
|
||||||||
|
|
||||||||
|
Common stock ($1.00 stated value per share, 10,000,000 shares authorized;
2016 - 5,325,504 shares issued; 2015 - 4,777,414 shares issued
|
5,326
|
4,777
|
||||||
|
Additional paid-in capital
|
46,788
|
35,318
|
||||||
|
Retained earnings
|
69,117
|
65,782
|
||||||
|
Accumulated other comprehensive income (loss)
|
(991
|
)
|
305
|
|||||
|
Treasury stock, at cost (659,739 shares)
|
(15,712
|
)
|
(15,712
|
)
|
||||
|
Total shareholders' equity
|
104,528
|
90,470
|
||||||
|
Total liabilities and shareholders' equity
|
$
|
954,640
|
$
|
796,285
|
||||
See accompanying notes to consolidated financial statements
10
CONSOLIDATED STATEMENTS OF INCOME
|
For the years ended December 31
|
2016
|
2015
|
2014
|
|||||||||
|
(dollars in thousands, except per share data)
|
||||||||||||
|
|
||||||||||||
|
Interest and dividend income:
|
||||||||||||
|
Loans, including fees
|
$
|
36,266
|
$
|
33,481
|
$
|
33,635
|
||||||
|
Securities:
|
||||||||||||
|
Taxable
|
1,961
|
1,849
|
1,717
|
|||||||||
|
Tax exempt
|
445
|
526
|
555
|
|||||||||
|
Dividends
|
302
|
293
|
312
|
|||||||||
|
Other interest
|
374
|
185
|
136
|
|||||||||
|
|
39,348
|
36,334
|
36,355
|
|||||||||
|
Interest expense:
|
||||||||||||
|
Deposits
|
2,154
|
2,191
|
2,236
|
|||||||||
|
Other borrowed funds
|
664
|
478
|
474
|
|||||||||
|
Subordinated debentures
|
204
|
170
|
165
|
|||||||||
|
|
3,022
|
2,839
|
2,875
|
|||||||||
|
Net interest income
|
36,326
|
33,495
|
33,480
|
|||||||||
|
Provision for loan losses
|
2,826
|
1,090
|
2,787
|
|||||||||
|
Net interest income after provision for loan losses
|
33,500
|
32,405
|
30,693
|
|||||||||
|
|
||||||||||||
|
Noninterest income:
|
||||||||||||
|
Service charges on deposit accounts
|
1,977
|
1,573
|
1,627
|
|||||||||
|
Trust fees
|
227
|
221
|
223
|
|||||||||
|
Income from bank owned life insurance and annuity assets
|
725
|
681
|
672
|
|||||||||
|
Mortgage banking income
|
227
|
242
|
228
|
|||||||||
|
Electronic refund check / deposit fees
|
2,048
|
2,371
|
3,133
|
|||||||||
|
Debit / credit card interchange income
|
2,594
|
2,399
|
2,174
|
|||||||||
|
Gain (loss) on other real estate owned
|
(467
|
)
|
99
|
113
|
||||||||
|
Gain on sale of securities
|
----
|
163
|
----
|
|||||||||
|
Gain on sale of ProAlliance Corporation
|
----
|
----
|
810
|
|||||||||
|
Other
|
908
|
848
|
813
|
|||||||||
|
|
8,239
|
8,597
|
9,793
|
|||||||||
|
Noninterest expense:
|
||||||||||||
|
Salaries and employee benefits
|
18,874
|
17,498
|
17,878
|
|||||||||
|
Occupancy
|
1,846
|
1,599
|
1,585
|
|||||||||
|
Furniture and equipment
|
922
|
801
|
757
|
|||||||||
|
Professional fees
|
1,362
|
1,375
|
1,151
|
|||||||||
|
Marketing expense
|
915
|
860
|
1,004
|
|||||||||
|
FDIC insurance
|
455
|
583
|
483
|
|||||||||
|
Data processing
|
1,455
|
1,259
|
1,127
|
|||||||||
|
Software
|
1,316
|
1,123
|
1,014
|
|||||||||
|
Foreclosed assets
|
357
|
347
|
185
|
|||||||||
|
Amortization of intangibles
|
68
|
----
|
----
|
|||||||||
|
Merger related expenses
|
930
|
----
|
----
|
|||||||||
|
Other
|
4,399
|
4,174
|
4,109
|
|||||||||
|
|
32,899
|
29,619
|
29,293
|
|||||||||
|
Income before income taxes
|
8,840
|
11,383
|
11,193
|
|||||||||
|
Provision for income taxes
|
1,920
|
2,809
|
3,120
|
|||||||||
|
NET INCOME
|
$
|
6,920
|
$
|
8,574
|
$
|
8,073
|
||||||
|
Earnings per share
|
$
|
1.59
|
$
|
2.08
|
$
|
1.97
|
||||||
See accompanying notes to consolidated financial statements
11
CONSOLIDATED STATEMENTS OF
COMPREHENSIVE INCOME
|
For the years ended December 31
|
2016
|
2015
|
2014
|
|||||||||
|
(dollars in thousands)
|
||||||||||||
|
|
||||||||||||
|
NET INCOME
|
$
|
6,920
|
$
|
8,574
|
$
|
8,073
|
||||||
|
Other comprehensive income (loss):
|
||||||||||||
|
Change in unrealized gain (loss) on available for sale securities
|
(1,963
|
)
|
(830
|
)
|
1,077
|
|||||||
|
Reclassification adjustment for realized (gains)
|
----
|
(163
|
)
|
----
|
||||||||
|
(1,963
|
)
|
(993
|
)
|
1,077
|
||||||||
|
Related tax (expense) benefit
|
667
|
338
|
(366
|
)
|
||||||||
|
Total other comprehensive income (loss), net of tax
|
(1,296
|
)
|
(655
|
)
|
711
|
|||||||
|
Total comprehensive income
|
$
|
5,624
|
$
|
7,919
|
$
|
8,784
|
||||||
See accompanying notes to consolidated financial statements
12
Consolidated Statements of Changes in
Shareholders' Equity
|
For the years ended December 31, 2016, 2015, and 2014
|
||||||||||||||||||||||||
|
(dollars in thousands, except share and per share data)
|
||||||||||||||||||||||||
|
|
Common
Stock
|
Additional Paid-In Capital
|
Retained
Earnings
|
Accumulated Other Comprehensive Income
|
Treasury
Stock
|
Total Shareholders' Equity
|
||||||||||||||||||
|
Balances at January 1, 2014
|
$
|
4,758
|
$
|
34,883
|
$
|
56,241
|
$
|
249
|
$
|
(15,712
|
)
|
$
|
80,419
|
|||||||||||
|
Net income
|
----
|
----
|
8,073
|
----
|
----
|
8,073
|
||||||||||||||||||
|
Other comprehensive
income (loss), net
|
----
|
----
|
----
|
711
|
----
|
711
|
||||||||||||||||||
|
Common stock issued to ESOP,
14,618 shares
|
15
|
336
|
----
|
----
|
----
|
351
|
||||||||||||||||||
|
Common stock issued through
dividend reinvestment,
4,304 shares
|
4
|
99
|
----
|
----
|
----
|
103
|
||||||||||||||||||
|
Cash dividends, $.84 per share
|
----
|
----
|
(3,441
|
)
|
----
|
----
|
(3,441
|
)
|
||||||||||||||||
|
Balances at December 31, 2014
|
4,777
|
35,318
|
60,873
|
960
|
(15,712
|
)
|
86,216
|
|||||||||||||||||
|
Net income
|
----
|
----
|
8,574
|
----
|
----
|
8,574
|
||||||||||||||||||
|
Other comprehensive
income (loss), net
|
----
|
----
|
----
|
(655
|
)
|
----
|
(655
|
)
|
||||||||||||||||
|
Cash dividends, $.89 per share
|
----
|
----
|
(3,665
|
)
|
----
|
----
|
(3,665
|
)
|
||||||||||||||||
|
Balances at December 31, 2015
|
4,777
|
35,318
|
65,782
|
305
|
(15,712
|
)
|
90,470
|
|||||||||||||||||
|
Net income
|
----
|
----
|
6,920
|
----
|
----
|
6,920
|
||||||||||||||||||
|
Other comprehensive
income (loss), net
|
----
|
----
|
----
|
(1,296
|
)
|
----
|
(1,296
|
)
|
||||||||||||||||
|
Common stock issued to ESOP,
24,572 shares
|
25
|
550
|
----
|
----
|
----
|
575
|
||||||||||||||||||
|
Acquisition – Milton Bancorp, Inc.
523,518 shares
|
524
|
10,920
|
----
|
----
|
----
|
11,444
|
||||||||||||||||||
|
Cash dividends, $.82 per share
|
----
|
----
|
(3,585
|
)
|
----
|
----
|
(3,585
|
)
|
||||||||||||||||
|
Balances at December 31, 2016
|
$
|
5,326
|
$
|
46,788
|
$
|
69,117
|
$
|
(991
|
)
|
$
|
(15,712
|
)
|
$
|
104,528
|
||||||||||
See accompanying notes to consolidated financial statements
13
Consolidated Statements of Cash Flows
|
For the years ended December 31
|
2016
|
2015
|
2014
|
|||||||||
|
(dollars in thousands)
|
||||||||||||
|
|
||||||||||||
|
Cash flows from operating activities:
|
||||||||||||
|
Net income
|
$
|
6,920
|
$
|
8,574
|
$
|
8,073
|
||||||
|
Adjustments to reconcile net income to net cash provided by operating activities:
|
||||||||||||
|
Depreciation of premises and equipment
|
1,126
|
872
|
795
|
|||||||||
|
Net (accretion) of purchase accounting adjustments
|
(255
|
)
|
----
|
----
|
||||||||
|
Net amortization of securities
|
407
|
432
|
732
|
|||||||||
|
Net realized (gain) on sale of securities
|
----
|
(163
|
)
|
----
|
||||||||
|
Proceeds from sale of loans in secondary market
|
6,455
|
6,746
|
4,286
|
|||||||||
|
Loans disbursed for sale in secondary market
|
(6,228
|
)
|
(6,504
|
)
|
(4,058
|
)
|
||||||
|
Amortization of mortgage servicing rights
|
79
|
93
|
77
|
|||||||||
|
Gain on sale of loans
|
(306
|
)
|
(335
|
)
|
(305
|
)
|
||||||
|
Amortization of intangible assets
|
68
|
----
|
----
|
|||||||||
|
Deferred tax (benefit) expense
|
(725
|
)
|
591
|
(517
|
)
|
|||||||
|
Provision for loan losses
|
2,826
|
1,090
|
2,787
|
|||||||||
|
Common stock issued to ESOP
|
575
|
----
|
351
|
|||||||||
|
Earnings on bank owned life insurance and annuity assets
|
(725
|
)
|
(681
|
)
|
(672
|
)
|
||||||
|
Gain on sale of ProAlliance Corporation
|
----
|
----
|
(810
|
)
|
||||||||
|
(Gain) loss on sale of other real estate owned
|
(22
|
)
|
(99
|
)
|
(25
|
)
|
||||||
|
(Appreciation) write-down of other real estate owned
|
489
|
----
|
(88
|
)
|
||||||||
|
Change in accrued interest receivable
|
(496
|
)
|
(13
|
)
|
95
|
|||||||
|
Change in accrued liabilities
|
1,461
|
473
|
1,326
|
|||||||||
|
Change in other assets
|
1,717
|
(678
|
)
|
(366
|
)
|
|||||||
|
Net cash provided by operating activities
|
13,366
|
10,398
|
11,681
|
|||||||||
|
|
||||||||||||
|
Cash flows from investing activities:
|
||||||||||||
|
Net cash acquired from Milton Bancorp, Inc. acquisition
|
1,770
|
----
|
----
|
|||||||||
|
Proceeds from sales of securities available for sale
|
----
|
10,550
|
----
|
|||||||||
|
Proceeds from maturities of securities available for sale
|
18,591
|
15,085
|
15,318
|
|||||||||
|
Purchases of securities available for sale
|
(20,256
|
)
|
(33,251
|
)
|
(16,077
|
)
|
||||||
|
Proceeds from maturities of securities held to maturity
|
3,089
|
3,482
|
827
|
|||||||||
|
Purchases of securities held to maturity
|
(1,528
|
)
|
(626
|
)
|
(885
|
)
|
||||||
|
Proceeds from maturities of certificates of deposit in financial institutions
|
490
|
245
|
----
|
|||||||||
|
Purchases of certificates of deposit in financial institutions
|
(445
|
)
|
(980
|
)
|
(980
|
)
|
||||||
|
Proceeds from restricted investments in bank stocks
|
----
|
----
|
1,200
|
|||||||||
|
Purchases of restricted investments in bank stocks
|
(566
|
)
|
----
|
----
|
||||||||
|
Net change in loans
|
(38,299
|
)
|
5,049
|
(29,936
|
)
|
|||||||
|
Proceeds from sale of other real estate owned
|
403
|
458
|
821
|
|||||||||
|
Proceeds from sale of ProAlliance Corporation
|
----
|
----
|
810
|
|||||||||
|
Purchases of premises and equipment
|
(1,683
|
)
|
(1,950
|
)
|
(985
|
)
|
||||||
|
Purchases of bank owned life insurance and annuity assets
|
----
|
(3,000
|
)
|
----
|
||||||||
|
Net cash (used in) investing activities
|
(38,434
|
)
|
(4,938
|
)
|
(29,887
|
)
|
||||||
|
|
||||||||||||
|
Cash flows from financing activities:
|
||||||||||||
|
Change in deposits
|
10,150
|
13,916
|
17,953
|
|||||||||
|
Proceeds from common stock through dividend reinvestment
|
----
|
----
|
103
|
|||||||||
|
Cash dividends
|
(3,585
|
)
|
(3,665
|
)
|
(3,441
|
)
|
||||||
|
Proceeds from Federal Home Loan Bank borrowings
|
11,102
|
400
|
7,575
|
|||||||||
|
Repayment of Federal Home Loan Bank borrowings
|
(1,883
|
)
|
(1,671
|
)
|
(1,612
|
)
|
||||||
|
Change in other long-term borrowings
|
3,899
|
----
|
----
|
|||||||||
|
Change in other short-term borrowings
|
21
|
113
|
261
|
|||||||||
|
Net cash provided by financing activities
|
19,704
|
9,093
|
20,839
|
|||||||||
|
|
||||||||||||
|
Cash and cash equivalents:
|
||||||||||||
|
Change in cash and cash equivalents
|
(5,364
|
)
|
14,553
|
2,633
|
||||||||
|
Cash and cash equivalents at beginning of year
|
45,530
|
30,977
|
28,344
|
|||||||||
|
Cash and cash equivalents at end of year
|
$
|
40,166
|
$
|
45,530
|
$
|
30,977
|
||||||
|
Supplemental disclosure:
|
||||||||||||
|
Cash paid for interest
|
$
|
2,930
|
$
|
2,784
|
$
|
3,274
|
||||||
|
Cash paid for income taxes
|
1,725
|
2,450
|
3,567
|
|||||||||
|
Transfers from loans to other real estate owned
|
957
|
1,381
|
879
|
|||||||||
|
Other real estate owned sales financed by The Ohio Valley Bank Company
|
316
|
189
|
390
|
|||||||||
|
Issuance of common stock for Milton Bancorp, Inc. acquisition
|
11,444
|
----
|
----
|
|||||||||
|
Net assets acquired from Milton Bancorp, Inc. acquisition, excluding cash and cash equivalents.
|
3,140
|
----
|
----
|
|||||||||
See accompanying notes to consolidated financial statements
14
NOTES TO THE CONSOLIDATED FINANCIAL STATEMENTS
Amounts are in thousands, except share and per share data.
Note A - Summary of Significant Accounting Policies
Description of Business: Ohio Valley Banc Corp. ("Ohio Valley") is a financial holding company registered under the Bank Holding Company Act of 1956. Ohio Valley has one banking subsidiary, The Ohio Valley Bank Company (the "Bank"), an Ohio state-chartered bank that is a member of the Federal Reserve Bank and is regulated primarily by the Ohio Division of Financial Institutions and the Federal Reserve Board. Ohio Valley also has a subsidiary that engages in consumer lending to individuals with higher credit risk history, Loan Central, Inc.; a subsidiary insurance agency that facilitates the receipts of insurance commissions, Ohio Valley Financial Services Agency, LLC; and a limited purpose property and casualty insurance company, OVBC Captive, Inc. Ohio Valley and its subsidiaries are collectively referred to as the "Company."
The Company provides a full range of commercial and retail banking services from 25 offices located in southeastern Ohio and western West Virginia. It accepts deposits in checking, savings, time and money market accounts and makes personal, commercial, floor plan, student, construction and real estate loans. Substantially all loans are secured by specific items of collateral, including business assets, consumer assets, and commercial and residential real estate. Commercial loans are expected to be repaid from cash flow from business operations. The Company also offers safe deposit boxes, wire transfers and other standard banking products and services. The Bank's deposits are insured by the Federal Deposit Insurance Corporation. In addition to accepting deposits and making loans, the Bank invests in U. S. Government and agency obligations, interest-bearing deposits in other financial institutions and investments permitted by applicable law.
The Bank's trust department provides a wide variety of fiduciary services for trusts, estates and benefit plans and also provides investment and security services as an agent for its customers.
Principles of Consolidation: The consolidated financial statements include the accounts of Ohio Valley and its wholly-owned subsidiaries, the Bank, Loan Central, Inc., Ohio Valley Financial Services Agency, LLC, and OVBC Captive, Inc. All material intercompany accounts and transactions have been eliminated.
Industry Segment Information: Internal financial information is primarily reported and aggregated in two lines of business, banking and consumer finance.
Use of Estimates: To prepare financial statements in conformity with accounting principles generally accepted in the U.S., management makes estimates and assumptions based on available information. These estimates and assumptions affect the amounts reported in the financial statements and the disclosures provided, and actual results could differ.
Cash and Cash Equivalents: Cash and cash equivalents include cash on hand, noninterest-bearing deposits with banks, federal funds sold and interest-bearing deposits with banks with maturity terms of less than 90 days. Generally, federal funds are purchased and sold for one-day periods. The Company reports net cash flows for customer loan transactions, deposit transactions, short-term borrowings and interest-bearing deposits with other financial institutions.
Certificates of deposit in financial institutions: Certificates of deposit in financial institutions are carried at cost and have maturity terms of 90 days or greater. The longest maturity date is September 30,2019.
Securities: The Company classifies securities into held to maturity and available for sale categories. Held to maturity securities are those which the Company has the positive intent and ability to hold to maturity and are reported at amortized cost. Securities classified as available for sale include securities that could be sold for liquidity, investment management or similar reasons even if there is not a present intention of such a sale. Available for sale securities are reported at fair value, with unrealized gains or losses included in other comprehensive income, net of tax.
Premium amortization is deducted from, and discount accretion is added to, interest income on securities using the level yield method without anticipating prepayments, except for mortgage-backed securities where prepayments are anticipated. Gains and losses are recognized upon the sale of specific identified securities on the completed trade date.
15
NOTES TO THE CONSOLIDATED FINANCIAL STATEMENTS
Note A - Summary of Significant Accounting Policies (continued)
Other-Than-Temporary Impairments of Securities: In determining an other-than-temporary impairment ("OTTI"), management considers many factors, including: (1) the length of time and the extent to which the fair value has been less than cost, (2) the financial condition and near-term prospects of the issuer, (3) whether the market decline was affected by macroeconomic conditions, and (4) whether the Company has the intent to sell the debt security or more likely than not will be required to sell the debt security before its anticipated recovery. The assessment of whether an OTTI decline exists involves a high degree of subjectivity and judgment and is based on the information available to management at a point in time.
When an OTTI occurs, the amount of the OTTI recognized in earnings depends on whether an entity intends to sell the security or it is more likely than not it will be required to sell the security before recovery of its amortized cost basis, less any current-period credit loss. If an entity intends to sell or it is more likely than not it will be required to sell the security before recovery of its amortized cost basis, less any current-period credit loss, the OTTI shall be recognized in earnings equal to the entire difference between the investment's amortized cost basis and its fair value at the balance sheet date. If an entity does not intend to sell the security and it is not more likely than not that the entity will be required to sell the security before recovery of its amortized cost basis less any current-period loss, the OTTI shall be separated into the amount representing the credit loss and the amount related to all other factors. The amount of the total OTTI related to the credit loss is determined based on the present value of cash flows expected to be collected and is recognized in earnings. The amount of the total OTTI related to other factors is recognized in other comprehensive income, net of applicable taxes. The previous amortized cost basis less the OTTI recognized in earnings becomes the new amortized cost basis of the investment.
Restricted Investments in Bank Stocks: The Bank is a member of the Federal Home Loan Bank ("FHLB") system. Additionally, the Bank is a member of the Federal Reserve Bank ("FRB") system. Members are required to own a certain amount of stock based on their level of borrowings and other factors and may invest in additional amounts. FHLB stock and FRB stock are carried at cost, classified as restricted securities, and periodically evaluated for impairment based on ultimate recovery of par value. Both cash and stock dividends are reported as income. The Company has additional investments in other restricted bank stocks that are not material to the financial statements.
Loans: Loans that management has the intent and ability to hold for the foreseeable future or until maturity or payoff are reported at the principal balance outstanding, net of unearned interest, deferred loan fees and costs, and an allowance for loan losses. Interest income is reported on an accrual basis using the interest method and includes amortization of net deferred loan fees and costs over the loan term using the level yield method without anticipating prepayments. The amount of the Company's recorded investment is not materially different than the amount of unpaid principal balance for loans.
Interest income is discontinued and the loan moved to non-accrual status when full loan repayment is in doubt, typically when the loan is impaired or payments are past due 90 days or over unless the loan is well-secured or in process of collection. Past due status is based on the contractual terms of the loan. In all cases, loans are placed on nonaccrual or charged-off at an earlier date if collection of principal or interest is considered doubtful. Nonaccrual loans and loans past due 90 days or over and still accruing include both smaller balance homogeneous loans that are collectively evaluated for impairment and individually classified impaired loans.
All interest accrued but not received for loans placed on nonaccrual is reversed against interest income. Interest received on such loans is accounted for on the cash-basis method until qualifying for return to accrual. Loans are returned to accrual status when all the principal and interest amounts contractually due are brought current and future payments are reasonably assured.
Allowance for Loan Losses: The allowance for loan losses is a valuation allowance for probable incurred credit losses. Loan losses are charged against the allowance when management believes the uncollectibility of a loan balance is confirmed. Subsequent recoveries, if any, are credited to the allowance. Management estimates the allowance balance required using past loan loss experience, the nature and volume of the portfolio, information about specific borrower situations and estimated collateral values, economic conditions, and other factors. Allocations of the allowance may be made for specific loans, but the entire allowance is available for any loan that, in management's judgment, should be charged-off.
16
NOTES TO THE CONSOLIDATED FINANCIAL STATEMENTS
Note A - Summary of Significant Accounting Policies (continued)
The allowance consists of specific and general components. The specific component relates to loans that are individually classified as impaired. A loan is impaired when, based on current information and events, it is probable that the Company will be unable to collect all amounts due according to the contractual terms of the loan agreement. Loans for which the terms have been modified and for which the borrower is experiencing financial difficulties are considered troubled debt restructurings and classified as impaired.
Factors considered by management in determining impairment include payment status, collateral value, and the probability of collecting scheduled principal and interest payments when due. Loans that experience insignificant payment delays and payment shortfalls generally are not classified as impaired. Management determines the significance of payment delays and payment shortfalls on a case-by-case basis, taking into consideration all of the circumstances surrounding the loan and the borrower, including the length and reasons for the delay, the borrower's prior payment record, and the amount of shortfall in relation to the principal and interest owed.
Commercial and commercial real estate loans are individually evaluated for impairment. If a loan is impaired, a portion of the allowance is allocated so that the loan is reported, net, at the present value of estimated future cash flows using the loan's existing rate or at the fair value of collateral if repayment is expected solely from the collateral. Smaller balance homogeneous loans, such as consumer and most residential real estate, are collectively evaluated for impairment, and accordingly, they are not separately identified for impairment disclosure. Troubled debt restructurings are measured at the present value of estimated future cash flows using the loan's effective rate at inception. If a troubled debt restructuring is considered to be a collateral dependent loan, the loan is reported, net, at the fair value of the collateral. For troubled debt restructurings that subsequently default, the Company determines the amount of reserve in accordance with the accounting policy for the allowance for loan losses.
The general component covers non-impaired loans and impaired loans that are not individually reviewed for impairment and is based on historical loss experience adjusted for current factors. The historical loss experience is determined by portfolio segment and is based on the actual loss history experienced by the Company over the most recent 3 years for the consumer and real estate portfolio segment and 5 years for the commercial portfolio segment. The total loan portfolio's actual loss experience is supplemented with other economic factors based on the risks present for each portfolio segment. These economic factors include consideration of the following: levels of and trends in delinquencies and impaired loans; levels of and trends in charge-offs and recoveries; trends in volume and terms of loans; effects of any changes in risk selection and underwriting standards; other changes in lending policies, procedures, and practices; experience, ability, and depth of lending management and other relevant staff; national and local economic trends and conditions; industry conditions; and effects of changes in credit concentrations. The following portfolio segments have been identified: Commercial and Industrial, Commercial Real Estate, Residential Real Estate, and Consumer.
Commercial and industrial loans consist of borrowings for commercial purposes to individuals, corporations, partnerships, sole proprietorships, and other business enterprises. Commercial and industrial loans are generally secured by business assets such as equipment, accounts receivable, inventory, or any other asset excluding real estate and generally made to finance capital expenditures or operations. The Company's risk exposure is related to deterioration in the value of collateral securing the loan should foreclosure become necessary. Generally, business assets used or produced in operations do not maintain their value upon foreclosure, which may require the Company to write down the value significantly to sell.
17
NOTES TO THE CONSOLIDATED FINANCIAL STATEMENTS
Note A - Summary of Significant Accounting Policies (continued)
Commercial real estate consists of nonfarm, nonresidential loans secured by owner-occupied and nonowner-occupied commercial real estate as well as commercial construction loans. An owner-occupied loan relates to a borrower purchased building or space for which the repayment of principal is dependent upon cash flows from the ongoing business operations conducted by the party, or an affiliate of the party, who owns the property. Owner-occupied loans that are dependent on cash flows from operations can be adversely affected by current market conditions for their product or service. A nonowner-occupied loan is a property loan for which the repayment of principal is dependent upon rental income associated with the property or the subsequent sale of the property. Nonowner-occupied loans that are dependent upon rental income are primarily impacted by local economic conditions which dictate occupancy rates and the amount of rent charged. Commercial construction loans consist of borrowings to purchase and develop raw land into 1-4 family residential properties. Construction loans are extended to individuals as well as corporations for the construction of an individual or multiple properties and are secured by raw land and the subsequent improvements. Repayment of the loans to real estate developers is dependent upon the sale of properties to third parties in a timely fashion upon completion. Should there be delays in construction or a downturn in the market for those properties, there may be significant erosion in value which may be absorbed by the Company.
Residential real estate loans consist of loans to individuals for the purchase of 1-4 family primary residences with repayment primarily through wage or other income sources of the individual borrower. The Company's loss exposure to these loans is dependent on local market conditions for residential properties as loan amounts are determined, in part, by the fair value of the property at origination.
Consumer loans are comprised of loans to individuals secured by automobiles, open-end home equity loans and other loans to individuals for household, family, and other personal expenditures, both secured and unsecured. These loans typically have maturities of 6 years or less with repayment dependent on individual wages and income. The risk of loss on consumer loans is elevated as the collateral securing these loans, if any, rapidly depreciate in value or may be worthless and/or difficult to locate if repossession is necessary. The Company has allocated the highest percentage of its allowance for loan losses as a percentage of loans to the other identified loan portfolio segments due to the larger dollar balances associated with such portfolios.
At December 31, 2016, there were no changes to the accounting policies or methodologies within any of the Company's loan portfolio segments from the prior period.
Concentrations of Credit Risk: The Company grants residential, consumer and commercial loans to customers located primarily in the southeastern Ohio and western West Virginia areas.
The following represents the composition of the Company's loan portfolio as of December 31:
|
% of Total Loans
|
||||||||
|
2016
|
2015
|
|||||||
|
Residential real estate loans
|
38.92
|
%
|
38.22
|
%
|
||||
|
Commercial real estate loans
|
29.12
|
%
|
28.90
|
%
|
||||
|
Consumer loans
|
18.27
|
%
|
18.89
|
%
|
||||
|
Commercial and industrial loans
|
13.69
|
%
|
13.99
|
%
|
||||
|
100.00
|
%
|
100.00
|
%
|
|||||
Approximately 5.61% of total loans were unsecured at December 31, 2016, down from 6.06% at December 31, 2015.
The Bank, in the normal course of its operations, conducts business with correspondent financial institutions. Balances in correspondent accounts, investments in federal funds, certificates of deposit and other short-term securities are closely monitored to ensure that prudent levels of credit and liquidity risks are maintained. At December 31, 2016, the Bank's primary correspondent balance was $26,422 on deposit at the Federal Reserve Bank, Cleveland, Ohio.
18
NOTES TO THE CONSOLIDATED FINANCIAL STATEMENTS
Note A - Summary of Significant Accounting Policies (continued)
Premises and Equipment: Land is carried at cost. Premises and equipment are stated at cost less accumulated depreciation, which is computed using the straight-line method over the estimated useful life of the owned asset and, for leasehold improvement, over the remaining term of the leased facility, whichever is shorter. The useful lives range from 3 to 8 years for equipment, furniture and fixtures and 7 to 39 years for buildings and improvements.
Foreclosed assets: Assets acquired through or instead of loan foreclosure are initially recorded at fair value less costs to sell when acquired, establishing a new cost basis. Physical possession of residential real estate property collateralizing a consumer mortgage loan occurs when legal title is obtained upon completion of foreclosure or when the borrower conveys all interest in the property to satisfy the loan through completion of a deed in lieu of foreclosure or through a similar legal agreement. These assets are subsequently accounted for at lower of cost or fair value less estimated costs to sell. If fair value declines subsequent to foreclosure, a valuation allowance is recorded through expense. Operating costs after acquisition are expensed. Foreclosed assets totaled $2,129 and $2,358 at December 31, 2016 and 2015.
Goodwill: Goodwill resulting from business combinations prior to January 1, 2009 represents the excess of the purchase price over the fair value of the net assets of businesses acquired. Goodwill resulting from business combinations after January 1, 2009, is generally determined as the excess of the fair value of the consideration transferred, plus the fair value of any noncontrolling interests in the acquiree, over the fair value of the net assets acquired and liabilities assumed as of the acquisition date. Goodwill acquired in a purchase business combination and determined to have an indefinite useful life are not amortized, but tested for impairment at least annually. Goodwill is the only intangible asset with an indefinite life on our balance sheet. The Company has selected December 31 as the date to perform its annual qualitative impairment test. Given that the Company has been profitable and had positive equity, the qualitative assessment indicated that it was more likely than not that the fair value of goodwill was more than the carrying amount, resulting in no impairment.
Long-term Assets: Premises and equipment and other long-term assets are reviewed for impairment when events indicate their carrying amount may not be recoverable from future undiscounted cash flows. If impaired, the assets are recorded at fair value.
Mortgage Servicing Rights: A mortgage servicing right ("MSR") is a contractual agreement where the right to service a mortgage loan is sold by the original lender to another party. When the Company sells mortgage loans to the secondary market, it retains the servicing rights to these loans. The Company's MSR is recognized separately when acquired through sales of loans and is initially recorded at fair value with the income statement effect recorded in mortgage banking income. Subsequently, the MSR is then amortized in proportion to and over the period of estimated future servicing income of the underlying loan. The MSR is then evaluated for impairment periodically based upon the fair value of the rights as compared to the carrying amount, with any impairment being recognized through a valuation allowance. Fair value of the MSR is based on market prices for comparable mortgage servicing contracts. Impairment is determined by stratifying rights into groupings based on predominant risk characteristics, such as interest rate, loan type and investor type. If the Company later determines that all or a portion of the impairment no longer exists for a particular grouping, a reduction of the allowance may be recorded as an increase to income. At December 31, 2016 and 2015, the Company's MSR assets were $387 and $429, respectively.
Earnings Per Share: Earnings per share is based on net income divided by the following weighted average number of common shares outstanding during the periods: 4,351,748 for 2016; 4,117,675 for 2015; 4,099,194 for 2014. Ohio Valley had no dilutive securities outstanding for any period presented.
Earnings Per Share: Earnings per share is based on net income divided by the following weighted average number of common shares outstanding during the periods: 4,351,748 for 2016; 4,117,675 for 2015; 4,099,194 for 2014. Ohio Valley had no dilutive securities outstanding for any period presented.
Income Taxes: Income tax expense is the sum of the current year income tax due or refundable and the change in deferred tax assets and liabilities. Deferred tax assets and liabilities are the expected future tax consequences of temporary differences between the carrying amounts and tax bases of assets and liabilities, computed using enacted tax rates. A valuation allowance, if needed, reduces deferred tax assets to the amount expected to be realized.
A tax position is recognized as a benefit only if it is "more likely than not" that the tax position would be sustained in a tax examination, with a tax examination being presumed to occur. The amount recognized is the largest amount of tax benefit that is greater than 50% likely of being realized on examination. For tax positions not meeting the "more likely than not" test, no tax benefit is recorded. The Company recognizes interest and/or penalties related to income tax matters in income tax expense.
19
NOTES TO THE CONSOLIDATED FINANCIAL STATEMENTS
Note A - Summary of Significant Accounting Policies (continued)
Comprehensive Income: Comprehensive income consists of net income and other comprehensive income. Other comprehensive income includes unrealized gains and losses on securities available for sale which are also recognized as separate components of equity, net of tax.
Loss Contingencies: Loss contingencies, including claims and legal actions arising in the ordinary course of business, are recorded as liabilities when the likelihood of loss is probable and an amount or range of loss can be reasonably estimated. Management does not believe there now are such matters that will have a material effect on the financial statements.
Bank Owned Life Insurance and Annuity Assets: The Company has purchased life insurance policies on certain key executives. Bank owned life insurance is recorded at the amount that can be realized under the insurance contract at the balance sheet date, which is the cash surrender value adjusted for other charges or other amounts due that are probable at settlement. The Company also purchased an annuity investment for a certain key executive that earns interest.
Employee Stock Ownership Plan: Compensation expense is based on the market price of shares as they are committed to be allocated to participant accounts.
Loan Commitments and Related Financial Instruments: Financial instruments include off-balance sheet credit instruments, such as commitments to make loans and commercial letters of credit, issued to meet customer financing needs. The face amount for these items represents the exposure to loss, before considering customer collateral or ability to repay. These financial instruments are recorded when they are funded. See Note L for more specific disclosure related to loan commitments.
Dividend Restrictions: Banking regulations require maintaining certain capital levels and may limit the dividends paid by the Bank to Ohio Valley or by Ohio Valley to its shareholders. See Note P for more specific disclosure related to dividend restrictions.
Restrictions on Cash: Cash on hand or on deposit with a third-party correspondent and the Federal Reserve Bank of $28,102 and $36,535 was required to meet regulatory reserve and clearing requirements at year-end 2016 and 2015. The balances on deposit with a third-party correspondent do not earn interest.
Derivatives: At the inception of a derivative contract, the Company designates the derivative as one of three types based on the Company's intentions and belief as to likely effectiveness as a hedge. These three types are (1) a hedge of the fair value of a recognized asset or liability or of an unrecognized firm commitment ("fair value hedge"), (2) a hedge of a forecasted transaction or the variability of cash flows to be received or paid related to a recognized asset or liability ("cash flow hedge"), or (3) an instrument with no hedging designation ("stand-alone derivative").
Net cash settlements on derivatives that qualify for hedge accounting are recorded in interest income or interest expense, based on the item being hedged. Net cash settlements on derivatives that do not qualify for hedge accounting are reported in noninterest income. Cash flows on hedges are classified in the cash flow statement the same as the cash flows of the items being hedged.
At December 31, 2016 and 2015, the Company's only derivatives on hand were interest rate swaps, which are classified as stand-alone derivatives. See Note H for more specific disclosures related to interest rate swaps.
Fair Value of Financial Instruments: Fair values of financial instruments are estimated using relevant market information and other assumptions, as more fully disclosed in Note O. Fair value estimates involve uncertainties and matters of significant judgment regarding interest rates, credit risk, prepayments, and other factors, especially in the absence of broad markets for particular items. Changes in assumptions or in market conditions could significantly affect the estimates.
Reclassifications: The consolidated financial statements for 2015 and 2014 have been reclassified to conform with the presentation for 2016. These reclassifications had no effect on the net results of operations or shareholders' equity.
20
NOTES TO THE CONSOLIDATED FINANCIAL STATEMENTS
Note A - Summary of Significant Accounting Policies (continued)
Adoption of New Accounting Standards: In May 2014, the FASB issued Accounting Standards Update ("ASU") 2014-09, "Revenue from Contracts with Customers (Topic 606)". The ASU creates a new topic, Topic 606, to provide guidance on revenue recognition for entities that enter into contracts with customers to transfer goods or services or enter into contracts for the transfer of nonfinancial assets. The core principle of the guidance is that an entity should recognize revenue to depict the transfer of promised goods or services to customers in an amount that reflects the consideration to which the entity expects to be entitled in exchange for those goods or services. Additional disclosures are required to provide quantitative and qualitative information regarding the nature, amount, timing, and uncertainty of revenue and cash flows arising from contracts with customers. The new guidance is effective for annual reporting periods, and interim reporting periods within those annual periods, beginning after December 15, 2017, with early adoption permitted on January 1, 2017. The adoption of ASU 2014-09 is not expected to have a material effect on the Company's financial statements.
In January 2016, the FASB issued ASU No. 2016-01, "Recognition and Measurement of Financial Assets and Financial Liabilities". The update provides updated accounting and reporting requirements for both public and non-public entities. The most significant provisions that will impact the Company are: 1) measurement at fair value of equity securities available for sale, with the changes in fair value recognized in the income statement; 2) elimination of the requirement to disclose the method(s) and significant assumptions used to estimate the fair value that is required to be disclosed for financial instruments at amortized cost on the balance sheet; 3) utilization of the exit price notion when measuring the fair value of financial instruments for disclosure purposes; and 4) requirement of separate presentation of both financial assets and liabilities by measurement category and form of financial asset on the balance sheet or accompanying notes to the financial statements. The update will be effective for interim and annual periods beginning after December 15, 2017, using a cumulative-effect adjustment to the balance sheet as of the beginning of the year of adoption. Early adoption is not permitted. Management is currently evaluating the impact of this update on its Consolidated Financial Statements.
In February 2016, the FASB issued an update (ASU 2016-02, Leases) which will require lessees to record most leases on their balance sheet and recognize leasing expenses in the income statement. Operating leases, except for short-term leases that are subject to an accounting policy election, will be recorded on the balance sheet for lessees by establishing a lease liability and corresponding right-of-use asset. The guidance in this ASU will become effective for interim and annual reporting periods beginning after December 15, 2018, with early adoption permitted. Management is currently evaluating the impact of the adoption and does not expect to have a material impact on the income statement, but does anticipate an increase in the Company's assets and liabilities. However, the amounts that will be adjusted are still to be determined.
In June 2016, the FASB issued ASU No. 2016-13, "Financial Instruments - Credit Losses". ASU 2016-13 requires entities to report "expected" credit losses on financial instruments and other commitments to extend credit rather than the current "incurred loss" model. These expected credit losses for financial assets held at the reporting date are to be based on historical experience, current conditions, and reasonable and supportable forecasts. This ASU will also require enhanced disclosures to help investors and other financial statement users better understand significant estimates and judgments used in estimating credit losses, as well as the credit quality and underwriting standards of an entity's portfolio. These disclosures include qualitative and quantitative requirements that provide additional information about the amounts recorded in the financial statements. This ASU is effective for annual periods, and interim periods within those annual periods, beginning after December 15, 2019. Early adoption is permitted, for annual periods and interim periods within those annual periods, beginning after December 15, 2018. Management is currently in the developmental stages, collecting available historical information, in order to assess the expected credit losses. However, the impact to the financial statements are still yet to be determined.
In August 2016, the FASB issued an update (ASU 2016-15, Statement of Cash Flows) which addresses eight specific cash flow issues with the objective of reducing the existing diversity in practice in how certain cash receipts and cash payments are presented and classified in the statement of cash flows. The amendments in this Update apply to all entities, including business entities and not-for-profit entities that are required to present a statement of cash flows, and are effective for public business entities for fiscal years beginning after December 15, 2017, and interim periods within those fiscal years. Early adoption is permitted, including adoption in an interim period. The adoption of ASU 2016-15 is not expected to have a material effect on the Company's financial statements.
21
NOTES TO THE CONSOLIDATED FINANCIAL STATEMENTS
Note B – Business Combinations
As of the close of business on August 5, 2016, Ohio Valley completed its merger with Milton Bancorp, Inc. ("Milton Bancorp") pursuant to the terms of the Agreement and Plan of Merger dated as of January 7, 2016, by and between Ohio Valley and Milton Bancorp (the "Merger Agreement"). Pursuant to the terms of the Merger Agreement, Milton Bancorp was merged with and into Ohio Valley. Immediately following the Merger, The Milton Banking Company ("Milton Bank") was merged with and into the Bank. As a result of the Merger and in accordance with the terms of the Merger Agreement, each Milton Bancorp share was converted into the right to receive either 1,636 Ohio Valley common shares, no par value, or cash in the amount of $37,219, subject to certain allocation procedures set forth in the Merger Agreement pursuant to which 80% of the 400 outstanding Milton Bancorp common shares were converted into the right to receive Ohio Valley common shares and the remaining 20% of the outstanding Milton Bancorp common shares were converted into the right to receive cash. Each of the 1,237 Milton Bancorp preferred shares issued and outstanding were converted into the right to receive a cash payment in the amount of $3,600 per preferred share. The consideration paid for Milton Bancorp totaled $18,875, of which $11,444 was the market value of the Company's common shares and $7,431 was cash. Ohio Valley financed part of the cash portion of the purchase price through $5,000 in borrowed funds. Milton Bank's results of operations were included in the Company's results beginning August 6, 2016. Merger-related expenses of $930 were recorded to the Company's income statement for the year ended December 31, 2016. The fair value of the common shares issued as part of the consideration paid for Milton Bancorp was determined in the basis of the closing price of the Company's common shares on the acquisition date. After the Merger, the Company's assets totaled approximately $950 million and branches increased to 25 locations.
Goodwill of $6,534 arising from the acquisition consisted largely of synergies from combining the operations of the companies. As the acquisition was treated as a nontaxable stock acquisition transaction, the goodwill was not deductible for tax purposes. The following table summarizes the consideration paid for Milton Bancorp and the amounts of the assets acquired and liabilities assumed recognized at the acquisition date:
|
Consideration:
|
||||
|
Cash
|
$
|
7,431
|
||
|
Equity instruments
|
11,444
|
|||
|
Fair value of total consideration transferred
|
$
|
18,875
|
||
|
Recognized amounts of identifiable assets acquired and liabilities assumed:
|
||||
|
Cash and cash equivalents
|
$
|
9,201
|
||
|
Securities
|
5,868
|
|||
|
Restricted investments in bank stock
|
364
|
|||
|
Loans
|
112,479
|
|||
|
Premises and equipment
|
1,826
|
|||
|
Other real estate owned
|
641
|
|||
|
Bank owned life insurance
|
272
|
|||
|
Core deposit intangible asset
|
738
|
|||
|
Other assets
|
612
|
|||
|
Total assets acquired
|
132,001
|
|||
|
Deposits
|
119,669
|
|||
|
Other liabilities
|
(9
|
)
|
||
|
Total liabilities assumed
|
119,660
|
|||
|
Total identifiable net assets
|
12,341
|
|||
|
Goodwill
|
6,534
|
|||
|
$
|
18,875
|
|||
22
NOTES TO THE CONSOLIDATED FINANCIAL STATEMENTS
Note B – Business Combinations (continued)
The fair value of net assets acquired includes fair value adjustments to certain receivables that were not considered impaired as of the acquisition date. The fair value adjustments were determined using discounted contractual cash flows. However, the Company believes that all contractual cash flows related to these financial instruments will be collected. As such, these receivables were not considered impaired at the acquisition date and were not subject to the guidance relating to purchase credit impaired loans, which have shown evidence of credit deterioration since origination. Receivables acquired that were not subject to these requirements include non-impaired loans and customer receivables with a fair value and gross contractual amounts receivable of $111,558 and $112,249 on the date of acquisition. The Company also acquired purchase credit impaired loans that management deemed to be not material for disclosure. While the acquisition accounting adjustments have been recorded at year-end 2016, we will continue to evaluate these adjustments, specifically in the area of income taxes. Amounts presented in the table above are subject to change.
Note C - Securities
The following table summarizes the amortized cost and fair value of securities available for sale and securities held to maturity at December 31, 2016 and 2015 and the corresponding amounts of gross unrealized gains and losses recognized in accumulated other comprehensive income (loss) and gross unrecognized gains and losses:
|
|
Amortized
Cost
|
Gross Unrealized
Gains
|
Gross Unrealized
Losses
|
Estimated
Fair Value
|
||||||||||||
|
Securities Available for Sale
|
||||||||||||||||
|
December 31, 2016
|
||||||||||||||||
|
U.S. Government sponsored entity securities
|
$
|
10,624
|
$
|
----
|
$
|
(80
|
)
|
$
|
10,544
|
|||||||
|
Agency mortgage-backed securities, residential
|
87,367
|
495
|
(1,916
|
)
|
85,946
|
|||||||||||
|
Total securities
|
$
|
97,991
|
$
|
495
|
$
|
(1,996
|
)
|
$
|
96,490
|
|||||||
|
|
||||||||||||||||
|
December 31, 2015
|
||||||||||||||||
|
U.S. Government sponsored entity securities
|
$
|
9,011
|
$
|
----
|
$
|
(46
|
)
|
$
|
8,965
|
|||||||
|
Agency mortgage-backed securities, residential
|
82,178
|
981
|
(473
|
)
|
82,686
|
|||||||||||
|
Total securities
|
$
|
91,189
|
$
|
981
|
$
|
(519
|
)
|
$
|
91,651
|
|||||||
|
|
Amortized
Cost
|
Gross Unrecognized
Gains
|
Gross Unrecognized
Losses
|
Estimated
Fair Value
|
||||||||||||
|
Securities Held to Maturity
|
||||||||||||||||
|
December 31, 2016
|
||||||||||||||||
|
Obligations of states and political subdivisions
|
$
|
18,661
|
$
|
654
|
$
|
(148
|
)
|
$
|
19,167
|
|||||||
|
Agency mortgage-backed securities, residential
|
4
|
----
|
----
|
4
|
||||||||||||
|
Total securities
|
$
|
18,665
|
$
|
654
|
$
|
(148
|
)
|
$
|
19,171
|
|||||||
|
|
||||||||||||||||
|
December 31, 2015
|
||||||||||||||||
|
Obligations of states and political subdivisions
|
$
|
19,898
|
$
|
892
|
$
|
(5
|
)
|
$
|
20,785
|
|||||||
|
Agency mortgage-backed securities, residential
|
5
|
----
|
----
|
5
|
||||||||||||
|
Total securities
|
$
|
19,903
|
$
|
892
|
$
|
(5
|
)
|
$
|
20,790
|
|||||||
At year-end 2016 and 2015, there were no holdings of securities of any one issuer, other than the U.S. Government and its agencies, in an amount greater than 10% of shareholders' equity.
There were no sales of debt securities during 2016 and 2014. During 2015, proceeds from the sales of debt securities totaled $10,550 with gross gains of $163 recognized.
Securities with a carrying value of approximately $72,397 at December 31, 2016 and $59,267 at December 31, 2015 were pledged to secure public deposits and repurchase agreements and for other purposes as required or permitted by law.
Unrealized losses on the Company's debt securities have not been recognized into income because the issuers' securities are of high credit quality as of December 31, 2016, and management does not intend to sell and it is likely that management will not be required to sell the securities prior to their anticipated recovery. Management does not believe any individual unrealized loss at December 31, 2016 and 2015 represents an other-than-temporary impairment.
23
NOTES TO THE CONSOLIDATED FINANCIAL STATEMENTS
Note C - Securities (continued)
The amortized cost and estimated fair value of debt securities at December 31, 2016, by contractual maturity, are shown below. Actual maturities may differ from contractual maturities because certain issuers may have the right to call or prepay the debt obligations prior to their contractual maturities. Securities not due at a single maturity are shown separately.
|
|
Available for Sale
|
Held to Maturity
|
||||||||||||||
|
Debt Securities:
|
Amortized
Cost
|
Estimated
Fair
Value
|
Amortized
Cost
|
Estimated
Fair
Value
|
||||||||||||
|
Due in one year or less
|
$
|
4,001
|
$
|
3,999
|
$
|
272
|
$
|
275
|
||||||||
|
Due in one to five years
|
6,623
|
6,545
|
7,061
|
7,342
|
||||||||||||
|
Due in five to ten years
|
----
|
----
|
8,690
|
9,029
|
||||||||||||
|
Due after ten years
|
----
|
----
|
2,638
|
2,521
|
||||||||||||
|
Agency mortgage-backed securities, residential
|
87,367
|
85,946
|
4
|
4
|
||||||||||||
|
Total debt securities
|
$
|
97,991
|
$
|
96,490
|
$
|
18,665
|
$
|
19,171
|
||||||||
The following table summarizes securities with unrealized losses at December 31, 2016 and December 31, 2015, aggregated by major security type and length of time in a continuous unrealized loss position:
|
December 31, 2016
|
Less than 12 Months
|
12 Months or More
|
Total
|
|||||||||||||||||||||
|
Securities Available for Sale
|
Fair
Value
|
Unrealized
Loss
|
Fair
Value
|
Unrealized
Loss
|
Fair
Value
|
Unrealized
Loss
|
||||||||||||||||||
|
U.S. Government sponsored entity securities
|
$
|
10,544
|
$
|
(80
|
)
|
$
|
----
|
$
|
----
|
$
|
10,544
|
$
|
(80
|
)
|
||||||||||
|
Agency mortgage-backed securities, residential
|
64,043
|
(1,916
|
)
|
----
|
----
|
64,043
|
(1,916
|
)
|
||||||||||||||||
|
Total available for sale
|
$
|
74,587
|
$
|
(1,996
|
)
|
$
|
----
|
$
|
----
|
$
|
74,587
|
$
|
(1,996
|
)
|
||||||||||
|
|
Less than 12 Months
|
12 Months or More
|
Total
|
|||||||||||||||||||||
|
Securities Held to Maturity
|
Fair
Value
|
Unrecognized
Loss
|
Fair
Value
|
Unrecognized
Loss
|
Fair
Value
|
Unrecognized
Loss
|
||||||||||||||||||
|
|
||||||||||||||||||||||||
|
Obligations of states and political subdivisions
|
$
|
3,813
|
$
|
(148
|
)
|
$
|
----
|
$
|
----
|
$
|
3,813
|
$
|
(148
|
)
|
||||||||||
|
Total held to maturity
|
$
|
3,813
|
$
|
(148
|
)
|
$
|
----
|
$
|
----
|
$
|
3,813
|
$
|
(148
|
)
|
||||||||||
|
December 31, 2015
|
Less than 12 Months
|
12 Months or More
|
Total
|
|||||||||||||||||||||
|
Securities Available for Sale
|
Fair
Value
|
Unrealized
Loss
|
Fair
Value
|
Unrealized
Loss
|
Fair
Value
|
Unrealized
Loss
|
||||||||||||||||||
|
U.S. Government sponsored entity securities
|
$
|
7,964
|
$
|
(46
|
)
|
$
|
----
|
$
|
----
|
$
|
7,964
|
$
|
(46
|
)
|
||||||||||
|
Agency mortgage-backed securities, residential
|
42,112
|
(407
|
)
|
3,645
|
(66
|
)
|
45,757
|
(473
|
)
|
|||||||||||||||
|
Total available for sale
|
$
|
50,076
|
$
|
(453
|
)
|
$
|
3,645
|
$
|
(66
|
)
|
$
|
53,721
|
$
|
(519
|
)
|
|||||||||
|
Less than 12 Months
|
12 Months or More
|
Total
|
||||||||||||||||||||||
|
Securities Held to Maturity
|
Fair
Value
|
Unrecognized
Loss
|
Fair
Value
|
Unrecognized
Loss
|
Fair
Value
|
Unrecognized
Loss
|
||||||||||||||||||
|
|
||||||||||||||||||||||||
|
Obligations of states and political subdivisions
|
$
|
995
|
$
|
(5
|
)
|
$
|
----
|
$
|
----
|
$
|
995
|
$
|
(5
|
)
|
||||||||||
|
Total held to maturity
|
$
|
995
|
$
|
(5
|
)
|
$
|
----
|
$
|
----
|
$
|
995
|
$
|
(5
|
)
|
||||||||||
24
NOTES TO THE CONSOLIDATED FINANCIAL STATEMENTS
Note D - Loans and Allowance for Loan Losses
Loans are comprised of the following at December 31:
|
|
2016
|
2015
|
||||||
|
Residential real estate
|
$
|
286,022
|
$
|
223,875
|
||||
|
Commercial real estate:
|
||||||||
|
Owner-occupied
|
77,605
|
73,458
|
||||||
|
Nonowner-occupied
|
90,532
|
72,002
|
||||||
|
Construction
|
45,870
|
23,852
|
||||||
|
Commercial and industrial
|
100,589
|
81,936
|
||||||
|
Consumer:
|
||||||||
|
Automobile
|
59,772
|
44,566
|
||||||
|
Home equity
|
20,861
|
20,841
|
||||||
|
Other
|
53,650
|
45,222
|
||||||
|
|
734,901
|
585,752
|
||||||
|
Less: Allowance for loan losses
|
(7,699
|
)
|
(6,648
|
)
|
||||
|
|
||||||||
|
Loans, net
|
$
|
727,202
|
$
|
579,104
|
||||
The following table presents the activity in the allowance for loan losses by portfolio segment for the years ended December 31, 2016, 2015 and 2014:
|
December 31, 2016
|
Residential
Real Estate
|
Commercial
Real Estate
|
Commercial
& Industrial
|
Consumer
|
Total
|
|||||||||||||||
|
Allowance for loan losses:
|
||||||||||||||||||||
|
Beginning balance
|
$
|
1,087
|
$
|
1,959
|
$
|
2,589
|
$
|
1,013
|
$
|
6,648
|
||||||||||
|
Provision for loan losses
|
(63
|
)
|
2,287
|
(1,112
|
)
|
1,714
|
2,826
|
|||||||||||||
|
Loans charged off
|
(384
|
)
|
(63
|
)
|
(586
|
)
|
(2,170
|
)
|
(3,203
|
)
|
||||||||||
|
Recoveries
|
299
|
132
|
16
|
981
|
1,428
|
|||||||||||||||
|
Total ending allowance balance
|
$
|
939
|
$
|
4,315
|
$
|
907
|
$
|
1,538
|
$
|
7,699
|
||||||||||
|
December 31, 2015
|
Residential
Real Estate
|
Commercial
Real Estate
|
Commercial
& Industrial
|
Consumer
|
Total
|
|||||||||||||||
|
Allowance for loan losses:
|
||||||||||||||||||||
|
Beginning balance
|
$
|
1,426
|
$
|
4,195
|
$
|
1,602
|
$
|
1,111
|
$
|
8,334
|
||||||||||
|
Provision for loan losses
|
103
|
(469
|
)
|
777
|
679
|
1,090
|
||||||||||||||
|
Loans charged off
|
(828
|
)
|
(1,971
|
)
|
(24
|
)
|
(1,428
|
)
|
(4,251
|
)
|
||||||||||
|
Recoveries
|
386
|
204
|
234
|
651
|
1,475
|
|||||||||||||||
|
Total ending allowance balance
|
$
|
1,087
|
$
|
1,959
|
$
|
2,589
|
$
|
1,013
|
$
|
6,648
|
||||||||||
|
December 31, 2014
|
Residential
Real Estate
|
Commercial
Real Estate
|
Commercial
& Industrial
|
Consumer
|
Total
|
|||||||||||||||
|
Allowance for loan losses:
|
||||||||||||||||||||
|
Beginning balance
|
$
|
1,169
|
$
|
2,914
|
$
|
1,279
|
$
|
793
|
$
|
6,155
|
||||||||||
|
Provision for loan losses
|
458
|
1,408
|
(28
|
)
|
949
|
2,787
|
||||||||||||||
|
Loans charged off
|
(487
|
)
|
(235
|
)
|
(41
|
)
|
(1,216
|
)
|
(1,979
|
)
|
||||||||||
|
Recoveries
|
286
|
108
|
392
|
585
|
1,371
|
|||||||||||||||
|
Total ending allowance balance
|
$
|
1,426
|
$
|
4,195
|
$
|
1,602
|
$
|
1,111
|
$
|
8,334
|
||||||||||
25
NOTES TO THE CONSOLIDATED FINANCIAL STATEMENTS
Note D - Loans and Allowance for Loan Losses (continued)
The following table presents the balance in the allowance for loan losses and the recorded investment of loans by portfolio segment and based on impairment method as of December 31, 2016 and 2015:
|
December 31, 2016
|
Residential
Real Estate
|
Commercial
Real Estate
|
Commercial
& Industrial
|
Consumer
|
Total
|
|||||||||||||||
|
Allowance for loan losses:
|
||||||||||||||||||||
|
Ending allowance balance attributable to loans:
|
||||||||||||||||||||
|
Individually evaluated for impairment
|
$
|
----
|
$
|
2,535
|
$
|
241
|
$
|
205
|
$
|
2,981
|
||||||||||
|
Collectively evaluated for impairment
|
939
|
1,780
|
666
|
1,333
|
4,718
|
|||||||||||||||
|
Total ending allowance balance
|
$
|
939
|
$
|
4,315
|
$
|
907
|
$
|
1,538
|
$
|
7,699
|
||||||||||
|
|
||||||||||||||||||||
|
Loans:
|
||||||||||||||||||||
|
Loans individually evaluated for impairment
|
$
|
717
|
$
|
13,111
|
$
|
8,465
|
$
|
416
|
$
|
22,709
|
||||||||||
|
Loans collectively evaluated for impairment
|
285,305
|
200,896
|
92,124
|
133,867
|
712,192
|
|||||||||||||||
|
Total ending loans balance
|
$
|
286,022
|
$
|
214,007
|
$
|
100,589
|
$
|
134,283
|
$
|
734,901
|
||||||||||
|
December 31, 2015
|
Residential
Real Estate
|
Commercial
Real Estate
|
Commercial
& Industrial
|
Consumer
|
Total
|
|||||||||||||||
|
Allowance for loan losses:
|
||||||||||||||||||||
|
Ending allowance balance attributable to loans:
|
||||||||||||||||||||
|
Individually evaluated for impairment
|
$
|
----
|
$
|
311
|
$
|
1,850
|
$
|
3
|
$
|
2,164
|
||||||||||
|
Collectively evaluated for impairment
|
1,087
|
1,648
|
739
|
1,010
|
4,484
|
|||||||||||||||
|
Total ending allowance balance
|
$
|
1,087
|
$
|
1,959
|
$
|
2,589
|
$
|
1,013
|
$
|
6,648
|
||||||||||
|
|
||||||||||||||||||||
|
Loans:
|
||||||||||||||||||||
|
Loans individually evaluated for impairment
|
$
|
1,001
|
$
|
7,318
|
$
|
8,691
|
$
|
218
|
$
|
17,228
|
||||||||||
|
Loans collectively evaluated for impairment
|
222,874
|
161,994
|
73,245
|
110,411
|
568,524
|
|||||||||||||||
|
Total ending loans balance
|
$
|
223,875
|
$
|
169,312
|
$
|
81,936
|
$
|
110,629
|
$
|
585,752
|
||||||||||
26
NOTES TO THE CONSOLIDATED FINANCIAL STATEMENTS
Note D – Loans and Allowance for Loan Losses (continued)
The following table presents information related to loans individually evaluated for impairment by class of loans as of the years ended December 31, 2016, 2015 and 2014:
|
December 31, 2016
|
Unpaid
Principal
Balance
|
Recorded
Investment
|
Allowance for
Loan Losses
Allocated
|
Average
Impaired
Loans
|
Interest
Income
Recognized
|
Cash Basis
Interest
Recognized
|
||||||||||||||||||
|
With an allowance recorded:
|
||||||||||||||||||||||||
|
Commercial real estate:
|
||||||||||||||||||||||||
|
Owner-occupied
|
$
|
5,477
|
$
|
5,477
|
$
|
2,435
|
$
|
3,185
|
$
|
300
|
$
|
300
|
||||||||||||
|
Nonowner-occupied
|
384
|
384
|
100
|
390
|
19
|
19
|
||||||||||||||||||
|
Commercial and industrial
|
392
|
392
|
241
|
391
|
----
|
----
|
||||||||||||||||||
|
Consumer:
|
||||||||||||||||||||||||
|
Home equity
|
416
|
416
|
205
|
421
|
21
|
21
|
||||||||||||||||||
|
|
||||||||||||||||||||||||
|
With no related allowance recorded:
|
||||||||||||||||||||||||
|
Residential real estate
|
717
|
717
|
----
|
726
|
31
|
31
|
||||||||||||||||||
|
Commercial real estate:
|
||||||||||||||||||||||||
|
Owner-occupied
|
3,638
|
3,091
|
----
|
3,005
|
178
|
178
|
||||||||||||||||||
|
Nonowner-occupied
|
5,078
|
3,632
|
----
|
3,572
|
79
|
79
|
||||||||||||||||||
|
Construction
|
1,001
|
527
|
----
|
522
|
136
|
136
|
||||||||||||||||||
|
Commercial and industrial
|
8,073
|
8,073
|
----
|
7,681
|
381
|
381
|
||||||||||||||||||
|
|
||||||||||||||||||||||||
|
Total
|
$
|
25,176
|
$
|
22,709
|
$
|
2,981
|
$
|
19,893
|
$
|
1,145
|
$
|
1,145
|
||||||||||||
|
December 31, 2015
|
Unpaid
Principal
Balance
|
Recorded
Investment
|
Allowance for
Loan Losses
Allocated
|
Average
Impaired
Loans
|
Interest
Income
Recognized
|
Cash Basis
Interest
Recognized
|
||||||||||||||||||
|
With an allowance recorded:
|
||||||||||||||||||||||||
|
Commercial real estate:
|
||||||||||||||||||||||||
|
Owner-occupied
|
$
|
204
|
$
|
204
|
$
|
204
|
$
|
204
|
$
|
13
|
$
|
13
|
||||||||||||
|
Nonowner-occupied
|
396
|
396
|
107
|
402
|
75
|
75
|
||||||||||||||||||
|
Commercial and industrial
|
4,355
|
4,355
|
1,850
|
3,545
|
149
|
149
|
||||||||||||||||||
|
Consumer:
|
||||||||||||||||||||||||
|
Home equity
|
218
|
218
|
3
|
219
|
8
|
8
|
||||||||||||||||||
|
|
||||||||||||||||||||||||
|
With no related allowance recorded:
|
||||||||||||||||||||||||
|
Residential real estate
|
1,001
|
1,001
|
----
|
809
|
45
|
45
|
||||||||||||||||||
|
Commercial real estate:
|
||||||||||||||||||||||||
|
Owner-occupied
|
3,812
|
3,265
|
----
|
2,747
|
181
|
181
|
||||||||||||||||||
|
Nonowner-occupied
|
5,178
|
2,773
|
----
|
3,439
|
49
|
49
|
||||||||||||||||||
|
Construction
|
680
|
680
|
----
|
544
|
----
|
----
|
||||||||||||||||||
|
Commercial and industrial
|
4,336
|
4,336
|
----
|
3,985
|
180
|
180
|
||||||||||||||||||
|
|
||||||||||||||||||||||||
|
Total
|
$
|
20,180
|
$
|
17,228
|
$
|
2,164
|
$
|
15,894
|
$
|
700
|
$
|
700
|
||||||||||||
27
NOTES TO THE CONSOLIDATED FINANCIAL STATEMENTS
Note D – Loans and Allowance for Loan Losses (continued)
|
December 31, 2014
|
Unpaid
Principal
Balance
|
Recorded
Investment
|
Allowance for
Loan Losses
Allocated
|
Average
Impaired
Loans
|
Interest
Income
Recognized
|
Cash Basis
Interest
Recognized
|
||||||||||||||||||
|
With an allowance recorded:
|
||||||||||||||||||||||||
|
Residential real estate
|
$
|
----
|
$
|
----
|
$
|
----
|
$
|
----
|
$
|
6
|
$
|
6
|
||||||||||||
|
Commercial real estate:
|
||||||||||||||||||||||||
|
Owner-occupied
|
1,177
|
1,177
|
414
|
471
|
32
|
32
|
||||||||||||||||||
|
Nonowner-occupied
|
7,656
|
7,656
|
2,092
|
8,303
|
398
|
398
|
||||||||||||||||||
|
Commercial and industrial
|
2,356
|
2,356
|
900
|
2,441
|
110
|
110
|
||||||||||||||||||
|
Consumer:
|
||||||||||||||||||||||||
|
Home equity
|
219
|
219
|
6
|
219
|
7
|
7
|
||||||||||||||||||
|
|
||||||||||||||||||||||||
|
With no related allowance recorded:
|
||||||||||||||||||||||||
|
Residential real estate
|
1,415
|
1,415
|
----
|
882
|
58
|
58
|
||||||||||||||||||
|
Commercial real estate:
|
||||||||||||||||||||||||
|
Owner-occupied
|
3,125
|
2,578
|
----
|
2,135
|
113
|
113
|
||||||||||||||||||
|
Nonowner-occupied
|
1,298
|
300
|
----
|
300
|
50
|
50
|
||||||||||||||||||
|
Commercial and industrial
|
4,703
|
4,468
|
----
|
2,278
|
180
|
180
|
||||||||||||||||||
|
|
||||||||||||||||||||||||
|
Total
|
$
|
21,949
|
$
|
20,169
|
$
|
3,412
|
$
|
17,029
|
$
|
954
|
$
|
954
|
||||||||||||
The recorded investment of a loan is its carrying value excluding accrued interest and deferred loan fees.
Nonaccrual loans and loans past due 90 days or more and still accruing include both smaller balance homogenous loans that are collectively evaluated for impairment and individually classified as impaired loans.
The Company transfers loans to other real estate owned, at fair value less cost to sell, in the period the Company obtains physical possession of the property (through legal title or through a deed in lieu). As of December 31, 2016 and December 31, 2015, other real estate owned secured by residential real estate totaled $938 and $1,131, respectively. In addition, nonaccrual residential mortgage loans that are in the process of foreclosure had a recorded investment of $1,492 and $988 as of December 31, 2016 and December 31, 2015, respectively.
The following table presents the recorded investment of nonaccrual loans and loans past due 90 days or more and still accruing by class of loans as of December 31, 2016 and 2015:
|
|
Loans Past Due 90 Days
And Still Accruing
|
Nonaccrual
|
||||||
|
December 31, 2016
|
||||||||
|
Residential real estate
|
$
|
132
|
$
|
3,445
|
||||
|
Commercial real estate:
|
||||||||
|
Owner-occupied
|
28
|
1,571
|
||||||
|
Nonowner-occupied
|
----
|
2,506
|
||||||
|
Construction
|
----
|
527
|
||||||
|
Commercial and industrial
|
----
|
867
|
||||||
|
Consumer:
|
||||||||
|
Automobile
|
121
|
5
|
||||||
|
Home equity
|
----
|
34
|
||||||
|
Other
|
46
|
6
|
||||||
|
Total
|
$
|
327
|
$
|
8,961
|
||||
28
NOTES TO THE CONSOLIDATED FINANCIAL STATEMENTS
Note D – Loans and Allowance for Loan Losses (continued)
|
|
Loans Past Due 90 Days
And Still Accruing
|
Nonaccrual
|
||||||
|
December 31, 2015
|
||||||||
|
Residential real estate
|
$
|
20
|
$
|
2,048
|
||||
|
Commercial real estate:
|
||||||||
|
Owner-occupied
|
----
|
404
|
||||||
|
Nonowner-occupied
|
----
|
2,737
|
||||||
|
Construction
|
----
|
769
|
||||||
|
Commercial and industrial
|
----
|
1,152
|
||||||
|
Consumer:
|
||||||||
|
Automobile
|
18
|
27
|
||||||
|
Home equity
|
----
|
96
|
||||||
|
Other
|
1
|
3
|
||||||
|
Total
|
$
|
39
|
$
|
7,236
|
||||
The following table presents the aging of the recorded investment of past due loans by class of loans as of December 31, 2016 and 2015:
|
December 31, 2016
|
30-59
Days
Past Due
|
60-89
Days
Past Due
|
90 Days
Or More
Past Due
|
Total
Past Due
|
Loans Not
Past Due
|
Total
|
||||||||||||||||||
|
Residential real estate
|
$
|
3,728
|
$
|
953
|
$
|
2,201
|
$
|
6,882
|
$
|
279,140
|
$
|
286,022
|
||||||||||||
|
Commercial real estate:
|
||||||||||||||||||||||||
|
Owner-occupied
|
134
|
366
|
1,325
|
1,825
|
75,780
|
77,605
|
||||||||||||||||||
|
Nonowner-occupied
|
261
|
18
|
2,506
|
2,785
|
87,747
|
90,532
|
||||||||||||||||||
|
Construction
|
66
|
52
|
182
|
300
|
45,570
|
45,870
|
||||||||||||||||||
|
Commercial and industrial
|
1,283
|
483
|
800
|
2,566
|
98,023
|
100,589
|
||||||||||||||||||
|
Consumer:
|
||||||||||||||||||||||||
|
Automobile
|
1,091
|
221
|
126
|
1,438
|
58,334
|
59,772
|
||||||||||||||||||
|
Home equity
|
349
|
45
|
----
|
394
|
20,467
|
20,861
|
||||||||||||||||||
|
Other
|
685
|
155
|
46
|
886
|
52,764
|
53,650
|
||||||||||||||||||
|
|
||||||||||||||||||||||||
|
Total
|
$
|
7,597
|
$
|
2,293
|
$
|
7,186
|
$
|
17,076
|
$
|
717,825
|
$
|
734,901
|
||||||||||||
|
December 31, 2015
|
30-59
Days
Past Due
|
60-89
Days
Past Due
|
90 Days
Or More
Past Due
|
Total
Past Due
|
Loans Not
Past Due
|
Total
|
||||||||||||||||||
|
Residential real estate
|
$
|
2,564
|
$
|
1,484
|
$
|
1,708
|
$
|
5,756
|
$
|
218,119
|
$
|
223,875
|
||||||||||||
|
Commercial real estate:
|
||||||||||||||||||||||||
|
Owner-occupied
|
141
|
33
|
371
|
545
|
72,913
|
73,458
|
||||||||||||||||||
|
Nonowner-occupied
|
35
|
334
|
2,737
|
3,106
|
68,896
|
72,002
|
||||||||||||||||||
|
Construction
|
----
|
2
|
769
|
771
|
23,081
|
23,852
|
||||||||||||||||||
|
Commercial and industrial
|
31
|
88
|
1,077
|
1,196
|
80,740
|
81,936
|
||||||||||||||||||
|
Consumer:
|
||||||||||||||||||||||||
|
Automobile
|
727
|
197
|
36
|
960
|
43,606
|
44,566
|
||||||||||||||||||
|
Home equity
|
75
|
----
|
76
|
151
|
20,690
|
20,841
|
||||||||||||||||||
|
Other
|
420
|
104
|
4
|
528
|
44,694
|
45,222
|
||||||||||||||||||
|
|
||||||||||||||||||||||||
|
Total
|
$
|
3,993
|
$
|
2,242
|
$
|
6,778
|
$
|
13,013
|
$
|
572,739
|
$
|
585,752
|
||||||||||||
Troubled Debt Restructurings:
A troubled debt restructuring ("TDR") occurs when the Company has agreed to a loan modification in the form of a concession for a borrower who is experiencing financial difficulty. All TDR's are considered to be impaired. The modification of the terms of such loans included one or a combination of the following: a reduction of the stated interest rate of the loan; an extension of the maturity date at a stated rate of interest lower than the current market rate for new debt with similar risk; a reduction in the contractual principal and interest payments of the loan; or short-term interest-only payment terms.
29
NOTES TO THE CONSOLIDATED FINANCIAL STATEMENTS
Note D – Loans and Allowance for Loan Losses (continued)
The Company has allocated reserves for a portion of its TDR's to reflect the fair values of the underlying collateral or the present value of the concessionary terms granted to the customer.
The following table presents the types of TDR loan modifications by class of loans as of December 31, 2016 and December 31, 2015:
|
|
TDR's
Performing to
Modified Terms
|
TDR's Not
Performing to
Modified Terms
|
Total
TDR's
|
|||||||||
|
December 31, 2016
|
||||||||||||
|
Residential real estate:
|
||||||||||||
|
Interest only payments
|
$
|
717
|
$
|
----
|
$
|
717
|
||||||
|
Commercial real estate:
|
||||||||||||
|
Owner-occupied
|
||||||||||||
|
Interest only payments
|
284
|
----
|
284
|
|||||||||
|
Rate reduction
|
----
|
232
|
232
|
|||||||||
|
Reduction of principal and interest payments
|
579
|
----
|
579
|
|||||||||
|
Maturity extension at lower stated rate than market rate
|
1,582
|
----
|
1,582
|
|||||||||
|
Nonowner-occupied
|
||||||||||||
|
Interest only payments
|
600
|
2,210
|
2,810
|
|||||||||
|
Rate reduction
|
384
|
----
|
384
|
|||||||||
|
Credit extension at lower stated rate than market rate
|
574
|
----
|
574
|
|||||||||
|
Commercial and industrial
|
||||||||||||
|
Interest only payments
|
8,074
|
----
|
8,074
|
|||||||||
|
Credit extension at lower stated rate than market rate
|
----
|
391
|
391
|
|||||||||
|
Consumer:
|
||||||||||||
|
Home equity
|
||||||||||||
|
Maturity extension at lower stated rate than market rate
|
213
|
----
|
213
|
|||||||||
|
Credit extension at lower stated rate than market rate
|
203
|
----
|
203
|
|||||||||
|
Total TDR's
|
$
|
13,210
|
$
|
2,833
|
$
|
16,043
|
||||||
|
|
TDR's
Performing to
Modified Terms
|
TDR's Not
Performing to
Modified Terms
|
Total
TDR's
|
|||||||||
|
December 31, 2015
|
||||||||||||
|
Residential real estate:
|
||||||||||||
|
Interest only payments
|
$
|
1,001
|
$
|
----
|
$
|
1,001
|
||||||
|
Commercial real estate:
|
||||||||||||
|
Owner-occupied
|
||||||||||||
|
Interest only payments
|
433
|
----
|
433
|
|||||||||
|
Rate reduction
|
----
|
232
|
232
|
|||||||||
|
Reduction of principal and interest payments
|
604
|
----
|
604
|
|||||||||
|
Maturity extension at lower stated rate than market rate
|
1,996
|
----
|
1,996
|
|||||||||
|
Credit extension at lower stated rate than market rate
|
204
|
----
|
204
|
|||||||||
|
Nonowner-occupied
|
||||||||||||
|
Interest only payments
|
300
|
2,473
|
2,773
|
|||||||||
|
Rate reduction
|
396
|
----
|
396
|
|||||||||
|
Commercial and industrial
|
||||||||||||
|
Interest only payments
|
7,579
|
----
|
7,579
|
|||||||||
|
Credit extension at lower stated rate than market rate
|
226
|
391
|
617
|
|||||||||
|
Consumer:
|
||||||||||||
|
Home equity
|
||||||||||||
|
Maturity extension at lower stated rate than market rate
|
218
|
----
|
218
|
|||||||||
|
Total TDR's
|
$
|
12,957
|
$
|
3,096
|
$
|
16,053
|
||||||
30
NOTES TO THE CONSOLIDATED FINANCIAL STATEMENTS
Note D – Loans and Allowance for Loan Losses (continued)
During the twelve months ended December 31, 2016, the TDR's described above decreased the allowance for loan losses and provision expense by $1,112, with corresponding charge-offs of $11. During the year ended December 31, 2015, the TDR's described above increased the allowance for loan losses and provision expense by $93 with corresponding charge-offs of $1,422. The charge-offs of $1,422 during 2015 included $1,304 that were related to specific reserves that had already been provided for during 2014, and, as a result, did not impact provision expense during 2015.
At December 31, 2016, the balance in TDR loans decreased $10, or 0.1%, from year-end 2015. The Company had 82% of its TDR's performing according to their modified terms at December 31, 2016, as compared to 81% at December 31, 2015. The Company's specific allocations in reserves to customers whose loan terms have been modified in TDR's totaled $546 at December 31, 2016, as compared to $1,669 in reserves at December 31, 2015. Lower specific reserves in 2016 was impacted by the reduction of $1,160 in specific reserves that were previously related to one commercial and industrial loan relationship. During the second quarter of 2016, a re-evaluation of this borrower's financial performance identified significant improvement, which resulted in a credit quality upgrade to the borrower relationship and no identified collateral impairment. At December 31, 2016, the Company had $2,427 in commitments to lend additional amounts to customers with outstanding loans that are classified as TDR's, as compared to $995 at December 31, 2015.
The following table presents the pre- and post-modification balances of TDR loan modifications by class of loans that occurred during the years ended December 31, 2016 and 2015:
|
|
TDR's
Performing to Modified Terms
|
TDR's Not
Performing to Modified Terms
|
||||||||||||||
|
|
Pre-Modification
Recorded
Investment
|
Post-Modification
Recorded
Investment
|
Pre-Modification
Recorded
Investment
|
Post-Modification
Recorded
Investment
|
||||||||||||
|
December 31, 2016
|
||||||||||||||||
|
Commercial real estate:
|
||||||||||||||||
|
Nonowner-occupied
|
||||||||||||||||
|
Interest only payments
|
$
|
----
|
$
|
----
|
$
|
226
|
$
|
226
|
||||||||
|
Credit extension at lower stated rate than market rate
|
574
|
574
|
----
|
----
|
||||||||||||
|
|
||||||||||||||||
|
Total TDR's
|
$
|
574
|
$
|
574
|
$
|
226
|
$
|
226
|
||||||||
|
TDR's
Performing to Modified Terms
|
TDR's Not
Performing to Modified Terms
|
|||||||||||||||
|
|
Pre-Modification
Recorded
Investment
|
Post-Modification
Recorded
Investment
|
Pre-Modification
Recorded
Investment
|
Post-Modification
Recorded
Investment
|
||||||||||||
|
December 31, 2015
|
||||||||||||||||
|
Residential real estate
|
||||||||||||||||
|
Interest only payments
|
$
|
495
|
$
|
495
|
----
|
----
|
||||||||||
|
Commercial real estate:
|
||||||||||||||||
|
Owner-occupied
|
||||||||||||||||
|
Maturity extension at lower stated rate than market rate
|
1,025
|
1,025
|
----
|
----
|
||||||||||||
|
Commercial and industrial
|
||||||||||||||||
|
Credit extension at lower stated rate than market rate
|
226
|
226
|
----
|
----
|
||||||||||||
|
|
||||||||||||||||
|
Total TDR's
|
$
|
1,746
|
$
|
1,746
|
----
|
----
|
||||||||||
31
NOTES TO THE CONSOLIDATED FINANCIAL STATEMENTS
Note D - Loans and Allowance for Loan Losses (continued)
During the twelve months ended December 31, 2016, the Company placed one commercial real estate TDR totaling $226 on nonaccrual status. The borrower continues to experience financial difficulty and the Company has started the foreclosure process. The Company reviewed the loan's collateral during the third quarter and identified $11 in collateral impairment, which resulted in a partial charge-off of principal. There were no specific allocations of the allowance for loan losses recorded on the impaired TDR loan at December 31, 2016. All of the Company's loans that were restructured during the twelve months ended December 31, 2015 were performing in accordance with their modified terms. Excluding the commercial real estate loan of $226 previously mentioned, there were no other TDR's described above at December 31, 2016 and 2015 that experienced any payment defaults within twelve months following their loan modification. A default is considered to have occurred once the TDR is past due 90 days or more or it has been placed on nonaccrual. TDR loans are returned to accrual status when all the principal and interest amounts contractually due are brought current and future payments are reasonably assured. The loans modified during the twelve months ended December 31, 2016 increased the provision expense and the allowance for loan losses by $11. As of December 31, 2016, the Company had no allocation of reserves to customers whose loan terms were modified during the year ended 2016. The loans modified during the twelve months ended December 31, 2015 had no impact on the provision expense or the allowance for loan losses. As of December 31, 2015, the Company had no allocation of reserves to customers whose loan terms were modified during the year ended of 2015.
Credit Quality Indicators:
The Company categorizes loans into risk categories based on relevant information about the ability of borrowers to service their debt, such as: current financial information, historical payment experience, credit documentation, public information, and current economic trends, among other factors. These risk categories are represented by a loan grading scale from 1 through 11. The Company analyzes loans individually with a higher credit risk rating and groups these loans into categories called "criticized" and "classified" assets. The Company considers its criticized assets to be loans that are graded 8 and its classified assets to be loans that are graded 9 through 11. The Company's risk categories are reviewed at least annually on loans that have aggregate borrowing amounts that meet or exceed $500.
The Company uses the following definitions for its criticized loan risk ratings:
Special Mention. Loans classified as special mention indicate considerable risk due to deterioration of repayment (in the earliest stages) due to potential weak primary repayment source, or payment delinquency. These loans will be under constant supervision, are not classified and do not expose the institution to sufficient risks to warrant classification. These deficiencies should be correctable within the normal course of business, although significant changes in company structure or policy may be necessary to correct the deficiencies. These loans are considered bankable assets with no apparent loss of principal or interest envisioned. The perceived risk in continued lending is considered to have increased beyond the level where such loans would normally be granted. Credits that are defined as a troubled debt restructuring should be graded no higher than special mention until they have been reported as performing over one year after restructuring.
The Company uses the following definitions for its classified loan risk ratings:
Substandard. Loans classified as substandard represent very high risk, serious delinquency, nonaccrual, or unacceptable credit. Repayment through the primary source of repayment is in jeopardy due to the existence of one or more well defined weaknesses and the collateral pledged may inadequately protect collection of the loans. Loss of principal is not likely if weaknesses are corrected, although financial statements normally reveal significant weakness. Loans are still considered collectible, although loss of principal is more likely than with special mention loan grade 8 loans. Collateral liquidation considered likely to satisfy debt.
Doubtful. Loans classified as doubtful display a high probability of loss, although the amount of actual loss at the time of classification is undetermined. This should be a temporary category until such time that actual loss can be identified, or improvements made to reduce the seriousness of the classification. These loans exhibit all substandard characteristics with the addition that weaknesses make collection or liquidation in full highly questionable and improbable. This classification consists of loans where the possibility of loss is high after collateral liquidation based upon existing facts, market conditions, and value. Loss is deferred until certain important and reasonable specific pending factors which may strengthen the credit can be more accurately determined. These factors may include proposed acquisitions, liquidation procedures, capital injection, and receipt of additional collateral, mergers, or refinancing plans. A doubtful classification for an entire credit should be avoided when collection of a specific portion appears highly probable with the adequately secured portion graded substandard.
32
NOTES TO THE CONSOLIDATED FINANCIAL STATEMENTS
Note D - Loans and Allowance for Loan Losses (continued)
Loss. Loans classified as loss are considered uncollectible and are of such little value that their continuance as bankable assets is not warranted. This classification does not mean that the credit has absolutely no recovery or salvage value, but rather it is not practical or desirable to defer writing off this asset yielding such a minimum value even though partial recovery may be affected in the future. Amounts classified as loss should be promptly charged off.
Criticized and classified loans will mostly consist of commercial and industrial and commercial real estate loans. The Company considers its loans that do not meet the criteria for a criticized and classified asset rating as pass rated loans, which will include loans graded from 1 (Prime) to 7 (Watch). All commercial loans are categorized into a risk category either at the time of origination or re-evaluation date. As of December 31, 2016 and December 31, 2015, and based on the most recent analysis performed, the risk category of commercial loans by class of loans is as follows:
|
December 31, 2016
|
Pass
|
Criticized
|
Classified
|
Total
|
||||||||||||
|
Commercial real estate:
|
||||||||||||||||
|
Owner-occupied
|
$
|
66,495
|
$
|
428
|
$
|
10,682
|
$
|
77,605
|
||||||||
|
Nonowner-occupied
|
83,103
|
2,364
|
5,065
|
90,532
|
||||||||||||
|
Construction
|
45,325
|
----
|
545
|
45,870
|
||||||||||||
|
Commercial and industrial
|
94,091
|
188
|
6,310
|
100,589
|
||||||||||||
|
Total
|
$
|
289,014
|
$
|
2,980
|
$
|
22,602
|
$
|
314,596
|
||||||||
|
December 31, 2015
|
Pass
|
Criticized
|
Classified
|
Total
|
||||||||||||
|
Commercial real estate:
|
||||||||||||||||
|
Owner-occupied
|
$
|
62,287
|
$
|
6,738
|
$
|
4,433
|
$
|
73,458
|
||||||||
|
Nonowner-occupied
|
61,577
|
6,305
|
4,120
|
72,002
|
||||||||||||
|
Construction
|
23,080
|
----
|
772
|
23,852
|
||||||||||||
|
Commercial and industrial
|
70,852
|
5,232
|
5,852
|
81,936
|
||||||||||||
|
Total
|
$
|
217,796
|
$
|
18,275
|
$
|
15,177
|
$
|
251,248
|
||||||||
The Company also obtains the credit scores of its borrowers upon origination (if available by the credit bureau) but not thereafter. The Company focuses mostly on the performance and repayment ability of the borrower as an indicator of credit risk and does not consider a borrower's credit score to be a significant influence in the determination of a loan's credit risk grading.
For residential and consumer loan classes, the Company evaluates credit quality based on the aging status of the loan, which was previously presented, and by payment activity. The following table presents the recorded investment of residential and consumer loans by class of loans based on payment activity as of December 31, 2016 and December 31, 2015:
|
|
Consumer
|
||||||||||||||||||||
|
December 31, 2016
|
Automobile
|
Home Equity
|
Other
|
Residential
Real Estate
|
Total
|
||||||||||||||||
|
Performing
|
$
|
59,646
|
$
|
20,827
|
$
|
53,598
|
$
|
282,445
|
$
|
416,516
|
|||||||||||
|
Nonperforming
|
126
|
34
|
52
|
3,577
|
3,789
|
||||||||||||||||
|
Total
|
$
|
59,772
|
$
|
20,861
|
$
|
53,650
|
$
|
286,022
|
$
|
420,305
|
|||||||||||
|
|
Consumer
|
||||||||||||||||||||
|
December 31, 2015
|
Automobile
|
Home Equity
|
Other
|
Residential
Real Estate
|
Total
|
||||||||||||||||
|
Performing
|
$
|
44,521
|
$
|
20,745
|
$
|
45,218
|
$
|
221,807
|
$
|
332,291
|
|||||||||||
|
Nonperforming
|
45
|
96
|
4
|
2,068
|
2,213
|
||||||||||||||||
|
Total
|
$
|
44,566
|
$
|
20,841
|
$
|
45,222
|
$
|
223,875
|
$
|
334,504
|
|||||||||||
33
NOTES TO THE CONSOLIDATED FINANCIAL STATEMENTS
Note D - Loans and Allowance for Loan Losses (continued)
The Company, through its subsidiaries, grants residential, consumer, and commercial loans to customers located primarily in the southeastern area of Ohio as well as the western counties of West Virginia. Approximately 5.61% of total loans were unsecured at December 31, 2016, down from 6.06% at December 31, 2015.
Note E - Premises and Equipment
Following is a summary of premises and equipment at December 31:
|
|
2016
|
2015
|
||||||
|
Land
|
$
|
2,348
|
$
|
2,055
|
||||
|
Buildings
|
13,247
|
10,890
|
||||||
|
Leasehold improvements
|
1,238
|
2,066
|
||||||
|
Furniture and equipment
|
5,085
|
4,334
|
||||||
|
|
21,918
|
19,345
|
||||||
|
Less accumulated depreciation
|
9,135
|
8,941
|
||||||
|
Total premises and equipment
|
$
|
12,783
|
$
|
10,404
|
||||
The following is a summary of the future minimum operating lease payments for facilities leased by the Company. Operating lease expense was $464 in 2016, $464 in 2015, and $515 in 2014.
|
2017
|
$
|
332
|
||
|
2018
|
181
|
|||
|
2019
|
54
|
|||
|
2020
|
49
|
|||
|
2021
|
25
|
|||
|
$
|
641
|
Note F – Goodwill and Intangible Assets
Goodwill: The change in goodwill during the year is as follows:
|
|
2016
|
|||
|
Beginning of year
|
$
|
1,267
|
||
|
Acquired goodwill
|
6,534
|
|||
|
Impairment
|
----
|
|||
|
End of year
|
$
|
7,801
|
||
Impairment exists when a reporting unit's carrying value of goodwill exceeds its fair value. At December 31, 2016, the Company's reporting unit had positive equity and the Company elected to perform a qualitative assessment to determine if it was more likely than not that fair value of the reporting unit exceeded its carrying value, including goodwill. The qualitative assessment indicated that it is more likely than not that fair value of goodwill is more than the carrying value, resulting in no impairment. Therefore, the Company did not proceed to step one of the annual goodwill impairment testing requirement.
Acquired intangible assets: Acquired intangible assets were as follows at year-end:
|
|
2016
|
|||||||
|
|
Gross
Carrying
Amount
|
Accumulated
Amortization
|
||||||
|
Amortized intangible assets:
|
||||||||
|
Core deposit intangibles
|
$
|
738
|
$
|
68
|
||||
|
Other customer relationship intangibles
|
----
|
----
|
||||||
|
Total
|
$
|
738
|
$
|
68
|
||||
|
Amortized intangible assets:
|
Aggregate amortization expense was $68 for 2016.
34
NOTES TO THE CONSOLIDATED FINANCIAL STATEMENTS
Note F – Goodwill and Intangible Assets (continued)
Estimated amortization expense for each of the next five years:
|
2017
|
$
|
156
|
||
|
2018
|
135
|
|||
|
2019
|
114
|
|||
|
2020
|
94
|
|||
|
2021
|
74
|
|||
|
Thereafter
|
97
|
|||
|
Total
|
$
|
670
|
Note G - Deposits
Following is a summary of interest-bearing deposits at December 31:
|
|
2016
|
2015
|
||||||
|
NOW accounts
|
$
|
155,051
|
$
|
124,524
|
||||
|
Savings and Money Market
|
237,761
|
200,976
|
||||||
|
Time:
|
||||||||
|
In denominations of $250,000 or less
|
168,546
|
146,975
|
||||||
|
In denominations of more than $250,000
|
19,518
|
11,772
|
||||||
|
Total time deposits
|
188,064
|
158,747
|
||||||
|
Total interest-bearing deposits
|
$
|
580,876
|
$
|
484,247
|
||||
Following is a summary of total time deposits by remaining maturity at December 31, 2016:
|
2017
|
$
|
100,447
|
||
|
2018
|
53,559
|
|||
|
2019
|
17,611
|
|||
|
2020
|
11,401
|
|||
|
2021
|
4,570
|
|||
|
Thereafter
|
476
|
|||
|
Total
|
$
|
188,064
|
Brokered deposits, included in time deposits, were $22,463 and $28,998 at December 31, 2016 and 2015, respectively.
Note H - Interest Rate Swaps
The Company manages economic risks, including interest rate, liquidity, and credit risk, primarily by managing the amount, sources, and duration of its assets and liabilities. The Company utilizes interest rate swap agreements as part of its asset/liability management strategy to help manage its interest rate risk position. As part of this strategy, the Company provides its customer with a fixed-rate loan while creating a variable-rate asset for the Company by the customer entering into an interest rate swap with the Company on terms that match the loan. The Company offsets its risk exposure by entering into an offsetting interest rate swap with an unaffiliated institution. These interest rate swaps do not qualify as designated hedges; therefore, each swap is accounted for as a standalone derivative. At December 31, 2016, the Company had interest rate swaps associated with commercial loans with a notional value of $9,725 and a fair value of $22. This is compared to interest rate swaps with a notional value of $10,727 and a fair value of $29 at December 31, 2015. The notional amount of the interest rate swaps does not represent amounts exchanged by the parties. The amount exchanged is determined by reference to the notional amount and the other terms of the individual interest rate swap agreement. To further offset the risk exposure related to market value fluctuations of its interest rate swaps, the Company maintains collateral deposits on hand with a third-party correspondent, which totaled $350 at December 31, 2016 and December 31, 2015.
35
NOTES TO THE CONSOLIDATED FINANCIAL STATEMENTS
Note I - Other Borrowed Funds
Other borrowed funds at December 31, 2016 and 2015 are comprised of advances from the Federal Home Loan Bank ("FHLB") of Cincinnati and promissory notes. At December 31, 2016 and 2015, FHLB Borrowings included $73 and $117 in capitalized lease obligations, respectively.
|
FHLB Borrowings
|
Promissory Notes
|
Totals
|
||||||||||||
|
2016
|
$
|
29,203
|
$
|
7,882
|
$
|
37,085
|
||||||||
|
2015
|
$
|
20,028
|
$
|
3,918
|
$
|
23,946
|
||||||||
Pursuant to collateral agreements with the FHLB, advances are secured by $275,836 in qualifying mortgage loans, $71,443 in commercial loans and $5,365 in FHLB stock at December 31, 2016. Fixed-rate FHLB advances of $29,130 mature through 2042 and have interest rates ranging from 1.34% to 3.31% and a year-to-date weighted average cost of 2.08% at December 31, 2016 and 2015, respectively. There were no variable-rate FHLB borrowings at December 31, 2016.
At December 31, 2016, the Company had a cash management line of credit enabling it to borrow up to $75,000 from the FHLB. All cash management advances have an original maturity of 90 days. The line of credit must be renewed on an annual basis. There was $75,000 available on this line of credit at December 31, 2016.
Based on the Company's current FHLB stock ownership, total assets and pledgeable loans, the Company had the ability to obtain borrowings from the FHLB up to a maximum of $221,757 at December 31, 2016. Of this maximum borrowing capacity of $221,757, the Company had $147,627 available to use as additional borrowings, of which $75,000 could be used for short-term, cash management advances, as mentioned above.
Promissory notes, issued primarily by Ohio Valley, are due at various dates through a final maturity date of August 1, 2026, and have fixed rates ranging from 1.25% to 4.09% and a year-to-date weighted average cost of 2.34% at December 31, 2016, as compared to 1.38% at December 31, 2015. At December 31, 2016, there was one $360 promissory note payable by Ohio Valley to related parties. See Note M for further discussion of related party transactions. Promissory notes payable to other banks totaled $3,899 at December 31, 2016.
Letters of credit issued on the Bank's behalf by the FHLB to collateralize certain public unit deposits as required by law totaled $45,000 at December 31, 2016 and $34,800 at December 31, 2015.
Scheduled principal payments over the next five years:
|
FHLB Borrowings
|
Promissory Notes
|
Totals
|
||||||||||
|
2017
|
$
|
5,564
|
$
|
2,061
|
$
|
7,625
|
||||||
|
2018
|
2,313
|
2,140
|
4,453
|
|||||||||
|
2019
|
2,210
|
1,218
|
3,428
|
|||||||||
|
2020
|
2,083
|
519
|
2,602
|
|||||||||
|
2021
|
1,832
|
541
|
2,373
|
|||||||||
|
Thereafter
|
15,201
|
1,403
|
16,604
|
|||||||||
|
$
|
29,203
|
$
|
7,882
|
$
|
37,085
|
|||||||
Note J - Subordinated Debentures and Trust Preferred Securities
On March 22, 2007, a trust formed by Ohio Valley issued $8,500 of adjustable-rate trust preferred securities as part of a pooled offering of such securities. The rate on these trust preferred securities was fixed at 6.58% for five years, and then converted to a floating-rate term on March 15, 2012, based on a rate equal to the 3-month LIBOR plus 1.68%. The interest rate on these trust preferred securities was 2.64% at December 31, 2016 and 2.19% at December 31, 2015. There were no debt issuance costs incurred with these trust preferred securities. The Company issued subordinated debentures to the trust in exchange for the proceeds of the offering. The subordinated debentures must be redeemed no later than June 15, 2037.
36
NOTES TO THE CONSOLIDATED FINANCIAL STATEMENTS
Note J - Subordinated Debentures and Trust Preferred Securities (continued)
Under the provisions of the related indenture agreements, the interest payable on the trust preferred securities is deferrable for up to five years and any such deferral is not considered a default. During any period of deferral, the Company would be precluded from declaring or paying dividends to shareholders or repurchasing any of the Company's common stock. Under generally accepted accounting principles, the trusts are not consolidated with the Company. Accordingly, the Company does not report the securities issued by the trust as liabilities, and instead reports as liabilities the subordinated debentures issued by the Company and held by the trust. Since the Company's equity interest in the trusts cannot be received until the subordinated debentures are repaid, these amounts have been netted. The subordinated debentures may be included in Tier 1 capital (with certain limitations applicable) under current regulatory guidelines and interpretations.
Note K - Income Taxes
The provision for income taxes consists of the following components:
|
|
2016
|
2015
|
2014
|
|||||||||
|
Current tax expense
|
$
|
2,645
|
$
|
2,218
|
$
|
3,637
|
||||||
|
Deferred tax (benefit) expense
|
(725
|
)
|
591
|
(517
|
)
|
|||||||
|
Total income taxes
|
$
|
1,920
|
$
|
2,809
|
$
|
3,120
|
||||||
The source of deferred tax assets and deferred tax liabilities at December 31:
|
|
2016
|
2015
|
||||||
|
Items giving rise to deferred tax assets:
|
||||||||
|
Allowance for loan losses
|
$
|
2,538
|
$
|
2,302
|
||||
|
Unrealized loss on securities available for sale
|
510
|
----
|
||||||
|
Deferred compensation
|
2,194
|
2,089
|
||||||
|
Deferred loan fees/costs
|
248
|
273
|
||||||
|
Other real estate owned
|
719
|
370
|
||||||
|
Accrued bonus
|
240
|
166
|
||||||
|
Purchase accounting adjustments
|
305
|
----
|
||||||
|
Net operating loss
|
258
|
----
|
||||||
|
Other
|
275
|
143
|
||||||
|
Items giving rise to deferred tax liabilities:
|
||||||||
|
Mortgage servicing rights
|
(134
|
)
|
(149
|
)
|
||||
|
FHLB stock dividends
|
(1,078
|
)
|
(1,074
|
)
|
||||
|
Unrealized gain on securities available for sale
|
----
|
(157
|
)
|
|||||
|
Prepaid expenses
|
(283
|
)
|
(234
|
)
|
||||
|
Depreciation and amortization
|
(823
|
)
|
(740
|
)
|
||||
|
Other
|
(4
|
)
|
(5
|
)
|
||||
|
Net deferred tax asset
|
$
|
4,965
|
$
|
2,984
|
||||
The Company determined that it was not required to establish a valuation allowance for deferred tax assets since management believes that the deferred tax assets are likely to be realized through the future reversals of existing taxable temporary differences, deductions against forecasted income and tax planning strategies.
At December 31, 2016, the Company had Section 382 net operating loss carryforwards of approximately $758 that will expire in 2026.
37
NOTES TO THE CONSOLIDATED FINANCIAL STATEMENTS
Note K - Income Taxes (continued)
The difference between the financial statement tax provision and amounts computed by applying the statutory federal income tax rate of 34% to income before taxes is as follows:
|
|
2016
|
2015
|
2014
|
|||||||||
|
Statutory tax
|
$
|
3,006
|
$
|
3,870
|
$
|
3,806
|
||||||
|
Effect of nontaxable interest
|
(433
|
)
|
(437
|
)
|
(418
|
)
|
||||||
|
Effect of nontaxable insurance premiums
|
(340
|
)
|
(336
|
)
|
(142
|
)
|
||||||
|
Income from bank owned insurance, net
|
(239
|
)
|
(210
|
)
|
(217
|
)
|
||||||
|
Effect of postretirement benefits
|
(19
|
)
|
71
|
238
|
||||||||
|
Effect of nontaxable life insurance death proceeds
|
----
|
(11
|
)
|
----
|
||||||||
|
Effect of state income tax
|
64
|
66
|
73
|
|||||||||
|
Tax credits
|
(211
|
)
|
(221
|
)
|
(231
|
)
|
||||||
|
Milton Merger Costs
|
73
|
----
|
----
|
|||||||||
|
Other items
|
19
|
17
|
11
|
|||||||||
|
Total income taxes
|
$
|
1,920
|
$
|
2,809
|
$
|
3,120
|
||||||
At December 31, 2016 and December 31, 2015, the Company had no unrecognized tax benefits. The Company does not expect the amount of unrecognized tax benefits to significantly change within the next twelve months. As previously reported, the Internal Revenue Service ("IRS") has proposed that Loan Central, as a tax return preparer, be assessed a penalty for allegedly negotiating or endorsing checks issued by the U.S. Treasury to taxpayers. The penalty would amount to approximately $1.2 million. Loan Central appealed this matter within the IRS. Loan Central was notified that the Appeals Office will not concede the penalty, and the penalty has been assessed. The Company is employing further IRS procedures, and the IRS is currently processing the Company's claims. The matter may still be resolved at the IRS. If the matter is not resolved at the IRS, the matter may have to be resolved through the judicial system. Based on consultation with legal counsel, management remains confident that it is highly unlikely that the penalty recommendation will be sustained. Therefore, the Company did not recognize any interest and/or penalties related to this matter for the periods presented.
The Company is subject to U.S. federal income tax as well as West Virginia state income tax. The Company is no longer subject to federal or state examination for years prior to 2013. The tax years 2013-2015 remain open to federal and state examinations.
Note L - Commitments and Contingent Liabilities
The Bank is a party to financial instruments with off-balance sheet risk in the normal course of business to meet the financing needs of its customers. These financial instruments include commitments to extend credit, standby letters of credit and financial guarantees. The Bank's exposure to credit loss in the event of nonperformance by the other party to the financial instrument for commitments to extend credit and standby letters of credit, and financial guarantees written, is represented by the contractual amount of those instruments. The Bank uses the same credit policies in making commitments and conditional obligations as it does for instruments recorded on the balance sheet.
Following is a summary of such commitments at December 31:
|
|
2016
|
2015
|
||||||
|
Fixed rate
|
$
|
271
|
$
|
65
|
||||
|
Variable rate
|
61,786
|
59,028
|
||||||
|
Standby letters of credit
|
5,134
|
3,322
|
||||||
The interest rate on fixed-rate commitments ranged from 3.75% to 6.25% at December 31, 2016.
38
NOTES TO THE CONSOLIDATED FINANCIAL STATEMENTS
Note L - Commitments and Contingent Liabilities (continued)
Commitments to extend credit are agreements to lend to a customer as long as there is no violation of any condition established in the contract. Commitments generally have fixed expiration dates or other termination clauses and may require payment of a fee. Standby letters of credit are conditional commitments issued by the Bank to guarantee the performance of a customer to a third party. Since many of the commitments are expected to expire without being drawn upon, the total commitment amounts do not necessarily represent future cash requirements. The Bank evaluates each customer's credit worthiness on a case-by-case basis. The amount of collateral obtained, if deemed necessary by the Bank upon extension of credit, is based on management's credit evaluation of the counterparty. Collateral held varies but may include accounts receivable, inventory, property, plant and equipment and income-producing commercial properties.
The Company participates as a facilitator of tax refunds pursuant to a clearing agreement with a third-party tax refund product provider. The clearing agreement is effective through December 31, 2019 and is renewable in 3-year increments. The agreement requires the Bank to process electronic refund checks ("ERC's") and electronic refund deposits ("ERD's") presented for payment on behalf of taxpayers containing taxpayer refunds. The Bank receives a fee paid by the third-party tax refund product provider for each transaction that is processed. The agreement is subject to termination if the Bank fails to perform the required clearing services and/or the Bank's regulators would require the Bank to cease offering the product presented within the agreement.
There are various contingent liabilities that are not reflected in the financial statements, including claims and legal actions arising in the ordinary course of business. In the opinion of management, after consultation with legal counsel, the ultimate disposition of these matters is not expected to have a material effect on financial condition or results of operations.
Note M - Related Party Transactions
Certain directors, executive officers and companies with which they are affiliated were loan customers during 2016. A summary of activity on these borrower relationships with aggregate debt greater than $120 is as follows:
|
Total loans at January 1, 2016
|
$
|
3,989
|
||
|
New loans
|
1,085
|
|||
|
Repayments
|
(528
|
)
|
||
|
Other changes
|
1,399
|
|||
|
Total loans at December 31, 2016
|
$
|
5,945
|
Other changes include adjustments for loans applicable to one reporting period that are excludable from the other reporting period, such as changes in persons classified as directors, executive officers and companies' affiliates.
Deposits from principal officers, directors, and their affiliates at year-end 2016 and 2015 were $38,867 and $30,169.
Note N - Employee Benefits
The Bank has a profit-sharing plan for the benefit of its employees and their beneficiaries. Contributions to the plan are determined by the Board of Directors of Ohio Valley. Contributions charged to expense were $290, $288, and $278 for 2016, 2015 and 2014.
39
NOTES TO THE CONSOLIDATED FINANCIAL STATEMENTS
Note N - Employee Benefits (continued)
Ohio Valley maintains an Employee Stock Ownership Plan (ESOP) covering substantially all employees of the Company. Ohio Valley issues shares to the ESOP, purchased by the ESOP with subsidiary cash contributions, which are allocated to ESOP participants based on relative compensation. The total number of shares held by the ESOP, all of which have been allocated to participant accounts, were 350,170 and 322,056 at December 31, 2016 and 2015. In addition, the subsidiaries made contributions to its ESOP Trust as follows:
|
|
Years ended December 31
|
|||||||||||
|
|
2016
|
2015
|
2014
|
|||||||||
|
|
||||||||||||
|
Number of shares issued
|
24,572
|
----
|
14,618
|
|||||||||
|
|
||||||||||||
|
Fair value of stock contributed
|
$
|
575
|
$
|
----
|
$
|
351
|
||||||
|
|
||||||||||||
|
Cash contributed
|
----
|
674
|
300
|
|||||||||
|
|
||||||||||||
|
Total expense
|
$
|
575
|
$
|
674
|
$
|
651
|
||||||
Life insurance contracts with a cash surrender value of $27,343 and annuity assets of $2,006 at December 31, 2016 have been purchased by the Company, the owner of the policies. The purpose of these contracts was to replace a current group life insurance program for executive officers, implement a deferred compensation plan for directors and executive officers, implement a director retirement plan and implement supplemental retirement plans for certain officers. Under the deferred compensation plan, Ohio Valley pays each participant the amount of fees deferred plus interest over the participant's desired term, upon termination of service. Under the director retirement plan, participants are eligible to receive ongoing compensation payments upon retirement subject to length of service. The supplemental retirement plans provide payments to select executive officers upon retirement based upon a compensation formula determined by Ohio Valley's Board of Directors. The present value of payments expected to be provided are accrued during the service period of the covered individuals and amounted to $6,328 and $6,033 at December 31, 2016 and 2015. Expenses related to the plans for each of the last three years amounted to $399, $338, and $604. In association with the split-dollar life insurance plan, the present value of the postretirement benefit totaled $3,007 at December 31, 2016 and $3,062 at December 31, 2015.
During the fourth quarter of 2015, the Company recorded $941 in proceeds expected to be received from the settlement of two BOLI policies. The triggering event occurred in December 2015, resulting in a $908 reduction to BOLI assets and a net gain of $33 that was recorded to income. The proceeds of $941 had not yet been collected by year-end 2015 and, therefore, were recorded as other assets at December 31, 2015.
Note O - Fair Value of Financial Instruments
Fair value is the exchange price that would be received for an asset or paid to transfer a liability (exit price) in the principal or most advantageous market for the asset or liability in an orderly transaction between market participants on the measurement date. There are three levels of inputs that may be used to measure fair values:
Level 1: Quoted prices (unadjusted) for identical assets or liabilities in active markets that the entity has the ability to access as of the measurement date.
Level 2: Significant other observable inputs other than Level 1 prices, such as quoted prices for similar assets or liabilities, quoted prices in markets that are not active, or other inputs that are observable or can be corroborated by observable market data.
Level 3: Significant unobservable inputs that reflect a company's own assumptions about the assumptions that market participants would use in pricing an asset or liability.
40
NOTES TO THE CONSOLIDATED FINANCIAL STATEMENTS
Note O - Fair Value of Financial Instruments (continued)
The following is a description of the Company's valuation methodologies used to measure and disclose the fair values of its financial assets and liabilities on a recurring or nonrecurring basis:
Securities: The fair values for securities are determined by quoted market prices, if available (Level 1). For securities where quoted prices are not available, fair values are calculated based on market prices of similar securities (Level 2). For securities where quoted prices or market prices of similar securities are not available, fair values are calculated using discounted cash flows or other market indicators (Level 3). During times when trading is more liquid, broker quotes are used (if available) to validate the model. Rating agency and industry research reports as well as defaults and deferrals on individual securities are reviewed and incorporated into the calculations.
Impaired Loans: At the time a loan is considered impaired, it is valued at the lower of cost or fair value. Impaired loans carried at fair value generally receive specific allocations of the allowance for loan losses. For collateral dependent loans, fair value is commonly based on recent real estate appraisals. These appraisals may utilize a single valuation approach or a combination of approaches including comparable sales and the income approach. Adjustments are routinely made in the appraisal process by the independent appraisers to adjust for differences between the comparable sales and income data available. Such adjustments are usually significant and typically result in a Level 3 classification of the inputs for determining fair value. Non-real estate collateral may be valued using an appraisal, net book value per the borrower's financial statements, or aging reports, adjusted or discounted based on management's historical knowledge, changes in market conditions from the time of the valuation, and management's expertise and knowledge of the client and client's business, resulting in a Level 3 fair value classification. Impaired loans are evaluated on a quarterly basis for additional impairment and adjusted accordingly.
Other Real Estate Owned: Assets acquired through or instead of loan foreclosure are initially recorded at fair value less costs to sell when acquired, establishing a new cost basis. These assets are subsequently accounted for at lower of cost or fair value less estimated costs to sell. Fair value is commonly based on recent real estate appraisals. These appraisals may utilize a single valuation approach or a combination of approaches including comparable sales and the income approach. Adjustments are routinely made in the appraisal process by the independent appraisers to adjust for differences between the comparable sales and income data available. Such adjustments are usually significant and typically result in a Level 3 classification of the inputs for determining fair value.
Appraisals for both collateral-dependent impaired loans and other real estate owned are performed by certified general appraisers (for commercial properties) or certified residential appraisers (for residential properties) whose qualifications and licenses have been reviewed and verified by the Company. Once received, a member of management reviews the assumptions and approaches utilized in the appraisal as well as the overall resulting fair value in comparison with management's own assumptions of fair value based on factors that include recent market data or industry-wide statistics. On an as-needed basis, the Company reviews the fair value of collateral, taking into consideration current market data, as well as all selling costs that typically approximate 10%.
41
NOTES TO THE CONSOLIDATED FINANCIAL STATEMENTS
Note O - Fair Value of Financial Instruments (continued)
Assets and Liabilities Measured on a Recurring Basis
Assets and liabilities measured at fair value on a recurring basis are summarized below:
|
|
Fair Value Measurements at December 31, 2016, Using
|
|||||||||||
|
|
Quoted Prices in
Active Markets
for Identical
Assets
(Level 1)
|
Significant Other
Observable
Inputs
(Level 2)
|
Significant
Unobservable
Inputs
(Level 3)
|
|||||||||
|
Assets:
|
||||||||||||
|
U.S. Government sponsored entity securities
|
----
|
$
|
10,544
|
----
|
||||||||
|
Agency mortgage-backed securities, residential
|
----
|
85,946
|
----
|
|||||||||
|
|
Fair Value Measurements at December 31, 2015, Using
|
|||||||||||
|
|
Quoted Prices in
Active Markets
for Identical
Assets
(Level 1)
|
Significant Other
Observable
Inputs
(Level 2)
|
Significant
Unobservable
Inputs
(Level 3)
|
|||||||||
|
Assets:
|
||||||||||||
|
U.S. Government sponsored entity securities
|
----
|
$
|
8,965
|
----
|
||||||||
|
Agency mortgage-backed securities, residential
|
----
|
82,686
|
----
|
|||||||||
There were no transfers between Level 1 and Level 2 during 2016 or 2015.
Assets and Liabilities Measured on a Nonrecurring Basis
Assets and liabilities measured at fair value on a nonrecurring basis are summarized below:
|
|
Fair Value Measurements at December 31, 2016, Using
|
|||||||||||
|
|
Quoted Prices in
Active Markets
for Identical
Assets
(Level 1)
|
Significant Other
Observable
Inputs
(Level 2)
|
Significant
Unobservable
Inputs
(Level 3)
|
|||||||||
|
Assets:
|
||||||||||||
|
Impaired loans:
|
||||||||||||
|
Commercial real estate:
|
||||||||||||
|
Owner-occupied
|
----
|
----
|
$
|
3,536
|
||||||||
|
Nonowner-occupied
|
----
|
----
|
1,985
|
|||||||||
|
Commercial and industrial
|
----
|
----
|
298
|
|||||||||
|
Other real estate owned:
|
||||||||||||
|
Commercial real estate:
|
||||||||||||
|
Construction
|
----
|
----
|
754
|
|||||||||
42
NOTES TO THE CONSOLIDATED FINANCIAL STATEMENTS
Note O - Fair Value of Financial Instruments (continued)
|
|
Fair Value Measurements at December 31, 2015, Using
|
|||||||||||
|
|
Quoted Prices in
Active Markets
for Identical
Assets
(Level 1)
|
Significant Other
Observable
Inputs
(Level 2)
|
Significant
Unobservable
Inputs
(Level 3)
|
|||||||||
|
Assets:
|
||||||||||||
|
Impaired loans:
|
||||||||||||
|
Commercial real estate:
|
||||||||||||
|
Nonowner-occupied
|
----
|
----
|
$
|
2,473
|
||||||||
|
Commercial and industrial
|
----
|
----
|
3,779
|
|||||||||
|
Other real estate owned:
|
||||||||||||
|
Commercial real estate:
|
||||||||||||
|
Construction
|
----
|
----
|
1,147
|
|||||||||
At December 31, 2016, the recorded investment of impaired loans measured for impairment using the fair value of collateral for collateral-dependent loans totaled $8,732, with a corresponding valuation allowance of $2,913, resulting in an increase of $2,509 in provision expense during the year ended December 31, 2016, with no corresponding charge-offs recognized. At December 31, 2015, the recorded investment of impaired loans measured for impairment using the fair value of collateral for collateral-dependent loans totaled $7,811, with a corresponding valuation allowance of $1,559, resulting in an increase of $741 in provision expense during the year ended December 31, 2015, with $1,422 in additional charge-offs recognized.
Other real estate owned that was measured at fair value less costs to sell at December 31, 2016 had a net carrying amount of $754, which is made up of the outstanding balance of $2,217, net of a valuation allowance of $1,463 at December 31, 2016. There were $393 in corresponding write-downs during 2016. Other real estate owned that was measured at fair value less costs to sell at December 31, 2015 had a net carrying amount of $1,147, which is made up of the outstanding balance of $2,217, net of a valuation allowance of $1,070 at December 31, 2015. There were no corresponding write-downs during 2015.
The following table presents quantitative information about Level 3 fair value measurements for financial instruments measured at fair value on a non-recurring basis at December 31, 2016 and December 31, 2015:
|
December 31, 2016
|
Fair Value
|
Valuation
Technique(s)
|
Unobservable
Input(s)
|
Range
|
(Weighted
Average)
|
||||||||
|
Impaired loans:
|
|||||||||||||
|
Commercial real estate:
|
|||||||||||||
|
Owner-occupied
|
$
|
3,536
|
Sales approach
|
Adjustment to comparables
|
0% to 65%
|
13.7
|
%
|
||||||
|
Cost approach
|
Adjustment to comparables
|
0% to 29.5%
|
14.8
|
%
|
|||||||||
|
Nonowner-occupied
|
1,985
|
Sales approach
|
Adjustment to comparables
|
0% to 250%
|
58.6
|
%
|
|||||||
|
Commercial and industrial
|
298
|
Sales approach
|
Adjustment to comparables
|
0.9% to 9.7%
|
5.2
|
%
|
|||||||
|
Other real estate owned:
|
|||||||||||||
|
Commercial real estate:
|
|
|
|
||||||||||
|
Construction
|
754
|
Sales approach
|
Adjustment to comparables
|
0% to 30%
|
11.7
|
% | |||||||
|
December 31, 2015
|
Fair Value
|
Valuation
Technique(s)
|
Unobservable
Input(s)
|
Range
|
(Weighted
Average)
|
||||||||
|
Impaired loans:
|
|||||||||||||
|
Commercial real estate:
|
|||||||||||||
|
Nonowner-occupied
|
$
|
2,473
|
Sales approach
|
Adjustment to comparables
|
0% to 12.5%
|
5.7
|
%
|
||||||
|
Commercial and industrial
|
3,779
|
Sales approach
|
Adjustment to comparables
|
0.9% to 30%
|
14.3
|
%
|
|||||||
|
Other real estate owned:
|
|||||||||||||
|
Commercial real estate:
|
|
|
|
||||||||||
|
Construction
|
1,147
|
Sales approach
|
Adjustment to comparables
|
0% to 35%
|
15.2 | % | |||||||
43
NOTES TO THE CONSOLIDATED FINANCIAL STATEMENTS
Note O - Fair Value of Financial Instruments (continued)
The carrying amounts and estimated fair values of financial instruments at December 31, 2016 and December 31, 2015 are as follows:
|
|
Fair Value Measurements at December 31, 2016 Using:
|
|||||||||||||||||||
|
|
Carrying
Value
|
Level 1
|
Level 2
|
Level 3
|
Total
|
|||||||||||||||
|
Financial Assets:
|
||||||||||||||||||||
|
Cash and cash equivalents
|
$
|
40,166
|
$
|
40,166
|
$
|
----
|
$
|
----
|
$
|
40,166
|
||||||||||
|
Certificates of deposit in financial institutions
|
1,670
|
----
|
1,670
|
----
|
1,670
|
|||||||||||||||
|
Securities available for sale
|
96,490
|
----
|
96,490
|
----
|
96,490
|
|||||||||||||||
|
Securities held to maturity
|
18,665
|
----
|
9,541
|
9,630
|
19,171
|
|||||||||||||||
|
Restricted investments in bank stocks
|
7,506
|
N/A
|
N/A
|
N/A
|
N/A
|
|||||||||||||||
|
Loans, net
|
727,202
|
----
|
----
|
727,079
|
727,079
|
|||||||||||||||
|
Accrued interest receivable
|
2,315
|
----
|
224
|
2,091
|
2,315
|
|||||||||||||||
|
|
||||||||||||||||||||
|
Financial Liabilities:
|
||||||||||||||||||||
|
Deposits
|
790,452
|
209,576
|
581,340
|
----
|
790,916
|
|||||||||||||||
|
Other borrowed funds
|
37,085
|
----
|
35,948
|
----
|
35,948
|
|||||||||||||||
|
Subordinated debentures
|
8,500
|
----
|
5,821
|
----
|
5,821
|
|||||||||||||||
|
Accrued interest payable
|
513
|
4
|
509
|
----
|
513
|
|||||||||||||||
|
|
Fair Value Measurements at December 31, 2015 Using:
|
|||||||||||||||||||
|
|
Carrying
Value
|
Level 1
|
Level 2
|
Level 3
|
Total
|
|||||||||||||||
|
Financial Assets:
|
||||||||||||||||||||
|
Cash and cash equivalents
|
$
|
45,530
|
$
|
45,530
|
$
|
----
|
$
|
----
|
$
|
45,530
|
||||||||||
|
Certificates of deposit in financial institutions
|
1,715
|
----
|
1,715
|
----
|
1,715
|
|||||||||||||||
|
Securities available for sale
|
91,651
|
----
|
91,651
|
----
|
91,651
|
|||||||||||||||
|
Securities held to maturity
|
19,903
|
----
|
9,814
|
10,976
|
20,790
|
|||||||||||||||
|
Federal Home Loan Bank and Federal Reserve Bank stock
|
6,576
|
N/A
|
N/A
|
N/A
|
N/A
|
|||||||||||||||
|
Loans, net
|
579,104
|
----
|
----
|
582,427
|
582,427
|
|||||||||||||||
|
Accrued interest receivable
|
1,819
|
----
|
224
|
1,595
|
1,819
|
|||||||||||||||
|
|
||||||||||||||||||||
|
Financial Liabilities:
|
||||||||||||||||||||
|
Deposits
|
660,746
|
176,499
|
484,636
|
----
|
661,135
|
|||||||||||||||
|
Other borrowed funds
|
23,946
|
----
|
23,672
|
----
|
23,672
|
|||||||||||||||
|
Subordinated debentures
|
8,500
|
----
|
5,368
|
----
|
5,368
|
|||||||||||||||
|
Accrued interest payable
|
449
|
4
|
445
|
----
|
449
|
|||||||||||||||
44
NOTES TO THE CONSOLIDATED FINANCIAL STATEMENTS
Note O - Fair Value of Financial Instruments (continued)
The methods and assumptions, not previously presented, used to estimate fair values are described as follows:
Cash and Cash Equivalents: The carrying amounts of cash and short-term instruments approximate fair values and are classified as Level 1.
Certificates of deposit in financial institutions: The carrying amounts of certificates of deposit in financial institutions approximate fair values and are classified as Level 2.
Securities Held to Maturity: The fair values for securities held to maturity are determined in the same manner as securities held for sale and discussed earlier in this note. Level 3 securities consist of nonrated municipal bonds and tax credit ("QZAB") bonds.
Restricted Investments in Bank Stocks: It is not practical to determine the fair value of Federal Home Loan Bank, Federal Reserve Bank and United Bankers Bank stock due to restrictions placed on its transferability.
Loans: Fair values of loans are estimated as follows: The fair value of fixed rate loans is estimated by discounting future cash flows using interest rates currently being offered for loans with similar terms to borrowers of similar credit quality resulting in a Level 3 classification. For variable rate loans that reprice frequently and with no significant change in credit risk, fair values are based on carrying values resulting in a Level 3 classification. Impaired loans are valued at the lower of cost or fair value as described previously. The methods utilized to estimate the fair value of loans do not necessarily represent an exit price.
Deposit Liabilities: The fair values disclosed for noninterest-bearing deposits are, by definition, equal to the amount payable on demand at the reporting date (i.e., their carrying amount) resulting in a Level 1 classification. The carrying amounts of variable rate, fixed-term money market accounts and certificates of deposit approximate their fair values at the reporting date resulting in a Level 2 classification. Fair values for fixed rate certificates of deposit are estimated using a discounted cash flows calculation that applies interest rates currently being offered on certificates to a schedule of aggregated expected monthly maturities on time deposits resulting in a Level 2 classification.
Other Borrowed Funds: The carrying values of the Company's short-term borrowings, generally maturing within ninety days, approximate their fair values resulting in a Level 2 classification. The fair values of the Company's long-term borrowings are estimated using discounted cash flow analyses based on the current borrowing rates for similar types of borrowing arrangements resulting in a Level 2 classification.
Subordinated Debentures: The fair values of the Company's Subordinated Debentures are estimated using discounted cash flow analyses based on the current borrowing rates for similar types of borrowing arrangements resulting in a Level 2 classification.
Accrued Interest Receivable and Payable: The carrying amount of accrued interest approximates fair value resulting in a classification that is consistent with the earning assets and interest-bearing liabilities with which it is associated.
Off-balance Sheet Instruments: Fair values for off-balance sheet, credit-related financial instruments are based on fees currently charged to enter into similar agreements, taking into account the remaining terms of the agreements and the counterparties' credit standing. The fair value of commitments is not material.
Fair value estimates are made at a specific point in time, based on relevant market information and information about the financial instrument. These estimates do not reflect any premium or discount that could result from offering for sale at one time the Company's entire holdings of a particular financial instrument. Because no market exists for a significant portion of the Company's financial instruments, fair value estimates are based on judgments regarding future expected loss experience, current economic conditions, risk characteristics of various financial instruments and other factors. These estimates are subjective in nature and involve uncertainties and matters of significant judgment and therefore cannot be determined with precision. Changes in assumptions could significantly affect the estimates.
45
NOTES TO THE CONSOLIDATED FINANCIAL STATEMENTS
Note P - Regulatory Matters
Banks and bank holding companies are subject to regulatory capital requirements administered by federal banking agencies. Capital adequacy guidelines and, additionally for banks, prompt corrective action regulations, involve quantitative measures of assets, liabilities, and certain off-balance-sheet items calculated under regulatory accounting practices. Capital amounts and classifications are also subject to qualitative judgments by regulators. Failure to meet capital requirements can initiate regulatory action. The final rules implementing Basel Committee on Banking Supervision's capital guidelines for U.S. banks (Basel III rules) became effective for the Company and the Bank on January 1, 2015 with full compliance with all of the requirements being phased in over a multi-year schedule, and fully phased in by January 1, 2019. Under the final rules, minimum requirements increased for both the quantity and quality of capital held by the Company and the Bank. The rules include a new common equity tier 1 capital to risk-weighted assets ratio of 4.5% and a capital conservation buffer of 2.5% of risk-weighted assets. The capital conservation buffer began to phase in on January 1, 2016 at 0.625%, and will be phased in over a four-year period, increasing by the same amount on each subsequent January 1, until fully phased-in on January 1, 2019. Further, Basel III rules increased the minimum ratio of tier 1 capital to risk-weighted assets increased from 4.0% to 6.0% and all banks are now subject to a 4.0% minimum leverage ratio. The required total risk-based capital ratio was unchanged. Failure to maintain the required common equity tier 1 capital conservation buffer will result in potential restrictions on a bank's ability to pay dividends, repurchase stock and/or pay discretionary compensation to its employees. In addition, the Federal Reserve Board requires financial holding companies to meet "well capitalized" standards with ratios applicable to banks under the prompt corrective action regulations. Bank holding companies meeting the requirements of the Federal Reserve Board's Small Bank Holding Company Policy are exempt from compliance with the consolidated capital requirements, although their bank subsidiaries are still subject to the bank capital requirements.
Effective May 15, 2015, the Federal Reserve Board amended the Small Bank Holding Company Policy to increase from $500 million to $1 billion the asset threshold for a bank to qualify under the Policy. Pursuant to that Policy, at December 31, 2016, the Company was not subject to the consolidated capital requirements. The net unrealized gain or loss on available for sale securities is not included in computing regulatory capital. Management believes that as of December 31, 2016 and 2015, the Bank met all capital adequacy requirements to which it was subject.
Prompt corrective action regulations provide five classifications: well capitalized, adequately capitalized, undercapitalized, significantly undercapitalized and critically undercapitalized, although these terms are not used to represent overall financial condition. If adequately capitalized, regulatory approval is required to accept brokered deposits. If undercapitalized, capital distributions are limited, as is asset growth and expansion, and capital restoration plans are required. At year-end 2016 and 2015, the Bank met the capital requirements to be deemed well capitalized under the regulatory framework for prompt corrective action. There are no conditions or events since that notification that management believes have changed the institution's category.
At year-end, consolidated actual capital levels and minimum required levels for the Company and the Bank were:
|
|
Actual
|
Minimum Required
To Be Adequately
Capitalized Under
Prompt Corrective
Action Regulations
|
Minimum Required
To Be Well
Capitalized Under
Prompt Corrective
Action Regulations
|
|||||||||||||||||||||
|
|
Amount
|
Ratio
|
Amount
|
Ratio
|
Amount
|
Ratio
|
||||||||||||||||||
|
2016
|
||||||||||||||||||||||||
|
Total capital (to risk weighted assets)
|
||||||||||||||||||||||||
|
Consolidated
|
$
|
113,515
|
16.4
|
%
|
N/A
|
N/A
|
N/A
|
N/A
|
||||||||||||||||
|
Bank
|
104,317
|
15.3
|
$
|
54,631
|
8.0
|
%
|
$
|
68,289
|
10.0
|
%
|
||||||||||||||
|
Common equity Tier 1 capital (to risk weighted assets)
|
||||||||||||||||||||||||
|
Consolidated
|
97,316
|
14.0
|
N/A
|
N/A
|
N/A
|
N/A
|
||||||||||||||||||
|
Bank
|
96,946
|
14.2
|
30,730
|
4.5
|
44,388
|
6.5
|
||||||||||||||||||
|
Tier 1 capital (to risk weighted assets)
|
||||||||||||||||||||||||
|
Consolidated
|
105,816
|
15.3
|
N/A
|
N/A
|
N/A
|
N/A
|
||||||||||||||||||
|
Bank
|
96,946
|
14.2
|
40,973
|
6.0
|
54,631
|
8.0
|
||||||||||||||||||
|
Tier 1 capital (to average assets)
|
||||||||||||||||||||||||
|
Consolidated
|
105,816
|
11.2
|
N/A
|
N/A
|
N/A
|
N/A
|
||||||||||||||||||
|
Bank
|
96,946
|
10.4
|
37,168
|
4.0
|
46,461
|
5.0
|
||||||||||||||||||
46
NOTES TO THE CONSOLIDATED FINANCIAL STATEMENTS
Note P – Regulatory Matters (continued)
|
|
Actual
|
Minimum Required
To Be Adequately
Capitalized Under
Prompt Corrective
Action Regulations
|
Minimum Required
To Be Well
Capitalized Under
Prompt Corrective
Action Regulations
|
|||||||||||||||||||||
|
|
Amount
|
Ratio
|
Amount
|
Ratio
|
Amount
|
Ratio
|
||||||||||||||||||
|
2015
|
||||||||||||||||||||||||
|
Total capital (to risk weighted assets)
|
||||||||||||||||||||||||
|
Consolidated
|
$
|
104,047
|
18.2
|
%
|
N/A
|
N/A
|
N/A
|
N/A
|
||||||||||||||||
|
Bank
|
91,006
|
16.3
|
$
|
44,799
|
8.0
|
%
|
$
|
55,999
|
10.0
|
%
|
||||||||||||||
|
Common equity Tier 1 capital (to risk weighted assets)
|
||||||||||||||||||||||||
|
Consolidated
|
88,899
|
15.6
|
N/A
|
N/A
|
N/A
|
N/A
|
||||||||||||||||||
|
Bank
|
84,686
|
15.1
|
25,199
|
4.5
|
36,399
|
6.5
|
||||||||||||||||||
|
Tier 1 capital (to risk weighted assets)
|
||||||||||||||||||||||||
|
Consolidated
|
97,399
|
17.1
|
N/A
|
N/A
|
N/A
|
N/A
|
||||||||||||||||||
|
Bank
|
84,686
|
15.1
|
33,599
|
6.0
|
44,799
|
8.0
|
||||||||||||||||||
|
Tier 1 capital (to average assets)
|
||||||||||||||||||||||||
|
Consolidated
|
97,399
|
12.2
|
N/A
|
N/A
|
N/A
|
N/A
|
||||||||||||||||||
|
Bank
|
84,686
|
10.8
|
31,280
|
4.0
|
39,100
|
5.0
|
||||||||||||||||||
Dividends paid by the subsidiaries are the primary source of funds available to Ohio Valley for payment of dividends to shareholders and for other working capital needs. The payment of dividends by the subsidiaries to Ohio Valley is subject to restrictions by regulatory authorities. These restrictions generally limit dividends to the current and prior two years retained earnings of the Bank and Loan Central, Inc., and 90% of the prior year's net income of OVBC Captive, Inc. At January 1, 2017 approximately $5,884 of the subsidiaries' retained earnings were available for dividends under these guidelines. In addition to these restrictions, dividend payments cannot reduce regulatory capital levels below minimum regulatory guidelines. The amount of dividends payable by the Bank is also restricted if the Bank does not hold a capital conservation buffer. The Board of Governors of the Federal Reserve System also has a policy requiring Ohio Valley to provide notice to the FRB in advance of the payment of a dividend to Ohio Valley's shareholders under certain circumstances, and the FRB may disapprove of such dividend payment if the FRB determines the payment would be an unsafe or unsound practice.
Note Q - Parent Company Only Condensed Financial Information
Below is condensed financial information of Ohio Valley. In this information, Ohio Valley's investment in its subsidiaries is stated at cost plus equity in undistributed earnings of the subsidiaries since acquisition. This information should be read in conjunction with the consolidated financial statements of the Company.
CONDENSED STATEMENTS OF CONDITION
|
|
Years ended December 31:
|
|||||||
|
Assets
|
2016
|
2015
|
||||||
|
Cash and cash equivalents
|
$
|
2,747
|
$
|
2,233
|
||||
|
Investment in subsidiaries
|
115,057
|
96,759
|
||||||
|
Notes receivable – subsidiaries
|
3,420
|
3,881
|
||||||
|
Other assets
|
52
|
63
|
||||||
|
Total assets
|
$
|
121,276
|
$
|
102,936
|
||||
|
|
||||||||
|
Liabilities
|
||||||||
|
Notes payable
|
$
|
7,882
|
$
|
3,918
|
||||
|
Subordinated debentures
|
8,500
|
8,500
|
||||||
|
Other liabilities
|
366
|
48
|
||||||
|
Total liabilities
|
16,748
|
12,466
|
||||||
|
|
||||||||
|
Shareholders' Equity
|
||||||||
|
Total shareholders' equity
|
104,528
|
90,470
|
||||||
|
Total liabilities and shareholders' equity
|
$
|
121,276
|
$
|
102,936
|
||||
47
NOTES TO THE CONSOLIDATED FINANCIAL STATEMENTS
Note Q - Parent Company Only Condensed Financial Information (continued)
CONDENSED STATEMENTS OF INCOME
|
|
Years ended December 31:
|
|||||||||||
|
Income:
|
2016
|
2015
|
2014
|
|||||||||
|
Interest on notes
|
$
|
52
|
$
|
53
|
$
|
84
|
||||||
|
Other operating income
|
----
|
----
|
34
|
|||||||||
|
Dividends from subsidiaries
|
6,900
|
3,500
|
3,500
|
|||||||||
|
Gain on sale of ProAlliance Corporation
|
----
|
----
|
810
|
|||||||||
|
Expenses:
|
||||||||||||
|
Interest on notes
|
136
|
53
|
84
|
|||||||||
|
Interest on subordinated debentures
|
204
|
170
|
165
|
|||||||||
|
Operating expenses
|
667
|
345
|
384
|
|||||||||
|
Income before income taxes and equity in undistributed earnings of subsidiaries
|
5,945
|
2,985
|
3,795
|
|||||||||
|
Income tax benefit
|
256
|
167
|
(108
|
)
|
||||||||
|
Equity in undistributed earnings of subsidiaries
|
719
|
5,422
|
4,386
|
|||||||||
|
Net Income
|
$
|
6,920
|
$
|
8,574
|
$
|
8,073
|
||||||
CONDENSED STATEMENTS OF CASH FLOWS
|
|
Years ended December 31:
|
|||||||||||
|
Cash flows from operating activities:
|
2016
|
2015
|
2014
|
|||||||||
|
Net Income
|
$
|
6,920
|
$
|
8,574
|
$
|
8,073
|
||||||
|
Adjustments to reconcile net income to net cash provided by operating activities:
|
||||||||||||
|
Gain on sale of ProAlliance Corporation
|
----
|
----
|
(810
|
)
|
||||||||
|
Equity in undistributed earnings of subsidiaries
|
(719
|
)
|
(5,422
|
)
|
(4,386
|
)
|
||||||
|
Common stock issued to ESOP
|
575
|
----
|
351
|
|||||||||
|
Change in other assets
|
11
|
(16
|
)
|
323
|
||||||||
|
Change in other liabilities
|
318
|
(141
|
)
|
(334
|
)
|
|||||||
|
Net cash provided by operating activities
|
7,105
|
2,995
|
3,217
|
|||||||||
|
|
||||||||||||
|
Cash flows from investing activities:
|
||||||||||||
|
Cash paid for Milton Bancorp, Inc. acquisition
|
(7,431
|
)
|
----
|
----
|
||||||||
|
Proceeds from sale of ProAlliance Corporation
|
----
|
----
|
810
|
|||||||||
|
Investment in OVBC Captive
|
----
|
----
|
(250
|
)
|
||||||||
|
Change in notes receivable
|
461
|
(100
|
)
|
(262
|
)
|
|||||||
|
Net cash provided by (used in) investing activities
|
(6,970
|
)
|
(100
|
)
|
298
|
|||||||
|
Cash flows from financing activities:
|
||||||||||||
|
Change in notes payable
|
3,964
|
128
|
262
|
|||||||||
|
Proceeds from common stock through dividend reinvestment
|
----
|
----
|
103
|
|||||||||
|
Cash dividends paid
|
(3,585
|
)
|
(3,665
|
)
|
(3,441
|
)
|
||||||
|
Net cash provided by (used in) financing activities
|
379
|
(3,537
|
)
|
(3,076
|
)
|
|||||||
|
Cash and cash equivalents:
|
||||||||||||
|
Change in cash and cash equivalents
|
514
|
(642
|
)
|
439
|
||||||||
|
Cash and cash equivalents at beginning of year
|
2,233
|
2,875
|
2,436
|
|||||||||
|
Cash and cash equivalents at end of year
|
$
|
2,747
|
$
|
2,233
|
$
|
2,875
|
||||||
Note R - Segment Information
The reportable segments are determined by the products and services offered, primarily distinguished between banking and consumer finance. They are also distinguished by the level of information provided to the chief operating decision maker, who uses such information to review performance of various components of the business which are then aggregated if operating performance, products/services, and customers are similar. Loans, investments, and deposits provide the majority of the net revenues from the banking operation, while loans provide the majority of the net revenues for the consumer finance segment. All Company segments are domestic.
48
NOTES TO THE CONSOLIDATED FINANCIAL STATEMENTS
Note R - Segment Information (continued)
Total revenues from the banking segment, which accounted for the majority of the Company's total revenues, totaled 91.6%, 90.9% and 90.6% of total consolidated revenues for the years ended December 31, 2016, 2015 and 2014, respectively.
The accounting policies used for the Company's reportable segments are the same as those described in Note A - Summary of Significant Accounting Policies. Income taxes are allocated based on income before tax expense. All goodwill is in the Banking segment.
Segment information is as follows:
|
|
Year Ended December 31, 2016
|
|||||||||||
|
|
Banking
|
Consumer Finance
|
Total Company
|
|||||||||
|
Net interest income
|
$
|
33,019
|
$
|
3,307
|
$
|
36,326
|
||||||
|
Provision expense
|
2,665
|
161
|
2,826
|
|||||||||
|
Noninterest income
|
7,589
|
650
|
8,239
|
|||||||||
|
Noninterest expense
|
30,257
|
2,642
|
32,899
|
|||||||||
|
Tax expense
|
1,530
|
390
|
1,920
|
|||||||||
|
Net income
|
6,156
|
764
|
6,920
|
|||||||||
|
Assets
|
941,907
|
12,733
|
954,640
|
|||||||||
|
|
Year Ended December 31, 2015
|
|||||||||||
|
|
Banking
|
Consumer Finance
|
Total Company
|
|||||||||
|
Net interest income
|
$
|
30,175
|
$
|
3,320
|
$
|
33,495
|
||||||
|
Provision expense
|
1,055
|
35
|
1,090
|
|||||||||
|
Noninterest income
|
7,880
|
717
|
8,597
|
|||||||||
|
Noninterest expense
|
26,983
|
2,636
|
29,619
|
|||||||||
|
Tax expense
|
2,347
|
462
|
2,809
|
|||||||||
|
Net income
|
7,670
|
904
|
8,574
|
|||||||||
|
Assets
|
782,715
|
13,570
|
796,285
|
|||||||||
|
|
Year Ended December 31, 2014
|
|||||||||||
|
|
Banking
|
Consumer Finance
|
Total Company
|
|||||||||
|
Net interest income
|
$
|
30,172
|
$
|
3,308
|
$
|
33,480
|
||||||
|
Provision expense
|
2,645
|
142
|
2,787
|
|||||||||
|
Noninterest income
|
8,897
|
896
|
9,793
|
|||||||||
|
Noninterest expense
|
26,806
|
2,487
|
29,293
|
|||||||||
|
Tax expense
|
2,587
|
533
|
3,120
|
|||||||||
|
Net income
|
7,031
|
1,042
|
8,073
|
|||||||||
|
Assets
|
764,510
|
14,158
|
778,668
|
|||||||||
49
NOTES TO THE CONSOLIDATED FINANCIAL STATEMENTS
Note S - Consolidated Quarterly Financial Information (unaudited)
|
|
Quarters Ended
|
|||||||||||||||
|
Mar. 31
|
Jun. 30
|
Sept. 30
|
Dec. 31
|
|||||||||||||
|
2016
|
||||||||||||||||
|
Total interest income
|
$
|
9,770
|
$
|
8,913
|
$
|
9,824
|
$
|
10,841
|
||||||||
|
Total interest expense
|
670
|
707
|
839
|
806
|
||||||||||||
|
Net interest income
|
9,100
|
8,206
|
8,985
|
10,035
|
||||||||||||
|
Provision for loan losses (1)
|
479
|
141
|
1,708
|
498
|
||||||||||||
|
Noninterest income (3)
|
3,235
|
1,861
|
1,693
|
1,450
|
||||||||||||
|
Noninterest expense
|
7,969
|
7,773
|
8,828
|
8,329
|
||||||||||||
|
Net income
|
2,832
|
1,706
|
358
|
2,024
|
||||||||||||
|
|
||||||||||||||||
|
Earnings per share
|
$
|
0.69
|
$
|
0.41
|
$
|
0.08
|
$
|
0.43
|
||||||||
|
|
||||||||||||||||
|
2015
|
||||||||||||||||
|
Total interest income
|
$
|
9,627
|
$
|
8,866
|
$
|
9,016
|
$
|
8,825
|
||||||||
|
Total interest expense
|
697
|
717
|
731
|
694
|
||||||||||||
|
Net interest income
|
8,930
|
8,149
|
8,285
|
8,131
|
||||||||||||
|
Provision for loan losses (2)
|
(78
|
)
|
799
|
(11
|
)
|
380
|
||||||||||
|
Noninterest income (3)
|
3,489
|
1,917
|
1,584
|
1,607
|
||||||||||||
|
Noninterest expense
|
7,427
|
7,554
|
7,727
|
6,911
|
||||||||||||
|
Net income
|
3,624
|
1,410
|
1,642
|
1,898
|
||||||||||||
|
|
||||||||||||||||
|
Earnings per share
|
$
|
0.88
|
$
|
0.34
|
$
|
0.40
|
$
|
0.46
|
||||||||
|
|
||||||||||||||||
|
2014
|
||||||||||||||||
|
Total interest income
|
$
|
9,508
|
$
|
8,925
|
$
|
8,904
|
$
|
9,018
|
||||||||
|
Total interest expense
|
726
|
738
|
696
|
715
|
||||||||||||
|
Net interest income
|
8,782
|
8,187
|
8,208
|
8,303
|
||||||||||||
|
Provision for loan losses (4)
|
494
|
1,386
|
(682
|
)
|
1,589
|
|||||||||||
|
Noninterest income (3)
|
4,118
|
1,912
|
2,106
|
1,657
|
||||||||||||
|
Noninterest expense
|
7,295
|
6,997
|
7,244
|
7,757
|
||||||||||||
|
Net income
|
3,564
|
1,344
|
2,742
|
423
|
||||||||||||
|
|
||||||||||||||||
|
Earnings per share
|
$
|
0.87
|
$
|
0.33
|
$
|
0.67
|
$
|
0.10
|
||||||||
(1) During the third quarter of 2016, the Company experienced higher provision expense that was primarily related to an increase in specific allocations impacted by the decline in collateral values of two impaired commercial real estate loan relationships. A re-appraisal of the commercial properties securing the loans identified further collateral depreciation, which resulted in a $2,435 increase to the specific allocations related to the loans.
(2) During the first and third quarters of 2015, the Company experienced negative provision expense as a result of lower general allocations of the allowance for loan losses. General allocations were impacted by improved economic trends that include: decreasing historical loan loss factor, lower delinquencies and lower classified/criticized assets.
(3) The Company's noninterest income was significantly impacted by seasonal tax refund processing fees. The Bank serves as a facilitator for the clearing of tax refunds for a single tax refund product provider. The Bank processes electronic refund checks/deposits associated with taxpayer refunds, and will, in turn, receive a fee paid by the third-party tax refund product provider for each transaction processed. Due to the seasonal nature of tax refund transactions, the majority of income was recorded during the first quarter.
(4) During the third quarter of 2014, the Company experienced negative provision expense that was primarily related to a decrease in specific allocations impacted by the improvement in collateral values of an impaired commercial real estate loan relationship. A re-appraisal of the commercial properties securing the loan identified asset appreciation, which resulted in a $524 reduction to the specific allocation related to the loan.
50
Report of Independent Registered
Public Accounting Firm
To the Board of Directors and Shareholders
Ohio Valley Banc Corp.
We have audited the accompanying consolidated statements of condition of Ohio Valley Banc Corp. (the "Company") as of December 31, 2016 and 2015, and the related consolidated statements of income, comprehensive income, changes in shareholders' equity, and cash flows for each of the three years in the period ended December 31, 2016. We also have audited the Company's internal control over financial reporting as of December 31, 2016, based on criteria established in the 2013 Internal Control – Integrated Framework issued by the Committee of Sponsoring Organizations of the Treadway Commission (COSO). The Company's management is responsible for these financial statements, for maintaining effective internal control over financial reporting, and for its assessment of the effectiveness of internal control over financial reporting, included in the accompanying Management's Report on Internal Control Over Financial Reporting. Our responsibility is to express an opinion on these financial statements and an opinion on the Company's internal control over financial reporting based on our audits.
We conducted our audits in accordance with the standards of the Public Company Accounting Oversight Board (United States). Those standards require that we plan and perform the audits to obtain reasonable assurance about whether the financial statements are free of material misstatement and whether effective internal control over financial reporting was maintained in all material respects. Our audits of the financial statements included examining, on a test basis, evidence supporting the amounts and disclosures in the financial statements, assessing the accounting principles used and significant estimates made by management, and evaluating the overall financial statement presentation. Our audit of internal control over financial reporting included obtaining an understanding of internal control over financial reporting, assessing the risk that a material weakness exists, and testing and evaluating the design and operating effectiveness of internal control based on the assessed risk. Our audits also included performing such other procedures as we considered necessary in the circumstances. We believe that our audits provide a reasonable basis for our opinions.
A company's internal control over financial reporting is a process designed to provide reasonable assurance regarding the reliability of financial reporting and the preparation of financial statements for external purposes in accordance with U.S. generally accepted accounting principles. A company's internal control over financial reporting includes those policies and procedures that (1) pertain to the maintenance of records that, in reasonable detail, accurately and fairly reflect the transactions and dispositions of the assets of the company; (2) provide reasonable assurance that transactions are recorded as necessary to permit preparation of financial statements in accordance with generally accepted accounting principles, and that receipts and expenditures of the company are being made only in accordance with authorizations of management and directors of the company; and (3) provide reasonable assurance regarding prevention or timely detection of unauthorized acquisition, use, or disposition of the company's assets that could have a material effect on the financial statements.
Because of its inherent limitations, internal control over financial reporting may not prevent or detect misstatements. Also, projections of any evaluation of effectiveness to future periods are subject to the risk that controls may become inadequate because of changes in conditions, or that the degree of compliance with the policies or procedures may deteriorate.
In our opinion, the consolidated financial statements referred to above present fairly, in all material respects, the financial position of Ohio Valley Banc Corp. as of December 31, 2016 and 2015, and the results of its operations and its cash flows for each of the three years in the period ended December 31, 2016, in conformity with accounting principles generally accepted in the United States of America. Also in our opinion, Ohio Valley Banc Corp. maintained, in all material respects, effective internal control over financial reporting as of December 31, 2016, based on criteria established in the 2013 Internal Control – Integrated Framework issued by the Committee of Sponsoring Organizations of the Treadway Commission.
|
/s/Crowe Horwath LLP
|
|
Crowe Horwath LLP
|
Louisville, Kentucky
March 16, 2017
51
Management's Report on Internal Control
over Financial Reporting
Board of Directors and Shareholders
Ohio Valley Banc Corp.
The management of Ohio Valley Banc Corp. (the Company) is responsible for establishing and maintaining adequate internal control over financial reporting as defined in Rules 13a-15(f) and 15d-15(f) under the Securities Exchange Act of 1934. The Company's internal control over financial reporting is designed to provide reasonable assurance regarding the reliability of financial reporting and the preparation of financial statements for external purposes in accordance with generally accepted accounting principles. The Company's internal control over financial reporting includes those policies and procedures that: (i) pertain to the maintenance of records that, in reasonable detail, accurately and fairly reflect the transactions and dispositions of the assets of the Company; (ii) provide reasonable assurance that transactions are recorded as necessary to permit preparation of financial statements in accordance with generally accepted accounting principles, and that receipts and expenditures of the Company are being made only in accordance with authorizations of management and directors of the Company; and (iii) provide reasonable assurance regarding prevention or timely detection of unauthorized acquisition, use or disposition of the Company's assets that could have a material effect on the financial statements.
The system of internal control over financial reporting as it relates to the consolidated financial statements is evaluated for effectiveness by management. Because of its inherent limitations, internal control over financial reporting may not prevent or detect misstatements. Also, projections of any evaluation of effectiveness to future periods are subject to the risk that controls may become inadequate because of changes in conditions, or that the degree of compliance with the policies or procedures may deteriorate.
Management assessed Ohio Valley Banc Corp.'s system of internal control over financial reporting as of December 31, 2016, in relation to criteria for effective internal control over financial reporting as described in the 2013 "Internal Control Integrated Framework," issued by the Committee of Sponsoring Organizations of the Treadway Commission (COSO). Based on this assessment, management concluded that, as of December 31, 2016, its system of internal control over financial reporting is effective and meets the criteria of the "Internal Control Integrated Framework."
Crowe Horwath LLP, independent registered public accounting firm, has issued an audit report dated March 16, 2017 on the Company's consolidated financial statements and internal control over financial reporting. That report is contained in Ohio Valley's Annual Report to Shareholders under the heading "Report of Independent Registered Public Accounting Firm."
|
Ohio Valley Banc Corp.
|
|
|
|
/s/Thomas E. Wiseman
|
|
Thomas E. Wiseman
|
|
President, CEO
|
|
|
|
/s/Scott W. Shockey
|
|
Scott W. Shockey
|
|
Senior Vice President, CFO
|
|
|
|
|
|
March 16, 2017
|
52
Summary of Common Stock Data
OHIO VALLEY BANC CORP.
Years ended December 31, 2016 and 2015
INFORMATION AS TO STOCK PRICES AND DIVIDENDS: Ohio Valley's common shares are traded on The NASDAQ Stock Market under the symbol "OVBC." The following table summarizes the high and low sales prices for Ohio Valley's common shares on the NASDAQ Global Market for each quarterly period since January 1, 2015.
|
2016
|
High
|
Low
|
||||||
|
First Quarter
|
$
|
24.80
|
$
|
21.70
|
||||
|
Second Quarter
|
22.65
|
21.40
|
||||||
|
Third Quarter
|
22.40
|
21.60
|
||||||
|
Fourth Quarter
|
29.34
|
22.20
|
||||||
|
2015
|
High
|
Low
|
||||||
|
First Quarter
|
$
|
24.56
|
$
|
22.40
|
||||
|
Second Quarter
|
23.49
|
22.10
|
||||||
|
Third Quarter
|
25.48
|
22.40
|
||||||
|
Fourth Quarter
|
26.03
|
23.25
|
||||||
Shown below is a table which reflects the dividends declared per share on Ohio Valley's common shares. As of February 28, 2017, the number of holders of record of common shares was 2,178.
|
Dividends per share
|
2016
|
2015
|
||||||
|
First Quarter
|
$
|
.21
|
$
|
.21
|
||||
|
Second Quarter
|
.21
|
.26
|
||||||
|
Third Quarter
|
.19
|
.21
|
||||||
|
Fourth Quarter
|
.21
|
.21
|
||||||
During the second quarter of 2015, Ohio Valley paid a regular quarterly dividend of $0.21 per share and a special dividend of $0.05 per share.
Dividends paid by the subsidiaries are the primary source of funds available to Ohio Valley for payment of dividends to shareholders and for other working capital needs. The payment of dividends by the subsidiaries to Ohio Valley is subject to restrictions by regulatory authorities. These restrictions generally limit dividends to the amount of retained earnings for the current and prior two years of the Bank and Loan Central, Inc., and 90% of the prior year's net income of OVBC Captive, Inc. The amount of dividends payable by the Bank is also restricted if the Bank does not hold a capital conservation buffer. The ability of Ohio Valley to borrow funds from the Bank is limited as to amount and terms by banking regulations.
In addition, a policy of the Board of Governors of the Federal Reserve System requires Ohio Valley to provide notice to the FRB in advance of the payment of a dividend to Ohio Valley's shareholders under certain circumstances, and the FRB may disapprove of such dividend payment if the FRB determines the payment would be an unsafe or unsound practice.
Dividend restrictions are also listed within the provisions of Ohio Valley's trust preferred security arrangements. Under the provisions of these agreements, the interest payable on the trust preferred securities is deferrable for up to five years and any such deferral would not be considered a default. During any period of deferral, Ohio Valley would be precluded from declaring or paying dividends to its shareholders or repurchasing any of its common stock.
53
Performance Graph
OHIO VALLEY BANC CORP.
Year ended December 31, 2016
The following graph sets forth a comparison of five-year cumulative total returns among the Company's common shares (indicated "Ohio Valley Banc Corp." on the Performance Graph), the S & P 500 Index (indicated "S & P 500" on the Performance Graph), and SNL Securities SNL $500 Million-$1 Billion Bank Asset-Size Index (indicated "SNL" on the Performance Graph) for the fiscal years indicated. Information reflected on the graph assumes an investment of $100 on December 31, 2011 in each of the common shares of the Company, the S & P 500 Index, and the SNL Index. Cumulative total return assumes reinvestment of dividends. The SNL Index represents stock performance of 44 of the nation's banks located throughout the United States with total assets between $500 Million and $1 Billion as selected by SNL Securities of Charlottesville, Virginia. The Company is included as one of the 44 banks in the SNL Index.
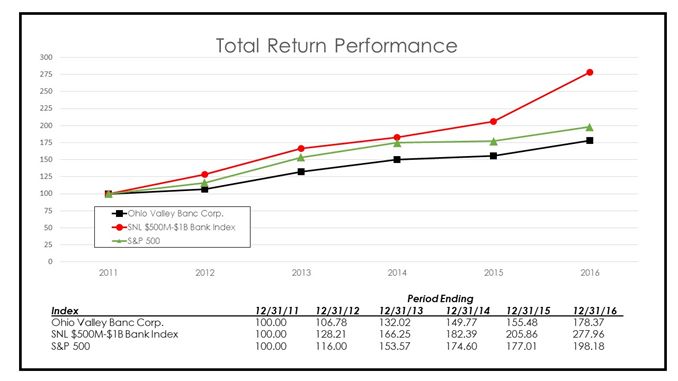
54
MANAGEMENT's DISCUSSION AND ANALYSIS OF
FINANCIAL CONDITION AND RESULTS OF OPERATIONS
FORWARD LOOKING STATEMENTS
Except for the historical statements and discussions contained herein, statements contained in this report constitute "forward looking statements" within the meaning of Section 27A of the Securities Act of 1933 and Section 21E of the Securities Act of 1934 and as defined in the Private Securities Litigation Reform Act of 1995. Such statements are often, but not always, identified by the use of such words as "believes," "anticipates," "expects," and similar expressions. Such statements involve various important assumptions, risks, uncertainties, and other factors, many of which are beyond our control and which could cause actual results to differ materially from those expressed in such forward looking statements. These factors include, but are not limited to: changes in political, economic or other factors, such as inflation rates, recessionary or expansive trends, taxes, the effects of implementation of legislation and the continuing economic uncertainty in various parts of the world; competitive pressures; fluctuations in interest rates; the level of defaults and prepayment on loans made by the Company; unanticipated litigation, claims, or assessments; fluctuations in the cost of obtaining funds to make loans; and regulatory changes. Additional detailed information concerning a number of important factors which could cause actual results to differ materially from the forward-looking statements contained in management's discussion and analysis is available in the Company's filings with the Securities and Exchange Commission, under the Securities Exchange Act of 1934, including the disclosure under the heading "Item 1A. Risk Factors" of Part 1 of the Company's Annual Report on Form 10-K for the fiscal year ended December 31, 2016. Readers are cautioned not to place undue reliance on such forward looking statements, which speak only as of the date hereof. The Company undertakes no obligation and disclaims any intention to republish revised or updated forward looking statements, whether as a result of new information, unanticipated future events or otherwise.
ANALYSIS OF FINANCIAL CONDITION AND RESULTS OF OPERATIONS
The purpose of this discussion is to provide an analysis of the financial condition and results of operations of Ohio Valley Banc Corp. ("Ohio Valley" or the "Company") that is not otherwise apparent from the audited consolidated financial statements included in this report. The accompanying consolidated financial information has been prepared by management in conformity with U.S. generally accepted accounting principles ("US GAAP") and is consistent with that reported in the consolidated financial statements. Reference should be made to those statements and the selected financial data presented elsewhere in this report for an understanding of the following tables and related discussion. All dollars are reported in thousands, except share and per share data.
RESULTS OF OPERATIONS:
SUMMARY
Ohio Valley generated net income of $6,920 for 2016, a decrease of 19.3% from 2015. Earnings per share were $1.59 for 2016, a decrease of 23.6% from 2015. The decrease in net income and earnings per share for 2016 was largely impacted by higher provision for loan loss expense, salaries and employee benefits and merger related expenses, which were up $1,736, $1,376 and $930, respectively, over 2015. The increase in provision for loan loss expense came mostly from higher specific allocations of the allowance for loan losses associated with two commercial real estate loan relationships during 2016. Management's analysis of both collateral dependent impaired loans identified asset impairment, which resulted in charges to provision expense of $2,435 during the year ended 2016. Partially offsetting these specific allocation increases was a reduction of $1,155 in specific reserves on one commercial and industrial loan relationship due to improvements in the borrower's credit quality and economic performance. The increase in salaries and employee benefit expenses was largely related to the Company's acquisition of Milton Bancorp, Inc. ("Milton Bancorp") on August 5, 2016, as was the increase in merger expenses. Immediately following the merger, Milton Bancorp's wholly-owned subsidiary, The Milton Banking Company ("Milton Bank"), was merged with and into the Bank. The acquisition resulted in the addition of $132,001 in assets and 5 branch locations in Jackson, Madison and Pickaway counties in Ohio.
55
MANAGEMENT's DISCUSSION AND ANALYSIS OF
FINANCIAL CONDITION AND RESULTS OF OPERATIONS
During 2016, the Company's net interest income finished strong at $36,326, representing an increase of $2,831, or 8.5%, from 2015. Average earning assets increased during 2016 by $62,372, or 8.0%, as compared to 2015, coming primarily from loans and investment securities. The growth in average earning assets was primarily attributable to the acquisition of Milton Bank during the third quarter of 2016. At the time of closing, the majority of Milton Bank's earning assets consisted of $112,479 in loans and $5,868 in securities. Further impacting average loan growth was the Company's new Athens, Ohio loan production office, which opened in late 2015. The new office has served to enhance the Company's market presence in Athens county, generating over $12,300 in average loans during 2016. Complementing average earning asset growth was an increase in the Company's net interest margin, which finished at 4.40% in 2016, as compared to 4.39% in 2015. Contributing to the increase in net interest margin were higher asset yields combined with lower funding costs.
The benefits of higher net interest income after provision for loan losses in 2016 were completely offset by a 17.3% increase in net noninterest expense (noninterest expense less noninterest income) during 2016, as compared to 2015. Noninterest income decreased $358, or 4.2%, from 2015, while noninterest expense increased $3,280, or 11.1%, over 2015. The decrease in noninterest income was affected by lower gains on the sale of other real estate owned ("OREO"), mostly from the lower appraised value on one land development property during the fourth quarter of 2016. Further impacting lower noninterest income was a reduction in tax processing fees through the Company's electronic refund check/deposit ("ERC/ERD") transactions. ERC/ERD transactions involve the payment of a tax refund to the taxpayer after the Bank has received the refund from the federal/state government. Although the Bank experienced a higher volume of tax refunds processed in 2016, tax refund processing fees were still lower than the year before, decreasing $323, or 13.6%, as compared to 2015. The decrease in total fees was due to the reduced per item fees received by the Company under a new contract entered into with the third-party tax refund product provider in October 2014 that impacted 2016's tax season. Partially offsetting some of the decreases to noninterest income during 2016 were positive contributions from service charges on deposit accounts, which increased $404, or 25.7%, impacted mostly by the acquisition of Milton Bank. Furthermore, debit/credit card interchange income increased $195, or 8.1%, primarily from the Company's continued marketing approach in offering incentives to customers to utilize the Bank's debit and credit cards for purchases. The Company's growth in noninterest expenses during 2016 was also impacted by the acquisition of Milton Bank, which contributed to general increases in most noninterest expense categories related to having a larger organization after the merger. The Company saw its salary and employee benefit expense grow by $1,376, or 7.9%, during 2016, as compared to 2015. The increase was related to adding Milton Bank employees, annual merit increases, and higher health insurance expense. Noninterest expense during 2016 was also impacted by merger expenses. As previously mentioned, the Company recorded $930 in one-time merger related expenses that consisted largely of services to combine the operating systems of the companies, as well as investment banking, accounting, and legal services. Noninterest expense growth was also affected by increases in occupancy, furniture and equipment, data processing and software expense.
56
MANAGEMENT's DISCUSSION AND ANALYSIS OF
FINANCIAL CONDITION AND RESULTS OF OPERATIONS
For 2015, Ohio Valley generated net income of $8,574, an increase of 6.2% from 2014. Earnings per share were $2.08 for 2015, an increase of 5.6% from 2014. The increase in net income and earnings per share for 2015 was primarily due to lower provision for loan loss expense, which was down $1,697 compared to 2014. The decrease in provision for loan loss expense during 2015 was mostly caused by the impact of higher general allocations of the allowance for loan losses experienced during 2014. The increase in prior year general allocations was mostly due to the downgrades of two impaired commercial credits during the second quarter of 2014, which increased the Company's classified assets and economic risk factors within the allowance for loan losses. Lower provision expense during 2015 was also impacted by increases in specific allocations of the allowance for loan losses experienced during 2014. The increase in prior year specific allocations was mostly due to the collateral value impairment of a commercial real estate loan recorded during the fourth quarter of 2014.
During 2015, the Company's net interest income finished relatively stable, increasing $15 from 2014. Average earning assets increased during 2015 by $26,703, or 3.6%, as compared to 2014, coming primarily from interest-bearing balances with banks and loans. Interest-bearing balances with banks were impacted by higher balances maintained within the Company's Federal Reserve Bank clearing account, while the increase in average loan balances was reflective of an increased loan demand within the Company's residential real estate and consumer loan portfolios. While average earning assets grew, the Company's net interest margin decreased 15 basis points from 4.54% in 2014 to 4.39% in 2015. Contributing to the decline in net interest margin were lower asset yields, which more than offset the reduction in funding costs. Furthermore, the additional balances maintained within the Federal Reserve clearing account have a dilutive effect on the net interest margin due to the balances only earning 25 basis points for most of 2015.
The benefits of higher net interest income and lower provision expense in 2015 were partially offset by a 12.2% decrease in noninterest income during 2015, as compared to 2014. The decrease came largely from the sale of the Company's 9% ownership interest in ProAlliance Corporation ("ProAlliance"), during the third quarter of 2014. The sale of ProAlliance, a specialty property and casualty insurance company, generated a total gain of $810 during the previous year. Further impacting lower noninterest income were reduced tax processing fees of $762, or 24.3%, through the Company's ERC/ERD transactions. The Bank experienced a higher volume of tax refunds processed in 2015, but was still affected by the reduced per item fees from the new contract agreement entered into during the fourth quarter of 2014. Partially offsetting the decreasing effects of ERC/ERD fees and sale of Pro Alliance, the Company's noninterest income saw positive contributions come from debit/credit card interchange income and gains on sale of securities. The Company's interchange fees from debit and credit card transactions improved by $225, or 10.4%, during 2015, as compared to 2014, affected by customer incentives that impacted the volume of debit and credit card transactions. Furthermore, the Company took opportunities during the second and third quarters of 2015 to sell some of its lower-yielding, U.S. Government agency ("Agency") mortgage-backed securities. Proceeds from the sale of securities during 2015 totaled $10,550, with gross gains of $163 recognized, while the Company did not recognize any security sales during 2014.
During 2015, the Company experienced higher costs associated with noninterest expenses, which increased $326, or 1.1%, as compared to the previous year. Growth in overhead came primarily from professional fees, foreclosure costs and data processing expenses, which collectively increased $518 during 2015. These increases were partially offset by lower salaries and employee benefits, which decreased $380 during 2015, as compared to the previous year. This decrease was primarily related to expense recorded in the fourth quarter of 2014 that incorporated the effects of new mortality expectations on various nonqualified defined benefit plans. The one-time adjustment to expense at the end of 2014 was not repeated in 2015, contributing to the decline in benefit costs.
57
MANAGEMENT's DISCUSSION AND ANALYSIS OF
FINANCIAL CONDITION AND RESULTS OF OPERATIONS
NET INTEREST INCOME
The most significant portion of the Company's revenue, net interest income, results from properly managing the spread between interest income on earning assets and interest expense incurred on interest-bearing liabilities. The Company earns interest and dividend income from loans, investment securities and short-term investments while incurring interest expense on interest-bearing deposits and short- and long-term borrowings. Net interest income is affected by changes in both the average volume and mix of assets and liabilities and the level of interest rates for financial instruments. Changes in net interest income are measured by net interest margin and net interest spread. Net interest margin is expressed as the percentage of net interest income to average interest-earning assets. Net interest spread is the difference between the average yield earned on interest-earning assets and the average rate paid on interest-bearing liabilities. Both of these are reported on a fully tax-equivalent ("FTE") basis. Net interest margin exceeds the net interest rate spread because noninterest-bearing sources of funds, principally noninterest-bearing demand deposits and stockholders' equity, also support interest-earning assets. Following is a discussion of changes in interest-earning assets, interest-bearing liabilities and the associated impact on interest income and interest expense for the three years ended December 31, 2016. Tables I and II have been prepared to summarize the significant changes outlined in this analysis.
Net interest income of $36,985 on an FTE basis increased $2,824 in 2016, or 8.3%, compared to the $34,161 earned in 2015, coming mostly from higher average earning assets. For the year ended December 31, 2016, average earning assets increased $62,372, or 8.0%, from 2015, which occurred primarily from loans, securities and the Company's Federal Reserve Bank clearing account. Higher average loan balances were impacted by the acquisition of $112,479 in Milton Bank loans as part of the merger on August 5, 2016. The acquisition contributed to average balance growth in commercial, residential real estate, and consumer loan balances, which were collectively up $54,737, or 9.3%, during 2016. The Company also acquired $5,868 in securities as part of the Milton Bank merger, which contributed to the $6,532 net increase in average securities for the year ended December 31, 2016. The increase came primarily from taxable securities, particularly within the Agency mortgage-backed investment segment.
Complementing the Company's growth in average earning assets was an increase in its FTE net interest margin from 4.39% in 2015 to 4.40% in 2016. A contributing factor to the FTE net interest margin was the Federal Reserve Bank's action of increasing short-term interest rates in December 2015 by 25 basis points. This increased the interest rate of the Company's Federal Reserve Bank clearing account from 0.25% to 0.50%. The net interest margin also benefited from lower rates paid on interest-bearing deposit liabilities and a continued emphasis on lower-cost core deposits. The Company's interest expense continues to be minimized by a sustained low-rate environment that has lowered the repricing rates of various Bank deposit products, particularly certain interest-bearing demand accounts. The low rate environment contributed to a decrease in the average cost on NOW accounts from 0.37% at December 31, 2015 to 0.27% at December 31, 2016. Furthermore, management continues to emphasize its lower-cost core deposit relationship balances, which consist of noninterest-bearing demand accounts and interest-bearing NOW, savings and money market balances. Over 60% of the acquired Milton Bank deposits consisted of core deposit funding sources. As a result, the Company benefited from higher core deposit average balances in 2016 (increasing $56,221), which offset the increase to its higher-cost time deposit, other borrowed money and subordinated debenture balances.
58
MANAGEMENT's DISCUSSION AND ANALYSIS OF
FINANCIAL CONDITION AND RESULTS OF OPERATIONS
These positive effects to the margin were partially offset by lower yields on loan originations, which have been negatively impacted by the continued low interest rates prevalent in the market. Also, while interest-bearing deposits continue to reprice, with the prolonged low interest rate environment, there continues to be limited opportunities to further reduce interest rates on the Company's retail funding sources, especially time deposits. From 2015 to 2016, the weighted average cost of time deposits increased from 0.77% to 0.78%, which represents a change from the interest expense savings that had occurred in previous years. While the Company has benefited from an emphasis on core deposit funding, management also utilizes higher-cost wholesale funding from Federal Home Loan Bank advances and promissory notes to help manage interest rate sensitivity and liquidity. These funding sources contributed to a $6,675 average balance increase in other borrowings, which was related to management's decision to fund specific fixed-rate loans with like-term FHLB advances.
Net interest income of $34,161 on an FTE basis increased $44 in 2015, or 0.1%, compared to the $34,117 earned in 2014. The nominal change in net interest income was impacted by a decrease in the FTE net interest margin, with positive contributions coming from higher average earning assets. For the year ended December 31, 2015, average earning assets increased $26,703, or 3.6%, from 2014, which occurred primarily from loans, securities and the Company's Federal Reserve Bank clearing account. Higher average loan balances were impacted by a loan demand increase in the residential real estate and consumer loan portfolios during 2015. In addition, the Company's taxable security purchases increased during 2015, particularly within the Agency mortgage-backed investment segment. The Company further benefited from increased earnings within taxable securities during 2015, primarily from less bond premium expense on Agency mortgage-backed securities, which contributed to a 7 basis point improvement in the yield on taxable securities.
While average earning assets grew during 2015, the Company experienced a decline in its FTE net interest margin from 4.54% in 2014 to 4.39% in 2015. The positive effects from average loan growth were completely offset by lower yields on loan originations, which have been negatively impacted by the continued low interest rates prevalent in the market. The lower margin in 2015 was also impacted by the Company's Federal Reserve Bank clearing account earning just 25 basis points for most of the year. The low rate on the clearing account combined with the fact that these Federal Reserve Bank balances contributed most to the overall average earning asset growth in 2015, contributed to the margin decline in 2015. Partially offsetting the negative effects to the margin were lower rates paid on interest-bearing deposit liabilities and a continued change in deposit mix to lower-cost core deposits from time deposit accounts and FHLB borrowings. For most of 2015, the Federal Reserve held the prime interest rate at 3.25%, and the target federal funds rate at a range from 0.0% to 0.25%. This sustained low-rate environment continued to impact the repricings of various Bank deposit products, especially time deposits. Interest rates on time deposit balances continue to reprice at lower rates, which continue to lower funding costs. However, the degree of interest expense savings from time deposits in 2015 versus 2014 has lowered significantly. With the prolonged low interest rate environment, there continues to be limited opportunities to further reduce interest rates on the Company's retail funding sources, especially time deposits. Management continues to emphasize its lower-cost core deposit relationship balances, which consist of noninterest-bearing demand accounts and interest-bearing NOW, savings and money market balances. As a result, the Company benefited from higher core deposit average balances in 2015 (increasing $22,035) while experiencing minimal change to its higher-cost time deposit, other borrowed money and subordinated debenture balances.
For 2016, average earning assets increased $62,372, or 8.0%, as compared to an increase of $26,703, or 3.6%, in 2015. Average loan balances represent the largest composition of earning assets. During 2016, average loans increased $54,737, or 9.3%, while increasing $8,263, or 1.4%, during 2015.
59
MANAGEMENT's DISCUSSION AND ANALYSIS OF
FINANCIAL CONDITION AND RESULTS OF OPERATIONS
CONSOLIDATED AVERAGE BALANCE SHEET & ANALYSIS OF NET INTEREST INCOME
Table I
|
(dollars in thousands)
|
December 31
|
|||||||||||||||||||||||||||||||||||
|
|
2016
|
2015
|
2014
|
|||||||||||||||||||||||||||||||||
|
|
Average Balance
|
Income/
Expense
|
Yield/
Average
|
Average Balance
|
Income/
Expense
|
Yield/
Average
|
Average Balance
|
Income/
Expense
|
Yield/
Average
|
|||||||||||||||||||||||||||
|
Assets
|
||||||||||||||||||||||||||||||||||||
|
Interest-earning assets:
|
||||||||||||||||||||||||||||||||||||
|
Interest-bearing balances with banks
|
$
|
74,486
|
$
|
374
|
0.50
|
%
|
$
|
73,383
|
$
|
185
|
0.25
|
%
|
$
|
56,528
|
$
|
136
|
0.24
|
%
|
||||||||||||||||||
|
Securities:
|
||||||||||||||||||||||||||||||||||||
|
Taxable
|
107,774
|
2,263
|
2.10
|
99,201
|
2,142
|
2.16
|
96,880
|
2,029
|
2.09
|
|||||||||||||||||||||||||||
|
Tax exempt
|
14,129
|
671
|
4.75
|
16,170
|
792
|
4.90
|
16,906
|
835
|
4.94
|
|||||||||||||||||||||||||||
|
Loans
|
644,690
|
36,699
|
5.69
|
589,953
|
33,881
|
5.74
|
581,690
|
33,992
|
5.84
|
|||||||||||||||||||||||||||
|
Total interest-earning assets
|
841,079
|
40,007
|
4.76
|
%
|
778,707
|
37,000
|
4.75
|
%
|
752,004
|
36,992
|
4.92
|
%
|
||||||||||||||||||||||||
|
|
||||||||||||||||||||||||||||||||||||
|
Noninterest-earning assets:
|
||||||||||||||||||||||||||||||||||||
|
Cash and due from banks
|
11,014
|
10,347
|
9,749
|
|||||||||||||||||||||||||||||||||
|
Other nonearning assets
|
54,195
|
47,186
|
44,764
|
|||||||||||||||||||||||||||||||||
|
Allowance for loan losses
|
(7,079
|
)
|
(7,796
|
)
|
(7,069
|
)
|
||||||||||||||||||||||||||||||
|
Total noninterest-earning assets …
|
58,130
|
49,737
|
47,444
|
|||||||||||||||||||||||||||||||||
|
Total assets
|
$
|
899,209
|
$
|
828,444
|
$
|
799,448
|
||||||||||||||||||||||||||||||
|
|
||||||||||||||||||||||||||||||||||||
|
Liabilities and Shareholders' Equity
|
||||||||||||||||||||||||||||||||||||
|
Interest-bearing liabilities:
|
||||||||||||||||||||||||||||||||||||
|
NOW accounts
|
$
|
143,180
|
$
|
383
|
0.27
|
%
|
$
|
125,104
|
$
|
462
|
0.37
|
%
|
$
|
112,644
|
$
|
458
|
0.41
|
%
|
||||||||||||||||||
|
Savings and money market
|
215,760
|
464
|
0.21
|
200,575
|
431
|
0.21
|
201,524
|
431
|
0.21
|
|||||||||||||||||||||||||||
|
Time deposits
|
167,584
|
1,307
|
0.78
|
168,969
|
1,298
|
0.77
|
170,196
|
1,347
|
0.79
|
|||||||||||||||||||||||||||
|
Other borrowed money
|
31,053
|
664
|
2.14
|
24,378
|
478
|
1.96
|
22,725
|
474
|
2.09
|
|||||||||||||||||||||||||||
|
Subordinated debentures
|
8.500
|
204
|
2.40
|
8.500
|
170
|
2.00
|
8.500
|
165
|
1.94
|
|||||||||||||||||||||||||||
|
Total int.-bearing liabilities
|
566,077
|
3,022
|
0.53
|
%
|
527,526
|
2,839
|
0.54
|
%
|
515,589
|
2,875
|
0.56
|
%
|
||||||||||||||||||||||||
|
|
||||||||||||||||||||||||||||||||||||
|
Noninterest-bearing liabilities:
|
||||||||||||||||||||||||||||||||||||
|
Demand deposit accounts
|
222,530
|
199,570
|
189,046
|
|||||||||||||||||||||||||||||||||
|
Other liabilities
|
12,469
|
12,628
|
10,926
|
|||||||||||||||||||||||||||||||||
|
Total noninterest-bearing liabilities
|
234,999
|
212,198
|
199,972
|
|||||||||||||||||||||||||||||||||
|
|
||||||||||||||||||||||||||||||||||||
|
Shareholders' equity
|
98,133
|
88,720
|
83,887
|
|||||||||||||||||||||||||||||||||
|
Total liabilities and shareholders' equity
|
$
|
899,209
|
$
|
828,444
|
$
|
799,448
|
||||||||||||||||||||||||||||||
|
|
||||||||||||||||||||||||||||||||||||
|
Net interest earnings
|
$
|
36,985
|
$
|
34,161
|
$
|
34,117
|
||||||||||||||||||||||||||||||
|
Net interest earnings as a percent of interest-earning assets
|
4.40
|
%
|
4.39
|
%
|
4.54
|
%
|
||||||||||||||||||||||||||||||
|
Net interest rate spread
|
4.23
|
%
|
4.21
|
%
|
4.36
|
%
|
||||||||||||||||||||||||||||||
|
Average interest-bearing liabilities to average earning assets
|
67.30
|
%
|
67.74
|
%
|
68.56
|
%
|
||||||||||||||||||||||||||||||
Fully taxable equivalent yields are calculated assuming a 34% tax rate, net of nondeductible interest expense. Average balances are computed on an average daily basis. The average balance for available for sale securities includes the market value adjustment. However, the calculated yield is based on the securities' amortized cost. Average loan balances include nonaccruing loans. Loan income includes cash received on nonaccruing loans.
60
MANAGEMENT's DISCUSSION AND ANALYSIS OF
FINANCIAL CONDITION AND RESULTS OF OPERATIONS
RATE VOLUME ANALYSIS OF CHANGES IN INTEREST INCOME & EXPENSE
Table II
|
(dollars in thousands)
|
2016
|
2015
|
||||||||||||||||||||||
|
|
Increase (Decrease)
From Previous Year Due to
|
Increase (Decrease)
From Previous Year Due to
|
||||||||||||||||||||||
|
|
Volume
|
Yield/Rate
|
Total
|
Volume
|
Yield/Rate
|
Total
|
||||||||||||||||||
|
Interest income
|
||||||||||||||||||||||||
|
Interest-bearing balances with banks
|
$
|
3
|
$
|
186
|
$
|
189
|
$
|
42
|
$
|
7
|
$
|
49
|
||||||||||||
|
Securities:
|
||||||||||||||||||||||||
|
Taxable
|
181
|
(60
|
)
|
121
|
49
|
64
|
113
|
|||||||||||||||||
|
Tax exempt
|
(97
|
)
|
(24
|
)
|
(121
|
)
|
(36
|
)
|
(7
|
)
|
(43
|
)
|
||||||||||||
|
Loans
|
3,118
|
(300
|
)
|
2,818
|
479
|
(590
|
)
|
(111
|
)
|
|||||||||||||||
|
Total interest income
|
3,205
|
(198
|
)
|
3,007
|
534
|
(526
|
)
|
8
|
||||||||||||||||
|
|
||||||||||||||||||||||||
|
Interest expense
|
||||||||||||||||||||||||
|
NOW accounts
|
60
|
(139
|
)
|
(79
|
)
|
48
|
(44
|
)
|
4
|
|||||||||||||||
|
Savings and money market
|
33
|
----
|
33
|
(2
|
)
|
2
|
----
|
|||||||||||||||||
|
Time deposits
|
(11
|
)
|
20
|
9
|
(10
|
)
|
(39
|
)
|
(49
|
)
|
||||||||||||||
|
Other borrowed money
|
140
|
46
|
186
|
34
|
(30
|
)
|
4
|
|||||||||||||||||
|
Subordinated debentures
|
----
|
34
|
34
|
----
|
5
|
5
|
||||||||||||||||||
|
Total interest expense
|
222
|
(39
|
)
|
183
|
70
|
(106
|
)
|
(36
|
)
|
|||||||||||||||
|
Net interest earnings
|
$
|
2,983
|
$
|
(159
|
)
|
$
|
2,824
|
$
|
464
|
$
|
(420
|
)
|
$
|
44
|
||||||||||
The change in interest due to volume and rate is determined as follows: Volume Variance - change in volume multiplied by the previous year's rate; Yield/Rate Variance - change in rate multiplied by the previous year's volume; Total Variance – change in volume multiplied by the change in rate. The change in interest due to both volume and rate has been allocated to volume and rate changes in proportion to the relationship of the absolute dollar amounts of the change in each. Fully taxable equivalent yield assumes a 34% tax rate, net of related nondeductible interest expense.
Average loan growth was impacted by the acquisition of Milton Bank on August 5, 2016, which contributed to increases in commercial, residential real estate and consumer loan balances. Further impacting average loan growth was the addition of the Company's loan production office in Athens, Ohio in the fourth quarter of 2015. Loan demand in the Athens County market responded very well, producing $19,282 in outstanding loan balances and year-to-date average loan increase of $12,354 at December 31, 2016, as compared to the same period in 2015. The acquisition of Milton Bank loans combined with the success in Athens County has contributed to a larger composition of average loans to average earning assets at year-end 2016 of 76.7%, as compared to 75.8% at year-end 2015. During 2015, average earning assets increased $26,703, or 3.6%, as compared to an increase of $20,881, or 2.9%, in 2014. Average loan balances continue to represent the largest composition of earning assets. During 2015, average loans increased $8,263, or 1.4%, while increasing $26,376, or 4.8%, during 2014. Average loan growth was positively impacted by consumer auto and capital lines during the second half of 2014 and all of 2015. Loan balances also grew from commercial and municipal loan originations during all of 2014. However, during 2015, the Company began experiencing the negative effects from larger commercial loan payoffs and competitive pressures that limited new commercial loan production within the Company's market areas. This deceleration of commercial loan balances during 2015 contributed to a smaller composition of average loans to average earning assets at year-end 2015 of 75.8%, as compared to 77.4% at year-end 2014.
61
MANAGEMENT's DISCUSSION AND ANALYSIS OF
FINANCIAL CONDITION AND RESULTS OF OPERATIONS
While the Company's average investment securities, both taxable and tax exempt, have increased during 2016 and 2015, their percentage of earning assets has declined, averaging 14.5% for 2016, compared to 14.8% for 2015 and 15.1% for 2014. The Company has focused on growing earning assets primarily through loans, which has contributed to a lower asset composition of securities. Management continues to focus on generating loan growth as this portion of earning assets provides the greatest return to the Company. Management maintains securities at a dollar level adequate enough to provide ample liquidity and cover pledging requirements.
The Company's average assets during 2016 and 2015 were also affected by changes in its average interest-bearing balances with banks. At year-end 2016, average interest-bearing balances with banks increased $1,103, or 1.5%, as compared to an increase of $16,855, or 29.8%, in 2015. These balances are driven primarily by the Company's use of its Federal Reserve Bank clearing account. The trend of larger average interest-bearing balances with banks has been primarily due to seasonal excess funds that result from the clearing of tax refund checks and deposits. These ERC/ERD deposits occur primarily during the first half of the year and are the result of the Company's relationship with a third-party tax refund product provider. The Company acts as the facilitator for these ERC/ERD transactions and earns a fee for each cleared item. For the short time the Company holds such refunds, constituting noninterest-bearing deposits, the Company increases its deposits with the Federal Reserve. This causes the interest-bearing balances with banks to represent a large percentage of earning assets during the time the Company holds the refunds, although such balances decrease during the second half of the year. Although the Company experienced loan growth in 2016, much of this was from the acquisition of Milton Bank loans. However, the Company also experienced organic loan growth, impacted by the Athens, Ohio market. As loan volume was increasing during 2016, the Company used more of its short-term Federal Reserve funds to satisfy loan demand. This led to lower average interest-bearing balances with banks, finishing at 8.9% of average earning assets in 2016, as compared to 9.4% and 7.5% in 2015 and 2014, respectively.
Average interest-bearing liabilities increased 7.3% between 2015 and 2016, while increasing 2.3% between 2014 and 2015. The growth in interest-bearing deposits during 2016 was in large part due to the Milton Bank merger, which resulted in the acquisition of $119,669 in deposits. Interest-bearing liabilities continue to be comprised largely of time deposits, which represented 29.6%, 32.0% and 33.0% of total interest-bearing liabilities at year-end 2016, 2015 and 2014, respectively. As interest rates on time deposits have continued to readjust to current market rates in 2016, competitive pricing pressures have grown, contributing to a continued maturity runoff of time deposits during 2016 and 2015. In addition, the Company's other borrowings and subordinated debentures continue to represent the smallest composition of average interest-bearing liabilities, finishing at 7.0%, 6.2% and 6.0% at year-end 2016, 2015 and 2014, respectively. During 2016, the Company utilized a portion of its FHLB borrowing capacity to fund specific fixed-rate loans with similar maturity terms which led to the composition shift increase.
The Company's core deposit segment of interest-bearing liabilities, which include NOW and savings and money market accounts, together represented 63.4% of average interest-bearing liabilities in 2016, compared to 61.7% in 2015 and 60.9% in 2014. As certificates of deposit ("CD") market rates continue to adjust downward, and the spread between a short-term CD rate and a statement savings rate is minimal, many customers choose to invest balances into a more liquid product.
The overall composition shift to higher demand, NOW, savings and money market balances combined with a lower composition of time deposits from 2014 to 2016 has served as a cost effective contribution to the net interest margin. The average cost of the "growing" interest-bearing NOW, savings and money market account core segment was 0.24%, 0.27% and 0.28% during the years ended 2016, 2015 and 2014, respectively. The higher average cost of the time deposit, other borrowed money and subordinated debenture segments was 1.05%, 0.96% and 0.99% during the years ended 2016, 2015 and 2014, respectively.
62
MANAGEMENT's DISCUSSION AND ANALYSIS OF
FINANCIAL CONDITION AND RESULTS OF OPERATIONS
The net interest margin increased 1 basis point to 4.40% in 2016 from 4.39% in 2015. Conversely, the net interest margin decreased 15 basis points to 4.39% in 2015 from 4.54% in 2014. These changes to the net interest margin are largely impacted by the net interest rate spread. During 2016, the net interest rate spread increased 2 basis points to 4.23%, resulting from the increase in average yield on interest-earning assets of 1 basis point from 4.75% to 4.76%, combined with 1 basis point decrease in average cost of interest-bearing liabilities from 0.54% to 0.53%. Partially offsetting the net interest rate spread increase in 2016 was a 1 basis point decrease in contributions from interest-free funds (i.e., demand deposits, shareholders' equity), which lowered from 0.18% in 2015 to 0.17% in 2016. Conversely, during 2015, the net interest rate spread decreased 15 basis points to 4.21%, resulting from the decrease in average yield on interest-earning assets of 17 basis points from 4.92% to 4.75%, which exceeded the decrease in average cost of interest-bearing liabilities of 2 basis points from 0.56% to 0.54%.
During 2016, total interest income on an FTE basis increased $3,007, or 8.1%, as compared to an increase of $8 during 2015. The significant interest income improvement from 2015 to 2016 came primarily from average earning asset growth as result of the Milton Bank acquisition. The acquisition contributed to a 9.3% increase in average loan balances from 2015 to 2016, which was also impacted by average loan growth from the Company's new Athens, Ohio office. Total interest income growth also came from the Company's Federal Reserve clearing account balances. In December 2015, the Federal Reserve increased short-term rates by 25 basis points. The timing of this rate adjustment benefited the Company, as it entered into the first quarter experiencing significant levels of excess funds from the large volume of ERC/ERD transactions that were maintained within the Federal Reserve clearing account. These positive contributions to interest income were partially offset by lower loan yields, which decreased 5 basis points from 2015 to 2016 in the sustained low interest rate environment. The nominal interest income improvement from 2014 to 2015 came primarily from average earning asset growth and improved asset yields associated with taxable securities. The Company experienced a 1.4% increase in average loan balances from 2014 to 2015, primarily from its residential real estate and consumer loan portfolios. These positive contributions to interest income completely offset the negative effects of lower loan yields, which decreased 10 basis points from 2014 to 2015.
During 2016, total interest income on average earning assets increased $3,014, or 8.3%, as compared to 2015. Conversely, total interest income decreased $21, or .06%, during 2015, as compared to 2014. The changes in interest income from 2015 to 2016 were impacted most by the commercial loan portfolio. During the third quarter of 2016, the Bank acquired $112,479 in loans as part of the Milton Bank merger, of which 36% were comprised of commercial loans. Furthermore, the Company experienced growing commercial loan demand within its new loan production office that opened in Athens, Ohio during the fourth quarter of 2016. Management was pleased with the loan volume production in response to the Company's new market presence in Athens county. These positive contributions helped to generate a 9.8% increase in average commercial loan balances during 2016, and, as a result, increased commercial interest and fee revenue by $1,272, or 10.0%, during the year ended 2016, as compared to 2015. The positive results of commercial loan revenue in 2016 is compared to a decrease of $110, or 0.9%, in commercial loan revenue during the year ended 2015, as compared to 2014. This was largely due to large payoffs of various commercial loans during 2015, along with increasing competition for loan opportunities within the Company's market areas during this time. The declining loan balances and increasing competitive pressures caused the commercial loan portfolio to stabilize by year-end 2015.
63
MANAGEMENT's DISCUSSION AND ANALYSIS OF
FINANCIAL CONDITION AND RESULTS OF OPERATIONS
The Company's interest and fees from its residential real estate loan portfolio increased $685, or 5.9%, during the year ended 2016 compared to 2015. Conversely, residential real estate interest and fee income decreased $143, or 1.2%, during 2015, as compared to 2014. The acquired loan balances of Milton Bank consisted of 42% in residential real estate loan balances, which contributed most to the increase in real estate loan revenue during 2016. When excluding the real estate revenue generated by the Milton Bank branches during 2016, the Company's real estate revenue represents a decrease of $204, or 1.8%, during the year ended 2016. This is then comparable to the 1.2% decrease experienced during the year ended 2015. A contributing factor to the decline in real estate revenue, excluding Milton Bank, is a composition shift from higher-yielding, long-term, fixed-rate loan balances to lower-yielding, adjustable-rate mortgage originations. This shift to more lower-yielding loans has placed additional pressure on asset yields. Furthermore, the Company continues to sell a portion of its long-term, fixed-rate real estate loans to the Federal Home Loan Mortgage Corporation, while retaining the servicing rights for those mortgages. While this strategy has generated loan sale and servicing fee revenue within noninterest income, it has also contributed to lower interest and fee revenues during 2015 and 2016.
During the year ended 2016, consumer loan interest and fees increased $828, or 9.1%, as compared to 2015, and increased $99, or 1.1%, during the year ended 2015, as compared to 2014. The improvement in consumer loan revenue during 2016 was impacted most by the acquired loans of Milton Bank, which consisted of 22% in consumer loan balances. Further impacting consumer loan revenue was the average balance growth associated with increased auto loan financings and unsecured consumer loan balances. However, consumer loan interest during 2016 and 2015 continued to be negatively impacted by lower asset yields reflective of the sustained low rate environment.
The Company's interest income from taxable investment securities improved during both 2016 and 2015, increasing $121, or 5.6%, in 2015 and $113, or 5.6%, in 2015. Average balance growth during 2016 and 2015 has contributed to higher interest income, particularly in 2016 with the Company acquiring $5,868 in securities as part of the Milton Bank merger. The improvement came primarily from increased purchases of Agency mortgage-backed securities during 2016. The positive effects from average balance growth in taxable investment securities were partially offset by a 6 basis point decrease in yield from 2015 to 2016, primarily due to the investment of maturities at market rates lower than the average portfolio yield. Furthermore, the portfolio of taxable securities acquired from Milton Bank carried a lower average yield than the Company's overall taxable securities yield prior to the merger. From 2014 to 2015, the yield on securities increased 7 basis points, which was related to the reduction in premium amortization expense on Agency mortgage-backed securities. Based on a reduction in mortgage refinancing in the general market, the Company experienced a decrease in cash flow on Agency mortgage-backed securities, which resulted in less premium amortization expense and a higher net portfolio yield.
Total interest expense incurred on the Company's interest-bearing liabilities increased $183, or 6.4%, during 2016, while decreasing $36, or 1.3%, during 2015. The increase in 2016 was primarily from the Milton Bank acquired deposits that generated more interest expense. However, the Company's interest expense continues to be minimized by a sustained low-rate environment that has impacted the repricings of various Bank deposit products. In addition, over 60% of the acquired Milton Bank deposits consisted of core deposit funding sources. As a result, the Company experienced a deposit composition shift from a higher level of average time deposits to an increasing level of average core deposit balances in demand, NOW, savings and money market balances. The Company's average time deposit balances with a weighted average cost of 0.8% decreased $1,385 during 2016 and $1,227 during 2015. This is compared to an average balance increase of $33,261 and $11,511 in lower costing, interest-bearing core deposit balances with a weighted average cost of less than 0.3% during 2016 and 2015, respectively. As a result of decreases in the average market interest rates mentioned above and the deposit composition shift to lower-costing, interest-bearing deposit balances, the Company's total weighted average funding costs have decreased to 0.53% at year-end 2016, as compared to 0.54% at year-end 2015 and 0.56% at year-end 2014.
64
MANAGEMENT's DISCUSSION AND ANALYSIS OF
FINANCIAL CONDITION AND RESULTS OF OPERATIONS
Partially offsetting the positive effects of core deposit funding mentioned above was the impact from other borrowed money and subordinated debentures, which collectively increased interest expense by $220 during the year ended 2016, and $9 during the year ended 2015. The increase was primarily from the average growth in FHLB borrowings which were used to fund the purchases of specific earning assets during 2016.
While the Company experienced margin improvement during 2016 primarily due to improved average loan balances and a higher deposit mix of lower-costing core deposits, the margin decreased 15 basis points during 2015. Margin compression during 2015 was attributed to the limited opportunities at which interest rates on core deposits could adjust downward. With interest rates so low, the Company's core deposit accounts are perceived to be at, or near, their interest rate floors. In addition, the Company's CDs that had higher interest rates have either repriced to current market rates or have matured and left the portfolio. The Company will continue to focus on growing the average loan portfolio and re-deploying the excess liquidity retained within the Federal Reserve account into higher yielding assets as opportunities arise. Further decreases in interest rates by the Federal Reserve would have a negative effect on the Company's net interest income. The Company will face pressure on its net interest income and margin improvement if loan balances do not continue to expand and become a larger component of overall earning assets. For additional discussion on the Company's rate sensitive assets and liabilities, please see "Interest Rate Sensitivity and Liquidity" and "Table VIII" within this Management's Discussion and Analysis.
PROVISION EXPENSE
Credit risk is inherent in the business of originating loans. The Company sets aside an allowance for loan losses through charges to income, which are reflected in the consolidated statement of income as the provision for loan losses. Provision for loan loss is recorded to achieve an allowance for loan losses that is adequate to absorb losses in the Company's loan portfolio. Management performs, on a quarterly basis, a detailed analysis of the allowance for loan losses that encompasses loan portfolio composition, loan quality, loan loss experience and other relevant economic factors.
The Company's provision expense during the years ended 2016, 2015 and 2014 totaled $2,826, $1,090 and $2,787, respectively. The Company experienced a $2,310 increase in provision expense during 2016, while provision expense decreased $1,697 from 2014 to 2015. The effects of both variances were largely related to changes in the specific and general allocations within the allowance for loan losses. Provision expense from 2015 to 2016 was largely impacted by higher specific allocations from year-end 2015. Specific allocations of the allowance for loan losses identify loan impairment by measuring fair value of the underlying collateral and the present value of estimated future cash flows. When re-evaluating the impaired loan balances to their corresponding collateral values at December 31, 2016, a specific allocation of $2,535 was needed to fund the allowance for loan losses of the commercial real estate loan segment, up from the $311 specific allocation at December 31, 2015. This higher reserve allocation was impacted mostly by two impaired commercial real estate loan relationships that required specific reserves of $2,435 at year-end 2016, and required a corresponding increase to provision for loan losses expense. This was partially offset by a decrease in the specific allocations within the commercial and industrial loan segment, which lowered from $1,850 at December 31, 2015 to $241 at December 31, 2016. This was due to a reduction in specific reserves that were previously related to one commercial and industrial loan relationship. Prior to 2016, specific reserves of $1,155 were necessary as a result of collateral impairment. During the second quarter of 2016, a re-evaluation of this borrower's financial performance identified significant improvement, which resulted in a credit quality upgrade to the borrower relationship and no identified collateral impairment at December 31, 2016. Provision expense from 2014 to 2015 was largely impacted by higher specific allocations during 2014. The Company identified the asset impairment of one commercial real estate loan relationship that required specific reserves of $1,340 to be recorded in the fourth quarter of 2014. These impairment charges were based on collateral values and required a corresponding increase to provision for loan losses expense. Consequently, during the second quarter of 2015, this specific allocation was charged off. Since this specific allocation had already been provided for during the fourth quarter of 2014, the charge-off did not have an impact to provision expense in 2015. This contributed to a decrease in the Company's specific allocations from $3,412 at December 31, 2014 to $2,164 at December 31, 2015.
65
MANAGEMENT's DISCUSSION AND ANALYSIS OF
FINANCIAL CONDITION AND RESULTS OF OPERATIONS
Provision expense during 2016 was also impacted by general allocations. The Company's general allocation evaluates several factors that include: average historical loan loss trends, economic risk, asset quality, and changes in classified and criticized assets. At December 31, 2016, general allocations totaled $4,718 as compared to $4,484 at December 31, 2015, mostly from an increase in the loan loss history of the consumer loan segment. During 2015, the Company experienced improvements (declines) in its average loan loss history, as well as declines in its classified asset portfolio, resulting in lower provision expense and general allocations in 2015, as compared to 2014.
During 2016, the Company's net charge-offs totaled $1,775, as compared to $2,776 in net charge-offs recognized during 2015. The decrease was largely due to the charge-off of a specific allocation of one impaired commercial real estate loan during 2015. The charge-off did not have an impact to provision expense since the allocation was already provided for during 2014. The remaining charge-off increases came primarily from consumer loans. The effect of lower charge-offs during 2016 had a direct effect in partially offsetting the provision expense increases impacted by higher classified assets and collateral value impairments. During 2015, the Company's net charge-offs totaled $2,776, as compared to $608 in net charge-offs recognized during 2014. The increase was largely due to the charge-off of a specific allocation of the impaired commercial real estate loan previously mentioned. The remaining charge-off increases came primarily from residential real estate and other commercial real estate loans. The effect of higher charge-offs during 2015 had a direct effect in partially offsetting the provision expense decreases impacted by lower classified assets and less collateral value impairments. Management believes that the allowance for loan losses was adequate at December 31, 2016 to absorb probable losses in the portfolio. The allowance for loan losses was 1.05% of total loans at December 31, 2016, compared to 1.13% at December 31, 2015 and 1.40% at December 31, 2014. Future provisions to the allowance for loan losses will continue to be based on management's quarterly in-depth evaluation that is discussed in further detail under the caption "Critical Accounting Policies - Allowance for Loan Losses" within this Management's Discussion and Analysis.
NONINTEREST INCOME
During 2016, total noninterest income decreased $358, or 4.2%, as compared to 2015. The decline in noninterest revenue was primarily from lower gains on the sale of OREO properties, which finished with a net loss of $467 at year-end 2016, as compared to a net gain of $99 at year-end 2015. The net OREO loss in 2016 was mostly from the lower appraised value of one land development property during the fourth quarter of 2016. A re-evaluation of the property resulted in a $393 impairment charge that was recorded as a write-down to the OREO property's carrying value.
The Company's noninterest income was also negatively impacted by a reduction in seasonal tax refund processing revenue classified as ERC/ERD fees. During the year ended 2016, the Company's ERC/ERD fees decreased by $323, or 13.6%, as compared to the same period in 2015, largely due to reduced transaction fees associated with each refund facilitated. On October 21, 2014, the Bank entered into a new agreement with the third-party tax refund product provider. Due to competitive pressures, the new agreement provided for a different fee structure, including different fees depending upon the tax refund product selected, and fees that were lower for each refund facilitated, with a reduction in per transaction fees in future years. As a result, even though the Company experienced an increase in the number of ERC/ERD transactions that were facilitated, the lower fee structure caused tax processing revenues to be lower than the year before. As a result of ERC/ERD fee activity being mostly seasonal, the majority of income was recorded during the first half of 2016. This revenue source accounted for 24.9% of total noninterest income in 2016.
66
MANAGEMENT's DISCUSSION AND ANALYSIS OF
FINANCIAL CONDITION AND RESULTS OF OPERATIONS
Also decreasing in 2016 were gains on the sale of securities. As earning asset yields during 2015 were declining, the Company took opportunities to sell some of its lower-yielding investment securities. During the second and third quarters of 2015, the Company recorded gross gains of $163 on the sale of $10,387 in Agency mortgage-backed securities, while reinvesting the proceeds into higher-yielding securities. The shift of balances to higher-yielding assets had a positive effect on the margin in 2015. The Company did not sell any of its securities during 2016.
Partially offsetting the declines in noninterest income were noninterest earnings from the Milton Bank acquisition. In total, the Company benefited from $293 in noninterest income generated by the Milton Bank acquisition during the second half of 2016, consisting mostly of $214 in service charges on deposit accounts. As a result, the Company's service charges on deposit accounts increased $404, or 25.7%, during 2016. Further impacting service charge income was a volume increase in overdraft items during 2016.
Noninterest income earnings also came from debit and credit interchange income, which increased $195, or 8.1%, during the year ended 2016 as compared to 2015. This increase included $75 in debit card interchange income from Milton Bank branches. The volume of transactions utilizing the Company's credit card and Jeanie® Plus debit card continue to increase from a year ago. The Company continues to offer incentive-based credit and debit cards that permit their users to redeem accumulated points for merchandise, as well as cash incentives paid, particularly to business users based on transaction criteria. While incenting debit/credit card customers has increased customer use of electronic payments, which has contributed to higher interchange revenue, the strategy also fits well with the Company's emphasis on growing and enhancing its customer relationships.
The Company's remaining noninterest income categories were up $95, or 4.8%, during the year ended 2016 as compared to 2015. This increase was in large part due to earnings from tax-free bank owned life insurance ("BOLI") investments.
During 2015, total noninterest income decreased $1,196, or 12.2%, as compared to 2014. The decline in noninterest revenue was primarily from the sale of the Company's 9% ownership interest in ProAlliance during the third quarter of 2014. The Company recorded the first installment of $135 during the first quarter of 2014 and the second installment of $675 in August 2014. The proceeds from the sale of $810 was reported as a gain on sale. The total after-tax impact to the Company's 2014 net income from the gain was $535.
The Company's noninterest income was also negatively impacted by a reduction in seasonal tax refund processing revenue classified as ERC/ERD fees. During the year ended 2015, the Company's ERC/ERD fees decreased by $762, or 24.3%, as compared to the same period in 2014, largely due to reduced transaction fees associated with each refund facilitated.
Partially offsetting the declines in noninterest income was growth from the Company's debit and credit interchange income, which increased $225, or 10.4%, during the year ended 2015 as compared to 2014. The increase was related to the larger volume of transactions utilizing the Company's credit card and Jeanie® Plus debit card from 2014.
67
MANAGEMENT's DISCUSSION AND ANALYSIS OF
FINANCIAL CONDITION AND RESULTS OF OPERATIONS
As earning asset yields during 2015 continued to decline, the Company took opportunities to sell some of its lower-yielding investment securities. During the second and third quarters of 2015, the Company recorded gross gains of $163 on the sale of $10,387 in Agency mortgage-backed securities, while reinvesting the proceeds into higher-yielding securities. The shift of balances to higher-yielding assets had a positive effect on the margin.
The Company's remaining noninterest income categories were down $12, or 0.3%, during the year ended 2015 as compared to 2014. This decline was in large part due to service charges on deposit accounts decreasing $54, or 3.3%, impacted by fewer overdraft items from the prior year.
NONINTEREST EXPENSE
Management continues to work diligently to minimize the growth in noninterest expense. For 2016, total noninterest expense increased $3,280, or 11.1%. The increase was impacted by the acquisition of Milton Bank, which contributed to general increases in most noninterest expense categories related to having a larger organization after the merger. Milton Bank's noninterest expense was $1,174 during 2016, coming mostly from salaries and employee benefits, as well as building and equipment costs. Excluding the impact from Milton Bank, the Company's total noninterest expense would have increased $2,106, or 7.1%, during 2016.
The Company's largest noninterest expense item, salaries and employee benefits, increased $1,376, or 7.9%, during 2016 as compared to 2015. The increase was largely from the personnel costs associated with Milton Bank, which contributed $754 to this line item during 2016. The remaining increase of $622 to salaries and employee benefit expense was largely due to annual merit increases and higher health insurance expense. During 2016, the Company experienced a higher full-time equivalent employee base, increasing from 248 employees at year-end 2015 to 297 employees at year-end 2016, in large part due to the addition of Milton Bank employees.
Noninterest expense during 2016 was also impacted by $930 in one-time merger related expenses related to the acquisition of Milton Bancorp and Milton Bank. The merger was closed on August 5, 2016. Merger expenses consisted largely of services to combine the operating systems of both companies, as well as investment banking, accounting, and legal services. The Company has incurred the majority of its merger related expenses during 2016 and anticipates any remaining merger costs to be minimal.
Noninterest expense increases during 2016 were also impacted by occupancy and furniture/equipment costs, which collectively increased $368, or 15.3%, as compared to 2015. This increase was impacted mostly by the fixed assets acquired as part of the Milton Bank merger during the third quarter of 2016. As part of the merger, the Company acquired five full-service branch facilities, one administrative building, and one building that is leased out to a third party. In total, Milton Bank's premises and equipment expenses totaled $315, consisting mostly of depreciation, repair and maintenance, and utility costs.
Data processing expenses during 2016 increased $196, or 15.6%, as compared to 2015, in relation to the growth in transaction volume with the Company's debit and credit cards, which was also affected by the addition of Milton Bank customers. Higher data processing charges were also impacted by the Company's Big Rewards customer incentive platform.
The Company also recognized a $193, or 17.2%, increase in software expense during 2016. Software costs were partly affected by the addition of Milton Bank and their transition to new system resources. The Company continues to utilize the software applications available in the banking industry to maximize computer network efficiencies and enhance customer convenience.
68
MANAGEMENT's DISCUSSION AND ANALYSIS OF
FINANCIAL CONDITION AND RESULTS OF OPERATIONS
The remaining noninterest expense categories increased $217, or 3.0%, during the year-ended 2016, as compared to 2015. The increases were primarily due to higher marketing, consulting and customer incentive expenses, partially offset by lower FDIC assessment expense.
For 2015, total noninterest expense increased $326, or 1.1%. Contributing most to the increase in net overhead expense for 2015 were professional fees, foreclosure costs and data processing expenses. Increases in total noninterest expense were partially offset by decreases in salaries and employee benefits.
The Company's largest noninterest expense item, salaries and employee benefits, decreased $380, or 2.1%, during 2015 as compared to 2014. The decrease was largely due to lower employee benefit costs associated with various nonqualified defined benefit plans. During the fourth quarter of 2014, the Company incorporated recently issued data in establishing the liability associated with its nonqualified defined benefit plans. The data was in relation to new mortality tables issued by the Society of Actuaries ("SOA") in October of 2014. The SOA-revised mortality tables reflected longer life expectancies, along with an expectation that the trend will continue. In following U.S. generally accepted accounting principles, the Company used the revised mortality tables to update its own assumption data that impact its nonqualified defined benefit plans. Furthermore, in relation to a decrease in long-term interest rates, management reduced the discount rate assumption for the nonqualified benefit plans. The combination of these two adjustments being recorded in 2014 and not being repeated in 2015 contributed to a $730 decrease in nonqualified benefit employee benefit expense from the prior year. Partially offsetting the decreases in employee plan benefit expense was a $259, or 2.0%, increase in salary and health insurance expense. This was primarily due to annual merit increases and higher insurance premiums. During 2015, the Company experienced a lower full-time equivalent employee base, decreasing from 264 employees at year-end 2014 to 248 employees at year-end 2015.
Noninterest expense during 2015 was also impacted by a decrease of $144, or 14.3%, in marketing costs. The decrease was largely a result of the significant donations made in 2014 as part of the Company's "Community First" initiative that emphasizes giving back to the communities in which it does business.
Noninterest expense during 2015 reflected increases in various overhead areas, including furniture/equipment costs, which increased $44, or 5.8%, as compared to 2014. This increase was impacted mostly by higher depreciation costs on furniture and equipment purchases related to the Company's new Barboursville, WV branch location that commenced operations in the first quarter of 2015.
During 2015, the Company experienced a $224, or 19.5%, increase in various professional service fees, which included accounting, audit and legal costs. A portion of this increase was impacted by the anticipated merger between the Company and Milton Bancorp.
Also contributing to higher noninterest expense during 2015 were FDIC assessments, which increased $100, or 20.7%, as compared to 2014. This increase was related to an increase in the average quarterly assessment rates during 2015 versus 2014.
Data processing expenses during 2015 increased $132, or 11.7%, as compared to 2014, in relation to the continued growth in transaction volume with the Company's debit and credit cards. Higher data processing charges were also impacted by the Company's Big Rewards customer incentive platform.
The Company also recognized a $109, or 10.8%, increase in software expense during 2015. The Company continues to utilize the software resources available in the banking industry to maximize computer network efficiencies and enhance customer convenience.
Further contributing to higher noninterest expense during 2015 were foreclosed asset costs, which increased $162, or 87.6%, as compared to 2014. This increase was related to various expenses incurred in 2015 in association with the liquidations of various commercial real estate properties in process of foreclosure. Foreclosure expenses include the costs in maintaining the properties, which consist of taxes, management fees and general maintenance.
69
MANAGEMENT's DISCUSSION AND ANALYSIS OF
FINANCIAL CONDITION AND RESULTS OF OPERATIONS
In 2015, the Company's other noninterest expenses increased $65, or 1.6%, as compared to 2014. The increase was largely from customer incentive expenses, increasing $125, or 16.1%, over 2014. This increasing trend of higher customer incentives has been part of management's emphasis on further building and maintaining core deposit relationships while increasing interchange revenue.
The Company's efficiency ratio is defined as noninterest expense as a percentage of fully tax-equivalent net interest income plus noninterest income. Management continues to place emphasis on managing its balance sheet mix and interest rate sensitivity to help expand the net interest margin as well as developing more innovative ways to generate noninterest revenue. During 2016, the Company experienced a nominal increase to its net interest margin as a result of higher earning asset yields complemented by higher average earning asset growth and lower funding costs. Noninterest revenues also decreased by 4.2%, while overhead expenses were up 11.1% from the prior year. As a result, net revenue levels during 2016 were outpaced by higher overhead expense, causing the year-to-date efficiency ratio to increase (regress) to 72.8% at December 31, 2016, as compared to 69.3% at December 31, 2015. During 2015, the Company experienced net interest margin compression as a result of lower earning asset yields completely offsetting higher average earning asset growth and lower funding costs. Noninterest revenues also decreased by 12.2%, while overhead expenses were up 1.1% from the prior year. As a result, net revenue levels during 2015 were outpaced by higher overhead expense, causing the year-to-date efficiency ratio to increase (regress) to 69.3% at December 31, 2015, as compared to 66.7% at December 31, 2014.
FINANCIAL CONDITION:
CASH AND CASH EQUIVALENTS
The Company's cash and cash equivalents consist of cash, as well as interest- and non-interest bearing balances due from banks. The amounts of cash and cash equivalents fluctuate on a daily basis due to customer activity and liquidity needs. At December 31, 2016, cash and cash equivalents had decreased $5,364, or 11.8%, to $40,166 as compared to $45,530 at December 31, 2015. The decrease in cash and cash equivalents was largely affected by an $8,401, or 23.3%, decrease within the Company's interest-bearing deposits from year-end 2015, mostly from its Federal Reserve Bank clearing account. The Company continues to utilize its interest-bearing Federal Reserve Bank clearing account to manage seasonal tax refund deposits, as well as to fund earning asset growth and maturities of retail CD's. The decrease in funds since year-end 2015 can be attributed to a funding increase of organic loan growth, particularly during the fourth quarter of 2016. The interest rate paid on both the required and excess reserve balances is based on the targeted federal funds rate established by the Federal Open Market Committee, which currently is 0.75%. In December 2015 and 2016, short-term interest rates were increased by 25 basis points, which had a corresponding effect to the interest revenue growth experienced during the twelve months ended December 31, 2016 on Federal Reserve Bank clearing account balances. This interest rate is higher than what the Company would have received from its investments in federal funds sold, currently in range of less than 0.75%. Furthermore, Federal Reserve Bank balances are 100% secured.
As liquidity levels vary continuously based on consumer activities, amounts of cash and cash equivalents can vary widely at any given point in time. The Company's focus will be to invest available funds into longer-term, higher-yielding assets, primarily loans, when the opportunities arise. Further information regarding the Company's liquidity can be found under the caption "Liquidity" in this Management's Discussion and Analysis.
70
MANAGEMENT's DISCUSSION AND ANALYSIS OF
FINANCIAL CONDITION AND RESULTS OF OPERATIONS
CERTIFICATES OF DEPOSIT
At December 31, 2016, the Company had $1,670 in certificates of deposit owned by the Captive, relatively unchanged from year-end 2015. The deposits on hand at December 31, 2016 consist of six certificates with maturity terms ranging from less than 1 year up to 3 years.
SECURITIES
Management's goal in structuring the portfolio is to maintain a prudent level of liquidity while providing an acceptable rate of return without sacrificing asset quality. During 2016, the balance of total securities increased $3,601, or 3.2%, compared to year-end 2015. The acquired investment securities from Milton Bank totaled $5,868, consisting mostly of U.S. Government sponsored entity securities of $2,628 and Agency mortgage-backed securities of $2,845. The Company's investment securities portfolio is made up mostly of Agency mortgage-backed securities, representing 74.6% of total investments at December 31, 2016. During the year ended 2016, the Company invested $20,938 in new Agency mortgage-backed securities, while receiving principal repayments of $17,381. The monthly repayment of principal has been the primary advantage of Agency mortgage-backed securities as compared to other types of investment securities, which deliver proceeds upon maturity or call date.
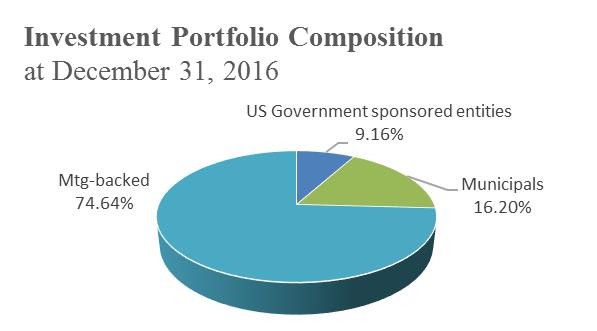 |
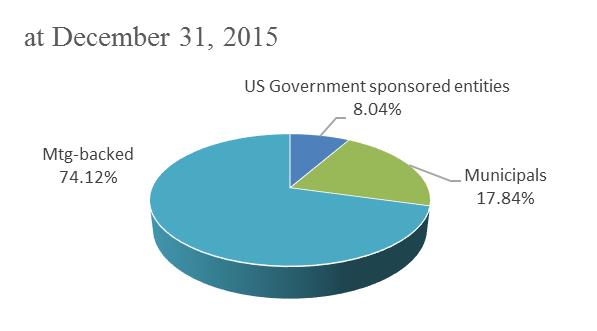 |
Management has not had to sell a debt security in order to maintain sufficient liquidity, as maturing securities have historically accomplished this. However, as overall average earning asset yields continued to decline from 2014, management took the opportunity to sell some of its lower-yielding, Agency mortgage-backed securities. During the second and third quarters of 2015, the Company sold $10,387 in Agency mortgage-backed securities that were collectively yielding 1.38% at a gain of $163. The Company used the proceeds from the sale to help fund new Agency mortgage-backed security purchases totaling $25,150 at an interest yield of 2.0%, which had a positive impact on the net interest margin. The Company did not sell any of its securities during 2016.
Since 2008, the reinvestment rates on debt securities have shown limited returns due to the sustained low rate environment. The weighted average FTE yield on debt securities at year-end 2016 was 2.29%, as compared to 2.43% at year-end 2015 and 2.38% at year-end 2014. As a result of minimal returns on debt securities, the Company's focus will be to generate interest revenue primarily through loan growth, as loans generate the highest yields of total earning assets. Table III provides a summary of the portfolio by category and remaining contractual maturity. Issues classified as equity securities have no stated maturity date and are not included in Table III.
71
MANAGEMENT's DISCUSSION AND ANALYSIS OF
FINANCIAL CONDITION AND RESULTS OF OPERATIONS
SECURITIES
Table III
|
|
MATURING
|
|||||||||||||||||||||||||||||||
|
As of December 31, 2016
|
Within
One Year
|
After One but Within Five Years
|
After Five but Within Ten Years
|
After Ten Years
|
||||||||||||||||||||||||||||
|
(dollars in thousands)
|
Amount
|
Yield
|
Amount
|
Yield
|
Amount
|
Yield
|
Amount
|
Yield
|
||||||||||||||||||||||||
|
|
||||||||||||||||||||||||||||||||
|
U.S. Government
sponsored entity
securities
|
$
|
3,999
|
0.64
|
%
|
$
|
6,545
|
1.02
|
%
|
$
|
----
|
----
|
$
|
----
|
----
|
||||||||||||||||||
|
Obligations of states and
political subdivisions
|
275
|
5.10
|
%
|
7,342
|
5.20
|
%
|
9,029
|
5.46
|
%
|
2,521
|
5.46
|
%
|
||||||||||||||||||||
|
Agency mortgage-backed
securities, residential
|
139
|
4.02
|
%
|
56,080
|
2.73
|
%
|
28,962
|
2.16
|
%
|
769
|
2.54
|
%
|
||||||||||||||||||||
|
Total securities
|
$
|
4,413
|
1.02
|
%
|
$
|
69,967
|
2.83
|
%
|
$
|
37,991
|
2.94
|
%
|
$
|
3,290
|
4.78
|
%
|
||||||||||||||||
Tax-equivalent adjustments have been made in calculating yields on obligations of states and political subdivisions using a 34% rate. Weighted average yields are calculated on the basis of the cost and effective yields weighted for the scheduled maturity of each security. Mortgage-backed securities, which have prepayment provisions, are assigned to a maturity category based on estimated average lives. Securities are shown at their fair values, which include the market value adjustments for available for sale securities.
LOANS
In 2016, the Company's primary category of earning assets and most significant source of interest income, total loans, increased $149,149, or 25.5%, to finish at $734,901. As previously mentioned, the significant increase in loan balances came largely from the loans acquired as part of the Milton Bank merger on August 5, 2016. The impact of higher loan balances came mostly from the commercial loan portfolio, which includes both commercial real estate and commercial and industrial loans. The increase came primarily from the commercial real estate segment. Management continues to place emphasis on its commercial lending, which generally yields a higher return on investment as compared to other types of loans.
Commercial real estate, the Company's largest segment of commercial loans, increased $44,695, or 26.4%, from year-end 2015. At December 31, 2016, the outstanding balance of commercial real estate loans acquired from Milton Bank totaled $22,989, which contributed to most of the 2016 growth. The Company's commercial real estate loans were also impacted by its Athens, Ohio market. In December 2015, the Company opened a loan production office in Athens, Ohio to expand its market presence. Loan demand was very responsive within the Athens location, producing $19,282 in loans during the year ended 2016. As a result, commercial real estate loan balances from the Athens loan production office have increased $19,123 since year-end 2015. Commercial real estate consists of owner-occupied, nonowner-occupied and construction loans. Commercial real estate also includes loan participations with other banks outside the Company's primary market area. Although the Company is not actively seeking to participate in loans originated outside its primary market area, it has taken advantage of the relationships it has with certain lenders in those areas where the Company believes it can profitably participate with an acceptable level of risk. Commercial real estate loans experienced growth in all three segments, led by construction loans increasing $22,018, or 92.3%, during 2016. Commercial construction loans are extended to individuals as well as corporations for the construction of an individual property or multiple properties and are secured by raw land and the subsequent improvements. Nonowner-occupied loans, which increased $18,530, or 25.7%, during 2016, are property loans for which the repayment of principal is dependent upon rental income associated with the property or the subsequent sale of the property, such as apartment buildings, condominiums, hotels and motels. These loans are primarily impacted by local economic conditions, which dictate occupancy rates and the amount of rent charged. The Company's owner-occupied loans also increased $4,147, or 5.6%, during 2016. Owner-occupied loans consist of nonfarm, nonresidential properties. A commercial owner-occupied loan is a borrower purchased building or space for which the repayment of principal is dependent upon cash flows from the ongoing operations conducted by the party, or an affiliate of the party, who owns the property. Owner-occupied loans of the Company include loans secured by hospitals, churches, and hardware and convenience stores.
72
MANAGEMENT's DISCUSSION AND ANALYSIS OF
FINANCIAL CONDITION AND RESULTS OF OPERATIONS
At December 31, 2016, the Company's commercial and industrial loan portfolio was also impacted by the Milton Bank acquisition, increasing from year-end 2015 by $18,653, or 22.8%. The outstanding balance of commercial and industrial loans acquired from Milton Bank totaled $12,526 at December 31, 2016, which contributed to most of the 2016 growth. Commercial and industrial loans consist of loans to corporate borrowers primarily in small to mid-sized industrial and commercial companies that include service, retail and wholesale merchants. Collateral securing these loans includes equipment, inventory, and stock.
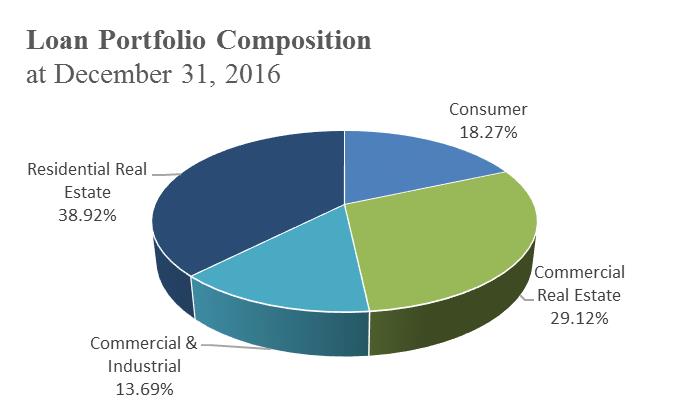 |
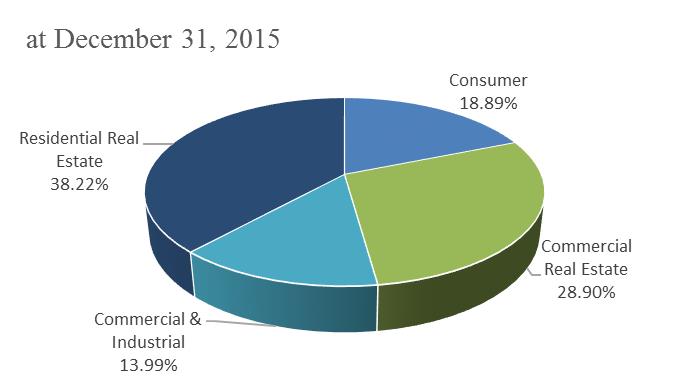 |
Generating residential real estate loans remains a significant focus of the Company's lending efforts. Residential real estate loan balances comprise the largest segment of the Company's total loan portfolio and consist primarily of one- to four-family residential mortgages and carry many of the same customer and industry risks as the commercial loan portfolio. During 2016, total residential real estate loan balances increased $62,147, or 27.8%, from year-end 2015. At December 31, 2016, the outstanding balance of residential real estate loans acquired from Milton Bank totaled $44,900, which contributed to most of the year-to-date growth. The organic loan production within the real estate portfolio consists of increasing short-term adjustable-rate mortgages partially offset by decreasing long-term fixed-rate mortgages. As part of management's interest rate risk strategy, the Company continues to sell most of its long-term fixed-rate residential mortgages to the Federal Home Loan Mortgage Corporation, while maintaining the servicing rights for those mortgages. A customer that does not qualify for a long-term, secondary market loan may choose from one of the Company's other adjustable-rate mortgage products, which contributed to higher balances of adjustable-rate mortgages from year-end 2015.
73
MANAGEMENT's DISCUSSION AND ANALYSIS OF
FINANCIAL CONDITION AND RESULTS OF OPERATIONS
Total loans also received positive contributions from the Company's consumer loan portfolio, which increased $23,654, or 21.4%, from year-end 2015. The Company's consumer loans are primarily secured by automobiles, mobile homes, recreational vehicles and other personal property. Personal loans and unsecured credit card receivables are also included as consumer loans. At December 31, 2016, the outstanding balance of consumer loans acquired from Milton Bank totaled $19,193, which contributed to most of the 2016 growth. The consumer loan portfolio during 2016 benefited mostly from automobile loans, which increased $15,206, or 34.1%, from year-end 2015. The automobile lending component comprises the largest portion of the Company's consumer loan portfolio, representing 44.5% of total consumer loans at December 31, 2016. In recent years, the Company's interest rates offered on indirect automobile opportunities had struggled to compete with the more aggressive lending practices of local banks and alternative methods of financing, such as captive finance companies offering loans at below-market interest rates. However, in 2015 and 2016, the Company continued to target more auto dealers within its market areas, which increased loan origination opportunities. In addition, the Company's interest rate offerings on auto loans have become more competitive with local banks, which has contributed to consumer loan growth. With auto loan volume increasing, the Company will continue to maintain a strict loan underwriting process on its consumer auto loan offerings to limit future loss exposure.
The Company will continue to place more emphasis on loan portfolios (i.e. commercial and, to a smaller extent, residential real estate) with higher returns than auto loans. Indirect automobile loans bear additional costs from dealers that partially offset interest revenue and lower the rate of return.
The Company will continue to follow its secondary market strategy until long-term interest rates increase back to a range that falls within an acceptable level of interest rate risk for the Company. Furthermore, the Company will continue to monitor the pace of its loan volume and remain consistent in its approach to sound underwriting practices and a focus on asset quality.
ALLOWANCE FOR LOAN LOSSES
Tables IV and V provide information about the loan portfolio and the allowance for loan losses. Management evaluates the adequacy of the allowance for loan losses quarterly based on several factors, including, but not limited to, general economic conditions, loan portfolio composition, prior loan loss experience, and management's estimate of probable incurred losses. Management continually monitors the loan portfolio to identify potential portfolio risks and to detect potential credit deterioration in the early stages, and then establishes reserves based upon its evaluation of these inherent risks. Actual losses on loans are reflected as reductions in the reserve and are referred to as charge-offs. The amount of the provision for loan losses charged to operating expenses is the amount necessary, in management's opinion, to maintain the allowance for loan losses at an adequate level that is reflective of probable and inherent loss. The allowance required is primarily a function of the relative quality of the loans in the loan portfolio, the mix of loans in the portfolio and the rate of growth of outstanding loans. Impaired loans, which include loans classified as TDR's, are considered in the determination of the overall adequacy of the allowance for loan losses.
Management continues to focus on improving asset quality and lowering credit risk while working to maintain its relationships with its borrowers. During 2016, the Company's allowance for loan losses increased $1,051, or 15.8%, to finish at $7,699 as compared to $6,648 at year-end 2015. The change in reserves was largely due to higher specific allocations from year-end 2015. When re-evaluating the impaired loan balances to their corresponding collateral values at December 31, 2016, a specific allocation of $2,981 was needed to fund the allowance for loan losses, representing an increase of $817, or 37.8%, from year-end 2015. This higher reserve allocation was impacted mostly by two impaired commercial real estate loan relationships that required specific reserves of $2,435 at December 31, 2016 based on updated collateral values. The increase in reserves for those loans was partially offset by a reduction of $1,155 in specific reserves that were previously related to one commercial and industrial loan relationship, which received a credit quality upgrade and no identified collateral impairment at year-end 2016. Further offsetting the specific reserve increases was the charge-off of a commercial and industrial loan's specific allocation of $586 during the third quarter of 2016.
74
MANAGEMENT's DISCUSSION AND ANALYSIS OF
FINANCIAL CONDITION AND RESULTS OF OPERATIONS
On a quarterly basis, management also reviewed various factors that directly impact allocations of the allowance, which include: historical loan losses, loan delinquency levels, local economic conditions and unemployment rates, criticized/classified asset coverage levels and loan loss recoveries. As a result of these factors, the general allocation component of the allowance for loan losses increased $234, or 5.2%, from year-end 2015. Contributing most to elevated general allocations were increases in classified assets from year-end 2015, consisting mostly of various commercial real estate and commercial and industrial loans being downgraded due to growing risks in their repayment ability. The negative effects of higher classified assets were partially offset by lower net charge-offs during the year ended December 31, 2016, which contributed to a lower average historical loan loss factor from year-end 2015. The average historical loan loss factor is based on a 5-year loan loss history for commercial loans and 3 years for real estate and consumer loans. The Company also experienced a decrease in its criticized assets from year-end 2015, which was largely due to the payoffs and risk rating upgrades associated with various commercial real estate and commercial and industrial loans.
Impaired loans at December 31, 2016 increased $5,481, or 31.8%, from year-end 2015, largely from the debt restructuring of one owner-occupied commercial real estate loan relationship during the second quarter of 2016. The Company also experienced an increase in its troubled assets, with nonperforming loans to total loans finishing at 1.26% at December 31, 2016, up from 1.24% at year-end 2015. Nonperforming loans consist of nonaccruing loans and accruing loans past due 90 days or more. Nonperforming loans finished at $9,288 at year-end 2016, compared to $7,275 at year-end 2015, due to various commercial real estate and residential real estate loans classified as nonaccrual. While the nonperforming loan ratio increased from year-end 2015, the Company's nonperforming assets to total assets ratio decreased to 1.20% at year-end 2016, as compared to 1.21% at December 31, 2015. These changes were largely due to the 19.9% increase in Company assets impacted by the merger with Milton Bancorp. Nonperforming loans and nonperforming assets at December 31, 2016 continue to be in various stages of resolution for which management believes such loans are adequately collateralized or otherwise appropriately considered in its determination of the adequacy of the allowance for loan losses.
At December 31, 2016, the ratio of the allowance for loan losses decreased to 1.05%, compared to 1.13% at December 31, 2015. While the balance of the allowance for loan losses increased from year-end 2015 due to higher general and specific allocations, it was the 25.5% increase in total loans that caused the allowance to total loans ratio to decrease. Loan increases were largely impacted by the Milton Bancorp merger. Management believes that the allowance for loan losses was
75
MANAGEMENT's DISCUSSION AND ANALYSIS OF
FINANCIAL CONDITION AND RESULTS OF OPERATIONS
ALLOCATION OF THE ALLOWANCE FOR LOAN LOSSES
Table IV
|
(dollars in thousands)
|
Years Ended December 31
|
|||||||||||||||||||
|
|
||||||||||||||||||||
|
|
2016
|
2015
|
2014
|
2013
|
2012
|
|||||||||||||||
|
Commercial loans(1)
|
$
|
5,222
|
$
|
4,548
|
$
|
5,797
|
$
|
4,193
|
$
|
4,729
|
||||||||||
|
Percentage of loans to total loans
|
42.81
|
%
|
42.89
|
%
|
43.98
|
%
|
43.21
|
%
|
41.60
|
%
|
||||||||||
|
Residential real estate loans
|
939
|
1,087
|
1,426
|
1,169
|
1,329
|
|||||||||||||||
|
Percentage of loans to total loans
|
38.92
|
%
|
38.22
|
%
|
37.60
|
%
|
38.73
|
%
|
40.49
|
%
|
||||||||||
|
Consumer loans(2)
|
1,538
|
1,013
|
1,111
|
793
|
847
|
|||||||||||||||
|
Percentage of loans to total loans
|
18.27
|
%
|
18.89
|
%
|
18.42
|
%
|
18.06
|
%
|
17.91
|
%
|
||||||||||
|
Allowance for loan losses
|
$
|
7,699
|
$
|
6,648
|
$
|
8,334
|
$
|
6,155
|
$
|
6,905
|
||||||||||
|
|
100.00
|
%
|
100.00
|
%
|
100.00
|
%
|
100.00
|
%
|
100.00
|
%
|
||||||||||
|
Ratio of net charge-offs to average loans
|
.28
|
%
|
.47
|
%
|
.10
|
%
|
.22
|
%
|
.35
|
%
|
||||||||||
The above allocation is based on estimates and subjective judgments and is not necessarily indicative of the specific amounts or loan categories in which losses may ultimately occur.
(1) Includes commercial and industrial and commercial real estate loans.
(2) Includes automobile, home equity and other consumer loans.
SUMMARY OF NONPERFORMING, PAST DUE AND RESTRUCTURED LOANS
Table V
|
(dollars in thousands)
|
At December 31
|
|||||||||||||||||||
|
|
||||||||||||||||||||
|
|
2016
|
2015
|
2014
|
2013
|
2012
|
|||||||||||||||
|
Impaired loans
|
$
|
22,709
|
$
|
17,228
|
$
|
20,169
|
$
|
14,696
|
$
|
17,401
|
||||||||||
|
Past due 90 days or more and still accruing
|
327
|
39
|
73
|
78
|
359
|
|||||||||||||||
|
Nonaccrual
|
8,961
|
7,236
|
9,549
|
3,580
|
3,626
|
|||||||||||||||
|
Accruing loans past due 90 days or more to total loans
|
.04
|
%
|
.01
|
%
|
.01
|
%
|
.02
|
%
|
.06
|
%
|
||||||||||
|
Nonaccrual loans as a % of total loans
|
1.22
|
%
|
1.23
|
%
|
1.61
|
%
|
.63
|
%
|
.65
|
%
|
||||||||||
|
Impaired loans as a % of total loans
|
3.09
|
%
|
2.94
|
%
|
3.39
|
%
|
2.60
|
%
|
3.12
|
%
|
||||||||||
|
Allowance for loan losses as a % of total loans
|
1.05
|
%
|
1.13
|
%
|
1.40
|
%
|
1.09
|
%
|
1.24
|
%
|
||||||||||
The impaired loan disclosures are comparable to the nonperforming loan disclosures except that the impaired loan disclosures do not include single family residential or consumer loans which are analyzed in the aggregate for loan impairment purposes.
Management formally considers placing a loan on nonaccrual status when collection of principal or interest has become doubtful. Furthermore, a loan should not be returned to the accrual status unless either all delinquent principal or interest has been brought current or the loan becomes well secured and is in the process of collection.
76
MANAGEMENT's DISCUSSION AND ANALYSIS OF
FINANCIAL CONDITION AND RESULTS OF OPERATIONS
MATURITY AND REPRICING DATA OF LOANS
As of December 31, 2016
Table VI
|
|
|
(dollars in thousands)
|
MATURING / REPRICING
|
|||||||||||||||
|
|
Within One Year
|
After One but Within Five Years
|
After Five Years
|
Total
|
||||||||||||
|
Residential real estate loans
|
$
|
83,354
|
$
|
99,544
|
$
|
103,124
|
$
|
286,022
|
||||||||
|
Commercial loans(1)
|
139,088
|
126,979
|
48,529
|
314,596
|
||||||||||||
|
Consumer loans(2)
|
42,670
|
66,866
|
24,747
|
134,283
|
||||||||||||
|
Total loans
|
$
|
265,112
|
$
|
293,389
|
$
|
176,400
|
$
|
734,901
|
||||||||
|
Loans maturing or repricing after one year with:
|
||||
|
Variable interest rates
|
$
|
238,869
|
||
|
Fixed interest rates
|
230,920
|
|||
|
Total
|
$
|
469,789
|
||
(1) Includes commercial and industrial and commercial real estate loans.
(2) Includes automobile, home equity and other consumer loans.
adequate at December 31, 2016 to absorb probable losses in the portfolio. There can be no assurance, however, that adjustments to the allowance for loan losses will not be required in the future. Changes in the circumstances of particular borrowers, as well as adverse developments in the economy, are factors that could change and make adjustments to the allowance for loan losses necessary. Asset quality will continue to remain a key focus, as management continues to stress not just loan growth, but quality in loan underwriting as well. Future provisions to the allowance for loan losses will continue to be based on management's quarterly in-depth evaluation that is discussed in further detail under the caption "Critical Accounting Policies - Allowance for Loan Losses" within this Management's Discussion and Analysis.
DEPOSITS
Deposits are used as part of the Company's liquidity management strategy to meet obligations for depositor withdrawals, to fund the borrowing needs of loan customers, and to fund ongoing operations. Deposits, both interest- and noninterest-bearing, continue to be the most significant source of funds used by the Company to support earning assets. Deposits are attractive sources of funding because of their stability and generally low cost as compared with other funding sources. The Company seeks to maintain a proper balance of core deposit relationships on hand while also utilizing various wholesale deposit sources, such as brokered and internet CD balances, as an alternative funding source to manage efficiently the net interest margin. Deposits are influenced by changes in interest rates, economic conditions and competition from other banks. The accompanying table VII shows the composition of total deposits as of December 31, 2016, 2015 and 2014. Total deposits increased $129,706, or 19.6%, from the end of 2015 to $790,452 at December 31, 2016. This deposit growth was largely impacted by the $119,669 in deposits acquired from Milton Bank. The acquired deposits consisted of $46,736 in time deposits, $45,688 in savings, NOW and money market accounts, and $27,245 in noninterest-bearing demand deposits. At December 31, 2016, the growth in deposit balances came mostly from the Company's "core" deposits, which include noninterest-bearing deposits, as well as interest-bearing demand, savings, and money market deposits. The Company believes core deposits from local consumers who can maintain multiple accounts and services at the Bank are more stable and less sensitive to changing interest rates and other economic factors. The Company also benefited from a lesser percentage of total deposits being held in brokered and retail time deposits at December 31, 2016 than at December 31, 2015.
77
MANAGEMENT's DISCUSSION AND ANALYSIS OF
FINANCIAL CONDITION AND RESULTS OF OPERATIONS
Contributing most to the 2016 growth in deposits was the Company's interest-bearing NOW accounts, which increased $30,527, or 24.5%, during the twelve months ended 2016, as compared to year-end 2015. This increase was largely driven by growth in public fund account balances. While the Company feels confident in the relationships it has with its public fund customers, these balances will continue to experience larger fluctuations than other deposit account relationships due to the nature of the account activity. Larger public fund account balance fluctuations are, at times, seasonal and can be predicted while most other large fluctuations are outside of management's control. The Company values these public fund relationships it has secured and will continue to market and service these accounts to maintain its long-term relationships.
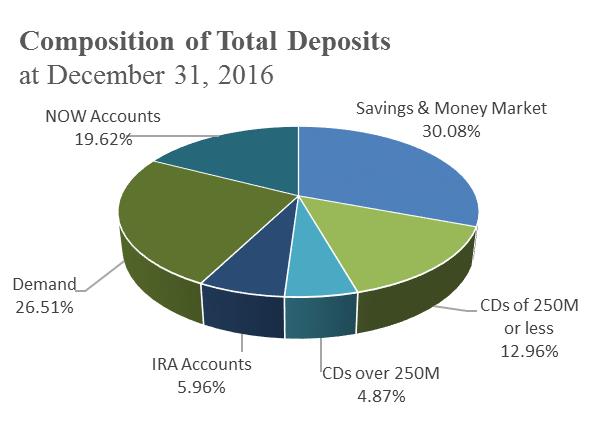 |
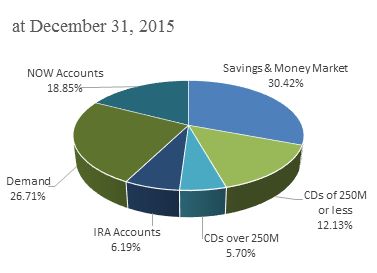 |
Further increases in the Company's deposit balances came from savings account balances, which increased $35,378, or 52.0%, from year-end 2015, coming primarily from the statement savings product.
Deposit balances were also impacted by the Company's interest-free funding source, noninterest-bearing demand deposits, which were up $33,077, or 18.7%, from year-end 2015. Demand deposit growth came primarily from the Company's business checking accounts and other noninterest-bearing products, particularly those offering incentive rewards to customers.
The Company's time deposits increased $29,317, or 18.5%, from year-end 2015. Excluding deposits from the Milton Bank acquisition, the Company's time deposits would have decreased from year-end 2015. This decreasing effect in time deposits from year-end 2015 fits within management's strategy of focusing on more "core" deposit balances and has caused time deposits to represent a smaller percentage of total deposits, finishing at 23.8% of total deposits at December 31, 2016 compared to 24.0% of total deposits at December 31, 2015. Historically, time deposits, particularly CD's, had been the most significant source of funding for the Company's earning assets. Based on the minimal spread between a short-term CD rate and a statement savings rate, many customers choose to invest balances into a more liquid product, perhaps hoping for rising rates in the near future. Furthermore, the Company's preference of core deposit funding sources has created a lesser reliance on brokered and internet CD issuances in recent years. As a result, wholesale CD balances decreased $7,503, or 23.8%, during 2016. The Company will continue to evaluate its use of brokered CD's to manage the Company's liquidity position and interest rate risk associated with longer-term, fixed-rate asset loan demand.
78
MANAGEMENT's DISCUSSION AND ANALYSIS OF
FINANCIAL CONDITION AND RESULTS OF OPERATIONS
DEPOSITS
Table VII
|
|
As of December 31
|
|||||||||||
|
(dollars in thousands)
|
2016
|
2015
|
2014
|
|||||||||
|
Interest-bearing deposits:
|
||||||||||||
|
NOW accounts
|
$
|
155,051
|
$
|
124,524
|
$
|
112,571
|
||||||
|
Money market
|
134,308
|
132,901
|
137,076
|
|||||||||
|
Savings accounts
|
103,453
|
68,075
|
61,712
|
|||||||||
|
IRA accounts
|
47,099
|
40,930
|
42,406
|
|||||||||
|
Certificates of deposit
|
140,965
|
117,817
|
131,271
|
|||||||||
|
|
580,876
|
484,247
|
485,036
|
|||||||||
|
Noninterest-bearing deposits:
|
||||||||||||
|
Demand deposits
|
209,576
|
176,499
|
161,794
|
|||||||||
|
Total deposits
|
$
|
790,452
|
$
|
660,746
|
$
|
646,830
|
||||||
The Company will continue to experience increased competition for deposits in its market areas, which should challenge its net growth. The Company will continue to emphasize growth and retention within its core deposit relationships during 2016, reflecting the Company's efforts to reduce its reliance on higher cost funding and improving net interest income.
OTHER BORROWED FUNDS
The Company also accesses other funding sources, including short-term and long-term borrowings, to fund potential asset growth and satisfy short-term liquidity needs. Other borrowed funds consist primarily of FHLB advances and promissory notes. During 2016, other borrowed funds were up $13,139, or 54.9%, from year-end 2015. The increase was related to management's decision to fund specific fixed-rate loans with like-term FHLB advances during the first and second quarters of 2016. Furthermore, the Company issued a $5,000 promissory note to a bank during the third quarter of 2016 to help finance the cash disbursements related to the Milton Bancorp acquisition. The note has a 10-year maturity that is fixed for 5 years. While deposits continue to be the primary source of funding for growth in earning assets, management will continue to utilize FHLB advances and promissory notes to help manage interest rate sensitivity and liquidity.
SUBORDINATED DEBENTURES
The Company received proceeds from the issuance of one trust preferred security on March 22, 2007 totaling $8,500 at a fixed rate of 6.58%. The trust preferred security is now at an adjustable rate equal to the 3-month LIBOR plus 1.68%. The Company does not report the securities issued by the trust as a liability, but instead, reports as a liability the subordinated debenture issued by the Company and held by the trust.
79
MANAGEMENT's DISCUSSION AND ANALYSIS OF
FINANCIAL CONDITION AND RESULTS OF OPERATIONS
OFF-BALANCE SHEET ARRANGEMENTS
As discussed in Notes I and L, the Company engages in certain off-balance sheet credit-related activities, including commitments to extend credit and standby letters of credit, which could require the Company to make cash payments in the event that specified future events occur. Commitments to extend credit are agreements to lend to a customer as long as there is no violation of any condition established in the contract. Commitments generally have fixed expiration dates or other termination clauses and may require payment of a fee. Standby letters of credit are conditional commitments to guarantee the performance of a customer to a third party. While these commitments are necessary to meet the financing needs of the Company's customers, many of these commitments are expected to expire without being drawn upon. Therefore, the total amount of commitments does not necessarily represent future cash requirements.Management does not anticipate that the Company's current off-balance sheet activities will have a material impact on the results of operations and financial condition.
CAPITAL RESOURCES
The Company maintains a capital level that exceeds regulatory requirements as a margin of safety for its depositors. As detailed in Note P to the financial statements at December 31, 2016, the Bank's capital exceeded the requirements to be deemed "well capitalized" under applicable prompt corrective action regulations. Total shareholders' equity at December 31, 2016 of $104,528 was up $14,058, or 15.5%, as compared to the balance of $90,470 at December 31, 2015. Shareholders' equity at December 31, 2016 included $11,444 from the 523,518 shares of common stock that were issued in conjunction with the acquisition of Milton Bancorp. Further contributing to capital growth was year-to-date net income of $6,920, partially offset by cash dividends paid of $3,585, or $.82 per share.
INTEREST RATE SENSITIVITY AND LIQUIDITY
The Company's goal for interest rate sensitivity management is to maintain a balance between steady net interest income growth and the risks associated with interest rate fluctuations. Interest rate risk ("IRR") is the exposure of the Company's financial condition to adverse movements in interest rates. Accepting this risk can be an important source of profitability, but excessive levels of IRR can threaten the Company's earnings and capital.
The Company evaluates IRR through the use of an earnings simulation model to analyze net interest income sensitivity to changing interest rates. The modeling process starts with a base case simulation, which assumes a static balance sheet and flat interest rates. The base case scenario is compared to rising and falling interest rate scenarios assuming a parallel shift in all interest rates. Comparisons of net interest income and net income fluctuations from the flat rate scenario illustrate the risks associated with the current balance sheet structure.
The Company's Asset/Liability Committee monitors and manages IRR within Board approved policy limits. The current IRR policy limits anticipated changes in net interest income to an instantaneous increase or decrease in market interest rates over a 12 month horizon to +/- 5% for a 100 basis point rate shock, +/- 7.5% for a 200 basis point rate shock and +/- 10% for a 300 basis point rate shock. Based on the level of interest rates, management did not test interest rates down 200 or 300 basis points.
80
MANAGEMENT's DISCUSSION AND ANALYSIS OF
FINANCIAL CONDITION AND RESULTS OF OPERATIONS
The following table presents the Company's estimated net interest income sensitivity:
|
INTEREST RATE SENSITIVITY
|
|
|
||
|
Table VIII
|
|
|
||
|
|
|
|
||
|
Change in
Interest Rates
Basis Points
|
December 31, 2016
% Change in
Net Interest Income
|
December 31, 2015
% Change in
Net Interest Income
|
||
|
|
|
|
||
|
+300
|
(.39%)
|
(.03%)
|
||
|
+200
|
(.05%)
|
.18%
|
||
|
+100
|
.09%
|
.19%
|
||
|
-100
|
(1.72%)
|
(2.48%)
|
The estimated percentage change in net interest income due to a change in interest rates was within the policy guidelines established by the Board. With the historical low interest rate environment, management generally has been focused on limiting the duration of assets, while trying to extend the duration of our funding sources to the extent customer preferences will permit the Company to do so. At December 31, 2016, the interest rate risk profile reflects limited exposure to an increase in interest rates, which is consistent with the interest rate risk profile at December 31, 2015. In a declining rate environment, net interest income is impacted by the interest rate on many deposit accounts not being able to adjust downward. With interest rates so low, deposit accounts are perceived to be at or near an interest rate floor. As a result, net interest income decreases in a declining interest rate environment. Overall, management is comfortable with the current interest rate risk profile, which reflects minimal exposure to interest rate changes.
Liquidity relates to the Company's ability to meet the cash demands and credit needs of its customers and is provided by the ability to readily convert assets to cash and raise funds in the market place. Total cash and cash equivalents, held to maturity securities maturing within one year and available for sale securities, totaling $136,928, represented 14.3% of total assets at December 31, 2016. In addition, the FHLB offers advances to the Bank, which further enhances the Bank's ability to meet liquidity demands. At December 31, 2016, the Bank could borrow an additional $147,627 from the FHLB, of which $75,000 could be used for short-term, cash management advances. Furthermore, the Bank has established a borrowing line with the Federal Reserve. At December 31, 2016, this line had total availability of $45,105. Lastly, the Bank also has the ability to purchase federal funds from a correspondent bank. For further cash flow information, see the condensed consolidated statement of cash flows. Management does not rely on any single source of liquidity and monitors the level of liquidity based on many factors affecting the Company's financial condition.
INFLATION
Consolidated financial data included herein has been prepared in accordance with US GAAP. Presently, US GAAP requires the Company to measure financial position and operating results in terms of historical dollars with the exception of securities available for sale, which are carried at fair value. Changes in the relative value of money due to inflation or deflation are generally not considered.
In management's opinion, changes in interest rates affect the financial institution to a far greater degree than changes in the inflation rate. While interest rates are greatly influenced by changes in the inflation rate, they do not change at the same rate or in the same magnitude as the inflation rate. Rather, interest rate volatility is based on changes in the expected rate of inflation, as well as monetary and fiscal policies. A financial institution's ability to be relatively unaffected by changes in interest rates is a good indicator of its capability to perform in today's volatile economic environment. The Company seeks to insulate itself from interest rate volatility by ensuring that rate sensitive assets and rate sensitive liabilities respond to changes in interest rates in a similar time frame and to a similar degree.
81
MANAGEMENT's DISCUSSION AND ANALYSIS OF
FINANCIAL CONDITION AND RESULTS OF OPERATIONS
CRITICAL ACCOUNTING POLICIES
The most significant accounting policies followed by the Company are presented in Note A to the consolidated financial statements. These policies, along with the disclosures presented in the other financial statement notes, provide information on how significant assets and liabilities are valued in the financial statements and how those values are determined. Management views critical accounting policies to be those that are highly dependent on subjective or complex judgments, estimates and assumptions, and where changes in those estimates and assumptions could have a significant impact on the financial statements. Management currently views the adequacy of the allowance for loan losses and business combinations to be critical accounting policies.
Allowance for Loan Losses:
The allowance for loan losses is a valuation allowance for probable incurred credit losses. Loan losses are charged against the allowance when management believes the uncollectibility of a loan balance is confirmed. Subsequent recoveries, if any, are credited to the allowance. Management estimates the allowance balance required using past loan loss experience, the nature and volume of the portfolio, information about specific borrower situations and estimated collateral values, economic conditions, and other factors. Allocations of the allowance may be made for specific loans, but the entire allowance is available for any loan that, in management's judgment, should be charged off.
The allowance consists of specific and general components. The specific component relates to loans that are individually classified as impaired. A loan is impaired when, based on current information and events, it is probable that the Company will be unable to collect all amounts due according to the contractual terms of the loan agreement. Impaired loans generally consist of loans with balances of $200 or more on nonaccrual status or nonperforming in nature. Loans for which the terms have been modified, and for which the borrower is experiencing financial difficulties, are considered troubled debt restructurings and classified as impaired.
Factors considered by management in determining impairment include payment status, collateral value, and the probability of collecting scheduled principal and interest payments when due. Loans that experience insignificant payment delays and payment shortfalls generally are not classified as impaired. Management determines the significance of payment delays and payment shortfalls on a case-by-case basis, taking into consideration all of the circumstances surrounding the loan and the borrower, including the length and reasons for the delay, the borrower's prior payment record, and the amount of shortfall in relation to the principal and interest owed.
Commercial and commercial real estate loans are individually evaluated for impairment. If a loan is impaired, a portion of the allowance is allocated so that the loan is reported, net, at the present value of estimated future cash flows using the loan's existing rate or at the fair value of collateral if repayment is expected solely from the collateral. Smaller balance homogeneous loans, such as consumer and most residential real estate, are collectively evaluated for impairment, and accordingly, they are not separately identified for impairment disclosure. Troubled debt restructurings are measured at the present value of estimated future cash flows using the loan's effective rate at inception. If a troubled debt restructuring is considered to be a collateral dependent loan, the loan is reported, net, at the fair value of the collateral. For troubled debt restructurings that subsequently default, the Company determines the amount of reserve in accordance with the accounting policy for the allowance for loan losses.
82
MANAGEMENT's DISCUSSION AND ANALYSIS OF
FINANCIAL CONDITION AND RESULTS OF OPERATIONS
The general component covers non‑impaired loans and impaired loans that are not individually reviewed for impairment and is based on historical loss experience adjusted for current factors. The historical loss experience is determined by portfolio segment and is based on the actual loss history experienced by the Company over the most recent 3 years for the consumer and real estate portfolio segment and 5 years for the commercial portfolio segment. Prior to 2014, the commercial portfolio's historical loss factor was based on a period of 3 years. During the first quarter of 2014, management extended the loan loss history to 5 years due to the significant decline in net charge-offs that have been experienced since the first quarter of 2012. By extending the historical loan loss period to 5 years, management feels the historical factor is more representative of the expected losses to be incurred on commercial loans. The total loan portfolio's actual loss experience is supplemented with other economic factors based on the risks present for each portfolio segment. These economic factors include consideration of the following: levels of and trends in delinquencies and impaired loans; levels of and trends in charge-offs and recoveries; trends in volume and terms of loans; effects of any changes in risk selection and underwriting standards; other changes in lending policies, procedures, and practices; experience, ability, and depth of lending management and other relevant staff; national and local economic trends and conditions; industry conditions; and effects of changes in credit concentrations. The following portfolio segments have been identified: Commercial Real Estate, Commercial and Industrial, Residential Real Estate, and Consumer.
Commercial and industrial loans consist of borrowings for commercial purposes by individuals, corporations, partnerships, sole proprietorships, and other business enterprises. Commercial and industrial loans are generally secured by business assets, such as equipment, accounts receivable, inventory, or any other asset excluding real estate, and are generally made to finance capital expenditures or operations. The Company's risk exposure is related to deterioration in the value of collateral securing the loan should foreclosure become necessary. Generally, business assets used or produced in operations do not maintain their value upon foreclosure, which may require the Company to write down the value significantly to sell.
Commercial real estate consists of nonfarm, nonresidential loans secured by owner-occupied and nonowner-occupied commercial real estate as well as commercial construction loans. An owner-occupied loan relates to a borrower purchased building or space for which the repayment of principal is dependent upon cash flows from the ongoing business operations conducted by the party, or an affiliate of the party, who owns the property. Owner-occupied loans that are dependent on cash flows from operations can be adversely affected by current market conditions for their product or service. A nonowner-occupied loan is a property loan for which the repayment of principal is dependent upon rental income associated with the property or the subsequent sale of the property. Nonowner-occupied loans that are dependent upon rental income are primarily impacted by local economic conditions which dictate occupancy rates and the amount of rent charged. Commercial construction loans consist of borrowings to purchase and develop raw land into one-to-four family residential properties. Construction loans are extended to individuals as well as corporations for the construction of an individual or multiple properties and are secured by raw land and the subsequent improvements. Repayment of the loans to real estate developers is dependent upon the sale of properties to third parties in a timely fashion upon completion. Should there be delays in construction or a downturn in the market for those properties, there may be significant erosion in value which may be absorbed by the Company
CONTRACTUAL OBLIGATIONS
Table IX
The following table presents, as of December 31, 2016, significant fixed and determinable contractual obligations to third parties by payment date. Further discussion of the nature of each obligation is included in the referenced note to the consolidated financial statements.
|
|
Payments Due In
|
|||||||||||||||||||||||
|
(dollars in thousands)
|
Note Reference
|
One Year or Less
|
One to Three Years
|
Three to Five Years
|
Over Five Years
|
Total
|
||||||||||||||||||
|
Deposits without a stated maturity
|
G |
|
$
|
602,388
|
$
|
----
|
$
|
----
|
$
|
----
|
$
|
602,388
|
||||||||||||
|
Consumer and brokered time deposits
|
G
|
|
100,447
|
71,170
|
15,971
|
476
|
188,064
|
|||||||||||||||||
|
Other borrowed funds
|
I |
|
7,625
|
7,881
|
4,975
|
16,604
|
37,085
|
|||||||||||||||||
|
Subordinated debentures
|
J |
|
----
|
----
|
----
|
8,500
|
8,500
|
|||||||||||||||||
|
Lease obligations
|
E |
|
332
|
235
|
74
|
----
|
641
|
|||||||||||||||||
83
.
MANAGEMENT's DISCUSSION AND ANALYSIS OF
FINANCIAL CONDITION AND RESULTS OF OPERATIONS
Residential real estate loans consist of loans to individuals for the purchase of one- to four-family primary residences with repayment primarily through wage or other income sources of the individual borrower. The Company's loss exposure to these loans is dependent on local market conditions for residential properties as loan amounts are determined, in part, by the fair value of the property at origination.
Consumer loans are comprised of loans to individuals secured by automobiles, open-end home equity loans and other loans to individuals for household, family, and other personal expenditures, both secured and unsecured. These loans typically have maturities of 6 years or less with repayment dependent on individual wages and income. The risk of loss on consumer loans is elevated as the collateral securing these loans, if any, rapidly depreciate in value or may be worthless and/or difficult to locate if repossession is necessary. During the last several years, one of the most significant portions of the Company's net loan charge-offs have been from consumer loans. Nevertheless, the Company has allocated the highest percentage of its allowance for loan losses as a percentage of loans to the other identified loan portfolio segments due to the larger dollar balances associated with such portfolios.
Business Combinations:
Business combinations are accounted for using the acquisition method. The cost of an acquisition is measured as the aggregate of the consideration transferred and the amount of any noncontrolling interest in the acquiree. Acquisition related transaction costs are expensed and included in other operational results. When a business is acquired, the Company assesses the financial assets and liabilities assumed for appropriate classification and designation in accordance with the contractual terms, economic circumstances and pertinent conditions as of the acquisition date. We are required to record the assets acquired, including identified intangible assets, and the liabilities assumed at their fair value. These often involve estimates based on third party valuations, such as appraisals, or internal valuations based on discounted cash flow analyses or other valuation techniques that may include estimates of attrition, inflation, asset growth rates, or other relevant factors. In addition, the determination of the useful lives over which an intangible asset will be amortized is subjective. Under FASB ASC 350 (SFAS No. 142 Goodwill and Other Intangible Assets), goodwill and indefinite-lived assets recorded must be reviewed for impairment on an annual basis, as well as on an interim basis if events or changes indicate that the asset might be impaired. An impairment loss must be recognized for any excess of carrying value over fair value of the goodwill or the indefinite-lived intangible asset.
KEY RATIOS
Table X
|
|
2016
|
2015
|
2014
|
2013
|
2012
|
|||||||||||||||
|
|
||||||||||||||||||||
|
Return on average assets
|
.77
|
%
|
1.03
|
%
|
1.01
|
%
|
1.04
|
%
|
.86
|
%
|
||||||||||
|
Return on average equity
|
7.05
|
%
|
9.66
|
%
|
9.62
|
%
|
10.40
|
%
|
9.53
|
%
|
||||||||||
|
Dividend payout ratio
|
51.79
|
%
|
42.74
|
%
|
42.62
|
%
|
36.56
|
%
|
62.29
|
%
|
||||||||||
|
Average equity to average assets
|
10.91
|
%
|
10.71
|
%
|
10.49
|
%
|
10.01
|
%
|
9.00
|
%
|
||||||||||
84
MANAGEMENT's DISCUSSION AND ANALYSIS OF
FINANCIAL CONDITION AND RESULTS OF OPERATIONS
CONCENTRATIONS OF CREDIT RISK
The Company maintains a diversified credit portfolio, with residential real estate loans currently comprising the most significant portion. Credit risk is primarily subject to loans made to businesses and individuals in southeastern Ohio and western West Virginia. Management believes this risk to be general in nature, as there are no material concentrations of loans to any industry or consumer group. To the extent possible, the Company diversifies its loan portfolio to limit credit risk by avoiding industry concentrations.
85
|
Ohio Valley Banc Corp.
|
|
Email: investorrelations@ovbc.com
|
|
Web: www.ovbc.com
|
|
Phone: 1-800-468-6682
|
|
Headquarters: 420 Third Avenue, Gallipolis, Ohio
|
|
Traded on The NASDAQ Global Market
|
|
Symbol OVBC
|