Attached files
| file | filename |
|---|---|
| EX-32.2 - EXHIBIT 32.2 - FS Bancorp, Inc. | fsbw-20161231x10kxexh322.htm |
| EX-32.1 - EXHIBIT 32.1 - FS Bancorp, Inc. | fsbw-20161231x10kxexh321.htm |
| EX-31.2 - EXHIBIT 31.2 - FS Bancorp, Inc. | fsbw-20161231x10kxexh312.htm |
| EX-31.1 - EXHIBIT 31.1 - FS Bancorp, Inc. | fsbw-20161231x10kxexh311.htm |
| EX-23 - EXHIBIT 23 - FS Bancorp, Inc. | fsbw-20161231x10kxexh23.htm |
| EX-21 - EXHIBIT 21 - FS Bancorp, Inc. | fsbw-20161231x10kxexh21.htm |
UNITED STATES
SECURITIES AND EXCHANGE COMMISSION
Washington, D.C. 20549
FORM 10-K
(Mark one)
[X] | ANNUAL REPORT PURSUANT TO SECTION 13 OR 15(d) OF THE SECURITIES EXCHANGE ACT OF 1934 |
For the fiscal year ended December 31, 2016 OR
[ ] | TRANSITION REPORT PURSUANT TO SECTION 13 OR 15(d) OF THE SECURITIES EXCHANGE ACT OF 1934 |
Commission File Number: 001-35589
FS BANCORP, INC.
(Exact name of registrant as specified in its charter)
Washington | 45-4585178 | |
(State or other jurisdiction of incorporation or organization) | (I.R.S. Employer Identification Number) | |
6920 220th Street SW, Mountlake Terrace, Washington | 98043 | |
(Address of principal executive offices) | (Zip Code) | |
Registrant’s telephone number, including area code: | (425) 771-5299 | |
Securities registered pursuant to Section 12(b) of the Act: | None | |
Securities registered pursuant to Section 12(g) of the Act: | Common Stock, par value $0.01 per share | |
(Title of Each Class) | ||
Indicate by check mark if the Registrant is a well-known seasoned issuer, as defined in Rule 405 of the Securities Act. YES [ ] NO [X]
Indicate by check mark if the Registrant is not required to file reports pursuant to Section 13 or Section 15(d) of the Act. YES [ ] NO [X]
Indicate by check mark whether the Registrant (1) has filed all reports required to be filed by Section 13 or 15(d) of the Securities Exchange Act of 1934 during the preceding 12 months (or for such shorter period that the Registrant was required to file such reports), and (2) has been subject to such filing requirements for the past 90 days. YES [X] NO [ ]
Indicate by check mark whether the registrant has submitted electronically and posted on its corporate Web site, if any, every Interactive Data File required to be submitted and posted pursuant to Rule 405 of Regulation S-T (§232.405 of this chapter) during the preceding 12 months (or for such shorter period that the registrant was required to submit and post such files). YES [X] NO [ ]
Indicate by check mark whether disclosure of delinquent filers pursuant to Item 405 of Regulation S-K is not contained herein, and will not be contained, to the best of the Registrant’s knowledge, in definitive proxy or other information statements incorporated by reference in Part III of this Form 10-K or any amendments to this Form 10-K. [X]
Indicate by check mark whether the Registrant is a large accelerated filer, an accelerated filer, a non-accelerated filer, or a smaller reporting company. See definition of “large accelerated filer,” “accelerated filer” and “smaller reporting company” in Rule 12b-2 of the Exchange Act.
Large accelerated filer [ ] | Accelerated filer [ ] |
Non-accelerated filer [ ] (Do not check if a smaller reporting company) | Smaller reporting company [X] |
Indicate by check mark whether the Registrant is a shell company (as defined in Exchange Act Rule 12b-2). YES [ ] NO [X]
As of March 10, 2017, there were 3,065,266 shares of the Registrant’s common stock outstanding. The Registrant’s common stock is listed on the NASDAQ Capital Market under the symbol “FSBW.” The aggregate market value of the common stock held by non-affiliates of the Registrant was $70,082,357, based on the closing sales price of $25.35 per share of the Registrant’s common stock as quoted on the NASDAQ Capital Market on June 30, 2016. For purposes of this calculation, common stock held only by executive officers and directors of the Registrant is considered to be held by affiliates.
DOCUMENTS INCORPORATED BY REFERENCE
1. Portions of the definitive Proxy Statement for the 2017 Annual Meeting of Shareholders (“Proxy Statement”) are incorporated by reference into Part III.
FS Bancorp, Inc.
Table of Contents
Page | |
Comparison of Financial Condition at December 31, 2016 and December 31, 2015 | |
Comparison of Results of Operations for the Years Ended December 31, 2016 and December 31, 2015 | |
Item 16. Form 10-K Summary | |
As used in this report, the terms “we,” “our,” “us,” “Company”, and “FS Bancorp” refer to FS Bancorp, Inc. and its consolidated subsidiary, 1st Security Bank of Washington, unless the context indicates otherwise. When we refer to “1st Security Bank of Washington” or the “Bank” in this report, we are referring to 1st Security Bank of Washington, the wholly owned subsidiary of FS Bancorp.
i
Forward-Looking Statements
This Form 10-K contains forward-looking statements, which can be identified by the use of words such as “believes,” “expects,” “anticipates,” “estimates” or similar expressions. Forward-looking statements include, but are not limited to:
• | statements of our goals, intentions and expectations; |
• | statements regarding our business plans, prospects, growth and operating strategies; |
• | statements regarding the quality of our loan and investment portfolios; and |
• | estimates of our risks and future costs and benefits. |
These forward-looking statements are subject to significant risks and uncertainties. Actual results may differ materially from those contemplated by the forward-looking statements due to, among others, the following factors:
• | general economic conditions, either nationally or in our market area, that are worse than expected; |
• | the credit risks of lending activities, including changes in the level and trend of loan delinquencies and write offs and changes in our allowance for loan losses and provision for loan losses that may be impacted by deterioration in the housing and commercial real estate markets; |
• | secondary market conditions and our ability to sell loans in the secondary market; |
• | fluctuations in the demand for loans, the number of unsold homes, land and other properties and fluctuations in real estate values in our market area; |
• | increases in premiums for deposit insurance; |
• | the use of estimates in determining fair value of certain of our assets, which estimates may prove to be incorrect and result in significant declines in valuation; |
• | changes in the interest rate environment that reduce our interest margins or reduce the fair value of financial instruments; |
• | increased competitive pressures among financial services companies; |
• | our ability to execute our plans to grow our residential construction lending, our mortgage banking operations and our warehouse lending and the geographic expansion of our indirect home improvement lending; |
• | our ability to attract and retain deposits; |
• | our ability to successfully integrate any assets, liabilities, customers, systems, and management personnel we may acquire into our operations and our ability to realize related revenue synergies and expected cost savings and other benefits within the anticipated time frames or at all including in particular, the branches we purchased from Bank of America; |
• | our ability to control operating costs and expenses; |
• | changes in consumer spending, borrowing and savings habits; |
• | our ability to successfully manage our growth; |
• | legislative or regulatory changes that adversely affect our business, including the effect of the Dodd-Frank Wall Street Reform and Consumer Protection Act, changes in regulation policies and principles, an increase in regulatory capital requirements or change in the interpretation of regulatory capital or other rules, including as a result of Basel III; |
• | adverse changes in the securities markets; |
• | changes in accounting policies and practices, as may be adopted by the bank regulatory agencies, the Public Company Accounting Oversight Board or the Financial Accounting Standards Board; |
• | costs and effects of litigation, including settlements and judgments; |
• | our ability to implement our branch expansion strategy; |
• | inability of key third-party vendors to perform their obligations to us; and |
• | other economic, competitive, governmental, regulatory and technical factors affecting our operations, pricing, products, and services and other risks described elsewhere in this Form 10-K and our other reports filed with the U.S. Securities and Exchange Commission. |
ii
Any of the forward-looking statements made in this Form 10-K and in other public statements may turn out to be wrong because of inaccurate assumptions we might make, because of the factors illustrated above or because of other factors that we cannot foresee. Forward-looking statements are based upon management’s beliefs and assumptions at the time they are made. The Company undertakes no obligation to update or revise any forward-looking statement included in this report or to update the reasons why actual results could differ from those contained in such statements, whether as a result of new information, future events or otherwise. In light of these risks, uncertainties and assumptions, the forward-looking statements discussed in this report might not occur and you should not put undue reliance on any forward-looking statements.
Available Information
The Company provides a link on its investor information page at www.fsbwa.com to filings with the U.S. Securities and Exchange Commission (“SEC”) for purposes of providing copies of its annual report to shareholders, annual report on Form 10-K, quarterly reports on Form 10-Q, current reports on Form 8-K and press releases. Other than an investor’s own internet access charges, these filings are available free of charge and also can be obtained by calling the SEC at 1-800-SEC-0330. The information contained on the Company’s website is not included as part of, or incorporated by reference into, this Annual Report on Form 10-K.
iii
PART 1
Item 1. Business
General
FS Bancorp, Inc. ( “FS Bancorp” or the “Company”), a Washington corporation, was organized in September 2011 for the purpose of becoming the holding company of 1st Security Bank of Washington (“1st Security Bank of Washington” or the “Bank”) upon the Bank’s conversion from a mutual to a stock savings bank (“Conversion”). The Conversion was completed on July 9, 2012. At December 31, 2016, the Company had consolidated total assets of $827.9 million, total deposits of $712.6 million, and stockholders’ equity of $81.0 million. The Company has not engaged in any significant activity other than holding the stock of the Bank. Accordingly, the information set forth in this Annual Report on Form 10-K (“Form 10-K”), including the consolidated financial statements and related data, relates primarily to the Bank.
1st Security Bank of Washington is a relationship-driven community bank. The Bank delivers banking and financial services to local families, local and regional businesses and industry niches within distinct Puget Sound area communities. The Bank emphasizes long-term relationships with families and businesses within the communities served, working with them to meet their financial needs. The Bank is also actively involved in community activities and events within these market areas, which further strengthens relationships within these markets. The Bank has been serving the Puget Sound area since 1936. Originally chartered as a credit union, and known as Washington’s Credit Union, the Bank served various select employment groups. On April 1, 2004, the Bank converted from a credit union to a Washington state-chartered mutual savings bank. Upon completion of the Conversion in July 2012, 1st Security Bank of Washington became a Washington state-chartered stock savings bank and the wholly owned subsidiary of the Company.
At December 31, 2016, the Bank maintained its main administrative office, eleven bank branch locations and seven loan production offices in suburban communities in the greater Puget Sound area. The Bank also has one loan production office in the Tri-Cities, Washington opened in the fourth quarter of 2014. The Bank purchased four retail bank branches from Bank of America (two in Clallam and two in Jefferson counties) on January 22, 2016 (the “Branch Purchase”). These branches opened as 1st Security Bank branches on January 25, 2016. See Item 8, “Financial Statements and Supplementary Data - Notes to Consolidated Financial Statements - Note 2 Business Combinations” of this Form 10-K. In November 2016, the Bank installed a free standing ATM in Kingston, Washington.
The Company is a diversified lender with a focus on the origination of indirect home improvement loans, also referred to as fixture secured loans, home loans, commercial real estate mortgage loans, commercial business loans and second mortgage/home equity loan products. Consumer loans, in particular indirect home improvement loans, represent the largest portion of the loan portfolio and have traditionally been the mainstay of the Company’s lending strategy. Going forward, the Company plans to place more emphasis on certain lending products, such as commercial real estate loans including speculative residential construction loans, one-to-four-family loans, and commercial business loans, while growing the current size of the consumer loan portfolio. The Company reintroduced in-house originations of residential mortgage loans in 2012, primarily for sale into the secondary market, through a mortgage banking program. The Company's lending strategies are intended to take advantage of: (1) the Company’s historical strength in indirect consumer lending, (2) recent market consolidation that has created new lending opportunities, and (3) relationship lending. Retail deposits will continue to serve as an important funding source. For more information regarding the business and operations of 1st Security Bank of Washington, see Item 7, “Management’s Discussion and Analysis of Financial Condition and Results of Operations” of this Form 10-K.
1st Security Bank of Washington is examined and regulated by the Washington State Department of Financial Institutions (“DFI”), its primary regulator, and by the Federal Deposit Insurance Corporation (“FDIC”). 1st Security Bank of Washington is required to have certain reserves set by the Board of Governors of the Federal Reserve System (“Federal Reserve”) and is a member of the Federal Home Loan Bank of Des Moines (“FHLB” or “FHLB of Des Moines”), which is one of the 11 regional banks in the Federal Home Loan Bank System.
The principal executive offices of the Company are located at 6920 220th Street SW, Mountlake Terrace, Washington 98043 and its telephone number is (425) 771-5299.
1
Market Area
The Company conducts operations out of its main administrative office, seven loan production offices, and eleven full-service bank branch offices in the Puget Sound region of Washington, as well as one loan production office in eastern Washington. The administrative office is located in Mountlake Terrace, in Snohomish County, Washington. The four stand-alone home lending offices in the Puget Sound region are located in Puyallup, in Pierce County, Bellevue, in King County, Port Orchard, in Kitsap County, Everett, in Snohomish County, and the one stand-alone home lending office is located in Tri-Cities (Kennewick), in Benton County, Washington. Regarding the eleven full-service bank branches, three branch offices are located in Snohomish County, two branch offices are located in King County, two branch offices are located in Clallam County, two branch offices in Jefferson County, one branch office is located in Pierce County, and one in Kitsap County. On January 22, 2016, the Bank completed the Branch Purchase and acquired four branches located in the communities of Port Angeles, Sequim, Port Townsend, and Hadlock, Washington. The Branch Purchase expanded our Puget Sound-focused retail footprint onto the Olympic Peninsula and provided an opportunity to extend our unique brand of community banking into those communities.
The primary market area for business operations is the Seattle-Tacoma-Bellevue, Washington Metropolitan Statistical Area (the “Seattle MSA”). Kitsap County, though not in the Seattle MSA, is also part of the Company’s market area. This overall region is typically known as the Puget Sound region. The population of the Puget Sound region was an estimated 4.2 million in 2016, over half of the state’s population, representing a large population base for potential business. The region has a well-developed urban area in the western portion along Puget Sound, with the north, central and eastern portions containing a mixture of developed residential and commercial neighborhoods and undeveloped, rural neighborhoods.
The Puget Sound region is the largest business center in both the State of Washington and the Pacific Northwest. Currently, key elements of the economy are aerospace, military bases, clean technology, biotechnology, education, information technology, logistics, international trade and tourism. The region is well known for the long presence of The Boeing Corporation and Microsoft, two major industry leaders, and for its leadership in technology. Amazon.com has expanded significantly in the Seattle downtown area. The workforce in general is well-educated and strong in technology. Washington State’s location with regard to the Pacific Rim, along with a deepwater port has made international trade a significant part of the regional economy. Tourism has also developed into a major industry for the area, due to the scenic beauty, temperate climate and easy accessibility.
King County, the location of the city of Seattle, has the largest employment base and overall level of economic activity. Six of the largest employers in the state are headquartered in King County including Microsoft Corporation, University of Washington, Amazon.com, Starbucks, Costco, and Swedish Health Services. Pierce County’s economy is also well diversified with the presence of military related government employment (Joint Base Lewis-McChord), along with health care (the Multicare Health System and the Franciscan Health System). In addition, there is a large employment base in the economic sectors of shipping (the Port of Tacoma) and aerospace employment (Boeing). Snohomish County to the north has an economy based on aerospace employment (Boeing), military (the Everett Naval Station) along with additional employment concentrations in biotechnology, electronics/computers, and wood products.
The United States Navy is a key element for Kitsap County’s economy. The United States Navy is the largest employer in the county, with installations at Puget Sound Naval Shipyard, Naval Undersea Warfare Center Keyport and Naval Base Kitsap (which comprises former Naval Submarine Base Bangor, and Naval Station Bremerton). The largest private employers in the county are the Harrison Medical Center and Port Madison Enterprises.
In 2010, approximately 86.6% of King County households had income levels in excess of $50,000 annually, compared to 82.5% for the State of Washington and 79.2% for the United States. In 2008, the U.S. Census Bureau determined that Seattle had the highest percentage of college and university graduates of any U.S. city. Seattle has been listed in the top three most literate cities in the country every year since 2005 by an annual review conducted by Central Connecticut State University. Seattle’s high income and education levels, especially compared to other major cities, result in King County ranking in the top 100 wealthiest counties in the United States based on 2011 non-census U.S. Census Bureau gathered data.
Unemployment in Washington was an estimated 5.2% as of December 31, 2016, down from a high of 10.2% in March 2010, closely paralleling national trends as disclosed in the U.S. Bureau of Labor Statistics. King County had the lowest unemployment rate in the state at 3.4%, much lower than the state average of 5.2% and national average of
2
4.9%, respectively, and improved from 4.5% at year end 2015. At December 31, 2016, the estimated unemployment rate in Pierce County was 6.0%, down from 6.1% as of December 31, 2015. The estimated unemployment rate in Snohomish County at year end 2016 was 3.9%, down from 5.0% at year end 2015. Kitsap County’s unemployment rate remained the same with an estimated 5.5% at both December 31, 2016 and 2015. Of the four counties, King and Snohomish counties reflected the largest improvement year over year with unemployment dropping 1.1% in both counties. Outside of the Puget Sound area, the Tri-Cities market includes two counties, Benton and Franklin, and the recently acquired four retail branches are in Clallam and Jefferson counties. The estimated unemployment rate in Benton County at year end 2016 was 7.0%, down slightly from 7.1% at year end 2015. At December 31, 2016, the estimated unemployment rate in Franklin County rose slightly to 9.5%, from 9.4% at December 31, 2015. For Clallam and Jefferson counties, the estimated unemployment rates at December 31, 2016 was 8.1% and 7.4%, respectively, compared to 8.3% and 7.3%, respectively at December 31, 2015.
According to the Washington Center for Real Estate Research, home values in the State of Washington continued to improve in 2016. For the quarter ended December 31, 2016, the average home value was $590,000 in King County, $393,000 in Snohomish County, $288,000 in Kitsap County, $286,000 in Pierce County, $221,000 for both Benton and Franklin counties, $243,000 for Clallam County, and $353,000 for Jefferson County. Compared to the statewide average increase in home values of 10.3% in the fourth quarter of 2016, Jefferson, King, Clallum, and Pierce counties outperformed the state average, with 22.2%, 19.3%, 12.8%, and 12.2% increases, respectively. Although below the state average, Snohomish County experienced a 9.1% increase in home values during 2016, Kitsap County was up 7.4%, and both Benton and Franklin counties increased 6.1% year over year.
For a discussion regarding the competition in the Company’s primary market area, see “Competition.”
Lending Activities
General. Historically, the Company’s primary emphasis was the origination of consumer loans (primarily indirect home improvement and automobile-secured loans), one-to-four-family residential first mortgages, and second mortgage/home equity loan products. As a result of the Company’s initial public offering in 2012, while maintaining the active indirect consumer lending program, the Company shifted its lending focus to include non-mortgage commercial business loans, as well as commercial real estate which includes construction and development loans. The Company reintroduced in-house originations of residential mortgage loans in 2012, primarily for sale in the secondary market. While maintaining the Company’s historical strength in consumer lending, the Company has added management and personnel in the commercial and home lending areas to take advantage of the relatively favorable long-term business and economic environments prevailing in the markets.
3
Loan Portfolio Analysis. The following table sets forth the composition of the loan portfolio by type of loan at the dates indicated.
December 31, | ||||||||||||||||||||||||||||||||||
(Dollars in thousands) | 2016 | 2015 | 2014 | 2013 | 2012 | |||||||||||||||||||||||||||||
Real estate loans | Amount | Percent | Amount | Percent | Amount | Percent | Amount | Percent | Amount | Percent | ||||||||||||||||||||||||
Commercial | $ | 55,871 | 9.23 | % | $ | 50,034 | 9.78 | % | $ | 42,970 | 10.90 | % | $ | 32,970 | 11.48 | % | $ | 33,250 | 11.88 | % | ||||||||||||||
Construction and development | 94,462 | 15.60 | 80,806 | 15.80 | 57,813 | 14.67 | 41,633 | 14.49 | 31,893 | 11.39 | ||||||||||||||||||||||||
Home equity | 20,081 | 3.32 | 16,540 | 3.24 | 15,737 | 3.99 | 15,172 | 5.28 | 15,474 | 5.53 | ||||||||||||||||||||||||
One-to-four-family(1) | 124,009 | 20.48 | 102,921 | 20.13 | 46,801 | 11.87 | 20,809 | 7.25 | 13,976 | 4.99 | ||||||||||||||||||||||||
Multi-family | 37,527 | 6.20 | 22,223 | 4.35 | 16,201 | 4.11 | 4,682 | 1.63 | 3,202 | 1.14 | ||||||||||||||||||||||||
Total real estate loans | 331,950 | 54.83 | 272,524 | 53.30 | 179,522 | 45.54 | 115,266 | 40.13 | 97,795 | 34.93 | ||||||||||||||||||||||||
Consumer loans | ||||||||||||||||||||||||||||||||||
Indirect home improvement | 107,759 | 17.80 | 103,064 | 20.16 | 99,304 | 25.19 | 91,167 | 31.74 | 83,786 | 29.93 | ||||||||||||||||||||||||
Solar | 36,503 | 6.03 | 29,226 | 5.72 | 18,162 | 4.61 | 16,838 | 5.86 | 2,463 | 0.89 | ||||||||||||||||||||||||
Marine | 28,549 | 4.71 | 23,851 | 4.66 | 16,713 | 4.24 | 11,203 | 3.90 | 17,226 | 6.15 | ||||||||||||||||||||||||
Other consumer | 1,915 | 0.32 | 2,181 | 0.43 | 2,628 | 0.66 | 3,498 | 1.22 | 5,195 | 1.86 | ||||||||||||||||||||||||
Total consumer loans | 174,726 | 28.86 | 158,322 | 30.97 | 136,807 | 34.70 | 122,706 | 42.72 | 108,670 | 38.83 | ||||||||||||||||||||||||
Commercial business loans | ||||||||||||||||||||||||||||||||||
Commercial and industrial | 65,841 | 10.88 | 59,619 | 11.66 | 55,624 | 14.11 | 42,657 | 14.85 | 34,519 | 12.33 | ||||||||||||||||||||||||
Warehouse lending | 32,898 | 5.43 | 20,817 | 4.07 | 22,257 | 5.65 | 6,587 | 2.30 | 38,946 | 13.91 | ||||||||||||||||||||||||
Total commercial business loans | 98,739 | 16.31 | 80,436 | 15.73 | 77,881 | 19.76 | 49,244 | 17.15 | 73,465 | 26.24 | ||||||||||||||||||||||||
Total loans receivable, gross | 605,415 | 100.00 | % | 511,282 | 100.00 | % | 394,210 | 100.00 | % | 287,216 | 100.00 | % | 279,930 | 100.00 | % | |||||||||||||||||||
Less: | ||||||||||||||||||||||||||||||||||
Allowance for loan losses | (10,211 | ) | (7,785 | ) | (6,090 | ) | (5,092 | ) | (4,698 | ) | ||||||||||||||||||||||||
Deferred costs, fees and discounts, net | (1,887 | ) | (962 | ) | (946 | ) | (1,043 | ) | (283 | ) | ||||||||||||||||||||||||
Total loans receivable, net | $ | 593,317 | $ | 502,535 | $ | 387,174 | $ | 281,081 | $ | 274,949 | ||||||||||||||||||||||||
(1) Excludes loans held for sale.
4
The following table shows the composition of the loan portfolio by fixed- and adjustable-rate loans at the dates indicated.
(Dollars in thousands) | December 31, | |||||||||||||||||||||||||||||||||
Fixed-rate loans: | 2016 | 2015 | 2014 | 2013 | 2012 | |||||||||||||||||||||||||||||
Real estate loans | Amount | Percent | Amount | Percent | Amount | Percent | Amount | Percent | Amount | Percent | ||||||||||||||||||||||||
Commercial | $ | 30,445 | 5.03 | % | $ | 26,189 | 5.12 | % | $ | 23,144 | 5.87 | % | $ | 23,210 | 8.08 | % | $ | 20,947 | 7.48 | % | ||||||||||||||
Construction and development | — | — | 315 | 0.06 | 322 | 0.08 | 525 | 0.18 | 3,958 | 1.41 | ||||||||||||||||||||||||
Home equity | 1,644 | 0.27 | 2,146 | 0.42 | 2,677 | 0.68 | 2,664 | 0.93 | 2,557 | 0.91 | ||||||||||||||||||||||||
One-to-four-family(1) | 10,267 | 1.69 | 9,305 | 1.82 | 8,108 | 2.06 | 19,981 | 6.96 | 8,328 | 2.98 | ||||||||||||||||||||||||
Multi-family | 4,538 | 0.75 | 2,659 | 0.52 | 3,240 | 0.82 | 3,467 | 1.21 | 2,053 | 0.73 | ||||||||||||||||||||||||
Total real estate loans | 46,894 | 7.74 | 40,614 | 7.94 | 37,491 | 9.51 | 49,847 | 17.36 | 37,843 | 13.51 | ||||||||||||||||||||||||
Consumer loans | 174,041 | 28.75 | 157,805 | 30.87 | 136,368 | 34.59 | 122,346 | 42.60 | 108,500 | 38.76 | ||||||||||||||||||||||||
Commercial business loans | ||||||||||||||||||||||||||||||||||
Commercial and industrial | 26,901 | 4.45 | 17,440 | 3.41 | 16,197 | 4.11 | 19,792 | 6.89 | 16,959 | 6.06 | ||||||||||||||||||||||||
Total commercial business loans | 26,901 | 4.45 | 17,440 | 3.41 | 16,197 | 4.11 | 19,792 | 6.89 | 16,959 | 6.06 | ||||||||||||||||||||||||
Total fixed-rate loans | 247,836 | 40.94 | 215,859 | 42.22 | 190,056 | 48.21 | 191,985 | 66.85 | 163,302 | 58.33 | ||||||||||||||||||||||||
Adjustable-rate loans: | ||||||||||||||||||||||||||||||||||
Real estate loans | ||||||||||||||||||||||||||||||||||
Commercial | 25,426 | 4.20 | 23,845 | 4.66 | 19,826 | 5.03 | 9,760 | 3.40 | 12,303 | 4.40 | ||||||||||||||||||||||||
Construction and development | 94,462 | 15.60 | 80,491 | 15.74 | 57,491 | 14.58 | 41,108 | 14.31 | 27,935 | 9.98 | ||||||||||||||||||||||||
Home equity | 18,437 | 3.05 | 14,394 | 2.82 | 13,060 | 3.31 | 12,508 | 4.35 | 12,917 | 4.62 | ||||||||||||||||||||||||
One-to-four-family(1) | 113,742 | 18.79 | 93,616 | 18.31 | 38,693 | 9.82 | 828 | 0.29 | 5,648 | 2.02 | ||||||||||||||||||||||||
Multi-family | 32,989 | 5.45 | 19,564 | 3.83 | 12,961 | 3.29 | 1,215 | 0.42 | 1,149 | 0.41 | ||||||||||||||||||||||||
Total real estate loans | 285,056 | 47.09 | 231,910 | 45.36 | 142,031 | 36.03 | 65,419 | 22.77 | 59,952 | 21.43 | ||||||||||||||||||||||||
Consumer loans | 685 | 0.11 | 517 | 0.10 | 439 | 0.11 | 360 | 0.12 | 170 | 0.06 | ||||||||||||||||||||||||
Commercial business loans | ||||||||||||||||||||||||||||||||||
Commercial and industrial | 38,940 | 6.43 | 42,178 | 8.25 | 39,427 | 10.00 | 22,865 | 7.96 | 17,560 | 6.27 | ||||||||||||||||||||||||
Warehouse lending | 32,898 | 5.43 | 20,818 | 4.07 | 22,257 | 5.65 | 6,587 | 2.30 | 38,946 | 13.91 | ||||||||||||||||||||||||
Total commercial business loans | 71,838 | 11.86 | 62,996 | 12.32 | 61,684 | 15.65 | 29,452 | 10.26 | 56,506 | 20.18 | ||||||||||||||||||||||||
Total adjustable-rate loans | 357,579 | 59.06 | 295,423 | 57.78 | 204,154 | 51.79 | 95,231 | 33.15 | 116,628 | 41.67 | ||||||||||||||||||||||||
Total loans receivable, gross | 605,415 | 100.00 | % | 511,282 | 100.00 | % | 394,210 | 100.00 | % | 287,216 | 100.00 | % | 279,930 | 100.00 | % | |||||||||||||||||||
Less: | ||||||||||||||||||||||||||||||||||
Allowance for loan losses | (10,211 | ) | (7,785 | ) | (6,090 | ) | (5,092 | ) | (4,698 | ) | ||||||||||||||||||||||||
Deferred costs, fees and discounts, net | (1,887 | ) | (962 | ) | (946 | ) | (1,043 | ) | (283 | ) | ||||||||||||||||||||||||
Total loans receivable, net | $ | 593,317 | $ | 502,535 | $ | 387,174 | $ | 281,081 | $ | 274,949 | ||||||||||||||||||||||||
(1) Excludes loans held for sale.
5
Loan Maturity and Repricing. The following table sets forth certain information at December 31, 2016, regarding the dollar amount and current rates of interest for the loans maturing or repricing in the portfolio based on their contractual terms to maturity, but does not include scheduled payments or potential prepayments. Loan balances do not include undisbursed loan proceeds, unearned discounts, unearned income, and allowance for loan losses.
Real Estate | ||||||||||||||||||||||||||||||||||||||||||||||||
(Dollars in thousands) | Commercial | Construction and Development | Home Equity | One-to-Four-Family (2) | Multi-family | Consumer | Commercial Business | Total | ||||||||||||||||||||||||||||||||||||||||
Due During Years Ending December 31, | Amount | Weighted Average Rate | Amount | Weighted Average Rate | Amount | Weighted Average Rate | Amount | Weighted Average Rate | Amount | Weighted Average Rate | Amount | Weighted Average Rate | Amount | Weighted Average Rate | Amount | Weighted Average Rate | ||||||||||||||||||||||||||||||||
2017(1) | $ | 2,565 | 4.81 | % | $ | 85,199 | 6.10 | % | $ | 18,806 | 4.86 | % | $ | 416 | 6.14 | % | $ | 2,266 | 5.45 | % | $ | 1,677 | 9.87 | % | $ | 82,825 | 4.83 | % | $ | 193,754 | 5.44 | % | ||||||||||||||||
2018 | 2,608 | 5.69 | 4,495 | 5.79 | — | — | 1,228 | 4.39 | 1 | 5.25 | 2,086 | 7.28 | 46 | 7.49 | 10,464 | 5.90 | ||||||||||||||||||||||||||||||||
2019 | 3,004 | 4.45 | — | — | — | — | 915 | 4.87 | 1 | 3.15 | 3,507 | 7.45 | 1,782 | 5.44 | 9,209 | 5.83 | ||||||||||||||||||||||||||||||||
2020 and 2021 | 8,961 | 4.38 | — | — | 213 | 7.76 | 1,509 | 4.74 | 5 | 5.97 | 9,740 | 8.24 | 5,384 | 4.56 | 25,812 | 5.92 | ||||||||||||||||||||||||||||||||
2022 to 2026 | 36,878 | 4.78 | — | — | 388 | 6.95 | 6,805 | 4.68 | 32,698 | 4.22 | 46,138 | 8.14 | 7,527 | 4.20 | 130,434 | 5.80 | ||||||||||||||||||||||||||||||||
2027 to 2031 | 1,366 | 4.85 | 382 | 5.75 | — | — | 3,262 | 4.04 | 2,395 | 4.95 | 99,846 | 6.61 | 1,175 | 5.34 | 108,426 | 6.46 | ||||||||||||||||||||||||||||||||
2032 and following | 489 | 6.50 | 4,386 | 4.05 | 674 | 7.54 | 109,874 | 4.10 | 161 | 5.44 | 11,732 | 6.38 | — | — | 127,316 | 4.34 | ||||||||||||||||||||||||||||||||
Total | $ | 55,871 | 4.76 | % | $ | 94,462 | 5.98 | % | $ | 20,081 | 5.02 | % | $ | 124,009 | 4.15 | % | $ | 37,527 | 4.35 | % | $ | 174,726 | 7.15 | % | $ | 98,739 | 4.78 | % | $ | 605,415 | 5.50 | % | ||||||||||||||||
_______________
(1) Includes demand loans, loans having no stated maturity and overdraft loans.
(2) Excludes loans held for sale.
The total amount of loans due after December 31, 2017, which have predetermined interest rates is $231.4 million, while the total amount of loans due after this date which have floating or adjustable interest rates is $180.3 million.
6
Lending Authority. The Chief Credit Officer has the authority to approve multiple loans to one borrower up to $6.0 million in aggregate. Loans in excess of $6.0 million require an additional signature from the Chief Executive Officer and/or Chief Financial Officer. All loans that are approved over $2.5 million are reported to the Asset Quality Committee (“AQC”) on a monthly basis. The Chief Credit Officer may delegate lending authority to other individuals at levels consistent with their responsibilities.
The Board of Directors has implemented a lending limit policy that it believes matches the Washington State legal lending limit. At December 31, 2016, the Company’s policy limits loans to one borrower and the borrower’s related entities to 20% of the Bank’s unimpaired capital and surplus, or $19.6 million at December 31, 2016. Management has adopted an internal lending limit of a maximum of 80% of the Bank’s legal lending limit for risk mitigation purposes and all loans over this limit require approval from the AQC. The Bank’s largest lending relationship at December 31, 2016, consisted of two commercial real estate loans having combined commitments of $14.0 million to two related companies. Both of these loans are secured by residential construction projects located primarily in King County, Washington, having a combined outstanding balance of $6.6 million at December 31, 2016. The second largest lending relationship consisted of two real estate secured lines of credit having combined commitments of $12.3 million to two companies. Both of these loans are secured by single family rental homes located in Snohomish and Island counties, Washington. The outstanding balance of these two lines of credit was $11.3 million at December 31, 2016. The third largest lending relationship consisted of 15 loans to eight related companies having combined commitments of $10.4 million. Seven of these loans are secured by a mix of owner and non-owner occupied commercial real estate properties located in King County, Washington, which had an aggregate outstanding balance of $8.2 million at December 31, 2016. The remaining eight loans with an aggregate outstanding balance of $1.8 million are secured by the respective borrowers’ business assets. All of the loans listed above were performing in accordance with their repayment terms at December 31, 2016.
At December 31, 2016, the Company had $35.0 million approved in mortgage warehouse lending lines for six companies. The commitments ranged from $3.0 million to $9.0 million. At December 31, 2016, there was $7.8 million in warehouse lines outstanding, compared to $33.0 million approved in warehouse lending lines with $5.4 million outstanding at December 31, 2015. In addition, the Company had $49.0 million approved commercial construction warehouse lending lines for eight companies. The commitments range from $4.0 million to $9.0 million. At December 31, 2016, there was $25.1 million outstanding, compared to $25.0 million approved in commercial warehouse lending lines for five companies with $15.4 million outstanding at December 31, 2015.
Commercial Real Estate Lending. The Company offers a variety of commercial real estate loans. Most of these loans are secured by income producing properties, including multi-family residences, retail centers, warehouses and office buildings located in the market areas. At December 31, 2016, commercial real estate loans (including $37.5 million of multi-family residential loans) totaled $93.4 million, or 15.4%, of the gross loan portfolio.
The Company’s loans secured by commercial real estate are originated with a fixed or variable interest rate for up to a 15-year maturity and a 30-year amortization. The variable rate loans are indexed to the prime rate of interest or a short-term LIBOR rate, or five or seven-year FHLB rate, with rates equal to the prevailing index rate to 5.0% above the prevailing rate. Loan-to-value ratios on the Company’s commercial real estate loans typically do not exceed 80% of the appraised value of the property securing the loan. In addition, personal guarantees are obtained from the primary borrowers on substantially all credits.
Loans secured by commercial real estate are generally underwritten based on the net operating income of the property and the financial strength of the borrower. The net operating income, which is the income derived from the operation of the property less all operating expenses, must be sufficient to cover the payments related to the outstanding debt plus an additional coverage requirement. The Company generally requires an assignment of rents or leases in order to be assured that the cash flow from the project will be sufficient to repay the debt. Appraisals on properties securing commercial real estate loans are performed by independent state certified or licensed fee appraisers. The Company does not generally maintain insurance or tax escrows for loans secured by commercial real estate. In order to monitor the adequacy of cash flows on income-producing properties, the borrower is required to provide financial information on at least an annual basis.
Loans secured by commercial real estate properties generally involve a greater degree of credit risk than one- to-four-family residential mortgage loans. These loans typically involve large balances to single borrowers or groups of related borrowers. Because payments on loans secured by commercial and multi-family real estate properties are
7
often dependent on the successful operation or management of the properties, repayment of these loans may be subject to adverse conditions in the real estate market or the economy. If the cash flow from the project is reduced, or if leases are not obtained or renewed, the borrower’s ability to repay the loan may be impaired. Commercial and multi-family loans also expose a lender to greater credit risk than loans secured by one-to-four-family because the collateral securing these loans typically cannot be sold as easily as one-to-four-family. In addition, most of our commercial and multi-family loans are not fully amortizing and include balloon payments upon maturity. Balloon payments may require the borrower to either sell or refinance the underlying property in order to make the payment, which may increase the risk of default or non-payment. The largest single commercial real estate loan at December 31, 2016 was a 50% participation loan originated by another bank in the Puget Sound area. The Bank’s share of the total outstanding loan at December 31, 2016 was $5.1 million, and is collateralized by commercial real estate located in King County, Washington. At December 31, 2016 this loan was performing in accordance with its repayment terms.
The Company intends to continue to emphasize commercial real estate lending and, as a result, the Company has assembled a highly experienced team, with an average of over 20 years of experience. The Bank’s Chief Credit Officer and Chief Lending Officer are both senior bankers with over 25 years of commercial lending experience in the northwestern U.S. region. Management has also hired experienced commercial loan officers to support the Company’s commercial real estate lending objectives. As the commercial loan portfolio expands, the Company intends to bring in additional experienced personnel in the areas of loan analysis and commercial deposit relationship management, as needed.
Construction and Development Lending. The Company expanded its residential construction lending team in 2011 with a focus on vertical, in-city one-to-four-family development in our market area. This team has over 60 years of combined experience and expertise in acquisition, development and construction (“ADC”) lending in the Puget Sound market area. The Company has implemented this strategy to take advantage of what is believed to be a strong demand for construction and ADC loans to experienced, successful and relationship driven builders in our market area after many other banks abandoned this segment because of previous overexposure. At December 31, 2016, outstanding construction and development loans totaled $94.5 million, or 15.6%, of the gross loan portfolio and consisted of loans for residential and commercial construction projects, primarily for vertical construction and $3.8 million of land acquisition and development loans. Total committed, including unfunded construction and development loans at December 31, 2016, was $154.3 million. At December 31, 2016, $57.0 million, or 60.3% of our outstanding construction and development loan portfolio was comprised of speculative one-to-four-family construction loans. In addition, the Company has eight commercial secured lines of credit, secured by notes to residential construction borrowers with guarantees from principles with experience in the construction re-lending market. These loans had combined commitments of $49.0 million, and an outstanding balance of $25.1 million at December 31, 2016.
The Company’s residential commercial construction lending program focuses on the origination of loans for the purpose of constructing, on both a pre-sold and speculative basis, and selling primarily one-to-four-family residences within the market area. The Company generally limits these types of loans to known builders and developers in the market area. Construction loans generally provide for the payment of interest only during the construction phase, which is typically up to 12 months. At the end of the construction phase, the construction loan is generally paid off through the sale of the newly constructed home and a permanent loan from another lender, although commitments to convert to a permanent loan may be made by us. Construction loans are generally made with a maximum loan-to-value ratio of the lower of 95% of cost or 75% of appraised value at completion. During the term of construction, the accumulated interest on the loan is typically added to the principal balance of the loan through an interest reserve of 3% to 5.5% of the loan commitment amount.
Commitments to fund construction loans generally are made subject to an appraisal of the property by an independent licensed appraiser. The Company also reviews and has a licensed third-party inspect each property before disbursement of funds during the term of the construction loan. Loan proceeds are disbursed after inspection by a third party inspector based on the percentage of completion method.
The Company may also make land acquisition and development loans to builders or residential lot developers on a limited basis. These loans involve a higher degree of credit risk, similar to commercial construction loans. At December 31, 2016, included in the $94.5 million of construction and development loans, were six residential land acquisition and development loans for finished lots totaling $3.8 million, with total commitments of $6.9 million. These land loans also involve additional risks because the loan amount is based on the projected value of the lots after development. Loans are made for up to 75% of the estimated value with a term of up to two years. These loans are
8
required to be paid on an accelerated basis as the lots are sold, so that the Company is repaid before all the lots are sold. Construction financing is generally considered to involve a higher degree of credit risk than longer-term financing on improved, owner-occupied real estate.
Construction and development lending contains the inherent difficulty in estimating both a property’s value at completion of the project and the estimated cost (including interest) of the project. Changes in the demand, such as for new housing and higher than anticipated building costs may cause actual results to vary significantly from those estimated. If the estimate of construction cost proves to be inaccurate, we may be required to advance funds beyond the amount originally committed to permit completion of the project. This type of lending also typically involves higher loan principal amounts and is often concentrated with a small number of builders. In addition, during the term of most of our construction loans, an interest reserve is created at origination and is added to the principal of the loan through the construction phase. If the estimate of value upon completion proves to be inaccurate, we may be confronted at, or prior to, the maturity of the loan with a project the value of which is insufficient to assure full repayment. Because construction loans require active monitoring of the building process, including cost comparisons and on-site inspections, these loans are more difficult and costly to monitor.
Increases in market rates of interest may have a more pronounced effect on construction loans by rapidly increasing the end-purchasers’ borrowing costs, thereby reducing the overall demand for the project. Properties under construction are often difficult to sell and typically must be completed in order to be successfully sold which also complicates the process of working out problem construction loans. This may require us to advance additional funds and/or contract with another builder to complete construction. Furthermore, speculative construction loans to a builder are often associated with homes that are not pre-sold, and thus pose a greater potential risk than construction loans to individuals on their personal residences as there is the added risk associated with identifying an end-purchaser for the finished project. Loans on land under development or held for future construction pose additional risk because of the lack of income being produced by the property and the potential illiquid nature of the collateral. These risks can be significantly impacted by supply and demand. As a result, this type of lending often involves the disbursement of substantial funds with repayment dependent on the success of the ultimate project and the ability of the borrower to sell or lease the property, rather than the ability of the borrower or guarantor themselves to repay principal and interest.
The Company seeks to address the forgoing risks associated with construction development lending by developing and adhering to underwriting policies, disbursement procedures and monitoring practices. Specifically, the Company (i) seeks to diversify the number of loans and projects in the market area, (ii) evaluate and document the creditworthiness of the borrower and the viability of the proposed project, (iii) limit loan-to-value ratios to specified levels, (iv) control disbursements on construction loans on the basis of on-site inspections by a licensed third-party, and (v) monitor economic conditions and the housing inventory in each market. No assurances, however, can be given that these practices will be successful in mitigating the risks of construction development lending.
Home Equity Lending. The Company has been active in second mortgage and home equity lending, with the focus of this lending being conducted in the Company’s primary market area. The home equity lines of credit generally have adjustable rates tied to the prime rate of interest with a draw term of ten years plus and a term to maturity of 15 years. Monthly payments are based on 1.0% of the outstanding balance with a maximum combined loan-to-value ratio of up to 90%, including any underlying first mortgage. Second mortgage home equity loans are typically fixed rate, amortizing loans with terms of up to 15 years. Total second mortgage/home equity loans totaled $20.1 million, or 3.3% of the gross loan portfolio, at December 31, 2016, $18.4 million of which were adjustable rate home equity lines of credit. Unfunded commitments on loans and lines of credit at December 31, 2016, was $26.1 million.
Residential. The Company originates loans secured by first mortgages on one-to-four-family residences primarily in the market area. The Company originates one-to-four-family residential mortgage loans through referrals from real estate agents, financial planners, builders and from existing customers. Walk-in customers are also an important source of the Company’s loan originations. The Company originated $770.2 million of one-to-four-family consumer mortgages and sold $711.7 million to investors in 2016. Of the loans sold to investors, $452.7 million were sold to Fannie Mae, Ginnie Mae, FHLB, and/or Freddie Mac with servicing rights retained in order to further build the relationship with the customer. At December 31, 2016, one-to-four-family residential mortgage loans totaled $124.0 million, or 20.5%, of the gross loan portfolio, excluding loans held for sale of $52.6 million. In addition, the Company originated $3.8 million in residential loans through our commercial lending channel, secured by single family rental homes in Washington, with combined commitments of $12.3 million, and an outstanding balance of $11.3 million at
9
December 31, 2016 that are not included in our one-to-four-family residential mortgage loan portfolio. See “Commercial Business Lending.”
The Company generally underwrites the one-to-four-family loans based on the applicant’s ability to repay. This includes employment and credit history and the appraised value of the subject property. The Company will lend up to 100% of the lesser of the appraised value or purchase price for one-to-four-family first mortgage loans. For first mortgage loans with a loan-to-value ratio in excess of 80%, the Company generally requires either private mortgage insurance or government sponsored insurance in order to mitigate the higher risk level associated with higher loan-to-value loans. Fixed-rate loans secured by one-to-four-family residences have contractual maturities of up to 30 years and are generally fully amortizing, with payments due monthly. Adjustable-rate mortgage loans generally pose different credit risks than fixed-rate loans, primarily because as interest rates rise the borrower’s payments rise, increasing the potential for default. Properties securing the one-to-four-family loans are appraised by independent fee appraisers who are selected in accordance with industry and regulatory standards. The Company requires borrowers to obtain title and hazard insurance, and flood insurance, if necessary. Loans are generally underwritten to the secondary market guidelines with overlays as determined by the internal underwriting department.
Consumer Lending. Consumer lending represents a significant and important historical activity for the Company, primarily reflecting the indirect lending through home improvement contractors and dealers. At December 31, 2016, consumer loans totaled $174.7 million, or 28.9% of the gross loan portfolio.
The Company’s indirect home improvement loans, also referred to as fixture secured loans, represent the largest portion of the consumer loan portfolio and have traditionally been the mainstay of the Company’s lending strategy. These loans totaled $107.8 million, or 17.8% of the gross loan portfolio, and 61.7% of total consumer loans, at December 31, 2016. Indirect home improvement loans are originated through a network of 115 home improvement contractors and dealers located in Washington, Oregon, Idaho, and California. Four dealers are responsible for a majority (50.5%) of the loan volume. These fixture secured loans consist of loans for a wide variety of products, such as replacement windows, siding, roofs, HVAC systems, and roofing materials.
In order to grow the Company’s indirect home improvement loan volume, the Company expanded into the State of California in 2012 with a limited number of contractors and dealers of solar loans. Solar loans are the second largest portion of the consumer loan portfolio which totaled $36.5 million, or 6.0% of the gross loan portfolio. As of December 31, 2016, the Company had $36.2 million in loans to borrowers that reside in California, or 99.2% of total solar loans, 20.7% of total consumer loans. The Company’s primary home improvement focus in California is on consumer solar panel installations which comprise 99.2% of the volume originated in California.
In connection with fixture secured and solar loans, the Company receives loan applications from the dealers, and originates the loans based on pre-defined lending criteria. The loans are processed through the loan origination software, with approximately 20% of the loan applications receiving an automated approval based on the information provided, and the remaining loans processed by the Company’s credit analysts. The Company follows the internal underwriting guidelines in evaluating loans obtained through the indirect dealer program, including using a Fair Isaac and Company, Incorporated (“FICO”), credit score to approve loans. A FICO score is a principal measure of credit quality and is one of the significant criteria we rely upon in our underwriting in addition to the borrower’s debt to income.
The Company’s fixture secured and solar loans generally range in amounts from $2,500 to $50,000, and generally carry terms of 12 to 20 years with fixed rates of interest. In some instances, the participating dealer may pay a fee to buy down the borrower’s interest rate to a rate below the Company’s published rate. Fixture secured and solar loans are secured by the personal property installed in, on or at the borrower’s real property, and may be perfected with a UCC-2 financing statement filed in the county of the borrower’s residence. The Company generally files a UCC-2 financing statement to perfect the security interest in the personal property in situations where the borrower’s credit score is below 720 or the home improvement loan is for an amount in excess of $5,000. Perfection gives the Company a claim to the collateral that is superior to someone that obtains a lien through the judicial process subsequent to the perfection of a security interest. The failure to perfect a security interest does not render the security interest unenforceable against the borrower. However, failure to perfect a security interest risks avoidance of the security interest in bankruptcy or subordination to the claims of third parties.
The Company also offers consumer marine loans secured by boats. Marine loans represent the third largest segment of the consumer loan portfolio. As of December 31, 2016, the marine loan portfolio totaled $28.5 million, or
10
4.7% of the gross loan portfolio and 16.3% of total consumer loans. Marine loans are originated with borrowers on both a direct and indirect basis, and generally carry terms of up to 20 years with fixed rates of interest. The Company requires a 10% down payment, and the loan amount may be up to the lesser of 120% of factory invoice or 90% of the purchase price.
The Company originates other consumer loans which totaled $1.9 million as of December 31, 2016. These loans primarily include personal lines of credit, automobile, direct home improvement, loans on deposit, and recreational loans.
In evaluating any consumer loan application, a borrower’s FICO score is utilized as an important indicator of credit risk. The FICO score represents the creditworthiness of a borrower based on the borrower’s credit history, as reported by an independent third party. A higher FICO score typically indicates a greater degree of creditworthiness. Over the last several years the Company has emphasized originations of loans to consumers with higher credit scores. This has resulted in a lower level of loan charge-offs in recent periods. As of December 31, 2016, 71.2% of the consumer loan portfolio was originated with borrowers having a FICO score over 720 at the time of origination, and 95.6% was originated with borrowers having a FICO score over 660 at the time of origination. Generally, a FICO score of 660 or higher indicates the borrower has an acceptable credit reputation. A credit score at the time of loan origination of less than 660 is considered “subprime” by federal banking regulators. Borrowers of our one-to-four-family loans had an average FICO score of 725 at the time of loan origination. Consideration for loans with FICO scores below 660 require additional management oversight and approval.
Consumer loans generally have shorter terms to maturity, which reduces the Company’s exposure to changes in interest rates. In addition, management believes that offering consumer loan products helps to expand and create stronger ties to existing customer base by increasing the number of customer relationships and providing cross-marketing opportunities.
Consumer and other loans generally entail greater risk than do one-to-four-family residential mortgage loans, particularly in the case of consumer loans that are secured by rapidly depreciable assets, such as boats, automobiles and other recreational vehicles. In these cases, any repossessed collateral for a defaulted loan may not provide an adequate source of repayment of the outstanding loan balance. As a result, consumer loan collections are dependent on the borrower’s continuing financial stability and, thus, are more likely to be adversely affected by job loss, divorce, illness or personal bankruptcy. In the case of fixture secured and solar loans, it is very difficult to repossess the personal property securing these loans as they are typically attached to the borrower’s personal residence. Accordingly, if a borrower defaults on a fixture secured or solar loan the only practical recourse is to wait until the borrower wants to sell or refinance the home, at which time if there is a perfected security interest the Company generally will be able to collect a percentage of the loan previously charged off.
Commercial Business Lending. The Company originates commercial business loans and lines of credit to local small- and mid-sized businesses in the Puget Sound market area that are secured by accounts receivable, inventory or property, plant and equipment. Consistent with management’s objectives to expand commercial business lending, in 2009, the Company commenced a mortgage warehouse lending program through which the Company funds third-party mortgage bankers. Under this program the Company provides short term funding to the mortgage banking companies for the purpose of originating residential mortgage loans for sale into the secondary market. The Company’s warehouse lending lines are secured by the underlying notes associated with one-to-four-family mortgage loans made to borrowers by the mortgage banking company and generally require guarantees from the principal shareholder(s) of the mortgage banking company. These loans are repaid when the note is sold by the mortgage bank into the secondary market, with the proceeds from the sale used to pay down the outstanding loan before being dispersed to the mortgage bank. The Company also has construction warehouse lines secured by notes on construction loans and guaranteed by principles with experience in construction lending. At December 31, 2016, the Company had $35.0 million approved in mortgage warehouse lending lines for six companies. The commitments ranged from $3.0 million to $9.0 million. At December 31, 2016, there was $7.8 million in warehouse lines outstanding, compared to $33.0 million approved in warehouse lending lines with $5.4 million outstanding at December 31, 2015. In addition, the Company had $49.0 million approved commercial construction warehouse lending lines for eight companies. The commitments range from $4.0 million to $9.0 million. At December 31, 2016, there was $25.1 million outstanding, compared to $25.0 million approved in commercial warehouse lending lines for five companies with $15.4 million outstanding at December 31, 2015.
11
Commercial business loans may be fixed-rate, but are usually adjustable-rate loans indexed to the prime rate of interest, plus a margin. Some of the commercial business loans, such as those made pursuant to the warehouse lending program, are structured as lines of credit with terms of 12 months and interest only payments required during the term, while other loans may reprice on an annual basis and amortize over a two to five year period. Due to the current interest rate environment, these loans and lines of credit are generally originated with a floor, which is generally set between 3.5% and 5.5%. Loan fees are generally charged at origination depending on the credit quality and account relationships of the borrower. Advance rates on these types of lines are generally limited to 80% of accounts receivable and 50% of inventory. The Company also generally requires the borrower to establish a deposit relationship as part of the loan approval process. At December 31, 2016, the commercial business loan portfolio totaled $98.7 million, or 16.3%, of the gross loan portfolio including warehouse lending loans.
At December 31, 2016, most of the commercial business loans were secured. The Company’s commercial business lending policy includes credit file documentation and analysis of the borrower’s background, capacity to repay the loan, the adequacy of the borrower’s capital and collateral, as well as an evaluation of other conditions affecting the borrower. Analysis of the borrower’s past, present and future cash flows is also an important aspect of credit analysis. The Company generally requires personal guarantees on commercial business loans. Nonetheless, commercial business loans are believed to carry higher credit risk than residential mortgage loans. The two largest commercial business lending relationships consisted of two commercial lines of credit to two related companies, and two real estate secured lines of credit to two related companies. The first two commercial lines of credit, secured by notes for residential construction projects located primarily in King County, Washington, have combined commitments of $14.0 million, and an outstanding balance of $6.6 million at December 31, 2016. These loans are classified as construction warehouse loans and included in our warehouse lending program. The other two real estate secured lines of credit, secured by single family rental homes located in Snohomish and Island counties, Washington, have combined commitments of $12.3 million, and an outstanding balance of $11.3 million at December 31, 2016.
Unlike residential mortgage loans, commercial business loans, particularly unsecured loans, are made on the basis of the borrower’s ability to make repayment from the cash flow of the borrower’s business and, therefore, are of higher risk. The Company makes commercial loans secured by business assets, such as accounts receivable, inventory, equipment, real estate and cash as collateral with loan-to-value ratios in most cases up to 80%, based on the type of collateral. This collateral depreciates over time, may be difficult to appraise and may fluctuate in value based on the specific type of business and equipment used. As a result, the availability of funds for the repayment of commercial business loans may be substantially dependent on the success of the business itself (which, in turn, is often dependent in part upon general economic conditions).
Loan Originations, Servicing, Purchases and Sales
The Company originates both fixed-rate and adjustable-rate loans. The ability to originate loans, however, is dependent upon customer demand for loans in the market areas. From time to time to supplement our loan originations and based on our asset/liability objectives we will also purchase bulk loans or pools of loans from other financial institutions.
Over the past few years, the Company has continued to originate consumer loans, and increased emphasis on commercial real estate loans, including construction and development lending, as well as commercial business loans. Demand is affected by competition and the interest rate environment. In periods of economic uncertainty, the ability of financial institutions, including us, to originate large dollar volumes of commercial business and real estate loans may be substantially reduced or restricted, with a resultant decrease in interest income. In addition to interest earned on loans and loan origination fees, the Company receives fees for loan commitments, late payments and other miscellaneous services. The fees vary from time to time, generally depending on the supply of funds and other competitive conditions in the market.
The Company will sell long-term, fixed-rate residential real estate loans in the secondary market to mitigate interest rate risk. These loans are generally sold for cash in amounts equal to the unpaid principal amount of the loans determined using present value yields to the buyer. These sales allowed for a servicing fee on loans when the servicing is retained by the Company. A majority of residential real estate loans sold by the Company were sold with servicing retained. The Company earned gross mortgage servicing fees of $2.0 million for the year ended December 31, 2016. At December 31, 2016, the Company was servicing $973.5 million of one-to-four-family loans for Federal National
12
Mortgage Association, Federal Home Loan Mortgage Corporation, Government National Mortgage Association, and Federal Home Loan Bank. These mortgage servicing rights constituted a $8.5 million asset on the books on that date, which is amortized in proportion to and over the period of the net servicing income. These mortgage servicing rights are periodically evaluated for impairment based on their fair value, which takes into account the rates and potential prepayments of those sold loans being serviced. The fair value of the servicing rights at December 31, 2016 was $11.7 million. See Notes 5 and 15 of the Notes to Consolidated Financial Statements included in Item 8, “Financial Statements and Supplementary Data” of this Form 10-K.
The following table presents the activity during the year ended December 31, 2016, related to loans serviced for others.
Beginning balance at January 1, 2016 | (In thousands) | |||
One-to-four-family | $ | 631,940 | ||
Consumer | 2,191 | |||
Commercial business | 1,988 | |||
Subtotal | 636,119 | |||
Additions | ||||
One-to-four-family | 452,655 | |||
Repayments | ||||
One-to-four-family | (111,054 | ) | ||
Consumer | (563 | ) | ||
Commercial business | (39 | ) | ||
Subtotal | (111,656 | ) | ||
Ending balance at December 31, 2016 | ||||
One-to-four-family | 973,541 | |||
Consumer | 1,628 | |||
Commercial business | 1,949 | |||
Total | $ | 977,118 | ||
13
The following table shows total loans originated, purchased, sold and repaid during the years indicated.
(In thousands) | Years Ended December 31, | ||||||
Originations by type: | 2016 | 2015 | |||||
Fixed-rate: | |||||||
Commercial | $ | 9,812 | $ | 5,172 | |||
Home equity | 2,504 | 1,256 | |||||
One-to-four-family (1) | 3,990 | 3,309 | |||||
Loans held for sale (one-to-four-family) | 704,366 | 531,460 | |||||
Multi-family | 2,061 | 784 | |||||
Consumer | 84,039 | 79,789 | |||||
Commercial business (excluding warehouse lines) | 21,830 | 4,709 | |||||
Total fixed-rate | 828,602 | 626,479 | |||||
Adjustable- rate: | |||||||
Commercial | 10,224 | 9,691 | |||||
Construction and development | 73,730 | 126,095 | |||||
Home equity | 12,793 | 8,498 | |||||
One-to-four-family (1) | 51,136 | 54,992 | |||||
Loans held for sale (one-to-four-family) | 14,498 | 40,285 | |||||
Multi-family | 15,209 | 7,001 | |||||
Consumer | 1,484 | 973 | |||||
Commercial business (excluding warehouse lines) | 104,073 | 65,695 | |||||
Warehouse lines, net | 2,416 | (4,685 | ) | ||||
Total adjustable-rate | 285,563 | 308,545 | |||||
Total loans originated | 1,114,165 | 935,024 | |||||
Purchases by type: | |||||||
Adjustable-rate: | |||||||
One-to-four-family (1) | — | 16,255 | |||||
Total loans purchased | — | 16,255 | |||||
Sales and repayments: | |||||||
Commercial | (111 | ) | — | ||||
Loans held for sale (one-to-four-family) | (711,698 | ) | (551,455 | ) | |||
Consumer | — | — | |||||
Total loans sold | (711,809 | ) | (551,455 | ) | |||
Total principal repayments | (300,595 | ) | (263,810 | ) | |||
Total reductions | (1,012,404 | ) | (815,265 | ) | |||
Net increase | $ | 101,761 | $ | 136,014 | |||
(1) One-to-four-family portfolio loans.
Sales of whole real estate loans and participations in real estate loans can be beneficial to us since these sales systematically generate income at the time of sale, produce future servicing income on loans where servicing is retained, provide funds for additional lending and other investments, and increase liquidity.
Sales of whole consumer loans, specifically longer term consumer loans, can be beneficial to us since these sales generate income at the time of sale, can potentially create future servicing income where servicing is retained, and provide a mitigation of interest rate risk associated with holding 15-20 year maturity consumer loans.
Asset Quality
When a borrower fails to make a required payment on a residential real estate loan, the Company attempts to cure the delinquency by contacting the borrower. In the case of loans secured by residential real estate, a late notice typically is sent 16 days after the due date, and the borrower is contacted by phone within 16 to 25 days after the due date. When the loan is 30 days past due, an action plan is formulated for the credit under the direction of the Loan Control department manager. Generally, a delinquency letter is mailed to the borrower. All delinquent accounts are reviewed by a loan control representative who attempts to cure the delinquency by contacting the borrower once the loan is 30 days past due. If the account becomes 60 days delinquent and an acceptable repayment plan has not been
14
agreed upon, a loan control representative will generally refer the account to legal counsel with instructions to prepare a notice of intent to foreclose. The notice of intent to foreclose allows the borrower up to 30 days to bring the account current. Between 90 - 120 days past due, a value is obtained for the loan collateral. At that time, a mortgage analysis is completed to determine the loan-to-value ratio and any collateral deficiency. If foreclosed, the Company customarily takes title to the property and sells it directly through a real estate broker.
Delinquent consumer loans are handled in a similar manner. Appropriate action is taken in the form of phone calls and notices to collect any loan payment that is delinquent more than 16 days. Once the loan is 90 days past due, it is classified as non-accrual. Generally, credits are charged off if past due 120 days, unless the collections department provides support for a customer repayment plan. Bank procedures for repossession and sale of consumer collateral are subject to various requirements under the applicable consumer protection laws as well as other applicable laws and the determination by us that it would be beneficial from a cost basis.
Delinquent commercial business loans and loans secured by commercial real estate are handled by the loan officer in charge of the loan, who is responsible for contacting the borrower. The loan officer works with outside counsel and, in the case of real estate loans, a third party consultant to resolve problem loans. In addition, management meets as needed and reviews past due and classified loans, as well as other loans that management feels may present possible collection problems, which are reported to the loan committee and the board on a monthly basis. If an acceptable workout of a delinquent commercial loan cannot be agreed upon, the Company customarily will initiate foreclosure or repossession proceedings on any collateral securing the loan.
The following table shows delinquent loans by the type of loan and number of days delinquent at December 31, 2016. Categories not included in the table below did not have any delinquent loans at December 31, 2016.
Loans Delinquent For: | |||||||||||||||||||||||||||||
(Dollars in thousands) | 60-89 Days | 90 Days or More | Total Loans Delinquent 60 Days or More | ||||||||||||||||||||||||||
Real estate loans | Number | Amount | Percent of Loan Category | Number | Amount | Percent of Loan Category | Number | Amount | Percent of Loan Category | ||||||||||||||||||||
Home equity | — | $ | — | — | % | 5 | $ | 210 | 1.05 | % | 5 | $ | 210 | 1.05 | % | ||||||||||||||
Total real estate loans | — | — | — | 5 | 210 | 0.06 | 5 | 210 | 0.06 | ||||||||||||||||||||
Consumer loans | |||||||||||||||||||||||||||||
Indirect home improvement | 31 | 278 | 0.26 | 20 | 167 | 0.15 | 51 | 445 | 0.41 | ||||||||||||||||||||
Solar | — | — | — | 2 | 69 | 0.19 | 2 | 69 | 0.19 | ||||||||||||||||||||
Other consumer | 2 | 2 | 0.10 | 2 | 4 | 0.21 | 4 | 6 | 0.31 | ||||||||||||||||||||
Total consumer loans | 33 | 280 | 0.16 | 24 | 240 | 0.14 | 57 | 520 | 0.30 | ||||||||||||||||||||
Total | 33 | $ | 280 | 0.05 | % | 29 | $ | 450 | 0.07 | % | 62 | $ | 730 | 0.12 | % | ||||||||||||||
15
Non-performing Assets. The following table sets forth information with respect to the Company’s non-performing assets.
(Dollars in thousands) | December 31, | ||||||||||||||||||
Non-accruing loans: | 2016 | 2015 | 2014 | 2013 | 2012 | ||||||||||||||
Real estate loans | |||||||||||||||||||
Commercial | $ | — | $ | — | $ | — | $ | 567 | $ | 783 | |||||||||
Home equity | 210 | 47 | 61 | 172 | 248 | ||||||||||||||
One-to-four-family | — | 525 | 73 | 104 | 344 | ||||||||||||||
Total real estate loans | 210 | 572 | 134 | 843 | 1,375 | ||||||||||||||
Consumer loans | |||||||||||||||||||
Indirect home improvement | 435 | 408 | 250 | 258 | 295 | ||||||||||||||
Solar | 69 | 37 | 29 | — | — | ||||||||||||||
Marine | — | — | 19 | — | — | ||||||||||||||
Other consumer | 7 | — | 1 | — | 42 | ||||||||||||||
Total consumer loans | 511 | 445 | 299 | 258 | 337 | ||||||||||||||
Commercial business loans | |||||||||||||||||||
Commercial and industrial | — | — | — | — | 194 | ||||||||||||||
Total Commercial business loans | — | — | — | — | 194 | ||||||||||||||
Total non-accruing loans | 721 | 1,017 | 433 | 1,101 | 1,906 | ||||||||||||||
Accruing loans contractually past due 90 days or more | — | — | — | — | — | ||||||||||||||
Real estate owned | — | — | — | 2,075 | 2,127 | ||||||||||||||
Repossessed consumer property | 15 | — | — | 32 | 31 | ||||||||||||||
Total non-performing assets | $ | 736 | $ | 1,017 | $ | 433 | $ | 3,208 | $ | 4,064 | |||||||||
Restructured loans | $ | 57 | $ | 734 | $ | 783 | $ | 815 | $ | 3,260 | |||||||||
Total non-performing assets as a percentage of total assets | 0.09 | % | 0.15 | % | 0.08 | % | 0.77 | % | 1.13 | % | |||||||||
For the year ended December 31, 2016, gross interest income which would have been recorded had the non-accruing loans been current in accordance with their original terms was $8,000. Prior to non-accrual status, the amount of interest income included in net income for the year ended December 31, 2016 was $47,000 for these loans.
Real Estate Owned. Real estate acquired by the Company as a result of foreclosure or by deed-in-lieu of foreclosure is classified as real estate owned until it is sold. When the property is acquired, it is recorded at the lower of its cost, which is the unpaid principal balance of the related loan plus foreclosure costs, or the fair market value of the property less selling costs. The Company had no real estate owned properties as of December 31, 2016.
Restructured Loans. According to generally accepted accounting principles in the United States of America (“U.S. GAAP”), the Company is required to account for certain loan modifications or restructuring as a “troubled debt restructuring.” In general, the modification or restructuring of a debt is considered a troubled debt restructuring if the Company, for economic or legal reasons related to the borrower’s financial difficulties, grants a concession to the borrowers that would not otherwise be considered. The Company had one restructured loan at December 31, 2016, of $57,000 that was performing in accordance with its modified terms.
Other Assets Especially Mentioned. At December 31, 2016, there were no loans with respect to which known information about the possible credit problems of the borrowers caused management to have doubts as to the ability of the borrowers to comply with present loan repayment terms and which may result in the future inclusion of such items in the non-performing asset categories.
Classified Assets. Federal regulations provide for the classification of lower quality loans and other assets (such as other real estate owned and repossessed property), debt and equity securities, as substandard, doubtful or loss. An asset is considered substandard if it is inadequately protected by the current net worth and pay capacity of the
16
borrower or of any collateral pledged. Substandard assets include those characterized by the distinct possibility that the Company will sustain some loss if the deficiencies are not corrected. Assets classified as doubtful have all the weaknesses inherent in those classified substandard with the added characteristic that the weaknesses present make collection or liquidation in full highly questionable and improbable, on the basis of currently existing facts, conditions and values. Assets classified as loss are those considered uncollectible and of such little value that their continuance as assets without the establishment of a specific loss reserve is not warranted.
When the Company classifies problem assets as either substandard or doubtful, a specific allowance may be established in an amount deemed prudent to address specific impairments. General allowances represent loss allowances which have been established to recognize the inherent risk associated with lending activities, but which, unlike specific allowances, have not been specifically allocated to particular problem assets. When an insured institution classifies problem assets as a loss, it is required to charge off those assets in the period in which they are deemed uncollectible. The Company’s determination as to the classification of assets and the amount of valuation allowances is subject to review by the FDIC and the DFI, which can order the establishment of additional loss allowances. Assets which do not currently expose the Company to sufficient risk to warrant classification in one of the aforementioned categories but possess weaknesses are required to be designated as special mention.
In connection with the filing of periodic reports with the FDIC and in accordance with the Company’s classification of assets policy, the Company regularly reviews the problem assets in the portfolio to determine whether any assets require classification in accordance with applicable regulations. On the basis of the review of the Company’s assets, at December 31, 2016, the Company had classified $8.0 million of assets as substandard. The $8.0 million of classified assets represented 9.9% of equity and 1.0% of total assets at December 31, 2016. The Company had no assets classified as special mention at December 31, 2016.
Allowance for Loan Losses
The Company maintains an allowance for loan losses to absorb probable incurred credit losses in the loan portfolio. The allowance is based on ongoing, monthly assessments of the estimated probable incurred losses in the loan portfolio. In evaluating the level of the allowance for loan losses, management considers the types of loans and the amount of loans in the loan portfolio, peer group information, historical loss experience, adverse situations that may affect the borrower’s ability to repay, estimated value of any underlying collateral, and prevailing economic conditions. Large groups of smaller balance homogeneous loans, such as residential real estate, small commercial real estate, home equity and consumer loans, are evaluated in the aggregate using historical loss factors and peer group data adjusted for current economic conditions. More complex loans, such as commercial real estate loans and commercial business loans, are evaluated individually for impairment, primarily through the evaluation of net operating income and available cash flow and their possible impact on collateral values.
The allowance is increased by the provision for loan losses, which is charged against current period earnings and decreased by the amount of actual loan charge-offs, net of recoveries.
The provision for loan losses was $2.4 million for the year ended December 31, 2016. The allowance for loan losses was $10.2 million, or 1.7% of gross loans receivable at December 31, 2016, as compared to $7.8 million, or 1.5% of gross loans receivable outstanding at December 31, 2015. The level of the allowance is based on estimates, and the ultimate losses may vary from the estimates. Management will continue to review the adequacy of the allowance for loan losses and make adjustments to the provision for loan losses based on loan growth, economic conditions, charge-offs and portfolio composition.
Assessing the allowance for loan losses is inherently subjective as it requires making material estimates, including the amount and timing of future cash flows expected to be received on impaired loans that may be susceptible to significant change. In the opinion of management, the allowance, when taken as a whole, reflects probable incurred loan losses in the loan portfolio. See Item 7. “Management’s Discussion and Analysis of Financial Condition and Results of Operations - Comparison of Results of Operations for the Years Ended December 31, 2016 and 2015 - Provision for Loan Losses” and Notes 1 and 4 of the Notes to Consolidated Financial Statements included in Item 8, “Financial Statements and Supplementary Data” of this Form 10-K.
17
The following table summarizes the distribution of the allowance for loan losses by loan category.
December 31, | |||||||||||||||||||||||||||||||||||||||||||||||||||||||
(Dollars in thousands) | 2016 | 2015 | 2014 | 2013 | 2012 | ||||||||||||||||||||||||||||||||||||||||||||||||||
Allocated at end of year to: | Loan balance | Percent of loan balance in each category to total loans | Allowance for loan losses by loan category | Loan balance | Percent of loan balance in each category to total loans | Allowance for loan losses by loan category | Loan balance | Percent of loan balance in each category to total loans | Allowance for loan losses by loan category | Loan balance | Percent of loan balance in each category to total loans | Allowance for loan losses by loan category | Loan balance | Percent of loan balance in each category to total loans | Allowance for loan losses by loan category | ||||||||||||||||||||||||||||||||||||||||
Real estate loans | |||||||||||||||||||||||||||||||||||||||||||||||||||||||
Commercial | $ | 55,871 | 9.23 | % | $ | 708 | $ | 50,034 | 9.78 | % | $ | 514 | $ | 42,970 | 10.90 | % | $ | 559 | $ | 32,970 | 11.48 | % | $ | 377 | $ | 33,250 | 11.88 | % | $ | 242 | |||||||||||||||||||||||||
Construction and development | 94,462 | 15.60 | 1,273 | 80,806 | 15.80 | 1,157 | 57,813 | 14.67 | 675 | 41,633 | 14.49 | 591 | 31,893 | 11.39 | 556 | ||||||||||||||||||||||||||||||||||||||||
Home equity | 20,081 | 3.32 | 244 | 16,540 | 3.24 | 222 | 15,737 | 3.99 | 187 | 15,172 | 5.28 | 612 | 15,474 | 5.53 | 596 | ||||||||||||||||||||||||||||||||||||||||
One-to-four-family | 124,009 | 20.48 | 947 | 102,921 | 20.13 | 770 | 46,801 | 11.87 | 303 | 20,809 | 7.25 | 336 | 13,976 | 4.99 | 275 | ||||||||||||||||||||||||||||||||||||||||
Multi-family | 37,527 | 6.20 | 375 | 22,223 | 4.35 | 211 | 16,201 | 4.11 | 143 | 4,682 | 1.63 | 47 | 3,202 | 1.14 | 21 | ||||||||||||||||||||||||||||||||||||||||
Total real estate loans | 331,950 | 54.83 | 3,547 | 272,524 | 53.30 | 2,874 | 179,522 | 45.54 | 1,867 | 115,266 | 40.13 | 1,963 | 97,795 | 34.93 | 1,690 | ||||||||||||||||||||||||||||||||||||||||
Consumer loans | |||||||||||||||||||||||||||||||||||||||||||||||||||||||
Indirect home improvement | 107,759 | 17.80 | 1,404 | 103,064 | 20.16 | 1,157 | 99,304 | 25.19 | 1,146 | 91,167 | 31.74 | 1,198 | 83,786 | 29.93 | 1,795 | ||||||||||||||||||||||||||||||||||||||||
Solar | 36,503 | 6.03 | 407 | 29,226 | 5.72 | 299 | 18,162 | 4.61 | 137 | 16,838 | 5.86 | 195 | 2,463 | 0.89 | 53 | ||||||||||||||||||||||||||||||||||||||||
Marine | 28,549 | 4.71 | 229 | 23,851 | 4.66 | 192 | 16,713 | 4.24 | 108 | 11,203 | 3.90 | 86 | 17,226 | 6.15 | 233 | ||||||||||||||||||||||||||||||||||||||||
Other consumer | 1,915 | 0.32 | 42 | 2,181 | 0.43 | 33 | 2,628 | 0.66 | 40 | 3,498 | 1.22 | 33 | 5,195 | 1.86 | 77 | ||||||||||||||||||||||||||||||||||||||||
Total consumer loans | 174,726 | 28.86 | 2,082 | 158,322 | 30.97 | 1,681 | 136,807 | 34.70 | 1,431 | 122,706 | 42.72 | 1,512 | 108,670 | 38.83 | 2,158 | ||||||||||||||||||||||||||||||||||||||||
Commercial business loans | |||||||||||||||||||||||||||||||||||||||||||||||||||||||
Commercial and industrial | 65,841 | 10.88 | 2,297 | 59,619 | 11.66 | 1,035 | 55,624 | 14.11 | 849 | 45,242 | 15.75 | 735 | 34,519 | 12.33 | 383 | ||||||||||||||||||||||||||||||||||||||||
Warehouse lending | 32,898 | 5.43 | 378 | 20,817 | 4.07 | 361 | 22,257 | 5.65 | 340 | 4,002 | 1.40 | 65 | 38,946 | 13.91 | 432 | ||||||||||||||||||||||||||||||||||||||||
Total commercial business loans | 98,739 | 16.31 | 2,675 | 80,436 | 15.73 | 1,396 | 77,881 | 19.76 | 1,189 | 49,244 | 17.15 | 800 | 73,465 | 26.24 | 815 | ||||||||||||||||||||||||||||||||||||||||
Unallocated reserve | — | — | 1,907 | — | — | 1,834 | — | — | 1,603 | — | — | 817 | — | — | 35 | ||||||||||||||||||||||||||||||||||||||||
Total | $ | 605,415 | 100.00 | % | $ | 10,211 | $ | 511,282 | 100.00 | % | $ | 7,785 | $ | 394,210 | 100.00 | % | $ | 6,090 | $ | 287,216 | 100.00 | % | $ | 5,092 | $ | 279,930 | 100.00 | % | $ | 4,698 | |||||||||||||||||||||||||
18
The following table sets forth an analysis of the allowance for loan losses at the dates and or the periods indicated.
(Dollars in thousands) | Years Ended December 31, | ||||||||||||||||||
2016 | 2015 | 2014 | 2013 | 2012 | |||||||||||||||
Balance at beginning of year | $ | 7,785 | $ | 6,090 | $ | 5,092 | $ | 4,698 | $ | 4,345 | |||||||||
Charge-offs: | |||||||||||||||||||
Real estate loans | |||||||||||||||||||
Commercial | — | 191 | 120 | 340 | 48 | ||||||||||||||
Construction and development | — | — | — | 194 | 94 | ||||||||||||||
Home equity | 65 | 57 | 94 | 257 | 381 | ||||||||||||||
One-to-four-family | — | — | — | 18 | 257 | ||||||||||||||
Total real estate loans | 65 | 248 | 214 | 809 | 780 | ||||||||||||||
Consumer loans | |||||||||||||||||||
Indirect home improvement | 822 | 1,265 | 1,341 | 1,562 | 2,156 | ||||||||||||||
Solar | 50 | 92 | — | — | — | ||||||||||||||
Marine | 81 | 63 | 15 | 43 | — | ||||||||||||||
Other consumer | 49 | 46 | 51 | 152 | 425 | ||||||||||||||
Total consumer loans | 1,002 | 1,466 | 1,407 | 1,757 | 2,581 | ||||||||||||||
Commercial business loans | |||||||||||||||||||
Commercial and industrial | — | 40 | 75 | 63 | 179 | ||||||||||||||
Total commercial business loans | — | 40 | 75 | 63 | 179 | ||||||||||||||
Total charge-offs | 1,067 | 1,754 | 1,696 | 2,629 | 3,540 | ||||||||||||||
Recoveries: | |||||||||||||||||||
Real estate loans | |||||||||||||||||||
Commercial | — | 191 | — | 38 | — | ||||||||||||||
Home equity | 68 | 33 | 80 | 35 | 9 | ||||||||||||||
One-to-four-family | 48 | — | 104 | 18 | — | ||||||||||||||
Total real estate loans | 116 | 224 | 184 | 91 | 9 | ||||||||||||||
Consumer loans | |||||||||||||||||||
Indirect home improvement | 780 | 870 | 630 | 510 | 630 | ||||||||||||||
Marine | 29 | 33 | 13 | 17 | — | ||||||||||||||
Other consumer | 81 | 56 | 65 | 219 | 322 | ||||||||||||||
Total consumer loans | 890 | 959 | 708 | 746 | 952 | ||||||||||||||
Commercial business loans | |||||||||||||||||||
Commercial and industrial | 87 | 16 | 2 | 16 | 19 | ||||||||||||||
Total commercial business loans | 87 | 16 | 2 | 16 | 19 | ||||||||||||||
Total recoveries | 1,093 | 1,199 | 894 | 853 | 980 | ||||||||||||||
Net (recoveries) charge-offs | (26 | ) | 555 | 802 | 1,776 | 2,560 | |||||||||||||
Additions charged to operations | 2,400 | 2,250 | 1,800 | 2,170 | 2,913 | ||||||||||||||
Balance at end of year | $ | 10,211 | $ | 7,785 | $ | 6,090 | $ | 5,092 | $ | 4,698 | |||||||||
Net (recoveries) charge-offs to average loans outstanding | — | % | 0.11 | % | 0.24 | % | 0.63 | % | 1.03 | % | |||||||||
Net (recoveries) charge-offs to average non- performing assets | (3.00 | )% | 76.55 | % | 44.04 | % | 48.84 | % | 46.72 | % | |||||||||
Allowance as a percentage of non-performing loans | 1,416.23 | % | 765.49 | % | 1,406.47 | % | 462.49 | % | 246.48 | % | |||||||||
Allowance as a percentage of gross loans receivable (end of year) | 1.69 | % | 1.52 | % | 1.54 | % | 1.77 | % | 1.68 | % | |||||||||
19
While management believes that the estimates and assumptions used in its determination of the adequacy of the allowance for loan losses are reasonable, there can be no assurance that such estimates and assumptions will not be proven incorrect in the future, or that the actual amount of future provisions will not exceed the amount of past provisions or that any increased provisions that may be required will not adversely impact the Company’s financial condition and results of operations. In addition, the determination of the amount of the Bank’s allowance for loan losses is subject to review by bank regulators as part of the routine examination process, which may result in the adjustment of reserves based upon their judgment of information available to them at the time of their examination.
Investment Activities
General. Under Washington law, savings banks are permitted to invest in various types of liquid assets, including U.S. Treasury obligations, securities of various federal agencies, certain certificates of deposit of insured banks and savings institutions, banker’s acceptances, repurchase agreements, federal funds (“Fed Funds”), commercial paper, investment grade corporate debt securities, and obligations of states and their political subdivisions.
The Chief Financial Officer has the responsibility for the management of the Company’s investment portfolio, subject to consultation with the Chief Executive Officer, and the direction and guidance of the Board of Directors. Various factors are considered when making investment decisions, including the marketability, maturity and tax consequences of the proposed investment. The maturity structure of investments will be affected by various market conditions, including the current and anticipated slope of the yield curve, the level of interest rates, the trend of new deposit inflows, and the anticipated demand for funds via deposit withdrawals and loan originations and purchases.
The general objectives of the Company’s investment portfolio will be to provide liquidity when loan demand is high, to assist in maintaining earnings when loan demand is low and to maximize earnings while satisfactorily managing risk, including credit risk, reinvestment risk, liquidity risk and interest rate risk. See Item 7, “Management’s Discussion and Analysis of Financial Condition and Results of Operations - Asset and Liability Management and Market Risk” of this Form 10-K.
As a member of the FHLB of Des Moines, the Bank had $2.7 million in stock at December 31, 2016. For the year ended December 31, 2016, the Bank received $50,000 in dividends from the FHLB of Des Moines.
The table below sets forth information regarding the composition of the securities portfolio and other investments at the dates indicated. At December 31, 2016, the securities portfolio did not contain securities of any issuer with an aggregate book value in excess of 10% of equity capital, excluding those issued by the United States Government or its agencies.
December 31, | |||||||||||||||||||||||
(In thousands) | 2016 | 2015 | 2014 | ||||||||||||||||||||
Securities available-for-sale | Amortized Cost | Fair Value | Amortized Cost | Fair Value | Amortized Cost | Fair Value | |||||||||||||||||
U.S. agency securities | $ | 8,150 | $ | 8,068 | $ | 6,134 | $ | 6,035 | $ | 5,998 | $ | 5,845 | |||||||||||
Corporate securities | 7,654 | 7,500 | 3,495 | 3,433 | 4,495 | 4,437 | |||||||||||||||||
Municipal bonds | 15,183 | 15,264 | 18,531 | 18,891 | 15,886 | 16,161 | |||||||||||||||||
Mortgage-backed securities | 45,856 | 45,195 | 22,926 | 22,835 | 20,169 | 20,244 | |||||||||||||||||
U.S. Small Business Administration securities | 5,862 | 5,848 | 4,011 | 4,023 | 2,019 | 2,057 | |||||||||||||||||
Total securities available-for-sale | $ | 82,705 | $ | 81,875 | $ | 55,097 | $ | 55,217 | $ | 48,567 | $ | 48,744 | |||||||||||
20
The composition and contractual maturities of the investment portfolio at December 31 2016, excluding FHLB stock, are indicated in the following table. The yields on municipal bonds have not been computed on a tax equivalent basis.
December 31, 2016 | ||||||||||||||||||||||||||||||||||||||
(Dollars in thousands) | 1 year or less | Over 1 year to 5 years | Over 5 to 10 years | Over 10 years | Total Securities | |||||||||||||||||||||||||||||||||
Securities available-for-sale | Amortized Cost | Weighted Average Yield | Amortized Cost | Weighted Average Yield | Amortized Cost | Weighted Average Yield | Amortized Cost | Weighted Average Yield | Amortized Cost | Weighted Average Yield | Fair Value | |||||||||||||||||||||||||||
U.S. agency securities | $ | — | — | % | $ | 4,000 | 1.60 | % | $ | 4,150 | 2.33 | % | $ | — | — | % | $ | 8,150 | 1.97 | % | $ | 8,068 | ||||||||||||||||
Corporate securities | — | — | 5,659 | 2.09 | 1,995 | 1.88 | — | — | 7,654 | 2.04 | 7,500 | |||||||||||||||||||||||||||
Municipal bonds | 509 | 1.95 | 5,326 | 2.21 | 7,476 | 2.17 | 1,872 | 2.81 | 15,183 | 2.26 | 15,264 | |||||||||||||||||||||||||||
Mortgage-backed securities | — | — | — | — | 7,754 | 2.39 | 38,102 | 2.10 | 45,856 | 2.15 | 45,195 | |||||||||||||||||||||||||||
U.S. Small Business Administration securities | — | — | — | — | 5,862 | 2.60 | — | — | 5,862 | 2.60 | 5,848 | |||||||||||||||||||||||||||
Total securities available-for-sale | $ | 509 | 1.95 | % | $ | 14,985 | 2.00 | % | $ | 27,237 | 2.33 | % | $ | 39,974 | 2.13 | % | $ | 82,705 | 2.17 | % | $ | 81,875 | ||||||||||||||||
21
Deposit Activities and Other Sources of Funds
General. Deposits, borrowings, and loan repayments are the major sources of funds for lending and other investment purposes. Scheduled loan repayments are a relatively stable source of funds, while deposit inflows and outflows and loan prepayments are influenced significantly by general interest rates and market conditions. Borrowings from the FHLB of Des Moines are used to supplement the availability of funds from other sources and also as a source of term funds to assist in the management of interest rate risk.
The Company’s deposit composition reflects a mixture with certificates of deposit accounting for 27.5% of the total deposits at December 31, 2016, and interest and noninterest-bearing checking, savings and money market accounts comprising the balance of total deposits. The Company relies on marketing activities, convenience, customer service and the availability of a broad range of deposit products and services to attract and retain customer deposits. The Company also had $47.1 million of brokered deposits, or 6.6% of total deposits at December 31, 2016, with original terms averaging four years which were used to manage interest rate risk.
Deposits. Deposits are attracted from within the market area through the offering of a broad selection of deposit instruments, including checking accounts, money market deposit accounts, savings accounts and certificates of deposit with a variety of rates. Deposit account terms vary according to the minimum balance required, the time periods the funds must remain on deposit and the interest rate, among other factors. In determining the terms of the Company’s deposit accounts, the Company considers the development of long term profitable customer relationships, current market interest rates, current maturity structure and deposit mix, customer preferences and the profitability of acquiring customer deposits compared to alternative sources.
The following table sets forth total deposit activities for the years indicated.
Years Ended December 31, | |||||||||||
(Dollars in thousands) | 2016 | 2015 | 2014 | ||||||||
Beginning balance | $ | 485,178 | $ | 420,444 | $ | 336,876 | |||||
Net deposits before interest credited | 224,161 | (1) | 61,505 | 81,134 | |||||||
Interest credited | 3,254 | 3,229 | 2,434 | ||||||||
Ending balance | $ | 712,593 | $ | 485,178 | $ | 420,444 | |||||
Net increase in deposits | $ | 227,415 | $ | 64,734 | $ | 83,568 | |||||
Percent increase | 46.87 | % | 15.40 | % | 24.81 | % | |||||
(1) On January 22, 2016, the Company completed the previously announced Branch Purchase from Bank of America, N.A and acquired approximately $186.4 million in deposits. At December 31, 2016 approximately $162.2 million of the acquired deposits remained with the Bank. These branches attracted new deposits with an aggregated total of $195.5 million including public funds for the year ended December 31, 2016.
22
The following table sets forth the dollar amount of savings deposits in the various types of deposit programs the Company offered at the dates indicated.
December 31, | |||||||||||||
(Dollars in thousands) | 2016 | 2015 | |||||||||||
Transactions and Savings Deposits | Amount | Percent of Total | Amount | Percent of Total | |||||||||
Noninterest-bearing checking | $ | 143,236 | 20.10 | % | $ | 66,676 | 13.74 | % | |||||
Interest-bearing checking | 66,119 | 9.28 | 34,098 | 7.03 | |||||||||
Savings | 54,995 | 7.71 | 30,126 | 6.21 | |||||||||
Money market | 242,849 | 34.08 | 159,605 | 32.89 | |||||||||
Escrow accounts related to mortgages serviced | 9,677 | 1.36 | 5,571 | 1.15 | |||||||||
Total transaction and savings deposits | 516,876 | 72.53 | 296,076 | 61.02 | |||||||||
Certificates | |||||||||||||
0.00 - 1.99% | 192,665 | 27.04 | 188,586 | 38.87 | |||||||||
2.00 - 3.99% | 2,973 | 0.42 | 516 | 0.11 | |||||||||
8.00 | 79 | 0.01 | — | — | |||||||||
Total certificates | 195,717 | 27.47 | 189,102 | 38.98 | |||||||||
Total deposits | $ | 712,593 | 100.00 | % | $ | 485,178 | 100.00 | % | |||||
The following table sets forth the rate and maturity information of time deposit certificates at December 31, 2016.
Rate | ||||||||||||||||||
(Dollars in thousands) | 0.00- 1.99% | 2.00- 3.99% | 8.00% | Total | Percent of Total | |||||||||||||
Certificate accounts maturing in quarter ending: | ||||||||||||||||||
March 31, 2017 | $ | 16,065 | $ | 1,566 | $ | — | $ | 17,631 | 9.01 | % | ||||||||
June 30, 2017 | 31,687 | 603 | 15 | $ | 32,305 | 16.51 | ||||||||||||
September 30, 2017 | 13,750 | 128 | — | $ | 13,878 | 7.09 | ||||||||||||
December 31, 2017 | 20,043 | — | — | $ | 20,043 | 10.24 | ||||||||||||
March 31, 2018 | 23,570 | 7 | — | $ | 23,577 | 12.05 | ||||||||||||
June 30, 2018 | 14,524 | — | — | $ | 14,524 | 7.42 | ||||||||||||
September 30, 2018 | 5,568 | 455 | — | $ | 6,023 | 3.08 | ||||||||||||
December 31, 2018 | 14,247 | — | 64 | $ | 14,311 | 7.31 | ||||||||||||
March 31, 2019 | 8,825 | — | — | $ | 8,825 | 4.51 | ||||||||||||
June 30, 2019 | 5,181 | — | — | $ | 5,181 | 2.65 | ||||||||||||
September 30, 2019 | 4,651 | — | — | $ | 4,651 | 2.37 | ||||||||||||
December 31, 2019 | 4,143 | 17 | — | $ | 4,160 | 2.12 | ||||||||||||
Thereafter | 30,411 | 197 | — | $ | 30,608 | 15.64 | ||||||||||||
Total | $ | 192,665 | $ | 2,973 | $ | 79 | $ | 195,717 | 100.00 | % | ||||||||
Percent of total | 98.44 | % | 1.52 | % | 0.04 | % | 100.00 | % | ||||||||||
23
The following table indicates the amount of jumbo certificates of deposit by time remaining until maturity at December 31, 2016. Jumbo certificates of deposit are certificates in amounts of $100,000 or more.
Maturity | |||||||||||||||||||
(In thousands) | 3 Months or Less | Over 3 to 6 Months | Over 6 to 12 Months | Over 12 Months | Total | ||||||||||||||
Certificates of deposit of less than $100,000(1) | $ | 10,511 | $ | 13,240 | $ | 17,043 | $ | 52,997 | $ | 93,791 | |||||||||
Certificates of deposit of $100,000 through $250,000 | 3,815 | 15,940 | 14,362 | 40,715 | 74,832 | ||||||||||||||
Certificates of deposit of $250,000 and over | 3,305 | 3,125 | 2,516 | 18,148 | 27,094 | ||||||||||||||
Total certificates of deposit | $ | 17,631 | $ | 32,305 | $ | 33,921 | $ | 111,860 | $ | 195,717 | |||||||||
The Federal Reserve requires the Bank to maintain reserves on transaction accounts or non-personal time deposits. These reserves may be in the form of cash or noninterest-bearing deposits with the Federal Reserve Bank of San Francisco (“Federal Reserve Bank”). Negotiable order of withdrawal (“NOW”) accounts and other types of accounts that permit payments or transfers to third parties fall within the definition of transaction accounts and are subject to the reserve requirements, as are any non-personal time deposits at a savings bank. As of December 31, 2016, the Bank’s deposit with the Federal Reserve Bank and vault cash exceeded the reserve requirements.
Debt. Although customer deposits are the primary source of funds for lending and investment activities, the Company uses various borrowings such as advances and warehouse lines of credit from the FHLB of Des Moines, and to a lesser extent Fed Funds purchased to supplement the supply of lendable funds, to meet short-term deposit withdrawal requirements and also to provide longer term funding to better match the duration of selected loan and investment maturities.
As one of the Company’s capital management strategies, the Company has used advances from the FHLB of Des Moines to fund loan originations in order to increase net interest income. Depending upon the retail banking activity, the Company will consider and may undertake additional leverage strategies within applicable regulatory requirements or restrictions. These borrowings would be expected to primarily consist of FHLB of Des Moines advances.
As a member of the FHLB of Des Moines, the Bank is required to own capital stock in the FHLB of Des Moines and authorized to apply for advances on the security of that stock and certain mortgage loans and other assets (principally securities which are obligations of, or guaranteed by, the U.S. Government) provided certain creditworthiness standards have been met. Advances are individually made under various terms pursuant to several different credit programs, each with its own interest rate and range of maturities. Depending on the program, limitations on the amount of advances are based on the financial condition of the member institution and the adequacy of collateral pledged to secure the credit. The Bank maintains a committed credit facility with the FHLB of Des Moines that provides for immediately available advances up to an aggregate of $191.1 million. At December 31, 2016, outstanding advances from the FHLB of Des Moines totaled $12.7 million. At December 31, 2016, the Bank had $85.9 million additional short-term borrowing capacity with the Federal Reserve Bank. The Bank also had an aggregate of $40.0 million in unsecured Fed Funds lines of credit with other large financial institutions of which none was outstanding at December 31, 2016.
In addition, on October 15, 2015 (the “Closing Date”), FS Bancorp, Inc. closed on a third-party loan commitment by the issuance of an unsecured subordinated term note in the aggregate principal amount of $10.0 million due October 1, 2025 (the “Subordinated Note”). The Subordinated Note bears interest at an annual interest rate of 6.50%, payable by the Company quarterly in arrears on January 1, April 1, July 1 and October 1 of each year, commencing on the first such date following the Closing Date and on the maturity date. The Subordinated Note will mature on October 1, 2025 but may be prepaid at the Company’s option and with regulatory approval at any time on or after five years after the Closing Date or at any time upon certain events, such as a change in the regulatory capital treatment of the Subordinated Note or the interest on the Subordinated Note no longer being deductible by the Company for United States federal income tax purposes. The Company contributed $9.0 million of the proceeds from the Subordinated Note as additional capital to
24
the Bank in the fourth quarter of 2015. See Note 9 of the Notes to Consolidated Financial Statements included in Item 8, “Financial Statements and Supplementary Data” of this Form 10-K.
The following tables set forth information regarding both long- and short-term borrowings.
(Dollars in thousands) | Years Ended December 31, | ||||||||||
Maximum balance: | 2016 | 2015 | 2014 | ||||||||
Federal Home Loan Bank advances and Fed Funds | $ | 98,769 | $ | 98,769 | $ | 47,522 | |||||
Federal Reserve Bank | $ | 1,000 | $ | — | $ | 1,000 | |||||
Fed Funds lines of credit | $ | 6,000 | $ | 2,901 | $ | 3,450 | |||||
Warehouse lines of credit | $ | — | $ | 2,300 | $ | — | |||||
Subordinated note | $ | 10,000 | $ | 10,000 | $ | — | |||||
Average balances: | |||||||||||
Federal Home Loan Bank advances and Fed Funds | $ | 26,259 | $ | 38,393 | $ | 22,589 | |||||
Federal Reserve Bank | $ | 3 | $ | — | $ | 33 | |||||
Fed Funds lines of credit | $ | 16 | $ | 145 | $ | 72 | |||||
Warehouse lines of credit | $ | — | $ | 1,886 | $ | — | |||||
Subordinated note | $ | 10,000 | $ | 2,120 | $ | — | |||||
Weighted average interest rate: | |||||||||||
Federal Home Loan Bank advances and Fed Funds | 0.98 | % | 0.82 | % | 1.23 | % | |||||
Federal Reserve Bank | 1.00 | % | — | % | 0.75 | % | |||||
Fed Funds lines of credit | 0.77 | % | 0.42 | % | 0.25 | % | |||||
Warehouse lines of credit | — | % | 4.18 | % | — | % | |||||
Subordinated note | 6.82 | % | 6.79 | % | — | % | |||||
(Dollars in thousands) | At December 31, | ||||||||||
Balance outstanding at end of year: | 2016 | 2015 | 2014 | ||||||||
Federal Home Loan Bank advances | $ | 12,670 | $ | 98,769 | $ | 17,034 | |||||
Total borrowings | $ | 12,670 | $ | 98,769 | $ | 17,034 | |||||
Weighted average interest rate of: | |||||||||||
Federal Home Loan Bank advances, at end of year | 1.24 | % | 0.47 | % | 1.35 | % | |||||
Subsidiary and Other Activities
The Company has one active subsidiary, the Bank, and the Bank has one inactive subsidiary. The Bank had no capital investment in its inactive subsidiary as of December 31, 2016.
Competition
The Company faces strong competition in attracting deposits. Competition in originating real estate loans comes primarily from other savings institutions, commercial banks, credit unions, life insurance companies and mortgage bankers. Other savings institutions, commercial banks, credit unions and finance companies provide vigorous competition in consumer lending, including indirect lending. Commercial business competition is primarily from local commercial banks. The Company competes by delivering high-quality, personal service to customers that result in a high level of customer satisfaction.
25
The Company’s market areas have a high concentration of financial institutions, many of which are branches of large money centers and regional banks that have resulted from the consolidation of the banking industry in Washington and other western states. These include such large national lenders as Wells Fargo, Bank of America, Chase and others in the Company’s market area that have greater resources and offer services that the Bank does not provide. For example, the Bank does not offer trust services. Customers who seek “one-stop shopping” may be drawn to institutions that offer services that the Bank does not.
The Company attracts deposits through the branch office system. Competition for those deposits is principally from other savings institutions, commercial banks and credit unions located in the same community, as well as mutual funds and other alternative investments. The Bank competes for these deposits by offering superior service and a variety of deposit accounts at competitive rates. Based on the most recent branch deposit data provided by the FDIC, as of June 30, 2016, 1st Security Bank of Washington’s share of aggregate deposits in the market area consisting of the four counties where the Company has branches was less than one percent.
Employees
At December 31, 2016, the Company had 306 full-time equivalent employees. Company employees are not represented by any collective bargaining group. The Company considers employee relations to be good.
Set forth below is certain information regarding the executive officers of the Company and the Bank. There are no family relationships among or between the executive officers.
Executive Officers. The following table sets forth information with respect to the executive officers of the Company and the Bank.
Position | |||
Name | Age (1) | Company | Bank |
Joseph C. Adams | 57 | Director and Chief Executive Officer | Director and Chief Executive Officer |
Matthew D. Mullet | 38 | Chief Financial Officer, Treasurer and Secretary | Chief Financial Officer |
Robert B. Fuller | 57 | Chief Credit Officer | Chief Credit Officer |
Dennis V. O’Leary | 49 | — | Chief Lending Officer |
Drew B. Ness | 52 | — | Chief Operating Officer |
Donn C. Costa | 55 | — | Executive Vice President, Home Lending |
Debbie L. Steck | 57 | — | Executive Vice President, Home Lending Operations |
(1) | As of December 31, 2016. |
Joseph C. Adams, age 57, is a director and has been the Chief Executive Officer of 1st Security Bank of Washington since July 2004. He joined 1st Security Bank of Washington in April 2003 as its Chief Financial Officer, when the Bank was Washington’s Credit Union. Mr. Adams also served as Supervisory Committee Chairperson from 1993 to 1999. Mr. Adams is a lawyer having worked for Deloitte as a tax consultant, K&L Gates as a lawyer and then at Univar USA as a lawyer and Director, Regulatory Affairs. Mr. Adams received a Masters Degree equivalent from the Pacific Coast Banking School. Mr. Adams’ legal and accounting backgrounds, as well as his duties as Chief Executive Officer of 1st Security Bank of Washington, bring a special knowledge of the financial, economic and regulatory challenges faced by the Bank which makes him well suited to educate the Board on these matters.
26
Matthew D. Mullet, age 38, joined 1st Security Bank of Washington in July 2011 and was appointed Chief Financial Officer in September 2011. Mr. Mullet started his banking career in June 2000 as a financial examiner with the Washington State Department of Financial Institutions, Division of Banks, where he worked until October 2004. From October 2004 until August 2010, Mr. Mullet was employed at Golf Savings Bank, Mountlake Terrace, WA, where he served in several financial capacities, including as Chief Financial Officer from May 2007 until August 2010. In August 2010, Golf Savings Bank was merged with Sterling Savings Bank, where Mr. Mullet held the position as Senior Vice President of the Home Loan Division until resigning and commencing work at 1st Security Bank of Washington.
Robert B. Fuller, age 57, joined 1st Security Bank of Washington as Chief Credit Officer in September of 2013. Prior to his employment with the Bank, Mr. Fuller served as Chief Financial Officer/Chief Credit Officer for Blueprint Capital, REIT in 2013, Chief Credit Officer for Core Business Bank during 2012, and Plaza Bank during 2011, and in credit administration at Golf Savings Bank/Sterling Bank during 2009 and 2010. Mr. Fuller also served as Executive Vice President, Chief Operating Officer, and Chief Financial Officer for Golf Savings Bank from March 2001 to September 2006 and was a member of the integration team for the Golf sale to Sterling Savings Bank. Mr. Fuller started his banking career at US Bank of Washington’s mid-market production team and has over 30 years of banking experience.
Dennis V. O’Leary, age 49, joined 1st Security Bank of Washington as Senior Vice President - Consumer, Small Business and Construction Lending in August 2011 and currently holds the position of Chief Lending Officer. Prior to his employment with the Bank, Mr. O’Leary previously was employed by Sterling Savings Bank from July 2006 until August 2011 as Senior Vice President and Puget Sound Regional Director of the residential construction lending division. Sterling Savings Bank acquired Golf Savings Bank in 2006 where Mr. O’Leary had served as Executive Vice President, Commercial Real Estate Lending, having previously served in various senior lending positions at Golf Savings Bank since June 1985.
Drew B. Ness, age 52, joined 1st Security Bank of Washington as Chief Operating Officer in 2008. Mr. Ness has over 26 years of diverse banking experience, including retail branch sales and service, branch network and project management, and national customer service training. He served as Vice President and Manager of the Corporate Deposit Operations Department for Washington Federal, Seattle, Washington from February 2008 until August 2008, following its acquisition of First Mutual Bank. Mr. Ness served as Vice President and Administrative/Operations Manager of the Retail Banking Group at First Mutual Bank, Bellevue, Washington from 2004 through February 2008, and, prior to that, in various management positions for Bank of America in Seattle, Washington and Newport Beach, California.
Donn C. Costa, age 55, Executive Vice President, Home Lending, joined 1st Security Bank of Washington in October 2011 as Senior Vice President, Home Lending. He previously held the position of Executive Vice President at Sterling Savings Bank, Mountlake Terrace, Washington after the merger with Golf Savings Bank in August 2009, and held the position of Executive Vice President at Golf Savings Bank, Mountlake Terrace, Washington since 2006. With more than 25 years of home lending experience, Mr. Costa began as a loan officer at Lomas and Nettleton Mortgage Company in Mountlake Terrace in 1986.
Debbie L. Steck, age 57, Executive Vice President, Home Lending Operations, joined 1st Security Bank of Washington in September 2011. Prior to her employment at the Bank, she served as Chief Operating Officer and Vice President at Sterling Savings Bank after the merger with Golf Savings Bank in August 2009, and held that position with Golf Savings Bank for several years prior to that. Ms. Steck has over 30 years of experience in the mortgage industry. She currently serves on the Board of Directors for the Everett Gospel Mission.
HOW WE ARE REGULATED
The following is a brief description of certain laws and regulations applicable to FS Bancorp and 1st Security Bank of Washington. Descriptions of laws and regulations here and elsewhere in this Form 10-K do not purport to be complete and are qualified in their entirety by reference to the actual laws and regulations. Legislation is introduced from time to time in the United States Congress or in the Washington State Legislature that may affect the operations of FS Bancorp and 1st Security Bank of Washington. In addition, the regulations governing the Company and the Bank may be amended from time to time by the FDIC, DFI, Federal Reserve and the Consumer Financial Protection Bureau
27
(“CFPB”). Any such legislation or regulatory changes in the future could adversely affect our operations and financial condition. We cannot predict whether any such changes may occur.
The laws and regulations affecting banks and bank holding companies have changed significantly particularly in connection with the enactment of the Dodd-Frank Wall Street Reform and Consumer Protection Act (the “Dodd Frank Act”). Among other changes, the Dodd-Frank Act established the CFPB as an independent bureau of the Federal Reserve Board. The CFPB assumed responsibility for the implementation of the federal financial consumer protection and fair lending laws and regulations and has authority to impose new requirements. However, institutions of less than $10 billion in assets, such as 1st Security Bank of Washington, subject to consumer protection regulations issued by the CFPB, but as a smaller financial institution, 1st Security Bank of Washington is generally subject to supervision and enforcement by the FDIC and the DFI with respect to its compliance with consumer financial protection laws and CFPB regulations.
Many aspects of the Dodd-Frank Act are subject to rulemaking by the federal banking agencies, which has not been completed and in some instances will not take effect for some time, making it difficult to anticipate the overall financial impact of the Dodd-Frank Act on 1st Security Bank of Washington, FS Bancorp and the financial services industry more generally.
Regulation of 1st Security Bank of Washington
General. 1st Security Bank of Washington, as a state-chartered savings bank, is subject to applicable provisions of Washington law and to regulations and examinations of the DFI. As an insured institution, it also is subject to examination and regulation by the FDIC, which insures the deposits of 1st Security Bank of Washington to the maximum permitted by law. During these state or federal regulatory examinations, the examiners may require 1st Security Bank of Washington to provide for higher general or specific loan loss reserves, which can impact capital and earnings. This regulation of 1st Security Bank of Washington is intended for the protection of depositors and the Deposit Insurance Fund (“DIF”) of the FDIC and not for the purpose of protecting shareholders of 1st Security Bank of Washington or FS Bancorp. 1st Security Bank of Washington is required to maintain minimum levels of regulatory capital and is subject to some limitations on the payment of dividends to FS Bancorp. See below “Regulatory Capital Requirements” and “Restrictions on Dividends and Stock Repurchases.”
Federal and State Enforcement Authority and Actions. As part of its supervisory authority over Washington-chartered savings banks, the DFI may initiate enforcement proceedings to obtain a consent order to cease-and-desist against an institution believed to have engaged in unsafe and unsound practices or to have violated a law, regulation, or other regulatory limit, including a written agreement. The FDIC also has the authority to initiate enforcement actions against insured institutions for similar reasons and may terminate the deposit insurance if it determines that an institution has engaged in unsafe or unsound practices or is in an unsafe or unsound condition. Both these agencies may utilize less formal supervisory tools to address their concerns about the condition, operations or compliance status of a savings bank.
Regulation by the Washington State Department of Financial Institutions. State law and regulations govern 1st Security Bank of Washington’s ability to take deposits and pay interest, to make loans on or invest in residential and other real estate, to make consumer loans, to invest in securities, to offer various banking services to its customers, and to establish branch offices. As a state savings bank, 1st Security Bank of Washington must pay semi-annual assessments, examination costs and certain other charges to the DFI.
Washington law generally provides the same powers for Washington savings banks as federally and other-state chartered savings institutions and banks with branches in Washington, subject to the approval of the DFI. Washington law allows Washington savings banks to charge the maximum interest rates on loans and other extensions of credit to Washington residents which are allowable for a national bank in another state if higher than Washington limits. In addition, the DFI may approve applications by Washington savings banks to engage in an otherwise unauthorized activity, if the DFI determines that the activity is closely related to banking, and 1st Security Bank of Washington is otherwise qualified under the statute. This additional authority, however, is subject to review and approval by the FDIC if the activity is not permissible for national banks.
Insurance of Accounts and Regulation by the FDIC. The DIF of the FDIC insures deposit accounts in 1st Security Bank of Washington up to $250,000 per separately insured depositor. As insurer, the FDIC imposes deposit insurance premiums and is authorized to conduct examinations of and to require reporting by FDIC-insured institutions.
28
The Bank’s deposit insurance premiums for the year ended December 31, 2016, were $487,000. Those premiums have been reduced in recent years due to management’s focus on asset quality, risk management, and growing capital levels.
The Dodd-Frank Act requires the FDIC’s deposit insurance assessments to be based on assets instead of deposits. The FDIC has issued rules which specify that the assessment base for a bank is equal to its total average consolidated assets less average tangible capital. The FDIC assessment rates range from approximately five basis points to 35 basis points, depending on applicable adjustments for unsecured debt issued by an institution and brokered deposits (and to further adjustment for institutions that hold unsecured debt of other FDIC-insured institutions), until such time as the FDIC’s reserve ratio equals 1.15%. Once the FDIC’s reserve ratio reaches 1.15% and the reserve ratio for the immediately prior assessment period is less than 2.0%, the applicable assessment rates may range from three basis points to 30 basis points (subject to adjustments as described above). If the reserve ratio for the prior assessment period is equal to, or greater than 2.0% and less than 2.5%, the assessment rates may range from two basis points to 28 basis points and if the reserve ratio for the prior assessment period is greater than 2.5%, the assessment rates may range from one basis point to 25 basis points (in each case subject to adjustments as described above). No institution may pay a dividend if it is in default on its federal deposit insurance assessment.
The FDIC conducts examinations of and requires reporting by state non-member banks, such as 1st Security Bank of Washington. The FDIC also may prohibit any insured institution from engaging in any activity determined by regulation or order to pose a serious risk to the DIF.
In addition to the assessment for deposit insurance, institutions are required to make payments on bonds issued in the late 1980s by the Financing Corporation to recapitalize a predecessor deposit insurance fund. These assessments, which may be revised based upon the level of DIF deposits, will continue until the bonds mature from 2017 through 2019. This payment is established quarterly and is an annual rate of 7.47 basis points of assessable assets for December 31, 2016. The Financing Corporation was chartered in 1987 solely for the purpose of functioning as a vehicle for the recapitalization of the deposit insurance system.
The FDIC may terminate the deposit insurance of any insured depository institution, including 1st Security Bank of Washington, if it determines after a hearing that the institution has engaged or is engaging in unsafe or unsound practices, is in an unsafe or unsound condition to continue operations, or has violated any applicable law, regulation, order or any condition imposed by an agreement with the FDIC. It also may suspend deposit insurance temporarily during the hearing process for the permanent termination of insurance, if the institution has no tangible capital. If insurance of accounts is terminated, the accounts at the institution at the time of the termination, less subsequent withdrawals, shall continue to be insured for a period of six months to two years, as determined by the FDIC. Management is aware of no existing circumstances which would result in termination of 1st Security Bank of Washington’s deposit insurance.
A significant increase in insurance premiums would likely have an adverse effect on the operating expenses and results of operations of 1st Security Bank of Washington. There can be no prediction as to what changes in insurance assessment rates may be made in the future.
Prompt Corrective Action. Federal statutes establish a supervisory framework for FDIC-insured institutions based on five capital categories: well capitalized, adequately capitalized, undercapitalized, significantly undercapitalized and critically undercapitalized. An institution’s category depends upon where its capital levels are in relation to relevant capital measures, which include a risk-based capital measure, a leverage ratio capital measure and certain other factors. The well capitalized category is described below in “Capital Requirements”. An institution that is not well capitalized is subject to certain restrictions on brokered deposits, including restrictions on the rates it can offer on its deposits generally. Any institution which is neither well capitalized nor adequately capitalized is considered undercapitalized.
Undercapitalized institutions are subject to certain prompt corrective action requirements, regulatory controls and restrictions which become more extensive as an institution becomes more severely undercapitalized. Failure by 1st Security Bank of Washington to comply with applicable capital requirements would, if unremedied, result in progressively more severe restrictions on its activities and lead to enforcement actions, including, but not limited to, the issuance of a capital directive to ensure the maintenance of required capital levels and, ultimately, the appointment of the FDIC as receiver or conservator. Banking regulators will take prompt corrective action with respect to depository institutions that do not meet minimum capital requirements. Additionally, approval of any regulatory application filed for their review may be dependent on compliance with capital requirements.
29
At December 31, 2016, 1st Security Bank of Washington was categorized as well capitalized under the prompt corrective action regulations of the FDIC. For additional information, see “Capital Requirements” below and Note 14 of the Notes to Consolidated Financial Statements included in Item 8, “Financial Statements and Supplementary Data,” of this Form 10-K.
Capital Requirements. Effective January 1, 2015 (with some changes transitioned into full effectiveness over two to four years), 1st Security Bank of Washington became subject to new capital regulations adopted by the Federal Reserve and the FDIC, which created a new required ratio for common equity Tier 1 (“CET1”) capital, increased the minimum leverage and Tier 1 capital ratios, changed the risk-weightings of certain assets for purposes of the risk-based capital ratios, created an additional capital conservation buffer over the required capital ratios, and changed what qualifies as capital for purposes of meeting the capital requirements. These regulations implement the regulatory capital reforms required by the Dodd Frank Act and the “Basel III” requirements.
Under the new capital regulations, the minimum capital ratios applicable to FS Bancorp and 1st Security Bank of Washington are: (1) a CET1 capital ratio of 4.5% of risk-weighted assets; (2) a Tier 1 capital ratio of 6.0% of risk-weighted assets; (3) a total risk-based capital ratio of 8.0% of risk-weighted assets; and (4) a leverage ratio (the ratio of Tier 1 capital to average total adjusted assets) of 4.0%. CET1 generally consists of common stock; retained earnings; accumulated other comprehensive income (“AOCI”) unless an institution elects to exclude AOCI from regulatory capital; and certain minority interests; all subject to applicable regulatory adjustments and deductions. Tier 1 capital generally consists of CET1 and noncumulative perpetual preferred stock. Tier 2 capital generally consists of other preferred stock and subordinated debt meeting certain conditions plus an amount of the allowance for loan and lease losses up to 1.25% of assets. Total capital is the sum of Tier 1 and Tier 2 capital.
In addition to the minimum capital requirements, a new capital conservation buffer must be maintained by 1st Security Bank of Washington which consists of additional CET1 capital greater than 2.5% of risk-weighted assets above the required minimum levels in order to avoid limitations on paying dividends, repurchasing shares, and paying discretionary bonuses. The new capital conservation buffer requirement was phased in beginning on January 1, 2016 when a buffer greater than 0.625% of risk-weighted assets was required. The capital conservation buffer will increase each year until the capital conservation buffer requirement is fully phased in on January 1, 2019.
To be considered well capitalized, a depository institution must have a Tier 1 risk-based capital ratio of at least 8.00%, a total risk-based capital ratio of at least 10%, a CET1 capital ratio of at least 6.50% and a leverage ratio of at least 5.00% and not be subject to an individualized order, directive or agreement under which its primary federal banking regulator requires it to maintain a specific capital level.
At December 31, 2016, 1st Security Bank of Washington met the requirements to be well capitalized and met the fully phased-in capital conservation buffer requirement. Management monitors the capital levels of the Bank to provide for current and future business opportunities and to meet regulatory guidelines for well capitalized institutions. The Bank’s actual capital ratios at December 31, 2016 and 2015 are presented in the following tables:
Actual | For Capital Adequacy Purposes | To be Well Capitalized Under Prompt Corrective Action Provisions Ratio | ||||||
As of December 31, 2016 | Ratio | Ratio | ||||||
Total risk-based capital | ||||||||
(to risk-weighted assets) | 13.87 | % | 8.00 | % | 10.00 | % | ||
Tier 1 risk-based capital | ||||||||
(to risk-weighted assets) | 12.62 | % | 6.00 | % | 8.00 | % | ||
Tier 1 leverage capital | ||||||||
(to average assets) | 10.33 | % | 4.00 | % | 5.00 | % | ||
CET1 capital | ||||||||
(to risk-weighted assets) | 12.62 | % | 4.50 | % | 6.50 | % | ||
30
Actual | For Capital Adequacy Purposes | To be Well Capitalized Under Prompt Corrective Action Provisions Ratio | ||||||
As of December 31, 2015 | Ratio | Ratio | ||||||
Total risk-based capital | ||||||||
(to risk-weighted assets) | 15.51 | % | 8.00 | % | 10.00 | % | ||
Tier 1 risk-based capital | ||||||||
(to risk-weighted assets) | 14.26 | % | 6.00 | % | 8.00 | % | ||
Tier 1 leverage capital | ||||||||
(to average assets) | 12.14 | % | 4.00 | % | 5.00 | % | ||
CET1 capital | ||||||||
(to risk-weighted assets) | 14.26 | % | 4.50 | % | 6.50 | % | ||
The FDIC also has authority to establish individual minimum capital requirements in appropriate cases upon a determination that an institution’s capital level is or may become inadequate in light of particular risks or circumstances. Management of 1st Security Bank of Washington believes that, under the current regulations, 1st Security Bank of Washington will continue to meet its minimum capital requirements in the foreseeable future.
For a complete description of the Bank’s required and actual capital levels on December 31, 2016, see Note 14 of the Notes to Consolidated Financial Statements included in Item 8, “Financial Statements and Supplementary Data,” of this Form 10-K.
Standards for Safety and Soundness. The federal banking regulatory agencies have prescribed, by regulation, guidelines for all insured depository institutions relating to internal controls, information systems and internal audit systems; loan documentation; credit underwriting; interest rate risk exposure; asset growth; asset quality; earnings; and compensation, fees and benefits. The guidelines set forth the safety and soundness standards that the federal banking agencies use to identify and address problems at insured depository institutions before capital becomes impaired. Each insured depository institution must implement a comprehensive written information security program that includes administrative, technical, and physical safeguards appropriate to the institution’s size and complexity and the nature and scope of its activities. The information security program must be designed to ensure the security and confidentiality of customer information, protect against any unanticipated threats or hazards to the security or integrity of such information, protect against unauthorized access to or use of such information that could result in substantial harm or inconvenience to any customer, and ensure the proper disposal of customer and consumer information. Each insured depository institution must also develop and implement a risk-based response program to address incidents of unauthorized access to customer information in customer information systems. If the FDIC determines that an institution fails to meet any of these guidelines, it may require an institution to submit to the FDIC an acceptable plan to achieve compliance.
Federal Home Loan Bank System. The FHLB of Des Moines is one of 11 regional FHLBs that administer the home financing credit function of savings institutions. The FHLBs are subject to the oversight of the Federal Housing Finance Agency and each FHLB serves as a reserve or central bank for its members within its assigned region. The FHLBs are funded primarily from proceeds derived from the sale of consolidated obligations of the FHLB System and makes loans or advances to members in accordance with policies and procedures established by the Board of Directors of the FHLB, which are subject to the oversight of the Federal Housing Finance Board. All advances from the FHLB are required to be fully secured by sufficient collateral as determined by the FHLB. In addition, all long-term advances are required to provide funds for residential home financing. See “Business - Deposit Activities and Other Sources of Funds - Debt.” At December 31, 2016, 1st Security Bank of Washington had $2.7 million in FHLB of Des Moines stock, which was in compliance with this requirement.
Other than as noted above, during the year ended December 31, 2016, the FHLB of Des Moines did not repurchase any of its membership stock from 1st Security Bank of Washington. The FHLB pays dividends quarterly, and 1st Security Bank of Washington received $50,000 in dividends during the year ended December 31, 2016.
31
The FHLBs continue to contribute to low- and moderately-priced housing programs through direct loans or interest subsidies on advances targeted for community investment and low- and moderate-income housing projects. These contributions have adversely affected the level of FHLB dividends paid and could continue to do so in the future. These contributions could also have an adverse effect on the value of FHLB stock in the future. A reduction in value of 1st Security Bank of Washington’s FHLB stock may result in a decrease in net income and possibly capital.
Activities and Investments of Insured State-Chartered Financial Institutions. Federal law generally limits the activities and equity investments of FDIC insured, state-chartered banks to those that are permissible for national banks. An insured state bank is not prohibited from, among other things, (1) acquiring or retaining a majority interest in a subsidiary, (2) investing as a limited partner in a partnership the sole purpose of which is direct or indirect investment in the acquisition, rehabilitation or new construction of a qualified housing project, provided that such limited partnership investments may not exceed 2% of the bank’s total assets, (3) acquiring up to 10% of the voting stock of a company that solely provides or reinsures directors’ and officers’ liability insurance coverage or bankers’ blanket bond group insurance coverage for insured depository institutions, and (4) acquiring or retaining the voting shares of a depository institution if certain requirements are met.
Dividends. Dividends from 1st Security Bank of Washington constitute a major source of funds for dividends in future periods that may be paid by FS Bancorp to shareholders. The amount of dividends payable by 1st Security Bank of Washington to FS Bancorp depends upon the Bank’s earnings and capital position, and is limited by federal and state laws, regulations and policies. According to Washington law, 1st Security Bank of Washington may not declare or pay a cash dividend on its capital stock if it would cause its net worth to be reduced below (1) the amount required for liquidation accounts or (2) the net worth requirements, if any, imposed by the Director of the DFI. Dividends on 1st Security Bank of Washington’s capital stock may not be paid in an aggregate amount greater than the aggregate retained earnings of 1st Security Bank of Washington, without the approval of the Director of the DFI. The Bank paid $1.4 million in dividends to the holding company in 2016.
The amount of dividends actually paid during any one period will be strongly affected by 1st Security Bank of Washington’s policy of maintaining a strong capital position. Federal law further provides that no insured depository institution may pay a cash dividend if it would cause the institution to be “undercapitalized,” as defined in the prompt corrective action regulations. Moreover, the federal bank regulatory agencies also have the general authority to limit the dividends paid by insured banks if such payments are deemed to constitute an unsafe and unsound practice.
Affiliate Transactions. FS Bancorp and 1st Security Bank of Washington are separate and distinct legal entities. FS Bancorp (and any non-bank subsidiary of FS Bancorp) is an affiliate of 1st Security Bank of Washington. Federal laws strictly limit the ability of banks to engage in certain transactions with their affiliates. Transactions deemed to be a “covered transaction” under Section 23A of the Federal Reserve Act and between a bank and an affiliate are limited to 10% of the bank subsidiary’s capital and surplus and, with respect to all affiliates, to an aggregate of 20% of the bank’s capital and surplus. Further, covered transactions that are loans and extensions of credit generally are required to be secured by eligible collateral in specified amounts. Federal law also requires that covered transactions and certain other transactions listed in Section 23B of the Federal Reserve Act between a bank and its affiliates be on terms as favorable to the bank as transactions with non-affiliates.
Community Reinvestment Act. 1st Security Bank of Washington is also subject to the provisions of the Community Reinvestment Act of 1977 (“CRA”), which requires the appropriate federal bank regulatory agency to assess a bank’s performance under the CRA in meeting the credit needs of the community serviced by the Bank, including low and moderate income neighborhoods. The regulatory agency’s assessment of a bank’s record is made available to the public. Further, a bank’s CRA performance rating must be considered in connection with a bank’s application to, among other things, establish a new branch office that will accept deposits, relocate an existing office or merge or consolidate with, or acquire the assets or assume the liabilities of, a federally regulated financial institution. 1st Security Bank of Washington received an “outstanding” rating during its most recent CRA examination.
Privacy Standards. The Gramm-Leach-Bliley Financial Services Modernization Act of 1999 (“GLBA”) modernized the financial services industry by establishing a comprehensive framework to permit affiliations among commercial banks, insurance companies, securities firms and other financial service providers. 1st Security Bank of Washington is subject to FDIC regulations implementing the privacy protection provisions of the GLBA. These regulations require 1st Security Bank of Washington to disclose its privacy policy, including informing consumers of its information sharing practices and informing consumers of its rights to opt out of certain practices.
32
Environmental Issues Associated with Real Estate Lending. The Comprehensive Environmental Response, Compensation and Liability Act (“CERCLA”) is a federal statute that generally imposes strict liability on, all prior and present “owners and operators” of sites containing hazardous waste. However, Congress asked to protect secured creditors by providing that the term “owner and operator” excludes a person whose ownership is limited to protecting its security interest in the site. Since the enactment of the CERCLA, this “secured creditor exemption” has been the subject of judicial interpretations which have left open the possibility that lenders could be liable for cleanup costs on contaminated property that they hold as collateral for a loan. To the extent that legal uncertainty exists in this area, all creditors, including 1st Security Bank of Washington, that have made loans secured by properties with potential hazardous waste contamination (such as petroleum contamination) could be subject to liability for cleanup costs, which costs often substantially exceed the value of the collateral property.
Federal Reserve System. The Federal Reserve Board requires that all depository institutions maintain reserves on transaction accounts or non-personal time deposits. These reserves may be in the form of cash or noninterest-bearing deposits with the regional Federal Reserve Bank. Negotiable order of withdrawal (“NOW”) accounts and other types of accounts that permit payments or transfers to third parties fall within the definition of transaction accounts and are subject to the reserve requirements, as are any non-personal time deposits at a savings bank. As of December 31, 2016, 1st Security Bank of Washington’s deposit with the Federal Reserve Bank and vault cash exceeded its reserve requirements.
Other Consumer Protection Laws and Regulations. The Dodd-Frank Act established the CFPB and empowered it to exercise broad regulatory, supervisory and enforcement authority with respect to both new and existing consumer financial protection laws. 1st Security Bank of Washington is subject to consumer protection regulations issued by the CFPB, but as financial institutions with assets of less than $10 billion, 1st Security Bank of Washington is generally subject to supervision and enforcement by the FDIC and the DFI with respect to our compliance with consumer financial protection laws and CFPB regulations.
1st Security Bank of Washington is subject to a broad array of federal and state consumer protection laws and regulations that govern almost every aspect of its business relationships with consumers. While the list set forth below is not exhaustive, these include the Truth-in-Lending Act, the Truth in Savings Act, the Electronic Fund Transfer Act, the Expedited Funds Availability Act, the Equal Credit Opportunity Act, the Fair Housing Act, the Real Estate Settlement Procedures Act, the Home Mortgage Disclosure Act, the Fair Credit Reporting Act, the Fair Debt Collection Practices Act, the Right to Financial Privacy Act, the Home Ownership and Equity Protection Act, the Consumer Leasing Act, the Fair Credit Billing Act, the Homeowners Protection Act, the Check Clearing for the 21st Century Act, laws governing flood insurance, laws governing consumer protections in connection with the sale of insurance, federal and state laws prohibiting unfair and deceptive business practices, and various regulations that implement some or all of the foregoing. These laws and regulations mandate certain disclosure requirements and regulate the manner in which financial institutions must deal with customers when taking deposits, making loans, collecting loans, and providing other services. Failure to comply with these laws and regulations can subject 1st Security Bank of Washington to various penalties, including but not limited to, enforcement actions, injunctions, fines, civil liability, criminal penalties, punitive damages, and the loss of certain contractual rights.
Regulation and Supervision of FS Bancorp
General. FS Bancorp is a bank holding company registered with the Federal Reserve and is the sole shareholder of 1st Security Bank of Washington. Bank holding companies are subject to comprehensive regulation by the Federal Reserve under the Bank Holding Company Act of 1956, as amended (“BHCA”), and the regulations promulgated there under. This regulation and oversight is generally intended to ensure that FS Bancorp limits its activities to those allowed by law and that it operates in a safe and sound manner without endangering the financial health of 1st Security Bank of Washington.
As a bank holding company, FS Bancorp is required to file quarterly and annual reports with the Federal Reserve and any additional information required by the Federal Reserve and is subject to regular examinations by the Federal Reserve. The Federal Reserve also has extensive enforcement authority over bank holding companies, including the ability to assess civil money penalties, to issue cease and desist or removal orders and to require that a holding company divest subsidiaries (including its bank subsidiaries). In general, enforcement actions may be initiated for violations of law and regulations and unsafe or unsound practices.
33
The Bank Holding Company Act. Under the BHCA, FS Bancorp is supervised by the Federal Reserve. The Federal Reserve has a policy that a bank holding company is required to serve as a source of financial and managerial strength to its subsidiary banks and may not conduct its operations in an unsafe or unsound manner. In addition, the Dodd-Frank Act and earlier Federal Reserve policy provide that a bank holding company should serve as a source of strength to its subsidiary banks by having the ability to provide financial assistance to its subsidiary banks during periods of financial stress to the bank. A bank holding company’s failure to meet its obligation to serve as a source of strength to its subsidiary banks will generally be considered by the Federal Reserve to be an unsafe and unsound banking practice or a violation of the Federal Reserve’s regulations or both. No regulations have yet been proposed by the Federal Reserve to implement the source of strength doctrine required by the Dodd-Frank Act. FS Bancorp and any subsidiaries that it may control are considered “affiliates” within the meaning of the Federal Reserve Act, and transactions between 1st Security Bank of Washington and affiliates are subject to numerous restrictions. With some exceptions, FS Bancorp and its subsidiaries are prohibited from tying the provision of various services, such as extensions of credit, to other services offered by FS Bancorp or by its affiliates.
Acquisitions. The BHCA prohibits a bank holding company, with certain exceptions, from acquiring ownership or control of more than 5% of the voting shares of any company that is not a bank or bank holding company and from engaging in activities other than those of banking, managing or controlling banks, or providing services for its subsidiaries. Under the BHCA, the FRB may approve the ownership of shares by a bank holding company in any company, the activities of which the FRB has determined to be so closely related to the business of banking or managing or controlling banks as to be a proper incident thereto. These activities include: operating a savings institution, mortgage company, finance company, credit card company or factoring company; performing certain data processing operations; providing certain investment and financial advice; underwriting and acting as an insurance agent for certain types of credit-related insurance; leasing property on a full-payout, non-operating basis; selling money orders, travelers' checks and U.S. Savings Bonds; real estate and personal property appraising; providing tax planning and preparation services; and, subject to certain limitations, providing securities brokerage services for customers.
Regulatory Capital Requirements. Bank holding companies like FS Bancorp are subject to capital adequacy requirements of the Federal Reserve under the BHCA and the regulations of the Federal Reserve. For a bank holding company with less than $1.0 billion in assets, the capital guidelines apply on a bank only basis, and the Federal Reserve expects the holding company’s subsidiary bank to be well capitalized under the prompt corrective action regulations. If FS Bancorp were subject to regulatory guidelines for bank holding companies with $1.0 billion or more in assets at December 31, 2016, FS Bancorp would have exceeded all regulatory requirements.
The Company’s regulatory capital amounts and ratios at December 31, 2016 are presented in the following table.
Actual | For Capital Adequacy Purposes | To be Well Capitalized Under Prompt Corrective Action Provisions | |||||||||||||||
Amount | Ratio | Amount | Ratio | Amount | Ratio | ||||||||||||
As of December 31, 2016 | |||||||||||||||||
Total risk-based capital | |||||||||||||||||
(to risk-weighted assets) | $ | 86,660 | 12.88 | % | $ | 53,813 | 8.00 | % | $ | 67,266 | 10.00 | % | |||||
Tier 1 risk-based capital | |||||||||||||||||
(to risk-weighted assets) | $ | 78,227 | 11.63 | % | $ | 40,360 | 6.00 | % | $ | 40,360 | 6.00 | % | |||||
Tier 1 leverage capital | |||||||||||||||||
(to average assets) | $ | 78,227 | 9.52 | % | $ | 32,883 | 4.00 | % | $ | 41,104 | 5.00 | % | |||||
CET1 capital | |||||||||||||||||
(to risk-weighted assets) | $ | 78,227 | 11.63 | % | $ | 30,270 | 4.50 | % | $ | 43,723 | 6.50 | % | |||||
For additional information, see Note 14 to the Consolidated Financial Statements contained in “Item 8. Financial Statements and Supplementary Data” of this Form 10-K.
Interstate Banking. The Federal Reserve must approve an application of a bank holding company to acquire control of, or acquire all or substantially all of the assets of, a bank located in a state other than the holding company’s
34
home state, without regard to whether the transaction is prohibited by the laws of any state. The Federal Reserve may not approve the acquisition of a bank that has not been in existence for the minimum time period, not exceeding five years, specified by the law of the host state. Nor may the Federal Reserve approve an application if the applicant controls or would control more than 10% of the insured deposits in the United States or 30% or more of the deposits in the target bank’s home state or in any state in which the target bank maintains a branch. Federal law does not affect the authority of states to limit the percentage of total insured deposits in the state that may be held or controlled by a bank holding company to the extent such limitation does not discriminate against out-of-state banks or bank holding companies. Individual states may also waive the 30% state-wide concentration limit contained in the federal law.
The federal banking agencies are authorized to approve interstate merger transactions without regard to whether the transaction is prohibited by the law of any state, unless the home state of one of the banks adopted a law prior to June 1, 1997, which applies equally to all out-of-state banks and expressly prohibits merger transactions involving out-of-state banks. Interstate acquisitions of branches will be permitted only if the law of the state in which the branch is located permits such acquisitions. Interstate mergers and branch acquisitions will also be subject to the nationwide and statewide insured deposit concentration amounts described above.
Restrictions on Dividends and Stock Repurchases. FS Bancorp’s ability to declare and pay dividends is subject to the Federal Reserve limits and Washington law, and it may depend on its ability to receive dividends received from 1st Security Bank of Washington.
Federal Reserve policy limits the payment of a cash dividend by a bank holding company if the holding company’s net income for the past year is not sufficient to cover both the cash dividend and a rate of earnings retention that is consistent with capital needs, asset quality and overall financial condition. A bank holding company that does not meet any applicable capital standard would not be able to pay any cash dividends under this policy. A bank holding company not subject to consolidated capital requirements is expected not to pay dividends unless its debt-to-equity ratio is less than 1:1, and it meets certain additional criteria. The Federal Reserve also has indicated that it would be inappropriate for a company experiencing serious financial problems to borrow funds to pay dividends.
Except for a company that meets the well capitalized standard for bank holding companies, is well managed, and is not subject to any unresolved supervisory issues, a bank holding company is required to give the Federal Reserve prior written notice of any purchase or redemption of its outstanding equity securities if the gross consideration for the purchase or redemption, when combined with the net consideration paid for all such purchases or redemptions during the preceding 12 months, is equal to 10% or more of the company’s consolidated net worth. The Federal Reserve may disapprove such a purchase or redemption if it determines that the proposal would constitute an unsafe or unsound practice or would violate any law, regulation or regulatory order, condition, or written agreement. A bank holding company is considered well capitalized if on a consolidated basis it has a total risk-based capital ratio of at least 10.0% and a Tier 1 risk-based capital ratio of 6.0% or more, and is not subject to an agreement, order, or directive to maintain a specific level for any capital measure.
Under Washington corporate law, FS Bancorp generally may not pay dividends if after that payment it would not be able to pay its liabilities as they become due in the usual course of business, or its total assets would be less than the sum of its total liabilities.
Federal Securities Law. The stock of FS Bancorp is registered with the SEC under the Securities Exchange Act of 1934, as amended. As a result, FS Bancorp is subject to the information, proxy solicitation, insider trading restrictions and other requirements under the Securities Exchange Act of 1934.
FS Bancorp stock held by persons who are affiliates of FS Bancorp may not be resold without registration unless sold in accordance with certain resale restrictions. Affiliates are generally considered to be officers, directors and principal shareholders. If FS Bancorp meets specified current public information requirements, each affiliate of FS Bancorp will be able to sell in the public market, without registration, a limited number of shares in any three-month period.
Sarbanes-Oxley Act of 2002. As a public company that files periodic reports with the SEC, under the Securities Exchange Act of 1934, FS Bancorp is subject to the Sarbanes-Oxley Act of 2002 (“Sarbanes-Oxley Act”), which addresses, among other issues, corporate governance, auditing and accounting, executive compensation and enhanced and timely disclosure of corporate information. The Sarbanes-Oxley Act represents significant federal involvement in matters traditionally left to state regulatory systems, such as the regulation of the accounting profession, and to state corporate law, such as the relationship between a board of directors and management and between a board of directors
35
and its committees. Our policies and procedures have been updated to comply with the requirements of the Sarbanes-Oxley Act.
The Dodd-Frank Act. On July 21, 2010, the Dodd-Frank Act was signed into law. The Dodd-Frank-Act imposed new restrictions and an expanded framework of regulatory oversight for financial institutions, including depository institutions and implements new capital regulations that FS Bancorp and 1st Security Bank of Washington have and will become subject to and that are discussed above under the section entitled “Regulation of 1st Security Bank of Washington - Capital Requirements.”
In addition, among other changes, the Dodd-Frank Act requires public companies, like FS Bancorp, to (i) provide their shareholders with a non-binding vote (a) at least once every three years on the compensation paid to executive officers and (b) at least once every six years on whether they should have a “say on pay” vote every one, two or three years; (ii) have a separate, non-binding shareholder vote regarding golden parachutes for named executive officers when a shareholder vote takes place on mergers, acquisitions, dispositions or other transactions that would trigger the parachute payments; (iii) provide disclosure in annual proxy materials concerning the relationship between the executive compensation paid and the financial performance of the issuer; and (iv) amend Item 402 of Regulation S-K to require companies to disclose the ratio of the Chief Executive Officer’s annual total compensation to the median annual total compensation of all other employees. For certain of these changes, the implementing regulations have not been promulgated, so the full impact of the Dodd-Frank Act on public companies cannot be determined at this time.
TAXATION
Federal Taxation
General. FS Bancorp and 1st Security Bank of Washington are subject to federal income taxation in the same general manner as other corporations, with some exceptions discussed below. The following discussion of federal taxation is intended only to summarize certain pertinent federal income tax matters and is not a comprehensive description of the tax rules applicable to FS Bancorp. 1st Security Bank of Washington is no longer subject to U.S. federal income tax examinations by tax authorities for years ended before 2013, and income tax returns have not been audited for the past five years, 2012 to 2016. See Note 11 of the Notes to Consolidated Financial Statements included in Item 8, “Financial Statements and Supplementary Data” of this Form 10-K.
FS Bancorp files a consolidated federal income tax return with 1st Security Bank of Washington. Accordingly, any cash distributions made by FS Bancorp to its shareholders would be considered to be taxable dividends and not as a non‑taxable return of capital to shareholders for federal and state tax purposes.
Method of Accounting. For federal income tax purposes, FS Bancorp currently reports its income and expenses on the accrual method of accounting and uses a fiscal year ending on December 31 for filing its federal income tax return.
Minimum Tax. The Internal Revenue Code imposes an alternative minimum tax at a rate of 20% on a base of regular taxable income plus certain tax preferences, called alternative minimum taxable income. The alternative minimum tax is payable to the extent such alternative minimum taxable income is in excess of an exemption amount. Net operating losses can offset no more than 90% of alternative minimum taxable income. Certain payments of alternative minimum tax may be used as credits against regular tax liabilities in future years.
Corporate Dividends‑Received Deduction. FS Bancorp may eliminate from its income dividends received from 1st Security Bank of Washington as a wholly owned subsidiary of FS Bancorp if it elects to file a consolidated return with 1st Security Bank of Washington. The corporate dividends-received deduction is 100%, or 80%, in the case of dividends received from corporations with which a corporate recipient does not file a consolidated tax return, depending on the level of stock ownership of the payor of the dividend. Corporations which own less than 20% of the stock of a corporation distributing a dividend may deduct 70% of dividends received or accrued on their behalf.
Washington Taxation
The Company and the Bank are subject to a business and occupation tax which is imposed under Washington law at the rate of 1.50% of gross receipts. Interest received on loans secured by mortgages or deeds of trust on residential
36
properties, residential mortgage-backed securities, and certain U.S. Government and agency securities are not subject to this tax.
Item 1A. Risk Factors
An investment in our common stock is subject to risks inherent in our business. Before making an investment decision, you should carefully consider the risks and uncertainties described below together with all of the other information included in this report and our other filings with the SEC. In addition to the risks and uncertainties described below, other risks and uncertainties not currently known to us or that we currently deem to be immaterial also may materially and adversely affect our business, financial condition, capital levels, cash flows, liquidity, results of operations and prospects. The market price of our common stock could decline significantly due to any of these identified or other risks, and you could lose some or all of your investment. The risks discussed below also include forward-looking statements, and our actual results may differ substantially from those discussed in these forward-looking statements. This report is qualified in its entirety by these risk factors.
Risks Related to Our Business
Our business may be adversely affected by downturns in the national economy and in the economies in our market areas.
Our primary market area is concentrated in the Puget Sound region of Washington. Our business is directly affected by market conditions, trends in industry and finance, legislative and regulatory changes, and changes in governmental monetary and fiscal policies and inflation, all of which are beyond our control. General economic conditions, including inflation, unemployment and money supply fluctuations, also may affect our profitability adversely. A decline in the economies of the counties in which we operate could have a material adverse effect on our business, financial condition, results of operations and prospects.
While real estate values and unemployment rates have recently improved, a deterioration in economic conditions in the market areas we serve could result in loan losses beyond that which is provided for in our allowance for loan losses and could result in the following consequences, any of which could have a material adverse effect on the business, financial condition and results of operations:
• | demand for our products and services may decline, possibly resulting in a decrease in our total loans or assets; |
• | loan delinquencies, problem assets and foreclosures may increase; |
• | we may increase our allowance for loan losses; |
• | collateral for our loans may further decline in value, in turn reducing customer’s borrowing power, reducing the value of assets and collateral associated with existing loans; |
• | the net worth and liquidity of loan guarantors may decline, impairing their ability to honor commitments to us; and |
• | the amount of our low-cost or noninterest-bearing deposits may decrease. |
A decline in local economic conditions may have a greater effect on our earnings and capital than on the earnings and capital of larger financial institutions whose real estate loan portfolios are geographically diverse. If we are required to liquidate a significant amount of collateral during a period of reduced real estate values, our financial condition and profitability could be adversely affected.
Our loan portfolio possesses increased risk due to a large percentage of consumer loans.
Our consumer loans accounted for $174.7 million, or 28.9% of our total gross loan portfolio as of December 31, 2016, of which $107.8 million (61.7% of total consumer loans) consisted of indirect home improvement loans (some of which were not secured by a lien on the real property), $36.5 million (20.9% of total consumer loans) consisted of solar loans, $28.5 million (16.3% of total consumer loans) consisted of marine loans secured by boats, $1.9 million
37
(1.1% of total consumer loans) consisted of other consumer loans, which includes personal lines of credit, automobile, direct home improvement, loans on deposit, and recreational loans. Generally, we consider these types of loans to involve a higher degree of risk compared to first mortgage loans on owner-occupied, one-to-four-family residential properties. As a result of our large portfolio of consumer loans, it may become necessary to increase the level of provision for our loan losses, which would reduce profits. Consumer loans generally entail greater risk than do one-to-four-family residential mortgage loans, particularly in the case of loans that are secured by rapidly depreciable assets, such as automobiles and boats. In these cases, any repossessed collateral for a defaulted loan may not provide an adequate source of repayment of the outstanding loan balance.
Most of our consumer loans are originated indirectly by or through third parties, which presents greater risk than our direct lending products which involves direct contact between us and the borrower. Unlike a direct loan where the borrower makes an application directly to us, in these loans the dealer, who has a direct financial interest in the loan transaction, assists the borrower in preparing the loan application. Although we disburse the loan proceeds directly to the dealer upon receipt of a “completion certificate” signed by the borrower, because we do not have direct contact with the borrower, these loans may be more susceptible to a material misstatement on the loan application or having the loan proceeds being misused by the borrower or the dealer. In addition, if the work is not properly performed, the borrower may cease payment on the loan until the problem is rectified.
Indirect home improvement and solar loans totaled $144.3 million, or 23.8% of our total gross loan portfolio at December 31, 2016, and are originated through a network of 115 home improvement contractors and dealers located in Washington, Oregon, Idaho, and California. At December 31, 2016, the Company had $36.2 million in loans to borrowers that reside in California. Adverse economic conditions in California, including an increase in the level of unemployment, or a decline in real estate values could adversely affect the ability of these borrowers to make loan payments to us.
In addition, we rely on four dealers for a majority (50.5%) of our loan volume so the loss of one of these dealers can have a significant effect on our loan origination volume. See Item 1, “Business - Lending Activities - Consumer Lending” and “- Asset Quality.”
Our business could suffer if we are unsuccessful in making, continuing and growing relationships with home improvement contractors and dealers.
Our indirect home improvement lending, which is the largest component of our loan portfolio, is reliant on our relationships with home improvement contractors and dealers. In particular, our indirect home improvement loan operations depend in large part upon our ability to establish and maintain relationships with reputable contractors and dealers who originate loans at the point of sale. Our indirect home improvement contractor/dealer network is currently comprised of 115 active contractors and dealers with businesses located throughout Washington, Oregon, Idaho, and California with approximately four contractors/dealers responsible for more than half of this loan volume. Indirect home improvement and solar loans totaled $144.3 million, or 23.8% of our total gross loan portfolio, at December 31, 2016, reflecting approximately 13,000 loans with an average balance of approximately $11,000.
We have relationships with home improvement contractors/dealers, however, the relationships generally are not exclusive, some of them are newly established and they may be terminated at any time. If there is another economic downturn and contraction of credit to both contractors/dealers and their customers, there could be an increase in business closures and our existing contractor/dealer base could experience decreased sales and loan volume, which may have an adverse effect on our business, results of operations and financial condition. In addition, if a competitor were to offer better service or more attractive loan products to our contractor/dealer partners, it is possible that our partners would terminate their relationships with us or recommend customers to our competitors. If we are unable to continue to grow our existing relationships and develop new relationships, our results of operations and financial condition could be adversely affected.
In the fourth quarter of 2012, we expanded consumer solar loan originations in California which enabled us to increase originations of consumer solar loans from $2.5 million at the beginning of 2013 to $94.6 million at the end of 2016. We have adopted limits on California lending to be no more than 100% of total risk-based capital. At December 31, 2016, the maximum level of California originated consumer solar loans was $93.3 million. At December 31, 2016, we held $36.2 million of these consumer solar loans to borrowers located in California.
38
A significant portion of our business involves commercial business and commercial real estate lending which is subject to various risks that could adversely impact our results of operations and financial condition.
At December 31, 2016, our loan portfolio included $192.1 million of commercial real estate, multi-family real estate loans, and commercial business loans, or 31.7% of our total gross loan portfolio, compared to $152.7 million, or 29.9%, at December 31, 2015. We have been increasing and intend to continue to increase, subject to market demand, the origination of commercial and multi-family real estate and commercial business loans. The credit risk related to these types of loans is considered to be greater than the risk related to one-to-four-family residential loans because the repayment of commercial and multi-family real estate loans and commercial business loans typically is dependent on the successful operation and income stream of the property securing the loan and/or the borrowers’ business and the value of the real estate securing the loan as collateral, which can be significantly affected by economic conditions.
Our renewed focus on these types of lending will increase the risk profile relative to traditional one-to-four-family lenders as we continue to implement our business strategy. Although commercial and multi-family real estate loans and commercial business loans are intended to enhance the average yield of the earning assets, they do involve a different, and possibly higher, level of risk of delinquency or collection than generally associated with one-to-four-family loans for a number of reasons. Among other factors, these loans involve larger balances to a single borrower or groups of related borrowers. Since commercial business, commercial real estate and multi-family real estate loans generally have large balances, if we make any errors in judgment in the collectability of these loans, we may need to significantly increase the provision for loan losses since any resulting charge‑offs will be larger on a per loan basis. Consequently, this could materially adversely affect our future earnings. Collateral evaluation and financial statement analysis in these types of loans also requires a more detailed analysis at the time of loan underwriting and on an ongoing basis. In addition, most of our commercial and multi-family loans are not fully amortizing and include balloon payments upon maturity. Balloon payments may require the borrower to either sell or refinance the underlying property in order to make the payment, which may increase the risk of default or non-payment. Finally, if foreclosure occurs on a commercial real estate loan, the holding period for the collateral, if any, typically is longer than for a one-to-four-family residence because the secondary market for most types of commercial and multi-family real estate is not readily liquid, so we have less opportunity to mitigate credit risk by selling part or all of our interest in these assets. See Item 1, “Business - Lending Activities - Commercial Real Estate Lending” of this Form 10-K.
We continue to expand residential construction lending which is subject to various risks that could adversely impact our results of operations and financial condition.
We make real estate construction loans to individuals and builders, primarily for the construction of residential properties. We originate these loans whether or not the collateral property underlying the loan is under contract for sale. At December 31, 2016, construction and development loans totaled $94.5 million, or 15.6 % of our total gross loan portfolio (excluding $57.0 million of undisbursed construction loan commitments), of which $61.4 million were for residential real estate projects. This compares to construction and development loans of $80.8 million, or 15.8% of our total loan portfolio at December 31, 2015, or an increase of 16.9% during the past year. Construction financing is generally considered to involve a higher degree of credit risk than longer-term financing on improved, owner-occupied real estate.
Construction and development lending contains the inherent difficulty in estimating both a property’s value at completion of the project and the estimated cost (including interest) of the project. Changes in the demand, such as for new housing and higher than anticipated building costs may cause actual results to vary significantly from those estimated. If the estimate of construction cost proves to be inaccurate, we may be required to advance funds beyond the amount originally committed to permit completion of the project. This type of lending also typically involves higher loan principal amounts and is often concentrated with a small number of builders. In addition, during the term of most of our construction loans, an interest reserve is created at origination and is added to the principal of the loan through the construction phase. If the estimate of value upon completion proves to be inaccurate, we may be confronted at, or prior to, the maturity of the loan with a project the value of which is insufficient to assure full repayment.
Because construction loans require active monitoring of the building process, including cost comparisons and on-site inspections, these loans are more difficult and costly to monitor. Increases in market rates of interest may have a more pronounced effect on construction loans by rapidly increasing the end-purchasers' borrowing costs, thereby reducing the overall demand for the project. Properties under construction are often difficult to sell and typically must
39
be completed in order to be successfully sold which also complicates the process of working out problem construction loans. This may require us to advance additional funds and/or contract with another builder to complete construction. Furthermore, speculative construction loans to a builder are often associated with homes that are not pre-sold, and thus pose a greater potential risk than construction loans to individuals on their personal residences as there is the added risk associated with identifying an end-purchaser for the finished project. At December 31, 2016, outstanding construction and development loans totaled $94.5 million of which $57.0 million was comprised of speculative one-to-four-family construction loans and $3.8 million of land acquisition and development loans. Total committed, including unfunded construction and development loans at December 31, 2016 was $154.3 million.
Loans on land under development or held for future construction pose additional risk because of the lack of income being produced by the property and the potential illiquid nature of the collateral. These risks can be significantly impacted by supply and demand. As a result, this type of lending often involves the disbursement of substantial funds with repayment dependent on the success of the ultimate project and the ability of the borrower to sell or lease the property, rather than the ability of the borrower or guarantor themselves to repay principal and interest. No real estate construction and development loans were non-performing at December 31, 2016. A material increase in our non-performing construction and development loans could have a material adverse effect on our financial condition and results of operation.
Our mortgage warehouse lending program is subject to various risks that could adversely impact our results of operations and financial condition.
In October 2009, we commenced a mortgage warehouse lending program. Our mortgage warehouse lending program focuses on six Pacific Northwest mortgage banking companies. Short term funding is provided to the mortgage banking companies for the purpose of originating residential mortgage loans for sale into the secondary market. Our warehouse lending lines are secured by the underlying notes associated with mortgage loans made to borrowers by the mortgage banking company and we generally require guarantees from the principle shareholder(s) of the mortgage banking company. These loans are repaid when the note is sold by the mortgage bank into the secondary market, with the proceeds from the sale used to pay down the outstanding loan before being dispersed to the mortgage bank. At December 31, 2016, we had approved warehouse lending lines in varying amounts from $3.0 million to $9.0 million with each of the six companies, for an aggregate amount of $35.0 million. During the year ended December 31, 2016, we processed approximately 1,000 loans and funded approximately $360.0 million under this program. Our mortgage warehouse related gross revenues totaled $682,000 for the year ended December 31, 2016. At December 31, 2016, there was $7.8 million in warehouse lines outstanding, compared to $5.4 million outstanding at December 31, 2015.
There are numerous risks associated with this type of lending, which include, without limitation, (i) credit risks relating to the mortgage bankers that borrow from us, (ii) the risk of intentional misrepresentation or fraud by any of these mortgage bankers, (iii) changes in the market value of mortgage loans originated by the mortgage banker, the sale of which is the expected source of repayment of the borrowings under the warehouse line of credit, due to changes in interest rates during the time in warehouse, (iv) unsalable or impaired mortgage loans so originated, which could lead to decreased collateral value and the failure of a purchaser of the mortgage loan to purchase the loan from the mortgage banker, and (v) the volatility of mortgage loan originations.
Additionally, the impact of interest rates on our mortgage warehouse lending business can be significant. Changes in interest rates can impact the number of residential mortgages originated and initially funded under mortgage warehouse lines of credit and thus our mortgage warehouse related revenues. A decline in mortgage rates generally increases the demand for mortgage loans. Conversely, in a constant or increasing rate environment, we would expect fewer loans to be originated.
Our lending limit may limit growth.
The Board of Directors has implemented a policy lending limit that it believes matches the Washington State legal lending limit. Our policy limits loans to one borrower and the borrower’s related entities to 20% of our unimpaired capital and surplus, or $19.6 million at December 31, 2016. Management has adopted an internal lending limit of a maximum of 80% of the Bank’s legal lending limit for risk mitigation purposes and all loans over this limit require approval from the AQC. These amounts are significantly less than that of many of our competitors and may discourage potential commercial borrowers who have credit needs in excess of our lending limit from doing business with us. The lending limit also impacts the efficiency of our commercial lending operation because it tends to lower the average
40
loan size, which means a higher number of transactions have to be generated to achieve the same portfolio volume. We can accommodate larger loans by selling participations in those loans to other financial institutions, but this strategy is not efficient or always available. We may not be able to attract or maintain clients seeking larger loans or may not be able to sell participations in these loans on terms that are considered favorable.
Revenue from mortgage banking operations are sensitive to changes in economic conditions, decreased economic activity, a slowdown in the housing market, higher interest rates or new legislation and may adversely impact our financial condition and results of operations.
Our mortgage banking program, which we restarted in the fourth quarter of 2011 in an effort to diversify our revenue streams and to generate additional income, is dependent upon our ability to originate and sell loans to investors. Mortgage revenues are primarily generated from gains on the sale of one-to-four-family residential loans underwritten to programs currently offered by Fannie Mae, Freddie Mac, Ginnie Mae, FHA, VA, USDA Rural Housing and other non-GSE investors. These entities account for a substantial portion of the secondary market in residential mortgage loans. We sell loans on both a servicing retained and servicing released basis utilizing market execution analysis and customer relationships as the criteria. Any future changes in these programs, our eligibility to participate in these programs, the criteria for loans to be accepted or laws that significantly affect the activity of these entities could, in turn, materially adversely affect the success of our mortgage banking program and, consequently, our results of operations.
Mortgage loan production levels are sensitive to changes in economic conditions and can suffer from decreased economic activity, a slowdown in the housing market or higher interest rates. Generally, any sustained period of decreased economic activity or higher interest rates could adversely affect mortgage originations and, consequently, adversely affect income from mortgage lending activities.
In the past several years, as a result of government actions and other economic factors related to the economic downturn, interest rates have been at historically low levels. In December 2016, the Federal Reserve slightly increased the Fed Funds rate by 25 basis points for the second time within a year and intends further increases during 2017 subject to economic conditions. As the Federal Reserve increases the Fed Funds rate, refinancing activity typically declines and new home purchases may be negatively impacted. To the extent that market interest rates increase in the future, our ability to originate mortgage loans held for sale may decrease, resulting in fewer loans that are available to be sold to investors. This would adversely affect our ability to generate mortgage revenues, and consequently noninterest income. Because interest rates depend on factors outside of our control, we cannot eliminate the interest rate risk associated with our mortgage operations.
Our results of operations will also be affected by the amount of noninterest expense associated with mortgage banking activities, such as salaries and employee benefits, occupancy, equipment and data processing expense and other operating costs. If we cannot generate a sufficient volume of loans for sale, our results of operations may be adversely affected. In addition, during periods of reduced loan demand, our results of operations may be adversely affected to the extent that we are unable to reduce expenses commensurate with the decline in loan originations.
Finally, deteriorating economic conditions may also increase the potential for home buyers to default on their mortgages. In certain of these cases where we have originated loans and sold them to investors, we may be required to repurchase loans or provide a financial settlement to investors if it is proven that the borrower failed to provide full and accurate information on or related to their loan application or for which appraisals have not been acceptable or when the loan was not underwritten in accordance with the loan program specified by the loan investor. Such repurchases or settlements would also adversely affect our net income.
If our allowance for loan losses is not sufficient to cover actual loan losses, our earnings could be reduced.
We make various assumptions and judgments about the collectability of our loan portfolio, including the creditworthiness of borrowers and the value of the real estate and other assets serving as collateral for the repayment of many of our loans. In determining the amount of the allowance for loan losses, we review loans and our historical loss and delinquency experience, and evaluate economic conditions. Management recognizes that significant new growth in loan portfolios, new loan products and the refinancing of existing loans can result in portfolios comprised of unseasoned loans that may not perform in a historical or projected manner. If our assumptions are incorrect, our allowance for loan losses may not be sufficient to cover actual losses, resulting in additional provisions for loan losses to replenish the allowance for loan losses. Deterioration in economic conditions, new information regarding existing
41
loans, identification of additional problem loans or relationships, and other factors, both within and outside of our control, may increase our loan charge-offs and/or may also otherwise also require an increase in our provision for loan losses.
Our allowance for loan losses was 1.7% of total gross loans, and 1,416.2% of non-performing loans at December 31, 2016, compared to 1.5% of total gross loans, and 765.5% of non-performing loans at December 31, 2015. In addition, bank regulators periodically review our allowance for loan losses and may require us to increase our provision for loan losses or recognize additional loan charge-offs. Any increases in the provision for loan losses may result in a decrease in net income and may have a material adverse effect on our financial condition, results of operations, and capital.
The unseasoned nature of our commercial business, commercial construction and commercial real estate portfolios may result in difficulties in judging collectability, which may lead to additional provisions or charge-offs, which would reduce our profits.
During the period from January 1, 2012 through December 31, 2016, we originated $219.3 million of commercial loans, including loans in process, with an outstanding balance of $125.4 million, at December 31, 2016. As a result, a significant portion of the portfolio is relatively unseasoned and some borrowers may not have had sufficient time to perform to properly indicate the magnitude of potential losses. These loans may have delinquency or charge-off levels above our historical experience, which could adversely affect our future performance.
Our business may be adversely affected by credit risk associated with residential property.
At December 31, 2016, $124.0 million, or 20.5% of our total loan portfolio, was secured by first liens on one-to-four-family residential loans and our home equity lines of credit totaled $20.1 million, or 3.3% of our total loan portfolio. These types of loans are generally sensitive to regional and local economic conditions that significantly impact the ability of borrowers to meet their loan payment obligations, making loss levels difficult to predict. A decline in residential real estate values resulting from a downturn in the Washington housing markets in which our loans are concentrated may reduce the value of the real estate collateral securing these types of loans and increase our risk of loss if borrowers default on their loans. A decline in economic conditions or in the volume of real estate sales and/or the sales prices coupled with elevated unemployment rates may result in higher than expected loan delinquencies or problem assets, and a decline in demand for our products and services. In addition, residential loans with high combined loan-to-value ratios will be more sensitive to the fluctuation of property values than those with lower combined loan-to-value ratios and therefore may experience a higher incidence of default and severity of losses. Further, the majority of our home equity lines of credit consist of second mortgage loans. For those home equity lines secured by a second mortgage, it is unlikely that we will be successful in recovering all or a portion of our loan proceeds in the event of default unless we are prepared to repay the first mortgage loan and such repayment and the costs associated with a foreclosure are justified by the value of the property. For these reasons, we may experience higher rates of delinquencies, defaults and losses which would adversely affect our net income.
Our non-owner occupied commercial real estate loans may expose us to increased credit risk.
At December 31, 2016, $32.2 million, or 5.3% of our total loan portfolio, consisted of loans secured by non-owner occupied commercial real estate properties. Loans secured by non-owner occupied properties generally expose a lender to greater risk of non-payment and loss than loans secured by owner occupied properties because repayment of such loans depend primarily on the tenant’s continuing ability to pay rent to the property owner, who is our borrower, or, if the property owner is unable to find a tenant, the property owner’s ability to repay the loan without the benefit of a rental income stream. Furthermore, some of our non-owner occupied commercial loan borrowers have more than one loan outstanding with us. At December 31, 2016, we had six non-owner occupied commercial multi-loan relationships, each having a combined outstanding balance of over $691,000, with an aggregate outstanding balance of $16.9 million. Consequently, an adverse development with respect to one credit relationship may expose us to a greater risk of loss compared to an adverse development with respect to an owner occupied commercial real estate loan.
42
We occasionally purchase loans in bulk or “pools.” We may experience lower yields or losses on loan pools because the assumptions we use when purchasing loans in bulk may not prove correct.
From time to time, we purchase real estate loans in bulk or “pools.” For the year ended December 31, 2016, there were no pools purchased, as compared to the prior year when we purchased a single pool of $16.3 million in adjustable rate one-to-four-family, non-owner occupied loans secured by properties located in the Puget Sound market. When we determine the purchase price we are willing to pay to purchase loans in bulk, management makes certain assumptions about, among other things, how fast borrowers will prepay their loans, the real estate market and our ability to collect loans successfully and, if necessary, to dispose of any real estate that may be acquired through foreclosure. When we purchase loans in bulk, we perform certain due diligence procedures and we purchase the loans subject to customary limited indemnities. To the extent that our underlying assumptions prove to be inaccurate or the basis for those assumptions change (such as an unanticipated decline in the real estate market), the purchase price paid for pools of loans may prove to have been excessive, resulting in a lower yield or a loss of some or all of the loan principal. For example, if we purchase pools of loans at a premium and some of the loans are prepaid before we expected we will earn less interest income on the purchase than expected. Our success in growing through purchases of loan pools depends on our ability to price loan pools properly and on general economic conditions in the geographic areas where the underlying properties of our loans are located.
Acquiring loans through bulk purchases may involve acquiring loans of a type or in geographic areas where management may not have substantial prior experience. We may be exposed to a greater risk of loss to the extent that bulk purchases contain such loans.
Our securities portfolio may be negatively impacted by fluctuations in market value and interest rates.
Our securities portfolio may be impacted by fluctuations in market value, potentially reducing accumulated other comprehensive income and/or earnings. Fluctuations in market value may be caused by changes in market interest rates, lower market prices for securities and limited investor demand. Our securities portfolio is evaluated for other-than-temporary impairment. If this evaluation shows impairment to the actual or projected cash flows associated with one or more securities, a potential loss to earnings may occur. Changes in interest rates can also have an adverse effect on our financial condition, as our securities available-for-sale are reported at their estimated fair value, and therefore are impacted by fluctuations in interest rates. We increase or decrease our shareholders’ equity by the amount of change in the estimated fair value of the securities available-for-sale, net of taxes. There can be no assurance that the declines in market value will not result in other-than-temporary impairments of these assets, which would lead to accounting charges that could have a material adverse effect on our net income and capital levels.
New lines of business or new products and services may subject us to additional risk.
From time to time, we may implement new lines of business or offer new products and services within existing lines of business. Currently, we are expanding existing commercial real estate, commercial business and residential lending programs such as home improvement loans for consumer solar projects. There are substantial risks and uncertainties associated with these efforts, particularly in instances where the markets are not fully developed. In developing and marketing new lines of business and/or new products and services, we may invest significant time and resources. Initial timetables for the introduction and development of new lines of business and/or new products or services may not be achieved and price and profitability targets may not prove feasible. External factors, such as compliance with regulations, competitive alternatives and shifting market preferences, may also impact the successful implementation of a new line of business and/or a new product or service. Furthermore, any new line of business and/or new product or service could have a significant impact on the effectiveness of the system of internal controls. Failure to successfully manage these risks in the development and implementation of new lines of business and/or new products or services could have a material adverse effect on our business, results of operations and financial condition.
Our inability to manage our growth or deploy assets profitably could harm our business and decrease our overall profitability, which may cause our stock price to decline.
Our assets and deposit base have grown substantially in recent years, and we anticipate that we will continue to grow over time, perhaps significantly. To manage the expected growth of our operations and personnel, we will be required to manage multiple aspects of the business simultaneously, including among other things: (i) improve existing and implement new transaction processing, operational and financial systems, procedures and controls; (ii) maintain
43
effective credit scoring and underwriting guidelines; (iii) maintain sufficient levels of regulatory capital; and (iv) expand our employee base and train and manage this growing employee base. In addition, to the extent we acquire other banks and or bank branches, asset pools or deposits we may have to manage additional risks such as exposure to potential asset quality issues, disruption to our normal business activities and diversion of management’s time and attention due to integration and conversion efforts. If we are unable to manage growth effectively or execute integration efforts properly, we may not be able to achieve the anticipated benefits of growth and our business, financial condition and results of operations could be adversely affected.
We may not be able to sustain past levels of profitability as we grow, and our past levels of profitability should not be considered a guarantee or indicator of future success. If we are not able to maintain our levels of profitability by deploying growth in our deposits in profitable assets or investments, our net interest margin and overall level of profitability will decrease and our stock price may decline.
Hedging against interest rate exposure may adversely affect our earnings.
We employ techniques that limit, or “hedge,” the adverse effects of rising interest rates on our loans held for sale, and originated interest rate locks to customers. Our hedging activity varies based on the level and volatility of interest rates and other changing market conditions. These techniques may include purchasing or selling forward contracts, purchasing put and call options on securities or securities underlying futures contracts, or entering into other mortgage-backed derivatives. There are, however, no perfect hedging strategies, and interest rate hedging may fail to protect us from loss. Moreover, hedging activities could result in losses if the event against which we hedge does not materialize. Additionally, interest rate hedging could fail to protect us or adversely affect us because, among other things:
• | available interest rate hedging may not correspond directly with the interest rate risk for which protection is sought; |
• | the duration of the hedge may not match the duration of the related liability; |
• | the party owing money in the hedging transaction may default on its obligation to pay; |
• | the credit quality of the party owing money on the hedge may be downgraded to such an extent that it impairs our ability to sell or assign our side of the hedging transaction; |
• | the value of derivatives used for hedging may be adjusted from time to time in accordance with accounting rules to reflect changes in fair value; and |
• | downward adjustments, or “mark-to-market losses,” could reduce our stockholders’ equity. |
Changes in interest rates may reduce our net interest income, and may result in higher defaults in a rising rate environment.
Our earnings and cash flows are largely dependent upon our net interest income. Interest rates are highly sensitive to many factors that are beyond our control, including domestic and international economic conditions and policies of various governmental and regulatory agencies and, in particular, the Federal Reserve, and other factors beyond our control. In an attempt to help the overall economy, the Federal Reserve has kept interest rates low through its targeted Fed Funds rate. In December 2016, the Federal Reserve slightly increased the Fed Funds rate by 25 basis points and intends further increases during 2017 subject to economic conditions. As the Federal Reserve increases the Fed Funds rate, overall interest rates will likely rise, which may negatively impact the housing markets and the U.S. economic recovery. In addition, deflationary pressures, while possibly lowering our operating costs, could have a significant negative effect on our borrowers, especially our business borrowers, and the values of collateral securing loans, which could negatively affect our financial performance.
We principally manage interest rate risk by managing our volume and mix of our earning assets and funding liabilities. Changes in monetary policy, including changes in interest rates, could influence not only the interest we receive on loans and investments and the amount of interest we pay on deposits and borrowings, but could also affect: (i) our ability to originate and/or sell loans; (ii) the fair value of our interest-earning assets, which could negatively impact shareholders’ equity, and our ability to realize gains from the sale of such assets; (iii) our ability to obtain and retain deposits in competition with other available investment alternatives; (iv) the ability of our borrowers to repay adjustable or variable rate loans; and (v) the average duration of our mortgage-backed securities portfolio and other
44
interest-earning assets. If the interest rates paid on deposits and other borrowings increase at a faster rate than the interest rates received on loans and other investments, our net interest income, and therefore earnings, could be adversely affected. Earnings could also be adversely affected if the interest rates received on loans and other investments fall more quickly than the interest rates paid on deposits and other borrowings. In a changing interest rate environment, we may not be able to manage this risk effectively. If we are unable to manage interest rate risk effectively, our business, financial condition and results of operations could be materially affected.
A sustained increase in market interest rates could adversely affect our earnings. A significant portion of our loans have fixed interest rates and longer terms than our deposits and borrowings. As a result of the relatively low interest rate environment, an increasing percentage of our deposits have been comprised of certificates of deposit and other deposits yielding no or a relatively low rate of interest having a shorter duration than our assets. At December 31, 2016, we had $83.9 million in certificates of deposit that mature within one year and $516.9 million in non-interest bearing, NOW checking, savings and money market accounts. We would incur a higher cost of funds to retain these deposits in a rising interest rate environment. Our net interest income could be adversely affected if the rates we pay on deposits and borrowings increase more rapidly than the rates we earn on loans. In addition, a substantial amount of our residential mortgage loans and home equity lines of credit have adjustable interest rates. As a result, these loans may experience a higher rate of default in a rising interest rate environment.
Our net income can also be reduced by the impact that changes in interest rates can have on the value of our capitalized servicing rights. At December 31, 2016, we serviced $977.1 million of loans sold to third parties, and the servicing rights associated with such loans had an amortized cost of $8.5 million and an estimated fair value, at that date, of $11.7 million. Because the estimated life and estimated income to be derived from servicing the underlying loans generally increase with rising interest rates and decrease with falling interest rates, the value of servicing rights generally increases as interest rates rise and decreases as interest rates fall. If interest rates fall and the value of our capitalized servicing rights decrease, we may be required to recognize an additional impairment charge against income for the amount by which amortized cost exceeds estimated fair market value.
Although management believes it has implemented effective asset and liability management strategies to reduce the potential effects of changes in interest rates on our results of operations, any substantial, unexpected or prolonged change in market interest rates could have a material adverse effect on our financial condition and results of operations. Also, our interest rate risk modeling techniques and assumptions likely may not fully predict or capture the impact of actual interest rate changes on our balance sheet. See Item 7, “Management’s Discussion and Analysis of Financial Condition and Results of Operations - Asset and Liability Management and Market Risk” of this Form 10-K.
Liquidity risk could impair our ability to fund operations and jeopardize our financial condition.
Liquidity is essential to our business. An inability to raise funds through deposits, debt, the sale of loans or other sources could have a substantial negative effect on our liquidity. Our access to funding sources in amounts adequate to finance activities or the terms of which are acceptable to us could be impaired by factors that affect us specifically or the financial services industry or economy in general. Factors that could detrimentally impact our access to liquidity sources include a decrease in the level of our business activity as a result of a downturn in the Washington markets in which our loans are concentrated or adverse regulatory action against us. Our ability to borrow could also be impaired by factors that are not specific to us, such as a disruption in the financial markets or negative views and expectations about the prospects for the financial services industry in light of the recent turmoil faced by banking organizations and the continued deterioration in credit markets. See Item 7, “Management’s Discussion and Analysis of Financial Condition and Results of Operations - Liquidity” of this Form 10-K.
Loss of key employees may disrupt relationships with certain customers.
Our business is primarily relationship-driven in that some of our business development and relationship managers have extensive customer relationships. Loss of such key personnel could result in the loss of some of our customers. While we believe the relationship with key producers is good, we cannot guarantee that all of the key personnel will remain with our organization. The loss of these key persons could negatively impact the affected banking operations.
45
We operate in a highly competitive industry and market area.
We face substantial competition in all areas of our operations from a variety of different competitors, many of which are larger and may have more financial resources. These competitors primarily include national, regional and internet banks within the various markets in which we operate. We also face competition from many other types of financial institutions, including, without limitation, savings and loans, credit unions, mortgage banking finance companies, brokerage firms, insurance companies and other financial intermediaries. The financial services industry could become even more competitive as a result of legislative, regulatory and technological changes and continued consolidation. Banks, securities firms and insurance companies can merge under the umbrella of a financial holding company, which can offer virtually any type of financial service, including banking, securities underwriting, insurance (both agency and underwriting) and merchant banking. Also, technology has lowered barriers to entry and made it possible for nonbanks to offer products and services traditionally provided by banks, such as automatic transfer and automatic payment systems. Many of our competitors have fewer regulatory constraints and may have lower cost structures. Additionally, due to their size, many competitors may be able to achieve economies of scale and, as a result, may offer a broader range of products and services as well as better pricing for those products and services than we can.
Our ability to compete successfully depends on a number of factors including the following:
• | the ability to develop, maintain and build upon long-term customer relationships based on top-quality service, high ethical standards and safe, sound assets; |
• | the ability to expand our market position; |
• | the scope, relevance and pricing of products and services offered to meet customer needs and demands; |
• | the rate at which we introduce new products and services relative to our competitors; |
• | customer satisfaction with our level of service; and |
• | industry and general economic trends. |
Failure to perform in any of these areas could significantly weaken our competitive position, which could adversely affect our growth and profitability, which, in turn, could have a material adverse effect on our financial condition and results of operations. See Item 1, “Business - Competition” of this Form 10-K.
We operate in a highly regulated environment and may be adversely affected by changes in federal and state laws and regulations that are expected to increase our costs of operations.
We are currently subject to extensive examination, supervision and comprehensive regulation by the FDIC and the DFI. The FDIC and the DFI govern the activities in which we may engage, primarily for the protection of depositors and the DFI. These regulatory authorities have extensive discretion in connection with their supervisory and enforcement activities, including the ability to impose restrictions on an institution’s operations, reclassify assets, determine the adequacy of an institution’s allowance for loan losses and determine the level of deposit insurance premiums assessed. These regulations, along with the currently existing tax, accounting, securities, insurance, and monetary laws, regulations, rules, standards, policies, and interpretations control the methods by which financial institutions conduct business, implement strategic initiatives and tax compliance, and govern financial reporting and disclosures. These laws, regulations, rules, standards, policies, and interpretations are constantly evolving and may change significantly over time. Any new regulations or legislation, change in existing regulations or oversight, whether a change in regulatory policy or a change in a regulator’s interpretation of a law or regulation, could have a material impact on our operations, increase our costs of regulatory compliance and of doing business and or otherwise adversely affect us and our profitability. Further, changes in accounting standards can be both difficult to predict and involve judgment and discretion in their interpretation by us and our independent accounting firms. These changes could materially impact, potentially even retroactively, how we report our financial condition and results of our operations as could our interpretation of those changes.
46
As discussed under “Business - How We Are Regulated” in Item 1 of this Form 10-K, the Dodd-Frank Act has significantly changed the bank regulatory structure and will affect the lending, deposit, investment, trading and operating activities of financial institutions and their holding companies. The Dodd-Frank Act requires various federal agencies to adopt and implement a broad range of new rules and regulations, and to prepare numerous studies and reports for Congress. The federal agencies are given significant discretion in drafting and implementing rules and regulations, and consequently, many of the details and much of the impact of the Dodd-Frank Act may not be known for many months or years. It is difficult at this time to predict when or how any new standards will ultimately be applied to us or what specific impact the Dodd-Frank Act and the yet to be written rules and regulations for implementation will have on community banks. However, it is expected that at a minimum they will increase our operating and compliance costs and could increase our non-interest expense.
Any other additional changes in our regulation and oversight, whether in the form of new laws, rules or regulations, could likewise make compliance more difficult or expensive or otherwise materially adversely affect our business, financial condition or prospects.
A new accounting standard will likely require us to increase our allowance for loan losses and may have a material adverse effect on our financial condition and results of operations.
The Financial Accounting Standards Board has adopted a new accounting standard that will be effective for the Company and the Bank after December 15, 2019. This standard, referred to as Current Expected Credit Loss, or CECL, will require financial institutions to determine periodic estimates of lifetime expected credit losses on loans, and recognize the expected credit losses as allowances for loan losses. This will change the current method of providing allowances for loan losses that are probable, which would likely require us to increase our allowance for loan losses, and to greatly increase the types of data we would need to collect and review to determine the appropriate level of the allowance for loan losses. Any increase in our allowance for loan losses or expenses incurred to determine the appropriate level of the allowance for loan losses may have a material adverse effect on our financial condition and results of operations.
The Company relies, in part, on external financing to fund its operations and the unavailability of such funds in the future could adversely impact its growth and prospects.
The Company relies on customer deposits, advances from the Federal Home Loan Bank of Des Moines and other borrowings to fund its operations. Management has historically been able to replace maturing deposits if desired; however the Company may not be able to replace such funds at any given point in time if its financial condition or market conditions change or if the cost of doing so might adversely affect our financial condition or results of operations. We are also required by federal regulatory authorities to maintain adequate levels of capital to support our operations.
During 2015, we incurred $10.0 million in subordinated debt to contribute to the Bank’s capital to support its growth. At some point in the future, we may seek additional debt or may raise additional capital to support our growth and achieve our long-term business objectives. Our ability to issue additional debt or raise additional capital, if needed, will depend on conditions in the capital markets at that time, which are outside our control, and on our financial condition and performance. Such borrowings or additional capital, if sought, may not be available to us or, if available, may not be on favorable terms. If additional financing sources are unavailable or are not available on reasonable terms, the Company’s financial condition, results of operations and future prospects could be adversely affected and we may have to raise additional capital on terms that may be significantly dilutive to our shareholders.
The Company’s ability to pay dividends and make subordinated debt payments is subject to the ability of the Bank to make capital distributions to the Company.
The Company is a separate legal entity from its subsidiary and does not have significant operations of its own. The long-term ability of the Company to pay dividends to its stockholders and debt payments is based primarily upon the ability of the Bank to make capital distributions to the Company, and also on the availability of cash at the holding company level. The availability of dividends from the Bank is limited by the Bank’s earnings and capital, as well as various statutes and regulations. In the event, the Bank is unable to pay dividends to the Company, the Company may not be able to pay dividends on its common stock or make payments on its outstanding debt. Consequently, the inability to receive dividends from the Bank could adversely affect the Company’s financial condition, results of operations and future prospects.
47
Non-compliance with the USA PATRIOT Act, Bank Secrecy Act, or other laws and regulations could result in fines or sanctions.
The USA PATRIOT and Bank Secrecy Acts require financial institutions to develop programs to prevent financial institutions from being used for money laundering and terrorist activities. If such activities are detected, financial institutions are obligated to file suspicious activity reports with the U.S. Treasury’s Office of Financial Crimes Enforcement Network. These rules require financial institutions to establish procedures for identifying and verifying the identity of customers seeking to open new financial accounts. Failure to comply with these regulations could result in fines or sanctions. During the last few years, several banking institutions have received large fines for non-compliance with these laws and regulations. While we have developed policies and procedures designed to assist in compliance with these laws and regulations, no assurance can be given that these policies and procedures will be effective in preventing violations of these laws and regulations.
We are subject to certain risks in connection with our use of technology.
Our security measures may not be sufficient to mitigate the risk of a cyber-attack. Communications and information systems are essential to the conduct of our business, as we use such systems to manage our customer relationships, our general ledger and virtually all other aspects of our business. Our operations rely on the secure processing, storage, and transmission of confidential and other information in our computer systems and networks. Although we take protective measures and endeavor to modify them as circumstances warrant, the security of our computer systems, software, and networks may be vulnerable to breaches, unauthorized access, misuse, computer viruses, or other malicious code and cyber-attacks that could have a security impact. If one or more of these events occur, this could jeopardize our or our customers’ confidential and other information processed and stored in, and transmitted through, our computer systems and networks, or otherwise cause interruptions or malfunctions in our operations or the operations of our customers or counterparties. We may be required to expend significant additional resources to modify our protective measures or to investigate and remediate vulnerabilities or other exposures, and we may be subject to litigation and financial losses that are either not insured against or not fully covered through any insurance maintained by us. We could also suffer significant reputational damage.
Security breaches in our internet banking activities could further expose us to possible liability and damage our reputation. Any compromise of our security could also deter customers from using our internet banking services that involve the transmission of confidential information. We rely on standard internet security systems to provide the security and authentication necessary to effect secure transmission of data. These precautions may not protect our systems from compromises or breaches of our security measures, which could result in significant legal liability and significant damage to our reputation and our business.
Our security measures may not protect us from systems failures or interruptions. While we have established policies and procedures to prevent or limit the impact of systems failures and interruptions, there can be no assurance that such events will not occur or that they will be adequately addressed if they do. In addition, we outsource certain aspects of our data processing and other operational functions to certain third-party providers. If our third-party providers encounter difficulties, or if we have difficulty in communicating with them, our ability to adequately process and account for transactions could be affected, and our business operations could be adversely impacted. Threats to information security also exist in the processing of customer information through various other vendors and their personnel.
The occurrence of any failures or interruptions may require us to identify alternative sources of such services and we cannot make assurances that we could negotiate terms that are as favorable to us, or could obtain services with similar functionality as found in our existing systems without the need to expend substantial resources, if at all. Further, the occurrence of any systems failure or interruption could damage our reputation and result in a loss of customers and business, could subject us to additional regulatory scrutiny, or could expose us to legal liability. Any of these occurrences could have a material adverse effect on our financial condition and results of operations.
Our exposure to operational risks may adversely affect us.
Similar to other financial institutions, we are exposed to many types of operational risk, including reputational risk, legal and compliance risk, the risk of fraud or theft by employees or outsiders, the risk that sensitive customer or
48
Company data is compromised, unauthorized transactions by employees or operational errors, including clerical or record-keeping errors. Nationally, reported incidents of fraud and other financial crimes have increased. We have also experienced losses due to apparent fraud and other financial crimes. While we have policies and procedures designed to prevent such losses, there can be no assurance that such losses will not occur. If any of these risks occur, it could result in material adverse consequences for us.
The markets in which the Company operates are subject to the risk of flooding, mudslides, and other natural disasters.
The Company’s offices are located in Washington. Also, most of the real and personal properties securing the Company’s loans are located in Washington. Washington is prone to flooding, mudslides, brush fires, earthquakes, and other natural disasters. In addition to possibly sustaining damage to its own properties, if there is a major flood, mudslide, brush fire, earthquake or other natural disaster, the Company faces the risk that many of the Company’s borrowers may experience uninsured property losses, or sustained job interruption and/or loss which may materially impair their ability to meet the terms of their loan obligations. Therefore, a major flood, mudslide, brush fire, earthquake or other natural disaster in Washington could have a material adverse effect on the Company’s business, financial condition, results of operations and cash flows.
Item 1B. Unresolved Staff Comments
None.
49
Item 2. Properties
At December 31, 2016, the Company had one main administrative office, one free-standing ATM, five stand-alone loan production offices, and eleven full-service banking branch offices with an aggregate net book value of $16.0 million. The following table sets forth certain information concerning the properties at December 31, 2016. See also Note 6 of the Notes to Consolidated Financial Statements included in Item 8, “Financial Statements and Supplementary Data” of this Form 10-K. In the opinion of management, the facilities are adequate and suitable for the Company’s needs.
Location | Square Footage | Owned or Leased | Lease Expiration Date | Net Book Value at December 31, 2016 (1) | ||||||
(In thousands) | ||||||||||
Capitol Hill 614 Broadway East Seattle, WA 98102 | 5,100 | Leased | December 2022 (2) | $ | 494 | |||||
Edmonds 620 Edmonds Way Edmonds, WA 98020 | 2,474 | Owned | — | $ | 1,235 | |||||
Hadlock 10 Old Oak Bay Rd Hadlock, WA 98339 | 1,755 | Owned | — | $ | 420 | |||||
Kingston (ATM) 8215 NE State Hwy 104 Kingston, WA 98346 | 50 | Leased | December 2021 (3) | $ | 48 | |||||
Lynnwood 19002 33rd Ave W Lynnwood, WA 98036 | 3,000 | Leased | June 2020 | $ | 82 | |||||
Mill Creek (Banking and Home Lending) 15224 Main St, Suite 105 Mill Creek, WA 98012 | 2,894 | Leased | April 2020 (2) | $ | 346 | |||||
Mountlake Terrace (Administrative) 6920 220th St SW Mountlake Terrace, WA 98043 | 39,535 | Owned | — | $ | 7,103 | |||||
Mountlake Terrace (Lending) 6100 219th St SW, Suite 400 Mountlake Terrace, WA 98043 | 9,980 | Leased | July 2027 | $ | 372 | |||||
Overlake 14808 NE 24th St, Suite D Redmond, WA 98052 | 2,331 | Leased | May 2021 | $ | 12 | |||||
Port Angeles 134 W 8th St Port Angeles, WA 98362 | 2,267 | Owned | — | $ | 392 | |||||
Port Townsend 734 Water St Port Townsend, WA 98368 | 11,671 | Leased | September 2019 (4) | $ | 154 | |||||
Poulsbo (Banking and Home Lending) 21650 Market Place Poulsbo, WA 98370 | 3,498 | Owned | — | $ | 2,741 | |||||
Puyallup 307 W Stewart St Puyallup, WA 98371 | 2,474 | Owned | — | $ | 1,267 | |||||
Sequim 114 S Sequim Ave Sequim, WA 98382 | 8,866 | Owned | — | $ | 980 | |||||
(1) Net book value includes investment in premises, equipment and leaseholds.
(2) Lease provides for two five-year renewal options.
(3) Lease provides for three five-year renewal options.
(4) Lease provides for 17 five-year renewal options.
50
Location | Square Footage | Owned or Leased | Lease Expiration Date | Net Book Value at December 31, 2016 (1) | ||||||
(In thousands) | ||||||||||
Bellevue Home Lending 1110 112th Ave NE, Suite 310 Bellevue, WA 98004 | 4,068 | Leased | December 2017 | $ | 24 | |||||
Everett Home Lending 2825 Colby Ave, Suite 205 Everett, WA 98201 | 3,020 | Leased | December 2021(5) | $ | 132 | |||||
Port Orchard Home Lending 1140 Bethel Ave, Suite 202 Port Orchard, WA 98336 | 330 | Leased | Month-to-Month | $ | 32 | |||||
Puyallup Home Lending 2910 S Meridian, Suite 180 Puyallup, WA 98373 | 3,389 | Leased | June 2019 (5) | $ | 36 | |||||
Tri-Cities Home Lending 8500 West Gage Blvd, Suite A Kennewick, WA 99336 | 5,477 | Leased | March 2020 (2) | $ | 141 | |||||
(5) Lease provides for one five-year renewal option.
The Company maintains depositor and borrower customer files on an on-line basis, utilizing a telecommunications network, portions of which are leased. The book value of all data processing and computer equipment utilized by the Company at December 31, 2016 was $540,000. Management has a business continuity plan in place with respect to the data processing system, as well as the Company’s operations as a whole.
Item 3. Legal Proceedings
Because of the nature of our activities, the Company is subject to various pending and threatened legal actions, which arise in the ordinary course of business. From time to time, subordination liens may create litigation which requires us to defend our lien rights. In the opinion of management, liabilities arising from these claims, if any, will not have a material effect on our financial position.
Item 4. Mine Safety Disclosures
Not applicable.
PART II
Item 5. Market for Registrant’s Common Equity, Related Stockholder Matters and Issuer Purchases of Equity Securities
The Company’s common stock is traded on The NASDAQ Stock Market LLC’s Global Market, under the symbol “FSBW.” At December 31, 2016, there were 3,059,503 shares of common stock issued and outstanding and approximately 149 shareholders of record based upon securities position listings furnished to us by our transfer agent. This total does not reflect the number of persons or entities who hold stock in nominee or “street name” accounts with brokers.
Common shares outstanding of 2,861,135 were calculated using shares outstanding of 3,059,503 at December 31, 2016, less 68,763 restricted stock shares, and 129,605 unallocated ESOP shares. Common shares of 2,991,910 were calculated using shares outstanding at period end of 3,242,120 at December 31, 2015, less 94,684 restricted stock shares, and 155,526 unallocated ESOP shares.
51
The tables below show the high and low closing prices and quarterly cash dividends for our common stock for the periods indicated.
Year Ended December 31, 2016 | High | Low | Cash dividends declared and paid | |||||||||
First quarter | $ | 26.28 | $ | 23.21 | $ | 0.07 | ||||||
Second quarter | 26.00 | 24.41 | 0.10 | |||||||||
Third quarter | 29.50 | 25.26 | 0.10 | |||||||||
Fourth quarter | 37.94 | 28.00 | 0.10 | |||||||||
Year Ended December 31, 2015 | High | Low | Cash dividends declared and paid | |||||||||
First quarter | $ | 19.49 | $ | 18.01 | $ | 0.06 | ||||||
Second quarter | 22.68 | 18.99 | 0.07 | |||||||||
Third quarter | 23.90 | 21.61 | 0.07 | |||||||||
Fourth quarter | 26.42 | 23.42 | 0.07 | |||||||||
1st Security Bank of Washington is a wholly-owned subsidiary of FS Bancorp. Under federal regulations, the dollar amount of dividends 1st Security Bank of Washington may pay to FS Bancorp depends upon its capital position and recent net income. Generally, if 1st Security Bank of Washington satisfies its regulatory capital requirements, it may make dividend payments up to the limits prescribed by state law and FDIC regulations. See “Item 1 Business - How We Are Regulated - Regulation of 1st Security Bank of Washington - Dividends” and “Regulation and Supervision of FS Bancorp - Restrictions on Dividends and Stock Repurchases”.
The cash dividend policy is reviewed by management and the Board of Directors. Any dividends declared and paid in the future would depend upon a number of factors including capital requirements, the Company's financial condition and results of operations, tax considerations, statutory and regulatory limitations, and general economic conditions. No assurances can be given that any dividends will be paid or that, if paid, will not be reduced or eliminated in future periods.
Stock Repurchases. There were no stock repurchases by the Company during the quarter ended December 31, 2016. During the year ended December 31, 2016, the Company repurchased 198,000 shares of its common stock, of which 193,000 shares were purchased in accordance with its stock repurchase plan at an average price per share of $24.79. The Company’s stock repurchase plan announced on July 28, 2015, ended on August 31, 2016.
Equity Compensation Plan Information. The equity compensation plan information presented under subparagraph (d) in Part III, Item 12 of this report is incorporated herein by reference.
52
Performance Graph. The following graph compares the cumulative total shareholder return on the Company’s common stock with the cumulative total return on the NASDAQ Stock Index (U.S. Stock) and NASDAQ Bank Index. Total return assumes the reinvestment of all dividends and that the value of common stock and bank index was $100 on July 10, 2012.
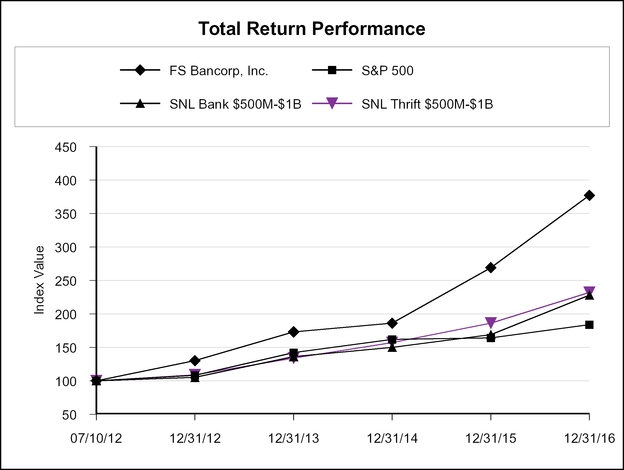
Source: SNL Financial LC, Charlottesville, VA
Periods Ended | ||||||||||||
Index | 07/10/12 | 12/31/12 | 12/31/13 | 12/31/14 | 12/31/15 | 12/31/16 | ||||||
FS Bancorp, Inc. | 100.00 | 129.57 | 172.84 | 186.41 | 268.72 | 376.77 | ||||||
S&P 500 | 100.00 | 107.51 | 142.33 | 161.82 | 164.06 | 183.68 | ||||||
SNL Bank $500M-$1B | 100.00 | 105.19 | 136.40 | 149.65 | 168.91 | 228.06 | ||||||
SNL Thrift $500M-$1B | 100.00 | 109.18 | 134.19 | 156.57 | 186.45 | 232.22 | ||||||
53
Item 6. Selected Financial Data
The following table sets forth certain information concerning the Company’s consolidated financial position and results of operations at and for the dates indicated and have been derived from the audited consolidated financial statements. The information below is qualified in its entirety by the detailed information included elsewhere herein and should be read along with Item 7, “Management’s Discussion and Analysis of Financial Condition and Results of Operations” and Item 8, “Financial Statements and Supplementary Data.”
At December 31, | |||||||||||||||||||
(In thousands) | 2016 | 2015 | 2014 | 2013 | 2012 | ||||||||||||||
Selected Financial Condition Data: | |||||||||||||||||||
Total assets | $ | 827,926 | $ | 677,561 | $ | 509,754 | $ | 419,187 | $ | 359,030 | |||||||||
Loans receivable, net(1) | 593,317 | 502,535 | 387,174 | 281,081 | 274,949 | ||||||||||||||
Loans held for sale, at fair value | 52,553 | 44,925 | 25,983 | 11,185 | 8,870 | ||||||||||||||
Securities available-for-sale, at fair value | 81,875 | 55,217 | 48,744 | 56,239 | 43,313 | ||||||||||||||
FHLB stock, at cost | 2,719 | 4,551 | 1,650 | 1,702 | 1,765 | ||||||||||||||
Deposits | 712,593 | 485,178 | 420,444 | 336,876 | 288,949 | ||||||||||||||
Borrowings | 12,670 | 98,769 | 17,034 | 16,664 | 6,840 | ||||||||||||||
Subordinated note, net | 9,825 | 9,805 | — | — | — | ||||||||||||||
Total stockholders’ equity | 81,033 | 75,340 | 65,836 | 62,313 | 59,897 | ||||||||||||||
Years Ended December 31, | |||||||||||||||||||
(In thousands) | 2016 | 2015 | 2014 | 2013 | 2012 | ||||||||||||||
Selected Operations Data: | |||||||||||||||||||
Total interest and dividend income | $ | 38,020 | $ | 31,707 | $ | 24,842 | $ | 21,733 | $ | 18,787 | |||||||||
Total interest expense | 4,163 | 3,658 | 2,702 | 2,178 | 2,363 | ||||||||||||||
Net interest income | 33,857 | 28,049 | 22,140 | 19,555 | 16,424 | ||||||||||||||
Provision for loan losses | 2,400 | 2,250 | 1,800 | 2,170 | 2,913 | ||||||||||||||
Net interest income after provision for loan losses | 31,457 | 25,799 | 20,340 | 17,385 | 13,511 | ||||||||||||||
Service charges and fee income | 3,391 | 1,977 | 1,762 | 1,807 | 1,993 | ||||||||||||||
Gain on sale of loans | 19,058 | 14,672 | 7,577 | 6,371 | 3,684 | ||||||||||||||
(Impairment) recovery on long-lived assets | — | — | (9 | ) | — | 165 | |||||||||||||
Gain (loss) on sale of investment securities | 146 | 76 | (41 | ) | 264 | — | |||||||||||||
Earnings on cash surrender value of BOLI | 282 | 216 | 187 | 83 | — | ||||||||||||||
Other noninterest income | 692 | 652 | 557 | 390 | 322 | ||||||||||||||
Total noninterest income | 23,569 | 17,593 | 10,033 | 8,915 | 6,164 | ||||||||||||||
Total noninterest expense | 38,923 | 29,643 | 23,902 | 20,361 | 16,477 | ||||||||||||||
Income before provision for income taxes | 16,103 | 13,749 | 6,471 | 5,939 | 3,198 | ||||||||||||||
Provision (benefit) for income taxes | 5,604 | 4,873 | 1,931 | 2,019 | (2,097 | ) | |||||||||||||
Net income | $ | 10,499 | $ | 8,876 | $ | 4,540 | $ | 3,920 | $ | 5,295 | |||||||||
_______________________
(1) Net of allowances for loan losses, loans in process and deferred loan costs, fees, and discounts.
54
At or For the | ||||||||||||||||||||
Selected Financial Ratios and Other Data | Years Ended December 31, | |||||||||||||||||||
Performance ratios: | 2016 | 2015 | 2014 | 2013 | 2012 | |||||||||||||||
Return on assets (ratio of net income to average total assets) | 1.31 | % | 1.52 | % | 1.00 | % | 1.01 | % | 1.64 | % | ||||||||||
Return on equity (ratio of net income to average equity) | 13.84 | 12.73 | 7.19 | 6.43 | 12.71 | |||||||||||||||
Yield on average interest-earning assets | 4.97 | 5.67 | 5.74 | 5.93 | 6.21 | |||||||||||||||
Rate paid on average interest-bearing liabilities | 0.74 | 0.83 | 0.80 | 0.77 | 0.94 | |||||||||||||||
Interest rate spread information: | ||||||||||||||||||||
Average during period | 4.23 | 4.84 | 4.94 | 5.16 | 5.27 | |||||||||||||||
Net interest margin(1) | 4.43 | 5.01 | 5.12 | 5.33 | 5.43 | |||||||||||||||
Operating expense to average total assets | 4.87 | 5.07 | 5.27 | 5.27 | 5.12 | |||||||||||||||
Average interest-earning assets to average | ||||||||||||||||||||
interest-bearing liabilities | 135.96 | 127.09 | 128.30 | 129.73 | 120.34 | |||||||||||||||
Efficiency ratio(2) | 67.78 | 64.95 | 74.29 | 71.52 | 72.95 | |||||||||||||||
Margin on loans sold (3) | 2.64 | 2.58 | 2.31 | 2.37 | 2.47 | |||||||||||||||
Asset quality ratios: | ||||||||||||||||||||
Non-performing assets to total assets at end of period(4) | 0.09 | % | 0.15 | % | 0.08 | % | 0.77 | % | 1.13 | % | ||||||||||
Non-performing loans to total gross loans(5) | 0.12 | 0.20 | 0.11 | 0.38 | 0.68 | |||||||||||||||
Allowance for loan losses to non-performing loans(5) | 1,416.23 | 765.49 | 1,406.47 | 462.49 | 246.48 | |||||||||||||||
Allowance for loan losses to gross loans receivable | 1.69 | 1.52 | 1.54 | 1.77 | 1.68 | |||||||||||||||
Capital ratios: | ||||||||||||||||||||
Equity to total assets at end of period | 9.79 | % | 11.12 | % | 12.92 | % | 14.87 | % | 16.68 | % | ||||||||||
Average equity to average assets | 9.49 | 11.94 | 13.92 | 15.78 | 12.93 | |||||||||||||||
Other data: | ||||||||||||||||||||
Number of full service offices | 11 | 7 | 7 | 7 | 6 | |||||||||||||||
Full-time equivalent employees | 306 | 239 | 209 | 158 | 130 | |||||||||||||||
Net income per common share: | ||||||||||||||||||||
Basic | $ | 3.63 | $ | 2.98 | $ | 1.52 | $ | 1.29 | $ | 1.76 | ||||||||||
Diluted | $ | 3.51 | $ | 2.93 | $ | 1.52 | $ | 1.29 | $ | 1.76 | ||||||||||
Book values: | ||||||||||||||||||||
Book value per common share | $ | 28.32 | (10) | $ | 25.18 | (9) | $ | 22.48 | (8) | $ | 20.55 | (7) | $ | 19.92 | (6) | |||||
__________________________
(1) Net interest income divided by average interest earning assets.
(2) Total noninterest expense as a percentage of net interest income and total other noninterest income.
(3) | Cash margins on loans sold net of deferred fees/costs. Mortgage loan program started in 2012; no activity related to loans held for sale in prior years. |
(4) | Non-performing assets consists of non-performing loans (which include non-accruing loans and accruing loans more than 90 days past due), foreclosed real estate and other repossessed assets. |
(5) Non-performing loans consists of non-accruing loans and accruing loans more than 90 days past due.
(6) | Book value per common share was calculated using shares outstanding of 3,240,125 at December 31, 2012, less unallocated employee stock ownership plan (“ESOP”) shares of 233,289. |
(7) | Book value per common share was calculated using shares outstanding of 3,240,125 at December 31, 2013, less unallocated ESOP shares of 207,368. |
(8) | Book value per common share was calculated using shares outstanding of 3,235,625 at December 31, 2014, less 125,105 shares of restricted stock, and unallocated ESOP shares of 181,447. |
(9) | Book value per common share was calculated using shares outstanding of 3,242,120 at December 31, 2015, less 94,684 shares of restricted stock, and unallocated ESOP shares of 155,526. |
(10) | Book value per common share was calculated using shares outstanding of 3,059,503 at December 31, 2016, less 68,763 shares of restricted stock, and unallocated ESOP shares of 129,605. |
55
Item 7. Management’s Discussion and Analysis of Financial Condition and Results of Operations
This discussion and analysis reviews our consolidated financial statements and other relevant statistical data and is intended to enhance your understanding of our financial condition and results of operations. The information in this section has been derived from the Consolidated Financial Statements and footnotes thereto that appear in Item 8 of this Form 10-K. The information contained in this section should be read in conjunction with these Consolidated Financial Statements and footnotes and the business and financial information provided in this Form 10-K.
Overview
FS Bancorp, Inc. and its subsidiary bank, 1st Security Bank of Washington have been serving the Puget Sound area since 1936. Originally chartered as a credit union, previously known as Washington’s Credit Union, the credit union served various select employment groups. On April 1, 2004, the credit union converted to a Washington state-chartered mutual savings bank. On July 9, 2012, the Bank converted from mutual to stock ownership and became the wholly owned subsidiary of FS Bancorp, Inc.
The Company is relationship-driven delivering banking and financial services to local families, local and regional businesses and industry niches within distinct Puget Sound area communities, and one loan production office located in the Tri-Cities, Washington during the fourth quarter of 2014. On January 22, 2016, the Company completed the previously announced Branch Purchase from Bank of America, N.A and acquired $186.4 million in deposits and $419,000 in loans based on financial information at that date. The four branches are located in the communities of Port Angeles, Sequim, Port Townsend, and Hadlock, Washington. The Branch Purchase expanded our Puget Sound-focused retail footprint onto the Olympic Peninsula and provided an opportunity to extend our unique brand of community banking into those communities.
The Company also maintains its long-standing indirect consumer lending platform which operates throughout the West Coast. The Company emphasizes long-term relationships with families and businesses within the communities served, working with them to meet their financial needs. The Company is actively involved in community activities and events within these market areas, which further strengthens our relationships within those markets.
The Company focuses on diversifying revenues, expanding lending channels, and growing the banking franchise. Management remains focused on building diversified revenue streams based upon credit, interest rate, and concentration risks. Our business plan remains as follows:
▪ | Growing and diversifying our loan portfolio; |
▪ | Maintaining strong asset quality; |
▪ | Emphasizing lower cost core deposits to reduce the costs of funding our loan growth; |
▪ | Capturing our customers’ full relationship by offering a wide range of products and services by leveraging our well-established involvement in our communities and by selectively emphasizing products and services designed to meet our customers’ banking needs; and |
▪ | Expanding the Company’s markets. |
The Company is a diversified lender with a focus on the origination of indirect home improvement loans, also referred to as fixture secured loans, commercial real estate mortgage loans, home loans, commercial business loans and second mortgage/home equity loan products. Consumer loans, in particular indirect home improvement loans to finance window replacement, gutter replacement, siding replacement, solar panels, and other improvement renovations, represent the largest portion of the loan portfolio and have traditionally been the mainstay of our lending strategy. At December 31, 2016, consumer loans represented 28.9% of the Company's total gross loan portfolio, down from 31.0% at December 31, 2015, as real estate loan originations have increased at a faster pace than consumer loan originations during the year ended December 31, 2016.
Indirect home improvement lending is dependent on the Bank’s relationships with home improvement contractors and dealers. The Company funded $71.2 million, or 5,000 loans during the year ended December 31, 2016, using its indirect home improvement contractor/dealer network located throughout Washington, Oregon, Idaho, and California with four contractor/dealers responsible for 50.5% of the funded loans dollar volume. The Company began originating consumer indirect loans in the State of California in 2012 with $2.5 million in these loans originated during 2012. In 2016, the Company originated $20.5 million in the State of California and held $36.5 million in California originated consumer loans at December 31, 2016. Management has established a concentration limit of no more than
56
100% of the Bank’s total risk-based capital. At December 31, 2016, the limit was $93.3 million. See Item 1A, “Risk Factors - Our business could suffer if we are unsuccessful in making, continuing and growing relationships with home improvement contractors and dealers” of this Form 10-K.
Since 2012, the Company has had an emphasis on diversifying lending products by expanding commercial real estate, commercial business and residential lending, while maintaining the current size of the consumer loan portfolio. The Company’s lending strategies are intended to take advantage of: (1) historical strength in indirect consumer lending, (2) recent market consolidation that has created new lending opportunities and the availability of experienced bankers, and (3) strength in relationship lending. Retail deposits will continue to serve as an important funding source. See Item 1, “Business: Lending Activities” and Item 1A, “Risk Factors - Risks Related to Our Business” in this Form 10-K.
The Company generally underwrites the one-to-four-family loans based on the applicant’s ability to repay. This includes employment and credit history and the appraised value of the subject property. The Company lends up to 100% of the lesser of the appraised value or purchase price for one-to-four-family first mortgage loans. For first mortgage loans with a loan-to-value ratio in excess of 80%, the Company generally requires either private mortgage insurance or government sponsored insurance in order to mitigate the higher risk level associated with higher loan-to-value loans. Fixed-rate loans secured by one-to-four-family residences have contractual maturities of up to 30 years and are generally fully amortizing, with payments due monthly. Adjustable-rate mortgage loans may pose different credit risks than fixed-rate loans, primarily because as interest rates increase, the borrower’s payments rise, increasing the potential for default. Properties securing the one-to-four-family loans are appraised by independent fee appraisers who are selected in accordance with industry and regulatory standards. The Company requires borrowers to obtain title and hazard insurance, and flood insurance, if necessary. Loans are generally underwritten to the secondary market guidelines with additional requirements as determined by the internal underwriting department.
The Company is significantly affected by prevailing economic conditions, as well as government policies and regulations concerning, among other things, monetary and fiscal affairs. Deposit flows are influenced by a number of factors, including interest rates paid on time deposits, other investments, account maturities, and the overall level of personal income and savings. Lending activities are influenced by the demand for funds, the number and quality of lenders, and regional economic cycles. Sources of funds for lending activities include primarily deposits, including brokered deposits, borrowings, payments on loans and income provided from operations.
The Company’s earnings are primarily dependent upon net interest income, the difference between interest income and interest expense. Interest income is a function of the balances of loans and investments outstanding during a given period and the yield earned on these loans and investments. Interest expense is a function of the amount of deposits and borrowings outstanding during the same period and interest rates paid on these deposits and borrowings. Another significant influence on the Company’s earnings is fee income from mortgage banking activities. The Company’s earnings are also affected by the provision for loan losses, service charges and fees, gains from sales of assets, operating expenses and income taxes.
Critical Accounting Policies and Estimates
Certain of the Company’s accounting policies are important to the portrayal of the Company’s financial condition, since they require management to make difficult, complex or subjective judgments, some of which may relate to matters that are inherently uncertain. Estimates associated with these policies are susceptible to material changes as a result of changes in facts and circumstances. Facts and circumstances which could affect these judgments include, but are not limited to, changes in interest rates, changes in the performance of the economy and changes in the financial condition of borrowers. Management believes that its critical accounting policies include determining the allowance for loan losses, the fair value of servicing rights, derivatives and hedging activity, and the accounting for deferred income taxes. The Company’s accounting policies are discussed in detail in Note 1 of the Notes to Consolidated Financial Statements included in Item 8, “Financial Statements and Supplementary Data” of this Form 10-K.
Allowance for Loan Loss. The allowance for loan losses is the amount estimated by management as necessary to cover probable losses inherent in the loan portfolio at the balance sheet date. The allowance is established through the provision for loan losses, which is charged to income. A high degree of judgment is necessary when determining the amount of the allowance for loan losses. Among the material estimates required to establish the allowance are: loss
57
exposure at default; the amount and timing of future cash flows on impacted loans; value of collateral; and determination of loss factors to be applied to the various elements of the portfolio. All of these estimates are susceptible to significant change. Management reviews the level of the allowance at least quarterly and establishes the provision for loan losses based upon an evaluation of the portfolio, past loss experience, current economic conditions and other factors related to the collectability of the loan portfolio. Although the Company believes that use of the best information available to establish the allowance for loan losses, future adjustments to the allowance may be necessary if economic conditions differ substantially from the assumptions used in making the evaluation. As the Company adds new products to the loan portfolio and expands the Company’s market area, management intends to enhance and adapt the methodology to keep pace with the increased size and complexity of the loan portfolio. Changes in any of the above factors could have a significant effect on the calculation of the allowance for loan losses in any given period. Management believes that its systematic methodology continues to be appropriate given the Company’s increased size and level of complexity.
Servicing Rights. Servicing assets are recognized as separate assets when rights are acquired through the purchase or through the sale of financial assets. Generally, purchased servicing rights are capitalized at the cost to acquire the rights. For sales of mortgage, commercial and consumer loans, a portion of the cost of originating the loan is allocated to the servicing right based on relative fair value. Fair value is based on market prices for comparable mortgage, commercial, or consumer servicing contracts, when available, or alternatively, is based on a valuation model that calculates the present value of estimated future net servicing income. The valuation model incorporates assumptions that market participants would use in estimating future net servicing income, such as the cost to service, the discount rate, the custodial earnings rate, an inflation rate, ancillary income, prepayment speeds, and default rates and losses. Servicing assets are evaluated quarterly for impairment based upon the fair value of the rights as compared to amortized cost. Impairment is determined by stratifying rights into tranches based on predominant characteristics, such as interest rate, loan type, and investor type. Impairment is recognized through a valuation allowance for an individual tranche, to the extent that fair value is less than the capitalized amount for the tranches. If the Company later determines that all or a portion of the impairment no longer exists for a particular tranche, a reduction of the allowance may be recorded as a recovery and an increase to income. Capitalized servicing rights are stated separately on the consolidated balance sheets and are amortized into noninterest income in proportion to, and over the period of, the estimated future net servicing income of the underlying financial assets.
Derivative and Hedging Activity. ASC 815, “Derivatives and Hedging,” requires that derivatives of the Company be recorded in the consolidated financial statements at fair value. Management considers its accounting policy for derivatives to be a critical accounting policy because these instruments have certain interest rate risk characteristics that change in value based upon changes in the capital markets. The Company’s derivatives are primarily the result of its mortgage banking activities in the form of commitments to extend credit, commitments to sell loans, To-Be-Announced (“TBA”) mortgage backed securities trades and option contracts to mitigate the risk of the commitments to extend credit. Estimates of the percentage of commitments to extend credit on loans to be held for sale that may not fund are based upon historical data and current market trends. The fair value adjustments of the derivatives are recorded in the Consolidated Statements of Income with offsets to other assets or other liabilities in the Consolidated Balance Sheets.
Income Taxes. Income taxes are reflected in the Company’s consolidated financial statements to show the tax effects of the operations and transactions reported in the consolidated financial statements and consist of taxes currently payable plus deferred taxes. Accounting Standards Codification, ASC 740, “Accounting for Income Taxes,” requires the asset and liability approach for financial accounting and reporting for deferred income taxes. Deferred tax assets and liabilities result from differences between the financial statement carrying amounts and the tax bases of assets and liabilities. They are reflected at currently enacted income tax rates applicable to the period in which the deferred tax assets or liabilities are expected to be realized or settled and are determined using the assets and liability method of accounting. The deferred income provision represents the difference between net deferred tax asset/liability at the beginning and end of the reported period. In formulating the deferred tax asset, the Company is required to estimate income and taxes in the jurisdiction in which the Company operates. This process involves estimating the actual current tax exposure for the reported period together with assessing temporary differences resulting from differing treatment of items, such as depreciation and the provision for loan losses, for tax and financial reporting purposes.
Deferred tax liabilities occur when taxable income is smaller than reported income on the income statements due to accounting valuation methods that differ from tax, as well as tax rate estimates and payments made quarterly and adjusted to actual at the end of the year. Deferred tax liabilities are temporary differences payable in future periods.
58
The Company had a net deferred tax liability of $1.2 million, and $1.3 million, at December 31, 2016 and 2015, respectively.
Our Business and Operating Strategy and Goals
The Company’s primary objective is to operate 1st Security Bank of Washington as a well capitalized, profitable, independent, community-oriented financial institution, serving customers in its primary market area defined generally as the greater Puget Sound market area. The Company’s strategy is to provide innovative products and superior service to small businesses, industry and geographic niches, and individuals located in its primary market area. Services are currently provided to communities through the main office and seven full-service banking centers. These banking centers are supported with 24/7 access to on-line banking and participation in a worldwide ATM network.
The Company focuses on diversifying revenues, expanding lending channels, and growing the banking franchise. Management remains focused on building diversified revenue streams based upon credit, interest rate, and concentration risks. The Board of Directors seeks to accomplish the Company’s objectives through the adoption of a strategy designed to improve profitability and maintain a strong capital position and high asset quality. This strategy primarily involves:
Growing and diversifying the loan portfolio and revenue streams. The Company intends to transition lending activities from a predominantly consumer-driven model to a more diversified consumer and business model by emphasizing three key lending initiatives: expansion of commercial business lending programs, increasing in-house originations of residential mortgage loans primarily for sale into the secondary market through the mortgage banking program; and commercial real estate lending. Additionally, the Company will seek to diversify the loan portfolio by increasing lending to small businesses in the market area, as well as residential construction lending.
Maintaining strong asset quality. The Company believes that strong asset quality is a key to long-term financial success. The percentage of non-performing loans to total gross loans was 0.1% and 0.2% for December 31, 2016 and 2015, respectively. The Company’s percentage of non-performing assets to total assets at December 31, 2016 was 0.1% and 0.2% at December 31, 2015. The Company has actively managed the delinquent loans and non-performing assets by aggressively pursuing the collection of consumer debts and marketing saleable properties upon which were foreclosed or repossessed, work-outs of classified assets and loan charge-offs. In the past several years, the Company also began emphasizing consumer loan originations to borrowers with higher credit scores, generally credit scores over 720 (although the policy allows us to go lower), which has led to lower charge-offs in recent periods. Although the Company plans to place more emphasis on certain lending products, such as commercial and multi-family real estate loans, construction and development loans, including speculative residential construction loans, and commercial business loans, while growing the current size of the one-to-four-family residential mortgage loans and the consumer loan portfolios, the Company continues to manage its credit exposures through the use of experienced bankers and an overall conservative approach to lending.
Emphasizing lower cost core deposits to reduce the costs of funding loan growth. The Company offers personal and business checking accounts, NOW accounts and savings and money market accounts, which generally are lower-cost sources of funds than certificates of deposit, and are less sensitive to withdrawal when interest rates fluctuate. In order to build a core deposit base, the Company is pursuing a number of strategies. First, a diligent attempt to recruit all commercial loan customers to maintain a deposit relationship with the Company, generally a business checking account relationship to the extent practicable, for the term of their loan. Second, interest rate promotions are provided on savings and checking accounts from time to time to encourage the growth of these types of deposits. Third, by hiring experienced personnel with relationships in the communities we serve.
Capturing customers’ full relationship. The Company offers a wide range of products and services that provide diversification of revenue sources and solidify the relationship with the Bank’s customers. The Company focuses on core retail and business deposits, including savings and checking accounts, that lead to long-term customer retention. As part of the commercial lending process cross-selling the entire business banking relationship, including deposit relationships and business banking products, such as online cash management, treasury management, wires, direct deposit, payment processing and remote deposit capture.
59
The Company’s mortgage banking program also provides opportunities to cross-sell products to new customers.
Expanding the Company’s markets. In addition to deepening relationships with existing customers, the Company intends to expand business to new customers by leveraging the Company’s well-established involvement in the community and by selectively emphasizing products and services designed to meet their banking needs. The Company also intends to pursue expansion in other market areas through selective growth of the home lending network. As an example, through the Branch Purchase, the Company expanded its retail market area onto the Olympic Peninsula into the communities of Port Angeles, Sequim, Port Townsend, and Hadlock, Washington. See Note 2 to the Notes to the Consolidated Financial Statements included in Item 8, “Financial Statements and Supplementary Data” of this Form 10-K.
Comparison of Financial Condition at December 31, 2016 and December 31, 2015
Assets. Total assets increased $150.4 million, or 22.2%, to $827.9 million at December 31, 2016, from $677.6 million at December 31, 2015, primarily the result of an increase in loans receivable, net of $90.8 million, securities available-for-sale of $26.7 million, cash and cash equivalents of $12.0 million, loans held for sale of $7.6 million, certificates of deposit at other financial institutions of $2.8 million, other assets of $2.8 million, and capitalized servicing rights of $2.6 million. The increase in assets was primarily funded by cash received from the deposits acquired in the Branch Purchase.
Loans receivable, net, increased $90.8 million, or 18.1%, to $593.3 million at December 31, 2016, from $502.5 million at December 31, 2015. The increase in loans receivable, net was primarily a result of a $59.4 million increase in total real estate loans, including increases in one-to-four-family loans of $21.1 million, multi-family loans of $15.3 million, construction and development loans of $13.7 million, commercial real estate loans of $5.8 million, and home equity loans of $3.5 million, as well as increases in commercial business loans of $18.3 million, and consumer loans of $16.4 million.
Loans held for sale, consisting of one-to-four-family loans, increased by $7.6 million, or 17.0%, to $52.6 million at December 31, 2016, compared to $44.9 million for the prior year due to increased loan originations and the timing difference between loan fundings and loan sale settlements. The Company continues to expand its home lending operations by hiring additional lending staff and will continue selling one-to-four-family mortgage loans into the secondary market for asset/liability management purposes.
One-to-four-family originations of loans held for sale, including loans brokered to other institutions, increased 34.4% to $779.8 million during the year ended December 31, 2016, compared to $580.0 million for the prior year. The growth in originations was a result of increased purchase activity associated with the strong home purchase demand in the Pacific Northwest and the continued favorable market interest rates which have also sustained the market for customer refinances.
The allowance for loan losses at December 31, 2016 was $10.2 million, or 1.7% of gross loans receivable, excluding loans held for sale, compared to $7.8 million, or 1.5% of gross loans receivable, excluding loans held for sale, at December 31, 2015. Substandard loans increased $5.1 million, or 170.1%, to $8.0 million at December 31, 2016, compared to $3.0 million at December 31, 2015, primarily due to seven commercial lines of credit totaling $5.3 million that were downgraded as a result of the financial performance of the borrowers. Non-performing loans, consisting of non-accruing loans, decreased $296,000, or 29.1%, to $721,000 at December 31, 2016, from $1.0 million at December 31, 2015. At December 31, 2016, non-performing loans consisted of $511,000 of consumer loans, and $210,000 of home equity loans.
Non-performing loans to total loans decreased to 0.1% at December 31, 2016, compared to 0.2% at December 31, 2015. There was no other real estate owned at December 31, 2016 and 2015. The Company had one TDR loan with a balance of $57,000 at December 31, 2016, which was performing in accordance with its modified terms, compared to three TDR loans totaling $734,000 at December 31, 2015, of which one loan with a balance of $525,000 was placed on non-accrual, and the remaining two TDR loans totaling $209,000 were performing in accordance with their modified terms. See Item 1, “Business - Lending Activities - Asset Quality” of this Form 10-K for additional information regarding the Company’s non-performing loans.
60
Liabilities. Total liabilities increased $144.7 million, or 24.0%, to $746.9 million at December 31, 2016, from $602.2 million at December 31, 2015, due primarily to the Branch Purchase in the first quarter of 2016. Deposits increased $227.4 million, or 46.9% to $712.6 million from $485.2 million at December 31, 2015. Relationship-based transactional accounts (noninterest-bearing checking, interest-bearing checking, and escrow accounts) increased $112.7 million, or 106.0%, to $219.0 million as of December 31, 2016, from $106.3 million at December 31, 2015. Money market and savings accounts increased $108.1 million, or 57.0%, to $297.8 million at December 31, 2016, from $189.7 million at December 31, 2015. Time deposits increased $6.6 million, or 3.5%, to $195.7 million at December 31, 2016, from $189.1 million at December 31, 2015. Non-retail certificates of deposit which include brokered certificates of deposit, online certificates of deposit, and public funds, increased $13.9 million, or 30.0%, to $60.2 million, at December 31, 2016, compared to $46.3 million at December 31, 2015. Management remains focused on growth in lower cost relationship-based deposits.
At December 31, 2016, total debt was $22.5 million consisting of borrowings of $12.7 million and a subordinated note, net of $9.8 million, compared to a total debt of $108.6 million at December 31, 2015. Borrowings decreased $86.1 million, or 87.2%, to $12.7 million at December 31, 2016, from $98.8 million at December 31, 2015, primarily due to the cash received in the Branch Purchase being utilized to repay FHLB advances.
Stockholders’ Equity. Total stockholders’ equity increased $5.7 million, or 7.6%, to $81.0 million at December 31, 2016, from $75.3 million at December 31, 2015. The increase in stockholders’ equity was predominately a result of net income of $10.5 million, primarily offset by $4.9 million in common stock repurchases. During the year ended December 31, 2016, the Company repurchased 198,000 shares of its common stock, of which 193,000 shares were purchased in accordance with its stock repurchase plan at an average price per share of $24.79. The Company’s stock repurchase plan announced on July 28, 2015, ended on August 31, 2016. Book value per common share was $28.32 at December 31, 2016, compared to $25.18 at December 31, 2015.
61
Average Balances, Interest and Average Yields/Cost
The following table sets forth for the periods indicated, information regarding average balances of assets and liabilities as well as the total dollar amounts of interest income from average interest-earning assets and interest expense on average interest-bearing liabilities, resultant yields, interest rate spread, net interest margin (otherwise known as net yield on interest-earning assets), and the ratio of average interest-earning assets to average interest-bearing liabilities. Also presented is the weighted average yield on interest-earning assets, rates paid on interest-bearing liabilities and the resultant spread at December 31, 2016. Income and all average balances are monthly average balances. Non-accruing loans have been included in the table as loans carrying a zero yield.
At December 31, | Years Ended December 31, | ||||||||||||||||||||||||||||||||||
(Dollars in thousands) | 2016 | 2016 | 2015 | 2014 | |||||||||||||||||||||||||||||||
Interest-earning assets: | Yield/ Rate | Average Balance Outstanding | Interest Earned Paid | Yield/ Rate | Average Balance Outstanding | Interest Earned Paid | Yield/ Rate | Average Balance Outstanding | Interest Earned Paid | Yield/ Rate | |||||||||||||||||||||||||
Loans receivable, net and loans held for sale (1) | 5.58 | % | $ | 618,557 | $ | 35,772 | 5.78 | % | $ | 490,774 | $ | 30,418 | 6.20 | % | $ | 353,792 | $ | 23,615 | 6.67 | % | |||||||||||||||
Mortgage-backed securities | 1.99 | 38,515 | 793 | 2.06 | 18,975 | 380 | 2.00 | 27,314 | 534 | 1.96 | |||||||||||||||||||||||||
Investment securities | 2.17 | 41,378 | 895 | 2.16 | 30,068 | 669 | 2.22 | 30,449 | 618 | 2.03 | |||||||||||||||||||||||||
FHLB stock | 3.50 | 2,047 | 50 | 2.44 | 2,201 | 42 | 1.91 | 1,733 | 2 | 0.12 | |||||||||||||||||||||||||
Interest-bearing deposits at other financial institutions | 1.07 | 64,165 | 510 | 0.79 | 17,473 | 198 | 1.13 | 19,446 | 73 | 0.38 | |||||||||||||||||||||||||
Total interest-earning assets (1) | 5.01 | % | 764,662 | 38,020 | 4.97 | % | 559,491 | 31,707 | 5.67 | % | 432,734 | 24,842 | 5.74 | % | |||||||||||||||||||||
Interest-bearing liabilities: | |||||||||||||||||||||||||||||||||||
Savings and money market | 0.33 | % | 280,660 | 1,019 | 0.36 | % | 186,151 | 982 | 0.53 | % | 142,967 | 609 | 0.43 | % | |||||||||||||||||||||
Interest-bearing checking | 0.05 | 53,310 | 27 | 0.05 | 30,740 | 25 | 0.08 | 27,123 | 28 | 0.10 | |||||||||||||||||||||||||
Certificates of deposit | 1.16 | 192,347 | 2,208 | 1.15 | 182,263 | 2,222 | 1.22 | 144,476 | 1,797 | 1.24 | |||||||||||||||||||||||||
Borrowings | 1.19 | 26,278 | 226 | 0.86 | 38,960 | 285 | 0.73 | 22,714 | 268 | 1.18 | |||||||||||||||||||||||||
Subordinated note | 6.82 | 9,814 | 683 | 6.96 | 2,120 | 144 | 6.79 | — | — | — | |||||||||||||||||||||||||
Total interest-bearing liabilities | 0.71 | % | 562,409 | 4,163 | 0.74 | % | 440,234 | 3,658 | 0.83 | % | 337,280 | 2,702 | 0.80 | % | |||||||||||||||||||||
Net interest income | $ | 33,857 | $ | 28,049 | $ | 22,140 | |||||||||||||||||||||||||||||
Net interest rate spread | 4.30 | % | 4.23 | % | 4.84 | % | 4.94 | % | |||||||||||||||||||||||||||
Net earning assets | $ | 202,253 | $ | 119,257 | $ | 95,454 | |||||||||||||||||||||||||||||
Net interest margin | N/A | 4.43 | % | 5.01 | % | 5.12 | % | ||||||||||||||||||||||||||||
Average interest-earning assets to average interest-bearing liabilities | 135.96 | % | 127.09 | % | 128.30 | % | |||||||||||||||||||||||||||||
_____________________________________________
(1) The average loans receivable, net balances include non-accruing loans.
62
Rate/Volume Analysis
The following table presents the dollar amount of changes in interest income and interest expense for major components of interest-earning assets and interest-bearing liabilities. It distinguishes between the changes related to outstanding balances and that due to the changes in interest rates. For each category of interest-earning assets and interest-bearing liabilities, information is provided on changes attributable to (i) changes in volume (i.e., changes in volume multiplied by old rate) and (ii) changes in rate (i.e., changes in rate multiplied by old volume). For purposes of this table, changes attributable to both rate and volume, which cannot be segregated, have been allocated proportionately to the change due to volume and the change due to rate.
Years Ended December 31, 2016 vs. 2015 | Years Ended December 31, 2015 vs. 2014 | ||||||||||||||||||||||
(In thousands) | Increase (Decrease) Due to | Total Increase (Decrease) | Increase (Decrease) Due to | Total Increase (Decrease) | |||||||||||||||||||
Interest-earning assets: | Volume | Rate | Volume | Rate | |||||||||||||||||||
Loans receivable, net and loans held for sale(1) | $ | 7,920 | $ | (2,566 | ) | $ | 5,354 | $ | 9,143 | $ | (2,340 | ) | $ | 6,803 | |||||||||
Mortgage-backed securities | 391 | 22 | 413 | (163 | ) | 9 | (154 | ) | |||||||||||||||
Investment securities | 252 | (26 | ) | 226 | (8 | ) | 59 | 51 | |||||||||||||||
FHLB stock | (3 | ) | 11 | 8 | 1 | 39 | 40 | ||||||||||||||||
Interest-bearing deposits at other financial institutions | 529 | (217 | ) | 312 | (7 | ) | 132 | 125 | |||||||||||||||
Total interest-earning assets(1) | $ | 9,089 | $ | (2,776 | ) | $ | 6,313 | $ | 8,966 | $ | (2,101 | ) | $ | 6,865 | |||||||||
Interest-bearing liabilities: | |||||||||||||||||||||||
Savings and money market | $ | 499 | $ | (462 | ) | $ | 37 | $ | 184 | $ | 189 | $ | 373 | ||||||||||
Interest-bearing checking | 18 | (16 | ) | 2 | 4 | (7 | ) | (3 | ) | ||||||||||||||
Certificates of deposit | 123 | (137 | ) | (14 | ) | 470 | (45 | ) | 425 | ||||||||||||||
Borrowings | (93 | ) | 34 | (59 | ) | 192 | (175 | ) | 17 | ||||||||||||||
Subordinated note | 523 | 16 | 539 | 144 | — | 144 | |||||||||||||||||
Total interest-bearing liabilities | $ | 1,070 | $ | (565 | ) | $ | 505 | $ | 994 | $ | (38 | ) | $ | 956 | |||||||||
Net change in interest income | $ | 5,808 | $ | 5,909 | |||||||||||||||||||
____________________
(1) The average loans receivable, net balances include non-accruing loans.
Comparison of Results of Operations for the Years Ended December 31, 2016 and 2015
General. Net income for the year ended December 31, 2016, increased $1.6 million, or 18.3%, to $10.5 million, from $8.9 million for the year ended December 31, 2015. The increase in net income was primarily a result of a $6.3 million, or 19.9% increase in interest income, and a 6.0 million, or 34.0% increase in noninterest income, partially offset by a $9.3 million, or 31.3% increase in noninterest expense, a $731,000, or 15.0% increase in the provision for income tax expense and $505,000, or 13.8% increase in interest expense.
Net Interest Income. Net interest income increased $5.8 million, or 20.7%, to $33.9 million for the year ended December 31, 2016, from $28.0 million for the year ended December 31, 2015. The increase in net interest income was primarily attributable to a $5.4 million, or 17.6% increase in loan receivable interest income resulting from a $127.8 million increase in average loans receivable, net and loans held for sale over the last year, a $1.0 million, or 74.4% increase in interest and dividends on investment securities, and cash and cash equivalents, primarily offset by a $539,000, or 374.3% increase in subordinated note interest expense. The subordinated note was issued on October 15, 2015.
63
The net interest margin (“NIM”) decreased 58 basis points to 4.43% for the year ended December 31, 2016, from 5.01% for the same period last year. The decreased NIM reflects continued growth in diversified, lower yielding assets including loan and investment assets. As a percentage, consumer loans to total loans were 28.9% at December 31, 2016, compared to 31.0% at December 31, 2015, reflecting our loan diversification strategy. The average cost of funds for total interest-bearing liabilities decreased nine basis points to 0.74% for the year ended December 31, 2016, from 0.83% for the year ended December 31, 2015. The decrease primarily reflects a significant amount of relatively low cost relationship-based transactional deposits acquired in the Branch Purchase and the decline in the percentage of higher cost certificates of deposit to total deposits over the last year. The decrease does not reflect the $152.9 million in noninterest-bearing deposits that reduced our overall cost of deposits. Management remains focused on matching deposit duration with the duration of earning assets where appropriate.
Interest Income. Interest income for the year ended December 31, 2016, increased $6.3 million, or 19.9%, to $38.0 million, from $31.7 million for the year ended December 31, 2015. The increase during the year was primarily attributable to an increase in the average balance of net loans receivable and loans held for sale to $618.6 million for the year ended December 31, 2016, compared to $490.8 million for the year ended December 31, 2015, partially offset by a 70 basis point decline in the average yield on interest-earning assets to 4.97% during the year ended December 31, 2016, from 5.67% for the prior year. The average yield on loans receivable, net and loans held for sale declined to 5.78% during the year ended December 31, 2016, from 6.20% for the prior year.
The following table compares average earning asset balances, associated yields, and resulting changes in interest income for the years ended December 31, 2016 and 2015:
Years Ended December 31, | |||||||||||||||||
(Dollars in thousands) | 2016 | 2015 | Increase in Interest Income | ||||||||||||||
Average Balance Outstanding | Yield/Rate | Average Balance Outstanding | Yield/Rate | ||||||||||||||
Loans receivable, net and loans held for sale (1) | $ | 618,557 | 5.78 | % | $ | 490,774 | 6.20 | % | $ | 5,354 | |||||||
Mortgage-backed securities | 38,515 | 2.06 | 18,975 | 2.00 | 413 | ||||||||||||
Investment securities | 41,378 | 2.16 | 30,068 | 2.22 | 226 | ||||||||||||
FHLB stock | 2,047 | 2.44 | 2,201 | 1.91 | 8 | ||||||||||||
Interest-bearing deposits at other financial institutions | 64,165 | 0.79 | 17,473 | 1.13 | 312 | ||||||||||||
Total interest-earning assets | $ | 764,662 | 4.97 | % | $ | 559,491 | 5.67 | % | $ | 6,313 | |||||||
____________________
(1) The average loans receivable, net balances include non-accruing loans.
Interest Expense. Interest expense increased $505,000, or 13.8%, to $4.2 million for the year ended December 31, 2016, from $3.7 million for the prior year. The increase was primarily attributable to the $539,000, or 374.3% increase in subordinated note interest expense to $683,000 for the year ended December 31, 2016, reflecting a full year of interest expense, compared to $144,000 for the year ended December 31, 2015, primarily offset by the reduction of interest paid on borrowings of $59,000. The average cost of funds for total interest-bearing liabilities decreased nine basis points to 0.74% for the year ended December 31, 2016, compared to 0.83% for the year ended December 31, 2015. The decrease does not reflect the $152.9 million in noninterest-bearing deposits that reduced our overall cost of deposits. The average cost of deposits (excluding noninterest-bearing deposits) decreased 21 basis points to 0.48% for the year ended December 31, 2016, compared to 0.69% for the year ended December 31, 2015, reflecting the significant amount of relatively low cost relationship-based transactional deposits acquired in the Branch Purchase and the decline in the percentage of higher cost certificates of deposit to total deposits over the last year.
64
The following table details average balances for cost of funds and the change in interest expense for the years ended December 31, 2016 and 2015:
Years Ended December 31, | |||||||||||||||||
(Dollars in thousands) | 2016 | 2015 | Increase (Decrease) in Interest Expense | ||||||||||||||
Average Balance Outstanding | Yield | Average Balance Outstanding | Yield | ||||||||||||||
Savings and money market | $ | 280,660 | 0.36 | % | $ | 186,151 | 0.53 | % | $ | 37 | |||||||
Interest-bearing checking | 53,310 | 0.05 | 30,740 | 0.08 | 2 | ||||||||||||
Certificates of deposit | 192,347 | 1.15 | 182,263 | 1.22 | (14 | ) | |||||||||||
Borrowings | 26,278 | 0.86 | 38,960 | 0.73 | (59 | ) | |||||||||||
Subordinated note | 9,814 | 6.96 | 2,120 | 6.79 | 539 | ||||||||||||
Total interest-bearing liabilities | $ | 562,409 | 0.74 | % | $ | 440,234 | 0.83 | % | $ | 505 | |||||||
Provision for Loan Losses. The provision for loan losses was $2.4 million for the year ended December 31, 2016, compared to $2.3 million for the year ended December 31, 2015. The increase in the provision primarily relates to the significant increases in real estate loans, specifically, one-to-four-family, construction and development, and multi-family loans, compared to the prior year. Substandard loans increased $5.0 million, or 166.7%, to $8.0 million at December 31, 2016, compared to $3.0 million at December 31, 2015. The increase in substandard loans from one year ago was primarily due to the downgrade of seven commercial lines of credit totaling $5.3 million as a result of the financial performance of the borrowers. Non-performing loans reduced to $721,000, or 0.1% of total gross loans at December 31, 2016, compared to $1.0 million, or 0.2% of total gross loans at December 31, 2015. During the year ended December 31, 2016, net recoveries totaled $26,000 compared to net charge-offs of $555,000 during the year ended December 31, 2015.
The following table details activity and information related to the allowance for loan losses for the years ended December 31, 2016 and 2015:
At or For the Years Ended December 31, | |||||||
(Dollars in thousands) | 2016 | 2015 | |||||
Provision for loan losses | $ | 2,400 | $ | 2,250 | |||
Net (recoveries) charge-offs | $ | (26 | ) | $ | 555 | ||
Allowance for loan losses | $ | 10,211 | $ | 7,785 | |||
Allowance for loan losses as a percentage of total gross loans receivable at the end of the year | 1.7 | % | 1.5 | % | |||
Non-accrual and 90 days or more past due loans | $ | 721 | $ | 1,017 | |||
Allowance for loan losses as a percentage of non-performing loans at end of year | 1,416.2 | % | 765.5 | % | |||
Non-accrual and 90 days or more past due loans as a percentage of gross loans receivable at the end of the year | 0.1 | % | 0.2 | % | |||
Total gross loans | $ | 605,415 | $ | 511,282 | |||
Management considers the allowance for loan losses at December 31, 2016, to be adequate to cover probable losses inherent in the loan portfolio based on the assessment of the above-mentioned factors affecting the loan portfolio. While management believes the estimates and assumptions used in its determination of the adequacy of the allowance are reasonable, there can be no assurance that such estimates and assumptions will not be proven incorrect in the future, or that the actual amount of future provisions will not exceed the amount of past provisions or that any increased provisions that may be required will not adversely impact the Company’s financial condition and results of operations. In addition, the determination of the amount of allowance for loan losses is subject to review by bank regulators, as part of the routine examination process, which may result in the establishment of additional reserves based upon their judgment of information available to them at the time of their examination.
65
Noninterest Income. Noninterest income increased $6.0 million, or 34.0%, to $23.6 million for the year ended December 31, 2016, from $17.6 million for the year ended December 31, 2015. The following table provides a detailed analysis of the changes in the components of noninterest income:
Years Ended December 31, | Increase | |||||||||||||
(Dollars in thousands) | 2016 | 2015 | Amount | Percent | ||||||||||
Service charges and fee income | $ | 3,391 | $ | 1,977 | $ | 1,414 | 71.5 | % | ||||||
Gain on sale of loans | 19,058 | 14,672 | 4,386 | 29.9 | ||||||||||
Gain on sale of investment securities | 146 | 76 | 70 | 92.1 | ||||||||||
Earnings on cash surrender value of BOLI | 282 | 216 | 66 | 30.6 | ||||||||||
Other noninterest income | 692 | 652 | 40 | 6.1 | ||||||||||
Total noninterest income | $ | 23,569 | $ | 17,593 | $ | 5,976 | 34.0 | % | ||||||
The $4.4 million increase in gain on sale of loans was primarily a result of increased loan originations resulting in additional sales of mortgage loans to the secondary market as part of the Company’s mortgage lending operations. In addition, for the year ended December 31, 2016, we recorded a net gain of $3.1 million for changes in the valuation of derivatives carried at fair value, compared to a net gain of $1.9 for the year ended December 31, 2015, which are included in gain on sale of loans. These adjustments in fair value primarily reflect changes in loan volume and interest rate lock commitments issued as a result of subsequent changes in the level of market interest rates. See Note 17 of the Notes to Consolidated Financial Statements included in Item 8, “Financial Statements and Supplementary Data” of this Form 10-K. During the year ended December 31, 2016, the Company originated $770.2 million of one-to-four-family consumer martgages during 2016 and sold $711.7 million to investors, compared to sales of $551.5 million during the year ended December 31, 2015. In addition, the margin on loans sold increased to 2.64% for the year ended December 31 2016, from 2.58% a year ago.
The $1.4 million increase in service charges and fee income was primarily due to a $1.1 million increase in service charges and fee income primarily associated with the Branch Purchase, growth in the number of home loans serviced by the Bank, and a $294,000 increase in loan fees.
Noninterest Expense. Noninterest expense increased $9.3 million, or 31.3%, to $38.9 million for the year ended December 31, 2016, compared to $29.6 million for the year ended December 31, 2015. The following table provides an analysis of the changes in the components of noninterest expense:
Years Ended December 31, | Increase (Decrease) | |||||||||||||
(Dollars in thousands) | 2016 | 2015 | Amount | Percent | ||||||||||
Salaries and benefits | $ | 21,982 | $ | 16,732 | $ | 5,250 | 31.4 | % | ||||||
Operations | 6,000 | 4,376 | 1,624 | 37.1 | ||||||||||
Occupancy | 2,404 | 1,867 | 537 | 28.8 | ||||||||||
Data processing | 2,134 | 1,573 | 561 | 35.7 | ||||||||||
Gain on sale of OREO | (150 | ) | — | (150 | ) | (100.0 | ) | |||||||
Loan costs | 2,505 | 1,547 | 958 | 61.9 | ||||||||||
Professional and board fees | 1,943 | 1,658 | 285 | 17.2 | ||||||||||
FDIC insurance | 487 | 305 | 182 | 59.7 | ||||||||||
Marketing and advertising | 710 | 709 | 1 | 0.1 | ||||||||||
Acquisition costs | 389 | 876 | (487 | ) | (55.6 | ) | ||||||||
Amortization of core deposit intangible | 522 | — | 522 | 100.0 | ||||||||||
Recovery on servicing rights | (3 | ) | — | (3 | ) | (100.0 | ) | |||||||
Total noninterest expense | $ | 38,923 | $ | 29,643 | $ | 9,280 | 31.3 | % | ||||||
Salaries and benefits increased $5.3 million, or 31.4%, which includes $3.7 million of commissions and incentives for the loan production staff reflecting our increased loan production, as well as $783,000 of share-based compensation associated with the equity incentive plan with the remainder of the increase in salaries and benefits due
66
to additional staff added as a result of the Branch Purchase. At December 31, 2016, the Company employed 306 full-time equivalent employees compared to 239 at December 31, 2015. Other expense categories also increased due primarily to the Branch Purchase and Company growth. These expenses include a $1.6 million, or 37.1% increase in operations costs, a $958,000, or 61.9% increase in loan costs, a $561,000, or 35.7% increase in data processing, a $537,000, or 28.8% increase in occupancy, and a $285,000, or 17.2% increase in professional fees, partially offset by a decrease of $487,000 in acquisition costs. We also recorded $522,000 in amortization from the core deposit intangible attributable to the Branch Purchase during the year ended December 31, 2016, as compared to none in the same period last year.
The efficiency ratio, which is noninterest expense as a percentage of net interest income and noninterest income, weakened to 67.8% for the year ended December 31, 2016, compared to 65.0% for the year ended December 31, 2015. The slight increase in the efficiency ratio was primarily attributable to a slightly greater increase in noninterest expense compared to the increases in net interest income and noninterest income. By definition, a lower efficiency ratio would be an indication that the Company is more efficiently utilizing resources to generate income.
Provision for Income Tax. During the year ended December 31, 2016, the Company recorded a provision for income tax expense of $5.6 million on pre-tax income compared to $4.9 million for the year ended December 31, 2015. The effective tax rate for the year ended December 31, 2016 was 34.8%, compared to 35.4% for the year ended December 31, 2015. At December 31, 2016 and 2015, there was a $1.2 million and $1.3 million net deferred tax liability, respectively.
Asset and Liability Management and Market Risk
Risk When Interest Rates Change. The rates of interest the Company earns on assets and pays on liabilities generally is established contractually for a period of time. Market rates change over time. Like other financial institutions, the Company’s results of operations are impacted by changes in interest rates and the interest rate sensitivity of the Company’s assets and liabilities. The risk associated with changes in interest rates and the Company’s ability to adapt to these changes is known as interest rate risk and is the most significant market risk.
How The Company Measures Risk of Interest Rate Changes. As part of an attempt to manage exposure to changes in interest rates and comply with applicable regulations, the Company monitors interest rate risk. In doing so, the Company analyzes and manages assets and liabilities based on their interest rates and payment streams, timing of maturities, repricing opportunities, and sensitivity to actual or potential changes in market interest rates.
The Company is subject to interest rate risk to the extent that its interest-bearing liabilities, primarily deposits and FHLB advances, reprice more rapidly or at different rates than the interest-earning assets. In order to minimize the potential for adverse effects of material prolonged increases or decreases in interest rates on the Company’s results of operations, the Company has adopted an Asset and Liability Management Policy. The Board of Directors sets the Asset and Liability Management Policy for the Bank, which is implemented by the asset/liability committee (“ALCO”), an internal management committee. The board level oversight for ALCO is performed by the audit committee of the Board of Directors.
The purpose of the ALCO is to communicate, coordinate, and control asset/liability management consistent with the business plan and board-approved policies. The committee establishes and monitors the volume and mix of assets and funding sources, taking into account relative costs and spreads, interest rate sensitivity and liquidity needs. The objectives are to manage assets and funding sources to produce results that are consistent with liquidity, capital adequacy, growth, risk and profitability goals.
The committee generally meets monthly to, among other things, protect capital through earnings stability over the interest rate cycle; maintain the Bank’s well capitalized status; and provide a reasonable return on investment. The committee recommends appropriate strategy changes based on this review. The committee is responsible for reviewing and reporting the effects of the policy implementations and strategies to the Board of Directors at least quarterly. The Chief Financial Officer oversees the process on a daily basis.
A key element of the Bank’s asset/liability management plan is to protect net earnings by managing the maturity or repricing mismatch between interest-earning assets and rate-sensitive liabilities. The Company seeks to accomplish this by extending funding maturities through wholesale funding sources, including the use of FHLB advances and brokered certificates of deposit, and through asset management, including the use of adjustable-rate loans and selling
67
certain fixed-rate loans in the secondary market. Management is also focused on matching deposit duration with the duration of earning assets as appropriate.
As part of the efforts to monitor and manage interest rate risk, a number of indicators are used to monitor overall risk. Among the measurements are:
Market Risk. Market risk is the potential change in the value of investment securities if interest rates change. This change in value impacts the value of the Company and the liquidity of the securities. Market risk is controlled by setting a maximum average maturity/average life of the securities portfolio to 10 years.
Economic Risk. Economic risk is the risk that the underlying value of a bank will change when rates change. This can be caused by a change in value of the existing assets and liabilities (this is called Economic Value of Equity or EVE), or a change in the earnings stream (this is caused by interest rate risk). The Company takes economic risk primarily when fixed rate loans are made, or purchase fixed-rate investments, or issue long term certificates of deposit or take fixed-rate FHLB advances. It is the risk that interest rates will change and these fixed-rate assets and liabilities will change in value. This change in value usually is not recognized in the earnings, or equity (other than marking to market securities available-for-sale or fair value adjustments on loans held for sale). The change is recognized only when the assets and liabilities are liquidated. Although the change in market value is usually not recognized in earnings or in capital, the impact is real to the long-term value of 1st Security Bank of Washington. Therefore, the Company will control the level of economic risk by limiting the amount of long-term, fixed-rate assets the Company will have and by setting a limit on concentrations and maturities of securities.
Interest Rate Risk. If the Federal Reserve Board changes the Fed Funds rate 100, 200 or 300 basis points, the Bank policy dictates that a change in net interest income should not change more that 7.5%, 15% and 30%, respectively.
The table presented below, as of December 31, 2016, is an analysis prepared for 1st Security Bank of Washington by Olson Research Associates, Inc. utilizing various market and actual experience-based assumptions. The table represents a static shock to the net interest income using instantaneous and sustained shifts in the yield curve, in 100 basis point increments, up and down 100 basis points. No rates in the model are allowed to go below zero. Given the low interest rate environment, reduction in rates by 200 and 300 basis points are not reported. The results reflect a projected income statement with minimal exposure to instantaneous changes in interest rates. These results are primarily based upon historical prepayment speeds within the consumer lending portfolio in combination with the above average yields associated with the consumer portfolio if those prepayments do not occur. The current Fed Funds rate is 0.50% making a 200 and 300 basis point decrease impossible.
December 31, 2016 | |||||||||||
Change in Interest Rates in Basis Points | Net Interest Income | ||||||||||
Amount | Change | Change | |||||||||
(Dollars in thousands) | |||||||||||
300bp | $ | 36,832 | $ | 2,008 | 5.77 | % | |||||
200bp | 36,409 | 1,585 | 4.55 | ||||||||
100bp | 35,674 | 850 | 2.44 | ||||||||
0bp | 34,823 | — | — | ||||||||
(100)bp | 33,291 | (1,533 | ) | (4.40 | ) | ||||||
In managing the assets/liability mix the Company typically places an equal emphasis on maximizing net interest margin and matching the interest rate sensitivity of the assets and liabilities. From time to time, however, depending on the relationship between long- and short-term interest rates, market conditions and consumer preference, the Company may place somewhat greater emphasis on maximizing net interest margin than on strictly matching the interest rate sensitivity of the assets and liabilities. Management also believes that the increased net income which may result from an acceptable mismatch in the actual maturity or repricing of the asset and liability portfolios can, during periods of declining or stable interest rates, provide sufficient returns to justify the increased exposure to sudden and
68
unexpected increases in interest rates which may result from such a mismatch. Management believes that 1st Security Bank of Washington’s level of interest rate risk is acceptable under this approach.
In evaluating 1st Security Bank of Washington’s exposure to interest rate movements, certain shortcomings inherent in the method of analysis presented in the foregoing table must be considered. For example, although certain assets and liabilities may have similar maturities or repricing periods, they may react in different degrees to changes in market interest rates. Also, the interest rates on certain types of assets and liabilities may fluctuate in advance of changes in market interest rates, while interest rates on other types may lag behind changes in interest rates. Additionally, certain assets, such as adjustable rate mortgages, have features which restrict changes in interest rates on a short-term basis and over the life of the asset. Further, in the event of a significant change in interest rates, prepayment and early withdrawal levels would likely deviate significantly from those assumed above. Finally, the ability of many borrowers to service their debt may decrease in the event of an interest rate increase. 1st Security Bank of Washington considers all of these factors in monitoring its exposure to interest rate risk.
Liquidity
Management maintains a liquidity position that it believes will adequately provide funding for loan demand and deposit runoff that may occur in the normal course of business. The Company relies on a number of different sources in order to meet potential liquidity demands. The primary sources are increases in deposit accounts, FHLB advances, purchases of Fed Funds, sale of securities available-for-sale, cash flows from loan payments, sales of one-to-four-family loans held for sale, and maturing securities.
At December 31, 2016, the Bank’s total borrowing capacity was $191.1 million with the FHLB of Des Moines, with unused borrowing capacity of $177.5 million at that date. The FHLB borrowing limit is based on certain categories of loans, primarily real estate loans that qualify as collateral for FHLB advances. At December 31, 2016, the Bank held approximately $249.8 million in loans that qualify as collateral for FHLB advances. In addition to the availability of liquidity from the FHLB of Des Moines, the Bank maintained a short-term borrowing line with the Federal Reserve Bank, with a current limit of $85.9 million, and a combined credit limit of $40.0 million in written Fed Funds lines of credit through correspondent banking relationships as of December 31, 2016. The Federal Reserve Bank borrowing limit is based on certain categories of loans, primarily consumer loans that qualify as collateral for Federal Reserve Bank line of credit. At December 31, 2016, the Bank held approximately $217.2 million in loans that qualify as collateral for the Federal Reserve Bank line of credit.
At December 31, 2016, $12.7 million in FHLB advances and FHLB Fed Funds were outstanding, and no advances were outstanding against the Federal Reserve Bank line of credit, and Fed Funds lines of credit. The Bank’s Asset Liability Management Policy permits management to utilize brokered deposits up to 20% of deposits or $143.1 million as of December 31, 2016. Total brokered deposits as of December 31, 2016 were $47.1 million. Management utilizes brokered deposits to mitigate interest rate risk exposure where appropriate.
Liquidity management is both a daily and long-term function of Company management. Excess liquidity is generally invested in short-term investments, such as overnight deposits and Fed Funds. On a longer term basis, a strategy is maintained of investing in various lending products and investment securities, including U.S. Government obligations and U.S. agency securities. The Company uses sources of funds primarily to meet ongoing commitments, pay maturing deposits and fund withdrawals, and to fund loan commitments. At December 31, 2016, the approved outstanding loan commitments, including unused lines of credit, amounted to $255.0 million. Certificates of deposit scheduled to mature in one year or less at December 31, 2016, totaled $83.9 million. It is management’s policy to offer deposit rates that are competitive with other local financial institutions. Based on this management strategy, the Company believes that a majority of maturing deposits will remain with the Bank.
As a separate legal entity from the Bank, FS Bancorp, Inc. must provide for its own liquidity. Sources of capital and liquidity for the FS Bancorp, Inc. include distributions from the Bank and the issuance of debt or equity securities. Dividends and other capital distributions from the Bank are subject to regulatory notice. At December 31, 2016, FS Bancorp, Inc. had $3.0 million in cash to meet liquidity needs.
69
Off-Balance Sheet Activities
The Company is a party to financial instruments with off-balance sheet risk in the normal course of business in order to meet the financing needs of its customers. For information regarding our commitments and off-balance sheet arrangements, see Note 12 of the Notes to Consolidated Financial Statements included in Item 8, “Financial Statements and Supplementary Data” of this Form 10-K.
A summary of off-balance sheet commitments to extend credit at December 31, 2016 was as follows:
(1) Includes held for sale loans
Off-balance sheet loan commitments: | (In thousands) | ||
Real estate secured (1) | $ | 137,420 | |
Commercial business loans | 82,877 | ||
Home equity loans and lines of credit | 26,129 | ||
Consumer loans | 8,527 | ||
Total commitments to extend credit | $ | 254,953 | |
Capital Resources
The Bank is subject to minimum capital requirements imposed by the FDIC. Based on its capital levels at December 31, 2016, the Bank exceeded these requirements as of that date. Consistent with our goals to operate a sound and profitable organization, our policy is for the Bank to maintain a well capitalized status under the capital categories of the FDIC. Based on capital levels at December 31, 2016, the Bank was considered to be well capitalized. At December 31, 2016, the Bank exceeded all regulatory capital requirements with Tier 1 leverage-based capital, Tier 1 risk-based capital, total risk-based capital, and common equity Tier 1 (“CET1”) capital ratios of 10.3%, 12.6%, 13.9%, and 12.6%, respectively. For additional information regarding the Bank’s regulatory capital compliance, see the discussion included in Note 14 to the Notes to Consolidated Financial Statements included in Item 8, “Financial Statements and Supplementary Data” of this Form 10-K.
For a bank holding company with less than $1 billion in consolidated assets, such as FS Bancorp, Inc., the capital guidelines apply on a bank only basis and the Federal Reserve requires the holding company’s subsidiary banks to be well capitalized under the prompt corrective action regulations. If FS Bancorp, Inc. was subject to regulatory guidelines for bank holding companies with $1 billion or more in assets, at December 31, 2016, FS Bancorp, Inc. would have exceeded all regulatory capital requirements.
The following table compares 1st Security Bank of Washington’s actual capital amounts at December 31, 2016, to its minimum regulatory capital requirements at that date:
To be Well Capitalized Under Prompt Corrective Action Provisions | ||||||||||||||||||||
For Capital Adequacy Purposes | ||||||||||||||||||||
Actual | ||||||||||||||||||||
(Dollars in thousands) | Amount | Ratio | Amount | Ratio | Amount | Ratio | ||||||||||||||
As of December 31, 2016 | ||||||||||||||||||||
Total risk-based capital | ||||||||||||||||||||
(to risk-weighted assets) | $ | 93,309 | 13.87 | % | $ | 53,813 | 8.00 | % | $ | 67,266 | 10.00 | % | ||||||||
Tier 1 risk-based capital | ||||||||||||||||||||
(to risk-weighted assets) | $ | 84,876 | 12.62 | % | $ | 40,360 | 6.00 | % | $ | 53,813 | 8.00 | % | ||||||||
Tier 1 leverage capital | ||||||||||||||||||||
(to average assets) | $ | 84,876 | 10.33 | % | $ | 32,862 | 4.00 | % | $ | 41,078 | 5.00 | % | ||||||||
CET1 capital | ||||||||||||||||||||
(to risk-weighted assets) | $ | 84,876 | 12.62 | % | $ | 30,270 | 4.50 | % | $ | 43,723 | 6.50 | % | ||||||||
70
Recent Accounting Pronouncements
For a discussion of recent accounting standards, please see Note 1 of the Notes to Consolidated Financial Statements included in Item 8, “Financial Statement and Supplementary Data” of this Form 10-K.
Item 7A. Quantitative and Qualitative Disclosures about Market Risk
Market risk is the risk of loss from adverse changes in market prices and rates. The Company’s market risk arises principally from interest rate risk inherent in lending, investing, deposit and borrowings activities. Management actively monitors and manages its interest rate risk exposure. In addition to other risks that are managed in the normal course of business, such as credit quality and liquidity, management considers interest rate risk to be a significant market risk that could potentially have a material effect on the Company’s financial condition and result of operations. The information contained in Item 7, “Management’s Discussion and Analysis of Financial Condition and Results of Operations - Asset and Liability Management” of this Form 10-K is incorporated herein by reference.
Item 8. Financial Statements and Supplementary Data
FS BANCORP, INC. AND SUBSIDIARY
INDEX TO FINANCIAL STATEMENTS
INDEX TO FINANCIAL STATEMENTS
Index to Consolidated Financial Statements | |
Page | |
Report of Independent Registered Public Accounting Firm | |
Consolidated Balance Sheets as of December 31, 2016 and 2015 | |
Consolidated Statements of Income For the Years Ended December 31, 2016 and 2015 | |
Consolidated Statements of Comprehensive Income For the Years Ended December 31, 2016 and 2015 | |
Consolidated Statements of Changes in Stockholders’ Equity For the Years Ended December 31, 2016 and 2015 | |
Consolidated Statements of Cash Flows For the Years Ended December 31, 2016 and 2015 | |
Notes to Consolidated Financial Statements | |
71
Report of Independent Registered Public Accounting Firm
To the Board of Directors
FS Bancorp, Inc.
Mountlake Terrace, Washington
We have audited the accompanying consolidated balance sheets of FS Bancorp, Inc. and subsidiary (the “Company”) as of December 31, 2016 and 2015, and the related consolidated statements of income, comprehensive income, changes in stockholders’ equity, and cash flows for the years then ended. These consolidated financial statements are the responsibility of the Company’s management. Our responsibility is to express an opinion on these consolidated financial statements based on our audits.
We conducted our audits in accordance with the standards of the Public Company Accounting Oversight Board (United States). Those standards require that we plan and perform the audit to obtain reasonable assurance about whether the consolidated financial statements are free of material misstatement. The Company is not required to have, nor were we engaged to perform, an audit of its internal control over financial reporting. Our audit included consideration of internal control over financial reporting as a basis for designing audit procedures that are appropriate in the circumstances, but not for the purpose of expressing an opinion on the effectiveness of the Company’s internal control over financial reporting. Accordingly, we express no such opinion. An audit also includes examining, on a test basis, evidence supporting the amounts and disclosures in the consolidated financial statements, assessing the accounting principles used and significant estimates made by management, as well as evaluating the overall consolidated financial statement presentation. We believe that our audits provide a reasonable basis for our opinion.
In our opinion, the consolidated financial statements referred to above present fairly, in all material respects, the consolidated financial position of FS Bancorp, Inc. and subsidiary as of December 31, 2016 and 2015, and the consolidated results of their operations and their cash flows for the years then ended in conformity with accounting principles generally accepted in the United States of America.
/s/ Moss Adams LLP
Everett, Washington
March 16, 2017
72 | ||
FS BANCORP, INC. AND SUBSIDIARY CONSOLIDATED BALANCE SHEETS DECEMBER 31, 2016 AND 2015 | ||||
(In thousands, except share data) | ||||
2016 | 2015 | ||||||
ASSETS | |||||||
Cash and due from banks | $ | 3,590 | $ | 1,708 | |||
Interest-bearing deposits at other financial institutions | 32,866 | 22,747 | |||||
Total cash and cash equivalents | 36,456 | 24,455 | |||||
Certificates of deposit at other financial institutions | 15,248 | 12,421 | |||||
Securities available-for-sale, at fair value | 81,875 | 55,217 | |||||
Loans held for sale, at fair value | 52,553 | 44,925 | |||||
Loans receivable, net | 593,317 | 502,535 | |||||
Accrued interest receivable | 2,524 | 2,107 | |||||
Premises and equipment, net | 16,012 | 13,856 | |||||
Federal Home Loan Bank (“FHLB”) stock, at cost | 2,719 | 4,551 | |||||
Bank owned life insurance (“BOLI”), net | 10,054 | 9,772 | |||||
Servicing rights, held at the lower of cost or fair value | 8,459 | 5,811 | |||||
Goodwill | 2,312 | — | |||||
Core deposit intangible, net | 1,717 | — | |||||
Other assets | 4,680 | 1,911 | |||||
TOTAL ASSETS | $ | 827,926 | $ | 677,561 | |||
LIABILITIES | |||||||
Deposits: | |||||||
Noninterest-bearing accounts | $ | 152,913 | $ | 72,247 | |||
Interest-bearing accounts | 559,680 | 412,931 | |||||
Total deposits | 712,593 | 485,178 | |||||
Borrowings | 12,670 | 98,769 | |||||
Subordinated note: | |||||||
Principal amount | 10,000 | 10,000 | |||||
Unamortized debt issuance costs | (175 | ) | (195 | ) | |||
Total subordinated note less unamortized debt issuance costs | 9,825 | 9,805 | |||||
Deferred tax liability, net | 1,161 | 1,293 | |||||
Other liabilities | 10,644 | 7,176 | |||||
Total liabilities | 746,893 | 602,221 | |||||
COMMITMENTS AND CONTINGENCIES (NOTE 12) | |||||||
STOCKHOLDERS’ EQUITY | |||||||
Preferred stock, $.01 par value; 5,000,000 shares authorized; none issued or outstanding | — | — | |||||
Common stock, $.01 par value; 45,000,000 shares authorized; 3,059,503 and 3,242,120 shares issued and outstanding at December 31, 2016, and 2015, respectively | 31 | 32 | |||||
Additional paid-in capital | 27,334 | 30,692 | |||||
Retained earnings | 55,584 | 46,175 | |||||
Accumulated other comprehensive (loss) income, net of tax | (536 | ) | 78 | ||||
Unearned shares - Employee Stock Ownership Plan (“ESOP”) | (1,380 | ) | (1,637 | ) | |||
Total stockholders’ equity | 81,033 | 75,340 | |||||
TOTAL LIABILITIES AND STOCKHOLDERS’ EQUITY | $ | 827,926 | $ | 677,561 | |||
See accompanying notes to these consolidated financial statements.
73 | ||
FS BANCORP, INC. AND SUBSIDIARY CONSOLIDATED STATEMENTS OF INCOME FOR THE YEARS ENDED DECEMBER 31, 2016 and 2015 | ||
(In thousands, except earnings per share data) | |||||||
2016 | 2015 | ||||||
INTEREST INCOME | |||||||
Loans receivable, including fees | $ | 35,772 | $ | 30,418 | |||
Interest and dividends on investment securities, cash and cash equivalents, and certificates of deposit at other financial institutions | 2,248 | 1,289 | |||||
Total interest and dividend income | 38,020 | 31,707 | |||||
INTEREST EXPENSE | |||||||
Deposits | 3,254 | 3,229 | |||||
Borrowings | 226 | 285 | |||||
Subordinated note | 683 | 144 | |||||
Total interest expense | 4,163 | 3,658 | |||||
NET INTEREST INCOME | 33,857 | 28,049 | |||||
PROVISION FOR LOAN LOSSES | 2,400 | 2,250 | |||||
NET INTEREST INCOME AFTER PROVISION FOR LOAN LOSSES | 31,457 | 25,799 | |||||
NONINTEREST INCOME | |||||||
Service charges and fee income | 3,391 | 1,977 | |||||
Gain on sale of loans | 19,058 | 14,672 | |||||
Gain on sale of investment securities | 146 | 76 | |||||
Earnings on cash surrender value of BOLI | 282 | 216 | |||||
Other noninterest income | 692 | 652 | |||||
Total noninterest income | 23,569 | 17,593 | |||||
NONINTEREST EXPENSE | |||||||
Salaries and benefits | 21,982 | 16,732 | |||||
Operations | 6,000 | 4,376 | |||||
Occupancy | 2,404 | 1,867 | |||||
Data processing | 2,134 | 1,573 | |||||
Gain on sale of other real estate owned (“OREO”) | (150 | ) | — | ||||
Loan costs | 2,505 | 1,547 | |||||
Professional and board fees | 1,943 | 1,658 | |||||
Federal Deposit Insurance Corporation (“FDIC”) insurance | 487 | 305 | |||||
Marketing and advertising | 710 | 709 | |||||
Acquisition costs | 389 | 876 | |||||
Amortization of core deposit intangible | 522 | — | |||||
Recovery on servicing rights | (3 | ) | — | ||||
Total noninterest expense | 38,923 | 29,643 | |||||
INCOME BEFORE PROVISION FOR INCOME TAXES | 16,103 | 13,749 | |||||
PROVISION FOR INCOME TAXES | 5,604 | 4,873 | |||||
NET INCOME | $ | 10,499 | $ | 8,876 | |||
Basic earnings per share | $ | 3.63 | $ | 2.98 | |||
Diluted earnings per share | $ | 3.51 | $ | 2.93 | |||
See accompanying notes to these consolidated financial statements.
74 | ||
FS BANCORP, INC. AND SUBSIDIARY CONSOLIDATED STATEMENTS OF COMPREHENSIVE INCOME FOR THE YEARS ENDED DECEMBER 31, 2016 and 2015 | ||
(In thousands) | |||||||
2016 | 2015 | ||||||
Net Income | $ | 10,499 | $ | 8,876 | |||
Other comprehensive loss, before tax: | |||||||
Securities available-for-sale: | |||||||
Unrealized holding (loss) gain during year | (804 | ) | 19 | ||||
Income tax benefit (provision) related to unrealized holding (loss) gain | 286 | (7 | ) | ||||
Reclassification adjustment for realized gain included in net income | (146 | ) | (76 | ) | |||
Income tax provision related to reclassification for realized gain | 50 | 25 | |||||
Other comprehensive loss, net of tax | (614 | ) | (39 | ) | |||
COMPREHENSIVE INCOME | $ | 9,885 | $ | 8,837 | |||
See accompanying notes to these consolidated financial statements.
75 | ||
FS BANCORP, INC. AND SUBSIDIARY CONSOLIDATED STATEMENTS OF CHANGES IN STOCKHOLDERS’ EQUITY FOR THE YEARS ENDED DECEMBER 31, 2016 and 2015 | ||
(In thousands, except share data) | ||||||||||||||||||||||||||
Common Stock | Accumulated | |||||||||||||||||||||||||
Shares | Amount | Additional Paid-in Capital | Retained Earnings | Other Comprehensive (Loss) Income | Unearned ESOP Shares | Total Stockholders’ Equity | ||||||||||||||||||||
BALANCE, January 1, 2015 | 3,235,625 | $ | 32 | $ | 29,450 | $ | 38,125 | $ | 117 | $ | (1,888 | ) | $ | 65,836 | ||||||||||||
Net income | — | $ | — | — | 8,876 | — | — | $ | 8,876 | |||||||||||||||||
Dividends paid ($0.22 per share) | — | $ | — | — | (826 | ) | — | — | $ | (826 | ) | |||||||||||||||
Share-based compensation | — | $ | — | 746 | — | — | — | $ | 746 | |||||||||||||||||
Common stock repurchase | (4,605 | ) | $ | — | (101 | ) | — | — | — | $ | (101 | ) | ||||||||||||||
Stock options exercised | 11,100 | $ | — | 187 | — | — | — | $ | 187 | |||||||||||||||||
Other comprehensive loss, net of tax | — | $ | — | — | — | (39 | ) | — | $ | (39 | ) | |||||||||||||||
Excess tax benefits of stock compensation | — | $ | — | 9 | — | — | — | $ | 9 | |||||||||||||||||
ESOP shares allocated | — | $ | — | 401 | — | — | 251 | $ | 652 | |||||||||||||||||
BALANCE, December 31, 2015 | 3,242,120 | $ | 32 | $ | 30,692 | $ | 46,175 | $ | 78 | $ | (1,637 | ) | $ | 75,340 | ||||||||||||
BALANCE, January 1, 2016 | 3,242,120 | $ | 32 | $ | 30,692 | $ | 46,175 | $ | 78 | $ | (1,637 | ) | $ | 75,340 | ||||||||||||
Net income | — | $ | — | — | 10,499 | — | — | $ | 10,499 | |||||||||||||||||
Dividends paid ($0.36 per share) | — | $ | — | — | (1,090 | ) | — | — | $ | (1,090 | ) | |||||||||||||||
Share-based compensation | — | $ | — | 783 | — | — | — | $ | 783 | |||||||||||||||||
Restricted stock awards | 4,500 | $ | — | — | — | — | — | $ | — | |||||||||||||||||
Common stock repurchased | (198,167 | ) | $ | (1 | ) | (4,902 | ) | — | — | — | $ | (4,903 | ) | |||||||||||||
Stock options exercised | 11,050 | $ | — | 186 | — | — | — | $ | 186 | |||||||||||||||||
Other comprehensive loss, net of tax | — | $ | — | — | — | (614 | ) | — | $ | (614 | ) | |||||||||||||||
ESOP shares allocated | — | $ | — | 575 | — | — | 257 | $ | 832 | |||||||||||||||||
BALANCE, December 31, 2016 | 3,059,503 | $ | 31 | $ | 27,334 | $ | 55,584 | $ | (536 | ) | $ | (1,380 | ) | $ | 81,033 | |||||||||||
See accompanying notes to these consolidated financial statements.
76 | ||
FS BANCORP, INC. AND SUBSIDIARY CONSOLIDATED STATEMENTS OF CASH FLOWS FOR THE YEARS ENDED DECEMBER 31, 2016 and 2015 | ||
(In thousands) | |||||||
CASH FLOWS FROM OPERATING ACTIVITIES | 2016 | 2015 | |||||
Net income | $ | 10,499 | $ | 8,876 | |||
Adjustments to reconcile net income to net cash from operating activities | |||||||
Provision for loan losses | 2,400 | 2,250 | |||||
Depreciation, amortization and accretion | 5,210 | 2,430 | |||||
Compensation expense related to stock options and restricted stock awards | 783 | 746 | |||||
ESOP compensation expense for allocated shares | 832 | 652 | |||||
Excess tax benefits of stock compensation | — | 9 | |||||
Provision for deferred income taxes | 206 | 501 | |||||
Increase in cash surrender value of BOLI | (282 | ) | (216 | ) | |||
Gain on sale of loans and loans held for sale | (19,058 | ) | (14,672 | ) | |||
Origination of loans held for sale | (718,864 | ) | (571,745 | ) | |||
Proceeds from sale of loans held for sale | 726,831 | 563,751 | |||||
Gain on sale of investment securities | (146 | ) | (76 | ) | |||
Recovery on servicing rights | (3 | ) | — | ||||
Gain on sale of OREO | (150 | ) | — | ||||
Changes in operating assets and liabilities | |||||||
Accrued interest receivable | (417 | ) | (549 | ) | |||
Other assets | (7,326 | ) | (565 | ) | |||
Other liabilities | 3,073 | 1,545 | |||||
Net cash from (used by) operating activities | 3,588 | (7,063 | ) | ||||
CASH FLOWS FROM INVESTING ACTIVITIES | |||||||
Activity in securities available-for-sale: | |||||||
Proceeds from sale of investment securities | 13,577 | 4,178 | |||||
Maturities, prepayments, sales, and calls | 14,093 | 6,377 | |||||
Purchases | (55,811 | ) | (17,402 | ) | |||
Maturities of certificates of deposit at other financial institutions | 292 | 744 | |||||
Purchase of certificates of deposit at other financial institutions | (3,122 | ) | (8,624 | ) | |||
Loan originations and principal collections, net | (95,043 | ) | (101,371 | ) | |||
Purchase of portfolio loans | — | (16,255 | ) | ||||
Proceeds from sale of OREO, net | 682 | — | |||||
Purchase of BOLI | — | (3,000 | ) | ||||
Purchase of premises and equipment, net | (3,595 | ) | (1,512 | ) | |||
FHLB stock, net | 1,832 | (2,901 | ) | ||||
Net cash received from acquisition | 180,356 | — | |||||
Net cash from (used by) investing activities | 53,261 | (139,766 | ) | ||||
CASH FLOWS FROM FINANCING ACTIVITIES | |||||||
Net increase in deposits | 47,059 | 64,734 | |||||
Proceeds from borrowings | 349,125 | 496,387 | |||||
Repayments of borrowings | (435,225 | ) | (414,652 | ) | |||
Proceeds from subordinated note | — | 10,000 | |||||
See accompanying notes to these consolidated financial statements. | |||||||
77 | ||
FS BANCORP, INC. AND SUBSIDIARY CONSOLIDATED STATEMENTS OF CASH FLOWS (Continued) FOR THE YEARS ENDED DECEMBER 31, 2016 and 2015 | ||
(In thousands) | |||||||
Dividends paid | (1,090 | ) | (826 | ) | |||
Proceeds from stock options exercised | 186 | 187 | |||||
Common stock repurchased | (4,903 | ) | (101 | ) | |||
Net cash (used by) from financing activities | (44,848 | ) | 155,729 | ||||
NET INCREASE IN CASH AND CASH EQUIVALENTS | 12,001 | 8,900 | |||||
CASH AND CASH EQUIVALENTS, beginning of year | 24,455 | 15,555 | |||||
CASH AND CASH EQUIVALENTS, end of year | $ | 36,456 | $ | 24,455 | |||
SUPPLEMENTARY DISCLOSURES OF CASH FLOW INFORMATION | |||||||
Cash paid during the year for: | |||||||
Interest | $ | 4,164 | $ | 3,660 | |||
Income taxes | $ | 6,110 | $ | 3,953 | |||
Assets acquired in acquisition of branches (Note 2) | $ | 181,575 | $ | — | |||
Liabilities assumed in acquisition of branches (Note 2) | $ | 186,393 | $ | — | |||
SUPPLEMENTARY DISCLOSURES OF NONCASH INVESTING AND FINANCING ACTIVITIES | |||||||
Change in unrealized loss on investment securities | $ | (950 | ) | $ | (57 | ) | |
Property received in settlement of loans | $ | 525 | $ | — | |||
Retention of mortgage servicing rights from loan sales | $ | 4,194 | $ | 3,699 | |||
See accompanying notes to these consolidated financial statements.
78 | ||
FS BANCORP, INC. AND SUBSIDIARY NOTES TO CONSOLIDATED FINANCIAL STATEMENTS DECEMBER 31, 2016 AND 2015 |
NOTE 1 - BASIS OF PRESENTATION AND SUMMARY OF SIGNIFICANT ACCOUNTING POLICIES
Nature of Operations - FS Bancorp, Inc. (the “Company”) was incorporated in September 2011 as the proposed holding company for 1st Security Bank of Washington (the “Bank” or “1st Security Bank”) in connection with the Bank’s conversion from the mutual to stock form of ownership which was completed on July 9, 2012. The Bank is a community-based savings bank with 11 branches and seven loan production offices in suburban communities in the greater Puget Sound area which includes Snohomish, King, Pierce, Jefferson, Kitsap, and Clallam counties, and one loan production office in the market area of the Tri-Cities, Washington. The Bank provides loan and deposit services to customers who are predominantly small and middle-market businesses and individuals. The Bank acquired four retail bank branches from Bank of America (two in Clallam and two in Jefferson counties) on January 22, 2016, and these branches opened as 1st Security Bank branches on January 25, 2016. The Company and its subsidiary are subject to regulation by certain federal and state agencies and undergo periodic examination by these regulatory agencies.
Pursuant to the Plan of Conversion (the “Plan”), the Company’s Board of Directors adopted an employee stock ownership plan ( “ESOP”) which purchased 8% of the common stock in the open market or 259,210 shares. As provided for in the Plan, the Bank also established a liquidation account in the amount of retained earnings at December 31, 2011. The liquidation account is maintained for the benefit of eligible savings account holders at June 30, 2007 and supplemental eligible account holders as of March 31, 2012, who maintain deposit accounts at the Bank after the conversion. The conversion was accounted for as a change in corporate form with the historic basis of the Company’s assets, liabilities, and equity unchanged as a result.
Financial Statement Presentation - The consolidated financial statements have been prepared in accordance with accounting principles generally accepted in the United States (“U.S. GAAP”) and with prevailing practices within the banking and securities industries. In preparing such financial statements, management is required to make certain estimates and judgments that affect the reported amounts of assets and liabilities and disclosure of contingent assets and liabilities as of the date of the balance sheet and the reported amounts of revenues and expenses for the reporting period. Actual results could differ significantly from those estimates. Material estimates that are particularly susceptible to significant change relate to the determination of the allowance for loan and lease losses, fair value of financial instruments, the valuation of servicing rights, and the deferred income taxes.
Amounts presented in the consolidated financial statements and footnote tables are rounded and presented in thousands of dollars except per share amounts. In the narrative footnote discussion, amounts are rounded and presented in millions of dollars to one decimal point if the amounts are above $1.0 million. Amounts below $1.0 million are rounded and presented in dollars to the nearest thousands. Certain prior year amounts have been reclassified to conform to the 2016 presentation with no change to consolidated net income or stockholders’ equity previously reported.
Principles of Consolidation - The consolidated financial statements include the accounts of FS Bancorp, Inc. and its wholly owned subsidiary, 1st Security Bank of Washington. All material intercompany accounts have been eliminated in consolidation.
Segment Reporting - The Company’s major lines of business are community banking. Management has determined that the Company operates as a single operating segment based on U.S. GAAP.
Subsequent Events - The Company has evaluated events and transactions subsequent to December 31, 2016, for potential recognition or disclosure.
Cash and Cash Equivalents - Cash and cash equivalents include cash and due from banks, and interest-bearing balances due from other banks and the Federal Reserve Bank of San Francisco (“FRB”) and have a maturity of 90 days or less at the time of purchase. The Company had $7.8 million of cash and due from banks and interest-bearing deposits at other financial institutions in excess of Federal Deposit Insurance Corporation (“FDIC”) insured limits at December 31, 2016, and none at December 31, 2015. Because the Company places these deposits with major financial institutions and monitors the financial condition of these institutions, management believes the risk of loss to any deposits in excess of FDIC limits to be minimal.
79 | ||
FS BANCORP, INC. AND SUBSIDIARY NOTES TO CONSOLIDATED FINANCIAL STATEMENTS DECEMBER 31, 2016 AND 2015 | ||
Securities Available-for-Sale - Securities available-for-sale consist of debt securities that the Company has the intent and ability to hold for an indefinite period, but not necessarily to maturity. Such securities may be sold to implement the Company’s asset/liability management strategies and in response to changes in interest rates and similar factors. Securities available-for-sale are reported at fair value. Realized gains and losses on securities available-for-sale, determined using the specific identification method, are included in results of operations. Amortization of premium and accretion of discounts are recognized in interest income over the period to maturity.
Unrealized holding gains and losses, net of the related deferred tax effect, are reported as a net amount in a separate component of equity entitled accumulated other comprehensive income. Unrealized losses that are deemed to be other than temporary are reflected in results of operations. Any declines in the values of these securities that are considered to be other-than-temporary-impairment (“OTTI”) and credit-related are recognized in earnings. Noncredit-related OTTI on securities not expected to be sold is recognized in other comprehensive income. The review for OTTI is conducted on an ongoing basis and takes into account the severity and duration of the impairment, recent events specific to the issuer or industry, fair value in relationship to cost, extent and nature of change in fair value, creditworthiness of the issuer including external credit ratings and recent downgrades, trends and volatility of earnings, current analysts’ evaluations, and other key measures. In addition, the Company does not intend to sell the securities and it is more likely than not that we will not be required to sell the securities before recovery of their amortized cost basis. In doing this, we take into account our balance sheet management strategy and consideration of current and future market conditions. Dividends and interest income are recognized when earned.
Federal Home Loan Bank Stock - The Bank’s investment in FHLB stock is carried at cost, which approximates fair value. As a member of the FHLB system, the Bank is required to maintain an investment in capital stock of the FHLB in an amount of $813,000 and 4.0% of advances from the FHLB. The Bank’s required minimum level of investment in FHLB stock is based on specific percentages of its outstanding mortgages, total assets, or FHLB advances. At December 31, 2016 and 2015, the Bank’s minimum level of investment requirement in FHLB stock was $2.7 million and $4.6 million, respectively. The Bank was in compliance with the FHLB minimum investment requirement at December 31, 2016 and 2015.
Management evaluates FHLB stock for impairment as needed. Management’s determination of whether these investments are impaired is based on its assessment of the ultimate recoverability of cost rather than by recognizing temporary declines in value. The determination of whether a decline affects the ultimate recoverability of cost is influenced by criteria such as (1) the significance of any decline in net assets of the FHLB as compared with the capital stock amount for the FHLB and the length of time this situation has persisted; (2) commitments by the FHLB to make payments required by law or regulation and the level of such payments in relation to the operating performance of the FHLB; (3) the impact of legislative and regulatory changes on institutions and, accordingly, the customer base of the FHLB; and (4) the liquidity position of the FHLB. Based on its evaluation, management determined that there was no impairment of FHLB stock at December 31, 2016 and 2015, respectively.
Loans Held for Sale - The Bank records all mortgage loans held-for-sale at fair value. Fair value is determined by outstanding commitments from investors or current investor yield requirements calculated on the aggregate loan basis. Origination fees and costs are recognized in earnings at the time of origination. Mortgage loans held-for-sale are sold with the mortgage service rights either released or retained by the Bank. Gains or losses on sales of mortgage loans are recognized based on the difference between the selling price and the carrying value of the related mortgage loans sold. All sales are made with limited recourse against the Company.
Derivatives - Commitments to fund mortgage loans (interest rate locks) to be sold into the secondary market and forward commitments for the future delivery of these mortgage loans are accounted for as free-standing derivatives. The fair value of the interest rate lock is recorded at the time the commitment to fund the mortgage loan is executed and is adjusted for the expected exercise of the commitments to fund the loans, the Company enters into forward commitments for the future delivery of mortgage loans when interest rate locks are entered. Fair values of these mortgage derivatives are estimated based on changes in mortgage interest rates from the date the interest on the loan is locked. Changes in the fair values of these derivatives are reported in “Gain on sale of loans” on the Consolidated Statements of Income.
Loans Receivable - Loans receivable, are stated at the amount of unpaid principal reduced by an allowance for loan losses and net deferred fees or costs. Interest on loans is calculated using the simple interest method based on the daily
80 | ||
FS BANCORP, INC. AND SUBSIDIARY NOTES TO CONSOLIDATED FINANCIAL STATEMENTS DECEMBER 31, 2016 AND 2015 | ||
balance of the principal amount outstanding and is credited to income as earned. Loan fees, net of direct origination costs, are deferred and amortized over the life of the loan using the effective yield method.
Interest on loans is accrued daily based on the principal amount outstanding. Generally, the accrual of interest on loans is discontinued when, in management’s opinion, the borrower may be unable to meet payments as they become due or when they are past due 90 days as to either principal or interest (based on contractual terms), unless they are well secured and in the process of collection. All interest accrued but not collected for loans that are placed on non-accrual status or charged off are reversed against interest income. Subsequent collections on a cash basis are applied proportionately to past due principal and interest, unless collectability of principal is in doubt, in which case all payments are applied to principal. Loans are returned to accrual status when the loan is deemed current, and the collectability of principal and interest is no longer doubtful, or, generally, when the loan is less than 90 days delinquent, and performing according to its contractual terms after a period of six months performance.
The Company charges fees for originating loans. These fees, net of certain loan origination costs, are deferred and amortized to income, on the level-yield basis, over the loan term. If the loan is repaid prior to maturity, the remaining unamortized net deferred loan origination fee is recognized in income at the time of repayment.
Impaired Loans - A loan is considered impaired when it is probable the Company will be unable to collect all contractual principal and interest payments due in accordance with the original or modified terms of the loan agreement. Impaired loans are measured on a loan by loan basis based on the estimated fair value of the collateral less estimated cost to sell if the loan is considered collateral dependent. Impaired loans not considered to be collateral dependent are measured based on the present value of expected future cash flows. Impairment is measured for each loan in the portfolio except for the smaller groups of homogeneous consumer loans.
The categories of non-accrual loans and impaired loans overlap, although they are not coextensive. The Company considers all circumstances regarding the loan and borrower on an individual basis when determining whether an impaired loan should be placed on non-accrual status, such as the financial strength of the borrower, the collateral value, reasons for delay, payment record, the amount of past due and the number of days past due. Loans that experience insignificant payment delays and payment shortfalls are generally not classified as impaired. Management determines the significance of payment delays and payment shortfalls on a case-by-case basis, taking into consideration all of the circumstances surrounding the loan and the borrower, including the length of the delay, the reasons for the delay, the borrower’s prior payment record, and the amount of shortfall in relation to the principal and interest owed.
Troubled Debt Restructured Loans - Troubled debt restructured (“TDR”) loans are loans for which the Company, for economic or legal reasons related to the borrower’s financial condition, has granted a significant concession to the borrower that it would otherwise not consider. The loan terms which have been modified or restructured due to a borrower’s financial difficulty include but are not limited to: a reduction in the stated interest rate; an extension of the maturity at an interest rate below current market; a reduction in the face amount of the debt; a reduction in the accrued interest; or re-aging, extensions, deferrals and renewals. TDR loans are considered impaired loans and are individually evaluated for impairment and can be classified as either accrual or non-accrual. TDR loans are classified as non-performing loans unless they have been performing in accordance with their modified terms for a period of at least six months in which case they are placed on accrual status.
Allowance for Loan Losses - The allowance for loan losses is maintained at a level considered adequate to provide for probable losses on existing loans based on evaluating known and inherent risks in the loan portfolio. The allowance is reduced by loans charged-off and increased by provisions charged to earnings and recoveries on loans previously charged-off. The allowance is based on management’s periodic, systematic evaluation of factors underlying the quality of the loan portfolio including changes in the size and composition of the loan portfolio, the estimated value of any underlying collateral, actual loan loss experience, current economic conditions, and detailed analysis of individual loans for which full collectability may not be assured. This evaluation is inherently subjective as it requires estimates that are susceptible to significant revision as more information becomes available. While management uses the best information available to make its estimates, future adjustments to the allowance may be necessary if there is a significant change in economic and other conditions. The appropriateness of the allowance for loan losses is estimated based on these factors and trends identified by management at the time the financial statements are prepared.
81 | ||
FS BANCORP, INC. AND SUBSIDIARY NOTES TO CONSOLIDATED FINANCIAL STATEMENTS DECEMBER 31, 2016 AND 2015 | ||
When available information confirms that specific loans or portions thereof are uncollectible, these amounts are charged-off against the allowance for loan losses. The existence of some or all of the following criteria will generally confirm that a loss has been incurred: the loan is significantly delinquent and the borrower has not evidenced the ability or intent to bring the loan current; the Company has no recourse to the borrower, or if it does, the borrower has insufficient assets to pay the debt; the estimated fair value of the loan collateral is significantly below the current loan balance, and there is little or no near-term prospect for improvement.
A provision of loan losses is charged against income and added to the allowance for loan losses based on regular assessment of the loan portfolio. The allowance for loan losses is allocated to certain loan categories based on the relative risk characteristics, asset classifications, and actual loss experience within the loan portfolio. Although management has allocated the allowance for loan losses to various loan portfolio segments, the allowance is general in nature and is available for the loan portfolio in its entirety.
The ultimate recovery of all loans is susceptible to future market factors beyond the Company’s control. These factors may result in losses or recoveries differing significantly from those provided for in the financial statements. In addition, regulatory agencies, as an integral part of their examination process, periodically review the Company’s allowance for loan losses, and may require the Company to make additions to the allowance based on their judgment about information available to them at the time of their examinations.
Reserve for Unfunded Loan Commitments - The reserve for unfunded loan commitments is maintained at a level believed by management to be sufficient to absorb estimated probable losses related to these unfunded credit facilities. The determination of the adequacy of the reserve is based on periodic evaluations of the unfunded credit facilities including an assessment of the probability of commitment usage, credit risk factors for loans outstanding to these same customers, and the terms and expiration dates of the unfunded credit facilities. The reserve for unfunded loan commitments is included in other liabilities on the consolidated balance sheet, with changes to the balance charged against noninterest expense.
Premises and Equipment, Net - Land is carried at cost. Premises and equipment are stated at cost less accumulated depreciation and amortization. Depreciation is computed using the straight-line method over the estimated useful lives of the assets. The estimated useful lives used to compute depreciation include building and building improvements from 25 to 40 years and furniture, fixtures, and equipment from 3 to 10 years. Leasehold and tenant improvements are amortized using the straight-line method over the lesser of useful life or the life of the related lease. Gains or losses on dispositions are reflected in results of operations.
Management reviews buildings, improvements and equipment for impairment on an annual basis or whenever events or changes in the circumstances indicate that the undiscounted cash flows for the property are less than its carrying value. If identified, an impairment loss is recognized through a charge to earnings based on the fair value of the property.
Transfers of Financial Assets - Transfers of an entire financial asset, a group of entire financial assets, or participating interest in an entire financial asset are accounted for as sales when control over the assets has been surrendered. Control over transferred assets is deemed to be surrendered when (1) the assets have been isolated from the Company, (2) the transferee obtains the right (free of conditions that constrain it from taking advantage of that right) to pledge or exchange the transferred assets, and (3) the Company does not maintain effective control over the transferred assets through an agreement to repurchase them before their maturity.
Servicing Rights - Servicing assets are recognized as separate assets when rights are acquired through purchase or through sale of financial assets. Generally, purchased servicing rights are capitalized at the cost to acquire the rights. For sales of mortgage, commercial and consumer loans, a portion of the cost of originating the loan is allocated to the servicing right based on relative fair value. Fair value is based on market prices for comparable mortgage, commercial, or consumer servicing contracts, when available, or alternatively, is based on a valuation model that calculates the present value of estimated future net servicing income. The valuation model incorporates assumptions that market participants would use in estimating future net servicing income, such as the cost to service, the discount rate, the custodial earnings rate, an inflation rate, ancillary income, prepayment speeds, and default rates and losses.
82 | ||
FS BANCORP, INC. AND SUBSIDIARY NOTES TO CONSOLIDATED FINANCIAL STATEMENTS DECEMBER 31, 2016 AND 2015 | ||
Servicing assets are evaluated quarterly for impairment based upon the fair value of the rights as compared to amortized cost. Impairment is determined by stratifying rights into tranches based on predominant characteristics, such as interest rate, loan type, and investor type. Impairment is recognized through a valuation allowance for an individual tranche, to the extent that fair value is less than the capitalized amount for the tranches. If the Company later determines that all or a portion of the impairment no longer exists for a particular tranche, a reduction of the allowance may be recorded as an increase to income. Capitalized servicing rights are stated separately on the consolidated balance sheets and are amortized into noninterest income in proportion to, and over the period of, the estimated future net servicing income of the underlying financial assets.
Income Taxes - The Company files a consolidated federal income tax return. Deferred federal income taxes result from temporary differences between the tax basis of assets and liabilities, and their reported amounts in the financial statements. These will result in differences between income for tax purposes and income for financial reporting purposes in future years. As changes in tax laws or rates are enacted, deferred tax assets and liabilities are adjusted through the provision for income taxes. Valuation allowances are established to reduce the net recorded amount of deferred tax assets if it is determined to be more likely than not, that all or some portion of the potential deferred tax asset will not be realized.
The Financial Accounting Standards Board (“FASB”) issued guidance related to accounting for uncertainty in income taxes. The guidance prescribes a recognition threshold and measurement attribute for the financial statement recognition and measurement of a tax position taken or expected to be taken in a tax return. It is the Company’s policy to record any penalties or interest arising from federal or state taxes as a component of income tax expense.
Employee Stock Ownership Plan (“ESOP”) - Compensation expense recognized for the Company’s ESOP equals the fair value of shares that have been allocated or committed to be released for allocation to participants. Any difference between the fair value of the shares at the time and the ESOP’s original acquisition cost is charged or credited to stockholders’ equity (additional paid-in capital). The cost of ESOP shares that have not yet been allocated or committed to be released is deducted from stockholders’ equity.
Earnings Per Share - Basic earnings per share (“EPS”) are computed by dividing income available to common stockholders by the weighted average number of common shares outstanding for the period. Diluted earnings per share reflect the potential dilution that could occur if securities or other contracts to issue common stock were exercised or converted into common stock or resulted in the issuance of common stock that then shared in the earnings of the entity. For purposes of computing basic and dilutive EPS, ESOP shares that have been committed to be released are outstanding and ESOP shares that have not been committed to be released shall not be considered outstanding.
Comprehensive Income (Loss) - Comprehensive income (loss) is comprised of net income and other comprehensive income (loss). Other comprehensive income (loss) includes items recorded directly to equity, such as unrealized holding gains and losses on securities available-for-sale.
Financial Instruments - In the ordinary course of business, the Company has entered into agreements for off-balance-sheet financial instruments consisting of commitments to extend credit and stand-by letters of credit. Such financial instruments are recorded in the financial statements when they are funded or related fees are incurred or received.
Restricted Assets - Federal Reserve regulations require that the Bank maintain reserves in the form of cash on hand and deposit balances with the FRB, based on a percentage of deposits. The amounts of such balances for the years ended December 31, 2016 and 2015 were $10.7 million and $3.0 million, respectively, included in interest-bearing deposits at other financial institutions on the balance sheet.
Marketing and Advertising Costs - The Company records marketing and advertising costs as expenses as they are incurred. Total marketing and advertising expense was $710,000 and $709,000 for the years ended December 31, 2016 and 2015, respectively.
Stock-Based Compensation - Compensation cost is recognized for stock options and restricted stock awards, based on the fair value of these awards at the grant date. A Black-Scholes model is utilized to estimate the fair value of stock options, while the market price of the Company’s common stock at the grant date is used for restricted stock awards.
83 | ||
FS BANCORP, INC. AND SUBSIDIARY NOTES TO CONSOLIDATED FINANCIAL STATEMENTS DECEMBER 31, 2016 AND 2015 | ||
Compensation cost is recognized over the required service period, generally defined as the vesting period. For awards with graded vesting, compensation cost is recognized on a straight-line basis over the requisite service period for the entire award.
Goodwill - Goodwill is recorded upon completion of a business combination as the difference between the purchase price and the fair value of net identifiable assets acquired. Goodwill was not recorded until the first quarter of 2016 in recognition of the four retail branches purchased from Bank of America. Subsequent to initial recognition, the Company tests goodwill for impairment during the fourth quarter of each fiscal year, or more often if events or circumstances, such as adverse changes in the business climate indicate there may be impairment. There was no goodwill impairment at December 31, 2016 and there was no goodwill at December 31, 2015.
Application of New Accounting Guidance
At October 1, 2016, the Company adopted FASB Accounting Standards Update (“ASU”) No 2016-09, Compensation - Stock Compensation (Topic 718): Improvements to Employee Share-Based Payment Accounting. ASU 2016-09, seeks to simplify several aspects of the accounting for employee share-based payment transactions, including income tax consequences, classification of awards as either equity or liabilities, and classification on the statement of cash flows. As required by ASU 2016-09, all adjustments are reflected as of the beginning of the fiscal year, January 1, 2016. By applying this ASU, the Company no longer adjusts common stock for the tax impact of shares released, instead the tax impact is recognized as tax expense in the period the shares are released. This simplifies the tracking of the excess tax benefits and deficiencies, but could cause volatility in tax expense for the periods presented. The statement of cash flows has been adjusted to reflect the provisions of this ASU. The application of this ASU did not have a material impact on the consolidated financial statements.
RECENT ACCOUNTING PRONOUNCEMENTS
In May 2014, the FASB issued ASU No. 2014-09, Revenue from Contracts with Customers (Topic 606), which creates Topic 606 and supersedes Topic 605, Revenue Recognition. In August 2015, FASB issued ASU No. 2015-14, Revenue from Contracts with Customers (Topic 606), which postponed the effective date of 2014-09. In March 2016, the FASB issued ASU 2016-08, Revenue from Contracts with Customers (Topic 606): Principal versus Agent Considerations (Reporting Revenue Gross versus Net), which amended the principal versus agent implementation guidance set for in ASU 2014-09. Among other things, ASU 2016-08 clarifies that an entity should evaluate whether it is the principal or the agent for each specified good or service promised in a contract with a customer. In April 2016, the FASB issued ASU No. 2016-10, Revenue from Contracts with Customers (Topic 606): Identifying Performance Obligations and Licensing. The ASU amends certain aspects of the guidance set forth in the FASB's new revenue standard related to identifying performance obligations and licensing implementation. The core principle of Topic 606 is that an entity recognizes revenue to depict the transfer of promised goods or services to customers in an amount that reflects the consideration to which the entity expects to be entitled in exchange for those goods or services. In general, the new guidance requires companies to use more judgment and make more estimates than under current guidance, including identifying performance obligations in the contract, estimating the amount of variable consideration to include in the transaction price and allocating the transaction price to each separate performance obligation. In May 2016, the FASB issued ASU No. 2016-12, Revenue from Contracts with Customers (Topic 606): Narrow-Scope Improvements and Practical Expedients, which provides clarifying guidance in certain narrow areas and adds some practical expedients, but does not change the core revenue recognition principle in Topic 606. The ASU is effective for public entities for interim and annual periods beginning after December 15, 2017; early adoption is not permitted. For financial reporting purposes, the ASU allows for either full retrospective adoption, meaning the ASU is applied to all of the periods presented, or modified retrospective adoption, meaning the ASU is applied only to the most current period presented in the financial statements with the cumulative effect of initially applying the standard recognized at the date of initial application. As a bank holding company, key revenue sources, such as interest income have been identified as out of the scope of this new guidance. The Company’s preliminary analysis suggests that the adoption of this accounting standard is not expected to have a material impact on the Company’s consolidated financial statements as substantially all of the Company’s revenues are excluded from the scope of the new guidance. New accounting guidance related to
84 | ||
FS BANCORP, INC. AND SUBSIDIARY NOTES TO CONSOLIDATED FINANCIAL STATEMENTS DECEMBER 31, 2016 AND 2015 | ||
the adoption of this standard continues to be released by the FASB, which could impact the Company’s preliminary analysis of materiality and may change the preliminary conclusions reached as to the application of this new guidance.
In January 2016, the FASB issued ASU No. 2016-01, Financial Instruments - Overall (Subtopic 825-10), Recognition and Measurement of Financial Assets and Financial Liabilities. The new guidance is intended to improve the recognition and measurement of financial instruments. This ASU requires equity investments (except those accounted for under the equity method of accounting, or those that result in consolidation of the investee) to be measured at fair value with changes in fair value recognized in net income. In addition, the amendments in this ASU require the exit price notion be used when measuring the fair value of financial instruments for disclosure purposes and requires separate presentation of financial assets and financial liabilities by measurement category and form of financial asset (i.e., securities or loans and receivables) on the balance sheet or the accompanying notes to the financial statements. This ASU also eliminates the requirement to disclose the method(s) and significant assumptions used to estimate the fair value that is required to be disclosed for financial instruments measured at amortized cost on the balance sheet. The ASU also requires a reporting organization to present separately in other comprehensive income the portion of the total change in the fair value of a liability resulting from a change in the instrument specific credit risk (also referred to as “own credit”) when the organization has elected to measure the liability at fair value in accordance with the fair value option for financial instruments. ASU No. 2016-01 is effective for financial statements issued for fiscal years beginning after December 15, 2017, and interim periods within those fiscal years. Early adoption is permitted for certain provisions. The Company is currently evaluating the impact of this ASU on the Company’s consolidated financial statements.
In February 2016, FASB issued ASU No. 2016-02, Leases (Topic 842). ASU No. 2016-02 requires lessees to recognize on the balance sheet the assets and liabilities arising from operating leases. A lessee should recognize a liability to make lease payments and a right-of-use asset representing its right to use the underlying asset for the lease term. A lessee should include payments to be made in an optional period only if the lessee is reasonably certain to exercise an option to extend the lease or not to exercise an option to terminate the lease. For a finance lease, interest payments should be recognized separately from amortization of the right-of-use asset in the statement of comprehensive income. For operating leases, the lease cost should be allocated over the lease term on a generally straight-line basis. The amendments in ASU 2016-02 are effective for fiscal years beginning after December 15, 2018, including interim periods within those fiscal years. Early application of the amendments in the ASU is permitted. Once adopted, we expect to report higher assets and liabilities as a result of including additional lease information on the consolidated balance sheets, however, the adoption of ASU 2016-02 is expected to increase our balance sheets by less than 5% and not to have a material impact on our regulatory capital ratios.
In March 2016, the FASB issued ASU No. 2016-06, Derivatives and Hedging (Topic 815): Contingent Put and Call Options in Debt Instruments. The ASU simplifies the embedded derivative analysis for debt instruments containing contingent call or put options by removing the requirement to assess whether a contingent event is related to interest rates or credit risks. The ASU is effective for annual periods beginning after December 15, 2016, including interim periods within those fiscal years. Early adoption of the ASU is permitted. The Company does not expect this ASU to have a material impact on the Company’s consolidated financial statements.
In March 2016, the FASB issued ASU No. 2016-07, Investments - Equity Method and Joint Ventures (Topic 323): Simplifying the Transition to the Equity Method of Accounting. The ASU eliminates the requirement that when an investment qualifies for use of the equity method as a result of an increase in the level of ownership interest or degree of influence, an adjustment must be made to the investment, results of operations, and retained earnings retroactively on a step-by-step basis as if the equity method had been in effect during all previous periods that the investment had been held. The ASU is effective for annual periods beginning after December 15, 2016, including interim periods within those fiscal years. Early adoption of the ASU is permitted. The Company does not expect this ASU to have a material impact on the Company’s consolidated financial statements.
In March 2016, the FASB issued ASU No. 2016-09, Compensation - Stock Compensation (Topic 718): Improvements to Employee Share-Based Payment Accounting. The amendments in this ASU seek to simplify several aspects of the accounting for employee share-based payment transactions, including income tax consequences, classification of awards as either equity or liabilities, and classification on the statement of cash flows. ASU 2016-09 will be effective for the Company for annual periods beginning after December 15, 2016, including interim periods within those fiscal years.
85 | ||
FS BANCORP, INC. AND SUBSIDIARY NOTES TO CONSOLIDATED FINANCIAL STATEMENTS DECEMBER 31, 2016 AND 2015 | ||
Early adoption of the update is permitted. The early adoption of ASU 2016-09 did not have a material impact on the Company’s consolidated financial statements.
In June 2016, the FASB issued ASU No. 2016-13, Financial Instruments - Credit Losses (Topic 326): Measurement of Credit Losses on Financial Instruments. The ASU is intended to improve financial reporting by requiring timelier recording of credit losses on loans and other financial instruments held by financial institutions and other organizations. The ASU requires the measurement of all expected credit losses for financial assets held at the reporting date based on historical experience, current conditions, and reasonable and supportable forecasts. Financial institutions and other organizations will now use forward-looking information to better inform their credit loss estimates. Many of the loss estimation techniques applied today will still be permitted, although the inputs to those techniques will change to reflect the full amount of expected credit losses. Organizations will continue to use judgment to determine which loss estimation method is appropriate for their circumstances. The ASU requires enhanced disclosures to help investors and other financial statement users better understand significant estimates and judgments used in estimating credit losses, as well as the credit quality and underwriting standards of an organization’s portfolio. These disclosures include qualitative and quantitative requirements that provide additional information about the amounts recorded in the financial statements. In addition, the ASU amends the accounting for credit losses on available-for-sale debt securities and purchased financial assets with credit deterioration. The ASU is effective for fiscal years, and interim periods within those fiscal years, beginning after December 15, 2019. Early application will be permitted for fiscal years, and interim periods within those fiscal years, beginning after December 15, 2018. The Company is currently evaluating the impact of this ASU on the Company’s consolidated financial statements. Once adopted, we expect our allowance for loan losses to increase, however, until our evaluation is complete the magnitude of the increase will be unknown.
In August 2016, the FASB issued ASU No. 2016-15, Statement of Cash Flows (Topic 230): Classification of Certain Receipts and Cash Payments, a consensus of the FASB’s Emerging Issues Task Force. The ASU is intended to reduce diversity in practice in how certain transactions are presented and classified in the statement of cash flows. The standard will take effect for SEC filers for fiscal years, and interim periods within those fiscal years, beginning after December 15, 2017. The Company does not expect this ASU to have a material impact on the Company’s consolidated financial statements.
In January 2017, the FASB issued ASU 2017-03, Accounting Changes and Error Corrections (Topic 250) and Investments-Equity Method and Joint Ventures (Topic 323). The ASU amends the Codification for SEC staff announcements made at recent Emerging Issues Task Force (EITF) meetings. The SEC guidance that specifically relates to our Consolidated Financial Statement was from the September 2016 meeting, where the SEC staff expressed their expectations about the extent of disclosures registrants should make about the effects of the new FASB guidance as well as any amendments issued prior to adoption, on revenue (ASU 2014-09), leases (ASU 2016-02) and credit losses on financial instruments (ASU 2016-13) in accordance with SAB Topic 11.M. Registrants are required to disclose the effect that recently issued accounting standards will have on their financial statements when adopted in a future period. In cases where a registrant cannot reasonably estimate the impact of the adoption, then additional qualitative disclosures should be considered. The ASU incorporates these SEC staff views into ASC 250 and adds references to that guidance in the transition paragraphs of each of the three new standards. The adoption of this ASU did not have a material effect on the company's consolidated financial statements.
In January 2017, the FASB issued ASU 2017-04 - Intangibles - Goodwill and Other (Topic 350): Simplifying the Test for Goodwill Impairment. The ASU was issued to simplify the subsequent measurement of goodwill and the amendment eliminates Step 2 from the goodwill impairment test. The annual, or interim, goodwill impairment test is performed by comparing the fair value of a reporting unit with its carrying amount. An impairment charge should be recognized for the amount by which the carrying amount exceeds the reporting unit's fair value; however, the loss recognized should not exceed the total amount of goodwill allocated to that reporting unit. In addition, income tax effects from any tax deductible goodwill on the carrying amount of the reporting unit should be considered when measuring the goodwill impairment loss, if applicable. An entity still has the option to perform the qualitative assessment for a reporting unit to determine if the quantitative impairment test is necessary. This ASU is effective for annual reporting periods beginning after December 31, 2019. Early adoption is of the update is permitted. The Company does not expect this ASU to have a material impact on the Company's consolidated financial statements.
86 | ||
FS BANCORP, INC. AND SUBSIDIARY NOTES TO CONSOLIDATED FINANCIAL STATEMENTS DECEMBER 31, 2016 AND 2015 | ||
NOTE 2 - BUSINESS COMBINATION
On January 22, 2016, the Company’s wholly-owned subsidiary, 1st Security Bank, completed the purchase of four branches (“Branch Purchase”) from Bank of America, National Association (“Bank of America”). The Branch Purchase included four retail bank branches located in the communities of Port Angeles, Sequim, Port Townsend, and Hadlock, Washington. In accordance with the Purchase and Assumption Agreement, dated as of September 1, 2015, between Bank of America and 1st Security Bank, the Bank acquired $186.4 million of deposits, a small portfolio of performing loans, two owned bank branches, three leases for the bank branches and parking facilities and certain other assets of the branches effective January 22, 2016. As of December 31, 2016, approximately $162.2 million of the acquired deposits remain at 1st Security Bank. These banks attracted new deposits with an aggregated total of $195.5 million, including public funds at year ended December 31, 2016. In consideration of the purchased assets and transferred liabilities, 1st Security Bank paid (a) the unpaid principal balance and accrued interest of $419,000 for the loans acquired, (b) the net book value, or approximately $778,000, for the bank facilities and certain other assets associated with the acquired branches, and (c) a deposit premium of 2.50% on substantially all of the deposits assumed, which equated to approximately $4.8 million. The transaction was settled with Bank of America paying cash of $180.4 million to 1st Security Bank for the difference between these amounts and the total deposits assumed.
The Branch Purchase was accounted for under the acquisition method of accounting and accordingly, the assets and liabilities were recorded at their fair values on January 22, 2016, the date of acquisition. Determining the fair value of assets and liabilities is a complicated process involving significant judgment regarding methods and assumptions used to calculate estimated fair values. Fair values are preliminary and subject to refinement for up to one year after the closing date of the acquisition as information relative to closing date fair values become available. During the second quarter of 2016, the Company completed a re-evaluation of the core deposit intangible because a portion of core deposits were excluded from the original valuation. The updated valuation of the core deposit intangible increased the fair value adjustment by $100,000 to $2.2 million from $2.1 million resulting in a decrease of $100,000 to the fair value adjustment of goodwill. The impact to consolidated net income was an increase in the amortization of the core deposit intangible for the six months ended June 30, 2016 of $6,000 and was not considered material to the consolidated financial statements.
The following table summarizes the estimated fair values of assets acquired and liabilities assumed at the date of acquisition:
January 22, 2016 | Acquired Book Value | Fair Value Adjustments | Amount Recorded | |||||||||
Assets | ||||||||||||
Cash and cash equivalents | $ | 180,356 | $ | — | $ | 180,356 | ||||||
Loans receivable | 417 | — | 417 | |||||||||
Premises and equipment, net | 697 | 267 | (1) | 964 | ||||||||
Accrued interest receivable | 2 | — | 2 | |||||||||
Core deposit intangible | — | 2,239 | (2) | 2,239 | ||||||||
Goodwill | — | 2,312 | (3) | 2,312 | ||||||||
Other assets | 103 | — | 103 | |||||||||
Total assets acquired | $ | 181,575 | $ | 4,818 | $ | 186,393 | ||||||
Liabilities | ||||||||||||
Deposits: | ||||||||||||
Noninterest-bearing accounts | $ | 79,966 | $ | — | $ | 79,966 | ||||||
Interest-bearing accounts | 106,398 | — | 106,398 | |||||||||
Total deposits | 186,364 | — | 186,364 | |||||||||
Accrued interest payable | 7 | — | 7 | |||||||||
Other liabilities | 22 | — | 22 | |||||||||
Total liabilities assumed | $ | 186,393 | $ | — | $ | 186,393 | ||||||
87 | ||
FS BANCORP, INC. AND SUBSIDIARY NOTES TO CONSOLIDATED FINANCIAL STATEMENTS DECEMBER 31, 2016 AND 2015 | ||
Explanation of Fair Value Adjustments
(1) The fair value adjustment represents the difference between the fair value of the acquired branches and the book value of the assets acquired. The Company utilized third-party valuations but did not receive appraisals to assist in the determination of fair value.
(2) The fair value adjustment represents the value of the core deposit base assumed in the Branch Purchase based on a study performed by an independent consulting firm. This amount was recorded by the Company as an identifiable intangible asset and will be amortized as an expense on an accelerated basis over the average life of the core deposit base, which is estimated to be nine years.
(3) The fair value adjustment represents the value of the goodwill calculated from the purchase based on the purchase price, less the fair value of assets acquired net of liabilities assumed.
Goodwill - The acquired goodwill represents the excess purchase price over the estimated fair value of the net assets acquired and was recorded at $2.3 million on January 22, 2016.
The following table summarizes the aggregate amount recognized for each major class of assets acquired and liabilities assumed by 1st Security Bank in the Branch Purchase on January 22, 2016:
At January 22, 2016 | ||||
Purchase price (1) | $ | 6,015 | ||
Recognized amounts of identifiable assets acquired and (liabilities assumed), at fair value: | ||||
Cash and cash equivalents | 186,371 | |||
Acquired loans | 417 | |||
Premises and equipment, net | 964 | |||
Accrued interest receivable | 2 | |||
Core deposit intangible | 2,239 | |||
Other assets | 103 | |||
Deposits | (186,364 | ) | ||
Accrued interest payable | (7 | ) | ||
Other liabilities | (22 | ) | ||
Total fair value of identifiable net assets | 3,703 | |||
Goodwill | $ | 2,312 | ||
(1) Purchase price includes premium paid on the deposits, the aggregate net book value of all assets acquired, and the unpaid principal and accrued interest on loans acquired.
Core deposit intangible
The core deposit intangible represents the fair value of the acquired core deposit base. The core deposit intangible will be amortized on an accelerated basis over approximately nine years. Total amortization expense was $522,000 for the year ended December 31, 2016, and none for the same period in 2015. Amortization expense for core deposit intangible is expected to be as follows:
2017 | $ | 400 | |
2018 | 307 | ||
2019 | 235 | ||
2020 | 181 | ||
2021 | 166 | ||
Thereafter | 428 | ||
Total | $ | 1,717 | |
88 | ||
FS BANCORP, INC. AND SUBSIDIARY NOTES TO CONSOLIDATED FINANCIAL STATEMENTS DECEMBER 31, 2016 AND 2015 | ||
NOTE 3 - SECURITIES AVAILABLE-FOR-SALE
The following tables present the amortized costs, unrealized gains, unrealized losses, and estimated fair values of securities available-for-sale at December 31, 2016 and 2015:
December 31, 2016 | |||||||||||||||
SECURITIES AVAILABLE-FOR-SALE | Amortized Cost | Unrealized Gains | Unrealized Losses | Estimated Fair Values | |||||||||||
U.S. agency securities | $ | 8,150 | $ | 12 | $ | (94 | ) | $ | 8,068 | ||||||
Corporate securities | 7,654 | 14 | (168 | ) | 7,500 | ||||||||||
Municipal bonds | 15,183 | 164 | (83 | ) | 15,264 | ||||||||||
Mortgage-backed securities | 45,856 | 52 | (713 | ) | 45,195 | ||||||||||
U.S. Small Business Administration securities | 5,862 | 27 | (41 | ) | 5,848 | ||||||||||
Total securities available-for-sale | $ | 82,705 | $ | 269 | $ | (1,099 | ) | $ | 81,875 | ||||||
December 31, 2015 | |||||||||||||||
SECURITIES AVAILABLE-FOR-SALE | Amortized Cost | Unrealized Gains | Unrealized Losses | Estimated Fair Values | |||||||||||
U.S. agency securities | $ | 6,134 | $ | — | $ | (99 | ) | $ | 6,035 | ||||||
Corporate securities | 3,495 | 5 | (67 | ) | 3,433 | ||||||||||
Municipal bonds | 18,531 | 373 | (13 | ) | 18,891 | ||||||||||
Mortgage-backed securities | 22,926 | 72 | (163 | ) | 22,835 | ||||||||||
U.S. Small Business Administration securities | 4,011 | 23 | (11 | ) | 4,023 | ||||||||||
Total securities available-for-sale | $ | 55,097 | $ | 473 | $ | (353 | ) | $ | 55,217 | ||||||
The Bank pledged 12 securities held at the FHLB with a carrying value of $14.2 million to secure Washington State public deposits of $5.5 million with a $550,000 collateral requirement by the Washington Public Deposit Protection Commission at December 31, 2016.
Investment securities that were in an unrealized loss position at December 31, 2016 and 2015 are presented in the following tables, based on the length of time individual securities have been in an unrealized loss position. Management believes that these securities are only temporarily impaired due to changes in market interest rates or the widening of market spreads subsequent to the initial purchase of the securities, and not due to concerns regarding the underlying credit of the issuers or the underlying collateral.
December 31, 2016 | |||||||||||||||||||||||
Less than 12 Months | 12 Months or Longer | Total | |||||||||||||||||||||
SECURITIES AVAILABLE-FOR-SALE | Fair Value | Unrealized Losses | Fair Value | Unrealized Losses | Fair Value | Unrealized Losses | |||||||||||||||||
U.S. agency securities | $ | 6,998 | $ | (94 | ) | $ | — | $ | — | $ | 6,998 | $ | (94 | ) | |||||||||
Corporate securities | 5,048 | (106 | ) | 1,438 | (62 | ) | 6,486 | (168 | ) | ||||||||||||||
Municipal bonds | 6,741 | (83 | ) | — | — | 6,741 | (83 | ) | |||||||||||||||
Mortgage-backed securities | 39,373 | (713 | ) | — | — | 39,373 | (713 | ) | |||||||||||||||
U.S. Small Business Administration securities | 2,963 | (41 | ) | — | — | 2,963 | (41 | ) | |||||||||||||||
Total | $ | 61,123 | $ | (1,037 | ) | $ | 1,438 | $ | (62 | ) | $ | 62,561 | $ | (1,099 | ) | ||||||||
89 | ||
FS BANCORP, INC. AND SUBSIDIARY NOTES TO CONSOLIDATED FINANCIAL STATEMENTS DECEMBER 31, 2016 AND 2015 | ||
December 31, 2015 | |||||||||||||||||||||||
Less than 12 Months | 12 Months or Longer | Total | |||||||||||||||||||||
SECURITIES AVAILABLE-FOR-SALE | Fair Value | Unrealized Losses | Fair Value | Unrealized Losses | Fair Value | Unrealized Losses | |||||||||||||||||
U.S. agency securities | $ | 2,107 | $ | (31 | ) | $ | 3,928 | $ | (68 | ) | $ | 6,035 | $ | (99 | ) | ||||||||
Corporate securities | 994 | (6 | ) | 1,439 | (61 | ) | 2,433 | (67 | ) | ||||||||||||||
Municipal bonds | 956 | (1 | ) | 293 | (12 | ) | 1,249 | (13 | ) | ||||||||||||||
Mortgage-backed securities | 15,642 | (112 | ) | 2,119 | (51 | ) | 17,761 | (163 | ) | ||||||||||||||
U.S. Small Business Administration securities | 990 | (11 | ) | — | — | 990 | (11 | ) | |||||||||||||||
Total | $ | 20,689 | $ | (161 | ) | $ | 7,779 | $ | (192 | ) | $ | 28,468 | $ | (353 | ) | ||||||||
There were 48 investments with unrealized losses of less than one year and two investments with unrealized losses of more than one year at December 31, 2016. There were 17 investments with unrealized losses of less than one year and eight investments with unrealized losses of more than one year at December 31, 2015. The unrealized losses associated with these investments are believed to be caused by changing market conditions that are considered to be temporary and the Company does not intend to sell these securities, and it is not likely to be required to sell these securities prior to maturity. No other-than-temporary impairment was recorded for the years ended December 31, 2016 and 2015.
The contractual maturities of securities available-for-sale at December 31, 2016 and 2015 are listed below. Expected maturities of mortgage-backed securities may differ from contractual maturities because borrowers may have the right to call or prepay the obligations; therefore, these securities are classified separately with no specific maturity date.
December 31, 2016 | December 31, 2015 | ||||||||||||||
U.S. agency securities | Amortized Cost | Fair Value | Amortized Cost | Fair Value | |||||||||||
Due after one year through five years | $ | 4,000 | $ | 3,956 | $ | — | $ | — | |||||||
Due after five years through ten years | 4,150 | 4,112 | 6,134 | 6,035 | |||||||||||
Subtotal | 8,150 | 8,068 | 6,134 | 6,035 | |||||||||||
Corporate securities | |||||||||||||||
Due after one year through five years | 5,659 | 5,625 | 1,500 | 1,490 | |||||||||||
Due after five years through ten years | 1,995 | 1,875 | 1,995 | 1,943 | |||||||||||
Subtotal | 7,654 | 7,500 | 3,495 | 3,433 | |||||||||||
Municipal bonds | |||||||||||||||
Due in one year or less | 509 | 513 | 991 | 997 | |||||||||||
Due after one year through five years | 5,326 | 5,386 | 3,904 | 3,954 | |||||||||||
Due after five years through ten years | 7,476 | 7,492 | 7,807 | 7,981 | |||||||||||
Due after ten years | 1,872 | 1,873 | 5,829 | 5,959 | |||||||||||
Subtotal | 15,183 | 15,264 | 18,531 | 18,891 | |||||||||||
Mortgage-backed securities | |||||||||||||||
Federal National Mortgage Association (“FNMA”) | 23,522 | 23,197 | 12,515 | 12,466 | |||||||||||
Federal Home Loan Mortgage Corporation (“FHLMC”) | 14,950 | 14,662 | 4,524 | 4,501 | |||||||||||
Government National Mortgage Association (“GNMA”) | 7,384 | 7,336 | 5,887 | 5,868 | |||||||||||
Subtotal | 45,856 | 45,195 | 22,926 | 22,835 | |||||||||||
U.S. Small Business Administration securities | |||||||||||||||
Due after five years through ten years | 5,862 | 5,848 | 4,011 | 4,023 | |||||||||||
Total | $ | 82,705 | $ | 81,875 | $ | 55,097 | $ | 55,217 | |||||||
90 | ||
FS BANCORP, INC. AND SUBSIDIARY NOTES TO CONSOLIDATED FINANCIAL STATEMENTS DECEMBER 31, 2016 AND 2015 | ||
The proceeds and resulting gains and losses, computed using specific identification from sales of securities available-for-sale for the years ended December 31, 2016 and 2015 were as follows:
December 31, 2016 | |||||||||||
Proceeds | Gross Gains | Gross Losses | |||||||||
Securities available-for-sale | $ | 13,577 | $ | 149 | $ | (3 | ) | ||||
December 31, 2015 | |||||||||||
Proceeds | Gross Gains | Gross Losses | |||||||||
Securities available-for-sale | $ | 4,178 | $ | 76 | $ | — | |||||
NOTE 4 - LOANS RECEIVABLE AND ALLOWANCE FOR LOAN LOSSES
The composition of the loan portfolio was as follows at December 31:
REAL ESTATE LOANS | 2016 | 2015 | |||||
Commercial | $ | 55,871 | $ | 50,034 | |||
Construction and development | 94,462 | 80,806 | |||||
Home equity | 20,081 | 16,540 | |||||
One-to-four-family (excludes loans held for sale) | 124,009 | 102,921 | |||||
Multi-family | 37,527 | 22,223 | |||||
Total real estate loans | 331,950 | 272,524 | |||||
CONSUMER LOANS | |||||||
Indirect home improvement | 107,759 | 103,064 | |||||
Solar | 36,503 | 29,226 | |||||
Marine | 28,549 | 23,851 | |||||
Other consumer | 1,915 | 2,181 | |||||
Total consumer loans | 174,726 | 158,322 | |||||
COMMERCIAL BUSINESS LOANS | |||||||
Commercial and industrial | 65,841 | 59,619 | |||||
Warehouse lending | 32,898 | 20,817 | |||||
Total commercial business loans | 98,739 | 80,436 | |||||
Total loans receivable, gross | 605,415 | 511,282 | |||||
Allowance for loan losses | (10,211 | ) | (7,785 | ) | |||
Deferred costs, fees, and discounts, net | (1,887 | ) | (962 | ) | |||
Total loans receivable, net | $ | 593,317 | $ | 502,535 | |||
The Company has defined its loan portfolio into three segments that reflect the structure of the lending function, the Company’s strategic plan and the manner in which management monitors performance and credit quality. The three loan portfolio segments are: (a) Real Estate Loans, (b) Consumer Loans and (c) Commercial Business Loans. Each of these segments is disaggregated into classes based on the risk characteristics of the borrower and/or the collateral type securing the loan.
91 | ||
FS BANCORP, INC. AND SUBSIDIARY NOTES TO CONSOLIDATED FINANCIAL STATEMENTS DECEMBER 31, 2016 AND 2015 | ||
The following is a summary of each of the Company’s loan portfolio segments and classes:
Real Estate Loans
Commercial Lending. Loans originated by the Company primarily secured by income producing properties, including retail centers, warehouses and office buildings located in our market areas.
Construction and Development Lending. Loans originated by the Company for the construction of, and secured by, commercial real estate, one-to-four-family, and multi-family residences and tracts of land for development that are not pre-sold.
Home Equity Lending. Loans originated by the Company secured by second mortgages on one-to-four-family residences in our market areas.
One-to-Four-Family Real Estate Lending. One-to-four-family residential loans include owner occupied properties (including second homes), and non-owner occupied properties. These loans originated by the Company are secured by first mortgages on one-to-four-family residences in our market areas that the Company intends to hold (excludes loans held for sale).
Multi-family Lending. Apartment term lending (five or more units) to current banking customers and community reinvestment loans for low to moderate income individuals in the Company’s footprint.
Consumer Loans
Indirect Home Improvement. Fixture secured loans are originated by the Company for home improvement and are secured by the personal property installed in, on, or at the borrower’s real property, and may be perfected with a UCC-2 financing statement filed in the county of the borrower’s residence. These indirect home improvement loans include replacement windows, siding, roofing, and other home fixture installations.
Solar. Fixture secured loans are originated by the Company for home improvement and are secured by the personal property installed in, on, or at the borrower’s real property, and may be perfected with a UCC-2 financing statement filed in the county of the borrower’s residence.
Marine. Loans originated by the Company secured by boats to borrowers primarily located in its market areas.
Other Consumer. Loans originated by the Company, including automobiles, recreational vehicles, direct home improvement loans, loans on deposits and other consumer loans, primarily consisting of personal lines of credit.
Commercial Business Loans
Commercial and Industrial Lending. Loans originated by the Company to local small and mid-sized businesses in our Puget Sound market area are secured primarily by accounts receivable, inventory, or personal property, plant and equipment. Commercial and industrial loans are made on the basis of the borrower’s ability to make repayment from the cash flow of the borrower’s business.
Warehouse Lending. Loans originated by the Company’s mortgage and construction warehouse lending program through which the Company funds third-party bankers originating residential mortgage and construction loans for sale into the secondary market and speculative construction loans for sale to single family households. These loans are secured by the notes and assigned deeds of trust associated with the residential mortgage and construction loans on properties primarily located in the Company’s market areas.
92 | ||
FS BANCORP, INC. AND SUBSIDIARY NOTES TO CONSOLIDATED FINANCIAL STATEMENTS DECEMBER 31, 2016 AND 2015 | ||
The following tables detail activities in the allowance for loan losses by loan categories for the years shown:
At or For the Year Ended December 31, 2016 | |||||||||||||||||||
ALLOWANCE FOR LOAN LOSSES | Real Estate | Consumer | Commercial Business | Unallocated | Total | ||||||||||||||
Beginning balance | $ | 2,874 | $ | 1,681 | $ | 1,396 | $ | 1,834 | $ | 7,785 | |||||||||
Provision for loan losses | 622 | 513 | 1,192 | 73 | 2,400 | ||||||||||||||
Charge-offs | (65 | ) | (1,002 | ) | — | — | (1,067 | ) | |||||||||||
Recoveries | 116 | 890 | 87 | — | 1,093 | ||||||||||||||
Net recoveries (charge-offs) | 51 | (112 | ) | 87 | — | 26 | |||||||||||||
Ending balance | $ | 3,547 | $ | 2,082 | $ | 2,675 | $ | 1,907 | $ | 10,211 | |||||||||
Year-end amount allocated to: | |||||||||||||||||||
Loans individually evaluated for impairment | $ | — | $ | — | $ | — | $ | — | $ | — | |||||||||
Loans collectively evaluated for impairment | 3,547 | 2,082 | 2,675 | 1,907 | 10,211 | ||||||||||||||
Ending balance | $ | 3,547 | $ | 2,082 | $ | 2,675 | $ | 1,907 | $ | 10,211 | |||||||||
LOANS RECEIVABLE | |||||||||||||||||||
Loans individually evaluated for impairment | $ | 194 | $ | — | $ | — | $ | — | $ | 194 | |||||||||
Loans collectively evaluated for impairment | 331,756 | 174,726 | 98,739 | — | 605,221 | ||||||||||||||
Ending balance | $ | 331,950 | $ | 174,726 | $ | 98,739 | $ | — | $ | 605,415 | |||||||||
At or For the Year Ended December 31, 2015 | |||||||||||||||||||
ALLOWANCE FOR LOAN LOSSES | Real Estate | Consumer | Commercial Business | Unallocated | Total | ||||||||||||||
Beginning balance | $ | 1,872 | $ | 1,431 | $ | 1,184 | $ | 1,603 | $ | 6,090 | |||||||||
Provision for loan losses | 1,026 | 757 | 236 | 231 | 2,250 | ||||||||||||||
Charge-offs | (248 | ) | (1,466 | ) | (40 | ) | — | (1,754 | ) | ||||||||||
Recoveries | 224 | 959 | 16 | — | 1,199 | ||||||||||||||
Net charge-offs | (24 | ) | (507 | ) | (24 | ) | — | (555 | ) | ||||||||||
Ending balance | $ | 2,874 | $ | 1,681 | $ | 1,396 | $ | 1,834 | $ | 7,785 | |||||||||
Year-end amount allocated to: | |||||||||||||||||||
Loans individually evaluated for impairment | $ | — | $ | — | $ | — | $ | — | $ | — | |||||||||
Loans collectively evaluated for impairment | 2,874 | 1,681 | 1,396 | 1,834 | 7,785 | ||||||||||||||
Ending balance | $ | 2,874 | $ | 1,681 | $ | 1,396 | $ | 1,834 | $ | 7,785 | |||||||||
LOANS RECEIVABLE | |||||||||||||||||||
Loans individually evaluated for impairment | $ | 734 | $ | — | $ | — | $ | — | $ | 734 | |||||||||
Loans collectively evaluated for impairment | 271,790 | 158,322 | 80,436 | — | 510,548 | ||||||||||||||
Ending balance | $ | 272,524 | $ | 158,322 | $ | 80,436 | $ | — | $ | 511,282 | |||||||||
Nonaccrual and Past Due Loans. Loans are considered past due if the required principal and interest payments have not been received as of the date such payments were due. Loans are automatically placed on nonaccrual once the loan is 90 days past due or sooner if, in management’s opinion, the borrower may be unable to meet payment obligations as they become due, or as required by regulatory authorities.
93 | ||
FS BANCORP, INC. AND SUBSIDIARY NOTES TO CONSOLIDATED FINANCIAL STATEMENTS DECEMBER 31, 2016 AND 2015 | ||
The following tables provide information pertaining to the aging analysis of contractually past due loans and nonaccrual loans for the years ended December 31, 2016 and 2015:
December 31, 2016 | |||||||||||||||||||||||||||
REAL ESTATE LOANS | 30-59 Days Past Due | 60-89 Days Past Due | 90 Days or More Past Due | Total Past Due | Current | Total Loans Receivable | Non-Accrual | ||||||||||||||||||||
Commercial | $ | — | $ | — | $ | — | $ | — | $ | 55,871 | $ | 55,871 | $ | — | |||||||||||||
Construction and development | — | — | — | — | 94,462 | 94,462 | — | ||||||||||||||||||||
Home equity | 34 | — | 210 | 244 | 19,837 | 20,081 | 210 | ||||||||||||||||||||
One-to-four-family | — | — | — | — | 124,009 | 124,009 | — | ||||||||||||||||||||
Multi-family | — | — | — | — | 37,527 | 37,527 | — | ||||||||||||||||||||
Total real estate loans | 34 | — | 210 | 244 | 331,706 | 331,950 | 210 | ||||||||||||||||||||
CONSUMER LOANS | |||||||||||||||||||||||||||
Indirect home improvement | 268 | 278 | 167 | 713 | 107,046 | 107,759 | 435 | ||||||||||||||||||||
Solar | 92 | — | 69 | 161 | 36,342 | 36,503 | 69 | ||||||||||||||||||||
Marine | 8 | — | — | 8 | 28,541 | 28,549 | — | ||||||||||||||||||||
Other consumer | 3 | 2 | 4 | 9 | 1,906 | 1,915 | 7 | ||||||||||||||||||||
Total consumer loans | 371 | 280 | 240 | 891 | 173,835 | 174,726 | 511 | ||||||||||||||||||||
COMMERCIAL BUSINESS LOANS | |||||||||||||||||||||||||||
Commercial and industrial | — | — | — | — | 65,841 | 65,841 | — | ||||||||||||||||||||
Warehouse lending | — | — | — | — | 32,898 | 32,898 | — | ||||||||||||||||||||
Total commercial business loans | — | — | — | — | 98,739 | 98,739 | — | ||||||||||||||||||||
Total loans | $ | 405 | $ | 280 | $ | 450 | $ | 1,135 | $ | 604,280 | $ | 605,415 | $ | 721 | |||||||||||||
December 31, 2015 | |||||||||||||||||||||||||||
REAL ESTATE LOANS | 30-59 Days Past Due | 60-89 Days Past Due | 90 Days or More Past Due | Total Past Due | Current | Total Loans Receivable | Non-Accrual | ||||||||||||||||||||
Commercial | $ | — | $ | — | $ | — | $ | — | $ | 50,034 | $ | 50,034 | $ | — | |||||||||||||
Construction and development | — | — | — | — | 80,806 | 80,806 | — | ||||||||||||||||||||
Home equity | 157 | 20 | 47 | 224 | 16,316 | 16,540 | 47 | ||||||||||||||||||||
One-to-four-family | 48 | — | 525 | 573 | 102,348 | 102,921 | 525 | ||||||||||||||||||||
Multi-family | — | — | — | — | 22,223 | 22,223 | — | ||||||||||||||||||||
Total real estate loans | 205 | 20 | 572 | 797 | 271,727 | 272,524 | 572 | ||||||||||||||||||||
CONSUMER LOANS | |||||||||||||||||||||||||||
Indirect home improvement | 307 | 243 | 157 | 707 | 102,357 | 103,064 | 408 | ||||||||||||||||||||
Solar | 69 | — | 37 | 106 | 29,120 | 29,226 | 37 | ||||||||||||||||||||
Marine | 28 | — | — | 28 | 23,823 | 23,851 | — | ||||||||||||||||||||
Other consumer | — | — | — | — | 2,181 | 2,181 | — | ||||||||||||||||||||
Total consumer loans | 404 | 243 | 194 | 841 | 157,481 | 158,322 | 445 | ||||||||||||||||||||
COMMERCIAL BUSINESS LOANS | |||||||||||||||||||||||||||
Commercial and industrial | — | — | — | — | 59,619 | 59,619 | — | ||||||||||||||||||||
Warehouse lending | — | — | — | — | 20,817 | 20,817 | — | ||||||||||||||||||||
Total commercial business loans | — | — | — | — | 80,436 | 80,436 | — | ||||||||||||||||||||
Total loans | $ | 609 | $ | 263 | $ | 766 | $ | 1,638 | $ | 509,644 | $ | 511,282 | $ | 1,017 | |||||||||||||
There were no loans 90 days or more past due and still accruing interest at December 31, 2016 and 2015.
94 | ||
FS BANCORP, INC. AND SUBSIDIARY NOTES TO CONSOLIDATED FINANCIAL STATEMENTS DECEMBER 31, 2016 AND 2015 | ||
The following tables provide additional information about our impaired loans that have been segregated to reflect loans for which an allowance for credit losses has been provided and loans for which no allowance was provided for the years ended December 31, 2016 and 2015:
December 31, 2016 | |||||||||||||||
WITH NO RELATED ALLOWANCE RECORDED | Unpaid Principal Balance | Write- downs | Recorded Investment | Related Allowance | |||||||||||
Home equity | $ | 137 | $ | — | $ | 137 | $ | — | |||||||
One-to-four-family | 69 | (12 | ) | 57 | — | ||||||||||
Total | $ | 206 | $ | (12 | ) | $ | 194 | $ | — | ||||||
December 31, 2015 | |||||||||||||||
WITH NO RELATED ALLOWANCE RECORDED | Unpaid Principal Balance | Write- downs | Recorded Investment | Related Allowance | |||||||||||
One-to-four-family | $ | 801 | $ | (67 | ) | $ | 734 | $ | — | ||||||
The following table presents the average recorded investment in loans individually evaluated for impairment and the interest income recognized and received for the years ended December 31, 2016 and 2015:
At or For the Years Ended | |||||||||||||||
December 31, 2016 | December 31, 2015 | ||||||||||||||
WITH NO RELATED ALLOWANCE RECORDED | Average Recorded Investment | Interest Income Recognized | Average Recorded Investment | Interest Income Recognized | |||||||||||
Home equity | $ | 139 | $ | 1 | $ | — | $ | — | |||||||
One-to-four-family | 57 | 3 | 738 | 22 | |||||||||||
Total | $ | 196 | $ | 4 | $ | 738 | $ | 22 | |||||||
Credit Quality Indicators
As part of the Company’s on-going monitoring of credit quality of the loan portfolio, management tracks certain credit quality indicators including trends related to (i) the risk grading of loans, (ii) the level of classified loans, (iii) net charge-offs, (iv) non-performing loans and (v) the general economic conditions in the Company’s markets.
The Company utilizes a risk grading matrix to assign a risk grade to its real estate and commercial business loans. Loans are graded on a scale of 1 to 10, with loans in risk grades 1 to 6 considered “Pass” and loans in risk grades 7 to 10 are reported as classified loans in the Company’s allowance for loan loss analysis.
A description of the 10 risk grades is as follows:
• | Grades 1 and 2 - These grades include loans to very high quality borrowers with excellent or desirable business credit. |
• | Grade 3 - This grade includes loans to borrowers of good business credit with moderate risk. |
• | Grades 4 and 5 - These grades include “Pass” grade loans to borrowers of average credit quality and risk. |
• | Grade 6 - This grade includes loans on management’s “Watch” list and is intended to be utilized on a temporary basis for “Pass” grade borrowers where frequent and thorough monitoring is required due to credit weaknesses and where significant risk-modifying action is anticipated in the near term. |
• | Grade 7 - This grade is for “Other Assets Especially Mentioned (OAEM)” in accordance with regulatory guidelines and includes borrowers where performance is poor or significantly less than expected. |
95 | ||
FS BANCORP, INC. AND SUBSIDIARY NOTES TO CONSOLIDATED FINANCIAL STATEMENTS DECEMBER 31, 2016 AND 2015 | ||
• | Grade 8 - This grade includes “Substandard” loans in accordance with regulatory guidelines which represent an unacceptable business credit where a loss is possible if loan weakness is not corrected. |
• | Grade 9 - This grade includes “Doubtful” loans in accordance with regulatory guidelines where a loss is highly probable. |
• | Grade 10 - This grade includes “Loss” loans in accordance with regulatory guidelines for which total loss is expected and when identified are charged off. |
Consumer, Home Equity and One-to-Four-Family Real Estate Loans
Homogeneous loans are risk rated based upon the FDIC’s Uniform Retail Credit Classification and Account Management Policy. Loans classified under this policy at the Company are consumer loans which include indirect home improvement, solar, marine, other consumer, and one-to-four-family first and second liens. Under the Uniform Retail Credit Classification Policy, loans that are current or less than 90 days past due are graded “Pass” and risk graded “4” or “5”internally. Loans that are past due more than 90 days are classified “Substandard” risk graded “8” internally until the loan has demonstrated consistent performance, typically six months of contractual payments. Closed-end loans that are 120 days past due and open-end loans that are 180 days past due are charged off based on the value of the collateral less cost to sell.
The following tables summarize risk rated loan balances by category at the dates indicated:
December 31, 2016 | |||||||||||||||||||||||||||
REAL ESTATE LOANS | Pass (1 - 5) | Watch (6) | Special Mention (7) | Substandard (8) | Doubtful(9) | Loss (10) | Total | ||||||||||||||||||||
Commercial | $ | 53,234 | $ | 2,637 | $ | — | $ | — | $ | — | $ | — | $ | 55,871 | |||||||||||||
Construction and development | 94,462 | — | — | — | — | — | 94,462 | ||||||||||||||||||||
Home equity | 19,871 | — | — | 210 | — | — | 20,081 | ||||||||||||||||||||
One-to-four-family | 124,009 | — | — | — | — | — | 124,009 | ||||||||||||||||||||
Multi-family | 37,527 | — | — | — | — | — | 37,527 | ||||||||||||||||||||
Total real estate loans | 329,103 | 2,637 | — | 210 | — | — | 331,950 | ||||||||||||||||||||
CONSUMER | |||||||||||||||||||||||||||
Indirect home improvement | 107,324 | — | — | 435 | — | — | 107,759 | ||||||||||||||||||||
Solar | 36,434 | — | — | 69 | — | — | 36,503 | ||||||||||||||||||||
Marine | 28,549 | — | — | — | — | — | 28,549 | ||||||||||||||||||||
Other consumer | 1,813 | — | — | 102 | — | — | 1,915 | ||||||||||||||||||||
Total consumer loans | 174,120 | — | — | 606 | — | — | 174,726 | ||||||||||||||||||||
COMMERCIAL BUSINESS LOANS | |||||||||||||||||||||||||||
Commercial and industrial | 58,105 | 525 | — | 7,211 | — | — | 65,841 | ||||||||||||||||||||
Warehouse lending | 32,898 | — | — | — | — | — | 32,898 | ||||||||||||||||||||
Total commercial business loans | 91,003 | 525 | — | 7,211 | — | — | 98,739 | ||||||||||||||||||||
Total loans | $ | 594,226 | $ | 3,162 | $ | — | $ | 8,027 | $ | — | $ | — | $ | 605,415 | |||||||||||||
96 | ||
FS BANCORP, INC. AND SUBSIDIARY NOTES TO CONSOLIDATED FINANCIAL STATEMENTS DECEMBER 31, 2016 AND 2015 | ||
December 31, 2015 | |||||||||||||||||||||||||||
REAL ESTATE LOANS | Pass (1 - 5) | Watch (6) | Special Mention (7) | Substandard (8) | Doubtful(9) | Loss (10) | Total | ||||||||||||||||||||
Commercial | $ | 50,034 | $ | — | $ | — | $ | — | $ | — | $ | — | $ | 50,034 | |||||||||||||
Construction and development | 79,100 | 1,706 | — | — | — | — | 80,806 | ||||||||||||||||||||
Home equity | 16,493 | — | — | 47 | — | — | 16,540 | ||||||||||||||||||||
One-to-four-family | 102,396 | — | — | 525 | — | — | 102,921 | ||||||||||||||||||||
Multi-family | 22,223 | — | — | — | — | — | 22,223 | ||||||||||||||||||||
Total real estate loans | 270,246 | 1,706 | — | 572 | — | — | 272,524 | ||||||||||||||||||||
CONSUMER | |||||||||||||||||||||||||||
Indirect home improvement | 102,656 | — | — | 408 | — | — | 103,064 | ||||||||||||||||||||
Solar | 29,189 | — | — | 37 | — | — | 29,226 | ||||||||||||||||||||
Marine | 23,851 | — | — | — | — | — | 23,851 | ||||||||||||||||||||
Other consumer | 2,181 | — | — | — | — | — | 2,181 | ||||||||||||||||||||
Total consumer loans | 157,877 | — | — | 445 | — | — | 158,322 | ||||||||||||||||||||
COMMERCIAL BUSINESS LOANS | |||||||||||||||||||||||||||
Commercial and industrial | 54,977 | 2,352 | 335 | 1,955 | — | — | 59,619 | ||||||||||||||||||||
Warehouse lending | 20,817 | — | — | — | — | — | 20,817 | ||||||||||||||||||||
Total commercial business loans | 75,794 | 2,352 | 335 | 1,955 | — | — | 80,436 | ||||||||||||||||||||
Total loans | $ | 503,917 | $ | 4,058 | $ | 335 | $ | 2,972 | $ | — | $ | — | $ | 511,282 | |||||||||||||
Troubled Debt Restructured Loans
The Company had one TDR loan on accrual and included in impaired loans with a balance of $57,000 at December 31, 2016. At December 31, 2015, the Company had three TDR loans totaling $734,000, of which one TDR loan with a balance of $525,000 was on non-accrual and included in impaired loans, and the remaining two TDR loans totaling $209,000 were on accrual. The Company had no commitments to lend additional funds on the one TDR loan at December 31, 2016. At December 31, 2016 and 2015, all of the Company’s TDR loans consisted of one-to-four-family loans.
The following table summarizes TDR loan balances at the dates indicated:
December 31, | |||||||
2016 | 2015 | ||||||
TDR loans on accrual | $ | 57 | $ | 209 | |||
TDR loans on non-accrual | — | 525 | |||||
Total TDR loan balances | $ | 57 | $ | 734 | |||
For the years ended December 31, 2016 and 2015 there were no reported TDR loans that were modified in the previous 12 months that subsequently defaulted in the reporting year.
There was a $43,000 and a $525,000 mortgage loan collateralized by residential real estate property in the process of foreclosure at December 31, 2016 and 2015, respectively.
Related Party Loans
Certain directors and executive officers or their related affiliates are customers of and have had banking transactions with the Company. Total loans to directors, executive officers, and their affiliates are subject to regulatory limitations.
97 | ||
FS BANCORP, INC. AND SUBSIDIARY NOTES TO CONSOLIDATED FINANCIAL STATEMENTS DECEMBER 31, 2016 AND 2015 | ||
Outstanding loan balances were as follows and were within regulatory limitations:
At December 31, | |||||||
(In thousands) | 2016 | 2015 | |||||
Beginning balance | $ | — | $ | 13 | |||
Additions | 313 | — | |||||
Repayments | — | (13 | ) | ||||
Ending balance | $ | 313 | $ | — | |||
Aggregate loan balances of extended credit were $469,000 and $200,000 at December 31, 2016 and 2015, respectively.
These loans and lines of credit were made in compliance with applicable laws on substantially the same terms (including interest rates and collateral) as those prevailing at the time for comparable transactions with other persons and do not involve more than the normal risk of collectability.
NOTE 5 - SERVICING RIGHTS
Loans serviced for others are not included on the Consolidated Balance Sheets. The unpaid principal balances of loans serviced for others were $977.1 million and $636.1 million at December 31, 2016 and 2015, respectively and are carried at the lower of cost or market.
The following table summarizes servicing rights activity for the years ended December 31, 2016 and 2015:
2016 | 2015 | ||||||
Beginning balance | $ | 5,811 | $ | 3,061 | |||
Additions | 4,194 | 3,699 | |||||
Servicing rights amortized | (1,549 | ) | (949 | ) | |||
Recovery on servicing rights | 3 | — | |||||
Ending balance | $ | 8,459 | $ | 5,811 | |||
The fair market value of the servicing rights’ assets was $11.7 million and $6.8 million at December 31, 2016 and December 31, 2015, respectively. Fair value adjustments to servicing rights are mainly due to market based assumptions associated with discounted cash flows, loan prepayment speeds, and changes in interest rates. A significant change in prepayments of the loans in the servicing portfolio could result in significant changes in the valuation adjustments, thus creating potential volatility in the carrying amount of servicing rights.
The following provides valuation assumptions used in determining the fair value of mortgage servicing rights (“MSR”) at the dates indicated:
At December 31, | ||||||
Key assumptions: | 2016 | 2015 | ||||
Weighted average discount rate | 9.5 | % | 8.5 | % | ||
Conditional prepayment rate (“CPR”) | 8.8 | % | 12.2 | % | ||
Weighted average life in years | 7.9 | 6.4 | ||||
98 | ||
FS BANCORP, INC. AND SUBSIDIARY NOTES TO CONSOLIDATED FINANCIAL STATEMENTS DECEMBER 31, 2016 AND 2015 |
Key economic assumptions and the sensitivity of the current fair value for single family mortgage servicing rights to immediate adverse changes in those assumptions at December 31, 2016 and December 31, 2015 were as follows:
December 31, 2016 | December 31, 2015 | |||||||||||
Aggregate portfolio principal balance | $ | 973,139 | $ | 631,812 | ||||||||
Weighted average rate of note | 3.9 | % | 4.0 | % | ||||||||
At December 31, 2016 | Base | 0.5% Adverse Change | 1.0% Adverse Change | |||||||||
Conditional Prepayment Rate | 8.8 | % | 12.8 | % | 20.2 | % | ||||||
Fair value MSR | $ | 11,735 | $ | 9,991 | $ | 7,808 | ||||||
Percentage of MSR | 1.2 | % | 1.0 | % | 0.8 | % | ||||||
Discount rate | 9.5 | % | 10.0 | % | 10.5 | % | ||||||
Fair value MSR | $ | 11,735 | $ | 11,480 | $ | 11,235 | ||||||
Percentage of MSR | 1.2 | % | 1.2 | % | 1.2 | % | ||||||
At December 31, 2015 | Base | 0.5% Adverse Change | 1.0% Adverse Change | |||||||||
Conditional prepayment rate | 12.2 | % | 17.8 | % | 25.3 | % | ||||||
Fair value MSR | $ | 6,813 | $ | 5,660 | $ | 4,557 | ||||||
Percentage of MSR | 1.1 | % | 0.9 | % | 0.7 | % | ||||||
Discount rate | 8.5 | % | 9.0 | % | 9.5 | % | ||||||
Fair value MSR | $ | 6,813 | $ | 6,678 | $ | 6,548 | ||||||
Percentage of MSR | 1.1 | % | 1.1 | % | 1.0 | % | ||||||
The above tables show the sensitivity to market rate changes for the par rate coupon for a conventional one-to-four-family FNMA/FHLMC/GNMA/FHLB serviced home loan. The above tables reference a 50 basis point and 100 basis point decrease in note rate.
These sensitivities are hypothetical and should be used with caution as the tables above demonstrate the Company’s methodology for estimating the fair value of MSR is highly sensitive to changes in key assumptions. For example, actual prepayment experience may differ and any difference may have a material effect on MSR fair value. Changes in fair value resulting from changes in assumptions generally cannot be extrapolated because the relationship of the change in the assumption to the change in fair value may not be linear. Also, in these tables, the effects of a variation in a particular assumption on the fair value of the MSR is calculated without changing any other assumption; in reality, changes in one factor may be associated with changes in another (for example, decreases in market interest rates may provide an incentive to refinance; however, this may also indicate a slowing economy and an increase in the unemployment rate, which reduces the number of borrowers who qualify for refinancing), which may magnify or counteract the sensitivities. Thus, any measurement of MSR fair value is limited by the conditions existing and assumptions made as a particular point in time. Those assumptions may not be appropriate if they are applied to a different point in time.
The Company recorded $2.0 million and $1.3 million of contractually specified servicing fees, late fees, and other ancillary fees resulting from servicing of mortgage, commercial and consumer loans for the years ended December 31, 2016 and 2015, respectively. The income, net of amortization, is reported in noninterest income.
99 | ||
FS BANCORP, INC. AND SUBSIDIARY NOTES TO CONSOLIDATED FINANCIAL STATEMENTS DECEMBER 31, 2016 AND 2015 | ||
NOTE 6 - PREMISES AND EQUIPMENT
Premises and equipment at December 31, 2016 and 2015 were as follows:
2016 | 2015 | ||||||
Land | $ | 2,028 | $ | 1,767 | |||
Buildings | 8,611 | 7,787 | |||||
Furniture, fixtures, and equipment | 8,826 | 6,966 | |||||
Leasehold improvements | 2,102 | 1,939 | |||||
Building improvements | 4,537 | 4,123 | |||||
Projects in process | 467 | 394 | |||||
Subtotal | 26,571 | 22,976 | |||||
Less accumulated depreciation and amortization | (10,559 | ) | (9,120 | ) | |||
Total | $ | 16,012 | $ | 13,856 | |||
Depreciation and amortization expense for these assets totaled $1.4 million and $1.2 million for the years ended December 31, 2016 and 2015, respectively.
The Company leases premises and equipment under operating leases. Minimum net rental commitments under non-cancelable leases, having an original or remaining term of more than one year for future years, were as follows:
Years Ending December 31, | ||||
2017 | $ | 1,142 | ||
2018 | 944 | |||
2019 | 883 | |||
2020 | 657 | |||
2021 | 530 | |||
Thereafter | 1,470 | |||
Total | $ | 5,626 | ||
Certain leases contain renewal options from five to ten years and escalation clauses based on increases in property taxes and other costs. Rental expense of leased premises and equipment was $977,000 and $839,000 for the years ended December 31, 2016 and 2015, respectively, which is included in occupancy expense.
NOTE 7 - OTHER REAL ESTATE OWNED
The following table presents the activity related to OREO at and for the years ended December 31:
2016 | 2015 | ||||||
Beginning balance | $ | — | $ | — | |||
Net loans transferred to OREO | 525 | — | |||||
Capitalized costs | 7 | — | |||||
Gross proceeds from sale of OREO | (682 | ) | — | ||||
Gain on sale of OREO | 150 | — | |||||
Ending balance | $ | — | $ | — | |||
At December 31, 2016 and 2015, there were no OREO properties. There were no holding costs associated with OREO for the years ended December 31, 2016 and 2015, respectively.
100 | ||
FS BANCORP, INC. AND SUBSIDIARY NOTES TO CONSOLIDATED FINANCIAL STATEMENTS DECEMBER 31, 2016 AND 2015 | ||
NOTE 8 - DEPOSITS
Deposits are summarized as follows at December 31:
2016(1) | 2015 | ||||||
Noninterest-bearing checking | $ | 143,236 | $ | 66,676 | |||
Interest-bearing checking | 66,119 | 34,098 | |||||
Savings | 54,995 | 30,126 | |||||
Money market | 242,849 | 159,605 | |||||
Certificates of deposit less than $100,000(2) | 93,791 | 65,175 | |||||
Certificates of deposit of $100,000 through $250,000 | 74,832 | 91,317 | |||||
Certificates of deposit of $250,000 and over(3) | 27,094 | 32,610 | |||||
Escrow accounts related to mortgages serviced | 9,677 | 5,571 | |||||
Total | $ | 712,593 | $ | 485,178 | |||
(2) Includes $47.1 million and $27.9 million of brokered deposits at December 31, 2016 and 2015, respectively.
(3) Time deposits that meet or exceed the FDIC insurance limit.
Scheduled maturities of time deposits at December 31, 2016 for future years ending are as follows:
At December 31, 2016 | ||||
2017 | $ | 83,857 | ||
2018 | 58,435 | |||
2019 | 22,817 | |||
2020 | 14,342 | |||
2021 | 8,819 | |||
Thereafter | 7,447 | |||
Total | $ | 195,717 | ||
Interest expense by deposit category for the years ended December 31, 2016 and 2015 is as follows:
2016 | 2015 | ||||||
Interest-bearing checking | $ | 27 | $ | 25 | |||
Savings and money market | 1,019 | 982 | |||||
Certificates of deposit | 2,208 | 2,222 | |||||
Total | $ | 3,254 | $ | 3,229 | |||
The Company had related party deposits of approximately $976,000 and $584,000 at December 31, 2016 and 2015, respectively, which includes deposits held for directors and executive officers.
101 | ||
FS BANCORP, INC. AND SUBSIDIARY NOTES TO CONSOLIDATED FINANCIAL STATEMENTS DECEMBER 31, 2016 AND 2015 | ||
NOTE 9 - DEBT
Borrowings
The Bank is a member of the FHLB of Des Moines, which entitles it to certain benefits including a variety of borrowing options consisting of a secured credit line that allows both fixed and variable rate advances. The FHLB borrowings at December 31, 2016 and 2015, consisted of a warehouse securities credit line (“securities line”), which allows advances with interest rates fixed at the time of borrowing and a warehouse Federal Funds (“Fed Funds”) advance, which allows daily advances at variable interest rates. Credit capacity is primarily determined by the value of assets collateralized at the FHLB, funds on deposit at the FHLB, and stock owned by the Bank.
Credit is limited to 35% of the Company’s total assets. The Bank entered into an Advanced, Pledges and Security Agreement with the FHLB for which specific loans are pledged to secure these credit lines. At December 31, 2016, loans of approximately $249.8 million were pledged to the FHLB with a borrowing capacity, net of advances of $177.5 million. In addition, all FHLB stock owned by the Company is collateral for credit lines.
The Bank maintains a short-term borrowing line with the FRB with total credit based on eligible collateral. The Bank can borrow under the Term Auction or Term Facility at rates published by the San Francisco FRB. At December 31, 2016 and 2015, the Bank had approximately $170.1 million in pledged consumer loans with a Term Auction or Term Facility borrowing capacity of $85.9 million and $79.5 million, respectively, of which none was outstanding at either date. The Bank also had $40.0 million unsecured Fed Funds lines of credit with other large financial institutions of which none was outstanding at December 31, 2016.
Advances on these lines at December 31, 2016 and 2015 were as follows:
2016 | 2015 | ||||||
Federal Home Loan Bank - (interest rates ranging from 0.86% to 1.73% and 0.34% to 1.73% at December 31, 2016 and 2015, respectively) | $ | 12,670 | $ | 98,769 | |||
Total | $ | 12,670 | $ | 98,769 | |||
Subordinated Note
On October 15, 2015 (the “Closing Date”), FS Bancorp, Inc. issued an unsecured subordinated term note in the aggregate principal amount of $10.0 million due October 1, 2025 (the “Subordinated Note”) pursuant to a Subordinated Loan Agreement with Community Funding CLO, Ltd. The Subordinated Note bears interest at an annual interest rate of 6.50%, payable by the Company quarterly in arrears on January 1, April 1, July 1 and October 1 of each year, commencing on the first such date following the Closing Date and on the maturity date.
The Subordinated Note will mature on October 1, 2025 but may be prepaid at the Company’s option and with regulatory approval at any time on or after five years after the Closing Date or at any time upon certain events, such as a change in the regulatory capital treatment of the Subordinated Note or the interest on the Subordinated Note no longer being deductible by the Company for United States federal income tax purposes. The Company contributed $9.0 million of the proceeds from the Subordinated Note as additional capital to the Bank in the fourth quarter of 2015 and used the balance to fund general working capital and operating expenses.
102 | ||
FS BANCORP, INC. AND SUBSIDIARY NOTES TO CONSOLIDATED FINANCIAL STATEMENTS DECEMBER 31, 2016 AND 2015 | ||
The maximum and average outstanding and weighted average interest rates on debt during the years ended December 31, 2016 and 2015 were as follows:
2016 | 2015 | ||||||
Maximum balance: | |||||||
Federal Home Loan Bank advances and Fed Funds | $ | 98,769 | $ | 98,769 | |||
Federal Reserve Bank | $ | 1,000 | $ | — | |||
Fed Funds lines of credit | $ | 6,000 | $ | 2,901 | |||
Warehouse lines of credit | $ | — | $ | 2,300 | |||
Subordinated note | $ | 10,000 | $ | 10,000 | |||
Average balance: | |||||||
Federal Home Loan Bank advances and Fed Funds | $ | 26,259 | $ | 38,393 | |||
Federal Reserve Bank | $ | 3 | $ | — | |||
Fed Funds lines of credit | $ | 16 | $ | 145 | |||
Warehouse lines of credit | $ | — | $ | 1,886 | |||
Subordinated note | $ | 10,000 | $ | 2,120 | |||
Weighted average interest rate: | |||||||
Federal Home Loan Bank advances and Fed Funds | 0.98 | % | 0.82 | % | |||
Federal Reserve Bank | 1.00 | % | — | % | |||
Fed Funds lines of credit | 0.77 | % | 0.42 | % | |||
Warehouse lines of credit | — | % | 4.18 | % | |||
Subordinated note | 6.50 | % | 6.50 | % | |||
Scheduled maturities of Federal Home Loan Bank advances were as follows:
Year Ending | Interest | ||||||
December 31, | Balances | Rates | |||||
2017 | $ | 5,140 | 1.10 | % | |||
2018 | 3,987 | 1.01 | % | ||||
2019 | 1,207 | 1.73 | % | ||||
2020 | 2,336 | 1.71 | % | ||||
Total | $ | 12,670 | |||||
NOTE 10 - EMPLOYEE BENEFITS
Employee Stock Ownership Plan
On January 1, 2012, the Company established an ESOP for eligible employees of the Company and the Bank. Employees of the Company and the Bank who have been credited with at least 1000 hours of service during a 12-month period are eligible to participate in the ESOP.
The ESOP borrowed $2.6 million from FS Bancorp, Inc. and used those funds to acquire 259,210 shares of FS Bancorp, Inc. common stock in the open market at an average price of $10.17 per share during the second half of 2012. It is anticipated that the Bank will make contributions to the ESOP in amounts necessary to amortize the ESOP loan payable to FS Bancorp, Inc. over a period of 10 years, bearing interest at 2.30%. Intercompany expenses associated with the ESOP are eliminated in consolidation. Shares purchased by the ESOP with the loan proceeds are held in a suspense account and allocated to ESOP participants on a pro rata basis as principal and interest payments are made by the ESOP
103 | ||
FS BANCORP, INC. AND SUBSIDIARY NOTES TO CONSOLIDATED FINANCIAL STATEMENTS DECEMBER 31, 2016 AND 2015 | ||
to FS Bancorp, Inc. The loan is secured by shares purchased with the loan proceeds and will be repaid by the ESOP with funds from the Bank’s discretionary contributions to the ESOP and earnings on the ESOP assets. Payments of principal and interest are due annually on December 31, the Company’s fiscal year end. On December 31, 2016, the ESOP made the fifth annual installment payment of principal in the amount of $257,000, plus accrued interest of $38,000 pursuant to the ESOP loan agreement.
As shares are committed to be released from collateral, the Company reports compensation expense equal to the average daily market prices of the shares at December 31, 2016 for the prior 90 days. These shares become outstanding for earnings per share computations. The compensation expense is accrued monthly throughout the year. Dividends on allocated ESOP shares are recorded as a reduction of retained earnings; dividends on unallocated ESOP shares are recorded as a reduction of debt and accrued interest.
Compensation expense related to the ESOP for the years ended December 31, 2016 and 2015, was $832,000 and $652,000, respectively.
Shares held by the ESOP at December 31, 2016 and December 31, 2015, were as follows (shown as actual):
December 31, | |||||||
2016 | 2015 | ||||||
Allocated shares | 126,589 | 102,359 | |||||
Committed to be released shares | — | — | |||||
Unallocated shares | 129,605 | 155,526 | |||||
Total ESOP shares | 256,194 | 257,885 | |||||
Fair value of unallocated shares (in thousands) | $ | 4,158 | $ | 3,913 | |||
401(k) Plan
The Company has a salary deferral 401(k) Plan covering substantially all of its employees. Employees are eligible to participate in the 401(k) plan at the date of hire if they are 18 years of age. Eligible employees may contribute through payroll deductions and are 100% vested at all times in their deferral contributions account. The Company matches 100% for contributions between 1% and 3%, and 50% for contributions between 4% and 5%. There was a $759,000 and $589,000 matching contribution for the years ended December 31, 2016 and 2015, respectively.
NOTE 11 - INCOME TAXES
The components of income tax expense for the years ended December 31, 2016 and 2015, were as follows:
2016 | 2015 | ||||||
Provision for income taxes | |||||||
Current | $ | 5,398 | $ | 4,372 | |||
Deferred | 206 | 501 | |||||
Total provision for income tax | $ | 5,604 | $ | 4,873 | |||
104 | ||
FS BANCORP, INC. AND SUBSIDIARY NOTES TO CONSOLIDATED FINANCIAL STATEMENTS DECEMBER 31, 2016 AND 2015 | ||
A reconciliation of the effective income tax rate with the federal statutory tax rates at December 31, 2016 and 2015 was as follows:
2016 | 2015 | ||||||||||||
Amount | Rate | Amount | Rate | ||||||||||
Income tax provision at statutory rate | $ | 5,636 | 35.0 | % | $ | 4,881 | 35.5 | % | |||||
Tax exempt income | (255 | ) | (1.6 | ) | (618 | ) | (4.5 | ) | |||||
Increase in tax resulting from other items | 42 | 0.3 | 270 | 1.9 | |||||||||
ESOP | 181 | 1.1 | 340 | 2.5 | |||||||||
Total | $ | 5,604 | 34.8 | % | $ | 4,873 | 35.4 | % | |||||
Total deferred tax assets and liabilities at December 31, 2016 and 2015 were as follows:
2016 | 2015 | |||||||
Deferred Tax Assets | ||||||||
Allowance for loan losses | $ | 2,467 | $ | 1,274 | ||||
Non-accrued loan interest | 3 | 12 | ||||||
Restricted stock awards | — | 25 | ||||||
Non-qualified stock options | 159 | 115 | ||||||
Securities available-for-sale | 294 | — | ||||||
Other | 437 | 577 | ||||||
Total deferred tax assets | 3,360 | 2,003 | ||||||
Deferred Tax Liabilities | ||||||||
Loan origination costs | (1,242 | ) | (996 | ) | ||||
Servicing rights | (3,003 | ) | (2,063 | ) | ||||
Prepaids | (72 | ) | (65 | ) | ||||
Stock dividend - FHLB stock | (1 | ) | (2 | ) | ||||
Securities available-for-sale | — | (43 | ) | |||||
Property, plant, and equipment | (203 | ) | (127 | ) | ||||
Total deferred tax liabilities | (4,521 | ) | (3,296 | ) | ||||
Net deferred tax liabilities | $ | (1,161 | ) | $ | (1,293 | ) | ||
The Company files a U.S. Federal income tax return and Oregon State return, which are subject to examination by tax authorities for years 2013 and later. At December 31, 2016 and 2015, the Company had no uncertain tax positions. The Company recognizes interest and penalties in tax expense and at December 31, 2016 and 2015, the Company recognized no interest and penalties.
NOTE 12 - COMMITMENTS AND CONTINGENCIES
Commitments - The Company is party to financial instruments with off-balance-sheet risk in the normal course of business to meet the financing needs of its customers. These financial instruments include commitments to extend credit. These instruments involve, to varying degrees, elements of credit risk in excess of the amount recognized on the balance sheet.
105 | ||
FS BANCORP, INC. AND SUBSIDIARY NOTES TO CONSOLIDATED FINANCIAL STATEMENTS DECEMBER 31, 2016 AND 2015 | ||
The Company’s exposure to credit loss in the event of nonperformance by the other party to the financial instrument for commitments to extend credit is represented by the contractual amount of those instruments. The Company uses the same credit policies in making commitments and conditional obligations as it does for on-balance sheet instruments.
The following table provides a summary of the Company’s commitments at December 31, 2016 and 2015:
COMMITMENTS TO EXTEND CREDIT | 2016 | 2015 | |||||
REAL ESTATE LOANS | |||||||
Commercial | $ | 108 | $ | 1,988 | |||
Construction and development | 57,016 | 44,109 | |||||
One-to-four-family (includes held for sale) | 79,870 | 76,013 | |||||
Home equity | 26,129 | 18,089 | |||||
Multi-family | 426 | 429 | |||||
Total real estate loans | 163,549 | 140,628 | |||||
CONSUMER LOANS | 8,527 | 5,754 | |||||
COMMERCIAL BUSINESS LOANS | |||||||
Commercial and industrial | 31,775 | 39,537 | |||||
Warehouse lending | 51,102 | 27,601 | |||||
Total commercial business loans | 82,877 | 67,138 | |||||
Total commitments to extend credit | $ | 254,953 | $ | 213,520 | |||
Commitments to extend credit are agreements to lend to a customer as long as there is no violation of any condition established in the contract. Since many of the commitments are expected to expire without being drawn upon, the amount of the total commitments do not necessarily represent future cash requirements. The Company evaluates each customer’s creditworthiness on a case-by-case basis. The amount of collateral obtained, if deemed necessary by the Company upon extension of credit, is based on management’s credit evaluation of the party. Collateral held varies, but may include accounts receivable, inventory, property and equipment, residential real estate, and income-producing commercial properties.
Unfunded commitments under commercial lines of credit, revolving credit lines and overdraft protection agreements are commitments for possible future extensions of credit to existing customers. These lines of credit are uncollateralized and usually do not contain a specified maturity date and ultimately may not be drawn upon to the total extent to which the Company is committed. The Company has established reserves for estimated losses from unfunded commitments of $179,000 and $147,000 at December 31, 2016 and 2015, respectively. One-to-four-family commitments included in the table above are accounted for as fair value derivatives and do not carry an associated loss reserve.
The Company has entered into a severance agreement with its Chief Executive Officer. The severance agreement, subject to certain requirements, generally includes a lump sum payment to the Chief Executive Officer equal to 24 months of base compensation in the event their employment is involuntarily terminated, other than for cause or the executive terminates his employment with good reason, as defined in the severance agreement.
The Company has entered into change of control agreements with its Chief Financial Officer, Chief Operating Officer, Chief Lending Officer, and two Executive Vice Presidents of Home Lending. The change of control agreements, subject to certain requirements, generally remain in effect until canceled by either party upon at least 24 months prior written notice. Under the change of control agreements, the executive generally will be entitled to a change of control payment from the Company if the executive is involuntarily terminated within six months preceding or 12 months after a change in control (as defined in the change of control agreements). In such an event, the executives would each be entitled to
106 | ||
FS BANCORP, INC. AND SUBSIDIARY NOTES TO CONSOLIDATED FINANCIAL STATEMENTS DECEMBER 31, 2016 AND 2015 | ||
receive a cash payment in an amount equal to 12 months of their then current salary, subject to certain requirements in the change of control agreements.
Because of the nature of our activities, the Company is subject to various pending and threatened legal actions, which arise in the ordinary course of business. From time to time, subordination liens may create litigation which requires us to defend our lien rights. In the opinion of management, liabilities arising from these claims, if any, will not have a material effect on our financial position. The Company had no material pending legal actions at December 31, 2016.
Contingent liabilities for loans held for sale - In the ordinary course of business, loans are sold with limited recourse against the Company and may have to subsequently be repurchased due to defects that occurred during the origination of the loan. The defects are categorized as documentation errors, underwriting errors, early payoff, early payment defaults, breach of representation or warranty, servicing errors, and/or fraud. When a loan sold to an investor without recourse fails to perform according to its contractual terms, the investor will typically review the loan file to determine whether defects in the origination process occurred. If a defect is identified, the Company may be required to either repurchase the loan or indemnify the investor for losses sustained. If there are no such defects, the Company has no commitment to repurchase the loan. The Company has recorded reserves of $955,000 and $561,000 to cover loss exposure related to these guarantees for one-to-four-family loans sold into the secondary market at December 31, 2016 and 2015, respectively, which is included in other liabilities in the Consolidated Balance Sheets.
NOTE 13 - SIGNIFICANT CONCENTRATION OF CREDIT RISK
Most of the Company’s business and lending activities are primarily with customers located in the greater Puget Sound area and one loan production office located in the Tri-Cities, Washington. The Company originates real estate and consumer loans and has concentrations in these areas, however, indirect home improvement loans are originated through a network of home improvement contractors and dealers located throughout Washington, Oregon, Idaho, and California. The Company also originates solar loans through contractors and dealers in the state of California. Generally, loans are secured by deposit accounts, personal property, or real estate. Rights to collateral vary and are legally documented to the extent practicable. Local economic conditions may affect borrowers’ ability to meet the stated repayment terms.
NOTE 14 - REGULATORY CAPITAL
The Company and the Bank are subject to various regulatory capital requirements administered by the federal banking agencies. Failure to meet minimum capital requirements can initiate certain mandatory and possibly additional discretionary actions by regulators that, if undertaken, could have a direct material effect on the Company’s consolidated financial statements. Under capital adequacy guidelines of the regulatory framework for prompt corrective action, the Bank must meet specific capital adequacy guidelines that involve quantitative measures of the Bank’s assets, liabilities, and certain off-balance sheet items as calculated under regulatory accounting practices. The Bank’s capital classification is also subject to qualitative judgments by the regulators about components, risk weightings, and other factors.
Quantitative measures established by regulation to ensure capital adequacy require the Bank to maintain minimum amounts and ratios (set forth in the table below) of Tier 1 capital (as defined in the regulations) to total average assets (as defined), and minimum ratios of Tier 1 total capital (as defined) and common equity Tier 1 (“CET 1”) capital to risk-weighted assets (as defined).
The Bank must maintain minimum total risk-based, Tier 1 risk-based, and Tier 1 leverage ratios as set forth in the table below to be categorized as well capitalized. At December 31, 2016 and December 31, 2015, the Bank was categorized as well capitalized under applicable regulatory requirements. There are no conditions or events since that notification that management believes have changed the Bank’s category. Management believes, as of December 31, 2016, that the Company meets all capital adequacy requirements to which it is subject.
107 | ||
FS BANCORP, INC. AND SUBSIDIARY NOTES TO CONSOLIDATED FINANCIAL STATEMENTS DECEMBER 31, 2016 AND 2015 | ||
The following tables compare the Bank’s actual capital amounts and ratios at December 31, 2016 and 2015 to their minimum regulatory capital requirements and well capitalized regulatory capital at those dates (dollars in thousands):
To be Well Capitalized Under Prompt Corrective Action Provisions | ||||||||||||||||||||
For Capital Adequacy Purposes | ||||||||||||||||||||
Actual | ||||||||||||||||||||
Bank Only | Amount | Ratio | Amount | Ratio | Amount | Ratio | ||||||||||||||
At December 31, 2016 | ||||||||||||||||||||
Total risk-based capital | ||||||||||||||||||||
(to risk-weighted assets) | $ | 93,309 | 13.87 | % | $ | 53,813 | 8.00 | % | $ | 67,266 | 10.00 | % | ||||||||
Tier 1 risk-based capital | ||||||||||||||||||||
(to risk-weighted assets) | $ | 84,876 | 12.62 | % | $ | 40,360 | 6.00 | % | $ | 53,813 | 8.00 | % | ||||||||
Tier 1 leverage capital | ||||||||||||||||||||
(to average assets) | $ | 84,876 | 10.33 | % | $ | 32,862 | 4.00 | % | $ | 41,078 | 5.00 | % | ||||||||
CET 1 capital | ||||||||||||||||||||
(to risk-weighted assets) | $ | 84,876 | 12.62 | % | $ | 30,270 | 4.50 | % | $ | 43,723 | 6.50 | % | ||||||||
At December 31, 2015 | ||||||||||||||||||||
Total risk-based capital | ||||||||||||||||||||
(to risk-weighted assets) | $ | 85,570 | 15.51 | % | $ | 44,132 | 8.00 | % | $ | 55,164 | 10.00 | % | ||||||||
Tier 1 risk-based capital | ||||||||||||||||||||
(to risk-weighted assets) | $ | 78,662 | 14.26 | % | $ | 33,099 | 6.00 | % | $ | 44,132 | 8.00 | % | ||||||||
Tier 1 leverage capital | ||||||||||||||||||||
(to average assets) | $ | 78,662 | 12.14 | % | $ | 25,924 | 4.00 | % | $ | 32,406 | 5.00 | % | ||||||||
CET 1 capital | ||||||||||||||||||||
(to risk-weighted assets) | $ | 78,662 | 14.26 | % | $ | 24,824 | 4.50 | % | $ | 35,857 | 6.50 | % | ||||||||
In addition to the minimum CET 1, Tier 1 and total capital ratios, the Bank has to maintain a capital conservation buffer consisting of additional CET 1 capital above the required minimum levels in order to avoid limitations on paying dividends, engaging in share repurchases, and paying discretionary bonuses based on percentages of eligible retained income that could be utilized for such actions. This new capital conservation buffer requirement was phased in beginning in January 2016 at 0.625% of risk-weighted assets and will increase each year until fully implemented to an amount equal to 2.5% of risk-weighted assets in January 2019.
FS Bancorp, Inc. is a bank holding company subject to capital adequacy requirements of the Federal Reserve under the Bank Holding Company Act of 1956, as amended, and the regulations of the Federal Reserve. For a bank holding company with less than $1.0 billion in assets, the capital guidelines apply on a bank only basis and the Federal Reserve expects the holding company’s subsidiary banks to be well capitalized under the prompt corrective action regulations. If FS Bancorp Inc. was subject to regulatory guidelines for bank holding companies with $1.0 billion or more in assets, at December 31, 2016, the Company would have exceeded all regulatory capital requirements. The regulatory capital ratios calculated for FS Bancorp Inc. at December 31, 2016 were 9.5% for Tier 1 leverage-based capital, 11.6% for Tier 1 risk-based capital, 12.9% for total risk-based capital, and 11.6% for CET 1 capital ratio.
108 | ||
FS BANCORP, INC. AND SUBSIDIARY NOTES TO CONSOLIDATED FINANCIAL STATEMENTS DECEMBER 31, 2016 AND 2015 | ||
NOTE 15 - FAIR VALUE OF FINANCIAL INSTRUMENTS
The Company assumes interest rate risk (the risk that general interest rate levels will change) as a result of its normal operations. Consequently, the fair value of the Company’s consolidated financial instruments will change when interest rate levels change and that change may either be favorable or unfavorable to the Company. Management attempts to match maturities of assets and liabilities to the extent believed necessary to minimize interest rate risk. However, borrowers with fixed interest rate obligations are less likely to prepay in a rising interest rate environment and more likely to prepay in a falling interest rate environment. Conversely, depositors who are receiving fixed interest rates are more likely to withdraw funds before maturity in a rising interest rate environment and less likely to do so in a falling interest rate environment. Management monitors interest rates and maturities of assets and liabilities, and attempts to minimize interest rate risk by adjusting terms of new loans, and deposits, and by investing in securities with terms that mitigate the Company’s overall interest rate risk.
Accounting guidance regarding fair value measurements defines fair value and establishes a framework for measuring fair value in accordance with U.S. GAAP. Fair value is the exchange price that would be received for an asset or paid to transfer a liability in an orderly transaction between market participants on the measurement date. The following definitions describe the levels of inputs that may be used to measure fair value:
Level 1 - Inputs to the valuation methodology are quoted prices (unadjusted) for identical assets or liabilities in active markets.
Level 2 - Inputs to the valuation methodology include quoted prices for similar assets and liabilities in active markets, and inputs that are observable for the asset or liability, either directly or indirectly, for substantially the full term of the financial instrument.
Level 3 - Inputs to the valuation methodology are unobservable and significant to the fair value measurement.
Determination of Fair Market Values:
Securities Available-for-Sale - The fair value of securities available-for-sale are recorded on a recurring basis. The fair value of investments and mortgage-backed securities are provided by a third-party pricing service. These valuations are based on market data using pricing models that vary by asset class and incorporate available current trade, bid and other market information, and for structured securities, cash flow, and loan performance data. The pricing processes utilize benchmark curves, benchmarking of similar securities, sector groupings, and matrix pricing. Option adjusted spread models are also used to assess the impact of changes in interest rates and to develop prepayment scenarios. Transfers between the fair value hierarchy are determined through the third-party service provider which, from time to time will transfer between levels based on market conditions per the related security. All models and processes used take into account market convention (Level 2).
Mortgage Loans Held for Sale - The fair value of loans held for sale reflects the value of commitments with investors and/or the relative price as delivered into a to be announced (“TBA”) mortgage-backed security (Level 2).
Derivative Instruments - The fair value of the interest rate lock commitments and forward sales commitments are estimated using quoted or published market prices for similar instruments, adjusted for factors such as pull-through rate assumptions based on historical information, where appropriate. TBA mortgage-backed securities are fair valued using similar contracts in active markets (Level 2) while locks and forwards with customers and investors are fair valued using similar contracts in the market and changes in the market interest rates (Level 2 and 3).
Impaired Loans - Fair value adjustments to impaired collateral dependent loans are recorded to reflect partial write-downs based on the current appraised value of the collateral or internally developed models, which contain management’s assumptions. Management will utilize discounted cashflow impairment for TDRs when the change in terms result in a discount to the overall cashflows to be received (Level 3).
109 | ||
FS BANCORP, INC. AND SUBSIDIARY NOTES TO CONSOLIDATED FINANCIAL STATEMENTS DECEMBER 31, 2016 AND 2015 | ||
The following tables present securities available-for-sale measured at fair value on a recurring basis at December 31, 2016 and December 31, 2015:
Securities Available-for-Sale | |||||||||||||||
At December 31, 2016 | Level 1 | Level 2 | Level 3 | Total | |||||||||||
U.S. agency securities | $ | — | $ | 8,068 | $ | — | $ | 8,068 | |||||||
Corporate securities | — | 7,500 | — | 7,500 | |||||||||||
Municipal bonds | — | 15,264 | — | 15,264 | |||||||||||
Mortgage-backed securities | — | 45,195 | — | 45,195 | |||||||||||
U.S. Small Business Administration securities | — | 5,848 | — | 5,848 | |||||||||||
Total | $ | — | $ | 81,875 | $ | — | $ | 81,875 | |||||||
Securities Available-for-Sale | |||||||||||||||
At December 31, 2015 | Level 1 | Level 2 | Level 3 | Total | |||||||||||
U.S. agency securities | $ | — | $ | 6,035 | $ | — | $ | 6,035 | |||||||
Corporate securities | — | 3,433 | — | 3,433 | |||||||||||
Municipal bonds | — | 18,891 | — | 18,891 | |||||||||||
Mortgage-backed securities | — | 22,835 | — | 22,835 | |||||||||||
U.S. Small Business Administration securities | — | 4,023 | — | 4,023 | |||||||||||
Total | $ | — | $ | 55,217 | $ | — | $ | 55,217 | |||||||
The following table presents mortgage loans held for sale measured at fair value on a recurring basis at December 31, 2016 and December 31, 2015:
Mortgage Loans Held for Sale | |||||||||||||||
Level 1 | Level 2 | Level 3 | Total | ||||||||||||
December 31, 2016 | $ | — | $ | 52,553 | $ | — | $ | 52,553 | |||||||
December 31, 2015 | $ | — | $ | 44,925 | $ | — | $ | 44,925 | |||||||
The following tables present the fair value of interest rate lock commitments with customers, individual forward sale commitments with investors and paired off commitments with investors measured at their fair value on a recurring basis at December 31, 2016 and December 31, 2015:
Interest Rate Lock Commitments with Customers | |||||||||||||||
Level 1 | Level 2 | Level 3 | Total | ||||||||||||
December 31, 2016 | $ | — | $ | — | $ | 818 | $ | 818 | |||||||
December 31, 2015 | $ | — | $ | — | $ | 698 | $ | 698 | |||||||
Individual Forward Sale Commitments with Investors | |||||||||||||||
Level 1 | Level 2 | Level 3 | Total | ||||||||||||
December 31, 2016 | $ | — | $ | 495 | $ | 177 | $ | 672 | |||||||
December 31, 2015 | $ | — | $ | 3 | $ | 74 | $ | 77 | |||||||
110 | ||
FS BANCORP, INC. AND SUBSIDIARY NOTES TO CONSOLIDATED FINANCIAL STATEMENTS DECEMBER 31, 2016 AND 2015 | ||
Paired Off Commitments with Investors | |||||||||||||||
Level 1 | Level 2 | Level 3 | Total | ||||||||||||
December 31, 2016 | $ | — | $ | 747 | $ | — | $ | 747 | |||||||
December 31, 2015 | $ | — | $ | 30 | $ | — | $ | 30 | |||||||
The following table presents impaired loans measured at fair value on a nonrecurring basis for which a nonrecurring change in fair value has been recorded during the reporting period. The amounts disclosed below represent the fair values at the time the nonrecurring fair value measurements were made, and not necessarily the fair value as of the dates reported upon.
Impaired Loans | |||||||||||||||
Level 1 | Level 2 | Level 3 | Total | ||||||||||||
December 31, 2016 | $ | — | $ | — | $ | 194 | $ | 194 | |||||||
December 31, 2015 | $ | — | $ | — | $ | 734 | $ | 734 | |||||||
Quantitative Information about Level 3 Fair Value Measurements - Shown in the table below is the fair value of financial instruments measured under a Level 3 unobservable input on a recurring and nonrecurring basis at December 31, 2016:
Level 3 Fair Value Instrument | Valuation Technique | Significant Unobservable Inputs | Range (Weighted Average) | Weighted Average |
RECURRING | ||||
Interest rate lock commitments with customers | Quoted market prices | Pull-through expectations | 80% - 99% | 94.7% |
Individual forward sale commitments with investors | Quoted market prices | Pull-through expectations | 80% - 99% | 94.7% |
NONRECURRING | ||||
Impaired loans | Fair value of underlying collateral | Discount applied to the obtained appraisal | 0% - 18.0% | 0.0% |
An increase in the pull-through rate utilized in the fair value measurement of the interest rate lock commitments with customers and forward sale commitments with investors will result in positive fair value adjustments (and an increase in the fair value measurement). Conversely, a decrease in the pull-through rate will result in a negative fair value adjustment (and a decrease in the fair value measurement).
The following table provides a reconciliation of assets and liabilities measured at fair value using significant unobservable inputs (Level 3) on a recurring basis during the years ended December 31, 2016 and 2015.
2016 | Beginning Balance | Purchases and issuances | Sales and settlements | Ending Balance | Net change in fair value for gains/(losses) relating to items held at end of year | |||||||||||||||
Interest rate lock commitments with customers | $ | 698 | $ | 16,793 | $ | (16,673 | ) | $ | 818 | $ | 120 | |||||||||
Individual forward sale commitments with investors | 74 | 175 | (72 | ) | 177 | 103 | ||||||||||||||
2015 | ||||||||||||||||||||
Interest rate lock commitments with customers | $ | 396 | $ | 11,041 | $ | (10,739 | ) | $ | 698 | $ | 302 | |||||||||
Individual forward sale commitments with investors | 12 | 245 | (183 | ) | 74 | 62 | ||||||||||||||
Gains (losses) on interest rate lock commitments carried at fair value are recorded in other noninterest income. Gains (losses) on forward sale commitments with investors carried at fair value are recorded within other noninterest income.
111 | ||
FS BANCORP, INC. AND SUBSIDIARY NOTES TO CONSOLIDATED FINANCIAL STATEMENTS DECEMBER 31, 2016 AND 2015 | ||
Fair Values of Financial Instruments - The following methods and assumptions were used by the Company in estimating the fair values of financial instruments disclosed in these financial statements:
Cash, and Cash Equivalents and Certificates of Deposit at Other Financial Institutions - The carrying amounts of cash and short-term instruments approximate their fair value (Level 1).
Federal Home Loan Bank Stock - The par value of FHLB stock approximates its fair value (Level 2).
Accrued Interest - The carrying amounts of accrued interest approximate its fair value (Level 2).
Loans Receivable, Net - For variable rate loans that re-price frequently and have no significant change in credit risk, fair values are based on carrying values. Fair values for fixed rate loans are estimated using discounted cash flow analyses, using interest rates currently being offered for loans with similar terms to borrowers or similar credit quality (Level 3).
Servicing Rights - The fair value of mortgage, commercial and consumer servicing rights are estimated using net present value of expected cash flows using a third party model that incorporates assumptions used in the industry to value such rights, adjusted for factors such as weighted average prepayments speeds based on historical information, where appropriate (Level 3).
Deposits - The fair value of deposits with no stated maturity date is included at the amount payable on demand. Fair values for fixed rate certificates of deposit are estimated using a discounted cash flow calculation on interest rates currently offered on similar certificates (Level 2).
Borrowings - The carrying amounts of advances maturing within 90 days approximate their fair values. The fair values of long-term advances are estimated using discounted cash flow analyses based on the Bank’s current incremental borrowing rates for similar types of borrowing arrangements (Level 2).
Subordinated Note - The fair value of the Subordinated Note is based upon the average yield of debt issuances in the fourth quarter of 2016 for similarly sized issuances (Level 2).
Off-Balance Sheet Instruments - The fair value of commitments to extend credit are estimated using the fees currently charged to enter into similar agreements, taking into account the remaining terms of the agreement and the present creditworthiness of the customers. The majority of the Company’s off-balance-sheet instruments consist of non-fee producing, variable-rate commitments, the Company has determined they do not have a distinguishable fair value. The fair value of loan lock commitments with customers and investors reflect an estimate of value based upon the interest rate lock date, the expected pull through percentage for the commitment, and the interest rate at year end (Level 2 and 3).
112 | ||
FS BANCORP, INC. AND SUBSIDIARY NOTES TO CONSOLIDATED FINANCIAL STATEMENTS DECEMBER 31, 2016 AND 2015 | ||
The following table provides estimated fair values of the Company’s financial instruments at December 31, 2016 and 2015:
2016 | 2015 | ||||||||||||||
Financial Assets | Carrying Amount | Fair Value | Carrying Amount | Fair Value | |||||||||||
Level 1 inputs: | |||||||||||||||
Cash and cash equivalents | $ | 36,456 | $ | 36,456 | $ | 24,455 | $ | 24,455 | |||||||
Certificates of deposit at other financial institutions | 15,248 | 15,248 | 12,421 | 12,421 | |||||||||||
Level 2 inputs: | |||||||||||||||
Securities available-for-sale, at fair value | 81,875 | 81,875 | 55,217 | 55,217 | |||||||||||
Loans held for sale, at fair value | 52,553 | 52,553 | 44,925 | 44,925 | |||||||||||
FHLB stock, at cost | 2,719 | 2,719 | 4,551 | 4,551 | |||||||||||
Accrued interest receivable | 2,524 | 2,524 | 2,107 | 2,107 | |||||||||||
Individual forward sale commitments with investors | 495 | 495 | 3 | 3 | |||||||||||
Paired off commitments with investors | 747 | 747 | 30 | 30 | |||||||||||
Level 3 inputs: | |||||||||||||||
Loans receivable, gross | 605,415 | 670,183 | 511,282 | 566,209 | |||||||||||
Servicing rights, held at lower of cost or fair value | 8,459 | 11,741 | 5,811 | 6,848 | |||||||||||
Fair value interest rate locks with customers | 818 | 818 | 698 | 698 | |||||||||||
Individual forward sale commitments with investors | 177 | 177 | 74 | 74 | |||||||||||
Financial Liabilities | |||||||||||||||
Level 2 inputs: | |||||||||||||||
Deposits | 712,593 | 718,970 | 485,178 | 494,871 | |||||||||||
Borrowings | 12,670 | 12,660 | 98,769 | 98,739 | |||||||||||
Subordinated note, net | 9,825 | 9,805 | 9,805 | 9,550 | |||||||||||
Accrued interest payable | 192 | 192 | 22 | 22 | |||||||||||
NOTE 16 - EARNINGS PER SHARE
Basic earnings per share are computed by dividing income available to common shareholders by the weighted average number of common shares outstanding for the year. Diluted earnings per share reflect the potential dilution that could occur if securities or other contracts to issue common stock were exercised or converted into common stock or resulted in the issuance of common stock that then shared in the earnings of the entity.
The following table presents a reconciliation of the components used to compute basic and diluted earnings per share for the years ended December 31, 2016 and 2015.
113 | ||
FS BANCORP, INC. AND SUBSIDIARY NOTES TO CONSOLIDATED FINANCIAL STATEMENTS DECEMBER 31, 2016 AND 2015 | ||
At or For the Years Ended | |||||||
December 31, | |||||||
Numerator: | 2016 | 2015 | |||||
Net Income (in thousands) | $ | 10,499 | $ | 8,876 | |||
Denominator: | |||||||
Basic weighted average common shares outstanding | 2,896,209 | 2,978,165 | |||||
Dilutive shares | 93,950 | 54,352 | |||||
Diluted weighted average common shares outstanding | 2,990,159 | 3,032,517 | |||||
Basic earnings per share | $ | 3.63 | $ | 2.98 | |||
Diluted earnings per share | $ | 3.51 | $ | 2.93 | |||
The Company purchased 259,210 shares in the open market during the year ended December 31, 2012, for the ESOP. For earnings per share calculations, the ESOP shares committed to be released are included as outstanding shares for both basic and diluted earnings per share. There were 129,605 shares in the ESOP that were not committed to be released at December 31, 2016.
NOTE 17 - DERIVATIVES
The Company regularly enters into commitments to originate and sell loans held for sale. The Company has established a hedging strategy to protect itself against the risk of loss associated with interest rate movements on loan commitments. The Company enters into contracts to sell forward TBA mortgage-backed securities. These commitments and contracts are considered derivatives but have not been designated as hedging instruments. Rather, they are accounted for as free-standing derivatives, or economic hedges, with changes in the fair value of the derivatives reported in noninterest income. The Company recognizes all derivative instruments as either other assets or other liabilities on the Consolidated Balance Sheets and measures those instruments at fair value.
The following tables summarize the Company’s derivative instruments at the dates indicated:
December 31, 2016 | ||||||||||||
Fair Value | ||||||||||||
Notional | Asset | Liability | ||||||||||
Fallout adjusted interest rate lock commitments with customers | $ | 33,289 | $ | 818 | $ | — | ||||||
Mandatory and best effort forward commitments with investors | 23,536 | 177 | — | |||||||||
Forward TBA mortgage-backed securities | 53,000 | 495 | — | |||||||||
TBA mortgage-backed securities forward sales paired off with investors | 44,000 | 747 | — | |||||||||
December 31, 2015 | ||||||||||||
Fair Value | ||||||||||||
Notional | Asset | Liability | ||||||||||
Fallout adjusted interest rate lock commitments with customers | $ | 34,154 | $ | 698 | $ | — | ||||||
Mandatory and best effort forward commitments with investors | 24,135 | 74 | — | |||||||||
Forward TBA mortgage-backed securities | 49,000 | 3 | — | |||||||||
TBA mortgage-backed securities forward sales paired off with investors | 28,500 | 30 | — | |||||||||
Changes in the fair value of the derivatives recognized in other noninterest income on the Consolidated Statements of Income and included in gain on sale of loans resulted in a net gain of $3.1 million and $1.9 million for the years ended December 31, 2016 and 2015, respectively.
NOTE 18 - STOCK-BASED COMPENSATION
Stock Options and Restricted Stock
In September 2013, the shareholders of FS Bancorp, Inc. approved the FS Bancorp, Inc. 2013 Equity Incentive Plan (“Plan”). The Plan provides for the grant of stock options and restricted stock awards.
Total share-based compensation expense for the Plan was $783,000 for the year ended December 31, 2016, and $746,000 for the year ended December 31, 2015. The related income tax benefit was $274,000 for the year ended December 31, 2016, and $265,000 for 2015.
114 | ||
FS BANCORP, INC. AND SUBSIDIARY NOTES TO CONSOLIDATED FINANCIAL STATEMENTS DECEMBER 31, 2016 AND 2015 | ||
Stock Options
The Plan authorizes the grant of stock options totaling 324,013 shares to Company directors and employees. Option awards are granted with an exercise price equal to the market price of FS Bancorp’s common stock at the grant date. May 8, 2014, of $16.89 per share. These option awards were granted as non-qualified stock options, having a vesting period of five years, with 20% vesting on the anniversary date of each grant date, and a contractual life of 10 years. Any unexercised stock options will expire 10 years after the grant date or sooner in the event of the award recipient’s termination of service with the Company or the Bank. There were no options granted in 2016 or 2015.
The fair value of each option award is estimated on the grant date using a Black-Scholes Option pricing model that uses the following assumptions. The dividend yield is based on the current quarterly dividend in effect at the time of
the grant. Historical employment data is used to estimate the forfeiture rate. The Company became a publicly held company in July 2012, therefore historical data was not available to calculate the volatility for FS Bancorp stock. Given this limitation, management utilized a proxy to determine the expected volatility of FS Bancorp’s stock. The proxy chosen was the NASDAQ Bank Index, or NASDAQ Bank (NASDAQ symbol: BANK). This index provides the volatility of the banking sector for NASDAQ traded banks. The majority of smaller banks are traded on the NASDAQ given the costs and daily interaction required with trading on the New York Stock Exchange. The Company utilized the comparable Treasury rate for the discount rate associated with the stock options granted. The Company elected to use Staff Accounting Bulletin 107, simplified expected term calculation for the “Share-Based Payments” method permitted by the SEC to calculate the expected term. This method uses the vesting term of an option along with the contractual term, setting the expected life at 6.5 years.
The following table presents a summary of the Company’s stock option plan awards during the year ended December 31, 2016 (shown as actual):
Shares | Weighted-Average Exercise Price | Weighted-Average Remaining Contractual Term In Years | Aggregate Intrinsic Value | ||||||||||
Outstanding at January 1, 2016 | 306,900 | $ | 16.89 | 8.36 | $ | 2,794,570 | |||||||
Granted | — | — | — | — | |||||||||
Less exercised | 11,050 | 16.89 | — | 106,477 | |||||||||
Forfeited or expired | — | — | — | — | |||||||||
Outstanding at December 31, 2016 | 295,850 | $ | 16.89 | 7.36 | $ | 5,638,901 | |||||||
Expected to vest, assuming a 0.31% annual forfeiture rate | 295,053 | $ | 16.89 | 7.36 | $ | 5,623,711 | |||||||
Exercisable at December 31, 2016 | 105,650 | $ | 16.89 | 7.36 | $ | 2,013,689 | |||||||
For the year ended December 31, 2016, there was $540,000 of total unrecognized compensation cost related to nonvested stock options granted under the Plan. The cost is expected to be recognized over the remaining weighted-average vesting period of 2.4 years.
Restricted Stock Awards
The Plan authorizes the grant of restricted stock awards totaling 129,605 shares to Company directors and employees, and all but 4,500 shares were granted on May 8, 2014 at a grant date fair value of $16.89 per share. The remaining 4,500 restricted stock awards were granted on January 1, 2016 at a grant date fair value of $26.00 per share. Compensation expense is recognized over the vesting period of the awards based on the fair value of the restricted stock. The restricted stock awards’ fair value is equal to the value on the grant date. Shares awarded as restricted stock vest ratably over a three-year period for directors and a five-year period for employees, beginning at the grant date. Any unexercised
115 | ||
FS BANCORP, INC. AND SUBSIDIARY NOTES TO CONSOLIDATED FINANCIAL STATEMENTS DECEMBER 31, 2016 AND 2015 | ||
restricted stock awards will expire after vesting or sooner in the event of the award recipient’s termination of service with the Company or the Bank.
The following table presents a summary of the Company’s nonvested awards during the year ended December 31, 2016 (shown as actual):
Nonvested Shares | Shares | Weighted-Average Grant-Date Fair Value Per Share | Weighted-Average Grant-Date Fair Value | |||||||||
Nonvested at January 1, 2016 | 94,684 | $ | 16.89 | $ | 1,599,212 | |||||||
Granted | 4,500 | 26.00 | 117,000 | |||||||||
Less vested | 30,421 | 16.89 | 513,811 | |||||||||
Forfeited or expired | — | — | — | |||||||||
Nonvested at December 31, 2016 | 68,763 | $ | 17.49 | $ | 1,202,401 | |||||||
For the year ended December 31, 2016, there was $832,000 of total unrecognized compensation costs related to nonvested shares granted as restricted stock awards. The cost is expected to be recognized over the remaining weighted-average vesting period of 2.1 years.
Item 9. Changes in and Disagreements With Accountants on Accounting and Financial Disclosure
None.
Item 9A. Controls and Procedures
a)Evaluation of Disclosure Controls and Procedures.
An evaluation of the disclosure controls and procedures (as defined in Rule 13a-15(e) under the Securities Exchange Act of 1934 (the “Exchange Act”)) at December 31, 2016, was carried out under the supervision and with the participation of the Company’s Chief Executive Officer, Chief Financial Officer and several other members of the Company’s senior management within the 90-day period preceding the filing of this annual report. The Company’s Chief Executive Officer and Chief Financial Officer concluded that the Company’s disclosure controls and procedures in effect at December 31, 2016 were effective in ensuring that the information required to be disclosed by the Company in the reports it files or submits under the Exchange Act is (i) accumulated and communicated to the Company’s management (including the Chief Executive Officer and Chief Financial Officer) in a timely manner, and (ii) recorded, processed, summarized and reported within the time periods specified in the SEC’s rules and forms.
We intend to continually review and evaluate the design and effectiveness of the Company's disclosure controls and procedures and to improve the Company's controls and procedures over time and to correct any deficiencies that we may discover in the future. The goal is to ensure that senior management has timely access to all material financial and non-financial information concerning the Company's business. While we believe the present design of the disclosure controls and procedures is effective to achieve its goal, future events affecting its business may cause the Company to modify its disclosure controls and procedures.
The Company does not expect that its disclosure controls and procedures and internal control over financial reporting will prevent all error and all fraud. A control procedure, no matter how well conceived and operated, can provide only reasonable, not absolute, assurance that the objectives of the control procedure are met. Because of the inherent limitations in all control procedures, no evaluation of controls can provide absolute assurance that all control issues and instances of fraud, if any, within the Company have been detected. These inherent limitations include the realities that judgments in decision-making can be faulty, and that breakdowns can occur because of simple error or
116 | ||
mistake. Additionally, controls can be circumvented by the individual acts of some persons, by collusion of two or more people, or by management override of the control. The design of any control procedure also is based in part upon certain assumptions about the likelihood of future events, and there can be no assurance that any design will succeed in achieving its stated goals under all potential future conditions; over time, controls may become inadequate because of changes in conditions, or the degree of compliance with the policies or procedures may deteriorate. Because of the inherent limitations in a cost-effective control procedure, misstatements due to error or fraud may occur and not be detected.
b) Internal Control Over Financial Reporting.
MANAGEMENT’S REPORT ON INTERNAL CONTROL OVER FINANCIAL REPORTING
The management of FS Bancorp is responsible for establishing and maintaining adequate internal control over financial reporting, as such term is defined in Exchange Act Rule 13a-15(f). The Company’s internal control over financial reporting is a process designed to provide reasonable assurance to the Company’s management and Board of Directors regarding the reliability of financial reporting and the preparation of the financial statements for external purposes in accordance with accounting principles generally accepted in the United States of America.
The Company’s internal control over financial reporting includes those policies and procedures that (i) pertain to the maintenance of records that, in reasonable detail, accurately and fairly reflect the transactions and dispositions of the assets of the Company; (ii) provide reasonable assurance that transactions are recorded as necessary to permit preparation of financial statements in accordance with accounting principles generally accepted in the United States of America, and that receipts and expenditures of the Company are being made only in accordance with authorizations of management and directors of the Company; and (iii) provide reasonable assurance regarding prevention or timely detection of unauthorized acquisition, use, or disposition of the Company’s assets that could have a material effect on the financial statements.
Because of its inherent limitations, internal controls over financial reporting may not prevent or detect misstatements. All internal control systems, no matter how well designed, have inherent limitations, including the possibility of human error and the circumvention of overriding controls. Accordingly, even effective internal control over financial reporting can provide only reasonable assurance with respect to financial statement preparation. Also, projections of any evaluation of effectiveness to future periods are subject to the risk that controls may become inadequate because of changes in conditions, or that the degree of compliance with the policies or procedures may deteriorate.
Our management assessed the effectiveness of the Company’s internal control over financial reporting as of December 31, 2016. In making this assessment, it used the criteria set forth by the Committee of Sponsoring Organizations of the Treadway Commission (COSO) in Internal Control-Integrated Framework (2013). Based on our assessment, we concluded that, as of December 31, 2016, the Company’s internal control over financial reporting was effective based on those criteria.
Federal law does not require that this annual report include an attestation of our independent registered public accounting firm regarding internal control over financial reporting.
c) Changes in Internal Control Over Financial Reporting
There were no changes in our internal controls over financial reporting (as defined in Rule 13a-15(f) under the Exchange Act) that occurred during the quarter ended December 31, 2016, that have materially affected, or is reasonably likely to materially affect, our internal control over financial reporting.
Item 9B. Other Information
None.
117
PART III
Item 10. Directors, Executive Officers and Corporate Governance
The information required by this item regarding the Company’s Board of Directors is incorporated herein by reference from the section captioned “Proposal I - Election of Directors” in the Company’s Proxy Statement, a copy of which will be filed with the SEC no later than 120 days after the Company’s fiscal year end.
The executive officers of the Company and the Bank are elected annually and hold office until their respective successors have been elected and qualified or until death, resignation or removal by the Board of Directors. For information regarding the Company’s executive officers, see Item 1., Business - “Executive Officers” included in this Form 10-K.
Compliance with Section 16(a) of the Exchange Act
The information required by this item is incorporated herein by reference from the section captioned “Compliance with Section 16(a) of the Exchange Act” in the Company’s Proxy Statement, a copy of which will be filed with the SEC no later than 120 days after the Company’s fiscal year end.
Code of Ethics for Senior Financial Officers
The Board of Directors has adopted a Code of Ethics for the Company’s officers (including its senior financial officers), directors and employees. The Code is applicable to the Company’s principal executive officer and senior financial officers. The Company’s Code of Ethics is posted on its website at www.fsbwa.com under the Investor Relations tab.
Audit Committee Financial Expert
The Audit Committee of the Company is composed of Directors Leech (Chairperson), Mansfield and Zavaglia. Each member of the Audit Committee is “independent” as defined in the Nasdaq Stock Market listing standards. The Board of Directors has determined that Mr. Leech and Mr. Mansfield meet the definition of “audit committee financial expert,” as defined by the SEC.
Item 11. Executive Compensation
The information required by this item is incorporated herein by reference from the sections captioned “Executive Compensation” and “Directors’ Compensation” in the Proxy Statement, a copy of which will be filed with the SEC no later than 120 days after the Company’s fiscal year end.
Item 12. Security Ownership of Certain Beneficial Owners and Management and Related Stockholder Matters
(a) Security Ownership of Certain Beneficial Owners.
The information required by this item is incorporated herein by reference from the section captioned “Security Ownership of Certain Beneficial Owners and Management” in the Company’s Proxy Statement, a copy of which will be filed with the SEC no later than 120 days after the Company’s fiscal year end.
(b) Security Ownership of Management.
The information required by this item is incorporated herein by reference from the sections captioned “Security Ownership of Certain Beneficial Owners and Management” and “Proposal I - Election of Directors” in the Company’s Proxy Statement, a copy of which will be filed with the SEC no later than 120 days after the Company’s fiscal year end.
(c) Changes in Control.
118
The Company is not aware of any arrangements, including any pledge by any person of securities of the Company, the operation of which may at a subsequent date result in a change in control of the Company.
(d) Equity Compensation Plan Information.
The following table summarizes share and exercise price information about FS Bancorp’s equity compensation plans as of December 31, 2016:
Plan category | Number of securities to be issued upon exercise of outstanding options, warrants, and rights | Weighted-average exercise price of outstanding options, warrants, and rights | Number of securities remaining available for future issuance under equity compensation plans (excluding securities reflected in column (a)) | |||||||
(a) | (b) | (c) | ||||||||
Equity compensation plans (stock options) approved by security holders: | ||||||||||
2013 Equity Incentive Plan(1) | 324,013 | $16.89 | 2,013 | |||||||
Equity compensation plans not approved by security holders | N/A | N/A | N/A | |||||||
Total | 324,013 | $16.89 | 2,013 | |||||||
(1) The restricted shares granted under the 2013 Equity Incentive Plan were purchased by FS Bancorp in open market transactions and subsequently issued to the Company’s directors and certain employees. At December 31, 2016, there were 129,605 restricted shares granted pursuant to the 2013 Equity Incentive Plan and no shares were available for future grants of restricted stock.
Item 13. Certain Relationships and Related Transactions, and Director Independence
The information required by this item is incorporated herein by reference from the section captioned “Transactions with Management” in the Company’s Proxy Statement, a copy of which will be filed with the SEC no later than 120 days after the Company’s fiscal year end.
Item 14. Principal Accounting Fees and Services
The information required by this item is incorporated herein by reference from the section captioned “Proposal 3 - Ratification of Appointment of Independent Auditor” in the Company’s Proxy Statement, a copy of which will be filed with the SEC no later than 120 days after the Company’s fiscal year end.
119
PART IV
Item 15. Exhibits and Financial Statement Schedules
(a) 1. Financial Statements |
For a list of the financial statements filed as part of this report see Part II - Item 8., “Financial Statements and Supplementary Data.” |
2. Financial Statement Schedules |
Schedules to the Consolidated Financial Statements have been omitted as the required information is inapplicable. |
(b) Exhibits |
Exhibits are available from the Company by written request |
3.1 Articles of Incorporation for FS Bancorp, Inc. (1) |
3.2 Amended and Restated Bylaws for FS Bancorp, Inc. (2) |
4.1 Form of Common Stock Certificates for FS Bancorp, Inc. (1) |
10.1 Severance Agreement between 1st Security Bank of Washington and Joseph C. Adams (1) |
10.2 Form of Change of Control Agreement between 1st Security Bank of Washington and each of Joseph C. Adams, Matthew D. Mullet, Drew B. Ness, and Dennis V. O’Leary (1) |
10.3 FS Bancorp, Inc. 2013 Equity Incentive Plan (the “2013 Plan”) (3) |
10.4 Form of Incentive Stock Option Agreement under the 2013 Plan (3) |
10.5 Form of Non-Qualified Stock Option Agreement under the 2013 Plan (3) |
10.6 Form of Restricted Stock Agreement under the 2013 Plan (3) |
10.7 Purchase and Assumption Agreement between Bank of America, National Association and 1st Security Bank dated September 1, 2015 (5) |
10.8 Subordinated Loan Agreement dated September 30, 2015 by and among Community Funding CLO, Ltd. and the Company. (6) |
10.9 Form of Change of Control Agreement with Donn C. Costa and Debbie L. Steck (7) |
14 Code of Ethics and Conduct Policy (4) |
21 Subsidiaries of Registrant |
23 Consent of Independent Registered Public Accounting Firm |
31.1 Certification of Chief Executive Officer Pursuant to Section 302 of the Sarbanes-Oxley Act of 2002 |
31.2 Certification of Chief Financial Officer Pursuant to Section 302 of the Sarbanes-Oxley Act of 2002 |
32.1 Certification of Chief Executive Officer Pursuant to Section 906 of the Sarbanes-Oxley Act of 2002 |
32.2 Certification of Chief Financial Officer Pursuant to Section 906 of the Sarbanes-Oxley Act of 2002 |
101 The following materials from the Company’s Annual Report on Form 10-K for the fiscal year ended December 31, 2016, formatted in Extensible Business Reporting Language (XBRL): (1) Consolidated Balance Sheets; (2) Consolidated Statements of Income; (3) Consolidated Statements of Comprehensive Income; (4) Consolidated Statements of Stockholders’ Equity; (5) Consolidated Statements of Cash Flows; and (6) Notes to Consolidated Financial Statements. |
_____________
(1) | Filed as an exhibit to the Registrant’s Registration Statement on Form S-1 (333-177125) filed on October 3, 2011, and incorporated by reference. |
(2) | Filed as an exhibit to the Registrant’s Current Report on Form 8-K filed on July 10, 2013 (File No. 001-355589). |
(3) | Filed as an exhibit to the Registrant's Registration Statement on Form S-8 (333-192990) filed on December 20, 2013 and incorporated by reference. |
(4) | Registrant elects to satisfy Regulation S-K §229.406(c) by posting its Code of Ethics on its website at www.fsbwa.com in the section titled Investor Relations: Corporate Governance. |
(5) | Filed as an exhibit to the Registrant’s Current Report on Form 8-K filed on September 2, 2015 (File No. 001-35589). |
(6) Filed as an exhibit to the Registrant’s Current Report on Form 8-K filed on October 19, 2015 (File No. 001-35589).
(7) Filed as an exhibit to the Registrant’s Current Report on Form 8-K filed on February 1, 2016 (File No. 001-35589).
120
Item 16. Form 10-K Summary
None.
SIGNATURES
Pursuant to the requirements of Section 13 or 15(d) of the Securities Exchange Act of 1934, the registrant has duly caused this report to be signed on its behalf by the undersigned, thereunto duly authorized.
Date: | March 16, 2017 | FS Bancorp, Inc. | |
/s/Joseph C. Adams | |||
Joseph C. Adams Chief Executive Officer | |||
Pursuant to the requirements of the Securities Exchange Act of 1934, this report has been signed below by the following persons on behalf of the registrant and in the capacities and on the dates indicated.
SIGNATURES | TITLE | DATE | ||
/s/Joseph C. Adams | Director and Chief Executive Officer (Principal Executive Officer) | |||
Joseph C. Adams | March 16, 2017 | |||
/s/Matthew D. Mullet | Chief Financial Officer, Treasurer and Secretary (Principal Financial and Accounting Officer) | |||
Matthew D. Mullet | March 16, 2017 | |||
/s/Ted A. Leech | Chairman of the Board | |||
Ted A. Leech | March 16, 2017 | |||
/s/Margaret R. Piesik | Director | |||
Margaret R. Piesik | March 16, 2017 | |||
/s/Judith A. Cochrane | Director | |||
Judith A. Cochrane | March 16, 2017 | |||
/s/Joseph P. Zavaglia | Director | |||
Joseph P. Zavaglia | March 16, 2017 | |||
/s/Michael J. Mansfield | Director | |||
Michael J. Mansfield | March 16, 2017 | |||
/s/Marina Cofer-Wildsmith | Director | |||
Marina Cofer-Wildsmith, MA | March 16, 2017 | |||
/s/Mark H. Tueffers | Director | |||
Mark H. Tueffers | March 16, 2017 | |||
121
EXHIBIT INDEX
21 Subsidiaries of Registrant
23 Consent of Independent Registered Public Accounting Firm
31.1 | Certification of Chief Executive Officer Pursuant to Section 302 of the Sarbanes-Oxley Act of 2002 |
31.2 | Certification of Chief Financial Officer Pursuant to Section 302 of the Sarbanes-Oxley Act of 2002 |
32.1 | Certification of Chief Executive Officer Pursuant to Section 906 of the Sarbanes-Oxley Act of 2002 |
32.2 | Certification of Chief Financial Officer Pursuant to Section 906 of the Sarbanes-Oxley Act of 2002 |
101 | The following materials from the Company’s Annual Report on Form 10-K for the fiscal year ended December 31, 2016, formatted in Extensible Business Reporting Language (XBRL): (1) Consolidated Balance Sheets; (2) Consolidated Statements of Income; (3) Consolidated Statements of Comprehensive Income; (4) Consolidated Statements of Changes in Stockholders’ Equity; (5) Consolidated Statements of Cash Flows; and (6) Notes to Consolidated Financial Statements. |
122