Attached files
| file | filename |
|---|---|
| 8-K - 8-K - ANI PHARMACEUTICALS INC | v461762_8k.htm |
Exhibit 99.1
A Specialty Pharmaceutical Company NASDAQ: ANIP GENERIC AND BRANDED PRESCRIPTION DRUG PRODUCTS Corporate Presentation March 2017

Forward - Looking Statements To the extent any statements made in this presentation deal with information that is not historical, these are forward - looking statements within the meaning of the Private Securities Litigation Reform Act of 1995. Such statements include, but are not limited to, statements about price increases, the Company’s future operations, products financial position, operating results and prospects , the Company’s pipeline or potential markets therefore, and other statements that are not historical in nature, particularly those that utilize terminology such as “anticipates,” “will,” “expects,” “plans,” “potential,” “future,” “believes,” “intends,” “continue,” other words of similar meaning, derivations of such words and the use of future dates. Uncertainties and risks may cause the Company’s actual results to be materially different than those expressed in or implied by such forward - looking statements. Uncertainties and risks include, but are not limited to, the risk that the Company may face with respect to importing raw materials; increased competition; acquisitions; contract manufacturing arrangements; delays or failure in obtaining product approval from the U.S. Food and Drug Administration; general business and economic conditions; market trends; products development; regulatory and other approvals and marketing. More detailed information on these and additional factors that could affect the Company’s actual results are described in the Company’s filings with the Securities and Exchange Commission, including its most recent annual report on Form 10 - K and quarterly reports on Form 10 - Q, as well as its proxy statement. All forward - looking statements in this presentation speak only as of the date of this presentation and are based on the Company’s current beliefs, assumptions, and expectations. The Company undertakes no obligation to update or revise any forward - looking statement, whether as a result of new information, future events or otherwise. 2

3 Mission and Strategy ANI Pharmaceuticals is an integrated specialty pharmaceutical company focused on delivering value to our customers by developing , manufacturing and marketing high quality branded and generic prescription pharmaceuticals. Our dedicated team of R&D, business development, manufacturing, sales, and regulatory compliance personnel focus on niche and high barrier to entry opportunities, including controlled substances, anti - cancer (oncolytics), hormones and steroids, and complex formulations. We manufacture diverse product offerings in two facilities with combined manufacturing, packaging, warehouse and laboratory space totaling 116,000 square feet.
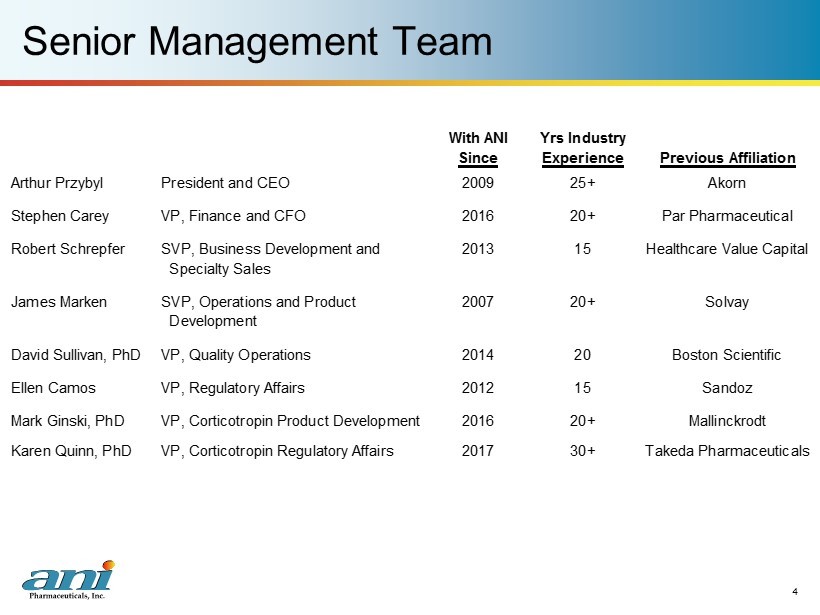
Senior Management Team 4 With ANI Yrs Industry Since Experience Previous Affiliation Arthur Przybyl President and CEO 2009 25+ Akorn Stephen Carey VP, Finance and CFO 2016 20+ Par Pharmaceutical Robert Schrepfer SVP, Business Development and 2013 15 Healthcare Value Capital Specialty Sales James Marken SVP, Operations and Product 2007 20+ Solvay Development David Sullivan, PhD VP, Quality Operations 2014 20 Boston Scientific Ellen Camos VP, Regulatory Affairs 2012 15 Sandoz Mark Ginski, PhD VP, Corticotropin Product Development 2016 20+ Mallinckrodt Karen Quinn, PhD VP, Corticotropin Regulatory Affairs 2017 30+ Takeda Pharmaceuticals

Financial Highlights - 4Q and Full Year 2016 Record annual results on the strength of new product launches during 2016: 25 commercial product families, up from 16 at the beginning of 2016 Net revenues increased 112% from prior year in 4Q and 69% on full year basis Adjusted non - GAAP EBITDA increased 88% from prior year in 4Q and 41% on full year basis (1) See Appendix A for US GAAP reconciliations 5 ($ in millions, except per share data) 2016 2015 2016 2015 Net revenues 38.2$ 18.0$ 128.6$ 76.3$ Net (loss) / income (1.1)$ 2.9$ 3.9$ 15.4$ GAAP (loss) / earnings per diluted share (0.09)$ 0.25$ 0.34$ 1.32$ Adjusted non-GAAP EBITDA (1) 17.9$ 9.5$ 61.1$ 43.5$ Adjusted non-GAAP net income 0.84$ 0.52$ 3.78$ 2.72$ per diluted share (1) Three Months Ended Year Ended December 31, December 31,
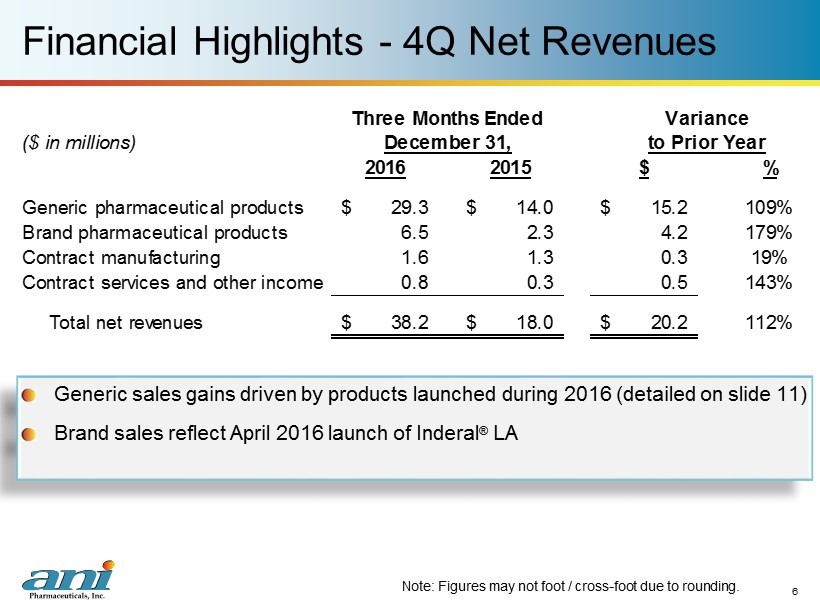
Financial Highlights - 4Q Net Revenues Generic sales gains driven by products launched during 2016 (detailed on slide 11) Brand sales reflect April 2016 launch of Inderal ® LA 6 Note: Figures may not foot / cross - foot due to rounding. ($ in millions) 2016 2015 $ % Generic pharmaceutical products 29.3$ 14.0$ 15.2$ 109% Brand pharmaceutical products 6.5 2.3 4.2 179% Contract manufacturing 1.6 1.3 0.3 19% Contract services and other income 0.8 0.3 0.5 143% Total net revenues 38.2$ 18.0$ 20.2$ 112% Three Months Ended Variance December 31, to Prior Year

Financial Highlights - 2016 Net Revenues Generic sales gains driven by products launched during 2016 (detailed on slide 11) Brand sales reflect April 2016 launch of Inderal ® LA Contract manufacturing reflects timing and volume of customer orders Contract services and other previously reflected royalty income on authorized generic of Vancocin ® , which is now sold directly by ANI and reflected in Generic sales 7 Note: Figures may not foot / cross - foot due to rounding. ($ in millions) 2016 2015 $ % Generic pharmaceutical products 95.2$ 55.2$ 40.0$ 73% Brand pharmaceutical products 26.4 11.0 15.4 140% Contract manufacturing 5.5 4.9 0.7 13% Contract services and other income 1.4 5.3 (3.8) -73% Total net revenues 128.6$ 76.3$ 52.3$ 69% Year Ended Variance December 31, to Prior Year
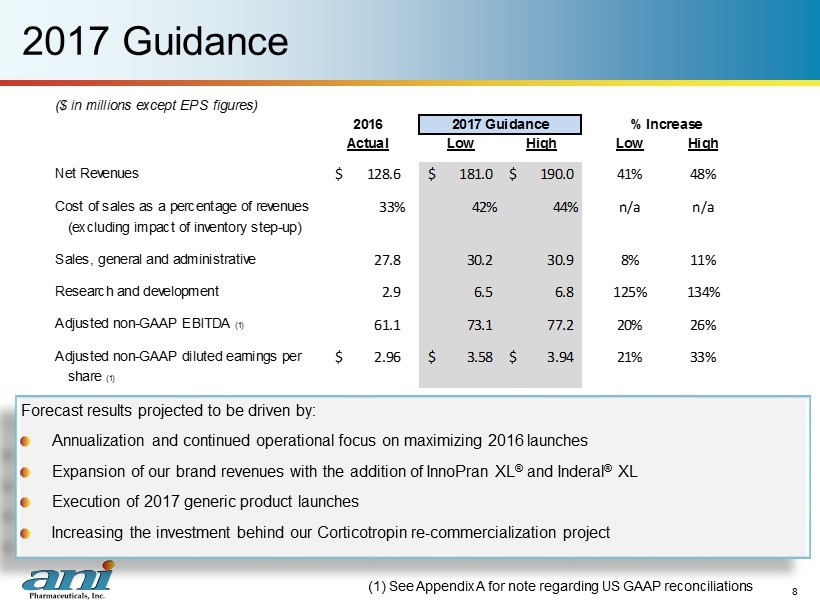
2017 Guidance Forecast results projected to be driven by: Annualization and continued operational focus on maximizing 2016 launches Expansion of our brand revenues with the addition of InnoPran XL ® and Inderal ® XL Execution of 2017 generic product launches Increasing the investment behind our Corticotropin re - commercialization project (1) See Appendix A for note regarding US GAAP reconciliations 8 ($ in millions except EPS figures) 2016 Actual Low High Low High Net Revenues 128.6$ 181.0$ 190.0$ 41% 48% Cost of sales as a percentage of revenues 33% 42% 44% n/a n/a (excluding impact of inventory step-up) Sales, general and administrative 27.8 30.2 30.9 8% 11% Research and development 2.9 6.5 6.8 125% 134% Adjusted non-GAAP EBITDA (1) 61.1 73.1 77.2 20% 26% Adjusted non-GAAP diluted earnings per 2.96$ 3.58$ 3.94$ 21% 33% share (1) 2017 Guidance % Increase
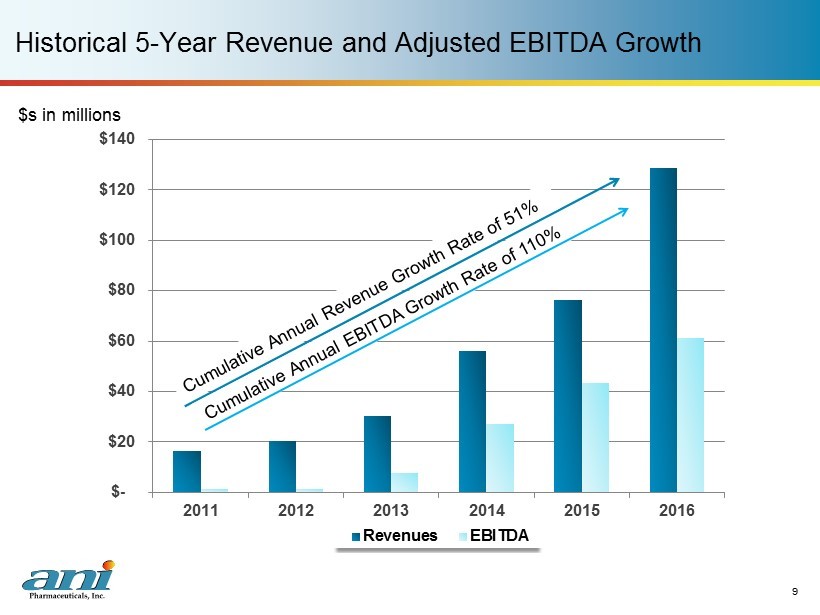
$- $20 $40 $60 $80 $100 $120 $140 2011 2012 2013 2014 2015 2016 Revenues EBITDA Historical 5 - Year Revenue and Adjusted EBITDA Growth 9 $s in millions

10 Sales and Marketing Overview

Generic Rx Product Portfolio 2016 Product Introductions Erythromycin Ethylsuccinate Fenofibrate Capsules (AG) HC Cream, for rectal use Lithium Carbonate ER (AG) Mesalamine Enema (AG) Nilutamide Tablets Oxycodone Capsules Propranolol ER Capsules (AG) 11 Continued broadening of our product offerings ▪ Twenty generic product families encompassing 40 SKUs ▪ $95.2 million of generic n et sales in 2016 (AG) = Authorized Generic

Generic Rx Product Portfolio Foundational Products (launched prior to 2016) 12 (AG) = Authorized Generic EE/MT Tablets Etodolac Capsules Flecainide Tablets Fluvoxamine Maleate Tablets (AG) HC Enema (AG) Methazolamide Tablets Metoclopramide Solution Nimodipine Capsules Opium Tincture Oxycodone Oral Solution Propafenone Tablets Vancomycin Capsules (AG)

Brand Rx Product Portfolio Lithobid ® Tablets Bipolar Disorder Vancocin ® Capsules C. difficile - Associated Diarrhea Cortenema ® U lcerative Colitis Reglan ® Tablets Gastroesophageal Reflux Inderal ® LA Capsules Hypertension ▪ Inderal ® LA launched April 2016 ▪ $26.4 million of brand net sales in 2016 13

Brand Rx InnoPran XL ® and Inderal ® XL 14 Two additional hypertension brands added in first quarter 2017: Purchased on February 23, 2017, for approximately $51 million Generated combined sales of $23.3 million in 2016 according to IMS Health data (gross sales basis)
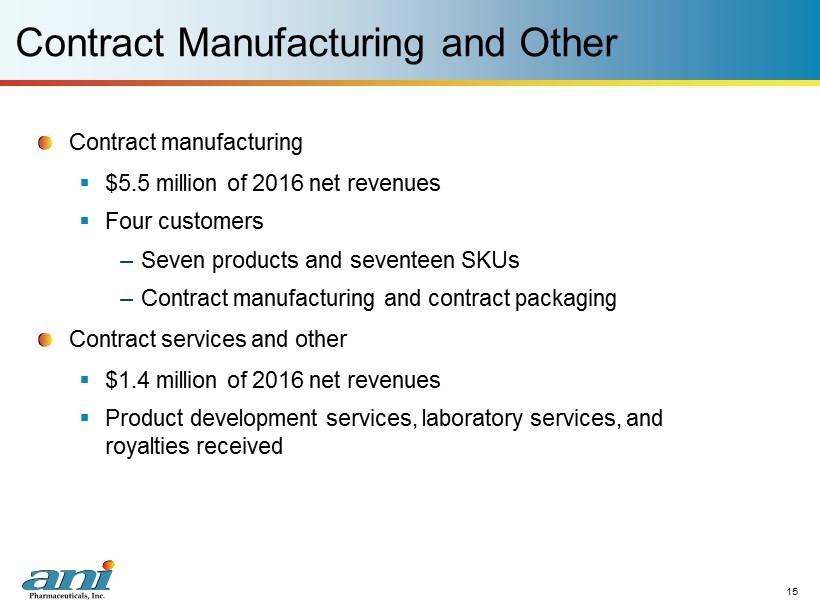
Contract Manufacturing and Other 15 Contract manufacturing ▪ $5.5 million of 2016 net revenues ▪ Four customers – Seven products and seventeen SKUs – Contract manufacturing and contract packaging Contract services and other ▪ $1.4 million of 2016 net revenues ▪ Product development services, laboratory services, and royalties received
16 Business and Product Development Overview

Business Development Activity - Generics 17 P $0.0 Acquisition of US Distr Rights Nimodipine & Omega Private P P $10.0 IDT Partnership (18 previously approved ANDAs) P $1.0 P P Rowasa AG (Partnership with Meda) US Distr Rights Private P Lipofen AG & 1% and 2.5% HC Cream US Distr Rights Private US Distr Rights Private P P P $25.0 (Partnership with Sofgen) Total $54.1 ANDA Basket 1 (31 previously approved ANDAs) Flecainide (flecainide tablets) P $12.5 Acquisition Private P P P $4.5 Acquisition Public P P Acquisition Public P P G e n e r i c s $1.1 STRUCTURE SOURCE STRATEGY ANI MANUF APPROVED COST ($M) ANDA Basket 2 (22 previously approved ANDAs)
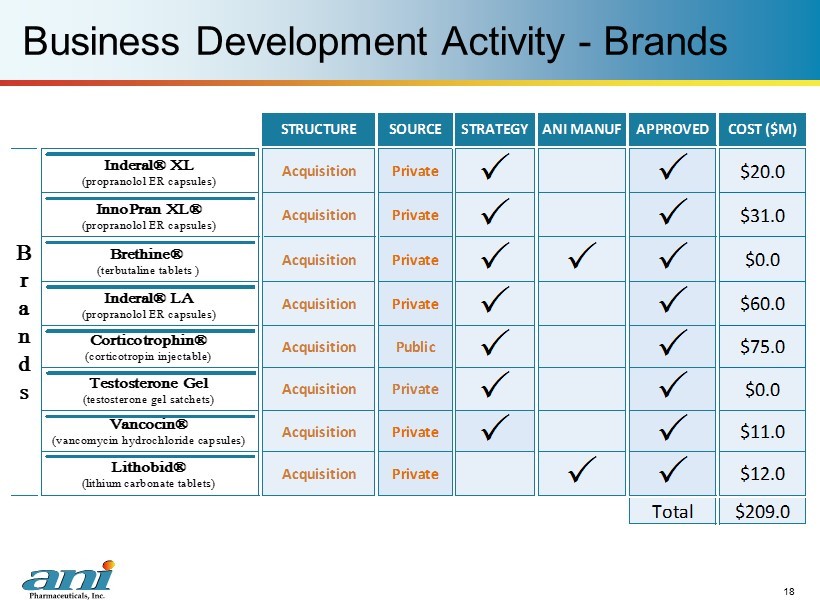
Business Development Activity - Brands 18 (lithium carbonate tablets) $11.0 Vancocin® $209.0Total P Private (vancomycin hydrochloride capsules) Acquisition P P STRUCTURE SOURCE STRATEGY ANI MANUF APPROVED COST ($M) $60.0 Inderal® LA (propranolol ER capsules) Private P P B r a n d s Acquisition Private P P $31.0 InnoPran XL® (propranolol ER capsules) Acquisition Private P P P $0.0 Brethine® Corticotrophin® Acquisition Lithobid® P $0.0 Testosterone Gel (testosterone gel satchets) (corticotropin injectable) $12.0 (terbutaline tablets ) Acquisition Private P P $20.0 Inderal® XL (propranolol ER capsules) Acquisition Public P P $75.0 Acquisition Private P P Acquisition Private
19 Product Development Pipeline ANI Pipeline ▪ 78 products in development, total combined current market: $3.7 billion (1) ▪ 54 products were acquired and of those, ANI believes 47 can be commercialized based on either a CBE - 30 or PAS Corticotropin Re - commercialization Update ▪ Expert team assembled across key functions ▪ Dedicated lab established for analytical method development ▪ Identified, initiated, and continuing to make substantial progress toward the development of analytical methods required for the sNDA filing ▪ Porcine pituitary supply secured for small and commercial scale API ▪ API manufacturer secured; in fourth quarter of 2016 initiated manufacturing of R&D development batches of API (1) Based on Company estimates, and recent IMS and NSP Audit data

20 Manufacturing Overview
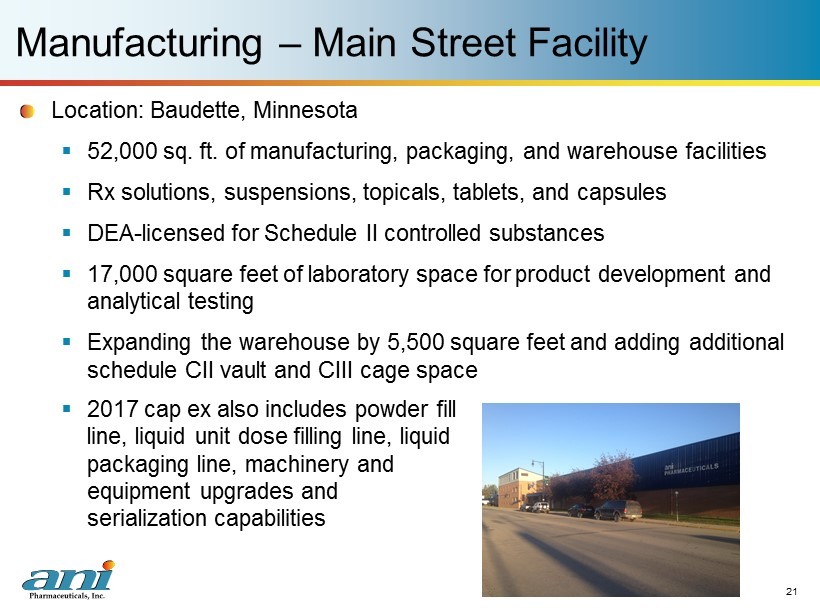
21 Manufacturing – Main Street Facility Location: Baudette , Minnesota ▪ 52,000 sq. ft. of manufacturing , packaging, and warehouse facilities ▪ Rx solutions , suspensions , topicals , tablets , and capsules ▪ DEA - licensed for Schedule II controlled substances ▪ 17,000 square feet of laboratory space for product development and analytical testing ▪ Expanding the warehouse by 5,500 square feet and adding additional schedule CII vault and CIII cage space ▪ 2017 cap ex also includes powder fill line, liquid unit dose filling line, liquid packaging line, machinery and equipment upgrades and serialization capabilities

22 Manufacturing – IDC Road Facility Location: Baudette, Minnesota ▪ Fully - contained h igh potency facility with capabilities to manufacture h ormone , steroid , and oncolytic products ▪ 47,000 square feet of manufacturing, packaging , and warehouse facilities ▪ 100 nano - gram per eight - hour time weighted average maximum exposure limit to ensure employee safety ▪ DEA Schedule IIIN capability ▪ Adding a low - humidity suite for processing and encapsulating moisture - sensitive compounds

Summary ANI is an integrated specialty generic pharmaceutical company with: ▪ Profitable base business generating organic growth ▪ Strong capital position ▪ Experienced management team ▪ US - based manufacturing assets and expertise ▪ 2017 Annual guidance (1) – Net revenues of $181 million to $190 million – Adjusted non - GAAP EBITDA (2) of $73.1 million to $77.2 million – Adjusted non - GAAP diluted earnings per share (2) of $3.58 to $3.94 ANI is focused on delivering value through: ▪ Partnerships and strategic alliances ▪ Accretive acquisitions ▪ Internal product development 23 (1) March 2, 2017 press release (2) See Appendix A for note regarding US GAAP reconciliations

24 Appendix A

U.S. GAAP Reconciliations 25 2016 2015 2016 2015 Net (Loss)/Income (1,080)$ 2,876$ 3,934$ 15,375$ Add back Interest expense, net 2,859 2,768 11,327 11,008 Other income/(expense), net 43 (1) 74 (41) (Benefit)/Provision for income taxes (524) 625 4,744 6,358 Depreciation and amortization 5,812 2,111 22,343 6,900 Intangible asset impairment charge 6,685 - 6,685 - Add back Stock-based compensation 1,380 1,139 6,067 3,856 Excess of fair value over cost of acquired inventory 2,758 - 5,938 - Adjusted non-GAAP EBITDA 17,933$ 9,518$ 61,112$ 43,456$ Year Ended December 31, ANI Pharmaceuticals, Inc. and Subsidiaries Adjusted non-GAAP EBITDA Calculation and US GAAP to Non-GAAP Reconciliation (unaudited, in thousands) Three Months Ended December 31,

U.S. GAAP Reconciliations 26 Three Months Ended Three Months Ended Three Months Ended Three Months Ended Year Ended March 31, 2016 June 30, 2016 September 30, 2016 December 31, 2016 December 31, 2016 Net Income/(Loss) 1,346$ 1,125$ 2,543$ (1,080)$ 3,934$ Add back Excess of fair value over cost of acquired inventory - 2,078 1,102 2,758 5,938 Non-cash interest expense 1,725 1,757 1,782 1,784 7,048 Stock-based compensation 1,105 2,217 1,365 1,380 6,067 Depreciation and amortization expense 4,609 5,956 5,966 5,812 22,343 Intangible asset impairment charge - - - 6,685 6,685 Less Tax impact of adjustments (2,752) (4,443) (3,780) (6,815) (17,790) Adjusted non-GAAP Net Income 6,033$ 8,690$ 8,978$ 10,524$ 34,225$ Diluted Weighted-Average Shares Outstanding 11,489 11,541 11,625 11,635 11,573 Adjusted non-GAAP Diluted Earnings per Share 0.53$ 0.75$ 0.77$ 0.90$ 2.96$ ANI Pharmaceuticals, Inc. and Subsidiaries Adjusted non-GAAP Net Income and Adjusted non-GAAP Diluted Earnings per Share Reconciliation (New Methodology) (unaudited, in thousands, except per share amounts)

U.S. GAAP Reconciliations 27 2016 2015 2016 2015 Net (Loss)/Income (1,080)$ 2,876$ 3,934$ 15,375$ Add back (Benefit)/Provision for income taxes (524) 625 4,744 6,358 Depreciation and amortization expense 5,812 2,111 22,343 6,900 Intangible asset impairment charge 6,685 - 6,685 - Non-cash interest expense 1,784 1,722 7,048 6,831 Stock-based compensation 1,380 1,139 6,067 3,856 Excess of fair value over cost of acquired inventory 2,758 - 5,938 - Less Current Provision (6,993) (2,431) (13,038) (7,875) Adjusted non-GAAP Net Income 9,822$ 6,042$ 43,721$ 31,445$ Diluted Weighted-Average Shares Outstanding 11,635 11,552 11,573 11,557 Adjusted non-GAAP Net Income Per Diluted Share 0.84$ 0.52$ 3.78$ 2.72$ ANI Pharmaceuticals, Inc. and Subsidiaries Adjusted non-GAAP Net Income and Adjusted non-GAAP Net Income per Diluted Share Reconciliation (Previous Methodology) (unaudited, in thousands, except per share amounts) Three Months Ended December 31, Year Ended December 31,
U.S. GAAP Reconciliations 28 Non - GAAP Financial Measures included in 2016 Guidance The Company's fiscal 2017 guidance for adjusted non - GAAP EBITDA and adjusted non - GAAP diluted earnings per share is not reconciled to the most comparable GAAP measure. This is due to the inherent difficulty of forecasting the timing or amount of items that would be included in a reconciliation to the most directly comparable forward - looking GAAP financial measures. Because a reconciliation is not available without unreasonable effort, it is not included in this presentation.