Attached files
| file | filename |
|---|---|
| EX-32.2 - EX-32.2 - JP Energy Partners LP | jpep-20161231ex322414a2a.htm |
| EX-32.1 - EX-32.1 - JP Energy Partners LP | jpep-20161231ex321b36465.htm |
| EX-31.2 - EX-31.2 - JP Energy Partners LP | jpep-20161231ex312545218.htm |
| EX-31.1 - EX-31.1 - JP Energy Partners LP | jpep-20161231ex311febc8f.htm |
| EX-23.1 - EX-23.1 - JP Energy Partners LP | jpep-20161231ex231387e3e.htm |
| EX-21.1 - EX-21.1 - JP Energy Partners LP | jpep-20161231ex211e51e05.htm |
UNITED STATES
SECURITIES AND EXCHANGE COMMISSION
WASHINGTON, DC 20549
FORM 10-K
(Mark One)
☒ANNUAL REPORT PURSUANT TO SECTION 13 OR 15 (d) OF THE SECURITIES EXCHANGE ACT OF 1934
For the fiscal year ended December 31, 2016
or
☐TRANSITION REPORT PURSUANT TO SECTION 13 OR 15 (d) OF THE SECURITIES EXCHANGE ACT OF 1934
For the transition period from to
Commission file number 001-36647
JP ENERGY PARTNERS LP
(Exact name of registrant as specified in its charter)
|
Delaware |
|
27-2504700 |
|
(State or other jurisdiction of |
|
(I.R.S. employer |
600 East Las Colinas Blvd
Suite 2000
Irving, Texas 75039
(Address of principal executive offices, including zip code)
(972) 444-0300
(Registrant’s telephone number, including area code)
SECURITIES REGISTERED PURSUANT TO SECTION 12(b) OF THE ACT:
|
Title of each class |
|
Name of each exchange on which registered |
|
Common Units Representing Limited Partner Interests |
|
New York Stock Exchange |
SECURITIES REGISTERED PURSUANT TO SECTION 12(g) OF THE ACT: None
Indicate by check mark if the Registrant is a well-known seasoned issuer, as defined in Rule 405 of the Securities Act. Yes No ☒
Indicate by check mark if the Registrant is not required to file reports pursuant to Section 13 or Section 15(d) of the Exchange Act. Yes No ☒
Indicate by check mark whether the Registrant: (1) has filed all reports required to be filed by Section 13 or 15(d) of the Securities Exchange Act of 1934 during the preceding 12 months (or for such shorter period that the Registrant was required to file such reports), and (2) has been subject to such filing requirements for the past 90 days. Yes ☒ No
Indicate by check mark whether the registrant has submitted electronically and posted on its corporate Web site, if any, every Interactive Data File required to be submitted and posted pursuant to Rule 405 of Regulation S-T during the preceding 12 months (or for such shorter period that the registrant was required to submit and post such files). Yes ☒ No
Indicate by check mark if disclosure of delinquent filers pursuant to Item 405 of Regulation S-K is not contained herein, and will not be contained, to the best of the Registrant’s knowledge, in definitive proxy or information statements incorporated by reference in Part III of this Form 10-K or any amendment to this Form 10-K. ☒
Indicate by check mark whether the Registrant is a large accelerated filer, an accelerated filer, a non-accelerated filer, or a smaller reporting company. See the definitions of “large accelerated filer”, “accelerated filer” and “smaller reporting company” in Rule 12b-2 of the Exchange Act.
|
Large accelerated filer ☐ |
|
Accelerated filer ☒ |
|
|
|
|
|
Non-accelerated filer ☐ |
|
Smaller reporting company ☐ |
Indicate by check mark whether the Registrant is a shell company (as defined in Rule 12b-2 of the Exchange Act). Yes ☐ No ☒
The aggregate market value of common units held by non-affiliates of the registrant on June 30, 2016, was $122,192,092. The aggregate market value was computed by reference to the last sale price of the registrant's common units on the New York Stock Exchange on June 30, 2016.
As of February 27, 2017, the Registrant had 18,550,906 common units and 18,122,903 subordinated units outstanding.
DOCUMENTS INCORPORATED BY REFERENCE:
i
Unless the context otherwise requires, references in this Annual Report on Form 10-K (this “report” or this “Form 10-K”) to “JP Energy Partners,” “the Partnership,” “we,” “our,” “us,” or like terms refer to JP Energy Partners LP and its subsidiaries, and references to “our general partner” refer to JP Energy GP II LLC, our general partner prior to March 8, 2017, and Argo Merger GP Sub, LLC, our general partner after March 8, 2017. References to “our sponsor” or “Lonestar” refer to AL Lonestar, LLC, which owns and controls our general partner. References to “ArcLight Capital” refer to ArcLight Capital Partners, LLC and references to “ArcLight Fund V” refer to ArcLight Energy Partners Fund V, L.P. References to “ArcLight” refer collectively to ArcLight Capital and ArcLight Fund V. ArcLight Capital manages ArcLight Fund V, which controls our general partner through its ownership and control of Lonestar.
Cautionary Note Regarding Forward-Looking Statements
Certain statements and information in this Annual Report on Form 10-K may constitute “forward-looking statements.” The words “believe,” “expect,” “anticipate,” “plan,” “intend,” “foresee,” “estimate,” “forecast,” “target,” “project,” “assume,” “should,” “would,” “could” or other similar expressions are intended to identify forward-looking statements, which are generally not historical in nature. These forward-looking statements are based on our current expectations and beliefs concerning future developments and their potential effect on us. While management believes that these forward-looking statements are reasonable as and when made, there can be no assurance that future developments affecting us will be those that we anticipate. All comments concerning our expectations for future revenues and operating results are based on our forecasts for our existing operations and do not include the potential impact of any future acquisitions. Our forward-looking statements involve significant risks and uncertainties (some of which are beyond our control) and assumptions that could cause actual results to differ materially from our historical experience and our present expectations or projections. Important factors that could cause actual results to differ materially from those in the forward-looking statements include, but are not limited to, those summarized below:
the price of, demand for and production of, crude oil, refined products and natural gas liquids (“NGLs”) in the markets we serve;
the volumes of crude oil that we gather, transport and store, the throughput volumes at our refined products terminals and our NGL sales volumes;
the fees we receive for the crude oil, refined products and NGL volumes we handle;
pressures from our competitors, some of which may have significantly greater resources than us;
the cost of propane that we buy for resale, including due to disruptions in its supply, and whether we are able to pass along cost increases to our customers;
competitive pressures from other energy sources such as natural gas, which could reduce existing demand for propane;
the risk of contract cancellation, non-renewal or failure to perform by our customers, and our inability to replace such contracts and/or customers;
leaks or releases of hydrocarbons into the environment that result in significant costs and liabilities;
the level of our operating, maintenance and general and administrative expenses;
regulatory action affecting our existing contracts, our operating costs or our operating flexibility;
1
failure to secure or maintain contracts with our largest customers, or non-performance of any of those customers under the applicable contract;
competitive conditions in our industry;
changes in the long-term supply of and demand for oil, natural gas liquids, refined products and natural gas;
the availability and cost of capital and our ability to access certain capital sources;
a deterioration of the credit and capital markets;
volatility of fuel prices;
actions taken by our customers, competitors and third-party operators;
our ability to complete growth projects on time and on budget;
inclement or hazardous weather conditions, including flooding, and the physical impacts of climate change;
environmental hazards;
industrial accidents;
changes in laws and regulations (or the interpretation thereof) related to the transportation, storage or terminaling of crude oil and refined products or the distribution and sales of NGLs;
fires, explosions or other accidents;
the effects of future litigation;
the possibility that the expected synergies and value creation from the AMID Merger will not be realized or will not be realized within the expected time period;
the risk that the businesses of JPEP and AMID will not be integrated successfully;
disruption from the AMID Merger making it more difficult to maintain business and operational relationships; and
other factors discussed elsewhere in this Annual Report and in our other current and periodic reports filed with the Securities and Exchange Commission (the “SEC”).
Readers are cautioned not to place undue reliance on forward-looking statements, which speak only as of the date hereof. We disclaim any obligation to and do not intend to publicly update or revise any forward-looking statements after the date they are made, whether as a result of new information, future events or otherwise.
2
Overview
We are a growth-oriented limited partnership formed in May 2010 by members of management and further capitalized by ArcLight to own, operate, develop and acquire a diversified portfolio of midstream energy assets. Our operations consist of three business segments: (i) crude oil pipelines and storage, (ii) refined products terminals and storage and (iii) NGL distribution and sales.
For additional information relating to our disclosure of revenues, profits and total assets by operating segment, please read “Note 16—Reportable Segments” included in our audited consolidated financial statements incorporated by reference into this Form 10-K.
AMID Merger Agreement
On October 23, 2016, we and JP Energy GP II LLC entered into an Agreement and Plan of Merger (“LP Merger Agreement”) with American Midstream Partners, L.P. (“AMID”), American Midstream GP, LLC, the general partner of AMID (“AMID GP”), and an indirect and wholly owned subsidiary of AMID (“Merger Sub”). On March 8, 2017, we were merged with and into Merger Sub (“AMID Merger”), with the Partnership surviving the merger as a wholly owned subsidiary of AMID.
At the effective time of the AMID Merger, (i) each common unit and each subordinated unit of the Partnership issued and outstanding, other than common units and subordinated units of the Partnership held by Lonestar, JP Energy Development LP, a Delaware limited partnership, or their respective affiliates (together, the “Affiliated Holders”) was converted into the right to receive 0.5775 of a common unit representing limited partner interests in AMID (“AMID Common Unit”) and (ii) each common unit and subordinated unit of the Partnership issued and outstanding held by the Affiliated Holders was converted into the right to receive 0.5225 of an AMID Common Unit.
In connection with the LP Merger Agreement, on October 23, 2016, AMID GP entered into an Agreement and Plan of Merger (the “GP Merger Agreement” and, together with the LP Merger Agreement, the “Merger Agreements”) with JP Energy GP II LLC and a wholly owned subsidiary of AMID GP (“GP Merger Sub”). On March 8, 2017, GP Merger Sub merged with and into JP Energy GP II LLC (the “GP Merger” together with the LP Merger, the “Mergers”), with JP Energy GP II LLC surviving the merger as a wholly owned subsidiary of AMID GP.
In connection with the Merger Agreements, Lonestar, the Partnership and JP Energy GP II LLC entered into an Expense Reimbursement Agreement providing that Lonestar will reimburse, or will pay directly on behalf of, the Partnership or our general partner the third party reasonable costs and expenses incurred by the Partnership or our general partner in connection with the Mergers, including all reasonable out-of-pocket legal and financial advisory fees, costs and expenses paid or payable to third parties and incurred in connection with the negotiation, execution and performance of the LP Merger Agreement and consummation of the Mergers.
How We Conduct Our Business
We conduct our business through fee-based and margin-based arrangements.
Fee-based. We charge our customers a capacity, throughput or volume-based fee that is not contingent on commodity price changes. Our fee-based services include the operations in our crude oil pipelines and storage segment, our refined products terminals and storage segment, and the NGL transportation services we provide within our NGL distribution and sales segment. In our crude oil pipelines business, we purchase crude oil at an index price less a transportation fee, and simultaneously sell an identical volume of crude oil at a designated delivery point at the same index price. We consider this a fee-based business because we lock in the economic equivalent of a transportation fee. Our fee-based businesses are governed by tariffs or other negotiated fee agreements between us and our customers with terms ranging from one month to eight years.
3
Margin-based. We purchase and sell crude oil in our crude oil pipelines and storage segment, and NGLs and refined products in our NGL distribution and sales segment. A portion of our margin related to the purchase and sale of crude oil in our crude oil pipelines and storage segment is derived from “fee equivalent” transactions in which we concurrently purchase and sell crude oil at prices that are based on an index, thereby generating revenue consisting of a margin plus our purchase, transportation, handling and storage costs. In our NGL distribution and sales segment, sales prices to our customers generally provide for a margin plus the cost of our products to our customers. We manage commodity price exposure through the structure of our sales and supply contracts and through a managed hedging program. Our risk management policy permits the use of financial instruments to reduce the exposure to changes in commodity prices that occur in the normal course of business, but prohibits the use of financial instruments for trading or to speculate on future changes in commodity prices.
Our Assets and Operations
Crude Oil Pipelines and Storage
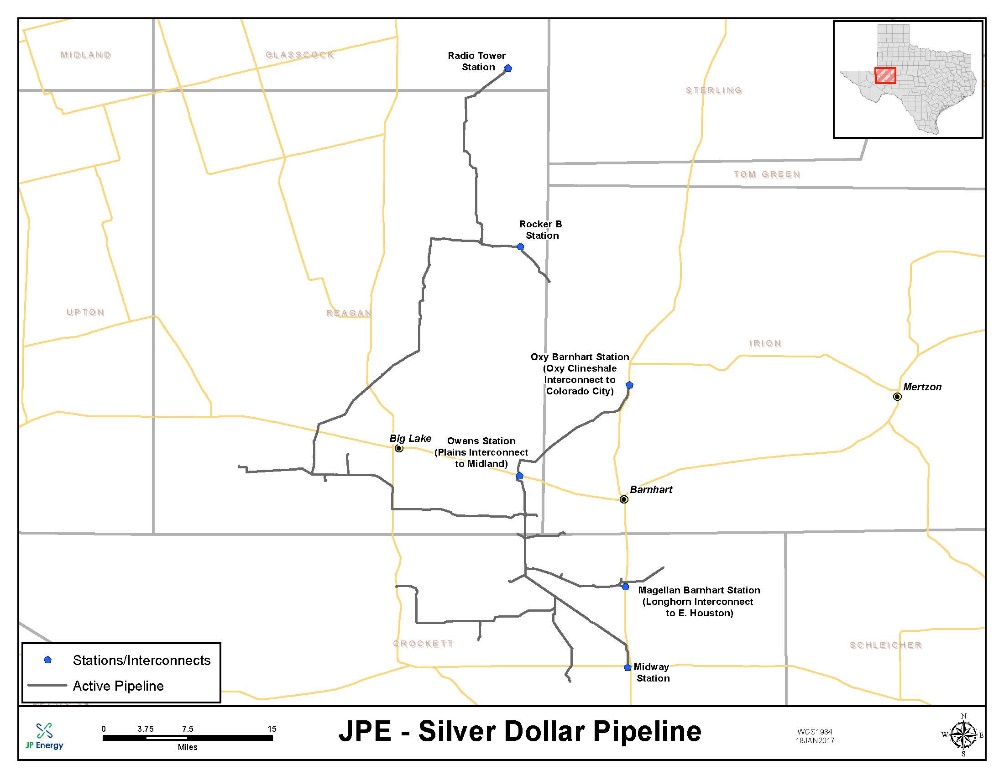
Silver Dollar Pipeline System. The Silver Dollar Pipeline System provides crude oil gathering services for producers targeting the Spraberry and Wolfcamp formations in the Midland Basin. The system currently consists of approximately 161 miles of high-pressure steel pipeline with throughput capacity of approximately 130,000 barrels per day and three interconnections to third-party, long-haul, transportation pipelines. Our operations are underpinned by long-term, fee-based contracts with leading producers in the Midland Basin. One significant contract has a remaining term of approximately six years and contains an acreage dedication related to crude oil production from approximately 125,000 acres in Crockett and Schleicher counties, Texas. Another significant contract has a remaining term of approximately 2.5 years and contains a minimum volume commitment that was amended in June 2016 to significantly increase the volumes committed thereunder. A third significant contract has a remaining term of approximately eight years and contains an acreage dedication related to crude oil production from approximately 57,000 acres in Reagan, Glasscock, Sterling and Irion Counties.
The Silver Dollar Pipeline System serves production from the Spraberry and Wolfcamp formations in the Midland Basin within Crockett, Reagan, Glasscock, Sterling, Irion and Schleicher Counties, Texas. As of December 2016, the Silver Dollar Pipeline System is connected to producers that control approximately 360,000 acres in Crockett, Reagan, Glasscock, Sterling, Irion and Schleicher Counties, Texas. The table below contains operational information related to the Silver Dollar Pipeline System.
|
|
|
|
|
|
|
Throughput For The Three |
|
|||
|
|
|
|
|
|
|
Months Ended |
|
|||
|
Length |
|
Capacity |
|
Storage Capacity |
|
December 31, 2016 |
|
December 31, 2015 |
|
|
|
161 miles |
|
130,000bpd |
|
140,000 barrels |
|
30,932bpd |
|
26,888bpd |
|
|
Construction of the Silver Dollar Pipeline System began in October 2012, and it was put into service in April 2013. The pipeline extends from the Midway Station in Crockett County, Texas to the Owens Station in Reagan County, Texas, a 4.3-acre site with an interconnection to Plains All American Pipeline, L.P.’s Spraberry pipeline expansion. In November 2014, a second connection was made to Oxy Centurion’s Cline Shale pipeline to give Silver Dollar a second delivery location. The Midway Station receives trucking volumes from multiple producers located to the south and has connections to neighboring producer facilities. The Midway Station currently has a 10,000 barrel tank and six truck injection stations.
In February 2015, we commissioned a new 70,000 barrel crude oil storage tank which increased our total crude oil storage capacity on the Silver Dollar Pipeline to 110,000 barrels at that time.
In April 2015, we announced that we had executed an interconnection agreement with an affiliate of Magellan Midstream Partners, L.P. (“Magellan”) to connect our Silver Dollar Pipeline System to Magellan’s Longhorn pipeline at the Barnhart Terminal in Crockett County, Texas. The interconnection provides producers with a third takeaway option from the Silver Dollar Pipeline System. The connection was completed and began service in September 2015. As part of the Magellan project, we also added 30,000 barrels of crude oil storage which further increased the total crude oil storage capacity on the Silver Dollar Pipeline to 140,000 barrels.
4
In our crude oil pipelines business, we purchase crude oil from a producer or supplier at a designated receipt point on our Silver Dollar Pipeline System at an index price less a transportation fee, and simultaneously sell an identical volume of crude oil at a designated delivery point at the same index price, allowing us to lock in a fixed margin that is in effect economically equivalent to a transportation fee. These transactions account for substantially all of the Adjusted EBITDA we generate on our Silver Dollar Pipeline System.
Crude Oil Storage. We own a crude oil storage facility in Cushing, Oklahoma with an aggregate shell capacity of approximately 3.0 million barrels, consisting of five 600,000-barrel storage tanks. These storage tanks were built in 2009 and are located on the western side of a terminal owned by Enterprise Products Partners L.P. (the “Enterprise Terminal”). The storage tanks are able to receive approximately 18,000 barrels of crude oil per hour or deliver approximately 8,000 barrels of crude oil per hour, and have inbound connections with multiple pipelines and two-way interconnections with all of the other major storage facilities in Cushing, including the delivery point specified in all crude oil futures contracts traded on the NYMEX. TEPPCO Partners LP (“TEPPCO”), a wholly owned subsidiary of Enterprise, serves as the operator of our facilities.
Our crude oil storage business provides stable and predictable fee-based cash flows. All of the shell capacity of our storage tanks is dedicated to one customer pursuant to a long-term contract, backed by an escrow account, with an expiration in August 2017. We generate crude oil storage revenues by charging this customer a fixed monthly fee per barrel of shell capacity that is not contingent on the customer’s actual usage of our storage tanks.
Our storage facility is on land that is subject to a 50-year lease with TEPPCO. We have the option to extend our lease by up to an additional 30 years. Our location in the Enterprise Terminal provides our customer with access to multiple pipelines outbound from Cushing, including a manifold connecting our tanks to the Enterprise Terminal. The Enterprise Terminal is connected to the Seaway Pipeline, which is owned and operated by Enterprise and Enbridge Inc. and transports crude oil from Cushing to the Gulf Coast.
We are party to an operating agreement pursuant to which an affiliate of TEPPCO operates and maintains the crude oil storage tanks located at our crude oil storage facility and provides us with certain services, including services related to product movements, data tracking, station operations (including documentation and inspection programs), and purchases of material. These services are provided to us at a monthly base rate and we are permitted to request additional
5
services from TEPPCO, which are provided to us at cost. TEPPCO is obligated to perform the services as a reasonably prudent operator and in accordance with all applicable laws and accepted industry practices. The operating agreement contains certain other customary terms, including provisions relating to restrictions on assignment, terms of payment, indemnification, confidentiality and dispute resolution. The operating agreement remains in place for the same term as the lease agreement described above.
Crude Oil Supply and Logistics. Our crude oil pipelines and storage segment also manages the physical movement of crude oil from origination to final destination largely through our network of owned and leased assets. Our assets and operations are located in areas of substantial future crude oil production growth, including the Permian Basin, Eagle Ford shale, and the Texas Panhandle. We own and operate a fleet of approximately 63 crude oil gathering and transportation trucks and approximately four crude oil truck injection stations and terminals. Due to the limited pipeline infrastructure in some of the basins in which we operate, our crude oil gathering and transportation trucks provide immediate access for customers to transport their crude oil to the most advantageous outlets, including pipelines, rail terminals and local refining centers.
We primarily generate revenues in our crude oil supply and logistics business by purchasing crude oil from producers, aggregators and traders at an index price less a discount and selling crude oil to producers, traders and refiners at a price linked to the same index. The majority of activities that are carried out within our crude oil supply and logistics business are designed to produce a stable baseline of results in a variety of market conditions, while at the same time providing upside opportunities.
In general, sales prices referenced in the underlying contracts, most of which have a 30-day evergreen term, are market-based and may include pricing differentials for such factors as delivery location or crude oil quality. Our crude oil supply and logistics business generates substantial revenues and cost of products sold as a result of the significant volume of crude oil bought and sold. While the absolute price levels of crude oil significantly impact revenues and cost of products sold, such price levels normally do not bear a relationship to gross profit for crude oil sales generated under buy/sell contracts. As a result, period-to-period variations in revenues and cost of products sold are not generally meaningful in analyzing the variation in gross profit for our crude oil supply business.
We mitigate the commodity price exposure of our crude oil supply and logistics business by limiting our net open positions through the concurrent purchase and sale of like quantities of crude oil intended to lock in positive margins based on the timing, location or quality of the crude oil purchased and delivered. All of our supply activities are subject to our comprehensive risk management policy, which establishes limits in order to manage risk and mitigate our commodity price exposure.
We are focused on increasing the utilization of our crude oil gathering and transportation fleet. We typically assign crude oil gathering and transportation trucks to a specific area but can temporarily relocate them to meet demand as needed.
CAST. We equip our drivers with advanced computer technology and dispatch them from central locations. Our drivers are provided with hand-held computers which allow them to utilize our CAST software after they have loaded product. Our CAST software is a centralized system for dispatch, electronic ticket management, reporting, operations data management and lease data management. The CAST software validates ticket data in the field to greatly improve accuracy relative to paper tickets and provides our customers with near real-time views of dispatch, truck tickets, vehicle location, load acceptances and rejections and drivers. The CAST software also offers our customers flexible reporting options by providing customized data to the customer in the format that works best for its accounting and marketing needs.
Refined Products Terminals and Storage
Our refined products terminals and storage segment is comprised of two refined products terminals located in North Little Rock, Arkansas and Caddo Mills, Texas. Our refined products terminals are facilities where refined products
6
are transferred to or from storage or transportation systems, such as pipelines, to other transportation systems, such as trucks. Our refined products terminals provide the following services:
|
· |
receipt, storage, inventory management and distribution; |
|
· |
blending and injection of additives to achieve specified grades of gasoline; and |
|
· |
other ancillary services that include heating of bio-diesel, product transfer and railcar handling services. |
Our refined products terminals consist of multiple storage tanks with a combined aggregate storage capacity of 1.3 million barrels and are equipped with automated truck loading equipment that is operational 24 hours per day. This automated system provides for control of security, allocations, and credit and carrier certification by remote input of data by the terminal and our customers. In addition, our refined products terminals are equipped with truck loading racks capable of providing automated computer blending to individual customer specifications.
We generate fee-based revenues in our refined products terminals and storage segment from:
|
· |
throughput fees based on the receipt and redelivery of refined products, including fees based on the volume of product redelivered from the terminal; |
|
· |
storage fees based on a rate per barrel of storage capacity per month; |
|
· |
additive service fees based on ethanol and biodiesel used in blending services and for additive injection; and |
|
· |
ancillary fees for the heating of bio-diesel, product transfer and railcar handling services. |
Our refined products terminals and storage segment generates its fee-based revenues pursuant to contracts that typically contain evergreen provisions consistent with industry practice so that, after an initial term of one to two years, they can be canceled upon 60 days’ notice. We also generate revenues from (i) blending activities, such as ethanol blending and butane blending, and (ii) our vapor recovery units.
The following table highlights the storage capacity, number of loading lanes, number of tanks, supply source, mode of distribution and average daily throughput of our refined products terminals:
|
|
|
|
|
|
|
|
|
|
|
|
|
|
|
||
|
|
|
Shell |
|
|
|
|
|
|
|
|
|
|
|
||
|
|
|
Storage |
|
|
|
|
|
|
|
|
|
Approximate Average Throughput |
|
||
|
|
|
Capacity |
|
Loading |
|
Number |
|
|
|
Mode of |
|
(barrels per day) for the Year Ended |
|||
|
Terminal Location |
|
(bbls) |
|
Lanes |
|
of Tanks |
|
Supply Source |
|
Redelivery |
|
December 31, 2016 |
|
December 31, 2015 |
|
|
Little Rock, AR |
|
550,000 |
|
8 |
|
11 |
|
Pipeline, Rail and Truck |
|
Truck |
|
35,485 |
|
41,018 |
|
|
Caddo Mills, TX |
|
770,000 |
|
5 |
|
10 |
|
Pipeline and Truck |
|
Truck |
|
21,256 |
|
21,057 |
|
North Little Rock terminal. Our North Little Rock terminal consists of 11 storage tanks with an aggregate capacity of approximately 550,000 barrels and has eight loading lanes with automated truck loading equipment to minimize wait time for our customers. Our truck loading racks are capable of providing automated computer blending to customer specifications. The North Little Rock terminal handles products such as multi-octane conventional gasoline, ultra-low sulphur diesel with dye-at-rack capability, bio-diesel with ratio blending capability and ethanol. In the second quarter of 2016, we completed the connection of the North Little Rock terminal to Magellan’s Little Rock Pipeline. Following the connection, the North Little Rock terminal allows delivery from Enterprise TE Products Pipeline Company LLC and Magellan’s Little Rock Pipeline which provides access to both Gulf Coast and Mid-Continent refineries. We also completed our ethanol unit train expansion project in the fourth quarter of 2016. With the ethanol
7
unit train expansion, our North Little Rock terminal’s ethanol offloading efficiency and capacity significantly improved, allowing for offloading of up to 108 car unit trains. Our North Little Rock terminal serves the Little Rock metropolitan area.
Caddo Mills terminal. Our Caddo Mills terminal consists of 10 storage tanks with an aggregate capacity of approximately 770,000 barrels and has five loading lanes with automated truck loading equipment to minimize wait time for our customers. This terminal is served by the Explorer Pipeline and has truck loading racks capable of providing automated computer blending to customer specifications. Our Caddo Mills terminal handles products such as conventional blend stock for oxygenate blending (CBOB) gasoline, reformulated blend stock for oxygenate blending (RBOB), premium blend stock for oxygenate blending (PBOB), ethanol, ultra-low sulphur diesel with dye-at-rack capability and bio-diesel with ratio blending capability. We own approximately six additional acres of land at our Caddo Mills terminal that is available for future expansion. Management estimates that this acreage is capable of housing an additional 200,000 barrels of storage capacity. The Caddo Mills terminal serves Collin County, located in the northeast portion of the Dallas-Fort Worth metroplex (“DFW”). In the first quarter of 2017, we began a capital project to connect to Explorer’s pipeline serving DFW, which will enable our customers to send gasoline and diesel volumes to DFW.
NGL Distribution and Sales
NGL Sales
Our NGL sales business involves the retail, commercial and wholesale sale of NGLs and other refined products (including sales of gasoline and diesel to our oilfield service and agricultural customers) in seven states in the Southwest and Midwest to approximately 102,000 customers through our distribution network of 43 customer service locations. We generate revenues by charging a price per gallon consisting of our product supply, transportation, handling, and storage costs plus a margin. Since July 2010, we have acquired 18 propane franchises to expand our market presence within our operating region in Texas, Oklahoma, New Mexico, Arizona, Arkansas, Kansas and Missouri.
Customers. We sell propane, butane and refined fuels, including diesel, gasoline, lubricants and solvents, primarily to three customer markets: retail, commercial and wholesale, which include a mix of residential, commercial, agricultural, oilfield service and industrial customers. The customer service centers in our NGL sales business are located in suburban and rural areas where natural gas is not readily available. These customer service centers generally consist of an office, warehouse and service facilities, with one or more 2,500 to 45,000 gallon storage tanks on the premises. These tanks are used to supply our bobtail trucks, which in turn make deliveries to our retail customers. Customers can also bring their own NGL storage containers to our customer service centers to be filled.
Retail. We primarily serve residential customers through the sale of propane for home heating and power generation. We deliver propane through our 133 active bobtail trucks, which have capacities ranging from 2,000 gallons to 5,000 gallons of propane into stationary storage tanks on our customers’ premises. Tank ownership and control at customer locations are important components of our operations and customer retention, and account for approximately half of our retail volumes. The capacity of these storage tanks ranges from approximately 100 gallons to approximately 12,000 gallons, with a typical tank having a capacity of 250 to 500 gallons. We also offer a propane supply commitment program to customers who own their own tanks. Under the program, customers receive progressively larger discounts off our posted prices each year that they remain as our customer. We also offer our customers a budget payment plan whereby the customer’s estimated annual propane purchases and service contracts are paid for in a series of estimated equal monthly payments over a twelve-month period.
In Arizona, our subsidiary, Alliant Arizona Propane, L.L.C., sells propane to residential and commercial customers through regulated central distribution systems in two communities, Payson and Page, which utilize pipelines to distribute propane through meters at the customer’s location. Alliant Arizona Propane, L.L.C. is a regulated utility that receives a fixed cost-plus fee for propane sold. Another subsidiary, Alliant Gas L.L.C., serves 28 communities in Texas through regulated central distribution systems pursuant to long-term contracts.
Commercial. Our commercial customers include a mix of industrial customers, hotels, restaurants, churches, warehouses and retail stores. These customers generally use propane for the same purposes as our residential customers
8
as well as industrial, oilfield service and agricultural customers, who use propane and refined fuels, such as gasoline and diesel, for heating requirements and as fuel to power over-the-road vehicles, forklifts and stationary engines.
Wholesale. Our wholesale customers are principally governmental agencies and other propane distributors. Our LPG transports, which are large trucks that have capacities ranging from 9,000 to 11,500 gallons, load propane at third-party supply points for delivery directly to tanks located on the property of our wholesale customers.
Product supply. We utilize approximately 20 domestic sources of propane supply, including spot market purchases, with four suppliers providing a substantial portion of our propane. Our propane supply contracts are typically standard agreements with one-year terms and standard commercial provisions.
Our supply group manages and sources propane to ensure secure and reliable supply throughout the year. Our LPG transports pick up propane at our supply points, typically refineries, natural gas processing and fractionation plants or LPG storage terminals, for delivery to our customer service centers and our wholesale customers. Supplies of propane from our sources historically have been readily available. During the years ended December 31, 2016 and December 31, 2015, approximately 91% and 88%, respectively, of our propane supply was purchased under supply agreements, which typically have a term of one year, and the remainder was purchased on the spot market.
Our supply contracts typically provide for pricing based upon (i) index formulas using the current prices established at a major storage point such as Mont Belvieu, Texas, or Conway, Kansas or (ii) posted prices at the time of delivery. We use a variety of delivery methods, including our LPG transports and common carrier transports, to transport propane from suppliers to our customer service locations as well as various third-party storage facilities and terminals located in strategic areas across our area of operations. In order to manage our cost of propane, we enter into hedging arrangements on substantially all fixed-price contracts.
Cylinder Exchange
We currently operate the third-largest propane cylinder exchange business in the United States, which consists of the distribution of propane-filled cylinder tanks typically used in barbeque grilling and which covers 46 states in the continental United States through a network of approximately 20,000 distribution locations. We market our business under the brand name Pinnacle Propane Express or under the brand names of our customers. Our customers include grocery stores, pharmacies, convenience stores and hardware retailers which sell or exchange our propane-filled cylinders to consumers for end-use. For the year ended December 31, 2016, we sold or exchanged approximately 4.8 million propane cylinders containing approximately 17.0 million aggregate gallons of propane.
We generate revenues in our cylinder exchange business through the sale or exchange of propane-filled cylinders at an agreed upon contract price. For the years ended December 31, 2016 and December 31, 2015, we distributed 50% and 49%, respectively, of our propane volumes in our cylinder exchange business under long-term agreements and the remaining 50% and 51%, respectively, under one-month contracts or on a spot/demand basis. Our long-term cylinder exchange agreements typically permit us to adjust our prices at the time of contract renewal while our month-to-month cylinder exchange agreements allow us to pass our costs on to our customers and thereby minimize our commodity price exposure. In order to manage our cost of propane, we enter into hedging arrangements on a majority of fixed-price sales contracts.
Cylinder production cycle. We own eight production facilities strategically located in Alabama, Illinois, Michigan, Missouri, Nevada, Oregon, South Carolina and Texas. Our production facilities receive inbound pallets of empty 20-pound propane cylinders, which are put through a processing cycle that includes cleaning, inspection, testing, painting, refilling and loading onto relay trucks for delivery to our 51 distribution depot locations. Drivers at our depots receive the full cylinders from our production facilities for delivery to our customer service locations and pick up empty cylinders, which are shipped to our production facilities for processing.
9
NGL Transportation
We own and operate a fleet of approximately 34 hard shell tank trucks that gather and transport NGLs and condensate for producers, gas processing plants, refiners and fractionators located in the Eagle Ford shale and Permian Basin. For the years ended December 31, 2016 and December 31, 2015, our NGL transportation trucks transported approximately 270,626 gallons per day and 344,763 gallons per day, respectively, of NGLs.
Competition
Crude oil pipelines and storage. We are subject to competition from other crude oil pipelines, crude oil storage tank operators and crude oil marketing companies that may be able to transport or store crude oil at more favorable prices or transport crude oil greater distance or to more favorable markets. Additionally, we are subject to competition from other providers of crude oil supply and logistics services that may be able to supply our customers with the same or comparable services on a more competitive basis. We compete with national, regional and local crude oil pipeline, transportation, gathering and storage companies, including the major integrated oil companies, of widely varying sizes, financial resources and experience. Our competitors in our crude oil pipelines and storage segment include Blueknight Energy Partners, L.P., Enterprise Products Partners L.P., Medallion Midstream LLC, NGL Energy Partners L.P., Occidental Petroleum Corporation, Plains All American Pipeline, L.P., SemGroup Corporation, and Sunoco Logistics.
Refined products terminals and storage. Our refined products terminals located in North Little Rock, Arkansas and Caddo Mills, Texas compete with other terminals on price, versatility and services provided. The competition primarily comes from integrated petroleum companies, refining and marketing companies, independent terminal companies and distribution companies with marketing and trading activities. In the North Little Rock, Arkansas market, these competitors include Magellan Midstream Partners LP, Delek Logistics Partners LP and HWRT Oil Company, LLC. In Dallas, Texas, the market served by our Caddo Mills, Texas terminal, these competitors include Valero Energy Corporation, Delek Logistics Partners, LP, Magellan Midstream Partners LP and Flint Hills Resources LP.
NGL distribution and sales. In addition to competing with suppliers of other energy sources such as natural gas, our NGL distribution and sales segment competes with other retail propane distributors. The retail propane industry is highly fragmented and competition generally occurs on a local basis with other large full-service multi-state propane marketers, thousands of smaller local independent marketers and farm cooperatives. The large, full-service multi-state marketers we compete with include Ferrellgas, L.P. and AmeriGas Partners, L.P. Each of our customer service centers operates in its own competitive environment because retail marketers tend to be located in close proximity to customers in order to lower the cost of providing service. Our typical customer service center has an effective marketing radius of approximately 50 miles, although in certain areas the marketing radius may be extended by one or more satellite offices. Most of our customer service centers compete with five or more marketers or distributors.
Customers
We rely on a limited number of customers for a substantial portion of our revenues. Occidental Energy Marketing, Inc., Plains Marketing LP., and BP Products North America each accounted for 10% or more of our total revenue for the year ended December 31, 2016, at approximately 25%, 15%, and 11%, respectively.
Seasonality
Weather conditions have a significant impact on the demand for our products, particularly propane and refined fuels for heating purposes. Many of our customers rely on propane primarily as a heating source. Accordingly, the volumes sold are directly affected by the severity of the winter weather in our service areas, which can vary substantially from year to year. In any given area, sustained warmer than normal temperatures, as was the case in the heating season over the last three years throughout our operating territories, will tend to result in reduced propane, fuel oil and natural gas consumption, while sustained colder than normal temperatures will tend to result in greater consumption. Meanwhile, our cylinder exchange operations experience higher volumes in the spring and summer, which includes the majority of the grilling season. Sustained periods of poor weather, particularly in the grilling season, can negatively
10
affect our cylinder exchange revenues. In addition, poor weather may reduce consumers’ propensity to purchase and use grills and other propane-fueled appliances, thereby reducing demand for cylinder exchange.
The volume of propane used by customers of our NGL sales business is higher during the first and fourth calendar quarters and lower during the second and third calendar quarters. Conversely, the volume of propane that we sell through our cylinder exchange business is higher during the second and third calendar quarters and lower in the first and fourth calendar quarters. We believe that our combination of our winter-weighted NGL sales business with our higher-margin, summer-weighted cylinder exchange business reduces overall seasonal fluctuations in volumes and financial results, as our cylinder exchange business is more active in summer months and our NGL sales business is more active in winter months. The impact of seasonality is also mitigated by non-heating related demand throughout the year for propane for oilfield services, fuel for automobiles and for industrial applications, such as forklifts, mowers and generators. For the year ended December 31, 2016, we sold approximately 58.8 million gallons of NGLs in our cylinder exchange and NGL sales businesses, selling approximately 41% in the second and third quarters of 2016 and 59% in the first and fourth quarters of 2016.
The volume of product that is handled, transported, throughput or stored in our refined products terminals is directly affected by the level of supply and demand in the wholesale markets served by our terminals. Overall supply of refined products in the wholesale markets is influenced by the absolute prices of the products, the availability of capacity on delivering pipelines and vessels, fluctuating refinery margins and the market’s perception of future product prices. Although demand for gasoline typically peaks during the summer driving season, which extends from April to September, and declines during the fall and winter months, most of the revenues generated at our refined products terminals do not experience any effects from such seasonality. However, the butane blending operations at our refined products terminals are affected by seasonality because of federal regulations governing seasonal gasoline vapor pressure specifications. Accordingly, we expect that the revenues we generate from butane blending will be highest in the winter months and lowest in the summer months.
Insurance
Our assets may experience physical damage as a result of an accident or natural disaster. These hazards can also cause personal injury and loss of life, severe damage to and destruction of property and equipment, pollution or environmental damage and suspension of operations. We maintain casualty, property, and environmental liability insurance policies at varying levels of deductibles and limits that we believe are reasonable and prudent under the circumstances to cover our operations and assets. As we continue to grow, we will continue to evaluate our policy limits and retentions as they relate to the overall cost and scope of our insurance program.
Regulation of the Industry and Our Operations
Crude Oil
We own and operate a fleet of trucks to transport crude oil. We are licensed to perform both intrastate and interstate motor carrier services and are subject to certain safety regulations issued by the Department of Transportation (“DOT”). DOT regulations cover, among other things, driver operations, maintaining log books, truck manifest preparations, the placement of safety placards on trucks and trailer vehicles, drug and alcohol testing, safety of operation and equipment and many other aspects of our trucking operations. Our trucking operations are also subject to regulations and oversight by the Occupational Safety and Health Administration. Additionally, our Silver Dollar Pipeline System is subject to the regulatory oversight of the Texas Railroad Commission and the DOT’s Pipeline and Hazardous Materials Safety Administration (“PHMSA”), whose pipeline safety regulations are described in the section below.
Refined Products and NGLs
All states in which we operate have adopted fire safety codes that regulate the storage and distribution of propane. In some states, these laws are administered by state agencies, and in others they are administered on a municipal level. We maintain various permits necessary to ensure that our operations comply with applicable regulations. We conduct training programs to help ensure that our operations are in compliance with applicable governmental regulations. With respect to general operations, certain National Fire Protection Association (“NFPA”) Pamphlets, including Nos. 54 and 58 and/or one or more of various international codes (including international fire,
11
building and fuel gas codes) establish rules and procedures governing the safe handling of propane, or comparable regulations, which have been adopted by all states in which we operate. In addition, Alliant Arizona Propane, LLC is subject to regulation by the Arizona Corporation Commission and Alliant Gas, LLC is subject to regulation by the Texas Railroad Commission. We believe that the policies and procedures currently in effect at all of our facilities for the handling, storage and distribution of propane are consistent with industry standards and are in compliance in all material respects with applicable environmental, health and safety laws.
With respect to the transportation of NGLs, including propane, by truck, we are subject to regulation by PHMSA under the Federal Motor Carrier Safety Act and the Homeland Security Act of 2002, among other statutes. Our propane gas pipeline systems are also subject to regulation by the PHMSA under the Natural Gas Pipeline Safety Act of 1968, which applies to, among other things, a propane gas system that supplies ten or more residential customers or two or more commercial customers from a single source and to a propane gas system any portion of which is located in a public place. The DOT’s pipeline safety regulations require operators of all gas systems to train employees and third-party contractors, establish written procedures to minimize the hazards resulting from gas pipeline emergencies and conduct and keep records of inspections and testing.
PHMSA requires pipeline operators to implement integrity management programs, including more frequent inspections and other measures to ensure pipeline safety in high-consequence areas (“HCAs”), defined as those areas that are unusually sensitive to environmental damage, that cross a navigable waterway, or that have a high population density. The regulations require operators, including us, to (i) perform ongoing assessments of pipeline integrity, (ii) identify and characterize applicable threats to pipeline segments that could impact a HCA, (iii) improve data collection, integration and analysis, (iv) repair and remediate pipelines as necessary and (v) implement preventive and mitigating actions. In October 2015, PHMSA proposed changes to its pipeline safety regulations that would significantly extend the integrity management requirements to previously exempted pipelines and would impose additional obligations on pipeline operators that are already subject to the integrity management provisions. PHMSA’s proposed rule would also require annual reporting of safety-related conditions and incident reports for all gathering lines and gravity lines, including pipelines that are currently exempt from PHMSA regulations. PHMSA issued a separate regulatory proposal in July 2015 that would impose further pipeline incident prevention and response measures on pipeline operations. While we expect such regulatory changes to allow us time to become compliant with new requirements, once finalized, costs associated with compliance may have a material effect on our operations.
The Pipeline Safety, Regulatory Certainty, and Job Creation Act of 2011, among other things, increases the maximum civil penalty for pipeline safety violations and directs the Secretary of Transportation to promulgate rules or standards relating to expanded integrity management requirements, automatic or remote-controlled valve use, excess flow valve use, leak detection system installation and testing to confirm the material strength of pipe operating above 30% of specified minimum yield strength in high consequence areas. Effective October 25, 2013, PHMSA adopted new rules increasing the maximum administrative civil penalties for violation of the pipeline safety laws and regulations after January 3, 2012 to $200,000 per violation per day, with a maximum of $2,000,000 for a related series of violations. PHMSA also has published an advisory bulletin providing guidance on verification of records related to pipeline maximum operating pressure. We have performed hydrotests of our facilities to confirm the maximum operating pressure and do not expect that any final rulemaking by PHMSA regarding verification of maximum operating pressure would materially affect our operations or revenue.
States are largely preempted by federal law from regulating pipeline safety for interstate lines but most states are certified by the DOT to assume responsibility for enforcing federal intrastate pipeline regulations and inspection of intrastate pipelines. States may adopt stricter standards for intrastate pipelines than those imposed by the federal government for interstate lines; however, states vary considerably in their authority and capacity to address pipeline safety. State standards may include requirements for facility design and management in addition to requirements for pipelines.
Management believes that the policies and procedures currently in effect at all of our propane gas systems are consistent with industry standards and are in compliance with applicable law. Due to our ownership and control of these gas utility companies, we are required to notify FERC of our status as a holding company. We filed such a notification of holding company status and we qualified for an exemption from FERC accounting regulations and access to our books and records because we are a holding company solely by reason of our interests in local gas distribution systems.
12
Environmental Matters
General
Our operations are subject to stringent and complex federal, state and local laws and regulations relating to the protection of the environment. As an owner or operator of certain terminals, storage and transportation facilities, we must comply with these laws and regulations at the federal, state and local levels. These laws and regulations can restrict or impact our business activities in many ways, such as:
|
· |
requiring the installation of pollution-control equipment or otherwise restricting the way we operate; |
|
· |
limiting or prohibiting construction activities in sensitive areas, such as wetlands, coastal regions or areas inhabited by endangered or threatened species; |
|
· |
delaying system modification or upgrades during permit reviews; |
|
· |
requiring investigatory and remedial actions to mitigate pollution conditions caused by our operations or attributable to former operations; and |
|
· |
enjoining the operations of facilities deemed to be in non-compliance with permits issued pursuant to or permit requirements imposed by such environmental laws and regulations. |
Failure to comply with these laws and regulations may trigger a variety of administrative, civil and criminal enforcement measures, including the assessment of monetary penalties. Certain environmental statutes impose strict joint and several liability for costs required to clean up and restore sites where hazardous substances, hydrocarbons or wastes have been disposed or otherwise released. Moreover, it is not uncommon for neighboring landowners and other third parties to file claims for personal injury and property damage allegedly caused by the release of hazardous substances, hydrocarbons or other waste products into the environment.
We do not believe that compliance with federal, state or local environmental laws and regulations will have a material adverse effect on our business, financial position or results of operations or cash flows. In addition, we believe that the various environmental activities in which we are presently engaged are not expected to materially interrupt or diminish our operational ability. We cannot assure you, however, that future events, such as changes in existing laws or enforcement policies, the promulgation of new laws or regulations or the development or discovery of new facts or conditions will not cause us to incur significant costs. Below is a discussion of the material environmental laws and regulations that relate to our business.
Hazardous Substances and Waste
Our operations are subject to environmental laws and regulations relating to the management and release of solid and hazardous wastes and other substances, including hydrocarbons. These laws generally regulate the generation, storage, treatment, transportation and disposal of solid and hazardous waste and may impose strict joint and several liability for the investigation and remediation of affected areas where hazardous substances may have been released or disposed. For instance, the Comprehensive Environmental Response, Compensation, and Liability Act (“CERCLA”), and comparable state laws impose liability, without regard to fault or the legality of the original conduct, on certain classes of persons that contributed to the release of a hazardous substance into the environment. We may handle hazardous substances within the meaning of CERCLA, or similar state statutes, in the course of our ordinary operations and, as a result, may be jointly and severally liable under CERCLA for all or part of the costs required to clean up sites at which these hazardous substances have been released into the environment.
We also generate industrial wastes that are subject to the requirements of the Resource Conservation and Recovery Act (“RCRA”) and comparable state statutes. While RCRA regulates both solid and hazardous wastes, it imposes strict requirements on the generation, storage, treatment, transportation and disposal of hazardous wastes. We
13
generate little hazardous waste. However, it is possible that wastes currently designated as non-hazardous, which could include wastes currently generated during our operations, will in the future be designated as “hazardous wastes” and, therefore, be subject to more rigorous and costly disposal requirements. Moreover, from time to time, the EPA and state regulatory agencies have considered the adoption of stricter disposal standards for non-hazardous wastes, including natural gas wastes. Any such changes in the laws and regulations could have a material adverse effect on our maintenance capital expenditures and operating expenses or otherwise impose limits or restrictions on our operations or those of our customers.
We currently own or lease properties where hydrocarbons are being or have been handled for many years. Although previous operators have utilized operating and disposal practices that were standard in the industry at the time, hydrocarbons or other wastes may have been disposed of or released on or under the properties owned or leased by us or on or under the other locations where these hydrocarbons and wastes have been transported for treatment or disposal. These properties and the wastes disposed thereon may be subject to CERCLA, RCRA and analogous state laws. Under these laws, we could be required to remove or remediate previously disposed wastes (including wastes disposed of or released by prior owners or operators), to clean up contaminated property (including contaminated groundwater) or to perform remedial operations to prevent future contamination. We are not currently aware of any facts, events or conditions relating to such requirements that could materially impact our operations or financial condition.
Oil Pollution Act
The Oil Pollution Act (“OPA”) requires the preparation of a Spill Prevention Control and Countermeasure Plan (“SPCC”) for facilities engaged in drilling, producing, gathering, storing, processing, refining, transferring, distributing, using, or consuming oil and oil products, and which due to their location, could reasonably be expected to discharge oil in harmful quantities into or upon the navigable waters of the United States. The owner or operator of an SPCC-regulated facility is required to prepare a written, site-specific spill prevention plan, which details how a facility’s operations comply with the requirements. To be in compliance, the facility’s SPCC plan must satisfy all of the applicable requirements for drainage, bulk storage tanks, tank car and truck loading and unloading, transfer operations (intrafacility piping), inspections and records, security, and training.
Air Emissions
Our operations are subject to the Clean Air Act (“CAA”) and comparable state and local laws and regulations. These laws and regulations regulate emissions of air pollutants from various industrial sources and also impose various monitoring and reporting requirements. Such laws and regulations may require us to obtain pre-approval for the construction or modification of certain projects or facilities expected to produce or significantly increase air emissions, obtain and strictly comply with air permits containing various emissions and operational limitations and utilize specific emission control technologies to limit emissions. Our failure to comply with these requirements could subject us to monetary penalties, injunctions, conditions or restrictions on operations and criminal enforcement actions. We may be required to incur certain capital expenditures in the future for air pollution control equipment in connection with obtaining and maintaining operating permits and approvals for air emissions.
On August 20, 2010, the EPA published regulations to control emissions of hazardous air pollutants from existing stationary reciprocating internal combustion engines, which was later amended in response to several petitions for reconsideration. The rule requires us to make certain expenditures and undertake certain activities, including the purchase and installation of emissions control equipment (e.g. oxidation catalysts, non-selective catalytic reduction equipment) on our engines following prescribed maintenance practices. In addition, on June 28, 2011, the EPA issued a final rule that establishes new source performance standards for manufacturers, owners and operators of new, modified and reconstructed stationary internal combustion engines. This rule requires us to purchase, install, monitor and maintain emissions control equipment.
Water Discharges
The Clean Water Act (“CWA”) and analogous state laws impose restrictions and strict controls regarding the discharge of pollutants into regulated waters and impose requirements affecting our ability to conduct construction
14
activities in waters and wetlands. In addition, these laws require individual permits or coverage under general permits for discharges of storm water runoff from certain types of facilities. These permits may require us to monitor and sample the storm water runoff from certain of our facilities. Some states also maintain groundwater protection programs that require permits for discharges or operations that may impact groundwater conditions. Federal and state regulatory agencies can impose administrative, civil and criminal penalties for non-compliance with discharge permits or other requirements of the CWA and analogous state laws and regulations.
Endangered Species
The Endangered Species Act (“ESA”) restricts activities that may affect endangered or threatened species or their habitats. In addition, as a result of a settlement approved by the United States District Court for the District of Columbia on September 9, 2011, the United States Fish and Wildlife Service is required to consider listing more than 250 species as endangered under the Endangered Species Act. Under the September 9, 2011 settlement, the United States Fish and Wildlife Service is required to review and address the needs of more than 250 species on the candidate list over a 6-year period. The designation of previously unprotected species as threatened or endangered in areas where we or our oil and propane exploration and production customers operate could cause us or our customers to incur increased costs arising from species protection measures and could result in delays or limitations in our customers’ performance of operations, which could reduce demand for our services.
Hydraulic Fracturing and Flaring
Increased regulation of hydraulic fracturing and flaring of natural gas could result in reductions or delays in crude oil, natural gas and NGL production by our customers, which could materially adversely impact our revenues. Hydraulic fracturing involves the injection of water, sand and chemicals under pressure into geographic formations to stimulate hydrocarbon production. Although we do not engage in hydraulic fracturing or flaring activities, an increasing percentage of hydrocarbon production by our customers and suppliers is developed from unconventional sources, such as shales, that require hydraulic fracturing as part of the completion process and, due to the lack of natural gas transportation infrastructure in certain areas, sometimes also results in flaring of natural gas produced in association with crude oil production. Hydraulic fracturing and flaring are typically regulated by state oil and gas commissions. Some states, including those in which we operate, have adopted, and other states are considering adopting, regulations that could impose more stringent disclosure and/or well construction requirements on hydraulic fracturing operations. In addition, a number of federal agencies, including the EPA and the Department of Energy, are analyzing, or have been requested to review, a variety of environmental issues associated with hydraulic fracturing, and have asserted federal regulatory authority over the process. In December 2016, the EPA released its final report regarding the potential impacts of hydraulic fracturing on drinking water resources, concluding that “water cycle” activities associated with hydraulic fracturing may impact drinking water resources under certain circumstances such as water withdrawals for fracturing in times or areas of low water availability, surface spills during the management of fracturing fluids, chemicals or produced water, injection of fracturing fluids into wells with inadequate mechanical integrity, injection of fracturing fluids directly into groundwater resources, discharge of inadequately treated fracturing wastewater to surface waters, and disposal or storage of fracturing wastewater in unlined pits. The results of these studies could lead federal and state governments and agencies to develop and implement additional regulations. Moreover, Congress from time to time has proposed legislation to more closely and uniformly regulate hydraulic fracturing at the federal level. If new laws or regulations that significantly restrict hydraulic fracturing or flaring are adopted, such laws could make it more difficult or costly for our customers to perform fracturing to stimulate production from tight formations. Restrictions on hydraulic fracturing or flaring could also reduce the volume of hydrocarbons that our customers produce, and could thereby adversely affect our revenues and results of operations.
Climate Change
On December 15, 2009, the EPA published its findings that emissions of carbon dioxide, methane and other greenhouse gases (“GHGs”) present an endangerment to public health and the environment because emissions of such gases are contributing to warming of the earth’s atmosphere and other climatic changes. These findings allow the EPA to adopt and implement regulations that restrict emissions of GHGs under existing provisions of the Clean Air Act (“CAA”). Accordingly, the EPA adopted construction and operating permit requirements under the Prevention of Significant Deterioration and Title V programs for certain stationary sources. In addition, the EPA has adopted a
15
mandatory GHG emissions reporting program that imposes reporting and monitoring requirements on various types of facilities and industries. In November 2010, the EPA expanded its GHG reporting rule to include onshore and offshore oil and natural gas production, processing, transmission, storage, and distribution facilities, requiring reporting of GHG emissions from such facilities on an annual basis. In October 2015, the EPA finalized additional amendments to its greenhouse gas reporting rule, which added pre-reporting requirements for additional facilities. And in May 2016, the EPA finalized additional regulations to reduce emissions of methane and volatile organic compounds from the oil and gas sector.
While Congress has from time to time considered legislation to reduce emissions of GHGs, there has not been significant activity in the form of adopted legislation to reduce GHG emissions at the federal level in recent years. In the absence of federal climate legislation in the United States, a number of state and regional efforts have emerged that are aimed at tracking or reducing GHG emissions by means of cap and trade programs that typically require major sources of GHG emissions, such as electric power plants, to acquire and surrender emission allowances in return for emitting those GHGs. In addition, in December 2015, over 190 countries, including the United States, reached an international agreement to address GHG emissions (“Paris Accord”). The Paris Accord entered into force in November 2016 after over 70 countries, including the United States, ratified or otherwise indicated that it intends to comply with the agreement.
Although it is not possible at this time to predict how legislation or new regulations that may be adopted to address GHG emissions would affect our business, any such future laws and regulations could require us to incur increased operating costs, such as costs to purchase and operate emissions control systems, acquire emissions allowances or comply with new regulatory or reporting requirements. Any such legislation or regulatory programs could also increase the cost of consuming, and thereby reduce demand for, oil and gas, which could reduce the demand for crude oil or refined products produced or distributed by our customers, which could in turn reduce revenues we are able to generate by providing services to our customers. Accordingly, legislation and regulatory programs to reduce emissions of GHGs could have an adverse effect on our business, financial condition and results of operations. Also increasing concentrations of GHGs in the Earth’s atmosphere may produce climate changes that have significant physical effects, such as increased frequency and severity of storms, droughts, floods and other climatic events. If any such effects were to occur, they could have an adverse effect on our financial condition and results of operations.
Anti-terrorism Measures
Certain of our bulk storage facilities are also subject to regulation by the Department of Homeland Security (“DHS”). The Department of Homeland Security Appropriation Act of 2007 requires the DHS to issue regulations establishing risk-based performance standards for the security of chemical and industrial facilities, including oil and gas facilities that are deemed to present “high levels of security risk.” The DHS issued an interim final rule in April 2007 regarding risk-based performance standards to be attained pursuant to this act and, on November 20, 2007, further issued an Appendix A to the interim rules that establish chemicals of interest and their respective threshold quantities that will trigger compliance with these interim rules. Covered facilities that are determined by DHS to pose a high level of security risk will be required to prepare and submit Security Vulnerability Assessments and Site Security Plans as well as comply with other regulatory requirements, including those regarding inspections, audits, recordkeeping, and protection of chemical-terrorism vulnerability information.
Trademarks and Tradenames
We utilize a variety of trademarks and tradenames which we own or have the right to use, including “JP Energy Partners,” “Pinnacle Propane,” “Pinnacle Propane Express” and “Alliant Arizona Propane.” We regard our trademarks, tradenames and other proprietary rights as valuable assets and believe that they have significant value in the marketing of our products and services.
Employees
We are managed and operated by the board of directors and executive officers of our general partner. Neither we nor our subsidiaries have any employees. Our general partner has the sole responsibility for providing the employees and other personnel necessary to conduct our operations. As of February 27, 2017, our general partner and its affiliates
16
have approximately 664 employees performing services for our operations. None of these employees are covered by collective bargaining agreements and we believe that our general partner and its affiliates have a satisfactory relationship with their employees.
Financial Information about Geographical Areas
We have no international activities. For all periods included in this report, all of our revenue was derived from operations conducted in, and all of our assets were located in, the U.S. See Note 16 to our audited consolidated financial statements for additional information.
Available Information
We file or furnish annual reports on Form 10-K, quarterly reports on Form 10-Q, current reports on Form 8-K and any related amendments and supplements thereto with the Securities and Exchange Commission (“SEC”). You may read and copy any materials we file or furnish with the SEC at the SEC’s Public Reference Room at 100 F Street, N.E., Washington, D.C. 20549. You may obtain information regarding the public reference room by calling the SEC at 1-800-732-0330. In addition, the SEC maintains a website at www.sec.gov that contains reports, proxy and information statements and other information regarding issuers that file electronically with the SEC.
17
The occurrence of any of the events described in this Risk Factors section and elsewhere in this Annual Report on Form 10-K or in any other of our filings with the SEC could have a material adverse effect on our business, financial position, results of operations and cash flows. In evaluating an investment in any of our securities, you should consider carefully, among other things, the factors and the specific risks set forth below. This Annual Report on Form 10-K contains forward-looking statements that involve risks and uncertainties. See “Cautionary Note Regarding Forward-Looking Statements” and “Management’s Discussion and Analysis of Financial Condition and Results of Operations” for a discussion of the factors that could cause our actual results to differ materially from those projected.
Risks Related to Our Business
A sustained decrease in demand for, or production of, crude oil, refined products or NGLs in the areas we serve could reduce our revenues.
A sustained decrease in demand for crude oil, refined products or NGLs in the areas we serve could reduce our revenues, which could have a material adverse effect on our financial condition, results of operations and cash flows. Factors that could lead to a decrease in market demand for, or production of crude oil, refined products or NGLs include:
|
· |
lower demand by consumers for refined products, NGLs or crude oil as a result of adverse economic conditions, an increase in the market price of crude oil, NGLs, gasoline or other refined products, use by consumers of alternative fuels or an increase in the fuel economy of vehicles; |
|
· |
lower drilling activity in the areas served by our crude oil gathering and transportation business as a result of a decrease in the market price of crude oil, NGLs or natural gas or for other reasons; and |
|
· |
fluctuations in the demand for crude oil, such as those caused by refinery downtime or shutdowns, lower crack spreads or lower consumer demand for petroleum products. |
Benchmark crude oil prices declined significantly during 2015 and early 2016. As a result, many of the companies that produce oil and gas reduced capital expenditures for 2016. Such reduced expenditure levels, coupled with the high decline rates for many horizontal wells in shale resource plays, could lead to a substantial decrease in overall North American oil production. Other factors that could adversely impact production include reduced capital market access, increased capital raising costs for producers or adverse governmental or regulatory action. In turn, such developments could lead to reduced throughput on our pipelines, which, depending on the level of production declines, could have a material adverse effect on our business.
Certain of our operating costs and expenses are fixed and do not vary with the volumes we transport or redeliver. These costs and expenses may not decrease ratably or at all should we experience a reduction in the volumes we sell, transport or redeliver. As a result, we may experience declines in our margin and profitability if our volumes decrease.
We have several short-term contracts, one long-term contract and other contracts that can be canceled on as little as 30 days’ notice and will have to be renegotiated or replaced periodically. Our failure to replace contracts that are canceled or expire on acceptable terms, or at all, could cause our revenues to decline and reduce our ability to make distributions to our unitholders.
All of the shell capacity of our crude oil storage tanks in Cushing, Oklahoma is dedicated to one customer pursuant to a long-term contract with an initial expiration in August 2017. In January 2017, such customer declined to exercise its option to extend the term of such contract by an additional two years. We may not be able to renegotiate or replace this contract, and the terms of any renegotiated or replacement contract may not be as favorable as the contract it replaces. In addition, many of our contracts in our crude oil pipelines and storage segment either have terms as short as one month or have evergreen provisions and are cancellable on as little as 30 days’ notice. Many of our contracts in our NGL sales and distribution segment have terms as short as one month, and substantially all of our contracts with customers in our refined products terminals and storage segment have evergreen provisions after an initial term of one to
18
two years and are cancellable on as little as 60 days’ notice. As these NGL or crude oil contracts expire or if a refined products contract is canceled, we may not be able to extend, renegotiate or replace these contracts and the terms of any renegotiated contracts may not be as favorable as the contracts they replace. In addition, while the majority of the revenue in our crude oil pipelines and storage segment is generated pursuant to long-term contracts, our customers may negotiate for more favorable terms upon any renewal and could set contracts aside in the event of bankruptcy.
Our ability to extend or replace contracts could be impacted by a number of factors beyond our control, including competition, the level of supply and demand for crude oil and refined products in our areas of operations, general economic conditions and regulatory developments. To the extent we are unable to renew our contracts, including our crude oil storage contract, on terms that are favorable to us, our revenue and cash flows could decline and our ability to make cash distributions to our unitholders could be materially adversely affected.
We face competition in all of our business segments. Competitors that are able to supply our customers with similar services or products at a lower price could reduce our revenues.
We are subject to competition from other providers of crude oil transportation and storage services, refined products terminals and storage services and NGL distribution and sales services, including national, regional and local companies engaged in these activities. Some of these competitors are substantially larger than us and may have greater financial resources. Our ability to compete could be affected by many factors, including:
|
· |
price competition; |
|
· |
the perception that another company can provide better service; and |
|
· |
the availability of alternative supply points, or supply points located closer to the operations of our customers. |
In addition, our general partner and its affiliates, including JP Development, Lonestar and ArcLight, may engage in competition with us. If we are unable to compete with services offered by our competitors, including possibly our general partner or its affiliates, it could have a material adverse effect on our financial condition, results of operations and cash flows.
Because of the natural decline in production from our customers’ existing wells in our areas of operation, we depend, in part, on producers replacing declining production and also on our ability to secure new sources of crude oil. Any decrease in the volumes of crude oil that we transport could adversely affect our business and operating results.
The crude oil volumes that support our crude oil pipelines and storage segment depend on the level of oil production from wells on which we rely for throughput or sales and transportation volumes, which may be less than expected and will naturally decline over time. As a result, our cash flows associated with these wells will also decline over time. In order to maintain or increase throughput in this segment, we must obtain new sources of crude oil. In our crude oil pipelines and storage segment, the primary factors affecting our ability to obtain non-dedicated sources of crude oil include (i) the level of successful drilling activity and overall crude oil production in our areas of operation, (ii) our ability to compete for volumes from successful new wells and (iii) our ability to compete successfully for volumes from sources connected to other pipelines.
We have no control over the level of drilling activity in our areas of operation, the amount of reserves associated with wells on which we rely for throughput or the rate at which production from such wells declines. In addition, we have no control over producers or their drilling or production decisions, which are affected by, among other things:
|
· |
the availability and cost of capital; |
|
· |
prevailing and projected oil, natural gas and NGL prices; |
|
· |
basis differentials, transportation costs and other expenses impacting a producer’s net-back price; |
19
|
· |
demand for oil, natural gas and NGLs; |
|
· |
levels of reserves; |
|
· |
geological considerations; |
|
· |
environmental or other governmental regulations, including the availability of drilling permits and the regulation of hydraulic fracturing; and |
|
· |
the availability of drilling rigs and other costs of production and equipment. |
Fluctuations in energy prices can also greatly affect the development of oil reserves. Drilling and production activity generally decreases as oil prices decrease. Declines in oil prices could have a negative impact on exploration, development and production activity, and if sustained, could lead to a material decrease in exploration and production activity. Any sustained decline of exploration or production activity in our areas of operation could lead to reduced utilization of our assets.
Because of these and other factors, even if oil reserves are known to exist in areas served by our assets, producers may choose not to develop those reserves. If reductions in drilling activity result in our inability to maintain throughput and our sales and transportation volumes in our crude oil pipelines and storage segment, our revenue and cash flow could be reduced and our ability to make cash distributions to our unitholders could be adversely affected.
We do not intend to obtain independent evaluations of oil reserves connected to our Silver Dollar Pipeline System on a regular or ongoing basis; therefore, in the future, volumes of oil on our Silver Dollar Pipeline System could be less than we anticipate.
We do not intend to obtain independent evaluations of oil reserves connected to our Silver Dollar Pipeline System on a regular or ongoing basis. Accordingly, we may not have independent estimates of total reserves dedicated to our Silver Dollar Pipeline System or the anticipated life of such reserves. If the total reserves or estimated life of the reserves connected to our Silver Dollar Pipeline System are less than we anticipate and if our customers are unable to secure additional sources of crude oil production it could have a material adverse effect on our business, results of operations, financial condition and our ability to make cash distributions to our unitholders.
Our success in our crude oil pipelines business depends, in part, on drilling activity and our ability to attract and maintain customers in a limited number of geographic areas.
Our Silver Dollar Pipeline System is located in the Midland Basin and we intend to focus future capital expenditures on developing our business in this area. Due to our focus on production from the Spraberry and Wolfcamp formations in the Midland Basin, an adverse development in oil production from this area would have a greater impact on our financial condition and results of operations than if we spread expenditures more evenly over a wider geographic area. For example, a change in the rules and regulations governing operations in or around the Midland Basin or a continued decline in oil prices could cause producers to reduce or cease drilling or to permanently or temporarily shut-in their production within the area, which could have a material adverse effect on our business, results of operations, financial condition and our ability to make cash distributions to our unitholders.
We may not be able to increase throughput and resulting revenue due to competition and other factors, which could limit our ability to grow our crude oil pipelines and storage segment.
Our ability to increase our throughput and resulting revenue is subject to numerous factors beyond our control, including competition from third parties, aggregate crude oil production from the area in close proximity to our pipeline and the extent to which our Silver Dollar Pipeline System has available takeaway capacity. To the extent that we lack available capacity on our Silver Dollar Pipeline System for additional volumes, we may not be able to compete effectively with third-party systems for additional oil production in our areas of operation. In addition, our efforts to attract new customers may be adversely affected by our desire to provide services pursuant to contracts that are
20
effectively fee-based. Our potential customers may prefer to obtain services pursuant to other forms of contractual arrangements under which we would be required to assume direct commodity exposure.
Our crude oil pipelines and storage operations involve market and regulatory risks.
As part of our crude oil pipelines and storage activities, we purchase crude oil at prices determined by prevailing market conditions. Following our purchase of crude oil, we generally resell crude oil at a higher price under a sales contract that is generally comparable in terms to our purchase contract, including any price escalation provisions. The profitability of our crude oil operations may be affected by the following factors:
|
· |
our ability to negotiate crude oil purchase and sales agreements in changing markets on a timely basis; |
|
· |
reluctance of customers to enter into long-term purchase contracts; |
|
· |
consumers’ willingness to use other fuels instead of the end products in the crude oil supply chain; |
|
· |
the timing of imbalance or volume discrepancy corrections and their impact on our financial results; |
|
· |
the ability of our customers to make timely payment; and |
|
· |
any inability we may have to match purchase and sale of crude oil on comparable terms. |
We depend on a relatively limited number of customers for a significant portion of our revenues. The loss of, or material nonpayment or nonperformance by, any one or more of these customers could adversely affect our ability to make cash distributions to our unitholders.
We rely on a limited number of customers for a substantial portion of our revenues. Occidental Energy Marketing, Inc., Plains Marketing LP., and BP Products North America accounted for 10% or more of our total revenue for the year ended December 31, 2016, at approximately 25%, 15%, and 11%. We may be unable to negotiate extensions or replacements of contracts with our key customers on favorable terms or at all. In addition, these key customers may experience financial problems that could have a significant effect on their creditworthiness. Severe financial problems encountered by our customers could limit our ability to collect amounts owed to us, or to enforce performance of obligations under contractual arrangements. Furthermore, our customers may be highly leveraged and subject to their own operating and regulatory risks, which increases the risk that they may default on their obligations to us. The loss of all or even a portion of the contracted volumes of these key customers, as a result of competition, creditworthiness or otherwise, could have a material adverse effect on our business, results of operations, financial condition and ability to make cash distributions to our unitholders.
Midstream capacity constraints and interruptions could impact our operations.
We rely on various midstream facilities and systems in connection with our crude oil pipelines and storage operations. Such midstream systems include the systems we operate, as well as systems operated by third parties. When possible, we gain access to midstream systems that provide the most advantageous downstream market prices available to us. Regardless of who operates the midstream systems we rely upon, a portion of the supply in our crude oil pipelines and storage business may be interrupted or shut-in from time to time due to loss of access to plants, pipelines or gathering systems. Such access could be lost due to a number of factors, including, but not limited to, weather conditions, accidents, field labor issues or strikes. Additionally, we and third parties may be subject to constraints that limit our ability to construct, maintain or repair midstream facilities needed in connection with our crude oil pipelines and storage operations. Such interruptions or constraints could negatively impact our profitability.
21
The risk management policy governing our crude oil supply activities cannot eliminate all risks associated with our crude oil pipelines and storage business, and we cannot ensure that employees of our general partner will fully comply with the policy at all times, both of which could impact our financial and operational results and, in turn, our ability to make cash distributions to our unitholders.
We have in place a risk management policy that seeks to establish limits for the exposure in our crude oil pipelines and storage business by requiring that we restrict net open positions through the concurrent purchase and sale of like quantities of crude oil to create transactions intended to lock in positive margins based on the timing, location or quality of the crude oil purchased and delivered. Our risk management policy, however, cannot eliminate all risks. Any event that disrupts our anticipated physical supply of crude oil could create a net open position that would expose us to risk of loss resulting from price changes.
Moreover, we are exposed to price movements on products that are not hedged, such as our crude oil linefill, which must be maintained to operate our crude oil pipeline system. We are also exposed to certain price risks related to basis differentials. Basis differentials can be created to the extent that we hold or sell crude oil of a grade or quality at a location or at a time that differs from the specific delivery terms with respect to grade, quality, time or location of the applicable offsetting agreement. If this occurs, we may not be able to use the physical markets to fully hedge our price risk. Our exposure to price risks could impact our operational and financial results and our ability to make cash distributions to our unitholders.
We are also subject to the risk that employees of our general partner involved in our crude oil operations may not comply at all times with our risk management policy. We cannot ensure that all violations of our risk management policy, particularly if deception or other intentional misconduct is involved, will be detected prior to our businesses being materially affected.
A prolonged decline in index prices at Cushing, relative to other index prices, could reduce the demand for the services we provide in our crude oil storage business.
In recent years, a shortfall in takeaway pipeline capacity has at times led to an oversupply of crude oil at Cushing. This was cited as a principal reason for the decline in the West Texas Intermediate Index (“WTI Index”) price used at Cushing relative to other crude oil price indexes, including the Brent Crude Index over the same period. While the WTI Index price has recovered compared to the Brent Crude Index, a renewed decline in the WTI Index price relative to other index prices may reduce demand for transportation of crude oil to, and storage at our facility in, Cushing, which could have a material adverse effect on our business, results of operations, financial condition and ability to make cash distributions to our unitholders.
The results of our crude oil storage business could be adversely affected during periods in which the overall forward market for crude oil is flat or backwardated.
The results of our crude oil storage business are influenced by the overall forward market for crude oil. A contango market (meaning that the price of crude oil for future delivery is higher than the current price) has a favorable impact on the demand for crude oil storage as it allows a party to simultaneously purchase crude oil at current prices for storage and sell at higher prices for future delivery. Conversely, a flat or backwardated market (meaning that the price of crude oil for future deliveries is lower than current prices) can negatively affect the demand for crude oil storage because there is little incentive to store crude oil when prices offered for future delivery are expected to be lower. Accordingly, a flat or backwardated market can negatively impact the demand for crude oil storage. If the mild contango in the forward market for crude oil does not become more pronounced or if the forward market becomes backwardated while we are attempting to renew our crude oil storage contract or enter into new crude oil storage contracts, it could adversely affect the results in our crude oil storage business.
22
All of our operations have indirect exposure to changes in commodity prices and some of our operations have direct exposure to commodity price changes.
Our operations have limited direct exposure to changes in commodity prices. However, the volumes of crude oil that we transport, store or supply, refined products that we handle and NGLs that we distribute and sell are indirectly affected by commodity prices because many of our customers have direct exposure to commodity prices. If our customers are negatively impacted by changes in commodity prices, they may, among other things, reduce the services they purchase from us. For example, lower crude oil prices could suppress drilling activity, which would reduce demand for our crude oil pipeline and storage services, while higher refined products prices could decrease consumer demand for refined products, which could reduce demand for services we provide at our refined products terminals.
In addition, in our refined products terminals and storage segment, we also generate revenue from (i) blending activities, such as ethanol blending and butane blending, and (ii) our vapor recovery units. Our blending activities are subject to direct commodity price exposure. Any significant reduction in the amount of services we provide to our customers because of direct or indirect commodity price exposure and any significant reduction in the refined products that we sell could have a material adverse effect on our business, results of operations, financial condition and our ability to make cash distributions to our unitholders.
We do not operate our crude oil storage facility.
TEPPCO Partners L.P., a wholly owned subsidiary of Enterprise Products Partners L.P., serves as the operator of our crude oil storage facility. Under the operating agreement governing TEPPCO’s operation of our facility, we are liable for any losses or claims arising from damage to our property or personal injury claims of our personnel that may result from the actions of the operator, even if such losses or claims result from the operator’s gross negligence or willful misconduct. If disputes arise over operation of our crude oil storage facility, or if our operator fails to provide the services contracted under the agreement, our business, results of operation, financial condition and ability to make cash distributions to our unitholders could be adversely affected.
Our refined products terminals are dependent upon their interconnections with terminals and pipelines owned and operated by others.
Our refined products terminals are dependent upon their interconnections with other terminals and pipelines owned and operated by third parties to reach end markets and as a significant source of supply. Our North Little Rock terminal is currently supplied by the TEPPCO Pipeline and Magellan’s Little Rock Pipeline, while our Caddo Mills terminal is supplied by the Explorer Pipeline. Reduced or interrupted throughput on these pipelines or outages at terminals with which our refined products terminals share interconnects because of weather or other natural events, testing, line repair, damage, reduced operating pressures or other causes could result in our being unable to deliver refined products to our customers from our terminals or receive products for storage at our terminals, which could adversely affect our cash flows and revenues. In addition, in the event that one of the pipelines depended upon by either of our refined products terminals modifies its tariff to discontinue service for one or more of the products throughput at our terminals, we will have to discontinue selling or secure an alternate supply of such product. This could have a material adverse impact on the throughput volumes and revenues of our refined products terminals and storage segment.
The assets in our refined products terminals and storage segment have been in service for several decades.
Our refined products terminals and storage assets are generally long-lived assets. Our North Little Rock terminal has been in service for approximately 35 years, and our Caddo Mills terminal has been in service for approximately 30 years. The age and condition of these assets could result in increased maintenance or remediation expenditures. Any significant increase in these expenditures could adversely affect our business, results of operations, financial condition and our ability to make cash distributions to our unitholders.
23
Warm weather in the winter heating season or inclement weather in the summer grilling season could lower demand for propane.
Weather conditions have a significant impact on the demand for propane for both heating and agricultural purposes. Many of our customers rely on propane primarily as a heating source during the winter. For the year ended December 31, 2016, we sold approximately 65% of our retail, commercial and wholesale propane volumes during the first and fourth quarters of the year.
Actual weather conditions can vary substantially from year to year, significantly affecting our financial performance. For example, in 2016 the average temperature in the seven states in which we operate was 7% warmer than the average temperature of the prior year, as measured by the number of heating degree days reported by the National Oceanic and Atmospheric Administration (“NOAA”).
Conversely, our cylinder exchange business experiences higher volumes in the spring and summer, which includes the majority of the grilling season. For the year ended December 31, 2016, we sold approximately 55% of the propane volumes in our cylinder exchange business during the second and third quarters of the year. Sustained periods of poor weather, particularly in the grilling season, can reduce consumers’ propensity to purchase and use grills and other propane-fueled appliances, thereby reducing demand for cylinder exchange and our outdoor products.
Sudden and sharp propane cost increases cannot be passed on to customers with contracted pricing arrangements and these contracted pricing arrangements will adversely affect our profit margins if they are not immediately hedged with an offsetting propane purchase commitment.
Results of operations related to the retail distribution of propane is primarily based on the cents-per-gallon difference between the sales price we charge our customers and our costs to purchase and deliver propane to our propane distribution locations. We enter into propane sales commitments with a portion of our customers that provide for a contracted price agreement for a specified period of time. The propane cost per gallon is subject to various market conditions and may fluctuate based on changes in demand, supply and other energy commodity prices, such as crude oil and natural gas prices. We employ risk management techniques that attempt to mitigate risks related to the purchasing, storing, transporting and selling of propane. However, sudden and sharp propane cost increases cannot be passed on to customers with contracted pricing arrangements. In addition, even upon the expiration of short-term contracts, we may face competitive or relationship pressure to minimize any price increases. Therefore, these commitments expose us to product price risk and reduced profit margins if those transactions are not immediately hedged with an offsetting propane purchase commitment.
High prices for propane can lead to customer conservation and attrition, resulting in reduced demand for our products.
Propane prices are subject to fluctuations in response to changes in wholesale prices and other market conditions beyond our control. Therefore, our average retail sales prices can vary significantly within a heating season or from year to year as wholesale prices fluctuate with propane commodity market conditions. During periods of high propane costs our selling prices generally increase. High prices can lead to customer conservation and attrition, resulting in reduced demand for our products.
We are dependent on certain principal propane suppliers, which increases the risks from an interruption in supply and transportation.
During the year ended December 31, 2016, we purchased 75% of our propane needs from four suppliers. If supplies from these sources were interrupted, the cost of procuring replacement supplies and transporting those supplies from alternative locations might be materially higher and our earnings could be affected. Additionally, in certain areas, based on favorable pricing or the strategic location of certain supply points, a single supplier may provide more than 75% of our propane requirements for that area. Although we have relationships with other suppliers in these areas and have the ability to acquire product elsewhere, in the event of a supply disruption with our primary suppliers in certain regions, we could be forced to purchase propane at a less favorable price and with a higher transportation cost. Accordingly, disruptions in supply in certain areas could also have an adverse impact on our business, results of operations, financial condition and our ability to make cash distributions to our unitholders.
24
Energy efficiency, advances in technology and competition from other energy sources may affect demand for propane and increases in propane prices may cause our residential customers to increase their conservation efforts.
The national trend toward increased conservation and technological advances, including installation of improved insulation and the development of more efficient furnaces and other heating devices, has generally reduced the demand for propane. Propane also competes with other sources of energy such as electricity, natural gas and fuel oil, some of which can be less costly for equivalent energy value. In particular, the gradual expansion of the nation’s natural gas distribution systems has increased the availability of affordable natural gas in rural areas, which historically found propane to be the more cost-effective choice. We cannot predict the effect that future conservation measures, technological advances in heating, conservation, energy generation or other devices or the development of alternative energy sources might have on our operations. As the price of propane increases, some of our customers tend to increase their conservation efforts and thereby decrease their consumption of propane.
If the independently owned third-party haulers that we rely upon for the delivery of propane cylinders from our production facilities to certain of our distribution depots do not perform as expected, or if we or these third-party haulers are not able to manage growth effectively, our relationships with our customers may be adversely impacted and our delivery of propane by cylinder exchange may decline.
We rely in part on independently owned third-party haulers to deliver cylinders from our production facilities to certain of our distribution depots. Accordingly, our success depends on our ability to maintain and manage relationships with these third-party haulers. We exercise only limited influence over the resources that the third-party haulers devote to the delivery of cylinders. We could experience a loss of consumer or retailer goodwill if our third-party haulers do not adhere to our quality control and service guidelines or fail to ensure the timely delivery of an adequate supply of propane cylinders to certain of our production depots. In addition, the number of retail locations accepting delivery of our propane by cylinder exchange and, subsequently, the retailer’s corresponding sales have historically grown significantly along with the creation of our third-party hauler network. Accordingly, our haulers must be able to adequately service an increasing number of propane cylinder deliveries to our distribution depots so that we can service our retail accounts. If we or our third-party haulers fail to manage the growth of our cylinder exchange operations effectively, our financial results from our delivery of propane by cylinder exchange may be adversely affected.
A significant increase in motor fuel costs or other commodity prices may adversely affect our profits.
Motor fuel is a significant operating expense for us in connection with the operation of both our crude oil pipelines and storage and NGL distribution and sales segments. Because we do not attempt to hedge motor fuel price risk, a significant increase in motor fuel prices will result in increased transportation costs to us. The price and supply of motor fuel is unpredictable and fluctuates based on events we cannot control, such as geopolitical developments, supply and demand for oil and gas, actions by oil and gas producers, war and unrest in oil-producing countries and regions, regional production patterns and weather concerns. Additionally, we may be affected by increases in the cost of materials used to produce portable propane cylinders. As a result, any increases in these prices may adversely affect our profitability and competitiveness.
Our failure or our counterparties’ failure to perform on obligations under commodity derivative and financial derivative contracts could have a material adverse effect on our financial condition, results of operations and cash flows.
We enter into hedging arrangements to manage the cost of propane in our cylinder exchange business. We also may from time to time enter into derivative instruments to hedge our exposure to variable interest rates. Volatility in the oil and gas commodities sector for an extended period of time or intense volatility in the near-term could impair our or our counterparties’ ability to meet margin calls, which could cause us or our counterparties to default on commodity and financial derivative contracts. This could have a material adverse effect on our liquidity or our ability to procure product supply at prices reasonable to us or at all.
25
We are exposed to the credit risks, and certain other risks, of our key customers and other counterparties.
In connection with the acquisition of certain of our assets, we have entered into agreements pursuant to which various counterparties have agreed to indemnify us, subject to certain limitations, for (i) certain pre-closing environmental liabilities discovered within specified time periods after the date of the applicable acquisition, (ii) certain matters arising from the pre-closing ownership and operation of assets and (iii) ongoing remediation related to the assets. Our business, results of operations, financial condition and our ability to make cash distributions to our unitholders could be adversely affected in the future if these third parties fail to satisfy an indemnification obligation owed to us.
Risks of nonpayment and nonperformance by customers, including producers, are significant considerations in our business. Although we have credit risk management policies and procedures that are designed to mitigate and limit our exposure in this area, there can be no assurance that we have adequately assessed and managed the creditworthiness of our existing or future counterparties, that there will not be an unanticipated deterioration in their creditworthiness or unexpected instances of nonpayment or nonperformance or that they will try to renegotiate contractual terms, all of which could have an adverse impact on our business, results of operations, financial condition and our ability to make cash distributions to our unitholders.
We may be asked by third parties to provide additional credit support for certain of our crude oil purchases.
We rely on letters of credit under our revolving credit facility to purchase crude oil for our supply and logistics business. Any changes in our credit profile could affect the way crude oil suppliers view our ability to make payments and induce them to require additional support for our obligations, such as letters of credit or other forms of security, which would increase our operating costs and impact our ability to purchase crude oil or capitalize on market opportunities. Our business, results of operations, financial condition and our ability to make cash distributions to our unitholders could be adversely affected in the future if third parties require additional credit support from us.
Our construction of new assets may not result in revenue increases and will be subject to regulatory, environmental, political, legal and economic risks, which could adversely affect our results of operations and financial condition.
One of the ways we intend to grow our business is through organic growth projects. The construction of additions or modifications to our existing assets and the construction of new midstream assets involve numerous regulatory, environmental, political, legal and economic uncertainties that are beyond our control. Such expansion projects may also require the expenditure of significant amounts of capital, and financing may not be available on economically acceptable terms or at all. If we undertake these projects, they may not be completed on schedule, at the budgeted cost, or at all. Moreover, our revenue may not increase immediately upon the expenditure of funds on a particular project.
Our growth strategy requires access to new capital. Tightened capital markets or increased competition for investment opportunities could impair our ability to grow.
We continuously consider potential acquisitions and opportunities for organic growth projects. Our ability to fund our capital projects and make acquisitions depends on whether we can access the necessary financing to fund these activities. Any limitations on our access to capital or increase in the cost of that capital could significantly impair our growth strategy. In addition, a variety of factors beyond our control could impact the availability or cost of capital, including domestic or international economic conditions, changes in key benchmark interest rates, the adoption of new or amended banking or capital market laws or regulations, the re-pricing of market risks and volatility in capital and financial markets. Due to these factors, we cannot be certain that funding for our capital needs will be available from bank credit arrangements or the capital markets on acceptable terms. If funding is not available when needed, or is available only on unfavorable terms, we may be unable to implement our growth strategy, enhance our existing business, complete acquisitions and organic growth projects, take advantage of business opportunities or respond to competitive pressures, any of which could have a material adverse effect on our revenues and results of operations.
26
Our business is subject to federal, state and local laws and regulations that govern the product quality specifications of the crude oil and refined products that we gather, store, transport and handle.
The crude oil and refined products that we gather, store, transport and handle are sold by our customers for consumption into the public market. Various federal, state and local agencies have the authority to prescribe specific product quality specifications to commodities sold into the public market. Changes in product quality specifications could reduce our throughput volume, require us to incur additional handling costs or require the expenditure of significant capital. In addition, different product specifications for different markets impact the fungibility of products transported and stored in our refined products terminals and could require the construction of additional facilities to segregate products with different specifications. We may be unable to recover these costs through increased revenues.
We are subject to stringent environmental laws and regulations that may expose us to significant costs and liabilities.
Our operations are subject to stringent and complex federal, state and local environmental laws and regulations that govern the discharge of materials into the environment or otherwise relate to environmental protection. These laws include federal and state laws that impose obligations related to air emissions, regulate the cleanup of hazardous substances that may be or have been released at properties currently or previously owned or operated by us or at locations to which our wastes are or have been transported for disposal, regulate discharges from our facilities into state and federal waters, including wetlands, establish strict liability for releases of oil into waters of the United States, impose requirements for the storage, treatment and disposal of solid and hazardous waste from our facilities, relate to the protection of endangered flora and fauna and impose requirements on the use, storage and disposal of various chemicals and chemical substances at our facilities.
These laws and regulations may impose numerous obligations that are applicable to our operations, including the acquisition of permits to conduct regulated activities, the incurrence of capital or operating expenditures to limit or prevent releases of materials from our facilities, and the imposition of substantial liabilities and remedial obligations for pollution resulting from our operations or at locations currently or previously owned or operated by us. Joint and several strict liability may be incurred, without regard to fault, under certain of these environmental laws and regulations in connection with discharges or releases of hydrocarbon wastes on, under or from our properties and facilities, some of which have been used for midstream activities for a number of years, oftentimes by third parties not under our control. Private parties, including the owners of the facilities where any wastes we generate are taken for reclamation or disposal, may also have the right to pursue legal actions to enforce compliance as well as to seek damages for non-compliance with environmental laws and regulations or for personal injury or property damage. Numerous governmental authorities, such as the Environmental Protection Agency (the “EPA”) and analogous state agencies, have the power to enforce compliance with these laws and regulations and the permits issued under them, oftentimes requiring difficult and costly corrective actions or costly pollution control measures. Failure to comply with these laws, regulations and permits may result in the assessment of administrative, civil and criminal penalties, the imposition of remedial obligations and the issuance of injunctions limiting or preventing some or all of our operations. In addition, we may experience a delay in obtaining or be unable to obtain required permits or regulatory authorizations, which may cause us to lose potential and current customers, interrupt our operations and limit our growth and revenue. More stringent laws and regulations may be adopted in the future. We may not be able to recover all or any of these costs from insurance.
Climate change legislation or regulatory initiatives could result in increased operating costs and reduced demand for the services we provide.
On December 15, 2009, the EPA published its findings that emissions of carbon dioxide, methane and other greenhouse gases (“GHGs”) present an endangerment to public health and the environment because emissions of such gases are contributing to warming of the earth’s atmosphere and other climatic changes. These findings allow the EPA to adopt and implement regulations that restrict emissions of GHGs under existing provisions of the Clean Air Act (“CAA”). Accordingly, the EPA adopted pre-construction and operating permit requirements under the Prevention of Significant Deterioration and Title V programs for certain stationary sources. In addition, the EPA has adopted a mandatory GHG emissions reporting program that imposes reporting and monitoring requirements on various types of facilities and industries. In November 2010, the EPA expanded its GHG reporting rule to include onshore and offshore oil and natural gas production, processing, transmission, storage, and distribution facilities, requiring reporting of GHG
27
emissions from such facilities on an annual basis. In October 2015, the EPA finalized additional amendments to its greenhouse gas reporting rule, which added reporting requirements for additional facilities. And in May 2016, the EPA finalized additional regulations to reduce emissions of methane and volatile organic compounds from the oil and gas sector.
While Congress has from time to time considered legislation to reduce emissions of GHGs, there has not been significant activity in the form of adopted legislation to reduce GHG emissions at the federal level in recent years. In the absence of federal climate legislation in the United States, a number of state and regional efforts have emerged that are aimed at tracking or reducing GHG emissions by means of cap and trade programs that typically require major sources of GHG emissions, such as electric power plants, to acquire and surrender emission allowances in return for emitting those GHGs. In additions, in December 2015, over 190 countries, including the United States, reached an international agreement to address GHG emissions (“Paris Accord”). The Paris Accord entered into force in November 2016 after over 70 countries, including the United States, ratified or otherwise indicated that it intends to comply with the agreement.
Although it is not possible at this time to predict how legislation or new regulations that may be adopted to address GHG emissions would affect our business, any such future laws and regulations could require us to incur increased operating costs, such as costs to purchase and operate emissions control systems, acquire emissions allowances or comply with new regulatory or reporting requirements. Any such legislation or regulatory programs could also increase the cost of consuming, and thereby reduce demand for, oil and gas, which could reduce the demand for crude oil or refined products produced or distributed by our customers, which could in turn reduce revenues we are able to generate by providing services to our customers. Accordingly, legislation and regulatory programs to reduce emissions of GHGs could have an adverse effect on our business, financial condition and results of operations. Also, increasing concentrations of GHGs in the Earth’s atmosphere may produce climate changes that have significant physical effects, such as increased frequency and severity of storms, droughts, floods and other climatic events. If any such effects were to occur, they could have an adverse effect on our financial condition and results of operations.
Our operations are subject to regulation by state and local regulatory authorities. Changes to or additional regulatory measures adopted by such authorities could adversely affect our results of operations and our ability to make cash distributions to unitholders.
Services provided by our gathering systems are subject to ratable-take and common purchaser statutes and complaint-based regulation by state regulatory authorities, such as the Texas Railroad Commission. Ratable-take statutes generally require gatherers to take without undue discrimination crude oil production that may be tendered to the gatherer for handling. Similarly, common purchaser statutes generally require gatherers to purchase without undue discrimination as to source of supply or producer. Complaint-based regulation allows oil producers to file complaints with state regulators in an effort to resolve grievances relating to access to oil gathering pipelines and rate discrimination. These statutes could restrict our right as an owner of gathering facilities to decide with whom we contract to purchase or transport oil.
Our pipelines do not provide interstate transportation services that are subject to regulation by FERC; however, a change in the jurisdictional characterization of our assets, or a change in policy, could result in increased regulation of our assets, which could materially affect our financial condition, results of operations and cash flows and our ability to make cash distributions to our unitholders.
Our crude oil pipeline facilities are not subject to regulation by FERC under the Interstate Commerce Act (the “ICA”) because we do not provide interstate transportation service or have been exempted from FERC regulation. However, if circumstances change as to the use of our pipelines or FERC’s policies, services provided by our facilities could become subject to regulation by FERC under the ICA. Such regulation could decrease revenue, increase operating costs, and, depending upon the facility in question, could adversely affect our results of operations and cash flows. In addition, if any of our facilities were found to have provided services or otherwise operated in violation of the ICA, this could result in the imposition of civil penalties as well as a requirement to disgorge charges collected for such service in excess of the cost-based rate established by the FERC.
28
We may incur significant costs and liabilities as a result of pipeline integrity management program testing and any related pipeline repair or preventative or remedial measures.
The DOT has adopted regulations requiring pipeline operators to develop integrity management programs for transportation pipelines located where a leak or rupture could do the most harm in “high consequence areas.” The regulations require operators to:
|
· |
Perform ongoing assessments of pipeline integrity; |
|
· |
Identify and characterize applicable threats to pipeline segments that could impact a high consequence area; |
|
· |
Improve data collection, integration, and analysis; |
|
· |
Repair and remediate the pipeline, as necessary; and |
|
· |
Implement preventive and mitigation actions. |
The 2011 Pipeline Safety Act, among other things, increased the maximum civil penalty for pipeline safety violations and directed the Secretary of Transportation to promulgate rules or standards relating to expanded integrity management requirements, automatic or remote-controlled valve use, excess flow valve use, leak detection system installation and testing to confirm the material strength of pipe operating above 30% of specified minimum yield strength in high consequence areas. Effective October 25, 2013, the PHMSA adopted new rules increasing the maximum administrative civil penalties for violations of the pipeline safety laws and regulations that occur after January 3, 2012 to $200,000 per violation per day, with a maximum of $2,000,000 for a related series of violations. Should our operations fail to comply with DOT or comparable state regulations, we could be subject to substantial penalties and fines.
PHMSA has also proposed changes to its pipeline safety regulations that would significantly extend the integrity management requirements to previously exempt pipelines and would impose additional obligations on pipeline operators that are already subject to the integrity management requirements. PHMSA’s proposed rule would also require annual reporting of safety-related conditions and incident reports for all gathering lines and gravity lines, including pipelines that are currently exempt from PHMSA regulations. PHMSA has also issued a separate regulatory proposal that would impose pipeline incident prevention and response measures on pipeline operators. The adoption of these and other laws or regulations that apply more comprehensive or stringent safety standards could require us to install new or modified safety controls, pursue new capital projects, or conduct maintenance programs on an accelerated basis, all of which could require us to incur increased operational costs that could be significant. While we cannot predict the outcome of legislative or regulatory initiatives, such legislative and regulatory changes could have a material effect on our cash flow.
Increased regulation of hydraulic fracturing could result in reductions or delays in crude oil, natural gas and NGL production in our areas of operation, which could adversely impact our business and results of operations.
Increased regulation of hydraulic fracturing could result in reductions or delays in crude oil, natural gas and NGL production by our customers, which could materially adversely impact our revenues. Hydraulic fracturing involves the injection of water, sand and chemicals under pressure into geographic formations to stimulate hydrocarbon production. Although we do not engage in hydraulic fracturing activities, an increasing percentage of hydrocarbon production by our customers and suppliers is developed from unconventional sources, such as shales, that require hydraulic fracturing as part of the completion process. Hydraulic fracturing is typically regulated by state oil and gas commissions. Some states, including those in which we operate, have adopted, and other states are considering adopting, regulations that could impose more stringent disclosure and/or well construction requirements on hydraulic fracturing operations. In addition, a number of federal agencies, including the EPA and the Department of Energy, are analyzing, or have been requested to review, a variety of environmental issues associated with hydraulic fracturing, and have asserted federal regulatory authority over the process. In December 2016, the EPA released its final report regarding the potential impacts of hydraulic fracturing on drinking water resources, concluding that “water cycle” activities associated with hydraulic fracturing may impact drinking water resources under certain circumstances such as water withdrawals for
29
fracturing in times or areas of low water availability, surface spills during the management of fracturing fluids, chemicals or produced water, injection of fracturing fluids into wells with inadequate mechanical integrity, injection of fracturing fluids directly into groundwater resources, discharge of inadequately treated fracturing wastewater to surface waters, and disposal or storage of fracturing wastewater in unlined pits. The results of these studies could lead federal and state governments and agencies to develop and implement additional regulations. Moreover, Congress from time to time has proposed legislation to more closely and uniformly regulate hydraulic fracturing at the federal level. If new laws or regulations that significantly restrict hydraulic fracturing are adopted, such laws could make it more difficult or costly for our customers to perform fracturing to stimulate production from tight formations. Restrictions on hydraulic fracturing could also reduce the volume of hydrocarbons that our customers produce, and could thereby adversely affect our revenues and results of operations.
Our business involves many hazards and operational risks, some of which may not be fully covered by insurance. If a significant accident or event occurs for which we are not adequately insured or if we fail to recover all anticipated insurance proceeds for significant accidents or events for which we are insured, our operations and financial results could be adversely affected.
Our operations are subject to all of the risks and hazards inherent in the crude oil transportation and storage, refined products terminals and storage and NGL distribution and sales industries, including:
|
· |
damage to our facilities, vehicles and equipment caused by hurricanes, tornadoes, floods, fires and other natural disasters, acts of terrorism and actions by third parties; |
|
· |
inadvertent damage from construction, vehicles, farm and utility equipment; |
|
· |
leaks of crude oil, NGLs and other hydrocarbons or losses of crude oil or NGLs as a result of the malfunction of equipment or facilities; |
|
· |
ruptures, fires and explosions; and |
|
· |
other hazards that could also result in personal injury, loss of life, pollution or suspension of operations. |
These risks could result in substantial losses due to personal injury and/or loss of life, severe damage to and destruction of property and equipment and pollution or other environmental damage. These risks may also result in curtailment or suspension of our operations. A natural disaster or other hazard affecting the areas in which we operate could have a material adverse effect on our operations. We are not fully insured against all risks inherent in our business. For example our business interruption/loss of income insurance provides limited coverage in the event of damage to any of our underground storage tanks. In addition, although we are insured for environmental pollution resulting from certain environmental incidents, we may not be insured against all environmental incidents that might occur, some of which may result in toxic tort claims. If a significant incident occurs for which we are not fully insured, it could adversely affect our operations and financial condition. Furthermore, we may not be able to maintain or obtain insurance of the type and amount we desire at reasonable rates.
We are subject to litigation risks that could adversely affect our operating results to the extent not covered by insurance.
Our operations are subject to all operating hazards and risks normally associated with handling, storing and delivering combustible liquids such as NGLs, refined products and crude oil. We have been, and are likely to continue to be, a defendant in various legal proceedings and litigation arising in the ordinary course of business, both as a result of these operating hazards and risks and as a result of other aspects of our business. We are self-insured for general and product, workers’ compensation and automobile liabilities up to predetermined amounts above which third-party insurance applies. We cannot guarantee that our insurance will be adequate to protect us from all material expenses related to potential future claims for personal injury and property damage or that these levels of insurance will be available at economical prices, or that all legal matters that arise will be covered by our insurance programs.
30
Cyber-attacks and threats could have a material adverse effect on our operations.
Cyber-attacks may significantly affect our operations and those of our customers. Strategic targets, such as energy-related assets, may be at greater risk of future attacks than other targets in the United States. We do not maintain specialized insurance for possible liability resulting from a cyber-attack on our assets that may shut down all or part of our business. We currently are implementing our own cyber security programs and protocols; however, we cannot guarantee their effectiveness. A significant cyber-attack could have a material adverse effect on our operations or those of our customers.
The risk of terrorism, political unrest and hostilities in the Middle East or other energy producing regions may adversely affect the economy and our business.
Terrorist attacks, political unrest and hostilities in the Middle East or other energy producing regions may adversely impact the price and availability of crude oil, refined products and NGLs, as well as our results of operations, our ability to raise capital and our future growth. The impact that the foregoing may have on our industry in general, and on us in particular, is not known at this time. An act of terror could result in disruptions of crude oil and NGL supplies and markets, and our infrastructure or facilities could be direct or indirect targets. Terrorist activity may also hinder our ability to gather and transport crude oil, refined products and NGLs if our means of transportation become damaged as a result of an attack.
Derivatives legislation adopted by Congress and rules and regulations promulgated thereunder by the CFTC could have an adverse impact on our ability to hedge risks associated with our business.
The Dodd-Frank Act was signed into law in 2010 and regulates derivative and commodity transactions, which include certain instruments used in our risk management activities. The Dodd-Frank Act requires the Commodity Futures Trading Commission (the “CFTC”), the SEC and other regulators to promulgate rules and regulations implementing the legislation. Although the CFTC has finalized most of its regulations under the Dodd-Frank Act, it continues to review and refine its initial rulemakings through additional interpretations and supplemental rulemakings. As a result, it is not possible at this time to predict the ultimate effect of the rules and regulations on our business and while most of the regulations have been adopted, any new regulations or modifications to existing regulations may increase the cost of derivative contracts, limit the availability of derivatives to protect against risks that we encounter, reduce our ability to monetize or restructure our existing derivative contracts, and increase our exposure to less creditworthy counterparties. If we reduce our use of derivatives as a result of the Dodd-Frank Act and the regulations thereunder, our results of operations may become more volatile and our cash flows may be less predictable, which could adversely affect our ability to plan for and fund capital expenditures.
In December 2016, the CFTC re-proposed new rules that would place federal limits on positions in certain core futures and equivalent swaps contracts for or linked to certain physical commodities, subject to exceptions for certain bona fide hedging transactions and finalized a companion rule on aggregation of positions among entities under common ownership or control. If finalized, the position limits rule may have an impact on our ability to hedge our exposure to certain enumerated commodities.
The CFTC has designated certain interest rate swaps and credit default swaps for mandatory clearing and mandatory trading on designated contract markets or swap execution facilities. The CFTC may designate additional classes of swaps as subject to the mandatory clearing requirement in the future, but has not yet proposed rules designating any other classes of swaps, including physical commodity swaps, for mandatory clearing. The CFTC and prudential banking regulators also adopted mandatory margin requirements on uncleared swaps between swap dealers and certain other counterparties. The margin requirements are currently effective with respect to certain market participants and will be phased in over time with respect to other market participants, based on the level of an entity’s swaps activity. We expect to qualify for and rely upon an end-user exception from the mandatory clearing and trade execution requirements for swaps entered to hedge our commercial risks. We will also qualify for an exception from the uncleared swaps margin requirements. However, the application of the mandatory clearing and trade execution requirements and the uncleared swaps margin requirement to other market participants, such as swap dealers, may adversely affect the cost and availability of the swaps that we use for hedging.
31
Finally, under the Dodd-Frank Act, the CFTC is also directed generally to prevent price manipulation and fraud in physical commodities markets traded in interstate commerce, including physical energy and other commodities, as well as financial instruments, such as futures, options and swaps. The CFTC has adopted additional anti-market manipulation, anti-fraud and disruptive trading practices regulations that prohibit, among other things, fraud and price manipulation in the physical commodities, futures, options and swaps markets. Should we violate the laws regulating our hedging activities, we could be subject to CFTC enforcement action and material penalties and sanctions.
Our ability to operate our business effectively could be impaired if we fail to attract and retain key management personnel and employees.
Our ability to operate our business and implement our strategies will depend on our continued ability to attract and retain highly skilled management personnel with energy industry experience. Competition for these persons in the energy industry is intense. Additionally, given our size, we may be at a disadvantage, relative to our larger competitors, in the competition to attract and retain such personnel. We may not be able to continue to employ our senior executives and key personnel or attract and retain qualified personnel in the future, and our failure to retain or attract senior executives and key personnel could have a material adverse effect on our ability to effectively operate our business.
The amount of cash we have available for distribution to holders of our common and subordinated units depends primarily on our cash flow rather than on our profitability, which may prevent us from making distributions, even during periods in which we record net income.
The amount of cash we have available for distribution depends primarily upon our cash flow and not solely on our profitability, which will be affected by non-cash items. As a result, we may make cash distributions during periods when we record losses for financial accounting purposes and may not make cash distributions during periods when we record net income for financial accounting purposes.
Risks Inherent in an Investment in Us
Affiliates of our general partner, including Lonestar and ArcLight, may compete with us, and neither our general partner nor its affiliates have any obligation to present business opportunities to us.
Neither our partnership agreement nor any other agreement will prohibit affiliates of our general partner, including Lonestar and ArcLight, from owning assets or engaging in businesses that compete directly or indirectly with us. For example, ArcLight Fund V is the majority owner of the general partners of other publicly traded master limited partnerships in the midstream segment of the energy industry, which may compete with us in the future. In addition, Lonestar, ArcLight and other affiliates of our general partner may acquire, construct or dispose of midstream assets in the future without any obligation to offer us the opportunity to purchase any of those assets. As a result, competition from affiliates of our general partner, including Lonestar and ArcLight, could materially adversely impact our results of operations and distributable cash flow.
We have no legal obligation to make quarterly cash distributions, and our general partner has considerable discretion to establish cash reserves that would reduce the amount of available cash we distribute to unitholders.
Generally, our available cash is comprised of cash on hand at the end of a quarter plus cash on hand resulting from any working capital borrowings made after the end of the quarter less cash reserves established by our general partner. Our general partner has considerable discretion to establish cash reserves, which would result in a reduction in the amount of available cash we distribute to unitholders. Accordingly, there is no guarantee that we will make quarterly cash distributions to our unitholders, and we have no legal obligation to do so.
32
Unitholders may have to repay distributions that were wrongfully distributed to them.
Under certain circumstances, unitholders may have to repay amounts wrongfully distributed to them. Under Section 17-607 of the Delaware Revised Uniform Limited Partnership Act (the “Delaware Act”), we may not make a distribution to you if the distribution would cause our liabilities to exceed the fair value of our assets. Delaware law provides that for a period of three years from the date of the impermissible distribution, limited partners who received an impermissible distribution and who knew at the time of the distribution that it violated Delaware law will be liable to the limited partnership for the distribution amount. Transferees of common units are liable for the obligations of the transferor to make contributions to the partnership that are known to the transferee at the time of the transfer and for unknown obligations if the liabilities could be determined from our partnership agreement. Liabilities to partners on account of their partnership interest and liabilities that are non-recourse to the partnership are not counted for purposes of determining whether a distribution is permitted.
Tax Risks
Our tax treatment depends on our status as a partnership for U.S. federal income tax purposes. If the Internal Revenue Service (“IRS”) were to treat us as a corporation for U.S. federal income tax purposes, which would subject us to entity-level taxation, or if we were otherwise subjected to a material amount of additional entity-level taxation, then our distributable cash flow to our unitholders would be substantially reduced.
The anticipated after-tax economic benefit of an investment in our common units depends largely on our being treated as a partnership for U.S. federal income tax purposes. We have not requested a ruling from the IRS on this matter. Despite the fact that we are a limited partnership under Delaware law, it is possible in certain circumstances for a partnership such as ours to be treated as a corporation for U.S. federal income tax purposes. A change in our business, a change in current law or our failure to satisfy the requirements for partnership treatment under the Internal Revenue Code of 1986, as amended (the “Code”) could cause us to be treated as a corporation for U.S. federal income tax purposes or otherwise subject us to taxation as an entity.
If we were treated as a corporation for U.S. federal income tax purposes, we would pay federal income tax on our taxable income at the corporate tax rate, which is currently a maximum of 35.0%, and would likely pay state and local income tax at varying rates. Distributions would generally be taxed again as corporate dividends (to the extent of our current and accumulated earnings and profits), and no income, gains, losses, deductions or credits would flow through to you. In addition, changes in current state law may subject us to additional entity-level taxation by individual states. Several states have subjected, or are evaluating ways to subject, partnerships to entity-level taxation through the imposition of state income, franchise and other forms of taxation. Imposition of any such taxes may substantially reduce the cash available for distribution to you. Therefore, if we were treated as a corporation for U.S. federal income tax purposes or otherwise subjected to a material amount of entity-level taxation, there would be a material reduction in the anticipated cash flow and after-tax return to our unitholders, likely causing a substantial reduction in the value of our common units.
The tax treatment of publicly traded partnerships or an investment in our common units could be subject to potential legislative, judicial or administrative changes and differing interpretations, possibly on a retroactive basis.
The present U.S. federal income tax treatment of publicly traded partnerships, including us, or an investment in our common units may be modified by administrative, legislative or judicial interpretation at any time. For example, members of Congress have periodically considered substantive changes to the existing U.S. federal income tax laws that affect publicly traded partnerships, including the elimination of the qualifying income exception upon which we rely for our treatment as a partnership for U.S. federal income tax purposes. In addition, recent regulatory developments surrounding the qualifying income exception may impact our treatment as a partnership for U.S. federal income tax purposes. The U.S. Department of Treasury and the IRS have published final regulations regarding "qualifying income" under Section 7704(d)(1)(E) of the Code (the “Final Regulations”). The Final Regulations provide a list of industry-specific activities and certain limited support activities that generate qualifying income, which includes the retail sale of propane. The impact on the Final Regulations of a regulatory freeze imposed by the incoming administration in a January 20, 2017 White House memorandum (the “Regulatory Freeze Memorandum”) is not immediately clear. Should the Final Regulations be withdrawn or otherwise deemed inapplicable, we may have to rely on other guidance to
33
determine if we satisfy the qualifying income exception. The U.S. Department of Treasury and the IRS have previously issued proposed regulations regarding qualifying income (the “Proposed Regulations”). Although the Proposed Regulations adopt a narrow interpretation of the activities that generate qualifying income and do not specifically address retail sales of propane, we believe the income that we treat as qualifying income also satisfies the qualifying income requirements under the Proposed Regulations. Because the Proposed Regulations are not binding on the IRS and the impact of the Regulatory Freeze Memorandum remains unclear, it is possible that future guidance could take a position that is contrary to our interpretation of Section 7704 of the Code. If such future guidance were to treat any portion of our income we treat as qualifying income as non-qualifying income, we anticipate being able to treat that income as qualifying income for ten years under special transition rules provided in the Proposed Regulations.
Any modification to the U.S. federal income tax laws and interpretations thereof may or may not be retroactively applied and could make it more difficult or impossible for us to be treated as a partnership for U.S. federal income tax purposes. We are unable to predict whether any of these changes or other proposals will ultimately be enacted. However, it is possible that a change in law could affect us, and any such changes could negatively impact the value of an investment in our common units.
Our unitholders’ share of our income is taxable to them for U.S. federal income tax purposes even if they do not receive any cash distributions from us.
Because a unitholder is treated as a partner to whom we allocate taxable income that could be different in amount than the cash we distribute, a unitholder’s allocable share of our taxable income is taxable to it, which may require the payment of federal income taxes and, in some cases, state and local income taxes, on its share of our taxable income even if it receives no cash distributions from us. Our unitholders may not receive cash distributions from us equal to their share of our taxable income or even equal to the actual tax liability that results from that income.
If the IRS contests the U.S. federal income tax positions we take, the market for our common units may be adversely impacted and the cost of any IRS contest will reduce our cash available for distribution to our unitholders.
We have not requested a ruling from the IRS with respect to our treatment as a partnership for U.S. federal income tax purposes. The IRS may adopt positions that differ from the positions we take, and the IRS’s positions may ultimately be sustained. It may be necessary to resort to administrative or court proceedings to sustain some or all of the positions we take and such positions may not ultimately be sustained. A court may not agree with some or all of the positions we take. Any contest with the IRS, and the outcome of any IRS contest, may have a materially adverse impact on the market for our common units and the price at which they trade. In addition, our costs connected to any contest with the IRS will be borne indirectly by our unitholders (including holders of our subordinated units), because the costs will reduce our distributable cash flow.
If the IRS makes audit adjustments to our income tax returns for tax years beginning after December 31, 2017, it may assess and collect any taxes (including any applicable penalties and interest) resulting from such audit adjustment directly from us, in which case our cash available for distribution to our unitholders might be substantially reduced.
Pursuant to the Bipartisan Budget Act of 2015, for tax years beginning after December 31, 2017, if the IRS makes audit adjustments to our income tax returns, it may assess and collect any taxes (including any applicable penalties and interest) resulting from such audit adjustment directly from us. Generally, we expect to elect to have our general partner and our unitholders take such audit adjustment into account in accordance with their interests in us during the tax year under audit, but there can be no assurance that such election will be effective in all circumstances. If we are unable to have our general partner and our unitholders take such audit adjustment into account in accordance with their interests in us during the tax year under audit, our current unitholders may bear some or all of the tax liability resulting from such audit adjustment, even if such unitholders did not own units in us during the tax year under audit. If, as a result of any such audit adjustment, we are required to make payments of taxes, penalties and interest, our cash available for distribution to our unitholders might be substantially reduced. These rules are not applicable to us for tax years beginning on or prior to December 31, 2017.
34
Tax gain or loss on the disposition of our common units could be more or less than expected.
If our unitholders sell common units, they will recognize a gain or loss for U.S. federal income tax purposes equal to the difference between the amount realized and their tax basis in those common units. Because distributions in excess of their allocable share of our net taxable income decrease their tax basis in their common units, the amount, if any, of such prior excess distributions with respect to the common units a unitholder sells will, in effect, become taxable income to the unitholder if it sells such common units at a price greater than its tax basis in those common units, even if the price received is less than its original cost. Furthermore, a substantial portion of the amount realized on any sale of common units, whether or not representing gain, may be taxed as ordinary income due to potential recapture items, including depreciation recapture. In addition, because the amount realized includes a unitholder’s share of our nonrecourse liabilities, a unitholder that sells common units may incur a tax liability in excess of the amount of cash received from the sale.
Tax-exempt entities and non-United States persons face unique tax issues from owning our common units that may result in adverse tax consequences to them.
An investment in our common units by tax-exempt entities, such as employee benefit plans and individual retirement accounts (known as IRAs), and non-United States persons raises issues unique to them. For example, virtually all of our income allocated to organizations that are exempt from federal income tax, including IRAs and other retirement plans, is unrelated business taxable income and is taxable to them. Distributions to non-United States persons are reduced by withholding taxes at the highest applicable effective tax rate, and non-United States persons are required to file federal income tax returns and pay tax on their share of our taxable income. If you are a tax-exempt entity or a non-United States person, you should consult a tax advisor before investing in our common units.
We treat each purchaser of our common units as having the same tax benefits without regard to the actual common units purchased. The IRS may challenge this treatment, which could adversely affect the value of our common units.
Because, among other reasons, we cannot match transferors and transferees of common units, we adopt depreciation and amortization positions that may not conform to all aspects of existing regulations promulgated under the Code by the U.S. Department of Treasury and the IRS (“Treasury Regulations”). A successful IRS challenge to those positions could adversely affect the amount of tax benefits available to you. It also could affect the timing of these tax benefits or the amount of gain from your sale of common units and could have a negative impact on the value of our common units or result in audit adjustments to your tax returns.
We prorate our items of income, gain, loss and deduction for U.S. federal income tax purposes between transferors and transferees of our units each month based upon the ownership of our units on the first business day of each month, instead of on the basis of the date a particular unit is transferred. The IRS may challenge aspects of our proration method, which could change the allocation of items of income, gain, loss and deduction among our unitholders.
We prorate our items of income, gain, loss and deduction between transferors and transferees of our units each month based upon the ownership of our units on the first business day of each month, instead of on the basis of the date a particular unit is transferred. The U.S. Department of Treasury and the IRS have issued Treasury Regulations that permit publicly traded partnerships to use a similar monthly simplifying convention, but these Treasury Regulations do not specifically authorize all aspects of our proration method. If the IRS were to successfully challenge this method, we could be required to change the allocation of items of income, gain, loss and deduction among our unitholders.
A unitholder whose common units are loaned to a “short seller” to effect a short sale of common units may be considered as having disposed of those common units. If so, he would no longer be treated for U.S. federal income tax purposes as a partner with respect to those common units during the period of the loan and may recognize gain or loss from the disposition.
Because a unitholder whose common units are loaned to a “short seller” to effect a short sale of common units may be considered as having disposed of the loaned common units, he may no longer be treated for U.S. federal income
35
tax purposes as a partner with respect to those common units during the period of the loan to the short seller and the unitholder may recognize gain or loss from such disposition. Moreover, during the period of the loan to the short seller, any of our income, gain, loss or deduction with respect to those common units may not be reportable by the unitholder and any cash distributions received by the unitholder as to those common units could be fully taxable as ordinary income. Unitholders desiring to assure their status as partners and avoid the risk of gain recognition from a loan to a short seller are urged to consult a tax advisor to discuss whether it is advisable to modify any applicable brokerage account agreements to prohibit their brokers from loaning their common units.
We have adopted certain valuation methodologies in determining a unitholder’s allocations of income, gain, loss and deduction. The IRS may challenge these methodologies or the resulting allocations, and such a challenge could adversely affect the value of our common units.
In determining the items of income, gain, loss and deduction allocable to our unitholders, in certain circumstances, including when we issue additional units, we must determine the fair market value of our assets. Although we may from time to time consult with professional appraisers regarding valuation matters, we make many fair market value estimates using a methodology based on the market value of our common units as a means to measure the fair market value of our assets. The IRS may challenge these valuation methods and the resulting allocations of income, gain, loss and deduction.
A successful IRS challenge to these methods or allocations could adversely affect the amount, character and timing of taxable income or loss allocated to our unitholders. It also could affect the amount of gain from our unitholders’ sale of common units and could have a negative impact on the value of our common units or result in audit adjustments to our unitholders’ tax returns without the benefit of additional deductions.
The sale or exchange of 50.0% or more of our capital and profits interests during any twelve-month period will result in the termination of our partnership for U.S. federal income tax purposes.
We will be considered to have technically terminated our partnership for U.S. federal income tax purposes if there is a sale or exchange of 50.0% or more of the total interests in our capital and profits within a twelve-month period. For purposes of determining whether this 50.0% threshold has been met, multiple sales of the same interest will be counted only once. Our technical termination would, among other things, result in the closing of our taxable year for all unitholders, which would result in us filing two tax returns (and our unitholders could receive two Schedules K-1 if relief was not available, as described below) for one fiscal year and could result in a deferral of depreciation deductions allowable in computing our taxable income. In the case of a unitholder reporting on a taxable year other than a fiscal year ending December 31, the closing of our taxable year may also result in more than twelve months of our taxable income or loss being includable in his taxable income for the year of termination. Our termination currently would not affect our classification as a partnership for U.S. federal income tax purposes, but instead we would be treated as a new partnership for U.S. federal income tax purposes. If treated as a new partnership, we must make new tax elections, including a new election under Section 754 of the Code, and we could be subject to penalties if we are unable to determine that a termination occurred. The IRS administers a publicly traded partnership technical termination relief program whereby, if a publicly traded partnership that technically terminated requests publicly traded partnership technical termination relief and such relief is granted by the IRS, among other things, the partnership will only have to provide one Schedule K-1 to unitholders for the year notwithstanding two partnership tax years.
As a result of investing in our common units, you may become subject to state and local taxes and return filing requirements in jurisdictions where we operate or own or acquire properties.
In addition to U.S. federal income taxes, our unitholders are likely subject to other taxes, including state and local taxes, unincorporated business taxes and estate, inheritance or intangible taxes that are imposed by the various jurisdictions in which we conduct business or control property now or in the future, even if they do not live in any of those jurisdictions. Our unitholders are likely required to file state and local income tax returns and pay state and local income taxes in some or all of these various jurisdictions. Further, our unitholders may be subject to penalties for failure to comply with those requirements. We conduct business in every state in the continental United States. Many of these states currently impose a personal income tax on individuals. As we make acquisitions or expand our business, we may
36
control assets or conduct business in additional states that impose a personal income tax. It is your responsibility to file all federal, state and local tax returns.
Risks Related to the AMID Merger
The failure to integrate successfully our business and AMID’s business in the expected timeframe would adversely affect the combined company’s future.
The AMID merger involved the integration of two companies that currently operate independently. The success of the AMID merger will depend—in large part—on the ability of the combined company to realize the anticipated benefits, including cost savings, innovation and operational efficiencies, from combining our business with AMID’s business. To realize these anticipated benefits, our business and AMID’s business must be successfully integrated. This integration will be complex and time-consuming. The failure to integrate successfully and to manage successfully the challenges presented by the integration process may result in the combined company not achieving the anticipated benefits of the AMID merger.
Potential difficulties that may be encountered in the integration process include the following:
|
· |
integrating our business and AMID’s business in a manner that permits the combined company to achieve the full benefit of synergies, cost savings and operational efficiencies that are anticipated to result from the AMID merger; |
|
· |
our funds available for operations, future business opportunities and cash distributions to our unitholders will be reduced by that portion of our cash flow required to make interest payments on our debt; |
|
· |
complexities associated with managing the larger, more complex combined business; |
|
· |
complexities associated with integrating the workforces of the two companies; |
|
· |
potential unknown liabilities and unforeseen expenses, delays or regulatory conditions associated with the AMID merger, including one-time cash costs to integrate the two companies that may exceed the anticipated range of such one-time cash costs that we and AMID estimated as of the date of execution of the merger agreement; difficulty or inability to refinance the debt of the combined company or comply with the covenants thereof; |
|
· |
performance shortfalls at one or both of the companies as a result of the diversion of management’s attention caused by completing the AMID merger and integrating the companies’ operations; and |
|
· |
the disruption of, or the loss of momentum in, each company’s ongoing business or inconsistencies in standards, controls, systems, procedures and policies. |
Any of these difficulties in successfully integrating our business and AMID’s business, or any delays in the integration process, could adversely affect the combined company’s ability to achieve the anticipated benefits of the AMID merger and could adversely affect the combined company’s business, financial results, financial condition and unit price. Even if the combined company is able to integrate our business operations and AMID’s business operations successfully, there can be no assurance that this integration will result in the realization of the full benefits of synergies, cost savings, innovation and operational efficiencies that we and AMID currently expect from this integration or that these benefits will be achieved within the anticipated time frame.
The future results of the combined company will suffer if the combined company does not effectively manage its expanded operations.
The size of the business of the combined company has increased significantly beyond the pre-merger size of either our business or AMID’s business. The combined company’s future success depends, in part, upon its ability to manage this expanded business, which will pose substantial challenges for management, including challenges related to the management and monitoring of new operations and associated increased costs and complexity. There can be no assurances that the combined company will be successful or that it will realize the expected operating efficiencies, cost savings, revenue enhancements and other benefits currently anticipated from the AMID merger.
37
ITEM 1B. UNRESOLVED STAFF COMMENTS.
None.
We believe that we have satisfactory title to all of the assets that we own. Although title to these properties is subject to encumbrances in some cases, such as customary interests generally retained in connection with the acquisition of real property, liens that can be imposed in some jurisdictions for government-initiated action to clean up environmental contamination, liens for current taxes and other burdens and easements, restrictions and other encumbrances to which the underlying properties were subject at the time of acquisition by us, we believe that none of these burdens should materially detract from the value of these properties or from our interest in these properties or should materially interfere with their use in the operation of our business.
Our general partner maintains its headquarters in Irving, Texas. We also have regional offices located in Houston, Texas, Tulsa, Oklahoma and Gurnee, Illinois. The current lease of our general partner’s headquarters expires in 2020. We believe that our existing facilities are adequate to meet our needs for the immediate future and that additional facilities will be available on commercially reasonable terms as needed.
The information required for this item is provided in “Note 15 — Commitments and Contingencies” included in our audited consolidated financial statements in Part IV, Item 15 of this report, which is incorporated herein by reference.
ITEM 4. MINE SAFETY DISCLOSURES.
None.
ITEM 5. MARKET FOR REGISTRANT’S COMMON EQUITY, RELATED UNITHOLDER MATTERS AND
ISSUER PURCHASES OF EQUITY SECURITIES.
Market Information
Our common limited partner units are traded on the New York Stock Exchange (“NYSE”) under the symbol “JPEP.” Initial trading of our common units commenced on October 2, 2014. The AMID Merger closed on March 8, 2017, and our units will be delisted from the NYSE.
38
The following table sets forth the quarterly high and low sales prices per common unit, as reported by the NYSE, and the quarterly cash distributions for the indicated period:
|
|
|
Price Range |
|
Distribution per |
|
|||||
|
Quarterly Period |
|
High |
|
Low |
|
common unit |
|
|||
|
|
|
|
|
|
|
|
|
|
|
|
|
2016 |
|
|
|
|
|
|
|
|
|
|
|
Fourth Quarter |
|
$ |
10.19 |
|
$ |
7.16 |
|
$ |
0.3250 |
|
|
Third Quarter |
|
|
10.08 |
|
|
6.49 |
|
|
0.3250 |
|
|
Second Quarter |
|
|
8.96 |
|
|
4.88 |
|
|
0.3250 |
|
|
First Quarter |
|
|
6.17 |
|
|
1.89 |
|
|
0.3250 |
|
|
2015 |
|
|
|
|
|
|
|
|
|
|
|
Fourth Quarter |
|
$ |
8.95 |
|
$ |
3.91 |
|
$ |
0.3250 |
|
|
Third Quarter |
|
|
13.94 |
|
|
5.25 |
|
|
0.3250 |
|
|
Second Quarter |
|
|
15.00 |
|
|
10.75 |
|
|
0.3250 |
|
|
First Quarter |
|
|
15.52 |
|
|
10.75 |
|
|
0.3250 |
|
Holders
As of February 27, 2017, the market price for our common units was $8.93 per unit and there were approximately 61 unitholders of record of our common units. There are 76 unitholders of record of our subordinated units. There is no established public trading market for our subordinated units. The AMID Merger closed on March 8, 2017, at which time all of our common and subordinated units converted into AMID Common Units. See Item 1—Business—AMID Merger Agreement for more details.
Securities Authorized for Issuance under Equity Compensation Plans
For information regarding our Equity Compensation Plan, please read “Item 12—Security Ownership of Certain Beneficial Owners and Management and Related Unitholder Matters,” which is incorporated by reference into this Item 5.
Recent Sales of Unregistered Securities
The information required for this item is provided in “Note 5 – Acquisitions and Dispositions”, included in our audited consolidated financial statements in Part IV, Item 15 of this report.
Issuer Purchases of Equity Securities
The following table summarizes our repurchases of equity securities during the three months ended December 31, 2016:
|
Period |
|
Total number of units withheld (1) |
|
Average price per unit |
|
Total number of units purchased as part of publicly announced plans |
|
Maximum number of units that may yet be purchased under the plan |
|
||||
|
October 1, 2016 - October 31, 2016 |
|
|
— |
|
$ |
— |
|
|
— |
|
|
— |
|
|
November 1, 2016 - November 30, 2016 |
|
|
92 |
|
|
7.63 |
|
|
— |
|
|
— |
|
|
December 1, 2016 - December 31, 2016 |
|
|
609 |
|
|
8.72 |
|
|
— |
|
|
— |
|
|
(1) |
Represents units withheld to satisfy employees’ tax withholding obligations in connection with vesting of phantom units during the period. |
39
Unitholder Return Performance Graph
The following performance graph and related information shall not be deemed “soliciting material” or “filed” with the SEC, nor shall such information be incorporated by reference into any future filings under the Securities Act of 1933, as amended (the “Securities Act”) or the Securities Exchange Act of 1934, as amended (the “Exchange Act”), except to the extent we specifically incorporate it by reference into such filing.
The following performance graph compares the cumulative total unitholder return on our common units as traded on the NYSE with the Standard & Poor’s 500 Stock Index (the “S&P 500”), and the Alerian MLP Index (“MLP Index”). It is assumed that (i) $100 was invested in our common units at $19.11 per unit (the closing price at the end of our first trading day), the S&P 500, and the MLP Index on October 2, 2014 (our first day of trading) and (ii) distributions were reinvested on the relevant payment dates. The following performance graph is historical and not necessarily indicative of future price performance.
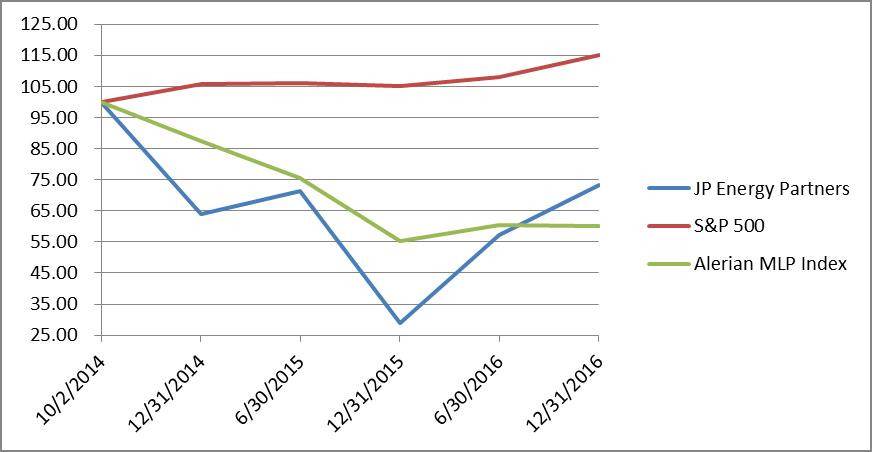
|
|
|
10/2/2014 |
|
12/31/2014 |
|
6/30/2015 |
|
12/31/2015 |
|
6/30/2016 |
|
12/31/2016 |
||||||
|
JP Energy Partners |
|
$ |
100.00 |
|
$ |
64.00 |
|
$ |
71.29 |
|
$ |
28.91 |
|
$ |
57.14 |
|
$ |
73.24 |
|
S&P 500 |
|
|
100.00 |
|
|
105.79 |
|
|
106.01 |
|
|
105.02 |
|
|
107.85 |
|
|
115.04 |
|
Alerian MLP Index |
|
|
100.00 |
|
|
87.43 |
|
|
75.54 |
|
|
55.15 |
|
|
60.53 |
|
|
60.16 |
ITEM 6. SELECTED FINANCIAL DATA.
The table set forth below presents, as of the dates and for the periods indicated, our selected historical consolidated financial and operating data. The historical financial data presented as of December 31, 2016, 2015, 2014, 2013 and 2012 and for the years ended December 31, 2016, 2015, 2014, 2013 and 2012 have been derived from our audited historical consolidated financial statements.
The following table should be read in conjunction with “Item 7. Management’s Discussion and Analysis of Financial Condition and Results of Operations” and our audited consolidated financial statements included elsewhere in this document.
40
The following table presents Adjusted EBITDA and adjusted gross margin, financial measures that are not presented in accordance with generally accepted accounting principles in the United States (“GAAP”). For a discussion of how we derive these measures and a reconciliation of Adjusted EBITDA and adjusted gross margin to their most directly comparable financial measures calculated in accordance with GAAP and a discussion of how we use Adjusted EBITDA and adjusted gross margin to evaluate our operating performance, please read “Item 7. Management’s Discussion and Analysis of Financial Condition and Results of Operations — How We Evaluate Our Operations — Adjusted EBITDA and adjusted gross margin.”
41
|
|
|
Year Ended December 31, |
|
|||||||||||||
|
|
|
2016 |
|
2015 |
|
2014 |
|
2013 |
|
2012 |
|
|||||
|
|
|
($ in thousands, except unit data) |
|
|||||||||||||
|
Statement of Operations Data: |
|
|
|
|
|
|
|
|
|
|
|
|
|
|
|
|
|
Total revenue |
|
$ |
493,960 |
|
$ |
680,585 |
|
$ |
726,154 |
|
$ |
390,869 |
|
$ |
204,391 |
|
|
Costs and expenses: |
|
|
|
|
|
|
|
|
|
|
|
|
|
|
|
|
|
Cost of sales, excluding depreciation and amortization |
|
|
350,187 |
|
|
527,476 |
|
|
605,682 |
|
$ |
276,804 |
|
|
151,478 |
|
|
Operating expense |
|
|
64,137 |
|
|
69,377 |
|
|
65,584 |
|
|
57,728 |
|
|
26,292 |
|
|
General and administrative |
|
|
42,581 |
|
|
45,383 |
|
|
46,362 |
|
|
44,488 |
|
|
20,785 |
|
|
Depreciation and amortization |
|
|
47,151 |
|
|
46,852 |
|
|
40,230 |
|
|
30,987 |
|
|
12,941 |
|
|
Goodwill impairment |
|
|
15,456 |
|
|
29,896 |
|
|
— |
|
|
— |
|
|
— |
|
|
Loss on disposal of assets, net |
|
|
2,569 |
|
|
909 |
|
|
1,137 |
|
|
1,492 |
|
|
1,142 |
|
|
Operating loss |
|
|
(28,121) |
|
|
(39,308) |
|
|
(32,841) |
|
|
(20,630) |
|
|
(8,247) |
|
|
Other income (expense): |
|
|
|
|
|
|
|
|
|
|
|
|
|
|
|
|
|
Interest expense |
|
|
(5,970) |
|
|
(5,375) |
|
|
(8,981) |
|
|
(8,245) |
|
|
(3,249) |
|
|
Loss on extinguishment of debt |
|
|
— |
|
|
— |
|
|
(1,634) |
|
|
— |
|
|
(497) |
|
|
Other income, net |
|
|
628 |
|
|
1,732 |
|
|
8 |
|
|
887 |
|
|
320 |
|
|
Loss from continuing operations before income taxes |
|
|
(33,463) |
|
|
(42,951) |
|
|
(43,448) |
|
|
(27,988) |
|
|
(11,673) |
|
|
Income tax expense |
|
|
(521) |
|
|
(754) |
|
|
(300) |
|
|
(208) |
|
|
(222) |
|
|
Net loss from continuing operations |
|
|
(33,984) |
|
|
(43,705) |
|
|
(43,748) |
|
|
(28,196) |
|
|
(11,895) |
|
|
Net income (loss) from discontinued operations (1) |
|
|
(539) |
|
|
(14,951) |
|
|
(9,275) |
|
|
13,975 |
|
|
3,507 |
|
|
Net loss |
|
$ |
(34,523) |
|
$ |
(58,656) |
|
$ |
(53,023) |
|
$ |
(14,221) |
|
$ |
(8,388) |
|
|
Net loss attributable to the period from January 1, 2014 to October 1, 2014 |
|
|
— |
|
|
— |
|
|
34,407 |
|
|
|
|
|
|
|
|
Net loss attributable to limited partners |
|
$ |
(34,523) |
|
$ |
(58,656) |
|
$ |
(18,616) |
|
|
|
|
|
|
|
|
Basic and diluted net loss from continuing operations per common unit |
|
$ |
(0.92) |
|
$ |
(1.19) |
|
|
(0.52) |
|
|
|
|
|
|
|
|
Basic and diluted net loss per common unit |
|
|
(0.93) |
|
|
(1.60) |
|
|
(0.51) |
|
|
|
|
|
|
|
|
Basic and diluted net loss from continuing operations per subordinated unit |
|
|
(0.94) |
|
|
(1.20) |
|
|
(0.52) |
|
|
|
|
|
|
|
|
Basic and diluted net loss per subordinated unit |
|
|
(0.95) |
|
|
(1.61) |
|
|
(0.51) |
|
|
|
|
|
|
|
|
Distributions declared per common and subordinated unit |
|
|
1.300 |
|
|
1.279 |
|
|
— |
|
|
|
|
|
|
|
|
|
|
|
|
|
|
|
|
|
|
|
|
|
|
|
|
|
|
Statement of Cash Flows Data: |
|
|
|
|
|
|
|
|
|
|
|
|
|
|
|
|
|
Cash provided by (used in): |
|
|
|
|
|
|
|
|
|
|
|
|
|
|
|
|
|
Operating activities |
|
$ |
45,277 |
|
$ |
46,041 |
|
$ |
30,157 |
|
$ |
13,882 |
|
$ |
(6,990) |
|
|
Investing activities |
|
|
(13,063) |
|
|
(79,077) |
|
|
(46,153) |
|
|
(27,735) |
|
|
(292,334) |
|
|
Financing activities |
|
|
(31,474) |
|
|
31,698 |
|
|
16,087 |
|
|
6,988 |
|
|
304,991 |
|
|
|
|
|
|
|
|
|
|
|
|
|
|
|
|
|
|
|
|
Other Financial Data(2): |
|
|
|
|
|
|
|
|
|
|
|
|
|
|
|
|
|
Adjusted gross margin |
|
$ |
142,749 |
|
$ |
150,291 |
|
$ |
133,832 |
|
$ |
112,954 |
|
$ |
51,326 |
|
|
Adjusted EBITDA |
|
|
52,325 |
|
|
46,865 |
|
|
31,651 |
|
|
34,284 |
|
|
14,560 |
|
|
|
|
|
|
|
|
|
|
|
|
|
|
|
|
|
|
|
|
Balance Sheet Data: |
|
|
|
|
|
|
|
|
|
|
|
|
|
|
|
|
|
Cash and cash equivalents |
|
$ |
2,727 |
|
$ |
1,987 |
|
$ |
3,325 |
|
$ |
3,234 |
|
$ |
10,099 |
|
|
Property, plant and equipment, net |
|
|
278,150 |
|
|
291,454 |
|
|
251,690 |
|
|
227,068 |
|
|
181,142 |
|
|
Total assets |
|
|
674,430 |
|
|
735,259 |
|
|
813,173 |
|
|
843,402 |
|
|
562,124 |
|
|
Total long-term debt (including current maturities) |
|
|
177,950 |
|
|
163,194 |
|
|
84,508 |
|
|
184,846 |
|
|
167,739 |
|
|
Total partners’ capital |
|
|
434,086 |
|
|
504,920 |
|
|
600,680 |
|
|
533,393 |
|
|
314,153 |
|
|
|
|
|
|
|
|
|
|
|
|
|
|
|
|
|
|
|
|
Operating Data(3): |
|
|
|
|
|
|
|
|
|
|
|
|
|
|
|
|
|
Crude oil pipeline throughput (Bbl/d) |
|
|
26,662 |
|
|
28,246 |
|
|
20,868 |
|
|
13,738 |
|
|
— |
|
|
Crude oil sales (Bbl/d) |
|
|
24,425 |
|
|
40,255 |
|
|
15,612 |
|
|
5,107 |
|
|
7,516 |
|
|
Refined products terminals throughput (Bbl/d) |
|
|
56,741 |
|
|
62,075 |
|
|
63,859 |
|
|
69,071 |
|
|
57,143 |
|
|
NGL and refined product sales (Mgal/d) |
|
|
181 |
|
|
211 |
|
|
200 |
|
|
181 |
|
|
129 |
|
|
(1) |
In February 2016, we completed the sale of our crude oil supply and logistics operations in the Midcontinent region of Oklahoma and Kansas. In June 2014, we completed the sale of our crude oil logistics operations in the Bakken region of North Dakota, Montana and Wyoming. |
|
(2) |
Adjusted gross margin and Adjusted EBITDA are financial measures that are not presented in accordance with GAAP. Please read “Item 7. Management’s Discussion and Analysis of Financial Condition and Results of Operations — How We Evaluate Our Operations — Adjusted EBITDA and adjusted gross margin.” |
42
|
(3) |
Represents the average daily throughput volume and the average daily sales volume in our crude oil pipelines and storage segment, the average daily throughput volume in our refined products terminals and storage segment and the average daily sales volume in our NGL distribution and sales segment. |
ITEM 7. MANAGEMENT’S DISCUSSION AND ANALYSIS OF FINANCIAL CONDITION AND RESULTS OF OPERATIONS.
The following discussion and analysis of our financial condition and results of operations is provided as a supplement to, and should be read in conjunction with, our historical consolidated financial statements and the notes thereto included elsewhere in this document.
Overview
We are a growth-oriented limited partnership formed in May 2010 by members of management and further capitalized by ArcLight to own, operate, develop and acquire a diversified portfolio of midstream energy assets. Our operations consist of three business segments: (i) crude oil pipelines and storage, (ii) refined products terminals and storage and (iii) NGL distribution and sales. Together our businesses provide midstream infrastructure solutions for the growing supply of crude oil, refined products and NGLs in the United States. Our primary business strategy is to focus on:
|
· |
owning, operating and developing midstream assets serving two of the most prolific shale plays in the United States, as well as serving key crude oil, refined product and NGL distribution hubs; |
|
· |
providing midstream infrastructure solutions to users of liquid petroleum products in order to capitalize on changing product flows between producing and consuming markets resulting from the significant growth in hydrocarbon production across the United States; and |
|
· |
operating one of the largest propane cylinder exchange businesses in the United States and capitalizing on the increase in demand and extended applications for portable propane cylinders. |
We are focused on growing our business through organic development, acquiring and constructing additional midstream infrastructure assets and by increasing the utilization of our existing assets to gather, transport, store and distribute crude oil, refined products and NGLs.
Recent Developments
AMID Merger Agreement
On October 23, 2016, we and JP Energy GP II LLC entered into LP Merger Agreement with AMID, AMID GP, and Merger Sub. On March 8, 2017, we were merged with and into Merger Sub, with the Partnership surviving the merger as a wholly owned subsidiary of AMID.
At the effective time of the AMID Merger, (i) each of our common and subordinated units issued and outstanding, other than our common and subordinated units held by Affiliated Holders was converted into 0.5775 of an AMID Common Unit and (ii) each of our common and subordinated units issued and outstanding held by the Affiliated Holders was converted into 0.5225 of an AMID Common Unit.
In connection with the LP Merger Agreement, on October 23, 2016, AMID GP entered into the GP Merger Agreement with JP Energy GP II LLC and GP Merger Sub. On March 8, 2017, GP Merger Sub merged with and into JP Energy GP II LLC (the “GP Merger” together with the LP Merger, the “Mergers”), with JP Energy GP II LLC surviving the merger as a wholly owned subsidiary of AMID GP.
In connection with the Merger Agreements, Lonestar, the Partnership and JP Energy GP II LLC entered into an Expense Reimbursement Agreement providing that Lonestar will reimburse, or will pay directly on behalf of, the
43
Partnership or our general partner the third party reasonable costs and expenses incurred by the Partnership or our general partner in connection with the Mergers, including all reasonable out-of-pocket legal and financial advisory fees, costs and expenses paid or payable to third parties and incurred in connection with the negotiation, execution and performance of the LP Merger Agreement and consummation of the Mergers.
Current Year Highlights
Disposition of Mid-Continent Crude Oil Supply and Logistics Assets
On February 1, 2016, we sold certain trucking and marketing assets in the Mid-Continent area (the “Mid-Continent Business”), in connection with JP Development’s sale of its GSPP pipeline assets to a third party buyer. The sales price related to the Mid-Continent Business was $9.7 million; which included certain adjustments related to inventory and other working capital items. We continue to retain our crude oil storage operations in the Mid-Continent area of Oklahoma.
General Trends and Outlook
Our business is subject to the key trends discussed below. We have based our expectations on assumptions made by us and on the basis of information currently available to us. To the extent our underlying assumptions about our interpretation of available information prove to be incorrect, our actual results may vary from our expected results.
Production
Over the past several years, there has been a fundamental shift in crude oil production in the United States towards unconventional resources. According to the EIA, this includes crude oil produced from shale formations, tight gas and coal beds. The emergence of unconventional crude oil plays, such as in the Permian Basin, and advances in technology have been crucial factors that have allowed producers to efficiently extract significant volumes of crude oil from these plays. According to the EIA, the dual application of horizontal drilling and hydraulic fracturing has been the primary driver of increases in shale production. The development of these unconventional sources has offset declines in other, more traditional hydrocarbon supply sources, which has helped meet growing demand and lowered the need for imported crude oil. While crude oil production in the United States has been strong in recent years, the steep decline in crude oil prices has reduced the incentive for producers to expand production. Several major producers have reported that they plan to reduce their capital expansion budgets, and several oilfield services companies have announced reductions in staffing. Various media outlets have reported that, with prices at current levels, it may become uneconomical to drill new crude oil wells in certain basins. If crude oil prices remain low, declines in crude oil production may adversely impact volumes in our crude oil pipelines and storage segment.
Production of Refined Products
Access to lower cost crude oil supplies has enabled inland refineries to produce refined petroleum products at a cost that allows them to compete over a much broader geographic area with supply from refineries located on the Gulf Coast. This dynamic has significantly diminished the flow of crude oil from the Gulf Coast to the Midwest and increased the flow of refined petroleum products from the Midwest to the Gulf Coast.
Supply of Crude Oil Storage Capacity
An important factor in determining the value of our crude oil storage capacity and the rates we are able to charge for new contracts or contract renewals is whether a surplus or shortfall of crude oil storage capacity exists relative to the overall demand for crude oil storage services in a given market area. We currently have a long-term contract with the user of our crude oil storage capacity in Cushing, Oklahoma that expires in August 2017.
44
Seasonality
The financial and operational results in our NGL distribution and sales segment are impacted by the seasonal nature of propane demand. The retail propane business is seasonal because of increased demand during the months of November through March primarily for the purpose of providing heating in residential and commercial buildings. As a result, the volume of propane we sell is at its highest during our first and fourth quarters and is directly affected by the severity of the winter. However, our cylinder exchange business sales volumes provide us increased operating profits during our second and third quarters, which reduces overall seasonal fluctuations in the financial and operational results in our cylinder exchange business and our NGL sales business. For the year ended December 31, 2016, we sold approximately 59% of the propane volumes in our cylinder exchange and NGL sales businesses during the first and fourth quarters of the year.
The butane blending operations at our refined products terminals are affected by seasonality because of federal regulations governing seasonal gasoline vapor pressure specifications. Accordingly, we expect that the revenues we generate from butane blending will be highest in the winter months and lowest in the summer months.
Weather
Weather conditions have a significant impact on the demand for propane for both heating and agricultural purposes. Accordingly, the volume of propane used by our customers for this purpose is affected by the severity of winter weather in the regions we serve and can vary substantially from year to year while general economic conditions in the United States and the wholesale price of propane can have a significant impact on the correlation between weather and customer demand. For the year ended December 31, 2016, the weather in Texas, Oklahoma, New Mexico, Arizona, Arkansas, Kansas and Missouri, the seven states in which our NGL sales business operates, was 7% warmer than the average temperature of the prior year as measured by the number of heating degree days reported by the NOAA. If these seven states were to experience a cooling trend, we could expect demand for propane to increase, which could lead to greater sales and income.
Commodity Prices
We are exposed to volatility in crude oil, refined products and NGL commodity prices. We manage such exposure through the structure of our sales and supply contracts and through a managed hedging program. Our risk management policy permits the use of financial instruments to reduce the exposure to changes in commodity prices that occur in the normal course of business but prohibits the use of financial instruments for trading or to speculate on future changes in commodity prices.
In our crude oil pipelines and storage segment, we purchase and take title to a portion of the crude oil that we sell, which exposes us to changes in the price of crude oil in our sales markets. We manage this commodity price risk by limiting our net open positions and through the concurrent purchase and sale of like quantities of crude oil that are intended to lock in positive margins based on the timing, location or quality of the crude oil purchased and delivered. In our refined products terminals and storage segment, we sell excess volumes of refined products and our gross margin is impacted by changes in the market prices for these sales. We may execute forward sales contracts or financial swaps to reduce the risk of commodity price changes in this segment. In our NGL distribution and sales business, we are generally able to pass through the cost of products through sales prices to our customers. To the extent we enter into fixed price product sales contracts in this business, we generally hedge our supply costs using financial swaps. In our cylinder-exchange business, we sell approximately half of our volumes pursuant to contracts of generally two to three years in duration, which allow us to re-negotiate prices at the time of contract renewal, and we sell the remaining volumes on demand or under month-to-month contracts and generally adjust prices on these contracts on an annual basis. We hedge a majority of the forecasted volumes under our fixed-price contracts using financial swaps, and we may also use financial swaps to manage commodity price risk on our month-to-month contracts. In our NGL transportation business, we do not take title to the products we transport and, therefore, have no direct commodity price exposure to the price of volumes transported.
45
Average daily prices for NYMEX West Texas Intermediate crude oil ranged from a high of $54.01 per barrel to a low of $26.19 per barrel from January 1, 2016 through December 31, 2016. Fluctuations in energy prices, like the recent declines in commodity prices of crude oil, can also greatly affect the development of new crude oil reserves. Further declines in commodity prices of crude oil could have a negative impact on exploration, development and production activity, and, if sustained, could lead to a material decrease in such activity. Sustained reductions in exploration or production activity in our areas of operation would lead to reduced utilization of our assets. We are unable to predict future potential movements in the market price for crude oil and, thus, cannot predict the ultimate impact of commodity prices on our operations. If commodity prices revert to the lower trend experienced in 2015 and early 2016, this could lead to reduced profitability and may result in future potential impairments of long-lived assets, goodwill or intangible assets. We performed our annual impairment assessment of goodwill in the fourth quarter of 2016, which resulted in an impairment charge of $15.5 million. Due to the market conditions discussed above, there is an increased likelihood of incurring additional future goodwill impairments, which may be material.
Interest Rates
The credit markets experienced near-record low interest rates in recent years. As the overall economy strengthens, it is likely that monetary policy will tighten, resulting in higher interest rates to counter possible inflation. If this occurs, interest rates on floating rate credit facilities and future offerings in the debt capital markets could be higher than current levels, causing our current or prospective financing costs to increase accordingly. We mitigate some of our exposure to variable interest rate risk by entering into interest rate swap agreements related to a portion of our variable-rate debt. These agreements change a portion of our variable-rate cash flow exposure on the debt obligations to fixed cash flows.
How We Evaluate Our Operations
Our management uses a variety of financial and operational metrics to analyze our performance. We view these metrics as important factors in evaluating our profitability and review these measurements for consistency and trend analysis. These metrics include volumes, revenues, cost of sales, excluding depreciation and amortization, operating expenses, Adjusted EBITDA and distributable cash flow.
|
· |
Volumes and revenues. |
|
· |
Crude oil pipelines and storage. The amount of revenue we generate from our crude oil pipelines business depends primarily on throughput volumes. We generate a substantial majority of our crude oil pipeline revenues through long-term contracts containing acreage dedications or minimum volume commitments. Throughput volumes on our pipeline system are affected primarily by the supply of crude oil in the market served by our assets. The revenue generated from our crude oil supply and logistics business depends on the volume of crude oil we purchase from producers, aggregators and traders and then sell to producers, traders and refiners as well as the volumes of crude oil that we gather and transport. The volume of our crude oil supply and logistics activities and the volumes transported by our crude oil gathering and transportation trucks are affected by the supply of crude oil in the markets served directly or indirectly by our assets. Accordingly, we actively monitor producer activity in the areas served by our crude oil supply and logistics business and other producing areas in the United States to compete for volumes from crude oil producers. Revenues in this business are also impacted by changes in the market price of commodities that we pass through to our customers. The volume of crude oil stored at our crude oil storage facility in Cushing, Oklahoma has no impact on the revenue generated by our crude oil storage business because we receive a fixed monthly fee per barrel of shell capacity that is not contingent on the usage of our storage tanks. |
|
· |
Refined products terminals and storage. The amount of revenue we generate from our refined products terminals depends primarily on the volume of refined products that we handle. These volumes are affected primarily by the supply of and demand for refined products in the markets served directly or indirectly by our refined products terminals. |
|
· |
NGL distribution and sales. The amount of revenue we generate from our NGL distribution and sales segment depends on the gallons of NGLs we sell through our cylinder exchange and NGL sales |
46
businesses. In addition, our NGL transportation operations generate revenue based on the number of gallons of NGLs we gather and the distance we transport those gallons for our customers. Revenues in this segment are also impacted by changes in the market price of commodities that we pass through to our customers. |
|
· |
Cost of sales, excluding depreciation and amortization. Our management attempts to minimize cost of sales, excluding depreciation and amortization, in order to enhance the profitability of our operations. Cost of sales, excluding depreciation and amortization, includes the costs to purchase the product and any costs incurred to transport the product to the point of sale and to store the product until it is sold. We seek to minimize cost of sales, excluding depreciation and amortization, by attempting to acquire the products which we use in each of our segments at times and prices which are most optimal based on our knowledge of the industry and the regions in which we operate. |
|
· |
Operating expenses. Our management seeks to maximize the profitability of our operations in part by minimizing operating expenses. These expenses are comprised of payroll, wages and benefits, utility costs, fleet costs, repair and maintenance costs, rent, fuel, insurance premiums, taxes and other operating costs, some of which are independent of the volumes we handle. |
|
· |
Adjusted EBITDA and adjusted gross margin. Our management uses Adjusted EBITDA and adjusted gross margin to analyze our performance. We define Adjusted EBITDA as net income (loss) plus (minus) interest expense (income), income tax expense (benefit), depreciation and amortization expense, asset impairments, (gains) losses on asset sales, certain non-cash charges such as non-cash equity compensation, non-cash vacation expense, non-cash (gains) losses on commodity derivative contracts (total (gain) loss on commodity derivatives less net cash flow associated with commodity derivatives settled during the period), corporate overhead support from our general partner (expenses incurred by us but absorbed by our general partner and not passed through to us) and selected (gains) charges and transaction costs that are unusual or non-recurring. We define adjusted gross margin as total revenues minus cost of sales, excluding depreciation and amortization, and certain non-cash charges such as non-cash vacation expense and non-cash gains (losses) on derivative contracts (total gain (losses) on commodity derivatives less net cash flow associated with commodity derivatives settled during the period). |
Adjusted EBITDA and adjusted gross margin are supplemental, non-GAAP financial measures used by management and by external users of our financial statements, such as investors and commercial banks, to assess:
|
· |
our operating performance as compared to those of other companies in the midstream sector, without regard to financing methods, historical cost basis or capital structure; |
|
· |
the ability of our assets to generate sufficient cash flow to make distributions to our unitholders; and |
|
· |
the viability of acquisitions and other capital expenditure projects and the returns on investment of various investment opportunities. |
Adjusted EBITDA and adjusted gross margin are not financial measures presented in accordance with GAAP. We believe that the presentation of these non-GAAP financial measures provides information useful to investors in assessing our financial condition and results of operations. The GAAP measures most directly comparable to Adjusted EBITDA and adjusted gross margin are net income (loss) and operating income (loss), respectively. Adjusted EBITDA and adjusted gross margin should not be considered as an alternative to net income (loss), operating income (loss) or any other measure of financial performance or liquidity presented in accordance with GAAP. Adjusted EBITDA and adjusted gross margin exclude some, but not all, items that affect net income (loss) and operating income (loss) and these measures may vary among other companies. As a result, Adjusted EBITDA and adjusted gross margin may not be comparable to similarly titled measures of other companies, thereby diminishing their utility.
47
Set forth below are reconciliations of Adjusted EBITDA and adjusted gross margin to their most directly comparable financial measure calculated in accordance with GAAP.
|
|
|
Year Ended December 31, |
|
|
|||||||||||||
|
|
|
2016 |
|
2015 |
|
2014 |
|
2013 |
|
2012 |
|
|
|||||
|
|
|
(in thousands) |
|
|
|||||||||||||
|
Reconciliation of Adjusted EBITDA to net loss |
|
|
|
|
|
|
|
|
|
|
|
|
|
|
|
|
|
|
Net loss |
|
$ |
(34,523) |
|
$ |
(58,656) |
|
$ |
(53,023) |
|
$ |
(14,221) |
|
$ |
(8,388) |
|
|
|
Depreciation and amortization |
|
|
47,151 |
|
|
46,852 |
|
|
40,230 |
|
|
30,987 |
|
|
12,941 |
|
|
|
Goodwill impairment |
|
|
15,456 |
|
|
29,896 |
|
|
— |
|
|
— |
|
|
— |
|
|
|
Interest expense |
|
|
5,970 |
|
|
5,375 |
|
|
8,981 |
|
|
8,245 |
|
|
3,249 |
|
|
|
Loss on extinguishment of debt |
|
|
— |
|
|
— |
|
|
1,634 |
|
|
— |
|
|
497 |
|
|
|
Income tax expense |
|
|
521 |
|
|
754 |
|
|
300 |
|
|
208 |
|
|
222 |
|
|
|
Loss on disposal of assets, net |
|
|
2,569 |
|
|
909 |
|
|
1,137 |
|
|
1,492 |
|
|
1,142 |
|
|
|
Unit-based compensation |
|
|
2,024 |
|
|
1,217 |
|
|
1,658 |
|
|
790 |
|
|
2,485 |
|
|
|
Total (gain) loss on commodity derivatives |
|
|
(385) |
|
|
3,057 |
|
|
13,762 |
|
|
(902) |
|
|
(640) |
|
|
|
Net cash payments for commodity derivatives settled during the period |
|
|
(639) |
|
|
(14,821) |
|
|
(1,071) |
|
|
(209) |
|
|
(946) |
|
|
|
Early settlement of commodity derivatives (1) |
|
|
— |
|
|
8,745 |
|
|
— |
|
|
— |
|
|
— |
|
|
|
Corporate overhead support from general partner (2) |
|
|
9,000 |
|
|
5,500 |
|
|
— |
|
|
— |
|
|
— |
|
|
|
Transaction costs and other |
|
|
5,013 |
|
|
1,877 |
|
|
3,766 |
|
|
1,286 |
|
|
1,492 |
|
|
|
Discontinued operations (3) |
|
|
168 |
|
|
16,160 |
|
|
14,277 |
|
|
6,608 |
|
|
2,506 |
|
|
|
Adjusted EBITDA |
|
$ |
52,325 |
|
$ |
46,865 |
|
$ |
31,651 |
|
$ |
34,284 |
|
$ |
14,560 |
|
|
|
(1) |
Due to its non-recurring nature, we excluded this transaction in calculating Adjusted EBITDA. |
|
(2) |
Represents expenses incurred by us that were absorbed by our general partner and not passed through to us. |
|
(3) |
In February 2016, we completed the sale of our crude oil supply and logistics operations in the Midcontinent region of Oklahoma and Kansas. In June 2014, we completed the sale of our crude oil logistics operations in the Bakken region of North Dakota, Montana and Wyoming. |
48
|
|
|
Year Ended December 31, |
|
|
|||||||||||||
|
|
|
2016 |
|
2015 |
|
2014 |
|
2013 |
|
2012 |
|
|
|||||
|
|
|
(in thousands) |
|
|
|||||||||||||
|
Reconciliation of adjusted gross margin to operating loss |
|
|
|
|
|
|
|
|
|
|
|
|
|
|
|
|
|
|
Adjusted gross margin |
|
|
|
|
|
|
|
|
|
|
|
|
|
|
|
|
|
|
Crude oil pipelines and storage |
|
$ |
37,393 |
|
$ |
35,500 |
|
$ |
36,788 |
|
$ |
19,249 |
|
$ |
3,465 |
|
|
|
Refined products terminals and storage |
|
|
16,408 |
|
|
14,578 |
|
|
16,834 |
|
|
19,328 |
|
|
1,732 |
|
|
|
NGL distribution and sales |
|
|
88,948 |
|
|
100,213 |
|
|
80,210 |
|
|
74,377 |
|
|
46,129 |
|
|
|
Total Adjusted gross margin |
|
|
142,749 |
|
|
150,291 |
|
|
133,832 |
|
|
112,954 |
|
|
51,326 |
|
|
|
|
|
|
|
|
|
|
|
|
|
|
|
|
|
|
|
|
|
|
Operating expenses |
|
|
(64,137) |
|
|
(69,377) |
|
|
(65,584) |
|
|
(57,728) |
|
|
(26,292) |
|
|
|
General and administrative |
|
|
(42,581) |
|
|
(45,383) |
|
|
(46,362) |
|
|
(44,488) |
|
|
(20,785) |
|
|
|
Depreciation and amortization |
|
|
(47,151) |
|
|
(46,852) |
|
|
(40,230) |
|
|
(30,987) |
|
|
(12,941) |
|
|
|
Goodwill impairment |
|
|
(15,456) |
|
|
(29,896) |
|
|
— |
|
|
— |
|
|
— |
|
|
|
Loss on disposal of assets, net |
|
|
(2,569) |
|
|
(909) |
|
|
(1,137) |
|
|
(1,492) |
|
|
(1,142) |
|
|
|
Total gain (loss) from commodity derivative contracts |
|
|
385 |
|
|
(3,057) |
|
|
(13,762) |
|
|
902 |
|
|
640 |
|
|
|
Net cash payments for commodity derivatives settled during the period |
|
|
639 |
|
|
14,821 |
|
|
1,071 |
|
|
209 |
|
|
947 |
|
|
|
Early settlement of commodity derivatives (1) |
|
|
— |
|
|
(8,745) |
|
|
— |
|
|
— |
|
|
— |
|
|
|
Other non-cash items |
|
|
— |
|
|
(201) |
|
|
(669) |
|
|
— |
|
|
— |
|
|
|
Operating loss |
|
$ |
(28,121) |
|
$ |
(39,308) |
|
$ |
(32,841) |
|
$ |
(20,630) |
|
$ |
(8,247) |
|
|
|
(1) |
Due to its non-recurring nature, we excluded this transaction in calculating adjusted gross margin. |
49
Results of Operations
The following historical consolidated statements of operations data for the years ended December 31, 2016, 2015 and 2014 has been derived from our audited historical consolidated financial statements.
|
|
|
Year Ended December 31, |
|
|||||||
|
|
|
2016 |
|
2015 |
|
2014 |
|
|||
|
|
|
(in thousands) |
|
|||||||
|
TOTAL REVENUES |
|
$ |
493,960 |
|
$ |
680,585 |
|
$ |
726,154 |
|
|
|
|
|
|
|
|
|
|
|
|
|
|
COSTS AND EXPENSES |
|
|
|
|
|
|
|
|
|
|
|
Cost of sales, excluding depreciation and amortization |
|
|
350,187 |
|
|
527,476 |
|
|
605,682 |
|
|
Operating expense |
|
|
64,137 |
|
|
69,377 |
|
|
65,584 |
|
|
General and administrative |
|
|
42,581 |
|
|
45,383 |
|
|
46,362 |
|
|
Depreciation and amortization |
|
|
47,151 |
|
|
46,852 |
|
|
40,230 |
|
|
Goodwill impairment |
|
|
15,456 |
|
|
29,896 |
|
|
— |
|
|
Loss on disposal of assets, net |
|
|
2,569 |
|
|
909 |
|
|
1,137 |
|
|
OPERATING LOSS |
|
|
(28,121) |
|
|
(39,308) |
|
|
(32,841) |
|
|
|
|
|
|
|
|
|
|
|
|
|
|
OTHER INCOME (EXPENSE) |
|
|
|
|
|
|
|
|
|
|
|
Interest expense |
|
|
(5,970) |
|
|
(5,375) |
|
|
(8,981) |
|
|
Loss on extinguishment of debt |
|
|
— |
|
|
— |
|
|
(1,634) |
|
|
Other income, net |
|
|
628 |
|
|
1,732 |
|
|
8 |
|
|
|
|
|
|
|
|
|
|
|
|
|
|
LOSS FROM CONTINUING OPERATIONS BEFORE INCOME TAXES |
|
|
(33,463) |
|
|
(42,951) |
|
|
(43,448) |
|
|
|
|
|
|
|
|
|
|
|
|
|
|
Income tax expense |
|
|
(521) |
|
|
(754) |
|
|
(300) |
|
|
LOSS FROM CONTINUING OPERATIONS |
|
|
(33,984) |
|
|
(43,705) |
|
|
(43,748) |
|
|
|
|
|
|
|
|
|
|
|
|
|
|
DISCONTINUED OPERATIONS (1) |
|
|
|
|
|
|
|
|
|
|
|
Net loss from discontinued operations, including loss on disposal of $7,288 in 2014 |
|
|
(539) |
|
|
(14,951) |
|
|
(9,275) |
|
|
|
|
|
|
|
|
|
|
|
|
|
|
NET LOSS |
|
$ |
(34,523) |
|
$ |
(58,656) |
|
$ |
(53,023) |
|
|
(1) |
In February 2016, we completed the sale of our crude oil supply and logistics operations in the Midcontinent region of Oklahoma and Kansas. In June 2014, we completed the sale of our crude oil logistics operations in the Bakken region of North Dakota, Montana and Wyoming. |
50
Year Ended December 31, 2016 Compared to the Year Ended December 31, 2015
Consolidated Results
|
|
|
Year Ended December 31, |
|
|||||||
|
|
|
2016 |
|
2015 |
|
Variance |
|
|||
|
|
|
|
(in thousands) |
|
||||||
|
Segment Adjusted EBITDA |
|
|
|
|
|
|
|
|
|
|
|
Crude oil pipelines and storage (1) |
|
$ |
26,405 |
|
$ |
23,119 |
|
$ |
3,286 |
|
|
Refined products terminals and storage (1) |
|
|
13,317 |
|
|
10,867 |
|
|
2,450 |
|
|
NGL distribution and sales (1) |
|
|
25,736 |
|
|
30,896 |
|
|
(5,160) |
|
|
Discontinued operations (2) |
|
|
(371) |
|
|
1,209 |
|
|
(1,580) |
|
|
Corporate and other |
|
|
(12,762) |
|
|
(19,226) |
|
|
6,464 |
|
|
Total Adjusted EBITDA |
|
|
52,325 |
|
|
46,865 |
|
|
5,460 |
|
|
Depreciation and amortization |
|
|
(47,151) |
|
|
(46,852) |
|
|
(299) |
|
|
Goodwill impairment |
|
|
(15,456) |
|
|
(29,896) |
|
|
14,440 |
|
|
Interest expense |
|
|
(5,970) |
|
|
(5,375) |
|
|
(595) |
|
|
Income tax expense |
|
|
(521) |
|
|
(754) |
|
|
233 |
|
|
Loss on disposal of assets, net |
|
|
(2,569) |
|
|
(909) |
|
|
(1,660) |
|
|
Unit-based compensation |
|
|
(2,024) |
|
|
(1,217) |
|
|
(807) |
|
|
Total gain (loss) on commodity derivatives |
|
|
385 |
|
|
(3,057) |
|
|
3,442 |
|
|
Net cash payments for commodity derivatives settled during the period |
|
|
639 |
|
|
14,821 |
|
|
(14,182) |
|
|
Early settlement of commodity derivatives |
|
|
— |
|
|
(8,745) |
|
|
8,745 |
|
|
Corporate overhead support from general partner |
|
|
(9,000) |
|
|
(5,500) |
|
|
(3,500) |
|
|
Transaction costs and other |
|
|
(5,013) |
|
|
(1,877) |
|
|
(3,136) |
|
|
Discontinued operations (2) |
|
|
(168) |
|
|
(16,160) |
|
|
15,992 |
|
|
Net loss |
|
$ |
(34,523) |
|
$ |
(58,656) |
|
$ |
24,133 |
|
|
(1) |
See further analysis of the Adjusted EBITDA of each reportable segment below. |
|
(2) |
In February 2016, we completed the sale of our crude oil supply and logistics operations in the Midcontinent region of Oklahoma and Kansas. |
Discontinued operations Adjusted EBITDA. Adjusted EBITDA related to discontinued operations included previously in our crude oil pipelines and storage segment decreased $1.6 million for the year ended December 31, 2016 compared to the year ended December 31, 2015. The decrease was primarily due to a decrease in crude oil sales volumes and crude oil sales margin in our operations in the Mid-Continent region of Oklahoma and Kansas. We completed the sale of our Mid-Continent Business in February 2016.
Corporate and other Adjusted EBITDA. Corporate and other Adjusted EBITDA primarily represents corporate expenses not allocated to reportable segments. Such expenses decreased to $12.8 million for the year ended December 31, 2016 from $19.2 million for the year ended December 31, 2015. The decrease was primarily due to an increase in corporate overhead support of $3.5 million and a reduction in employee expenses of $3.0 million from a reduction in corporate headcount and general cost reduction initiatives. The corporate overhead support represents expenses incurred by us during the year ended December 31, 2016 and 2015 that were absorbed by our general partner and not passed through to us.
51
Goodwill impairment. For the year ended December 31, 2016, we recognized impairment charges of $12.8 million in our Pinnacle Propane Express reporting unit within our NGL distribution and sales segment due primarily to declines in future estimated margins as a result of increased competition and recent increases in propane prices and $2.7 million in our JP Liquids reporting unit within our NGL distribution and sales segment due primarily to declines in future estimated volumes. For the year ended December 31, 2015, we recognized goodwill impairment charges of $23.6 million and $6.3 million in our crude oil supply and logistics reporting unit within our crude oil pipelines and storage segment and JP Liquids reporting unit within our NGL distribution and sales segment, respectively, primarily due to the substantial decline in commodity prices in 2015 and the resulting decline in margin as well as volumes in those reporting units.
Interest expense. Interest expense for the year ended December 31, 2016 increased to $6.0 million from $5.4 million for the year ended December 31, 2015. The increase was primarily due to an increase in average outstanding borrowings under our revolving credit facility. Our average outstanding borrowings increased from $141.6 million for the year ended December 31, 2015 to $162.4 million for the year ended December 31, 2016.
Loss on disposal of assets, net. The increase in loss on disposal of assets, net for the year ended December 31, 2016 from the year ended December 31, 2015 is primarily due to the sale of certain crude oil supply and logistics assets in November 2015, which resulted in a gain on disposal of approximately $1.0 million. In addition, we also had an increase in the number of cages disposed of, and the resulting loss on disposal, in our propane cylinder exchange business for the year ended December 31, 2016 compared to the year ended December 31, 2015.
Unit-based compensation. Unit-based compensation for the year ended December 31, 2016 increased to $2.0 million from $1.2 million for the year ended December 31, 2015 primarily due to the additional LTIP phantom units granted in the year ended December 31, 2016.
Total gain (loss) on commodity derivatives and net cash payments for commodity derivatives settled during the period. The change in both total gain (loss) on commodity derivatives and net cash payments for commodity derivatives settled during the period are primarily due to the more favorable position of our propane and crude hedges during the year ended December 31, 2016 compared to the year ended December 31, 2015.
Early settlement of commodity derivatives. In August 2015, we paid approximately $8.7 million to settle all of our outstanding propane financial swap contracts that were scheduled to mature at various dates through April 2017. Due to the non-recurring nature, we have excluded the $8.7 million early settlement of commodity derivatives in calculating Adjusted EBITDA.
Corporate overhead support from general partner. Corporate overhead support from general partner for the year ended December 31, 2016 increased to $9.0 million from $5.5 million for the year ended December 31, 2015. These amounts represent expenses incurred by us during the year ended December 31, 2016 and 2015, which were absorbed by our general partner and not passed through to us. This support is evaluated on a quarterly basis by our general partner.
Transaction costs and other. The increase in transaction costs and other of $3.1 million for the year ended December 31, 2016 compared to the year ended December 31, 2015 is primarily due to costs incurred associated with the AMID Merger.
Discontinued operations. Discontinued operations primarily represents non-cash depreciation and amortization expense, impairment charges and the total loss on commodity derivatives and net cash payments for commodity derivatives settled during the period related to the discontinued operations previously owned by our crude oil pipelines and storage segment. Such expenses decreased to $0.2 million for the year ended December 31, 2016 from $16.2 million for the year ended December 31, 2015. The decrease was primarily due to an impairment charge of $12.9 million related to fixed assets, intangible assets and goodwill associated with the disposal of our crude oil supply and logistics operations in the Midcontinent region of Oklahoma and Kansas in 2015 as well as reduction in depreciation and amortization expense of $2.1 million and total loss on commodity derivatives and net cash payments for commodity derivatives settled during the period of $0.6 million.
52
Segment Operating Results
Crude Oil Pipelines and Storage
|
|
|
Year Ended December 31, |
|
|||||||
|
|
|
2016 |
|
2015 |
|
Variance |
|
|||
|
|
|
(in thousands, unless otherwise noted) |
|
|||||||
|
Volumes: |
|
|
|
|
|
|
|
|
|
|
|
Crude oil pipeline throughput (Bbls/d) (1) |
|
|
26,662 |
|
|
28,246 |
|
|
(1,584) |
|
|
Crude oil sales (Bbls/d) (2) |
|
|
24,425 |
|
|
40,255 |
|
|
(15,830) |
|
|
Revenues: |
|
|
|
|
|
|
|
|
|
|
|
Crude oil sales |
|
$ |
300,220 |
|
$ |
456,349 |
|
$ |
(156,129) |
|
|
Gathering, transportation and storage fees |
|
|
20,438 |
|
|
21,820 |
|
|
(1,382) |
|
|
Other revenues |
|
|
1,482 |
|
|
2,358 |
|
|
(876) |
|
|
Total Revenues |
|
|
322,140 |
|
|
480,527 |
|
|
(158,387) |
|
|
Cost of sales, excluding depreciation and amortization (3) |
|
|
(284,747) |
|
|
(445,027) |
|
|
160,280 |
|
|
Adjusted gross margin |
|
|
37,393 |
|
|
35,500 |
|
|
1,893 |
|
|
Operating expenses (3) |
|
|
(8,195) |
|
|
(9,238) |
|
|
1,043 |
|
|
General and administrative (3) |
|
|
(2,801) |
|
|
(3,143) |
|
|
342 |
|
|
Other income, net |
|
|
8 |
|
|
— |
|
|
8 |
|
|
Segment Adjusted EBITDA |
|
$ |
26,405 |
|
$ |
23,119 |
|
$ |
3,286 |
|
|
(1) |
Represents the average daily throughput volume in our crude oil pipelines and storage segment. The volumes in our crude oil storage facility are excluded because they have no effect on operations as we receive a set fee per month that does not fluctuate with the volume of crude oil stored. |
|
(2) |
Represents the average daily sales volume in our crude oil pipelines and storage segment. |
|
(3) |
Certain expenses have been excluded from cost of sales, excluding depreciation and amortization, operating expenses and general and administrative expenses for the purpose of calculating segment Adjusted EBITDA. |
Volumes. Crude oil pipeline throughput volumes decreased to 26,662 barrels per day for the year ended December 31, 2016 from 28,246 barrels per day for the year ended December 31, 2015. Crude oil sales volumes decreased to 24,425 barrels per day for the year ended December 31, 2016 from 40,255 barrels per day for the year ended December 31, 2015. These decreases are primarily due to an overall reduction in our customer crude oil production volumes in our areas of operation. However, producer activity around our Silver Dollar Pipeline has recently increased, resulting in average pipeline throughput volumes of approximately 31,000 barrels per day in the quarter ended December 31, 2016.
Adjusted gross margin. Adjusted gross margin increased to $37.4 million for the year ended December 31, 2016 from $35.5 million for the year ended December 31, 2015. The increase was primarily due to an increase in crude oil sales margin of $10.0 million due to the capturing of more favorable margins associated with previously stored inventory during contango market conditions as well as more favorable regional pricing spreads on bulk purchased crude oil. This increase is partially offset by a decrease in crude oil sales and throughput volumes of $6.9 million and $0.7 million, respectively, as explained above.
Operating expenses. Operating expenses decreased to $8.2 million for the year ended December 31, 2016 from $9.2 million for the year ended December 31, 2015. The decrease was primarily due to reductions in personnel costs of $1.2 million from lower headcount.
53
Refined Products Terminals and Storage
|
|
|
Year Ended December 31, |
|
|||||||
|
|
|
2016 |
|
2015 |
|
Variance |
|
|||
|
|
|
|
|
|
|
|
|
|
|
|
|
|
|
(in thousands, unless otherwise noted) |
|
|||||||
|
Volumes: |
|
|
|
|
|
|
|
|
|
|
|
Terminal and storage throughput (Bbls/d) (1) |
|
|
56,741 |
|
|
62,075 |
|
|
(5,334) |
|
|
Revenues: |
|
|
|
|
|
|
|
|
|
|
|
Refined products sales |
|
$ |
14,655 |
|
$ |
10,394 |
|
$ |
4,261 |
|
|
Refined products terminals and storage fees |
|
|
13,513 |
|
|
12,833 |
|
|
680 |
|
|
Total Revenues |
|
|
28,168 |
|
|
23,227 |
|
|
4,941 |
|
|
Cost of sales, excluding depreciation and amortization (2) |
|
|
(11,760) |
|
|
(8,649) |
|
|
(3,111) |
|
|
Adjusted gross margin |
|
|
16,408 |
|
|
14,578 |
|
|
1,830 |
|
|
Operating expenses (2) |
|
|
(2,428) |
|
|
(2,980) |
|
|
552 |
|
|
General and administrative (2) |
|
|
(679) |
|
|
(737) |
|
|
58 |
|
|
Other income |
|
|
16 |
|
|
6 |
|
|
10 |
|
|
Segment Adjusted EBITDA |
|
$ |
13,317 |
|
$ |
10,867 |
|
$ |
2,450 |
|
|
(1) |
Represents the average daily throughput volume in our refined products terminals and storage segment. |
|
(2) |
Certain expenses have been excluded from cost of sales, excluding depreciation and amortization, operating expenses and general and administrative expenses for the purpose of calculating segment Adjusted EBITDA. |
Volumes. Volumes decreased to 56,741 barrels per day for the year ended December 31, 2016 from 62,075 for the year ended December 31, 2015. The decrease was primarily due to increased competition in our area of operations and a non-recurring increase in volumes in the year ended December 31, 2015 from a refinery turnaround in our area of operations during that period.
Revenues. Revenues increased to $28.2 million for the year ended December 31, 2016 from $23.2 million for the year ended December 31, 2015. The increase was primarily due to an increase in refined products sales revenue of $4.3 million related to the addition of butane blending capabilities at our North Little Rock Terminal since the second quarter of 2015. Refined products terminals and storage fees increased $0.7 million primarily driven by increased blending and injection of additives during the year ended December 31, 2016 compared to the year ended December 31, 2015.
Cost of Sales, excluding depreciation and amortization. Cost of sales, excluding depreciation and amortization, increased to $11.8 million for the year ended December 31, 2016 from $8.6 million for the year ended December 31, 2015 primarily due to an increase in butane blending sales volumes.
Operating expenses. Operating expenses decreased to $2.4 million for the year ended December 31, 2016 from $3.0 million for the year ended December 31, 2015. The decrease was primarily due to $0.2 million related to inadvertent product releases and $0.2 million from the final settlement of the under-delivered product volumes with a certain customer, both of which were incurred in the year ended December 31, 2015.
54
NGL Distribution and Sales
|
|
|
Year Ended December 31, |
|
|||||||
|
|
|
2016 |
|
2015 |
|
Variance |
|
|||
|
|
|
(in thousands, unless otherwise noted) |
|
|||||||
|
Volumes: |
|
|
|
|
|
|
|
|
|
|
|
NGL and refined product sales (Mgal/d) (1) |
|
|
181 |
|
|
211 |
|
|
(30) |
|
|
Revenues: |
|
|
|
|
|
|
|
|
|
|
|
Gathering, transportation and storage fees |
|
$ |
2,948 |
|
$ |
5,960 |
|
$ |
(3,012) |
|
|
NGL and refined product sales |
|
|
129,116 |
|
|
159,616 |
|
|
(30,500) |
|
|
Other revenues |
|
|
11,588 |
|
|
11,255 |
|
|
333 |
|
|
Total Revenues |
|
|
143,652 |
|
|
176,831 |
|
|
(33,179) |
|
|
Cost of sales, excluding depreciation and amortization (2) |
|
|
(54,704) |
|
|
(76,618) |
|
|
21,914 |
|
|
Adjusted gross margin |
|
|
88,948 |
|
|
100,213 |
|
|
(11,265) |
|
|
Operating expenses (2) |
|
|
(53,278) |
|
|
(57,200) |
|
|
3,922 |
|
|
General and administrative (2) |
|
|
(10,073) |
|
|
(12,373) |
|
|
2,300 |
|
|
Other income, net |
|
|
139 |
|
|
256 |
|
|
(117) |
|
|
Segment Adjusted EBITDA |
|
$ |
25,736 |
|
$ |
30,896 |
|
$ |
(5,160) |
|
|
(1) |
Represents the average daily sales volume in our NGL distribution and sales segment. |
|
(2) |
Certain expenses have been excluded from cost of sales, excluding depreciation and amortization, operating expenses and general and administrative expenses for the purpose of calculating segment Adjusted EBITDA. |
Adjusted gross margin. Adjusted gross margin decreased to $88.9 million for the year ended December 31, 2016 from $100.2 million for the year ended December 31, 2015. The decrease was driven by a reduction in NGL and refined product sales volumes of $14.6 million, partially offset by an increase in average NGL and refined product sales margin of $3.3 million. The reduction in NGL and refined product sales volumes was primarily due to a decline in volumes associated with oilfield services as a result of lower exploration and production activity and overall warmer than normal temperatures sustained in the year ended December 31, 2016. The average NGL and refined products sales margin increased due to more favorable market conditions in the earlier months of 2016 compared to the same months in the prior year.
Operating expenses. Operating expenses decreased to $53.3 million for the year ended December 31, 2016 from $57.2 million for the year ended December 31, 2015. The decrease was primarily due to a reduction in distribution and employee costs of $1.5 million and $1.2 million, respectively. The decrease in distribution costs was driven by lower volumes and improved fleet efficiencies while the decline in employee costs was related to a reduction in headcount. Facility maintenance expenses also declined $0.7 million for the year ended December 31, 2016 compared to the year ended December 31, 2015 due to overall cost reduction initiatives.
General and administrative. General and administrative expenses decreased to $10.1 million for the year ended December 31, 2016 from $12.4 million for the year ended December 31, 2015 due to overall cost reduction efforts. The decrease is primarily due to a reduction in bad debt expense of $0.8 million from an improvement in collection efforts and lower personnel costs of $0.5 million related to a reduction in headcount. The remaining decrease is due to reductions in various expenses from our cost reduction efforts.
55
Year Ended December 31, 2015 Compared to the Year Ended December 31, 2014
Consolidated Results
|
|
|
Year ended December 31, |
|
|||||||
|
|
|
2015 |
|
2014 |
|
Variance |
|
|||
|
|
|
|
|
|
|
|
|
|
|
|
|
|
|
(in thousands) |
|
|||||||
|
Segment Adjusted EBITDA |
|
|
|
|
|
|
|
|
|
|
|
Crude oil pipelines and storage (1) |
|
$ |
23,119 |
|
$ |
25,339 |
|
$ |
(2,220) |
|
|
Refined products terminals and storage (1) |
|
|
10,867 |
|
|
10,723 |
|
|
144 |
|
|
NGL distribution and sales (1) |
|
|
30,896 |
|
|
15,511 |
|
|
15,385 |
|
|
Discontinued operations (2) |
|
|
1,209 |
|
|
5,002 |
|
|
(3,793) |
|
|
Corporate and other |
|
|
(19,226) |
|
|
(24,924) |
|
|
5,698 |
|
|
Total Adjusted EBITDA |
|
|
46,865 |
|
|
31,651 |
|
|
15,214 |
|
|
Depreciation and amortization |
|
|
(46,852) |
|
|
(40,230) |
|
|
(6,622) |
|
|
Goodwill impairment |
|
|
(29,896) |
|
|
— |
|
|
(29,896) |
|
|
Interest expense |
|
|
(5,375) |
|
|
(8,981) |
|
|
3,606 |
|
|
Loss on extinguishment of debt |
|
|
— |
|
|
(1,634) |
|
|
1,634 |
|
|
Income tax expense |
|
|
(754) |
|
|
(300) |
|
|
(454) |
|
|
Loss on disposal of assets, net |
|
|
(909) |
|
|
(1,137) |
|
|
228 |
|
|
Unit-based compensation |
|
|
(1,217) |
|
|
(1,658) |
|
|
441 |
|
|
Total loss on commodity derivatives |
|
|
(3,057) |
|
|
(13,762) |
|
|
10,705 |
|
|
Net cash payments for commodity derivatives settled during the period |
|
|
14,821 |
|
|
1,071 |
|
|
13,750 |
|
|
Early settlement of commodity derivatives |
|
|
(8,745) |
|
|
— |
|
|
(8,745) |
|
|
Corporate overhead support from general partner |
|
|
(5,500) |
|
|
— |
|
|
(5,500) |
|
|
Transaction costs and other |
|
|
(1,877) |
|
|
(3,766) |
|
|
1,889 |
|
|
Discontinued operations (2) |
|
|
(16,160) |
|
|
(14,277) |
|
|
(1,883) |
|
|
Net loss |
|
$ |
(58,656) |
|
$ |
(53,023) |
|
$ |
(5,633) |
|
|
(1) |
See further analysis of the Adjusted EBITDA of each reportable segment below. |
|
(2) |
In February 2016, we completed the sale of our crude oil supply and logistics operations in the Midcontinent region of Oklahoma and Kansas. In June 2014, we completed the sale of our crude oil logistics operations in the Bakken region of North Dakota, Montana and Wyoming. |
Discontinued operations Adjusted EBITDA. Adjusted EBITDA related to discontinued operations included previously in our crude oil pipelines and storage segment decreased to $1.2 million for the year ended December 31, 2015 from $5.0 million for the year ended December 31, 2014. The decrease was primarily due to a decrease in crude oil sales margin in our operations in the Midcontinent region of Oklahoma and Kansas. We completed the sale of our crude oil logistics operations in the Midcontinent region in February 2016. In addition, we also completed the sale of our crude oil logistics operations in the Bakken region of North Dakota, Montana and Wyoming in June 2014, which contributed to the overall decrease for the year ended December 31, 2015 compared to the year ended December 31, 2014.
Corporate and other Adjusted EBITDA. Corporate and other Adjusted EBITDA primarily represents corporate expenses not allocated to reportable segments. Such expenses decreased to $19.2 million for the year ended December 31, 2015 from $24.9 million for the year ended December 31, 2014. The decrease was primarily due to $5.5 million of expenses incurred by us during the year ended December 31, 2015, that were absorbed by our general partner and not passed through to us. An additional decrease of $3.2 million in professional and consulting fees was related to expenses associated with the IPO in the year ended December 31, 2014. These decreases were partially offset by increases of $1.9 million in employee expenses, $0.5 million in contract labor and $0.5 million in insurance expenses related to an increase in corporate personnel to support our business in the year ended December 31, 2015 compared to the year ended December 31, 2014.
56
Depreciation and amortization expense. Depreciation and amortization expense for the year ended December 31, 2015 increased to $46.9 million from $40.2 million for the year ended December 31, 2014. The increase was primarily due to the expansions of our Silver Dollar Pipeline System in the fourth quarter of 2014 and throughout 2015. Our average depreciable asset base increased from $258.2 million during the year ended December 31, 2014 to $324.6 million during the year ended December 31, 2015.
Goodwill impairment. For the year ended December 31, 2015, we recognized goodwill impairment charges of $23.6 million and $6.3 million in our crude oil supply and logistics reporting unit within our crude oil pipelines and storage segment and JP Liquids reporting unit within our NGL distribution and sales segment, respectively, primarily due to the substantial decline in commodity prices in 2015 and the resulting decline in margin as well as volumes in those reporting units.
Interest expense. Interest expense for the year ended December 31, 2015 decreased to $5.4 million from $9.0 million for the year ended December 31, 2014. The decrease was primarily due to the repayment of a substantial portion of our revolving credit facility utilizing a portion of the proceeds from our initial public offering completed on October 7, 2014, as well as a decrease in the average interest rate. Our average borrowings decreased from $177.9 million for the year ended December 31, 2014 to $141.6 million for the year ended December 31, 2015. Our average interest rate decreased from 5.1% for the year ended December 31, 2014 to 3.8% for the year ended December 31, 2015.
Loss on extinguishment of debt. Loss on extinguishment of debt of $1.6 million for the year ended December 31, 2014 relates to the write off of deferred financing costs associated with extinguishment of our 2011 revolving credit facility in February 2014.
Unit-based compensation. Unit-based compensation for the year ended December 31, 2015 decreased to $1.2 million from $1.7 million for the year ended December 31, 2014. The higher expense in 2014 was primarily due to the accelerated vesting of certain awards in connection with our IPO in October 2014.
Total loss on commodity derivatives and net cash payments for commodity derivatives settled during the period. The changes in both total loss on commodity derivatives and net cash payments for commodity derivatives settled during the period are due to the more favorable position of our propane hedges during the year ended December 31, 2015 compared to the year ended December 31, 2014.
Early settlement of commodity derivatives. In August 2015, we paid approximately $8.7 million to settle all of our outstanding propane financial swap contracts that were scheduled to mature at various dates through April 2017. Due to the non-recurring nature, we have excluded the $8.7 million early settlement of commodity derivatives in calculating Adjusted EBITDA.
Corporate overhead support from general partner. Corporate overhead support from general partner of $5.5 million represents expenses incurred by us during the year ended December 31, 2015, that were absorbed by our general partner and not passed through to us.
Transaction costs and other. Transaction costs and other decreased to $1.9 million for the year ended December 31, 2015 from $3.8 million for the year ended December 31, 2014. The decrease was primarily due to a decrease in non-cash employee expenses of $2.8 million related to changes in our management structure and personnel in the year ended December 31, 2015. An additional decrease of $1.9 million is related to changes in contingent consideration liabilities due to the post-acquisition performance of a portion of our assets. These decreases were partially offset by $1.4 million of expenses related to changes in our management structure and personnel in the year ended December 31, 2015 and an increase in transaction costs of $1.4 million.
Discontinued operations. Discontinued operations primarily represents non-cash depreciation and amortization expense, impairment charges and loss on disposal of assets related to the discontinued operations previously owned by our crude oil pipelines and storage segment. Such expenses increased to $16.2 million for the year ended December 31, 2015 from $14.3 million for the year ended December 31, 2014. The increase was primarily due to an impairment charge of $12.9 million related to fixed assets, intangible assets and goodwill associated with the disposal of our crude oil
57
supply and logistics operations in the Midcontinent region of Oklahoma and Kansas in 2015. This increase was partially offset by decreases in the loss on the disposal of assets of $9.1 million, non-cash depreciation and amortization expense of $1.4 million and non-cash inventory costing adjustments of $0.4 million in the year ended December 31, 2015 compared to the year ended December 31, 2014.
58
Segment Operating Results
Crude Oil Pipelines and Storage
|
|
|
Year ended December 31, |
|
|||||||
|
|
|
2015 |
|
2014 |
|
Variance |
|
|||
|
|
|
(in thousands, unless otherwise noted) |
|
|||||||
|
Volumes: |
|
|
|
|
|
|
|
|
|
|
|
Crude oil pipeline throughput (Bbls/d) (1) |
|
|
28,246 |
|
|
20,868 |
|
|
7,378 |
|
|
Crude oil sales (Bbls/d) (2) |
|
|
40,255 |
|
|
15,612 |
|
|
24,643 |
|
|
Revenues: |
|
|
|
|
|
|
|
|
|
|
|
Crude oil sales |
|
$ |
456,349 |
|
$ |
470,336 |
|
$ |
(13,987) |
|
|
Gathering, transportation and storage fees |
|
|
21,820 |
|
|
24,013 |
|
|
(2,193) |
|
|
Other revenues |
|
|
2,358 |
|
|
1,622 |
|
|
736 |
|
|
Total Revenues |
|
|
480,527 |
|
|
495,971 |
|
|
(15,444) |
|
|
Cost of sales, excluding depreciation and amortization (3) |
|
|
(445,027) |
|
|
(459,183) |
|
|
14,156 |
|
|
Adjusted gross margin |
|
|
35,500 |
|
|
36,788 |
|
|
(1,288) |
|
|
Operating expenses (3) |
|
|
(9,238) |
|
|
(7,928) |
|
|
(1,310) |
|
|
General and administrative (3) |
|
|
(3,143) |
|
|
(3,548) |
|
|
405 |
|
|
Other income, net |
|
|
— |
|
|
27 |
|
|
(27) |
|
|
Segment Adjusted EBITDA |
|
$ |
23,119 |
|
$ |
25,339 |
|
$ |
(2,220) |
|
|
(1) |
Represents the average daily throughput volume in our crude oil pipelines and storage segment. The volumes in our crude oil storage facility are excluded because they have no effect on operations as we receive a set fee per month that does not fluctuate with the volume of crude oil stored. |
|
(2) |
Represents the average daily sales volume in our crude oil pipelines and storage segment. |
|
(3) |
Certain expenses have been excluded from cost of sales, excluding depreciation and amortization, operating expenses and general and administrative expenses for the purpose of calculating segment Adjusted EBITDA. |
Volumes. Crude oil pipeline throughput volumes increased to 28,246 barrels per day for the year ended December 31, 2015 from 20,868 barrels per day for the year ended December 31, 2014. Crude oil sales volumes increased to 40,255 barrels per day for the year ended December 31, 2015 from 15,612 barrels per day for the year ended December 31, 2014. The increases were due to the expansions of the Silver Dollar Pipeline System in the third quarter of 2014 and throughout 2015.
Adjusted gross margin. Adjusted gross margin decreased to $35.5 million for the year ended December 31, 2015 from $36.8 million for the year ended December 31, 2014. The major components of this decrease were as follows:
|
· |
a $10.1 million decrease in crude oil sales margin primarily due to the impact of the current lower-priced crude oil market on margin per barrel and the lack of any market dislocation opportunities for the year ended December 31, 2015 compared to the year ended December 31, 2014.; partially offset by |
|
· |
a $4.7 million increase in crude oil sales volumes and a $3.6 million increase in crude oil throughput volume on our Silver Dollar Pipeline System, as explained above.; and |
|
· |
a $0.5 million increase in storage fees from a service outage that occurred to make repairs to a portion of our storage tanks in December 2014. |
Operating expenses. Operating expenses increased to $9.2 million for the year ended December 31, 2015 from $7.9 million for the year ended December 31, 2014. The increase was primarily due to increases in insurance premiums ($0.8 million), property tax expenses ($0.2 million) and repairs and maintenance expenses ($0.2 million) in the year ended December 31, 2015.
59
Refined Products Terminals and Storage
|
|
|
Year ended December 31, |
|
|||||||
|
|
|
2015 |
|
2014 |
|
Variance |
|
|||
|
|
|
(in thousands, unless otherwise noted) |
|
|||||||
|
Volumes: |
|
|
|
|
|
|
|
|
|
|
|
Terminal and storage throughput (Bbls/d) (1) |
|
|
62,075 |
|
|
63,859 |
|
|
(1,784) |
|
|
Revenues: |
|
|
|
|
|
|
|
|
|
|
|
Refined products sales |
|
$ |
10,394 |
|
$ |
11,521 |
|
$ |
(1,127) |
|
|
Refined products terminals and storage fees |
|
|
12,833 |
|
|
11,766 |
|
|
1,067 |
|
|
Total Revenues |
|
|
23,227 |
|
|
23,287 |
|
|
(60) |
|
|
Cost of sales, excluding depreciation and amortization (2) |
|
|
(8,649) |
|
|
(6,453) |
|
|
(2,196) |
|
|
Adjusted gross margin |
|
|
14,578 |
|
|
16,834 |
|
|
(2,256) |
|
|
Operating expenses (2) |
|
|
(2,980) |
|
|
(4,602) |
|
|
1,622 |
|
|
General and administrative |
|
|
(737) |
|
|
(1,518) |
|
|
781 |
|
|
Other income |
|
|
6 |
|
|
9 |
|
|
(3) |
|
|
Segment Adjusted EBITDA |
|
$ |
10,867 |
|
$ |
10,723 |
|
$ |
144 |
|
|
(1) |
Represents the average daily throughput volume in our refined products terminals and storage segment. |
|
(2) |
Certain expenses have been excluded from cost of sales, excluding depreciation and amortization, operating expenses and general and administrative expenses for the purpose of calculating segment Adjusted EBITDA. |
Revenues. Revenues decreased to $23.2 million for the year ended December 31, 2015 from $23.3 million for the year ended December 31, 2014. The decrease was primarily due to a decrease in refined product sales revenue of $1.1 million from a decrease in commodities prices ($4.1 million) in the year ended December 31, 2015 compared to the year ended December 31, 2014, partially offset by an increase in refined product sales volumes ($3.0 million) due to the addition of butane blending capabilities at our North Little Rock Terminal in the second quarter of 2015. The decrease in refined products sales revenue was partially offset by an increase in terminal throughput and additive fees of $0.6 million related to changes in our terminaling agreements in the year ended December 31, 2015 and an increase in storage fees of $0.3 million.
Cost of sales, excluding depreciation and amortization. Cost of sales, excluding depreciation and amortization increased to $8.6 million for the year ended December 31, 2015 from $6.5 million for the year ended December 31, 2014. The increase was primarily due to an increase in refined products sales volumes.
Operating expenses. Operating expenses decreased to $3.0 million for the year ended December 31, 2015 from $4.6 million for the year ended December 31, 2014. The decrease was primarily due to the recording of a non-recurring charge of $2.3 million at our North Little Rock, Arkansas terminal in the year ended December 31, 2014, related to the settlement of under-delivered product volumes with our North Little Rock terminal customers.
General and administrative. General and administrative decreased to $0.7 million for the year ended December 31, 2015 from $1.5 million for the year ended December 31, 2014. The decrease was primarily due to changes in our management structure and personnel in the year ended December 31, 2015 compared to the year ended December 31, 2014.
60
NGL Distribution and Sales
|
|
|
Year ended December 31, |
|
|||||||
|
|
|
2015 |
|
2014 |
|
Variance |
|
|||
|
|
|
(in thousands, unless otherwise noted) |
|
|||||||
|
Volumes: |
|
|
|
|
|
|
|
|
|
|
|
NGL and refined product sales (Mgal/d) (1) |
|
|
211 |
|
|
200 |
|
|
11 |
|
|
Revenues: |
|
|
|
|
|
|
|
|
|
|
|
Gathering, transportation and storage fees |
|
$ |
5,960 |
|
$ |
6,688 |
|
$ |
(728) |
|
|
NGL and refined product sales |
|
|
159,616 |
|
|
188,701 |
|
|
(29,085) |
|
|
Other revenues |
|
|
11,255 |
|
|
11,507 |
|
|
(252) |
|
|
Total Revenues |
|
|
176,831 |
|
|
206,896 |
|
|
(30,065) |
|
|
Cost of sales, excluding depreciation and amortization (2) |
|
|
(76,618) |
|
|
(126,686) |
|
|
50,068 |
|
|
Adjusted gross margin |
|
|
100,213 |
|
|
80,210 |
|
|
20,003 |
|
|
Operating expenses (2) |
|
|
(57,200) |
|
|
(52,109) |
|
|
(5,091) |
|
|
General and administrative (2) |
|
|
(12,373) |
|
|
(13,092) |
|
|
719 |
|
|
Other income, net |
|
|
256 |
|
|
502 |
|
|
(246) |
|
|
Segment Adjusted EBITDA |
|
$ |
30,896 |
|
$ |
15,511 |
|
$ |
15,385 |
|
|
(1) |
Represents the average daily sales volume in our NGL distribution and sales segment. |
|
(2) |
Certain expenses have been excluded from cost of sales, excluding depreciation and amortization, operating expenses and general and administrative expenses for the purpose of calculating segment Adjusted EBITDA. |
Adjusted gross margin. Adjusted gross margin increased to $100.2 million for the year ended December 31, 2015 from $80.2 million for the year ended December 31, 2014. The increase was primarily due to an increase in the average NGL and refined product sales margin ($14.6 million) combined with an increase in NGL and refined products sales volume ($5.5 million). The average sales margin of NGL and refined products increased due to more favorable market conditions in the year ended December 31, 2015 compared to the year ended December 31, 2014. Sales volumes increased as a result of organic growth in our customer base and the acquisition of Southern Propane in May 2015.
Operating expenses. Operating expenses increased to $57.2 million for the year ended December 31, 2015 from $52.1 million for the year ended December 31, 2014. The increase was primarily due to increases in employee costs of $4.0 million, distribution expenses of $0.6 million and insurance premiums of $0.5 million related to the increased sales volumes.
General and administrative. General and administrative decreased to $12.4 million for the year ended December 31, 2015 from $13.1 million for the year ended December 31, 2014. The decrease was primarily due to changes in our management structure and personnel in the year ended December 31, 2015 compared to the year ended December 31, 2014.
Liquidity and Capital Resources
Distributions
A distribution of $0.3250 per common unit and subordinated unit for the three months ended December 31, 2016 was declared on January 24, 2017 and paid on February 14, 2017 to unitholders of record as of February 7, 2017.
Revolving Credit Facility
Our revolving credit facility had a maturity date of February 12, 2019 and consisted of a $275.0 million revolving line of credit, which included a sub-limit of up to $100.0 million for letters of credit. Our revolving credit facility was available for refinancing and repayment of certain existing indebtedness, working capital, capital
61
expenditures, permitted acquisitions and for general partnership purposes, including distributions, not in contravention of law or the loan documents. Substantially all of our assets, but excluding equity in and assets of unrestricted subsidiaries and other customary exclusions, were pledged as collateral under our revolving credit facility.
On March 8, 2017, in connection with the closing of the AMID Merger, the revolving credit facility was paid off in full and the credit agreement was terminated.
Cash Flow
Cash provided by (used in) operating activities, investing activities and financing activities were as follows for the periods indicated:
|
|
|
Year Ended December 31, |
|||||||
|
|
|
2016 |
|
2015 |
|
2014 |
|||
|
|
|
(in thousands) |
|||||||
|
Operating activities |
|
$ |
45,277 |
|
$ |
46,041 |
|
$ |
30,157 |
|
Investing activities |
|
|
(13,063) |
|
|
(79,077) |
|
|
(46,153) |
|
Financing activities |
|
|
(31,474) |
|
|
31,698 |
|
|
16,087 |
Year Ended December 31, 2016 Compared to Year Ended December 31, 2015
Cash provided by operating activities. Cash provided by operating activities was $45.3 million for the year ended December 31, 2016 compared to $46.0 million for the year ended December 31, 2015. The $0.7 million decrease was primarily attributable to a $7.3 million reduction from the timing of collections and payments and cash used for inventory and an additional $5.9 million reduction from the timing of cash paid for prepaid insurance premiums and amounts received from insurance claims. The overall reduction is partially offset by a $14.2 million reduction in cash payments for commodity derivatives settled, primarily related to our propane financial swap contracts.
Cash used in investing activities. Cash used in investing activities was $13.1 million for the year ended December 31, 2016 compared to $79.1 million for the year ended December 31, 2015. The $66.0 million decrease was primarily due to a decrease in capital expenditures of $46.3 million and an increase of $7.7 million in proceeds from the sale of assets, which includes the sale of our trucking and marketing assets in the Mid-Continent Business. The year ended December 31, 2015 also included $12.6 million in cash used for the acquisition of Southern Propane.
Cash (used in) provided by financing activities. Cash used in financing activities was $31.5 million for the year ended December 31, 2016 compared to cash provided by financing activities of $31.7 million for the year ended December 31, 2015. The $63.2 million change was primarily due to a reduction in net borrowings under our revolving credit facility of $64.0 million and an increase in distributions paid to unitholders of $1.0 million for the year ended December 31, 2016 compared to the year ended December 31, 2015 partially offset by an increase in cash contributions received from our general partner of $1.2 million.
Cash flows from discontinued operations. We combined the cash flows from discontinued operations with the cash flows from continuing operations. The cash flows from discontinued operations related to our operating, investing and financing activities were insignificant. We do not expect the absence of cash flows from these discontinued operations will have a significant impact to our future liquidity.
Year Ended December 31, 2015 Compared to Year Ended December 31, 2014
Cash provided by operating activities. Cash provided by operating activities was $46.0 million for the year ended December 31, 2015 compared to $30.2 million for the year ended December 31, 2014. The $15.8 million increase was primarily attributable to a $15.2 million increase in total Adjusted EBITDA.
Cash used in investing activities. Cash used in investing activities was $79.1 million for the year ended December 31, 2015 compared to $46.2 million for the year ended December 31, 2014. The $32.9 million increase was primarily due to an increase in capital expenditures of $14.1 million in the year ended December 31, 2015 associated with our organic growth projects, $12.6 million related to the acquisition of Southern Propane in 2015 and a $7.4 million
62
decrease in the proceeds from the sale of assets. These increases were partially offset by a $1.2 million change in restricted cash.
Cash provided by financing activities. Cash provided by financing activities was $31.7 million for the year ended December 31, 2015 compared to $16.1 million for the year ended December 31, 2014. For the year ended December 31, 2015, cash provided by financing activities included net borrowings under our revolving credit facility and other debt of $78.6 million, partially offset by distributions to unitholders of $47.0 million. For the year ended December 31, 2014, cash provided by financing activities included cash provided by the issuance of common and preferred units of $302.6 million, partially offset by net payments under our revolving credit facility and other debt of $100.4 million, distributions to unitholders of $92.0 million, $52.0 million used to purchase the Dropdown Assets and $42.4 million of cash used to redeem preferred units.
Cash flows from discontinued operations. We combined the cash flows from discontinued operations with the cash flows from continuing operations. The cash flows from discontinued operations related to our operating, investing and financing activities were insignificant. We do not expect the absence of cash flows from these discontinued operations will have a significant impact to our future liquidity.
Capital Expenditures
Our capital expenditures were $24.7 million, $83.6 million and $108.9 million for the years ended December 31, 2016, 2015 and 2014, respectively, which included capital expenditures for acquisitions of $12.6 million and $52.0 million for the years ended December 31, 2015 and 2014, respectively.
Our capital spending program is focused on expanding our pipeline and cylinder exchange businesses, maintaining our fleet and storage assets and maintaining and updating our information systems. Capital expenditure plans are generally evaluated based on return on investment and estimated incremental cash flow. In addition to annually recurring capital expenditures, potential acquisition opportunities are evaluated based on their anticipated return on invested capital, accretive impact to operating results and strategic fit.
63
Contractual Obligations
A summary of our contractual obligations as of December 31, 2016 is as follows:
|
|
|
|
|
|
|
|
|
|
|
|
|
|
|
|
|
|
|
|
|
Less Than 1 |
|
|
|
|
|
|
|
More Than 5 |
|
|
|
|
||
|
|
|
Year |
|
1‑3 Years |
|
3‑5 Years |
|
Years |
|
Total |
|
|||||
|
|
|
(in thousands) |
|
|||||||||||||
|
Long-term debt obligations(1) |
|
$ |
950 |
|
$ |
177,000 |
|
$ |
— |
|
$ |
— |
|
$ |
177,950 |
|
|
Capital lease obligations(2) |
|
|
105 |
|
|
131 |
|
|
85 |
|
|
— |
|
|
321 |
|
|
Operating lease obligations(2) |
|
|
4,670 |
|
|
6,321 |
|
|
1,100 |
|
|
4,556 |
|
|
16,647 |
|
|
Total |
|
$ |
5,725 |
|
$ |
183,452 |
|
$ |
1,185 |
|
$ |
4,556 |
|
$ |
194,918 |
|
|
(1) |
In January 2017, we paid the final remaining balance on our HBH note payable in full and on March 8, 2017, in connection with the closing of the AMID Merger, the revolving credit facility was paid off in full and the credit agreement was terminated. See Note 11 to our audited consolidated financial statements. |
|
(2) |
Represents future minimum lease payments under non-cancelable operating and capital leases related to various buildings, land, storage facilities, transportation vehicles and office equipment. See Note 10 and Note 15 to our audited consolidated financial statements. |
Off Balance Sheet Arrangements
We have not entered into any transactions, agreements or other contractual arrangements that would result in off balance sheet liabilities, except for operating lease commitments as disclosed in the contractual obligations table above.
Working Capital
Our working capital is the amount by which our current assets exceed our current liabilities and is a measure of our ability to pay our liabilities as they come due. Our working capital was $12.3 million, $16.7 million and $26.3 million as of December 31, 2016, 2015 and 2014, respectively.
Our working capital requirements have been and will continue to be primarily driven by changes in accounts receivable and accounts payable, which generally fluctuate with changes in the market prices of commodities that we buy and sell in the ordinary course of our business. Other factors impacting changes in accounts receivable and accounts payable could include the timing of collections from customers and payments to suppliers, as well as our level of spending for maintenance and growth capital expenditures. A material adverse change in our operations or available financing under our revolving credit facility could impact our ability to fund our working capital requirements for liquidity and capital resources.
Critical Accounting Policies and Estimates
Our significant accounting policies are described in Note 2 to our consolidated financial statements. We prepare our consolidated financial statements in conformity with GAAP, and in the process of applying these principles, we must make judgments, assumptions and estimates based on the best available information at the time. To aid a reader’s understanding, management has identified our critical accounting policies. These policies are considered critical because they are both most important to the portrayal of our financial condition and results, and require our most difficult, subjective or complex judgments. Often they require judgments and estimation about matters which are inherently uncertain and involve measuring, at a specific point in time, events which are continuous in nature. Actual results may
64
differ based on the accuracy of the information utilized and subsequent events, some over which we may have little or no control.
Revenue Recognition
We recognize revenue when persuasive evidence of an arrangement exists, delivery has occurred and/or services have been rendered, the seller’s price to the buyer is fixed and determinable and collectability is reasonably assured. Revenue-related taxes collected from customers and remitted to taxing authorities, principally sales and use taxes, are presented on a net basis within the consolidated statements of operations.
Crude oil pipelines and storage. We generate revenue through crude oil sales and pipeline transportation and storage fees. Revenues for crude oil pipeline transportation services are recognized upon delivery of the product, and when payment has either been received or collection is reasonably assured. For certain crude oil pipeline transportation arrangements, we enter into sale and purchase contracts with counterparties that are the equivalent of pipeline transportation agreements. In such cases, we assess the indicators associated with agent and principal considerations for each arrangement to determine whether revenue should be recorded on a gross basis versus net basis. We also generate revenue through crude oil sales. We enter into outright purchase and sales contracts as well as buy/sell contracts with counterparties, under which contracts we gather and transport different types of crude oil and eventually sell the crude oil to either the same counterparty or different counterparties. We account for such revenue arrangements on a gross basis. Occasionally, we enter into crude oil inventory exchange arrangements with the same counterparty in which the buy and sell of inventory are in contemplation of each other. Revenue from such inventory exchange arrangements is recorded on a net basis. In addition, we also provide crude oil transportation services to third party customers.
Refined products terminals and storage. We generate fee-based revenues with customers under contracts that, consistent with industry practice, typically contain evergreen provisions after an initial term of one to two years. Such fee-based revenues are recognized when services are provided upon delivery of the products to customers. Revenues are also generated by selling excess refined products that result from blending, additization and inventory control processes.
NGLs distribution and sales. Revenues from our NGL distribution and sales segment are mainly generated from NGL and refined product sales, sales of the related parts and equipment and gathering and transportation fees.
Impairment of Long-Lived Assets
Long-lived assets such as property, plant and equipment, and acquired intangible assets subject to depreciation and amortization, are reviewed for impairment whenever events or changes in circumstances indicate that the carrying amount of an asset may not be recoverable. If circumstances require a long-lived asset or asset group to be tested for possible impairment, we first compare undiscounted cash flows expected to be generated by that asset or asset group to its carrying value. If the carrying value of the long-lived asset or asset group is not recoverable on an undiscounted cash flow basis, impairment is recognized to the extent that the carrying value exceeds its fair value. Fair value is determined through various valuation techniques including discounted cash flow models, quoted market values and third-party independent appraisals, as considered necessary. For assets held for sale, we compare the fair value of the disposal group to its carrying value. Under the assets held for sale criteria, the order of impairment is based on (i) testing other assets, such as accounts receivable, inventory and indefinite-lived intangible assets, for impairment, (ii) testing goodwill for impairment and (iii) testing the long-lived asset group for impairment. In connection with the sale of our Mid-Continent Business, which was classified as held for sale at December 31, 2015, we recorded an impairment charge of $5.0 million during the year ended December 31, 2015 related to long-lived assets.
Goodwill
We apply Accounting Standards Codification ("ASC") 805, "Business Combinations," and ASC 350, "Intangibles—Goodwill and Other," to account for goodwill. In accordance with these standards, goodwill is not amortized but is tested for impairment at least annually, or more frequently whenever a triggering event or change in circumstances occurs at the reporting unit level. A reporting unit is the operating segment, or business one level below the operating segment if discrete financial information is prepared and regularly reviewed by segment management. We
65
have the option to first assess qualitative factors to determine whether it is more likely than not that the fair value of the reporting unit is less than its carrying amount as a basis for determining whether further impairment testing is necessary. Impairment is indicated when the carrying amount of a reporting unit exceeds its fair value. To estimate the fair value of the reporting units, we make estimates and judgments about future cash flows, as well as revenues, cost of sales, operating expenses, capital expenditures and net working capital based on assumptions that are consistent with our most recent forecast. At the time it is determined that an impairment has occurred, the carrying value of the goodwill is written down to its fair value.
For the year ended December 31, 2016, we recognized impairment charges of $12.8 million in our Pinnacle Propane Express reporting unit within our NGL distribution and sales segment due primarily to declines in future estimated margins as a result of increased competition and recent increases in propane prices and $2.7 million in our JP Liquids reporting unit within our NGL distribution and sales segment due primarily to declines in future estimated volumes.
In 2015, we recognized impairment charges of $23.6 million and $6.3 million, related to the goodwill in our crude oil supply and logistics reporting unit within our crude oil pipelines and storage segment and JP Liquids reporting unit within our NGL distribution and sales segment, respectively, primarily due to the substantial decline in commodity prices in 2015 and the resulting decline in margin as well as volume in those reporting units. We also recorded an additional goodwill impairment charge of $7.9 million triggered by the disposition of our Mid-Continent Business. The $7.9 million of goodwill was allocated to the Mid-Continent Business and the portion of the reporting unit that was retained by us. No provision for impairment of goodwill was recorded during 2014.
During the second quarter of 2014, immediately prior to the sale of the Bakken Business (defined in Note 3) within the crude oil supply and logistics reporting unit, we allocated $2.0 million of goodwill to the Bakken Business, which was based on the relative fair value of the disposed Bakken Business and the portion of the reporting unit that was retained by us. The $2.0 million allocation contributed to the overall net loss from discontinued operations.
Risk Management Activities and Derivative Financial Instruments
We have established comprehensive risk management policies and procedures to monitor and manage the market risks associated with commodity prices, counterparty credit and interest rates. The board of directors of our general partner is responsible for the overall management of these risks, including monitoring exposure limits. We do not enter into derivative instruments for any purpose other than management of commodity price and interest rate risks. We enter into commodity forward and swap contracts to hedge exposures to market fluctuations in crude oil, refined products and propane prices and interest rate swap contracts to hedge exposures to variable interest rate risk. These derivative contracts are reported in our consolidated balance sheets at fair value with changes in fair value recognized in cost of sales, excluding depreciation and amortization, and interest expense in our consolidated statements of operations. We estimate the fair value of our derivative contracts using industry standard valuation models using market-based observable inputs, including commodity pricing and interest rate curves. Changes in the methods used to determine the fair value of these contracts could have a material effect on our consolidated balance sheets and consolidated statements of operations. For further discussion of derivative contracts, see Note 12 to our audited consolidated financial statements included elsewhere in Form 10-K. We do not anticipate future changes in the methods used to determine the fair value of these derivative contracts.
Business Combinations
When a business is acquired, we allocate the purchase price to the various components of the acquisition based upon the fair value of each component using various valuation techniques, including the market approach, income approach and/or cost approach. ASC 805, Business Combinations, requires most identifiable assets, liabilities, noncontrolling interests and goodwill acquired to be recorded at fair value. Transaction costs related to the acquisition of the business are expensed as incurred. Costs incurred for the issuance of debt associated with a business combination are capitalized and included as a yield adjustment to the underlying debt’s stated rate. Acquired intangible assets other than goodwill are amortized over their estimated useful lives unless the lives are determined to be indefinite.
66
When we acquire a business from an entity under common control, whereby the companies are ultimately controlled by the same party or parties both before and after the transaction, it is treated similar to the pooling of interest method of accounting, whereby the assets and liabilities are recorded at the transferring entity’s historical cost instead of reflecting the fair market value of assets and liabilities.
Equity-Based Compensation
ASC 718, Stock Compensation, requires all share-based payments to employees to be recognized in the financial statements, based on the fair value on the grant date, date of modification or end of the period, as applicable, and recognized in earnings over the requisite service period. Depending upon the settlement terms of the awards, all or a portion of the fair value of equity-based awards may be presented as equity in the consolidated balance sheets. Equity-based compensation costs associated with the portion of awards classified as equity are measured based upon their estimated fair value on the date of grant or modification. Prior to our IPO in October 2014, we used to estimate the fair value of our common units by dividing the estimated total enterprise value by the number of outstanding units. Estimated total enterprise value was determined using the income approach of discounting the estimated future cash flow to its present value. We estimated a 32% forfeiture rate in calculating the unit-based compensation expense associated with our non-vested phantom units.
ITEM 7A. QUANTITATIVE AND QUALITATIVE DISCLOSURES OF MARKET RISK.
Commodity price risk. Market risk is the risk of loss arising from adverse changes in market rates and prices. We manage exposure to commodity price risk in our business segments through the structure of our sales and supply contracts and through a managed hedging program. Our risk management policy permits the use of financial instruments to reduce the exposure to changes in commodity prices that occur in the normal course of business but prohibits the use of financial instruments for trading or to speculate on future changes in commodity prices. See “Note 12 — Derivative Instruments” included in our audited consolidated financial statements in Part IV, Item 15 of this report for additional information.
In our crude oil pipelines and storage segment, we purchase and take title to a portion of the crude oil that we sell, which exposes us to changes in the price of crude oil in our sales markets. We manage this commodity price risk by limiting our net open positions and through the concurrent purchase and sale of like quantities of crude oil that are intended to lock in positive margins based on the timing, location or quality of the crude oil purchased and delivered. In our refined products terminals and storage segment, we sell excess volumes of refined products and our gross margin is impacted by changes in the market prices for these sales. We may execute forward sales contracts or financial swaps to reduce the risk of commodity price changes in this segment. In our NGL distribution and sales business, we are generally able to pass through the cost of products through sales prices to our customers. To the extent we enter into fixed price product sales contracts in this business, we generally hedge our supply costs using fixed price forward contracts and swap contracts. In our cylinder exchange business, we sell approximately half of our volumes pursuant to contracts of generally one to three years in duration, which allow us to re-negotiate prices at the time of contract renewal, and we sell the remaining volumes on demand or under month-to-month contracts and generally adjust prices on these contracts on an annual basis. We hedge a majority of the forecasted volumes under our fixed-price contracts using financial swaps, and we may also use financial swaps to manage commodity price risk on our month-to-month contracts. At times we may also terminate or unwind hedges or a portion of hedges in order to meet cash flow objectives or when the expected future volumes do not support the level of hedges. In our NGL transportation business, we do not take title to the products we transport and therefore have no direct commodity price exposure.
67
Sensitivity analysis. The table below summarizes our commodity-related financial derivative instruments and fair values, as well as the effect of an assumed hypothetical 10% change in the underlying price of the commodity.
|
|
|
Maturity |
|
Notional Volume |
|
Fair Value Asset/(Liability) |
|
Effect of Hypothetical 10% Change |
||||
|
|
|
|
|
|
|
|
|
(in thousands) |
||||
|
Commodity Swaps : |
|
|
|
|
|
|
|
|
|
|
|
|
|
Propane Fixed Price (Gallons) |
|
|
Jan 2017 - Nov 2018 |
|
|
4,364,880 |
|
$ |
530 |
|
$ |
284 |
|
Crude Oil Basis (Barrels) |
|
|
Jan 2017 - Mar 2017 |
|
|
180,000 |
|
|
112 |
|
|
(2) |
Price-risk sensitivities were calculated by assuming a theoretical 10% change (increase or decrease) in price regardless of term or historical relationships between the contractual price of the instruments and the underlying commodity price. Results are presented in absolute terms and represent a potential gain or loss in net income. The preceding hypothetical analysis is limited because changes in prices may or may not equal 10% and actual results may differ.
Interest rate risk. Our revolving credit facility bears interest at a variable rate and exposes us to interest rate risk. From time to time, we may use certain derivative instruments to hedge our exposure to variable interest rates. As of December 31, 2016, $100.0 million of our outstanding debt is economically hedged using financial interest rate swaps. Based on our unhedged interest rate exposure to variable rate debt outstanding as of December 31, 2016, a 1% increase or decrease in interest rates would change annual interest expense by approximately $0.8 million.
We do not hold or purchase financial instruments or derivative financial instruments for trading purposes.
Credit risk. We are exposed to credit risk. Credit risk represents the loss that we would incur if a counterparty fails to perform under its contractual obligations. We manage our exposure to credit risk associated with customers to whom we extend credit through analyzing the counterparties’ financial condition prior to entering into an agreement, establishing credit limits, monitoring the appropriateness of these limits on an ongoing basis and entering into netting agreements that allow for offsetting counterparty receivable and payable balances for certain transactions, as deemed appropriate. We may request letters of credit, cash collateral, prepayments or guarantees as forms of credit support.
ITEM 8. FINANCIAL STATEMENTS AND SUPPLEMENTARY DATA.
Our audited consolidated financial statements are included in this Annual Report on Form 10-K and incorporated herein by reference. See the Index to Consolidated Financial Statements on page F-1.
ITEM 9. CHANGES IN AND DISAGREEMENTS WITH ACCOUNTANTS ON ACCOUNTING AND FINANCIAL DISCLOSURE.
None.
ITEM 9A. CONTROLS AND PROCEDURES.
Evaluation of Disclosure Controls and Procedures
An evaluation was performed under the supervision and with the participation of the Partnership’s management, including the Chief Executive Officer and Chief Financial Officer, of the effectiveness of the design and operation of our disclosure controls and procedures, as defined in Rule 13a-15(e) of the Securities Exchange Act of 1934, as amended (the “Exchange Act”), as of December 31, 2016. Based on this evaluation, our Chief Executive Officer and Chief Financial Officer concluded that as of December 31, 2016, our disclosure controls and procedures were effective to provide reasonable assurance that information required to be disclosed by us in the reports that we file or submit under the Exchange Act is recorded, processed, summarized and reported within the time periods specified in the SEC’s rules and forms and to provide reasonable assurance that such information is accumulated and communicated to our
68
management, including our Chief Executive Officer and Chief Financial Officer, as appropriate to allow timely decisions regarding required disclosures.
Changes in Internal Control over Financial Reporting
There have been no changes in our internal control over financial reporting in connection with the evaluation required by Rule 13a-15(d) of the Exchange Act that occurred during the fourth quarter that has materially affected, or is reasonably likely to materially affect, our internal control over financial reporting.
Management’s Report on Internal Control over Financial Reporting
Company management is responsible for establishing and maintaining adequate internal control over financial reporting (as is defined in the Exchange Act Rule 13a-15(f)). Our internal control over financial reporting is designed to provide reasonable assurance regarding the reliability of financial reporting and the preparation of our financial statements for external purposes in accordance with generally accepted accounting principles. We used the criteria established in Internal Control-Integrated Framework (2013) issued by the Committee of Sponsoring Organizations of the Treadway Commission (''COSO") to evaluate the effectiveness of our internal control over financial reporting as of December 31, 2016. Based on that evaluation, our management concluded that our internal control over financial reporting was effective as of December 31, 2016.
PricewaterhouseCoopers LLP, our independent registered public accounting firm, audited the effectiveness of our internal control over financial reporting as of December 31, 2016, as stated in their report which appears under Item 15.
Goodwill Impairment
As part of our annual assessment of goodwill impairment conducted in connection with the preparation of our financial statements for the period ended December 31, 2016, we recorded impairment charges of $12.8 million in our Pinnacle Propane Express reporting unit within our NGL distribution and sales segment due primarily to declines in future estimated margins as a result of increased competition and recent increases in propane prices and $2.7 million in our JP Liquids reporting unit within our NGL distribution and sales segment due primarily to declines in future estimated volumes.
The impairment charges described above are not expected to result in future capital expenditures. For additional information, see “Management’s Discussion and Analysis of Financial Condition and Results of Operations – Critical Accounting Policies and Estimates – Goodwill and Intangible Assets.”
ITEM 10. DIRECTORS, EXECUTIVE OFFICERS AND CORPORATE GOVERNANCE.
Management of JP Energy Partners LP
The information contained in this section speaks as of March 7, 2017.
We are managed by the directors and executive officers of our general partner, JP Energy GP II LLC. Our general partner is not elected by our unitholders and will not be subject to re-election by our unitholders in the future. Lonestar and members of our management directly own 100% of the membership interests in our general partner. Our general partner has a board of directors, and our unitholders are not entitled to elect the directors and cannot directly or indirectly participate in our management or operations. Our general partner will be liable, as general partner, for all of our debts (to the extent not paid from our assets), except for indebtedness or other obligations that are made specifically nonrecourse to it. Whenever possible, we intend to incur indebtedness that is nonrecourse to our general partner.
69
Our general partner has nine directors, including three independent directors. The members of our general partner, including Lonestar, will appoint all members to the board of directors of our general partner. Our board has determined that T. Porter Trimble, Norman J. Szydlowski and Josh L. Sherman are independent under the independence standards of the NYSE.
Neither we nor our subsidiaries will have any employees. Our general partner will have the sole responsibility for providing the employees and other personnel necessary to conduct our operations. All of the employees that conduct our business will be employed by our general partner, but we sometimes refer to these individuals in this Form 10-K as our employees.
Director Independence
Although most companies listed on the NYSE are required to have a majority of independent directors serving on the board of directors of the listed company, the NYSE does not require a publicly traded partnership like us to have a majority of independent directors on the board of directors of our general partner or to establish a compensation or a nominating and corporate governance committee. We are, however, required to have an audit committee of at least three members within one year of the date our common units are first listed on the NYSE, and all of our audit committee members are required to meet the independence and financial literacy tests established by the NYSE and the Exchange Act.
Committees of the Board of Directors
The board of directors of our general partner has an audit committee, a compensation committee and, as necessary, a conflicts committee, and may have such other committees as the board of directors shall determine from time to time. Each of the committees of the board of directors has the composition and responsibilities described below.
Audit Committee
T. Porter Trimble, Norman J. Szydlowski and Josh L. Sherman serve as members of our audit committee. Our audit committee assists the board of directors in its oversight of the integrity of our financial statements and our compliance with legal and regulatory requirements and corporate policies and controls. Our audit committee has the sole authority to retain and terminate our independent registered public accounting firm, approve all auditing services and related fees and the terms thereof, and pre-approve any non-audit services to be rendered by our independent registered public accounting firm. Our audit committee is responsible for confirming the independence and objectivity of our independent registered public accounting firm. Our independent registered public accounting firm is given unrestricted access to our audit committee.
Josh L. Sherman has been designated by the board as the audit committee’s financial expert meeting the requirements promulgated by the SEC and set forth in Item 407(d) of Regulation S-K based upon his education and employment experience as more fully detailed in Mr. Sherman’s biography set forth below. Mr. Sherman also acts as the Chairman of our audit committee.
Compensation Committee
John F. Erhard, Norman J. Szydlowski and T. Porter Trimble serve as members of our compensation committee. The compensation committee will establish salaries, incentives and other forms of compensation for officers and other employees. The compensation committee also administers our incentive compensation and benefit plans. The NYSE does not require publicly traded partnerships, such as us, to have a compensation committee or, for publicly traded partnerships like us that have voluntarily elected to have a compensation committee, require that the members of the compensation committee be independent directors.
70
Conflicts Committee
At least two members of the board of directors of our general partner will serve on our conflicts committee each time it is formed to review specific matters that may involve conflicts of interest in accordance with the terms of our partnership agreement. T. Porter Trimble, Norman J. Szydlowski and Josh L. Sherman have, in the past, served as the members of the conflicts committee. Our conflicts committee will determine if the resolution of the conflict of interest is fair and reasonable to us. The members of our conflicts committee may not be officers or employees of our general partner or directors, officers, or employees of its affiliates, and must meet the independence and experience standards established by the NYSE and the Exchange Act to serve on an audit committee of a board of directors. In addition, the members of our conflicts committee may not own any interest in our general partner or any interest in us or our subsidiaries other than (i) common units and (ii) awards under our incentive compensation plan. Any matters approved by our conflicts committee will be presumed to have been approved in good faith, will be deemed to be approved by all of our partners and will not be a breach by our general partner of any duties it may owe us or our unitholders.
Corporate Governance
Our general partner has adopted a code of business conduct and ethics for all directors, officers, employees, and agents. If our general partner amends the code of business conduct and ethics or grants a waiver, including an implicit waiver, from the code of business conduct and ethics, we will disclose this information on our website. Our general partner has also adopted corporate governance guidelines that outline the important policies and practices regarding our corporate governance and provide that the Chairman of the Audit Committee shall preside over any executive sessions. Our corporate governance guidelines also outline how interested parties may communicate directly with the independent Board members.
Section 16(a) Beneficial Ownership Reporting Compliance
Section 16(a) of the Exchange Act requires our general partner’s board of directors and executive officers, and persons who own more than 10% of a registered class of our equity securities, to file with the SEC, and any exchange or other system on which such securities are traded or quoted, initial reports of ownership and reports of changes in ownership of our common units and other equity securities. Officers, directors and greater than 10% unitholders are required by the SEC’s regulations to furnish to us and any exchange or other system on which such securities are traded or quoted with copies of all Section 16(a) forms they file with the SEC.
Based solely upon a review of Forms 3, 4 and 5, and amendments thereto, we know of no director, officer, or beneficial owner of more than 10% of any class of our equity securities registered pursuant to Section 12 of the Exchange Act that failed to file timely any reports required to be furnished during 2016 pursuant to Section 16(a) of the Exchange Act.
Directors and Executive Officers of JP Energy GP II LLC
Directors are elected by the members of our general partner and hold office until their successors have been elected or qualified or until their earlier death, resignation, removal or disqualification. Executive officers are appointed by, and serve at the discretion of, the board of directors. The following table shows information for the directors and executive officers of JP Energy GP II LLC as of March 7, 2017.
71
|
Name |
|
Age |
|
Position with JP Energy GP II LLC |
||
|
J. Patrick Barley |
|
42 |
|
Chairman of the Board, President and Chief Executive Officer |
||
|
Patrick J. Welch |
|
49 |
|
Executive Vice President, Chief Financial Officer and Director |
||
|
Jon E. Hanna |
|
51 |
|
Executive Vice President—Crude Oil Pipelines and Storage |
||
|
Shiming Chen |
|
42 |
|
Senior Vice President and Chief Accounting Officer |
||
|
Cory Willis |
|
40 |
|
Senior Vice President—Terminals and Distribution |
||
|
John F. Erhard |
|
42 |
|
Director |
||
|
Daniel R. Revers |
|
55 |
|
Director |
||
|
Evan M. Schwartz |
|
34 |
|
Director |
||
|
Greg Arnold |
|
53 |
|
Director |
||
|
T. Porter Trimble |
|
56 |
|
Director |
||
|
Norman J. Szydlowski |
|
65 |
|
Director |
||
|
Josh L. Sherman |
|
41 |
|
Director |
||
J. Patrick Barley. J. Patrick Barley has served as President, Chief Executive Officer and Chairman of the Board of directors of our general partner since May 2010. Mr. Barley brings over 16 years of experience managing early-stage investments. Prior to founding JP Energy Partners, Mr. Barley was the Founder, President and Chief Executive Officer of Lonestar Midstream Partners, LP (“Lonestar Midstream”), a midstream company focused on natural gas gathering and processing, from March 2005 to July 2008. Mr. Barley managed his private investments from the sale of Lonestar Midstream to Penn Virginia Resources Partners LP in July 2008 until he founded JP Energy Partners in May 2010. In 2004, Mr. Barley formed his own private investment firm, CB Capital, LLC, which served as the general partner of Lonestar Midstream. Prior to forming CB Capital, LLC, Mr. Barley was a partner at Greenfield Capital Management, LLC from 1999 to 2004. Mr. Barley earned a Bachelor of Science from Texas Tech University and a Master of Business Administration in Finance from Southern Methodist University.
Patrick J. Welch. Patrick J. Welch has served as the Executive Vice President and Chief Financial Officer of our general partner since April 2014 and served as Interim Chief Financial Officer of our general partner from November 2013 to April 2014. Mr. Welch was named to the board of directors of our general partner in October 2014. From August 2013 to April 2014, Mr. Welch served as a Managing Director at Opportune LLP, an independent consultancy focused exclusively on the energy industry. From March 2012 to August 2013, Mr. Welch served as an independent consultant, advising and assisting clients in all aspects of the CFO function in energy companies with a focus on IPO readiness. From June 2011 through March 2012, he served as Chief Financial Officer for RES Americas, a privately held renewable energy development and construction company with activities in the United States and Canada. Mr. Welch served as the Chief Financial Officer of Atlantic Power Corporation (NYSE: AT) from May 2006 through June 2011. Mr. Welch has an extensive background in the energy and independent power industries. Before joining Atlantic Power Corporation, from January 2004 to May 2006, Mr. Welch was Vice President and Controller of DCP Midstream and DCP Midstream Partners, LP (NYSE: DPM) in Denver, Colorado. Prior to that he held various positions at Dynegy Inc. (NYSE: DYN) in Houston, Texas, including Vice President and Controller for Dynegy Generation, and Assistant Corporate Controller. Prior to Dynegy, Mr. Welch was a Senior Audit Manager in the Energy, Utilities and Mining Practice of PricewaterhouseCoopers LLP, predominantly in Houston, Texas, where he served several major energy clients. Mr. Welch earned his Bachelor’s Degree from the University of Central Oklahoma and is a Certified Public Accountant.
Jon E. Hanna. Jon E. Hanna has served as Executive Vice President—Crude Oil Pipelines and Storage of our general partner since September 2015 and served as Executive Vice President—Commercial and Business Development from January 2014 to September 2015. Prior to joining JP Energy Partners, Mr. Hanna was Vice President—Business Development of Enable Midstream Partners, a natural gas gathering, processing, transportation and storage partnership, from August 2011 to December 2013. Prior to Enable, Mr. Hanna served as Vice President—Market Development for ONEOK Partners, a natural gas gathering, processing, storage and transportation partnership, from July 2007 to August 2011 and as Vice President—Business Development for ONEOK Hydrocarbon L.P., a NGL processing, storage and transportation partnership, from July 2005 to July 2007. Mr. Hanna held various other positions with ONEOK NGL Marketing, L.P. and ONEOK Energy Marketing from September 2000 to July 2005. Prior to joining ONEOK, Mr. Hanna held positions with Texaco Inc. relating to its NGL and natural gas businesses from November 1989 to September 2000. Mr. Hanna earned a Bachelor of Science in Business Administration from Drake University.
72
Shiming (Simon) Chen. Simon Chen has served as the Senior Vice President and Chief Accounting Officer of our general partner since November 2014. Mr. Chen served as Vice President, Chief Accounting Officer and Controller of our general partner from November 2014 to September 2015 and as Vice President and Controller of our general partner from February 2013 to November 2014. Prior to joining JP Energy Partners, Mr. Chen served as the Assistant Controller from October 2010 to February 2013, and Director of Financial Reporting from July 2009 to October 2010 for Regency Energy Partners LP, a midstream company focusing on the gathering, transportation, and storage of NGLs and crude oil, natural gas and NGL marketing and trading, and the management of coal and natural resource properties in the United States. Prior to joining Regency Energy Partners LP, Mr. Chen served in various roles with the assurance and business advisory services practice of PricewaterhouseCoopers LLP from 2003 to 2009. Mr. Chen is a Certified Public Accountant.
Cory Willis. Cory Willis has served as the Senior Vice President—Terminals and Distribution of our general partner since September 2015 and served as Vice President—Natural Gas Liquids of our general partner from March 2015 to September 2015. Mr. Willis provided independent consulting services to clients engaged in the acquisition, development, and operation of energy assets from October 2013 to February 2015. From September 2012 to September 2013, Mr. Willis was the Vice President, Asset Management — West for Atlantic Power Corporation. Mr. Willis joined Atlantic Power as Director, Asset Management in March 2011 and was Atlantic Power’s Vice President and Chief Administrative Officer from June 2011 through September 2012, leading the company’s Human Resources, Information Technology, and Environmental Health & Safety functions. From 2003 through February 2011, Mr. Willis worked for Goldman Sachs & Co. and its Cogentrix Energy subsidiary in various positions, including as Vice President, Development & Asset Management. Mr. Willis holds a Bachelor’s Degree in Information and Operations Management from Texas A&M University.
John F. Erhard. John F. Erhard was named a member of the board of directors of our general partner in July 2011 and was appointed to the board in connection with his affiliation with ArcLight, which controls our general partner. Mr. Erhard, a Partner at ArcLight, joined the firm in 2001 and has 15 years of energy finance and private equity experience. Prior to joining ArcLight, he was an Associate at Blue Chip Venture Company, a venture capital firm focused on the information technology sector. Mr. Erhard began his career at Schroders, where he focused on mergers and acquisitions. Mr. Erhard earned a Bachelor of Arts in Economics from Princeton University and a Juris Doctor from Harvard Law School. Mr. Erhard previously served on the board of directors of Patriot Coal and on the board of directors of Buckeye GP Holdings (NYSE: BGH), the publicly traded general partner of Buckeye Partners (NYSE: BPL). In addition, Mr. Erhard has experience in the master limited partnership sector. He is currently serving on the board of directors of the general partner of American Midstream (NYSE: AMID), the company with which we recently merged with. We believe that Mr. Erhard’s considerable energy, finance and private equity experience, including his experience with master limited partnerships, provide him with the necessary skills to be a member of the board of directors of our general partner.
Daniel R. Revers. Daniel R. Revers was named a member of the board of directors of our general partner in June 2011 and was appointed to the board in connection with his affiliation with ArcLight, which controls our general partner. Mr. Revers is Managing Partner of and a co-founder of ArcLight Capital Partners, LLC and has 25 years of energy finance and private equity experience. Mr. Revers manages the Boston office of ArcLight and is responsible for overall investment, asset management, strategic planning, and operations of ArcLight and its funds. Prior to forming ArcLight in 2000, Mr. Revers was a Managing Director in the Corporate Finance Group at John Hancock Financial Services, where he was responsible for the origination, execution, and management of a $6 billion portfolio consisting of debt, equity, and mezzanine investments in the energy industry. Prior to joining John Hancock in 1995, Mr. Revers held various financial positions at Wheelabrator Technologies, Inc., where he specialized in the development, acquisition, and financing of domestic and international power and energy projects. In addition, Mr. Revers is currently serving on the board of directors of the general partner of American Midstream and the board of directors of the general partner of TransMontaigne Partners L.P. (NASDAQ: TLP). Mr. Revers also serves in various capacities for a number of not-for-profit organizations, currently serving on the Board of Overseers at the Amos Tuck School of Business Administration and the board of directors of the Citizen Schools. Mr. Revers earned a Bachelor of Arts in Economics from Lafayette College and a Master of Business Administration from the Amos Tuck School of Business Administration at Dartmouth College. We believe that Mr. Revers’ significant energy, finance and private equity experience provide him with the necessary skills to be a member of the board of directors of our general partner.
73
Evan M Schwartz. Evan M. Schwartz was named a member of the board of directors of our general partner in September 2015 and was appointed to the board in connection with his affiliation with ArcLight, which controls our general partner. Mr. Schwartz is a Director at ArcLight, where he has worked since 2011, and has more than eight years of experience in energy finance. Prior to joining ArcLight, Mr. Schwartz worked at DC Energy and McKinsey & Company. Mr. Schwartz is a CFA charterholder and holds a Bachelor of Arts in Chemistry and Physics from Harvard University and a Master of Business Administration from the MIT Sloan School of Management. Mr. Schwartz was selected to serve as a director of the board due to his affiliation with ArcLight, his in-depth knowledge of the energy industry and his financial and business expertise.
Greg Arnold. Greg Arnold was named to the board of directors of our general partner in November 2012 and was appointed to the board in connection with the acquisition of our North Little Rock, Arkansas and Caddo Mills, Texas refined products terminals in November 2012. Mr. Arnold has over 25 years of midstream and downstream refined products experience. Mr. Arnold is currently the President, CEO and Chairman of the board of directors of Truman Arnold Companies, a privately owned national petroleum marketing and aviation fixed-based operation company, where he has been since 1987. Mr. Arnold was named President and Chief Operation Officer of Truman Arnold Companies in 1990 and was named President and Chief Executive Officer in 2003. Mr. Arnold has previously served on the board of directors of Century Bancshares, Inc. from 1998 until December of 2008. Additionally, Mr. Arnold served on the board of Christus St. Michael Hospital board prior to 2009. Mr. Arnold received a Bachelor of Business Administration from Stephen F. Austin University. We believe that Mr. Arnold’s significant energy industry and financial experience provide him with the necessary skills to be a member of the board of directors of our general partner.
T. Porter Trimble. T. Porter Trimble was named to the board of directors of our general partner in October 2014. Mr. Trimble founded Fleur de Lis Energy, L.L.C., a private firm specializing in direct investments in upstream oil and gas assets, in January 2014 and has served as its President since founding. From 2008 until December 2013, Mr. Trimble served as Vice Chairman of Merit Energy Company, a private firm specializing in direct investments in oil and gas assets. Between 2004 and 2008, Mr. Trimble was an Executive Vice President at Merit, in which role he was responsible for the oversight and implementation of Merit’s acquisition strategy and the articulation of that strategy to investors. Mr. Trimble has been directly involved in the purchase of over $6.0 billion in oil and gas assets while at Merit and served as a member of its board of directors and its audit committee from 2004 until December 2013. Prior to joining Merit in 1992, Mr. Trimble was with Graham Resources, Inc. in various acquisition and operational positions, and, before that, was in drilling operations for Amoco Production Company in the Gulf of Mexico. Mr. Trimble holds a Bachelor of Science degree in Petroleum Geology from Louisiana State University and a Master of Engineering degree in Petroleum Engineering from Tulane University. We believe that Mr. Trimble’s significant energy industry experience, particularly his acquisition strategy and upstream oil and gas expertise, provides him with the necessary skills to be a member of the board of directors of our general partner.
Norman J. Szydlowski. Norman J. Szydlowski was named to the board of directors of our general partner in October 2014. From April 2014 through September 2014, Mr. Szydlowski managed his personal investments as a private investor. Mr. Szydlowski served as President and Chief Executive Officer and Chairman of the board of directors of Rose Rock Midstream GP, LLC from December 2011 to April 2014. Mr. Szydlowski served as a director and as President and Chief Executive Officer of SemGroup Corporation from November 2009 to April 2014 and as a director of NGL Energy Partners from November 2011 to April 2014. Mr. Szydlowski also served on the board of directors of the general partner of Transocean Partners LLC from November 2014 to December 2016. From January 2006 until January 2009, Mr. Szydlowski served as President and Chief Executive Officer of Colonial Pipeline Company, an interstate common carrier of petroleum products. From 2004 to 2005, he served as a senior consultant to the Iraqi Ministry of Oil in Baghdad on behalf of the U.S. Department of Defense, where he led an advisory team in the rehabilitation, infrastructure security and development of future strategy of the Iraqi oil sector. From 2002 until 2004, he served as vice president of refining for Chevron Corporation (formerly ChevronTexaco), one of the world’s largest integrated energy companies. Mr. Szydlowski joined Chevron in 1981 and served in various capacities of increasing responsibility in sales, planning, supply chain management, refining and plant operations, transportation and construction engineering. In addition, Mr. Szydlowski serves on the board of directors of the general partner of 8point3 Energy Partners, LP (NASDAQ: CAFD). We believe that Mr. Szydlowski’s significant energy industry experience provides him with the necessary skills to be a member of the board of directors of our general partner.
74
Josh L. Sherman. Josh L. Sherman was named to the board of directors of our general partner in January 2015. Mr. Sherman is a partner at Opportune LLP (“Opportune”), an independent consultancy focused exclusively on the energy industry. Since January 2008, Mr. Sherman has been the partner in charge of the Complex Financial Reporting group of Opportune and previously held the title of managing director from June 2006 through December 2007. Mr. Sherman has over 16 years of experience with the technical aspects of financial reporting, SEC filings, valuation and financial due diligence assistance. Prior to working with Opportune, Mr. Sherman was employed as a director with Sirius Solutions LLLP, where he provided energy consulting services from September 2002 to June 2006. Mr. Sherman worked in the audit and global energy markets departments with Deloitte & Touche from January 1997 to August 2002, where he managed the audits of regulated gas and electric utilities, independent power producers and energy trading entities. A Certified Public Accountant and a member of the American Institute of Certified Public Accountants and the National Association of Corporate Directors, Mr. Sherman holds a BBA and a Masters in Accountancy from the University of Texas. Mr. Sherman served on the board of directors of Trans Energy, Inc. from September 2012 to December 2016, where he was also chairman of the Audit Committee, chairman of the Compensation Committee and a member of the Governance Committee. Mr. Sherman also previously served on the board of directors of Voyager Oil & Gas (Emerald Oil). Based on the attributes, education, and experience requirements set forth in the rules of the SEC and the NYSE, the Board has determined that Mr. Sherman qualifies as an “Audit Committee Financial Expert.” We believe that Mr. Sherman’s extensive energy, audit and financial reporting experience provide him with the necessary skills to be a member of the board of directors of our general partner.
Board Leadership Structure
The president and chief executive officer of our general partner currently serves as the chairman of the board. The board of directors of our general partner has no policy with respect to the separation of the offices of chairman of the board of directors and chief executive officer. Instead, that relationship is defined and governed by the amended and restated operating agreement of our general partner, which permits the same person to hold both offices. Directors of the board of directors of our general partner are designated or elected by the members of our general partner, including Lonestar and certain members of management. Accordingly, unlike holders of common stock in a corporation, our unitholders will have only limited voting rights on matters affecting our business or governance, subject in all cases to any specific unitholder rights contained in our partnership agreement.
Board Role in Risk Oversight
Our corporate governance guidelines provides that the board of directors of our general partner is responsible for reviewing the process for assessing the major risks facing us and the options for their mitigation. This responsibility is largely satisfied by our audit committee, which is responsible for reviewing and discussing with management and our registered public accounting firm our major risk exposures and the policies management has implemented to monitor such exposures, including our financial risk exposures and risk management policies.
ITEM 11. EXECUTIVE COMPENSATION.
Compensation Discussion and Analysis
We do not directly employ any of the persons responsible for managing our business. Our general partner, under the direction of its board of directors, is responsible for managing our operations and employs all of the employees that operate our business. The compensation payable to the officers of our general partner is paid by our general partner and such payments are reimbursed by us. For more information please read “Our Partnership Agreement—Reimbursement of Expenses.” However, we sometimes refer to the employees and officers of our general partner as our employees and officers in this Compensation Discussion and Analysis.
This Compensation Discussion and Analysis provides an overview and analysis of (i) the elements of our compensation program for our named executive officers, or NEOs, identified below, (ii) the material compensation decisions made under that program and reflected in the executive compensation tables that follow this Compensation Discussion and Analysis and (iii) the material factors considered in making those decisions. Our general partner intends to provide our NEOs with compensation that is significantly performance based. Our executive compensation program is designed to align executive pay with our performance on both short and long-term bases, link executive pay to the
75
creation of value for unitholders and utilize compensation as a tool to assist us in attracting and retaining the high-caliber executives that we believe are critical to our long-term success.
The primary elements of our executive compensation program and their corresponding objectives are identified in the following table.
|
Compensation Element |
|
Primary Objective |
|
Base salary |
|
Recognize performance of job responsibilities and attract and retain individuals with superior talent. |
|
|
|
|
|
Annual performance-based compensation |
|
Promote near-term performance and reward individual contributions to our business on an annual basis. |
|
|
|
|
|
Discretionary long-term equity incentive awards |
|
Emphasize long-term performance objectives, encourage the maximization of unitholder value and retain key executives by providing an opportunity to participate in the ownership and value creation in our partnership. |
|
|
|
|
|
Retirement savings (401(k)) plan |
|
Provide an opportunity for tax-efficient savings and long term financial security. |
|
|
|
|
|
Other elements of compensation and perquisites |
|
Attract and retain talented executives in a cost-efficient manner by providing benefits with high perceived values at relatively low cost. |
To serve the foregoing objectives, our overall executive compensation program is generally designed to be flexible rather than formulaic. Our compensation decisions for our NEOs in fiscal 2016 are discussed below in relation to each of the above-described elements of our compensation program. The below discussion is intended to be read in conjunction with the executive compensation tables and related disclosures that follow this Compensation Discussion and Analysis.
For the year ended December 31, 2016, our NEOs were:
|
· |
J. Patrick Barley, our Executive Chairman, President and Chief Executive Officer; |
|
· |
Patrick Welch, our Executive Vice President and Chief Financial Officer; |
|
· |
Jon Hanna, our Executive Vice President—Crude Oil, Pipelines and Storage; |
|
· |
Shiming Chen, our Senior Vice President and Chief Accounting Officer; and |
|
· |
Forgan McIntosh, our former Senior Vice President—Commercial and Corporate Development. Mr. McIntosh resigned from his position with us effective February 24, 2017. |
Compensation Overview
Our overall compensation program is structured to attract, motivate and retain highly qualified executive officers by paying them competitively, consistent with our success and their contribution to that success. We believe compensation should be structured to ensure that a significant portion of compensation opportunity will be related to factors that directly and indirectly influence unitholder value. Consistent with our performance-based philosophy, we provide a base salary to our NEOs and significant incentive-based compensation opportunity, which includes variable awards under our annual incentive bonus program.
76
In 2016, our general partner made annual grants of equity-based awards as a means of compensating our executives. Equity-based awards were granted to each of our NEOs in 2016, and we believe that equity participation by our NEOs is an important component of NEO pay.
Determination of Compensation Awards
The compensation committee of the board of directors of our general partner, or the Compensation Committee, is provided with the primary authority to determine and approve the compensation awards available to our NEOs and is charged with reviewing our executive compensation policies and practices to ensure (i) adherence to our compensation philosophies and (ii) that the total compensation paid to our NEOs is fair, reasonable and competitive, taking into account our position within our industry and the level of expertise and experience of our NEOs in their positions. As a result, the Compensation Committee periodically (i) reviews each NEO’s base salary, (ii) assesses the performance of the Chief Executive Officer and other NEOs for each applicable performance period and (iii) determines the amount of awards to be paid to our Chief Executive Officer and other NEOs under our annual bonus incentive program for each year. In making compensation and performance determinations for our NEOs other than our CEO, the Compensation Committee will consider the recommendations of our CEO. Additionally, on a historical basis, performance determinations for our NEOs have been made in a subjective and discretionary manner without regard to pre-determined financial, operational or other performance goals or metrics.
In determining compensation levels for our NEOs, our general partner considers each NEO’s unique position and responsibility and relies upon the judgment and industry experience of its members, including their knowledge of competitive compensation levels in our industry. We believe that our NEOs’ base salaries should be competitive with salaries for executive officers in similar positions and with similar responsibilities in our marketplace and adjusted for financial and operating performance and previous work experience. In this regard, each NEO’s current and prior compensation, including compensation paid by the NEO’s prior employer, is considered as a reference point against which determinations are made as to whether increases are appropriate to retain the NEO in light of competition or in order to provide continuing performance incentives.
At the request of our board of directors, our Vice President — Human Resources reviews and provides input on the compensation of our NEOs, trends in executive compensation, meeting materials prepared for and circulated to our board of directors and management’s proposed executive compensation plans.
While we do not apply rigid formulas in determining the amount and mix of compensation elements, we consider long-term Company performance trends and review each element of compensation as described in this Annual Report on Form 10-K in evaluating and approving the total compensation of each of our NEOs. We have also used an internal Certified Compensation Professional (CCP) to perform market studies. External surveys have also been used to benchmark similar NEO positions and the scope of these positions by comparing total compensation in a similar industry, revenue size and geographic location. For example, for 2015 compensation studies, we used the Economic Resources Institute (ERI) and Aon/Hewitt 2015 U.S. Total Compensation Measurement Executive Survey. We do not benchmark compensation for our NEOs at any particular percentile of the companies included in these surveys; rather the Compensation Committee considered a variety of factors in making compensation decisions. In general, we maintain and incorporate flexibility into our compensation programs and in the assessment process to respond to and adjust for the evolving business environment and individual performance. Surveys generally were not referenced in 2016, as no changes to compensation levels were made.
Base Compensation for 2016
We believe that executive officer base salaries should be competitive with salaries for executive officers in similar positions with similar responsibilities in our marketplace. Each year we determine base salary increases, if any, based upon the performance of our NEOs as assessed by the Compensation Committee and based upon market conditions, and for NEOs other than the Chief Executive Officer, in conjunction with the recommendations made by the Chief Executive Officer. No base salary changes were made for 2016.
77
Annual Performance-Based Compensation for 2016
We structure our compensation programs to reward executive officers based on our performance and the individual executive’s relative contribution to that performance. Each of our NEOs participates in our annual bonus program, under which cash incentive awards are determined annually in the discretion of the Compensation Committee of the board of directors of our general partner. In making individual annual bonus decisions, the Compensation Committee of the board of directors of our general partner has not historically relied on pre-determined performance goals or targets and did not do so for 2016. Instead, determinations regarding annual bonus compensation awards have been based on a subjective assessment of all reasonably available information, including the applicable executive’s business impact, contributions and leadership, among other factors. The target annual bonus opportunity, expressed as a percentage of salary, for each of our NEOs for 2016 was as follows: Mr. Barley: 100%; Mr. Welch: 75%; Mr. Hanna: 50%; Mr. Chen: 50%; and Mr. McIntosh: 40%.
In connection with our entry into the Merger Agreement, the board of directors of our general partner determined to award each NEO an annual bonus for 2016 at the target level in recognition of our executives’ efforts in connection with such transaction and to reward their service and loyalty. The 2016 bonus amounts are set forth in the Summary Compensation Table for 2016 below and were paid on February 24, 2017.
Long-Term Equity Incentive Awards
In 2016, our general partner made annual grants of equity-based awards in the form of phantom units with distribution equivalent rights as a means of compensating our executives, primarily to encourage executive retention, promote a long-term focus and align executive and unitholder interests.
Each phantom unit is the economic equivalent of one common unit and is accompanied by a distribution equivalent right entitling the holder to an amount equal to any cash distributions paid in respect of our common units underlying the phantom units. The awards to each of Messrs. Barley, Welch, Hanna, Chen and McIntosh vest in three equal annual installments beginning on the first anniversary of the grant date. The awards to each of our NEOs are subject to continued employment with us on the applicable vesting dates and represent an important element of our efforts to retain these key employees and reward them for strong company performance.
The number of phantom units granted to each of our NEOs in fiscal year 2016 is set forth in the following table.
|
|
|
Number of |
|
|
|
Phantom |
|
|
|
Units |
|
Name |
|
(#) |
|
J. Patrick Barley |
|
50,000 |
|
Patrick Welch |
|
47,000 |
|
Jon Hanna |
|
20,000 |
|
Shiming Chen |
|
17,000 |
|
Forgan McIntosh(1) |
|
17,000 |
|
(1) |
Mr. McIntosh resigned from his position with us effective February 24, 2017. |
In connection with the AMID Merger, to reward their service and loyalty, the board of directors of our general partner determined to accelerate the vesting of the unvested common units, subordinated units and phantom units held by our NEOs in the event the NEO is terminated without cause or resigns for good reason, in either case, within 12 months following the Merger. The number and market value of outstanding common units, subordinated units and phantom units held by our NEOs as of December 31, 2016 that would be subject to accelerated vesting is set forth in the Outstanding Equity Awards table below.
78
Other Elements of Compensation and Perquisites
Our NEOs are eligible under the same plans as all other employees for medical and dental coverage and life and other insurance. We provide these benefits due to their relatively low cost and the high value they provide in attracting and retaining talented executives. Our NEOs do not receive any tax gross up in connection with our provision of these benefits. In addition, for 2016, our general partner provided certain perquisites to Mr. Welch in the form of housing and commuting expenses, primarily related to his long-distance commuting requirements from his personal residence in Colorado to our executive offices pursuant to his employment offer letter agreement. Mr. Welch receives a tax gross up in connection with the provision of his housing and commuting expenses.
Employment Agreements
Our general partner has entered into employment agreements with each of Mr. Welch and Mr. Chen, the key terms of which are set forth below.
Agreements with Mr. Welch and Mr. Chen. In September 2014 and 2015, respectively, our general partner entered into employment agreements with each of Mr. Welch and Mr. Chen. The agreement with Mr. Welch has a three-year initial term and is subject to automatic annual renewal thereafter unless either party gives the other a notice of non-extension at least 60 days prior to the expiration of the then-applicable term, and the agreement with Mr. Chen has a three-year term. The agreements provided for an annual base salary of $400,000 for Mr. Welch and $300,000 for Mr. Chen, subject to review and adjustment from time to time. In addition, the agreements provide for the executives to participate in the bonus and benefit plans maintained by our general partner from time to time. If our general partner terminates Mr. Welch’s or Mr. Chen’s employment for cause or due to death or disability or if the executive resigns his employment without good reason, then he will receive only his base salary earned through the date of termination but not yet paid, any expenses owed to him and any amount accrued arising from his participation in employee benefit plans or as required by law and, solely in the event of a termination of employment due to disability or death, continued payment of the executive’s base salary through the end of the third or first month, respectively, following termination. Any further right to salary, bonus or other benefits will cease. Pursuant to Mr. Welch’s employment agreement, if Mr. Welch’s employment is terminated by our general partner without cause or he resigns for good reason during the term of the employment agreement and, in either case, signs a release of claims in favor of our general partner, then he will be entitled to receive, as severance payments, an amount equal to one year of his base salary plus an amount equal to the average of his annual bonus received during the three most recent fiscal years (or if he was not employed with our general partner over the full three most recent fiscal years, his target bonus will be substituted for the year in which he was not employed for purposes of determining the average bonus), plus an amount equal to his healthcare continuation COBRA premiums for twelve months. Pursuant to Mr. Chen’s employment agreement, if Mr. Chen’s employment is terminated by our general partner without cause or he resigns for good reason during the term of the employment agreement and, in either case, signs a release of claims in favor of our general partner, then he will be entitled to receive, as severance payments, an amount equal to one year of his base salary.
In addition, upon termination of employment, the employment agreements for each of Mr. Welch and Mr. Chen provide that the executive (i) will not engage in any business that is competitive with us in the geographical locations where we operate for a period of at least 12 months following termination and (ii) will not solicit our employees, customers, suppliers or other business associates for a period of two years following termination.
79
Severance Arrangements
In connection with the AMID Merger, to reward their service and loyalty, our general partner committed to pay severance to each of our NEOs, other than Mr. Barley, in the event the NEO is terminated without cause or resigns for good reason, in either case, within 12 months following the AMID Merger. The severance payments, which, with respect to Mr. Welch and Mr. Chen, are intended to satisfy the severance obligations set forth in their employment agreements, would be paid in a lump sum following such termination in the following amounts:
|
Name |
|
Severance Amount |
|
|
Patrick Welch |
|
$ |
650,000 |
|
Jon Hanna |
|
$ |
310,050 |
|
Shiming Chen |
|
$ |
300,000 |
|
Forgan McIntosh(1) |
|
$ |
350,000 |
|
(1) |
Mr. McIntosh resigned from his position with us effective February 24, 2017. |
In addition to the severance amount set forth above, each of Mr. Welch and Mr. Chen would be entitled to receive monthly payments of his healthcare continuation premiums pursuant to COBRA for up to 12 months.
The NEOs would also be entitled to accelerated vesting of their unvested common units, subordinated units and phantom units upon termination without cause or resignation for good reason, in either case, within 12 months following the AMID Merger, as described above under “– Long-Term Equity Incentive Awards”.
Each NEO’s receipt of the severance payments and equity acceleration is subject to the NEO signing and not revoking a release of claims in favor of our general partner. In addition, each NEO will be subject to a two year non-solicitation covenant.
For purposes of these severance arrangements, “cause” is generally defined to mean, subject to certain opportunities for notice and cure, (i) fraud, embezzlement or theft against our general partner or any of its affiliates, (ii) any material violation of our general partner’s corporate policies or code of ethics, (iii) any acts involving gross negligence, dishonesty or fraud, or that in the good faith opinion of our general partner may cause material harm to our general partner or any of its affiliates, or any conviction of, or guilty plea or nolo contendere plea to, or confession of, a Class A-type felony or felony involving moral turpitude or other crime involving moral turpitude, (iv) an unauthorized disclosure or misuse of any trade secrets or confidential information of our general partner or any of its affiliates, (v) material nonperformance by the executive of such executive’s duties, including, failing in any material respect to carry out lawful directions of the board of directors of our general partner, (vi) willful misconduct by the executive that is intended, or reasonably likely, to materially injure the business, prospects, or reputation of our general partner or its affiliates, (vii) breach of a fiduciary duty owed to our general partner or any of the material terms or provisions of the agreement, or (viii) use of illegal drugs at work.
For purposes of these severance arrangements, “good reason” is generally defined to mean, subject to opportunity for notice and cure, (i) our general partner’s material breach of its obligations to the executive, including its obligation to pay amounts owed or owing to the executive, (ii) a material and adverse diminution in the executive’s job duties, responsibilities or authority, (iii) a change in the location where the executive is required to perform the executive’s duties and responsibilities to a location more than 50 miles from the location the executive is required to perform such duties and responsibilities as of the date of the agreement, or (iv) a material reduction in the executive’s base salary, target cash bonus or target long-term incentive bonus, it being intended that an individual or aggregate reduction of more than 10% from the executive’s prior base salary, target cash bonus or target long-term incentive bonus level (or any material and adverse change in vesting schedule) shall be considered material.
80
Summary Compensation Table for 2016
The following table sets forth certain information with respect to the compensation paid to our NEOs for the year ended December 31, 2016.
|
|
|
|
|
|
|
|
|
Unit |
|
All Other |
|
|
|
|
Name and Principal Position |
|
Year |
|
Salary($) |
|
Bonus($)(1) |
|
Awards($)(2) |
|
Compensation($)(3) |
|
Total($) |
|
|
J. Patrick Barley |
|
2016 |
|
425,000 |
|
425,000 |
|
266,500 |
|
15,808 |
|
1,132,308 |
|
|
President and Chief Executive Officer |
|
2015 |
|
441,346 |
|
212,500 |
|
276,500 |
|
10,600 |
|
940,946 |
|
|
|
|
2014 |
|
425,000 |
|
425,000 |
|
— |
|
10,400 |
|
860,400 |
|
|
Patrick Welch |
|
2016 |
|
400,000 |
|
300,000 |
|
250,510 |
|
106,911 |
|
1,057,421 |
|
|
Executive Vice President and Chief Financial Officer |
|
2015 |
|
415,385 |
|
150,000 |
|
221,200 |
|
110,285 |
|
896,870 |
|
|
|
|
2014 |
|
523,917 |
|
300,000 |
|
356,080 |
|
59,953 |
|
1,239,950 |
|
|
John Hanna |
|
2016 |
|
310,500 |
|
155,250 |
|
106,600 |
|
16,051 |
|
588,401 |
|
|
Executive Vice President—Crude Oil, Pipelines and Storage |
|
2015 |
|
319,413 |
|
77,625 |
|
210,140 |
|
35,600 |
|
642,778 |
|
|
|
|
2014 |
|
282,692 |
|
220,000 |
|
437,088 |
|
10,400 |
|
950,180 |
|
|
Shiming Chen |
|
2016 |
|
300,000 |
|
150,000 |
|
90,610 |
|
14,412 |
|
555,022 |
|
|
Senior Vice President and Chief Accounting Officer |
|
2015 |
|
279,230 |
|
150,000 |
|
426,859 |
|
9,457 |
|
865,546 |
|
|
|
|
2014 |
|
214,615 |
|
25,200 |
|
— |
|
— |
|
239,815 |
|
|
Forgan McIntosh(4) |
|
2016 |
|
250,000 |
|
100,000 |
|
90,610 |
|
1,839 |
|
442,449 |
|
|
Senior Vice President—Commercial and Corporate Development |
|
2015 |
|
245,192 |
|
50,000 |
|
101,022 |
|
— |
|
396,214 |
|
|
|
|
2014 |
|
194,711 |
|
70,000 |
|
— |
|
— |
|
264,711 |
|
|
(1) |
The 2016 bonus amounts reflect 2016 annual bonuses determined by the board of directors of our general partner in connection with the Merger. For additional information, please read “—Annual Performance-Based Compensation for 2016” above. |
|
(2) |
Amounts shown for 2016 represent the aggregate grant-date fair value of phantom units granted during 2016 computed in accordance with ASC Topic 718, excluding the effect of estimated forfeitures. |
|
(3) |
For each of our NEOs other than Mr. McIntosh, the amount shown reflects company contributions to our 401(k) retirement savings plan. For Mr. Welch, the amount shown also reflects $92,436 for travel and housing costs, which amount includes $41,245 representing a tax gross-up. |
|
(4) |
Mr. McIntosh resigned from his position with us effective February 24, 2017. |
81
Grants of Plan-Based Awards for 2016
|
|
|
|
|
|
|
|
|
|
|
|
|
|
|
All Other Unit Awards: |
|
|
|
|
|
|
|
|
|
Number of |
|
|
|
|
|
|
|
|
|
Phantom |
|
Grant Date Fair |
|
|
|
|
|
Grant |
|
Units |
|
Value of Unit |
|
|
|
Name |
|
Date |
|
(#) |
|
Awards(1) |
|
|
|
J. Patrick Barley |
|
4/1/16 |
|
50,000 |
|
$ |
266,500 |
|
|
Patrick Welch |
|
4/1/16 |
|
47,000 |
|
$ |
250,510 |
|
|
Jon Hanna |
|
4/1/16 |
|
20,000 |
|
$ |
106,600 |
|
|
Shiming Chen |
|
4/1/16 |
|
17,000 |
|
$ |
90,610 |
|
|
Forgan McIntosh |
|
4/1/16 |
|
17,000 |
|
$ |
90,610 |
|
|
(1) |
Amounts shown represent the aggregate grant-date fair value of phantom units computed in accordance with ASC Topic 718, excluding the effect of estimated forfeitures. |
Outstanding Equity Awards at December 31, 2016
The following table provides information regarding the outstanding unvested unit awards held by our NEOs as of December 31, 2016.
|
|
|
Unit Awards(5)(6) |
|
||||
|
|
|
Number of |
|
|
|
|
|
|
|
|
Units |
|
|
Market Value of |
|
|
|
|
|
That |
|
|
Units |
|
|
|
|
|
Have Not |
|
|
That Have |
|
|
|
|
|
Vested |
|
|
Not Vested |
|
|
|
Name |
|
(#) |
|
|
($) |
|
|
|
J. Patrick Barley |
|
66,666 |
(1) |
|
$ |
674,660 |
|
|
Patrick Welch |
|
60,333 |
(1) |
|
$ |
610,570 |
|
|
|
|
8,902 |
(2) |
|
$ |
90,088 |
|
|
Jon Hanna |
|
32,666 |
(1) |
|
$ |
330,580 |
|
|
|
|
8,902 |
(3) |
|
$ |
90,088 |
|
|
Shiming Chen |
|
41,424 |
(4) |
|
$ |
419,211 |
|
|
Forgan McIntosh |
|
23,089 |
(1) |
|
$ |
233,661 |
|
|
(1) |
The phantom units vest in three equal annual installments on the first, second and third anniversaries of the applicable date of grant, subject to the NEO’s continued service with us on each applicable vesting date. |
|
(2) |
Amount shown represents 1,752 common units and 7,150 subordinated units. The units vest in two equal annual installments on each of April 7, 2017 and 2018, subject to the NEO’s continued service with us on each applicable vesting date. |
|
(3) |
Amount shown represents 1,752 common units and 7,150 subordinated units. The units vest in two equal annual installments on each of January 6, 2017 and 2018, subject to the NEO’s continued service with us on each applicable vesting date. |
|
(4) |
For Mr. Chen, (i) 22,973 of his phantom units vest in three equal annual installments on the first, second and third anniversaries of the applicable date of grant, (ii) 14,451 of his phantom units vest in two equal annual installments on April 1, 2017 and 2018 and (iii) 4,000 of his phantom units vest on April 1, 2018, in each case, subject to Mr. Chen’s continued service with us on each applicable vesting date. |
|
(5) |
Common and subordinated unit awards in the table above reflect the conversion of Class B common units into common and subordinated units in us in connection with our IPO. |
|
(6) |
Outstanding common units, subordinated units and phantom units are subject to accelerated vesting in the event the NEO is terminated without cause or resigns for good reason, in either case, within 12 months following the Merger. For additional information see “—Long-Term Equity Incentive Awards” above. |
82
Units Vested in 2016
The following table sets forth the number and value of common and subordinated unit awards that vested for the NEOs during 2016.
|
|
|
Unit Awards |
|
|||||
|
|
|
|
|
Number of |
|
|
|
|
|
|
|
Number of Units |
|
Subordinated Units |
|
|
|
|
|
|
|
Acquired on |
|
Acquired on Vesting |
|
Value Realized on |
|
|
|
Name |
|
Vesting (#) |
|
(#) |
|
Vesting ($)(1) |
|
|
|
J. Patrick Barley |
|
8,334 |
|
— |
|
$ |
44,420 |
|
|
Patrick Welch |
|
7,543 |
|
3,575 |
|
$ |
59,971 |
|
|
Jon Hanna |
|
7,210 |
|
3,575 |
|
$ |
54,858 |
|
|
Shiming Chen |
|
10,650 |
|
1,787 |
|
$ |
73,832 |
|
|
Forgan McIntosh |
|
3,045 |
|
— |
|
$ |
16,230 |
|
|
(1) |
Amount shown reflects an estimate of the fair market value of the units as of the vesting date. |
Nonqualified Deferred Compensation and Pension Benefits
None of our NEOs participate in any nonqualified deferred compensation plans or pension plans and received no nonqualified deferred compensation or pension benefits during the year ended December 31, 2016.
83
Potential Payments upon Termination or Change in Control
Each of Messrs. Welch and Chen have an agreement that provides for severance benefits upon a termination of employment. See “—Employment Agreements” above for a description of the employment and severance agreements for each of our NEOs. Assuming that each of these agreements were in place on December 31, 2016, as applicable, and a termination of employment effective as of December 31, 2016 (i) by our general partner without cause, (ii) due to the executive’s resignation for good reason or (iii) due to the executive’s disability or death, each of our NEOs would have received the following payments and benefits:
|
|
|
|
|
|
|
|
|
|
|
Termination |
|
|
|
|
|
|
|
|
|
|
|
|
Without Cause or |
|
|
|
|
|
|
|
|
|
|
|
|
Resignation |
|
|
|
|
|
|
Termination |
|
|
|
|
|
for Good |
|
|
|
|
|
|
Without Cause or |
|
|
|
|
|
Reason |
|
|
|
|
|
|
Resignation |
|
|
|
Termination |
|
After a |
|
|
|
|
Payment |
|
for Good |
|
|
|
due to |
|
Change in |
|
|
Name |
|
Type |
|
Reason($) |
|
Death($) |
|
Disability($) |
|
Control($)(2) |
|
|
J. Patrick Barley |
|
Salary |
|
n/a |
|
n/a |
|
n/a |
|
— |
|
|
|
|
Bonus |
|
n/a |
|
n/a |
|
n/a |
|
— |
|
|
|
|
Equity |
|
n/a |
|
n/a |
|
n/a |
|
674,660 |
|
|
|
|
Total |
|
n/a |
|
n/a |
|
n/a |
|
674,660 |
|
|
Patrick Welch |
|
Salary |
|
420,000 |
(1) |
33,333 |
|
99,999 |
|
650,000 |
|
|
|
|
Bonus |
|
300,000 |
|
— |
|
— |
|
— |
|
|
|
|
Equity |
|
— |
|
— |
|
— |
|
700,658 |
|
|
|
|
Total |
|
720,000 |
|
33,333 |
|
99,999 |
|
1,350,658 |
|
|
Jon Hanna |
|
Salary |
|
n/a |
|
n/a |
|
n/a |
|
310,050 |
|
|
|
|
Bonus |
|
n/a |
|
n/a |
|
n/a |
|
— |
|
|
|
|
Equity |
|
n/a |
|
n/a |
|
n/a |
|
420,668 |
|
|
|
|
Total |
|
n/a |
|
n/a |
|
n/a |
|
730,718 |
|
|
Shiming Chen |
|
Salary |
|
320,000 |
(1) |
25,000 |
|
75,000 |
|
300,000 |
|
|
|
|
Bonus |
|
— |
|
— |
|
— |
|
— |
|
|
|
|
Equity |
|
— |
|
— |
|
— |
|
419,211 |
|
|
|
|
Total |
|
320,000 |
|
25,000 |
|
75,000 |
|
719,211 |
|
|
Forgan McIntosh |
|
Salary |
|
n/a |
|
n/a |
|
n/a |
|
350,000 |
|
|
|
|
Bonus |
|
n/a |
|
n/a |
|
n/a |
|
— |
|
|
|
|
Equity |
|
n/a |
|
n/a |
|
n/a |
|
233,661 |
|
|
|
|
Total |
|
n/a |
|
n/a |
|
n/a |
|
583,661 |
|
|
(1) |
Salary amount shown includes an estimated amount for healthcare continuation COBRA reimbursement payments of $20,000 per year. |
|
(2) |
In connection with the AMID Merger, our general partner committed to pay severance to each of our NEOs, other than Mr. Barley, in the event the NEO is terminated without cause or resigns for good reason, in either case, within 12 months following the AMID Merger. In addition, the NEOs would also be entitled to accelerated vesting of their unvested common units, subordinated units and phantom units upon termination without cause or resignation for good reason, in either case, within 12 months following the AMID Merger. The value for unvested common units, subordinated units and phantom units was determined based on the fair market value of our units as of December 31, 2016. For further information regarding these severance arrangements, please see “– Severance Arrangements” and “– Long-Term Equity Incentive Awards” above. |
Compensation Risk
We have analyzed the potential risks arising from our compensation policies and practices, and have determined that there are no such risks that are reasonably likely to have a material adverse effect on us.
84
Director Compensation
For the year ended December 31, 2016, our NEOs or other employees who also served as members of the board of directors of our general partner did not receive additional compensation for their service as directors. Directors who were not officers, employees or paid consultants or advisors of us or our general partner were eligible to receive the following amounts as compensation for their services as directors in 2016 (i) an annual retainer of $50,000; (ii) an additional annual retainer of $10,000 for service as the chair of any standing committee and a $5,000 fee for service on two or more committees; and (iii) meeting attendance fees of $1,750 per meeting attended, whether telephonically or in person.
In 2016, we provided the following compensation to our independent directors:
|
|
|
Fees Earned or |
|
|
|
|
|
|
|
|
Paid in |
|
Unit |
|
|
|
|
Name |
|
Cash ($) |
|
Awards ($)(1) |
|
Total |
|
|
T. Porter Trimble |
|
89,000 |
|
51,125 |
|
140,125 |
|
|
Norman J. Szydlowski |
|
86,500 |
|
51,125 |
|
137,625 |
|
|
Josh Sherman |
|
92,750 |
|
51,125 |
|
143,875 |
|
|
(1) |
Reflects the fair market value of the unit awards on the date of grant. As of December 31, 2016, each of Messrs. Trimble, Szydlowski and Sherman held 10,926 unvested phantom units. |
Directors also receive reimbursement for out-of-pocket expenses associated with attending board or committee meetings and director and officer liability insurance coverage.
In connection with the AMID Merger, all outstanding phantom units held by our non-employee directors will vest in full.
ITEM 12. SECURITY OWNERSHIP OF CERTAIN BENEFICIAL OWNERS AND MANAGEMENT AND RELATED UNITHOLDER MATTERS.
As of March 8, 2017, in connection with the closing of the AMID Merger, all of our common and subordinated units converted into AMID Common Units. See Item 1—Business—AMID Merger Agreement for more details.
85
The following table summarizes the number of securities remaining available for future issuance under the LTIP as of December 31, 2016:
|
|
|
|
|
|
|
|
|
|
|
|
|
|
|
|
Number of securities |
|
|
|
|
|
|
|
|
remaining available for |
|
|
|
|
|
|
|
|
future issuance under |
|
|
|
|
Number of securities to |
|
|
|
equity compensation |
|
|
|
|
be issued upon exercise |
|
Weighted-average |
|
plans (excluding |
|
|
|
|
of outstanding options, |
|
exercise price of |
|
securities reflected in |
|
|
|
|
warrants and rights |
|
outstanding options, |
|
column (a)) |
|
|
Plan Category |
|
(a) |
|
warrants and rights (b) |
|
(c) |
|
|
Equity compensation plans approved by security holders: |
|
|
|
|
|
|
|
|
N/A |
|
— |
|
— |
|
— |
|
|
Equity compensation not approved by security holders |
|
|
|
|
|
|
|
|
2014 Long-Term Incentive Plan (1) |
|
541,534 |
|
— |
|
2,996,403 |
|
|
Total |
|
541,534 |
|
— |
|
2,996,403 |
|
|
(1) |
The LTIP was adopted by our general partner in October 2014 in connection with our IPO and did not require approval by our unitholders. The LTIP contemplates the issuance or delivery of up to 3,642,700 common units to satisfy awards under the LTIP. The material features of the LTIP are described in our prospectus filed pursuant to Rule 424(b)(4) with the SEC on October 2, 2014 under “Management—Determination of Compensation Awards—2014 Long-Term Incentive Plan.” |
ITEM 13. CERTAIN RELATIONSHIPS AND RELATED TRANSACTIONS, AND DIRECTOR INDEPENDENCE.
As of February 27, 2017, our general partner and its affiliates, including Lonestar, owned 3,674,187 common units and 14,992,654 subordinated units representing a 50.9% limited partner interest in us. In addition, our general partner owned a non-economic general partner interest in us and all of our incentive distribution rights.
Other Transactions With Related Persons
AMID Merger
On March 8, 2017, in connection with the closing of the AMID Merger, we were merged with and into Merger Sub, a wholly owned subsidiary of AMID, with us surviving the merger as a wholly owned subsidiary of AMID. See Item 1—Business—AMID Merger Agreement for more details.
JP Development
We performed certain management services for JP Development pursuant to a services agreement in exchange for a monthly fee of $50,000, which was subject to an adjustment each month to accurately reflect the degree and extent of the services provided. Following the sale of the Mid-Continent Business in February 2016, we no longer provided management services for JP Development. For the year ended December 31, 2016, we received $50,000 of fees from JP Development.
JP Development had a pipeline transportation business that provided crude oil pipeline transportation services to our discontinued Mid-Continent Business. As a result of utilizing JP Development’s pipeline transportation services, we incurred pipeline tariff fees of $372,000 for the year ended December 31, 2016.
86
On February 1, 2016, we completed the sale of our crude oil supply and logistics operations in the Mid-Continent region of Oklahoma and Kansas to JP Development in connection with JP Development’s sale of its GSPP pipeline assets to a third-party buyer. The sales price was $9,685,000; which included certain adjustments related to inventory and other working capital items.
Refined Products
Occasionally we sell and deliver to Truman Arnold Companies (“TAC”), which directly or indirectly owned a 4.0% limited partner interest in us, certain refined petroleum products at agreed upon prices. For the year ended December 31, 2016, the revenue generated from the refined products sales to TAC was $244,000. In addition, our NGL distribution and sales segment purchased refined products from TAC during the year ended December 31, 2016. We paid TAC $986,000 for such products.
Terminal Registration Rights Agreement
In connection with the acquisition of our North Little Rock, Arkansas and Caddo Mills, Texas refined products terminals in November 2012, we entered into a registration rights agreement (the “Terminal registration rights agreement”) with certain of the sellers (the “Terminal Sellers”) where we agreed to grant “piggyback” rights. Pursuant to the terms of the piggyback rights, at any time after the closing of the IPO, in the event that we file a registration statement of any kind for the sale of common units for our own account or the account of another person or if any holder of registrable securities notifies us that it seeks to dispose of such registrable securities in an underwritten offering, we must notify the Terminal Sellers and offer them the opportunity to include their common units in such filing or underwritten offering. In addition, at any time after we become eligible to register our securities on Form S-3 under the Securities Act of 1933, as amended (the “Securities Act”), any one or more of the Terminal Sellers that is a holder of registrable securities is entitled to certain demand rights, whereby they may request that we register such securities for sale under the Securities Act. These demand rights may be exercised on up to two occasions. We are entitled to select the managing underwriter for any registration of securities under the Terminal registration rights agreement. Although we are responsible for all expenses incurred in connection with the filing of any registration statement, any holder seeking to sell registrable securities under the Terminal registration rights agreement must pay certain selling expenses, including underwriting fees, discounts or commissions allocable to the sale of such securities. The Terminal registration rights agreement also includes provisions dealing with indemnification and contribution and allocation of expenses and the registration rights which it grants are subject to certain conditions and limitations. All registrable securities held by the Terminal Sellers and any permitted transferee will be entitled to these registration rights.
Employees of Our General Partner
We ceased having employees in July 2013. Since July 2013, the employees supporting our operations are employees of our general partner and, as such, we reimburse our general partner for our payroll and other payroll-related expenses that it incurs on our behalf.
Management Services Agreement with Republic
We performed certain management services for Republic Midstream, LLC, an entity owned by ArcLight, in exchange for a monthly fee of approximately $75,000. In September 2016, this monthly fee decreased to approximately $40,000 before ceasing in November 2016. For the year ended December 31, 2016, we charged fees of $665,000 to Republic Midstream, LLC for these services. During 2016, we performed crude transportation and marketing services for Republic Midstream, LLC. We charged $3,214,000 for the year ended December 31, 2016 for these crude transportation and marketing services.
ArcLight
ArcLight reimbursed us for expenses we incurred associated with the AMID Merger for the year ended December 31, 2016. The total amounts paid on our behalf or reimbursed to us were $2,400,000 for the year ended December 31, 2016, and were treated as deemed contributions from ArcLight. In addition, during the year ended
87
December 31, 2016, our general partner agreed to absorb $9,000,000 of corporate overhead expenses incurred by us and not pass such expense through to us.
Director Independence
Please read “Item 10. Directors, Executive Officers and Corporate Governance—Management of JP Energy Partners LP” and “—Director Independence” which is incorporated by reference into this Item 13.
ITEM 14. PRINCIPAL ACCOUNTANT FEES AND SERVICES.
We have engaged PricewaterhouseCoopers LLP as our independent registered public accounting firm. The following sets forth fees billed by PricewaterhouseCoopers LLP for the audit of our annual financial statements and other services rendered for the fiscal years ended December 31, 2016 and 2015:
|
|
|
|
|
|
|
|
|
|
|
|
Year Ended December 31, |
|
||||
|
|
|
2016 |
|
2015 |
|
||
|
|
|
(in thousands) |
|
||||
|
Audit fees (1) |
|
$ |
1,555 |
|
$ |
1,863 |
|
|
Tax fees (2) |
|
|
611 |
|
|
780 |
|
|
Other (3) |
|
|
4 |
|
|
17 |
|
|
Total |
|
$ |
2,170 |
|
$ |
2,660 |
|
|
(1) |
Represents fees for professional services provided in connection with (i) the integrated audit of our annual financial statements, (ii) the review of our quarterly financial statements or (iii) those services normally provided in connection with statutory and regulatory filings or engagements including comfort letters, consents and other services related to SEC matters. |
|
(2) |
Represents fees for professional services provided for tax compliance, tax advice and tax planning. |
|
(3) |
Represents other fees provided for other valuation services and subscriptions to online accounting guidance tool. |
All services provided by our independent registered public accountant are subject to pre-approval by the audit committee of our general partner. The audit committee of our general partner is informed of each engagement of the independent registered public accountant to provide services under the policy. The audit committee of our general partner has approved the use of PricewaterhouseCoopers LLP as our independent registered public accounting firm.
88
ITEM 15. EXHIBITS AND FINANCIAL STATEMENT SCHEDULES.
|
|
|
The following documents are filed as part of this report: |
|
|
|
|
|
1. |
|
Financial Statements. See “Index to Consolidated Financial Statements” on page F-1. |
|
|
|
|
|
2. |
|
Financial Statement Schedules and Other Financial Information. All financial statement schedules are omitted because either they are not applicable or the required information is included in the consolidated financial statements or notes included herein. |
|
|
|
|
|
3. |
|
Exhibits. See “Index to Exhibits.” |
89
INDEX TO CONSOLIDATED FINANCIAL STATEMENTS
F-1
Report of Independent Registered Public Accounting Firm
To the Partners and Unitholders of
JP Energy Partners LP:
In our opinion, the accompanying consolidated balance sheets and the related consolidated statements of operations, partners’ capital and cash flows present fairly, in all material respects, the financial position of JP Energy Partners LP and its subsidiaries (the “Partnership”) at December 31, 2016 and 2015, and the results of their operations and their cash flows for each of the three years in the period ended December 31, 2016 in conformity with accounting principles generally accepted in the United States of America. Also in our opinion, the Partnership maintained, in all material respects, effective internal control over financial reporting as of December 31, 2016, based on criteria established in Internal Control - Integrated Framework (2013) issued by the Committee of Sponsoring Organizations of the Treadway Commission (COSO). The Partnership’s management is responsible for these financial statements, for maintaining effective internal control over financial reporting and for its assessment of the effectiveness of internal control over financial reporting, included in Management's Report on Internal Control over Financial Reporting appearing under Item 9A. Our responsibility is to express opinions on these financial statements and on the Partnership's internal control over financial reporting based on our audits (which were integrated audits in 2016 and 2015). We conducted our audits in accordance with the standards of the Public Company Accounting Oversight Board (United States). Those standards require that we plan and perform the audits to obtain reasonable assurance about whether the financial statements are free of material misstatement and whether effective internal control over financial reporting was maintained in all material respects. Our audits of the financial statements included examining, on a test basis, evidence supporting the amounts and disclosures in the financial statements, assessing the accounting principles used and significant estimates made by management, and evaluating the overall financial statement presentation. Our audit of internal control over financial reporting included obtaining an understanding of internal control over financial reporting, assessing the risk that a material weakness exists, and testing and evaluating the design and operating effectiveness of internal control based on the assessed risk. Our audits also included performing such other procedures as we considered necessary in the circumstances. We believe that our audits provide a reasonable basis for our opinions.
A company’s internal control over financial reporting is a process designed to provide reasonable assurance regarding the reliability of financial reporting and the preparation of financial statements for external purposes in accordance with generally accepted accounting principles. A company’s internal control over financial reporting includes those policies and procedures that (i) pertain to the maintenance of records that, in reasonable detail, accurately and fairly reflect the transactions and dispositions of the assets of the company; (ii) provide reasonable assurance that transactions are recorded as necessary to permit preparation of financial statements in accordance with generally accepted accounting principles, and that receipts and expenditures of the company are being made only in accordance with authorizations of management and directors of the company; and (iii) provide reasonable assurance regarding prevention or timely detection of unauthorized acquisition, use, or disposition of the company’s assets that could have a material effect on the financial statements.
Because of its inherent limitations, internal control over financial reporting may not prevent or detect misstatements. Also, projections of any evaluation of effectiveness to future periods are subject to the risk that controls may become inadequate because of changes in conditions, or that the degree of compliance with the policies or procedures may deteriorate.
/s/ PricewaterhouseCoopers LLP
Dallas, Texas
March 13, 2017
F-2
Item 1.Financial Statements
JP ENERGY PARTNERS LP
|
|
|
December 31, |
|
December 31, |
|
||
|
|
|
2016 |
|
2015 |
|
||
|
|
|
(in thousands, except unit data) |
|
||||
|
ASSETS |
|
|
|
|
|
|
|
|
Current assets |
|
|
|
|
|
|
|
|
Cash and cash equivalents |
|
$ |
2,727 |
|
$ |
1,987 |
|
|
Accounts receivable, net |
|
|
54,093 |
|
|
60,519 |
|
|
Receivables from related parties |
|
|
599 |
|
|
8,624 |
|
|
Inventory |
|
|
6,515 |
|
|
4,786 |
|
|
Prepaid expenses and other current assets |
|
|
10,859 |
|
|
4,168 |
|
|
Current assets of discontinued operations held for sale |
|
|
— |
|
|
2,730 |
|
|
Total Current Assets |
|
|
74,793 |
|
|
82,814 |
|
|
|
|
|
|
|
|
|
|
|
Non-current assets |
|
|
|
|
|
|
|
|
Property, plant and equipment, net |
|
|
278,150 |
|
|
291,454 |
|
|
Goodwill |
|
|
201,236 |
|
|
216,692 |
|
|
Intangible assets, net |
|
|
117,385 |
|
|
134,432 |
|
|
Deferred financing costs and other assets, net |
|
|
2,866 |
|
|
3,223 |
|
|
Noncurrent assets of discontinued operations held for sale |
|
|
— |
|
|
6,644 |
|
|
Total Non-Current Assets |
|
|
599,637 |
|
|
652,445 |
|
|
Total Assets |
|
$ |
674,430 |
|
$ |
735,259 |
|
|
|
|
|
|
|
|
|
|
|
LIABILITIES AND PARTNERS’ CAPITAL |
|
|
|
|
|
|
|
|
Current liabilities |
|
|
|
|
|
|
|
|
Accounts payable |
|
$ |
42,903 |
|
$ |
45,933 |
|
|
Payables to related parties |
|
|
177 |
|
|
— |
|
|
Accrued liabilities |
|
|
15,268 |
|
|
15,260 |
|
|
Capital leases and short-term debt |
|
|
77 |
|
|
107 |
|
|
Customer deposits and advances |
|
|
3,080 |
|
|
3,742 |
|
|
Current portion of long-term debt |
|
|
950 |
|
|
454 |
|
|
Current liabilities of discontinued operations held for sale |
|
|
— |
|
|
640 |
|
|
Total Current Liabilities |
|
|
62,455 |
|
|
66,136 |
|
|
|
|
|
|
|
|
|
|
|
Non-current liabilities |
|
|
|
|
|
|
|
|
Long-term debt |
|
|
177,000 |
|
|
162,740 |
|
|
Other long-term liabilities |
|
|
889 |
|
|
1,463 |
|
|
Total Liabilities |
|
|
240,344 |
|
|
230,339 |
|
|
|
|
|
|
|
|
|
|
|
Commitments and Contingencies |
|
|
|
|
|
|
|
|
|
|
|
|
|
|
|
|
|
Partners’ capital |
|
|
|
|
|
|
|
|
General Partner |
|
|
15,468 |
|
|
5,568 |
|
|
Common units (22,119,170 units authorized; 18,532,419 and 18,465,320 units issued and outstanding as of December 31, 2016 and December 31, 2015, respectively) |
|
|
226,551 |
|
|
266,691 |
|
|
Subordinated units (18,197,249 units authorized; 18,124,071 and 18,127,678 units issued and outstanding as of December 31, 2016 and December 31, 2015, respectively) |
|
|
192,067 |
|
|
232,661 |
|
|
Total Partners’ Capital |
|
|
434,086 |
|
|
504,920 |
|
|
Total Liabilities and Partners’ Capital |
|
$ |
674,430 |
|
$ |
735,259 |
|
See accompanying notes to consolidated financial statements.
F-3
JP ENERGY PARTNERS LP
CONSOLIDATED STATEMENTS OF OPERATIONS
|
|
|
Year Ended December 31, |
|
|||||||
|
|
|
2016 |
|
2015 |
|
2014 |
|
|||
|
|
|
(in thousands, except unit and per unit data) |
||||||||
|
REVENUES |
|
|
|
|
|
|
|
|
|
|
|
Crude oil sales |
|
$ |
300,220 |
|
$ |
455,465 |
|
$ |
470,336 |
|
|
Crude oil sales - related parties |
|
|
— |
|
|
884 |
|
|
— |
|
|
Gathering, transportation and storage fees |
|
|
20,539 |
|
|
25,991 |
|
|
30,762 |
|
|
Gathering, transportation and storage fees - related parties |
|
|
3,319 |
|
|
2,165 |
|
|
— |
|
|
NGL and refined product sales |
|
|
143,528 |
|
|
170,009 |
|
|
192,804 |
|
|
NGL and refined product sales - related parties |
|
|
244 |
|
|
— |
|
|
7,419 |
|
|
Refined products terminals and storage fees |
|
|
13,189 |
|
|
12,362 |
|
|
10,260 |
|
|
Refined products terminals and storage fees - related parties |
|
|
— |
|
|
— |
|
|
1,533 |
|
|
Other revenues |
|
|
12,921 |
|
|
13,709 |
|
|
13,040 |
|
|
Total revenues |
|
|
493,960 |
|
|
680,585 |
|
|
726,154 |
|
|
|
|
|
|
|
|
|
|
|
|
|
|
COSTS AND EXPENSES |
|
|
|
|
|
|
|
|
|
|
|
Cost of sales, excluding depreciation and amortization |
|
|
350,187 |
|
|
527,476 |
|
|
605,682 |
|
|
Operating expense |
|
|
64,137 |
|
|
69,377 |
|
|
65,584 |
|
|
General and administrative |
|
|
42,581 |
|
|
45,383 |
|
|
46,362 |
|
|
Depreciation and amortization |
|
|
47,151 |
|
|
46,852 |
|
|
40,230 |
|
|
Goodwill impairment |
|
|
15,456 |
|
|
29,896 |
|
|
— |
|
|
Loss on disposal of assets, net |
|
|
2,569 |
|
|
909 |
|
|
1,137 |
|
|
Total costs and expenses |
|
|
522,081 |
|
|
719,893 |
|
|
758,995 |
|
|
|
|
|
|
|
|
|
|
|
|
|
|
OPERATING LOSS |
|
|
(28,121) |
|
|
(39,308) |
|
|
(32,841) |
|
|
|
|
|
|
|
|
|
|
|
|
|
|
OTHER INCOME (EXPENSE) |
|
|
|
|
|
|
|
|
|
|
|
Interest expense |
|
|
(5,970) |
|
|
(5,375) |
|
|
(8,981) |
|
|
Loss on extinguishment of debt |
|
|
— |
|
|
— |
|
|
(1,634) |
|
|
Other income, net |
|
|
628 |
|
|
1,732 |
|
|
8 |
|
|
|
|
|
|
|
|
|
|
|
|
|
|
LOSS FROM CONTINUING OPERATIONS BEFORE INCOME TAXES |
|
|
(33,463) |
|
|
(42,951) |
|
|
(43,448) |
|
|
|
|
|
|
|
|
|
|
|
|
|
|
Income tax expense |
|
|
(521) |
|
|
(754) |
|
|
(300) |
|
|
|
|
|
|
|
|
|
|
|
|
|
|
LOSS FROM CONTINUING OPERATIONS |
|
|
(33,984) |
|
|
(43,705) |
|
|
(43,748) |
|
|
|
|
|
|
|
|
|
|
|
|
|
|
DISCONTINUED OPERATIONS |
|
|
|
|
|
|
|
|
|
|
|
Net loss from discontinued operations |
|
|
(539) |
|
|
(14,951) |
|
|
(9,275) |
|
|
|
|
|
|
|
|
|
|
|
|
|
|
NET LOSS |
|
$ |
(34,523) |
|
$ |
(58,656) |
|
$ |
(53,023) |
|
|
|
|
|
|
|
|
|
|
|
|
|
|
Net loss attributable to the period from January 1, 2014 to October 1, 2014 |
|
|
— |
|
|
— |
|
|
34,407 |
|
|
Net loss attributable to limited partners |
|
$ |
(34,523) |
|
$ |
(58,656) |
|
$ |
(18,616) |
|
|
|
|
|
|
|
|
|
|
|
|
|
|
Basic and diluted loss per unit |
|
|
|
|
|
|
|
|
|
|
|
Net loss from continuing operations allocated to common units |
|
$ |
(16,955) |
|
$ |
(21,830) |
|
$ |
(9,460) |
|
|
Net loss allocated to common units |
|
$ |
(17,227) |
|
$ |
(29,351) |
|
$ |
(9,293) |
|
|
Weighted average number of common units outstanding - basic and diluted |
|
|
18,514,476 |
|
|
18,373,594 |
|
|
18,212,632 |
|
|
Basic and diluted net loss from continuing operations per common unit |
|
$ |
(0.92) |
|
$ |
(1.19) |
|
$ |
(0.52) |
|
|
Basic and diluted net loss per common unit |
|
$ |
(0.93) |
|
$ |
(1.60) |
|
$ |
(0.51) |
|
|
|
|
|
|
|
|
|
|
|
|
|
|
Net loss from continuing operations allocated to subordinated units |
|
$ |
(17,029) |
|
$ |
(21,875) |
|
$ |
(9,490) |
|
|
Net loss allocated to subordinated units |
|
$ |
(17,296) |
|
$ |
(29,305) |
|
$ |
(9,323) |
|
|
Weighted average number of subordinated units outstanding - basic and diluted |
|
|
18,125,093 |
|
|
18,151,700 |
|
|
18,209,948 |
|
|
Basic and diluted net loss from continuing operations per subordinated unit |
|
$ |
(0.94) |
|
$ |
(1.20) |
|
$ |
(0.52) |
|
|
Basic and diluted net loss per subordinated unit |
|
$ |
(0.95) |
|
$ |
(1.61) |
|
$ |
(0.51) |
|
|
|
|
|
|
|
|
|
|
|
|
|
|
Distributions declared per common and subordinated unit |
|
$ |
1.300 |
|
$ |
1.279 |
|
$ |
— |
|
See accompanying notes to consolidated financial statements.
F-4
JP ENERGY PARTNERS LP
CONSOLIDATED STATEMENTS OF CASH FLOWS
|
|
|
Year Ended December 31, |
|
|||||||
|
|
|
2016 |
|
2015 |
|
2014 |
|
|||
|
|
|
(in thousands) |
|
|||||||
|
CASH FLOWS FROM OPERATING ACTIVITIES |
|
|
|
|
|
|
|
|
|
|
|
Net loss |
|
$ |
(34,523) |
|
$ |
(58,656) |
|
$ |
(53,023) |
|
|
Adjustments to reconcile net loss to net cash provided by operating activities including discontinued operations: |
|
|
|
|
|
|
|
|
|
|
|
Depreciation and amortization |
|
|
47,362 |
|
|
49,133 |
|
|
43,922 |
|
|
Goodwill impairment |
|
|
15,456 |
|
|
37,835 |
|
|
— |
|
|
Asset impairment |
|
|
— |
|
|
4,970 |
|
|
1,984 |
|
|
Derivative valuation changes |
|
|
(1,179) |
|
|
(11,340) |
|
|
12,645 |
|
|
Amortization of deferred financing costs |
|
|
969 |
|
|
909 |
|
|
906 |
|
|
Unit-based compensation expenses |
|
|
2,024 |
|
|
1,309 |
|
|
1,789 |
|
|
Loss on disposal of assets |
|
|
2,455 |
|
|
1,028 |
|
|
8,415 |
|
|
Bad debt expense |
|
|
408 |
|
|
1,212 |
|
|
820 |
|
|
Loss on extinguishment of debt |
|
|
— |
|
|
— |
|
|
1,634 |
|
|
Non-cash inventory LCM adjustment |
|
|
— |
|
|
— |
|
|
222 |
|
|
Other non-cash items |
|
|
(469) |
|
|
(1,256) |
|
|
434 |
|
|
Changes in working capital, net of acquired assets and liabilities: |
|
|
|
|
|
|
|
|
|
|
|
Accounts receivable |
|
|
5,563 |
|
|
47,926 |
|
|
13,307 |
|
|
Receivables from related parties |
|
|
8,025 |
|
|
1,924 |
|
|
(7,806) |
|
|
Inventory |
|
|
(2,104) |
|
|
13,372 |
|
|
17,501 |
|
|
Prepaid expenses and other current assets |
|
|
(5,808) |
|
|
709 |
|
|
(545) |
|
|
Accounts payable and other accrued liabilities |
|
|
(235) |
|
|
(45,168) |
|
|
(13,078) |
|
|
Payables to related parties |
|
|
177 |
|
|
— |
|
|
(1,464) |
|
|
Customer deposits and advances |
|
|
(185) |
|
|
(1,308) |
|
|
2,328 |
|
|
Changes in other assets and liabilities |
|
|
(159) |
|
|
442 |
|
|
166 |
|
|
Corporate overhead support from general partner |
|
|
7,500 |
|
|
3,000 |
|
|
— |
|
|
NET CASH PROVIDED BY OPERATING ACTIVITIES |
|
|
45,277 |
|
|
46,041 |
|
|
30,157 |
|
|
|
|
|
|
|
|
|
|
|
|
|
|
CASH FLOWS FROM INVESTING ACTIVITIES |
|
|
|
|
|
|
|
|
|
|
|
Capital expenditures |
|
|
(24,718) |
|
|
(71,011) |
|
|
(56,878) |
|
|
Acquisitions of businesses |
|
|
— |
|
|
(12,583) |
|
|
— |
|
|
Proceeds received from sale of assets |
|
|
11,655 |
|
|
3,917 |
|
|
11,325 |
|
|
Change in restricted cash |
|
|
— |
|
|
600 |
|
|
(600) |
|
|
NET CASH USED IN INVESTING ACTIVITIES |
|
|
(13,063) |
|
|
(79,077) |
|
|
(46,153) |
|
|
|
|
|
|
|
|
|
|
|
|
|
|
CASH FLOWS FROM FINANCING ACTIVITIES |
|
|
|
|
|
|
|
|
|
|
|
Borrowings under revolving line of credit |
|
|
74,000 |
|
|
130,000 |
|
|
390,800 |
|
|
Payments on revolving line of credit |
|
|
(59,000) |
|
|
(51,000) |
|
|
(485,357) |
|
|
Payments on long-term debt and capital leases |
|
|
(451) |
|
|
(512) |
|
|
(5,032) |
|
|
Payment of related party note payable |
|
|
|
|
|
— |
|
|
(1,000) |
|
|
Payments on contingent earnout liabilities |
|
|
— |
|
|
(488) |
|
|
— |
|
|
Change in cash overdraft |
|
|
— |
|
|
(91) |
|
|
(295) |
|
|
Debt issuance costs |
|
|
(188) |
|
|
(6) |
|
|
(3,193) |
|
|
Distributions to unitholders |
|
|
(48,061) |
|
|
(47,025) |
|
|
(91,956) |
|
|
Issuance of Series D preferred units |
|
|
— |
|
|
— |
|
|
40,000 |
|
|
Redemption of Series D preferred units |
|
|
— |
|
|
— |
|
|
(42,436) |
|
|
Issuance of common units, net of issuance costs |
|
|
— |
|
|
— |
|
|
262,638 |
|
|
Common control acquisition |
|
|
— |
|
|
— |
|
|
(52,000) |
|
|
Contributions from the Predecessor |
|
|
— |
|
|
— |
|
|
4,321 |
|
|
Contributions from general partner |
|
|
2,400 |
|
|
1,218 |
|
|
— |
|
|
Tax withholding on unit-based vesting |
|
|
(174) |
|
|
(289) |
|
|
(354) |
|
|
Other |
|
|
— |
|
|
(109) |
|
|
(49) |
|
|
NET CASH (USED IN) PROVIDED BY FINANCING ACTIVITIES |
|
|
(31,474) |
|
|
31,698 |
|
|
16,087 |
|
|
|
|
|
|
|
|
|
|
|
|
|
|
Net change in cash and cash equivalents |
|
|
740 |
|
|
(1,338) |
|
|
91 |
|
|
Cash and cash equivalents balance, beginning of period |
|
|
1,987 |
|
|
3,325 |
|
|
3,234 |
|
|
Cash and cash equivalents balance, end of period |
|
$ |
2,727 |
|
$ |
1,987 |
|
$ |
3,325 |
|
|
|
|
|
|
|
|
|
|
|
|
|
|
SUPPLEMENTAL DISCLOSURES: |
|
|
|
|
|
|
|
|
|
|
|
Cash paid for interest |
|
$ |
5,381 |
|
$ |
4,527 |
|
$ |
7,179 |
|
|
Cash paid for taxes |
|
|
530 |
|
|
450 |
|
|
108 |
|
|
Non-cash investing and financing transactions: |
|
|
|
|
|
|
|
|
|
|
|
Accrued capital expenditures |
|
$ |
1,180 |
|
$ |
3,796 |
|
$ |
3,628 |
|
|
Debt funded portion of acquisition |
|
|
— |
|
|
12,475 |
|
|
52,000 |
|
|
Contributions from general partner |
|
|
7,500 |
|
|
4,350 |
|
|
— |
|
|
Acquisitions funded by issuance of units |
|
|
— |
|
|
3,442 |
|
|
267,100 |
|
|
Assets acquired under capital lease |
|
|
139 |
|
|
— |
|
|
177 |
|
See accompanying notes to consolidated financial statements
F-5
JP ENERGY PARTNERS LP
CONSOLIDATED STATEMENTS OF PARTNERS’ CAPITAL
(in thousands, except unit data)
|
|
|
|
Units |
||||||||||||||||||||||
|
|
|
|
Series D |
|
|
General |
|
|
|
|
|
|
|
|
Class A |
|
|
Class B |
|
|
Class C |
|
|
|
|
|
|
|
|
Preferred |
|
|
Partner |
|
|
Common |
|
|
Subordinated |
|
|
Common |
|
|
Common |
|
|
Common |
|
|
Total |
|
|
|
|
|
|
|
|
|
|
|
|
|
|
|
|
|
|
|
|
|
|
|
|
|
|
|
|
|
Balance - January 1, 2014 |
|
|
— |
|
|
45 |
|
|
— |
|
|
— |
|
|
8,004,368 |
|
|
1,206,844 |
|
|
3,254,781 |
|
|
12,466,038 |
|
|
|
|
|
|
|
|
|
|
|
|
|
|
|
|
|
|
|
|
|
|
|
|
|
|
|
|
|
Issuance of Class A Common Units |
|
|
— |
|
|
— |
|
|
— |
|
|
— |
|
|
363,636 |
|
|
— |
|
|
— |
|
|
363,636 |
|
|
Issuance of Class B Common Units |
|
|
— |
|
|
— |
|
|
— |
|
|
— |
|
|
— |
|
|
90,000 |
|
|
— |
|
|
90,000 |
|
|
Common control acquisition |
|
|
— |
|
|
— |
|
|
— |
|
|
— |
|
|
12,561,934 |
|
|
— |
|
|
— |
|
|
12,561,934 |
|
|
Issuance of Preferred Units |
|
|
1,928,909 |
|
|
— |
|
|
— |
|
|
— |
|
|
— |
|
|
— |
|
|
— |
|
|
1,928,909 |
|
|
Redemption of Preferred Units |
|
|
(1,928,909) |
|
|
— |
|
|
— |
|
|
— |
|
|
— |
|
|
— |
|
|
— |
|
|
(1,928,909) |
|
|
Recapitalization |
|
|
— |
|
|
(45) |
|
|
4,463,502 |
|
|
18,213,502 |
|
|
(20,929,938) |
|
|
(1,296,844) |
|
|
(3,254,781) |
|
|
(2,804,604) |
|
|
Issuance of Common Units, net of forfeitures |
|
|
— |
|
|
— |
|
|
13,746,017 |
|
|
— |
|
|
— |
|
|
— |
|
|
— |
|
|
13,746,017 |
|
|
Forfeiture of Subordinated Units |
|
|
— |
|
|
— |
|
|
— |
|
|
(16,253) |
|
|
— |
|
|
— |
|
|
— |
|
|
(16,253) |
|
|
|
|
|
|
|
|
|
|
|
|
|
|
|
|
|
|
|
|
|
|
|
|
|
|
|
|
|
Balance - December 31, 2014 |
|
|
— |
|
|
— |
|
|
18,209,519 |
|
|
18,197,249 |
|
|
— |
|
|
— |
|
|
— |
|
|
36,406,768 |
|
|
|
|
|
|
|
|
|
|
|
|
|
|
|
|
|
|
|
|
|
|
|
|
|
|
|
|
|
Issuance of Common Units |
|
|
— |
|
|
— |
|
|
266,951 |
|
|
— |
|
|
— |
|
|
— |
|
|
— |
|
|
266,951 |
|
|
Forfeiture of units under LTIP |
|
|
— |
|
|
— |
|
|
(19,400) |
|
|
(69,571) |
|
|
— |
|
|
— |
|
|
— |
|
|
(88,971) |
|
|
Vesting of units under LTIP |
|
|
— |
|
|
— |
|
|
8,250 |
|
|
— |
|
|
— |
|
|
— |
|
|
— |
|
|
8,250 |
|
|
|
|
|
|
|
|
|
|
|
|
|
|
|
|
|
|
|
|
|
|
|
|
|
|
|
|
|
Balance - December 31, 2015 |
|
|
— |
|
|
— |
|
|
18,465,320 |
|
|
18,127,678 |
|
|
— |
|
|
— |
|
|
— |
|
|
36,592,998 |
|
|
|
|
|
|
|
|
|
|
|
|
|
|
|
|
|
|
|
|
|
|
|
|
|
|
|
|
|
Forfeiture of units under LTIP |
|
|
— |
|
|
— |
|
|
(29,414) |
|
|
(3,607) |
|
|
— |
|
|
— |
|
|
— |
|
|
(33,021) |
|
|
Vesting of units under LTIP |
|
|
— |
|
|
— |
|
|
96,513 |
|
|
— |
|
|
— |
|
|
— |
|
|
— |
|
|
96,513 |
|
|
|
|
|
|
|
|
|
|
|
|
|
|
|
|
|
|
|
|
|
|
|
|
|
|
|
|
|
Balance - December 31, 2016 |
|
|
— |
|
|
— |
|
|
18,532,419 |
|
|
18,124,071 |
|
|
— |
|
|
— |
|
|
— |
|
|
36,656,490 |
|
|
|
|
Series D |
|
General |
|
|
|
|
|
Class A |
|
Class B |
|
Class C |
|
Predecessor |
|
|
|
|
||||||||
|
|
|
Preferred |
|
Partner |
|
Common |
|
Subordinated |
|
Common |
|
Common |
|
Common |
|
Capital |
|
Total |
|
|||||||||
|
|
|
(in thousands) |
|
|||||||||||||||||||||||||
|
Balance - January 1, 2014 |
|
$ |
— |
|
$ |
404 |
|
$ |
— |
|
$ |
— |
|
$ |
140,752 |
|
$ |
11,366 |
|
$ |
76,806 |
|
$ |
304,065 |
|
$ |
533,393 |
|
|
|
|
|
|
|
|
|
|
|
|
|
|
|
|
|
|
|
|
|
|
|
|
|
|
|
|
|
|
|
|
Contribution from Predecessor |
|
|
— |
|
|
— |
|
|
— |
|
|
— |
|
|
— |
|
|
— |
|
|
— |
|
|
4,321 |
|
|
4,321 |
|
|
Issuance of Class A Common Units |
|
|
— |
|
|
— |
|
|
— |
|
|
— |
|
|
8,000 |
|
|
— |
|
|
— |
|
|
— |
|
|
8,000 |
|
|
Issuance of Preferred Units |
|
|
40,000 |
|
|
— |
|
|
— |
|
|
— |
|
|
— |
|
|
— |
|
|
— |
|
|
— |
|
|
40,000 |
|
|
Redemption of Preferred Units |
|
|
(40,656) |
|
|
— |
|
|
(350) |
|
|
(1,430) |
|
|
— |
|
|
— |
|
|
— |
|
|
— |
|
|
(42,436) |
|
|
Unit-based compensation |
|
|
— |
|
|
— |
|
|
123 |
|
|
503 |
|
|
— |
|
|
1,163 |
|
|
— |
|
|
— |
|
|
1,789 |
|
|
Common control acquisition |
|
|
— |
|
|
(12,727) |
|
|
— |
|
|
— |
|
|
267,067 |
|
|
— |
|
|
— |
|
|
(306,340) |
|
|
(52,000) |
|
|
Recapitalization |
|
|
— |
|
|
12,323 |
|
|
72,405 |
|
|
295,453 |
|
|
(313,481) |
|
|
(6,268) |
|
|
(60,432) |
|
|
— |
|
|
— |
|
|
Issuance of units, net of issuance costs, forfeitures and tax withholdings |
|
|
— |
|
|
— |
|
|
252,745 |
|
|
— |
|
|
— |
|
|
— |
|
|
— |
|
|
— |
|
|
252,745 |
|
|
Issuance of Subordinated Units, net of issuance costs, forfeitures and tax withholdings |
|
|
— |
|
|
— |
|
|
— |
|
|
(153) |
|
|
— |
|
|
— |
|
|
— |
|
|
— |
|
|
(153) |
|
|
Distribution to unitholders |
|
|
— |
|
|
— |
|
|
— |
|
|
— |
|
|
(75,662) |
|
|
(4,528) |
|
|
(11,766) |
|
|
— |
|
|
(91,956) |
|
|
Net loss attributable to the period from January 1, 2014 to October 1, 2014 |
|
|
656 |
|
|
— |
|
|
— |
|
|
— |
|
|
(26,676) |
|
|
(1,733) |
|
|
(4,608) |
|
|
(2,046) |
|
|
(34,407) |
|
|
Net loss attributable to the period from October 2, 2014 to December 31, 2014 |
|
|
— |
|
|
— |
|
|
(9,293) |
|
|
(9,323) |
|
|
— |
|
|
— |
|
|
— |
|
|
— |
|
|
(18,616) |
|
|
|
|
|
|
|
|
|
|
|
|
|
|
|
|
|
|
|
|
|
|
|
|
|
|
|
|
|
|
|
|
Balance - December 31, 2014 |
|
$ |
— |
|
$ |
— |
|
$ |
315,630 |
|
$ |
285,050 |
|
$ |
— |
|
$ |
— |
|
$ |
— |
|
$ |
— |
|
$ |
600,680 |
|
|
|
|
|
|
|
|
|
|
|
|
|
|
|
|
|
|
|
|
|
|
|
|
|
|
|
|
|
|
|
|
Unit-based compensation |
|
|
— |
|
|
— |
|
|
941 |
|
|
368 |
|
|
— |
|
|
— |
|
|
— |
|
|
— |
|
|
1,309 |
|
|
Issuance of units, net of issuance costs, forfeitures and tax withholdings |
|
|
— |
|
|
— |
|
|
3,259 |
|
|
(215) |
|
|
— |
|
|
— |
|
|
— |
|
|
— |
|
|
3,044 |
|
|
Distribution to unitholders |
|
|
— |
|
|
— |
|
|
(23,788) |
|
|
(23,237) |
|
|
— |
|
|
— |
|
|
— |
|
|
— |
|
|
(47,025) |
|
|
Contribution from general partner |
|
|
— |
|
|
5,568 |
|
|
— |
|
|
— |
|
|
— |
|
|
— |
|
|
— |
|
|
— |
|
|
5,568 |
|
|
Net loss |
|
|
— |
|
|
— |
|
|
(29,351) |
|
|
(29,305) |
|
|
— |
|
|
— |
|
|
— |
|
|
— |
|
|
(58,656) |
|
|
|
|
|
|
|
|
|
|
|
|
|
|
|
|
|
|
|
|
|
|
|
|
|
|
|
|
|
|
|
|
Balance - December 31, 2015 |
|
$ |
— |
|
$ |
5,568 |
|
$ |
266,691 |
|
$ |
232,661 |
|
$ |
— |
|
$ |
— |
|
$ |
— |
|
$ |
— |
|
$ |
504,920 |
|
|
|
|
|
|
|
|
|
|
|
|
|
|
|
|
|
|
|
|
|
|
|
|
|
|
|
|
|
|
|
|
Unit-based compensation |
|
|
— |
|
|
— |
|
|
1,758 |
|
|
266 |
|
|
— |
|
|
— |
|
|
— |
|
|
— |
|
|
2,024 |
|
|
Unit forfeitures and tax withholdings |
|
|
— |
|
|
— |
|
|
(164) |
|
|
(10) |
|
|
— |
|
|
— |
|
|
— |
|
|
— |
|
|
(174) |
|
|
Distribution to unitholders |
|
|
— |
|
|
— |
|
|
(24,507) |
|
|
(23,554) |
|
|
— |
|
|
— |
|
|
— |
|
|
— |
|
|
(48,061) |
|
|
Contribution from general partner |
|
|
— |
|
|
9,900 |
|
|
— |
|
|
— |
|
|
— |
|
|
— |
|
|
— |
|
|
— |
|
|
9,900 |
|
|
Net loss |
|
|
— |
|
|
— |
|
|
(17,227) |
|
|
(17,296) |
|
|
— |
|
|
— |
|
|
— |
|
|
— |
|
|
(34,523) |
|
|
|
|
|
|
|
|
|
|
|
|
|
|
|
|
|
|
|
|
|
|
|
|
|
|
|
|
|
|
|
|
Balance - December 31, 2016 |
|
$ |
— |
|
$ |
15,468 |
|
$ |
226,551 |
|
$ |
192,067 |
|
$ |
— |
|
$ |
— |
|
$ |
— |
|
$ |
— |
|
$ |
434,086 |
|
See accompanying notes to consolidated financial statements.
F-6
JP ENERGY PARTNERS LP AND SUBSIDIARIES
NOTES TO CONSOLIDATED FINANCIAL STATEMENTS
1. Business and Basis of Presentation
Business. The consolidated financial statements presented herein contain the results of JP Energy Partners LP, a Delaware limited partnership, and its subsidiaries. All expressions of the “Partnership”, “JPE”, “us”, “we”, “our”, and all similar expressions are references to JP Energy Partners LP and our consolidated, wholly-owned subsidiaries, unless otherwise expressly stated or the context requires otherwise. We were formed in May 2010 by members of management and were further capitalized in June 2011 by ArcLight Capital Partners, LLC (“ArcLight”) to own, operate, develop and acquire a diversified portfolio of midstream energy assets. Our operations currently consist of three business segments: (i) crude oil pipelines and storage, (ii) refined products terminals and storage and (iii) NGL distribution and sales, which together provide midstream infrastructure solutions for the growing supply of crude oil, refined products and NGLs, in the United States. JP Energy GP II LLC (“GP II”) was our general partner with Argo Merger GP Sub, LLC becoming our general partner on March 8, 2017. See “AMID Merger Agreement” below for more details.
AMID Merger Agreement. On October 23, 2016, we and our general partner entered into an Agreement and Plan of Merger (“LP Merger Agreement”) with American Midstream Partners, L.P. (“AMID”), American Midstream GP, LLC, the general partner of AMID (“AMID GP”), and an indirect and wholly owned subsidiary of AMID (“Merger Sub”). On March 8, 2017, we were merged with and into Merger Sub (“AMID Merger”), with the Partnership surviving the merger as a wholly owned subsidiary of AMID.
At the effective time of the AMID Merger, (i) each of our common and subordinated units issued and outstanding, other than our common and subordinated units held by Lonestar, JP Energy Development LP, a Delaware limited partnership, or their respective affiliates (together, the “Affiliated Holders”) was converted into 0.5775 of a common unit representing limited partner interests in AMID (“AMID Common Unit”) and (ii) each of our common and subordinated units issued and outstanding held by the Affiliated Holders was converted into 0.5225 of an AMID Common Unit.
In connection with the LP Merger Agreement, on October 23, 2016, AMID GP entered into an Agreement and Plan of Merger (the “GP Merger Agreement” and, together with the LP Merger Agreement, the “Merger Agreements”) with our general partner and a wholly owned subsidiary of AMID GP (“GP Merger Sub”). On March 8, 2017, GP Merger Sub merged with and into GP II (the “GP Merger” together with the LP Merger, the “Mergers”), with GP II surviving the merger as a wholly owned subsidiary of AMID GP. As a result of the GP Merger, Argo Merger GP Sub, LLC was admitted as the sole general partner of JPE and GP II simultaneously ceased to be the general partner of JPE.
In connection with the Merger Agreements, Lonestar, the Partnership and our general partner entered into an Expense Reimbursement Agreement providing that Lonestar will reimburse, or will pay directly on behalf of, the Partnership or our general partner the third party reasonable costs and expenses incurred by the Partnership or our general partner in connection with the Mergers, including all reasonable out-of-pocket legal and financial advisory fees, costs and expenses paid or payable to third parties and incurred in connection with the negotiation, execution and performance of the LP Merger Agreement and consummation of the Mergers.
JP Development. On July 12, 2012, ArcLight and the owners of JPE formed JP Energy Development LP, a Delaware limited partnership (“JP Development”), for the express purpose of supporting JPE’s growth. Since its formation, JP Development had acquired a portfolio of midstream assets that were developed for potential future sale to JPE. JPE and JP Development are under common control because a majority of the equity interests in each entity and their general partners are owned by ArcLight. JP Development made the following acquisitions since its formation in July 2012:
On August 3, 2012, JP Development acquired Parnon Gathering LLC, a Delaware limited liability company (“Parnon Gathering”), which provides midstream gathering and transportation services to
F-7
companies engaged in the production, distribution and marketing of crude oil. Subsequent to the acquisition, Parnon Gathering LLC was renamed to JP Energy Marketing LLC (“JPEM”).
On July 15, 2013, JP Development acquired substantially all of the retail propane assets of BMH Propane, LLC, an Arkansas limited liability company (“BMH”), which is engaged in the retail and wholesale propane and refined fuel distribution business.
On August 30, 2013, JP Development, through JPEM, acquired substantially all the operating assets of Alexander Oil Field Services, Inc., a Texas Corporation (“AOFS”), which is engaged in the crude oil trucking business.
On October 7, 2013, JP Development acquired Wildcat Permian Services LLC, a Texas limited liability company (“Wildcat Permian”) that was later merged with and into JP Energy Permian, LLC, a Delaware limited liability company (“JP Permian”). JP Permian is engaged in the transportation of crude oil by pipeline.
On October 10, 2013, JP Liquids, LLC, a Delaware limited liability company and wholly owned subsidiary of JP Development (“JP Liquids”), acquired substantially all of the assets of Highway Pipeline, Inc., a Texas corporation (“Highway Pipeline”), which is engaged in the transportation of natural gas liquids and condensate via hard shell tank trucks.
As a result of the common control acquisition between JPE and JP Development discussed below and the sale of its GSPP pipeline assets (see Note 3), JP Development does not currently hold any material assets.
Common Control Acquisition between JPE and JP Development. On February 12, 2014, pursuant to a Membership Interest and Asset Purchase Agreement, we acquired (i) certain marketing and trucking businesses of JPEM (the “Parnon Gathering Assets”), (ii) the assets and liabilities associated with AOFS, (iii) the retail propane assets acquired from BMH and (iv) all of the issued and outstanding membership interests in JP Permian and JP Liquids (collectively, the “Dropdown Assets”) from JP Development for an aggregate purchase price of approximately $319.1 million (the “Common Control Acquisition”), which was comprised of 12,561,934 JPE Class A Common Units and $52.0 million cash. We financed the cash portion of the purchase price through borrowings under our revolving credit facility.
Basis of Presentation. Because JPE and JP Development are under common control, we are required under generally accepted accounting principles in the United States (“GAAP”) to account for this Common Control Acquisition in a manner similar to the pooling of interest method of accounting. Under this method of accounting, our balance sheet reflected JP Development’s historical carryover net basis in the Dropdown Assets instead of reflecting the fair market value of assets and liabilities of the Dropdown Assets. We also retrospectively recast our financial statements to include the operating results of the Dropdown Assets from the dates these assets were originally acquired by JP Development (the dates upon which common control began).
The historical assets and liabilities and the operating results of the Dropdown Assets have been “carved out” from JP Development’s consolidated financial statements using JP Development’s historical basis in the assets and liabilities of the businesses and reflects assumptions and allocations made by management to separate the Dropdown Assets on a stand-alone basis. Our recast historical consolidated financial statements include all revenues, costs, expenses, assets and liabilities directly attributable to the Dropdown Assets, as well as allocations that include certain expenses for services, including, but not limited to, general corporate expenses related to finance, legal, information technology, shared services, employee benefits and incentives and insurance. These expenses have been allocated based on the most relevant allocation method to the services provided, primarily on the relative percentage of revenue, relative percentage of headcount, or specific identification. Management believes the assumptions underlying the combined financial statements are reasonable. However, the combined financial statements do not fully reflect what our, including the Dropdown Assets’ balance sheets, results of operations and cash flows would have been, had the Dropdown Assets been under our management during the periods presented. As a result, historical financial information is not necessarily indicative of what our balance sheet, results of operations, and cash flows will be in the future.
F-8
JP Development has a centralized cash management that covers all of its subsidiaries. The net amounts due from/to JP Development by the Dropdown Assets relate to a variety of intercompany transactions including the collection of trade receivables, payment of accounts payable and accrued liabilities, charges of allocated corporate expenses and payments by JP Development on behalf of the Dropdown Assets. Such amounts have been treated as deemed contributions from/deemed distributions to JP Development for the year ended December 31, 2014. The total net effect of the deemed contributions is reflected as contribution from the predecessor in the statements of cash flows as a financing activity. The net balances due to us from the Dropdown Assets were settled in cash based on the outstanding balances at the effective date of Common Control Acquisition.
The total purchase price from the Common Control Acquisition exceeded JP Development’s book value of the net assets acquired. As a result, the excess of the total purchase price over the book value of the assets acquired of $12.7 million was considered a deemed distribution by the general partner and is included as a reduction in general partner interest in Partners’ Capital.
The “predecessor capital” included in Partners’ Capital represents JP Development’s net investment in the Dropdown Assets, which included the net income or loss allocated to the Dropdown Assets, and contributions from and distributions to JP Development. Certain transactions between the Dropdown Assets and other related parties that are wholly-owned subsidiaries of JP Development were not cash settled and, as a result, were considered deemed contributions or distributions and are included in JP Development’s net investment.
Net income (loss) attributable to the Dropdown Assets prior to our acquisition of such assets was not available for distribution to our unitholders. Therefore, this income (loss) was not allocated to the limited partners for the purpose of calculating net loss per common unit; instead, the income (loss) was allocated to predecessor capital.
Initial Public Offering. On October 2, 2014, our common units began trading on the New York Stock Exchange under the ticker symbol “JPEP.” On October 7, 2014, we closed our IPO of 13,750,000 common units at a price of $20.00 per unit. Prior to the closing of the IPO, the following recapitalization trasactions occurred:
we distributed approximately $92.1 million of accounts receivable that comprised our working capital assets to the existing partners, pro rata in accordance with their ownership interests, of which $72.5 million, $6.0 million and $3.3 million was distributed to Lonestar Midstream Holdings, LLC (“Lonestar”), Truman Arnold Companies (“TAC”) and JP Development, respectively, all of which are related parties;
each Class A common unit, Class B common unit and Class C common unit (collectively, the “Existing Common Units”) were split into approximately 0.89 common units, resulting in an aggregate of 22,677,004 outstanding Existing Common Units; and
an aggregate of 18,213,502 Existing Common Units held by the existing partners were automatically converted into 18,213,502 subordinated units representing a 80.3% interest in us prior to the IPO, and a 50.0% interest in us after the closing of the IPO, with 4,463,502 Existing Common Units remaining representing a 19.7% interest in us (the “Remaining Existing Common Units”).
Subsequent to the closing of the IPO, the following recapitalization transactions occurred:
the Remaining Existing Common Units were automatically converted on a one-to-one basis into 4,463,502 common units representing a 12.3% interest in us;
the 45 general partner units in the Partnership held by the general partner were recharacterized as a non-economic general partner interest in us; and
we issued 13,750,000 common units to the public representing a 37.7% interest in us.
F-9
We used the proceeds from the IPO of approximately $257.1 million, net of underwriting discounts and structuring fees, to:
pay offering expenses of approximately $2.0 million;
redeem 100% of our issued and outstanding Series D preferred units for approximately $42.4 million;
repay $195.6 million of the debt outstanding under our revolving credit facility; and
replenish $17.1 million of working capital that was distributed to the then existing partners immediately prior to the IPO.
Immediately following the repayment of the debt outstanding under the our revolving credit facility, we borrowed approximately $75.0 million thereunder in order to replenish the remainder of working capital that was distributed to existing partners immediately prior to the IPO.
2. Summary of Significant Accounting Policies
Principles of Consolidation. Our consolidated financial statements have been prepared in accordance with GAAP. All intercompany accounts and transactions have been eliminated in the preparation of the accompanying consolidated financial statements.
Use of Estimates. The preparation of the consolidated financial statements in conformity with GAAP requires management to make estimates and assumptions that affect the reported amounts of assets and liabilities, the disclosure of contingent assets and liabilities as of the date of the consolidated financial statements, and the reported amounts of revenues and expenses during the reporting period. Actual results could differ from these estimates.
Cash and Cash Equivalents. We consider all highly liquid instruments with an original maturity of three months or less at the time of issuance to be cash equivalents. Bank overdrafts that do not meet the right of offset criteria are recorded in capital leases and short-term debt in the consolidated balance sheets.
Accounts Receivable. Accounts receivable are reported net of the allowance for doubtful accounts. The allowance for doubtful accounts is based on specific identification and expectation of collecting considering historical collection results. Account balances considered to be uncollectible are recorded to the allowance for doubtful accounts and charged to bad debt expense, which is included in general and administrative expenses in the consolidated statements of operations. The allowance for doubtful accounts was $1,241,000 and $1,217,000 as of December 31, 2016 and 2015, respectively. Bad debt expense for the years ended December 31, 2016, 2015 and 2014 was $408,000, $1,212,000 and $820,000, respectively.
Inventory. Inventory is mainly comprised of crude oil, NGLs, refined products for resale, as well as propane cylinders expected to be sold to customers. Inventory is stated at the lower of cost or market. Cost of crude oil, NGLs and refined products inventory is determined using the first-in, first-out (FIFO) method. Cost of propane cylinders is determined using the weighted average method.
Prepaid Expenses and Other Current Assets. Prepaid expenses and other current assets primarily relate to prepaid insurance premiums, which totaled $5,394,000 and $1,239,000, and insurance receivables due from overpaid premiums and insurance claims, which totaled $2,156,000 and $115,000 as of December 31, 2016 and 2015, respectively.
Derivative Instruments and Hedging Activities. We recognize all derivative instruments as either assets or liabilities on the balance sheet at their respective fair values. We did not have any derivatives designated in hedging relationships during the years ended December 31, 2016, 2015 and 2014. Therefore, the change in the fair value of the derivative asset or liability is reflected in net loss in the consolidated statements of operations (mark-to-market
F-10
accounting). Cash flows from derivatives settled are reported as cash flow from operating activities, in the same category as the cash flows from the items being economically hedged.
We are also a party to a number of contracts that have elements of a derivative instrument. These contracts are primarily forward propane and crude oil purchase and sales contracts with counterparties. Although many of these contracts have the requisite elements of a derivative instrument, these contracts qualify for normal purchase and normal sales exception (“NPNS”) accounting under GAAP because they provide for the delivery of products or services in quantities that are expected to be used in the normal course of operating our business and the price in the contract is based on an underlying that is directly associated with the price of the product or service being purchased or sold. As a result, these contracts are not recorded in our consolidated financial statements until they are settled.
Property, Plant and Equipment. Property, plant and equipment is recorded at historical cost of construction, or, upon acquisition, the fair value of the assets acquired. Repairs and maintenance costs are expensed as incurred. Any major additions and improvements that materially extend the useful lives of property, plant and equipment are capitalized. At the time assets are retired, or otherwise disposed of, the asset and related accumulated depreciation are removed from the account, and any resulting gain or loss is recognized within the consolidated statements of operations.
We account for asset retirement obligations by recognizing on our balance sheet the net present value of any legally binding obligation to remove or remediate tangible long-lived assets, such as requirements to dispose of equipment. We record a liability for asset retirement obligations when a known obligation exists under current law or contract and when a reasonable estimate of the value of the liability can be made.
Depreciation of property, plant and equipment is recorded on a straight-line basis over the following estimated useful lives:
|
Buildings |
|
20 |
- |
30 |
years |
|
Leasehold improvements |
|
|
Various* |
|
|
|
Transportation equipment |
|
5 |
- |
15 |
years |
|
Propane tanks and cylinders |
|
3 |
- |
25 |
years |
|
Bulk storage tanks |
|
|
|
20 |
years |
|
Pipelines |
|
|
|
20 |
years |
|
Right-of-way |
|
|
Various* |
|
|
|
Office furniture and fixtures |
|
5 |
- |
10 |
years |
|
Other equipment |
|
3 |
- |
31 |
years |
*Leasehold improvements are depreciated over the shorter of the life of the leasehold improvement or the lease term. Right-of-way assets are depreciated over the shorter of the life of the related pipeline or the right-of-way term.
Leases. We have both capital and operating leases. Classification is made at the inception of the lease. The classification of leases is based on the extent to which risks and rewards incidental to ownership of a leased asset lie with the lessor or the lessee.
Leased property meeting certain capital lease criteria is capitalized and the present value of the related lease payments is recorded as a liability. The present value of the minimum lease payments is calculated utilizing the lower of our incremental borrowing rate or the lessor’s interest rate implicit in the lease, if known by us. Depreciation of capitalized leased assets is computed utilizing the straight-line method over the shorter of the estimated useful life of the asset or the lease term and is included in depreciation and amortization in our consolidated statements of operations. However, if the lease meets the bargain purchase or transfer of ownership criteria, the asset shall be amortized in accordance with our normal depreciation policy for owned assets.
Minimum rent payments under operating leases are recognized as an expense on a straight-line basis over the lease term, including any rent free periods.
F-11
Impairment of Long-Lived Assets. Long-lived assets such as property, plant and equipment, and acquired intangible assets subject to depreciation and amortization, are reviewed for impairment whenever events or changes in circumstances indicate that the carrying amount of an asset may not be recoverable. If circumstances require a long-lived asset or asset group to be tested for possible impairment, we first compare undiscounted cash flows expected to be generated by that asset or asset group to its carrying value. If the carrying value of the long-lived asset or asset group is not recoverable on an undiscounted cash flow basis, impairment is recognized to the extent that the carrying value exceeds its fair value. Fair value is determined through various valuation techniques including discounted cash flow models, quoted market values and third-party independent appraisals, as considered necessary (Level 3). For assets held for sale, we compare the fair value of the disposal group to its carrying value. Under the assets held for sale criteria, the order of impairment is based on (i) testing other assets, such as accounts receivable, inventory and indefinite-lived intangible assets, for impairment (ii) testing goodwill for impairment and (iii) testing the long-lived asset group for impairment. In connection with the sale of our Mid-Continent Business (defined in Note 3 and classified as held for sale at December 31, 2015), we recorded an impairment charge of $4,970,000 during the year ended December 31, 2015 related to long-lived assets, which is classified in net loss from discontinued operations in the consolidated statements of operations.
Goodwill and Other Intangible Assets. We apply Accounting Standards Codification ("ASC") 805, "Business Combinations," and ASC 350, "Intangibles—Goodwill and Other," to account for goodwill. In accordance with these standards, goodwill is not amortized but is tested for impairment at least annually, or more frequently whenever a triggering event or change in circumstances occurs at the reporting unit level. A reporting unit is the operating segment, or business one level below the operating segment if discrete financial information is prepared and regularly reviewed by segment management. We have the option to first assess qualitative factors to determine whether it is more likely than not that the fair value of the reporting unit is less than its carrying amount as a basis for determining whether further impairment testing is necessary. Impairment is indicated when the carrying amount of a reporting unit exceeds its fair value. To estimate the fair value of the reporting units, we make estimates and judgments about future cash flows, as well as revenues, cost of sales, operating expenses, capital expenditures and net working capital based on assumptions that are consistent with our most recent forecast. At the time it is determined that an impairment has occurred, the carrying value of the goodwill is written down to its fair value.
During the fourth quarter of 2016, we recognized impairment charges of $12.8 million in our Pinnacle Propane Express reporting unit within our NGL distribution and sales segment due primarily to declines in future estimated margins as a result of increased competition and recent increases in propane prices and $2.7 million in our JP Liquids reporting unit within our NGL distribution and sales segment due primarily to declines in future estimated volumes.
During the fourth quarter of 2015, we recognized impairment charges of $23,574,000 and $6,322,000 related to the goodwill in our crude oil supply and logistics reporting unit within our crude oil pipelines and storage segment and JP Liquids reporting unit within our NGL distribution and sales segment, respectively, primarily due to the substantial decline in commodity prices in 2015 and the resulting decline in margin as well as volume in those reporting units. We also recorded an additional goodwill impairment charge of $7,939,000 triggered by the disposition of our Mid-Continent Business. The $7,939,000 of goodwill was allocated to the Mid-Continent Business based on the relative fair value of the Mid-Continent Business and the portion of the reporting unit that was retained by us. No provision for impairment of goodwill was recorded during 2014.
During the second quarter of 2014, immediately prior to the sale of the Bakken Business (defined in Note 3) within the crude oil supply and logistics reporting unit, we allocated $1,984,000 of goodwill to the Bakken Business, which was based on the relative fair value of the disposed Bakken Business and the portion of the reporting unit that was retained by us. The $1,984,000 allocation contributed to the overall net loss from discontinued operations.
Business Combinations. When a business is acquired, we allocate the purchase price to the various components of the acquisition based upon the fair value of each component using various valuation techniques, including the market approach, income approach and/or cost approach. The accounting standard for business combinations requires most identifiable assets, liabilities, noncontrolling interests and goodwill acquired to be recorded at fair value. Transaction costs related to the acquisition of the business are expensed as incurred. Costs associated with the issuance of debt associated with a business combination are capitalized and included as a yield adjustment to the underlying
F-12
debt’s stated rate. Acquired intangible assets other than goodwill are amortized over their estimated useful lives unless the lives are determined to be indefinite. Contingent consideration obligations are recorded at fair value on the date of acquisition, with increases or decreases in the fair value arising from changes in assumptions or discount periods recorded as contingent consideration expenses in the consolidated statement of operations in subsequent periods. The fair values assigned to tangible and intangible assets acquired and liabilities assumed, including contingent consideration, are based on management’s estimates and assumptions, as well as other information compiled by management, including valuations that utilize customary valuation procedures and techniques.
When we acquire a business from an entity under common control, whereby the companies are ultimately controlled by the same party or parties both before and after the transaction, it is treated similar to the pooling of interest method of accounting. Under a common control acquisition, the assets and liabilities are recorded at the transferring entity’s historical cost instead of reflecting the fair market value of assets and liabilities.
Deferred Financing Costs. Debt issuance costs related to our revolving credit agreement (see Note 11) are deferred and are recorded net of accumulated amortization in the consolidated balance sheets as deferred financing costs, and totaled $2,029,000 and $2,809,000 at December 31, 2016 and 2015, respectively. These costs are amortized over the terms of the related debt using the effective interest rate method for the notes payable and the straight-line method for the revolving credit facilities. As a result of the financing transactions discussed in Note 11, we wrote off $1,634,000 of deferred financing costs associated with the extinguishment of debt during the year ended December 31, 2014 which is recorded in loss on extinguishment of debt in the consolidated statements of operations. Amortization of deferred financing costs is recorded in interest expense and totaled $969,000, $909,000 and $906,000 for the years ended December 31, 2016, 2015 and 2014, respectively.
Customer Deposits and Advances. Certain customers are offered a prepayment program which requires a customer to pay a fixed periodic amount or to otherwise prepay a portion of their anticipated product purchases. Customer prepayments in excess of associated billings are classified as customer deposits and advances in the consolidated balance sheets.
Revenue Recognition. We recognize revenue when persuasive evidence of an arrangement exists, delivery has occurred and/or services have been rendered, the seller’s price to the buyer is fixed and determinable and collectability is reasonably assured.
Revenue-related taxes collected from customers and remitted to taxing authorities, principally sales taxes, are presented on a net basis within the consolidated statements of operations.
Crude Oil Pipelines and Storage. The crude oil pipelines and storage segment mainly generates revenues through crude oil sales and pipeline transportation and storage fees. We enter into outright purchase and sales contracts as well as buy/sell contracts with counterparties, under which contracts we gather and transport different types of crude oil and eventually sell the crude oil to either the same counterparty or different counterparties. We account for such revenue arrangements on a gross basis. Occasionally, we enter into crude oil inventory exchange arrangements with the same counterparty which the purchase and sale of inventory are considered in contemplation of each other. Revenues from such inventory exchange arrangements are recorded on a net basis. Revenues for crude oil pipeline transportation services are recognized upon delivery of the product, and when payment has either been received or collection is reasonably assured. For certain crude oil pipeline transportation arrangements, we enter into sale and purchase contracts with counterparties instead of pipeline transportation agreements. In such cases, we assess the indicators associated with agent and principal considerations for each arrangement to determine whether revenue should be recorded on a gross basis versus net basis. In addition, we also provide crude oil transportation services to third party customers.
Refined Products Terminals and Storage. We generate fee-based revenues for terminal and storage services with longstanding customers under contracts that, consistent with industry practice, typically contain evergreen provisions after an initial term of one to two years. Such fee-based revenues are recognized when services are proved upon delivery of the products to customers. Revenues are also generated by selling excess refined products that result from blending, additization and inventory control processes.
F-13
NGLs Distributions and Sales. Revenues from the NGLs distributions and sales are mainly generated from NGL and refined product sales, sales of the related parts and equipment and through gathering and transportation fees.
Operating expenses. Operating expenses primarily include personnel, vehicle, delivery, handling, office, selling, and other expenses related to the distribution, terminal and storage of products and related supplies.
Expenses associated with the delivery of products to customers (including vehicle expenses, expenses of delivery personnel and vehicle repair and maintenance) are classified as operating expenses in the consolidated statements of operations.
General and administrative expenses. General and administrative expenses primarily include wages and benefits and department related costs for human resources, legal, finance and accounting, administrative support and supply.
Fair value measurement. We utilize valuation techniques that maximize the use of observable inputs and minimize the use of unobservable inputs to the extent possible. We determine fair value based on assumptions that market participants would use in pricing an asset or liability in the principal or most advantageous market. When considering market participant assumptions in fair value measurements, the following fair value hierarchy distinguishes between observable and unobservable inputs, which are categorized in one of the following levels:
Level 1 Inputs—Unadjusted quoted prices in active markets for identical assets or liabilities accessible to the reporting entity at the measurement date.
Level 2 Inputs—Other than quoted prices included in Level 1 inputs that are observable for the asset or liability, either directly or indirectly, for substantially the full term of the asset or liability.
Level 3 Inputs—Unobservable inputs for the asset or liability used to measure fair value to the extent that observable inputs are not available, thereby allowing for situations in which there is little, if any, market activity for the asset or liability at measurement date.
The fair value of our derivatives (see Note 12) was estimated using industry standard valuation models using market-based observable inputs, including commodity pricing and interest rate curves (Level 2). The fair value of our contingent liabilities (see Note 5) was determined using the discounted future estimated cash payments based on inputs that are not observable in the market (Level 3). We do not have any other assets or liabilities measured at fair value on a recurring basis.
Our other financial instruments consist primarily of cash and cash equivalents, trade and other receivables, accounts payable, accrued expenses and long term debt. The carrying value of our trade and other receivables, accounts payable and accrued expenses approximates fair value due to their highly liquid nature, short term maturity, or competitive rates assigned to these financial instruments. The fair value of long-term debt approximates the carrying value as the underlying instruments bear interest at rates similar to current rates offered to us for debt with the same remaining maturities.
Concentration Risk. Cash and cash equivalents are maintained at financial institutions and, at times, balances may exceed federally insured limits. We have not experienced any losses related to these balances.
F-14
The following table provides information about the extent of reliance on major customers and gas suppliers. Total revenues from transactions with an external customer amounting to 10% or more of revenue are disclosed below, together with the identity of the reportable segment.
|
|
|
|
|
Year Ended December 31, |
||||
|
Customer |
|
Reportable Segment |
|
2016 |
|
2015 |
|
2014 |
|
|
|
|
|
(in thousands) |
||||
|
Customer A |
|
Crude oil pipelines and storage, NGLs distribution and sales |
|
123,530 |
|
252,969 |
|
164,115 |
|
Customer B |
|
Crude oil pipelines and storage, NGLs distribution and sales |
|
76,367 |
|
* |
|
* |
|
Customer C |
|
Crude oil pipelines and storage |
|
55,540 |
|
* |
|
* |
|
Customer D |
|
Crude oil pipelines and storage, Refined products terminals and storage |
|
* |
|
* |
|
90,923 |
* Revenues are less than 10% of the total revenues during the period.
We are party to various commercial netting agreements that allow us and contractual counterparties to net receivable and payable obligations. These agreements are customary and the terms follow standard industry practice. In the opinion of management, these agreements reduce the overall counterparty risk exposure.
Income Taxes. We are a limited partnership, and therefore not directly subject to federal income taxes or most state income taxes. Our taxable income (loss) will be included in the federal income tax returns filed by the individual partners. Accordingly, no federal income tax provision has been made in our consolidated financial statements since the income tax is an obligation of the partners. We are subject to the Texas margin tax, which is reported in income tax expense in the consolidated statements of operations.
ASC 740, “Income Taxes”, requires the evaluation of tax positions taken or expected to be taken in the course of preparing our state tax returns and disallows the recognition of tax positions not deemed to meet a “more-likely-than-not” threshold of being sustained by the applicable tax authority. Our management does not believe we have any tax positions taken within our consolidated financial statements that would not meet this threshold. Our policy is to reflect interest and penalties related to uncertain tax positions as part of our income tax expense, when and if they become applicable.
Equity-Based Compensation. We account for equity based compensation by recognizing the fair value of awards on the grant date or the date of modification, as applicable, into expense as they are earned, using an estimated forfeiture rate. The forfeiture rate assumption is reviewed annually to determine whether any adjustments to expense are required.
Comprehensive Loss. For the years ended December 31, 2016, 2015 and 2014, comprehensive loss was equal to net loss.
Recent Accounting Pronouncements. In January 2017, the Financial Accounting Standards Board (“FASB”) issued Accounting Standards Update (“ASU”) 2017-01, Business Combinations (Topic 805): Clarifying the Definition of a Business. The amendment address the definition of what qualifies as a business to provide guidance to companies when determining whether the transaction should be treated as acquisitions of assets or businesses. The ASU is effective for public business entities for fiscal years beginning after December 15, 2017, including interim periods within those fiscal years. We are currently evaluating the potential impact this standard will have on our consolidated financial statements and related disclosures.
In November 2016, the FASB issued ASU 2016-18, Statement of Cash Flows (Topic 230): Restricted Cash. The amendments in this ASU require that a statement of cash flows explain the change during the period in the total of
F-15
cash, cash equivalents, and amounts generally described as restricted cash or restricted cash equivalents. The ASU is effective for public business entities for fiscal years beginning after December 15, 2017, including interim periods within those fiscal years. We are currently evaluating the potential impact this standard will have on our consolidated financial statements and related disclosures.
In August 2016, the FASB issued ASU 2016-15, Statement of Cash Flows (Topic 230): Classification of Certain Cash Receipts and Cash Payments. ASU 2016-15 addresses specific cash flow issues with the objective of reducing the diversity that exists in practice in how certain transactions are classified in the statement of cash flows. The standard is effective for interim and annual reporting periods beginning after December 15, 2017. Early adoption of this ASU is permitted. We adopted ASU 2016-15 in the third quarter of 2016 and the adoption did not have a material impact on our consolidated financial statements and related disclosures.
In March 2016, the FASB issued ASU 2016-09, Compensation—Stock Compensation (Topic 718): Improvements to Employee Share-Based Payment Accounting. This standard makes several modifications to Topic 718 related to the accounting for forfeitures, employer tax withholding on share-based compensation and the financial statement presentation of excess tax benefits or deficiencies. ASU 2016-09 also clarifies the statement of cash flows presentation for certain components of share-based awards. The standard is effective for interim and annual reporting periods beginning after December 15, 2016, although early adoption is permitted. The adoption of ASU 2016-09 is not expected to have a material impact on our consolidated financial statements and related disclosures.
In February 2016, the FASB issued ASU 2016-02, Leases (ASC 842). Lessees will need to recognize almost all leases on their balance sheet as a right-of-use asset and a lease liability. It will be critical to identify leases embedded in a contract to avoid misstating the lessee’s balance sheet. For income statement purposes, the FASB retained a dual model, requiring leases to be classified as either operating or finance. Classification will be based on criteria that are largely similar to those applied in current lease accounting, but without explicit bright lines. ASU 2016-02 is effective for public companies for annual reporting periods beginning after December 15, 2018 and interim periods within those fiscal years. We are currently evaluating the potential impact this standard will have on our consolidated financial statements and related disclosures.
In January 2016, the FASB issued ASU 2016-01, Recognition and Measurement of Financial Assets and Financial Liabilities. ASU 2016-01 requires equity investments to be measured at fair value with changes in fair value recognized in net income; simplifies the impairment assessment of equity investments without readily determinable fair values by requiring a qualitative assessment to identify impairment; Eliminates the requirement for public business entities to disclose the method(s) and significant assumptions used to estimate the fair value that is required to be disclosed for financial instruments measured at amortized cost on the balance sheet; requires public business entities to use the exit price notion when measuring the fair value of financial instruments for disclosure purposes; requires an entity to present separately in other comprehensive income the portion of the total change in the fair value of a liability resulting from a change in the instrument-specific credit risk when the entity has elected to measure the liability at fair value in accordance with the fair value option for financial instruments; requires separate presentation of financial assets and financial liabilities by measurement category and form of financial assets on the balance sheet or the accompanying notes to the financial statements and clarifies that an entity should evaluate the need for a valuation allowance on a deferred tax asset related to available-for-sale securities in combination with the entity’s other deferred tax assets. ASU 2016-01 is effective for financial statements issued for fiscal years beginning after December 15, 2017, and interim periods within those fiscal years. This standard does not allow for early adoption except related to credit risk adjustment in other comprehensive income. The adoption of ASU 2016-01 is not expected to have a material impact on our consolidated financial statements and related disclosures.
In November 2015, the FASB issued ASU 2015-17, Balance Sheet Classification of Deferred Taxes, which requires that deferred tax liabilities and assets be classified as non-current in a classified statement of financial position. This ASU is effective for financial statements issued for annual periods beginning after December 15, 2016, and interim periods within those annual periods, with early application permitted and, upon adoption, may be applied either prospectively or retrospectively. We early adopted, retrospectively, ASU 2015-17. There is no impact from the adoption of this ASU as our deferred taxes are already presented under the non-current classification for all periods presented.
F-16
In July 2015, the FASB issued ASU No. 2015-11, Inventory (Topic 330): Simplifying the Measurement of Inventory. ASU 2015-11 changes the measurement principle for inventory measured using any method other than LIFO or the retail inventory method from the lower of cost or market to lower of cost and net realizable value. Net realizable value is defined as estimated selling prices in the ordinary course of business, less reasonably predictable costs of completion, disposal, and transportation. ASU 2015-11 is effective for interim and annual periods beginning after December 15, 2016. Early adoption of this ASU is permitted. The adoption of ASU 2015-11 is not expected to have a material impact on our consolidated financial statements and related disclosures.
In May 2014, the FASB issued ASU No. 2014-09, Revenue from Contracts with Customers. ASU 2014-09 supersedes the existing revenue recognition guidance under GAAP. The core principle of ASU 2014-09 is to recognize revenues when promised goods or services are transferred to customers in an amount that reflects the consideration to which an entity expects to be entitled for those goods or services. ASU 2014-09 defines a five step process to achieve this core principle and, in doing so, more judgment and estimates may be required within the revenue recognition process than are required under existing GAAP. ASU 2014-09 is effective for interim and annual periods beginning after December 15, 2016 using either of the following transition methods: (i) a full retrospective approach reflecting the application of the standard in each prior reporting period with the option to elect certain practical expedients, or (ii) a retrospective approach with the cumulative effect of initially adopting ASU 2014-09 recognized at the date of adoption (which includes additional footnote disclosures). In August 2015, the FASB issued ASU No. 2015-14, Update Revenue from Contracts with Customers (Topic 606), which defers the effective date of ASU 2014-09 for public and non-public entities reporting under U.S. GAAP for one year. The FASB also decided to permit entities to early adopt the standard but adoption is not permitted earlier than the original effective date for public entities. In March 2016, the FASB issued ASU No. 2016-08, Revenue from Contracts with Customers (Topic 606) – Principal versus Agent Considerations (Reporting Gross versus Net), which is intended to provide clarity to principal versus agent considerations when it comes to revenue recognition related to ASU 2014-09. In April 2016, the FASB issued ASU No. 2016-10, Revenue from Contracts with Customers (Topic 606) – Identifying Performance Obligations and Licensing, which provides clarity to a few items for identifying performance obligations and licensing where the board had received feedback on the issuance of ASU 2014-09. In December 2016, the FASB issued ASU No. 2016-20, Technical Corrections and Improvements to Topic 606, Revenue from Contracts with Customers, which provides clarity and narrows the scope on numerous issues that have arisen from feedback the board received on the issuance of ASU 2014-09. ASU 2016-08, ASU 2016-10, and ASU 2016-20 are not effective until ASU 2014-09 becomes effective. We are currently evaluating the potential impact this standard will have on our consolidated financial statements and related disclosures.
3. Discontinued Operations
Mid-Continent. On February 1, 2016, we sold certain trucking and marketing assets in the Mid-Continent area (the “Mid-Continent Business”) to JP Development, simultaneous with JP Development’s sale of its GSPP pipeline assets to a third party buyer. The sales price related to the Mid-Continent Business was $9,685,000, in cash, which included certain adjustments related to inventory and other working capital items. We recognized a loss on disposal of approximately $12,909,000 during the year ended December 31, 2015, which primarily relates to the goodwill and long-lived asset impairment charge associated with the Mid-Continent Business. As of December 31, 2015, the Mid-Continent Business met all the criteria to be classified as asset held for sale in accordance with ASC 360, therefore, we classified all the related assets and liabilities as held for sale in the consolidated balance sheets. In addition, we allocated $7,939,000 of goodwill to the Mid-Continent Business, which was based on the relative fair value of the disposed Mid-Continent Business and the portion of the crude oil supply and logistics reporting unit that was retained by us. The $7,939,000 was subsequently impaired and contributed to the overall net loss from discontinued operations. The operating results of the Mid-Continent Business have been classified as discontinued operations for all periods presented in the consolidated statements of operations. We combined the cash flows from the Mid-Continent Business with the cash flows from continuing operations for all periods presented in the consolidated statements of cash flows. The Mid-Continent Business will not generate any continuing cash flows subsequent to the date of disposition. Prior to the classification as discontinued operations, we reported the Mid-Continent Business in our crude oil pipelines and storage segment. The following table summarizes selected financial information related to the Mid-Continent Business’ operations in the years ended December 31, 2016, 2015 and 2014.
F-17
Consolidated Statements of Operations
The discontinued operations of the Mid-Continent Business are summarized below:
|
|
|
Year Ended December 31, |
|
|||||||
|
|
|
2016 |
|
2015 |
|
2014 |
|
|||
|
|
|
(in thousands) |
|
|||||||
|
REVENUES |
|
|
|
|
|
|
|
|
|
|
|
Crude oil sales |
|
$ |
11,493 |
|
$ |
429,716 |
|
$ |
967,359 |
|
|
Gathering, transportation and storage fees |
|
|
— |
|
|
16 |
|
|
31 |
|
|
Other revenues |
|
|
2 |
|
|
52 |
|
|
90 |
|
|
Total revenues |
|
|
11,495 |
|
|
429,784 |
|
|
967,480 |
|
|
|
|
|
|
|
|
|
|
|
|
|
|
COSTS AND EXPENSES |
|
|
|
|
|
|
|
|
|
|
|
Cost of sales, excluding depreciation and amortization |
|
|
11,687 |
|
|
426,886 |
|
|
961,428 |
|
|
Operating expense |
|
|
172 |
|
|
1,402 |
|
|
1,930 |
|
|
General and administrative |
|
|
31 |
|
|
867 |
|
|
936 |
|
|
Impairment of goodwill and assets held for sale |
|
|
— |
|
|
12,909 |
|
|
— |
|
|
Depreciation and amortization |
|
|
211 |
|
|
2,281 |
|
|
2,258 |
|
|
(Gain) loss on disposal of assets, net |
|
|
(114) |
|
|
119 |
|
|
229 |
|
|
Total costs and expenses |
|
|
11,987 |
|
|
444,464 |
|
|
966,781 |
|
|
|
|
|
|
|
|
|
|
|
|
|
|
OPERATING (LOSS) INCOME |
|
|
(492) |
|
|
(14,680) |
|
|
699 |
|
|
|
|
|
|
|
|
|
|
|
|
|
|
OTHER INCOME (EXPENSE) |
|
|
|
|
|
|
|
|
|
|
|
Interest expense |
|
|
(47) |
|
|
(296) |
|
|
(412) |
|
|
Other income, net |
|
|
— |
|
|
25 |
|
|
46 |
|
|
|
|
|
|
|
|
|
|
|
|
|
|
(LOSS) INCOME FROM DISCONTINUED OPERATIONS BEFORE INCOME TAXES |
|
|
(539) |
|
|
(14,951) |
|
|
333 |
|
|
|
|
|
|
|
|
|
|
|
|
|
|
Income tax expense |
|
|
— |
|
|
— |
|
|
— |
|
|
|
|
|
|
|
|
|
|
|
|
|
|
NET (LOSS) INCOME FROM DISCONTINUED OPERATIONS |
|
$ |
(539) |
|
$ |
(14,951) |
|
$ |
333 |
|
Consolidated Balance Sheets
The current and non-current assets and liabilities of the Mid-Continent Business are as follows:
|
|
|
December 31, |
|
|
|
|
2015 |
|
|
|
|
(in thousands) |
|
|
ASSETS |
|
|
|
|
Current assets |
|
|
|
|
Inventory |
|
$ |
2,692 |
|
Prepaid expenses and other current assets |
|
|
38 |
|
Total Current assets of discontinued operations held for sale |
|
|
2,730 |
|
|
|
|
|
|
Non-current assets |
|
|
|
|
Property, plant and equipment, net |
|
|
5,203 |
|
Intangible assets, net |
|
|
1,138 |
|
Deferred financing costs and other assets, net |
|
|
303 |
|
Total Non-current assets of discontinued operations held for sale |
|
|
6,644 |
|
Total Assets of discontinued operations held for sale |
|
$ |
9,374 |
|
|
|
|
|
|
LIABILITIES |
|
|
|
|
Current liabilities |
|
|
|
|
Accrued liabilities |
|
$ |
640 |
|
Total Current liabilities of discontinued operations held for sale |
|
$ |
640 |
The following table summarizes other selected financial information related to the Mid-Continent Business.
|
|
|
Year Ended December 31, |
|||||||
F-18
|
|
|
2016 |
|
2015 |
|
2014 |
|||
|
|
|
(in thousands) |
|||||||
|
Depreciation |
|
$ |
115 |
|
$ |
1,127 |
|
$ |
1,104 |
|
Amortization |
|
|
96 |
|
|
1,154 |
|
|
1,154 |
|
Capital expenditures |
|
|
— |
|
|
637 |
|
|
316 |
|
Other operating noncash items related to discontinued operations: |
|
|
|
|
|
|
|
|
|
|
Impairment on goodwill and assets held for sale |
|
$ |
— |
|
$ |
12,909 |
|
$ |
— |
|
Derivative valuation changes |
|
|
— |
|
|
630 |
|
|
— |
|
(Gain) loss on disposal of assets |
|
|
(114) |
|
|
119 |
|
|
229 |
|
Non-cash inventory LCM adjustments |
|
|
— |
|
|
— |
|
|
222 |
|
|
|
|
|
|
|
|
|
|
|
|
Investing noncash items related to discontinued operations: |
|
|
|
|
|
|
|
|
|
|
Accrued capital expenditures |
|
$ |
— |
|
$ |
— |
|
$ |
218 |
Bakken Business. On June 30, 2014, we (“Seller”) entered into and simultaneously closed an Asset Purchase Agreement with Gold Spur Trucking, LLC (“Buyer”), pursuant to which the Seller sold all the trucking and related assets and activities in North Dakota, Montana and Wyoming (the “Bakken Business”) to the Buyer for a purchase price of $9,100,000. As a result, we recognized a loss on this sale of approximately $7,288,000 during the second quarter of 2014, which primarily relates to the write-off of a customer contract associated with the Bakken Business. In addition, immediately prior to the sale, we allocated $1,984,000 of goodwill to the Bakken Business, which was based on the relative fair value of the disposed Bakken Business and the portion of the crude oil supply and logistics reporting unit that was retained by us. The $1,984,000 allocation contributed to the overall net loss from discontinued operations.
The Bakken Business operations have been classified as discontinued operations for the year ended December 31, 2014 in the consolidated statements of operations. We combined the cash flows from the Bakken Business with the cash flows from continuing operations for all periods presented in the consolidated statements of cash flows. The Bakken Business will not generate any continuing cash flows subsequent to the date of disposition. Prior to the classification as discontinued operations, we reported the Bakken Business in our crude oil pipelines and storage segment. The following table summarizes selected financial information related to the Bakken Business’s operations in the year ended December 31, 2014.
|
|
|
Year Ended December 31, 2014 |
|
|
|
|
|
(in thousands) |
|
|
|
Revenues from discontinued operations |
|
$ |
7,865 |
|
|
Net loss of discontinued operations, including loss on disposal of $7,288 in 2014 |
|
|
(9,608) |
|
4. Net Loss Per Unit
Net loss per unit applicable to common limited partner units and to subordinated limited partner units is computed by dividing the respective limited partners’ interest in net income for the period subsequent to the IPO by the weighted-average number of common units and subordinated units outstanding for the period. Loss per limited partner unit is calculated in accordance with the two-class method for determining loss per unit for master limited partnerships (“MLPs”) when incentive distribution rights (“IDRs”) and other participating securities are present. The two-class method requires that loss per limited partner unit be calculated as if all earnings for the period were distributed as cash, and allocated by applying the provisions of the partnership agreement, and requires a separate calculation for each quarter and year-to-date period. Under the two-class method, any excess of distributions declared over net income is allocated to the partners based on their respective sharing of income specified in the partnership agreement. For the years ended December 31, 2016, 2015 and 2014, dilutive loss per unit was equal to basic loss per unit because all instruments were antidilutive.
On January 24, 2017, the Board of Directors of our general partner declared a cash distribution for the fourth quarter of 2016 of $0.325 per common unit and subordinated unit. The distribution was paid on February 14, 2017 to unitholders of record as of February 7, 2017.
F-19
|
|
|
Year ended December 31, 2016 |
|||||||
|
|
|
Common Units |
|
Subordinated Units |
|
Total |
|||
|
|
|
(in thousands except for unit and per unit data) |
|||||||
|
Net loss from continuing operations attributable to the limited partners: |
|
|
|
|
|
|
|
|
|
|
Distribution declared |
|
$ |
24,508 |
|
$ |
23,562 |
|
$ |
48,070 |
|
Distributions in excess of net income |
|
|
(41,463) |
|
|
(40,591) |
|
|
(82,054) |
|
Net loss from continuing operations attributable to the limited partners |
|
$ |
(16,955) |
|
$ |
(17,029) |
|
$ |
(33,984) |
|
|
|
|
|
|
|
|
|
|
|
|
Net loss from discontinued operations attributable to the limited partners |
|
|
(272) |
|
|
(267) |
|
|
(539) |
|
Net loss attributable to the limited partners |
|
$ |
(17,227) |
|
$ |
(17,296) |
|
$ |
(34,523) |
|
|
|
|
|
|
|
|
|
|
|
|
Weighted average units outstanding: |
|
|
|
|
|
|
|
|
|
|
Basic |
|
|
18,514,476 |
|
|
18,125,093 |
|
|
36,639,569 |
|
|
|
|
|
|
|
|
|
|
|
|
Net loss per unit: |
|
|
|
|
|
|
|
|
|
|
Basic and diluted from continuing operations |
|
$ |
(0.92) |
|
$ |
(0.94) |
|
|
|
|
Basic and diluted from discontinued operations |
|
$ |
(0.01) |
|
$ |
(0.01) |
|
|
|
|
Basic and diluted total |
|
$ |
(0.93) |
|
$ |
(0.95) |
|
|
|
|
|
|
Year ended December 31, 2015 |
|
|||||||
|
|
|
Common Units |
|
Subordinated Units |
|
Total |
|
|||
|
|
|
|
(in thousands except for unit and per unit data) |
|
||||||
|
Net loss from continuing operations attributable to the limited partners: |
|
|
|
|
|
|
|
|
|
|
|
Distribution declared |
|
$ |
24,172 |
|
$ |
23,571 |
|
$ |
47,743 |
|
|
Distributions in excess of net income |
|
|
(46,002) |
|
|
(45,446) |
|
|
(91,448) |
|
|
Net loss from continuing operations attributable to the limited partners |
|
$ |
(21,830) |
|
$ |
(21,875) |
|
$ |
(43,705) |
|
|
|
|
|
|
|
|
|
|
|
|
|
|
Net loss from discontinued operations attributable to the limited partners |
|
|
(7,521) |
|
|
(7,430) |
|
|
(14,951) |
|
|
Net loss attributable to the limited partners |
|
$ |
(29,351) |
|
$ |
(29,305) |
|
$ |
(58,656) |
|
|
|
|
|
|
|
|
|
|
|
|
|
|
Weighted average units outstanding: |
|
|
|
|
|
|
|
|
|
|
|
Basic |
|
|
18,373,594 |
|
|
18,151,700 |
|
|
36,525,294 |
|
|
|
|
|
|
|
|
|
|
|
|
|
|
Net loss per unit: |
|
|
|
|
|
|
|
|
|
|
|
Basic and diluted from continuing operations |
|
$ |
(1.19) |
|
$ |
(1.20) |
|
|
|
|
|
Basic and diluted from discontinued operations |
|
$ |
(0.41) |
|
$ |
(0.41) |
|
|
|
|
|
Basic and diluted total |
|
$ |
(1.60) |
|
$ |
(1.61) |
|
|
|
|
F-20
|
|
|
Year ended December 31, 2014 |
|
|||||||
|
|
|
Common Units |
|
Subordinated Units |
|
Total |
|
|||
|
|
|
|
(in thousands except for unit and per unit data) |
|
||||||
|
Net loss from continuing operations attributable to the limited partners: |
|
|
|
|
|
|
|
|
|
|
|
Distribution declared |
|
$ |
5,523 |
|
$ |
5,491 |
|
$ |
11,014 |
|
|
Distributions in excess of net income |
|
|
(14,983) |
|
|
(14,981) |
|
|
(29,964) |
|
|
Net loss from continuing operations attributable to the limited partners |
|
$ |
(9,460) |
|
$ |
(9,490) |
|
$ |
(18,950) |
|
|
|
|
|
|
|
|
|
|
|
|
|
|
Net income from discontinued operations attributable to the limited partners |
|
|
167 |
|
|
167 |
|
|
334 |
|
|
Net loss attributable to the limited partners |
|
$ |
(9,293) |
|
$ |
(9,323) |
|
$ |
(18,616) |
|
|
|
|
|
|
|
|
|
|
|
|
|
|
Weighted average units outstanding: |
|
|
|
|
|
|
|
|
|
|
|
Basic |
|
|
18,212,632 |
|
|
18,209,948 |
|
|
36,422,580 |
|
|
|
|
|
|
|
|
|
|
|
|
|
|
Net income (loss) per unit: |
|
|
|
|
|
|
|
|
|
|
|
Basic and diluted from continuing operations |
|
$ |
(0.52) |
|
$ |
(0.52) |
|
|
|
|
|
Basic and diluted from discontinued operations |
|
$ |
0.01 |
|
$ |
0.01 |
|
|
|
|
|
Basic and diluted total |
|
$ |
(0.51) |
|
$ |
(0.51) |
|
|
|
|
The following data shows securities that could potentially dilute earnings per unit in the future that were not included in the computation of diluted earnings per unit because to do so would have been antidilutive for the year ended December 31, 2016 and 2015:
|
|
|
Year Ended December 31, |
||||
|
|
|
2016 |
|
2015 |
||
|
Phantom units |
|
|
530,133 |
|
|
406,218 |
5. Acquisitions and Dispositions
2015 Acquisitions
Acquisition of Southern Propane Inc. On May 8, 2015, we acquired substantially all of the assets of Southern Propane Inc. (“Southern”), a Houston-based industrial and commercial propane distribution and logistics company. The acquisition expanded the asset base and market share of our NGL distribution and sales segment, specifically the acceleration of our entry into the Houston, Texas market, as well as expansion of our industrial, non-seasonal customers. The total purchase price of $16,292,000 consisted of a $12,475,000 cash payment that was paid on the acquisition date, and which was funded through the use of borrowings from our revolving credit facility, a $108,000 cash payment to the seller as the final working capital adjustment, the issuance of 266,951 common units valued at $3,442,000 and a contingent earn-out liability with a value of $267,000 that is subject to the achievement of certain gross profit targets at Southern. The earn-out period covers the period from June 2015 through December 2016, and the maximum earn-out that could be earned was $1,250,000. The common units issued with this acquisition were issued in a private offering conducted in accordance with the exemption from the registration requirements of Section 4(a)(2) of the Securities Act of 1933, as amended, as such units were issued to the owners of a business acquired in a privately negotiated transaction not involving any public offering or solicitation.
The fair value of the contingent earn-out liability was estimated by applying an expected present value technique based on the probability-weighted average of possible outcomes that would occur should certain financial metrics be reached. That measure is based on significant inputs that are not observable in the market, which ASC 820
F-21
refers to as Level 3 inputs. The contingent earn-out was established at the time of the acquisition and is revalued at each reporting period. Based on the actual post-acquisition performance results and revised projections, we estimated the fair value of the Southern contingent earn-out liability to be $243,000 as of December 31, 2015, which is recorded in Other long-term liabilities in the consolidated balance sheets. As of December 31, 2016, the Southern contingent earn-out liability was written off and we recognized a $243,000 gain for the year ended December 31, 2016. For the year ended December 31, 2015, we recorded $24,000 in income related to the changes in the fair value of the contingent earn-out liability. Changes in fair value of the Southern contingent earn-out is included in Other income, net, in our consolidated statements of operations.
The following table represents our allocation of the total purchase price of this acquisition to the assets acquired (in thousands):
|
Accounts receivable |
|
$ |
932 |
|
Inventory |
|
|
24 |
|
Total current assets |
|
|
956 |
|
Property, plant and equipment |
|
|
2,962 |
|
Intangible assets: |
|
|
|
|
Customer relationships |
|
|
6,163 |
|
Noncompete agreements |
|
|
292 |
|
Trade names |
|
|
113 |
|
Total identifiable net assets acquired |
|
|
10,486 |
|
Goodwill |
|
|
5,806 |
|
Net assets acquired |
|
$ |
16,292 |
Goodwill associated with the Southern acquisition principally results from synergies expected from integrated operations. The fair values of the acquired intangible assets were estimated by applying the income approach. That measure is based on significant inputs that are not observable in the market, which ASC 820 refers to as Level 3 inputs. Trade names are amortized over an estimated useful life of one year, customer relationships are amortized over a weighted average useful life of 12 years, and non-compete agreements are amortized over a weighted average useful life of 5 years.
Revenues attributable to Southern included in the consolidated statements of operations totaled $5,766,000 for the year ended December 31, 2016 and $3,849,000 for the period from May 8, 2015 to December 31, 2015. We do not account for the operations of Southern on a stand-alone basis, therefore, it is impracticable to report the amounts of net income of Southern included in the consolidated statements of operations related to the post-acquisition periods.
Disposition of crude oil supply and logistics assets. On September 30, 2015, we entered into an asset purchase agreement pursuant to which we sold certain crude oil supply and logistics assets for a sales price of $1,914,000. We closed the transaction on November 2, 2015 and recognized a gain on disposal of $1,046,000 for the year ended December 31, 2015.
F-22
6. Inventory
Inventory consists of the following as of December 31, 2016 and 2015:
|
|
|
December 31, |
|
December 31, |
|
||
|
|
|
2016 |
|
2015 |
|
||
|
|
|
(in thousands) |
|
||||
|
Crude oil |
|
$ |
1,270 |
|
$ |
338 |
|
|
NGLs |
|
|
3,194 |
|
|
2,364 |
|
|
Refined products |
|
|
264 |
|
|
430 |
|
|
Materials, supplies and equipment |
|
|
1,787 |
|
|
1,654 |
|
|
Total inventory |
|
$ |
6,515 |
|
$ |
4,786 |
|
7. Property, Plant and Equipment, net
Property, plant and equipment, net consists of the following as of December 31, 2016 and 2015:
|
|
|
December 31, |
|
||||
|
|
|
2016 |
|
2015 |
|
||
|
|
|
(in thousands) |
|
||||
|
Land |
|
$ |
6,699 |
|
$ |
6,874 |
|
|
Buildings and improvements |
|
|
12,846 |
|
|
12,561 |
|
|
Transportation equipment |
|
|
44,060 |
|
|
46,582 |
|
|
Storage and propane tanks |
|
|
151,793 |
|
|
151,988 |
|
|
Pipelines and linefill |
|
|
84,207 |
|
|
73,404 |
|
|
Right-of-way |
|
|
5,563 |
|
|
3,891 |
|
|
Office furniture and fixtures |
|
|
12,751 |
|
|
9,701 |
|
|
Other equipment |
|
|
52,439 |
|
|
48,171 |
|
|
Construction-in-progress |
|
|
8,564 |
|
|
12,763 |
|
|
Total property, plant and equipment |
|
|
378,922 |
|
|
365,935 |
|
|
Less: accumulated depreciation |
|
|
(100,772) |
|
|
(74,481) |
|
|
Property, plant and equipment, net |
|
$ |
278,150 |
|
$ |
291,454 |
|
Depreciation expense totaled $30,108,000, $29,391,000 and $23,514,000 for the years ended December 31, 2016, 2015 and 2014, respectively, which is included in depreciation and amortization expense in the consolidated statements of operations. Depreciation expense amounts have been adjusted by $115,000, $1,127,000 and $1,685,000 for the years ended December 31, 2016, 2015 and 2014, respectively, to present the Mid-Continent and Bakken Business’s operations as discontinued operations.
F-23
8. Goodwill and Intangible Assets
Intangible assets consist of the following for the years ended December 31, 2016 and 2015:
|
|
|
|
|
|
|
|
|
|
|
|
|
|
|
December 31, 2016 |
|
|||||||
|
|
|
Gross |
|
|
|
Net |
|
|||
|
|
|
carrying |
|
Accumulated |
|
carrying |
|
|||
|
|
|
amount |
|
amortization |
|
amount |
|
|||
|
|
|
|
(in thousands) |
|
||||||
|
|
|
|
|
|
|
|
|
|
|
|
|
Customer relationships |
|
$ |
80,103 |
|
$ |
(25,775) |
|
$ |
54,328 |
|
|
Noncompete agreements |
|
|
3,423 |
|
|
(3,086) |
|
|
337 |
|
|
Trade names |
|
|
553 |
|
|
(191) |
|
|
362 |
|
|
Customer contract |
|
|
95,594 |
|
|
(33,414) |
|
|
62,180 |
|
|
Other |
|
|
198 |
|
|
(20) |
|
|
178 |
|
|
Total |
|
$ |
179,871 |
|
$ |
(62,486) |
|
$ |
117,385 |
|
|
|
|
|
|
|
|
|
|
|
|
|
|
|
|
December 31, 2015 |
|
|||||||
|
|
|
Gross |
|
|
|
|
Net |
|
||
|
|
|
carrying |
|
Accumulated |
|
carrying |
|
|||
|
|
|
amount |
|
amortization |
|
amount |
|
|||
|
|
|
(in thousands) |
|
|||||||
|
Customer relationships |
|
$ |
82,630 |
|
$ |
(20,761) |
|
$ |
61,869 |
|
|
Noncompete agreements |
|
|
3,575 |
|
|
(2,664) |
|
|
911 |
|
|
Trade names |
|
|
553 |
|
|
(139) |
|
|
414 |
|
|
Customer contract |
|
|
95,594 |
|
|
(24,538) |
|
|
71,056 |
|
|
Other |
|
|
198 |
|
|
(16) |
|
|
182 |
|
|
Total |
|
$ |
182,550 |
|
$ |
(48,118) |
|
$ |
134,432 |
|
In connection with the sale of the Mid-Continent Business, which was classified as held for sale at December 31, 2015, we recorded an impairment charge of $689,000 related to customer relationships during the year ended December 31, 2015, which is classified in net loss from discontinued operations in the consolidated statements of operations. In addition, as a result of the sale of the Bakken Business, we wrote-off $8,060,000 in customer contracts during the year ended December 31, 2014 (see Note 3).
Amortization expense totaled $17,043,000, $17,461,000 and $16,716,000 for December 31, 2016, 2015 and 2014, respectively, which is included in depreciation and amortization expense in the consolidated statements of operations. Amortization expense amounts have been adjusted by $96,000, $1,154,000 and $2,007,000 for the years ended December 31, 2016, 2015 and 2014, respectively, to present the Mid-Continent and Bakken Business’s operations as discontinued operations.
We amortize intangible assets over their estimated benefit period on a straight-line basis.
F-24
The estimated future amortization expense for amortizable intangible assets to be recognized as of December 31, 2016 is as follows (in thousands):
|
|
|
|
|
|
|
2017 |
|
$ |
15,249 |
|
|
2018 |
|
|
15,105 |
|
|
2019 |
|
|
13,499 |
|
|
2020 |
|
|
10,790 |
|
|
2021 |
|
|
9,647 |
|
|
Thereafter |
|
|
53,095 |
|
|
Total |
|
$ |
117,385 |
|
All of the shell capacity of our storage tanks in our crude oil storage facility in Cushing, Oklahoma is dedicated to one customer pursuant to a long-term contract with an initial expiration of August 3, 2017 and an optional two year renewal term. We did not receive notice of intent to renew the lease from that customer by the required date of February 3, 2017. While we continue to be in discussions with this customer and other parties about renting the storage, we currently expect to accelerate the remaining amortization of the related customer relationship intangible of $9,960,000 beginning in the first quarter of 2017 through August 2017.
Goodwill activity in 2016 and 2015 consists of the following:
|
|
|
|
|
|
Refined |
|
|
|
|
|
|
|
|
|
|
|
Crude oil |
|
products |
|
NGL |
|
|
|
|
|||
|
|
|
pipelines and |
|
terminals and |
|
distribution |
|
|
|
|
|||
|
|
|
storage |
|
storage |
|
and sales |
|
Total |
|
||||
|
|
|
(in thousands) |
|
||||||||||
|
Balance at January 1, 2015 |
|
$ |
148,284 |
|
$ |
61,163 |
|
$ |
31,335 |
|
$ |
240,782 |
|
|
Goodwill acquired during the year |
|
|
— |
|
|
— |
|
|
5,806 |
|
|
5,806 |
|
|
Goodwill impairment |
|
|
(23,574) |
|
|
— |
|
|
(6,322) |
|
|
(29,896) |
|
|
Balance at December 31, 2015 |
|
|
124,710 |
|
|
61,163 |
|
|
30,819 |
|
|
216,692 |
|
|
Goodwill impairment |
|
|
— |
|
|
— |
|
|
(15,456) |
|
|
(15,456) |
|
|
Balance at December 31, 2016 |
|
$ |
124,710 |
|
$ |
61,163 |
|
$ |
15,363 |
|
$ |
201,236 |
|
We recorded a goodwill impairment charge of $15,456,000 during the year ended December 31, 2016 related to our Pinnacle Propane Express and JP Liquids reporting units. We recorded a goodwill impairment charge of $29,896,000 during the year ended December 31, 2015 related to our Crude Oil Supply and Logistics and JP Liquids reporting units. Additionally, in connection with the sale of the Mid-Continent Business, we recorded a goodwill impairment charge of $7,939,000 during the year ended December 31, 2015 which is classified in net loss from discontinuing operations in the consolidated statements of operations.
9. Accrued Liabilities
Accrued liabilities are comprised of the following as of December 31, 2016 and 2015:
|
|
|
December 31, |
|
||||
|
|
|
2016 |
|
2015 |
|
||
|
|
|
(in thousands) |
|
||||
|
Taxes payable |
|
$ |
1,066 |
|
$ |
1,204 |
|
|
Accrued payroll and employee benefits |
|
|
6,578 |
|
|
4,756 |
|
|
Royalties payable |
|
|
3,926 |
|
|
4,163 |
|
|
Recoverable gas costs |
|
|
1,126 |
|
|
1,337 |
|
|
Other |
|
|
2,572 |
|
|
3,800 |
|
|
Total accrued liabilities |
|
$ |
15,268 |
|
$ |
15,260 |
|
F-25
10. Capital Leases and Other Short-Term Debt
Capital Leases. We have certain leases for buildings, transportation equipment and office equipment, which are accounted for as capital leases. The leases mature between 2017 and 2021. Assets under capital lease are recorded within property, plant and equipment, net in the consolidated balance sheets. The following is a summary of assets held under such agreements.
|
|
|
December 31, |
|
||||
|
|
|
2016 |
|
2015 |
|
||
|
|
|
(in thousands) |
|
||||
|
Buildings and improvements |
|
$ |
277 |
|
$ |
16 |
|
|
Transportation equipment |
|
|
85 |
|
|
167 |
|
|
Office furniture and equipment |
|
|
133 |
|
|
133 |
|
|
Other equipment |
|
|
38 |
|
|
35 |
|
|
|
|
|
533 |
|
|
351 |
|
|
Less: Accumulated depreciation |
|
|
(307) |
|
|
(197) |
|
|
Assets under capital lease, net |
|
$ |
226 |
|
$ |
154 |
|
Scheduled repayments of capital lease obligations are as follows (in thousands):
|
Years ending December 31, |
|
|
|
|
|
2017 |
|
$ |
105 |
|
|
2018 |
|
|
70 |
|
|
2019 |
|
|
61 |
|
|
2020 |
|
|
52 |
|
|
2021 |
|
|
33 |
|
|
Thereafter |
|
|
— |
|
|
|
|
|
321 |
|
|
Less: amounts representing interest |
|
|
(96) |
|
|
Total obligations under capital leases |
|
|
225 |
|
|
Less: current portion |
|
|
(77) |
|
|
Long-term capital lease obligation |
|
$ |
148 |
|
The long term capital lease obligation is included within other long-term liabilities in the consolidated balance sheets.
11. Long-Term Debt
Long-term debt consists of the following at December 31, 2016 and 2015:
|
|
|
December 31, |
|
||||
|
|
|
2016 |
|
2015 |
|
||
|
|
|
(in thousands) |
|
||||
|
Bank of America revolving loan |
|
$ |
177,000 |
|
$ |
162,000 |
|
|
HBH note payable |
|
|
950 |
|
|
1,077 |
|
|
Non-compete notes payable |
|
|
— |
|
|
117 |
|
|
Total long-term debt |
|
$ |
177,950 |
|
$ |
163,194 |
|
|
Less: Current maturities |
|
|
(950) |
|
|
(454) |
|
|
Total long-term debt, net of current maturities |
|
$ |
177,000 |
|
$ |
162,740 |
|
Bank of America Credit Agreement. On February 12, 2014, we entered into a credit agreement with Bank of America, N.A. (the “BOA Credit Agreement”), which was available for refinancing and repayment of certain existing
F-26
indebtedness, working capital, capital expenditures, permitted acquisitions and general partnership purposes, including distributions, not in contravention of law of the loan documents and to pay off our existing WFB commitments and F&M Loans (as described below). The BOA Credit Agreement consisted of a $275,000,000 revolving loan, which included a sub-limit of up to $100,000,000 for letters of credit. The BOA Credit Agreement was scheduled to mature on February 12, 2019. On March 8, 2017, in connection with the closing of the AMID Merger, the BOA Credit Agreement was paid off in full and terminated.
Borrowings under the BOA Credit Agreement bore interest at a rate per annum equal to, at our option, either (a) a base rate determined by reference to the highest of (1) the federal funds effective rate plus 0.50%, (2) the prime rate of Bank of America, and (3) LIBOR, subject to certain adjustments, plus 1.00% or (b) LIBOR, in each case plus an applicable rate. The applicable rate was (a) 1.25% for prime rate borrowings and 2.25% for LIBOR borrowings. The commitment fee was subject to an adjustment each quarter based on the Consolidated Net Total Leverage Ratio, as defined in the BOA Credit Agreement.
As of December 31, 2016, the unused balance of the BOA Credit Agreement was $78,150,000. Issued and outstanding letters of credit, which reduced available borrowings under the BOA Credit Agreement, totaled $19,850,000 at December 31, 2016. We are required to pay a commitment fee on the unused commitments under the BOA Credit Agreement, which initially was 0.50% per annum. The commitment fee was subject to an adjustment each quarter based on the Consolidated Net Total Leverage Ratio, as defined in the BOA Credit Agreement.
The BOA Credit Agreement contained various restrictive covenants and compliance requirements including:
Maintenance of certain financial covenants including a consolidated net total leverage ratio of not more than 4.50 to 1.00 prior to the issuance of certain unsecured notes, a consolidated net total leverage ratio of not more than 5.00 to 1.00 from and after the issuance of certain unsecured notes, a consolidated senior secured net leverage ratio of not more than 3:50 to 1:00 from and after the issuance of certain unsecured notes, available liquidity (as defined in the BOA Credit Agreement) of not less than $25,000,000 and a consolidated interest coverage ratio of not less than 2.50 to 1.00.
Financial statement reporting requirements, including quarterly unaudited financial statement reporting and annual audited financial statement reporting.
Restrictions on cash distributions, including cash distributions to holders of equity units, unless certain leverage and coverage ratios are maintained before and after the cash distribution.
We were in compliance with all covenants as of December 31, 2016.
HBH Note Payable. We issued a $2,012,500 non-interest bearing promissory note in conjunction with the acquisition of HBH on November 15, 2011. The carrying value of this note is $950,000 and $1,077,000 as of December 31, 2016 and December 31, 2015, respectively, which is based on an interest rate of 5.0%. This balance is payable every January and July through December 31, 2016 based on the number of meter connections above a threshold. The minimum amount due is $2,012,500. The final remaining balance on this loan was paid in full in January 2017. Accretion expense, included as a component of interest expense, totaled $54,000, $55,000 and $66,000 for the years ended December 31, 2016, 2015 and 2014, respectively. The fair value measure is based on significant inputs that are not observable in the market, which ASC 820 refers to as Level 3 inputs.
Non-Compete Notes Payable. As part of the acquisition of Heritage Propane Express, LLC (“HPX”) in June 2012, we acquired several promissory notes, which were issued prior to acquisition by HPX as consideration for several non-compete agreements unrelated to the acquisition transaction. Each of the agreements had a five year term and is non-interest bearing. The fair value of the agreements was $117,000 at December 31, 2015, which was based on an effective imputed interest rate of 3.5%. On September 19, 2016, we repaid the non-compete agreements in full.
F-27
Wells Fargo Credit Agreement. We had a $20,000,000 working capital revolving credit facility and a $180,000,000 acquisition revolving credit facility with Wells Fargo Bank, N.A. (the “WFB Credit Agreement”). Our outstanding borrowings under the WFB Credit Agreement were collateralized by substantially all of our assets.
On February 12, 2014, we entered into a credit agreement with Bank of America and used the borrowings under the Bank of America credit facility to repay all outstanding balances under the WFB Credit Agreement. As a result of the termination of the WFB Credit Agreement, we wrote off $1,634,000 of deferred financing costs during the year ended December 31, 2014.
F&M Bank & Trust Company Credit Agreement. On July 20, 2012, we entered into an amended and restated credit agreement with F&M Bank & Trust Company for the purchase of new, and the refinancing of existing, vehicles and equipment. The F&M Bank Credit Agreement consisted of several term loans (collectively, “F&M Loans”). Our obligations under the F&M Loans were collateralized by our vehicles and equipment financed by these loans.
On February 12, 2014, the outstanding balance on the F&M Loans of $4,135,000 was paid in full with the proceeds from the BOA Credit Agreement.
Reynolds Note Payable. We issued a $645,000 non-interest bearing promissory note as partial consideration for the acquisition of Reynolds Brother Propane on May 1, 2012. The note was payable in two installments of $295,000 and $350,000 at the first and second anniversary of the acquisition closing date (i.e. May 1, 2013 and May 1, 2014), respectively. On May 1, 2014, we repaid the promissory note in full.
Related Party Note Payable. On November 5, 2013, we issued a $1,000,000 promissory note to JP Development for working capital requirements. The note was to mature on November 5, 2016 and bore interest at 4.75%. On March 20, 2014, we repaid the promissory note in full.
As of December 31, 2016, our scheduled principal repayments of long-term debt for each of the next five years ending December 31 and thereafter are as follows (in thousands):
|
2017 |
|
$ |
950 |
|
|
2018 |
|
|
— |
|
|
2019 |
|
|
177,000 |
(1) |
|
2020 |
|
|
— |
|
|
2021 |
|
|
— |
|
|
Thereafter |
|
|
— |
|
|
Total |
|
$ |
177,950 |
|
|
(1) |
On March 8, 2017, in connection with the closing of the AMID Merger, the BOA Credit Agreement was paid off in full and the credit agreement was terminated. |
12. Derivative Instruments
We are exposed to certain market risks related to the volatility of commodity prices and changes in interest rates. To monitor and manage these market risks, we have established comprehensive risk management policies and procedures. We do not enter into derivative instruments for any purpose other than hedging commodity price risk and interest rate risk. That is, we do not speculate using derivative instruments.
Commodity Price Risk. Our normal business activities expose us to risks associated with changes in the market price of crude oil, propane and refined products, among other commodities. Management believes it is prudent to limit our exposure to these risks, which include our (i) propane purchases, (ii) pre-existing or anticipated physical crude oil and refined product sales and (iii) certain crude oil held in inventory. To meet this objective, we use a combination of fixed price swaps, basis swaps and forward contracts. At times, we may also terminate or unwind hedges or portions of hedges in order to meet cash flow objectives or when the expected future volumes do not support the level of hedges. Our forward contracts that qualify for the Normal Purchase Normal Sale (“NPNS”) exception under GAAP are
F-28
recognized when the underlying physical transaction is delivered. While these contracts are considered derivative financial instruments under ASC 815, they are not recorded at fair value, but on an accrual basis of accounting. If it is determined that a transaction designated as NPNS no longer meets the scope exception, the fair value of the related contract is recorded on the balance sheet and immediately recognized through earnings.
In the first quarter of 2015, we entered into several long-term fixed price forward sale contracts related to certain barrels of crude oil we had on hand as of December 31, 2014, effectively locking these barrels at higher future sales prices in future periods. These forward sale contracts were intended to mitigate the effect of the decline in crude oil prices, but did not qualify for NPNS accounting under GAAP, because of our normal business practice to buy and sell crude oil inventory either within the same month or in the following month. As a result, these longer than normal term forward sale contracts were given mark-to-market accounting treatment. As these forward sale contracts related to the marketing assets in our Mid-Continent Business (see Note 3), the fair values of the forward contracts have been classified as held for sale in the consolidated balance sheets as of December 31, 2015. As of December 31, 2015, the fair value of the Mid-Continent forward contracts was $630,000 and was included in current liabilities of discontinued operations held for sale in the consolidated balance sheets.
In August 2015, we paid approximately $8,745,000 to settle all of our then-outstanding propane financial swap contracts that were scheduled to mature at various dates through April 2017. We simultaneously executed new propane financial swap contracts at then current forward market prices for the purpose of economically hedging a substantial majority of our fixed price propane sales contracts through July 2017.
The following table summarizes the net notional volume buy (sell) of our outstanding commodity-related derivatives, excluding those derivatives that qualified for the NPNS exception as of December 31, 2016 and 2015, none of which were designated as hedges for accounting purposes.
|
|
|
December 31, 2016 |
|
December 31, 2015 |
|
||||
|
|
|
Notional Volume |
|
Maturity |
|
Notional Volume |
|
Maturity |
|
|
Commodity Swaps : |
|
|
|
|
|
|
|
|
|
|
Propane Fixed Price (Gallons) |
|
4,364,880 |
|
Jan 2017 - Nov 2018 |
|
8,614,631 |
|
Jan 2016 - July 2017 |
|
|
Crude Oil Fixed Price (Barrels) |
|
— |
|
— |
|
(93,000) |
|
Jan 2016 |
|
|
Crude Oil Basis (Barrels) |
|
180,000 |
|
Jan 2017 - Mar 2017 |
|
— |
|
— |
|
Interest Rate Risk. We are exposed to variable interest rate risk as a result of variable-rate borrowings under our revolving credit facilities. We entered into interest rate swap agreements to manage fluctuations in cash flows resulting from interest rate risk on a portion of our debt with a variable-rate component. These swaps changed the variable-rate cash flow exposure on the debt obligations to fixed cash flows. Under the terms of the interest rate swaps, we received variable interest rate payments and made fixed interest rate payments, thereby creating the equivalent of fixed-rate debt for the portion of the debt that was swapped. As of December 31, 2016, our outstanding interest rate swap contracts contained a notional amount of $100,000,000 with maturity dates ranging from January 2017 to January 2019. There were no outstanding interest rate swap agreements as of December 31, 2015.
Credit Risk. By using derivative instruments to economically hedge exposures to changes in commodity prices and interest rates, we are exposed to counterparty credit risk. Credit risk is the failure of the counterparty to perform under the terms of the derivative contract. When the fair value of a derivative contract is positive, the counterparty owes the Partnership, which creates credit risk for us. When the fair value of a derivative contract is negative, we owe the counterparty and, therefore, we do not possess credit risk. We minimize the credit risk in derivative instruments by entering into transactions with high- quality counterparties. We have entered into Master International Swap Dealers Association (“ISDA”) Agreements that allow for netting of swap contract receivables and payables in the event of default by either party.
F-29
Fair Value of Derivative Instruments. We measure derivative instruments at fair value using the income approach which discounts the future net cash settlements expected under the derivative contracts to a present value. These valuations utilize indirectly observable (“level 2”) inputs, including contractual terms, commodity prices, interest rates and yield curves observable at commonly quoted intervals. None of our derivative contracts are designated as hedging instruments. The following table summarizes the fair values of our derivative contracts included in the consolidated balance sheets as of December 31, 2016 and 2015.
|
|
|
|
|
Asset Derivatives |
|
Liability Derivatives |
|
||||||||
|
|
|
|
|
December 31, |
|
December 31, |
|
December 31, |
|
December 31, |
|
||||
|
|
|
Balance Sheet Location |
|
2016 |
|
2015 |
|
2016 |
|
2015 |
|
||||
|
|
|
|
|
|
|
|
|
|
|
|
|
|
|
|
|
|
|
|
|
|
(in thousands) |
|
||||||||||
|
Commodity swaps |
|
Prepaid expenses and other current assets |
|
$ |
607 |
|
$ |
92 |
|
$ |
— |
|
$ |
— |
|
|
Commodity swaps |
|
Accrued liabilities |
|
|
— |
|
|
— |
|
|
(1) |
|
|
(450) |
|
|
Commodity swaps |
|
Deferred financing costs and other assets, net |
|
|
37 |
|
|
— |
|
|
— |
|
|
— |
|
|
Commodity swaps |
|
Other long-term liabilities |
|
|
— |
|
|
— |
|
|
(1) |
|
|
(24) |
|
|
Interest rate swaps |
|
Accrued liabilities |
|
|
— |
|
|
— |
|
|
(71) |
|
|
— |
|
|
Interest rate swaps |
|
Deferred financing costs and other assets, net |
|
|
226 |
|
|
— |
|
|
— |
|
|
— |
|
The following table presents the fair value of our recognized derivative assets and liabilities on a gross basis and amounts offset in the consolidated balance sheets as of December 31, 2016 and 2015 that are subject to enforceable master netting arrangements.
|
|
|
As of December 31, 2016 |
|||||||||||||
|
|
|
Gross Amount Recognized |
|
Gross Amounts Offset |
|
Net Amounts Presented in the Balance Sheet |
|
Financial Collateral |
|
Net Amount |
|||||
|
|
|
(in thousands) |
|||||||||||||
|
Derivative Assets: |
|
|
|
|
|
|
|
|
|
|
|
|
|
|
|
|
Derivative contracts - current |
|
$ |
607 |
|
$ |
(72) |
|
$ |
535 |
|
$ |
— |
|
$ |
535 |
|
Derivative contracts - noncurrent |
|
|
263 |
|
|
(1) |
|
|
262 |
|
|
— |
|
|
262 |
|
Derivative Liabilities: |
|
|
|
|
|
|
|
|
|
|
|
|
|
|
|
|
Derivative contracts - current |
|
$ |
72 |
|
$ |
(72) |
|
$ |
— |
|
$ |
— |
|
$ |
— |
|
Derivative contracts - noncurrent |
|
|
1 |
|
|
(1) |
|
|
— |
|
|
— |
|
|
— |
|
|
|
As of December 31, 2015 |
|||||||||||||
|
|
|
Gross Amount Recognized |
|
Gross Amounts Offset |
|
Net Amounts Presented in the Balance Sheet |
|
Financial Collateral |
|
Net Amount |
|||||
|
|
|
(in thousands) |
|||||||||||||
|
Derivative Assets: |
|
|
|
|
|
|
|
|
|
|
|
|
|
|
|
|
Derivative contracts - current |
|
$ |
92 |
|
$ |
(92) |
|
$ |
— |
|
$ |
— |
|
$ |
— |
|
Derivative contracts - noncurrent |
|
|
— |
|
|
— |
|
|
— |
|
|
— |
|
|
— |
|
Derivative Liabilities: |
|
|
|
|
|
|
|
|
|
|
|
|
|
|
|
|
Derivative contracts - current |
|
$ |
450 |
|
$ |
(92) |
|
$ |
358 |
|
$ |
— |
|
$ |
358 |
|
Derivative contracts - noncurrent |
|
|
24 |
|
|
— |
|
|
24 |
|
|
— |
|
|
24 |
The following tables summarize the amounts recognized with respect to our derivative instruments within the consolidated statements of operations.
|
|
|
|
|
|
|
|
|
|
|
|
|
|
|
|
|
Location of Gain (Loss) Recognized in |
|
Amount of Gain/(Loss) Recognized in Income on Derivatives |
|
|||||||
|
|
|
Income on Derivatives |
|
December 31, 2016 |
|
December 31, 2015 |
|
December 31, 2014 |
|
|||
|
|
|
|
|
(in thousands) |
|
|||||||
|
Commodity derivatives (swaps) |
|
Cost of sales |
|
$ |
385 |
|
$ |
(3,056) |
|
$ |
(13,762) |
|
|
Interest rate swaps |
|
Interest expense |
|
|
10 |
|
|
(27) |
|
|
(227) |
|
F-30
We recognized total gains of $361,000 and losses of $1,962,000 for the years ended December 31, 2016 and 2015, respectively, with respect to derivative instruments related to the Mid-Continent business which was included in discontinued operations in the consolidated statements of operations.
In the consolidated statements of cash flows, the effects of settlements of derivative instruments are classified as operating activities, consistent with the related transactions.
13. Partners’ Capital
Initial Public Offering. On October 7, 2014, we closed on our IPO of 13,750,000 common units, representing a 37.7% interest in us. Total proceeds from the sale of the units were $257.1 million, net of underwriting discounts and structuring fees. See Note 1 for details of the IPO and recapitalization transactions.
Preferred Units. On March 28, 2014, we authorized and issued to Lonestar 1,818,182 Series D Convertible Redeemable Preferred Units (the “Series D Preferred Units”) for a cash purchase price of $22.00 per unit pursuant to the terms of a Series D Subscription Agreement (the “Subscription Agreement”) by and among us, JP Energy GP II LLC, a Delaware limited liability company and general partner to the Partnership (the “General Partner”) and Lonestar. This transaction resulted in proceeds to us of $40,000,000. During the year ended December 31, 2014, we issued to Lonestar 110,727 Series D PIK Units related to the distributions earned for the three months ended June 30, 2014 and the three months ended September 30, 2014. On October 7, 2014, we paid $42,436,000 from proceeds related to the IPO to redeem all then outstanding Series D Preferred Units.
Common Units. On February 12, 2014, we issued 363,636 Class A Common Units to Lonestar for total net proceeds of $8,000,000.
With the exception of the distribution of proceeds upon a “Change of Control Event” as described in the Partnership Agreement, all Class A Common Units, Class B Common Units, and Class C Common Units (collectively, the “Existing Common Units”) had the same terms and conditions.
Prior to the closing of the IPO, the Existing Common Units were split into approximately 0.89 common units, resulting in an aggregate of 22,677,004 outstanding Existing Common Units. An aggregate of 18,213,502 of the Existing Common Units held by existing partners were automatically converted into 18,213,502 subordinated units. Subsequent to the closing of our IPO, the remaining 4,463,502 Existing Common Units were automatically converted into common units on a one-to-one basis and we issued 13,750,000 common units to the public.
On May 8, 2015, in connection with the Southern acquisition, we issued 266,951 common units valued at $3,442,000.
On March 8, 2017, we were merged with and into Merger Sub and each of our common units issued and outstanding were converted into AMID Common Units. See Note 1 for details of the AMID Merger.
Subordinated Units. In connection with the IPO, we executed the Third Amended and Restated Agreement
of Limited Partnership (“Amended Partnership Agreement”) on October 7, 2014. Our Amended Partnership Agreement provides that, during the subordination period, the common units will have the right to receive distributions each quarter in an amount equal to $0.3250 per common unit, which amount is defined in our Amended Partnership Agreement as the minimum quarterly distribution (“MQD”), plus any arrearages in the payment of the MQD on the common units from prior quarters, before any distributions of available cash may be made on the subordinated units. These units are deemed "subordinated" because for a period of time, referred to as the subordination period, the subordinated units will not be entitled to receive any distributions until the common units have received the MQD plus any arrearages from prior quarters. Furthermore, no arrearages will be paid on the subordinated units. The practical effect of the subordinated units is to increase the likelihood that, during the subordination period, there will be available cash to be distributed on the common units. The subordination period will end, and the subordinated units will convert to common units, on a one-for-one basis, when certain distribution milestones described in the Amended Partnership Agreement have been met.
F-31
On March 8, 2017, we were merged with and into Merger Sub and each of our subordinated units issued and outstanding were converted into AMID Common Units. See Note 1 for details of the AMID Merger.
General Partner Interest. As of December 31, 2014, the General Partner had 45 general partner units. On October 7, 2014, subsequent to the closing of the IPO, the 45 general partner units were recharacterized as a non-economic general partners interest in us.
The non-economic general partner interest in us does not entitle it to receive cash distributions.
Distributions. Prior to our IPO, our Partnership Agreement required that, within 60 days after the end of each quarter, we distribute all of our available cash to unitholders of record on the applicable record date, as determined by the General Partner. In connection with the IPO, we entered into the Amended Partnership Agreement, which requires that, within 45 days after the end of each quarter, beginning with the quarter ending December 31, 2014, we distribute all of our available cash to unitholders of record on the applicable record date, subject to certain terms and conditions. During the year ended December 31, 2014, we did not make any cash distributions. During the years ended December 31, 2016 and 2015, we made the following cash distributions per unit:
|
Quarter Ended |
|
Record Date |
|
Payment Date |
|
Cash Distributions (per unit) |
|
|
|
December 31, 2014 |
|
February 6, 2015 |
|
February 13, 2015 |
|
$ |
0.3038 |
(1) |
|
March 31, 2015 |
|
May 7, 2015 |
|
May 14, 2015 |
|
$ |
0.3250 |
|
|
June 30, 2015 |
|
August 7, 2015 |
|
August 14, 2015 |
|
$ |
0.3250 |
|
|
September 30, 2015 |
|
November 6, 2015 |
|
November 13, 2015 |
|
$ |
0.3250 |
|
|
December 31, 2015 |
|
February 5, 2016 |
|
February 12, 2016 |
|
$ |
0.3250 |
|
|
March 31, 2016 |
|
May 6, 2016 |
|
May 13, 2016 |
|
$ |
0.3250 |
|
|
June 30, 2016 |
|
August 5, 2016 |
|
August 12, 2016 |
|
$ |
0.3250 |
|
|
September 30, 2016 |
|
November 4, 2016 |
|
November 11, 2016 |
|
$ |
0.3250 |
|
|
(1) |
Represents a prorated amount of our minimum quarterly distribution of $0.325 per common unit, based on the number of days between the closing of the IPO on October 7, 2014 and December 31, 2014. |
We paid a cash distribution of $0.325 per common unit and subordinated unit on February 14, 2017.
The Fourth Amended and Restated Agreement of Limited Partnership provides that the General Partner may, in its sole discretion, make cash distributions, but there is no requirement that we make any cash distributions.
14. Unit-Based Compensation
Long-Term Incentive Plan and Phantom Units. The 2014 Long-Term Incentive Plan (“LTIP”) for our employees, directors and consultants authorizes grants of up to 3,642,700 common units in the aggregate. Our phantom units issued under our LTIP are primarily composed of two types of grants: (1) service condition grants with vesting over three years in equal annual installments; and (2) service condition grants with cliff vesting on April 1, 2018. Distributions related to these unvested phantom units are paid concurrent with our distribution for common units. The fair value of our phantom units issued under our LTIP is determined by utilizing the market value of our common units on the respective grant date.
F-32
The following table presents phantom units activity for the years ended December 31, 2016 and 2015:
|
2016 |
|||||
|
Phantom Units |
|
Units |
|
Weighted Average Grant Date Fair Value |
|
|
|
|
|
|
|
|
|
Outstanding at the beginning of the period |
|
392,420 |
|
$ |
12.99 |
|
Service condition grants |
|
362,743 |
|
|
5.33 |
|
Vested service condition |
|
(96,513) |
|
|
11.27 |
|
Forfeited service condition |
|
(117,116) |
|
|
10.81 |
|
Outstanding at the end of period |
|
541,534 |
|
|
8.64 |
|
2015 |
|||||
|
Phantom Units |
|
Units |
|
Weighted Average Grant Date Fair Value |
|
|
|
|
|
|
|
|
|
Outstanding at the beginning of the period |
|
— |
|
$ |
— |
|
Service condition grants |
|
497,479 |
|
|
12.84 |
|
Vested service condition |
|
(8,250) |
|
|
12.90 |
|
Forfeited service condition |
|
(96,809) |
|
|
12.26 |
|
Outstanding at the end of period |
|
392,420 |
|
|
12.99 |
Total unit-based compensation expense related to our phantom units was $1,691,000 and $849,000 for the years ended December 31, 2016 and 2015, respectively, which was recorded in general and administrative expense in the consolidated statements of operations.
We expect to recognize $2.6 million of compensation expense related to non-vested phantom units over a weighted average period of 1.4 years. We have estimated a weighted average forfeiture rate of 32% in calculating the unit-based compensation expense.
Restricted (Non-Vested) Common and Subordinated Units. Prior to the completion of our IPO on October 7, 2014, from time to time, we granted service condition restricted class B common units to certain key employees. Such service condition restricted common units require the recipients’ continuous employment with us and vest, according to the vesting schedule in each respective grant agreement, over certain periods, typically three to five years.
Pursuant to certain employment agreements, as amended, between us and certain employees, we were obligated to grant restricted Class B common units to those employees upon their achievement of certain agreed-upon performance goals that were measured by different milestones. Different milestone achievements caused different amounts of restricted Class B common units to be awarded. The maximum amount of the restricted Class B common units that could have been issued pursuant to these employment agreements, as amended, was 100,000 units. Prior to year ended December 31, 2014, 75,000 restricted Class B common units were issued as a result of the employees’ achievement of certain milestones and the unit-based compensation expense related to these units have been fully recorded as general and administrative expenses in respective historical periods. With respect to the remaining 25,000 restricted Class B common units to be issued, we estimated the probable number of years for the performance goals to be achieved and have recognized the related unit-based compensation expense over the estimated number of years. During the second quarter of 2015, each employee terminated their employment with us prior to one employee achieving their performance goal related to the remaining 25,000 restricted Class B common units. As a result, we reversed previously recognized unit-based compensation expense of $297,000 in the year ended December 31, 2015.
Fair value of the restricted class B common units equaled the fair value of our common unit at the respective grant dates. We estimate the fair value of our common unit by dividing the estimated total equity value by the number of outstanding units. Estimated total equity value was determined using the income approach of discounting the estimated future cash flow to its present value.
F-33
Immediately prior to the IPO, each of our Class B common unit was split into approximately 0.89 common unit, then approximately 80.3% of the common unit was converted into subordinated unit and the remaining 19.7% was converted into common unit.
During the years ended December 31, 2016, 2015 and 2014, unit-based compensation expense of $333,000, $460,000 and $1,789,000, respectively, was recorded in general and administrative expense in the consolidated statements of operations related to these restricted units.
The following table presents restricted (non-vested) common, subordinated and class B common units during the years ended December 31, 2016, 2015 and 2014:
|
2016 |
||||||||||
|
|
|
Common Units |
|
Subordinated Units |
||||||
|
Restricted (Non‑Vested) Units |
|
Units |
|
Weighted Average Grant Date Fair Value |
|
Units |
|
Weighted Average Grant Date Fair Value |
||
|
|
|
|
|
|
|
|
|
|
|
|
|
Outstanding at the beginning of the period |
|
6,424 |
|
$ |
25.91 |
|
26,216 |
|
$ |
25.91 |
|
Vested - service condition |
|
(2,920) |
|
|
29.46 |
|
(11,916) |
|
|
29.46 |
|
Outstanding at the end of period |
|
3,504 |
|
|
22.95 |
|
14,300 |
|
|
22.95 |
|
2015 |
||||||||||
|
|
|
Common Units |
|
Subordinated Units |
||||||
|
Restricted (Non‑Vested) Units |
|
Units |
|
Weighted Average Grant Date Fair Value |
|
Units |
|
Weighted Average Grant Date Fair Value |
||
|
|
|
|
|
|
|
|
|
|
|
|
|
Outstanding at the beginning of the period |
|
31,012 |
|
$ |
24.36 |
|
126,553 |
|
$ |
24.36 |
|
Vested - service condition |
|
(10,512) |
|
|
25.37 |
|
(42,898) |
|
|
25.37 |
|
Forfeited - service condition |
|
(14,076) |
|
|
22.89 |
|
(57,439) |
|
|
22.89 |
|
Outstanding at the end of period |
|
6,424 |
|
|
25.91 |
|
26,216 |
|
|
25.91 |
|
2014 |
|||||||||||||||
|
|
|
Class B Common Units |
|
Common Units |
|
Subordinated Units |
|||||||||
|
Restricted (Non‑Vested) Units |
|
Units |
|
Weighted Average Grant Date Fair Value |
|
Units |
|
Weighted Average Grant Date Fair Value |
|
Units |
|
Weighted Average Grant Date Fair Value |
|||
|
|
|
|
|
|
|
|
|
|
|
|
|
|
|
|
|
|
Outstanding at the beginning of the period |
|
177,867 |
|
$ |
25.58 |
|
— |
|
$ |
— |
|
— |
|
$ |
— |
|
Granted - service condition |
|
90,000 |
|
|
19.64 |
|
— |
|
|
— |
|
— |
|
|
— |
|
Vested - service condition |
|
(63,698) |
|
|
24.21 |
|
— |
|
|
— |
|
— |
|
|
— |
|
Forfeited - service condition |
|
(6,667) |
|
|
34.91 |
|
— |
|
|
— |
|
— |
|
|
— |
|
Conversion upon IPO |
|
(197,502) |
|
|
23.00 |
|
34,603 |
|
|
25.84 |
|
141,211 |
|
|
25.84 |
|
Vested - service condition |
|
— |
|
|
— |
|
(876) |
|
|
36.75 |
|
(3,576) |
|
|
36.75 |
|
Forfeited - service condition |
|
— |
|
|
— |
|
(2,715) |
|
|
39.22 |
|
(11,082) |
|
|
39.22 |
|
Outstanding at the end of period |
|
— |
|
|
— |
|
31,012 |
|
|
24.36 |
|
126,553 |
|
|
24.36 |
F-34
We make distributions to non-vested restricted units on a 1:1 ratio with the per unit distributions paid to common units. Upon the vesting of the restricted units, we intend to settle these obligations with common units. Accordingly, we expect to recognize an aggregate of $228,000 of compensation expense related to non-vested restricted units over a weighted average period of 1.03 years.
15. Commitments and Contingencies
Legal Matters. We are involved in legal proceedings and litigation in the ordinary course of business. In the opinion of management, the outcome of such matters will not have a material adverse effect on our consolidated financial statements.
Environmental Matters. We are subject to various federal, state and local laws and regulations relating to the protection of the environment. Such environmental laws and regulations impose numerous obligations, including the acquisition of permits to conduct regulated activities, the incurrence of capital expenditures to comply with applicable laws and restrictions on the generation, handling, treatment, storage, disposal and transportation of certain materials and wastes.
Failure to comply with such environmental laws and regulations can result in the assessment of substantial administrative, civil and criminal penalties, the imposition of remedial liabilities and even the issuance of injunctions restricting or prohibiting our activities. We have established procedures for the ongoing evaluation of our operations, to identify potential environmental exposures and to comply with regulatory policies and procedures.
We account for environmental contingencies in accordance with the ASC 410 related to accounting for contingencies. Environmental expenditures that relate to current operations are expensed or capitalized as appropriate. Expenditures that relate to an existing condition caused by past operations, and do not contribute to current or future revenue generation, are expensed.
Liabilities are recorded when environmental assessments and/or clean- ups are probable, and the costs can be reasonably estimated. As of December 31, 2016 and 2015, we had no significant environmental matters.
Refined Products Terminals. In the third quarter of 2014, we discovered that certain elements of the product measurement and quality control at our refined products terminal in North Little Rock, Arkansas were not in compliance with industry standards and certain regulations. As a result, the terminal could under-deliver refined products to our customers and, consequently, recognize excess gains on refined products generated through the terminal’s normal terminal and storage process. We recognize revenues for refined product gains as the products are sold at the terminal based on current market prices. We have undertaken procedures to improve and remediate our measurement and quality control processes to be in compliance with industry standards and regulations, and have discussed this matter with our customers and have returned a certain amount of refined products to the majority of our customers. Because there are numerous elements inherent in the product measurement process that could affect the amount of refined product gains generated at the terminal, it is not practicable for us to accurately quantify this amount or the discrete period of refined product gains previously recognized that were caused by these specific issues. However, using available operational data and certain management assumptions, we have reasonably estimated the volume of refined products to be returned to our customers of approximately 24,000 barrels. During 2014, we returned approximately 20,900 barrels to our customers, which amounts to a value of $2,092,000. As of December 31, 2014, we had approximately 3,100 barrels remaining that were due to our customers, at an estimated value of $167,000. Accordingly, we recorded a $2,259,000 charge to operating expense in the consolidated statement of operations for the year ended December 31, 2014. We completed the final settlement of the under-delivered product volumes in the third quarter of 2015, which resulted in a charge to operating expenses of $172,000 in the year ended December 31, 2015.
Asset retirement obligations (ARO). We have contractual obligations to perform dismantlement and removal activities in the event that some assets, such as storage tanks, are abandoned. These obligations include varying levels of activity including completely removing the assets and returning the land to its original state. We have determined that the settlement dates related to the retirement obligations are indeterminate. The assets with indeterminate settlement dates
F-35
have either been in existence for many years or are relatively new assets and with regular maintenance will continue to be in service for many years to come. In addition, it is not possible to predict when demand for the service will cease, and we do not believe that such demand will cease for the foreseeable future. Accordingly, the date when these assets will be abandoned is indeterminate. With no reasonably determinable abandonment date, we cannot reasonably estimate the fair value of the associated ARO’s and therefore, no ARO liability is recorded as of December 31, 2016 and 2015. Additionally, many of these assets could be re-deployed for a similar use. We will continue to monitor these assets and if sufficient information becomes available for us to reasonably determine the settlement dates, an ARO will be recorded for these assets in the relevant periods.
Operating Leases. We lease various buildings, land, storage facilities, transportation vehicles and office equipment under operating leases. Certain of the leases contain renewal and purchase options. Our aggregate rental expense for such leases was $6,070,785, $5,741,000 and $4,806,000 for the years ended December 31, 2016, 2015 and 2014, respectively. Additionally, we assumed a land lease in the acquisition of Parnon Storage, LLC on August 3, 2012. Equal payments of $10,000 are due each month over the remaining 41 year lease period with no implied interest rate noted in the lease agreement.
Minimum future payments under non-cancelable operating leases as of December 31, 2016 and thereafter are as follows (in thousands):
|
2017 |
|
$ |
4,670 |
|
|
2018 |
|
|
3,850 |
|
|
2019 |
|
|
2,471 |
|
|
2020 |
|
|
772 |
|
|
2021 |
|
|
328 |
|
|
Thereafter |
|
|
4,556 |
|
|
|
|
$ |
16,647 |
|
16. Reportable Segments
Our operations are located in the United States and are organized into three reportable segments: crude oil pipelines and storage; refined products terminals and storage; and NGL distribution and sales.
Crude oil pipelines and storage. The crude oil pipelines and storage segment consists of a crude oil pipeline operation and a crude oil storage facility. The crude oil pipeline operates in the Permian Basin and consists of approximately 161 miles of high-pressure steel pipeline with throughput capacity of approximately 130,000 barrels per day and a related system of truck terminals, LACT bay facilities, crude oil receipt points and crude oil storage facilities with an aggregate of 140,000 barrels of storage capacity. We also operate a crude oil storage facility that has an aggregate storage capacity of approximately 3,000,000 barrels in Cushing, Oklahoma.
The crude oil pipelines and storage segment also consists of crude oil supply activities and a fleet of crude oil gathering and transportation trucks. We conduct crude oil supply activities by purchasing crude oil for our own account from producers, aggregators and traders and selling crude oil to traders and refiners. We also own a fleet of crude oil gathering and transportation trucks operating in and around highly prolific drilling areas such as the Eagle Ford shale and the Permian Basin.
Refined products terminals and storage. The refined products terminals and storage segment has aggregate storage capacity of 1.3 million barrels from two refined products terminals located in North Little Rock, Arkansas and Caddo Mills, Texas. The North Little Rock terminal has storage capacity of 550,000 barrels from 11 tanks and has eight loading lanes with automated truck loading equipment. The Caddo Mills terminal consists of 10 storage tanks with an aggregate capacity of approximately 770,000 barrels and has five loading lanes with automated truck loading equipment. In the second quarter of 2016, we completed the connection of the North Little Rock terminal to Magellan’s Little Rock
F-36
Pipeline. Following the connection, the North Little Rock terminal allows delivery from Enterprise TE Products Pipeline Company LLC and Magellan’s Little Rock Pipeline. The Caddo Mills terminal is primarily served by the Explorer Pipeline. In the fourth quarter of 2016, we also completed our ethanol unit train expansion project at our North Little Rock terminal which significantly improved the terminal’s ethanol offloading efficiency and capacity, allowing for offloading of up to 108 car unit trains.
NGL distribution and sales. The NGL distribution and sales segment consists of three businesses: (i) portable cylinder tank exchange (ii) NGL sales through our retail, commercial and wholesale distribution business and (iii) NGL gathering and transportation business. Currently, the cylinder exchange network covers 46 states through a network of approximately 20,000 locations, which includes grocery chains, pharmacies, convenience stores and hardware stores. Additionally, in seven states in the southwest region of the U.S., we sell NGLs to retailers, wholesalers, industrial end-users and commercial and residential customers. We also own a fleet of NGL gathering and transportation operations trucks operating in the Eagle Ford shale and the Permian Basin.
Corporate and other. Corporate and other includes general partnership expenses associated with managing all of our reportable segments.
Our chief operating decision maker (“CODM”) evaluates the segments’ operating performance based on Adjusted EBITDA. We define Adjusted EBITDA as net income (loss) plus (minus) interest expense (income), income tax expense (benefit), depreciation and amortization expense, asset impairments, (gains) losses on asset sales, certain non-cash charges such as non-cash equity compensation, non-cash vacation expense, non-cash (gains) losses on commodity derivative contracts (total (gain) loss on commodity derivatives less net cash flow associated with commodity derivatives settled during the period), corporate overhead support from our general partner (expenses incurred by us but absorbed by our general partner and not passed through to us) and selected (gains) charges and transaction costs that are unusual or non-recurring.
F-37
The following tables reflect certain financial data for each reportable segment for the years ended December 31, 2016, 2015 and 2014.
|
|
|
Year ended December 31, |
|
|||||||
|
|
|
2016 |
|
2015 |
|
2014 |
|
|||
|
|
|
(in thousands) |
|
|||||||
|
External Revenues: |
|
|
|
|
|
|
|
|
|
|
|
Crude oil pipelines and storage |
|
$ |
322,140 |
|
$ |
480,527 |
|
$ |
495,971 |
|
|
Refined products terminals and storage |
|
|
28,168 |
|
|
23,227 |
|
|
23,287 |
|
|
NGL distribution and sales |
|
|
143,652 |
|
|
176,831 |
|
|
206,896 |
|
|
Total revenues |
|
$ |
493,960 |
|
$ |
680,585 |
|
$ |
726,154 |
|
|
|
|
|
|
|
|
|
|
|
|
|
|
Cost of Sales, excluding depreciation and amortization: |
|
|
|
|
|
|
|
|
|
|
|
Crude oil pipelines and storage |
|
$ |
284,747 |
|
$ |
445,027 |
|
$ |
459,183 |
|
|
Refined products terminals and storage |
|
|
11,760 |
|
|
8,649 |
|
|
6,453 |
|
|
NGL distribution and sales |
|
|
54,704 |
|
|
76,618 |
|
|
126,686 |
|
|
Amounts not included in segment Adjusted EBITDA |
|
|
(1,024) |
|
|
(2,818) |
|
|
13,360 |
|
|
Total cost of sales, excluding depreciation and amortization |
|
$ |
350,187 |
|
$ |
527,476 |
|
$ |
605,682 |
|
|
|
|
|
|
|
|
|
|
|
|
|
|
Operating Expenses: |
|
|
|
|
|
|
|
|
|
|
|
Crude oil pipelines and storage |
|
$ |
8,195 |
|
$ |
9,238 |
|
$ |
7,928 |
|
|
Refined products terminals and storage |
|
|
2,428 |
|
|
2,980 |
|
|
4,602 |
|
|
NGL distribution and sales |
|
|
53,278 |
|
|
57,200 |
|
|
52,109 |
|
|
Amounts not included in segment Adjusted EBITDA |
|
|
236 |
|
|
(41) |
|
|
945 |
|
|
Total operating expenses |
|
$ |
64,137 |
|
$ |
69,377 |
|
$ |
65,584 |
|
|
|
|
|
|
|
|
|
|
|
|
|
|
Depreciation and Amortization: |
|
|
|
|
|
|
|
|
|
|
|
Crude oil pipelines and storage |
|
$ |
20,799 |
|
$ |
20,356 |
|
$ |
17,240 |
|
|
Refined products terminals and storage |
|
|
6,664 |
|
|
6,830 |
|
|
5,911 |
|
|
NGLs distribution and sales |
|
|
17,986 |
|
|
18,628 |
|
|
16,163 |
|
|
Corporate and other |
|
|
1,702 |
|
|
1,038 |
|
|
916 |
|
|
Total depreciation and amortization |
|
$ |
47,151 |
|
$ |
46,852 |
|
$ |
40,230 |
|
|
|
|
|
|
|
|
|
|
|
|
|
|
Adjusted EBITDA: |
|
|
|
|
|
|
|
|
|
|
|
Crude oil pipelines and storage |
|
$ |
26,405 |
|
$ |
23,119 |
|
$ |
25,339 |
|
|
Refined products terminals and storage |
|
|
13,317 |
|
|
10,867 |
|
|
10,723 |
|
|
NGL distribution and sales |
|
|
25,736 |
|
|
30,896 |
|
|
15,511 |
|
|
Total Adjusted EBITDA from reportable segments |
|
$ |
65,458 |
|
$ |
64,882 |
|
$ |
51,573 |
|
|
|
|
|
|
|
|
|
|
|
|
|
|
Capital Expenditures: |
|
|
|
|
|
|
|
|
|
|
|
Crude oil pipelines and storage |
|
$ |
8,192 |
|
$ |
42,919 |
|
$ |
36,691 |
|
|
Refined products terminals and storage |
|
|
6,028 |
|
|
8,002 |
|
|
2,489 |
|
|
NGLs distribution and sales |
|
|
6,553 |
|
|
18,587 |
|
|
16,557 |
|
|
Corporate and other |
|
|
3,945 |
|
|
1,503 |
|
|
1,141 |
|
|
Total capital expenditures |
|
$ |
24,718 |
|
$ |
71,011 |
|
$ |
56,878 |
|
F-38
A reconciliation of Adjusted EBITDA to net loss from continuing operations is included in the table below.
|
|
|
Year ended December 31, |
|
|||||||
|
|
|
2016 |
|
2015 |
|
2014 |
|
|||
|
|
|
(in thousands) |
|
|||||||
|
Total Adjusted EBITDA from reportable segments |
|
$ |
65,458 |
|
$ |
64,882 |
|
$ |
51,573 |
|
|
Other expenses not allocated to reportable segments |
|
|
(12,762) |
|
|
(19,226) |
|
|
(24,924) |
|
|
Depreciation and amortization |
|
|
(47,151) |
|
|
(46,852) |
|
|
(40,230) |
|
|
Goodwill impairment |
|
|
(15,456) |
|
|
(29,896) |
|
|
— |
|
|
Interest expense |
|
|
(5,970) |
|
|
(5,375) |
|
|
(8,981) |
|
|
Loss on extinguishment of debt |
|
|
— |
|
|
— |
|
|
(1,634) |
|
|
Loss on disposal of assets, net |
|
|
(2,569) |
|
|
(909) |
|
|
(1,137) |
|
|
Unit-based compensation |
|
|
(2,024) |
|
|
(1,217) |
|
|
(1,658) |
|
|
Total gain (loss) on commodity derivatives |
|
|
385 |
|
|
(3,057) |
|
|
(13,762) |
|
|
Net cash payments for commodity derivatives settled during the period |
|
|
639 |
|
|
14,821 |
|
|
1,071 |
|
|
Early settlement of commodity derivatives (1) |
|
|
— |
|
|
(8,745) |
|
|
— |
|
|
Corporate overhead support from general partner (2) |
|
|
(9,000) |
|
|
(5,500) |
|
|
— |
|
|
Transaction costs and other |
|
|
(5,013) |
|
|
(1,877) |
|
|
(3,766) |
|
|
Loss from continuing operations before income taxes |
|
$ |
(33,463) |
|
$ |
(42,951) |
|
$ |
(43,448) |
|
|
(1) |
Due to its non-recurring nature, we excluded this transaction in calculating Adjusted EBITDA. |
|
(2) |
Represents expenses incurred by us that were absorbed by our general partner and not passed through to us. |
Total assets from our reportable segments as of December 31 were as follows:
|
|
|
December 31, |
|
December 31, |
|
||
|
|
|
2016 |
|
2015 |
|
||
|
|
|
(in thousands) |
|
||||
|
Crude oil pipelines and storage |
|
$ |
383,056 |
|
$ |
408,304 |
|
|
Refined products terminals and storage |
|
|
131,644 |
|
|
131,931 |
|
|
NGL distribution and sales |
|
|
140,864 |
|
|
173,558 |
|
|
Corporate and other |
|
|
18,866 |
|
|
12,092 |
|
|
Discontinued operations held for sale |
|
|
— |
|
|
9,374 |
|
|
Total assets |
|
$ |
674,430 |
|
$ |
735,259 |
|
17. Related Parties
We performed certain management services for JP Development. We received a monthly fee of $50,000 for these services through January 2016. The monthly fee reduced general and administrative expenses in the consolidated statements of operations by $50,000, $600,000 and $600,000 for the years ended December 31, 2016, 2015 and 2014, respectively. In the year ended December 31, 2015, we also performed certain additional services for which we received $228,000.
JP Development had a pipeline transportation business that provided crude oil pipeline transportation services to our discontinued Mid-Continent Business. As a result of utilizing JP Development’s pipeline transportation services during the years ended December 31, 2016, 2015 and 2014, we incurred pipeline tariff fees of $372,000, $6,023,000 and $8,875,000, respectively, which have been included in net loss from discontinued operations in the consolidated statements of operations. As of December 31, 2015, we had a net receivable from JP Development of $7,933,000, primarily as the result of the prepayments made in 2014 for the crude oil pipeline transportation services to be provided by JP Development. We recovered these amounts in full in the first quarter of 2016.
F-39
As discussed in Note 11, on November 5, 2013, we issued a $1,000,000 promissory note to JP Development for working capital requirements. The note was to mature on November 5, 2016 and bore interest at 4.75%. The interest rate was subject to an adjustment each quarter equal to the weighted average rate of JP Development’s outstanding indebtedness during the most recently ended fiscal quarter. Accrued interest on the note was payable quarterly in arrears. On March 20, 2014, we repaid this promissory note in full.
As discussed in Note 3, on February 1, 2016, we sold certain trucking and marketing assets in the Mid-Continent area to JP Development in connection with JP Development’s sale of its GSPP pipeline assets to a third party.
As discussed in Note 13, on February 12, 2014, we issued 363,636 Class A Common Units to Lonestar for total net proceeds of $8,000,000 and on March 28, 2014, we issued 1,818,182 Series D Preferred Units to Lonestar for proceeds of $40,000,000. On October 7, 2014, we paid $42,436,000 from proceeds related to our IPO to redeem all then outstanding Series D Preferred Units.
As a result of the acquisition of our North Little Rock, Arkansas refined product terminal in November 2012, Truman Arnold Companies (‘TAC”) owns common and subordinated units in us. In addition, Mr. Greg Arnold, President and CEO of TAC, was also one of our directors and owned a 5% equity interest in our general partner through October 2016. Our refined products terminals and storage segment sold refined products to TAC during 2016 and 2014. For the years ended December 31, 2016 and 2014, our revenue from TAC was $244,000 and $8,952,000, which is included in NGL and refined product sales - related parties in the consolidated statements of operations.
Our NGL distribution and sales segment also purchases refined products from TAC. For the years ended December 31, 2016, 2015 and 2014, we paid $986,000, $1,124,000 and $1,964,000, respectively, for refined product purchases from TAC, which is included in cost of sales in the consolidated statements of operations.
Through April of 2015 and during all of 2014, we entered into transactions with CAMS Bluewire, an entity in which Arclight holds a non-controlling interest. CAMS Bluewire provides IT support for us. For the years ended December 31, 2015 and 2014, we paid $132,000 and $422,000, respectively, for IT support and consulting services, and for purchases of IT equipment, which are included in operating expenses, general and administrative expenses and property plant and equipment in the consolidated statements of operations and the consolidated balance sheets.
During the third quarter of 2014, we began performing certain management services for Republic Midstream, LLC (“Republic”), an entity owned by ArcLight. We charged a monthly fee of approximately $75,000 for these services. In September 2016, this monthly fee decreased to approximately $40,000 before ceasing in November 2016. The monthly fee reduced general and administrative expenses in the consolidated statements of operations by $665,000, $712,000 and $297,000 for the years ended December 31, 2016, 2015 and 2014, respectively. During the second quarter of 2015, we began performing crude transportation and marketing services for Republic. We charged $3,214,000 and $3,049,000 for the years ended December 31, 2016 and 2015, respectively, for these services which is included in gathering, transportation and storage fees – related parties and crude oil sales – related parties on the consolidated statements of operations. As of December 31, 2016 and 2015, we had a receivable balance due from Republic of $436,000 and $646,000, respectively, which is included in receivables from related parties in the consolidated balance sheets.
During the years ended December 31, 2016 and 2015, our general partner agreed to absorb $9,000,000 and $5,500,000 of corporate overhead expenses incurred by us and not pass such expense through to us. We receive reimbursements for these expenses from our general partner in the quarters subsequent to when they were incurred, which was $7,500,000 and $3,000,000 for the years ended December 31, 2016 and 2015, respectively. In the first quarter of 2015, certain executive bonuses related to the year ended December 31, 2014 were paid on our behalf by ArcLight. In addition, ArcLight reimbursed us for expenses we incurred for the years ended December 31, 2016 and 2015. The total amounts paid on our behalf or reimbursed to us were $2,400,000 and $2,568,000 for the years ended December 31, 2016 and 2015, respectively, and were treated as deemed contributions from ArcLight.
Beginning July 2013, we have no employees. The employees supporting our operations are employees of GP II, and as such, we fund GP II for payroll and other payroll-related expenses we incur. As of December 31, 2016, we had a
F-40
payable balance due to GP II $134,000, which is included in payables to related parties in the consolidated balance sheets.
As discussed in Note 1, on March 8, 2017, in connection with the closing of the AMID Merger, we were merged with and into Merger Sub, a wholly owned subsidiary of AMID, with us surviving the merger as a wholly owned subsidiary of AMID.
18. Selected Quarterly Financial Data (unaudited)
Selected financial data by quarter is set forth in the table below:
|
|
|
Quarter Ended |
|
||||||||||
|
|
|
March 31, |
|
June 30, |
|
September 30, |
|
December 31, |
|
||||
|
|
|
|
(in thousands, except per unit data) |
|
|||||||||
|
2016 |
|
|
|
|
|
|
|
|
|
|
|
|
|
|
Total revenue |
|
$ |
97,491 |
|
$ |
130,769 |
|
$ |
122,805 |
|
$ |
142,895 |
|
|
Operating income (loss) |
|
|
126 |
|
|
(598) |
|
|
(6,348) |
|
|
(21,301) |
|
|
Income (loss) from continuing operations |
|
|
(2,689) |
|
|
(2,365) |
|
|
(6,891) |
|
|
(22,039) |
|
|
Income (loss) from discontinued operations |
|
|
(539) |
|
|
— |
|
|
— |
|
|
— |
|
|
Net income (loss) |
|
|
(3,228) |
|
|
(2,365) |
|
|
(6,891) |
|
|
(22,039) |
|
|
Basic and diluted income (loss) from continuing operations per common unit |
|
|
(0.07) |
|
|
(0.06) |
|
|
(0.18) |
|
|
(0.60) |
|
|
Basic and diluted income (loss) from continuing operations per subordinated unit |
|
|
(0.08) |
|
|
(0.07) |
|
|
(0.19) |
|
|
(0.60) |
|
|
Basic and diluted income (loss) per common unit |
|
|
(0.09) |
|
|
(0.06) |
|
|
(0.18) |
|
|
(0.60) |
|
|
Basic and diluted income (loss) per subordinated unit |
|
|
(0.09) |
|
|
(0.07) |
|
|
(0.19) |
|
|
(0.60) |
|
|
|
|
|
|
|
|
|
|
|
|
|
|
|
|
|
2015 |
|
|
|
|
|
|
|
|
|
|
|
|
|
|
Total revenue |
|
$ |
173,291 |
|
$ |
199,448 |
|
$ |
154,641 |
|
$ |
153,205 |
|
|
Operating income (loss) |
|
|
2,185 |
|
|
(4,204) |
|
|
(5,877) |
|
|
(31,412) |
|
|
Income (loss) from continuing operations |
|
|
1,072 |
|
|
(5,479) |
|
|
(7,201) |
|
|
(32,097) |
|
|
Income (loss) from discontinued operations |
|
|
(407) |
|
|
542 |
|
|
(1,247) |
|
|
(13,839) |
|
|
Net income (loss) |
|
|
665 |
|
|
(4,937) |
|
|
(8,448) |
|
|
(45,936) |
|
|
Basic and diluted income (loss) from continuing operations per common unit |
|
|
0.03 |
|
|
(0.15) |
|
|
(0.19) |
|
|
(0.88) |
|
|
Basic and diluted income (loss) from continuing operations per subordinated unit |
|
|
0.03 |
|
|
(0.15) |
|
|
(0.20) |
|
|
(0.88) |
|
|
Basic and diluted income (loss) per common unit |
|
|
0.02 |
|
|
(0.13) |
|
|
(0.23) |
|
|
(1.26) |
|
|
Basic and diluted income (loss) per subordinated unit |
|
|
0.02 |
|
|
(0.14) |
|
|
(0.23) |
|
|
(1.26) |
|
F-41
|
Exhibit |
|
Description |
|
2.1 |
|
Agreement and Plan of Merger, dated as of October 23, 2016, among American Midstream Partners, LP, American Midstream GP, LLC, JP Energy Partners LP, JP Energy GP II LLC, Argo Merger Sub, LLC and Argo Merger GP Sub, LLC (incorporated by reference to Exhibit 2.1 to the Partnership’s Current Report on Form 8-K filed with the SEC on October 24, 2016) |
|
|
|
|
|
3.1 |
|
Certificate of Limited Partnership of JP Energy Partners LP (incorporated by reference to Exhibit 3.1 of the Partnership’s Registration Statement on Form S-1 (File No. 333-195787) filed with the SEC on May 8, 2014). |
|
|
|
|
|
3.2 |
|
Third Amended and Restated Agreement of Limited Partnerships of JP Energy Partners LP dated October 7, 2014 (incorporated by reference to Exhibit 3.1 to the Partnership’s Current Report on Form 8-K filed with the SEC on October 7, 2014). |
|
|
|
|
|
4.1 |
|
Registration Rights Agreement dated November 27, 2012 among JP Energy Partners LP, Arkansas Terminaling and Training Inc., Michal Coulson, Mary Ann Dawkins and White Properties II Limited Partnership (incorporated by reference to Exhibit 4.1 to the Partnership’s Registration Statement on Form S-1 (File No. 333-195787) filed with the SEC on May 8, 2014). |
|
|
|
|
|
10.1 |
|
Credit Agreement dated February 12, 2014 among JP Energy Partners LP, Bank of America, N.A. as administrative agent and swing line lender and an L/C issuer, the other lender parties thereto, and Bank of America Merrill Lynch and BMO Harris Financing, Inc., as joint lead arrangers and joint book managers (incorporated by reference to Exhibit 10.1 to the Partnership’s Registration Statement on Form S-1 (File No. 333-195787) filed with the SEC on May 8, 2014). |
|
|
|
|
|
10.2 |
|
Amendment No. 1 to Credit Agreement, dated as of April 30, 2014 (incorporated by reference to Exhibit 10.2 to the Partnership’s Registration Statement on Form S-1 (File No. 333-195787) filed with the SEC on May 8, 2014). |
|
|
|
|
|
10.3 |
|
Amendment No. 2 and Waiver to Credit Agreement, dated as of August 5, 2014 (incorporated by reference to Exhibit 10.3 to the Partnership’s Registration Statement on Form S-1 (File No. 333-195787) filed with the SEC on September 22, 2014). |
|
|
|
|
|
10.4 |
|
Amendment No. 3 and Waiver to Credit Agreement dated as of September 19, 2014 (incorporated by reference to Exhibit 10.9 to the Partnership’s Registration Statement on Form S-1 (File No. 333-195787) filed with the SEC on September 22, 2014). |
|
|
|
|
|
10.5 |
|
Amendment No. 4 to Credit Agreement dated as of November 6, 2015 (incorporated by reference to Exhibit 10.1 to the Partnership’s Quarterly Report on Form 10-Q filed with the SEC on November 9, 2015). |
|
|
|
|
|
10.6 |
|
Amendment No. 5 to Credit Agreement dated February 23, 2016 (incorporated by reference to Exhibit 10.1 to the Partnership’s Annual Report on Form 10-K filed with the SEC on February 29, 2016). |
|
|
|
|
|
10.7 |
|
Amendment No. 6 to Credit Agreement dated as of November 18, 2016 (incorporated by reference to Exhibit 10.1 to the Partnership’s Current Report on Form 8-K filed with the SEC on November 21, 2016) |
|
|
|
|
|
10.8** |
|
JP Energy Partners LP 2014 Long-Term Incentive Plan (incorporated by reference to Exhibit 10.2 to the Partnership’s Current Report on Form 8-K filed with the SEC on October 7, 2014). |
|
|
|
|
95
|
Exhibit |
|
Description |
|
10.9 |
|
Right of First Offer Agreement dated as of October 7, 2014, by and among JP Energy Partners LP, JP Energy GP II LLC, JP Energy Development LP and Republic Midstream, Holdings LLC (incorporated by reference to Exhibit 10.1 to the Partnership’s Current Report on Form 8-K filed with the SEC on October 7, 2014). |
|
|
|
|
|
10.10** |
|
Employment Agreement of Patrick J. Welch (incorporated by reference to Exhibit 10.3 to the Partnership’s Current Report on Form 8-K filed with the SEC on October 7, 2014). |
|
|
|
|
|
10.11** |
|
Employment Agreement of Simon Chen dated as of October 21, 2015 (incorporated by reference to Exhibit 10.11 to the Partnership’s Annual Report on Form 10-K filed with the SEC on February 29, 2016.)
|
|
10.12 |
|
Expense Reimbursement Agreement dated as of October 23, 2016 by and among JP Energy Partners LP, JP Energy GP II LLC and Lonestar Midstream Holdings, LLC (incorporated by reference to Exhibit 10.1 to the Partnership’s Current Report on Form 8-K filed with the SEC on October 24, 2016)
|
|
21.1* |
|
List of Subsidiaries of JP Energy Partners LP. |
|
|
|
|
|
23.1* |
|
Consent of Pricewaterhouse Coopers LLP.
|
|
31.1* |
|
Certification of Chief Executive Officer pursuant to Section 302 of the Sarbanes-Oxley Act of 2002. |
|
|
|
|
|
31.2* |
|
Certification of Chief Financial Officer pursuant to Section 302 of the Sarbanes-Oxley Act of 2002. |
|
|
|
|
|
32.1* |
|
Certification of Chief Executive Officer pursuant to 18 U.S.C Section 1350, as adopted pursuant to Section 906 of the Sarbanes-Oxley Act of 2002. |
|
|
|
|
|
32.2* |
|
Certification of Chief Financial Officer pursuant to 18 U.S.C Section 1350, as adopted pursuant to Section 906 of the Sarbanes-Oxley Act of 2002. |
|
|
|
|
|
101.INS* |
|
XBRL Instance Document |
|
|
|
|
|
101.SCH* |
|
XBRL Taxonomy Extension Schema |
|
|
|
|
|
101.CAL* |
|
XBRL Taxonomy Calculation Linkbase |
|
|
|
|
|
101.DEF* |
|
XBRL Taxonomy Definition Linkbase |
|
|
|
|
|
101.LAB* |
|
XBRL Taxonomy Label Linkbase |
|
|
|
|
|
101.PRE* |
|
XBRL Taxonomy Presentation Linkbase |
* Filed Herewith
** Management contract or compensatory plan or arrangement
None.
96
Pursuant to the requirements of Section 13 or 15(d) of the Securities Act of 1934, the registrant has duly caused this report to be signed on its behalf by the undersigned, thereunto duly authorized.
|
|
JP Energy Partners LP |
|
|
|
|
|
|
|
By: |
Argo Merger GP Sub, LLC, its general partner |
|
|
|
|
|
Date: March 13, 2017 |
By: |
/s/ J. Patrick Barley |
|
|
|
J. Patrick Barley |
|
|
|
President and Chief Executive Officer |
Pursuant to the requirements of the Securities Act of 1934, this report has been signed by the following persons in the capacities and on the dates indicated.
|
Signature |
|
Title |
|
Date |
|
|
|
|
|
|
|
/s/ J. Patrick Barley |
|
Chairman of the Board, President and |
|
|
|
J. Patrick Barley |
|
|
March 13, 2017 |
|
|
|
|
|
|
|
|
|
|
|
|
|
|
/s/ Patrick J. Welch |
|
Executive Vice President, Chief Financial |
|
|
|
Patrick J. Welch |
|
|
March 13, 2017 |
|
|
|
|
|
|
|
|
|
|
|
|
|
|
/s/ Shiming Chen |
|
Senior Vice President, Chief Accounting Officer (Principal Accounting Officer) |
|
March 13, 2017 |
|
Shiming Chen |
|
|
97