Attached files
| file | filename |
|---|---|
| EX-31.1 - EXHIBIT 31.1 - First Financial Northwest, Inc. | ffnw-20161231x10kexx311.htm |
| EX-32.2 - EXHIBIT 32.2 - First Financial Northwest, Inc. | ffnw-20161231x10kexx322.htm |
| EX-32.1 - EXHIBIT 32.1 - First Financial Northwest, Inc. | ffnw-20161231x10kexx321.htm |
| EX-31.2 - EXHIBIT 31.2 - First Financial Northwest, Inc. | ffnw-20161231x10kexx312.htm |
| EX-23 - EXHIBIT 23 - First Financial Northwest, Inc. | ffnw-20161231x10kexx23.htm |
| EX-21 - EXHIBIT 21 - First Financial Northwest, Inc. | ffnw-20161231x10kexx21.htm |
UNITED STATES | |||
SECURITIES AND EXCHANGE COMMISSION | |||
Washington, D.C. 20549 | |||
FORM 10-K | |||
[X] | ANNUAL REPORT PURSUANT TO SECTION 13 OR 15(d) OF THE SECURITIES EXCHANGE ACT OF 1934 | ||
For the Fiscal Year Ended December 31, 2016 | |||
[ ] | TRANSITION REPORT PURSUANT TO SECTION 13 OR 15(d) OF THE SECURITIES EXCHANGE ACT OF 1934 | ||
Commission File Number: 001-33652 | |||
FIRST FINANCIAL NORTHWEST, INC. | |||
(Exact name of registrant as specified in its charter) | |||
Washington | 26-0610707 | ||
(State or other jurisdiction of incorporation or organization) | (I.R.S. Employer Identification Number) | ||
201 Wells Avenue South, Renton, Washington | 98057 | ||
(Address of principal executive offices) | (Zip Code) | ||
Registrant’s telephone number, including area code: | (425) 255-4400 | ||
Securities registered pursuant to Section 12(b) of the Act: | |||
Common Stock, $0.01 par value per share | The Nasdaq Stock Market LLC | ||
(Title of Each Class) | (Name of Each Exchange on Which Registered) | ||
Securities registered pursuant to Section 12(g) of the Act: | None | ||
Indicate by check mark if the Registrant is a well-known seasoned issuer, as defined in Rule 405 of the Securities Act.
YES NO X
Indicate by check mark if the Registrant is not required to file reports pursuant to Section 13 or Section 15(d) of the Act.
YES NO X
Indicate by check mark whether the Registrant: (1) has filed all reports required to be filed by Section 13 or 15(d) of the Securities Exchange Act of 1934 during the preceding 12 months (or for such shorter period that the Registrant was required to file such reports), and (2) has been subject to such filing requirements for the past 90 days. YES X NO
Indicate by check mark whether the Registrant has submitted electronically and posted on its corporate Web site, if any, every Interactive Data File required to be submitted and posted pursuant to Rule 405 of Regulation S-T (§232.405 of this chapter) during the preceding 12 months (or for such shorter period that the registrant was required to submit and post such files). YES X NO
Indicate by check mark if disclosure of delinquent filers pursuant to Item 405 of Regulation S-K (§229.405 of this chapter) is not contained herein, and will not be contained, to the best of the Registrant’s knowledge, in definitive proxy or information statements incorporated by reference in Part III of this Form 10-K or any amendment to this Form 10-K. _X__
Indicate by check mark whether the Registrant is a large accelerated filer, an accelerated filer, a non-accelerated filer, or a smaller reporting company. See definitions of “large accelerated filer,” “accelerated filer” and smaller reporting company in Rule 12b-2 of the Exchange Act:
Large accelerated filer | Accelerated filer X | Non-accelerated filer | Smaller reporting company ____ |
Indicate by check mark whether the Registrant is a shell company (as defined in Rule 12b-2 of the Act). YES NO X
The aggregate market value of the Common Stock outstanding held by nonaffiliates of the Registrant based on the closing sales price of the Registrant’s Common Stock as quoted on The Nasdaq Stock Market LLC on June 30, 2016, was $154,007,217 (11,596,929 shares at $13.28 per share). For purposes of this calculation, common stock held only by executive officers, the employee stock ownership plan and directors of the Registrant is considered to be held by affiliates. As of March 9, 2017, the Registrant had outstanding 11,035,791 shares of common stock.
DOCUMENTS INCORPORATED BY REFERENCE
1. Portions of Registrant’s Definitive Proxy Statement for the 2016 Annual Meeting of Shareholders (Part III).
FIRST FINANCIAL NORTHWEST, INC.
2016 ANNUAL REPORT ON FORM 10-K
TABLE OF CONTENTS
Page | ||||
48 | ||||
48 | ||||
51 | ||||
Overview | ||||
54 | ||||
Comparison of Financial Condition at December 31, 2016, and December 31, 2015 | 56 | |||
59 | ||||
Comparison of Financial Condition at December 31, 2015, and December 31, 2014 | 62 | |||
i
Principal Accounting Fees and Services | ||||
Item 16. | Form 10-K Summary | |||
ii
Forward-Looking Statements
Certain matters discussed in this Form 10-K constitute forward-looking statements within the meaning of the Private Securities Litigation Reform Act of 1995. These statements relate to our financial condition, results of operations, plans, objectives, future performance or business. Forward-looking statements are not statements of historical fact, are based on certain assumptions and are generally identified by use of the words “believes,” “expects,” “anticipates,” “estimates,” “forecasts,” “intends,” “plans,” “targets,” “potentially,” “probably,” “projects,” “outlook” or similar expressions or future or conditional verbs such as “may,” “will,” “should,” “would” and “could.” Forward-looking statements include statements with respect to our beliefs, plans, objectives, goals, expectations, assumptions and statements about, among other things, expectations of the business environment in which we operate, projections of future performance or financial items, perceived opportunities in the market, potential future credit experience, and statements regarding our mission and vision. These forward-looking statements are based upon current management expectations and may, therefore, involve risks and uncertainties. Our actual results, performance, or achievements may differ materially from those suggested, expressed, or implied by forward-looking statements as a result of a wide variety or range of factors including, but not limited to: the credit risks of lending activities, including changes in the level and trend of loan delinquencies and write-offs, that may be affected by deterioration in the housing and commercial real estate markets, and may lead to increased losses and nonperforming assets in our loan portfolio, and may result in our allowance for loan losses not being adequate to cover actual losses, and require us to materially increase our reserves; changes in general economic conditions, either nationally or in our market areas; changes in the levels of general interest rates, and the relative differences between short and long term interest rates, deposit interest rates, our net interest margin and funding sources; fluctuations in the demand for loans, the number of unsold homes and other properties and fluctuations in real estate values in our market areas; results of examinations of us by the Federal Reserve Bank of San Francisco (“FRB”) and our bank subsidiary by the Federal Deposit Insurance Corporation (“FDIC”), the Washington State Department of Financial Institutions, Division of Banks (“DFI”) or other regulatory authorities, including the possibility that any such regulatory authority may initiate an enforcement action against the Company or the Bank which could require us to increase our reserve for loan losses, write-down assets, change our regulatory capital position, affect our ability to borrow funds or maintain or increase deposits, or impose additional requirements or restrictions on us, any of which could adversely affect our liquidity and earnings; our ability to pay dividends on our common stock; our ability to attract and retain deposits; increases in premiums for deposit insurance; our ability to control operating costs and expenses; the use of estimates in determining the fair value of certain of our assets, which estimates may prove to be incorrect and result in significant declines in valuation; difficulties in reducing risk associated with the loans on our balance sheet; staffing fluctuations in response to product demand or the implementation of corporate strategies that affect our work force and potential associated charges; computer systems on which we depend could fail or experience a security breach; our ability to retain key members of our senior management team; costs and effects of litigation, including settlements and judgments; our ability to implement a branch expansion strategy; our ability to successfully integrate any assets, liabilities, customers, systems, and management personnel we have acquired or may in the future acquire into our operations and our ability to realize related revenue synergies and cost savings within expected time frames and any goodwill charges related thereto; our ability to manage loan delinquency rates; costs and effects of litigation, including settlements and judgments; increased competitive pressures among financial services companies; changes in consumer spending, borrowing and savings habits; legislative or regulatory changes that adversely affect our business including changes in regulatory policies and principles, including the interpretation of regulatory capital or other rules, including as a result of Basel III; the impact of the Dodd-Frank Wall Street Reform and Consumer Protection Act (the “Dodd-Frank Act”) and the implementing regulations; the availability of resources to address changes in laws, rules, or regulations or to respond to regulatory actions; adverse changes in the securities markets; inability of key third-party providers to perform their obligations to us; changes in accounting policies and practices, as may be adopted by the financial institution regulatory agencies or the Financial Accounting Standards Board, including additional guidance and interpretation on accounting issues and details of the implementation of new accounting methods; the economic impact of war or any terrorist activities; other economic, competitive, governmental, regulatory, and technological factors affecting our operations; pricing, products and services; and other risks detailed in this Form 10-K and our other reports filed with the U.S. Securities and Exchange Commission (“SEC”). Any of the forward-looking statements that we make in this Form 10-K and in the other public reports and statements we make may turn out to be wrong because of the inaccurate assumptions we might make, because of the factors illustrated above or because of other factors that we cannot foresee. Because of these and other uncertainties, our actual future results may be materially different from those expressed in any forward‑looking statements made by or on our behalf. Therefore, these factors should be considered in evaluating the forward‑looking statements, and undue reliance should not be placed on such statements. We undertake no responsibility to update or revise any forward-looking statements.
As used throughout this report, the terms “Company”, “we”, “our”, or “us” refer to First Financial Northwest, Inc. and its consolidated subsidiaries, including First Financial Northwest Bank and First Financial Diversified Corporation.
Internet Website
The information contained on our website, www.ffnwb.com, is not included as a part of, or incorporated by reference into, this Annual Report on Form 10-K. Other than an investor’s own Internet access charges, we make available free of charge
iii
through our website, our annual report on Form 10-K, quarterly reports on Form 10-Q, current reports on Form 8-K and amendments to these reports, on our investor relations page. These reports are posted as soon as reasonably practicable after they are electronically filed with the SEC. All of our SEC filings are also available free of charge at the SEC’s website at www.sec.gov or by calling the SEC at 1-800-SEC-0330.
iv
PART I
Item 1. Business
General
First Financial Northwest, Inc. (“First Financial Northwest” or the “Company”), a Washington corporation, was formed on June 1, 2007, for the purpose of becoming the holding company for First Financial Northwest Bank (“the Bank”) in connection with the Bank’s conversion from a mutual holding company structure to a stock holding company structure which was completed on October 9, 2007. At December 31, 2016, we had total assets of $1.0 billion, net loans of $815.0 million, deposits of $717.5 million and stockholders’ equity of $138.1 million. First Financial Northwest’s business activities generally are limited to passive investment activities and oversight of its investment in First Financial Northwest Bank. Accordingly, the information set forth in this report, including consolidated financial statements and related data, relates primarily to First Financial Northwest Bank.
The Bank was organized in 1923 as a Washington state-chartered savings and loan association, converted to a federal mutual savings and loan association in 1935 and to a Washington state-chartered mutual savings bank in 1992. In 2002, First Savings Bank reorganized into a two-tier mutual holding company structure, became a stock savings bank, and the wholly-owned subsidiary of First Financial of Renton, Inc. In connection with the 2002 conversion, First Savings Bank changed its name to First Savings Bank Northwest. Subsequently, in August 2015, the Bank changed its name to First Financial Northwest Bank to better reflect the commercial banking services it provides beyond those typically provided by a traditional savings bank. In February 2016, the Bank officially changed its charter from a Washington chartered stock savings bank to a Washington chartered commercial bank.
First Financial Northwest became a bank holding company, after converting from a savings and loan holding company on March 31, 2015, and is subject to regulation by the Board of Governors of the Federal Reserve System (the “Federal Reserve Board”) through the FRB. The change was consistent with First Financial Northwest Bank’s shift in focus from a traditional savings and loan association towards a full service, commercial bank. Additionally, First Financial Northwest Bank is examined and regulated by the DFI and by the FDIC. First Financial Northwest Bank is required to maintain reserves at a level set by the Federal Reserve Board. The Bank is a member of the Federal Home Loan Bank (“FHLB”) of Des Moines, which is one of the 11 regional banks in the Federal Home Loan Bank System (“FHLB System”). For additional information, see “How We are Regulated - Regulation and Supervision of First Financial Northwest Bank - Federal Home Loan Bank System.”
In February 2016, First Financial Northwest Bank converted its charter from a community-based savings bank to a commercial bank as a way of better serving its customer needs. The Bank’s largest concentration of customers is in King County, with additional concentrations in Snohomish, Pierce, and Kitsap counties, Washington. The Bank is headquartered in Renton, Washington where it has a full-service branch as well as a smaller branch located in a commercial development known as the “Landing”. Two additional, smaller branches are located in Mill Creek and Edmonds, both in Snohomish County, Washington. These smaller branches are focused on efficiency through the extensive use of the latest banking technology. First Financial Northwest Bank’s business consists of attracting deposits from the public and utilizing these funds to originate one-to-four family residential, multifamily, commercial real estate, construction/land, business and consumer loans.
The principal executive office of First Financial Northwest Bank is located at 201 Wells Avenue South, Renton, Washington, 98057; our telephone number is (425) 255-4400.
Market Area
We consider our primary market area to be the Puget Sound Region that consists primarily of King and Snohomish counties, to a lesser extent, Pierce and Kitsap counties. During 2016, the region experienced appreciation in residential market prices for the fifth consecutive year and a declining supply of homes for sale as a result of strong demand.
King County has the largest population of any county in the state of Washington and covers approximately 2,100 square miles. It has a population of approximately 2.1 million residents and a median household income of approximately $75,000, according to U.S. Census estimates. King County has a diversified economic base with many nationally recognized firms including Boeing, Microsoft, Amazon, Starbucks, Nordstrom, Costco and Paccar. According to the Washington State Employment Security Department, the unemployment rate for King County was 3.4% at December 31, 2016, compared to 4.5% at December 31, 2015, and the national average of 4.7% at December 31, 2016. According to the Northwest Multiple Listing Service (“MLS”), the median sales price of a residential home in King County for 2016 was $548,000, an increase of 14.2% from 2015. Residential sales volumes increased 1.7% in 2016 compared to 2015 and inventory levels as of December 31, 2016 were at 0.7 months according to the MLS.
1
Snohomish County has the third largest population of any county in the state of Washington and covers approximately 2,090 square miles. It has approximately 773,000 residents and a median household income of approximately $71,000, according to U.S. Census estimates. The economy of Snohomish County is diversified with the presence of military-related government employment (Naval Station Everett), aerospace-related employment (Boeing), and retail trade. According to the Washington State Employment Security Department, the unemployment rate for Snohomish County was 3.9% in December 2016 compared to 5.0% in December 2015. The median sales price of a residential home in Snohomish County was $390,000 during 2016, a 9.9% increase compared to 2015, according to the MLS. Residential sales volumes increased by 9.8% in 2016 compared to 2015 and inventory levels as of December 31, 2016 were at 0.9 months according to the MLS.
Pierce County, covering approximately 1,800 square miles, has the second largest population of any county in the state of Washington. It has approximately 844,000 residents and a median household income of approximately $60,000, according to U.S. Census estimates. The Pierce County economy is diversified with the presence of military-related government employment (Joint Base Lewis-McChord), transportation and shipping employment (Port of Tacoma), and aerospace-related employment (Boeing). According to the Washington State Employment Security Department, the unemployment rate for Pierce County was 6.0% in December 2016, compared to 6.1% at year-end 2015. The median sales price of a residential home in Pierce County was $275,000 during 2016, a 10.0% increase compared to 2015, according to the MLS. Residential sales volumes increased by 12.7% in 2016 compared to 2015 and inventory levels as of December 31, 2016 were at 1.3 months according to the MLS.
Kitsap County has the seventh largest population of any county in the state of Washington and covers approximately 570 square miles. It has approximately 260,000 residents and a median household income of approximately $63,000, according to U.S. Census estimates. The Kitsap County economy is diversified with the presence of military-related government employment (Naval Base Kitsap, Puget Sound Naval Shipyard), health care, retail trade and education. According to the Washington State Employment Security Department, the unemployment rate for Kitsap County was 5.5% in December 2016, unchanged from December of 2015. The median sales price of a residential home in Kitsap County was $284,000 during 2016, a 9.3% increase compared to 2015, according to the MLS. Residential sales volumes increased by 11.7% in 2016 compared to 2015 and inventory levels as of December 31, 2016 were at 1.4 months according to the MLS.
For a discussion regarding competition in our primary market area, see “- Competition” later in Item 1 of this report.
Lending Activities
General. We focus our lending activities primarily on loans secured by commercial real estate, construction/land, first mortgages on one-to-four family residences, multifamily, and to lesser extent, business lending. We offer a limited variety of secured consumer loans, including savings account loans and home equity loans that include lines of credit and second mortgage term loans. As of December 31, 2016, our net loan portfolio totaled $815.0 million and represented 78.6% of our total assets.
Our current loan policy generally limits the maximum amount of loans we can make to one borrower to 15% of the Bank’s total risk-based capital, which was $19.5 million at December 31, 2016. Exceptions to this policy are allowed only with the prior approval of the Board of Directors and if the borrower exhibits financial strength or sufficient, measurable compensating factors exist after consideration of the loan-to-value ratio, borrower’s financial condition, net worth, credit history, earnings capacity, installment obligations, and current payment history. The regulatory limit of loans we can make to one borrower is 20% of total risk-based capital, or $26.0 million, at December 31, 2016.
During 2016, the concentration of loans to our five largest lending relationships increased. At December 31, 2016, loans to our five largest lending relationships totaled $79.5 million compared to $76.1 million at December 31, 2015, an increase of $3.4 million, or 4.5%. Although the total of these relationships increased during 2016, their percentage of total loans, net of loans in process (“LIP”) decreased to 9.6% at December 31, 2016 from 10.9% at December 31, 2015 and the total number of loans comprising these relationships decreased to 23 from 70 during 2016. The following table details the types of loans to our five largest lending relationships at December 31, 2016.
2
Borrower (1) | Number of Loans | One-to-Four Family Residential | Multifamily | Commercial Real Estate (Rental Properties) | Construction/Land | Aggregate Balance of Loans (2) | |||||||||||||||||
(Dollars in thousands) | |||||||||||||||||||||||
Real estate investor | 12 | $ | — | $ | 17,591 | $ | 839 | $ | — | $ | 18,430 | ||||||||||||
Real estate investor | 3 | 482 | — | 15,082 | — | 15,564 | |||||||||||||||||
Real estate investor | 3 | — | — | 8,820 | 6,369 | 15,189 | |||||||||||||||||
Real estate investor | 2 | 467 | — | 14,704 | — | 15,171 | |||||||||||||||||
Real estate investor | 3 | — | 8,752 | — | 6,372 | 15,124 | |||||||||||||||||
Total | 23 | $ | 949 | $ | 26,343 | $ | 39,445 | $ | 12,741 | $ | 79,478 | ||||||||||||
(1) The composition of borrowers represented in the table may change between periods.
(2) Net of LIP.
The composition of loans to our five largest borrowers has changed over the last year. As of December 31, 2016, total
one-to-four family properties and commercial real estate loans to this group of borrowers decreased, as compared to December 31, 2015, by $12.6 million and $20.5 million, respectively, while total multifamily loans and construction loans increased by $24.3 million and $12.3 million, respectively. At December 31, 2016, all of the loans listed in the table above were in compliance with the original repayment terms of their respective loans.
3
Loan Portfolio Analysis. The following table sets forth the composition of our loan portfolio by type of loan at the dates indicated.
December 31, | ||||||||||||||||||||||||||||||||||
2016 | 2015 | 2014 | 2013 | 2012 | ||||||||||||||||||||||||||||||
Amount | Percent | Amount | Percent | Amount | Percent | Amount | Percent | Amount | Percent | |||||||||||||||||||||||||
(Dollars in thousands) | ||||||||||||||||||||||||||||||||||
One-to-four family residential: | ||||||||||||||||||||||||||||||||||
Permanent owner occupied | $ | 137,834 | 15.3 | % | $ | 147,229 | 19.6 | % | $ | 161,013 | 22.9 | % | $ | 158,797 | 23.0 | % | $ | 167,019 | 24.8 | % | ||||||||||||||
Permanent non-owner occupied | 111,601 | 12.4 | 106,543 | 14.2 | 112,180 | 15.9 | 121,877 | 17.7 | 139,832 | 20.7 | ||||||||||||||||||||||||
249,435 | 27.7 | 253,772 | 33.8 | 273,193 | 38.8 | 280,674 | 40.7 | 306,851 | 45.5 | |||||||||||||||||||||||||
Multifamily real estate | 123,250 | 13.7 | 122,747 | 16.3 | 116,014 | 16.5 | 106,152 | 15.4 | 105,936 | 15.7 | ||||||||||||||||||||||||
Commercial real estate | 303,694 | 33.7 | 244,211 | 32.5 | 239,211 | 34.0 | 227,016 | 33.0 | 207,436 | 30.8 | ||||||||||||||||||||||||
Construction/land: (1) | ||||||||||||||||||||||||||||||||||
One-to-four family residential | 67,842 | 7.5 | 52,233 | 7.0 | 20,360 | 2.9 | 3,977 | 0.6 | 785 | 0.1 | ||||||||||||||||||||||||
Multifamily | 111,051 | 12.4 | 46,666 | 6.2 | 22,352 | 3.1 | 24,851 | 3.5 | 13,960 | 2.1 | ||||||||||||||||||||||||
Commercial real estate | — | — | — | — | 10,400 | 1.5 | 26,631 | 3.9 | 12,500 | 1.9 | ||||||||||||||||||||||||
Land | 30,055 | 3.3 | 17,058 | 2.3 | 11,949 | 1.7 | 9,292 | 1.4 | 12,377 | 1.8 | ||||||||||||||||||||||||
208,948 | 23.2 | 115,957 | 15.5 | 65,061 | 9.2 | 64,751 | 9.4 | 39,622 | 5.9 | |||||||||||||||||||||||||
Business | 7,938 | 0.9 | 7,604 | 1.0 | 3,783 | 0.5 | 1,142 | 0.2 | 2,968 | 0.4 | ||||||||||||||||||||||||
Consumer | 6,922 | 0.8 | 6,979 | 0.9 | 7,130 | 1.0 | 9,201 | 1.3 | 11,110 | 1.7 | ||||||||||||||||||||||||
Total loans | 900,187 | 100.0 | % | 751,270 | 100.0 | % | 704,392 | 100.0 | % | 688,936 | 100.0 | % | 673,923 | 100.0 | % | |||||||||||||||||||
Less: | ||||||||||||||||||||||||||||||||||
Loans in process (“LIP”) | 72,026 | 53,854 | 27,359 | 10,209 | 8,856 | |||||||||||||||||||||||||||||
Deferred loan fees, net | 2,167 | 2,881 | 2,604 | 2,580 | 2,057 | |||||||||||||||||||||||||||||
Allowance for loan and lease losses (“ALLL”) | 10,951 | 9,463 | 10,491 | 12,994 | 12,542 | |||||||||||||||||||||||||||||
Loans receivable, net | $ | 815,043 | $ | 685,072 | $ | 663,938 | $ | 663,153 | $ | 650,468 | ||||||||||||||||||||||||
(footnote on the following page)
4
_____________
(1) We previously excluded from the construction/land category “rollover” loans, which are loans that will convert upon completion of the construction period to permanent loans. These loans were classified according to the underlying collateral categories instead of being included in the construction/land category. In addition, we previously classified raw land or buildable lots where the Company does not intend to finance the construction as commercial real estate land loans and have now included these loans in the construction/land category. At December 31, 2016, we reclassified $62.9 million of multifamily loans and $26.9 million of commercial real estate loans, and $2.6 million of one-to-four family residential loans as construction/land loans to facilitate the review of the composition of our loan portfolio. Prior periods have been reclassified consistent with this change in presentation.
5
The following table shows the composition of our loan portfolio by fixed- and adjustable-rate loans at the dates indicated.
December 31, | ||||||||||||||||||||||||||||||||||
2016 | 2015 | 2014 | 2013 | 2012 | ||||||||||||||||||||||||||||||
Amount | Percent | Amount | Percent | Amount | Percent | Amount | Percent | Amount | Percent | |||||||||||||||||||||||||
FIXED-RATE LOANS | (Dollars in thousands) | |||||||||||||||||||||||||||||||||
Real estate: | ||||||||||||||||||||||||||||||||||
One-to-four family residential | $ | 169,523 | 18.8 | % | $ | 172,951 | 23.0 | % | $ | 189,399 | 26.9 | % | $ | 224,820 | 32.6 | % | $ | 263,503 | 39.1 | % | ||||||||||||||
Multifamily | 72,593 | 8.1 | 82,767 | 11.0 | 82,639 | 11.7 | 82,310 | 11.9 | 94,327 | 14.0 | ||||||||||||||||||||||||
Commercial real estate | 211,054 | 23.4 | 199,101 | 26.5 | 206,395 | 29.3 | 197,624 | 28.7 | 192,029 | 28.5 | ||||||||||||||||||||||||
Construction/land | 50,431 | 5.6 | 12,158 | 1.6 | 5,469 | 0.8 | 860 | 0.1 | 5,409 | 0.8 | ||||||||||||||||||||||||
Total real estate | 503,601 | 55.9 | 466,977 | 62.1 | 483,902 | 68.7 | 505,614 | 73.3 | 555,268 | 82.4 | ||||||||||||||||||||||||
Business | 640 | 0.1 | 243 | — | 375 | 0.1 | 282 | 0.1 | 943 | 0.1 | ||||||||||||||||||||||||
Consumer | 432 | 0.1 | 558 | 0.1 | 689 | 0.1 | 855 | 0.1 | 1,084 | 0.2 | ||||||||||||||||||||||||
Total fixed-rate loans | 504,673 | 56.1 | 467,778 | 62.2 | 484,966 | 68.9 | 506,751 | 73.5 | 557,295 | 82.7 | ||||||||||||||||||||||||
ADJUSTABLE-RATE LOANS | ||||||||||||||||||||||||||||||||||
Real estate: | ||||||||||||||||||||||||||||||||||
One-to-four family residential | 79,912 | 8.9 | 80,821 | 10.8 | 83,794 | 11.9 | 55,854 | 8.1 | 43,347 | 6.4 | ||||||||||||||||||||||||
Multifamily | 50,657 | 5.6 | 39,980 | 5.3 | 33,375 | 4.7 | 23,842 | 3.5 | 11,609 | 1.7 | ||||||||||||||||||||||||
Commercial real estate | 92,640 | 10.3 | 45,110 | 6.0 | 32,816 | 4.6 | 29,392 | 4.3 | 15,406 | 2.3 | ||||||||||||||||||||||||
Construction/land | 158,517 | 17.6 | 103,799 | 13.8 | 59,592 | 8.5 | 63,891 | 9.3 | 34,215 | 5.1 | ||||||||||||||||||||||||
Total real estate | 381,726 | 42.4 | 269,710 | 35.9 | 209,577 | 29.7 | 172,979 | 25.2 | 104,577 | 15.5 | ||||||||||||||||||||||||
Business | 7,298 | 0.8 | 7,361 | 1.0 | 3,408 | 0.5 | 860 | 0.1 | 2,025 | 0.3 | ||||||||||||||||||||||||
Consumer | 6,490 | 0.7 | 6,421 | 0.9 | 6,441 | 0.9 | 8,346 | 1.2 | 10,026 | 1.5 | ||||||||||||||||||||||||
Total adjustable-rate loans | 395,514 | 43.9 | 283,492 | 37.8 | 219,426 | 31.1 | 182,185 | 26.5 | 116,628 | 17.3 | ||||||||||||||||||||||||
Total loans | 900,187 | 100.0 | % | 751,270 | 100.0 | % | 704,392 | 100.0 | % | 688,936 | 100.0 | % | 673,923 | 100.0 | % | |||||||||||||||||||
Less: | ||||||||||||||||||||||||||||||||||
LIP | 72,026 | 53,854 | 27,359 | 10,209 | 8,856 | |||||||||||||||||||||||||||||
Deferred loan fees, net | 2,167 | 2,881 | 2,604 | 2,580 | 2,057 | |||||||||||||||||||||||||||||
ALLL | 10,951 | 9,463 | 10,491 | 12,994 | 12,542 | |||||||||||||||||||||||||||||
Loans receivable, net | $ | 815,043 | $ | 685,072 | $ | 663,938 | $ | 663,153 | $ | 650,468 | ||||||||||||||||||||||||
6
Geographic Distribution of our Loans. The following table shows at December 31, 2016 the geographic distribution of our loan portfolio in dollar amounts and percentages.
Puget Sound Region (1) | Other Washington | Total in Washington State | All Other States (2) | Total | ||||||||||||||||||||||||||||||
Amount | % of Total in Category | Amount | % of Total in Category | Amount | % of Total in Category | Amount | % of Total in Category | Amount | % of Total in Category | |||||||||||||||||||||||||
Real estate: | (Dollars in thousands) | |||||||||||||||||||||||||||||||||
One-to-four family residential | $ | 236,880 | 95.0 | % | $ | 12,434 | 5.0 | % | $ | 249,314 | 100.0 | % | $ | 121 | — | % | $ | 249,435 | 100.0 | % | ||||||||||||||
Multifamily | 95,060 | 77.1 | 16,591 | 13.5 | 111,651 | 90.6 | 11,599 | 9.4 | 123,250 | 100.0 | % | |||||||||||||||||||||||
Commercial | 221,576 | 73.0 | 50,999 | 16.8 | 272,575 | 89.8 | 31,119 | 10.2 | 303,694 | 100.0 | % | |||||||||||||||||||||||
Construction/land | 134,627 | 98.3 | 2,295 | 1.7 | 136,922 | 100.0 | — | — | 136,922 | 100.0 | % | |||||||||||||||||||||||
Total real estate | 688,143 | 84.6 | 82,319 | 10.1 | 770,462 | 94.7 | 42,839 | 5.3 | 813,301 | 100.0 | % | |||||||||||||||||||||||
Business | 7,572 | 95.4 | — | — | 7,572 | 95.4 | 366 | 4.6 | 7,938 | 100.0 | % | |||||||||||||||||||||||
Consumer | 6,922 | 100.0 | — | — | 6,922 | 100.0 | — | — | 6,922 | 100.0 | % | |||||||||||||||||||||||
Total Loans | 702,637 | 84.8 | % | 82,319 | 9.9 | % | 784,956 | 94.8 | % | 43,205 | 5.2 | % | 828,161 | 100.0 | % | |||||||||||||||||||
____________
(1) Includes King, Snohomish, Pierce and Kitsap counties.
(2) Includes loans located in the states of Arizona, California, Colorado, Indiana, Oregon and Utah.
7
One-to-Four Family Residential Lending. As of December 31, 2016, $249.4 million, or 27.7% of our total loan portfolio consisted of loans secured by one-to-four family residences.
First Financial Northwest Bank is a traditional portfolio lender when it comes to financing residential home loans. In 2016, we originated and purchased $66.6 million in one-to-four family residential loans. At December 31, 2016, $137.8 million, or 55.3% of our one-to-four family residential portfolio consisted of owner occupied loans with the remaining $111.6 million, or 44.7% consisting of non-owner occupied loans. In addition, at December 31, 2016, $169.5 million, or 68.0% of our one-to-four family residential loan portfolio consisted of fixed-rate loans. Substantially all of our one-to-four family residential loans require monthly principal and interest payments.
Our fixed-rate, one-to-four family residential loans are generally originated with 15 to 30 year terms, although such loans typically remain outstanding for substantially shorter periods, particularly in the current low interest rate environment. We also originate hybrid loans with initial fixed-rate terms of five or seven years, that convert to variable-rate which adjusts annually thereafter. In addition, substantially all of our one-to-four family residential loans contain due-on-sale clauses that allow us to declare the unpaid amount due and payable upon the sale of the property securing the loan. Typically, we enforce these due‑on‑sale clauses to the extent permitted by law and as a standard course of business. The average period of time a loan is outstanding is a function of, among other factors, the level of purchase and sale activity in the real estate market, prevailing interest rates, and the interest rates payable on outstanding loans.
Our lending policy generally limits the maximum loan-to-value ratio on mortgage loans secured by one-to-four family residential properties to 85% of the lesser of the appraised value or the purchase price. Properties securing our one-to-four family residential loans are appraised by independent appraisers approved by us. We require the borrowers to obtain title insurance and if necessary, flood insurance. We generally do not require earthquake insurance because of competitive market factors.
Loans secured by rental properties represent higher risk and, as a result, we adhere to more stringent underwriting guidelines. Of primary concern in non-owner occupied real estate lending is the consistency of rental income of the property. Payments on loans secured by rental properties depend primarily on the tenants’ continuing ability to pay rent to the property owner, the character of the borrower or, if the property owner is unable to find a tenant, the property owner’s ability to repay the loan without the benefit of a rental income stream. In addition, successful operation and management of non-owner occupied properties, including property maintenance standards, may affect repayment. As a result, repayment of such loans may be subject to adverse conditions in the real estate market or the economy. We request that borrowers and loan guarantors, if any, provide annual financial statements, a budget factoring in a rental income cash flow analysis of the borrower as well as the net operating income of the property, information concerning the borrower’s expertise, credit history and profitability, and the value of the underlying property. These loans are generally secured by a first mortgage on the underlying collateral property along with an assignment of rents and leases. If the borrower has multiple rental property loans with us, the loans are typically not cross‑collateralized. At December 31, 2016, $798,000 of one-to-four family residential loans were in nonaccrual status, however, all of our one-to-four family non-owner occupied loans were performing.
Multifamily and Commercial Real Estate Lending. As of December 31, 2016, $123.3 million, or 13.7% of our total loan portfolio was secured by multifamily and $303.7 million, or 33.7% of our loan portfolio was secured by commercial real estate properties. Our commercial real estate loans are typically secured by office and medical buildings, retail shopping centers, mini-storage facilities, industrial use buildings and warehouses. Commercial real estate and multifamily loans are subject to similar underwriting standards and processes. These loans are viewed primarily as cash flow loans and secondarily as loans secured by real estate.
Typically, multifamily and commercial real estate loans have higher balances, are more complex to evaluate and monitor, and involve a greater degree of risk than one-to-four-family residential loans. In an attempt to compensate for and mitigate this risk, these loans are generally priced at higher interest rates than one-to-four family residential loans and generally have a maximum loan-to-value ratio of 80% of the lesser of the appraised value or purchase price. We generally require loan guarantees by any parties with a property ownership interest of 20% or more. If the borrower is a corporation or partnership, we generally require personal guarantees from the principals based upon a review of their personal financial statements and individual credit reports.
8
The following table presents a breakdown of our multifamily and commercial real estate loan portfolio at December 31, 2016, and 2015:
December 31, 2016 | December 31, 2015 | ||||||||||||
Amount | % of Total in Portfolio | Amount | % of Total in Portfolio | ||||||||||
(Dollars in thousands) | |||||||||||||
Multifamily real estate: | |||||||||||||
Micro-unit apartments | $ | 7,878 | 6.4 | % | $ | 18,339 | 14.9 | % | |||||
Other multifamily | 115,372 | 93.6 | 104,408 | 85.1 | |||||||||
Total multifamily | $ | 123,250 | 100.0 | % | $ | 122,747 | 100.0 | % | |||||
Commercial real estate: | |||||||||||||
Office | $ | 101,688 | 33.5 | % | $ | 78,297 | 32.1 | % | |||||
Retail | 106,294 | 35.0 | 76,813 | 31.4 | |||||||||
Storage | 34,816 | 11.5 | 40,238 | 16.5 | |||||||||
Mobile home park | 20,689 | 6.8 | 23,630 | 9.7 | |||||||||
Warehouse | 15,338 | 5.0 | 17,845 | 7.3 | |||||||||
Other non-residential | 24,869 | 8.2 | 7,388 | 3.0 | |||||||||
Total non-residential | $ | 303,694 | 100.0 | % | $ | 244,211 | 100.0 | % | |||||
The average loan size in our multifamily and commercial real estate loan portfolios was $770,000 and $1.9 million, respectively, as of December 31, 2016. At this date, $28.2 million, or 22.9%, of our multifamily loans and $82.1 million, or 27.0%, of our commercial real estate loans were from outside of our primary market area. We currently target individual, multifamily, and commercial real estate loans between $1.0 million and $5.0 million. The largest multifamily loan as of December 31, 2016 was a 161-unit apartment complex with a net outstanding principal balance of $7.8 million located in Franklin County, Washington. As of December 31, 2016, the largest commercial real estate loan had a net outstanding balance of $12.5 million and was secured by a self-storage facility located in King County, Washington. Both of these loans were performing according to their respective loan repayment terms as of December 31, 2016.
The credit risk related to multifamily and commercial real estate loans is considered to be greater than the risk related to one-to-four family residential loans because the repayment of multifamily and commercial real estate loans typically is dependent on the income stream from the real estate securing the loan as collateral and the successful operation of the borrower’s business, that can be significantly affected by adverse conditions in the real estate markets or in the economy. For example, if the cash flow from the borrower’s project is reduced due to leases not being obtained or renewed, the borrower’s ability to repay the loan may be impaired. In addition, many of our multifamily and commercial real estate loans are not fully amortizing and contain large balloon payments upon maturity. These balloon payments generally require the borrower to either refinance or occasionally sell the underlying property in order to make the balloon payment.
If we foreclose on a multifamily or commercial real estate loan, our holding period for the collateral typically is longer than for one-to-four family residential mortgage loan foreclosures because there are fewer potential purchasers of the collateral. Our multifamily and commercial real estate loans generally have relatively large balances to single borrowers or related groups of borrowers. Accordingly, if we make any errors in judgment in the collectability of our multifamily or commercial real estate loans, any resulting charge-offs may be larger on a per loan basis than those incurred in our one-to-four family residential or consumer loan portfolios. At December 31, 2016, there were no multifamily or commercial real estate loans past due 90 days or more or in nonaccrual status. There were no commercial real estate loans charged-off during both of the years ended December 31, 2016 and 2015, as compared to charge-offs of $311,000 for the year ended December 31, 2014. For multifamily loans, there were no charge-offs during 2016, as compared to $281,000 charged off in 2015 and no charge-offs in 2014.
Construction/Land Loans. We originate construction/land loans primarily to residential builders for the construction of single-family residences, condominiums, townhouses, multifamily properties and residential developments located in our market area. Land loans include land non-development loans for the purchase or refinance of unimproved land held for future residential development, improved residential lots held for speculative investment purposes or lines of credit secured by land, and land development loans. Construction/land loans to builders generally require the borrower to have an existing relationship with us and a proven record of successful projects. At December 31, 2016, our total construction/land loans were $208.9 million, or 23.2%
9
of our total loan portfolio. The $93.0 million or 80.2% increase in construction/land loans over the past year reflects our strategic decision to continue our focus on increasing construction loan origination activity in 2016 as real estate values and general economic conditions in our market areas continued to improve. The lending policy sets forth the guideline that the net balance of our acquisition, development, and construction loans not exceed 100% of risk-based capital. Management intends to maintain levels near this guideline. At December 31, 2016, net loans in this category totaled $136.9 million while total risk-based capital was $130.1 million. There were no construction/land loans classified as nonaccrual at either December 31, 2016 or 2015. There were no construction/land loan charge-offs during the years ended December 31, 2016 and 2015, as compared to $223,000 for the year ended December 31, 2014.
Following is the composition of our total construction/land loan portfolio at the dates indicated. All of the loans represented were performing:
December 31, | |||||||
2016 | 2015 | ||||||
(In thousands) | |||||||
Construction speculative: | |||||||
One-to-four family residential | $ | 65,272 | $ | 51,613 | |||
Multifamily | 10,157 | 12,403 | |||||
Total construction speculative | 75,429 | 64,016 | |||||
Construction permanent: (1) | |||||||
One-to-four family residential | 2,570 | 620 | |||||
Multifamily | 100,894 | 34,263 | |||||
Total construction permanent | 103,464 | 34,883 | |||||
Land: | |||||||
Land development | 3,134 | 8,768 | |||||
Land non-development | 26,921 | 8,290 | |||||
Total land | 30,055 | 17,058 | |||||
Total construction/land loans (2) | $ | 208,948 | $ | 115,957 | |||
_____________
(1) Includes loans where the builder does not intend to sell the property after the construction phase is completed.
(2) LIP for construction/land loans at December 31, 2016, and 2015, was $72.0 million and $53.9 million, respectively.
The following table includes construction/land loans by county, net of LIP, at December 31, 2016:
County | Loan Balance | Percent of Construction/Land Loan Balance | |||||
(Dollars in thousands) | |||||||
King | $ | 120,389 | 88.0 | % | |||
Snohomish | 12,828 | 9.4 | |||||
Pierce | 1,293 | 0.9 | |||||
Kitsap | 118 | 0.1 | |||||
Whatcom | 2,268 | 1.6 | |||||
All other | 26 | — | |||||
Total | $ | 136,922 | 100.0 | % | |||
Loans to finance the construction of single-family homes and subdivisions and land loans are generally offered to builders in our primary market areas. Loans that are termed “speculative” are those where the builder does not have, at the time of loan origination, a signed contract with a buyer for the home or lot who has a commitment for permanent financing with either us or another lender. The buyer may be identified either during or after the construction period, with the risk that the builder may have to fund the debt service on the speculative loan along with real estate taxes and other carrying costs for the project for a significant period of time after completion of the project until a buyer is identified. The maximum loan-to-value ratio applicable to these loans is generally 100% of the actual cost of construction, provided that the loan-to-completed value does not exceed 80%, with approval required from the Chief Credit Officer (“CCO”) for loan-to-value ratios over 80%. In addition, a minimum of 20%
10
verified equity is generally also required. Verified equity refers to cash equity invested in the project. Development plans are required from builders prior to committing to the loan. We require that builders maintain adequate title insurance and other appropriate insurance coverage, and, if applicable, appropriate environmental data report(s) that the land is free of hazardous or toxic waste. While maturity dates for residential construction loans are largely a function of the estimated construction period of the project and typically do not exceed one year, land loans generally are for 12 to 18 months. Substantially all of our residential construction loans have adjustable-rates of interest based on The Wall Street Journal prime rate. During the term of construction, the accumulated interest on the loan is either added to the principal of the loan through an interest reserve or billed monthly. At December 31, 2016, the LIP balance on construction/land loans was $72.0 million, including $5.0 million set aside for interest reserves. When these loans exhaust their original reserves set up at origination, no additional reserves are permitted unless the loan is re-analyzed and it is determined that the additional reserves are appropriate, based on the updated analysis. Construction loan proceeds are disbursed periodically as construction progresses and as inspections by our approved inspectors warrant. At December 31, 2016, our three largest construction/land loans, net of LIP, consisted of an $11.0 million line of credit, secured by land, for development activities in King County, a $7.9 million bridge loan on 11 lots to be developed in King County, and a $7.1 million loan for the purchase and rehabilitation of a multifamily apartment complex in Snohomish County.
Our residential construction loans to individuals to build their personal or non-owner occupied residences typically are structured to be converted to fixed-rate permanent loans at the end of the construction phase with one closing for both the construction loan and the permanent financing. Prior to making a commitment to fund a construction loan, we require an appraisal of the post construction value of the project by an independent appraiser. During the construction phase, which typically lasts 12 to 18 months, an approved inspector or designated Bank employee makes periodic inspections of the construction site to certify construction has reached the stated percentage of completion. Typically, disbursements are made in monthly draws and interest-only payments are required. These loans are converted to fixed-rate permanent loans at the end of the construction phase. At December 31, 2016, there was one non-owner occupied construction loan of $2.6 million that will convert to a permanent non-owner occupied one‑to‑four family loan in 2018.
We also make construction loans for commercial development projects. The projects include multifamily, retail, office/warehouse and office buildings. These loans typically have an interest-only payment phase during construction and generally convert to permanent financing when construction is complete. Disbursement of funds is at our sole discretion and is based on the progress of construction. The Bank uses an independent third party or Bank employee to conduct monthly inspections to certify that construction has reached the stated percentage of completion and that previous disbursements are reflected in the degree of work performed to date. Generally, the maximum loan-to-value ratio applicable to these loans is 90% of the actual cost of construction or 80% of the prospective value at completion. At December 31, 2016, $62.9 million of our multifamily construction loans will rollover to permanent loans with the Bank at the end of their construction period. The remaining $38.0 million of construction permanent loans represents loans which we anticipate that the builder will either refinance with us or with another lender. At December 31, 2016, we had $10.2 million of speculative multifamily loans where the builder intends to sell the property after the construction phase is completed.
Land development loans are generally made to builders for preparation of a building site and does not include the construction of buildings on the property. The maximum loan-to-value ratio for these loans is 75%. Land non-development loans are generally for raw land where we do not finance the cost of preparing the site for building and are subject to a maximum loan‑to‑value ratio of 65%.
Our construction/land loans are based upon estimates of costs in relation to values associated with the completed project. Construction/land lending involves additional risks when compared with permanent residential lending because funds are advanced upon the collateral for the project based on an estimate of costs that will produce a future value at completion. Because of the uncertainties inherent in estimating construction costs, as well as the market value of the completed project and the effects of governmental regulation on real property, it is relatively difficult to evaluate accurately the total funds required to complete a project and the completed project loan-to-value ratio. Changes in the demand, such as for new housing and higher than anticipated building costs may cause actual results to vary significantly from those estimated. For these reasons, this type of lending also typically involves higher loan principal amounts and is often concentrated with a small number of builders. These loans often involve the disbursement of funds with repayment substantially dependent on the success of the ultimate project and the ability of the borrower to sell or lease the property or obtain permanent take-out financing, rather than the ability of the borrower or guarantor to repay principal and interest. If our appraisal of the value of a completed project proves to be overstated, we may have inadequate security for the repayment of the loan upon completion of construction of the project and may incur a loss. Because construction loans require active monitoring of the building process, including cost comparisons and on-site inspections, these loans are more difficult and costly to monitor. Increases in market rates of interest may have a more pronounced effect on construction loans by rapidly increasing the end-purchasers’ borrowing costs, thereby reducing the overall demand for the project. Properties under construction are often difficult to sell and typically must be completed in order to be successfully sold which also complicates the process of working out problem construction loans. This may require us to advance additional funds and/or contract
11
with another builder to complete construction. Furthermore, in the case of speculative construction loans, there is the added risk associated with identifying an end-purchaser for the finished project. Land loans also pose additional risk because of the lack of income being produced by the property and the potential illiquid nature of the collateral. These risks can also be significantly influenced by supply and demand conditions.
Business Lending. Business loans totaled $7.9 million, or 0.9% of the loan portfolio at December 31, 2016. Business loans are generally secured by business equipment, accounts receivable, inventory or other property. Loan terms typically vary from one to five years. The interest rates on such loans are either fixed-rate or adjustable-rate. The interest rates for the adjustable‑rate loans are indexed to the prime rate published in The Wall Street Journal plus a margin. Our business lending policy includes credit file documentation and requires analysis of the borrower’s background, capacity to repay the loan, the adequacy of the borrower’s capital and collateral, as well as an evaluation of other conditions affecting the borrower. Analysis of the borrower’s past, present and future cash flows is also an important aspect of our credit analysis. We generally obtain personal guarantees on our business loans. The largest business loan had an outstanding balance of $7.1 million at December 31, 2016 and was performing according to its repayment terms. At December 31, 2016, we did not have any business loans delinquent in excess of 90 days or in nonaccrual status.
Beginning in 2016, we began a new line of business to originate aircraft loans directly and indirectly through the Aircraft Owners and Pilots Association Aviation Finance Company. We intend to significantly grow this portfolio over the next several years. These loans are to be collateralized by new or used, single-engine piston aircraft to light jets for business or personal use. We anticipate that our aircraft loans will initially range in size from $250,000 to $3.0 million with the primary focus of our underwriting guidelines on the asset value of the collateral rather than the ability of the borrower to repay the loan. At December 31, 2016, the Bank had an outstanding balance of $366,000 in aircraft loans.
Repayments of business loans are often dependent on the cash flows of the borrower, which may be unpredictable, and the collateral securing these loans may fluctuate in value. Our business loans are originated primarily based on the identified cash flow of the borrower and secondarily on the underlying collateral provided by the borrower. Credit support provided by the borrower for most of these loans and the probability of repayment is based on the liquidation of the pledged collateral and enforcement of a personal guarantee, if any. As a result, in the case of loans secured by accounts receivable, the availability of funds for the repayment of these loans may be substantially dependent on the ability of the borrower to collect amounts due from its customers. The collateral securing business loans may depreciate over time, may be difficult to appraise, or may fluctuate in value based on the success of the business.
Consumer Lending. We offer a limited variety of consumer loans to our customers, consisting primarily of home equity loans and savings account loans. Generally, consumer loans have shorter terms to maturity and higher interest rates than one‑to‑four family residential loans. Consumer loans are offered with both fixed and adjustable interest rates and with varying terms. At December 31, 2016, consumer loans were $6.9 million, or 0.8% of the total loan portfolio.
At December 31, 2016, the largest component of the consumer loan portfolio consisted of home equity loans, primarily home equity lines of credit that totaled $5.4 million, or 78% of the total consumer loan portfolio. The home equity lines of credit include $3.6 million of equity lines of credit in first lien position and $1.8 million of second liens on residential properties. At December 31, 2016, unfunded commitments on our home equity lines of credit totaled $6.6 million. Home equity loans are made for purposes such as the improvement of residential properties, debt consolidation and education expenses. At origination, the loan-to-value ratio is generally 90% or less, when taking into account both the balance of the home equity loans and the first mortgage loan. Home equity loans are originated on a fixed-rate or adjustable-rate basis. The interest rate for the adjustable-rate second lien loans is indexed to the prime rate published in The Wall Street Journal and may include a margin. Home equity loans generally have a ten year term and either convert to principal and interest payments with no further draws or require a balloon payment due at maturity.
Consumer loans entail greater risk than one-to-four family residential mortgage loans, particularly in the case of consumer loans that are unsecured or secured by rapidly depreciating assets. In these cases, any repossessed collateral for a defaulted consumer loan may not provide an adequate source of repayment of the outstanding loan balance as a result of the greater likelihood of damage, loss or depreciation. The remaining deficiency often does not warrant further collection efforts against the borrower beyond obtaining a deficiency judgment. In addition, consumer loan collections are dependent on the borrower’s continuing financial stability, and are more likely to be adversely affected by job loss, divorce, illness or personal bankruptcy. Furthermore, the application of various federal and state laws, including federal and state bankruptcy and insolvency laws, may limit the amount that can be recovered on these loans. Home equity lines of credit have greater credit risk than one-to-four family residential mortgage loans because they are generally secured by mortgages subordinated to the existing first mortgage on the property that we may or may not hold in our portfolio. We do not have private mortgage insurance coverage on these loans. Adjustable-rate loans may experience a higher rate of default in a rising interest rate environment due to the increase in payment amounts when
12
interest rates reset higher. If current economic conditions deteriorate for our borrowers and their home prices fall, we may also experience higher credit losses from this loan portfolio. Since our home equity loans primarily consist of second lien loans, it is unlikely that we will be successful in recovering our entire loan principal outstanding in the event of a default. At December 31, 2016, consumer loans totaling $60,000 were in nonaccrual status, however, no consumer loans were delinquent more than 30 days. Consumer loan charge-offs totaled $83,000 during the year ended December 31, 2016 compared with charge‑offs of $54,000 and $30,000 during the years ended December 31, 2015 and 2014.
Loan Maturity and Repricing. The following table sets forth certain information at December 31, 2016 regarding the amount of loans in our portfolio based on their contractual terms to maturity, not including prepayments. Loan balances are not net of LIP, deferred loan fees and costs, or the ALLL.
Within One Year | After One Year Through Three Years | After Three Years Through Five Years | After Five Years Through Ten Years | Beyond Ten Years | Total | ||||||||||||||||||
(In thousands) | |||||||||||||||||||||||
Real estate: | |||||||||||||||||||||||
One-to-four family residential | $ | 15,982 | $ | 16,966 | $ | 23,188 | $ | 8,829 | $ | 184,470 | $ | 249,435 | |||||||||||
Multifamily | 1,653 | 26,706 | 9,006 | 79,576 | 6,309 | 123,250 | |||||||||||||||||
Commercial | 18,434 | 51,665 | 50,669 | 156,805 | 26,121 | 303,694 | |||||||||||||||||
Construction/land | 113,419 | 47,887 | 16,298 | 31,344 | — | 208,948 | |||||||||||||||||
Total real estate | 149,488 | 143,224 | 99,161 | 276,554 | 216,900 | 885,327 | |||||||||||||||||
Business | 109 | 7,463 | 366 | — | — | 7,938 | |||||||||||||||||
Consumer | 535 | 3,432 | 140 | 33 | 2,782 | 6,922 | |||||||||||||||||
Total | $ | 150,132 | $ | 154,119 | $ | 99,667 | $ | 276,587 | $ | 219,682 | $ | 900,187 | |||||||||||
The following table sets forth the amount of all loans due after December 31, 2017, with fixed or adjustable interest rates. Loan balances are not net of LIP, deferred loan fees and costs, or the ALLL.
Fixed-Rate | Adjustable-Rate | Total | |||||||||
(In thousands) | |||||||||||
Real estate: | |||||||||||
One-to-four family residential | $ | 158,913 | $ | 74,540 | $ | 233,453 | |||||
Multifamily | 72,187 | 49,410 | 121,597 | ||||||||
Commercial | 198,856 | 86,404 | 285,260 | ||||||||
Construction/land | 50,278 | 45,251 | 95,529 | ||||||||
Total real estate | 480,234 | 255,605 | 735,839 | ||||||||
Business | 641 | 7,188 | 7,829 | ||||||||
Consumer | 285 | 6,102 | 6,387 | ||||||||
Total | $ | 481,160 | $ | 268,895 | $ | 750,055 | |||||
Loan Solicitation and Processing. The majority of our consumer and residential mortgage loan originations are generated through the Bank and from time to time through outside brokers and correspondent relationships we have established with select mortgage companies or other financial institutions. We originate multifamily, commercial real estate, construction/land and business loans primarily using the Bank’s loan officers, with referrals coming from builders, brokers and existing customers.
Upon receipt of a loan application from a prospective borrower, we obtain a credit report and other data to verify specific information relating to the loan applicant’s employment, income, and credit standing. All real estate loans requiring an appraisal are done by an independent third-party appraiser. All appraisers are approved by us, and their credentials are reviewed annually, as is the quality of their appraisals.
We use a multi-level approval matrix which establishes lending targets and tolerance levels depending on the loan type being approved. The matrix also sets minimum credit standards for each of the loan types as well as approval limits.
13
Lending Authority. The Directors’ Loan Committee consists of at least three members of the Board of Directors. The Directors’ Loan Committee recommends for approval by the Board of Directors exceptions to the aggregate loan limit to one borrower of 15% of total risk-based capital, or $19.5 million at December 31, 2016. The Board of Directors approves exceptions to such aggregate loan limit to one borrower up to 20% of total risk-based capital, or $26.0 million at December 31, 2016.
Officer Lending Authority. Individual signing authority has been delegated to three lending or executive officers. Our Chief Lending Officer (“CLO”) has authority from the Board of Directors to approve loan requests for both individual loans and aggregate relationships up to and including $1.0 million. Our Senior Credit Approval Officer (“SCAO”) has authority from the Board of Directors to approve loans and aggregate relationships up to and including $2.5 million. The Board of Directors has given our Chief Credit Officer (“CCO”) authority to approve credit to one borrower not to exceed 15% of total risk-based capital. Aircraft loan requests up to and including $5.0 million must be approved by any two of the SCAO, CLO and CCO.
Loan Originations, Servicing, Purchases, Sales and Repayments. For the years ended December 31, 2016 and 2015, our total loan originations and purchases were $420.8 million and $231.3 million, respectively.
One-to-four family residential loans are generally originated in accordance with the guidelines established by Freddie Mac and Fannie Mae, with the exception of our special community development loans originated to satisfy compliance with the Community Reinvestment Act. Our loans are underwritten by designated real estate loan underwriters internally in accordance with standards as provided by our Board-approved loan policy. We require title insurance on all loans and fire and casualty insurance on all secured loans and home equity loans where real estate serves as collateral. Flood insurance is also required on all secured loans when the real estate is located in a flood zone.
The following table shows total loans originated, purchased, repaid and other changes during the periods indicated.
Year Ended December 31, | |||||||||||
2016 | 2015 | 2014 | |||||||||
(In thousands) | |||||||||||
Loan originations: | |||||||||||
Real estate: | |||||||||||
One-to-four family residential | $ | 59,222 | $ | 37,808 | $ | 35,834 | |||||
Multifamily | 22,914 | 44,579 | 25,417 | ||||||||
Commercial | 92,495 | 64,046 | 39,864 | ||||||||
Construction/land | 165,363 | 68,637 | 47,157 | ||||||||
Total real estate | 339,994 | 215,070 | 148,272 | ||||||||
Business | 13,998 | 11,050 | 3,556 | ||||||||
Consumer | 5,674 | 3,660 | 2,669 | ||||||||
Total loans originated | 359,666 | 229,780 | 154,497 | ||||||||
Loans purchased: | |||||||||||
One-to-four family residential | 7,352 | 1,368 | 10,513 | ||||||||
Multifamily | 11,761 | 195 | 2,468 | ||||||||
Commercial | 41,990 | — | — | ||||||||
Total loans purchased | 61,103 | 1,563 | 12,981 | ||||||||
Principal repayments | (271,768 | ) | (183,962 | ) | (149,557 | ) | |||||
Charge-offs | (83 | ) | (362 | ) | (642 | ) | |||||
Loans transferred to other real estate owned (“OREO”) | — | (141 | ) | (1,823 | ) | ||||||
Change in LIP, net deferred fees, and ALLL | (18,947 | ) | (25,744 | ) | (14,671 | ) | |||||
Net increase in loans | $ | 129,971 | $ | 21,134 | $ | 785 | |||||
Loan Origination and Other Fees. In some instances, we receive loan origination fees on real estate-related products. Loan fees generally represent a percentage of the principal amount of the loan and are paid by the borrower. The amount of fees charged to the borrower on one-to-four family residential loans and multifamily and commercial real estate loans can range from 0% to 2%. United States generally accepted accounting principles require that certain fees received, net of certain origination
14
costs, be deferred and amortized over the contractual life of the loan. Net deferred fees or costs associated with loans that are prepaid or sold are recognized in income at the time of prepayment or sale. We had $2.2 million and $2.9 million of net deferred loan fees at December 31, 2016, and 2015, respectively.
One-to-four family residential and consumer loans are generally originated without a prepayment penalty. The majority of our multifamily and commercial real estate loans, however, have prepayment penalties associated with the loans. Most of the multifamily and commercial real estate loan originations with interest rates fixed for the first five years will adjust thereafter and have a prepayment penalty of 2 - 3% of the principal balance in year one, with decreasing penalties in subsequent years. Longer initial fixed rate terms generally have correspondingly longer prepayment penalty periods.
Asset Quality
As of December 31, 2016, we had $473,000 of loans past due 30 days or more. These loans represented 0.1% of total loans, net of LIP, and consisted of two one-to-four family residential loans (all owner-occupied). We generally assess late fees or penalty charges on delinquent loans of up to 5.0% of the monthly payment. The borrower is given up to a 15 day grace period from the due date to make the loan payment.
We handle collection procedures internally or with the assistance of outside legal counsel. Late charges are incurred when the loan exceeds 10 to 15 days past due depending upon the loan product. When a delinquent loan is identified, corrective action takes place immediately. The first course of action is to determine the cause of the delinquency and seek cooperation from the borrower in resolving the issue. Additional corrective action, if required, will vary depending on the borrower, the collateral, if any, and whether the loan requires specific handling procedures as required by the Washington State Deed of Trust Act.
If the borrower is chronically delinquent and all reasonable means of obtaining payments have been exhausted, we will seek to foreclose on the collateral securing the loan according to the terms of the security instrument and applicable law. The following table shows our delinquent loans by the type of loan, net of LIP, and the number of days delinquent at December 31, 2016:
Loans Delinquent | Total | ||||||||||||||||||||||||||
30-59 Days | 60-89 Days | 90 Days and Greater | Delinquent Loans | ||||||||||||||||||||||||
Number of Loans | Principal Balance | Number of Loans | Principal Balance | Number of Loans | Principal Balance | Number of Loans | Principal Balance | ||||||||||||||||||||
(Dollars in thousands) | |||||||||||||||||||||||||||
Real estate: | |||||||||||||||||||||||||||
One-to-four family residential: | |||||||||||||||||||||||||||
Owner occupied | 1 | $ | 304 | — | $ | — | 1 | $ | 169 | 2 | $ | 473 | |||||||||||||||
Total | 1 | $ | 304 | — | $ | — | 1 | $ | 169 | 2 | $ | 473 | |||||||||||||||
Nonperforming Assets. The following table sets forth information with respect to our nonperforming assets and troubled debt restructured loans (“TDRs”) for the periods indicated. All loan balances and ratios are calculated using loan balances that are net of LIP.
15
December 31, | ||||||||||||||||||||
2016 | 2015 | 2014 | 2013 | 2012 | ||||||||||||||||
(Dollars in thousands) | ||||||||||||||||||||
Loans accounted for on a nonaccrual basis: | ||||||||||||||||||||
Real estate: | ||||||||||||||||||||
One-to-four family residential | $ | 798 | $ | 996 | $ | 830 | $ | 2,297 | $ | 6,248 | ||||||||||
Multifamily | — | — | — | 233 | 4,711 | |||||||||||||||
Commercial | — | — | 434 | 1,198 | 6,274 | |||||||||||||||
Construction/land | — | — | — | 223 | 4,767 | |||||||||||||||
Consumer | 60 | 89 | 75 | 44 | 759 | |||||||||||||||
Total loans accounted for on a nonaccrual basis | 858 | 1,085 | 1,339 | 3,995 | 22,759 | |||||||||||||||
Total nonperforming loans | 858 | 1,085 | 1,339 | 3,995 | 22,759 | |||||||||||||||
OREO | 2,331 | 3,663 | 9,283 | 11,465 | 17,347 | |||||||||||||||
Total nonperforming assets | $ | 3,189 | $ | 4,748 | $ | 10,622 | $ | 15,460 | $ | 40,106 | ||||||||||
TDRs: | ||||||||||||||||||||
Nonaccrual (1) | $ | 174 | $ | 131 | $ | — | $ | 968 | $ | 4,528 | ||||||||||
Performing | 30,083 | 42,128 | 54,241 | 60,170 | 65,848 | |||||||||||||||
Total TDRs | $ | 30,257 | $ | 42,259 | $ | 54,241 | $ | 61,138 | $ | 70,376 | ||||||||||
Nonperforming loans as a percent of total loans, net of LIP | 0.10 | % | 0.16 | % | 0.20 | % | 0.59 | % | 3.42 | % | ||||||||||
Nonperforming loans as a percent of total assets | 0.08 | 0.11 | 0.14 | 0.43 | 2.41 | |||||||||||||||
Nonperforming assets as a percent of total assets | 0.31 | 0.48 | 1.13 | 1.68 | 4.25 | |||||||||||||||
Total loans, net of LIP | $ | 828,161 | $ | 697,416 | $ | 677,033 | $ | 678,727 | $ | 665,067 | ||||||||||
Foregone interest on nonaccrual loans | 51 | 103 | 126 | 650 | 1,399 | |||||||||||||||
_______
(1) These loans are also included in the appropriate loan category above under the caption: “Loans accounted for on a nonaccrual basis.”
When a loan becomes 90 days past due, we generally place the loan on nonaccrual status unless the credit is well secured and in the process of collection. Loans may be placed on nonaccrual status prior to being 90 days past due if there is an identified problem such as an impending foreclosure or bankruptcy or if the borrower is unable to meet their scheduled payment obligations.
Our three largest nonperforming loans at December 31, 2016 were as follows:
• | A one-to-four family residential loan with an outstanding balance of $304,000 secured by an owner-occupied single family residence in Snohomish County. The purpose of this loan was to refinance an existing lien with improved terms. |
• | A one-to-four family residential loan with an outstanding balance of $169,000 secured by an owner-occupied single family residence in King County. The purpose of this loan was to refinance an existing lien with improved terms. |
• | A one-to-four family residential loan with an outstanding balance of $137,000 secured by an owner-occupied single family residence in Snohomish County. The purpose of this loan was to purchase a primary residence. |
We have reduced our nonperforming assets by $1.6 million during 2016, including a $1.4 million or 36.4% reduction in OREO and a $227,000 or 20.9% reduction in nonperforming loans at December 31, 2016, as compared to December 31, 2015. This reduction in nonperforming loans was accomplished through payoffs or principal payments of $308,000, and $72,000 in charge offs of uncollectible portions of loans partially offset by $153,000 of new additions to nonperforming loans. Because of our structure, we believe we are able to make decisions regarding offers on OREO and the real estate underlying our nonperforming loans very quickly compared to larger institutions where decisions could take six to twelve months. This distinction has worked to our benefit in reducing our nonperforming assets and disposing of OREO.
16
The following tables summarize our total nonperforming loans, net of LIP and OREO, at December 31, 2016, by county and by type of loan or property:
County | Total Nonperforming Loans | Number of Loans | Percent of Total Nonperforming Loans | |||||||||||||||||||||||||
King | Snohomish | Pierce | Kitsap | All Other | ||||||||||||||||||||||||
(Dollars in thousands) | ||||||||||||||||||||||||||||
Nonperforming loans: | ||||||||||||||||||||||||||||
One-to-four family residential | $ | 357 | $ | 441 | $ | — | $ | — | $ | — | $ | 798 | 6 | 93.0 | % | |||||||||||||
Consumer | 60 | — | — | — | — | 60 | 1 | 7.0 | ||||||||||||||||||||
Total nonperforming loans | $ | 417 | $ | 441 | $ | — | $ | — | $ | — | $ | 858 | 7 | 100.0 | % | |||||||||||||
County | Total OREO | Number of Properties | Percent of Total OREO | |||||||||||||||||||||||||
King | Snohomish | Pierce | Kitsap | All Other | ||||||||||||||||||||||||
(Dollars in thousands) | ||||||||||||||||||||||||||||
OREO: | ||||||||||||||||||||||||||||
Commercial real estate (1) | $ | — | $ | — | $ | 1,320 | $ | 506 | $ | 505 | $ | 2,331 | 5 | 100.0 | % | |||||||||||||
Total OREO | $ | — | $ | — | $ | 1,320 | $ | 506 | $ | 505 | $ | 2,331 | 5 | 100.0 | % | |||||||||||||
Total nonperforming assets | $ | 417 | $ | 441 | $ | 1,320 | $ | 506 | $ | 505 | $ | 3,189 | ||||||||||||||||
_______
(1) Of the five properties classified as commercial real estate, two are office/retail buildings and three are undeveloped lots.
Construction/land, commercial real estate, and multifamily loans have larger individual loan amounts that have a greater single impact on asset quality in the event of delinquency or default. We continue to monitor our loan portfolio and believe additions to nonperforming loans, charge-offs, provisions for loan losses, and/or OREO are possible in the future, particularly if the housing market and other economic conditions do not continue to improve.
Other Real Estate Owned. Real estate acquired by us as a result of foreclosure or by deed-in-lieu of foreclosure is classified as OREO until it is sold. When the property is acquired, it is recorded at the lower of its cost or the fair market value of the property, less selling costs. We had $2.3 million and $3.7 million of OREO at December 31, 2016 and 2015, respectively. At December 31, 2016, OREO consisted of five commercial real estate properties. Our special assets department’s primary focus is the prompt and effective management of our troubled, nonperforming assets, and expediting their disposition to minimize any potential losses. During 2016, we did not foreclose or accept deeds-in-lieu of foreclosure on any loans, while during 2015, we foreclosed on one $141,000 property. We anticipate continued foreclosure, deed-in-lieu of foreclosure, and short sale activity while we work with our nonperforming loan customers to minimize our loss exposure.
Troubled Debt Restructured Loans. We account for certain loan modifications or restructurings as TDRs. In general, the modification or restructuring of a debt is considered a TDR if, for economic or legal reasons related to the borrower’s financial difficulties, we grant a concession to the borrower that we would not otherwise consider. These loans are all considered to be impaired loans. At December 31, 2016, we had $30.3 million in TDRs as compared to $42.3 million at December 31, 2015.
Prior to 2012, we utilized a strategy for a limited number of our lending relationships of establishing an “A” and “B” note structure. We created an “A” note representing a reduced principal balance expected to be fully collected and at a debt service level and loan-to-value ratio acceptable to us. The “A” note was classified as a performing TDR as long as the borrower continued to perform in accordance with the note terms. The “B” note represented the amount of the principal reduction portion of the original note and was immediately charged-off. The “B” note is held by the Bank and when the “A” note is paid off, the Bank may proceed with collection efforts on the “B” note. At December 31, 2016, 99.4% of our TDRs were classified as performing compared to 99.7% at December 31, 2015. Of the $30.1 million of performing TDRs at December 31, 2016, $13.2 million were related to an “A” note as a result of an “A” and “B” note workout strategy.
The largest TDR relationship at December 31, 2016 totaled $9.2 million and was comprised of $8.5 million in one‑to‑four family residential loans secured by rental properties and a $754,000 owner occupied commercial property, all located in King County. At December 31, 2016, there was no LIP in connection with our TDRs. For additional information regarding our TDRs, see Note 3 of the Notes to Consolidated Financial Statements contained in Item 8 of this report.
17
The following table summarizes our total TDRs:
December 31, | |||||||
2016 | 2015 | ||||||
(In thousands) | |||||||
Nonperforming TDRs: | |||||||
One-to-four family residential | $ | 174 | $ | 131 | |||
Total nonperforming TDRs | 174 | 131 | |||||
Performing TDRs: | |||||||
One-to-four family residential | 24,274 | 35,099 | |||||
Multifamily | 1,564 | 1,594 | |||||
Commercial real estate | 4,202 | 5,392 | |||||
Consumer | 43 | 43 | |||||
Total performing TDRs | 30,083 | 42,128 | |||||
Total TDRs | $ | 30,257 | $ | 42,259 | |||
Classified Assets. Federal regulations provide for the classification of lower quality loans and other assets as substandard, doubtful or loss. An asset is considered substandard if it is inadequately protected by the current net worth and payment capacity of the borrower or of any collateral pledged. Substandard assets include those characterized by the distinct possibility that we will sustain some loss if the deficiencies are not corrected. Assets classified as doubtful have all the weaknesses inherent in those classified substandard with the added characteristic that the weaknesses present make collection or liquidation in full highly questionable and improbable, on the basis of currently existing facts, conditions and values. Assets classified as loss are those considered uncollectible and of such little value that their continuance as assets without the establishment of a specific loss reserve is not warranted.
When we classify problem assets as either substandard or doubtful, we may establish a specific allowance in an amount we deem prudent. General allowances represent loss allowances that have been established to recognize the inherent risk associated with lending activities, but unlike specific allowances, have not been specifically allocated to particular problem assets. When an insured institution classifies problem assets as a loss, it is required to charge-off those assets in the period in which they are deemed uncollectible. Our determinations as to the classification of our assets and the amount of our valuation allowances are subject to review by the FDIC and the DFI that can order the establishment of additional loss allowances or the charge-off of specific loans against established loss reserves. Assets that do not currently expose us to sufficient risk to warrant classification in one of the aforementioned categories but possess weaknesses are designated as special mention. At December 31, 2016, special mention loans totaled $6.1 million.
In connection with the filing of periodic reports with the FDIC and in accordance with our loan policy, we regularly review the problem loans in our portfolio to determine whether any loans require classification in accordance with applicable regulations. The decrease in our classified loans during the year ended December 31, 2016 was a result of loan charge-offs, loans transferred to OREO, and short sales, as well as our efforts to work with our borrowers to bring their loans current when possible or restructure the loan when appropriate. During 2016, we continued our aggressive approach to reduce nonperforming assets and improve asset quality.
Classified loans, net of LIP, consisting solely of substandard loans, were as follows at the dates indicated:
18
December 31, | |||||||
2016 | 2015 | ||||||
(In thousands) | |||||||
One-to-four family residential | $ | 1,351 | $ | 2,693 | |||
Multifamily | — | — | |||||
Commercial real estate | — | 496 | |||||
Construction/land | 495 | — | |||||
Consumer | 60 | 89 | |||||
Total classified loans | $ | 1,906 | $ | 3,278 | |||
With the exception of these classified loans, of which $858,000 were accounted for as nonaccrual loans at December 31, 2016, management is not aware of any loans as of December 31, 2016, where the known credit problems of the borrower would cause us to have serious doubts as to the ability of such borrowers to comply with their present loan repayment terms and which may result in the future inclusion of such loans in the nonperforming loan categories.
Allowance for Loan Losses. Management recognizes that loan losses may occur over the life of a loan and that the ALLL must be maintained at a level necessary to absorb specific losses on impaired loans and probable losses inherent in the loan portfolio. Our methodology for analyzing the ALLL consists of two components: general and specific allowances. The general allowance is determined by applying factors to our various groups of loans. Management considers factors such as charge-off history, the prevailing economy, the borrower’s ability to repay, the regulatory environment, competition, geographic and loan type concentrations, policy and underwriting standards, nature and volume of the loan portfolio, managements’ experience level, our loan review and grading systems, the value of underlying collateral, and the level of problem loans in assessing the ALLL. The specific allowance component is created when management believes that the collectability of a specific loan has been impaired and a loss is probable. The specific reserves are computed using current appraisals, listed sales prices and other available information, less costs to complete, if any, and costs to sell the property. This evaluation is inherently subjective as it requires estimates that are susceptible to significant revision as more information becomes available or as future events differ from predictions. In addition, specific reserves may be created upon a loan’s restructuring, based on a discounted cash flow analysis comparing the present value of the anticipated repayments under the restructured terms to the outstanding principal balance of the loan.
Quarterly, our Board of Directors’ Internal Asset Review Committee reviews and recommends approval of the allowance for loan losses and any provision or recapture of provision for loan losses, and the full Board of Directors approves the provision or recapture after considering the Committee’s recommendation. The allowance is increased by the provision for loan losses which is charged against current period earnings. If the analysis of our loan portfolio indicates the risk of loss is less than the balance of the ALLL, a recapture of provision of loan loss is added to current period earnings.
For the year ended December 31, 2016, we recorded a $1.3 million loan loss provision to our ALLL, as compared to recaptures of $2.2 million and $2.1 million for the years ended December 31, 2015 and 2014, respectively. The provision for loan losses in 2016 was primarily a result of the $129.9 million growth in net loans receivable. The quality of our loan portfolio continued to improve, as reflected in reductions in the levels of nonperforming loans, classified assets, and charge-offs, due primarily to our efforts working with our borrowers to bring their loan payments current when possible. When this option was not feasible, we promptly initiated foreclosure or deed-in-lieu of foreclosure proceedings. The ALLL was $11.0 million, or 1.3% of total loans net of LIP at December 31, 2016 as compared to $9.5 million, or 1.4% at December 31, 2015. The level of the ALLL is based on estimates and the ultimate losses may vary from the estimates. Management reviews the adequacy of the ALLL on a quarterly basis.
A loan is considered impaired when, based on current information and events, it is probable we will be unable to collect the scheduled payments of principal or interest when due, according to the contractual terms of the loan agreement. Factors considered by management in determining impairment include payment status, collateral value, market conditions, rent rolls, and the borrower’s and guarantor’s, if any, financial strength. Loans that experience insignificant payment delays and payment shortfalls generally are not classified as impaired. Management determines the significance of payment delays and shortfalls on a case‑by‑case basis, taking into consideration all of the circumstances surrounding the loan and the borrower, including length of the delay, the reasons for the delay, the borrower’s prior payment record and the amounts of the shortfall in relation to the principal and interest owed. Loans are evaluated for impairment on a loan-by-loan basis. As of December 31, 2016 and 2015, impaired loans were $30.9 million and $43.3 million, respectively. At December 31, 2016, there was no LIP in connection with our impaired loans.
19
The following table summarizes the distribution of the ALLL by loan category, at the dates indicated.
December 31, | ||||||||||||||||||||||||||||||||||||||||||||||||||||||
2016 | 2015 | 2014 | 2013 | 2012 | ||||||||||||||||||||||||||||||||||||||||||||||||||
Loan Balance | Allowance by Loan Category | Percent of Loans to Total Loans | Loan Balance | Allowance by Loan Category | Percent of Loans to Total Loans | Loan Balance | Allowance by Loan Category | Percent of Loans to Total Loans | Loan Balance | Allowance by Loan Category | Percent of Loans to Total Loans | Loan Balance | Allowance by Loan Category | Percent of Loans to Total Loans | ||||||||||||||||||||||||||||||||||||||||
Real estate: | (Dollars in thousands) | |||||||||||||||||||||||||||||||||||||||||||||||||||||
One-to-four family | ||||||||||||||||||||||||||||||||||||||||||||||||||||||
residential | $ | 249,435 | $ | 2,551 | 27.7 | % | $ | 253,772 | $ | 3,028 | 33.8 | % | $ | 273,193 | $ | 3,691 | 38.8 | % | $ | 280,674 | $ | 5,141 | 40.7 | % | $ | 306,851 | $ | 5,561 | 45.5 | % | ||||||||||||||||||||||||
Multifamily | 123,250 | 1,199 | 13.7 | 122,747 | 1,193 | 16.4 | 116,014 | 1,606 | 16.5 | 106,152 | 1,269 | 15.4 | 105,936 | 1,102 | 15.7 | |||||||||||||||||||||||||||||||||||||||
Commercial real estate | 303,694 | 3,893 | 33.7 | 244,211 | 3,395 | 32.5 | 239,211 | 4,476 | 34.0 | 227,016 | 5,101 | 33.0 | 207,436 | 4,365 | 30.8 | |||||||||||||||||||||||||||||||||||||||
Construction/land | 208,948 | 2,792 | 23.2 | 115,957 | 1,193 | 15.4 | 65,061 | 519 | 9.2 | 64,751 | 1,287 | 9.4 | 39,622 | 1,317 | 5.9 | |||||||||||||||||||||||||||||||||||||||
Total real estate | 885,327 | 10,435 | 98.3 | 736,687 | 8,809 | 98.1 | 693,479 | 10,292 | 98.5 | 678,593 | 12,798 | 98.5 | 659,845 | 12,345 | 97.9 | |||||||||||||||||||||||||||||||||||||||
Business | 7,938 | 237 | 0.9 | 7,604 | 229 | 1.0 | 3,783 | 47 | 0.5 | 1,142 | 14 | 0.2 | 2,968 | 30 | 0.4 | |||||||||||||||||||||||||||||||||||||||
Consumer | 6,922 | 279 | 0.8 | 6,979 | 425 | 0.9 | 7,130 | 152 | 1.0 | 9,201 | 182 | 1.3 | 11,110 | 167 | 1.7 | |||||||||||||||||||||||||||||||||||||||
Total | $ | 900,187 | $ | 10,951 | 100.0 | % | $ | 751,270 | $ | 9,463 | 100.0 | % | $ | 704,392 | $ | 10,491 | 100.0 | % | $ | 688,936 | $ | 12,994 | 100.0 | % | $ | 673,923 | $ | 12,542 | 100.0 | % | ||||||||||||||||||||||||
20
We believe that the ALLL as of December 31, 2016 was adequate to absorb the probable and inherent losses in the loan portfolio at that date. While we believe the estimates and assumptions used in our determination of the adequacy of the ALLL are reasonable, there can be no assurance that such estimates and assumptions will be proven correct in the future, or that the actual amount of future provisions will not exceed the amount of past provisions, or that any increased provisions that may be required will not adversely impact our financial condition and results of operations. Future additions to the ALLL may become necessary based upon changing economic conditions, the level of problem loans, business conditions, credit concentrations, increased loan balances or changes in the underlying collateral of the loan portfolio. In addition, the determination of the amount of the ALLL is subject to review by bank regulators as part of the routine examination process that may result in the establishment of additional loss reserves or the charge-off of specific loans against established loss reserves based upon their judgment of information available to them at the time of their examination.
The following table sets forth an analysis of our ALLL at the dates and for the periods indicated.
At or For the Year Ended December 31, | |||||||||||||||||||
2016 | 2015 | 2014 | 2013 | 2012 | |||||||||||||||
(Dollars in thousands) | |||||||||||||||||||
ALLL at beginning of period | $ | 9,463 | $ | 10,491 | $ | 12,994 | $ | 12,542 | $ | 16,559 | |||||||||
Provision (recapture of provision) for loan losses | 1,300 | (2,200 | ) | (2,100 | ) | (100 | ) | 3,050 | |||||||||||
Charge-offs: | |||||||||||||||||||
One-to-four family residential | — | (27 | ) | (78 | ) | (456 | ) | (2,229 | ) | ||||||||||
Multifamily | — | (281 | ) | — | (346 | ) | (153 | ) | |||||||||||
Commercial real estate | — | — | (311 | ) | (98 | ) | (6,088 | ) | |||||||||||
Construction/land | — | — | (223 | ) | (582 | ) | (630 | ) | |||||||||||
Business | — | — | — | (13 | ) | — | |||||||||||||
Consumer | (83 | ) | (54 | ) | (30 | ) | (101 | ) | (491 | ) | |||||||||
Total charge-offs | (83 | ) | (362 | ) | (642 | ) | (1,596 | ) | (9,591 | ) | |||||||||
Total recoveries | 271 | 1,534 | 239 | 2,148 | 2,524 | ||||||||||||||
Net recoveries (charge-offs) | 188 | 1,172 | (403 | ) | 552 | (7,067 | ) | ||||||||||||
ALLL at end of period | $ | 10,951 | $ | 9,463 | $ | 10,491 | $ | 12,994 | $ | 12,542 | |||||||||
ALLL as a percent of total loans, net of LIP | 1.32 | % | 1.36 | % | 1.55 | % | 1.91 | % | 1.89 | % | |||||||||
Net recoveries (charge-offs) to average loans receivable, net of LIP | 0.02 | 0.18 | (0.06 | ) | 0.08 | (1.07 | ) | ||||||||||||
ALLL as a percent of nonperforming loans, net of LIP | 1,276.34 | % | 872.17 | % | 783.50 | % | 325.26 | % | 55.11 | % | |||||||||
Investment Activities
General. Under Washington State law, commercial banks are permitted to invest in various types of liquid assets, including U.S. Treasury obligations, securities of various federal agencies, certain certificates of deposit of insured banks and savings institutions, banker’s acceptances, repurchase agreements, federal funds, commercial paper, investment grade corporate debt securities, and obligations of states and their political sub-divisions.
The Investment, Asset/Liability Committee (“ALCO”), consisting of the Chief Executive Officer, Chief Financial Officer, and Controller of First Financial Northwest Bank, other members of management and the Board of Directors, has the authority and responsibility to administer our investment policy, monitor portfolio strategies, and recommend appropriate changes to policy and strategies to the Board of Directors. On a monthly basis, management reports to the Board a summary of investment holdings with respective market values and all purchases and sales of investment securities. The Chief Financial Officer has the primary responsibility for the management of the investment portfolio and considers various factors when making decisions, including the marketability, maturity, liquidity, and tax consequences of proposed investments. The maturity structure of investments will be affected by various market conditions, including the current and anticipated slope of the yield curve, the level of interest rates, the trend of new deposit inflows, and the anticipated demand for funds via deposit withdrawals and loan originations and purchases.
21
The general objectives of the investment portfolio are to provide liquidity when loan demand is high, to assist in maintaining earnings when loan demand is low, and to maximize earnings while satisfactorily managing risk, including credit risk, reinvestment risk, liquidity risk and interest rate risk.
At December 31, 2016, our investment portfolio consisted principally of mortgage-backed securities, municipal bonds, U.S. government agency obligations, and corporate bonds. From time to time, investment levels may increase or decrease depending upon yields available on investment opportunities and management’s projected demand for funds for loan originations, net deposit flows, and other activities. At December 31, 2016, we did not hold securities of any single issuer (other than government-sponsored entities) that exceeded 10% of our shareholders’ equity.
Other than our utilization of interest rate swaps, we do not currently participate in other hedging programs, stand-alone contracts for interest rate caps or floors or other activities involving the use of off-balance sheet derivative financial instruments, and have no present intention to do so. As of December 31, 2016, we had invested in interest rate swaps with an aggregate notional amount of $50.0 million. At December 31, 2016, the fair value of our interest rate swaps was $1.3 million. For additional information, see Item 1A. Risk Factors -“If interest rate swaps we entered into prove ineffective, it could result in volatility in our operating results, including potential loses, which could have a material adverse effect on our results of operations and cash flows, Item 7. “Management’s Discussion and Analysis of Financial Condition and Results of Operations - Asset and Liability Management” and Note 10 of the Notes to Consolidated Financial Statements contained in Item 8. of this report.
Mortgage-Backed Securities. The mortgage-backed securities in our portfolio were comprised of Fannie Mae, Freddie Mac, and Ginnie Mae mortgage-backed securities. These issuers guarantee the timely payment of principal and interest in the event of default. The mortgage-backed securities had a weighted-average yield of 2.12% at December 31, 2016.
U.S. Government Agency Obligations. The agency securities in our portfolio were comprised of Fannie Mae, Freddie Mac, and FHLB agency securities. These issuers guarantee the timely payment of principal and interest in the event of default. At December 31, 2016, the portfolio of government agency securities had a weighted-average yield of 1.87%.
Ginnie Mae is part of a U.S. government agency and its guarantees are backed by the full faith and credit of the United States. Fannie Mae, Freddie Mac, and the Federal Home Loan Banks are U.S. government-sponsored entities. Although their guarantees are not backed by the full faith and credit of the United States, they may borrow from the U.S. Treasury, which has taken other steps to ensure these U.S. government-sponsored entities can fulfill their financial obligations.
Corporate Bonds. The corporate bond portfolio was primarily comprised of variable rate securities issued by various financial institutions. At December 31, 2016, the corporate bond portfolio had a weighted-average yield of 4.33%.
Municipal Bonds. The municipal bond portfolio is comprised of both taxable and tax-exempt municipal bonds. The pre-tax weighted-average yield on the municipal bond portfolio was 2.70% at December 31, 2016.
Federal Home Loan Bank Stock. As a member of the FHLB Des Moines, we are required to own capital stock. The required amount of capital stock is based on a percentage of our previous year-end assets and our outstanding FHLB advances. The redemption of any excess stock we hold is at the discretion of the FHLB Des Moines. During 2016, our FHLB stock holdings increased by $1.9 million primarily as a result of the $46.0 million increase in our FHLB advances during 2016. The carrying value of our FHLB stock totaled $8.0 million at December 31, 2016. During the years ended December 31, 2016 and 2015, we received FHLB cash dividends of $202,000 and $69,000, respectively.
The following table sets forth the composition of our investment portfolio at the dates indicated.
22
December 31, | |||||||||||||||||||||||
2016 | 2015 | 2014 | |||||||||||||||||||||
Amortized Cost | Fair Value | Amortized Cost | Fair Value | Amortized Cost | Fair Value | ||||||||||||||||||
(In thousands) | |||||||||||||||||||||||
Available-for-sale: | |||||||||||||||||||||||
Mortgage-backed securities: | |||||||||||||||||||||||
Fannie Mae | $ | 42,060 | $ | 41,332 | $ | 50,288 | $ | 50,321 | $ | 40,083 | $ | 40,916 | |||||||||||
Freddie Mac | 18,013 | 18,009 | 26,011 | 26,137 | 21,442 | 21,946 | |||||||||||||||||
Ginnie Mae | 19,133 | 18,634 | 13,802 | 13,732 | 26,049 | 26,013 | |||||||||||||||||
Tax-exempt municipal bonds | 13,083 | 12,987 | 11,231 | 11,507 | — | — | |||||||||||||||||
Taxable municipal bonds | 120 | 120 | 556 | 557 | 642 | 644 | |||||||||||||||||
U.S. government agencies | 15,937 | 15,857 | 13,541 | 13,542 | 16,863 | 16,816 | |||||||||||||||||
Corporate bonds | 22,506 | 22,321 | 14,010 | 13,769 | 14,061 | 14,039 | |||||||||||||||||
Total available-for-sale | $ | 130,852 | $ | 129,260 | $ | 129,439 | $ | 129,565 | $ | 119,140 | $ | 120,374 | |||||||||||
At December 31, 2016, 2015, and 2014 there were no investments held to maturity.
During the year ended December 31, 2016, gross proceeds from the call and sale of investments was $26.4 million, with net realized gains of $50,000.
Management reviews investment securities on an ongoing basis for the presence of other than temporary impairment (“OTTI”) or permanent impairment, taking into consideration current market conditions, fair value in relationship to cost, extent and nature of the change in fair value, issuer rating changes and trends, whether management intends to sell a security or if it is likely that we will be required to sell the security before recovery of the amortized cost basis of the investment, which may be maturity, and other factors. For debt securities, if management intends to sell the security or it is likely that we will be required to sell the security before recovering its cost basis, the entire impairment loss would be recognized in earnings as an OTTI. If management does not intend to sell the security and it is not likely that we will be required to sell the security, but management does not expect to recover the entire amortized cost basis of the security, only the portion of the impairment loss representing credit losses would be recognized in earnings. The credit loss on a security is measured as the difference between the amortized cost basis and the present value of the cash flows expected to be collected. Projected cash flows are discounted by the original or current effective interest rate, depending on the nature of the security being measured for potential OTTI. The remaining impairment related to all other factors, the difference between the present value of the cash flows expected to be collected and fair value, is recognized as a charge to other comprehensive income (loss). Impairment losses related to all other factors are presented as separate categories within other comprehensive income (loss). There were no losses related to OTTI at December 31, 2016 and 2015. For additional information regarding our investments, see Note 2 of the Notes to Consolidated Financial Statements contained in Item 8 of this report.
23
The table below sets forth information regarding the carrying value and weighted-average yield by contractual maturity of our investment portfolio at December 31, 2016. Mortgage-backed securities have no stated maturity date and are included in the totals column only.
December 31, 2016 | ||||||||||||||||||||||||||||||||||
Within One Year | After One Year Through Five Years | After Five Through Ten Years | Thereafter | Totals | ||||||||||||||||||||||||||||||
Carrying Value | Weighted- Average Yield | Carrying Value | Weighted- Average Yield | Carrying Value | Weighted- Average Yield | Carrying Value | Weighted- Average Yield | Carrying Value | Weighted- Average Yield | |||||||||||||||||||||||||
(Dollars in thousands) | ||||||||||||||||||||||||||||||||||
Available-for-sale: | ||||||||||||||||||||||||||||||||||
Mortgage-backed securities | $ | — | — | % | $ | — | — | % | $ | — | — | % | $ | — | — | % | $ | 77,975 | 2.12 | % | ||||||||||||||
Municipal bonds | — | — | — | — | 2,130 | 2.14 | 10,977 | 3.05 | 13,107 | 2.70 | ||||||||||||||||||||||||
U.S. Government agencies | 510 | 0.86 | 3,837 | 1.37 | 5,535 | 2.01 | 5,975 | 2.15 | 15,857 | 1.87 | ||||||||||||||||||||||||
Corporate bonds | — | — | 5,018 | 1.75 | 15,940 | 5.17 | 1,363 | 4.00 | 22,321 | 4.33 | ||||||||||||||||||||||||
Total available-for-sale | $ | 510 | 0.86 | % | $ | 8,855 | 1.59 | % | $ | 23,605 | 4.18 | % | $ | 18,315 | 2.83 | % | $ | 129,260 | 2.53 | % | ||||||||||||||
24
Deposit Activities and Other Sources of Funds
General. Deposits and loan repayments are the major sources of our funds for lending and other investment purposes. Scheduled loan repayments are a relatively stable source of funds, while deposit inflows and outflows and loan prepayments are influenced significantly by general interest rates and market conditions. Borrowings from the FHLB are used to supplement the availability of funds from other sources and also as a source of term funds to assist in the management of interest rate risk.
Our deposit composition reflects a mixture of various deposit products. We rely on marketing activities, customer service, and the availability of a broad range of products and services to attract and retain customer deposits.
Deposits. We offer a competitive range of deposit products within our market area, including noninterest bearing accounts, interest-bearing demand accounts, money market deposit accounts, statement savings accounts, and certificates of deposit. Deposit account terms vary according to the minimum balance required, the time periods the funds must remain on deposit, and the interest rate, among other factors. In determining the terms of our deposit accounts, we consider the development of long-term profitable customer relationships, current market interest rates, current maturity structures, deposit mix, our customer preferences, and the profitability of acquiring customer deposits compared to alternative funding sources. As part of our strategy to shift our deposit mix to lower cost funds, we continued to better align our pricing with competitors in our local market to meet our goals. To supplement local deposits, funds are also generated through national brokered certificates of deposit. At December 31, 2016, $75.5 million, or 10.5% of total deposits were brokered certificates of deposit, with remaining maturities ranging from 1.5 to four years. These funds cannot be withdrawn early except in the case of the death or adjudication of incompetence of the depositor. However, the Bank has a quarterly call option six months after issuance on $56.4 million of these brokered deposits that allows the Bank to close the certificate of deposit and return the deposit to the customer if the Bank determines it is in its best interest to do so. The longer term nature of these brokered deposits, along with the enhanced features of these deposits as compared to retail certificates of deposit, assists us in our interest rate risk management efforts.
The following table sets forth our total deposit activity for the periods indicated.
Year Ended December 31, | |||||||||||
2016 | 2015 | 2014 | |||||||||
(In thousands) | |||||||||||
Total deposits, beginning balance | $ | 675,407 | $ | 614,127 | $ | 612,065 | |||||
Increase (decrease) in retail deposits | 32,732 | 49,558 | (52,367 | ) | |||||||
Increase in brokered funds | 9,337 | 11,722 | 54,429 | ||||||||
Net increase in deposits | 42,069 | 61,280 | 2,062 | ||||||||
Total deposits, ending balance | $ | 717,476 | $ | 675,407 | $ | 614,127 | |||||
At December 31, 2016, deposits totaled $717.5 million. We had $265.2 million of jumbo (greater than or equal to $100,000) certificates of deposit, which were 37.0% of total deposits at December 31, 2016. Of these jumbo deposits, $91.2 million were greater than or equal to $250,000. At that date, included in the jumbo certificates of deposit, were public funds totaling $23.7 million, or 3.3% of total deposits, of which $22.9 million was in excess of the $250,000 standard FDIC insurance coverage. Under Washington State law, in order to participate in the public funds program, we are required to pledge eligible securities of a minimum of 50% of the public deposits in excess of $250,000.
25
The following table sets forth information regarding our certificates of deposit and other deposits at December 31, 2016.
Weighted-Average Interest Rate | Term | Category | Amount | Percentage of Total Deposits | ||||||||
(Dollars in thousands) | ||||||||||||
— | % | N/A | Noninterest bearing demand deposits | $ | 33,422 | 4.7 | % | |||||
0.32 | N/A | Interest-bearing demand | 18,532 | 2.6 | ||||||||
0.16 | N/A | Statement savings | 28,383 | 4.0 | ||||||||
0.50 | N/A | Money market (1) | 204,998 | 28.6 | ||||||||
Certificates of deposit, retail | ||||||||||||
0.10 | Three months or less | 619 | 0.1 | |||||||||
0.43 | Over three through six months | 2,725 | 0.4 | |||||||||
0.69 | Over six through twelve months | 31,663 | 4.4 | |||||||||
1.26 | Over twelve months | 321,646 | 44.7 | |||||||||
1.20 | Total certificates of deposit, retail | 356,653 | 49.6 | |||||||||
1.49 | Over twelve months | Certificates of deposit, brokered | 75,488 | 10.5 | ||||||||
Total deposits | $ | 717,476 | 100.0 | % | ||||||||
_______________
(1) Money market funds include $8.5 million of developer construction accounts that are part of the EB-5 Immigrant Investor Program with the balance expected to be withdrawn during 2017. For more information see “If limitations arise in our ability to utilize the national brokered deposit market or to replace short-term deposits, our ability to replace maturing deposits on acceptable terms could be adversely impacted” and “Non-compliance with the USA PATRIOT Act, Bank Secrecy Act, or other laws and regulations could result in fines or sanctions” in Item 1.A. Risk Factors contained in this report.
Certificates of Deposit. The following table sets forth the amount and maturities of certificates of deposit at December 31, 2016.
Within One Year | After One Year Through Two Years | After Two Years Through Three Years | After Three Years Through Four Years | Thereafter | Total | ||||||||||||||||||
(In thousands) | |||||||||||||||||||||||
0.00 - 1.00% | $ | 94,299 | $ | 27,297 | $ | 3,113 | $ | 1,039 | $ | — | $ | 125,748 | |||||||||||
1.01 - 2.00% | 71,579 | 77,951 | 104,869 | 27,320 | 20,753 | 302,472 | |||||||||||||||||
2.01 - 3.00% | — | — | — | 641 | 3,144 | 3,785 | |||||||||||||||||
5.01 - 6.00% | 136 | — | — | — | — | 136 | |||||||||||||||||
Total | $ | 166,014 | $ | 105,248 | $ | 107,982 | $ | 29,000 | $ | 23,897 | $ | 432,141 | |||||||||||
The following table sets forth the amount of our jumbo certificates of deposit by remaining maturity as of December 31, 2016.
Maturity Period | Certificates of Deposit | |||
(In thousands) | ||||
Three months or less | $ | 31,688 | ||
Over three months through six months | 27,836 | |||
Over six months through twelve months | 61,260 | |||
Over twelve months | 144,423 | |||
Total | $ | 265,207 | ||
26
Deposit Flow. The following table sets forth the deposit balances by the types of accounts we offered at the dates indicated.
December 31, | ||||||||||||||||||||
2016 | 2015 | 2014 | ||||||||||||||||||
Amount | Percent of Total | Amount | Percent of Total | Amount | Percent of Total | |||||||||||||||
(Dollars in thousands) | ||||||||||||||||||||
Noninterest bearing | $ | 33,422 | 4.7 | % | $ | 29,392 | 4.4 | % | $ | 14,354 | 2.3 | % | ||||||||
Interest-bearing demand | 18,532 | 2.5 | 16,261 | 2.4 | 20,752 | 3.4 | ||||||||||||||
Statement savings | 28,383 | 4.0 | 28,327 | 4.2 | 23,901 | 3.9 | ||||||||||||||
Money market (1) | 204,998 | 28.6 | 211,436 | 31.3 | 142,532 | 23.2 | ||||||||||||||
Certificates of deposit, retail: | ||||||||||||||||||||
0.00 - 1.00% | 124,710 | 17.4 | 154,011 | 22.8 | 210,297 | 34.3 | ||||||||||||||
1.01 - 2.00% | 228,458 | 31.8 | 169,494 | 25.1 | 147,672 | 24.1 | ||||||||||||||
2.01 - 3.00% | 3,349 | 0.5 | 206 | — | 67 | — | ||||||||||||||
3.01 - 4.00% | — | — | — | — | 123 | — | ||||||||||||||
5.01 - 6.00% | 136 | — | 129 | — | — | — | ||||||||||||||
Total certificates of deposit, retail | 356,653 | 49.7 | 323,840 | 47.9 | 358,159 | 58.4 | ||||||||||||||
Certificates of deposit, brokered | ||||||||||||||||||||
0.00 - 1.00% | 1,038 | 0.1 | — | — | — | — | ||||||||||||||
1.01 - 2.00% | 74,014 | 10.3 | 65,715 | 9.7 | 33,126 | 5.3 | ||||||||||||||
2.01 - 3.00% | 436 | 0.1 | 436 | 0.1 | 21,303 | 3.5 | ||||||||||||||
Total certificates of deposit, brokered | 75,488 | 10.5 | 66,151 | 9.8 | 54,429 | 8.8 | ||||||||||||||
Total deposits | $ | 717,476 | 100.0 | % | $ | 675,407 | 100.0 | % | $ | 614,127 | 100.0 | % | ||||||||
_______________
(1) Money market funds include $8.5 million of developer construction accounts that are part of the EB-5 Immigrant investor Program with the balance expected to be withdrawn during 2017. For more information see “If limitations arise in our ability to utilize the national brokered deposit market or to replace short-term deposits, our ability to replace maturing deposits on acceptable terms could be adversely impacted” and “Non-compliance with the USA PATRIOT Act, Bank Secrecy Act, or other laws and regulations could result in fines or sanctions” in Item 1.A. Risk Factors contained in this report.
Borrowings. Customer deposits are the primary source of funds for our lending and investment activities. We use advances from the FHLB to supplement our supply of lendable funds, to meet short-term deposit withdrawal requirements and to provide longer term funding to better match the duration of selected loan and investment maturities. In addition, at December 31, 2016 we had available a total of $35.0 million lines of credit between two other financial institutions as supplemental funding sources.
As a member of the FHLB, we are required to own capital stock in the FHLB and are authorized to apply for advances on the security of that stock and certain of our mortgage loans, provided that certain creditworthiness standards have been met. Advances are individually made under various terms pursuant to several different credit programs, each with its own interest rate and range of maturities. Depending on the program, limitations on the amount of advances are based on the financial condition of the member institution and the adequacy of collateral pledged to secure the credit. We maintain a credit facility with the FHLB that provides for immediately available advances, subject to acceptable collateral. At December 31, 2016, our remaining FHLB credit capacity was $203.6 million and outstanding advances from the FHLB totaled $171.5 million.
27
The following table sets forth information regarding FHLB advances at the end of and during the periods indicated. The table includes both long- and short-term borrowings.
At or for the Year Ended December 31, | |||||||||||
2016 | 2015 | 2014 | |||||||||
(Dollars in thousands) | |||||||||||
Maximum amount of borrowings outstanding at any month end | $ | 251,500 | $ | 135,500 | $ | 135,500 | |||||
Average borrowings outstanding | 163,893 | 133,527 | 128,839 | ||||||||
Weighted-average rate paid | 0.87 | % | 0.94 | % | 0.91 | % | |||||
Balance outstanding at end of the year | $ | 171,500 | $ | 125,500 | $ | 135,500 | |||||
Weighted-average rate paid at end of the year | 0.87 | % | 0.97 | % | 0.95 | % | |||||
Subsidiaries and Other Activities
First Financial Northwest, Inc. First Financial Northwest has two wholly-owned subsidiaries, First Financial Northwest Bank and First Financial Diversified Corporation. First Financial Diversified Corporation currently holds a loan portfolio of one‑to-four family residential, commercial real estate, business, and consumer loans. At December 31, 2016, First Financial Diversified’s net loans receivable of $2.4 million represented less than one percent of the Company’s loan portfolio.
First Financial Northwest Bank. First Financial Northwest Bank is a community-based commercial bank. The Bank primarily serves the greater Puget Sound region of King and to a lesser extent, Pierce, Snohomish and Kitsap Counties, Washington through our full-service banking office and one branch located in Renton, Washington and additional branch offices in Mill Creek and Edmonds, Washington. We are in the business of attracting deposits from the public and utilizing those deposits to originate loans.
Competition
We face competition in originating loans and attracting deposits within our geographic market area. We compete by consistently delivering high-quality personal service to our customers that results in a high level of customer satisfaction.
Based on the most current FDIC market share data dated June 30, 2016, the Bank ranked 16th in terms of deposits in King County with a market share of 0.91% among the 42 FDIC insured depository institutions located in King County that accept deposits. The top five banks in the market (comprised of Bank of America, Wells Fargo Bank, JP Morgan Chase, US Bank and KeyBank) controlled 74.5% of the King County deposit market with deposits of $56.9 billion out of the $76.4 billion total for the county. Recently the Bank opened two branches in Snohomish County. At June 30, 2016, the Bank ranked 24th in total deposits in Snohomish County with a market share of 0.17% with a ranking of 24th out of 24 FDIC institutions operating in the county. The top five commercial banks in the market (comprised of Bank of America, JP Morgan Chase, Wells Fargo, US Bancorp and Mitsubishi FFJ Financial) controlled 60.9% of the Snohomish County deposit market with deposits of $6.6 billion out of the $10.8 billion total for the county. In addition to the FDIC insured competitors, credit unions, insurance companies and brokerage firms also compete for consumer deposit relationships.
Our competition for loans comes principally from commercial banks, mortgage brokers, thrift institutions, credit unions and finance companies. Several other financial institutions, including those previously mentioned, compete with us for banking business in our market area. These institutions may have substantially more resources than the Bank and, as a result, be able to offer a broader range of services, such as trust departments and enhanced retail services. Among the advantages of some of these institutions are their ability to make larger loans, initiate extensive advertising campaigns, access lower cost funding sources, and allocate their investable assets in regions of highest yield and demand. The challenges posed by such large competitors may impact our ability to originate loans, secure low cost deposits and establish product pricing levels that support our net interest margin goals and may limit our future growth and earnings potential. In addition, for aircraft financings, we also expect to compete with specialty leasing companies, including aircraft leasing companies.
Employees
At December 31, 2016, we had 121 full-time employees. Our employees are not represented by any collective bargaining group. We consider our employee relations to be good.
28
How We Are Regulated
The following is a brief description of certain laws and regulations that are applicable to First Financial Northwest and First Financial Northwest Bank. On March 31, 2015, First Financial Northwest rescinded the 10(1) election made by First Financial Northwest Bank and converted from a registered savings and loan holding company to a bank holding company. As a bank holding company, First Financial Northwest is subject to examination and supervision by, and is required to file certain reports with, the FRB. First Financial Northwest also is subject to the rules and regulations of the SEC under the federal securities laws. First Financial Northwest Bank, which changed its charter from a Washington-chartered savings bank to a Washington-chartered commercial bank effective on February 11, 2016, is subject to regulation and oversight by the DFI, the applicable provisions of Washington law and by the regulations of the DFI adopted thereunder. First Financial Northwest Bank also is subject to regulation and examination by the FDIC, which insures its deposits to the maximum extent permitted by law.
The laws and regulations affecting depository institutions and their holding companies have changed significantly, particularly in connection with the enactment of The Dodd-Frank Wall Street Reform and Consumer Protection Act of 2010 (“Dodd-Frank Act”). Among other changes, the Dodd-Frank Act established the Consumer Financial Protection Bureau (“CFPB”) as an independent bureau of the FRB. The CFPB assumed responsibility for the implementation of the federal financial consumer protection and fair lending laws and regulations and has authority to impose new requirements. In addition, the regulations governing us may be amended from time to time by the respective regulators. Any such legislation or regulatory changes in the future could adversely affect us. We cannot predict whether any such changes may occur.
Regulation and Supervision of First Financial Northwest Bank
General. As a state-chartered commercial bank, First Financial Northwest Bank is subject to applicable provisions of Washington state law and regulations of the DFI. State law and regulations govern First Financial Northwest Bank’s ability to take deposits and pay interest, to make loans on or invest in residential and other real estate, to make consumer loans, to invest in securities, to offer various banking services to its customers and to establish branch offices. Under state law, commercial banks in Washington also generally have all of the powers that federal commercial banks have under federal laws and regulations. First Financial Northwest Bank is subject to periodic examination and reporting requirements by and of the DFI.
Insurance of Accounts and Regulation by the FDIC. First Financial Northwest Bank’s deposits are insured up to $250,000 per separately insured depositor by the Deposit Insurance Fund of the FDIC. As insurer, the FDIC imposes deposit insurance premiums and is authorized to conduct examinations of, and to require reporting by, FDIC-insured institutions. The FDIC also may prohibit any insured institution from engaging in any activity the FDIC determines by regulation or order to pose a serious risk to the deposit insurance fund. The FDIC also has the authority to initiate enforcement actions against commercial institutions and may terminate the deposit insurance if it determines that the institution has engaged in unsafe or unsound practices or is in an unsafe or unsound condition.
The Dodd-Frank Act requires the FDIC’s deposit insurance assessments to be based on assets instead of deposits. The FDIC has issued rules which specify that the assessment base for a bank is equal to its total average consolidated assets less average tangible equity capital. As of June 30, 2016, the FDIC reserve ratio reached 1.15%, thereby reducing the initial base assessment rates from 5 to 35 basis points to 3 to 30 basis points. The assessment rates are subject to adjustment for unsecured debt, however the previous brokered deposit adjustment has been eliminated. The new pricing system for small institutions replaced the use of risk categories with the Financial Ratios Method to determine assessment rates. This method is based on statistical modeling that estimates the probability of failure over three years. No institution may pay a dividend if it is in default on its federal deposit insurance assessment.
In addition, federally insured institutions are required to pay a Financing Corporation (“FICO”) assessment in order to fund the interest on bonds issued to resolve thrift failures in the 1980s. At December 31, 2016, the FICO assessment equaled 0.56 basis points of the assessment base, computed on assets. These assessments will continue until the bonds mature in the years 2017 through 2019. For 2016, the Bank incurred approximately $420,000 in FDIC and FICO assessments.
The FDIC may terminate the deposit insurance of any insured depository institution, including First Financial Northwest Bank, if it determines after a hearing that the institution has engaged or is engaging in unsafe or unsound practices, is in an unsafe or unsound condition to continue operations or has violated any applicable law, regulation, rule, order or any condition imposed by an agreement with the FDIC. It also may suspend deposit insurance temporarily during the hearing process for the permanent termination of insurance if the institution has no tangible capital. If insurance of accounts is terminated, the accounts at the institution at the time of the termination, less subsequent withdrawals, shall continue to be insured for a period of six months to two years, as determined by the FDIC. We are not aware of any practice, condition or violation that might lead to termination of First Financial Northwest Bank’s deposit insurance.
29
A significant increase in insurance premiums would likely have an adverse effect on the operating expenses and results of operations of the Bank. There can be no prediction as to what changes in insurance assessment rates may be made in the future.
Standards for Safety and Soundness. The federal banking regulatory agencies have prescribed, by regulation, guidelines for all insured depository institutions relating to: internal controls, information systems and internal audit systems, loan documentation, credit underwriting, interest rate risk exposure, asset growth, asset quality, earnings and compensation, fees and benefits. The guidelines set forth the safety and soundness standards that the federal banking agencies use to identify and address problems at insured depository institutions before capital becomes impaired. Each insured depository institution must implement a comprehensive written information security program that includes administrative, technical and physical safeguards appropriate to the institution’s size and complexity and the nature and scope of its activities. The information security program also must be designed to ensure the security and confidentiality of customer information, protect against any unanticipated threats or hazards to the security or integrity of such information, protect against unauthorized access to or use of such information that could result in substantial harm or inconvenience to any customer and ensure the proper disposal of customer and consumer information. Each insured depository institution must also develop and implement a risk-based response program to address incidents of unauthorized access to customer information in customer information systems. If the FDIC determines that an institution fails to meet any of these guidelines, it may require an institution to submit to the FDIC an acceptable plan to achieve compliance. We are not aware of any conditions relating to these safety and soundness standards that would require submission of a plan of compliance by First Financial Northwest Bank.
Capital Requirements. Federally insured financial institutions, such as First Financial Northwest Bank, are required to maintain a minimum level of regulatory capital.
Effective January 1, 2015 (with some changes transitioned into full effectiveness over two to four years), First Financial Northwest Bank became subject to new capital regulations adopted by the FRB and the FDIC, which create a new required ratio for common equity Tier 1 (“CET1”) capital, increase the minimum leverage and Tier 1 capital ratios, change the risk-weightings of certain assets for purposes of the risk-based capital ratios, create an additional capital conservation buffer over the required capital ratios, and change what qualifies as capital for purposes of meeting the capital requirements. These regulations implement the regulatory capital reforms required by the Dodd-Frank Act and the “Basel III” requirements.
Under the new capital regulations, the minimum capital ratios are: (1) a CET1 capital ratio of 4.5% of risk-weighted assets; (2) a Tier 1 capital ratio of 6.0% of risk-weighted assets; (3) a total risk-based capital ratio of 8.0% of risk-weighted assets; and (4) a leverage ratio (the ratio of Tier 1 capital to average total adjusted assets) of 4.0%. CET1 generally consists of common stock, retained earnings, accumulated other comprehensive income (“AOCI”) unless an institution elects to exclude AOCI from regulatory capital, and certain minority interests, all subject to applicable regulatory adjustments and deductions. Tier 1 capital generally consists of CET1 and noncumulative perpetual preferred stock. Tier 2 capital generally consists of other preferred stock and subordinated debt meeting certain conditions plus an amount of the allowance for loan and lease losses up to 1.25% of assets. Total capital is the sum of Tier 1 and Tier 2 capital.
There are a number of changes in what constitutes regulatory capital compared to the rules in effect prior to January 1, 2015, some of which are subject to transition periods. These changes include the phasing-out of certain instruments as qualifying capital and eliminate or significantly reduce the use of hybrid capital instruments, especially trust preferred securities, as regulatory capital. Mortgage servicing assets and deferred tax assets over designated percentages of CET1 will be deducted from capital. In addition, Tier 1 capital includes AOCI, which includes all unrealized gains and losses on available for sale debt and equity securities. However, because of our asset size, we are eligible for the one-time option of permanently opting out of the inclusion of unrealized gains and losses on available for sale debt and equity securities in our capital calculations. We elected this option in the first quarter of 2015.
For purposes of determining risk-based capital, assets and certain off-balance sheet items are risk-weighted from 0% to 1,250%, depending on the risk characteristics of the asset or item. The new regulations make certain changes in the risk-weighting of assets to better reflect credit risk and other risk exposure compared to the earlier capital rules. These include a 150% risk weight (up from 100%) for certain high volatility commercial real estate acquisition, development and construction loans and for non‑residential mortgage loans that are 90 days past due or otherwise in nonaccrual status; a 20% (up from 0%) credit conversion factor for the unused portion of a commitment with an original maturity of one year or less that is not unconditionally cancellable (currently set at 0%); and a 250% risk weight (up from 100%) for mortgage servicing and deferred tax assets that are not deducted from capital.
In addition to the minimum CET1, Tier 1, leverage ratio and total capital ratios, First Financial Northwest Bank must maintain a capital conservation buffer consisting of additional CET1 capital above the required minimum levels in order to avoid
30
limitations on paying dividends, repurchasing shares, and paying discretionary bonuses. This new capital conservation buffer requirement began to be phased in starting in January 2016 at 0.625% of risk-weighted assets and will increase each year until fully implemented to an amount equal to 2.5% of risk-weighted assets in January 2019.
To be consider “well capitalized,” a depository institution must have a Tier 1 risk-based capital ratio of at least 8%, a total risk-based capital ratio of at least 10%, a CET1 capital ratio of at least 5% and a leverage ratio of at least 5% and not be subject to an individualized order, directive or agreement under which its primary federal banking regulator requires it to maintain a specific capital level. As of December 31, 2016, First Financial Northwest Bank met the requirements to be “well capitalized” and met the fully phased-in capital conservation buffer requirement.
The table below sets forth First Financial Northwest Bank’s capital position at December 31, 2016 and 2015, based on FDIC thresholds to be well-capitalized.
December 31, | |||||||||||||
2016 | 2015 | ||||||||||||
Amount | Ratio | Amount | Ratio | ||||||||||
(Dollars in thousands) | |||||||||||||
Bank equity capital under U.S. Generally Accepted Accounting Principles (“GAAP”) | $ | 118,346 | $ | 112,404 | |||||||||
Tier 1 leverage capital | $ | 119,652 | 11.17 | % | $ | 112,613 | 11.61 | % | |||||
Tier 1 leverage capital requirement | 53,558 | 5.00 | 48,484 | 5.00 | |||||||||
Excess | $ | 66,094 | 6.17 | % | $ | 64,129 | 6.61 | % | |||||
Common equity tier 1 | $ | 119,652 | 14.36 | % | $ | 112,613 | 16.36 | % | |||||
Common equity tier 1 capital requirement | 54,163 | 6.50 | 44,735 | 6.50 | |||||||||
Excess | $ | 65,489 | 7.86 | % | $ | 67,878 | 9.86 | % | |||||
Tier 1 risk-based capital | $ | 119,652 | 14.36 | % | $ | 112,613 | 16.36 | % | |||||
Tier 1 risk-based capital requirement | $ | 66,662 | 8.00 | % | $ | 55,058 | 8.00 | % | |||||
Excess | $ | 52,990 | 6.36 | % | $ | 57,555 | 8.36 | % | |||||
Total risk-based capital | $ | 130,078 | 15.61 | % | $ | 121,238 | 17.62 | % | |||||
Total risk-based capital requirement | 83,328 | 10.00 | 68,823 | 10.00 | |||||||||
Excess | $ | 46,750 | 5.61 | % | $ | 52,415 | 7.62 | % | |||||
The FDIC also has authority to establish individual minimum capital requirements in appropriate cases upon a determination that an institution’s capital level is or may become inadequate in light of particular risks or circumstances. Management of First Financial Northwest Bank believes that, under the current regulations, First Financial Northwest Bank will continue to meet its minimum capital requirements in the foreseeable future.
For a complete description of First Financial Northwest Bank’s required and actual capital levels on December 31, 2016, see Note 12 of the Notes to Consolidated Financial Statements contained in Item 8 of this report.
Prompt Corrective Action. Federal statutes establish a supervisory framework for FDIC-insured institutions based on five capital categories: well capitalized, adequately capitalized, undercapitalized, significantly undercapitalized and critically undercapitalized. An institution’s category depends upon where its capital levels are in relation to relevant capital measures. The well-capitalized category is described above. An institution that is not well capitalized is subject to certain restrictions on brokered deposits, including restrictions on the rates it can offer on its deposits, generally. To be considered adequately capitalized, an institution must have the minimum capital ratios described above. Any institution which is neither well capitalized nor adequately capitalized is considered undercapitalized.
Undercapitalized institutions are subject to certain prompt corrective action requirements, regulatory controls and restrictions which become more extensive as an institution becomes more severely undercapitalized. Failure by First Financial
31
Northwest Bank to comply with applicable capital requirements would, if unremedied, result in progressively more severe restrictions on its activities and lead to enforcement actions, including, but not limited to, the issuance of a capital directive to ensure the maintenance of required capital levels and, ultimately, the appointment of the FDIC as receiver or conservator. Banking regulators will take prompt corrective action with respect to depository institutions that do not meet minimum capital requirements. Additionally, approval of any regulatory application filed for their review may be dependent on compliance with capital requirements.
At December 31, 2016, First Financial Northwest Bank was categorized as “well capitalized” under the prompt corrective action regulations of the FDIC. For additional information, see Note 13 of the Notes to Consolidated Financial Statements contained in Item 8 of this report.
Federal Home Loan Bank System. First Financial Northwest Bank is a member of the FHLB of Des Moines, one of 11 regional FHLBs that administer the home financing credit function of savings institutions. The FHLBs are subject to the oversight of the Federal Housing Finance Agency (“FHFA”) and each FHLB serves as a reserve or central bank for its members within its assigned region. The FHLBs are funded primarily from proceeds derived from the sale of consolidated obligations of the FHLB System and makes loans or advances to members in accordance with policies and procedures established by the Board of Directors of the FHLB, which are subject to the oversight of the FHFA. All advances from the FHLB are required to be fully secured by sufficient collateral as determined by the FHLB. In addition, all long-term advances are required to provide funds for residential home financing. See “Business – Deposit Activities and Other Sources of Funds – Borrowings.”
At December 31, 2016, the Bank held $8.0 million in FHLB stock that was in compliance with the holding requirements. The Bank purchased 541 shares of additional stock in March 2016 as a result of the increase in assets as of December 31, 2015. In addition, activity stock was purchased and sold throughout 2016 in response to increases or payoffs to our outstanding advances. At December 31, 2016, the Bank had a net increase in activity stock held of 1,840 shares. The FHLB pays dividends quarterly, and First Financial Northwest Bank received $202,000 in dividends during the year ended December 31, 2016.
The FHLBs continue to contribute to low- and moderately-priced housing programs through direct loans or interest subsidies on advances targeted for community investment and low- and moderate-income housing projects. These contributions have adversely affected the level of FHLB dividends paid and could continue to do so in the future. These contributions could also have an adverse effect on the value of FHLB stock in the future. A reduction in value of First Financial Northwest Bank’s FHLB stock may result in a decrease in net income and possibly capital.
Commercial Real Estate Lending Concentrations. The federal banking agencies have issued guidance on sound risk management practices for concentrations in commercial real estate lending. The particular focus is on exposure to commercial real estate loans that are dependent on the cash flow from the real estate held as collateral and that are likely to be sensitive to conditions in the commercial real estate market (as opposed to real estate collateral held as a secondary source of repayment or as an abundance of caution). The purpose of the guidance is not to limit a bank’s commercial real estate lending but to guide banks in developing risk management practices and capital levels commensurate with the level and nature of real estate concentrations. The guidance directs the FDIC and other bank regulatory agencies to focus their supervisory resources on institutions that may have significant commercial real estate loan concentration risk. A bank that has experienced rapid growth in commercial real estate lending, has notable exposure to a specific type of commercial real estate loan, or is approaching or exceeding the following supervisory criteria may be identified for further supervisory analysis with respect to real estate concentration risk:
• | Total reported loans for construction, land development and other land represent 100% or more of the bank’s total regulatory capital; or |
• | Total commercial real estate loans (as defined in the guidance) represent 300% or more of the bank’s total regulatory capital and the outstanding balance of the bank’s commercial real estate loan portfolio has increased 50% or more during the prior 36 months. |
The guidance provides that the strength of an institution’s lending and risk management practices with respect to such concentrations will be taken into account in supervisory guidance on evaluation of capital adequacy. As of December 31, 2016, First Financial Northwest Bank’s aggregate recorded loan balances for construction, land development and land loans were 105.9% of regulatory capital. In addition, at December 31, 2016, First Financial Northwest Bank’s loans on commercial real estate, as defined by the FDIC, were 428.8% of regulatory capital.
Activities and Investments of Insured State-Chartered Financial Institutions. Federal law generally limits the activities and equity investments of FDIC-insured, state-chartered banks to those that are permissible for national banks. An insured state bank is not prohibited from, among other things, (1) acquiring or retaining a majority interest in a subsidiary, (2) investing
32
as a limited partner in a partnership the sole purpose of which is direct or indirect investment in the acquisition, rehabilitation or new construction of a qualified housing project, provided that such limited partnership investments may not exceed 2% of the bank’s total assets, (3) acquiring up to 10% of the voting stock of a company that solely provides or reinsures directors’, trustees’ and officers’ liability insurance coverage or bankers’ blanket bond group insurance coverage for insured depository institutions and (4) acquiring or retaining the voting shares of a depository institution owned by another FDIC-insured institution if certain requirements are met.
Washington State has enacted a law regarding financial institution parity. Primarily, the law affords Washington state‑chartered commercial banks the same powers as Washington state-chartered savings banks and provides that Washington chartered commercial banks may exercise any of the powers that the Federal Reserve has determined to be closely related to the business of banking and the powers of national banks subject to the approval of the Director of the DFI in certain situations. Finally, the law provides additional flexibility for Washington state-chartered commercial and savings banks with respect to interest rates on loans and other extensions of credit. Specifically, they may charge the maximum interest rate allowable for loans and other extensions of credit by federally-chartered financial institutions to Washington residents.
Environmental Issues Associated With Real Estate Lending. The Comprehensive Environmental Response, Compensation and Liability Act (“CERCLA”) is a federal statute that generally imposes strict liability on all prior and present “owners and operators” of sites containing hazardous waste. However, Congress acted to protect secured creditors by providing that the term “owner and operator” excludes a person whose ownership is limited to protecting its security interest in the site. Since the enactment of the CERCLA, this “secured creditor exemption” has been the subject of judicial interpretations that have left open the possibility that lenders could be liable for cleanup costs on contaminated property that they hold as collateral for a loan. To the extent that legal uncertainty exists in this area, all creditors, including First Financial Northwest Bank, that have made loans secured by properties with potential hazardous waste contamination (such as petroleum contamination) could be subject to liability for cleanup costs that often are substantial and can exceed the value of the collateral property.
Federal Reserve System. The Federal Reserve requires that all depository institutions maintain reserves on transaction accounts and non-personal time deposits. These reserves may be in the form of cash or deposits with the regional Federal Reserve Bank. Interest-bearing demand accounts and other types of accounts that permit payments or transfers to third parties fall within the definition of transaction accounts and are subject to reserve requirements, as are any non-personal time deposits at a savings bank. As of December 31, 2016, First Financial Northwest Bank’s deposits with the Federal Reserve exceeded its Regulation D reserve requirements.
Affiliate Transactions. First Financial Northwest and First Financial Northwest Bank are separate and distinct legal entities. First Financial Northwest (and any non-bank subsidiary of First Financial Northwest) is an affiliate of First Financial Northwest Bank. Federal laws strictly limit the ability of banks to engage in certain transactions with their affiliates. Transactions deemed to be a “covered transaction” under Section 23A of the Federal Reserve Act and between a bank and an affiliate are limited to 10% of the bank’s capital and surplus and, with respect to all affiliates, to an aggregate of 20% of the bank’s capital and surplus. Further, covered transactions that are loans and extensions of credit generally are required to be secured by eligible collateral in specified amounts. Federal law also requires that covered transactions and certain other transactions listed in Section 23B of the Federal Reserve Act between a bank and its affiliates be on terms as favorable to the bank as transactions with nonaffiliates. For additional information, see “– Regulation and Supervision of First Financial Northwest – Limitations on Transactions with Affiliates” below.
Community Reinvestment Act. First Financial Northwest Bank is subject to the provisions of the Community Reinvestment Act of 1977 (“CRA”) that requires the appropriate federal bank regulatory agency to assess a bank’s performance under the CRA in meeting the credit needs of the community serviced by the bank, including low and moderate income neighborhoods. The regulatory agency’s assessment of the bank’s record is made available to the public. Further, a bank’s CRA performance must be considered in connection with a bank’s application, to among other things, establish a new branch office that will accept deposits, relocate an existing office or merge or consolidate with, or acquire the assets or assume the liabilities of, a federally regulated financial institution. First Financial Northwest Bank received a “satisfactory” rating during its most recent examination.
Dividends. The amount of dividends payable by First Financial Northwest Bank to First Financial Northwest depends upon First Financial Northwest Bank’s earnings and capital position, and is limited by federal and state laws, regulations and policies. According to Washington law, First Financial Northwest Bank may not declare or pay a cash dividend on its capital stock if it would cause its net worth to be reduced below (1) the amount required for liquidation accounts or (2) the net worth requirements, if any, imposed by the Director of the DFI. In addition, dividends may not be declared or paid if First Financial Northwest Bank is in default in payment of any assessments due to the FDIC. Dividends on First Financial Northwest Bank’s capital stock may
33
not be paid in an aggregate amount greater than the aggregate retained earnings of First Financial Northwest Bank, without the approval of the Director of the DFI.
The amount of dividends actually paid during any one period is affected by First Financial Northwest Bank’s policy of maintaining a strong capital position. Federal law further provides that no insured depository institution may pay a cash dividend if it would cause the institution to be “undercapitalized,” as defined in the prompt corrective action regulations. Moreover, the federal bank regulatory agencies also have the general authority to limit the dividends paid by insured banks if such payments are deemed to constitute an unsafe and unsound practice.
Privacy Standards. The Gramm-Leach-Bliley Financial Services Modernization Act of 1999 (“GLBA”) modernized the financial services industry by establishing a comprehensive framework to permit affiliations among commercial banks, insurance companies, securities firms and other financial service providers. First Financial Northwest Bank is subject to FDIC regulations implementing the privacy protection provisions of the GLBA. These regulations require First Financial Northwest Bank to disclose its privacy policy, including informing consumers of its information sharing practices and informing consumers of their rights to opt out of certain practices.
Anti-Money Laundering and Customer Identification. The Uniting and Strengthening America by Providing Appropriate Tools Required to Intercept and Obstruct Terrorism Act of 2001 (USA Patriot Act) was signed into law on October 26, 2001. The USA PATRIOT and Bank Secrecy Acts require financial institutions to develop programs to prevent financial institutions from being used for money laundering and terrorist activities. If such activities are detected, financial institutions are obligated to file suspicious activity reports with the U.S. Treasury’s Office of Financial Crimes Enforcement Network. These rules require financial institutions to establish procedures for identifying and verifying the identity of customers seeking to open new financial accounts, and, effective in 2018, the beneficial owners of accounts. Bank regulators are directed to consider a holding company’s effectiveness in combating money laundering when ruling on Bank Holding Company Act and Bank Merger Act applications.
Other Consumer Protection Laws and Regulations. The Dodd-Frank Act established the CFPB and empowered it to exercise broad regulatory, supervisory and enforcement authority with respect to both new and existing consumer financial protection laws. First Financial Northwest Bank is subject to consumer protection regulations issued by the CFPB, but as a financial institution with assets of less than $10 billion, First Financial Northwest Bank is generally subject to supervision and enforcement by the FDIC and the DFI with respect to its compliance with consumer financial protection laws and CFPB regulations.
First Financial Northwest Bank is subject to a broad array of federal and state consumer protection laws and regulations that govern almost every aspect of its business relationships with consumers. While not exhaustive, these laws and regulations include the Truth-in-Lending Act, the Truth in Savings Act, the Electronic Fund Transfer Act, the Expedited Funds Availability Act, the Equal Credit Opportunity Act, the Fair Housing Act, the Real Estate Settlement Procedures Act, the Home Mortgage Disclosure Act, the Fair Credit Reporting Act, the Fair Debt Collection Practices Act, the Right to Financial Privacy Act, the Home Ownership and Equity Protection Act, the Consumer Leasing Act, the Fair Credit Billing Act, the Homeowners Protection Act, the Check Clearing for the 21st Century Act, laws governing flood insurance, laws governing consumer protections in connection with the sale of insurance, federal and state laws prohibiting unfair and deceptive business practices and various regulations that implement some or all of the foregoing. These laws and regulations mandate certain disclosure requirements and regulate the manner in which financial institutions must deal with customers when taking deposits, making loans, collecting loans and providing other services. Failure to comply with these laws and regulations can subject First Financial Northwest Bank to various penalties, including but not limited to, enforcement actions, injunctions, fines, civil liability, criminal penalties, punitive damages and the loss of certain contractual rights.
Regulation and Supervision of First Financial Northwest
General. First Financial Northwest, as sole shareholder of First Financial Northwest Bank, is a bank holding company registered with the FRB. Bank holding companies are subject to comprehensive regulation by the FRB under the Bank Holding Company Act of 1956, as amended (“BHCA”), and the regulations of the FRB. Accordingly, First Financial Northwest is required to file quarterly reports with the FRB and provide additional information as the FRB may require. The FRB may examine First Financial Northwest, and any of its subsidiaries, and charge First Financial Northwest for the cost of the examination. The FRB also has extensive enforcement authority over bank holding companies, including, among other things, the ability to assess civil money penalties, to issue cease and desist or removal orders and to require that a holding company divest subsidiaries (including its bank subsidiaries). In general, enforcement actions may be initiated for violations of law and regulations and unsafe or unsound practices. First Financial Northwest is also required to file certain reports with, and otherwise comply with the rules and regulations of the SEC.
34
The Bank Holding Company Act. Under the BHCA, First Financial Northwest is supervised by the FRB. The FRB has a policy that a bank holding company is required to serve as a source of financial and managerial strength to its subsidiary bank and may not conduct its operations in an unsafe or unsound manner. In addition, the Dodd-Frank Act and earlier FRB policy provide that a bank holding company should serve as a source of strength to its subsidiary bank by having the ability to provide financial assistance to its subsidiary bank during periods of financial distress to the bank. A bank holding company’s failure to meet its obligation to serve as a source of strength to its subsidiary bank will generally be considered by the FRB to be an unsafe and unsound banking practice or a violation of the FRB’s regulations or both. No regulations have yet been proposed by the FRB to implement the source of strength doctrine required by the Dodd-Frank Act. First Financial Northwest and any subsidiaries that it may control are considered “affiliates” within the meaning of the Federal Reserve Act, and transactions between First Financial Northwest Bank and affiliates are subject to numerous restrictions. With some exceptions, First Financial Northwest and its subsidiaries are prohibited from tying the provision of various services, such as extensions of credit, to other services offered by First Financial Northwest or by its affiliates.
Acquisitions. The BHCA prohibits a bank holding company, with certain exceptions, from acquiring ownership or control of more than 5% of the voting shares of any company that is not a bank or bank holding company and from engaging in activities other than those of banking, managing or controlling banks, or providing services for its subsidiaries. Under the BHCA, the FRB may approve the ownership of shares by a bank holding company in any company, the activities of which the FRB has determined to be so closely related to the business of banking or managing or controlling banks as to be a proper incident thereto. These activities include: operating a savings institution, mortgage company, finance company, credit card company or factoring company; performing certain data processing operations; providing certain investment and financial advice; underwriting and acting as an insurance agent for certain types of credit-related insurance; leasing property on a full-payout, non-operating basis; selling money orders, travelers’ checks and U.S. Savings Bonds; real estate and personal property appraising; providing tax planning and preparation services; and, subject to certain limitations, providing securities brokerage services for customers.
Regulatory Capital Requirements. Bank holding companies, like First Financial Northwest, are subject to capital adequacy requirements of the FRB under the BHCA and the regulations of the FRB. At December 31, 2016, First Financial Northwest exceeded all regulatory requirements for bank holding companies with $1.0 billion or more in assets.
The following table presents the regulatory capital ratios for First Financial Northwest as of December 31, 2016:
Actual | ||||||
Amount | Ratio | |||||
(Dollars in thousands) | ||||||
Tier I leverage capital (to average assets) | $ | 139,430 | 13.02 | % | ||
Common equity tier I (to risk-weighted assets) | 139,430 | 16.68 | % | |||
Tier I risk-based capital (to risk-weighted assets) | 139,430 | 16.68 | % | |||
Total risk-based capital (to risk-weighted assets) | 149,890 | 17.93 | % | |||
Acquisition of Control. Under the federal Change in Bank Control Act, a notice must be submitted to the FRB if any person (including a company), or group acting in concert, seeks to acquire “control” of a bank holding company or commercial bank. An acquisition of control can occur upon the acquisition of 10% or more of the voting stock of a bank holding company or commercial bank or as otherwise defined by the FRB. Under the Change in Bank Control Act, the FRB has 60 days from the filing of a complete notice to act, taking into consideration certain factors, including the financial and managerial resources of the acquirer and the anti-trust effects of the acquisition. Any company that so acquires control would then be subject to regulation as a bank holding company.
Restrictions on Dividends. The Federal Reserve has issued a policy statement on the payment of cash dividends by bank holding companies, which expresses its view that although there are no specific regulations restricting dividend payments by bank holding companies other than state corporate laws, a bank holding company must maintain an adequate capital position and generally should not pay cash dividends unless the company’s net income for the past year is sufficient to fully fund the cash dividends and that the prospective rate of earnings appears consistent with the company’s capital needs, asset quality, and overall financial condition. The Federal Reserve policy statement also indicates that it would be inappropriate for a company experiencing serious financial problems to borrow funds to pay dividends. As described above under “Capital Requirements,” beginning January 1, 2016 the capital conversion buffer requirement can also restrict First Financial Northwest’s and the Bank’s ability to pay dividends. For additional information, see Item 1.A. “Risk Factors – Certain regulatory restrictions are imposed on us and lack of compliance could result in monetary penalties and/or additional regulatory actions.” in Item 1.A. Risk Factors contained in this report.
35
Stock Repurchases. A bank holding company, except for certain “well-capitalized” and highly rated bank holding companies, is required to give the FRB prior written notice of any purchase or redemption of its outstanding equity securities if the gross consideration for the purchase or redemption, when combined with the net consideration paid for all such purchases or redemptions during the preceding twelve months, is equal to 10% or more of its consolidated net worth. The FRB may disapprove such a purchase or redemption if it determines that the proposal would constitute an unsafe or unsound practice or would violate any law, regulation, FRB order or any condition imposed by, or written agreement with, the FRB. During the year ended December 31, 2016, First Financial Northwest repurchased 2,864,389 shares of its common stock.
Limitations on Transactions with Affiliates. Transactions between banks and any affiliate are governed by Sections 23A and 23B of the FRB Act. An affiliate of a bank is any company or entity that controls, is controlled by or is under common control with the Bank. In a holding company context, the holding company and any companies that are controlled by such holding companies are affiliates of the Bank. Generally, Section 23A limits the extent to which the bank or its subsidiaries may engage in “covered transactions” with any one affiliate to an amount equal to 10% of the institution’s capital stock and surplus and contain an aggregate limit on all such transactions with all affiliates to an amount equal to 20% of such capital stock and surplus. Section 23B applies to “covered transactions” as well as certain other transactions and requires that all transactions be on terms substantially the same, or at least as favorable, to the bank as those provided to a nonaffiliate. The term “covered transaction” includes the making of loans to, purchase of assets from and issuance of a guarantee to an affiliate and similar transactions.
In addition, Sections 22(g) and (h) of the FRB Act place restrictions on loans to executive officers, directors and principal shareholders. Under Section 22(h), loans to a director, executive officer or greater than 10% shareholder of a bank and certain affiliated interests, may not exceed, together with all other outstanding loans to such person and affiliated interests, the bank’s loans to one borrower limit (generally equal to 15% of the institution’s unimpaired capital and surplus). Section 22(h) also requires that loans to directors, executive officers and principal shareholders be made on terms substantially the same as offered in comparable transactions to other persons unless the loans are made pursuant to a benefit or compensation program that (1) is widely available to employees of the institution and (2) does not give preference to any director, executive officer or principal shareholder, or certain affiliated interests, over other employees of the bank. Section 22(h) also requires prior board approval for certain loans. In addition, the aggregate amount of extensions of credit by a bank to all insiders cannot exceed the bank’s unimpaired capital and surplus. Furthermore, Section 22(g) places additional restrictions on loans to executive officers. At December 31, 2015, First Financial Northwest Bank was in compliance with these restrictions.
Federal Securities Laws. First Financial Northwest’s common stock is registered with the SEC under Section 12(b) of the Securities Exchange Act of 1934, as amended (“Exchange Act”). We are subject to information, proxy solicitation, insider trading restrictions and other requirements under the Exchange Act.
The Dodd-Frank Act. On July 21, 2010, the Dodd-Frank Act was signed into law. The Dodd-Frank-Act imposes new restrictions and an expanded framework of regulatory oversight for financial institutions, including depository institutions and implements new capital regulations that First Financial Northwest and First Financial Northwest Bank will become subject to and that are discussed above under the section entitled “- Regulation and Supervision of First Financial Northwest Bank - Capital Requirements.”
In addition, among other changes, the Dodd-Frank Act requires public companies, like First Financial Northwest, to (i) provide their shareholders with a non-binding vote (a) at least once every three years on the compensation paid to executive officers and (b) at least once every six years on whether they should have a “say on pay” vote every one, two or three years; (ii) have a separate, non-binding shareholder vote regarding golden parachutes for named executive officers when a shareholder vote takes place on mergers, acquisitions, dispositions or other transactions that would trigger the parachute payments; (iii) provide disclosure in annual proxy materials concerning the relationship between the executive compensation paid and the financial performance of the issuer; and (iv) amend Item 402 of Regulation S-K to require companies to disclose the ratio of the Chief Executive Officer’s annual total compensation to the median annual total compensation of all other employees. For certain of these changes, the implementing regulations have not been promulgated, so the full impact of the Dodd-Frank Act on public companies cannot be determined at this time.
The federal banking agencies have issued final rules to implement the provisions of Section 619 of the Dodd-Frank Act commonly referred to as the Volcker Rule. The regulations contain prohibitions and restrictions on the ability of financial institutions holding companies and their affiliates to engage in proprietary trading and to hold certain interests in, or to have certain relationships with, various types of investment funds, including hedge funds and private equity funds. Management believes First Financial Northwest’s investment portfolio and investment strategies are in compliance with the various provisions of the Volcker Rule regulations.
36
Sarbanes-Oxley Act of 2002. As a public company that files periodic reports with the SEC under the Exchange Act, First Financial Northwest, is subject to the Sarbanes-Oxley Act of 2002 (“Sarbanes-Oxley Act”), which addresses, among other issues, corporate governance, auditing and accounting, executive compensation, and enhanced and timely disclosure of corporate information. The Sarbanes-Oxley Act represents significant federal involvement in matters traditionally left to state regulatory systems, such as the regulation of the accounting profession, and to state corporate law, such as the relationship between a board of directors and management and between a board of directors and its committees. Our policies and procedures have been updated to comply with the requirements of the Sarbanes-Oxley Act.
Taxation
Federal Taxation
General. First Financial Northwest and First Financial Northwest Bank are subject to federal income taxation in the same general manner as other corporations, with some exceptions discussed below. The following discussion of federal taxation is intended only to summarize certain pertinent federal income tax matters and is not a comprehensive description of the tax rules applicable to First Financial Northwest or First Financial Northwest Bank. The tax years still open for review by the Internal Revenue Service are 2013 through 2016.
First Financial Northwest files a consolidated federal income tax return with First Financial Northwest Bank. Accordingly, any cash distributions made by First Financial Northwest to its shareholders are considered to be taxable dividends and not as a non-taxable return of capital to shareholders for federal and state tax purposes.
Method of Accounting. For federal income tax purposes, First Financial Northwest currently reports its income and expenses on the accrual method of accounting and uses a fiscal year ending on December 31 for filing its federal income tax return.
Minimum Tax. The Internal Revenue Code imposes an alternative minimum tax at a rate of 20% on a base of regular taxable income plus certain tax preferences, called alternative minimum taxable income. The alternative minimum tax is payable to the extent such alternative minimum taxable income is in excess of an exemption amount. Net operating losses can offset no more than 90% of alternative minimum taxable income. Certain payments of alternative minimum tax may be used as credits against regular tax liabilities in future years. The Company’s alternative minimum tax credit carryforward at December 31, 2016 totaled $45,000, with no expiration date.
Net Operating Loss Carryovers. A financial institution may carry back net operating losses to the preceding two taxable years and forward to the succeeding 20 taxable years. This provision applies to losses incurred in taxable years beginning after August 2009. The Company had no net operating loss carryforwards at December 31, 2016.
Corporate Dividends-Received Deduction. First Financial Northwest may eliminate from its income dividends received from First Financial Northwest Bank as a wholly-owned subsidiary of First Financial Northwest that files a consolidated return with First Financial Northwest Bank. The corporate dividends-received deduction is 100%, or 80%, in the case of dividends received from corporations with which a corporate recipient does not file a consolidated tax return, depending on the level of stock ownership of the payer of the dividend. Corporations that own less than 20% of the stock of a corporation distributing a dividend may deduct 70% of dividends received or accrued on their behalf.
For additional information regarding our federal income taxes, see Note 12 of the Notes to Consolidated Financial Statements contained in Item 8 of this report.
State Taxation
First Financial Northwest and its subsidiaries are subject to a business and occupation tax imposed under Washington state law at the rate of 1.50% of gross receipts. In addition, various municipalities also assess business and occupation taxes at differing rates. Interest received on loans secured by first lien mortgages or deeds of trust on residential properties, rental income from properties, and certain investment securities are exempt from this tax. An audit by the Washington State Department of Revenue was completed for the years 2010 through 2013, resulting in no material tax revisions.
Beginning in the year ended December 31, 2016, the Bank purchased and originated loans in California, and is subject to the California income tax on revenue earned from these loans. Corporations doing business in California are subject to an annual minimum franchise tax of $800 or an income tax of 8.84% of net income.
37
Executive Officers of First Financial Northwest, Inc.
The business experience for at least the past five years for the executive officers of First Financial Northwest and its primary subsidiary First Financial Northwest Bank is set forth below.
Joseph W. Kiley III, age 61, has served as President and Chief Executive Officer of First Financial Northwest and First Financial Diversified since September 2013, and served as President, Chief Executive Officer, Director of First Financial Northwest Bank since September 2012, and Director of First Financial Northwest and First Financial Diversified since December 2012. He previously served as President, Chief Executive Officer and Director of Frontier Bank, F.S.B., located in Palm Desert, California, and its holding company, Western Community Bancshares, Inc. from 2010 to 2012. From 2007 to 2010, Mr. Kiley was a Director at California General Bank. From 2009 to 2011, Mr. Kiley served as the President, Chief Executive Officer and Director of Imperial Capital Bank, located in San Diego, California and its holding company, Imperial Capital Bancorp, Inc. Mr. Kiley has over 25 years of executive experience at banks, thrifts and their holding companies that included serving as president, chief executive officer, chief financial officer, and director. Mr. Kiley holds a Bachelor of Science degree in Business Administration (Accounting) from California State University, Chico and is a former California certified public accountant. Mr. Kiley is an active member of the Renton Rotary Club and serves on the boards of directors of the Renton Chamber of Commerce and the Washington Bankers’ Association.
Richard P. Jacobson, age 53, has served as Chief Operating Officer of the Bank since July 2013, Chief Financial Officer of First Financial Northwest, First Financial Diversified, and the Bank since August 2013, and Chief Operating Officer of First Financial Northwest since September 2013. He was appointed as a director of First Financial Northwest and First Financial Northwest Bank effective September 2013. Mr. Jacobson served as a consultant to First Financial Northwest from April 2010 to April 2012, and from that time until July 2013, served as a mortgage loan originator in Palm Desert, California. Prior to that, he had been employed by Horizon Financial Corp, and Horizon Bank, Bellingham, Washington since 1987, and had served as President, Chief Executive Officer and a director of Horizon Financial Corp and Horizon Bank from 2008 to 2010. Mr. Jacobson also served as Chief Financial Officer of Horizon Financial Corp and Horizon Bank from March 2000 until October 2008. Between 1985 and 2008, Mr. Jacobson served in several other positions at Horizon Financial Corp. and Horizon Bank, and spent two years as a Washington State licensed real estate appraiser from 1992 to 1994. Mr. Jacobson received his Bachelor’s degree in Business Administration (Finance) from the University of Washington. In addition, Mr. Jacobson graduated with honors from the American Banker Association’s National School of Banking. Mr. Jacobson is a past president of the Whatcom County North Rotary club and has served on the boards of his church, the United Way, Boys and Girls Club, and Junior Achievement.
Gregg H. DeRitis, age 62, is Senior Vice President and Chief Credit Officer of First Financial Northwest Bank as of January 6, 2016. Mr. DeRitis previously served as First Vice President, Credit Administration since joining First Financial Northwest Bank in April 2015. Prior to that, he was the Chief Credit Officer at Eastside Commercial Bank, Bellevue, Washington, from March 2013 to March 2015. From October 2012 until February 2013, Mr. DeRitis was employed as Risk/Lending Consultant by Impact Capital, a non-profit Washington state community based lender. From January 1990 until July 2012, he was employed by KeyBank in a variety of credit related positions and served as Senior Vice President in charge of credit administration and approval for KeyBank’s Western Community Development Banking division (encompassing six states, including Washington) prior to his departure. Mr. DeRitis received his Bachelor of Science degree from Santa Clara University and his Master’s in Business Administration from the University of Washington. In addition, he holds a professional certificate from Pacific Coast Banking School. He is an active volunteer in the community, having served on the Board of Trustees for Plymouth Housing Group in Seattle, Washington.
Simon Soh, age 52, is Senior Vice President and Chief Lending Officer of First Financial Northwest Bank. Prior to his promotion in October 2012, Mr. Soh served as Vice President and Loan Production Manager of First Financial Northwest Bank, a position he held since August 2010. Prior to that, he was First Vice President and Commercial Lending Manager at East West Bank. In 1998, Mr. Soh was a founding member of Pacifica Bank in Bellevue, Washington that merged with United Commercial Bank in 2005, later becoming East West Bank in 2009. Mr. Soh has over 28 years of experience in commercial banking.
Ronnie J. Clariza, age 36, was appointed Chief Risk Officer and Senior Vice President of First Financial Northwest Bank in November 2013. Mr. Clariza previously served as Vice President and Risk Management Officer since May 2008, and prior to that, as Assistant Vice President and Compliance Officer, as well as serving in various other compliance and internal audit roles since he began with the Bank in 2003. Mr. Clariza is a graduate of the University of Washington where he received his Bachelor of Arts degree in Business Administration, Finance, and is a certified regulatory Compliance Officer. Mr. Clariza is an active member of the Education and Enterprise Risk Management Committees for the Washington Bankers’ Association. He was also a past member of the Seattle Children’s Hospital Guild Association as a Volunteer Compliance Manager.
38
Dalen D. Harrison, age 57, was appointed Chief Deposit Officer of First Financial Northwest Bank in March 2014 and Senior Vice President in July 2014. Ms. Harrison served as Senior Vice President and Director of Retail Banking at Peoples Bank in Bellingham, Washington from 2010 until 2014. Prior to that, she served as Vice President of Rainier Pacific Bank, Tacoma, Washington, from 1994 until 2010. Ms. Harrison received a Bachelor of Arts degree in Business Administration from St Mary’s College in Moraga, California. Ms. Harrison has served on the boards of Rainier Pacific Foundation, First Place for Children, and Gig Harbor Rotary Foundation, and currently serves on the boards of the Renton Area Youth and Family Services and the Renton Downtown Partnership.
Christine A. Huestis, age 51, is Vice President and Controller of First Financial Northwest and First Financial Northwest Bank. Prior to joining First Financial Northwest in October 2013, she was employed by Realty in Motion, LLC, a holding company for several mortgage default service companies in Bellevue, Washington. From 1999 until joining First Financial Northwest, Ms. Huestis held key accounting positions at affiliated companies within Realty in Motion, with her most recent position being that of Controller. Ms. Huestis received a Bachelor of Science degree in Accounting from Central Washington University. She is a certified public accountant and is a member of the American Institute of Certified Public Accountants.
Item 1A. Risk Factors.
An investment in our common stock is subject to risks inherent in our business. Before making an investment decision, you should carefully consider the risks and uncertainties described below together with all of the other information included in this report and our other filings with the SEC. In addition to the risks and uncertainties described below, other risks and uncertainties not currently known to us or that we currently deem to be immaterial also may materially and adversely affect our business, financial condition, capital levels, cash flows, liquidity, results of operations and prospects. The risks discussed below also include forward-looking statements, and our actual results may differ substantially from those discussed in these forward-looking statements. The market price of our common stock could decline significantly due to any of these identified or other risks and you could lose some or all of your investment. This report is qualified in its entirety by these risk factors.
Our business may be adversely affected by downturns in the national economy and in the economies in our market areas.
Substantially all of our loans are to businesses and individuals in the state of Washington. A decline in the national economy or the economies of the four counties which we consider to be our primary market area could have a material adverse effect on our business, financial condition, results of operations, and prospects. Weakness in the global economy has adversely affected many businesses operating in our markets that are dependent upon international trade and it is not known how the recent withdrawal by the United States from the Trans-Pacific Partnership trade agreement may also affect these businesses.
While real estate values and unemployment rates have recently improved, a deterioration in economic conditions in the market areas we serve, in particular the Puget Sound area of Washington State, could result in the following consequences, any of which could have a materially adverse impact on our business, financial condition, results of operations:
• | loan delinquencies, problem assets and foreclosures may increase; |
• | we may increase our allowance for loan losses; |
• | demand for our products and services may decline resulting in a decrease in our total loans or assets; |
• | collateral for loans, especially real estate, may decline in value, exposing us to increased risk of loss on existing loans, reducing customers’ borrowing power, and reducing the value of assets and collateral associated with existing loans; |
• | the net worth and liquidity of loan guarantors may decline, impairing their ability to honor commitments to us; and |
• | the amount of our low-cost or noninterest-bearing deposits may decrease and the composition of our deposits may be adversely affected. |
A decline in local economic conditions may have a greater effect on our earnings and capital than on the earnings and capital of larger financial institutions whose real estate loan portfolios are geographically diverse. If we are required to liquidate a significant amount of collateral during a period of reduced real estate values, our financial condition and profitability could be adversely affected.
39
Our results of operations, liquidity and cash flows are subject to interest rate risk.
Our earnings and cash flows are largely dependent upon our net interest income. Interest rates are highly sensitive to many factors that are beyond our control, including general economic conditions and policies of various governmental and regulatory agencies, and, in particular, the Federal Reserve Board. In an attempt to help the overall economy, the Federal Reserve Board has kept interest rates low through its targeted Fed Funds rate. In December 2016, the Federal Reserve Board slightly increased the Fed Funds rate by 25 basis points and indicated a likelihood for further increases during 2017 subject to economic conditions. As the Federal Reserve Board increases the Fed Funds rate, overall interest rates will likely rise, which may negatively impact both the housing markets by reducing refinancing activity and new home purchases and the U.S. economic recovery. Changes in monetary policy, including changes in interest rates, could influence not only the interest we receive on loans and investments and the amount of interest we pay on deposits and borrowings, but these changes could also affect (i) our ability to originate loans and obtain deposits, (ii) the fair value of our financial assets and liabilities and (iii) the average duration of our mortgage-backed securities portfolio and other interest-earning assets.
Changes in interest rates could also have a negative impact on our results of operations by reducing the ability of borrowers to repay their current loan obligations or by reducing our margins and profitability. Our net interest margin is the difference between the yield we earn on our assets and the interest rate we pay for deposits and our other sources of funding. Changes in interest rates-up or down-could adversely affect our net interest margin and, as a result, our net interest income. Although the yield we earn on our assets and our funding costs tend to move in the same direction in response to changes in interest rates, one can rise or fall faster than the other, causing our net interest margin to expand or contract. Our liabilities tend to be shorter in duration than our assets, so they may adjust faster in response to changes in interest rates. As a result, when interest rates rise, our funding costs may rise faster than the yield we earn on our assets, causing our net interest margin to contract until the yields on interest-earning assets catch up. Changes in the slope of the “yield curve”, or the spread between short-term and long-term interest rates-could also reduce our net interest margin. Normally, the yield curve is upward sloping, meaning short-term rates are lower than long-term rates. Because our liabilities tend to be shorter in duration than our assets, when the yield curve flattens or even inverts, we could experience pressure on our net interest margin as our cost of funds increases relative to the yield we can earn on our assets. Also, interest rate decreases can lead to increased prepayments of loans and mortgage-backed securities as borrowers refinance their loans to reduce borrowing costs. Under these circumstances, we are subject to reinvestment risk as we may have to redeploy such repayment proceeds into lower yielding investments, which would likely hurt our income.
A sustained increase in market interest rates could adversely affect our earnings. As a result of the exceptionally low interest rate environment, an increasing percentage of our deposits have been comprised of deposits bearing no or a relatively low rate of interest and having a shorter duration than our assets. We would incur a higher cost of funds to retain these deposits in a rising interest rate environment. If the interest rates paid on deposits and other borrowings increase at a faster rate than the interest rates received on loans and other investments, our net interest income, and therefore earnings, could be adversely affected
In addition, a portion of our adjustable-rate loans have interest rate floors below which the loan’s contractual interest rate may not adjust. At December 31, 2016, 41.7% of our net loans were comprised of adjustable-rate loans. At that date, $135.7 million, or 39.3%, of these loans with an average interest rate of 4.2% were at their floor interest rate. The inability of our loans to adjust downward can contribute to increased income in periods of declining interest rates, although this result is subject to the risks that borrowers may refinance these loans during periods of declining interest rates. Also, when loans are at their respective floor, which is above the fully-indexed rate, there is a further risk that our interest income may not increase as rapidly as our cost of funds during periods of increasing interest rates and could have a material adverse effect on our results of operations.
Changes in interest rates also affect the value of our interest-earning assets, including our securities portfolio. Generally, the fair value of fixed-rate securities fluctuates inversely with changes in interest rates. Unrealized gains and losses on securities available for sale are reported as a separate component of equity, net of tax. Decreases in the fair value of securities available for sale resulting from increases in interest rates could have an adverse effect on stockholders’ equity.
Although management believes it has implemented effective asset and liability management strategies to reduce the potential effects of changes in interest rates on our results of operations, any substantial, unexpected or prolonged change in market interest rates could have a material adverse effect on our financial condition and results of operations. Also, our interest rate risk modeling techniques and assumptions likely may not fully predict or capture the impact of actual interest rate changes on our balance sheet or projected operating results. For further discussion of how changes in interest rates could impact us, see Item 7A. Quantitative and Qualitative Disclosures About Market Risk” for additional information about our interest rate risk management.
40
A return of recessionary conditions could result in increases in our level of non-performing loans and/or reduce demand for our products and services, which could have an adverse effect on our results of operations.
A return of recessionary conditions and/or negative developments in the domestic and international credit markets may significantly affect the markets in which we do business, the value of our loans and investments, and our ongoing operations, costs and profitability. Declines in real estate values and sales volumes and high unemployment levels may result in higher than expected loan delinquencies and a decline in demand for our products and services. These negative events may cause us to incur losses and may adversely affect our capital, liquidity, and financial condition.
Our construction/land loans are based upon estimates of costs and the value of the completed project.
We make construction/land loans to contractors and builders primarily to finance the construction of single and multifamily homes, subdivisions, as well as commercial properties. We originate these loans whether or not the collateral property underlying the loan is under contract for sale. At December 31, 2016, construction/land loans totaled $208.9 million, or 23.2% of our total loan portfolio, an increase of $93.0 million or 80.2% since December 31, 2015. At December 31, 2016, $111.1 million were multifamily construction loans and $67.8 million were one-to-four family construction loans. Land loans, which are loans made with land as security, totaled $30.1 million, or 3.3% of our total loan portfolio at December 31, 2016. Land loans include land non-development loans for the purchase or refinance of unimproved land held for future residential development, improved residential lots held for speculative investment purposes and lines of credit secured by land, and land development loans.
Construction/land lending involves additional risks when compared with permanent residential lending because funds are advanced upon the collateral for the project based on an estimate of costs that will produce a future value at completion. Because of the uncertainties inherent in estimating construction costs, as well as the market value of the completed project and the effects of governmental regulation on real property, it is relatively difficult to evaluate accurately the total funds required to complete a project and the completed project loan-to-value ratio. Changes in the demand, such as for new housing and higher than anticipated building costs, may cause actual results to vary significantly from those estimated. For these reasons, this type of lending also typically involves higher loan principal amounts and is often concentrated with a small number of builders. A downturn in housing, or the real estate market, could increase loan delinquencies, defaults and foreclosures, and significantly impair the value of our collateral and our ability to sell the collateral upon foreclosure. Some of our builders have more than one loan outstanding with us and also have residential mortgage loans for rental properties with us. Consequently, an adverse development with respect to one loan or one credit relationship can expose us to a significantly greater risk of loss.
In addition, during the term of most of our construction loans, no payment from the borrower is required since the accumulated interest is added to the principal of the loan through an interest reserve. As a result, these loans often involve the disbursement of funds with repayment substantially dependent on the success of the ultimate project and the ability of the borrower to sell or lease the property or obtain permanent take-out financing, rather than the ability of the borrower or guarantor to repay principal and interest. If our appraisal of the value of a completed project proves to be overstated, we may have inadequate security for the repayment of the loan upon completion of construction of the project and may incur a loss. Because construction loans require active monitoring of the building process, including cost comparisons and on-site inspections, these loans are more difficult and costly to monitor. Increases in market rates of interest may have a more pronounced effect on construction loans by rapidly increasing the end-purchasers’ borrowing costs, thereby reducing the overall demand for the project. Properties under construction are often difficult to sell and typically must be completed in order to be successfully sold which also complicates the process of working out problem construction loans. This may require us to advance additional funds and/or contract with another builder to complete construction. Furthermore, in the case of speculative construction loans, there is the added risk associated with identifying an end-purchaser for the finished project. Land loans also pose additional risk because of the lack of income being produced by the property and the potential illiquid nature of the collateral. These risks can also be significantly impacted by supply and demand conditions.
At December 31, 2016, $75.4 million of our construction/land loans were for speculative construction loans and $38.0 million of our permanent multifamily loans did not have a take-out commitment for a permanent loan with us or another lender. At December 31, 2016, all of our construction/land loans were classified as performing.
Our level of commercial and multifamily real estate loans may expose us to increased lending risks.
While commercial and multifamily real estate lending may potentially be more profitable than single-family residential lending, it is generally more sensitive to regional and local economic conditions, making loss levels more difficult to predict. Collateral evaluation and financial statement analysis in these types of loans requires a more detailed analysis at the time of loan underwriting and on an ongoing basis. At December 31, 2016, we had $303.7 million of commercial real estate loans, representing 33.7% of our total loan portfolio and $123.3 million of multifamily loans, representing 13.7% of our total loan portfolio. These
41
loans typically involve higher principal amounts than other types of loans and some of our commercial borrowers have more than one loan outstanding with us. Consequently, an adverse development with respect to one loan or one credit relationship can expose us to a significantly greater risk of loss compared to an adverse development with respect to a one-to-four family residential loan. Repayment on these loans is dependent upon income generated, or expected to be generated, by the property securing the loan in amounts sufficient to cover operating expenses and debt service that may be adversely affected by changes in the economy or local market conditions. For example, if the cash flow from the borrower’s project is reduced as a result of leases not being obtained or renewed, the borrower’s ability to repay the loan may be impaired. Commercial and multifamily loans also expose a lender to greater credit risk than loans secured by one-to-four family residential real estate because the collateral securing these loans typically cannot be sold as easily as residential real estate. In addition, many of our commercial and multifamily real estate loans are not fully amortizing and contain large balloon payments upon maturity. Such balloon payments may require the borrower to either sell or refinance the underlying property in order to make the payment that may increase the risk of default or non-payment.
A secondary market for most types of commercial and multifamily real estate loans is not readily available, so we have less opportunity to mitigate credit risk by selling part or all of our interest in these loans. As a result of these characteristics, if we foreclose on a commercial or multifamily real estate loan, our holding period for the collateral typically is longer than for one‑to‑four family residential loans because there are fewer potential purchasers of the collateral. Accordingly, charge-offs on commercial real estate loans may be larger on a per loan basis than those incurred with our residential or consumer loan portfolios.
The level of our commercial real estate loan portfolio may subject us to additional regulatory scrutiny.
The FDIC, the Federal Reserve Board and the Office of the Comptroller of the Currency have promulgated joint guidance on sound risk management practices for financial institutions with concentrations in commercial real estate lending. Under this guidance, a financial institution that, like us, is actively involved in commercial real estate lending should perform a risk assessment to identify concentrations. A financial institution may have a concentration in commercial real estate lending if, among other factors (i) total reported loans for construction, land development, and other land represent 100% or more of total capital, or (ii) total reported loans secured by multifamily and non-farm residential properties, loans for construction, land development and other land, and loans otherwise sensitive to the general commercial real estate market, including loans to commercial real estate related entities, represent 300% or more of total capital. Based on the FDIC criteria, the Bank has a concentration in commercial real estate lending as total loans for multifamily, non-farm/non-residential, construction, land development and other land represented 428.8% of total risk-based capital at December 31, 2016. The particular focus of the guidance is on exposure to commercial real estate loans that are dependent on the cash flow from the real estate held as collateral and that are likely to be at greater risk to conditions in the commercial real estate market (as opposed to real estate collateral held as a secondary source of repayment or as an abundance of caution). The purpose of the guidance is to guide banks in developing risk management practices and capital levels commensurate with the level and nature of real estate concentrations. The guidance states that management should employ heightened risk management practices including board and management oversight and strategic planning, development of underwriting standards, risk assessment and monitoring through market analysis and stress testing.
Our non-owner occupied real estate loans may expose us to increased credit risk.
At December 31, 2016, $111.6 million, or 44.7% of our one-to-four family residential loan portfolio and 12.4% of our total loan portfolio, consisted of loans secured by non-owner occupied residential properties. At December 31, 2016, all of our non-owner occupied one-to-four family residential loans were performing in accordance with their repayment terms. Loans secured by non-owner occupied properties generally expose a lender to greater risk of non-payment and loss than loans secured by owner occupied properties because repayment of such loans depend primarily on the tenant’s continuing ability to pay rent to the property owner, who is our borrower, or, if the property owner is unable to find a tenant, the property owner’s ability to repay the loan without the benefit of a rental income stream. In addition, the physical condition of non-owner occupied properties is often below that of owner occupied properties due to lenient property maintenance standards that negatively impact the value of the collateral properties. Furthermore, some of our non-owner occupied residential loan borrowers have more than one loan outstanding with us. At December 31, 2016, we had 59 non-owner occupied residential loan relationships with an outstanding balance over $500,000 and an aggregate balance of $84.6 million. Consequently, an adverse development with respect to one credit relationship may expose us to a greater risk of loss compared to an adverse development with respect to an owner occupied residential mortgage loan.
Our business may be adversely affected by credit risk associated with residential property.
At December 31, 2016, $249.4 million, or 27.7% of our total loan portfolio, was secured by first liens on one-to-four family residential loans. In addition, at December 31, 2016, our home equity lines of credit totaled $5.4 million. A significant portion of our one- to four-family residential real estate loan portfolio consists of jumbo loans that do not conform to secondary market mortgage requirements, and therefore are not immediately saleable to Fannie Mae or Freddie Mac because such loans
42
exceed the maximum balance allowable for sale (generally $417,000 -$517,000 for single-family homes in our market area). Jumbo one- to four-family residential loans may expose us to increased risk because of their larger balances, and because they cannot be immediately sold to government sponsored enterprises.
In addition, one-to-four family residential loans are generally sensitive to regional and local economic conditions that significantly impact the ability of borrowers to meet their loan payment obligations, making loss levels difficult to predict. A decline in residential real estate values resulting from a downturn in the Washington housing market may reduce the value of the real estate collateral securing these types of loans and increase our risk of loss if borrowers default on their loans. Recessionary conditions or declines in the volume of real estate sales and/or the sales prices coupled with elevated unemployment rates may result in higher than expected loan delinquencies or problem assets, and a decline in demand for our products and services. These potential negative events may cause us to incur losses, adversely affect our capital and liquidity and damage our financial condition and business operations.
High loan-to-value ratios on a portion of our residential mortgage loan portfolio exposes us to greater risk of loss.
Some of our residential mortgage loans are secured by liens on mortgage properties in which the borrowers have little or no equity because of a decline in the value of the property subsequent to when the loans were originated. Residential loans with high loan-to-value ratios will be more sensitive to declining property values than those with lower loan-to-value ratios and, therefore, may experience a higher incidence of default and severity of losses. In addition, if the borrowers sell their homes, such borrowers may be unable to repay their loans in full from the sale. As a result, these loans may experience higher rates of delinquencies, defaults and losses.
To meet our growth objectives we may originate or purchase loans outside of our market area which could affect the level of our net interest margin and nonperforming loans.
In order to achieve our desired loan portfolio growth, we anticipate that we may, from time to time, opportunistically originate or purchase loans outside of our market area either individually, through participations, or in bulk or “pools”. We will perform certain due diligence procedures and may re-underwrite these loans to our underwriting standards prior to purchase, and anticipate acquiring loans subject to customary limited indemnities, however, we may be exposed to a greater risk of loss as we acquire loans of a type or in geographic areas where management may not have substantial prior experience and which may be more difficult for us to monitor. Further, when determining the purchase price we are willing to pay to acquire loans, management will make certain assumptions about, among other things, how borrowers will prepay their loans, the real estate market and our ability to collect loans successfully and, if necessary, to dispose of any real estate that may be acquired through foreclosure. To the extent that our underlying assumptions prove to be inaccurate or the basis for those assumptions change (such as an unanticipated decline in the real estate market), the purchase price paid may prove to have been excessive, resulting in a lower yield or a loss of some or all of the loan principal. For example, if we purchase “pools” of loans at a premium and some of the loans are prepaid before we anticipate, we will earn less interest income on the acquired loans than expected. Our success in increasing our loan portfolio through loan purchases will depend on our ability to price the loans properly and on general economic conditions in the geographic areas where the underlying properties or collateral for the loans acquired are located. Inaccurate estimates or declines in economic conditions or real estate values in the markets where we purchase loans could significantly adversely affect the level of our nonperforming loans and our results of operations. At December 31, 2016, our loan portfolio included $82.3 million in counties within Washington State that are outside of our primary market area. In addition, our portfolio included $43.2 million in loans outside of Washington State.
We engage in aircraft financing transactions, in which high-value collateral is susceptible to potential catastrophic loss. Consequently, if any of these transactions becomes non-performing, we could suffer a loss or some or all of our value in the assets.
Because our primary focus for aircraft loans is on the asset value of the collateral, the collectability of an aircraft loan ultimately may be dependent on the value of the aircraft. Aircraft values have from time to time experienced sharp decreases due to a number of factors including, but not limited to, the availability of used aircraft, decreases in passenger and air cargo demand, increases in fuel costs, government regulation and the comparative value of newly manufactured similar aircraft. Aircraft as collateral also presents unique risks because it is high-value and susceptible to rapid movement across different locations and potential catastrophic loss. Although the loan documentation for these transactions will include insurance covenants and other provisions to protect us against risk of loss, there can be no assurance that the insurance proceeds would be sufficient to ensure our full recovery of the aircraft loan. Moreover, a relatively small number of non-performing aircraft loans could have a significant negative impact on the value of our loan portfolio. If we are required to liquidate a significant amount of aircraft collateral during a period of reduced values, our financial condition and profitability could be adversely affected.
43
If interest rate swaps we entered into prove ineffective, it could result in volatility in our operating results, including potential loses, which could have a material adverse effect on our results of operations and cash flows.
We are exposed to the effects of interest rate changes as a result of the borrowings we use to maintain liquidity and fund our expansion and operations. To limit the impact of interest rate changes on earnings, prepayment penalties and cash flows and to lower overall borrowing costs while taking into account variable interest rate risk, we may borrow at fixed rates or variable rates depending upon prevailing market conditions. We may also enter into derivative financial instruments such as interest rate swaps in order to mitigate our interest rate risk on a related financial instrument.
Our interest rate contracts expose us to:
• | basis or spread risk, which is the risk of loss associated with variations in the spread between the interest rate contract and the hedged item; |
• | credit or counter-party risk which is the risk of the insolvency or other inability of another party to the transaction to perform its obligations; |
• | interest rate risk; |
• | volatility risk which is the risk that the expected uncertainty relating to the price of the underlying asset differs from what is anticipated; and |
• | liquidity risk. |
If we suffer losses on our interest rate contracts, our business, financial condition and prospects may be negatively affected, and our net income will decline.
We record the swaps at fair value, and designate them as an effective cash flow hedge under ASC 815, Derivatives and Hedging. Each quarter, we measure hedge effectiveness using the “hypothetical derivative method” and record in earnings any gains or losses resulting from hedge ineffectiveness. The hedge provided by our swaps could prove to be ineffective for a number of reasons, including early retirement of the debt, as is allowed under the debt, or in the event the counterparty to the interest rate swaps were determined to not be creditworthy. Any determination that the hedge created by the swaps was ineffective could have a material adverse effect on our results of operations and cash flows and result in volatility in our operating results. In addition, any changes in relevant accounting standards relating to the swaps, especially ASC 815, Derivatives and Hedging, could materially increase earnings volatility.
As of December 31, 2016, we had invested in interest rate swaps with an aggregate notional amount of $50.0 million. At December 31, 2016, market value of our interest rate swaps was $1.3 million. For additional information, see “Management’s Discussion and Analysis of Financial Condition and Results of Operations - Asset and Liability Management”.
Our allowance for loan losses may prove to be insufficient to absorb losses in our loan portfolio.
While conditions in the housing and real estate markets and economic conditions in our market areas have recently improved, if slow economic conditions return or real estate values and sales deteriorate, we may experience higher delinquencies and credit losses. As a result, we could be required to increase our provision for loan losses and to charge-off additional loans in the future. If charge-offs in future periods exceed the ALLL, we may need additional provisions to replenish the ALLL.
The determination of the appropriate level of the ALLL inherently involves a high degree of subjectivity and requires us to make various assumptions and judgments about the collectability of our loan portfolio, including the creditworthiness of our borrowers and the value of the real estate and other assets serving as collateral for the repayment of many of our loans. In determining the amount of the ALLL, we review our loans and the loss and delinquency experience and evaluate economic conditions and make significant estimates of current credit risks and future trends, all of which may undergo material changes. If our estimates are incorrect, the ALLL may not be sufficient to cover losses inherent in our loan portfolio, resulting in the need for increases in our provision for loan losses. Deterioration in economic conditions, new information regarding existing loans, identification of additional problem loans or relationships, and other factors, both within and outside of our control, may increase our loan charge‑offs and/or may otherwise require an increase in the ALLL. In addition, bank regulatory agencies periodically review our allowance for loan losses and may require an increase in the provision for possible loan losses or the recognition of further loan charge‑offs based on their judgment about information available to them at the time of their examination. Any increases in the provision for
44
loan losses will result in a decrease in net income and may have a material adverse effect on our financial condition, results of operations, and capital.
In addition, the Financial Accounting Standards Board has adopted new accounting standard 2016-13 that will be effective for our first fiscal year after December 15, 2019. This standard, referred to as Current Expected Credit Loss, or CECL, will require financial institutions to determine periodic estimates of lifetime expected credit losses on loans, and recognize the expected credit losses as allowances for credit losses. This will change the current method of providing allowances for credit losses that are probable, which may require us to increase our allowance for loan losses, and may greatly increase the types of data we would need to collect and review to determine the appropriate level of the allowance for credit losses. For more on this ASU, see Note 1 of the Notes to Consolidated Financial Statements - Recently Issued Accounting Pronouncements contained in Item 8 of this report.
If our investments in other real estate owned are not properly valued and managed our earnings could be reduced.
Our inventory of OREO property reduced from $3.7 million at December 31, 2015 to $2.3 million at December 31, 2016. We use current property valuations in the form of appraisals when a loan has been foreclosed and the property taken in as OREO. Subsequently, an evaluation is performed by our experienced lending staff during the asset’s holding period. Our net book value in the loan at the time of foreclosure and thereafter is compared to the updated market value of the foreclosed property less estimated selling costs (fair value). A charge-off is recorded for any excess in the asset’s net book value over its fair value. If our valuation process is incorrect, the fair value of our investments in OREO may not be sufficient to recover our net book value in such assets, resulting in the need for additional write-downs. During 2016, we had $257,000 in valuation write-downs to our inventory of OREO properties. We may also incur significant property management and legal expenses related to our OREO. Additional material write-downs or expenses relating to our OREO could have a material adverse effect on our financial condition and results of operations.
Bank regulators periodically review our OREO and may require us to recognize additional write-downs. Any increase in our write-downs, as required by such regulators, may have a material adverse effect on our financial condition, results of operations, and capital.
We may incur losses on our securities portfolio as a result of changes in interest rates.
Our securities portfolio may be affected by fluctuations in market value, potentially reducing accumulated other comprehensive income and/or earnings. Fluctuations in market value may be caused by changes in market interest rates, lower market prices for securities and limited investor demand. Our securities portfolio is evaluated for other-than-temporary impairment. If this evaluation shows impairment to the actual or projected cash flows associated with one or more securities, a potential loss to earnings may occur. Changes in interest rates can also have an adverse effect on our financial condition, as our available-for‑sale securities are reported at their estimated fair value, and therefore are impacted by fluctuations in interest rates. We increase or decrease our stockholders’ equity by the amount of change in the estimated fair value of the available-for-sale securities, net of taxes. There can be no assurance that the declines in market value will not result in other-than-temporary impairments of these assets, and would lead to accounting charges that could have a material adverse effect on our net income and capital levels.
Liquidity risk could impair our ability to fund operations and jeopardize our financial condition.
Liquidity is essential to our business, therefore, the inability to obtain adequate funding may negatively affect growth and, consequently, our earnings capability and capital levels. An inability to raise funds through deposits, borrowings, the sale of loans or investment securities, or other sources could have a substantial negative effect on our liquidity. Our access to funding sources in amounts adequate to finance our activities on terms that are acceptable to us could be impaired by factors that affect us specifically or the financial services industry or economy in general. Factors that could detrimentally impact our access to liquidity sources include a decrease in the level of our business activity as a result of a downturn in the Washington markets in which our loans are concentrated, negative operating results, or adverse regulatory action against us. Our ability to borrow could also be impaired by factors that are not specific to us, such as a disruption in the financial markets or negative views and expectations about the prospects for the financial services industry and the continued uncertainty in credit markets. In particular, our liquidity position could be significantly constrained if we are unable to access funds from the FHLB Des Moines, the Federal Reserve Bank of San Francisco or other wholesale funding sources, or if adequate financing is not available at acceptable interest rates. Finally, if we are required to rely more heavily on more expensive funding sources, our revenues may not increase proportionately to cover our costs. In this case, our results of operations and financial condition would be negatively affected. Additionally, collateralized public funds are bank deposits of state and local municipalities. These deposits are required to be secured by certain investment grade securities to ensure repayment that, on the one hand, tends to reduce our contingent liquidity risk by making these funds somewhat less credit sensitive, but on the other hand, reduces standby liquidity by restricting the potential liquidity of the pledged
45
collateral. Although these funds historically have been a relatively stable source of funds for us, availability depends on the individual municipality’s fiscal policies and cash flow needs. At December 31, 2016 we had $23.7 million in public funds.
If limitations arise in our ability to utilize the national brokered deposit market or to replace short-term deposits, our ability to replace maturing deposits on acceptable terms could be adversely impacted.
First Financial Northwest Bank utilizes the national brokered deposit market for a portion of our funding needs. At December 31, 2016, the balance of brokered certificates of deposit was $75.5 million, with remaining maturities of 1.5 to 4 years. If we are unable to participate in this market for any reason in the future, our ability to replace these deposits at maturity could be adversely impacted.
An additional source of deposits for the Bank is construction funds for large developers as part of the EB-5 Immigrant Investor Program (“EB-5 Program”). At December 31, 2016, money market funds included $8.5 million of EB-5 construction accounts with the full balance expected to be withdrawn during 2017. These deposits are expected to be short term in nature. If we are unable to replace these funds as they run off with new accounts, the loss of funds could adversely impact the results of our operations. See also “Non-compliance with the USA PATRIOT Act, Bank Secrecy Act, or other laws and regulations could result in fines or sanctions” below.
Further, there may be competitive pressures to pay higher interest rates on deposits, which would increase our funding costs. If deposit clients move money out of the Bank deposits and into other investments (or into similar products at other institutions that may provide a higher rate of return), we could lose a relatively low cost source of funds, increasing our funding costs and reducing our net interest income and net income. Additionally, any such loss of funds could result in reduced loan originations, which could materially negatively impact our growth strategy and results of operations.
Our limited branch locations limit our ability to attract deposits and as a result, a large portion of our deposits are certificates of deposit, including “jumbo” certificates that may not be as stable as other types of deposits.
With four branch locations in operation during 2016, our ability to compete with larger institutions for noninterest bearing deposits is limited as these institutions have a larger branch network providing greater convenience to customers. As a result, we are dependent on more interest rate sensitive deposits. At December 31, 2016, $356.7 million, or 49.7%, of our total deposits were retail certificates of deposit and, of that amount, $265.2 million were “jumbo” certificates greater than or equal to $100,000, with $91.2 million of these certificates greater than or equal to $250,000. In addition, deposit inflows are significantly influenced by general interest rates. Our money market accounts and jumbo certificates of deposit and the retention of these deposits are particularly sensitive to general interest rates, making these deposits traditionally a more volatile source of funding than other deposit accounts. In order to retain our money market accounts and jumbo certificates of deposit, we may have to pay a higher rate, resulting in an increase in our cost of funds. In a rising rate environment, we may be unwilling or unable to pay a competitive rate because of the resulting compression in our interest rate spread. To the extent that such deposits do not remain with us, they may need to be replaced with borrowings or other deposits that could increase our cost of funds and negatively impact our interest rate spread and financial condition.
Our branching strategy may cause our expenses to increase faster than revenues.
During 2016, we opened branch offices in Edmonds, Washington and at a commercial development at the Renton Landing, adding to our second branch opened in Mill Creek, Washington in 2015. Our current business strategy includes continued similar branch expansion in areas to enhance our market presence. These offices are much smaller than traditional bank branch offices, utilizing the improved technology available with our new core data processor. This allows us to maintain management’s focus on efficiency, while working to expand the Bank’s presence into new markets. The success of our expansion strategy into new markets, however, is contingent upon numerous factors, such as our ability to select suitable locations, assess each market’s competitive environment, secure managerial resources, hire and retain qualified personnel and implement effective marketing strategies. The opening of new offices may not increase the volume of our loans and deposits as quickly or to the degree that we hope, and opening new offices will increase our operating expenses. On average, de novo branches do not become profitable until three to four years after opening. We currently expect to lease rather than own the additional branch properties. Further, the projected time line and the estimated dollar amounts involved in opening de novo branches could differ significantly from actual results. In addition, we may not successfully manage the costs and implementation risks associated with our branching strategy. Accordingly, any new branch may negatively impact our earnings for some period of time until the branch reaches certain economies of scale. Finally, there is a risk that our new branches will not be successful even after they have been established.
46
We may be required to raise additional capital in the future, but that capital may not be available when it is needed, or it may only be available on unacceptable terms, which could adversely affect our financial condition and results of operations.
We are required by federal and state regulatory authorities to maintain adequate levels of capital to support our operations. Our ability to raise additional capital, if needed, will depend on conditions in the capital markets at that time, which are outside of our control, and on our financial performance. Accordingly, we may not be able to raise additional capital, if needed, on terms acceptable to us. If we cannot raise additional capital when needed, our ability to further expand our operations and pursue our growth strategy could be materially impaired and our financial condition and liquidity could be materially and adversely affected. In addition, if we are unable to raise additional capital when required by our bank regulators, we may be subject to adverse regulatory action.
We operate in a highly regulated environment and may be adversely affected by changes in federal and state laws and regulations that are expected to increase our costs of operations.
As a state-chartered, federally insured commercial bank, First Financial Northwest Bank is currently subject to extensive examination, supervision and comprehensive regulation by the FDIC and the DFI and as a bank holding company First Financial Northwest is subject to examination, supervision and regulation by the FRB. These regulatory authorities have extensive discretion in connection with their supervisory and enforcement activities, including the ability to impose restrictions on an institution’s operations, reclassify assets, determine the adequacy of an institution’s ALLL and determine the level of deposit insurance premiums assessed.
Additionally, the Dodd-Frank Wall Street Reform and Consumer Protection Act (the “Dodd-Frank Act”) has significantly changed the bank regulatory structure and will affect the lending, deposit, investment, trading and operating activities of financial institutions and their holding companies. The Dodd-Frank Act requires various federal agencies to adopt a broad range of new implementing rules and regulations, and to prepare numerous studies and reports for Congress. The federal agencies are given significant discretion in drafting the implementing rules and regulations, and consequently, many of the details and much of the impact of the Dodd-Frank Act may not be known for many months or years.
Certain provisions of the Dodd-Frank Act are expected to have a near term impact on us. For example, a provision of the Dodd-Frank Act eliminates the federal prohibitions on paying interest on demand deposits, thus allowing businesses to have interest bearing checking accounts. Depending on competitive responses, this significant change to existing law could have an adverse impact on our interest expense.
The Dodd-Frank Act created a new Consumer Financial Protection Bureau (the “CFPB”) with broad powers to supervise and enforce consumer protection laws. The CFPB has broad rule-making authority for a wide range of consumer protection laws that apply to all banks and savings institutions, including the authority to prohibit “unfair, deceptive or abusive” acts and practices. The CFPB has examination and enforcement authority over all banks and savings institutions with more than $10 billion in assets. Financial institutions such as First Financial Northwest Bank with $10 billion or less in assets will continue to be examined for compliance with the consumer laws by their primary bank regulators but are subject to the rules of the CFPB.
The CFPB has issued a number of final regulations and changes to certain consumer protections under existing laws. These final rules, most of the provisions of which (including the qualified mortgage rule) generally prohibit creditors from extending mortgage loans without regard for the consumer’s ability-to-repay and add restrictions and requirements to mortgage origination and servicing practices. In addition, these rules limit prepayment penalties and require the creditor to retain evidence of compliance with the ability-to-repay requirement for three years. Compliance with these rules has increased our overall regulatory compliance costs and may require changes to our underwriting practices with respect to mortgage loans. This includes compliance with The Truth in Lending Act and the Real Estate Settlement Procedures Act Integrated Disclosure (TRID) rule, which combines certain disclosures that consumers receive in connection with applying for and closing a mortgage loan. Moreover, these rules may adversely affect the volume of mortgage loans that we underwrite and may subject us to increased potential liabilities related to such residential loan origination activities.
It is difficult to predict at this time what specific impact the Dodd-Frank Act and the yet to be written implementing rules and regulations will have on community banks. However, it is expected that at a minimum they will increase our operating and compliance costs, which could adversely affect key operating efficiency ratios, and could increase our interest expense. See - “How We are Regulated” contained in, Item I - Business of this report.
47
Non-compliance with the USA PATRIOT Act, Bank Secrecy Act, or other laws and regulations could result in fines or sanctions.
The USA PATRIOT Act and Bank Secrecy Acts require financial institutions to develop programs to prevent financial institutions from being used for money laundering and terrorist activities. If such activities are detected, financial institutions are obligated to file suspicious activity reports with the U.S. Treasury’s Office of Financial Crimes Enforcement Network. These rules require financial institutions to establish procedures for identifying and verifying the identity of customers seeking to open new financial accounts. Failure to comply with these regulations could result in fines or sanctions. During the last few years, several banking institutions have received large fines for non-compliance with these laws and regulations. While we have developed policies and procedures designed to assist in compliance with these laws and regulations, no assurance can be given that these policies and procedures will be effective in preventing violations of these laws and regulations.
Beginning in 2015, we began opening money market accounts for large construction developers that are typically part of the EB-5 Program. Foreign investors opening accounts at the Bank are required to have filed the I-526 application and to have established U.S. residency. As part of the I-526 application process, funds used in the project are screened to ensure they were obtained through lawful means. If account holders or the source of the funds later prove to be fraudulent, the Bank may be subject to fines or sanctions, or at a minimum, incur reputational damage.
New or changing tax, accounting, and regulatory rules and interpretations could significantly impact strategic initiatives, results of operations, cash flows, and financial condition.
The banking industry is extensively regulated. Federal and state banking regulations are designed primarily to protect the deposit insurance funds and consumers, not to benefit a company’s shareholders. These regulations may sometimes impose significant limitations on operations. The significant federal and state banking regulations that affect us are described in this report under the heading “Item 1. Business- How We are Regulated”. These regulations, along with the currently existing tax, accounting, securities, insurance, and monetary laws, regulations, rules, standards, policies, and interpretations control the methods by which financial institutions conduct business, implement strategic initiatives and tax compliance, and govern financial reporting and disclosures. These laws, regulations, rules, standards, policies, and interpretations are constantly evolving and may change significantly over time. Any new regulations or legislation, change in existing regulations or oversight, whether a change in regulatory policy or a change in a regulator’s interpretation of a law or regulation, could have a material impact on our operations, increase our costs of regulatory compliance and of doing business and or otherwise adversely affect us and our profitability. Further, changes in accounting standards can be both difficult to predict and involve judgment and discretion in their interpretation by us and our independent accounting firms. These changes could materially impact, potentially even retroactively, how we report our financial condition and results of our operations as could our interpretation of those changes.
We are subject to certain risks in connection with our use of technology.
Our security measures may not be sufficient to mitigate the risk of a cyber-attack. Communications and information systems are essential to the conduct of our business, as we use such systems to manage our customer relationships, our general ledger and virtually all other aspects of our business. Our operations rely on the secure processing, storage, and transmission of confidential and other information in our computer systems and networks. Although we take protective measures and endeavor to modify them as circumstances warrant, the security of our computer systems, software, and networks may be vulnerable to breaches, unauthorized access, misuse, computer viruses, or other malicious code and cyber-attacks that could have a security impact. If one or more of these events occur, this could jeopardize our or our customers’ confidential and other information processed and stored in, and transmitted through, our computer systems and networks, or otherwise cause interruptions or malfunctions in our operations or the operations of our customers or counterparties. We may be required to expend significant additional resources to modify our protective measures or to investigate and remediate vulnerabilities or other exposures, and we may be subject to litigation and financial losses that are either not insured against or not fully covered through any insurance maintained by us. We could also suffer significant reputational damage.
We support the ability of our customers to transact business through multiple automated methods. As such, we may be susceptible to fraud performed through these technologies.
Security breaches in our internet banking activities could further expose us to possible liability and damage our reputation. Any compromise of our security also could deter customers from using our internet banking services that involve the transmission of confidential information. We rely on standard internet security systems to provide the security and authentication necessary to effect secure transmission of data. These precautions may not protect our systems from compromises or breaches of our security measures, and could result in significant legal liability and significant damage to our reputation and our business.
48
Our security measures may not protect us from systems failures or interruptions. While we have established policies and procedures to prevent or limit the impact of systems failures and interruptions, there can be no assurance that such events will not occur or that they will be adequately addressed if they do. In addition, we outsource certain aspects of our data processing and other operational functions to certain third-party providers. If our third-party providers encounter difficulties, or if we have difficulty in communicating with them, our ability to adequately process and account for transactions could be affected, and our business operations could be adversely impacted. Threats to information security also exist in the processing of customer information through various other vendors and their personnel.
The occurrence of any failures or interruptions may require us to identify alternative sources of such services, and we cannot assure that we could negotiate terms that are as favorable to us, or could obtain services with similar functionality as found in our existing systems without the need to expend substantial resources, if at all. Further, the occurrence of any systems failure or interruption could damage our reputation and result in a loss of customers and business, could subject us to additional regulatory scrutiny, or could expose us to legal liability. Any of these occurrences could have a material adverse effect on our financial condition and results of operations.
Our business may be adversely affected by an increasing prevalence of fraud and other financial crimes.
Our loans to businesses and individuals and our deposit relationships and related transactions are subject to exposure to the risk of loss due to fraud and other financial crimes. Nationally, reported incidents of fraud and other financial crimes have increased. We have also experienced losses due to apparent fraud and other financial crimes. While we have policies and procedures designed to prevent such losses, there can be no assurance that such losses will not occur.
We are dependent on key personnel and the loss of one or more of those key personnel may materially and adversely affect our prospects.
Competition for qualified employees and personnel in the banking industry is intense and there are a limited number of qualified persons with knowledge of, and experience in, the community banking industry where First Financial Northwest Bank conducts its business. The process of recruiting personnel with the combination of skills and attributes required to carry out our strategies is often lengthy. Our success depends to a significant degree upon our ability to attract and retain qualified management, loan origination, finance, administrative, marketing and technical personnel and upon the continued contributions of our management and personnel. In particular, our success has been and continues to be highly dependent upon the abilities of key executives, including our President, and certain other employees. In addition, our success has been and continues to be highly dependent upon the services of our directors, many of whom are at or nearing retirement age, and we may not be able to identify and attract suitable candidates to replace such directors.
We participate in a multiple employer defined benefit pension plan for the benefit of our employees. If we were to withdraw from this plan, or if Pentegra, the multiple employer defined benefit pension plan sponsor, requires us to make additional contributions, we could incur a substantial expense in connection with the withdrawal or the request for additional contributions.
We participate in the Pentegra Defined Benefit Plan for Financial Institutions, a multiple employer pension plan for the benefit of our employees. Effective March 31, 2013, we did not allow additional employees to participate in this plan. On March 31, 2013, we froze the future accrual of benefits under this plan with respect to those participating employees. In connection with our decision to freeze our benefit accruals under the plan, and since then, we considered withdrawing from the plan.
The actual expense that would be incurred in connection with a withdrawal from the plan is primarily dependent upon the timing of the withdrawal, the total value of the plan’s assets at the time of withdrawal, general market interest rates at that time, expenses imposed on withdrawal, and other conditions imposed by Pentegra as set forth in the plan. If we choose to withdraw from the plan in the future, we could incur a substantial expense in connection with the withdrawal.
Even if we do not withdraw from the plan Pentegra, as sponsor of the plan, may request that we make an additional contribution to the plan, in addition to contributions that we are regularly required to make, or obtain a letter of credit in favor of the plan, if our financial condition worsens to the point that it triggers certain criteria set out in the plan. If we fail to make the contribution or obtain the requested letter of credit, then we may be forced to withdraw from the plan and establish a separate, single employer defined benefit plan that we anticipate would be underfunded to a similar extent as under the multiple employer plan.
49
We rely on dividends from the Bank for substantially all of our revenue at the holding company level.
We are an entity separate and distinct from our principal subsidiary, First Financial Northwest Bank, and derive substantially all of our revenue at the holding company level in the form of dividends from that subsidiary. Accordingly, we are, and will be, dependent upon dividends from the Bank to pay the principal of and interest on our indebtedness, to satisfy our other cash needs and to pay dividends on our common stock. First Financial Northwest Bank’s ability to pay dividends is subject to its ability to earn net income and to meet certain regulatory requirements. In the event the Bank is unable to pay dividends to us, we may not be able to pay dividends on our common stock or continue our stock repurchases. Also, our right to participate in a distribution of assets upon a subsidiary’s liquidation or reorganization is subject to the prior claims of the subsidiary’s creditors.
Item 1B. Unresolved Staff Comments
Not applicable. First Financial Northwest has not received any written comments from the SEC regarding its periodic or current reports under the Securities Exchange Act of 1934, as amended, that are unresolved.
Item 2. Properties
At December 31, 2016, the corporate office for First Financial Northwest and First Financial Northwest Bank is located at 201 Wells Avenue South, Renton, Washington and is owned by us. The Bank’s full service retail operation is also at this location. At December 31, 2016, the Bank conducts community banking activities in leased locations in Mill Creek, Washington, Edmonds, Washington, and “The Landing” in Renton, Washington. The lending division operations of First Financial Northwest Bank are at our owned location at 207 Wells Avenue South, Renton, Washington. This location is also the site for the operations of First Financial Northwest’s wholly-owned subsidiary, First Financial Diversified. Subsequent to December 31, 2016, the Company has received FDIC approval to open a new branch office in the Crossroads area of Bellevue, Washington, which is expected to open early in the second quarter of 2017. The lease terms for our properties are for an initial term of five years with the option to extend for additional five year periods. In the opinion of management, all properties are adequately covered by insurance, are in a good state of repair and are appropriately designed for their present and future use.
Item 3. Legal Proceedings
From time to time, we are involved as plaintiff or defendant in various legal actions arising in the normal course of business. As of December 31, 2016, we were not involved in any significant litigation and do not anticipate incurring any material liability as a result of any such litigation.
Item 4. Mine Safety Disclosures
Not applicable.
PART II
Item 5. Market for Registrant’s Common Equity, Related Stockholder Matters and Issuer Purchases of Equity Securities
Our common stock is traded on The Nasdaq Stock Market LLC’s Global Select Market (“NASDAQ”), under the symbol “FFNW.” As of December 31, 2016, there were 10.9 million shares of common stock issued and outstanding and we had 587 shareholders of record, excluding persons or entities that hold stock in nominee or “street name” accounts with brokers.
Dividends
First Financial Northwest Bank is a wholly-owned subsidiary of First Financial Northwest. Under federal regulations, the dollar amount of dividends First Financial Northwest Bank may pay to First Financial Northwest depends upon its capital position and recent net income. Generally, if First Financial Northwest Bank satisfies its regulatory capital requirements, it may make dividend payments up to the limits prescribed by state law and FDIC regulations. See “Item 1. Business – How We Are Regulated – Regulation and Supervision of First Financial Northwest – Dividends” and Note 13 of the Notes to Consolidated Financial Statements contained in Item 8.
There were $2.8 million in dividends declared and paid during the year ended December 31, 2016 and there were $3.2 million in dividends declared and paid during the year ended December 31, 2015. The price range per share of our common
50
stock presented below represents the highest and lowest sales prices for our common stock on the NASDAQ during each quarter of the two most recent fiscal years.
High | Low | Cash Dividends Declared and Paid | |||||||||
2016 | |||||||||||
First Quarter | $ | 13.88 | $ | 12.51 | $ | 0.06 | |||||
Second Quarter | 13.89 | 12.55 | 0.06 | ||||||||
Third Quarter | 14.20 | 12.88 | 0.06 | ||||||||
Fourth Quarter | 20.54 | 14.06 | 0.06 | ||||||||
2015 | |||||||||||
First Quarter | $ | 12.60 | $ | 11.82 | $ | 0.06 | |||||
Second Quarter | 12.71 | 11.49 | 0.06 | ||||||||
Third Quarter | 12.78 | 11.61 | 0.06 | ||||||||
Fourth Quarter | 14.00 | 11.97 | 0.06 | ||||||||
Stock Repurchases
The Company’s Board of Directors authorized the repurchase of shares of our common stock under two stock repurchase plans and a self-tender offer in 2016. Stock repurchases through the stock repurchase plans are made in accordance with a plan established under the guidelines specified under Rule 10b5-1 of the Securities Exchange Act of 1934 as administered through an independent broker. From January 1, 2016 through April 27, 2016, the Company purchased 436,145 shares at an average price of $13.37 per share under the stock repurchase plan that began on November 2, 2015. On September 9, 2016, the Board of Directors authorized the repurchase of up to 1,500,000 shares of the Company’s stock between September 16, 2016 and March 17, 2017. At December 31, 2016, the Company had repurchased under this stock repurchase plan 1,133,777 shares at an average price of $14.42 per share.
In addition to the stock repurchase plans, on August 9, 2016, the Company completed the repurchase of $18.1 million or 1,294,467 shares at $14.00 per share through a modified Dutch auction tender offer announced July 13, 2016. During 2016, the Company repurchased a total of $40.8 million or 2,864,389 shares at an average price of $14.07 per share.
The following table represents the share repurchased during the fourth quarter ended December 31, 2016.
Period | Total Number of Shares Purchased | Average Price Paid per Share | Total Number of Shares Purchased as Part of Plan | Maximum Number of Shares that May be Repurchased Under the Plan | |||||||||
October 1 - October 31, 2016 (1) | 996,277 | $ | 14.47 | 996,277 | 366,223 | ||||||||
996,277 | 14.47 | 996,277 | 366,223 | ||||||||||
_______________
(1) Shares repurchased under the stock repurchase plan effective September 16, 2016 through March 17, 2017.
Equity Compensation Plan Information
The equity compensation plan information presented under subparagraph (d) in Part III, Item 12 of this report is incorporated herein by reference.
51
Performance Graph
The following graph compares the cumulative total shareholder return on First Financial Northwest’s Common Stock with the cumulative total return on the Russell 2000 Index, the NASDAQ Bank Index, and the SNL Thrift Index, a peer group index. The graph assumes that total return includes the reinvestment of all dividends and that the value of the investment in First Financial Northwest’s common stock and each index was $100 on December 31, 2011, and is the base amount used in the graph. The closing price of First Financial Northwest’s common stock on December 31, 2016 was $19.74.
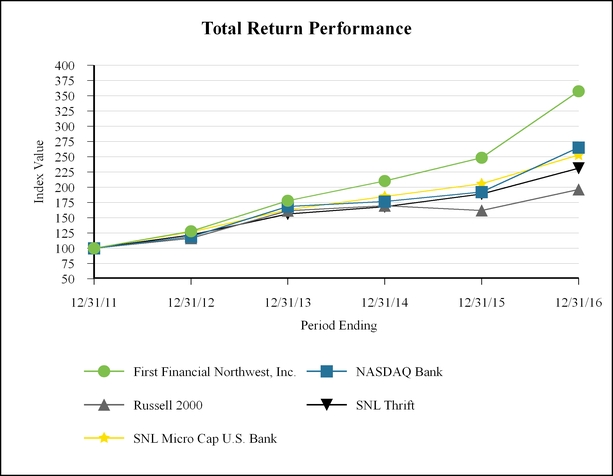
Period Ended | |||||||||||||||||
Index | 12/31/2011 | 12/31/2012 | 12/31/2013 | 12/31/2014 | 12/31/2015 | 12/31/2016 | |||||||||||
First Financial Northwest, Inc. | 100.00 | 127.97 | 177.81 | 210.26 | 248.58 | 357.52 | |||||||||||
NASDAQ Bank Index | 100.00 | 118.69 | 168.21 | 176.48 | 192.08 | 265.02 | |||||||||||
Russell 2000 Index | 100.00 | 116.35 | 161.52 | 169.43 | 161.95 | 196.45 | |||||||||||
SNL Thrift Index | 100.00 | 121.63 | 156.09 | 167.88 | 188.78 | 231.23 | |||||||||||
SNL Micro Cap U.S. Bank | 100.00 | 126.37 | 163.04 | 184.90 | 205.62 | 252.77 | |||||||||||
52
Item 6. Selected Financial Data
The following table sets forth certain information concerning our consolidated financial position and results of operations at and for the dates indicated and has been derived from our audited consolidated financial statements. The information below is qualified in its entirety by the detailed information included elsewhere herein and should be read along with Item 7. “Management’s Discussion and Analysis of Financial Condition and Results of Operations” and Item 8. “Financial Statements and Supplementary Data” included in this Form 10-K.
At or For the Year Ended December 31, | |||||||||||||||||||
2016 | 2015 | 2014 | 2013 | 2012 | |||||||||||||||
FINANCIAL CONDITION DATA: | (In thousands, except share data) | ||||||||||||||||||
Total assets | $ | 1,037,584 | $ | 979,913 | $ | 936,997 | $ | 920,979 | $ | 942,655 | |||||||||
Investments available-for-sale | 129,260 | 129,565 | 120,374 | 144,364 | 152,262 | ||||||||||||||
Loans receivable, net (1) | 815,043 | 685,072 | 663,938 | 663,153 | 650,468 | ||||||||||||||
Deposits | 717,476 | 675,407 | 614,127 | 612,065 | 665,797 | ||||||||||||||
Advances from the FHLB | 171,500 | 125,500 | 135,500 | 119,000 | 83,066 | ||||||||||||||
Stockholders’ equity | 138,125 | 170,673 | 181,412 | 184,355 | 187,117 | ||||||||||||||
OPERATING DATA: | |||||||||||||||||||
Interest income | $ | 41,709 | $ | 37,197 | $ | 38,689 | $ | 38,539 | $ | 41,466 | |||||||||
Interest expense | 7,507 | 6,751 | 6,241 | 7,526 | 12,246 | ||||||||||||||
Net interest income | 34,202 | 30,446 | 32,448 | 31,013 | 29,220 | ||||||||||||||
Provision (recapture of provision) for loan losses | 1,300 | (2,200 | ) | (2,100 | ) | (100 | ) | 3,050 | |||||||||||
Net interest income after provision (recapture of provision) for loan losses | 32,902 | 32,646 | 34,548 | 31,113 | 26,170 | ||||||||||||||
Noninterest income | 2,651 | 1,279 | 498 | 891 | 974 | ||||||||||||||
Noninterest expense | 22,949 | 19,878 | 18,503 | 21,082 | 25,430 | ||||||||||||||
Income before provision (benefit) for federal income taxes | 12,604 | 14,047 | 16,543 | 10,922 | 1,714 | ||||||||||||||
Provision (benefit) for federal income taxes | 3,712 | 4,887 | 5,856 | (13,543 | ) | (999 | ) | ||||||||||||
Net income | $ | 8,892 | $ | 9,160 | $ | 10,687 | $ | 24,465 | $ | 2,713 | |||||||||
Basic earnings per share | $ | 0.75 | $ | 0.67 | $ | 0.72 | $ | 1.47 | $ | 0.15 | |||||||||
Diluted earnings per share | $ | 0.74 | $ | 0.67 | $ | 0.71 | $ | 1.46 | $ | 0.15 | |||||||||
___________________
(1) Net of ALLL, LIP and deferred loan fees and costs.
53
At or For the Year Ended December 31, | |||||||||||||||||||
KEY FINANCIAL RATIOS: | 2016 | 2015 | 2014 | 2013 | 2012 | ||||||||||||||
Performance Ratios: | |||||||||||||||||||
Return on average assets | 0.88 | % | 0.96 | % | 1.17 | % | 2.73 | % | 0.27 | % | |||||||||
Return on average equity | 5.55 | 5.15 | 5.85 | 13.12 | 1.47 | ||||||||||||||
Dividend payout ratio | 32.02 | 35.57 | 27.73 | 8.11 | — | ||||||||||||||
Equity-to-assets ratio | 13.31 | 17.42 | 19.36 | 20.02 | 19.85 | ||||||||||||||
Interest rate spread | 3.47 | 3.23 | 3.62 | 3.49 | 2.85 | ||||||||||||||
Net interest margin | 3.60 | 3.38 | 3.77 | 3.68 | 3.08 | ||||||||||||||
Average interest-earning assets to average interest-bearing liabilities | 117.11 | 120.45 | 121.15 | 121.77 | 118.12 | ||||||||||||||
Efficiency ratio | 62.27 | 62.66 | 56.37 | 66.08 | 84.22 | ||||||||||||||
Noninterest expense as a percent of average total assets | 2.27 | 2.07 | 2.03 | 2.36 | 2.54 | ||||||||||||||
Book value per common share | $ | 12.63 | $ | 12.40 | $ | 11.96 | $ | 11.25 | $ | 9.95 | |||||||||
Capital Ratios: (1) | |||||||||||||||||||
Tier 1 leverage | 11.17 | % | 11.61 | % | 11.79 | % | 18.60 | % | 15.79 | % | |||||||||
Common equity tier 1 | 14.36 | 16.36 | n/a | n/a | n/a | ||||||||||||||
Tier 1 capital ratio | 14.36 | 16.36 | 18.30 | 27.18 | 26.11 | ||||||||||||||
Total capital ratio | 15.61 | 17.62 | 19.56 | 28.44 | 27.37 | ||||||||||||||
Asset Quality Ratios: (2) | |||||||||||||||||||
Nonperforming loans as a percent of total loans | 0.10 | 0.16 | 0.20 | 0.59 | 3.42 | ||||||||||||||
Nonperforming assets as a percent of total assets | 0.31 | 0.48 | 1.13 | 1.68 | 4.25 | ||||||||||||||
ALLL as a percent of total loans, net of LIP | 1.32 | 1.36 | 1.55 | 1.91 | 1.89 | ||||||||||||||
ALLL as a percent of nonperforming loans, net of LIP | 1,276.34 | 872.17 | 783.50 | 325.26 | 55.11 | ||||||||||||||
Net (recoveries) charge-offs to average loans receivable, net | (0.02 | ) | (0.18 | ) | 0.06 | (0.08 | ) | 1.07 | |||||||||||
_______________
(1) Capital ratios are for First Financial Northwest Bank only.
(2) Loans are reported net of LIP.
Item 7. Management’s Discussion and Analysis of Financial Condition and Results of Operations
This discussion and analysis reviews our consolidated financial statements and other relevant statistical data and is intended to enhance your understanding of our financial condition and results of operations. The information in this section has been derived from the Consolidated Financial Statements and footnotes thereto that appear in Item 8 of this Form 10-K. The information contained in this section should be read in conjunction with these Consolidated Financial Statements and footnotes and the business and financial information provided in this Form 10-K. Unless otherwise indicated, the financial information presented in this section reflects the consolidated financial condition and results of operations of First Financial Northwest and its subsidiaries.
Overview
First Financial Northwest Bank is a wholly-owned subsidiary of First Financial Northwest and, as such, comprises substantially all of the activity for First Financial Northwest. First Financial Northwest Bank was a community-based savings bank until February 4, 2016, when the Bank converted to a Washington chartered commercial bank reflecting the commercial banking services it now provides to its customers. The Bank primarily serves King and to a lesser extent, Snohomish, Pierce, and Kitsap counties, Washington through our full-service banking office located in Renton, Washington. Additional branches opened in Mill Creek, Washington in September 2015, Edmonds, Washington in March 2016, and The Landing in Renton, Washington in July 2016.
First Financial Northwest Bank’s business consists predominantly of attracting deposits from the general public, combined with borrowing from the Federal Home Loan Bank of Des Moines (“FHLB”) and raising funds in the wholesale market, then
54
utilizing these funds to originate or purchase one-to-four family residential, multifamily, commercial real estate, construction/land, business, and consumer loans.
Our current business strategy emphasizes commercial real estate, construction/land, one-to-four family residential, and multifamily lending. Recently, improvements in the economy, employment rates, stronger real estate prices, and a general lack of new housing inventory in certain areas in the Puget Sound region have led to our significantly increasing originations of construction loans for properties located in our market area. We anticipate that construction/land lending will continue to be a strong element of our total loan portfolio in future periods. We will continue to take a disciplined approach in our construction/land lending by concentrating our efforts on one-to-four residential loans to builders known to us. On a limited basis, we also will provide multifamily loans to developers with proven success in this type of construction. Originations of construction/land loans increased from $68.6 million in 2015 to $165.4 million in 2016. These short term loans typically mature in six to eighteen months. In addition, the funding is usually not fully disbursed at origination, thereby reducing our net loans receivable in the short term. At December 31, 2016, construction/land loans net of LIP was $136.9 million, a 120.5% increase from $62.1 million at December 31, 2015.
In addition, we are geographically expanding our loan portfolio through loan purchases or loan participations of commercial and multifamily real estate loans that are outside of our primary market area. We recently hired a loan officer with extensive experience in California to further support our efforts to geographically diversify our loan portfolio through direct loan originations, loan participations, or loan purchases.
In support of our strategic growth plan, the Bank is seeking niche expansion opportunities. We have employees with the language and experience to meet the specific deposit and lending needs of the Chinese/American community. In addition, we are developing a national line of business to originate and service aircraft loans. These loans will be collateralized by new or used, single-engine piston aircraft to light jets for business or personal use. We anticipate that our aircraft loans will initially range in size from $250,000 to $3.0 million and the primary focus of our underwriting guidelines will be on the asset value of the collateral rather than the ability of the borrower to repay the loan. We began originating aircraft loans in the fourth quarter of 2016.
With the current low interest rate environment, we are not aggressively pursuing longer term assets, but rather are focused on financing shorter term loans, in particular construction/land loans. During 2016, originations of new loans and refinances outpaced repayments, resulting in net loans receivable of $815.0 million at December 31, 2016, as compared to $685.1 million at December 31, 2015.
Our primary source of revenue is interest income, which is the income that we earn on our loans and investments. Interest expense is the interest that we pay on our deposits and borrowings. Net interest income is the difference between interest income and interest expense. Changes in levels of interest rates affect interest income and interest expense differently and, thus, impacts our net interest income. First Financial Northwest Bank is liability-sensitive, meaning our interest-bearing liabilities reprice at a faster rate than our interest-earning assets. During the year ended December 31, 2016, changes in the composition of our interest‑earning assets and interest-bearing liabilities resulted in an increase in our net interest rate spread to 3.47% for the year ended December 31, 2016 from 3.23% for the year ended December 31, 2015 while our net interest margin increased to 3.60% compared to 3.38% for the prior year.
An offset to net interest income is the provision for loan losses, or the recapture of the provision for loan losses, that is required to establish the ALLL at a level that adequately provides for probable losses inherent in our loan portfolio. As our loan portfolio increases, or due to an increase for probable losses inherent in our loan portfolio, our ALLL may increase, resulting in a decrease to net interest income. Improvements in loan risk ratings, increases in property values, or receipt of recoveries of amounts previously charged off may partially or fully offset any increase to ALLL due to loan growth or an increase in probable loan losses. During 2016, we had a provision for loan losses of $1.3 million, as compared to a recapture of $2.2 million for the year ended December 31, 2015. The provision for loan losses during 2016 was primarily attributable to the $129.9 million growth in net loans receivable. Our total adversely classified loans decreased $1.4 million during 2016, to $1.9 million at December 31, 2016, from $3.3 million at December 31, 2015. We will continue to monitor our loan portfolio and make adjustments to our ALLL as we deem necessary.
Noninterest income is generated from various loan or deposit fees, increases in the cash surrender value of bank owned life insurance (“BOLI”), and revenue earned on our wealth management brokerage services. This income is increased or partially offset by any net gain or loss on sales of investment securities. Our noninterest income increased $1.4 million during the year ended December 31, 2016 as compared to 2015. The increase was primarily attributable to a $630,000 increase in wealth management revenue, a $473,000 increase in other noninterest income and a $311,000 increase in the value of our BOLI policies.
Our noninterest expenses consist primarily of salaries and employee benefits, professional fees, regulatory assessments, occupancy and equipment, and other general and administrative expenses. Salaries and employee benefits consist primarily of the
55
salaries and wages paid to our employees, payroll taxes, expenses for retirement, and other employee benefits. OREO-related expenses consist primarily of maintenance and costs of utilities for the OREO inventory, market valuation adjustments, build-out expenses, gains and losses from OREO sales, legal fees, real estate taxes, and insurance related to the properties included in the OREO inventory. Professional fees include legal services, auditing and accounting services, computer support services, and other professional services in support of strategic plans. Occupancy and equipment expenses, which are the fixed and variable costs of buildings and equipment, consist primarily of real estate taxes, depreciation expenses, maintenance, and costs of utilities. Also included in noninterest expense are changes to the Company’s unfunded commitment reserve which are reflected in general and administrative expenses. This unfunded commitment reserve expense can vary significantly each quarter, based on the amount believed by management to be sufficient to absorb estimated probable losses related to unfunded credit facilities, and reflects changes in the amounts that the Company has committed to fund but has not yet disbursed. Our noninterest expenses increased $3.0 million during the year ended December 31, 2016 as compared to 2015. The increase was primarily attributable to a $1.4 million increase in salary and employee benefits expenses, a $544,000 increase in occupancy and equipment expenses, and a $778,000 increase in OREO-related expenses in 2016 as compared to 2015, which included a $526,000 gain on sale of OREO properties.
Net income for the year ended December 31, 2016 was $8.9 million or $0.74 per diluted share, compared to $9.2 million, or $0.67 per diluted share for the year ended December 31, 2015. The decrease in net income for the year ended December 31, 2016 was primarily the result of a $3.0 million increase in noninterest expense, combined with the $1.3 million provision for loan losses in 2016 as compared to a $2.2 million recapture in 2015, partially offset by a $3.8 million increase in net interest income due to the increase in net loans receivable, a $1.4 million increase in noninterest income and a $1.2 million decrease in federal income tax provision.
Business Strategy
Our long-term business strategy is to operate and grow First Financial Northwest Bank as a well-capitalized and profitable community bank, offering one-to-four family residential, commercial and multifamily, construction/land, consumer and business loans along with a diversified array of deposit and other products and services to individuals and businesses in our market areas. We intend to accomplish this strategy by leveraging our established name and franchise, capital strength, and loan production capability by:
• | Capitalizing on our intimate knowledge of our local communities to serve the convenience and needs of customers, and delivering a consistent, high-quality level of professional service; |
• | Offering competitive deposit rates and developing customer relationships to expand our core deposits, diversifying the deposit mix, growing lower cost deposits, attracting new customers, and expanding our footprint in the geographical area we serve; |
• | Utilizing wholesale funding sources, including but not limited to FHLB advances and acquiring deposits in the national brokered certificate of deposit market, to assist with funding needs and interest rate risk management efforts, as needed; |
• | Managing our loan portfolio to minimize concentration risk and diversify the types of loans within the portfolio; |
• | Managing credit risk to minimize the risk of loss and interest rate risk to optimize our net interest margin; and |
• | Improving profitability through disciplined pricing, expense control and balance sheet management, while continuing to provide excellent customer service. |
Critical Accounting Policies
Critical accounting policies are those that involve significant judgments and assumptions by management and that have, or could have, a material impact on our income or the carrying value of our assets. The following are our critical accounting policies.
Allowance for Loan Losses. Management recognizes that loan losses may occur over the life of a loan and that the ALLL must be maintained at a level necessary to absorb specific losses on impaired loans and probable losses inherent in the loan portfolio. Our methodology for analyzing the ALLL consists of two components: general and specific allowances. The general allowance is determined by applying factors to our various groups of loans. Management considers factors such as charge-off history, the current and expected economic conditions, borrower’s ability to repay, the regulatory environment, competition, geographic and loan type concentrations, policy and underwriting standards, nature and volume of the loan portfolio, management’s experience level, our loan review and grading systems, the value of underlying collateral, and the level of problem loans in assessing the ALLL. Specific allowances result when management performs an impairment analysis on a loan when it determines it is probable that all contractual amounts of principal and interest will not be paid as scheduled. The analysis usually occurs when a loan has been classified as substandard or placed on nonaccrual status. If the market value less costs to sell (“market value”) of
56
the impaired loan is less than the recorded investment in the loan, impairment is recognized by establishing a specific reserve in the ALLL for the loan or by adjusting an existing reserve amount. The amount of the specific reserve is computed using current appraisals, listed sales prices, and other available information less costs to complete, if any, and costs to sell the property. This evaluation is inherently subjective as it requires estimates that are susceptible to significant revision as more information becomes available or as future events differ from predictions. In addition, specific reserves may be created upon a loan’s restructuring, based on a discounted cash flow analysis, comparing the present value of the anticipated repayments under the restructured terms to the outstanding principal balance of the loan.
Our Board of Directors’ Internal Asset Review Committee reviews and recommends for approval the allowance for loan losses on a quarterly basis, and any related provision or recapture of provision for loan losses, and the full Board of Directors approves the provision or recapture after considering the Committee’s recommendations. The allowance is increased by the provision for loan losses which is charged against current period earnings. When analysis of the loan portfolio warrants, the allowance is decreased and a recapture of provision of loan losses is included in current period earnings.
We believe that the ALLL is a critical accounting estimate because it is highly susceptible to change from period‑to‑period requiring management to make assumptions about probable losses inherent in the loan portfolio. The impact of an unexpected large loss could deplete the allowance and potentially require increased provisions to replenish the allowance, thereby reducing earnings. For additional information see Item 1A. “Risk Factors – Our allowance for loan losses may prove to be insufficient to absorb losses in our loan portfolio,” in this Form 10-K.
Valuation of OREO. Real estate properties acquired through foreclosure or by deed-in-lieu of foreclosure are recorded at the lower of cost or fair value less estimated costs to sell. Fair value is generally determined by management based on a number of factors, including third-party appraisals of fair value in an orderly sale. Accordingly, the valuation of OREO is subject to significant external and internal judgment. If the carrying value of the loan at the date a property is transferred into OREO exceeds the fair value less estimated costs to sell, the excess is charged to the ALLL. Management periodically reviews OREO values to determine whether the property continues to be carried at the lower of its recorded book value or fair value, net of estimated costs to sell. Any further decreases in the value of OREO are considered valuation adjustments and are charged to noninterest expense in the Consolidated Income Statements. Expenses and income from the maintenance and operations and any gains or losses from the sales of OREO are included in noninterest expense.
Deferred Taxes. Deferred tax assets arise from a variety of sources, the most significant being expenses recognized in our financial statements but disallowed in the tax return until the associated cash flow occurs, and write-downs in the value of assets for financial statement purposes that are not deductible for tax purposes until the asset is sold or deemed worthless.
When warranted, we record a valuation allowance to reduce our deferred tax assets to the amount that can be recognized in line with the relevant accounting standards. The level of deferred tax asset recognition is influenced by management’s assessment of our historic and future profitability profile. At each balance sheet date, existing assessments are reviewed and, if necessary, revised to reflect changed circumstances. In a situation where income is less than projected or recent losses have been incurred, the relevant accounting standards require convincing evidence that there will be sufficient future tax capacity. For additional information regarding our deferred taxes, see Note 12 of the Notes to Consolidated Financial Statements contained in Item 8.
Other-Than-Temporary Impairments On the Market Value of Investments. Declines in the fair value of available‑for‑sale or held-to-maturity investments below their cost that is deemed to be other-than-temporary results in a reduction in the carrying amount of such investments to their fair value. A charge to earnings and an establishment of a new cost basis for the investment is made. Unrealized investment losses are evaluated at least quarterly to determine whether such declines should be considered other-than-temporary and therefore be subject to immediate loss recognition. Although these evaluations involve significant judgment, an unrealized loss in the fair value of a debt security is generally deemed to be temporary when the fair value of the investment security is below the carrying value primarily due to changes in interest rates and there has not been significant deterioration in the financial condition of the issuer. Other factors that may be considered in determining whether a decline in the value of a debt security is other-than-temporary include ratings by recognized rating agencies; the extent and duration of an unrealized loss position; actions of commercial banks or other lenders relative to the continued extension of credit facilities to the issuer of the security; the financial condition, capital strength and near-term prospects of the issuer and recommendations of investment advisers or market analysts. Therefore, deterioration of market conditions could result in impairment losses recognized within the investment portfolio.
Fair Value. FASB ASC 820, Fair Value Measurements and Disclosures, establishes a hierarchical disclosure framework associated with the level of pricing observability utilized in measuring financial instruments at fair value. The degree of judgment utilized in measuring the fair value of financial instruments generally correlates to the level of pricing observability. Financial instruments with readily available active quoted prices or for which fair value can be measured from actively quoted prices generally
57
will have a higher degree of pricing observability and a lesser degree of judgment utilized in measuring fair value. Conversely, financial instruments rarely traded or not quoted will generally have little or no pricing observability and a higher degree of judgment utilized in measuring fair value. Pricing observability is impacted by a number of factors, including the type of financial instrument, whether the financial instrument is new to the market and not yet established and the characteristics specific to the transaction. See Note 6 of the Notes to Consolidated Financial Statements contained in Item 8 for additional information about the level of pricing transparency associated with financial instruments carried at fair value.
Derivatives and Hedge Accounting. The Bank recognizes its interest rate swap as a cash flow hedge derivative instrument, and as such, reports the fair value as an asset or liability. Fair value is based on dealer quotes, pricing models, discounted cash flow methodologies or similar techniques for which the determination of fair value may require significant management judgment or estimation. The derivative is marked to its fair value through other comprehensive income. Any ineffectiveness is recognized in earnings. The gain or loss on the derivative is removed from equity and recognized in noninterest income in the same period the corresponding loss or gain on the hedged cash flow is recognized in earnings.
Comparison of Financial Condition at December 31, 2016 and December 31, 2015
Assets. The following table details the changes in the composition of our assets at December 31, 2016 from December 31, 2015.
Balance at December 31, 2016 | Change from December 31, 2015 | Percentage Change | ||||||||
(Dollars in thousands) | ||||||||||
Cash on hand and in banks | $ | 5,779 | $ | 66 | 1.2 | % | ||||
Interest-earning deposits | 25,573 | (74,425 | ) | (74.4 | ) | |||||
Investments available-for-sale, at fair value | 129,260 | (305 | ) | (0.2 | ) | |||||
Loans receivable, net | 815,043 | 129,971 | 19.0 | |||||||
Premises and equipment, net | 18,461 | 754 | 4.3 | |||||||
FHLB stock, at cost | 8,031 | 1,894 | 30.9 | |||||||
Accrued interest receivable | 3,147 | 179 | 6.0 | |||||||
Deferred tax assets, net | 3,142 | (1,414 | ) | (31.0 | ) | |||||
OREO | 2,331 | (1,332 | ) | (36.4 | ) | |||||
Bank owned life insurance (“BOLI”) | 24,153 | 844 | 3.6 | |||||||
Prepaid expenses and other assets | 2,664 | 1,439 | 117.5 | |||||||
Total assets | $ | 1,037,584 | $ | 57,671 | 5.9 | % | ||||
During 2016, total assets surpassed $1.0 billion with a $57.7 million increase in total assets during the year. The increase was primarily a result of redirecting $74.4 million from lower-yielding interest-earning deposits, consisting primarily of funds held at the Federal Reserve Bank of San Francisco, to partially fund the $130.0 million growth in higher-yielding loans receivable.
Investments. Our investments available-for-sale remained stable during 2016 with a $305,000 or 0.2% decrease to $129.3 million at December 31, 2016 from $129.6 million at December 31, 2015. During 2016, we continued to restructure our available‑for‑sale investment portfolio to transition our investment portfolio to securities with longer maturity periods, higher yields, and primarily fixed rates in order to enhance our interest income. During the year, we purchased $44.6 million of securities with an expected yield of 2.99%, partially funded by sales of $25.9 million with an average yield of 1.68%. Restructuring of our investment portfolio during 2016 and 2015 resulted in an increase in average yield of our available-for-sale investments to 2.31% in 2016 from 1.84% in 2015. The purchases included $31.9 million in fixed rate and $12.0 million in variable rate securities. These consisted of $28.2 million in mortgage-backed securities, $10.0 million in corporate bonds, consisting of two subordinated debt instruments issued by well capitalized financial institutions located in southern California in the amounts of $5.0 million each, $4.0 million in U.S. government agency bonds and $1.7 million in municipal bonds. The sales of investments available-for-sale generated a net gain of $50,000 for the year ended December 31, 2016. We also received calls or partial calls of $438,000 of U.S. Government agency and municipal securities. In addition to the purchase and call activity, we received principal repayments of $15.9 million on our investments available-for-sale during the 2016.
The effective duration of our portfolio increased to 4.00% at December 31, 2016 as compared to 3.20% at December 31, 2015. Effective duration is a measure that attempts to quantify the anticipated percentage change in the value of an investment
58
(or portfolio) in the event of a 100 basis point change in market yields. Since the Bank’s portfolio includes securities with embedded options (including call options on bonds and prepayment options on mortgage-backed securities), management believes that effective duration is an appropriate metric to use as a tool when analyzing the Bank’s investment securities portfolio, as effective duration incorporates assumptions relating to such embedded options, including changes in cash flow assumptions as interest rates change.
Loans receivable. Net loans receivable increased by $129.9 million during 2016 to $815.0 million primarily due to increases of $74.8 million, or 120.5% in our net construction/land loans and $59.5 million or 24.4% in our commercial real estate loans. These increases were partially offset by a decrease of $4.3 million in our one-to-four family residential loans. Commercial real estate and one-to-four family residential loans continue to be the largest concentrations in our loan portfolio at 33.7% and 27.7%, respectively, of total loans. Our construction/land loans increased to 23.2% of our total loan portfolio in 2016 from 15.5% in 2015 as we continue to originate more of these shorter term, higher yielding loans. During 2016, we supplemented our loan originations by purchasing $61.1 million in performing residential and non-residential commercial real estate and multifamily loans from other financial institutions. The loans were purchased at a 1.8% - 3.0% premium and are intended to be held to maturity. Included in these real estate loan purchases were $20.9 million of real estate loans secured by properties located in Washington. The remaining balance of $40.2 million of loan purchases were multifamily and commercial real estate loans secured by properties located in Arizona, California, Colorado, Oregon, and Utah, reflecting our efforts to geographically diversify our loan portfolio with loans meeting our investment and credit quality objectives.
The quality of our loan portfolio continued to improve during 2016 as our nonperforming loans decreased to $858,000 at December 31, 2016 from $1.1 million at December 31, 2015. Nonperforming loans as a percent of our total loans remained low at 0.10% and 0.16% at December 31, 2016 and 2015, respectively. Adversely classified loans, defined as substandard or below, decreased to $1.9 million at December 31, 2016, from $3.3 million at December 31, 2015. The following table presents a breakdown of our nonperforming assets:
December 31, | Amount of Change | Percent of Change | |||||||||||||
2016 | 2015 | ||||||||||||||
(Dollars in thousands) | |||||||||||||||
Nonperforming loans: | |||||||||||||||
One-to-four family residential | $ | 798 | $ | 996 | $ | (198 | ) | (19.9 | )% | ||||||
Consumer | 60 | 89 | (29 | ) | (32.6 | ) | |||||||||
Total nonperforming loans | 858 | 1,085 | (227 | ) | (20.9 | ) | |||||||||
OREO | 2,331 | 3,663 | (1,332 | ) | (36.4 | ) | |||||||||
Total nonperforming assets | $ | 3,189 | $ | 4,748 | $ | (1,559 | ) | (32.8 | )% | ||||||
We continued to focus on reducing our nonperforming assets through loan work outs or pursuing foreclosure. Foregone interest during the year ended December 31, 2016 relating to nonperforming loans totaled $51,000. There was no LIP related to nonperforming loans at December 31, 2016 or 2015. OREO decreased to $2.3 million at December 31, 2016 as we continue to sell our inventory of foreclosed real estate. During 2016, we sold two properties for $988,000 and had no additional foreclosures. During 2015, we sold nine properties for $6.2 million and foreclosed on one property for $141,000. The decline in both the transfer of properties into OREO and the sale of OREO properties reflects our continuing efforts to identify the problem loans within our portfolio and to take prompt appropriate actions to turn nonperforming assets into performing assets.
Allowance for loan and lease losses. We believe that we use the best information available to establish the ALLL, and that the ALLL as of December 31, 2016 was adequate to absorb the probable and inherent losses in the loan portfolio at that date. While we believe the estimates and assumptions used in our determination of the adequacy of the allowance are reasonable, there can be no assurance that such estimates and assumptions will not be proven incorrect in the future, or that the actual amount of future provisions will not exceed the amount of past provisions, or that any increased provisions that may be required will not adversely impact our financial condition and results of operations. Future additions to the allowance may become necessary based upon changing economic conditions, the level of problem loans, business conditions, credit concentrations, increased loan balances, or changes in the underlying collateral of the loan portfolio. In addition, the determination of the amount of our ALLL is subject to review by bank regulators as part of the routine examination process that which may result in the establishment of additional loss reserves or the charge-off of specific loans against established loss reserves based upon their judgment of information available to them at the time of their examination.
59
The ALLL was $11.0 million or 1.32% of total loans outstanding at December 31, 2016 as compared to $9.5 million or 1.36% of total loans outstanding at December 31, 2015. The ALLL represented 1276.3% of nonperforming loans at December 31, 2016 compared to 872.2% at December 31, 2015. The following table details activity and information related to the ALLL for the years ended December 31, 2016 and 2015. All loan balances and ratios are calculated using loan balances that are net of LIP.
At or For the Years Ended December 31, | |||||||
2016 | 2015 | ||||||
(Dollars in thousands) | |||||||
ALLL balance at beginning of year | $ | 9,463 | $ | 10,491 | |||
Recapture of provision for loan losses | 1,300 | (2,200 | ) | ||||
Charge-offs | (83 | ) | (362 | ) | |||
Recoveries | 271 | 1,534 | |||||
ALLL balance at end of year | $ | 10,951 | $ | 9,463 | |||
ALLL as a percent of total loans, net of LIP | 1.32 | % | 1.36 | % | |||
ALLL as a percent of nonperforming loans | 1,276.34 | 872.17 | |||||
Total nonperforming loans | $ | 858 | $ | 1,085 | |||
Nonperforming loans as a percent of total loans | 0.10 | % | 0.16 | % | |||
Total loans receivable, net LIP | $ | 828,161 | $ | 697,416 | |||
Total loans originated | 399,019 | 229,780 | |||||
Deposits. During the year ended December 31, 2016, deposits increased $42.1 million to $717.5 million as compared to $675.4 million at December 31, 2015. Our retail certificates of deposit increased by $32.8 million primarily as a result of the increased customer base with our new branch locations. Retail deposits in our three new branch locations increased by $30.6 million during 2016 as a direct result of our added market presence and focus on relationship development. These efforts also resulted in a $4.0 million increase in noninterest-bearing deposits and a $2.3 million increase in interest-bearing demand deposits.
Partially offsetting these increases, our money market accounts decreased by $6.4 million during the year ended December 31, 2016. Money market accounts related to short term deposits from large construction developers that are part of the EB-5 Immigrant Investor Program to fund development projects decreased from $62.8 million at December 31, 2015 to $8.5 million at December 31, 2016 as these funds were withdrawn in support of the construction projects. We do not anticipate new short term accounts of this nature to be a significant part of our retail deposits.
Brokered certificates of deposit increased by $9.3 million during the year to $75.5 million at December 31, 2016. While brokered certificates of deposit may carry a higher cost than our retail certificates, their remaining maturity periods of 18 to 48 months, along with the enhanced call features of the majority of these deposits, assist us in our interest rate risk management efforts.
At December 31, 2016 and December 31, 2015, we held $23.7 million and $16.0 million in public funds, respectively, nearly all of which were retail certificates of deposit.
Advances. We use advances from the FHLB as an alternative funding source to manage funding costs, reduce interest rate risk and to leverage our balance sheet. Total FHLB advances at December 31, 2016 were $171.5 million as compared to $125.5 million at December 31, 2015. During 2016, we restructured our borrowings by paying off $84.0 million of maturing advances, and adding an $80.0 million FHLB member option variable rate advance which reprices monthly and allows prepayment without penalties on the repricing dates and a $50.0 million three-month fixed rate advance entered into simultaneously with an interest rate swap for the same amount. Our average borrowings during 2016 were $163.9 million. At December 31, 2016, $70.0 million of our FHLB advances were due to mature in 2017, $21.5 million were due in one to three years and the remaining $80.0 million is due to mature in seven years.
Cash Flow Hedge. As part of its interest rate risk management efforts, the Bank entered into a five-year, $50 million notional, pay fixed, receive floating cash flow hedge or interest rate swap with a qualified institution on October 25, 2016. Under the terms of the agreement, the Bank will pay a fixed interest rate of 1.34% for five years and will in return receive an interest
60
payment based on the three-month LIBOR index, which resets quarterly. Concurrently, the Bank borrowed a $50 million fixed rate three-month FHLB advance that will be renewed quarterly at the fixed interest rate at that time. Effectiveness of the swap is evaluated quarterly with any ineffectiveness recognized as a gain or a loss on the income statement in noninterest income. A change in the fair value of the cash flow hedge is recognized as an other asset or other liability on the balance sheet with the tax-effected portion of the change included in other comprehensive income. At December 31, 2016, we recognized a $1.3 million fair value asset as a result of the increase in market value of the hedge agreement.
Stockholders’ Equity. Total stockholders’ equity decreased $32.5 million, or 19.1% to $138.1 million at December 31, 2016 from $170.7 million at December 31, 2015, primarily due to common stock repurchases totaling $40.8 million. Partially offsetting the repurchase activity, retained earnings increased $6.1 million due to net income of $8.9 million for 2016, reduced by $2.8 million of dividends paid to shareholders. Additional paid-in-capital decreased $39.5 million due to the repurchase and retirement of 2,864,389 shares of common stock at an average price of $14.07 per share, partially offset by $621,000 of stock‑based compensation expense, $297,000 from the exercise of stock options and $476,000 from the annual allocation of ESOP shares.
Comparison of Operating Results for the Years Ended December 31, 2016 and December 31, 2015
Net Interest Income. Net interest income in 2016 was $34.2 million, a $3.8 million or 12.3% increase from $30.4 million in 2015 due to a $4.5 million increase in interest income partially offset by a $756,000 increase in interest expense. The increase in interest income was primarily a result of a $50.5 million increase during the year ended December 31, 2016 in the average balance of our interest-earning assets, primarily due to our loan growth. In addition, as we moved funds from lower yielding interest-earning deposits to higher yielding loans receivable, we improved the total average yield on interest-earning assets by 26 basis points to 4.39% for the year ended December 31, 2016 as compared 4.13% for the prior year. These changes resulted in an increase to our interest rate spread of 24 basis points to 3.47% for the year ended December 31, 2016 from 3.23%. In addition, for the year ended December 31, 2016 our net interest margin increased 22 basis points to 3.60% from 3.38% for the year ended December 31, 2015. The following table compares average interest-earning asset balances, associated yields, and resulting changes in interest and dividend income for the years ended December 31, 2016 and 2015:
Year Ended December 31, | |||||||||||||||||
2016 | 2015 | Change in Interest and Dividend Income | |||||||||||||||
Average Balance | Yield | Average Balance | Yield | ||||||||||||||
(Dollars in thousands) | |||||||||||||||||
Loans receivable, net | $ | 765,948 | 4.99 | % | $ | 667,739 | 5.18 | % | $ | 3,606 | |||||||
Investments available-for-sale | 132,372 | 2.31 | 121,893 | 1.84 | 812 | ||||||||||||
Interest-earning deposits | 45,125 | 0.52 | 104,476 | 0.26 | (39 | ) | |||||||||||
FHLB stock | 7,714 | 2.62 | 6,527 | 1.06 | 133 | ||||||||||||
Total interest-earning assets | $ | 951,159 | 4.39 | % | $ | 900,635 | 4.13 | % | $ | 4,512 | |||||||
During the year ended December 31, 2016, the $3.6 million increase in loan interest income was primarily the result of a $98.2 million increase in the average balance of net loans receivable. The increase to interest generated from this loan growth was partially offset by a decrease in the average loan yield to 4.99% from 5.18% for the year ended December 31, 2016 and 2015, respectively.
Interest income from investments available-for-sale increased $812,000 during 2016 as a combined result of a $10.5 million increase in the average balance of our investments and a 47 basis point increase in the average yield to 2.31% from 1.84% a year ago. The increase in the average yield was a result of the restructuring of our investments portfolio by purchasing longer term higher-yielding investment securities to increase earnings on our investment portfolio.
Interest income on interest-earning deposits decreased $39,000 during the year ended December 31, 2016 as a result of the $59.4 million decrease in the average balance of these deposits and despite the Federal Reserve’s federal funds rate increases in December 2016 and 2015 which positively impacted the rate we receive on our interest-earning deposits. The average rate earned on interest-earning deposits increased 26 basis points for the year ended December 31, 2016, as compared to the prior year.
Interest expense increased $756,000 to $7.5 million for the year ended December 31, 2016 from $6.8 million for the year ended December 31, 2015. The increase in interest expense during 2016 was primarily a result of the increase in the average balance of interest-bearing liabilities as we acquired funds to be used for loan growth and stock repurchases. The following table
61
details average balances, cost of funds and the resulting increase in interest expense for the years ended December 31, 2016 and 2015:
Year Ended December 31, | |||||||||||||||||
2016 | 2015 | Change in Interest Expense | |||||||||||||||
Average Balance | Cost | Average Balance | Cost | ||||||||||||||
(Dollars in thousands) | |||||||||||||||||
Interest-bearing demand accounts | $ | 17,545 | 0.17 | % | $ | 17,866 | 0.10 | % | $ | 12 | |||||||
Statement savings accounts | 29,221 | 0.16 | 26,083 | 0.15 | 7 | ||||||||||||
Money market accounts | 196,670 | 0.44 | 167,139 | 0.36 | 267 | ||||||||||||
Certificates of deposit, retail | 335,496 | 1.17 | 338,180 | 1.06 | 360 | ||||||||||||
Certificates of deposit, brokered | 69,392 | 1.76 | 64,917 | 1.91 | (23 | ) | |||||||||||
Advances from the FHLB | 163,893 | 0.86 | 133,527 | 0.95 | 133 | ||||||||||||
Total interest-bearing liabilities | $ | 812,217 | 0.92 | % | $ | 747,712 | 0.90 | % | $ | 756 | |||||||
The average cost of our deposits increased by five basis points during 2016 primarily as a result of the increase in market interest rates that occurred late in 2015. As a result of the early redemption of several brokered certificates of deposit and obtaining new brokered certificates at lower rates, we were able to reduce our cost of these funds by 15 basis points.
Reductions in the average cost of FHLB advances were a further benefit to our net interest margin. Although the average balance of our FHLB advances increased by $30.4 million year over year, we were able to replace maturing longer-term fixed rate advances and obtain additional advances by utilizing short-term, variable rate advances, thereby reducing the overall average cost of these funds by nine basis points. In addition, low-rate fed funds borrowing was utilized during 2016 as needed to provide the necessary funds for loan growth, then were paid off as core deposits increased.
Provision for Loan Losses. Our provision for loan losses was $1.3 million for the year ended December 31, 2016 as compared to a recapture of the provision for loan losses of $2.2 million for the year ended December 31, 2015. The additional provision in 2016 was primarily the result of a $130.0 million increase in net loans receivable. The quality of our loan portfolio continued to improve as indicated by our credit metrics and that the loans evaluated individually for specific reserves decreased by $12.4 million. The related specific reserves declined to $309,000 at December 31, 2016 from $732,000 at December 31, 2015. In comparison, the recapture recognized in 2015 was primarily the result of recoveries of previously charged-off loans and declines in classified and special mention loans.
Noninterest Income. Noninterest income increased $1.4 million to $2.7 million for the year ended December 31, 2016 from $1.3 million for the year ended December 31, 2015. The following table provides a detailed analysis of the changes in the components of noninterest income:
Year Ended December 31, 2016 | Change from December 31, 2015 | Percentage Change | ||||||||
(Dollars in thousands) | ||||||||||
Service fees on deposit accounts | $ | 83 | $ | 14 | 20.3 | % | ||||
Loan service fees | 445 | 294 | 194.7 | |||||||
Gain on sale of investments, net | 50 | (42 | ) | (45.7 | ) | |||||
BOLI change in cash surrender value | 844 | 311 | 58.3 | |||||||
Wealth management revenue | 813 | 630 | 344.3 | |||||||
Other | 416 | 165 | 65.7 | |||||||
Total noninterest income | $ | 2,651 | $ | 1,372 | 107.3 | % | ||||
The largest change to our noninterest income was the $630,000 increase in wealth management revenue to $813,000 for the year ended December 31, 2016 as compared to $183,000 for the year ended December 31, 2015. The increase in 2016 is a reflection of the full year of operations and increased investment sales commissions. The Bank began offering wealth management services during the second quarter of 2015.
62
Our BOLI policies generated $844,000 of income for the year ended December 31, 2016 as a result of the increase in cash surrender values of these policies. The $311,000 increase from the year ended December 31, 2015 was primarily the result of holding throughout the year ended December 31, 2016, $20.0 million in additional BOLI policies purchased in April 2015. In addition, we replaced a $10.2 million BOLI policy with a higher yielding policy in the second quarter of 2016. We recognize the increase in cash surrender value of these policies as noninterest income, which assists in offsetting expenses for employee benefits.
Loan service fees increased by $294,000 for the year ended December 31, 2016 primarily as a result of the growth and related activity in our loan portfolio. In addition, other noninterest income increased by $165,000 during 2016 primarily as a result of $226,000 of fees received on loans where certain commercial loan customers participate in an interest rate swap. As a result of the interest rate swap, these commercial loan customers pay a fixed interest rate to us, which we forward to a third party broker institution and receive variable interest payments based on one month LIBOR in return. On most of these loans, in addition to the interest payment, the Bank receives a fee from the counterparty that is recognized as noninterest income at the time the loan is originated. In comparison, for the year ended December 31, 2015, other noninterest income solely included a $95,000 gain on the sale of investment property.
Noninterest Expense. Noninterest expense increased $3.0 million to $22.9 million for the year ended December 31, 2016 from $19.9 million for the year ended December 31, 2015. The following table provides a detailed analysis of the changes in the components of noninterest expense:
Year Ended December 31, 2016 | Change from December 31, 2015 | Percentage Change | ||||||||
(Dollars in thousands) | ||||||||||
Salaries and employee benefits | $ | 15,377 | $ | 1,437 | 10.3 | % | ||||
Occupancy and equipment | 1,984 | 544 | 37.8 | |||||||
Professional fees | 1,979 | 348 | 21.3 | |||||||
Data processing | 911 | 152 | 20.0 | |||||||
Loss (gain) on sales of OREO property, net | 87 | 613 | (116.5 | ) | ||||||
OREO market value adjustments | 257 | 216 | 526.8 | |||||||
OREO-related expenses, net | (50 | ) | (51 | ) | (5,100.0 | ) | ||||
Regulatory assessments | 420 | (50 | ) | (10.6 | ) | |||||
Insurance and bond premiums | 349 | (10 | ) | (2.8 | ) | |||||
Marketing | 194 | (17 | ) | (8.1 | ) | |||||
Other general and administrative | 1,441 | (111 | ) | (7.2 | ) | |||||
Total noninterest expense | $ | 22,949 | $ | 3,071 | 15.4 | % | ||||
For the year ended December 31, 2016, salaries and employee benefits increased by $1.4 million as compared to the previous year to $15.4 million as a result of normal wage increases and the hiring of 14 new full time positions in support of our growth, new branches and new product lines. Occupancy and equipment expense increased $544,000 to $2.0 million during 2016 as a result of the locations of new branches.
The loss on sale of OREO properties resulted in an increase to noninterest expense of $613,000 in 2016 as compared to 2015, which included a $526,000 gain on sale of OREO properties. In addition, the market value of our OREO inventory was written down by $257,000 during 2016, as compared to a write-down of $41,000 in 2015.
Other general and administrative expenses decreased by $111,000 during the year ended December 31, 2016. The primary contributor to this decline was a recapture of $160,000 in the reserve for unfunded commitments. This reserve is funded to absorb estimated probable losses related to unfunded credit facilities. The strong credit quality metrics of the Company’s loan portfolio resulted in corresponding modifications in the unfunded commitment reserve calculation methodology, resulting in the recapture during the year. In comparison, for the year ended December 31, 2015, we recognized $148,000 in additional expense representing an increase in the reserve for unfunded commitments.
Federal Income Tax Expense. We recorded a $3.7 million federal income tax provision for 2016, compared to $4.9 million for 2015, primarily as a result of the decrease in pre-tax net income. In addition, a $213,000 tax benefit was incurred for the year
63
ended December 31, 2016 as a partial result of utilization of the capital loss carryforward on our 2015 federal tax return. The provision was based on a 35% tax rate, adjusted for permanent and temporary differences.
Comparison of Financial Condition at December 31, 2015 and December 31, 2014
Assets. The following table details the changes in the composition of our assets at December 31, 2015 from December 31, 2014.
Balance at December 31, 2015 | Change from December 31, 2014 | Percentage Change | ||||||||
(Dollars in thousands) | ||||||||||
Cash on hand and in banks | $ | 5,713 | $ | (207 | ) | (3.5 | )% | |||
Interest-earning deposits | 99,998 | 1,869 | 1.9 | |||||||
Investments available for sale, at fair value | 129,565 | 9,191 | 7.6 | |||||||
Loans receivable, net | 685,072 | 21,134 | 3.2 | |||||||
Premises and equipment, net | 17,707 | 973 | 5.8 | |||||||
FHLB stock, at cost | 6,137 | (608 | ) | (9.0 | ) | |||||
Accrued interest receivable | 2,968 | (297 | ) | (9.1 | ) | |||||
Deferred tax assets, net | 4,556 | (3,782 | ) | (45.4 | ) | |||||
OREO | 3,663 | (5,620 | ) | (60.5 | ) | |||||
Bank owned life insurance (“BOLI”) | 23,309 | 20,533 | 739.7 | |||||||
Prepaid expenses and other assets | 1,225 | (270 | ) | (18.1 | ) | |||||
Total assets | $ | 979,913 | $ | 42,916 | 4.6 | % | ||||
The primary factor behind the increase in total assets was the $61.3 million increase in funds from our deposit liabilities. These funds were partially used to increase our loan portfolio by $21.1 million, increase our available-for-sale investment portfolio by $9.2 million, and to purchase $20.0 million in additional BOLI.
Investments. Our investments available-for-sale increased 7.6% to $129.6 million at December 31, 2015 from $120.4 million at December 31, 2014. During 2015, we changed the composition of our investments by purchasing $57.3 million of securities with an expected yield of 2.38% and selling $25.6 million of securities with an average yield of 1.96%. This strategy to improve the performance of our investment portfolio resulted in an average yield of 1.84% in 2015 compared to 1.74% in 2014. In addition, the sales generated a net gain of $92,000 for the year ended December 31, 2015. The purchase of $57.3 million in new available-for-sale investments includes $49.8 million in fixed rate and $7.5 million in variable rate securities. In addition to the purchase and sale activity, we received calls, or partial calls, of $1.7 million during 2015. The reconfiguration of our investment portfolio resulted in an increase of the effective duration of the portfolio to 3.20% at December 31, 2015, as compared to 2.40% at December 31, 2014.
Loans receivable. Net loans receivable grew by $21.1 million during 2015 to $685.1 million with increases of $50.9 million in our construction/land loans, $6.7 million in our multifamily loans and $5.0 million in our commercial loans. These increases were partially offset by a decrease in our one-to-four family residential loans of $19.4 million. Commercial real estate and one-to-four family residential loans continue to be the largest concentrations in our loan portfolio at 32.5% and 33.8%, respectively, of total loans. Our construction/land loans increased to 15.5% of our total loan portfolio in 2015 from 9.2% in 2014 as we continue to originate more of these shorter term, higher yielding loans.
The quality of our loan portfolio continued to improve during 2015 as our nonperforming loans decreased to $1.1 million at December 31, 2015 from $1.3 million at December 31, 2014. Nonperforming loans as a percent of our total loan portfolio, net of LIP, remains low at 0.16% and 0.20% at December 31, 2015 and 2014, respectively. Adversely classified loans decreased to $3.3 million at December 31, 2015, from $10.2 million at December 31, 2014. The following table presents a breakdown of our nonperforming assets:
64
December 31, | Amount of Change | Percent of Change | |||||||||||||
2015 | 2014 | ||||||||||||||
(Dollars in thousands) | |||||||||||||||
Nonperforming loans: | |||||||||||||||
One-to-four family residential | $ | 996 | $ | 830 | $ | 166 | 20.0 | % | |||||||
Commercial real estate | — | 434 | (434 | ) | (100.0 | ) | |||||||||
Consumer | 89 | 75 | 14 | 18.7 | |||||||||||
Total nonperforming loans | 1,085 | 1,339 | (254 | ) | (19.0 | ) | |||||||||
OREO | 3,663 | 9,283 | (5,620 | ) | (60.5 | ) | |||||||||
Total nonperforming assets | $ | 4,748 | $ | 10,622 | $ | (5,874 | ) | (55.3 | )% | ||||||
Foregone interest during the year ended December 31, 2015 relating to nonperforming loans totaled $103,000. There was no LIP related to nonperforming loans at December 31, 2015 or 2014. OREO decreased $5.6 million to $3.7 million at December 31, 2015 as we continued to sell our inventory of foreclosed real estate and experienced decreased foreclosure activity. We foreclosed on $141,000 of real estate during 2015, as compared to $1.8 million during 2014. The number of properties that transferred into OREO decreased considerably compared to previous years and, consequently, the number of properties that we sold declined. During 2015, we transferred one property into OREO, compared to six properties during 2014. Sales of OREO in 2015 totaled 9 properties, as compared to 12 properties in 2014. The decline in both the transfer of properties into OREO and the sale of OREO properties was a result of our continued efforts to identify the problem loans within our portfolio and take prompt appropriate actions to turn nonperforming assets into performing assets.
Allowance for loan and lease losses. The ALLL was $9.5 million or 1.36% of total loans outstanding, net of LIP, at December 31, 2015 as compared to $10.5 million or 1.55% of total loans outstanding, net of LIP, at December 31, 2014. The ALLL represented 872.2% of nonperforming loans at December 31, 2015 compared to 783.5% at December 31, 2014. The following table details activity and information related to the ALLL for the years ended December 31, 2015 and 2014. All loan balances and ratios are calculated using loan balances that are net of LIP.
At or For the Years Ended December 31, | |||||||
2015 | 2014 | ||||||
(Dollars in thousands) | |||||||
ALLL balance at beginning of year | $ | 10,491 | $ | 12,994 | |||
Recapture of provision for loan losses | (2,200 | ) | (2,100 | ) | |||
Charge-offs | (362 | ) | (642 | ) | |||
Recoveries | 1,534 | 239 | |||||
ALLL balance at end of year | $ | 9,463 | $ | 10,491 | |||
ALLL as a percent of total loans, net of LIP | 1.36 | % | 1.55 | % | |||
ALLL as a percent of nonperforming loans | 872.17 | 783.50 | |||||
Total nonperforming loans | $ | 1,085 | $ | 1,339 | |||
Nonperforming loans as a percent of total loans | 0.16 | % | 0.20 | % | |||
Total loans receivable, net LIP | $ | 697,416 | $ | 677,033 | |||
Total loans originated | 229,780 | 154,497 | |||||
Deposits. During the year ended December 31, 2015, deposits increased $61.3 million to $675.4 million as compared to $614.1 million at December 31, 2014. The largest change to our deposits occurred with a $68.9 million increase to money market accounts, as part of our focus on strengthening our core deposit position. This growth in money market accounts was primarily comprised of $62.8 million in deposits generated in short term accounts from large construction developers that are part of the EB-5 Immigrant Investor Program. In addition, money market accounts increased $6.2 million due to consumer retail deposits.
Retail certificates of deposit decreased $34.3 million as we continued to reduce higher cost certificates of deposit by competing slightly less aggressively on certain deposit interest rates. As a partial offset, management increased our brokered
65
certificates of deposit by $11.7 million to $66.2 million at December 31, 2015. While these certificates carry a higher cost of funds than retail certificates, their remaining maturity ranges from 2.5 to five years and most include a call option six months after issuance and quarterly thereafter. The longer term nature of these brokered deposits, along with their enhanced features, compared to retail certificates of deposit, assist us in our interest rate risk management efforts. Also contributing to our efforts to reduce our cost of funds, a $4.5 million decrease in interest-bearing demand accounts was more than offset by a $15.0 million increase in noninterest checking accounts. Noninterest checking accounts are primarily comprised of operating accounts of businesses located in our primary market. In addition, statement savings accounts increased $4.4 million.
Advances. We use advances from the FHLB as an alternative funding source to manage funding costs, reduce interest rate risk and to leverage our balance sheet. Total FHLB advances at December 31, 2015 were $125.5 million as compared to $135.5 million at December 31, 2014. During 2015, we did not incur any new FHLB advances and paid off $10.0 million at maturity which had a 0.71% cost of funds. As a result, the weighted average rate of our FHLB advances increased to 0.97% for the year ended December 31, 2015, as compared to 0.91% for the year ended December 31, 2014. At December 31, 2015, $84.0 million of FHLB advances are due to mature within one year, with the remaining $41.5 million due in one to five years.
Stockholders’ Equity. Total stockholders’ equity decreased $10.7 million, or 5.9% to $170.7 million at December 31, 2015 from $181.4 million at December 31, 2014, primarily due to stock repurchases. Retained earnings increased $5.9 million due to net income of $9.2 million for 2015, partially offset by $3.2 million of dividends paid to shareholders. Additional paid-in-capital decreased $17.1 million due to the repurchase and retirement of 1,523,567 shares of common stock at an average price of $12.25 per share, partially offset by $1.6 million from stock based compensation, the exercise of stock options and allocation of ESOP shares.
Comparison of Operating Results for the Years Ended December 31, 2015 and December 31, 2014
Net Interest Income. Net interest income in 2015 was $30.4 million, a $2.0 million or 6.2% decrease from $32.4 million in 2014. The decrease was attributable to a $1.5 million decrease in interest income combined with a $510,000 increase in interest expense. The primary factors behind the decrease in interest income were a decrease in the average yield on our interest-earning assets from 4.50% to 4.13% and an increase in the percentage of average interest-earning deposits to average total interest earning assets. While our total average interest-earning assets increased by $40.1 million, the average balance of interest-earning deposits, held primarily at the FRB and carrying a nominal yield, increased by $57.7 million while the average balance of higher yielding net loan receivables declined $7.6 million, creating a net decrease in interest as a result of these changes in average balances. Our interest rate spread for the year ended December 31, 2015 decreased 39 basis points to 3.23% compared to 3.62% for 2014 due primarily to the decrease in our average yield on interest earning assets.
Total interest income decreased $1.5 million to $37.2 million for the year ended December 31, 2015 from $38.7 million for the year ended December 31, 2014. The following table compares average interest-earning asset balances, associated yields, and resulting changes in interest and dividend income for the years ended December 31, 2015 and 2014:
Year Ended December 31, | |||||||||||||||||
2015 | 2014 | Change in Interest and Dividend Income | |||||||||||||||
Average Balance | Yield | Average Balance | Yield | ||||||||||||||
(Dollars in thousands) | |||||||||||||||||
Loans receivable, net | $ | 667,739 | 5.18 | % | $ | 675,353 | 5.37 | % | $ | (1,668 | ) | ||||||
Investments available-for-sale | 121,893 | 1.84 | 131,474 | 1.74 | (45 | ) | |||||||||||
Interest-earning deposits | 104,476 | 0.26 | 46,776 | 0.25 | 159 | ||||||||||||
FHLB stock | 6,527 | 1.06 | 6,899 | 0.10 | 62 | ||||||||||||
Total interest-earning assets | $ | 900,635 | 4.13 | % | $ | 860,502 | 4.50 | % | $ | (1,492 | ) | ||||||
Interest income from net loans receivable decreased $1.7 million, or 4.6%, to $34.6 million for the year ended December 31, 2015. The decrease was due primarily to a decrease in yield from 5.37% in 2014 to 5.18% in 2015. The continued low rate environment during the year resulted in payoffs and refinances of higher yielding loans. While the balance of our net loans receivable increased $21.1 million from December 31, 2014 to December 31, 2015, the growth occurred in the latter part of the year, resulting in a $7.6 million decrease in average loans receivable during 2015, further contributing to the decline in interest income.
66
Interest income from investments available-for-sale decreased $45,000 primarily as a result of a $9.6 million decrease in the average balance during the year ended December 31, 2015, partially offset by a ten basis point increase in average yield. The balance at December 31, 2015 increased $9.2 million from December 31, 2014, however the average balance for the year decreased as principal paydowns of $18.7 million occurred throughout the year while the $30.0 million net increase from purchase and sale activity occurred primarily in the third and fourth quarters of 2015. While the expected average yield on purchased securities exceeds the average yield on securities sold by 42 basis points, the benefit from the higher average yield was limited to the period since purchase.
Interest income on interest-bearing deposits increased $159,000 during the year ended December 31, 2015 due almost entirely to the $57.7 million increase in the average balance of these deposits. The rate earned on these funds remained stable with a one basis point increase in our average yield over the prior year.
The following table details average balances, cost of funds and the resulting increase in interest expense for the years ended December 31, 2015 and 2014:
Year Ended December 31, | |||||||||||||||||
2015 | 2014 | Change in Interest Expense | |||||||||||||||
Average Balance | Cost | Average Balance | Cost | ||||||||||||||
(Dollars in thousands) | |||||||||||||||||
Interest-bearing demand accounts | $ | 17,866 | 0.10 | % | $ | 21,044 | 0.11 | % | $ | (5 | ) | ||||||
Statement savings accounts | 26,083 | 0.15 | 22,580 | 0.13 | 10 | ||||||||||||
Money market accounts | 167,139 | 0.36 | 140,147 | 0.22 | 291 | ||||||||||||
Certificates of deposit, retail | 338,180 | 1.06 | 381,736 | 1.15 | (813 | ) | |||||||||||
Certificates of deposit, brokered | 64,917 | 1.91 | 15,928 | 1.95 | 932 | ||||||||||||
Advances from the FHLB | 133,527 | 0.95 | 128,839 | 0.91 | 95 | ||||||||||||
Total interest-bearing liabilities | $ | 747,712 | 0.90 | % | $ | 710,274 | 0.88 | % | $ | 510 | |||||||
Total interest expense for the year ended December 31, 2015 increased 8.17% to $6.8 million from $6.2 million in 2014. Interest on brokered certificates of deposit increased by $932,000, primarily due to a $49.0 million increase in the average balance. The addition of brokered funds occurred midyear of 2014, therefore the related increase in interest expense was primarily a reflection of the number of days interest was paid during the year on these funds. These additional brokered deposits were obtained with maturities ranging from four to six years in an effort to help mitigate the Bank’s interest rate risk in a rising rate environment, however, this interest rate risk protection came at a cost to current earnings as the rates paid on these longer term deposits are higher than shorter term deposit rates. In addition, interest on money market accounts increased by $291,000, primarily as a result of a 14 basis point increase in the cost of these funds. The average balance of money market funds increased by $27.0 million, resulting in $60,000 of the increase in money market interest expense. Interest expense on FHLB advances increased by $95,000 as a combined result of a $4.7 million increase in the average balance and a four basis point increase in the cost of these funds. Partially offsetting these increases, interest expense for retail certificates of deposit decreased $813,000 during 2015 as compared to 2014 as a combined result of a $43.6 million decrease in the average balance and a nine basis point decrease in the cost of these funds.
Provision for Loan Losses. We recorded a recapture of $2.2 million of the provision for loan losses for the year ended December 31, 2015, reflecting continued improvement in the risk profile of our loan portfolio. During 2015, we had net recoveries of $1.2 million on previously charged off loans. In addition, payoffs of $5.0 million on three loans classified as “special mention” and the decline in classified loans in our loan portfolio resulted in a reduction to the general allowance at December 31, 2015. Loans classified as “substandard” decreased to $3.3 million at December 31, 2015 from $10.2 million at December 31, 2014.
As of December 31, 2015, nonperforming loans, net of LIP, totaled $1.1 million as compared to $1.3 million at December 31, 2014. Nonperforming loans as a percent of total loans was 0.16% at December 31, 2015, compared to 0.20% at December 31, 2014. Of our nonperforming loans, $996,000 related to the one-to-four family residential loan portfolio and $89,000 related to consumer loans.
Noninterest Income. Noninterest income increased $781,000 to $1.3 million for the year ended December 31, 2015 from $498,000 for 2014. The following table provides a detailed analysis of the changes in the components of noninterest income:
67
Year Ended December 31, 2015 | Change from December 31, 2014 | Percentage Change | ||||||||
(Dollars in thousands) | ||||||||||
Service fees on deposit accounts | $ | 211 | $ | 29 | 15.8 | % | ||||
Loan service fees | 151 | (38 | ) | (20.0 | ) | |||||
Gain on sale of investments, net | 92 | 112 | 562.1 | |||||||
BOLI change in cash surrender value | 533 | 410 | 333.5 | |||||||
Other | 292 | 268 | 1,128.8 | |||||||
Total noninterest income | $ | 1,279 | $ | 781 | 157.0 | % | ||||
During 2015, the cash surrender value of our BOLI policies increased by $410,000, generated primarily by the addition of $20.0 million in additional BOLI policies in April 2015. We recognize the increase in cash surrender value of these policies as noninterest income, which assists in offsetting expenses for employee benefits. In addition, we realized a net gain on sale of securities held for investment of $92,000 in 2015 as compared to a net loss on sale of $20,000 in 2014. Contributing to the increase in other noninterest income during 2015, the sale of investment property generated a net gain of $95,000, and our new wealth management line of business generated $180,000 in commission revenue during its first eight months of operations.
Noninterest Expense. Noninterest expense increased $1.4 million to $19.9 million for the year ended December 31, 2015 from $18.5 million for 2014. The following table provides a detailed analysis of the changes in the components of noninterest expense:
Year Ended December 31, 2015 | Change from December 31, 2014 | Percentage Change | ||||||||
(Dollars in thousands) | ||||||||||
Salaries and employee benefits | $ | 13,940 | $ | 1,953 | 16.3 | % | ||||
Occupancy and equipment | 1,440 | 75 | 5.5 | |||||||
Professional fees | 1,631 | 91 | 5.9 | |||||||
Data processing | 759 | 97 | 14.7 | |||||||
Gain on sales of OREO property, net | (526 | ) | (612 | ) | (711.6 | ) | ||||
OREO market value adjustments | 41 | (352 | ) | (89.6 | ) | |||||
OREO-related expenses, net | 1 | (189 | ) | (99.5 | ) | |||||
Regulatory assessments | 470 | 74 | 18.7 | |||||||
Insurance and bond premiums | 359 | (42 | ) | (10.5 | ) | |||||
Marketing | 211 | 114 | 117.5 | |||||||
Other general and administrative | 1,552 | 166 | 12.0 | |||||||
Total noninterest expense | $ | 19,878 | $ | 1,375 | 7.4 | % | ||||
A significant factor behind the increase in noninterest expense during 2015 was a result of an increase in salaries and employee benefits of $2.0 million. Salary expense increased by $1.3 million as a result of increased employees related to our core processor conversion project and the opening of a new branch office in Mill Creek, Washington, and wage increases as compared to the previous year. In addition, the contribution expense for our defined benefit plan increased by $250,000 as the contribution was electively increased as allowed under pension relief legislation in 2014. Health insurance costs increased by $256,000 during 2015 as a combined result of increased premiums and increased head count. These increases in compensation expenses were partially offset by a $150,000 increase in capitalized loan origination costs.
Noninterest expense benefited from sales of OREO properties which generated a $526,000 net gain in 2015, from the sale of a $4.4 million property, compared to a net loss of $86,000 in 2014. Further, the OREO market valuation expense decreased by $352,000 as a reflection of improvements in the housing prices in our market area. In addition, our OREO inventory decreased to seven properties at December 31, 2015 from 15 properties at December 31, 2014, reducing our OREO holding costs by $189,000 during the year. Marketing expenses increased $114,000 during the year ended December 31, 2015 as compared to last year, primarily as a result of increased customer communication and publicity for our branch opening, core conversion, and the Bank name change that occurred in the third quarter of 2015. Other general and administrative expenses increased by $166,000 during
68
2015 as compared to 2014 primarily as a result of a $148,000 increase in our reserve for unfunded commitments expense. The balances of unused lines of credit and construction loans in process increased by $22.4 million year over year, thereby requiring an increase in the related reserve. The unfunded commitment reserve expense can vary significantly each quarter, based on the amount believed by management to be sufficient to absorb estimated probable losses related to unfunded credit facilities.
Federal Income Tax Expense. We recorded a $4.9 million federal income tax provision for 2015, compared to $5.9 million for 2014, primarily as a result of the reduction in pre-tax net income. The provision is based on a 35% tax rate, adjusted for permanent and temporary differences.
Average Balances, Interest and Average Yields/Cost
The following table presents information regarding average balances of assets and liabilities as well as interest income from average interest-earning assets and interest expense on average interest-bearing liabilities, resultant yields, interest rate spreads, net interest margins and the ratio of average interest-earning assets to average interest-bearing liabilities. Average balances have been calculated using the average daily balances during the period. Interest and dividends are not reported on a tax equivalent basis.
Year Ended December 31, | ||||||||||||||||||||||||||||||||
2016 | 2015 | 2014 | ||||||||||||||||||||||||||||||
Average Balance (1) | Interest and Dividends | Yield/Cost | Average Balance (1) | Interest and Dividends | Yield/Cost | Average Balance (1) | Interest and Dividends | Yield/Cost | ||||||||||||||||||||||||
(Dollars in thousands) | ||||||||||||||||||||||||||||||||
Interest-earnings assets: | ||||||||||||||||||||||||||||||||
Loans receivable, net | $ | 765,948 | $ | 38,218 | 4.99 | % | $ | 667,739 | $ | 34,612 | 5.18 | % | $ | 675,353 | $ | 36,280 | 5.37 | % | ||||||||||||||
Investments available-for-sale | 132,372 | 3,054 | 2.31 | 121,893 | 2,242 | 1.84 | 131,474 | 2,287 | 1.74 | |||||||||||||||||||||||
Interest-earning deposits | 45,125 | 235 | 0.52 | 104,476 | 274 | 0.26 | 46,776 | 115 | 0.25 | |||||||||||||||||||||||
FHLB stock | 7,714 | 202 | 2.62 | 6,527 | 69 | 1.06 | 6,899 | 7 | 0.10 | |||||||||||||||||||||||
Total interest-earning assets | 951,159 | 41,709 | 4.39 | 900,635 | 37,197 | 4.13 | 860,502 | 38,689 | 4.50 | |||||||||||||||||||||||
Noninterest earning assets | 59,084 | 57,519 | 49,946 | |||||||||||||||||||||||||||||
Total average assets | $ | 1,010,243 | $ | 958,154 | $ | 910,448 | ||||||||||||||||||||||||||
Interest-bearing liabilities | ||||||||||||||||||||||||||||||||
Interest-bearing demand accounts | $ | 17,545 | $ | 30 | 0.17 | % | $ | 17,866 | $ | 18 | 0.10 | % | $ | 21,044 | $ | 23 | 0.11 | % | ||||||||||||||
Statement savings accounts | 29,221 | 47 | 0.16 | 26,083 | 40 | 0.15 | 22,580 | 30 | 0.13 | |||||||||||||||||||||||
Money market accounts | 196,670 | 870 | 0.44 | 167,139 | 603 | 0.36 | 140,147 | 312 | 0.22 | |||||||||||||||||||||||
Certificates of deposit, retail | 335,496 | 3,934 | 1.17 | 338,180 | 3,574 | 1.06 | 381,736 | 4,387 | 1.15 | |||||||||||||||||||||||
Certificates of deposit, brokered | 69,392 | 1,220 | 1.76 | 64,917 | 1,243 | 1.91 | 15,928 | 311 | 1.95 | |||||||||||||||||||||||
Total deposits | 648,324 | 6,101 | 0.94 | 614,185 | 5,478 | 0.89 | 581,435 | 5,063 | 0.87 | |||||||||||||||||||||||
Advances from the FHLB | 163,893 | 1,406 | 0.86 | 133,527 | 1,273 | 0.95 | 128,839 | 1,178 | 0.91 | |||||||||||||||||||||||
Total interest-bearing liabilities | 812,217 | 7,507 | 0.92 | 747,712 | 6,751 | 0.90 | 710,274 | 6,241 | 0.88 | |||||||||||||||||||||||
Noninterest bearing liabilities | 37,834 | 32,538 | 17,576 | |||||||||||||||||||||||||||||
Average equity | 160,192 | 177,904 | 182,598 | |||||||||||||||||||||||||||||
Total average liabilities and equity | $ | 1,010,243 | $ | 958,154 | $ | 910,448 | ||||||||||||||||||||||||||
Net interest income | $ | 34,202 | $ | 30,446 | $ | 32,448 | ||||||||||||||||||||||||||
Interest rate spread | 3.47 | % | 3.23 | % | 3.62 | % | ||||||||||||||||||||||||||
Net interest margin | 3.60 | % | 3.38 | % | 3.77 | % | ||||||||||||||||||||||||||
Ratio of average interest- | ||||||||||||||||||||||||||||||||
earning assets to average | ||||||||||||||||||||||||||||||||
interest-bearing liabilities | 117.11 | % | 120.45 | % | 121.15 | % | ||||||||||||||||||||||||||
________________
(1) The average loans receivable, net balances include nonaccruing loans.
69
Yields Earned and Rates Paid
The following table presents the weighted-average yields earned on our assets and the weighted-average interest rates paid on our liabilities, together with the net yield on interest-earning assets and liabilities, for the dates indicated.
Weighted Average Yield at December 31, 2016 | Net Yield Year Ended December 31, | ||||||||||
2016 | 2015 | 2014 | |||||||||
Yield on interest-earning assets: | |||||||||||
Loans receivable, net | 4.67 | % | 4.99 | % | 5.18 | % | 5.37 | % | |||
Investment securities available-for-sale | 2.62 | 2.31 | 1.84 | 1.74 | |||||||
FHLB stock | — | 2.62 | 1.06 | 0.10 | |||||||
Interest-earning deposits | 0.70 | 0.52 | 0.26 | 0.25 | |||||||
Total interest-earning assets | 4.26 | 4.39 | 4.13 | 4.50 | |||||||
Rate paid on interest-bearing liabilities: | |||||||||||
Interest-bearing demand accounts | 0.32 | 0.17 | 0.10 | 0.11 | |||||||
Statement savings accounts | 0.16 | 0.16 | 0.15 | 0.13 | |||||||
Money market accounts | 0.50 | 0.44 | 0.36 | 0.22 | |||||||
Certificates of deposit, retail | 1.20 | 1.17 | 1.06 | 1.15 | |||||||
Certificates of deposit, brokered | 1.49 | 1.76 | 1.91 | 1.95 | |||||||
Total interest-bearing deposits | 0.96 | 0.94 | 0.89 | 0.87 | |||||||
Advances from the FHLB | 0.87 | 0.86 | 0.95 | 0.91 | |||||||
Total interest-bearing liabilities | 0.94 | 0.92 | 0.90 | 0.88 | |||||||
Interest rate spread | 3.32 | 3.47 | 3.23 | 3.62 | |||||||
Net interest margin | N/A | 3.60 | 3.38 | 3.77 | |||||||
Rate/Volume Analysis
The following table presents the effects of changing rates and volumes on our net interest income. Information is provided with respect to: (1) effects on interest income attributable to changes in volume (changes in volume multiplied by prior rate); and (2) effects on interest income attributable to changes in rate (changes in rate multiplied by prior volume). Changes in rate/volume are allocated proportionately to the changes in rate and volume.
70
Year Ended December 31, 2016 Compared to December 31, 2015 Change in Interest | Year Ended December 31, 2015 Compared to December 31, 2014 Change in Interest | ||||||||||||||||||||||
2016 | 2015 | ||||||||||||||||||||||
Rate | Volume | Total | Rate | Volume | Total | ||||||||||||||||||
(In thousands) | |||||||||||||||||||||||
Interest-earning assets: | |||||||||||||||||||||||
Loans receivable, net | $ | (1,485 | ) | $ | 5,091 | $ | 3,606 | $ | (1,259 | ) | $ | (409 | ) | $ | (1,668 | ) | |||||||
Investments available-for-sale | 619 | 193 | $ | 812 | 122 | (167 | ) | $ | (45 | ) | |||||||||||||
Interest-earning deposits | 117 | (156 | ) | $ | (39 | ) | 17 | 142 | $ | 159 | |||||||||||||
FHLB stock | 120 | 13 | $ | 133 | 62 | — | $ | 62 | |||||||||||||||
Net change in interest income | (629 | ) | 5,141 | 4,512 | (1,058 | ) | (434 | ) | (1,492 | ) | |||||||||||||
Interest-bearing liabilities: | |||||||||||||||||||||||
Interest-bearing demand accounts | $ | 12 | $ | — | $ | 12 | $ | (2 | ) | $ | (3 | ) | $ | (5 | ) | ||||||||
Statement savings accounts | 2 | 5 | $ | 7 | 5 | 5 | $ | 10 | |||||||||||||||
Money market accounts | 160 | 107 | $ | 267 | 231 | 60 | $ | 291 | |||||||||||||||
Certificates of deposit, retail | 388 | (28 | ) | $ | 360 | (312 | ) | (501 | ) | $ | (813 | ) | |||||||||||
Certificates of deposit, brokered | (109 | ) | 86 | $ | (23 | ) | (25 | ) | 957 | $ | 932 | ||||||||||||
Advances from the FHLB | (156 | ) | 289 | $ | 133 | 52 | 43 | $ | 95 | ||||||||||||||
Net change in interest expense | 297 | 459 | 756 | (51 | ) | 561 | 510 | ||||||||||||||||
Net change in net interest income | $ | (926 | ) | $ | 4,682 | $ | 3,756 | $ | (1,007 | ) | $ | (995 | ) | $ | (2,002 | ) | |||||||
Asset and Liability Management and Market Risk
General. Our Board of Directors has approved an asset/liability management policy to guide management in maximizing interest rate spread by managing the differences in terms between interest-earning assets and interest-bearing liabilities while maintaining acceptable levels of liquidity, capital adequacy, interest rate risk, credit risk, and profitability. The policy established an Investment, Asset/Liability Committee (“ALCO”) comprised of certain members of senior management and the Board of Directors. The Committee’s purpose is to communicate, coordinate and manage our asset/liability position consistent with our business plan and Board-approved policies. The ALCO meets quarterly to review various areas including:
• | economic conditions; |
• | interest rate outlook; |
• | asset/liability mix; |
• | interest rate risk sensitivity; |
• | current market opportunities to promote specific products; |
• | historical financial results; |
• | projected financial results; and |
• | capital position. |
The Committee also reviews current and projected liquidity needs. As part of its procedures, the Committee regularly reviews interest rate risk by forecasting the impact that changes in interest rates may have on net interest income and the market value of portfolio equity, which is defined as the net present value of an institution’s existing assets, liabilities and off-balance sheet instruments and evaluating such impacts against the maximum potential change in the market value of portfolio equity that is authorized by the Board of Directors.
Our Risk When Interest Rates Change. The rates of interest we earn on assets and pay on liabilities generally are established contractually for a period of time. Market interest rates change over time. Our loans generally have longer maturities than our deposits. Accordingly, our results of operations, like those of other financial institutions, are impacted by changes in
71
interest rates and the interest rate sensitivity of our assets and liabilities. The risk associated with changes in interest rates and our ability to adapt to these changes is known as interest rate risk and is our most significant market risk.
We have utilized the following strategies in our efforts to manage interest rate risk:
• | we are originating shorter term, higher yielding loans, whenever possible; |
• | we have attempted, where possible, to extend the maturities of our deposits which typically fund our long-term assets; |
• | we have invested in securities with relatively short average lives, generally less than eight years; |
• | we have added adjustable-rate loans to our loan portfolio; |
• | we have added brokered certificates of deposit with a call option as a new funding source; and |
• | we have utilized an interest rate swap to effectively fix the rate on $50.0 million of FHLB advances. |
How We Measure the Risk of Interest Rate Changes. We monitor our interest rate sensitivity on a quarterly basis by measuring the impact of changes to net interest income in multiple rate environments. Management retains the services of Darling Consulting Group, LLC (“DCG”) to assist in its interest rate risk and asset-liability management. DCG has over 30 years of experience in asset-liability management. Management and DCG use various assumptions to evaluate the sensitivity of our operations to changes in interest rates. Although management believes these assumptions are reasonable, the interest rate sensitivity of our assets and liabilities on net interest income and the market value of portfolio equity could vary substantially if different assumptions were used or actual experience differs from these assumptions. Although certain assets and liabilities may have similar maturities or periods of repricing, they may react differently to changes in market interest rates. The interest rates on certain types of assets and liabilities may fluctuate in advance of changes in market interest rates, while interest rates on other types of assets and liabilities lag behind changes in market interest rates. Non-uniform changes and fluctuations in market interest rates across various maturities will also affect the results presented. In addition, certain assets, such as adjustable-rate mortgage loans, have features which restrict changes in interest rates on a short-term basis and over the life of the asset. Further, a portion of our adjustable-rate loans have interest rate floors below which the loan’s contractual interest rate may not adjust. Approximately 41.7% of our net loans were adjustable-rate loans at December 31, 2016. At that date, $135.7 million, or 39.3%, of these loans with a weighted-average interest rate of 4.2% were at their floor interest rate. The inability of our loans to adjust downward can contribute to increased income in periods of declining interest rates. However, when loans are at their floors, there is a further risk that our interest income may not increase as rapidly as our cost of funds during periods of increasing interest rates. Further, in the event of a significant change in interest rates, prepayment and early withdrawal levels would likely deviate from those assumed. Finally, the ability of many borrowers to service their debt may decrease in the event of an interest rate increase. We consider all these factors in monitoring our interest rate exposure.
The assumptions we use are based upon a combination of proprietary and market data that reflect historical results and current market conditions. These assumptions relate to interest rates, prepayments, deposit decay rates and the market value of certain assets under the various interest rate scenarios. We use market data to determine prepayments and maturities of loans, investments and borrowings and use our own assumptions on deposit decay rates except for time deposits. Time deposits are modeled to reprice to market rates upon their stated maturities. We also assume that non-maturity deposits can be maintained with rate adjustments not directly proportionate to the change in market interest rates, based upon our historical deposit decay rates, which are substantially lower than market decay rates. We have demonstrated in the past that the tiering structure of our deposit accounts during changing rate environments results in relatively lower volatility and less than market rate changes in our interest expense for deposits. We tier our deposit accounts by balance and rate, whereby higher balances within an account earn higher rates of interest. Therefore, deposits that are not very rate sensitive (generally, lower balance tiers) are separated from deposits that are rate sensitive (generally, higher balance tiers). When interest rates rise, we do not have to raise interest rates proportionately on less rate sensitive accounts to retain these deposits. These assumptions are based upon our analysis of our customer base, competitive factors, and historical experience.
Our income simulation model examines changes in net interest income in which interest rates were assumed to remain at their base level, instantaneously increase by 100, 200 and 300 basis points or decline immediately by 100 basis points. Reductions of rates by 200 and 300 basis points were not reported due to the very low rate environment.
The following table illustrates the estimated change in our net interest income over the next 12 months from December 31, 2016, that would occur in the event of an immediate change in interest rates equally across all maturities, with no effect given to any steps that we might take to counter the effect of that interest rate movement.
72
Interest Rate Simulation Impact on Net Interest Income for the year ended December 31, 2016 | |||||||
Basis Point Change in Rates | Net Interest Income | % Change | |||||
(Dollars in thousands) | |||||||
+300 | $ | 32,214 | (3.82 | )% | |||
+200 | 32,669 | (2.46 | ) | ||||
+100 | 33,142 | (1.05 | ) | ||||
Base | 33,494 | — | |||||
(100) | 33,561 | 0.20 | |||||
The following table illustrates the change in our net portfolio value (“NPV”) at December 31, 2016 that would occur in the event of an immediate change in interest rates equally across all maturities, with no effect given to any steps that we might take to counter the effect of that interest rate movement.
Basis Point Change in Rates (1) | Net Portfolio Value (2) | Net Portfolio as % of Portfolio Value of Assets | Market Value of Assets (6) | ||||||||||||||||||
Amount | $ Change (3) | % Change | NPV Ratio (4) | % Change (5) | |||||||||||||||||
(Dollars in thousands) | |||||||||||||||||||||
+300 | $ | 121,007 | $ | (34,249 | ) | (22.06 | )% | 12.55 | % | (3.29 | )% | $ | 963,849 | ||||||||
+200 | 132,034 | (23,222 | ) | (14.96 | ) | 13.36 | (2.23 | ) | 988,545 | ||||||||||||
+100 | 144,613 | (10,643 | ) | (6.86 | ) | 14.24 | (1.02 | ) | 1,015,495 | ||||||||||||
Base | 155,256 | — | — | 14.92 | — | 1,040,595 | |||||||||||||||
(100) | 161,826 | 6,570 | 4.23 | 15.21 | 0.63 | 1,064,243 | |||||||||||||||
__________
(1) | No rates in the model are allowed to go below zero. Given the relatively low level of market interest rates, a calculation for a decrease of greater than 100 basis points has not been prepared. |
(2) | The net portfolio value is the difference between the present value of the discounted cash flows of assets and liabilities and represents the market value of the Company’s equity for any given interest rate scenario. Net portfolio value is useful for determining, on a market value basis, how equity changes in response to various interest rate scenarios. Large changes in net portfolio value reflect increased interest rate sensitivity and generally more volatile earnings streams. |
(3) | The increase or decrease in the estimated net portfolio value at the indicated interest rates compared to the net portfolio value assuming no change in interest rates. |
(4) | Net portfolio value divided by the market value of assets. |
(5) | The increase or decrease in the net portfolio value divided by the market value of assets. |
(6) | The market value of assets represents the value of assets under the various interest rate scenarios and reflects the sensitivity of those assets to interest rate changes. |
The net interest income and net portfolio value tables presented above are predicated upon a stable balance sheet with no growth or change in asset or liability mix. In addition, the net portfolio value is based upon the present value of discounted cash flows using our estimates of current replacement rates to discount the cash flows. The effects of changes in interest rates in the net interest income table are based upon a cash flow simulation of our existing assets and liabilities and assuming that delinquency rates would not change as a result of changes in interest rates, although there can be no assurance that this will be the case. Delinquency rates may change when interest rates change as a result of changes in the loan portfolio mix, underwriting conditions, loan terms or changes in economic conditions that have a delayed effect on the portfolio. Even if interest rates change in the designated amounts, there can be no assurance that our assets and liabilities would perform as assumed. Also, a change in U.S. Treasury rates in the designated amounts accompanied by a change in the shape of the Treasury yield curve would cause changes to the net portfolio value and net interest income other than those indicated above.
Liquidity
We are required to have enough cash flow in order to maintain sufficient liquidity to ensure a safe and sound operation. We maintain cash flows above the minimum level believed to be adequate to meet the requirements of normal operations, including potential deposit outflows. On a daily basis, we review and update cash flow projections to ensure that adequate liquidity is maintained.
73
Our primary sources of funds are customer deposits, scheduled loan and investment repayments, including interest payments, maturing loans and investment securities, and advances from the FHLB. These funds, together with equity, are used to fund loans, acquire investment securities and other assets, and fund continuing operations. While maturities and the scheduled amortization of loans are a predictable source of funds, deposit flows and mortgage prepayments are greatly influenced by the level of interest rates, economic conditions and competition. We believe that our current liquidity position, and our forecasted operating results are sufficient to fund all of our existing commitments.
Liquidity management is both a daily and long-term function of business management. Excess liquidity is generally invested in short-term investments such as overnight deposits or agency or mortgage-backed securities. On a longer term basis, we maintain a strategy of investing in various lending products as described in greater detail under Item 1. “Business – Lending Activities.” At December 31, 2016, the undisbursed portion of construction LIP totaled $72.0 million and unused lines of credit were $24.6 million. We use our sources of funds primarily to meet ongoing commitments, to pay maturing certificates of deposit and withdrawals on other deposit accounts, to fund loan commitments, and to maintain our portfolio of investment securities. Certificates of deposit scheduled to mature in one year or less at December 31, 2016 totaled $166.0 million. Management’s policy is to maintain deposit rates at levels that are competitive with other local financial institutions. In 2016, our posture was to be less aggressive in competing for certificates of deposit and public funds and focus on core deposit acquisition to reduce our cost of funds. Based on historical experience, we believe that a significant portion of maturing certificates of deposit will remain with First Financial Northwest Bank. As further funding sources, we had the ability at December 31, 2016 to borrow an additional $203.6 million from the FHLB and $35.0 million from unused lines of credit with other financial institutions to meet commitments and for liquidity purposes. See the Consolidated Statements of Cash Flows in Item 8 of this report for further details on our cash flow activities.
We measure our liquidity based on our ability to fund our assets and to meet liability obligations when they come due. Liquidity (and funding) risk occurs when funds cannot be raised at reasonable prices, or in a reasonable time frame, to meet our normal or unanticipated obligations. We regularly monitor the mix between our assets and our liabilities to manage our liquidity and funding requirements.
Our primary source of funds is our retail deposits. When retail deposits are not available to provide the funds for our assets, we use alternative funding sources. These sources include, but are not limited to, advances from the FHLB, wholesale funding, brokered deposits, federal funds purchased, and dealer repurchase agreements, as well as other short-term alternatives. We may also liquidate assets to meet our funding needs.
On a monthly basis, we estimate our liquidity sources and needs for the next six months. Also, we determine funding concentrations and our need for sources of funds other than deposits. This information is used by our Asset/Liability Management Committee in forecasting funding needs and investing opportunities.
Capital
Our total stockholders’ equity was $138.1 million at December 31, 2016. Consistent with our goal to operate a sound and profitable financial organization we will actively seek to maintain a “well capitalized” institution in accordance with regulatory standards. As of December 31, 2016, First Financial Northwest Bank exceeded all regulatory capital requirements. Regulatory capital ratios for First Financial Northwest Bank were as follows as of December 31, 2016: Total capital to risk-weighted assets was 15.61%; Tier 1 capital and Common equity tier 1 capital to risk-weighted assets was 14.36%; and Tier 1 capital to total assets was 11.17%. At December 31, 2016, First Financial Northwest Bank met the financial ratios to be considered well-capitalized under the regulatory guidelines. See Item 1. “Business – How We Are Regulated – Regulation and Supervision of First Financial Northwest Bank – Capital Requirements.”
Commitments and Off-Balance Sheet Arrangements
We are a party to financial instruments with off-balance sheet risk in the normal course of business to meet the financing needs of our customers. These financial instruments include commitments to extend credit and the unused portions of lines of credit. These instruments involve, to varying degrees, elements of credit and interest rate risk in excess of the amount recognized in the consolidated statements of financial condition. Commitments to extend credit and lines of credit are not recorded as an asset or liability by us until the instrument is exercised. At December 31, 2016 and 2015, we had no commitments to originate loans for sale.
Commitments to extend credit are agreements to lend to a customer as long as there is no violation of any condition established in the loan agreement. Commitments generally have fixed expiration dates or other termination clauses and may require payment of a fee. Since many of the commitments are expected to expire without being drawn upon, the total commitment amounts
74
do not necessarily represent future cash requirements. We evaluate each customer’s creditworthiness on a case-by-case basis. The amount of collateral obtained, if deemed necessary by us upon extension of credit, is based on our credit evaluation of the customer. The amount and type of collateral required varies, but may include real estate and income-producing commercial properties.
The following table summarizes our outstanding commitments for lease payments, to advance additional amounts pursuant to outstanding lines of credit, and to disburse funds related to our construction loans at December 31, 2016.
Amount of Commitment Expiration - Per Period | |||||||||||||||||||
Total Amounts Committed | Through One Year | After One Through Three Years | After Three Through Five Years | After Five Years | |||||||||||||||
(In thousands) | |||||||||||||||||||
Unused portion of lines of credit | $ | 24,585 | $ | 2,834 | $ | 16,496 | $ | 2,456 | $ | 2,799 | |||||||||
Undisbursed portion of construction loans | 72,026 | 35,869 | 36,157 | — | — | ||||||||||||||
Total commitments | $ | 96,611 | $ | 38,703 | $ | 52,653 | $ | 2,456 | $ | 2,799 | |||||||||
First Financial Northwest and its subsidiaries from time to time are involved in various claims and legal actions arising in the ordinary course of business. There are currently no matters that in the opinion of management would have a material adverse effect on First Financial Northwest’s consolidated financial position, results of operation or liquidity.
We anticipate that we will continue to have sufficient funds and alternative funding sources to meet our current commitments.
The following table presents a summary of significant contractual obligations as of December 31, 2016, maturing as indicated:
Less Than One Year | One to Three Years | Three to Five Years | More Than Five Years | Total | |||||||||||||||
(In thousands) | |||||||||||||||||||
Deposits (1) | $ | 451,349 | $ | 213,230 | $ | 52,897 | $ | — | $ | 717,476 | |||||||||
Term debt | 70,000 | 21,500 | — | 80,000 | 171,500 | ||||||||||||||
Other long-term liabilities (2) | 192 | 383 | 309 | 1,133 | 2,017 | ||||||||||||||
Lease commitments | 169 | 362 | 217 | — | 748 | ||||||||||||||
Total contractual obligations | $ | 521,710 | $ | 235,475 | $ | 53,423 | $ | 81,133 | $ | 891,741 | |||||||||
___________
(1) | Deposit accounts with indeterminate maturities, such as noninterest bearing, interest-bearing demand, savings and money market accounts are reflected as obligations due in less than one year. |
(2) | Includes maximum payments related to employee benefit plans, assuming all future vesting conditions are met. Additional information about employee benefit plans is provided in Note 11 of the Notes to Consolidated Financial Statements included in Item 8 of this Form 10-K. |
Impact of Inflation
The Consolidated Financial Statements and related financial data presented herein have been prepared in accordance with accounting principles generally accepted in the United States of America. These principles generally require the measurement of financial position and operating results in terms of historical dollars, without considering changes in the relative purchasing power of money over time due to inflation.
Unlike most industrial companies, virtually all the assets and liabilities of a financial institution are monetary in nature. The primary impact of inflation is reflected in the increased cost of our operations. As a result, interest rates generally have a more significant impact on a financial institution’s performance than do general levels of inflation. Interest rates do not necessarily move in the same direction or to the same extent as the prices of goods and services. In a period of rapidly rising interest rates, the liquidity and maturity structures of our assets and liabilities are critical to the maintenance of acceptable performance levels.
The principal effect of inflation on earnings, as distinct from levels of interest rates, is in the area of noninterest expense. Expense items such as employee compensation, employee benefits, and occupancy and equipment costs may be subject to increases
75
as a result of inflation. An additional effect of inflation is the possible increase in dollar value of the collateral securing loans that we have made. Our management is unable to determine the extent, if any, to which properties securing loans have appreciated in dollar value due to inflation.
Recent Accounting Pronouncements
See Note 1 of the Notes to Consolidated Financial Statements included in Item 8 of this Form 10-K.
Item 7A. Quantitative and Qualitative Disclosures About Market Risk
The information contained under Item 7. “Management’s Discussion and Analysis of Financial Condition and Results of Operations – Asset and Liability Management and Market Risk” of this Form 10-K is incorporated herein by reference.
Item 8. Financial Statements and Supplementary Data
Index to Consolidated Financial Statements
Page | |
Report of Independent Registered Public Accounting Firm | |
Consolidated Balance Sheets as of December 31, 2016, and 2015 | |
Consolidated Income Statements for the Years Ended December 31, 2016, 2015, and 2014 | |
Consolidated Statements of Comprehensive Income for the Years Ended December 31, 2016, 2015, and 2014 | |
Consolidated Statements of Stockholders’ Equity for the Years Ended December 31, 2016, 2015, and 2014 | |
Consolidated Statements of Cash Flows For the Years Ended December 31, 2016, 2015, and 2014 | |
Notes to Consolidated Financial Statements | |
76
[Letterhead of Moss Adams LLP]
REPORT OF INDEPENDENT REGISTERED PUBLIC ACCOUNTING FIRM
The Board of Directors and Stockholders
First Financial Northwest, Inc.
We have audited the accompanying consolidated balance sheets of First Financial Northwest, Inc. and Subsidiaries (the Company) as of December 31, 2016 and 2015, and the related consolidated statements of income, comprehensive income, stockholders’ equity, and cash flows for each of the three years in the period ended December 31, 2016. We also have audited the Company’s internal control over financial reporting as of December 31, 2016, based on criteria established in Internal Control - Integrated Framework (2013) issued by the Committee of Sponsoring Organizations of the Treadway Commission. The Company’s management is responsible for these financial statements, for maintaining effective internal control over financial reporting, and for its assessment of the effectiveness of internal control over financial reporting, included in the accompanying Management’s Report on Internal Control over Financial Reporting. Our responsibility is to express an opinion on these consolidated financial statements and an opinion on the Company’s internal control over financial reporting based on our audits.
We conducted our audits in accordance with the standards of the Public Company Accounting Oversight Board (United States). Those standards require that we plan and perform the audits to obtain reasonable assurance about whether the consolidated financial statements are free of material misstatement and whether effective internal control over financial reporting was maintained in all material respects. Our audits of the consolidated financial statements included examining, on a test basis, evidence supporting the amounts and disclosures in the consolidated financial statements, assessing the accounting principles used and significant estimates made by management, and evaluating the overall consolidated financial statement presentation. Our audit of internal control over financial reporting included obtaining an understanding of internal control over financial reporting, assessing the risk that a material weakness exists, and testing and evaluating the design and operating effectiveness of internal control based on the assessed risk. Our audits also included performing such other procedures as we considered necessary in the circumstances. We believe that our audits provide a reasonable basis for our opinions.
A company’s internal control over financial reporting is a process designed to provide reasonable assurance regarding the reliability of financial reporting and the preparation of financial statements for external purposes in accordance with generally accepted accounting principles. A company’s internal control over financial reporting includes those policies and procedures that (1) pertain to the maintenance of records that, in reasonable detail, accurately and fairly reflect the transactions and dispositions of the assets of the company; (2) provide reasonable assurance that transactions are recorded as necessary to permit preparation of financial statements in accordance with generally accepted accounting principles, and that receipts and expenditures of the company are being made only in accordance with authorizations of management and directors of the company; and (3) provide reasonable assurance regarding prevention or timely detection of unauthorized acquisition, use, or disposition of the company’s assets that could have a material effect on the financial statements.
77
Because of its inherent limitations, internal control over financial reporting may not prevent or detect misstatements. Also, projections of any evaluation of effectiveness to future periods are subject to the risk that controls may become inadequate because of changes in conditions, or that the degree of compliance with the policies or procedures may deteriorate.
In our opinion, the consolidated financial statements referred to above present fairly, in all material respects, the consolidated financial position of First Financial Northwest, Inc. and Subsidiaries as of December 31, 2016 and 2015, and the consolidated results of its operations and its cash flows for each of the three years in the period ended December 31, 2016, in conformity with accounting principles generally accepted in the United States of America. Also in our opinion, First Financial Northwest, Inc. and Subsidiaries maintained, in all material respects, effective internal control over financial reporting as of December 31, 2016, based on criteria established in Internal Control - Integrated Framework (2013) issued by the Committee of Sponsoring Organizations of the Treadway Commission.
/s/ Moss Adams LLP
Everett, Washington
March 9, 2017
78
FIRST FINANCIAL NORTHWEST, INC. AND SUBSIDIARIES
Consolidated Balance Sheets
(Dollars in thousands, except share data)
December 31, | |||||||
2016 | 2015 | ||||||
Assets | |||||||
Cash on hand and in banks | $ | 5,779 | $ | 5,713 | |||
Interest-earning deposits with banks | 25,573 | 99,998 | |||||
Investments available-for-sale, at fair value | 129,260 | 129,565 | |||||
Loans receivable, net of allowance of $10,951 and $9,463 | 815,043 | 685,072 | |||||
Premises and equipment, net | 18,461 | 17,707 | |||||
Federal Home Loan Bank (“FHLB”) stock, at cost | 8,031 | 6,137 | |||||
Accrued interest receivable | 3,147 | 2,968 | |||||
Deferred tax assets, net | 3,142 | 4,556 | |||||
Other real estate owned (“OREO”) | 2,331 | 3,663 | |||||
Bank owned life insurance (“BOLI”), net | 24,153 | 23,309 | |||||
Prepaid expenses and other assets | 2,664 | 1,225 | |||||
Total assets | $ | 1,037,584 | $ | 979,913 | |||
Liabilities and Stockholders’ Equity | |||||||
Deposits | |||||||
Noninterest-bearing deposits | $ | 33,422 | $ | 29,392 | |||
Interest-bearing deposits | 684,054 | 646,015 | |||||
Total deposits | 717,476 | 675,407 | |||||
Advances from the FHLB | 171,500 | 125,500 | |||||
Advance payments from borrowers for taxes and insurance | 2,259 | 1,794 | |||||
Accrued interest payable | 231 | 135 | |||||
Other liabilities | 7,993 | 6,404 | |||||
Total liabilities | 899,459 | 809,240 | |||||
Commitments and contingencies (Note 14) | |||||||
Stockholders’ Equity | |||||||
Preferred stock, $0.01 par value; authorized 10,000,000 shares, no shares issued or outstanding | — | — | |||||
Common stock, $0.01 par value; authorized 90,000,000 shares; issued and outstanding 10,938,251 shares at December 31, 2016, and 13,768,814 shares at December 31, 2015 | 109 | 138 | |||||
Additional paid-in capital | 96,852 | 136,338 | |||||
Retained earnings, substantially restricted | 48,981 | 42,892 | |||||
Accumulated other comprehensive loss, net of tax benefit | (1,328 | ) | (1,077 | ) | |||
Unearned Employee Stock Ownership Plan (“ESOP”) shares | (6,489 | ) | (7,618 | ) | |||
Total stockholders’ equity | 138,125 | 170,673 | |||||
Total liabilities and stockholders’ equity | $ | 1,037,584 | $ | 979,913 | |||
See accompanying notes to consolidated financial statements.
79
FIRST FINANCIAL NORTHWEST, INC. AND SUBSIDIARIES
Consolidated Income Statements
(Dollars in thousands, except share data)
Year Ended December 31, | |||||||||||
2016 | 2015 | 2014 | |||||||||
Interest income | |||||||||||
Loans, including fees | $ | 38,218 | $ | 34,612 | $ | 36,280 | |||||
Investments available-for-sale | 3,054 | 2,242 | 2,287 | ||||||||
Interest-earning deposits with banks | 235 | 274 | 115 | ||||||||
Dividends on FHLB stock | 202 | 69 | 7 | ||||||||
Total interest income | $ | 41,709 | $ | 37,197 | $ | 38,689 | |||||
Interest expense | |||||||||||
Deposits | 6,101 | 5,478 | 5,063 | ||||||||
FHLB advances | 1,406 | 1,273 | 1,178 | ||||||||
Total interest expense | $ | 7,507 | $ | 6,751 | $ | 6,241 | |||||
Net interest income | 34,202 | 30,446 | 32,448 | ||||||||
Provision (recapture of provision) for loan losses | 1,300 | (2,200 | ) | (2,100 | ) | ||||||
Net interest income after recapture of provision for loan losses | $ | 32,902 | $ | 32,646 | $ | 34,548 | |||||
Noninterest income | |||||||||||
Net gain (loss) on sale of investments | 50 | 92 | (20 | ) | |||||||
BOLI income | 844 | 533 | 123 | ||||||||
Wealth management revenue | 813 | 183 | — | ||||||||
Other | 944 | 471 | 395 | ||||||||
Total noninterest income | $ | 2,651 | $ | 1,279 | $ | 498 | |||||
Noninterest expense | |||||||||||
Salaries and employee benefits | 15,377 | 13,940 | 11,987 | ||||||||
Occupancy and equipment | 1,984 | 1,440 | 1,347 | ||||||||
Professional fees | 1,979 | 1,631 | 1,540 | ||||||||
Data processing | 911 | 759 | 681 | ||||||||
Loss (gain) on sale of OREO property, net | 87 | (526 | ) | 86 | |||||||
OREO market value adjustments | 257 | 41 | 393 | ||||||||
OREO related (reimbursements) expenses, net | (50 | ) | 1 | 190 | |||||||
Regulatory assessments | 420 | 470 | 396 | ||||||||
Insurance and bond premiums | 349 | 359 | 401 | ||||||||
Marketing | 194 | 211 | 97 | ||||||||
Other general and administrative | 1,441 | 1,552 | 1,385 | ||||||||
Total noninterest expense | $ | 22,949 | $ | 19,878 | $ | 18,503 | |||||
Income before provision for federal income taxes | 12,604 | 14,047 | 16,543 | ||||||||
Federal income tax provision | 3,712 | 4,887 | 5,856 | ||||||||
Net income | $ | 8,892 | $ | 9,160 | $ | 10,687 | |||||
Earnings per common share | |||||||||||
Basic | $ | 0.75 | $ | 0.67 | $ | 0.72 | |||||
Diluted | $ | 0.74 | $ | 0.67 | $ | 0.71 | |||||
Weighted average number of common shares outstanding | |||||||||||
Basic | 11,868,278 | 13,528,393 | 14,747,086 | ||||||||
Diluted | 12,028,428 | 13,685,982 | 14,887,198 | ||||||||
See accompanying notes to consolidated financial statements.
80
FIRST FINANCIAL NORTHWEST, INC. AND SUBSIDIARIES
Consolidated Statements of Comprehensive Income
(In thousands)
Year Ended December 31, | ||||||||||||
2016 | 2015 | 2014 | ||||||||||
(In thousands) | ||||||||||||
Net income | $ | 8,892 | $ | 9,160 | $ | 10,687 | ||||||
Other comprehensive income (loss), net of tax: | ||||||||||||
Unrealized holding (losses) gains on available-for-sale securities | (1,669 | ) | (1,016 | ) | 2,538 | |||||||
Tax benefit (provision) | 584 | 356 | (888 | ) | ||||||||
Reclassification adjustment for net (gains) losses realized in income | (50 | ) | (92 | ) | 20 | |||||||
Tax provision (benefit) | 18 | 32 | (7 | ) | ||||||||
Gain on cash flow hedge | 1,333 | — | — | |||||||||
Tax provision | (467 | ) | — | — | ||||||||
Other comprehensive (loss) income, net of tax | $ | (251 | ) | $ | (720 | ) | $ | 1,663 | ||||
Total comprehensive income | $ | 8,641 | $ | 8,440 | $ | 12,350 | ||||||
See accompanying notes to consolidated financial statements.
81
FIRST FINANCIAL NORTHWEST, INC. AND SUBSIDIARIES
Consolidated Statements of Stockholders’ Equity
(In thousands, except share data)
Shares | Common Stock | Additional Paid-in Capital | Retained Earnings | Accumulated Other Comprehensive Income (Loss), net of tax | Unearned ESOP Shares | Total Stockholders’ Equity | |||||||||||||||||||||
Balances at December 31, 2013 | 16,392,139 | $ | 164 | $ | 166,866 | $ | 29,220 | $ | (2,020 | ) | 188 | $ | (9,875 | ) | $ | 184,355 | |||||||||||
Total other comprehensive income, net of tax | — | — | — | 10,687 | 1,663 | — | 12,350 | ||||||||||||||||||||
Cash dividends declared and paid ($.20 per share) | — | — | — | (2,938 | ) | — | — | (2,938 | ) | ||||||||||||||||||
Exercise of stock options | 369,275 | 3 | 3,608 | — | — | — | 3,611 | ||||||||||||||||||||
Repurchase and retirement of common stock | (1,594,033 | ) | (16 | ) | (17,550 | ) | — | — | — | (17,566 | ) | ||||||||||||||||
Stock compensation expense | — | — | 384 | — | — | — | 384 | ||||||||||||||||||||
Allocation of 112,854 ESOP shares | — | — | 87 | — | — | 1,129 | 1,216 | ||||||||||||||||||||
Balances at December 31, 2014 | 15,167,381 | $ | 151 | $ | 153,395 | $ | 36,969 | $ | (357 | ) | $ | (8,746 | ) | $ | 181,412 | ||||||||||||
Total other comprehensive income, net of tax | — | — | — | 9,160 | (720 | ) | — | 8,440 | |||||||||||||||||||
Cash dividends declared and paid ($.24 per share) | — | — | — | (3,237 | ) | — | — | (3,237 | ) | ||||||||||||||||||
Exercise of stock options | 125,000 | 1 | 934 | — | — | — | 935 | ||||||||||||||||||||
Repurchase and retirement of common stock | (1,523,567 | ) | (14 | ) | (18,703 | ) | — | — | — | (18,717 | ) | ||||||||||||||||
Stock compensation expense | — | — | 440 | — | — | — | 440 | ||||||||||||||||||||
Allocation of 112,853 ESOP shares | — | — | 272 | — | — | 1,128 | 1,400 | ||||||||||||||||||||
Balances at December 31, 2015 | 13,768,814 | $ | 138 | $ | 136,338 | $ | 42,892 | $ | (1,077 | ) | $ | (7,618 | ) | $ | 170,673 | ||||||||||||
Net income | — | — | — | 8,892 | — | — | 8,892 | ||||||||||||||||||||
Other comprehensive income | — | — | — | — | (251 | ) | — | (251 | ) | ||||||||||||||||||
Exercise of stock options | 101,303 | 1 | 297 | — | — | — | 298 | ||||||||||||||||||||
Issuance of common stock - restricted stock awards, net | 7,001 | — | (98 | ) | — | — | — | (98 | ) | ||||||||||||||||||
Compensation related to stock options and restricted stock awards | — | — | 621 | — | — | — | 621 | ||||||||||||||||||||
Allocation of 112,853 ESOP shares | — | — | 476 | — | — | 1,129 | 1,605 | ||||||||||||||||||||
Repurchase and retirement of common stock | (2,864,389 | ) | (29 | ) | (40,783 | ) | — | — | — | (40,812 | ) | ||||||||||||||||
Canceled common stock - restricted stock awards | (74,478 | ) | (1 | ) | 1 | — | — | — | — | ||||||||||||||||||
Cash dividends declared and paid ($.24 per share) | — | — | — | (2,803 | ) | — | — | (2,803 | ) | ||||||||||||||||||
Balances at December 31, 2016 | 10,938,251 | $ | 109 | $ | 96,852 | $ | 48,981 | $ | (1,328 | ) | $ | (6,489 | ) | $ | 138,125 | ||||||||||||
See accompanying notes to consolidated financial statements.
82
FIRST FINANCIAL NORTHWEST, INC. AND SUBSIDIARIES
Consolidated Statements of Cash Flows
(In thousands)
Year Ended December 31, | |||||||||||
2016 | 2015 | 2014 | |||||||||
Cash flows from operating activities: | |||||||||||
Net income | $ | 8,892 | $ | 9,160 | $ | 10,687 | |||||
Adjustments to reconcile net income to net cash provided by operating activities | |||||||||||
Provision (recapture of provision) for loan losses | 1,300 | (2,200 | ) | (2,100 | ) | ||||||
OREO market value adjustments | 257 | 41 | 393 | ||||||||
Loss (gain) on sale of OREO property, net | 87 | (526 | ) | 86 | |||||||
Net amortization of premiums and discounts on investments | 908 | 1,104 | 1,389 | ||||||||
(Gain) loss on sale of investments available-for-sale | (50 | ) | (92 | ) | 20 | ||||||
Depreciation of premises and equipment | 1,076 | 809 | 755 | ||||||||
Loss on sale of premises and equipment | 3 | — | 11 | ||||||||
Deferred federal income taxes | 1,548 | 4,170 | 5,602 | ||||||||
Allocation of ESOP shares | 1,605 | 1,400 | 1,216 | ||||||||
Stock compensation expense | 621 | 440 | 384 | ||||||||
Change in cash surrender value of BOLI | (844 | ) | (533 | ) | (123 | ) | |||||
Changes in operating assets and liabilities: | |||||||||||
Prepaid expenses and other assets | (105 | ) | 270 | (567 | ) | ||||||
Advance payments from borrowers for taxes and insurance | 465 | 87 | (139 | ) | |||||||
Accrued interest receivable | (179 | ) | 297 | 433 | |||||||
Accrued interest payable | 96 | (7 | ) | 54 | |||||||
Other liabilities | 1,589 | 2,295 | 484 | ||||||||
Net cash provided by operating activities | $ | 17,269 | $ | 16,715 | $ | 18,585 | |||||
Cash flows from investing activities: | |||||||||||
Proceeds from sales and call of investments | 26,437 | 27,327 | 6,430 | ||||||||
Principal repayments on investments | 15,852 | 18,651 | 20,818 | ||||||||
Purchases of investments | (44,561 | ) | (57,290 | ) | (2,109 | ) | |||||
Net increase in loans receivable | (131,271 | ) | (19,075 | ) | (508 | ) | |||||
Capital expenditures related to OREO | — | — | (120 | ) | |||||||
Proceeds from sales of OREO properties | 988 | 6,246 | 3,646 | ||||||||
Purchases of premises and equipment | (1,833 | ) | (1,781 | ) | (209 | ) | |||||
(Purchase) redemption of FHLB stock | (1,894 | ) | 608 | 272 | |||||||
Purchase of BOLI | — | (20,000 | ) | — | |||||||
Net cash (used in) provided by investing activities | $ | (136,282 | ) | $ | (45,314 | ) | $ | 28,220 | |||
Cash flows from financing activities: | |||||||||||
Net increase in deposits | 42,069 | 61,280 | 2,062 | ||||||||
Advances from the FHLB | 525,000 | — | 16,500 | ||||||||
Repayments of advances from the FHLB | (479,000 | ) | (10,000 | ) | — | ||||||
Proceeds from stock options exercises | 298 | 935 | 3,611 | ||||||||
Net share settlement of stock awards | (98 | ) | — | — | |||||||
Repurchase and retirement of common stock | (40,812 | ) | (18,717 | ) | (17,566 | ) | |||||
Dividends paid | (2,803 | ) | (3,237 | ) | (2,938 | ) | |||||
Net cash provided by financing activities | $ | 44,654 | $ | 30,261 | $ | 1,669 | |||||
continued
83
FIRST FINANCIAL NORTHWEST, INC. AND SUBSIDIARIES
Consolidated Statements of Cash Flows
(In thousands)
Year Ended December 31, | |||||||||||
2016 | 2015 | 2014 | |||||||||
Net (decrease) increase in cash and cash equivalents | $ | (74,359 | ) | $ | 1,662 | $ | 48,474 | ||||
Cash and cash equivalents at beginning of year | 105,711 | 104,049 | 55,575 | ||||||||
Cash and cash equivalents at end of year | $ | 31,352 | $ | 105,711 | $ | 104,049 | |||||
Supplemental disclosures of cash flow information: | |||||||||||
Cash paid during the period for: | |||||||||||
Interest | $ | 7,411 | $ | 6,757 | $ | 6,187 | |||||
Federal income taxes | 2,730 | 228 | 309 | ||||||||
Noncash transactions: | |||||||||||
Loans transferred to OREO, net of deferred loan fees and allowance for loan and lease losses (“ALLL”) | — | 141 | 1,823 | ||||||||
Change in unrealized loss on investments available-for-sale | (1,719 | ) | (1,108 | ) | 2,558 | ||||||
Change in gain on cash flow hedge | 1,333 | — | — | ||||||||
See accompanying notes to consolidated financial statements.
84
FIRST FINANCIAL NORTHWEST, INC. AND SUBSIDIARIES
NOTES TO CONSOLIDATED FINANCIAL STATEMENTS
Note 1 - Summary of Significant Accounting Policies
Nature of Operations and Principles of Consolidation
First Financial Northwest, Inc. (“First Financial Northwest”), a Washington corporation, was formed on June 1, 2007 for the purpose of becoming the holding company for First Financial Northwest Bank (“the Bank”) in connection with the conversion from a mutual holding company structure to a stock holding company structure completed on October 9, 2007. First Financial Northwest’s business activities generally are limited to passive investment activities and oversight of its investment in First Financial Northwest Bank. Accordingly, the information presented in the consolidated financial statements and related data, relates primarily to First Financial Northwest Bank. First Financial Northwest converted from a savings and loan holding company to a bank holding company in 2015 and is subject to regulation by the Board of Governors of the Federal Reserve Bank of San Francisco (“FRB”) as the successor to the Office of Thrift Supervision (“OTS”). First Financial Northwest Bank is regulated by the Federal Deposit Insurance Corporation (“FDIC”) and the Washington State Department of Financial Institutions (“DFI”).
First Financial Northwest Bank was organized in 1923 as a Washington state-chartered savings and loan association, converted to a federal mutual savings and loan association in 1935, and converted to a Washington state-chartered mutual savings bank in 1992. In 2002, First Financial Northwest Bank reorganized into a two-tier mutual holding company structure, became a stock savings bank and became the wholly-owned subsidiary of First Financial of Renton, Inc. In connection with the mutual to stock conversion in 2007, the Bank changed its name to First Savings Bank Northwest. In August 2015, the Bank changed its name to First Financial Northwest Bank to support the expansion of focus to being more than a traditional “savings” bank and in February 4, 2016 changed its charter from a Washington chartered stock savings bank to a Washington chartered commercial bank.
First Financial Northwest Bank is a community-based commercial bank primarily serving King and Snohomish Counties, and to a lesser extent, Pierce and Kitsap Counties, Washington. In King County, the headquarters and full-service banking office as well as a branch office are located in Renton. In Snohomish County, two additional branch offices serve Mill Creek and Edmonds. First Financial Northwest Bank’s business consists of attracting deposits from the public and utilizing these deposits to originate one-to-four family residential, multifamily, commercial real estate, construction/land, business and consumer loans.
First Financial Diversified Corporation (“FFD”), a wholly-owned subsidiary of First Financial Northwest, continues to hold a portfolio of one-to-four family, land and consumer loans that are serviced by the Bank. At December 31, 2016, FFD had net loans receivable of $2.4 million that were all performing.
The accompanying consolidated financial statements include the accounts of First Financial Northwest and its wholly‑owned subsidiaries First Financial Northwest Bank and First Financial Diversified Corporation (collectively, “the Company”). All significant intercompany balances and transactions between First Financial Northwest and its subsidiaries have been eliminated in consolidation.
Basis of Presentation and Use of Estimates
The accounting and reporting policies of First Financial Northwest and its subsidiaries conform to U.S. generally accepted accounting principles (“GAAP”). In preparing the consolidated financial statements, management makes estimates and assumptions based on available information. These estimates and assumptions affect the amounts reported in the financial statements and the disclosures provided. Actual results could differ from these estimates. Material estimates particularly subject to change include the allowance for loan and lease losses (“ALLL”), other real estate owned (“OREO”), deferred tax assets and the fair values of financial instruments.
Subsequent Events
The Company has evaluated events and transactions subsequent to December 31, 2016 for potential recognition or disclosure. See Note 18 - Subsequent Events for more information.
85
FIRST FINANCIAL NORTHWEST, INC. AND SUBSIDIARIES
NOTES TO CONSOLIDATED FINANCIAL STATEMENTS
Cash and Cash Equivalents
For purposes of reporting cash flows, cash and cash equivalents include cash on hand and in banks, interest-bearing deposits and federal funds sold all with maturities of three months or less.
The Bank is required to maintain an average reserve balance with the FRB or maintain such reserve balance in the form of cash. The required reserve balance was $228,000 at December 31, 2016, and $434,000 at December 31, 2015.
Investments
Investments are classified into one of three categories: (1) held-to-maturity, (2) available-for-sale, or (3) trading. We had no held-to-maturity or trading securities at December 31, 2016, or 2015. Investments are categorized as held-to-maturity when we have the positive intent and ability to hold them to maturity.
Investments are classified as available-for-sale if the Company intends to hold the securities for an indefinite period of time, but not necessarily to maturity. Investments available-for-sale are reported at fair value. Unrealized holding gains and losses on investments available-for-sale are excluded from earnings and are reported in other comprehensive income (loss), net of applicable taxes. Gains and losses on sales are recorded on the trade date and determined using the specific identification method. Amortization or accretion of purchase premiums and discounts are included in investment income using the level-yield method over the remaining period to contractual maturity. Dividend or interest income is recognized when it is earned.
The estimated fair value of investments is based on quoted market prices for investments traded in active markets or dealer quotes. Mortgage-backed investments represent participation interest in pools of first mortgage loans originated and serviced by the issuers of the investments.
Management makes an assessment to determine whether there have been any events or economic circumstances to indicate that a security on which there is an unrealized loss is impaired on an other-than-temporary basis. Management considers many factors including the severity and duration of the impairment, recent events specific to the issuer or industry, and for debt securities, external credit ratings and recent downgrades. Securities on which there is an unrealized loss that is deemed to be an other-than-temporary impairment (“OTTI”) are written down to fair value. For equity securities, the write-down is recorded as a realized loss in noninterest income in the Consolidated Income Statements. For debt securities, if management intends to sell the security or it is likely that management will be required to sell the security before recovering its cost basis, the entire impairment loss would be recognized in earnings as an OTTI. If management does not intend to sell the security and it is not likely that management will be required to sell the security but management does not expect to recover the entire amortized cost basis of the security, only the portion of the impairment loss representing credit losses would be recognized in earnings. The credit loss on a security is measured as the difference between the amortized cost basis and the present value of the cash flows expected to be collected. Projected cash flows are discounted by the original or current effective interest rate depending on the nature of the security being measured for potential OTTI. The remaining impairment related to all other factors, the difference between the present value of the cash flows expected to be collected and fair value, is recognized as a charge to other comprehensive income (“OCI”). Impairment losses related to all other factors are presented as separate categories within OCI.
Loans Receivable
Loans are recorded at their outstanding principal balance adjusted for charge-offs, the ALLL and net deferred fees or costs. Interest on loans is accrued on the unpaid principal balance. Loan origination fees, net of certain direct origination costs, are deferred and recognized in interest income using the level-yield method without anticipating prepayments.
The accrual of interest on loans is discontinued at the time the loan is 90 days delinquent unless the loan is well secured and in the process of collection. Consumer and other loans are typically managed in the same manner. In all cases, loans are placed on nonaccrual or charged-off at an earlier date if collection of principal or interest is doubtful.
All interest accrued but not collected on loans that are placed on nonaccrual is reversed against interest income. Loans are returned to accrual status when all principal and interest amounts contractually due are brought current and future payments are reasonably assured. In order to return a nonaccrual loan to accrual status, each loan is evaluated on a case-by-case basis. We evaluate the borrower’s financial condition to ensure that future loan payments are reasonably assured. We also take into consideration the borrower’s willingness and ability to make the loan payments and historical repayment performance. We require the borrower to make the loan payments consistently for a period of at least six months as agreed to under the terms of any modified loan agreement before we will consider reclassifying the loan to accrual status.
86
FIRST FINANCIAL NORTHWEST, INC. AND SUBSIDIARIES
NOTES TO CONSOLIDATED FINANCIAL STATEMENTS
Impaired Loans
A loan is considered impaired when, based on current information and events, it is probable that the Company will be unable to collect the scheduled payments of principal or interest when due according to the contractual terms of the loan agreement. Factors considered by management in determining impairment include payment status, collateral value, market conditions, rent rolls and the financial strength of the borrower(s) and guarantor(s), if any. Loans that experience insignificant payment delays and payment shortfalls generally are not classified as impaired.
Management determines the significance of payment delays and shortfalls on a case-by-case basis, taking into consideration all of the circumstances surrounding the loan and the borrowers, including the length of the delay, the reasons for the delay, the borrower’s prior payment history and the amount of the shortfall in relation to the principal and interest owed. Impairment is measured by the fair value method on a loan-by-loan basis.
When a loan is identified as impaired, its impairment is measured using the present value of expected future cash flows, discounted at the loan’s effective interest rate, except when the sole (remaining) source of repayment for the loan is the operation or liquidation of the collateral. In these cases, the Company uses an observable market price or current fair value of the collateral, less certain completion costs and closing costs when foreclosure is probable, instead of discounted cash flows. The Company obtains annual updated appraisals for impaired collateral dependent loans that exceed $1.0 million and loans that have been transferred to OREO. In addition, the Company may order appraisals on properties not included within these guidelines when there are extenuating circumstances where the Company is not otherwise able to determine the fair value of the property. Appraised values may be discounted based on management’s historical knowledge, changes in market conditions from the time of valuation and/or management’s expertise and knowledge of the borrower. If management determines that the value of the impaired loan is less than the recorded investment in the loan, an impairment is recognized through an allowance estimate or a charge-off to the ALLL.
Troubled Debt Restructurings
Certain loan modifications or restructurings are accounted for as troubled debt restructurings (“TDR”). In general, the modification or restructuring of a debt is considered a TDR if, for economic or legal reasons related to the borrower’s financial difficulties, a concession is granted to the borrower that the Company would not otherwise consider. Examples of these modifications or restructurings include advancement of maturity date, accepting interest only payments for a period of time, or granting an interest rate concession for a period of time. The impaired portion of the loan with an interest rate concession and/or interest-only payments for a specific period of time are calculated based on the present value of expected future cash flows discounted at the loan’s effective interest rate. The effective interest rate is the rate of return implicit on the original loan. This impaired amount reduces the ALLL and a valuation allowance is established to reduce the loan balance. As loan payments are received in future periods, the ALLL entry is reversed and the valuation allowance is reduced utilizing the level yield method over the modification period. A loan that is determined to be classified as a TDR is generally reported as a TDR until the loan is paid in full or otherwise settled, sold, or charged-off.
Allowance for Loan and Lease Losses
The allowance for loan and lease losses (“ALLL”) is a valuation allowance for probable incurred credit losses. Losses are charged against the allowance when management believes the uncollectability of a loan balance is confirmed. Any subsequent recoveries are credited to the allowance.
The ALLL is evaluated on a regular basis by management and is based upon management’s periodic review of the collectability of the loans and factors such as the nature and volume of the loan portfolio, historical loss considerations, adverse situations that may affect the borrower’s ability to repay, estimated value of any underlying collateral, and prevailing economic conditions. The evaluation is inherently subjective, as it requires estimates that are susceptible to significant revision as more information becomes available.
While management uses available information to recognize losses on loans, future additions to the allowance may be necessary based on changes in economic conditions or changes to the credit quality of the loan portfolio. In addition, various regulatory agencies, as an integral part of their examination process, periodically review the Company’s ALLL. Such agencies may require management to make adjustments to the allowance based on their judgments about information available to them at the time of their examination.
87
FIRST FINANCIAL NORTHWEST, INC. AND SUBSIDIARIES
NOTES TO CONSOLIDATED FINANCIAL STATEMENTS
Premises and Equipment
Premises and equipment are stated at cost less accumulated depreciation and amortization. Depreciation and amortization are computed using the straight-line method over the estimated useful lives of the assets. The estimated useful lives used to compute depreciation and amortization is 15 to 40 years for buildings and building improvements, and is three to seven years for furniture, fixtures, and equipment. Leasehold improvements are amortized over the life of the lease. Management reviews buildings, improvements and equipment for impairment on an annual basis or whenever events or changes in the circumstances indicate that the undiscounted cash flows for the property are less than its carrying value. If identified, an impairment loss is recognized through a charge to earnings based on the fair value of the property.
Federal Home Loan Bank Stock
As a member of the Federal Home Loan Bank System, the Bank is required to maintain a minimum level of investment in the Federal Home Loan Bank of Des Moines (“FHLB”) stock, based on specified percentages of outstanding mortgages and the Bank’s outstanding FHLB advances. Ownership of FHLB stock is restricted to the FHLB and member institutions. The Bank’s investment in FHLB stock is carried at par value ($100 per share), which reasonably approximates its fair value.
Transfer of Financial Assets
Transfers of an entire financial asset, a group of entire financial assets, or participating interest in an entire financial asset are accounted for as sales when control over the assets has been surrendered. Control over transferred assets is deemed to be surrendered when (1) the assets have been isolated from the Bank, (2) the transferee obtains the right (free of conditions that constrain it from taking advantage of that right) to pledge or exchange the transferred assets, and (3) the Bank does not maintain effective control over the transferred assets through an agreement to repurchase them before their maturity.
Other Real Estate Owned
OREO consists principally of properties acquired through foreclosure and is stated at the lower of cost or estimated market value less selling costs. Losses arising from the acquisition of property, in full or partial satisfaction of loans, are charged to the ALLL.
Subsequent to the transfer of foreclosed assets held for sale, the assets continue to be recorded at the lower of cost or fair value (less estimated costs to sell), based on periodic evaluations. Subsequent write-downs in value are charged to noninterest expense. Generally, legal and professional fees associated with foreclosures are expensed as incurred. Costs incurred to improve property prior to sale are capitalized; however, in no event are recorded costs allowed to exceed estimated fair value. Subsequent gains, losses, or expenses recognized on the sale of these properties are included in noninterest expense. The amounts that will ultimately be recovered from foreclosed assets may differ substantially from the carrying value of the assets because of future market factors beyond management’s control.
Bank-Owned Life Insurance
The Company has purchased life insurance on certain key executives and officers. Bank-owned life insurance (“BOLI”) is recorded at the amount that can be realized under the insurance contract at the balance sheet date, which is the cash surrender value adjusted for other charges or other amounts due that are probable at settlement. Increases to the cash surrender value are recorded as noninterest income and partially offset expenses for employee benefits.
Loan Commitments and Related Financial Instruments
Financial instruments include off-balance sheet credit instruments, such as unused lines of credit and commercial letters of credit issued to meet customer financing needs. The face amount of these items represents the exposure to loss before considering customer collateral or ability to repay. Such financial instruments are recorded when they are funded.
Reserve for Unfunded Commitments
Management maintains a reserve for unfunded commitments to absorb probable losses associated with our off-balance sheet commitments to lend funds such as unused lines of credit and the undisbursed portion of construction loans. Management determines the adequacy of the reserve based on reviews of individual exposures, current economic conditions, and other relevant factors. The reserve is based on estimates and ultimate losses may vary from the current estimates. The reserve is evaluated on a
88
FIRST FINANCIAL NORTHWEST, INC. AND SUBSIDIARIES
NOTES TO CONSOLIDATED FINANCIAL STATEMENTS
regular basis and necessary adjustments are reported in earnings during the period in which they become known. The reserve for unfunded commitments is included in the other liabilities section of the consolidated balance sheets.
Stock-Based Compensation
Compensation cost is recognized for stock options and restricted stock awards, based on the fair value of these awards at the grant date. A Black-Scholes model is utilized to estimate the fair value of stock options, while the market price of the Company’s common stock at the grant date is used for restricted stock awards. Compensation cost is recognized over the required service period, generally defined as the vesting period. For awards with graded vesting, compensation cost is recognized on a straight-line basis over the requisite service period for the entire award.
Federal Income Taxes
The Company files a consolidated Federal income tax return and records its provision for income taxes under the asset and liability method. Deferred taxes result from temporary differences in the recognition of certain income and expense amounts between the Company’s financial statements and its tax return. The principal items giving rise to these differences include net operating losses, valuation adjustments on foreclosed properties, and allowance for credit losses. Deferred tax assets and liabilities are reflected at currently enacted income tax rates applicable to the period in which the deferred tax assets or liabilities are expected to be realized or settled. As changes in tax laws or rates are enacted, deferred tax assets and liabilities are adjusted through the provision for income taxes. Valuation allowances are established to reduce the net carrying amount of deferred tax assets if it is determined to be more likely than not that all or some portion of the potential deferred tax asset will not be realized. The Company’s policy is to recognize interest and penalties associated with income tax matters in income tax expense.
Employee Stock Ownership Plan
The cost of shares issued to the Employee Stock Ownership Plan (“ESOP”), but not yet allocated to participants, is shown as a reduction of stockholders’ equity. Compensation expense is based on the market price of shares as they are committed to be released to participant accounts. Dividends on allocated ESOP shares reduce retained earnings; dividends on unearned ESOP shares reduce debt and accrued interest.
Earnings Per Share
Nonvested share-based payment awards that contain nonforfeitable rights to dividends or dividend equivalents are participating securities and are included in the computation of earnings per share (“EPS”) pursuant to the two-class method. The two-class method is an earnings allocation formula that determines EPS for each class of common stock and participating security according to dividends declared or accumulated and participation rights in undistributed earnings. Certain shares of the Company’s nonvested restricted stock awards qualify as participating securities.
Net income is allocated between the common stock and participating securities pursuant to the two-class method, based on their rights to receive dividends, participate in earnings or absorb losses. Basic earnings per common share is computed by dividing net earnings available to common shareholders by the weighted average number of common shares outstanding during the period, excluding participating nonvested restricted shares. As ESOP shares are committed to be released, they are included in the outstanding shares used in the basic EPS calculation.
Diluted earnings per share is computed in a similar manner, except that first the denominator is increased to include the number of additional shares that would have been outstanding if potentially dilutive shares, excluding the participating securities, were issued using the treasury stock method. For all periods presented, stock options and certain restricted stock awards are potentially dilutive non-participating instruments issued by the Company.
Undistributed losses are not allocated to the nonvested share-based payment awards (the participating securities) under the two-class method as the holders are not contractually obligated to share in the losses of the Company.
Comprehensive Income
Comprehensive income consists of net income and unrealized gains and losses on investments available-for-sale and derivatives which are also recognized as separate components of equity, net of tax.
89
FIRST FINANCIAL NORTHWEST, INC. AND SUBSIDIARIES
NOTES TO CONSOLIDATED FINANCIAL STATEMENTS
Advertising Expenses
Advertising costs are generally expensed as incurred.
Fair Value of Financial Instruments
Fair values of financial instruments are estimated using relevant market information and other assumptions, as more fully disclosed in a separate note. Fair value estimates involve uncertainties and matters of significant judgment regarding interest rates, credit risk, prepayments and other factors, especially in the absence of broad markets for particular items. Changes in assumptions or in market conditions could significantly affect the estimates.
Segment Information
The Company’s activities are considered to be a single industry segment for financial reporting purposes. The Company is engaged in the business of attracting deposits from the general public and providing lending services. Substantially all income is derived from a diverse base of investments and commercial, construction, mortgage, and consumer lending activities.
Reclassification
Certain amounts in the consolidated financial statements for prior years have been reclassified to conform to the current consolidated financial statement presentation. The results of the reclassifications are not considered material and have no effect on previously reported net income or stockholders’ equity.
Derivatives
The Company recognizes its interest rate swap as a cash flow hedge derivative instrument, and as such, reports the fair value as an asset or liability. Fair value is based on dealer quotes, pricing models, discounted cash flow methodologies or similar techniques for which the determination of fair value may require significant management judgment or estimation. The derivative is marked to its fair value through other comprehensive income. Any ineffectiveness is recognized in earnings. The gain or loss on the derivative is removed from equity and recognized in earnings in the same period the corresponding loss or gain on the hedged cash flow is recognized in earnings.
Recently Issued Accounting Pronouncements
In May 2014, the Financial Accounting Standards Board ("FASB") issued Accounting Standards Update ("ASU") No. 2014-09, Revenue from Contracts with Customer (Topic 606). In August 2015, FASB issued ASU No. 2015-14, Revenue from Contracts with Customers (Topic 606) which postponed the effective date of 2014-09. Subsequently, in March 2016, the FASB issued ASU 2016-08, Revenue from Contracts with Customers (Topic 606): Principal versus Agent Considerations. This amendment clarifies that an entity should determine if it is the principal or the agent for each specified good or service promised in a contract with a customer. In April 2016, the FASB issued ASU No. 2016-10, Revenue from Contracts with Customers (Topic 606): Identifying Performance Obligations and Licensing. The core principle of Topic 606 is that an entity must recognize revenue when it has satisfied a performance obligation of transferring promised goods or services to a customer. The standard is effective for public entities for interim and annual periods beginning after December 15, 2017; early adoption is not permitted. The standard allows for full retrospective adoption for all periods presented or modified retrospective adoption to only the most current period presented in the financial statements. The cumulative effect of initially applying the standard is recognized at the date of the initial application. Our primary source of revenue is interest income, which is recognized as it is earned and is deemed to be in compliance with this ASU. The Company does not expect implementation of this standard to have a material impact on our consolidated financial statements.
In January 2016, FASB issued ASU No. 2016-01, Financial Instruments--Overall, Recognition and Measurement of Financial Assets and Financial Liabilities. ASU 2016-01 requires equity investments (except those accounted for under the equity method of accounting) to be measured at fair value with changes in fair value recognized in net income. The amendments in this update also require an entity to present separately in other comprehensive income the portion of the total change in the fair value of a liability resulting from a change in instrument-specific credit risk. In addition, the ASU eliminates the requirement to disclose the method(s) and significant assumptions used to estimate the fair value that is required to be disclosed for financial instruments measured at amortized cost on the balance sheet. The ASU also clarifies that an entity should evaluate the need for a valuation allowance on a deferred tax asset related to available-for-sale securities in combination with the entity’s other deferred tax assets. The amendments in this update are effective for fiscal years beginning after December 15, 2017, including interim periods within those fiscal years. Early application is permitted for fiscal years or interim periods that have not yet been issued if adopted at the beginning of the fiscal year. The Company is reviewing our available-for-sale investment portfolio in accordance with the provision
90
FIRST FINANCIAL NORTHWEST, INC. AND SUBSIDIARIES
NOTES TO CONSOLIDATED FINANCIAL STATEMENTS
of this standard. The adoption of ASU 2016-01 is not expected to have a material impact on the Company’s consolidated financial statements.
In February 2016, FASB issued ASU No. 2016-02, Leases (Topic 842). ASU No. 2016-02 requires lessees to recognize on the balance sheet the assets and liabilities arising from operating leases. A lessee should recognize a liability to make lease payments and a right-of-use asset representing its right to use the underlying asset for the lease term. A lessee should include payments to be made in an optional period only if the lessee is reasonably certain to exercise an option to extend the lease or not to exercise an option to terminate the lease. For a finance lease, interest payments should be recognized separately from amortization of the right-of-use asset in the statement of comprehensive income. For operating leases, the lease cost should be allocated over the lease term on a generally straight-line basis. The amendments in ASU 2016-02 are effective for fiscal years beginning after December 15, 2018, including interim periods within those fiscal years. Early application of the amendments in the ASU is permitted. In accordance with this standard, the Company will be establishing a right-of-use asset and an offsetting lease liability. Once adopted, we expect to report higher assets and liabilities as a result of including additional lease information on the consolidated balance sheet. The adoption of ASU 2016-02 is not expected to have a material impact on the Company’s consolidated financial statements.
In March 2016, FASB issued ASU No. 2016-05, Effect of Derivative Contract Novations on Existing Hedge Accounting Relationships. The amendments in this ASU clarify that a change in the counterparty to a derivative instrument that has been designated as the hedging instrument under Topic 815 (Derivatives and Hedging) does not, in and of itself, require dedesignation of that hedging relationship provided that all other hedge accounting criteria continue to be met. The amendments in this ASU are effective for financial statements issued for fiscal years beginning after December 15, 2016, and interim periods within those fiscal years. An entity has an option to apply the amendments in this ASU on either a prospective basis or a modified retrospective basis. Early adoption is permitted, including adoption in an interim period. At December 31, 2016, the Company had one swap relationship using hedge accounting with a total market value of $1.3 million. This ASU became effective for the Company January 1, 2017 and is not expected to have a material impact on the Company’s consolidated financial statements.
In June 2016, FASB issued ASU No. 2016-13, Financial Instruments--Credit Losses (Topic 326). This ASU replaces the existing incurred loss impairment methodology that recognizes credit losses when a probable loss has been incurred with new methodology where loss estimates are based upon lifetime expected credit losses. The amendments in this ASU require a financial asset that is measured at amortized cost to be presented at the net amount expected to be collected. The income statement would then reflect the measurement of credit losses for newly recognized financial assets as well as changes to the expected credit losses that have taken place during the reporting period. The measurement of expected credit losses will be based on historical information, current conditions, and reasonable and supportable forecasts that impact the collectability of the reported amount. Available-for-sale securities will bifurcate the fair value mark and establish an allowance for credit losses through the income statement for the credit portion of that mark. The interest portion will continue to be recognized through accumulated other comprehensive income or loss. The change in allowance recognized as a result of adoption will occur through a cumulative-effect adjustment to retained earnings as of the beginning of the first reporting period in which the ASU is adopted. The amendments in this ASU are effective for fiscal years beginning after December 15, 2019, including interim periods within those fiscal years, with early adoption permitted for fiscal years beginning after December 15, 2018. The Company is evaluating our current expected loss methodology of our loan and investment portfolios to identify the necessary modifications in accordance with this standard. A valuation adjustment to our ALLL or investment portfolio that is identified in this process will be reflected in equity rather than earnings. We are evaluating the potential impact adoption of this standard will have on our consolidated financial statements. Once adopted, we expect our allowance for loan losses to increase, however, until our evaluation is complete the magnitude of the increase will be unknown.
In August 2016, FASB issued ASU No. 2016-15, Statement of Cash Flows (Topic 230): Classification of Certain Cash Receipts and Cash Payments. This ASU was to address the appropriate classification of eight specific cash flow issues on the cash flow statement. Debt prepayment costs should be classified as an outflow for financing activities. Settlement of zero-coupon debt instruments divides the interest portion as an outflow for operating activities and the principal portion as an outflow for financing activities. Contingent consideration payments made after a business combination should be classified as outflows for financing and operating activities. Proceeds from the settlement of bank-owned life insurance policies should be classified as inflows from investing activities. Other specific areas are identified in the ASU as to the appropriate classification of the cash inflows or outflows. The amendments in this ASU are effective for fiscal years beginning after December 15, 2017, including interim periods within those fiscal years. Early adoption is permitted and must be applied using a retrospective transition method to each period presented. The Company is evaluating our current cash flow statement classifications in accordance with the standard. Adoption of ASU 2016-15 is not expected to have a material impact on the Company’s consolidated financial statements.
In December 2016, FASB issued ASU No. 2016-19, “Technical Corrections and Improvements” and ASU 2016-20, “Technical Corrections and Improvements to Topic 606: Revenue from Contracts with Customers.” On November 10, 2010 FASB
91
FIRST FINANCIAL NORTHWEST, INC. AND SUBSIDIARIES
NOTES TO CONSOLIDATED FINANCIAL STATEMENTS
added a standing project that will facilitate the FASB Accounting Standards Codification (“Codification”) updates for technical corrections, clarifications, and improvements. These amendments are referred to as Technical Corrections and Improvements. Maintenance updates include non-substantive corrections to the Codification, such as editorial corrections, various link-related changes, and changes to source fragment information. These updates contain amendments that will affect a wide variety of Topics in the Codification. The amendments in these ASUs will apply to all reporting entities within the scope of the affected accounting guidance and generally fall into one of four categories: amendments related to differences between original guidance and the Codification, guidance clarification and reference corrections, simplification, and minor improvements. In summary, the amendments represent changes to clarify the Codification, correct unintended application of guidance, or make minor improvements to the Codification that are not expected to have a significant effect on current accounting practice. Transition guidance varies based on the amendments in the ASUs. The amendments that require transition guidance are effective for fiscal years and interim reporting periods after December 15, 2016. Early adoption is permitted including adoption in an interim period. All other amendments are effective upon the issuance of these ASUs. Neither ASU 2016-19 nor ASU 2016-20 had a material impact on the Company's consolidated financial statements.
In January 2017, FASB issued ASU 2017-03, "Accounting Changes and Error Corrections (Topic 250) and Investments-Equity Method and Joint Ventures (Topic 323)." The ASU amends the Codification for SEC staff announcements made at recent Emerging Issues Task Force (EITF) meetings. The SEC guidance that specifically relates to our Consolidated Financial Statement was from the September 2016 meeting, where the SEC staff expressed their expectations about the extent of disclosures registrants should make about the effects of the new FASB guidance as well as any amendments issued prior to adoption, on revenue (ASU 2014-09), leases (ASU 2016-02) and credit losses on financial instruments (ASU 2016-13) in accordance with SAB Topic 11.M. Registrants are required to disclose the effect that recently issued accounting standards will have on their financial statements when adopted in a future period. In cases where a registrant cannot reasonably estimate the impact of the adoption, then additional qualitative disclosures should be considered. The ASU incorporates these SEC staff views into ASC 250 and adds references to that guidance in the transition paragraphs of each of the three new standards. The adoption of this ASU did not have a material effect on the Company's consolidated financial statements.
Note 2 - Investments
The following tables summarize the amortized cost and fair value of investments available-for-sale at December 31, 2016, and 2015, and the corresponding amounts of gross unrealized gains and losses.
December 31, 2016 | |||||||||||||||
Amortized Cost | Gross Unrealized Gains | Gross Unrealized Losses | Fair Value | ||||||||||||
(In thousands) | |||||||||||||||
Mortgage-backed investments: | |||||||||||||||
Fannie Mae | $ | 42,060 | $ | 126 | $ | (854 | ) | $ | 41,332 | ||||||
Freddie Mac | 18,013 | 95 | (99 | ) | 18,009 | ||||||||||
Ginnie Mae | 19,133 | 41 | (540 | ) | 18,634 | ||||||||||
Municipal bonds | 13,203 | 11 | (107 | ) | 13,107 | ||||||||||
U.S. Government agencies | 15,937 | 75 | (155 | ) | 15,857 | ||||||||||
Corporate bonds | 22,506 | 241 | (426 | ) | 22,321 | ||||||||||
$ | 130,852 | $ | 589 | $ | (2,181 | ) | $ | 129,260 | |||||||
92
FIRST FINANCIAL NORTHWEST, INC. AND SUBSIDIARIES
NOTES TO CONSOLIDATED FINANCIAL STATEMENTS
December 31, 2015 | |||||||||||||||
Amortized Cost | Gross Unrealized Gains | Gross Unrealized Losses | Fair Value | ||||||||||||
(In thousands) | |||||||||||||||
Mortgage-backed investments: | |||||||||||||||
Fannie Mae | $ | 50,288 | $ | 260 | $ | (227 | ) | $ | 50,321 | ||||||
Freddie Mac | 26,011 | 243 | (117 | ) | 26,137 | ||||||||||
Ginnie Mae | 13,802 | 44 | (114 | ) | 13,732 | ||||||||||
Municipal bonds | 11,787 | 277 | — | 12,064 | |||||||||||
U.S. Government agencies | 13,541 | 89 | (88 | ) | 13,542 | ||||||||||
Corporate bonds | 14,010 | 4 | (245 | ) | 13,769 | ||||||||||
$ | 129,439 | $ | 917 | $ | (791 | ) | $ | 129,565 | |||||||
There were no investments classified as held-to-maturity at December 31, 2016, or 2015.
The amortized cost and estimated fair value of investments available-for-sale at December 31, 2016, by expected maturity, are shown below. Expected maturities will differ from contractual maturities because borrowers may have the right to call or prepay obligations with or without call or prepayment penalties. Investments not due at a single maturity date, primarily mortgage‑backed investments are shown separately.
December 31, 2016 | |||||||
Amortized Cost | Fair Value | ||||||
(In thousands) | |||||||
Due within one year | $ | 510 | $ | 510 | |||
Due after one year through five years | 8,852 | 8,855 | |||||
Due after five years through ten years | 23,740 | 23,605 | |||||
Due after ten years | 18,543 | 18,315 | |||||
51,645 | 51,285 | ||||||
Mortgage-backed investments | 79,207 | 77,975 | |||||
$ | 130,852 | $ | 129,260 | ||||
Under Washington State law, in order to participate in the public funds program the Company is required to pledge eligible securities as collateral in an amount equal to 50% of the public deposits held. Investments with a carrying value of $22.6 million and $17.4 million were pledged as collateral for public deposits at December 31, 2016, and 2015, respectively, both of which exceeded the minimum collateral requirements established by the Washington Public Deposit Protection Commission. At December 31, 2016, and 2015, there were no investments pledged as collateral for FHLB advances.
Sales and other redemptions of available-for-sale investments were as follows:
Year Ended December 31, | |||||||||||
2016 | 2015 | 2014 | |||||||||
(In thousands) | |||||||||||
Proceeds | $ | 26,437 | $ | 27,327 | $ | 4,980 | |||||
Gross gains | 245 | 449 | — | ||||||||
Gross losses | (195 | ) | (357 | ) | (20 | ) | |||||
The following tables summarize the aggregate fair value and gross unrealized loss by length of time those investments have been continuously in an unrealized loss position at December 31, 2016 and 2015.
93
FIRST FINANCIAL NORTHWEST, INC. AND SUBSIDIARIES
NOTES TO CONSOLIDATED FINANCIAL STATEMENTS
December 31, 2016 | |||||||||||||||||||||||
Less Than 12 Months | 12 Months or Longer | Total | |||||||||||||||||||||
Fair Value | Unrealized Loss | Fair Value | Unrealized Loss | Fair Value | Unrealized Loss | ||||||||||||||||||
(In thousands) | |||||||||||||||||||||||
Mortgage-backed investments: | |||||||||||||||||||||||
Fannie Mae | $ | 34,763 | $ | (854 | ) | $ | — | $ | — | $ | 34,763 | $ | (854 | ) | |||||||||
Freddie Mac | 8,343 | (99 | ) | — | — | 8,343 | (99 | ) | |||||||||||||||
Ginnie Mae | 16,734 | (540 | ) | — | — | 16,734 | (540 | ) | |||||||||||||||
Municipal bonds | 8,815 | (107 | ) | — | — | 8,815 | (107 | ) | |||||||||||||||
U.S. Government agencies | 9,000 | (153 | ) | 1,426 | (2 | ) | 10,426 | (155 | ) | ||||||||||||||
Corporate bonds | 3,880 | (119 | ) | 4,693 | (307 | ) | 8,573 | (426 | ) | ||||||||||||||
$ | 81,535 | $ | (1,872 | ) | $ | 6,119 | $ | (309 | ) | $ | 87,654 | $ | (2,181 | ) | |||||||||
December 31, 2015 | |||||||||||||||||||||||
Less Than 12 Months | 12 Months or Longer | Total | |||||||||||||||||||||
Fair Value | Unrealized Loss | Fair Value | Unrealized Loss | Fair Value | Unrealized Loss | ||||||||||||||||||
(In thousands) | |||||||||||||||||||||||
Mortgage-backed investments: | |||||||||||||||||||||||
Fannie Mae | $ | 37,593 | $ | (227 | ) | $ | — | $ | — | $ | 37,593 | $ | (227 | ) | |||||||||
Freddie Mac | 12,115 | (117 | ) | — | — | 12,115 | (117 | ) | |||||||||||||||
Ginnie Mae | 5,508 | (29 | ) | 3,233 | (85 | ) | 8,741 | (114 | ) | ||||||||||||||
Municipal bonds | — | — | — | — | — | — | |||||||||||||||||
U.S. Government agencies | 9,605 | (88 | ) | — | — | 9,605 | (88 | ) | |||||||||||||||
Corporate bonds | 10,263 | (245 | ) | — | — | 10,263 | (245 | ) | |||||||||||||||
$ | 75,084 | $ | (706 | ) | $ | 3,233 | $ | (85 | ) | $ | 78,317 | $ | (791 | ) | |||||||||
At December 31, 2016, and 2015, the Company had 53 and 43 securities, respectively, with a gross unrealized loss position. Management reviewed the financial condition of the entities underlying the securities at both December 31, 2016, and December 31, 2015, and determined that no OTTI was required. Management believes that, while actual fluctuation in unrealized losses will occur over the life of an investment security, the temporary impairment on the investment securities that were in an unrealized loss position at December 31, 2016 and 2015, will be incrementally relieved as the individual investment securities approach their respective contractual maturity dates. The unrealized losses relate principally to the general change in interest rate and illiquidity, and not credit quality. As management does not intend to sell the security, and it is likely that it will not be required to sell the security before its anticipated recovery, no declines are deemed to be other-than-temporary.
94
FIRST FINANCIAL NORTHWEST, INC. AND SUBSIDIARIES
NOTES TO CONSOLIDATED FINANCIAL STATEMENTS
Note 3 - Loans Receivable
Loans receivable at December 31, 2016, and 2015 are summarized as follows:
December 31, | |||||||
2016 | 2015 | ||||||
(In thousands) | |||||||
One-to-four family residential: | |||||||
Permanent owner occupied | $ | 137,834 | $ | 147,229 | |||
Permanent non-owner occupied | 111,601 | 106,543 | |||||
249,435 | 253,772 | ||||||
Multifamily: | |||||||
Permanent | 123,250 | 122,747 | |||||
123,250 | 122,747 | ||||||
Commercial real estate: | |||||||
Permanent | 303,694 | 244,211 | |||||
303,694 | 244,211 | ||||||
Construction/land: (1) | |||||||
One-to-four family residential | 67,842 | 52,233 | |||||
Multifamily | 111,051 | 46,666 | |||||
Land | 30,055 | 17,058 | |||||
208,948 | 115,957 | ||||||
Business | 7,938 | 7,604 | |||||
Consumer | 6,922 | 6,979 | |||||
Total loans | 900,187 | 751,270 | |||||
Less: | |||||||
Loans in process (“LIP”) | 72,026 | 53,854 | |||||
Deferred loan fees, net | 2,167 | 2,881 | |||||
ALLL | 10,951 | 9,463 | |||||
Loans receivable, net | $ | 815,043 | $ | 685,072 | |||
___________
(1) | We previously excluded from the construction/land category “rollover” loans, which are loans that will convert upon completion of the construction period to permanent loans. These loans were classified according to the underlying collateral categories instead of being included in the construction/land category. In addition, we previously classified raw land or buildable lots, where the Company does not intend to finance the construction, as commercial real estate land loans and have now included these loans in the construction/land category. At December 31, 2016, we reclassified $62.9 million of multifamily loans, $26.9 million of commercial land loans and $2.6 million of one-to-four family residential as construction/land loans to facilitate the review of the composition of our loan portfolio. At December 31, 2015, $21.1 million of multifamily loans, $8.3 million of commercial land loans and no one-to-four family residential loans were reclassified to the construction/land category. |
At December 31, 2016, and 2015 there were no loans classified as held for sale.
Concentrations of credit. Most of the Bank’s lending activity occurs within the state of Washington. The primary market areas include King and to a lesser extent Pierce, Snohomish and Kitsap counties. At December 31, 2016, the Company’s loan portfolio consists of one-to-four family residential loans which comprised 27.7%, commercial real estate and multifamily loans were 33.7% and 13.7%, respectively, and construction/land loans were 23.2% of the total loan portfolio. Consumer, and business loans accounted for the remaining 1.7% of the loan portfolio. Included in the one-to-four family residential, multifamily, commercial real estate and construction/land loan portfolios at December 31, 2016, were $949,000, $26.3 million, $39.5 million, and $12.7 million, respectively, to the Company’s five largest borrowing relationships.
95
FIRST FINANCIAL NORTHWEST, INC. AND SUBSIDIARIES
NOTES TO CONSOLIDATED FINANCIAL STATEMENTS
The Company originates both adjustable and fixed interest rate loans. The composition of loans receivable at December 31, 2016, and 2015, was as follows:
December 31, 2016 | ||||||||||
Fixed Rate | Adjustable Rate | |||||||||
Term to Maturity | Principal Balance | Term to Rate Adjustment | Principal Balance | |||||||
(In thousands) | ||||||||||
Due within one year | $ | 23,513 | Due within one year | $ | 214,794 | |||||
After one year through three years | 106,138 | After one year through three years | 32,448 | |||||||
After three years through five years | 71,251 | After three years through five years | 118,350 | |||||||
After five years through ten years | 145,063 | After five years through ten years | 29,922 | |||||||
Thereafter | 158,708 | Thereafter | — | |||||||
$ | 504,673 | $ | 395,514 | |||||||
December 31, 2015 | ||||||||||
Fixed Rate | Adjustable Rate | |||||||||
Term to Maturity | Principal Balance | Term to Rate Adjustment | Principal Balance | |||||||
(In thousands) | ||||||||||
Due within one year | $ | 17,476 | Due within one year | $ | 122,992 | |||||
After one year through three years | 107,792 | After one year through three years | 28,316 | |||||||
After three years through five years | 91,283 | After three years through five years | 90,779 | |||||||
After five years through ten years | 99,348 | After five years through ten years | 41,239 | |||||||
Thereafter | 151,879 | Thereafter | 166 | |||||||
$ | 467,778 | $ | 283,492 | |||||||
The majority of the adjustable-rate loans are tied to the prime rate as published in The Wall Street Journal. The remaining adjustable-rate loans have interest rate adjustment limitations and are generally indexed to the FHLB Long-Term Bullet advance rates published by the FHLB. Future market factors may affect the correlation of the interest rate adjustment with the rates paid on short‑term deposits that have been primarily utilized to fund these loans.
ALLL. When the Company classifies problem assets as either substandard or doubtful, pursuant to Federal regulations, it may establish a specific reserve in an amount deemed prudent to address the risk specifically or may allow the loss to be addressed in the general allowance. General allowances represent loss allowances which have been established to recognize the inherent risk associated with lending activities, but which, unlike specific allowances, have not been specifically allocated to the particular problem assets. When an insured institution classifies problem assets as a loss, pursuant to Federal regulations, it is required to charge-off such assets in the period in which they are deemed uncollectible. The determination as to the classification of the Company’s assets and the amount of valuation allowances is subject to review by bank regulators, who can require the establishment of additional loss allowances.
Loan grades are used by the Company to identify and track potential problem loans which do not rise to the levels described for substandard, doubtful, or loss. The grades for watch and special mention are assigned to loans which have been criticized based upon known characteristics such as periodic payment delinquency or stale financial information from the borrower and/or guarantors. Loans identified as criticized (watch and special mention) or classified (substandard, doubtful or loss) are subject to problem loan reporting every three months.
The following tables summarize changes in the ALLL and loan portfolio by type of loan and reserve method for the periods indicated.
96
FIRST FINANCIAL NORTHWEST, INC. AND SUBSIDIARIES
NOTES TO CONSOLIDATED FINANCIAL STATEMENTS
At or For the Year Ended December 31, 2016 | |||||||||||||||||||||||||||
One-to-Four Family Residential | Multifamily | Commercial Real Estate | Construction/ Land | Business | Consumer | Total | |||||||||||||||||||||
ALLL: | (In thousands) | ||||||||||||||||||||||||||
Beginning balance | $ | 3,028 | $ | 1,193 | $ | 3,395 | $ | 1,193 | $ | 229 | $ | 425 | $ | 9,463 | |||||||||||||
Charge-offs | — | — | — | — | — | (83 | ) | (83 | ) | ||||||||||||||||||
Recoveries | 165 | 1 | 104 | — | — | 1 | 271 | ||||||||||||||||||||
(Recapture) provision | (642 | ) | 5 | 394 | 1,599 | 8 | (64 | ) | 1,300 | ||||||||||||||||||
Ending balance | $ | 2,551 | $ | 1,199 | $ | 3,893 | $ | 2,792 | $ | 237 | $ | 279 | $ | 10,951 | |||||||||||||
General reserve | $ | 2,349 | $ | 1,199 | $ | 3,867 | $ | 2,711 | $ | 237 | $ | 279 | $ | 10,642 | |||||||||||||
Specific reserve | 202 | — | 26 | 81 | — | — | 309 | ||||||||||||||||||||
Loans: (1) | |||||||||||||||||||||||||||
Total Loans | $ | 249,435 | $ | 123,250 | $ | 303,694 | $ | 136,922 | $ | 7,938 | $ | 6,922 | $ | 828,161 | |||||||||||||
General reserve (2) | 224,363 | 121,686 | 299,987 | 136,427 | 7,938 | 6,819 | 797,220 | ||||||||||||||||||||
Specific reserve (3) | 25,072 | 1,564 | 3,707 | 495 | — | 103 | 30,941 | ||||||||||||||||||||
____________
(1) Net of LIP.
(2) Loans collectively evaluated for impairment.
(3) Loans individually evaluated for impairment.
At or For the Year Ended December 31, 2015 | |||||||||||||||||||||||||||
One-to-Four Family Residential | Multifamily | Commercial Real Estate | Construction/ Land | Business | Consumer | Total | |||||||||||||||||||||
ALLL: | (In thousands) | ||||||||||||||||||||||||||
Beginning balance | $ | 3,691 | $ | 1,606 | $ | 4,476 | $ | 519 | $ | 47 | $ | 152 | $ | 10,491 | |||||||||||||
Charge-offs | (27 | ) | (281 | ) | — | — | — | (54 | ) | (362 | ) | ||||||||||||||||
Recoveries | 936 | 78 | 181 | — | 3 | 336 | 1,534 | ||||||||||||||||||||
(Recapture) provision | (1,572 | ) | (210 | ) | (1,262 | ) | 674 | 179 | (9 | ) | (2,200 | ) | |||||||||||||||
Ending balance | $ | 3,028 | $ | 1,193 | $ | 3,395 | $ | 1,193 | $ | 229 | $ | 425 | $ | 9,463 | |||||||||||||
General reserve | $ | 2,516 | $ | 1,190 | $ | 3,270 | $ | 1,140 | $ | 229 | $ | 386 | $ | 8,731 | |||||||||||||
Specific reserve | 512 | 3 | 125 | 53 | — | 39 | 732 | ||||||||||||||||||||
Loans: (1) | |||||||||||||||||||||||||||
Total Loans | $ | 253,772 | $ | 122,747 | $ | 244,211 | $ | 62,103 | $ | 7,604 | $ | 6,979 | $ | 697,416 | |||||||||||||
General reserve (2) | 217,677 | 121,152 | 239,765 | 61,158 | 7,604 | 6,771 | 654,127 | ||||||||||||||||||||
Specific reserve (3) | 36,095 | 1,595 | 4,896 | 495 | — | 208 | 43,289 | ||||||||||||||||||||
_____________
(1) Net of LIP.
(2) Loans collectively evaluated for impairment.
(3) Loans individually evaluated for impairment.
97
FIRST FINANCIAL NORTHWEST, INC. AND SUBSIDIARIES
NOTES TO CONSOLIDATED FINANCIAL STATEMENTS
At or For the Year Ended December 31, 2014 | |||||||||||||||||||||||||||
One-to-Four Family Residential | Multifamily | Commercial Real Estate | Construction/ Land | Business | Consumer | Total | |||||||||||||||||||||
ALLL: | (In thousands) | ||||||||||||||||||||||||||
Beginning balance | $ | 5,141 | $ | 1,269 | $ | 5,101 | $ | 1,287 | $ | 14 | $ | 182 | $ | 12,994 | |||||||||||||
Charge-offs | (78 | ) | — | (311 | ) | (223 | ) | — | (30 | ) | (642 | ) | |||||||||||||||
Recoveries | 50 | — | 174 | — | 10 | 5 | 239 | ||||||||||||||||||||
(Recapture) provision | (1,422 | ) | 337 | (488 | ) | (545 | ) | 23 | (5 | ) | (2,100 | ) | |||||||||||||||
Ending balance | $ | 3,691 | $ | 1,606 | $ | 4,476 | $ | 519 | $ | 47 | $ | 152 | $ | 10,491 | |||||||||||||
General reserve | $ | 2,891 | $ | 1,579 | $ | 4,172 | $ | 494 | $ | 47 | $ | 93 | $ | 9,276 | |||||||||||||
Specific reserve | 800 | 27 | 304 | 25 | — | 59 | 1,215 | ||||||||||||||||||||
Loans: (1) | |||||||||||||||||||||||||||
Total Loans | $ | 273,193 | $ | 116,014 | $ | 239,211 | $ | 37,702 | $ | 3,783 | $ | 7,130 | $ | 677,033 | |||||||||||||
General reserve (2) | 229,455 | 113,842 | 230,155 | 37,206 | 3,783 | 6,933 | 621,374 | ||||||||||||||||||||
Specific reserve (3) | 43,738 | 2,172 | 9,056 | 496 | — | 197 | 55,659 | ||||||||||||||||||||
______________
(1) Net of LIP.
(2) Loans collectively evaluated for impairment.
(3) Loans individually evaluated for impairment.
Past Due Loans. Loans are considered past due if the required principal and interest payments have not been received as of the date such payments were due. At December 31, 2016, total past due loans comprised 0.06% of total loans, net of LIP, as compared to 0.18% at December 31, 2015.
The following tables represent a summary at December 31, 2016, and 2015, of the aging of loans by type:
Loans Past Due as of December 31, 2016 | |||||||||||||||||||||||
30-59 Days | 60-89 Days | 90 Days and Greater | Total | Current | Total Loans (1) (2) | ||||||||||||||||||
(In thousands) | |||||||||||||||||||||||
Real estate: | |||||||||||||||||||||||
One-to-four family residential: | |||||||||||||||||||||||
Owner occupied | $ | 304 | $ | — | $ | 169 | $ | 473 | $ | 137,361 | $ | 137,834 | |||||||||||
Non-owner occupied | — | — | — | — | 111,601 | 111,601 | |||||||||||||||||
Multifamily | — | — | — | — | 123,250 | 123,250 | |||||||||||||||||
Commercial real estate | — | — | — | — | 303,694 | 303,694 | |||||||||||||||||
Construction/land | — | — | — | — | 136,922 | 136,922 | |||||||||||||||||
Total real estate | 304 | — | 169 | 473 | 812,828 | 813,301 | |||||||||||||||||
Business | — | — | — | — | 7,938 | 7,938 | |||||||||||||||||
Consumer | — | — | — | — | 6,922 | 6,922 | |||||||||||||||||
Total | $ | 304 | $ | — | $ | 169 | $ | 473 | $ | 827,688 | $ | 828,161 | |||||||||||
_________________________
(1) There were no loans 90 days past due and still accruing interest at December 31, 2016.
(2) Net of LIP.
98
FIRST FINANCIAL NORTHWEST, INC. AND SUBSIDIARIES
NOTES TO CONSOLIDATED FINANCIAL STATEMENTS
Loans Past Due as of December 31, 2015 | |||||||||||||||||||||||
30-59 Days | 60-89 Days | 90 Days and Greater | Total | Current | Total Loans (1) (2) | ||||||||||||||||||
(In thousands) | |||||||||||||||||||||||
Real estate: | |||||||||||||||||||||||
One-to-four family residential: | |||||||||||||||||||||||
Owner occupied | $ | 678 | $ | 483 | $ | — | $ | 1,161 | $ | 146,068 | $ | 147,229 | |||||||||||
Non-owner occupied | — | — | — | — | 106,543 | 106,543 | |||||||||||||||||
Multifamily | — | — | — | — | 122,747 | 122,747 | |||||||||||||||||
Commercial real estate | — | — | — | — | 244,211 | 244,211 | |||||||||||||||||
Construction/land | — | — | — | — | 62,103 | 62,103 | |||||||||||||||||
Total real estate | 678 | 483 | — | 1,161 | 681,672 | 682,833 | |||||||||||||||||
Business | — | — | — | — | 7,604 | 7,604 | |||||||||||||||||
Consumer | — | 78 | 19 | 97 | 6,882 | 6,979 | |||||||||||||||||
Total | $ | 678 | $ | 561 | $ | 19 | $ | 1,258 | $ | 696,158 | $ | 697,416 | |||||||||||
________________________
(1) There were no loans 90 days past due and still accruing interest at December 31, 2015.
(2) Net of LIP.
Nonaccrual Loans. Loans are considered past due if the required principal and interest payments have not been received as of the date such payments were due. Loans are placed on nonaccrual when they are 90 days delinquent or when, in management’s opinion, the borrower is unable to meet scheduled payment obligations.
In order to return a nonaccrual loan to accrual status, each loan is evaluated on a case-by-case basis. The Company evaluates the borrower’s financial condition to ensure that future loan payments are reasonably assured. The Company also takes into consideration the borrower’s willingness and ability to make the loan payments and historical repayment performance. The Company requires the borrower to make loan payments consistently for a period of at least six months as agreed to under the terms of the loan agreement before the Company will consider reclassifying the loan to accrual status.
The following table is a summary of nonaccrual loans at December 31, 2016, and 2015 by type of loan
December 31, | |||||||
2016 | 2015 | ||||||
(In thousands) | |||||||
One-to-four family residential | $ | 798 | $ | 996 | |||
Consumer | 60 | 89 | |||||
Total nonaccrual loans | $ | 858 | $ | 1,085 | |||
Nonperforming loans, net of LIP, were $858,000 and $1.1 million at December 31, 2016, and 2015, respectively. Foregone interest on nonaccrual loans for the years ended December 31, 2016, 2015, and 2014 were $51,000, $103,000 and $126,000, respectively.
99
FIRST FINANCIAL NORTHWEST, INC. AND SUBSIDIARIES
NOTES TO CONSOLIDATED FINANCIAL STATEMENTS
The following tables summarize the loan portfolio at December 31, 2016, and 2015, by type and payment activity:
December 31, 2016 | |||||||||||||||||||||||||||
One-to-Four Family Residential | Multifamily | Commercial Real Estate | Construction / Land | Business | Consumer | Total (3) | |||||||||||||||||||||
(In thousands) | |||||||||||||||||||||||||||
Performing (1) | $ | 248,637 | $ | 123,250 | $ | 303,694 | $ | 136,922 | $ | 7,938 | $ | 6,862 | $ | 827,303 | |||||||||||||
Nonperforming (2) | 798 | — | — | — | — | 60 | 858 | ||||||||||||||||||||
Total | $ | 249,435 | $ | 123,250 | $ | 303,694 | $ | 136,922 | $ | 7,938 | $ | 6,922 | $ | 828,161 | |||||||||||||
____________
(1) There were $137.0 million of owner-occupied one-to-four family residential loans and $111.6 million of non-owner occupied one-to-four family residential loans classified as performing.
(2) There were $798,000 of owner-occupied one-to-four family residential loans and no non-owner occupied one-to-four family residential loans classified as nonperforming.
(3) Net of LIP.
December 31, 2015 | |||||||||||||||||||||||||||
One-to-Four Family Residential | Multifamily | Commercial Real Estate | Construction/ Land | Business | Consumer | Total (3) | |||||||||||||||||||||
(In thousands) | |||||||||||||||||||||||||||
Performing (1) | $ | 252,776 | $ | 122,747 | $ | 244,211 | $ | 62,103 | $ | 7,604 | $ | 6,890 | $ | 696,331 | |||||||||||||
Nonperforming (2) | 996 | — | — | — | — | 89 | 1,085 | ||||||||||||||||||||
Total | $ | 253,772 | $ | 122,747 | $ | 244,211 | $ | 62,103 | $ | 7,604 | $ | 6,979 | $ | 697,416 | |||||||||||||
_____________
(1) There were $146.2 million of owner-occupied one-to-four family residential loans and $106.5 million of non-owner occupied one-to-four family residential loans classified as performing.
(2) There were $996,000 of owner-occupied one-to-four family residential loans and no non-owner occupied one-to-four family residential loans classified as nonperforming.
(3) Net of LIP.
Impaired loans. The loan portfolio is constantly being monitored by management for delinquent loans and changes in the financial condition of each borrower. When an issue is identified with a borrower and it is determined that the loan needs to be classified as nonperforming and/or impaired, an evaluation of the collateral is performed prior to the end of the financial reporting period and, if necessary, an appraisal is ordered in accordance with the Company’s appraisal policy guidelines. Based on this evaluation, any additional provision for loan loss or charge-offs that may be needed is recorded prior to the end of the financial reporting period.
There were no commitments to advance funds related to impaired loans at December 31, 2016, and 2015.
100
FIRST FINANCIAL NORTHWEST, INC. AND SUBSIDIARIES
NOTES TO CONSOLIDATED FINANCIAL STATEMENTS
The following tables present a summary of loans individually evaluated for impairment at December 31, 2016, and 2015, by the type of loan:
At December 31, 2016 | |||||||||||
Recorded Investment (1) | Unpaid Principal Balance (2) | Related Allowance | |||||||||
(In thousands) | |||||||||||
Loans with no related allowance: | |||||||||||
One-to-four family residential: | |||||||||||
Owner occupied | $ | 2,216 | $ | 2,475 | $ | — | |||||
Non-owner occupied | 16,634 | 16,652 | — | ||||||||
Multifamily | 1,564 | 1,564 | — | ||||||||
Commercial real estate | 2,952 | 3,029 | — | ||||||||
Construction/land | — | — | — | ||||||||
Consumer | 103 | 223 | — | ||||||||
Total | 23,469 | 23,943 | — | ||||||||
Loans with an allowance: | |||||||||||
One-to-four family residential: | |||||||||||
Owner occupied | 1,896 | 1,965 | 51 | ||||||||
Non-owner occupied | 4,326 | 4,347 | 151 | ||||||||
Multifamily | — | — | — | ||||||||
Commercial real estate | 755 | 755 | 26 | ||||||||
Construction/land | 495 | 495 | 81 | ||||||||
Consumer | — | — | — | ||||||||
Total | 7,472 | 7,562 | 309 | ||||||||
Total impaired loans: | |||||||||||
One-to-four family residential: | |||||||||||
Owner occupied | 4,112 | 4,440 | 51 | ||||||||
Non-owner occupied | 20,960 | 20,999 | 151 | ||||||||
Multifamily | 1,564 | 1,564 | — | ||||||||
Commercial real estate | 3,707 | 3,784 | 26 | ||||||||
Construction/land | 495 | 495 | 81 | ||||||||
Consumer | 103 | 223 | — | ||||||||
Total | $ | 30,941 | $ | 31,505 | $ | 309 | |||||
_________________
(1) Represents the loan balance less charge-offs.
(2) Contractual loan principal balance.
101
FIRST FINANCIAL NORTHWEST, INC. AND SUBSIDIARIES
NOTES TO CONSOLIDATED FINANCIAL STATEMENTS
At December 31, 2015 | |||||||||||
Recorded Investment (1) | Unpaid Principal Balance (2) | Related Allowance | |||||||||
(In thousands) | |||||||||||
Loans with no related allowance: | |||||||||||
One-to-four family residential: | |||||||||||
Owner occupied | $ | 3,169 | $ | 3,441 | $ | — | |||||
Non-owner occupied | 23,285 | 23,310 | — | ||||||||
Multifamily | 415 | 414 | — | ||||||||
Commercial real estate | 2,675 | 2,857 | — | ||||||||
Construction/land | — | — | — | ||||||||
Consumer | 132 | 183 | — | ||||||||
Total | 29,676 | 30,205 | — | ||||||||
Loans with an allowance: | |||||||||||
One-to-four family residential: | |||||||||||
Owner occupied | 2,120 | 2,189 | 85 | ||||||||
Non-owner occupied | 7,521 | 7,573 | 427 | ||||||||
Multifamily | 1,180 | 1,180 | 3 | ||||||||
Commercial real estate | 2,221 | 2,222 | 125 | ||||||||
Construction/land | 495 | 495 | 53 | ||||||||
Consumer | 76 | 76 | 39 | ||||||||
Total | 13,613 | 13,735 | 732 | ||||||||
Total impaired loans: | |||||||||||
One-to-four family residential: | |||||||||||
Owner occupied | 5,289 | 5,630 | 85 | ||||||||
Non-owner occupied | 30,806 | 30,883 | 427 | ||||||||
Multifamily | 1,595 | 1,594 | 3 | ||||||||
Commercial real estate | 4,896 | 5,079 | 125 | ||||||||
Construction/land | 495 | 495 | 53 | ||||||||
Consumer | 208 | 259 | 39 | ||||||||
Total | $ | 43,289 | $ | 43,940 | $ | 732 | |||||
_____________
(1) Represents the loan balance less charge-offs.
(2) Contractual loan principal balance.
102
FIRST FINANCIAL NORTHWEST, INC. AND SUBSIDIARIES
NOTES TO CONSOLIDATED FINANCIAL STATEMENTS
The following table presents a summary of recorded investment in impaired loans, and interest income recognized on impaired loans for the years ended December 31, 2016, 2015 and 2014 by the type of loan:
Year Ended December 31, | |||||||||||||||||||||||
2016 | 2015 | 2014 | |||||||||||||||||||||
Average Recorded Investment | Interest Income Recognized | Average Recorded Investment | Interest Income Recognized | Average Recorded Investment | Interest Income Recognized | ||||||||||||||||||
(In thousands) | |||||||||||||||||||||||
Loans with no related allowance: | |||||||||||||||||||||||
One-to-four family residential: | |||||||||||||||||||||||
Owner occupied | $ | 2,566 | $ | 156 | $ | 3,180 | $ | 110 | $ | 3,302 | $ | 158 | |||||||||||
Non-owner occupied | 20,653 | 1,061 | 25,350 | 1,409 | 29,105 | 1,762 | |||||||||||||||||
Multifamily | 1,344 | 106 | 1,575 | 30 | 113 | — | |||||||||||||||||
Commercial real estate | 2,295 | 253 | 4,180 | 187 | 3,971 | 291 | |||||||||||||||||
Construction/land | — | — | — | — | — | — | |||||||||||||||||
Consumer | 117 | 12 | 125 | 2 | 81 | 4 | |||||||||||||||||
Total | 26,975 | 1,588 | 34,410 | 1,738 | 36,572 | 2,215 | |||||||||||||||||
Loans with an allowance: | |||||||||||||||||||||||
One-to-four family residential: | |||||||||||||||||||||||
Owner occupied | 2,026 | 104 | 2,131 | 89 | 2,975 | 124 | |||||||||||||||||
Non-owner occupied | 5,520 | 236 | 7,801 | 415 | 10,395 | 500 | |||||||||||||||||
Multifamily | 236 | — | 1,430 | 77 | 2,187 | 147 | |||||||||||||||||
Commercial real estate | 2,192 | 42 | 2,817 | 129 | 6,036 | 250 | |||||||||||||||||
Construction/land | 396 | 17 | 495 | 18 | 496 | 17 | |||||||||||||||||
Consumer | 30 | — | 77 | 3 | 20 | 3 | |||||||||||||||||
Total | 10,400 | 399 | 14,751 | 731 | 22,109 | 1,041 | |||||||||||||||||
Total impaired loans: | |||||||||||||||||||||||
One-to-four family residential: | |||||||||||||||||||||||
Owner occupied | 4,592 | 260 | 5,311 | 199 | 6,277 | 282 | |||||||||||||||||
Non-owner occupied | 26,173 | 1,297 | 33,151 | 1,824 | 39,500 | 2,262 | |||||||||||||||||
Multifamily | 1,580 | 106 | 3,005 | 107 | 2,300 | 147 | |||||||||||||||||
Commercial real estate | 4,487 | 295 | 6,997 | 316 | 10,007 | 541 | |||||||||||||||||
Construction/land | 396 | 17 | 495 | 18 | 496 | 17 | |||||||||||||||||
Consumer | 147 | 12 | 202 | 5 | 101 | 7 | |||||||||||||||||
Total | $ | 37,375 | $ | 1,987 | $ | 49,161 | $ | 2,469 | $ | 58,681 | $ | 3,256 | |||||||||||
103
FIRST FINANCIAL NORTHWEST, INC. AND SUBSIDIARIES
NOTES TO CONSOLIDATED FINANCIAL STATEMENTS
Troubled Debt Restructurings. The following is a summary of information pertaining to TDRs:
December 31, | |||||||
2016 | 2015 | ||||||
(In thousands) | |||||||
Performing TDRs | $ | 30,083 | $ | 42,128 | |||
Nonaccrual TDRs | 174 | 131 | |||||
Total TDRs | $ | 30,257 | $ | 42,259 | |||
The accrual status of a loan may change after it has been classified as a TDR. Management considers the following in determining the accrual status of restructured loans: (1) if the loan was on accrual status prior to the restructuring, the borrower has demonstrated performance under the previous terms, and a credit evaluation shows the borrower’s capacity to continue to perform under the restructured terms (both principal and interest payments), the loan will remain on accrual at the time of the restructuring; (2) if the loan was on nonaccrual status before the restructuring, and the Company’s credit evaluation shows the borrower’s capacity to meet the restructured terms, the loan would remain as nonaccrual for a minimum of six months until the borrower has demonstrated a reasonable period of sustained repayment performance (thereby providing reasonable assurance as to the ultimate collection of principal and interest in full under the modified terms).
The following table presents for the periods indicated TDRs and their recorded investment prior to the modification and after the modification:
Year Ended December 31, | |||||||||||||||||||||
2016 | 2015 | ||||||||||||||||||||
Number of Loans | Pre-Modification Outstanding Recorded Investment | Post-Modification Outstanding Recorded Investment | Number of Loans | Pre-Modification Outstanding Recorded Investment | Post-Modification Outstanding Recorded Investment | ||||||||||||||||
(Dollars in thousands) | |||||||||||||||||||||
TDRs that occurred during the period: | |||||||||||||||||||||
One-to-four family residential: | |||||||||||||||||||||
Interest only payments with interest rate concession | — | $ | — | $ | — | 6 | $ | 1,439 | $ | 1,439 | |||||||||||
Principal and interest with interest rate concession | 19 | 4,265 | 4,265 | 2 | 426 | 426 | |||||||||||||||
Advancement of maturity date | 5 | 1,121 | 1,121 | 2 | 248 | 248 | |||||||||||||||
Commercial real estate: | |||||||||||||||||||||
Principal and interest with interest rate concession | — | — | — | 1 | 775 | 775 | |||||||||||||||
Advancement of maturity date | 1 | 511 | 511 | 2 | 866 | 866 | |||||||||||||||
Interest-only payments with interest rate concession | 1 | 495 | 495 | 1 | 496 | 496 | |||||||||||||||
Interest-only payments with advancement of maturity date | — | — | — | 1 | 2,004 | 2,004 | |||||||||||||||
Total | 26 | $ | 6,392 | $ | 6,392 | 15 | $ | 6,254 | $ | 6,254 | |||||||||||
At December 31, 2016 and 2015, the Company had no commitments to extend additional credit to borrowers whose loan terms have been modified in a TDR. All TDRs are also classified as impaired loans and are included in the loans individually evaluated for impairment in the calculation of the ALLL.
TDRs resulted in no charge-offs to the ALLL for the years ended December 31, 2016 and 2015. For the years ended December 31, 2016 and 2015, there were no payment defaults on loans modified as TDRs within the previous 12 months.
104
FIRST FINANCIAL NORTHWEST, INC. AND SUBSIDIARIES
NOTES TO CONSOLIDATED FINANCIAL STATEMENTS
Credit Quality Indicators. The Company utilizes a nine-point risk rating system and assigns a risk rating for all credit exposures. The risk rating system is designed to define the basic characteristics and identify risk elements of each credit extension. Credits risk rated 1 through 5 are considered to be “pass” credits. Pass credits can be assets where there is virtually no credit risk, such as cash secured loans with funds on deposit with the Bank. Pass credits also include credits that are on the Company’s watch list, where the borrower exhibits potential weaknesses, which may, if not checked or corrected, negatively affect the borrower’s financial capacity and threaten their ability to fulfill debt obligations in the future. Credits classified as special mention are risk rated 6 and possess weaknesses that deserve management’s close attention. Special mention assets do not expose the Company to sufficient risk to warrant adverse classification in the substandard, doubtful or loss categories. Substandard credits are risk rated 7. An asset is considered substandard if it is inadequately protected by the current net worth and payment capacity of the borrower or of any collateral pledged. Substandard assets include those characterized by the distinct possibility that the Company will sustain some loss if the deficiencies are not corrected. Assets classified as doubtful are risk rated 8 and have all the weaknesses inherent in those credits classified as substandard with the added characteristic that the weaknesses present make collection or liquidation in full highly questionable and improbable, on the basis of currently existing facts, conditions and values. Assets classified as loss are risk rated 9 and are considered uncollectible and cannot be justified as a viable asset for the Company. As of December 31, 2016, and 2015, the Company had no loans rated as doubtful or loss.
The following tables represent a summary of loans at December 31, 2016, and 2015 by type and risk category:
December 31, 2016 | |||||||||||||||||||||||||||
One-to-Four Family Residential | Multifamily | Commercial Real Estate | Construction/ Land | Business | Consumer | Total (1) | |||||||||||||||||||||
(In thousands) | |||||||||||||||||||||||||||
Risk Rating: | |||||||||||||||||||||||||||
Pass | $ | 245,237 | $ | 123,250 | $ | 300,655 | $ | 136,427 | $ | 7,938 | $ | 6,674 | $ | 820,181 | |||||||||||||
Special mention | 2,847 | — | 3,039 | — | — | 188 | 6,074 | ||||||||||||||||||||
Substandard | 1,351 | — | — | 495 | — | 60 | 1,906 | ||||||||||||||||||||
Total | $ | 249,435 | $ | 123,250 | $ | 303,694 | $ | 136,922 | $ | 7,938 | $ | 6,922 | $ | 828,161 | |||||||||||||
_____________
(1) Net of LIP.
December 31, 2015 | |||||||||||||||||||||||||||
One-to-Four Family Residential | Multifamily | Commercial Real Estate | Construction / Land | Business | Consumer | Total (1) | |||||||||||||||||||||
(In thousands) | |||||||||||||||||||||||||||
Risk Rating: | |||||||||||||||||||||||||||
Pass | $ | 247,239 | $ | 122,747 | $ | 240,402 | $ | 61,607 | $ | 7,604 | $ | 6,702 | $ | 686,301 | |||||||||||||
Special mention | 3,840 | — | 3,809 | — | — | 188 | 7,837 | ||||||||||||||||||||
Substandard | 2,693 | — | — | 496 | — | 89 | 3,278 | ||||||||||||||||||||
Total | $ | 253,772 | $ | 122,747 | $ | 244,211 | $ | 62,103 | $ | 7,604 | $ | 6,979 | $ | 697,416 | |||||||||||||
______________
(1) Net of LIP.
Certain executive officers and directors have loans with the Bank. The aggregate dollar amount of these loans outstanding to related parties is summarized as follows:
105
FIRST FINANCIAL NORTHWEST, INC. AND SUBSIDIARIES
NOTES TO CONSOLIDATED FINANCIAL STATEMENTS
Year Ended December 31, | ||||||||||
2016 | 2015 | 2014 | ||||||||
(In thousands) | ||||||||||
Balance at beginning of year | $ | 118 | $ | 138 | $ | 548 | ||||
Additions | — | — | — | |||||||
Change in director or executive status during year | (40 | ) | ||||||||
Repayments | (18 | ) | (20 | ) | (410 | ) | ||||
Balance at end of year | $ | 60 | $ | 118 | $ | 138 | ||||
Note 4 - Other Real Estate Owned
The following table is a summary of OREO activity for the periods indicated:
Year Ended December 31, | |||||||||||
2016 | 2015 | 2014 | |||||||||
(In thousands) | |||||||||||
Balance at beginning of year | $ | 3,663 | $ | 9,283 | $ | 11,465 | |||||
Loans transferred to OREO | — | 141 | 1,823 | ||||||||
Capitalized improvements | — | — | 120 | ||||||||
Gross proceeds from sale of OREO | (988 | ) | (6,246 | ) | (3,646 | ) | |||||
(Loss) gain on sale of OREO | (87 | ) | 526 | (86 | ) | ||||||
Market value adjustments | (257 | ) | (41 | ) | (393 | ) | |||||
Balance at end of year | $ | 2,331 | $ | 3,663 | $ | 9,283 | |||||
OREO includes properties acquired by the Company through foreclosure and deed in lieu of foreclosure. OREO at December 31, 2016 consisted of $2.3 million in commercial real estate properties and no construction/land properties.
Note 5 - Premises and Equipment
Premises and equipment consisted of the following at December 31, 2016, and 2015:
December 31, | |||||||
2016 | 2015 | ||||||
(In thousands) | |||||||
Land | $ | 1,914 | $ | 1,914 | |||
Buildings and improvements | 17,820 | 17,820 | |||||
Leasehold improvements | 1,352 | 391 | |||||
Furniture, fixtures and equipment | 3,832 | 3,638 | |||||
Computer hardware and software | 1,924 | 1,883 | |||||
Construction in process | 704 | 235 | |||||
27,546 | 25,881 | ||||||
Less accumulated depreciation and amortization | (9,085 | ) | (8,174 | ) | |||
Total premises and equipment, net | $ | 18,461 | $ | 17,707 | |||
Depreciation and amortization expense was $1.1 million for the year ended December 31, 2016 and $809,000 and $755,000 for the years ended December 31, 2015 and 2014, respectively.
106
FIRST FINANCIAL NORTHWEST, INC. AND SUBSIDIARIES
NOTES TO CONSOLIDATED FINANCIAL STATEMENTS
Note 6 - Fair Value of Financial Instruments
Fair value is defined as the price that would be received to sell an asset or paid to transfer a liability in an orderly transaction between market participants at the measurement date.
The Company determines the fair values of its financial instruments based on the fair value hierarchy which requires an entity to maximize the use of observable inputs and minimize the use of unobservable inputs when measuring fair values. Observable inputs reflect market data obtained from independent sources, while unobservable inputs reflect its estimate for market assumptions.
Valuation inputs refer to the assumptions market participants would use in pricing a given asset or liability using one of the three valuation techniques. Inputs can be observable or unobservable. Observable inputs are those assumptions that market participants would use in pricing the particular asset or liability. These inputs are based on market data and are obtained from an independent source. Unobservable inputs are assumptions based on the Company’s own information or estimate of assumptions used by market participants in pricing the asset or liability. Unobservable inputs are based on the best and most current information available on the measurement date.
All inputs, whether observable or unobservable, are ranked in accordance with a prescribed fair value hierarchy:
• | Level 1 - Quoted prices for identical instruments in active markets. |
• | Level 2 - Quoted prices for similar instruments in active markets; quoted prices for identical or similar instruments in markets that are not active; and model-derived valuations whose inputs are observable. |
• | Level 3 - Instruments whose significant value drivers are unobservable. |
The tables below present the balances of assets and liabilities measured at fair value on a recurring basis (there were no transfers between Level 1, Level 2 and Level 3 recurring measurements during the periods presented):
December 31, 2016 | |||||||||||||||
Fair Value Measurements | Quoted Prices in Active Markets for Identical Assets (Level 1) | Significant Other Observable Inputs (Level 2) | Significant Unobservable Inputs (Level 3) | ||||||||||||
(In thousands) | |||||||||||||||
Available-for-sale investments: | |||||||||||||||
Mortgage-backed investments: | |||||||||||||||
Fannie Mae | $ | 41,332 | $ | — | $ | 41,332 | $ | — | |||||||
Freddie Mac | 18,009 | — | 18,009 | — | |||||||||||
Ginnie Mae | 18,634 | — | 18,634 | — | |||||||||||
Municipal bonds | 13,107 | — | 13,107 | — | |||||||||||
U.S. Government agencies | 15,857 | — | 15,857 | — | |||||||||||
Corporate bonds | 22,321 | — | 22,321 | — | |||||||||||
Total available-for-sale investments | 129,260 | — | 129,260 | — | |||||||||||
Derivative fair value asset | 1,333 | — | 1,333 | — | |||||||||||
$ | 130,593 | $ | — | $ | 130,593 | $ | — | ||||||||
107
FIRST FINANCIAL NORTHWEST, INC. AND SUBSIDIARIES
NOTES TO CONSOLIDATED FINANCIAL STATEMENTS
December 31, 2015 | |||||||||||||||
Fair Value Measurements | Quoted Prices in Active Markets for Identical Assets (Level 1) | Significant Other Observable Inputs (Level 2) | Significant Unobservable Inputs (Level 3) | ||||||||||||
(In thousands) | |||||||||||||||
Available-for-sale investments: | |||||||||||||||
Mortgage-backed investments: | |||||||||||||||
Fannie Mae | $ | 50,321 | $ | — | $ | 50,321 | $ | — | |||||||
Freddie Mac | 26,137 | — | 26,137 | — | |||||||||||
Ginnie Mae | 13,732 | — | 13,732 | — | |||||||||||
Municipal bonds | 12,064 | — | 12,064 | — | |||||||||||
U.S. Government agencies | 13,542 | — | 13,542 | — | |||||||||||
Corporate bonds | 13,769 | — | 13,769 | — | |||||||||||
$ | 129,565 | $ | — | $ | 129,565 | $ | — | ||||||||
The estimated fair value of Level 2 investments is based on quoted prices for similar investments in active markets, identical or similar investments in markets that are not active, and model-derived valuations whose inputs are observable.
The tables below present the balances of assets and liabilities measured at fair value on a nonrecurring basis at December 31, 2016, and 2015.
December 31, 2016 | |||||||||||||||
Fair Value Measurements | Quoted Prices in Active Markets for Identical Assets (Level 1) | Significant Other Observable Inputs (Level 2) | Significant Unobservable Inputs (Level 3) | ||||||||||||
(In thousands) | |||||||||||||||
Impaired loans (included in loans receivable, net)(1) | $ | 30,632 | $ | — | $ | — | $ | 30,632 | |||||||
OREO | 2,331 | — | — | 2,331 | |||||||||||
Total | $ | 32,963 | $ | — | $ | — | $ | 32,963 | |||||||
_______________
(1) Total value of impaired loans is net of $309,000 of specific reserves on performing TDRs.
December 31, 2015 | |||||||||||||||
Fair Value Measurements | Quoted Prices in Active Markets for Identical Assets (Level 1) | Significant Other Observable Inputs (Level 2) | Significant Unobservable Inputs (Level 3) | ||||||||||||
(In thousands) | |||||||||||||||
Impaired loans (included in loans receivable, net)(1) | $ | 42,557 | $ | — | $ | — | $ | 42,557 | |||||||
OREO (2) | 3,663 | — | — | 3,663 | |||||||||||
Total | $ | 46,220 | $ | — | $ | — | $ | 46,220 | |||||||
________________
(1) Total value of impaired loans is net of $732,000 of specific reserves on performing TDRs.
OREO properties are measured at the lower of their carrying amount or fair value, less costs to sell. Fair values are generally based on third party appraisals of the property, resulting in a Level 3 classification. In cases where the carrying amount exceeds the fair value, less costs to sell, an impairment loss is recognized.
108
FIRST FINANCIAL NORTHWEST, INC. AND SUBSIDIARIES
NOTES TO CONSOLIDATED FINANCIAL STATEMENTS
The following table presents quantitative information about Level 3 fair value measurements for financial instruments measured at fair value on a nonrecurring basis.
December 31, 2016 | |||||||||
Fair Value | Valuation Technique(s) | Unobservable Input(s) | Range (Weighted Average Change in Fair Value) | ||||||
(Dollars in thousands) | |||||||||
Impaired Loans | $ | 30,632 | Market approach | Appraised value discounted by market or borrower conditions | 0.0% (0.00%) | ||||
OREO | $ | 2,331 | Market approach | Appraised value less selling costs | 0.0% (0.00%) | ||||
December 31, 2015 | |||||||||
Fair Value | Valuation Technique(s) | Unobservable Input(s) | Range (Weighted Average Change in Fair Value) | ||||||
(Dollars in thousands) | |||||||||
Impaired Loans | $ | 42,557 | Market approach | Appraised value discounted by market or borrower conditions | 0.0% - 2.1% (0.3%) | ||||
OREO | $ | 3,663 | Market approach | Appraised value less selling costs | 0.0% -13.6% (1.0%) | ||||
109
FIRST FINANCIAL NORTHWEST, INC. AND SUBSIDIARIES
NOTES TO CONSOLIDATED FINANCIAL STATEMENTS
The carrying amounts and estimated fair values of financial instruments at December 31, 2016, and 2015, were as follows:
December 31, 2016 | Fair Value Measurements Using: | ||||||||||||||||||
Carrying Value | Estimated Fair Value | Level 1 | Level 2 | Level 3 | |||||||||||||||
(In thousands) | |||||||||||||||||||
Financial Assets: | |||||||||||||||||||
Cash on hand and in banks | $ | 5,779 | $ | 5,779 | $ | 5,779 | $ | — | $ | — | |||||||||
Interest-earning deposits | 25,573 | 25,573 | 25,573 | — | — | ||||||||||||||
Investments available-for-sale | 129,260 | 129,260 | — | 129,260 | — | ||||||||||||||
Loans receivable, net | 815,043 | 818,054 | — | — | 818,054 | ||||||||||||||
FHLB stock | 8,031 | 8,031 | — | 8,031 | — | ||||||||||||||
Accrued interest receivable | 3,147 | 3,147 | — | 3,147 | — | ||||||||||||||
Derivative fair value asset | 1,333 | 1,333 | — | 1,333 | — | ||||||||||||||
Financial Liabilities: | |||||||||||||||||||
Deposits | 285,335 | 285,335 | 285,335 | — | — | ||||||||||||||
Certificates of deposit, retail | 356,653 | 356,723 | — | 356,723 | — | ||||||||||||||
Certificates of deposit, brokered | 75,488 | 75,431 | — | 75,431 | — | ||||||||||||||
Advances from the FHLB | 171,500 | 170,221 | — | 170,221 | — | ||||||||||||||
Accrued interest payable | 231 | 231 | — | 231 | — | ||||||||||||||
December 31, 2015 | Fair Value Measurements Using: | ||||||||||||||||||
Carrying Value | Estimated Fair Value | Level 1 | Level 2 | Level 3 | |||||||||||||||
(In thousands) | |||||||||||||||||||
Financial Assets: | |||||||||||||||||||
Cash on hand and in banks | $ | 5,713 | $ | 5,713 | $ | 5,713 | $ | — | $ | — | |||||||||
Interest-earning deposits | 99,998 | 99,998 | 99,998 | — | — | ||||||||||||||
Investments available-for-sale | 129,565 | 129,565 | — | 129,565 | — | ||||||||||||||
Loans receivable, net | 685,072 | 693,480 | — | — | 693,480 | ||||||||||||||
FHLB stock | 6,137 | 6,137 | — | 6,137 | — | ||||||||||||||
Accrued interest receivable | 2,968 | 2,968 | — | 2,968 | — | ||||||||||||||
Financial Liabilities: | |||||||||||||||||||
Deposits | 285,416 | 285,416 | 285,416 | — | — | ||||||||||||||
Certificates of deposit, retail | 323,840 | 324,135 | — | 324,135 | — | ||||||||||||||
Certificates of deposit, brokered | 66,151 | 66,947 | — | 66,947 | — | ||||||||||||||
Advances from the FHLB | 125,500 | 125,466 | — | 125,466 | — | ||||||||||||||
Accrued interest payable | 135 | 135 | — | 135 | — | ||||||||||||||
Fair value estimates, methods, and assumptions are set forth below for the Company’s financial instruments:
• | Financial instruments with book value equal to fair value: The fair value of financial instruments that are short-term or reprice frequently and that have little or no risk are considered to have a fair value equal to book value. These instruments include cash on hand and in banks, interest-bearing deposits, accrued interest receivable, and accrued interest payable. |
110
FIRST FINANCIAL NORTHWEST, INC. AND SUBSIDIARIES
NOTES TO CONSOLIDATED FINANCIAL STATEMENTS
• | FHLB stock: FHLB stock is not publicly-traded, however, it may be redeemed on a dollar-for-dollar basis, for any amount the Bank is not required to hold, subject to the FHLB’s discretion. The fair value is therefore equal to the book value. |
• | Investments available-for-sale: The fair value of all investments excluding FHLB stock was based upon quoted market prices for similar investments in active markets, identical or similar investments in markets that are not active, and model-derived valuations whose inputs are observable. |
• | Loans receivable: For variable rate loans that reprice frequently and with no significant change in credit risk, fair values are based on carrying values. The fair value of fixed-rate loans is estimated using discounted cash flow analysis, utilizing interest rates that would be offered for loans with similar terms to borrowers of similar credit quality. As a result of current market conditions, cash flow estimates have been further discounted to include a credit factor. The fair value of nonperforming loans is estimated using the fair value of the underlying collateral. |
• | Derivatives: The fair value of derivatives is based on dealer quotes, pricing models, discounted cash flow methodologies or similar techniques for which the determination of fair value may require significant management judgment or estimation. |
• | Liabilities: The fair value of deposits with no stated maturity, such as statement savings, interest bearing deposits, and money market accounts, is equal to the amount payable on demand. The fair value of certificates of deposit is based on the discounted value of contractual cash flows using current interest rates for certificates of deposit with similar remaining maturities. The fair value of FHLB advances is estimated based on discounting the future cash flows using current interest rates for debt with similar remaining maturities. |
• | Off balance sheet commitments: No fair value adjustment is necessary for commitments made to extend credit, which represents commitments for loan originations or for outstanding commitments to purchase loans. These commitments are at variable rates, are for loans with terms of less than one year and have interest rates which approximate prevailing market rates, or are set at the time of loan closing. |
Fair value estimates are based on existing balance sheet financial instruments without attempting to estimate the value of anticipated future business. The fair value has not been estimated for assets and liabilities that are not considered financial instruments.
Note 7 - Accrued Interest Receivable
Accrued interest receivable consisted of the following at December 31, 2016 and 2015:
December 31, | |||||||
2016 | 2015 | ||||||
(In thousands) | |||||||
Loans receivable | $ | 2,665 | $ | 2,467 | |||
Investments | 478 | 493 | |||||
Interest-earning deposits | 4 | 8 | |||||
$ | 3,147 | $ | 2,968 | ||||
Note 8 - Deposits
Deposit accounts consisted of the following at December 31, 2016 and 2015:
111
FIRST FINANCIAL NORTHWEST, INC. AND SUBSIDIARIES
NOTES TO CONSOLIDATED FINANCIAL STATEMENTS
December 31, | |||||||
2016 | 2015 | ||||||
(In thousands) | |||||||
Noninterest-bearing | $ | 33,422 | $ | 29,392 | |||
Interest-bearing demand | 18,532 | 16,261 | |||||
Statement savings | 28,383 | 28,327 | |||||
Money market | 204,998 | 211,436 | |||||
Certificates of deposit, retail | 356,653 | 323,840 | |||||
Certificates of deposit, brokered | 75,488 | 66,151 | |||||
$ | 717,476 | $ | 675,407 | ||||
At December 31, 2016, scheduled maturities of certificates of deposit were as follows:
December 31, | Amount | |||
(In thousands) | ||||
2017 | $ | 166,014 | ||
2018 | 105,248 | |||
2019 | 107,982 | |||
2020 | 29,000 | |||
2021 | 23,897 | |||
thereafter | — | |||
$ | 432,141 | |||
Deposits included public funds of $23.7 million and $16.0 million at December 31, 2016 and 2015, respectively.
Certificates of deposit equal to or exceeding the FDIC insured amount of $250,000 included in deposits at December 31, 2016 and 2015, were $91.2 million and $72.5 million, respectively. Interest expense on these certificates totaled $975,000, $769,000, and $821,000 for the years ended December 31, 2016, 2015, and 2014, respectively.
Included in deposits are accounts of $9.4 million and $2.1 million at December 31, 2016, and 2015, respectively which are controlled by management, members of the Board of Directors, and related entities.
Interest expense on deposits for the periods indicated was as follows:
Year Ended December 31, | |||||||||||
2016 | 2015 | 2014 | |||||||||
(In thousands) | |||||||||||
Interest-bearing demand | $ | 30 | $ | 18 | $ | 23 | |||||
Statement savings | 47 | 40 | 30 | ||||||||
Money market | 870 | 603 | 311 | ||||||||
Certificates of deposit, retail | 3,934 | 3,574 | 4,388 | ||||||||
Certificates of deposit, brokered | 1,220 | 1,243 | 311 | ||||||||
$ | 6,101 | $ | 5,478 | $ | 5,063 | ||||||
Note 9 - Other Borrowings
At December 31, 2016, and 2015, the Bank maintained credit facilities with the FHLB totaling $375.1 million and $342.5 million, respectively. Outstanding advances totaled $171.5 million at December 31, 2016 and carried a weighted-average interest rate of 0.87%. At December 31, 2015, outstanding advances totaled $125.5 million with a weighted-average interest rate of 0.97%. The credit facility was collateralized by an advance equivalent of $188.8 million of single-family residential mortgages, $200.9 million of commercial real estate loans and $82.4 million of multifamily loans under a blanket lien arrangement at December 31, 2016. At December 31, 2015, the credit facility was collateralized by an advance equivalent of $162.8 million of single-family residential mortgages, $134.1 million of commercial real estate loans, and $68.2 million of multifamily loans under a blanket lien
112
FIRST FINANCIAL NORTHWEST, INC. AND SUBSIDIARIES
NOTES TO CONSOLIDATED FINANCIAL STATEMENTS
arrangement. The Bank also had $35.0 million unused line-of-credit facilities with other financial institutions at December 31, 2016, with interest payable at the then stated rate.
The maximum amount outstanding from the FHLB at a month end was $251.5 million during 2016 and $135.5 million during 2015. The average balance of outstanding FHLB advances was $163.9 million for the year ended December 31, 2016 and $133.5 million for the year ended December 31, 2015.
Outstanding advances consisted of the following at December 31, 2016, and 2015:
December 31, 2016 | |||||||
Maturity Date | Principal Balance | Fixed Interest Rate | |||||
(Dollars in thousands) | |||||||
01/2017 | $ | 50,000 | 0.61 | % | |||
04/2017 | 20,000 | 0.87 | |||||
06/2018 | 6,500 | 1.52 | |||||
11/2018 | 5,000 | 1.76 | |||||
05/2019 | 10,000 | 1.70 | |||||
10/2023 | 60,000 | 0.81 | |||||
12/2023 | 20,000 | 0.85 | |||||
$ | 171,500 | ||||||
December 31, 2015 | |||||||
Maturity Date | Principal Balance | Fixed Interest Rate | |||||
(Dollars in thousands) | |||||||
03/2016 | $ | 34,000 | 0.81 | % | |||
05/2016 | 20,000 | 0.70 | |||||
10/2016 | 10,000 | 1.02 | |||||
11/2016 | 20,000 | 0.84 | |||||
04/2017 | 20,000 | 0.87 | |||||
06/2018 | 6,500 | 1.52 | |||||
11/2018 | 5,000 | 1.76 | |||||
05/2019 | 10,000 | 1.70 | |||||
$ | 125,500 | ||||||
Note 10 - Derivatives
The Company uses a derivative financial instrument, which qualifies as a cash flow hedge, to manage the risk of changes in future cash flows due to interest rate fluctuations. The hedge instrument is a $50.0 million three-month FHLB advance that will be renewed every three months at the fixed interest rate at that time. The agreement has a five year term and stipulates that the counterparty will pay the Company interest at three-month LIBOR and the Company will pay fixed interest of 1.34% on the $50.0 million notional amount. The Company pays or receives the net interest amount quarterly and includes this amount as part of interest expense on the Consolidated Income Statement.
Quarterly, the effectiveness is evaluated of the fluctuation of the interest the Company pays to the FHLB for the hedge instrument as compared to the three-month LIBOR interest received from the counterparty. At December 31, 2016, the fair value of the cash flow hedge of $1.3 million was reported with other assets. The tax effected amount of $866,000 was included in Other Comprehensive Income. There were no amounts recorded in the Consolidated Income Statement for the year ended December 31, 2016 related to ineffectiveness.
Fair values for these derivative instruments, which generally change as a result of changes in the level of market interest rates, are estimated based on dealer quotes and secondary market sources.
113
FIRST FINANCIAL NORTHWEST, INC. AND SUBSIDIARIES
NOTES TO CONSOLIDATED FINANCIAL STATEMENTS
The following table presents the fair value of derivative instruments as of December 31, 2016 and 2015:
Balance sheet location | 2016 Fair Value | 2015 Fair Value | ||||||
(In thousands) | ||||||||
Interest rate swaps on FHLB debt designated as cash flow hedge | Other assets | $ | 1,333 | — | ||||
Total derivatives | $ | 1,333 | — | |||||
The following table presents the effect of derivative instruments on the Consolidated Statement of Comprehensive Income for the years ended December 31, 2016 and 2015:
Balance Sheet Location | 2016 Amount of Gain Recognized In OCI | 2015 Amount of Gain Recognized In OCI | ||||||
(In thousands) | ||||||||
Interest rate swaps on FHLB debt designated as cash flow hedge | Other assets | $ | 866 | — | ||||
Note 11 - Benefit Plans
Multi-employer Pension Plans
The Company participates in the Pentegra Defined Benefit Plan for Financial Institutions (“The Pentegra DB Plan”), a tax-qualified defined-benefit pension plan that covers substantially all employees after one year of continuous employment. Pension benefits vest over a period of five years of credited service. The Pentegra DB Plan’s Employer Identification Number is 13-5645888 and the Plan Number is 333. The Pentegra DB Plan operates as a multi-employer plan for accounting purposes and as a multiple-employer plan under the Employee Retirement Income Security Act of 1974 and the Internal Revenue Code. There are no collective bargaining agreements in place that require contributions to the Pentegra DB Plan.
The Pentegra DB Plan is a single plan under Internal Revenue Code Section 413(c) and, as a result, all of the assets stand behind all of the liabilities. Accordingly, under the Pentegra DB Plan, contributions made by a participating employer may be used to provide benefits to participants of other participating employers.
As of March 31, 2013, the Pentegra DB Plan was frozen, eliminating all future benefit accruals for employees. Each employee’s accrued benefit was determined as of March 31, 2013.
The funding target is the present value of all benefits that have accrued as of the first day of the current plan year (July 1). Because interest rates used to calculate the present value of all benefits (6.09% for 2016 and 6.28% for 2015) is significantly higher than current market rates, the funding target does not represent the Company’s actual liability upon withdrawal from participation in the Pentegra DB Plan, which is significantly larger than the funding target. The table below presents the funded status (market value of plan assets divided by funding target) of the plan as of July1:
2016 | 2015 | ||||
Source | Valuation Report | Valuation Report | |||
First Financial Northwest’s Plan(1) | 103.7 | % | 102.8 | % | |
_________________
(1) Market value of plan assets reflects any contributions received through June 30, 2016, or 2015, respectively.
Total contributions made to the Pentegra DB Plan, as reported on Form 5500, equal $163.1 million and $190.8 million for the plan years ended June 30, 2015 and June 30, 2014 respectively. The Company’s contributions to the Pentegra DB Plan are not more than 5% of the total contributions to the Pentegra DB Plan. The Company’s policy is to fund pension costs as accrued.
Total contributions during the years ended December 31, 2016, 2015, and 2014 were:
114
FIRST FINANCIAL NORTHWEST, INC. AND SUBSIDIARIES
NOTES TO CONSOLIDATED FINANCIAL STATEMENTS
2016 | 2015 | 2014 | ||||||||||||||
Date Paid | Amount | Date Paid | Amount | Date Paid | Amount | |||||||||||
10/7/2016 | $ | 40,129 | 11/25/2015 | $ | 540,000 | 9/25/2014 | $ | 8,735 | ||||||||
11/23/2016 | 499,871 | 11/28/2014 | 539,932 | |||||||||||||
Total | $ | 540,000 | Total | $ | 540,000 | Total | $ | 548,667 | ||||||||
Supplemental Executive Retirement Plan
The Company has post-employment agreements with certain key officers to provide supplemental retirement benefits. The Company recorded $36,000, $101,000 and $170,000 of deferred compensation expense for the years ended December 31, 2016, 2015, and 2014, respectively.
401(k) Plan
The Company has a savings plan under Section 401(k) of the Internal Revenue Code, covering substantially all employees after 90 days of continuous employment. Under the plan, employee contributions up to 6% will be matched 50% by the Company. Such matching becomes vested over a period of five years of credited service. Employees may make investments in various stock, money market, or fixed income plans. The Company contributed $201,000, $192,000 and $161,000 to the plan for the years ended December 31, 2016, 2015, and 2014, respectively.
Employee Stock Ownership Plan
The Company provides an ESOP for the benefit of substantially all employees. The ESOP borrowed $16.9 million from First Financial Northwest and used those funds to acquire 1,692,800 shares of First Financial Northwest’s stock at the time of the initial public offering at a price of $10.00 per share. The loan matures on October 8, 2022 and has a fixed interest rate of 4.88%.
Shares purchased by the ESOP with the loan proceeds are held in a suspense account and are allocated to ESOP participants on a pro rata basis as principal and interest payments are made by the ESOP to First Financial Northwest. The loan is secured by shares purchased with the loan proceeds and will be repaid by the ESOP with funds from the Company’s discretionary contributions to the ESOP and earnings on the ESOP assets. Annual principal and interest payments of $1.6 million were made by the ESOP during 2016, 2015, and 2014.
As shares are committed to be released from collateral, the Company reports compensation expense equal to the daily average market prices of the shares and the shares become outstanding for EPS computations. The compensation expense is accrued throughout the year.
A summary of key transactions for the ESOP for the periods indicated follows:
Year Ended December 31, | |||||||||||
2016 | 2015 | 2014 | |||||||||
(In thousands) | |||||||||||
ESOP contribution expense | $ | 1,605 | $ | 1,400 | $ | 1,216 | |||||
Dividends on unallocated ESOP shares used to reduce ESOP contribution | 183 | 210 | 197 | ||||||||
Shares held by the ESOP at December 31, 2016 and 2015, are as follows:
December 31, | |||||||
2016 | 2015 | ||||||
(Dollars in thousands, except share data) | |||||||
Allocated shares | 1,043,893 | 931,040 | |||||
Unallocated shares | 648,907 | 761,760 | |||||
Total ESOP shares | 1,692,800 | 1,692,800 | |||||
Fair value of unallocated shares | $ | 12,809 | $ | 10,634 | |||
115
FIRST FINANCIAL NORTHWEST, INC. AND SUBSIDIARIES
NOTES TO CONSOLIDATED FINANCIAL STATEMENTS
Stock-Based Compensation
In June 2016, First Financial Northwest’s shareholders approved the First Financial Northwest, Inc. 2016 Equity Incentive Plan (“2016 Plan”). This plan provides for the granting of incentive stock options (“ISO”), non-qualified stock options (“NQSO”), restricted stock and restricted stock units until June 2026. The 2016 Plan established 1,400,000 shares available to grant with a maximum of 400,000 of these shares available to grant as restricted stock awards. Each share issued as a restricted stock award counts as two shares towards the total shares available to be awarded.
Under the 2016 Plan, the vesting date for each option award or restricted stock award is determined by an award committee and specified in the award agreement. In the case of restricted stock awards granted in lieu of cash payments of directors’ fees, the grant date is used as the vesting date.
As a result of the approval of the 2016 Plan, the First Financial Northwest, Inc. 2008 Equity Incentive Plan (“2008 Plan”) was frozen and no additional awards will be made. As of June 30, 2016, there were 611,756 available stock options and 74,478 available restricted stock awards that are no longer available to be awarded under the 2008 Plan. Restricted stock awards and stock options that were granted under the 2008 Plan will continue to vest and be available for exercise, subject to the 2008 Plan provisions. At December 31, 2016, there were 1,371,896 total shares available for grant under the 2016 Plan, including 385,948 shares available to be granted as restricted stock.
Total compensation expense for the both the 2008 Plan and 2016 Plan for the years ended December 31, 2016, 2015, and 2014 was $622,000, $440,000, and $384,000, respectively. The related income tax benefit was $218,000, $154,000 and $134,000 for the years ended December 31, 2016, 2015, and 2014, respectively.
Stock Options
Under the 2008 Plan, stock option awards were granted with an exercise price equal to the market price of First Financial Northwest's common stock at the grant date. These option awards have a vesting period of five years, with 20% vesting on the anniversary date of each grant date, and a contractual life of ten years. Any unexercised stock options will expire ten years after the grant date, or sooner in the event of the award recipient’s death, disability or termination of service with the Company.
Under the 2016 Plan, the exercise price and vesting period for stock options are determined by the award committee and specified in the award agreement, however, the exercise price shall not be less than the fair market value of a share as of the grant date. Any unexercised stock option will expire 10 years after the award date or sooner in the event of the award recipient’s death, disability, retirement, or termination of service.
A cashless exercise of vested stock options may occur by the option holder surrendering the number of options valued at the current stock price at the time of exercise to cover the total cost to exercise. The surrendered options are canceled and are unavailable for reissue.
The fair value of each option award is estimated on the grant date using a Black-Scholes model that uses the assumptions noted in the table below. The dividend yield is based on the current quarterly dividend in effect at the time of the grant. Historical employment data is used to estimate the forfeiture rate. The historical volatility of the Company’s stock price over a specified period of time is used for the expected volatility assumption. First Financial Northwest bases the risk-free interest rate on the U.S. Treasury Constant Maturity Indices in effect on the date of the grant. First Financial Northwest elected to use the “Share-Based Payments” method permitted by the U.S. Securities and Exchange Commission to calculate the expected term. This method uses the vesting term of an option along with the contractual term, setting the expected life at the midpoint.
The fair value of options granted was determined using the following weighted-average assumptions as of the grant date for the periods indicated. There were no stock options granted in 2016.
116
FIRST FINANCIAL NORTHWEST, INC. AND SUBSIDIARIES
NOTES TO CONSOLIDATED FINANCIAL STATEMENTS
Year Ended December 31, | |||||||||
2016 | 2015 | 2014 | |||||||
Annual dividend yield | N/A | 1.77 | % | 1.86 | % | ||||
Expected volatility | N/A | 35.30 | 37.27 | ||||||
Risk-free interest rate | N/A | 2.23 | 2.44 | ||||||
Expected term | N/A | 10.0 years | 10.0 years | ||||||
Weighted-average grant date fair value per option granted | N/A | $ | 4.74 | $ | 4.13 | ||||
A summary of the Company’s stock option plan awards activity for the year ended December 31, 2016 follows:
Shares | Weighted- Average Exercise Price | Weighted- Average Remaining Contractual Term in Years | Aggregate Intrinsic Value | |||||||||
Outstanding at December 31, 2015 | 884,260 | $ | 10.11 | |||||||||
Granted | — | — | ||||||||||
Exercised | (260,440 | ) | 9.78 | |||||||||
Forfeited or expired | (20,000 | ) | 12.05 | |||||||||
Outstanding at December 31, 2016 | 603,820 | 10.19 | 4.84 | $ | 5,766,947 | |||||||
Expected to vest assuming a 3% forfeiture rate over the vesting term | 598,750 | 10.18 | 4.82 | 5,723,540 | ||||||||
Exercisable at December 31, 2016 | 434,820 | 9.80 | 3.80 | 4,320,027 | ||||||||
As of December 31, 2016, there was $590,000 of total unrecognized compensation cost related to nonvested stock options granted under the 2008 Plan. The cost is expected to be recognized over the remaining weighted-average vesting period of 2.8 years. There were no stock options granted during the year ended December 31, 2016 under either the 2008 Plan or 2016 Plan.
Restricted Stock Awards
The 2008 Plan authorized the grant of restricted stock awards to directors, advisory directors, officers and employees. Compensation expense is recognized over the vesting period of the awards based on the fair value of the stock at the grant date. The restricted stock awards’ fair value is equal to the stock price on the grant date. Shares awarded as restricted stock vest ratably over a five-year period beginning at the grant date with 20% vesting on the anniversary date of each grant date.
The 2016 Plan authorizes the grant of restricted stock awards subject to vesting periods or terms as defined by the award committee and specified in the award agreement. Restricted stock awards granted in lieu of cash payments for directors’ fees are subject to immediate vesting on the grant date unless the award agreement provides otherwise.
A summary of changes in nonvested restricted stock awards for the year ended December 31, 2016, follows:
Nonvested Shares | Shares | Weighted-Average Grant Date Fair Value | |||||
Nonvested at December 31, 2015 | 47,800 | $ | 8.95 | ||||
Granted | 14,052 | 12.81 | |||||
Vested | (35,452 | ) | 10.34 | ||||
Nonvested at December 31, 2016 | 26,400 | 9.13 | |||||
Expected to vest assuming a 3% forfeiture rate over the vesting term | 25,608 | ||||||
As of December 31, 2016 there was $177,000 of total unrecognized compensation costs related to nonvested shares granted as restricted stock awards. The cost is expected to be recognized over the remaining weighted-average vesting period of
117
FIRST FINANCIAL NORTHWEST, INC. AND SUBSIDIARIES
NOTES TO CONSOLIDATED FINANCIAL STATEMENTS
1.1 years. The total fair value of shares vested during the years ended December 31, 2016, and 2015 were $367,000 and $212,000, respectively.
Note 12 - Federal Income Taxes
The components of income tax expense for the years indicated are as follows:
Year Ended December 31, | |||||||||||
2016 | 2015 | 2014 | |||||||||
(In thousands) | |||||||||||
Current | $ | 2,164 | $ | 717 | $ | 254 | |||||
Deferred | 1,548 | 4,170 | 5,602 | ||||||||
Total income tax expense | $ | 3,712 | $ | 4,887 | $ | 5,856 | |||||
A reconciliation of the tax provision based on the statutory corporate rate of 35% during the years ended December 31, 2016, 2015 and 2014 on pretax income is as follows:
Year Ended December 31, | |||||||||||
2016 | 2015 | 2014 | |||||||||
(In thousands) | |||||||||||
Income tax expense at statutory rate | $ | 4,412 | $ | 4,917 | $ | 5,790 | |||||
Income tax effect of: | |||||||||||
Tax exempt interest, net | (103 | ) | (38 | ) | (8 | ) | |||||
Change in valuation allowance | — | (112 | ) | 19 | |||||||
Benefit of lower federal tax bracket | — | (39 | ) | — | |||||||
Other, net | (597 | ) | 159 | 55 | |||||||
Total income tax expense | $ | 3,712 | $ | 4,887 | $ | 5,856 | |||||
118
FIRST FINANCIAL NORTHWEST, INC. AND SUBSIDIARIES
NOTES TO CONSOLIDATED FINANCIAL STATEMENTS
The net deferred tax asset, included in the accompanying consolidated balance sheets, consisted of the following at the dates indicated:
December 31, | |||||||||||
2016 | 2015 | 2014 | |||||||||
(In thousands) | |||||||||||
Deferred tax assets: | |||||||||||
Net operating loss carryforward | $ | — | $ | — | $ | 3,052 | |||||
Charitable contributions | — | 7 | 2 | ||||||||
ALLL | 3,803 | 3,257 | 3,599 | ||||||||
Reserve for unfunded commitments | 131 | 187 | 128 | ||||||||
Deferred compensation | 592 | 646 | 688 | ||||||||
Net unrealized loss on investments available-for-sale | 557 | — | — | ||||||||
Alternative minimum tax credit carryforward | 45 | 1,375 | 1,939 | ||||||||
Employee benefit plans | 951 | 1,051 | 1,535 | ||||||||
Net capital loss on investments | — | — | 450 | ||||||||
OREO market value adjustments | 231 | 213 | 414 | ||||||||
Accrued expenses | 453 | 510 | 165 | ||||||||
Deferred tax assets before valuation allowance | 6,763 | 7,246 | 11,972 | ||||||||
Valuation allowance | — | — | (450 | ) | |||||||
Total deferred tax assets | 6,763 | 7,246 | 11,522 | ||||||||
Deferred tax liabilities: | |||||||||||
FHLB stock dividends | $ | 552 | $ | 1,255 | $ | 1,337 | |||||
Loan origination fees and costs | 1,477 | 870 | 744 | ||||||||
Net unrealized gain on investments available for sale | — | 44 | 432 | ||||||||
Derivatives fair value gain | 467 | — | — | ||||||||
Fixed assets | 869 | 299 | 472 | ||||||||
Other, net | 256 | 222 | 199 | ||||||||
Total deferred tax liabilities | $ | 3,621 | $ | 2,690 | $ | 3,184 | |||||
Deferred tax assets, net | $ | 3,142 | $ | 4,556 | $ | 8,338 | |||||
Deferred tax assets and liabilities are recognized for the future tax consequences attributable to temporary differences between the financial statement carrying amounts of existing assets and liabilities and their respective tax basis. Deferred tax assets and liabilities are measured using enacted tax rates expected to apply to taxable income in the years in which those temporary differences are expected to be recovered or settled. The effect on deferred tax assets and liabilities of a change in tax rates is recognized in income in the period that includes the enactment date. These calculations are based on many complex factors including estimates of the timing of reversals of temporary differences, the interpretation of federal income tax laws, and a determination of the differences between the tax and the financial reporting basis of assets and liabilities. Actual results could differ significantly from the estimates and interpretations used in determining the current and deferred income tax assets and liabilities.
At December 31, 2016 and 2015, the Company had no net operating loss carryforward. At December 31, 2016, the Company had an alternative minimum tax credit carryforward totaling $45,000, with no expiration date.
As a result of the bad debt deductions taken in years prior to 1988, retained earnings includes accumulated earnings of approximately $4.5 million, on which federal income taxes have not been provided. If, in the future, this portion of retained earnings is used for any purpose other than to absorb losses on loans or on property acquired through foreclosure, federal income taxes may be imposed at the then-prevailing corporate tax rates. The Bank does not contemplate that such amounts will be used for any purpose that would create a federal income tax liability; therefore no provision has been made.
119
FIRST FINANCIAL NORTHWEST, INC. AND SUBSIDIARIES
NOTES TO CONSOLIDATED FINANCIAL STATEMENTS
Under GAAP, a valuation allowance is required to be recognized if it is “more likely than not” that a portion of the deferred tax asset will not be realized. In order to support a conclusion that a valuation allowance is not needed, management evaluates both positive and negative evidence under the “more likely than not” standard. The weight given to the potential effect of negative and positive evidence should be commensurate with the extent to which the strength of the evidence can be objectively verified. As of December 31, 2016, it was determined the full deferred tax asset would be realized in future periods and a valuation allowance would not be necessary.
Note 13 - Regulatory Capital Requirements
Under Federal regulations, pre-conversion retained earnings are restricted for the protection of pre-conversion depositors.
The Bank is subject to various regulatory capital requirements administered by the federal banking agencies. Failure to meet minimum capital requirements can initiate certain mandatory and, possibly, additional discretionary actions by regulators that, if undertaken, could have a direct material effect on the Bank’s financial statements. Under capital adequacy guidelines and the regulatory framework for prompt corrective action, the Bank must meet specific capital guidelines that involve quantitative measures of their assets, liabilities and certain off-balance sheet items as calculated under regulatory accounting practices.
The capital amounts and classifications are also subject to qualitative judgments by the regulators about components, risk weightings and other factors. Prompt corrective action provisions are not applicable to bank holding companies.
Quantitative measures established by regulation to ensure capital adequacy require the Bank to maintain minimum amounts and ratios (set forth in the table that follows) of total and Tier 1 capital to risk-weighted assets (as defined in the regulations) and of Tier 1 capital to average assets.
As of December 31, 2016, according to the most recent notification from the FDIC, the Bank was categorized as well‑capitalized under the regulatory framework for prompt corrective action. There are no conditions or events since the notification that management believes have changed the Bank’s category.
120
FIRST FINANCIAL NORTHWEST, INC. AND SUBSIDIARIES
NOTES TO CONSOLIDATED FINANCIAL STATEMENTS
The Bank’s actual capital amounts and ratios at December 31, 2016, and 2015, are presented in the following table.
To be Well Capitalized | |||||||||||||||||||||
For Capital Adequacy | Under Prompt Corrective | ||||||||||||||||||||
Actual | Purposes | Action Provisions | |||||||||||||||||||
Amount | Ratio | Amount | Ratio | Amount | Ratio | ||||||||||||||||
(Dollars in thousands) | |||||||||||||||||||||
December 31, 2016: | |||||||||||||||||||||
Total risk-based capital | |||||||||||||||||||||
Bank only | $ | 130,078 | 15.61 | % | $ | 66,662 | 8.00 | % | $ | 83,328 | 10.00 | % | |||||||||
Parent company | 149,890 | 17.93 | 66,874 | 8.00 | 83,592 | 10.00 | |||||||||||||||
Tier 1 risk-based capital | |||||||||||||||||||||
Bank only | 119,652 | 14.36 | 49,997 | 6.00 | 66,662 | 8.00 | |||||||||||||||
Parent company | 139,430 | 16.68 | 50,155 | 6.00 | 66,874 | 8.00 | |||||||||||||||
Common equity tier 1 capital (“CET1”) | |||||||||||||||||||||
Bank only | 119,652 | 14.36 | 37,498 | 4.50 | 54,163 | 6.50 | |||||||||||||||
Parent company | 139,430 | 16.68 | 37,616 | 4.50 | 54,335 | 6.50 | |||||||||||||||
Tier 1 leverage capital | |||||||||||||||||||||
Bank only | 119,652 | 11.17 | 42,846 | 4.00 | 53,558 | 5.00 | |||||||||||||||
Parent company | 139,430 | 13.02 | 42,837 | 4.00 | 53,546 | 5.00 | |||||||||||||||
December 31, 2015: | |||||||||||||||||||||
Total risk-based capital | |||||||||||||||||||||
Bank only | $ | 121,237 | 17.62 | % | $ | 55,058 | 8.00 | % | $ | 68,823 | 10.00 | % | |||||||||
Parent company | 179,551 | 25.94 | 55,369 | 8.00 | 69,211 | 10.00 | |||||||||||||||
Tier 1 risk-based capital | |||||||||||||||||||||
Bank only | 112,613 | 16.36 | 41,294 | 6.00 | 55,058 | 8.00 | |||||||||||||||
Parent company | 170,877 | 24.69 | 41,527 | 6.00 | 55,369 | 8.00 | |||||||||||||||
Common equity tier 1 capital | |||||||||||||||||||||
Bank only | 112,613 | 16.36 | 30,970 | 4.50 | 44,735 | 6.50 | |||||||||||||||
Parent company | 170,877 | 24.69 | 31,145 | 4.50 | 44,987 | 6.50 | |||||||||||||||
Tier 1 leverage capital | |||||||||||||||||||||
Bank only | 112,613 | 11.61 | 38,787 | 4.00 | 48,484 | 5.00 | |||||||||||||||
Parent company | 170,877 | 17.55 | 38,952 | 4.00 | 48,484 | 5.00 | |||||||||||||||
In addition to the minimum CET1, Tier 1, total capital and leverage ratios, the Bank now has to maintain a capital conservation buffer consisting of additional CET1 capital above the required minimum levels in order to avoid limitations on paying dividends, engaging in share repurchases, and paying discretionary bonuses based on percentages of eligible retained income that could be utilized for such actions. This new capital conservation buffer requirement began to be phased in starting in January 2016 at 0.625% of risk-weighted assets and will increase each year until fully implemented to an amount equal to 2.5% of risk-weighted assets in January 2019.
121
FIRST FINANCIAL NORTHWEST, INC. AND SUBSIDIARIES
NOTES TO CONSOLIDATED FINANCIAL STATEMENTS
Note 14 - Commitments and Contingencies
Financial Instruments with Off-Balance-Sheet Risk. In the normal course of business, the Company makes loan commitments, typically unfunded loans and unused lines of credit, to accommodate the financial needs of its customers. These arrangements have credit risk essentially the same as that involved in extending loans to customers and are subject to the Company’s normal credit policies, including collateral requirements, where appropriate. Commitments to extend credit are agreements to lend to customers in accordance with predetermined contractual provisions. These commitments are for specific periods or, may contain termination clauses and may require the payment of a fee. The total amounts of unused commitments do not necessarily represent future credit exposure or cash requirements, in that commitments can expire without being drawn upon. Unfunded commitments to extend credit totaled $96.6 million and $66.4 million at December 31, 2016, and 2015, respectively.
Lease Commitments. First Financial Northwest Bank has entered into lease commitments for branch space in Mill Creek, Edmonds, and Renton, all in Washington. The following table sets forth, at December 31, 2016, the Bank’s commitment for future lease payments under our operating leases:
Years Ending December 31, | Future Minimum Lease Payments | ||
2017 | $ | 169,000 | |
2018 | 177,000 | ||
2019 | 185,000 | ||
2020 | 179,000 | ||
2021 | 38,000 | ||
Total | $ | 748,000 | |
Legal Proceedings. The Company and its subsidiaries are from time to time defendants in and are threatened with various legal proceedings arising from their regular business activities. Management, after consulting with legal counsel, is of the opinion that the ultimate liability, if any, resulting from these pending or threatened actions and proceedings will not have a material effect on the financial statements of the Company.
Employment Contracts and Severance Agreements. The Company has change in control severance agreements with key officers that offer specified terms of salary coverage. In addition, the Company has employment contracts with certain executives that include specified terms of salary coverage as a result of involuntary termination due to change in control or other circumstances.
122
FIRST FINANCIAL NORTHWEST, INC. AND SUBSIDIARIES
NOTES TO CONSOLIDATED FINANCIAL STATEMENTS
Note 15 - Parent Company Only Financial Statements
Presented below are the condensed balance sheets, income statements and statements of cash flows for First Financial Northwest.
FIRST FINANCIAL NORTHWEST, INC.
Condensed Balance Sheets
December 31, | |||||||
2016 | 2015 | ||||||
(In thousands) | |||||||
Assets | |||||||
Cash and cash equivalents | $ | 106 | $ | 27 | |||
Interest-bearing deposits | 13,299 | 50,311 | |||||
Investment in subsidiaries | 123,267 | 117,223 | |||||
Receivable from subsidiaries | 1,558 | 3,178 | |||||
Deferred tax assets, net | — | 23 | |||||
Other assets | 102 | 106 | |||||
Total assets | $ | 138,332 | $ | 170,868 | |||
Liabilities and Stockholders’ Equity | |||||||
Liabilities: | |||||||
Payable to subsidiaries | $ | 58 | $ | 84 | |||
Deferred tax liability, net | 17 | — | |||||
Other liabilities | 132 | 111 | |||||
Total liabilities | 207 | 195 | |||||
Stockholders’ equity | 138,125 | 170,673 | |||||
Total liabilities and stockholders’ equity | $ | 138,332 | $ | 170,868 | |||
FIRST FINANCIAL NORTHWEST, INC.
Condensed Income Statements
Year Ended December 31, | |||||||||||
2016 | 2015 | 2014 | |||||||||
(In thousands) | |||||||||||
Operating income: | |||||||||||
Interest income: | |||||||||||
Interest-bearing deposits with banks | $ | 92 | $ | 143 | $ | 26 | |||||
Other income | — | 2 | 8 | ||||||||
Total operating income | 92 | 145 | 34 | ||||||||
Operating expenses: | |||||||||||
Other expenses | 1,913 | 1,440 | 1,475 | ||||||||
Total operating expenses | 1,913 | 1,440 | 1,475 | ||||||||
Loss before provision for federal income taxes and equity in undistributed earnings of subsidiaries | (1,821 | ) | (1,295 | ) | (1,441 | ) | |||||
Federal income tax benefit | (701 | ) | (601 | ) | (573 | ) | |||||
Loss before equity in undistributed loss of subsidiaries | (1,120 | ) | (694 | ) | (868 | ) | |||||
Equity in undistributed earnings of subsidiaries | 10,012 | 9,854 | 11,555 | ||||||||
Net income | $ | 8,892 | $ | 9,160 | $ | 10,687 | |||||
123
FIRST FINANCIAL NORTHWEST, INC. AND SUBSIDIARIES
NOTES TO CONSOLIDATED FINANCIAL STATEMENTS
FIRST FINANCIAL NORTHWEST, INC.
Condensed Statements of Cash Flows
Year Ended December 31, | |||||||||||
2016 | 2015 | 2014 | |||||||||
(In thousands) | |||||||||||
Cash flows from operating activities: | |||||||||||
Net income | $ | 8,892 | $ | 9,160 | $ | 10,687 | |||||
Adjustments to reconcile net income to net cash from operating | |||||||||||
activities: | |||||||||||
Equity in undistributed earnings of subsidiaries | (10,012 | ) | (9,854 | ) | (11,555 | ) | |||||
Dividends received from subsidiary | 4,417 | 6,785 | 72,300 | ||||||||
ESOP, stock options, and restricted stock compensation | 27 | — | 13 | ||||||||
Change in deferred tax assets, net | 40 | 1,101 | (540 | ) | |||||||
Change in receivables from subsidiaries | 1,578 | (1,608 | ) | 8 | |||||||
Change in payables to subsidiaries | (26 | ) | (32 | ) | 50 | ||||||
Change in other assets | 4 | (55 | ) | (16 | ) | ||||||
Changes in other liabilities | 21 | (8 | ) | (130 | ) | ||||||
Net cash provided by operating activities | 4,941 | 5,489 | 70,817 | ||||||||
Cash flows from investing activities: | |||||||||||
Investments in subsidiaries | — | — | — | ||||||||
ESOP loan repayment | 1,171 | 1,115 | 1,054 | ||||||||
Net cash provided in investing activities | 1,171 | 1,115 | 1,054 | ||||||||
Cash flows from financing activities: | |||||||||||
Proceeds from exercise of stock options | 298 | 935 | 3,611 | ||||||||
Proceeds for vested awards | 370 | 282 | 282 | ||||||||
Net share settlement of stock awards | (98 | ) | — | — | |||||||
Repurchase and retirement of common stock | (40,812 | ) | (18,717 | ) | (17,566 | ) | |||||
Dividends paid | (2,803 | ) | (3,237 | ) | (2,938 | ) | |||||
Net cash used by financing activities | (43,045 | ) | (20,737 | ) | (16,611 | ) | |||||
Net (decrease) increase in cash | (36,933 | ) | (14,133 | ) | 55,260 | ||||||
Cash and cash equivalents at beginning of year | 50,338 | 64,471 | 9,211 | ||||||||
Cash and cash equivalents at end of year | $ | 13,405 | $ | 50,338 | $ | 64,471 | |||||
124
FIRST FINANCIAL NORTHWEST, INC. AND SUBSIDIARIES
NOTES TO CONSOLIDATED FINANCIAL STATEMENTS
Note 16 - Earnings Per Share
The following table presents a reconciliation of the components used to compute basic and diluted EPS for the periods indicated.
Year Ended December 31, | |||||||||||
2016 | 2015 | 2014 | |||||||||
(Dollars in thousands, except share data) | |||||||||||
Net income | $ | 8,892 | $ | 9,160 | $ | 10,687 | |||||
Earnings allocated to participating securities | (21 | ) | (31 | ) | (52 | ) | |||||
Earnings allocated to common shareholders | $ | 8,871 | $ | 9,129 | $ | 10,635 | |||||
Basic weighted-average common shares outstanding | 11,868,278 | 13,528,393 | 14,747,086 | ||||||||
Dilutive effect of stock options | 143,605 | 136,670 | 116,624 | ||||||||
Dilutive effect of restricted stock grants | 16,545 | 20,919 | 23,488 | ||||||||
Diluted weighted-average common shares outstanding | 12,028,428 | 13,685,982 | 14,887,198 | ||||||||
Basic earnings per share | $ | 0.75 | $ | 0.67 | $ | 0.72 | |||||
Diluted earnings per share | $ | 0.74 | $ | 0.67 | $ | 0.71 | |||||
Potential dilutive shares are excluded from the computation of EPS if their effect is anti-dilutive. Options to purchase an additional 60,000, 225,000, and 205,000 shares were not included in the computation of diluted EPS at December 31, 2016, 2015, and 2014, respectively, because the incremental shares under the treasury stock method of calculation resulted in them being antidilutive.
Note 17 - Summarized Consolidated Quarterly Financial Data (Unaudited)
The following table presents summarized consolidated quarterly data for each of the last three years.
125
FIRST FINANCIAL NORTHWEST, INC. AND SUBSIDIARIES
NOTES TO CONSOLIDATED FINANCIAL STATEMENTS
First Quarter | Second Quarter | Third Quarter | Fourth Quarter | ||||||||||||
(Dollars in thousands, except share data) | |||||||||||||||
2016 | |||||||||||||||
Total interest income | $ | 9,562 | $ | 9,896 | $ | 10,842 | $ | 11,409 | |||||||
Total interest expense | 1,781 | 1,713 | 1,908 | 2,105 | |||||||||||
Net interest income | 7,781 | 8,183 | 8,934 | 9,304 | |||||||||||
(Recapture of provision) provision for loan losses | (100 | ) | 600 | 900 | (100 | ) | |||||||||
Net interest income after recapture of provision for loan losses | 7,881 | 7,583 | 8,034 | 9,404 | |||||||||||
Total noninterest income | 480 | 708 | 673 | 790 | |||||||||||
Total noninterest expense | 5,773 | 6,072 | 5,254 | 5,850 | |||||||||||
Income before provision for income taxes | 2,588 | 2,219 | 3,453 | 4,344 | |||||||||||
Provision for federal income tax expense | 763 | 779 | 847 | 1,323 | |||||||||||
Net income | $ | 1,825 | $ | 1,440 | $ | 2,606 | $ | 3,021 | |||||||
Basic earnings per share | $ | 0.14 | $ | 0.12 | $ | 0.22 | $ | 0.29 | |||||||
Diluted earnings per share | $ | 0.14 | $ | 0.11 | $ | 0.22 | $ | 0.29 | |||||||
2015 | |||||||||||||||
Total interest income | $ | 9,154 | $ | 9,221 | $ | 9,358 | $ | 9,464 | |||||||
Total interest expense | 1,632 | 1,653 | 1,694 | 1,772 | |||||||||||
Net interest income | 7,522 | 7,568 | 7,664 | 7,692 | |||||||||||
Recapture of provision for loan losses | (100 | ) | (500 | ) | (700 | ) | (900 | ) | |||||||
Net interest income after recapture of provision for loan losses | 7,622 | 8,068 | 8,364 | 8,592 | |||||||||||
Total noninterest income | 91 | 357 | 447 | 384 | |||||||||||
Total noninterest expense | 4,290 | 4,874 | 5,381 | 5,333 | |||||||||||
Income before provision for income taxes | 3,423 | 3,551 | 3,430 | 3,643 | |||||||||||
Provision for federal income tax expense | 1,194 | 1,183 | 984 | 1,526 | |||||||||||
Net income | $ | 2,229 | $ | 2,368 | $ | 2,446 | $ | 2,117 | |||||||
Basic earnings per share | $ | 0.16 | $ | 0.17 | $ | 0.18 | $ | 0.16 | |||||||
Diluted earnings per share (1) | $ | 0.16 | $ | 0.17 | $ | 0.18 | $ | 0.16 | |||||||
2014 | |||||||||||||||
Total interest income | $ | 9,652 | $ | 9,695 | $ | 9,736 | $ | 9,606 | |||||||
Total interest expense | 1,598 | 1,517 | 1,517 | 1,609 | |||||||||||
Net interest income | 8,054 | 8,178 | 8,219 | 7,997 | |||||||||||
Recapture of provision for loan losses | (500 | ) | (100 | ) | (300 | ) | (1,200 | ) | |||||||
Net interest income after recapture of provision for loan losses | 8,554 | 8,278 | 8,519 | 9,197 | |||||||||||
Total noninterest income | 68 | 88 | 186 | 156 | |||||||||||
Total noninterest expense | 4,524 | 4,702 | 4,508 | 4,769 | |||||||||||
Income before provision (benefit) for income taxes | 4,098 | 3,664 | 4,197 | 4,584 | |||||||||||
Provision for federal income tax expense | 1,453 | 1,297 | 1,462 | 1,644 | |||||||||||
Net income | $ | 2,645 | $ | 2,367 | $ | 2,735 | $ | 2,940 | |||||||
Basic earnings per share (1) | $ | 0.17 | $ | 0.16 | $ | 0.19 | $ | 0.20 | |||||||
Diluted earnings per share (1) | $ | 0.17 | $ | 0.16 | $ | 0.19 | $ | 0.20 | |||||||
(1) Basic and diluted quarterly earnings per share may not equal total for year due to rounding. | |||||||||||||||
126
FIRST FINANCIAL NORTHWEST, INC. AND SUBSIDIARIES
NOTES TO CONSOLIDATED FINANCIAL STATEMENTS
Note 18 - Subsequent Events
The Company has received FDIC approval to open a new branch office in the Crossroads area of Bellevue, Washington. The branch will be a leased space in a retail center and is expected to open early in the second quarter of 2017.
Item 9. Changes in and Disagreements with Accountants on Accounting and Financial Disclosure
None.
Item 9A. Controls and Procedures
(i) Disclosure Controls and Procedures.
An evaluation of our disclosure controls and procedures (as defined in Rule 13a-15(e) of the Securities Exchange Act of 1934, as amended (the “Exchange Act”) was carried out as of December 31, 2016 under the supervision and with the participation of our Chief Executive Officer (“CEO”), Chief Financial Officer (“CFO”), and several other members of our senior management. The CEO (Principal Executive Officer) and CFO (Principal Financial Officer) concluded that, as of December 31, 2016, First Financial Northwest’s disclosure controls and procedures were effective in ensuring that information we are required to disclose in the reports we file or submit under the Exchange Act is (1) recorded, processed, summarized, and reported within the time periods specified in the SEC’s rules and forms, and (2) accumulated and communicated to First Financial Northwest management, including its CEO and CFO, as appropriate to allow timely decisions regarding required disclosure, specified in the SEC’s rules and forms.
(a) Management’s report on internal control over financial reporting.
First Financial Northwest’s management is responsible for establishing and maintaining adequate internal control over financial reporting as defined in Rule 13a-15(f) of the Securities Exchange Act of 1934. First Financial Northwest’s internal control system is designed to provide reasonable assurance to our management and the Board of Directors regarding the preparation and fair presentation of published financial statements for external purposes in accordance with generally accepted accounting principles.
This process includes policies and procedures that: (i) pertain to the maintenance of records that, in reasonable detail, accurately and fairly reflect the transactions of First Financial Northwest; (ii) provide reasonable assurance that transactions are recorded as necessary to permit preparation of financial statements in accordance with generally accepted accounting principles, and that receipts and expenditures of First Financial Northwest are being made only in accordance with authorizations of management and directors of First Financial Northwest; and (iii) provide reasonable assurance regarding prevention or timely detection of unauthorized acquisition, use, or disposition of First Financial Northwest’s assets that could have a material effect on the financial statements. A control procedure, no matter how well conceived and operated, can provide only reasonable, not absolute, assurance that the objectives of the control system are met. Also, because of the inherent limitations in all control procedures, no evaluation of controls can provide absolute assurance that all control issues and instances of fraud, if any, within the Company have been detected. Additionally, in designing disclosure controls and procedures, our management was required to apply its judgment in evaluating the cost-benefit relationship of possible disclosure controls and procedures. The design of any disclosure controls and procedures is also based in part upon certain assumptions about the likelihood of future events, and there can be no assurance that any design will succeed in achieving its stated goals under all potential future conditions. As a result of these inherent limitations, internal control over financial reporting may not prevent or detect misstatements. Furthermore, projections of any evaluation of effectiveness to future periods are subject to risk that controls may become inadequate because of changes in conditions or that the degree of compliance with the policies or procedures may deteriorate.
First Financial Northwest’s management assessed the effectiveness of First Financial Northwest’s internal control over financial reporting as of December 31, 2016. In making this assessment, management used the criteria set forth by the Committee of Sponsoring Organizations of the Treadway Commission in Internal Control-Integrated Framework (2013 Framework). Based on that assessment, First Financial Northwest’s management believes that, as of December 31, 2016, First Financial Northwest’s internal control over financial reporting is effective based on those criteria.
Moss Adams LLP, an independent registered public accounting firm, has audited the Company’s consolidated financial statements and the effectiveness of our internal control over financial reporting as of December 31, 2016, which is included in Item 8. Financial Statements and Supplementary Data.
127
(b) Attestation report of the registered public accounting firm.
The “Report of Independent Registered Public Accounting Firm” included in Item 8 of this Annual Report on Form 10‑K is incorporated herein by reference.
(c) Changes in internal control over financial reporting.
There were no significant changes in First Financial Northwest’s internal control over financial reporting during First Financial Northwest’s most recent fiscal quarter that have materially affected or are reasonably likely to materially affect, First Financial Northwest’s internal control over financial reporting.
Item 9B. Other Information
There was no information to be disclosed by us in a report on Form 8-K during the fourth quarter of fiscal 2016 that was not so disclosed.
PART III
Item 10. Directors, Executive Officers and Corporate Governance
The information required under the section captioned “Proposal 1 - Election of Directors” in First Financial Northwest’s Definitive Proxy Statement for the 2016 Annual Meeting of Shareholders (“Proxy Statement”) is incorporated herein by reference.
For information regarding the executive officers of First Financial Northwest and the Bank, see the information contained herein under the section captioned “Item 1. Business - Personnel - Executive Officers of the Registrant.”
Audit Committee Financial Expert
At December 31, 2016 our Audit Committee was composed of Directors Roger H. Molvar (Chairman), Richard M. Riccobono (replacing Gary F. Faull effective November 2016) and Joann E. Lee. Each member of the Audit Committee is “independent” as defined in listing standards of The Nasdaq Stock Market LLC. Our Board of Directors has designated Directors Roger H. Molvar and Joann E. Lee as the Audit Committee financial experts, as defined in the SEC’s Regulation S-K. Directors Roger H. Molvar and Joann E. Lee are independent as that term is used in Item 407(d)(5)(i)(B) of SEC’s Regulation S-K.
Code of Business Conduct and Ethics
A copy of the Code of Business Conduct and Ethics is available on our website at www.ffnwb.com under Investor Relations – Corporate Overview – Governance Documents. Additionally, any material amendments to, or waiver from a provision of the Code of Business Conduct and Ethics will be posted to the same website.
Compliance with Section 16(a) of the Exchange Act
The information required by this item under the section captioned “Section 16 (a) Beneficial Ownership Reporting Compliance” in the Proxy Statement is incorporated herein by reference.
Item 11. Executive Compensation
The information required by this item under the sections captioned “Executive Compensation” and “Directors’ Compensation” in the Proxy Statement are incorporated herein by reference.
Item 12. Security Ownership of Certain Beneficial Owners and Management and Related Stockholder Matters
(a) | Security Ownership of Certain Beneficial Owners and Management. |
The information required by this item under the section captioned “Security Ownership of Certain Beneficial Owners and Management” in the Proxy Statement is incorporated herein by reference.
(b) Security Ownership of Management.
128
The information required by this item under the section captioned “Security Ownership of Certain Beneficial Owners and Management” in the Proxy Statement is incorporated herein by reference.
(c) Change In Control
First Financial Northwest is not aware of any arrangements, including any pledge by any person of securities of First Financial Northwest, the operation of which may at a subsequent date result in a change in control of First Financial Northwest.
(d) Equity Compensation Plan Information
The following table summarizes share and exercise price information about First Financial Northwest’s equity compensation plans as of December 31, 2016.
Plan category | Number of securities to be issued upon exercise of outstanding options, warrants, and rights | Weighted-average exercise price of outstanding options, warrants, and rights | Number of securities remaining available for future issuance under equity compensation plans (excluding securities reflected in column (a)) | |||||||
(a) | (b) | (c) | ||||||||
Equity compensation plans (stock options) approved by security holders: | ||||||||||
2008 Equity Incentive Plan(1) | 603,820 | $ | 10.19 | — | ||||||
2016 Equity Incentive Plan (2) | — | — | 1,371,896 | |||||||
Equity compensation plans not approved by security holders | N/A | N/A | N/A | |||||||
Total | 603,820 | $ | 10.19 | — | ||||||
___________________
(1) The restricted shares granted under the 2008 Equity Incentive Plan were purchased by First Financial Northwest in open market transactions and subsequently issued to First Financial Northwest’s directors and certain employees. As of December 31, 2016, there were 839,634 restricted shares granted pursuant to the 2008 Equity Incentive Plan.
(2) The shares available for grant under the 2016 Equity Incentive Plan include 385,948 shares of restricted stock. Each share granted as restricted stock reduces the total available shares for grant by two shares.
Item 13. Certain Relationships and Related Transactions and Director Independence
The information required by this item under the sections captioned “Meetings and Committees of the Board of Directors and Corporate Governance Matters - Corporate Governance - Transactions with Related Persons,” and “Meetings and Committees of the Board of Directors and Corporate Governance Matters - Corporate Governance - Director Independence” in the Proxy Statement are incorporated herein by reference.
Item 14. Principal Accounting Fees and Services
The information required by this item under the section captioned "Proposal 4- Ratification of the appointment of Moss Adams as our independent auditor for 2017” in the Proxy Statement is incorporated herein by reference.
129
PART IV
Item 15. Exhibits and Financial Statement Schedules
(a) Exhibits
3.1 | Articles of Incorporation of First Financial Northwest (1) |
3.2 | Amended and Restated Bylaws of First Financial Northwest (2) |
4.0 | Form of stock certificate of First Financial Northwest (1) |
10.1 | Amended Employment Agreement between First Financial Northwest Bank and Joseph W. Kiley III (3) |
10.2 | Form of Change in Control Severance Agreement for Executive Officers (4) |
10.3 | Form of Supplemental Executive Retirement Agreement entered into by First Financial Northwest Bank with Joseph W. Kiley III (5) |
10.4 | 2008 Equity Incentive Plan (6) |
10.5 | 2016 Equity Incentive Plan (7) |
10.6 | Forms of incentive and non-qualified stock option award agreements (8) |
10.7 | Form of restricted stock award agreement (8) |
10.8 | Employment Agreement between First Financial Northwest Bank and Richard P. Jacobson (3) |
23 | Consent of Independent Registered Public Accounting Firm- Moss Adams LLP |
31.1 | Certification of Chief Executive Officer Pursuant to Section 302 of the Sarbanes-Oxley Act |
31.2 | Certification of Chief Financial Officer Pursuant to Section 302 of the Sarbanes-Oxley Act |
32.1 | Certification of Chief Executive Officer Pursuant to Section 906 of the Sarbanes-Oxley Act |
32.2 | Certification of Chief Financial Officer Pursuant to Section 906 of the Sarbanes-Oxley Act |
101 | The following materials from First Financial Northwest’s Annual Report on Form 10-K for the year ended December 31, 2016, formatted in Extensible Business Reporting Language (XBRL): (1) Consolidated Balance Sheets; (2) Consolidated Income Statements; (3) Consolidated Statements of Comprehensive Income; (4) Consolidated Statements of Stockholders’ Equity; (5) Consolidated Statements of Cash Flows; and (6) Notes to Consolidated Financial Statements. |
______________
(1) | Filed as an exhibit to First Financial Northwest’s Registration Statement on Form S-1 (333-143539) |
(2) | Filed as an exhibit to First Financial Northwest’s Current Report on Form 8-K dated November 18, 2016. |
(3) | Filed as an exhibit to First Financial Northwest’s Current Report on Form 8-K dated December 5, 2013. |
(4) | Filed as an exhibit to First Financial Northwest’s Current Report on Form 8-K dated September 9, 2014. |
(5) | Filed as an exhibit to First Financial Northwest’s Current Report on Form 8-K dated September 12, 2016. |
(6) | Filed as Appendix A to First Financial Northwest’s definitive proxy statement dated April 15, 2008. |
(7) | Filed as an exhibit to First Financial Northwest’s Current Report on Form 8-K dated June 15, 2016. |
(8) | Filed as an exhibit to First Financial Northwest’s Current Report on Form 8-K dated July 1, 2008. |
Item 16. Form 10-K Summary.
None.
130
SIGNATURES
Pursuant to the requirements of Section 13 or 15(d) of the Securities Exchange Act of 1934, the registrant has duly caused this report to be signed on its behalf by the undersigned, thereunto duly authorized.
FIRST FINANCIAL NORTHWEST, INC. | ||
Date: March 10, 2017 | By: | /s/ Joseph W. Kiley III |
Joseph W. Kiley III | ||
President and Chief Executive Officer | ||
131
Pursuant to the requirements of the Securities Exchange Act of 1934, this report has been signed below by the following persons on behalf of the registrant and in the capacities and on the dates indicated.
Signature | Title | Date | ||
/s/ Gary F. Kohlwes | Chairman of the Board and Director | March 10, 2017 | ||
Gary F. Kohlwes | ||||
/s/ Joseph W. Kiley III | President, Chief Executive Officer and Director | March 10, 2017 | ||
Joseph W. Kiley III | (Principal Executive Officer) | |||
/s/ Richard P. Jacobson | Chief Financial Officer and Director | March 10, 2017 | ||
Richard P. Jacobson | (Principal Financial Officer) | |||
/s/ Christine A. Huestis | Vice President and Controller | March 10, 2017 | ||
Christine A. Huestis | (Principal Accounting Officer) | |||
/s/ Gary F. Faull | Director | March 10, 2017 | ||
Gary F. Faull | ||||
/s/ Joann E. Lee | Director | March 10, 2017 | ||
Joann E. Lee | ||||
/s/ Roger H. Molvar | Director | March 10, 2017 | ||
Roger H. Molvar | ||||
/s/ Kevin D. Padrick | Director | March 10, 2017 | ||
Kevin D. Padrick | ||||
/s/ Daniel L. Stevens | Director | March 10, 2017 | ||
Daniel L. Stevens | ||||
/s/ Richard M. Riccobono | Director | March 10, 2017 | ||
Richard M. Riccobono | ||||
132
Exhibit Index
Exhibit No. | Description |
21 | Subsidiaries of the Registrant |
23 | Consent of Independent Registered Public Accounting Firm- Moss Adams LLP |
31.1 | Certification of Chief Executive Officer Pursuant to Section 302 of the Sarbanes-Oxley Act |
31.2 | Certification of Chief Financial Officer Pursuant to Section 302 of the Sarbanes-Oxley Act |
32.1 | Certification of Chief Executive Officer Pursuant to Section 906 of the Sarbanes-Oxley Act |
32.2 | Certification of Chief Financial Officer Pursuant to Section 906 of the Sarbanes-Oxley Act |
101 | The following materials from First Financial Northwest’s Annual Report on Form 10-K for the year ended December 31, 2016, formatted in Extensible Business Reporting Language (XBRL): (1) Consolidated Balance Sheets; (2) Consolidated Income Statements; (3) Consolidated Statements of Comprehensive Income; (4) Consolidated Statements of Stockholders’ Equity; (5) Consolidated Statements of Cash Flows; and (6) Notes to Consolidated Financial Statements. |