Attached files
| file | filename |
|---|---|
| EX-23.1 - EXHIBIT 23.1 - UCP, Inc. | exhibit231201610-k.htm |
| EX-32.2 - EXHIBIT 32.2 - UCP, Inc. | exhibit322201610-k.htm |
| EX-32.1 - EXHIBIT 32.1 - UCP, Inc. | exhibit321201610-k.htm |
| EX-31.2 - EXHIBIT 31.2 - UCP, Inc. | exhibit312201610-k.htm |
| EX-31.1 - EXHIBIT 31.1 - UCP, Inc. | exhibit311201610-k.htm |
| EX-21.1 - EXHIBIT 21.1 - UCP, Inc. | exhibit211201610-k.htm |
UNITED STATES SECURITIES AND EXCHANGE COMMISSION
Washington, D.C. 20549
______________________
FORM 10-K
SANNUAL REPORT PURSUANT TO SECTION 13 OR 15(d) OF THE SECURITIES EXCHANGE ACT OF 1934
FOR THE FISCAL YEAR ENDED December 31, 2016
OR
£TRANSITION REPORT PURSUANT TO SECTION 13 OR 15(d) OF THE SECURITIES EXCHANGE ACT OF 1934
For the transition period from _____ to _____
Commission file number 001-36001

UCP, Inc.
(Exact Name of Registrant as Specified in Its Charter)
Delaware (State or other jurisdiction of incorporation) | 90-0978085 (IRS Employer Identification No.) |
99 Almaden Boulevard, Suite 400, San Jose, CA 95113
(Address of principal executive offices, including zip code)
(408) 207-9499
Registrant’s telephone number, including area code
Securities Registered Pursuant to Section 12(b) of the Act:
Title of Each Class | Name of Each Exchange On Which Registered |
Class A Common Stock, Par Value $0.01 | New York Stock Exchange |
Securities Registered Pursuant to Section 12(g) of the Act: None
Indicate by check mark whether the registrant is a well-known seasoned issuer, as defined by Rule 405 of the Securities Act.
Yes ¨ No ý
Indicate by check mark if the registrant is not required to file reports pursuant to Section 13 or Section 15(d) of the Act. Yes ¨ No ý
Indicate by check mark whether the registrant (1) has filed all reports required to be filed by Section 13 or 15(d) of the Securities Exchange Act of 1934 during the preceding 12 months (or for such shorter period that the registrant was required to file such reports), and (2) has been subject to such filing requirements for the past 90 days. Yes ý No ¨
Indicate by check mark whether the registrant has submitted electronically and posted on its corporate Web site, every Interactive Data File required to be submitted and posted pursuant to Rule 405 of Regulation S-T (§ 232.405 of this chapter) during the preceding 12 months (or for such shorter period that the registrant was required to submit and post such files). Yes ý No ¨
Indicate by check mark if disclosure of delinquent filers pursuant to Item 405 of Regulation S-K is not contained herein, and will not be contained, to the best of registrant’s knowledge, in definitive proxy or information statements incorporated by reference in Part III of this Form 10-K or any amendment to this Form 10-K. ý
Indicate by check mark whether the registrant is a large accelerated filer, an accelerated filer, a non-accelerated filer, or a smaller reporting company. See definition of “large accelerated filer,” “accelerated filer” and “smaller reporting company” in Rule 12b-2 of the Exchange Act (check one):
Large accelerated filer Yes ¨ | Accelerated filer ý | Non-accelerated filer ¨ | Smaller reporting company ¨ |
Indicate by check mark whether the registrant is a shell company (as defined in Rule 12-b of the Act). Yes ¨ No ý
At June 30, 2016, the aggregate market value of shares of the registrant’s Class A common stock held by non-affiliates of the registrant (based upon the closing sale price of such shares on the New York Stock Exchange on June 30, 2016) was $59.8 million, which excludes shares of Class A common stock held in treasury and shares held by executive officers, directors, and stockholders whose ownership exceeds 10% of the registrant’s Class A common stock outstanding at June 30, 2016. This calculation does not reflect a determination that such persons are deemed to be affiliates for any other purposes.
On March 1, 2017, the registrant had 7,958,314 shares of Class A common stock, $0.01 par value, outstanding.
DOCUMENTS INCORPORATED BY REFERENCE
Portions of the Definitive Proxy Statement for our 2017 Annual Meeting of Stockholders are incorporated by reference into Part III of this Annual Report on Form 10-K. We expect to file our Proxy Statement within 120 days after December 31, 2016.
1
ANNUAL REPORT ON FORM 10-K
TABLE OF CONTENTS
Page No. | ||
PART I | ||
PART II | ||
PART III | ||
PART IV | ||
2
SPECIAL NOTE REGARDING FORWARD-LOOKING STATEMENTS
We have made forward-looking statements in this Annual Report on Form 10-K that are subject to risks, uncertainties and assumptions. All statements other than statements of historical fact included in this report are forward-looking statements. You can identify forward-looking statements by the fact that they do not relate strictly to historical facts. These statements may include words such as “may,” “might,” “will,” “should,” “expects,” “plans,” “anticipates,” “believes,” “estimates,” “predicts,” “potential” or “continue,” the negative of these terms and other comparable terminology. These forward-looking statements may include projections of our future financial or operating performance, our anticipated growth strategies, anticipated trends in our business and other future events or circumstances. These statements are only predictions based on our current expectations and projections about future events.
Forward-looking statements involve numerous risks and uncertainties and you should not rely on them as predictions of future events. Forward-looking statements depend on assumptions, data or methods which may be incorrect or imprecise and we may not be able to realize them. We do not guarantee that the transactions and events described will happen as described (or that they will happen at all). The following factors, among others, could cause actual results and future events to differ materially from those set forth or contemplated in the forward-looking statements:
• | economic changes either nationally or in the markets in which we operate, including declines in employment, volatility of mortgage interest rates, consumer sentiment and inflation; |
• | downturns in the homebuilding industry, either nationally or in the markets in which we operate; |
• | continued volatility and uncertainty in the credit markets and broader financial markets; |
• | our business operations; |
• | changes in our business and investment strategy; |
• | availability of land to acquire and our ability to acquire such land on favorable terms or at all; |
• | availability, terms and deployment of capital, including our ability to access debt financing on reasonable terms; |
• | disruptions in the availability of mortgage financing or increases in the number of foreclosures in our markets; |
• | shortages of or increased prices for labor, land or raw materials used in housing construction; |
• | delays or restrictions in land development or home construction resulting from adverse weather and geological conditions or other events outside our control; |
• | reduced consumer demand; |
• | the cost and availability of insurance and surety bonds; |
• | changes in, or the failure or inability to comply with, governmental laws and regulations; |
• | the timing of receipt of regulatory approvals and the opening of communities; |
• | the degree and nature of our competition; |
• | our leverage and debt service obligations; |
• | our future operating expenses, which may increase disproportionately to our revenue; |
• | our ability to achieve operational efficiencies with future revenue growth; |
• | our relationship, and actual and potential conflicts of interest, with PICO; and |
• | availability of qualified personnel and our ability to retain our key personnel. |
You are cautioned not to place undue reliance on forward-looking statements. While forward-looking statements reflect our good faith beliefs, they are not guarantees of future performance, and our actual results could differ materially from those expressed in any forward-looking statement. We disclaim any obligation to publicly update or revise any forward-looking statement to reflect changes in underlying assumptions or factors, new information, data or methods, future events or other changes, except as required by law. For a further discussion of these and other factors, see Item 1A, "Risk Factors" in this Annual Report on Form 10-K. In light of these risks and uncertainties, the forward-looking events discussed in this report might not occur.
3
PART I
ITEM 1. BUSINESS
As used in this Annual Report on Form 10-K, unless the context otherwise requires or indicates, references to “the Company,” “we,” “us,” “our” and “UCP” refer (1) prior to the July 23, 2013 completion of the initial public offering of Class A common stock, par value $0.01 per share (“Class A common stock”) of UCP, Inc. (the “IPO”) and related transactions, to UCP, LLC and its consolidated subsidiaries and (2) after our IPO and related transactions, to UCP, Inc. and its consolidated subsidiaries including UCP, LLC.
OUR COMPANY
The Company is a homebuilder and land developer with expertise in residential land acquisition, development and entitlement, as well as home design, construction and sales. We operate in the states of California, Washington, North Carolina, South Carolina and Tennessee. We design, construct and sell high quality single-family homes through Benchmark Communities, LLC (“Benchmark Communities”), our wholly owned homebuilding subsidiary. Prior to completion of our IPO, we operated as a wholly owned subsidiary of PICO Holdings, Inc. ("PICO"), a NASDAQ-listed, diversified holding company. Subsequent to our IPO, PICO holds a majority of the voting power of UCP, Inc. and of the economic interests of UCP, LLC, the subsidiary through which we operate our business under the name UCP.
Company’s History

The Company’s operations began in 2004 and principally focused on acquiring land, and entitling and developing it for residential construction, and selling residential lots to third-party homebuilders. | Company’s assets were acquired by PICO in January 2008, which allowed the Company to accelerate the development of its business and gain access to a capital partner capable of funding its growth. | Formed Benchmark Communities, LLC, its wholly-owned homebuilding subsidiary, to design, construct and sell high quality single-family homes. | The Company completed its IPO on July 23, 2013 and purchased a 42.3% economic interest in UCP, LLC with the net proceeds. | Completed the acquisition of the assets and liabilities of Citizens Homes, Inc. ("Citizens Acquisition") on April 10, 2014 to expand its operations for the purchase of real estate and the construction and marketing of residential homes in the Southeast. | Construction management services acquired as part of the Citizens Acquisition was sold in the fourth quarter of 2015. | Benchmark Communities reached a milestone of 2,000 new home deliveries since its parent company, UCP, went public in 2013, with over 1,000 occurring since the beginning of 2015. | ||||||
OUR BUSINESS STRATEGY
We actively source, evaluate and acquire land for residential real estate development and homebuilding. For each of our real estate assets, we periodically analyze ways to maximize value by either (i) building single-family homes and marketing them for sale under our Benchmark Communities brand or (ii) completing entitlement work and horizontal infrastructure development and selling lots to third-party homebuilders. We perform this analysis using a disciplined analytical process, which we believe is a differentiating component of our business strategy.
We believe that our sizable inventory of well-located land provides us with a significant opportunity to develop communities and design, construct and sell homes under our Benchmark Communities brand. While we expect to opportunistically sell select residential lots to third-party homebuilders when we believe it will maximize our returns or lower our risk, we expect that homebuilding and home sales will constitute our primary means of generating revenue growth for the foreseeable future.
4
When acquiring real estate assets, we focus on seeking maximum long-term risk-adjusted returns. Our underwriting and operating philosophies emphasize capital preservation, risk identification and mitigation, and risk-adjusted returns.
We seek to mitigate our exposure to market downturns and capitalize on market upturns through the following key strategies:
• | identifying and regularly reviewing the risks associated with our assets and business, including market, entitlement and environmental risks, and structuring transactions designed to reduce the impact of those risks; |
• | maintaining high quality in our construction activities; |
• | maintaining a strong balance sheet, using a prudent amount of leverage; |
• | leveraging our purchasing power and controlling costs; |
• | attracting highly experienced professionals and encouraging them to maintain a deep understanding and ownership of their respective disciplines; |
• | maintaining a strong corporate culture that is based on our core values including integrity, honesty, transparency, innovation, quality and excellence; and |
• | maintaining rigorous supervision over our operations. |
SEGMENTS AND GEOGRAPHIC MARKETS
The Company has segmented its operating activities into two geographical regions and currently has homebuilding reportable segments and land development reportable segments in the West and Southeast.
In California, we primarily operate in the Central Valley area (Fresno and Madera counties), the Monterey Bay area (Monterey County), the South San Francisco Bay area (Santa Clara and San Benito counties) and in Southern California (Los Angeles, Ventura and Kern counties). In Washington State, we operate in the Puget Sound area (King, Snohomish, Thurston and Kitsap counties). In North Carolina, we operate in the Charlotte and Raleigh areas (Mecklenburg, Iredell, Union, Chatham counties). In South Carolina, we operate in the Myrtle Beach area (Horry County). In Tennessee, we operate in the Nashville area (Davidson, Rutherford, Wilson and Sumner counties).
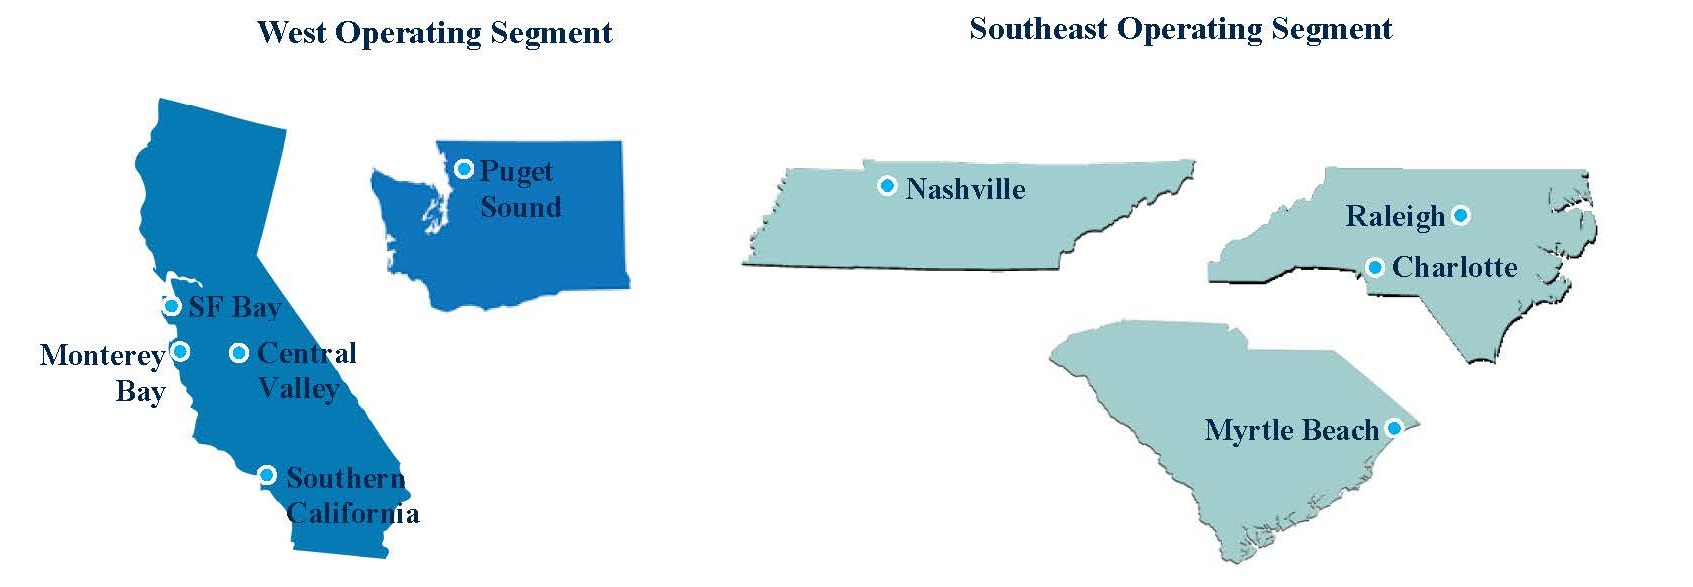
We believe that these markets have attractive residential real estate investment characteristics, such as favorable long-term population demographics, consumer demand for single-family housing that often exceeds available supply, large and growing employment bases, and the ability to generate above-average investment returns. We continue to experience significant homebuilding and land development opportunities in our current markets and are evaluating potential expansion opportunities in other markets that we believe have attractive long-term investment characteristics.
For a more detailed description of and financial information about our segments, see Note 12, "Segment Information" to our consolidated financial statements included elsewhere in this Annual Report on Form 10-K.
5
HOMEBUILDING OPERATIONS
We build homes through our wholly owned homebuilding subsidiary, Benchmark Communities, LLC. Benchmark Communities operates under the principle that “Everything Matters!” This principle underlies all phases of our new home sale and construction process including planning, design, construction, marketing, sales and the customer experience. We are diversified by product offering, which we believe reduces our exposure to any particular market or customer segment. We decide to target specific and identifiable buyer segments by project and geographic market, in part dictated by each particular asset, its location, topography and competitive market positioning, and the amenities of the surrounding area and the community in which it is located.
We believe our customers look for distinctive new homes; accordingly, we design homes in thoughtful and creative ways to create homes that we expect buyers will find highly desirable. We seek to accomplish this by collecting and analyzing information about the characteristics of our target buyer segments and incorporating our analysis into new home designs. We source information about our target buyer segments from our experience selling new homes and through market research that enables us to identify design preferences that we believe will appeal to our customers. We target diverse buyer segments, including first-time buyers, first-time move-up buyers, second-time move-up buyers and active-adult buyers. Most of our communities target multiple buyer segments, enabling us to seek increased sales pace and reduce our dependence on any single buyer segment.
We contract with third party architects, engineers and interior designers to assist our experienced internal product development personnel in designing homes that are intended to reflect our target customers’ tastes and preferences. In addition to identifying desirable design and amenities, this process includes a rigorous value engineering strategy that allows us to seek efficiencies in the construction process.
Customer Experience
We seek to make the home buying experience friendly, effective and efficient. Our integrated quality assurance and customer care functions assign the same personnel at each community the responsibility for monitoring quality control and managing the customer experience. As a standard practice, we seek to communicate with each homeowner multiple times during their first two years of ownership in an effort to ensure satisfaction with their new home. Additionally, we monitor the effectiveness of our customer experience efforts with third-party surveys that measure our home buyers’ perception of the quality of our homes and the responsiveness of our customer service. Our customer experience program seeks to optimize customer care in terms of availability, response time and effectiveness, and we believe that it reduces our exposure to future liability claims. We believe that our continuing commitment to quality and the customer experience provides a compelling value proposition for prospective home buyers and reduces our exposure to long-term construction defect claims.
Homebuilding, Marketing and Sales Process
We realize homebuilding is a local business. As a result, we focus on the unique characteristics of each market and submarket. Each of our markets is managed locally by a division president who has a deep understanding of the local market, including our competition. Additionally, our division presidents maintain a broad network of relationships with land sellers, land developers, subcontractors and realtors.
In order to balance construction capacity with consumer demand, we release homes for sale in small phases, usually four to eight homes. We use sales prices as the lever to maintain equilibrium between capacity and demand. In markets where demand is outpacing construction capacity we have been able to raise prices and improve gross margins. From time to time we may identify, specific communities where demand has lagged construction capacity. In these cases, we have used incentives in order to increase demand.
We utilize a construction methodology that allows us to standardize the time of new home starts in order to reduce labor and material costs and the administrative inefficiencies in the construction process. Our even flow method provides visibility to our material suppliers, vendors and subcontractors, helping them balance their labor and material needs consistently over time, which we believe results in higher-quality craftsmanship and lower production costs. Our even flow method provides us with enhanced visibility, oversight and control of our production process, staffing and cash flow requirements. As a result, we believe that we are able to more effectively manage our working capital and borrowing needs.
Generally, we seek to pre-sell homes before we commence construction. This allows customers to choose certain structural and finish options and often offers us higher profitability as compared to homes that are constructed prior to identifying a buyer. Pre-sold homes often result in superior customer satisfaction and higher gross margins. During periods of strong demand, we have been successful in pre-selling a majority of our homes before construction begins. Given our even flow method, when there is an
6
opportunity to start construction of a home that is not yet sold we will do so in order to have homes available for customers who would like to move into a new home quickly. Homes that are under construction or completed that are not yet sold are attractive to customers who are renting, who are relocating, and who have had or are having a major change in their lives such as marriage, birth of a child or divorce. Homes that are unsold and under construction or completed allow us to compete more aggressively with the resale market where time from contract to close is usually 45 to 60 days.
We routinely monitor and actively manage our even flow production process to align our inventory with prevailing and expected future home absorption trends. In the even our inventory begins to build faster than homes are sold, we will typically reduce or halt the start of any additional unsold homes in order to bring our supply in balance with consumer demand. This allows us to more efficiently manage our inventory and asset levels as well as our capital needs with the objective of improving our overall return metrics.
Our sales and marketing process uses extensive advertising and promotional strategies, including Benchmark Communities’ website, community marketing brochures, and the use of billboards and other roadside signage. Brokerage operations are conducted through our wholly owned subsidiaries in each state, as follows: (1) BMC Realty Advisors, Inc. in California and Washington; (2) Builders BMC, Inc. in North Carolina; (3) BMCH Tennessee, LLC in Tennessee; and (4) Benchmark Communities, LLC in South Carolina.
We typically staff two sales professionals at each of our communities. Our in-house sales teams have offices in their respective model home complex and are responsible for selling homes, interfacing with customers between the time a sales contract is executed and the home sale closes, and coordinating with our escrow management department. Our sales professionals work with potential buyers to determine their unique needs and then by demonstrating the functionality and livability of our homes with floor plans, price information, development and construction timetables, tours of model homes and the selection of amenities. Our sales professionals are internally trained, generally have prior experience selling new homes in their respective markets and are licensed by applicable real estate oversight agencies.
Model homes are one of our primary sales tools. Depending on the amount of time we expect it will take to complete sales at a community and the number of different homes we are offering, we typically build between two and four model homes. Our marketing staff uses interior designers, architects and color consultants to create model homes designed to appeal to our targeted buyer segments. Our models typically include features that are included in the base price of the particular home model, and options and upgrades that a home buyer may elect to purchase. We often use an on-site design center that offers our customers the opportunity to purchase various options and upgrades and provides additional revenue opportunities for us.
Home Buyer Financing
The majority of our home buyers finance a significant portion of the purchase price of their home with long-term mortgage financing. We assist prospective purchasers in obtaining mortgage financing by providing referrals to one of our preferred lenders. Our preferred lenders have a track record of offering our customers competitive rates and terms, a desire to enhance our customer's experience and the ability to perform on an agreed schedule in order to meet our expectations and those of our customers. Through our lender referral process we seek to reduce the challenges our customers encounter when trying to obtain mortgage financing for our homes.
Quality Control and Customer Service
We pay particular attention to the product design process and carefully consider quality and choice of materials in order to attempt to eliminate building deficiencies. The quality and workmanship of the subcontractors we employ are monitored and we make regular internal and third party inspections and evaluations of our subcontractors to seek to ensure that our standards are met.
We have quality control and customer service staff who seek to provide a positive experience for each home buyer throughout the pre-sale, sale, building, closing and post-closing periods. These employees are responsible for providing after sales customer service. Our quality and service initiatives include taking home buyers on a comprehensive tour of their home prior to closing and using customer survey results to improve our standards of quality and customer satisfaction.
Warranty Program
We provide a “fit and finish” warranty on our home sales that covers workmanship and materials consistent with local market custom (two years in the West homebuilding segment and one year in the Southeast homebuilding segment). As is customary in the homebuilding industry, our trade partners who build our homes are contractually obligated to provide warranty repairs inside the fit and finish warranty period, including structural and water intrusion repairs up the to the period designated by the relevant state statute.
7
Along with our homeowners receiving warranty information, they also receive important home maintenance guidelines in an effort to help them enjoy and prolong the durability of their home. Customers who actively and correctly maintain their home not only protect the value of their home, but minimize the longer-term risk to the Company that is normally associated with homes that are not properly maintained.
The limited warranty covering construction defects is transferable to subsequent buyers not under direct contract with us and requires that home buyers agree to the conditions, restrictions and procedures set forth in the warranty. We accrue estimated warranty costs based upon our estimates of the expense we expect to incur for work under warranty.
Raw Materials
When constructing homes, we use various materials and components. It has typically taken us four to six months to construct a home, during which time we are subject to price fluctuations in raw materials.
LAND DEVELOPMENT OPERATIONS
As a homebuilder and land developer, we are positioned to either build new homes on our lots or to sell our lots to third-party homebuilders. While our current business plan emphasizes building new homes, we proactively monitor market conditions and our operations allow us to opportunistically sell a portion of our lots to third-party homebuilders if we believe that will maximize our returns or lower our risk. We believe that our ability and willingness to opportunistically build on or sell our lots to third-party homebuilders afford us the following important advantages:
• | exploit periods of cyclical expansion by building on our lots; |
• | manage our operating margins and reduce operating income volatility by opportunistically selling lots as operating performance and market conditions dictate; and |
• | manage operating risk in periods where we anticipate cyclical contraction by reducing our land supply through lot sales. |
We benefit from the long-standing relationships our executive management team has with key land owners, brokers and lenders, as well as development and real estate companies in our markets. These relationships have provided us with opportunities to evaluate and privately negotiate acquisitions outside of a broader marketing process. In addition, we believe that our financial position and positive reputation in our markets provide land sellers and brokers confidence that we will consummate transactions in a highly professional, efficient and transparent manner. Our ability to regularly do so in turn strengthens these relationships for future opportunities. We believe our relationships with land owners and brokers will continue to provide opportunities to source land acquisitions prior to a full marketing process, helping us to maintain a significant pipeline of opportunities on favorable terms and prices.
The land development process in our markets can be very complex and often requires highly-experienced individuals that can respond to numerous unforeseen challenges with a high degree of competency and integrity. We actively seek land acquisition opportunities where others might seek to avoid complexities, as we believe we can add significant value through our expertise in entitlements, re-entitlements, horizontal land planning and development.
Acquisition Process
Our ability to identify, evaluate and acquire land in desirable locations and on favorable terms is critical to our success. We evaluate land opportunities based on risk-adjusted returns and employ a rigorous due diligence process to identify risks, which we then seek to mitigate.
We leverage our relationships with land owners, brokers, developers and financial institutions, and our history of purchasing land, to seek the “first look” at land acquisition opportunities or to evaluate opportunities before they are broadly marketed. We use a variety of transaction structures, including purchase and option contracts, to maximize our risk-adjusted return, with particular emphasis on reducing our risk, conserving our capital while accommodating the particular needs of each seller.
We combine our entitlement, land development and homebuilding expertise to increase the flexibility of our business, seek enhanced margins, control our lot deliveries and maximize returns. Additionally, we believe that the integration of the entitlement,
8
development and homebuilding process allows us to deliver communities that achieve a high level of customer satisfaction. Our entitlement expertise allows us to add value through the zoning and land planning process. Our land development entitlement expertise allows us to consider a broader range of land acquisition opportunities from which to seek superior risk-adjusted returns.
We selectively evaluate expansion opportunities in our existing markets as well as new markets that we believe have attractive long-term investment characteristics. These characteristics include, among others, demand for single-family housing that exceeds available supply, well regarded educational systems and institutions, high educational attainment levels, desirable transportation infrastructure, proximity to major trade corridors, positive employment trends, diverse employment bases and high barriers to the development of residential real estate, such as geographic or political factors.
OUR FINANCING STRATEGY
We intend to use debt and equity as part of our ongoing financing strategy, coupled with redeployment of cash flows from continuing operations. We intend to employ prudent levels of leverage to finance the acquisition and development of our lots and construction of our homes. We attempt to match the duration of our real estate assets with the duration of the capital that finances each asset.
Our indebtedness is primarily comprised of our 8.5% Senior Notes due 2017 (the "2017 Notes") and project-level secured acquisition, development and constructions loans. Substantially all of our project debt is guaranteed by UCP, LLC and UCP, Inc. Our board of directors considers a number of factors when evaluating our level of indebtedness and when making decisions regarding the incurrence of new indebtedness, including the purchase price of assets to be acquired with debt financing, the estimated market value of our assets, the expected asset's duration and the ability of particular assets, and our Company as a whole, to generate cash flow to cover the expected debt service. Though we intend to remain prudently capitalized, our charter does not contain a limitation on the amount of debt we may incur and our board of directors may change our target debt levels within the covenants and restrictions currently in place with our lenders at any time without the approval of our stockholders.
We intend to finance future acquisitions and developments with the most advantageous source of capital available to us at the time of the transaction, which may include a combination of common and preferred equity, secured and unsecured corporate-level debt, property-level debt and mortgage financing and other public, private or bank debt.
For a more detailed description of and financial information about our indebtedness, see Note 8, "Notes Payable and Senior Notes, Net" to our consolidated financial statements included elsewhere in this Annual Report on Form 10-K.
REGULATION AND ENVIRONMENTAL MATTERS
We are subject to various local, state, and federal statutes, ordinances, rules, and regulations concerning zoning, building design, construction, and similar matters, including local regulations which impose restrictive zoning and density requirements in order to limit the number of homes that can be built within the boundaries of a particular locality. In addition, we are subject to registration and filing requirements in connection with the construction, advertisement, and sale of our communities in certain states and localities in which we operate. We may also be subject to periodic delays or may be precluded entirely from developing communities due to building moratoriums that could be implemented in the future in the states in which we operate. Generally, such moratoriums relate to insufficient water or sewerage facilities or inadequate road capacity.
In addition, some state and local governments in markets where we operate have approved, and others may approve, slow-growth, or no-growth initiatives that could negatively affect the availability of land and building opportunities within those areas. Approval of these initiatives could adversely affect our ability to build and sell homes in the affected markets and/or could require the satisfaction of additional administrative and regulatory requirements, which could result in slowing the progress or increasing the costs of our homebuilding operations in these markets. Any such delays or costs could have a negative effect on our future revenues and earnings.
We are also subject to a variety of local, state, and federal laws and regulations concerning protection of health and the environment. The particular environmental laws which apply to any given community vary according to the community site, the site’s environmental conditions, and the present and former uses of the site. These environmental laws may result in delays, may cause us to incur substantial compliance, remediation, and/or other costs; and prohibit or severely restrict development and homebuilding activity.
9
Despite our past ability to obtain necessary permits and approvals for our communities, we anticipate that increasingly stringent requirements will be imposed on developers and homebuilders in the future. Although we cannot predict the effect of these requirements, they could result in time-consuming and expensive compliance programs and in substantial expenditures, which could cause delays and increase our cost of operations. In addition, our ability to obtain or renew permits or approvals and the continued effectiveness of permits already granted or approvals already obtained is dependent upon many factors, some of which are beyond our control, such as changes in policies, rules, and regulations and their interpretation and application.
SEASONALITY
The homebuilding industry generally exhibits seasonality. We have historically experienced, and in the future expect to continue to experience, variability in our operating results and capital needs on a quarterly basis. Although we enter into home sales contracts throughout the year, a significant portion of our sales activity takes place during the spring and summer, with the corresponding closings taking place during the fall and winter. Additionally, our capital needs are typically greater during the spring and summer when we are building homes for delivery later in the year. Accordingly, our revenue may fluctuate significantly on a quarterly basis, and we must maintain sufficient liquidity to meet short-term operating requirements. As a result of seasonal variation, our quarterly results of operations and financial position at the end of a particular quarter are not necessarily representative of the results we expect at year-end.
COMPETITION
The homebuilding and land development industry is highly competitive. We compete with numerous large national and regional homebuilding companies and with smaller local homebuilders and land developers for, among other things, home buyers, financing, desirable land parcels, raw materials and skilled management and labor resources. We also compete with sales of existing homes and, to a lesser extent, with the rental housing market. Our homes compete on the basis of design, quality, price, location and our reputation. In addition to home sales, we sell lots to third-party homebuilders. We compete for land buyers with other land owners. Our land holdings compete on the basis of quality, market positioning, location and price.
The homebuilding and land development industry has historically been subject to significant volatility. We may be at a competitive disadvantage with regard to certain of our national competitors whose operations are more geographically diversified than ours, as these competitors may be better able to withstand any future regional downturn in the housing market.
We compete directly with a number of national homebuilders who are larger than we are and may have greater financial and operational resources than we do. This may give our competitors an advantage in marketing their products, securing materials and labor at lower prices, purchasing land and allowing their homes to be delivered to customers more quickly and at more favorable prices. This competition could reduce our market share and limit our ability to expand our business.
EMPLOYEES
As of December 31, 2016, we had 203 employees consisting of 59 executive, management or administrative personnel, 96 construction personnel and 48 sales and marketing personnel. Although none of our employees are covered by collective bargaining agreements, certain of the subcontractors engaged by us are represented by labor unions or are subject to collective bargaining arrangements. We believe that we have good relations with our employees and subcontractors.
10
EXECUTIVE OFFICERS
The executive officers of UCP, Inc. are:
Name | Age | Position | ||
Dustin L. Bogue | 42 | President, Chief Executive Officer and Director | ||
James M. Pirrello | 58 | Chief Financial Officer, Chief Accounting Officer and Treasurer | ||
Dustin L. Bogue. Mr. Bogue has served as our President since 2008. Since our IPO in July of 2013, he has served as our President and Chief Executive Officer and as a member our board of directors. Mr. Bogue was involved with the formation of our predecessor, Union Community Partners, LLC in 2004 as the President and Managing Member until 2008. Mr. Bogue was instrumental in Union Community Partners, LLC’s acquisition and entitlement of several communities in Northern California. In 2008, Union Community Partners, LLC was acquired by PICO and its name was changed to UCP, LLC. Mr. Bogue was instrumental in creating our subsidiary, Benchmark Communities in 2010, with the goal of creating designing and delivering outstanding homes in communities with exceptional value and sustainability. Since Union Community Partners, LLC’s inception in 2004, Mr. Bogue has been principally responsible for developing the strategic direction of our Company and our operations. Prior to joining our Company, Mr. Bogue was the Vice President of Development and Sales at Landcastle Real Estate from 2001 to 2004. From 1999 to 2001, Mr. Bogue worked for Wellington Corporation of Northern California, a subsidiary of Triple Five National Development Company. At Wellington, Mr. Bogue was the Director of Land Acquisitions and Development, managing Wellington’s California real estate portfolio, including acquisition, disposition and development. Additionally, at Wellington, Mr. Bogue was actively involved in creating two technology start-ups; Bridgewater Ventures, an early-stage venture capital company, and Cenatek, Inc., a solid-state storage device company where Mr. Bogue served as an executive vice president.
James M. Pirrello. Mr. Pirrello serves as our Chief Financial Officer, Chief Accounting Officer and Treasurer; he has served in these roles since January 2016. Mr. Pirrello has over 30 years of homebuilding experience in both senior financial and senior operational roles, including chief operating officer, chief financial officer, and division president. Mr. Pirrello most recently served as President and Founder of American New Homes Group. Over his career he has held senior financial positions at numerous homebuilder and real estate development firms including BCB Homes, Builder Acquisition Corp., First Homebuilders of Florida, The Longford Group, and The Fortress Group and NVR. During his career, he has negotiated numerous debt and equity capital market financings, and over 20 merger and acquisition transactions. Mr. Pirrello earned MBAs, from both Columbia University and the University of California, Berkeley, along with an undergraduate degree in accounting from Juniata College.
OUR STRUCTURE
The amended and restated certificate of incorporation of UCP, Inc. authorizes two classes of common stock: Class A common stock and Class B common stock, par value $0.01 per share (“Class B common stock”). Shares of Class A common stock represent 100% of the economic rights of the holders of all classes of UCP, Inc.'s common stock. Shares of Class B common stock, which are held exclusively by PICO, are not entitled to any dividends paid by, or rights upon liquidation of, UCP, Inc. PICO holds 100 shares of Class B common stock of UCP, Inc., providing PICO with no economic rights but entitling PICO, without regard to the number of shares of Class B common stock held by PICO, to one vote on matters presented to stockholders of UCP, Inc. for each UCP, LLC Series A Unit (as defined below) held by PICO. Holders of the Company’s Class A common stock and Class B common stock will vote together as a single class on all matters presented to the Company’s stockholders for their vote or approval, except as otherwise required by applicable law. As of December 31, 2016, PICO held 10,593,000 UCP, LLC Series A Units and 100 shares of Class B common stock, which provided PICO with 56.8% of the aggregate voting power of UCP, Inc.'s outstanding Class A common stock and Class B common stock, which equals PICO’s economic interest in the Company. PICO effectively has control over the outcome of votes on all matters requiring approval by the Company’s stockholders. As described in more detail below, each Series A Unit of UCP, LLC can be exchanged for one share of Class A common stock.
The Company's charter provides that its board of directors has the authority, without action by the stockholders, to designate and issue up to 50,000,000 shares of preferred stock in one or more classes or series and to fix for each class or series the powers, rights, preferences and privileges of each series of preferred stock, including dividend rights, conversion rights, voting rights, terms of redemption, liquidation preferences and the number of shares constituting any class or series, which may be greater than the rights of the holders of the Class A common stock or Class B common stock.
11
As of December 31, 2016, UCP, Inc. held a 43.2% interest in UCP, LLC, through its ownership of UCP, LLC Series B Units (as defined below), and PICO held the remaining 56.8% interest in UCP, LLC through its ownership of UCP, LLC Series A Units. UCP, Inc. is a holding company, and its sole material asset is its equity interest in UCP, LLC.
In connection with the IPO, UCP, LLC's Amended and Restated Limited Liability Company Operating Agreement (the "Operating Agreement") was amended and restated to, among other things, designate UCP, Inc. as the sole managing member of UCP, LLC and establish a new series of units (“UCP, LLC Series B Units”), which are held solely by UCP, Inc., and reclassify PICO's units into 10,593,000 UCP, LLC Series A Units (the “UCP, LLC Series A Units”), which are held solely by PICO (and its permitted transferees). UCP, Inc. purchased 7,750,000 UCP, LLC Series B Units through its investment in UCP, LLC with the net proceeds from the IPO. The UCP, LLC Series B Units rank on parity with the UCP, LLC Series A Units as to distribution rights and rights upon liquidation, winding up or dissolution. Subsequent to the IPO and related transactions, as the sole managing member of UCP, LLC, UCP, Inc. operates and controls all of the business and affairs and consolidates the financial results of UCP, LLC and its subsidiaries.
Tax Distribution
Pursuant to the Operating Agreement, UCP, Inc. has the right to determine when distributions (other than tax distributions) will be made to the members of UCP, LLC and the amount of any such distributions. If UCP, Inc. authorizes a distribution, such distribution generally will be made to the members of UCP, LLC pro rata in accordance with their respective percentage interests. During the years ended December 31, 2016 and December 31, 2015, UCP, LLC made distributions of $4.8 million and $1.0 million, respectively, to PICO toward its tax liability as required by the Operating Agreement and a pro rata distribution of $3.7 million and $0.7 million, respectively, to UCP, Inc. There were no other distributions by UCP, LLC for the year ended December 31, 2016.
The holders of limited liability company interests in UCP, LLC, including UCP, Inc., generally have to include for purposes of calculating their U.S. federal, state and local income taxes their allocable share of any taxable income of UCP, LLC. In general, taxable income of UCP, LLC will be allocated to PICO and UCP, Inc. on a pro rata basis in accordance with their respective percentage interests. However, as a result of certain taxable “built-in gains” in the assets of UCP, LLC that existed at the time of the IPO which, by statute, must be allocated solely to PICO, UCP, Inc. is expected at times to be allocated a disproportionately smaller amount of net taxable income and PICO is expected to be allocated a disproportionately larger amount of net taxable income. UCP, LLC is obligated, subject to available cash, applicable law and contractual restrictions (including limitations imposed by any financing agreements), to make cash distributions, which we refer to as “tax distributions,” based on certain assumptions (including a combined federal, state and local tax rate of 41% (or such other rate determined by UCP, Inc. to be the highest marginal effective rate of federal, state and local income tax applicable to corporations doing business in California or such other jurisdiction in which UCP, LLC is doing business)), to its members (including UCP, Inc.). Generally, these tax distributions will be pro rata in accordance with the respective percentage interests of PICO and UCP, Inc. and will be in an amount sufficient to allow PICO and UCP, Inc. to pay taxes on their allocable shares of the taxable income of UCP, LLC. If, however, there is insufficient cash to make pro rata tax distributions to PICO and UCP, Inc. in an amount that would allow PICO and UCP, Inc. to pay taxes on their allocable shares of the taxable income of UCP, LLC, PICO and UCP, Inc. would receive distributions in proportion to their respective tax liabilities based upon their allocable shares of UCP, LLC’s taxable income. It is expected in that case that PICO would receive a larger proportional distribution than UCP, Inc. would receive and, in some cases (for instance if all of the taxable income is allocable to PICO), UCP, Inc. could receive no tax distributions. In any case in which UCP, Inc. received a smaller proportional distribution than PICO, UCP, LLC would have an obligation to make future distributions to UCP, Inc. to eliminate the difference as soon as funds become available and UCP, LLC would be required to pay interest to UCP, Inc. at a prevailing market rate on such difference.
As a result of the potential differences in the amount of net taxable income allocable to UCP, Inc. and to PICO described above, it is expected that UCP, Inc. will receive tax distributions significantly in excess of UCP, Inc.’s tax liabilities and obligations to make payments under the tax receivable agreement (as described below). To the extent, as currently expected, UCP, Inc. does not distribute such cash balances as dividends on its Class A common stock and instead, for example, holds such cash balances or lends them to UCP, LLC, PICO would benefit from any value attributable to such accumulated cash balances as a result of its ownership of our Class A common stock following an exchange of its UCP, LLC Series A Units (including any exchange upon an acquisition of UCP, Inc.).
On June 6, 2016, our Board of Directors authorized the repurchase of up to $5.0 million of the Company’s Class A common stock between June 7, 2016 and June 1, 2018 (the “Stock Repurchase Program”). As part of the Company's Stock Repurchase Program, the Company used $1.2 million of cash received through these tax distributions to repurchase stock. See Note 2, "Summary of Significant Accounting Policies--Stock Repurchase Program" and Note 10, “Equity--Stock Repurchase Program” to the consolidated financial statements included elsewhere in this Annual Report on Form 10-K for additional information regarding the Stock Repurchase Program.
12
The diagram below depicts our organizational structure as of December 31, 2016:
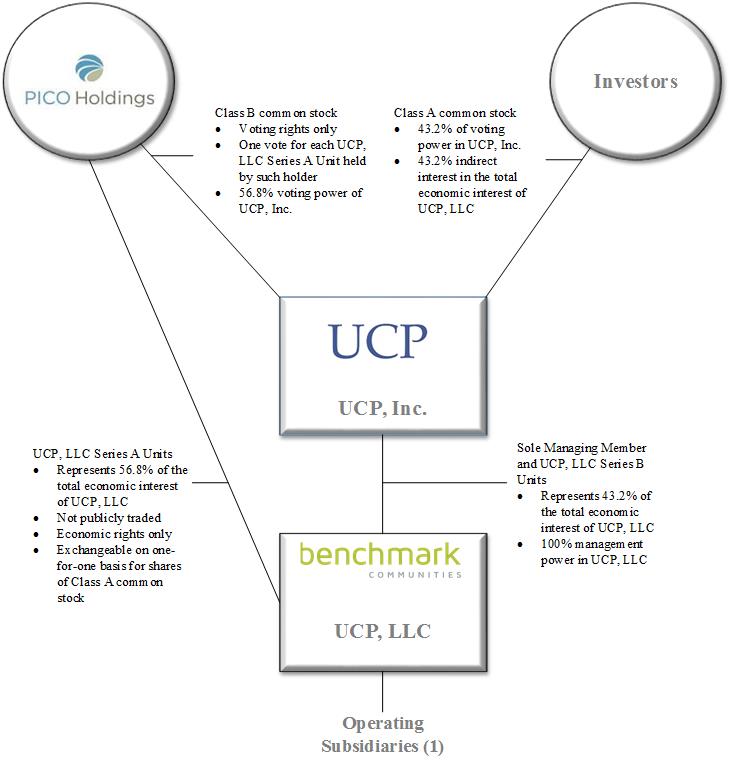
(1) | We carry out our business generally through a number of operating subsidiaries and project-specific subsidiaries that are directly or indirectly wholly owned by UCP, LLC. Benchmark Communities, LLC, a Delaware limited liability company, is our wholly owned general contractor subsidiary in all states except North Carolina. Benchmark Builders North Carolina, LLC, a Delaware limited liability company, is our wholly owned general contractor subsidiary in North Carolina. BMC Realty Advisors, Inc., a California corporation, is our wholly-owned subsidiary through which we conduct real estate brokerage activities relating to our business in California and Washington. Builders BMC, Inc., a Delaware corporation, is our wholly-owned subsidiary through which we conduct real estate brokerage activities relating to our business in North Carolina. BMCH Tennessee, LLC, a Delaware limited liability company, is our wholly-owned subsidiary through which we conduct real estate brokerage activities relating to our business in Tennessee. Benchmark Communities, LLC, a Delaware limited liability company, is our wholly-owned subsidiary through which we conduct real estate brokerage activities relating to our business in South Carolina. |
13
Exchange Agreement
In connection with the IPO, UCP, Inc. entered into an Exchange Agreement dated July 23, 2013 by and among UCP, Inc., UCP, LLC and PICO (the "Exchange Agreement"), pursuant to which PICO (and its permitted transferees) have the right to cause UCP, Inc. to exchange PICO's UCP, LLC Series A Units for shares of UCP, Inc. Class A common stock on a one-for-one basis, subject to equitable adjustments for stock splits, stock dividends, stock repurchases and reclassifications. As of December 31, 2016, giving effect to the Class A common stock that the Company would issue if PICO were to elect to exchange all of its UCP, LLC Series A Units for shares of Class A common stock, the Company would have 18,635,834 shares of Class A common stock outstanding. Any UCP, LLC Series A Units being exchanged will be reclassified as UCP, LLC Series B Units in connection with such exchange.
Exchanges by PICO of its UCP, LLC Series A Units for shares of UCP, Inc. Class A common stock are expected to result, with respect to UCP, Inc., in increases in the tax basis of the assets of UCP, LLC that otherwise would not have been available. These increases in tax basis may reduce the amount of tax that UCP, Inc. would otherwise be required to pay in the future. These increases in tax basis may also decrease gains (or increase losses) on future dispositions of certain assets to the extent tax basis is allocated to those assets.
Tax Receivable Agreement
UCP, Inc., UCP, LLC and PICO are party to a Tax Receivable Agreement dated July 23, 2013 (the "TRA"). When PICO sells or exchanges its UCP, LLC Series A Units for shares of the Company’s Class A common stock, such a sale or exchange by PICO would result in an adjustment to the tax basis of the assets owned by UCP, LLC at the time of an exchange. An increase in tax basis is expected to increase the Company's depreciation and amortization income tax deductions and create other tax benefits and therefore may reduce the amount of income tax that the Company would otherwise be required to pay in the future. Under the TRA, the Company generally is required to pay to PICO 85% of the applicable cash savings in U.S. federal and state income tax that the Company actually realizes (or is deemed to realize in certain circumstances) as a result of sales or exchanges of the UCP, LLC Series A Units held by PICO for shares of Class A common stock, leaving the Company with 15% of the benefits of the tax savings. Cash savings in income tax will be computed by comparing the Company’s actual income tax liability to the amount of income taxes that the Company would have been required to pay had there been no increase in the tax basis of the tangible and intangible assets of UCP, LLC as a result of the exchanges. If the Company would not have reported taxable income in a given year had there been no increase in the tax basis of assets as a result of the exchanges, no payment under the TRA for that taxable year is required because no tax savings will have been realized.
As of December 31, 2016, PICO has not exchanged any of its UCP, LLC Series A Units. Estimating the amount of future payments to be made under the TRA cannot be done reliably at this time because any increase in tax basis, as well as the amount and timing of any payments, will vary depending on a number of factors, including:
• | the timing of any exchanges of UCP, LLC Series A Units for shares of the Company’s Class A common stock by PICO, as the increase in any tax deductions will vary depending on the allocation of fair market value to the assets of UCP, LLC at the time of any such exchanges, and this value allocation may fluctuate over time; |
• | the price of the Company’s Class A common stock at the time of any exchanges of UCP, LLC Series A Units for shares of the Company’s Class A common stock (since the increase in the Company’s share of the basis in the assets of UCP, LLC, as well as the corresponding increase in any tax deductions, will be related to the price of the Company’s Class A common stock at the time of any such exchanges); |
• | the tax rates in effect at the time the Company uses the increased amortization and depreciation deductions or realize other tax benefits; and |
• | the amount, character and timing of the Company’s taxable income. |
The effects of the TRA on the Company’s consolidated balance sheet if PICO elects to exchange all or a portion of its UCP, LLC Series A Units for the Company’s Class A common stock are expected to be as follows:
• | an increase in deferred tax assets for the estimated income tax effects of the increase in the tax basis of the assets owned by UCP, LLC based on enacted federal, state and local income tax rates at the date of the relevant transaction. To the extent the Company believes that it is more likely than not that the Company will not realize the full tax benefit represented by the deferred tax asset, the Company will reduce the deferred tax asset with a valuation allowance; |
• | the Company may record 85% of the applicable cash tax savings in U.S. federal and state income taxes resulting from the increase in the tax basis of the UCP, LLC Series A Units and certain other tax benefits related to entering into the TRA, including tax benefits attributable to payments under the TRA as an increase in a payable due to PICO; and |
14
• | an increase to additional paid-in capital equal to the difference between the increase in deferred tax assets and the increase in the liability due to PICO. |
The Company has the right to terminate the TRA at any time. In addition, the TRA will terminate early if the Company breaches obligations under the TRA or upon certain mergers, asset sales, other forms of business combinations or other changes of control. In either case, the Company’s payment obligations under the TRA would be accelerated and would become due and payable based on certain assumptions, including that (a) all the UCP, LLC Series A Units are deemed exchanged for their fair value, (b) the Company would have sufficient taxable income to fully utilize the deductions arising from the increased tax deductions and tax basis and (c) the subsidiaries of UCP, LLC will sell certain non-amortizable assets (and realize certain related tax benefits) no later than a specified date. In each of these instances, the Company would be required to make an immediate payment to PICO equal to the present value of the anticipated future tax benefits (discounted over the applicable amortization and depreciation periods for the assets the tax bases of which are stepped up (which could be as long as fifteen years in respect of intangibles and goodwill) at a discount rate equal to the 30-day London Interbank Offered Rate ("LIBOR") plus 100 basis points). The benefits would be payable even though, in certain circumstances, no UCP, LLC Series A Units are actually exchanged at the time of the accelerated payment under the TRA, thereby resulting in no corresponding tax basis step up at the time of such accelerated payment under the TRA.
Investor Rights Agreement and Transition Services Agreement
Pursuant to an Investor Rights Agreement dated July 23, 2013 (the "Investor Rights Agreement"), PICO has the right to nominate two individuals for election to UCP, Inc.'s board of directors for as long as PICO owns 25% or more of the combined voting power of UCP, Inc.'s outstanding Class A and Class B common stock and one individual for as long as it owns at least 10% (in each case, excluding shares of any of UCP, Inc.'s common stock that are subject to issuance upon the exercise or exchange of rights of conversion or any options, warrants or other rights to acquire shares). However, the Investor Rights Agreement does not entitle PICO to nominate individuals for election to UCP, Inc.'s board of directors if their election would result in PICO nominees comprising more than two of UCP, Inc.'s directors (for as long as PICO owns 25% or more of the combined voting power of UCP, Inc.'s outstanding Class A and Class B common stock) or one of UCP, Inc.'s directors (for as long as PICO owns at least 10% of the combined voting power of UCP, Inc.'s outstanding Class A and Class B common stock).
UCP also entered into a Transition Services Agreement ("TSA"), dated July 23, 2013 with PICO, pursuant to which PICO provided UCP, Inc. with certain accounting, human resources and information technology services. This agreement was completed on July 31, 2015, and PICO no longer provides such services to UCP, Inc.
CORPORATE INFORMATION
Our principal executive offices are located at 99 Almaden Boulevard, Suite 400, San Jose, California 95113. Our telephone number is (408) 207-9499. Our website is located at www.unioncommunityllc.com. Our homebuilding subsidiary, Benchmark Communities, also maintains an Internet website at www.benchmarkcommunities.com. The information that is found on or accessible through our websites is not incorporated into, and does not form a part of this Annual Report on Form 10-K or any other report or document that we file with or furnish to the Securities and Exchange Commission (the "SEC"). We have included our website addresses in this Annual Report on Form 10-K as an inactive textual reference and do not intend it to be an active link to our websites.
We make available on our website, free of charge, our Annual Report on Form 10-K, Quarterly Reports on Form 10-Q, Current Reports on Form 8-K and amendments to those reports filed or furnished pursuant to Section 13(a) or 15(d) of the Securities and Exchange Act of 1934, as amended (the "Exchange Act") as soon as reasonably practicable after we electronically file such material with, or furnish it to, the SEC. We also make our Code of Business Conduct and Ethics for our directors, officers and employees available on our website on the Corporate Governance page under the Investor Relations section of our website.
This Annual Report on Form 10-K and other reports filed with the SEC can be read or copied at the SEC's Public Reference Room at 100 F Street, NE, Washington, D.C. 20549. Information on the operation of the Public Reference Room can be obtained by calling the SEC at 1-800-SEC-0330. The SEC maintains a website that contains reports, proxy and information statements, and other information regarding issuers that file electronically with the SEC; the website address is www.sec.gov.
15
ITEM 1A. RISK FACTORS
Set forth below are the risks that we believe are material to our investors. You should carefully consider the following risks and the other matters in this Annual Report on Form 10-K in evaluating our business and prospects. The occurrence of any of the following risks could materially adversely impact our financial condition, results of operations, cash flow, liquidity, the market price of our Class A common stock and our ability to achieve our objectives, which in turn could cause our stockholders to lose all or part of their investment. Some statements in this report, including statements in the following risk factors constitute forward-looking statements. Please refer to the section entitled “Special Note about Forward-Looking Statements” elsewhere in this Annual Report on Form 10-K.
RISKS RELATED TO OUR BUSINESS
Our long-term growth depends, in part, upon our ability to successfully identify and acquire desirable land parcels for residential buildout, which may be limited due to a variety of factors.
Our future growth depends, in part, upon our ability to successfully identify and acquire attractive land parcels in geographic areas in which we operate for development of single-family homes at reasonable prices, either by ourselves, through Benchmark Communities, or by our third-party homebuilder customers. Our ability to acquire land parcels for new single-family homes may be adversely affected by changes in the general availability of land parcels, the willingness of land sellers to sell land parcels at reasonable prices, competition for available land parcels, availability of financing to acquire land parcels, zoning and other market conditions. If the supply of land parcels appropriate for development of single-family homes is limited because of these factors, or for any other reason, our ability to grow could be significantly limited, and our revenue and gross margin could decline. To the extent that we are unable to purchase land parcels or enter into new contracts or options for the purchase of land parcels at reasonable prices, our revenue and results of operations could be negatively impacted.
Our industry is cyclical and adverse changes in general and local economic conditions could reduce the demand for homes and, as a result, could have a material adverse effect on us.
The residential homebuilding industry is cyclical and is highly sensitive to changes in general economic conditions, such as levels of employment, consumer sentiment and income, availability and cost of financing for acquisitions, construction and mortgages, interest rate levels, inflation and demand for housing. The health of the residential homebuilding industry may also be significantly affected by “shadow inventory” levels during recessionary and recovery periods.
“Shadow inventory” refers to the number of homes with mortgages that are in some form of distress but that have not yet been listed for sale. Shadow inventory can occur when lenders put properties that have been foreclosed or forfeited to lenders or available for short sale (i.e. potentially available for sale for an amount that is less than the unpaid principal balance on a related mortgage loan) on the market gradually, rather than all at once, or delay the foreclosure process. A significant shadow inventory in our markets could, were it to be released, adversely impact home and land prices and demand for our homes and land, which would have a material adverse effect on our business, prospects, liquidity, financial condition and results of operations. In addition, an important segment of our end-purchaser and customer base consists of first-time and second-time “move-up” buyers, the latter often purchase homes subject to contingencies related to the sale of their existing homes. The difficulties facing these buyers in selling their homes during recessionary periods may adversely affect our sales. Moreover, during such periods, we may need to reduce our sales prices and offer greater incentives to buyers to compete for sales, and that may result in reduced gross margins.
Our long-term growth depends, in part, upon our ability to acquire undeveloped land suitable for residential homebuilding at reasonable prices.
The availability of partially finished developed lots and undeveloped land for purchase at reasonable prices depends on a number of factors outside our control, including land availability in general, competition with other homebuilders and land buyers, inflation in land prices, zoning, allowable housing density, the ability to obtain building permits and other regulatory requirements. Should suitable lots or land become less available, the number of homes we may be able to build and sell could be reduced, and the cost of land could be increased, perhaps substantially, which could adversely impact us. As competition for suitable land increases, the cost of acquiring partially finished developed lots and undeveloped lots and the cost of developing owned land could rise and the availability of suitable land at acceptable prices may decline, which could adversely impact us. The availability of suitable land assets could also affect the success of our land acquisition strategy, which may impact our ability to increase the number of actively selling communities, grow our revenue and gross margins, and achieve or maintain profitability. Additionally, developing undeveloped land
16
is capital intensive and time consuming. It is possible that we may develop land based upon forecasts and assumptions that prove to be inaccurate, resulting in projects that are not economically viable.
Because of the seasonal nature of our business our quarterly operating results fluctuate.
We generally experience seasonal fluctuations in our quarterly operating results and capital requirements that can have a material impact on our results and our consolidated financial statements. We typically experience the highest new home order activity in spring and summer, although this activity is also highly dependent on the number of active selling communities, the timing of new community openings and other market factors. Since it typically takes four to six months to construct a new home, we deliver more homes in the second half of the year as spring and summer home orders convert to home deliveries. Because of this seasonality, home starts, construction costs and related cash outflows have historically been highest in the second and third quarters, and the majority of cash receipts from home deliveries occur during the second half of the year. We expect this seasonal pattern to continue over the long‑term, although it may be affected by volatility in the homebuilding industry. In a recovering housing market, we expect the traditional seasonality and its impact on our results of operations would become more pronounced. This seasonality requires us to finance our construction activities significantly in advance of the receipt of sales proceeds. Accordingly, there is a risk that we will invest significant amounts of capital in the acquisition and development of land and construction of homes that we do not sell at anticipated pricing levels or within anticipated time frames. If, due to market conditions, construction delays or other causes we do not complete home sales at anticipated pricing levels or within anticipated time frames, our liquidity, financial condition and results of operations would be adversely affected.
If the market value of our land inventory decreases, our results of operations could be adversely affected by impairments and write-downs.
The market value of our land and housing inventories depends on market conditions. We acquire land for expansion into new markets and for replacement of land inventory and expansion within our current markets. There is a risk that the value of the land owned by us may decline after purchase. The valuation of property is inherently subjective and based on the individual characteristics of each property. We may have acquired options on or bought and developed land at a cost we will not be able to recover fully or on which we cannot build and sell homes profitably. In addition, our deposits for lots controlled under purchase, option or similar contracts may be put at risk.
Factors such as changes in regulatory requirements and applicable laws (including in relation to building regulations, taxation and planning), political conditions, the condition of financial markets, both local and national economic conditions, the financial condition of customers, potentially adverse tax consequences, and interest and inflation rate fluctuations subject land valuations to uncertainty. Moreover, our valuations are made on the basis of assumptions, including assumptions relating to economic conditions and demographics that may prove to be inaccurate. If housing demand fails to meet our expectations when we acquired our inventory, our profitability may be adversely affected and we may not be able to recover our costs when we sell homes that we build or land that we own.
We regularly review the value of our land holdings and continue to review our holdings on a periodic basis. Material write-downs and impairments in the value of our inventory may be required, and we may in the future sell land or homes at a loss, which could adversely affect our results of operations and financial condition. See Note 2, “Summary of Significant Accounting Policies” and Note 9, "Fair Value Disclosures" to the consolidated financial statements for further discussion on impairment and estimated fair values of real estate inventories included elsewhere in this report.
The homebuilding industry is highly competitive, and if our competitors are more successful or offer better value to our customers our business could decline.
We operate in a very competitive environment which is characterized by competition from a number of other homebuilders and land developers in each of the markets in which we operate. Additionally, there are relatively low barriers to entry into our business and new competitors arise from time to time. We compete with numerous large national and regional homebuilding companies and with smaller local homebuilders and land developers for, among other things, home buyers, desirable land parcels, financing, raw materials and skilled management and labor resources. Our competitors may develop land and construct housing units that are superior or substantially similar to our products, which could make our products less attractive to consumers.
We may be at a competitive disadvantage with regard to certain of our large national and regional homebuilding competitors whose operations are more geographically diversified than ours, as these competitors may be better able to withstand any future regional downturn in the housing market. Many of these competitors have longer operating histories and greater financial and operational resources than we do. Additionally, many of these competitors also have longstanding relationships with subcontractors
17
and suppliers in the markets in which we operate. This may give our competitors an advantage in marketing their products, securing materials and labor at lower prices and allowing their homes to be delivered to customers more quickly and at more favorable prices. This competition could reduce our market share and limit our ability to expand our business.
Increased competition could hurt our business, as it could prevent us from acquiring attractive land parcels on which to build homes or make such acquisitions more expensive, adversely affect our market share and cause us to increase our selling incentives and reduce our prices. An oversupply of homes available for sale or discounting of home prices could adversely affect pricing for homes in the markets in which we operate. Oversupply and price discounting can be exacerbated by supply from the resale, or “previously owned,” home market, with which we also compete. Oversupply and price discounting have periodically adversely affected certain markets, and it is possible that our markets will be adversely affected by these factors in the future. If we are unable to compete effectively in our markets, our business could decline disproportionately to our competitors, and our results of operations and financial condition could be adversely affected.
If home buyers are not able to obtain suitable mortgage financing, due to more stringent lending standards, rising interest rates, changes in regulation, reduced investor demand for mortgage loans and mortgage backed securities, changes in the relationship between Fannie Mae and Freddie Mac and the federal government or other reasons, our results of operations may decline.
A majority of home buyers finance their home purchases through lenders that provide mortgage financing. The availability of mortgage financing may be constrained, due in part to lower mortgage valuations on properties, various regulatory changes and lower risk appetite by lenders, with many lenders requiring increased levels of financial qualification, lending at lower multiples of income and requiring larger down payments. First-time home buyers are generally more affected by the availability of mortgage financing than other potential home buyers. These buyers are a key source of demand for new homes. A limited availability of home mortgage financing may adversely affect the volume of our home and land sales and the sales prices we achieve.
Additionally, housing demand is adversely affected by reduced availability of mortgage financing and factors that increase the upfront or monthly cost of financing a home, such as increases in interest rates, insurance premiums or limitations on mortgage interest deductibility. Any decrease in the willingness and ability of lenders to make home mortgage loans, the tightening of lending standards and the reduction in the types of financing products available, will make it more difficult for home buyers to obtain acceptable financing. Any substantial increase in mortgage interest rates or unavailability of mortgage financing may adversely affect the ability of prospective first-time and move-up home buyers to obtain financing for our homes, as well as adversely affect the ability of prospective move-up home buyers to sell their current homes. The housing industry is benefiting from the current low interest rate environment, which has allowed many home buyers to obtain mortgage financing with relatively low interest rates as compared to long-term historical averages. While the timing of any increase in interest rates is uncertain, it is widely expected that interest rates will increase over time, and any such increase will make mortgage financing more expensive and adversely affect the ability of home buyers to purchase our homes. The recent disruptions in the credit markets and the curtailed availability of mortgage financing has adversely affected, and is expected to continue to adversely affect, our business, prospects, liquidity, financial condition, results of operations and cash flows as compared to prior periods.
Beginning in 2008, the mortgage lending industry has experienced significant instability, beginning with increased defaults on sub-prime loans and other non-conforming loans and compounded by expectations of increasing interest payment requirements and further defaults. This in turn resulted in a decline in the market value of many mortgage loans and related securities. Lenders, regulators and others questioned the adequacy of lending standards and other credit requirements for several loan products and programs. Credit requirements have tightened, and investor demand for mortgage loans and mortgage-backed securities has declined. The deterioration in credit quality during the economic downturn caused almost all lenders to stop offering sub-prime mortgages and most other loan products that were not eligible for sale to Fannie Mae or Freddie Mac or loans that did not meet Federal Housing Administration and Veterans Administration requirements. Fewer loan products, tighter loan qualifications and a reduced willingness of lenders to make loans may continue to make it more difficult for certain buyers to finance the purchase of our homes.
These factors may reduce the pool of qualified home buyers and make it more difficult to sell to first-time and move-up buyers who have historically made up a substantial part of our homebuilding customers.
The liquidity provided by Fannie Mae and Freddie Mac to the mortgage industry has been very important to the housing market. These entities have required substantial injections of capital from the federal government and may require additional government support in the future. Several federal government officials have proposed changing the nature of the relationship between Fannie Mae and Freddie Mac and the federal government and even nationalizing or eliminating these entities entirely. If Fannie Mae and Freddie Mac were dissolved or if the federal government determined to stop providing liquidity support to the mortgage market, there would
18
be a reduction in the availability of the financing provided by these institutions. Any such reduction would likely have an adverse effect on interest rates, mortgage availability and our sales of new homes.
If suitable mortgage financing is not available to home buyers generally, our home buyers may not be able to sell their existing homes in order to buy a new home from us, which would adversely affect our results of operations.
In each of our markets, decreases in the availability of credit and increases in the cost of credit adversely affect the ability of home buyers to obtain or service mortgage debt. Even if potential home buyers do not themselves need mortgage financing, where potential home buyers must sell their existing homes in order to buy a new home, increases in mortgage costs, lack of availability of mortgages and/or regulatory changes could prevent the buyers of potential home buyers’ existing homes from obtaining a mortgage, which would result in our potential customers’ inability to buy a new home from us. Similar risks apply to those buyers who are awaiting delivery of their homes and are currently in backlog. Our success depends, in part, on the ability of potential home buyers to obtain mortgages for the purchase of homes. If our customers (or potential buyers of our customers’ existing homes) cannot obtain suitable financing, our sales and results of operations could be adversely affected.
Our geographic concentration could materially and adversely affect us if the homebuilding industry in our current markets should experience a decline.
Our business strategy is focused on the acquisition of suitable land and the design, construction and sale of single-family homes in residential subdivisions, including planned communities, in Northern and Southern California, Washington State, North Carolina, South Carolina and Tennessee. In California, we principally operate in the Central Valley area, the Monterey Bay area, the South San Francisco Bay area, and the Los Angeles area; in Washington State, we operate in the Puget Sound area. In North Carolina, we principally operate in the Charlotte area. In South Carolina, we principally operate in the Myrtle Beach area, and in Tennessee, we principally operate in the Nashville area. Because our operations are concentrated in these areas, a prolonged economic downturn in one or more of these areas, particularly within California, could have a material adverse effect on our business, prospects, liquidity, financial condition and results of operations, and a disproportionately greater impact on us than other homebuilders with more diversified operations.
Any limitation on, or reduction or elimination of, tax benefits associated with owning a home would have an adverse effect upon the demand for land and homes for residential development, which could adversely affect our business.
Changes in federal income tax laws may affect demand for new homes and land suitable for residential development. Current tax laws generally permit significant expenses associated with owning a home, primarily mortgage interest expense and real estate taxes, to be deducted for the purpose of calculating an individual’s federal and, in many cases, state taxable income. Various proposals have been publicly discussed to limit mortgage interest deductions and to limit the exclusion of gain from the sale of a principal residence. If the federal government or a state government changes or further changes its income tax laws, as some lawmakers have proposed, by eliminating, limiting or substantially reducing these income tax benefits, without offsetting provisions, the after-tax cost of owning a new home would increase for many of our potential customers. Enactment of any such proposal may have an adverse effect on the homebuilding industry in general and our business and profits in particular, as the loss or reduction of homeowner tax deductions could decrease the demand for new homes and land suitable for residential development.
Difficulty in obtaining sufficient capital could result in an inability to acquire land for development or increased costs and delays in the completion of development projects.
The homebuilding and land development industry is capital-intensive and requires significant up front expenditures to acquire land parcels and begin development. In addition, if housing markets are not favorable or permitting or development takes longer than anticipated, we may be required to hold our investments in land for extended periods of time. If internally generated funds are not sufficient, we may seek additional capital in the form of equity or debt financing from a variety of potential sources, including additional bank financings and/or securities offerings. The availability of borrowed funds, especially for land acquisition and construction financing, may be greatly reduced nationally, and the lending community may require increased amounts of equity to be invested in a project by borrowers in connection with both new loans and the extension of existing loans. The credit and capital markets have in the recent past experienced significant volatility. If we are required to seek additional financing to fund our operations, continued volatility in these markets may restrict our flexibility to access such financing. If we are not successful in obtaining sufficient capital to fund our planned capital and other expenditures, we may be unable to acquire land for development or to develop housing.
Additionally, if we cannot obtain funds required for the purchase of land under our purchase or option contracts, we may incur contractual penalties and fees. Any difficulty in obtaining sufficient capital for planned development expenditures could also cause
19
project delays and any such delay could result in cost increases. Any one or more of the foregoing events could have a material adverse effect on our business, prospects, liquidity, financial condition and results of operations.
We face potentially substantial risk with respect to our land and lot inventory.
We intend to acquire land parcels for replacement and expansion of land inventory within our current and any new markets we choose to enter. The risks inherent in purchasing and developing land parcels increase as consumer demand for housing decreases. As a result, we may buy and develop land parcels on which homes cannot be profitably built and sold. The market value of land parcels, building lots and housing inventories can fluctuate significantly as a result of changing market conditions, and the measures we employ to manage inventory risk may not be adequate to insulate our operations from a severe drop in inventory values. When market conditions are such that land values are depreciating, previously entered into option agreements may become less desirable, at which time we may elect to forego deposits, option costs and pre‑acquisition costs and terminate the agreements. Land parcels, building lots and housing inventories are illiquid assets and we may not be able to dispose of them efficiently or at all if we are in financial distress. In addition, inventory carrying costs can be significant and can result in losses in a poorly performing project or market. In the event of significant changes in economic or market conditions, we may have to sell homes at significantly lower margins or at a loss, if we are able to sell them at all.
Because real estate investments are relatively illiquid, our ability to promptly sell one or more properties for reasonable prices in response to changing economic, financial and investment conditions may be limited and we may be forced to hold non‑income producing properties for extended periods of time.
Real estate investments are relatively difficult to sell quickly. As a result, our ability to promptly sell one or more properties in response to changing economic, financial and investment conditions is limited and we may be forced to hold non‑income producing assets for an extended period of time. We cannot predict whether we will be able to sell any property for the price or on the terms that we set or whether any price or other terms offered by a prospective purchaser would be acceptable to us. We also cannot predict the length of time needed to find a willing purchaser and to close the sale of a property.
Adverse weather and geological conditions may increase costs, cause project delays and reduce consumer demand for housing, all of which could materially and adversely affect us.
As a homebuilder and land developer, we are subject to the risks associated with numerous weather-related and geologic events which are beyond our control. These weather-related and geologic events include but are not limited to droughts, floods, wildfires, landslides, hurricanes, tornadoes, soil subsidence and earthquakes. The occurrence of any of these events could damage our land parcels and projects, cause delays in completion of our projects, reduce consumer demand for housing, and cause shortages and price increases in labor or raw materials, any of which could affect our sales and profitability. For example, our California markets are in areas which have historically experienced significant earthquake activity and seasonal wildfires. Other unique meteorological and geographic conditions exist in all of the markets in which we operate.
In addition to directly damaging our land or projects, earthquakes, wildfires or other natural events could damage roads and highways providing access to those assets or affect the desirability of our land or projects, thereby adversely affecting our ability to market homes or sell land in those areas and possibly increasing the costs of homebuilding completion.
There are some risks of loss for which we may be unable to purchase insurance coverage. For example, losses associated with landslides, earthquakes and other geologic events may not be insurable and other losses, such as those arising from terrorism, may not be economically insurable. A sizeable uninsured loss could materially and adversely affect our business, prospects, liquidity, financial condition and results of operations.
Continued acquisition activity could expose us to additional risks and future results will suffer if we do not effectively manage our expanded operations.
We may continue to expand our operations through acquisitions and other strategic transactions. In connection with any such transactions, we may be required to integrate geographically diverse operations, additional employees, and different information technology and management systems, which may involve complex challenges. Our future success will depend, in part, upon our ability to: manage our expansion opportunities; integrate new operations into our existing business in an efficient and timely manner; successfully monitor our operations, costs and regulatory compliance; and develop and maintain other necessary systems, processes and internal controls. We cannot assure you that our expansion or acquisition initiatives will be successful, or that we will realize their expected operating efficiencies, cost savings, revenue enhancements, synergies or other benefits. For example, we may be required to integrate widely dispersed operations with different corporate cultures, operating margins, competitive environments, computer
20
systems, compensation programs, business plans and growth potential, which would likely require significant management time and attention. This could disrupt our ongoing operations and divert management resources that would otherwise focus on developing our existing business. Depending upon the circumstances of any particular acquisition, successful integration may depend, in large part, on retaining key personnel who have, for example, unique experience or business relationships. The loss of key personnel at any business we may acquire could result in a disruption of operations, a loss of information and business relationships, unanticipated recruitment and training costs, and otherwise diminish anticipated benefits of any such acquisitions. Acquisitions could also result in our assumption of unknown contingent liabilities, which could be material, expose us to the risk of impaired inventory and other assets relating to the acquisition, and the risks associated with entering markets in which we have limited or no direct experience. When financing any acquisitions, we may choose to issue additional shares of our Class A common stock or incur substantial additional indebtedness. Issuance of additional shares of Class A common stock would dilute the ownership interest of existing stockholders.
Accordingly, any acquisition activity could expose us to significant risks, beyond those associated with operating our existing business, and may adversely affect our business, financial position and results of operation.
Our business and results of operations are dependent on the availability and skill of subcontractors.
Substantially all of our construction work is done by third-party subcontractors with us acting as the general contractor. Accordingly, the timing and quality of our construction depend on the availability and skill of our subcontractors. We do not have long-term contractual commitments with any subcontractors, and there can be no assurance that skilled subcontractors will continue to be available at reasonable rates and in our markets. Certain of the subcontractors engaged by us are represented by labor unions or are subject to collective bargaining arrangements that require the payment of prevailing wages that are higher than normally expected on a residential construction site. A strike or other work stoppage involving any of our subcontractors could also make it difficult for us to retain subcontractors for our construction work. In addition, union activity or a scarcity of skilled labor supply could result in higher costs to retain our subcontractors. The inability to contract with skilled subcontractors at reasonable costs on a timely basis could have a material adverse effect on our business, prospects, liquidity, financial condition and results of operations.
In addition, despite our quality control efforts, we may discover that our subcontractors were engaging in improper construction practices or installing defective materials in our homes. When we discover these issues, we, generally through our subcontractors, repair the homes in accordance with our new home warranty and as required by law. We reserve a portion of the sales price of each home we sell to satisfy warranty and other legal obligations to our home buyers. We establish these reserves based on market practices, our historical experience, and our judgment of the qualitative risks associated with the types of homes built. However, the cost of satisfying our warranty and other legal obligations in these instances may be significantly higher than our reserves, and we may be unable to recover the cost of repair from such subcontractors. Regardless of the steps we take, we can in some instances be subject to fines or other penalties, and our reputation may be adversely affected.
Labor and raw material shortages and price fluctuations could delay or increase the cost of home construction, which could materially and adversely affect us.
The residential construction industry experiences serious labor and raw material shortages from time to time, including shortages in qualified tradespeople, and supplies of insulation, drywall, cement, steel and lumber. These labor and raw material shortages can be more severe during periods of strong demand for housing or during periods following natural disasters that have a significant impact on existing residential and commercial structures. Certain of our markets have recently begun to exhibit a scarcity of skilled labor relative to increased homebuilding demand in these markets. The cost of labor and raw materials may also be adversely affected during periods of shortage or high inflation. During the last economic downturn, a large number of qualified tradespeople went out of business or otherwise exited the market. A reduction in available tradespeople will likely exacerbate labor shortages if demand for new housing continues to increase. Shortages and price increases could cause delays in and increase our costs of home construction, which in turn could have a material adverse effect on our business, prospects, liquidity, financial condition and results of operations.
New and existing laws and regulations or other governmental actions may increase our expenses, limit the number of homes that we can build or delay completion of our projects.
We are subject to numerous local, state, federal and other statutes, ordinances, rules and regulations concerning zoning, development, building design, construction and similar matters which impose restrictive zoning and density requirements, the result of which is to limit the number of homes that can be built within the boundaries of a particular area. Projects that are not entitled may be subjected to periodic delays, changes in use, less intensive development or elimination of development in certain specific areas due to government regulations. We may also be subject to periodic delays or may be precluded entirely from developing in certain communities due to building moratoriums or “slow-growth” or “no-growth” initiatives that could be implemented in the future. Local governments also have broad discretion regarding the imposition of development fees and exactions for projects in their jurisdiction.
21
Projects for which we have received land use and development entitlements or approvals may still require a variety of other governmental approvals and permits during the development process and can also be impacted adversely by unforeseen health, safety and welfare issues, which can further delay these projects or prevent their development. As a result, home sales could decline and costs increase, which could have a material adverse effect on our business, prospects, liquidity, financial condition and results of operations.
We may be unable to obtain suitable bonding for the development of our housing projects.
We are often required to provide bonds to governmental authorities and others to ensure the completion of our projects and/or in support of obligations to build community improvements such as roads, sewers, water systems and other utilities. As a result of market conditions, surety providers have been reluctant to issue new bonds and some providers are requesting credit enhancements (such as guarantees, cash deposits or letters of credit) in order to maintain existing bonds or to issue new bonds. If we are unable to obtain required bonds in the future for our projects, or if we are required to provide credit enhancements with respect to our current or future bonds, our business, prospects, liquidity, financial condition and results of operations could be materially and adversely affected.
We are subject to environmental laws and regulations, which may increase our costs, result in liabilities, limit the areas in which we can build homes and delay completion of our projects.
We are subject to a variety of local, state, federal and other laws, statutes, ordinances, rules and regulations concerning the environment, hazardous materials, the discharge of pollutants and human health and safety. The particular environmental requirements which apply to any given site vary according to multiple factors, including the site’s location, its environmental conditions, the current and former uses of the site, the presence or absence of state-listed or federal-listed endangered or threatened plants or animals or sensitive habitats, and conditions at nearby properties. We may not identify all of these concerns during any pre-acquisition or pre-development review of project sites. Environmental requirements and conditions may result in delays, may cause us to incur substantial compliance and other costs, and can prohibit or severely restrict development and homebuilding activity in environmentally sensitive regions or in areas contaminated by others before we commence development. We are also subject to third-party challenges, such as by environmental groups or neighborhood associations, under environmental laws and regulations governing the permits and other approvals for our projects and operations. Sometimes regulators from different governmental agencies do not concur on development, remedial standards or property use restrictions for a project, and the resulting delays or additional costs can be material for a given project.
In addition, in cases where a state-listed or federally-listed endangered or threatened species is involved and related agency rule-making and litigation are ongoing, the outcome of such rule-making and litigation can be unpredictable and can result in unplanned or unforeseeable restrictions on, or the prohibition of, development and building activity in identified environmentally sensitive areas.
Furthermore, the Company is evaluating the impact of recent regulatory action under the federal Endangered Species Act on a project that it is developing in Washington State. The project, known as the Preserve at Tumwater Place (the “Preserve”), currently has approximately 462 lots consisting of Divisions 1, 2, 3 and 4. The preliminary residential subdivision was approved by the City of Tumwater and the Washington State Department of Fish and Wildlife based, in part, on an approved Habitat Protection Plan for the Mazama pocket gopher. Based on that plan, the Preserve contains a 25-acre, on-site habitat preservation area for the gopher. The Preserve has recorded a final subdivision for Division 1. We have obtained building permits from the City of Tumwater for some of the Division 1 lots and are currently building single family homes for sale therein.
Since these approvals, the U.S. Fish and Wildlife Service (“USFWS”) adopted a final rule listing gopher as “threatened” under the federal Endangered Species Act and designated certain areas of Washington State, including land in close proximity to the Preserve, as critical habitat for the gopher. The listing is broad and applies to areas near critical habitat area, including areas where the gopher may not be present. At this time, the USFWS has not provided guidance as to how USFWS intends to address ongoing development in light of the rule. However, USFWS has indicated that existing set-asides created under state and local authorities, such as the on-site habitat preservation area that we have previously established at the Preserve, will not provide sufficient mitigation for the take of the gopher as a matter of federal law. Accordingly, we will be required to implement additional restrictions and requirements at the Preserve. Any such restrictions or requirements could cause us to incur increased expense at the Preserve or delay or limit our activities there.
The recent regulatory action involving the listing of a certain species of gopher as “threatened” under the federal Endangered Species Act may adversely affect this project, for example by imposing new restrictions and requirements on our activities there and possibly delaying, halting or limiting, our development activities. However, an estimate of the amount of impact cannot be made as there is not enough information to do so due to the lack of clarity regarding any restrictions that may be imposed on our development
22
activities or other remedial measures that we may be required to make. We will continue to assess the impact of this regulatory action and will record any future liability as additional information becomes available.
We may suffer uninsured losses or suffer material losses in excess of insurance limits.
We could suffer physical damage to property and liabilities resulting in losses that may not be fully recoverable by insurance. In addition, certain types of risks, such as personal injury claims, may be, or may become in the future, either uninsurable or not economically insurable, or may not be currently or in the future covered by our insurance policies or otherwise be subject to significant deductibles or limits. Should an uninsured loss or a loss in excess of insured limits occur or be subject to deductibles, we could sustain financial loss or lose capital invested in the affected property as well as anticipated future income from that property.
In addition, we could be liable to repair damage or meet liabilities caused by risks that are uninsured or subject to deductibles. We may be liable for any debt or other financial obligations related to affected property. Material losses or liabilities in excess of insurance proceeds may occur in the future.
Increases in our cancellation rate could have a negative impact on our home sales revenue and homebuilding margins.
Home order cancellations can result from a number of factors, including declines or slow appreciation in the market value of homes, increases in the supply of homes available to be purchased, increased competition, higher mortgage interest rates, home buyers’ inability to sell their existing homes, home buyers’ inability to obtain suitable financing, including providing sufficient down payments, and adverse changes in economic conditions. Upon a home order cancellation, the escrow deposit is returned to the prospective purchaser (other than with respect to certain design-related deposits, which we retain). An increase in the level of our home order cancellations, due to stringent lending standards or otherwise, could have a negative impact on our business, prospects, liquidity, financial condition and results of operations.
We are subject to product liability and warranty claims arising in the ordinary course of business.
As a homebuilder, we are subject to construction defect, product liability and home warranty claims, including moisture intrusion and related claims, arising in the ordinary course of business. While we maintain general liability insurance and generally seek to require our subcontractors and design professionals to indemnify us for the liabilities arising from their work, there can be no assurance that these insurance rights and indemnities will be collectible or adequate to cover any or all construction defect and warranty claims for which we may be liable. For example, contractual indemnities can be difficult to enforce, we are often responsible for applicable self-insured retentions (particularly in markets where we include our subcontractors on our general liability insurance and our ability to seek indemnity for insured claims is significantly limited), certain claims may not be covered by insurance or may exceed applicable coverage limits, and one or more of our insurance carriers could become insolvent. Further, in the United States, and California in particular, the coverage offered and the availability of general liability insurance for construction defects is currently limited and is costly. As a result, an increasing number of our subcontractors may be unable to obtain insurance, particularly in California where we have instituted an “owner controlled insurance program,” under which subcontractors are effectively insured by us.
For our projects we obtain liability insurance that generally covers subcontractors. If we cannot effectively recover construction defect liabilities and costs of defense, or if we have self-insured, we may suffer losses. Coverage may be further restricted and become even more costly. Such circumstances could adversely affect our business, prospects, liquidity, financial condition and results of operations. Further, any product liability or warranty claims made against us, whether or not they are viable, may lead to negative publicity, which could impact our reputation and our home sales.
In addition, we conduct the substantial portion of our business in California, one of the most highly regulated and litigious jurisdictions in the United States, which imposes a ten year, strict liability tail on many construction liability claims. As a result, our potential losses and expenses due to litigation, new laws and regulations may be greater than those of our competitors who have more limited California operations.
Our operating performance is subject to risks associated with the real estate industry.
Real estate investments are subject to various risks and fluctuations and cycles in value and demand, many of which are beyond our control. These events include, but are not limited to:
• | adverse changes in international, national or local economic and demographic conditions; |
• | adverse changes in financial conditions of buyers and sellers of properties, particularly residential homes and land suitable for development of residential homes; |
23
• | competition from other real estate investors with significant capital, including other real estate operating companies and developers and institutional investment funds; |
• | reductions in the level of demand for and increases in the supply of land suitable for development; |
• | fluctuations in interest rates, which could adversely affect our ability, or the ability of home buyers, to obtain financing on favorable terms or at all; |
• | unanticipated increases in expenses, including, without limitation, insurance costs, development costs, real estate assessments and other taxes and costs of compliance with laws, regulations and governmental policies; and |
• | changes in enforcement of laws, regulations and governmental policies, including, without limitation, health, safety, environmental, zoning and tax laws, governmental fiscal policies and the Americans with Disabilities Act of 1990. |
In addition, periods of economic slowdown or recession, rising interest rates or declining demand for real estate, or the public perception that any of these events may occur, could result in a general decline in the purchase of homes or an increased incidence of home order cancellations. If we cannot successfully implement our business strategy, our business, prospects, liquidity, financial condition and results of operations will be adversely affected.
Poor relations with the residents of our communities could negatively impact sales, which could cause our revenue or results of operations to decline.
Residents of communities we develop rely on us to resolve issues or disputes that may arise in connection with the operation or development of their communities. Efforts made by us to resolve these issues or disputes could be deemed unsatisfactory by the affected residents and subsequent actions by these residents could adversely affect sales or our reputation. In addition, we could be required to make material expenditures related to the settlement of such issues or disputes or to modify our community development plans, which could adversely affect our results of operations.
If we are unable to develop our communities successfully or within expected timeframes, our results of operations could be adversely affected.
Before a community generates any revenue, time and material expenditures are required to acquire land, obtain development approvals and construct significant portions of project infrastructure, amenities, model homes and sales facilities. It can take several years from the time we acquire control of a property to the time we make our first home sale on the site. Delays in the development of communities expose us to the risk of changes in market conditions for homes. A decline in our ability to develop and market our communities successfully and to generate positive cash flow from these operations in a timely manner could have a material adverse effect on our business and results of operations and on our ability to service our debt and to meet our working capital requirements.
We depend on key senior management personnel and other experienced employees.
Our success depends to a significant degree upon the contributions of certain key senior management personnel including, but not limited to, Dustin L. Bogue, our President and Chief Executive Officer, and James M. Pirrello, our Chief Financial Officer, each of whom would be difficult to replace. Although we entered into employment agreements with Messrs. Bogue and Pirrello, there is no guarantee that these executives will remain employed by us. If any of our key senior management personnel were to cease employment with us, our operating results could suffer. Our ability to retain our key senior management personnel or to attract suitable replacements should any members of our management team leave is dependent on the competitive nature of the employment market. The loss of services from key senior management personnel or a limitation in their availability could materially and adversely impact our business, prospects, liquidity, financial condition and results of operations. Further, such a loss could be negatively perceived in the capital markets. We have not obtained key senior management life insurance that would provide us with proceeds in the event of death or disability of any of our key senior management personnel.
Experienced employees in the homebuilding, land acquisition and construction industries are fundamental to our ability to generate, obtain and manage opportunities. In particular, local knowledge and relationships are critical to our ability to source attractive land acquisition opportunities. Experienced employees working in the homebuilding and construction industries are highly sought after. Failure to attract and retain such personnel or to ensure that their experience and knowledge is not lost when they leave the business through retirement, redundancy or otherwise may adversely affect the standards of our service and may have an adverse impact on our business, prospects, liquidity, financial condition and results of operations. The loss of any of our key personnel could adversely impact our business, prospects, financial condition and results of operations.
24
Fluctuations in real estate values may require us to write-down the book value of our real estate assets.
The homebuilding and land development industries are subject to significant variability and fluctuations in real estate values. As a result, we may be required to write-down the book value of our real estate assets in accordance with U.S. generally accepted accounting principles ("GAAP"), and some of those write-downs could be material. Any material write-downs of assets could have a material adverse effect on our business, prospects, liquidity, financial condition and results of operations. For the year ended December 31, 2016, we recorded $2.6 million of impairment to real estate inventory in two of our projects, Sundance, located in Bakersfield, California ("Sundance"), and Heathers at Westport, located in Charlotte, North Carolina ("Heathers at Westport"). For the year ended December 31, 2015, we recorded $0.9 million of impairment to homebuilding real estate inventory in our River Run project, located in Bakersfield, California ("River Run"). See Note 2, “Summary of Significant Accounting Policies” and Note 9, "Fair Value Disclosures" to the consolidated financial statements for further discussion on impairment and estimated fair values of real estate inventories included elsewhere in this Annual Report on Form 10-K.
Inflation could adversely affect our business and financial results.
Inflation could adversely affect us by increasing the costs of land, raw materials and labor needed to operate our business. If our markets have an oversupply of homes relative to demand, we may be unable to offset any such increases in costs with corresponding higher sales prices for our homes. Inflation may also accompany higher interest rates, which could adversely impact potential customers’ ability to obtain financing on favorable terms, thereby further decreasing demand. If we are unable to raise the prices of our homes to offset the increasing costs of our operations, our margins could decrease. Furthermore, if we need to lower the price of our homes to meet demand, the value of our land inventory may decrease. Inflation may also raise our costs of capital and decrease our purchasing power, making it more difficult to maintain sufficient funds to operate our business.
We may become subject to litigation, which could materially and adversely affect us.
We may become subject to litigation, including claims relating to our operations, financings and otherwise in the ordinary course of business. Some of these claims may result in significant defense costs and potentially significant judgments against us, some of which are not, or cannot be, insured against. We cannot be certain of the ultimate outcomes of any claims that may arise in the future.
Resolution of these types of matters against us may result in our having to pay significant fines, judgments, or settlements, which, if uninsured, or if the fines, judgments and settlements exceed insured levels, could adversely impact our earnings and cash flows, thereby materially and adversely affecting us. Certain litigation or the resolution of certain litigation may affect the availability or cost of some of our insurance coverage, which could materially and adversely impact us, expose us to increased risks that would be uninsured, and materially and adversely impact our ability to attract directors and officers.
Our business could be negatively affected as a result of actions of activist stockholders and shareholder advisory firms.
Campaigns by stockholders to effect changes at publicly traded companies are sometimes led by investors seeking to increase short-term stockholder value through actions such as financial restructuring, increased debt, special dividends, stock repurchases or sales of assets or the entire company. If we become engaged in a process or proxy contest with an activist stockholder in the future, our business could be adversely affected, as such activities could be costly and time-consuming, disrupt our operations and divert the attention of management and our employees from executing our business plan. Additionally, perceived uncertainties as to our future direction as a result of stockholder activism or actual or potential changes to the composition of our board of directors or management team may lead to the perception of a change in the direction of our business, instability or lack of continuity, which may be exploited by our competitors, cause concern to current or potential transactional counterparties and financing sources, and make it more difficult to attract and retain qualified personnel. If potential or existing transactional counterparties or financing sources choose to delay, defer or reduce transactions with us or transact with our competitors instead of us because of any such issues, then our results of operations could be adversely affected. Similarly, we may suffer damage to our reputation (for example, regarding our corporate governance or stockholder relations) or brand by way of actions taken or statements made by outside constituents, including activist investors and shareholder advisory firms, which could adversely affect the market price of our Class A common stock and the value of our debt securities, resulting in significant loss of value, which could impact our ability to access capital, increase our cost of capital and decrease our ability to finance our business on attractive terms.
25
A major health and safety incident relating to our business could be costly in terms of potential liabilities and reputational damage.
Building sites are inherently dangerous, and operating in the homebuilding and land development industry poses certain inherent health and safety risks. Due to health and safety regulatory requirements and the number of projects we work on, health and safety performance is critical to the success of all areas of our business.
Any failure in health and safety performance may result in penalties for non‑compliance with relevant regulatory requirements or litigation, and a failure that results in a major or significant health and safety incident is likely to be costly in terms of potential liabilities incurred as a result. Such a failure could generate significant negative publicity and have a corresponding impact on our reputation, our relationships with relevant regulatory agencies, governmental authorities and local communities, and our ability to win new business, which in turn could have a material adverse effect on our business, prospects, liquidity, financial condition and results of operations.
Acts of war or terrorism may seriously harm our business.
Acts of war, any outbreak or escalation of hostilities between the United States and any foreign power or acts of terrorism may cause disruption to the U.S. economy, or the local economies of the markets in which we operate, cause shortages of building materials, increase costs associated with obtaining building materials, result in building code changes that could increase costs of construction, affect job growth and consumer sentiment, or cause economic changes that we cannot anticipate, all of which could reduce demand for our homes and adversely impact our business, prospects, liquidity, financial condition and results of operations.
Information technology failures and data security breaches could harm our business.
We use information technology for financial and operational management functions to conduct our operations. Any disruption in these systems could adversely affect our ability to conduct our business. Furthermore, we use information technology, digital telecommunications and other computer resources to carry out important operational and promotional marketing activities and to maintain our business records. Many of these resources are provided to us and/or maintained on our behalf by third-party service providers pursuant to agreements that specify to varying degrees certain security and service level standards. Although we and our service providers employ what we believe are adequate security, disaster recovery and other preventative and corrective measures, our ability to conduct our business may be impaired if these resources, including our primary websites, are compromised, degraded, damaged or fail, whether due to a virus or other harmful circumstance, intentional penetration or disruption of our information technology resources by a third party, natural disaster, hardware or software corruption or failure or error or poor product or vendor/developer selection (including a failure of security controls incorporated into or applied to such hardware or software), telecommunications system failure, service provider error or failure, intentional or unintentional personnel actions (including the failure to follow our security protocols), or lost connectivity to our networked resources. A significant and extended disruption in the functioning of these resources, including our primary websites, could damage our reputation and cause us to lose customers, orders, deliveries of homes and revenues, result in the unintended and/or unauthorized public disclosure or the misappropriation of proprietary, personal identifying and confidential information (including information about our buyers and business partners), and require us to incur significant expenses to address and remediate or otherwise resolve these kinds of issues, expenses that we may not be able to recover in whole or in any part from our service providers or responsible parties, or their or our insurers. The release of confidential information may also lead to litigation or other proceedings against us by affected individuals and/or business partners and/or by regulators, and the outcome of such proceedings, which could include penalties or fines and cause reputational harm, could have a material and adverse effect on our business and consolidated financial statements. In addition, the costs of maintaining adequate protection against such threats, based on considerations of their evolution, pervasiveness and frequency and/or government-mandated standards or obligations regarding protective efforts, could be material to our consolidated financial statements in a particular period or over various periods.
RISKS RELATED TO OUR CONTROLLING STOCKHOLDER
PICO holds a majority equity interest in our Company and its interests may not be aligned with ours or those of our other investors.
PICO holds 56.8% of the voting power of UCP, Inc. as of December 31, 2016. For so long as PICO continues to beneficially own a controlling stake in us, PICO will have the power to elect and remove all of our directors and to approve any action requiring the majority approval of our stockholders. PICO also has the power to transfer its controlling stake in our Company. In addition,
26
pursuant to an Investor Rights Agreement that we entered into with PICO, PICO will have the right to nominate two individuals for election to our board of directors for as long as PICO owns 25% or more of the combined voting power of our outstanding Class A and Class B common stock and one individual for as long as it owns at least 10% of the combined voting power of our outstanding Class A and Class B common stock (in each case, excluding any shares of our common stock that are subject to issuance upon the exercise or exchange of rights of conversion or any options, warrants or other rights to acquire shares); and Dustin L. Bogue, our President and Chief Executive Officer, James W. Fletcher, the President of our Northern California Division, and our former Chief Financial Officer, have agreed to vote all shares of our Class A common stock that they own in favor of such PICO nominees in any election of directors for as long as PICO owns at least 10% of the combined voting power of our outstanding Class A and Class B common stock. In the event that any board member nominated by PICO shall for any reason cease to serve as a member of our board of directors during his or her term of office, the resulting vacancy on the board will be filled by an individual selected by PICO.
PICO’s interests may not be fully aligned with ours and those of our other investors, and this could lead to actions that are not in our or in our other investors’ best interests. PICO holds all of the outstanding UCP, LLC Series A Units. Because PICO holds its economic interest in our business through UCP, LLC, rather than through the public company, it may have conflicting interests with holders of shares of our Class A common stock. For example, PICO may have different tax positions from us which could influence its decisions regarding whether and when we should dispose of assets or incur new or refinance existing indebtedness, especially in light of the existence of the TRA that we entered into with PICO, and whether and when we should undergo certain changes of control within the meaning of the Tax Receivable Agreement or terminate the TRA, which would accelerate our obligations thereunder. In addition, the structuring of future transactions may take into consideration these tax or other considerations even where no similar benefit would accrue to us. In addition, PICO’s significant ownership in us and resulting ability to effectively control us may discourage someone from making a significant equity investment in us, or could discourage transactions involving a change in control, including transactions in which you as a holder of shares of our Class A common stock might otherwise receive a premium for our shares over the then-current market price.
We are a "controlled company" within the meaning of the corporate governance rules of the NYSE as a result of the ownership positions and voting rights of PICO. A "controlled company" is a company of which more than 50% of the voting power is held by an individual, group or another company. More than 50% of the combined voting power of our outstanding Class A and Class B common stock is held by PICO. As a controlled company, we are entitled to not comply with certain corporate governance of the NYSE that would otherwise require our board of directors to have a majority of independent directors and our compensation committee and our nominating and corporate governance committee to be comprised entirely of independent directors, have written charters addressing such committee's purpose and responsibilities and perform an annual evaluation of such committee. Accordingly, holders of our Class A common stock do not have the same protection afforded to stockholders of companies that are subject to all of the corporate governance requirements of the NYSE and the ability of our independent directors to influence our business policies and affairs may be reduced.
As a result of PICO’s relationship with our Company, conflicts of interest may arise with respect to any transactions involving or with PICO or its affiliates.
Maxim C. W. Webb, a member of our board of directors, is the Chief Executive Officer of PICO. As a result of our relationship with PICO, there may be transactions between us and PICO that could present an actual or perceived conflict of interest.
This conflict of interest may lead Mr. Webb to recuse himself from actions of our board of directors with respect to any transactions involving or with PICO or its affiliates. In addition, Mr. Webb will devote only a portion of his business time to his duties with our board of directors, and he will devote the majority of his time to his duties with PICO and other commitments. PICO or its affiliates may also pursue transactions in competition with us.
RISKS RELATED TO OUR INDEBTEDNESS
We have substantial indebtedness, which may exacerbate the adverse effect of any declines in our business, industry or the general economy and exposes us to the risk of default. We may be unable to service our indebtedness.
As of December 31, 2016, we had approximately $161.0 million of consolidated outstanding debt (including capital lease obligations) of which $74.9 million was related to our 2017 Notes and $86.9 million for our acquisition and construction loans expected to mature during 2018. Our organizational documents do not limit the amount of indebtedness we may incur, our board of directors may change our target debt levels at any time without the approval of our stockholders or creditors as long as the Company is in compliance with the covenants and restrictions then in effect with its existing lenders. As a result, we may incur significant
27
additional indebtedness in the future. Our substantial outstanding indebtedness, and the limitations imposed on us by the instruments and agreements governing out outstanding indebtedness, could have significant adverse consequences, including the following:
• | our cash flow may be insufficient to meet our required principal and interest payments; |
• | we may use a substantial portion of our cash flows to make principal and interest payments and we may be unable to obtain additional financing as needed or on favorable terms, which could, among other things, have a material adverse effect on our ability to complete our development pipeline, capitalize upon emerging acquisition opportunities, fund working capital or capital expenditures, or meet our other business needs; |
• | we may be unable to refinance our indebtedness at maturity or the refinancing terms may be less favorable than the terms of our original indebtedness; |
• | we may be forced to dispose of one or more of our properties, possibly on unfavorable terms or in violation of certain covenants to which we may be subject; |
• | we may be required to maintain certain debt and coverage and other financial ratios at specified levels, which may limit our ability to obtain additional financing in the future, thereby reducing our financial flexibility to react to changes in our business; |
• | our vulnerability to general adverse economic and industry conditions may be increased; |
• | approximately $81.3 million of our indebtedness bears interest at variable rates, which exposes us to increased interest expense in a rising interest rate environment; |
• | we may be at a competitive disadvantage relative to our competitors that have less indebtedness; |
• | our flexibility in planning for, or reacting to, changes in our business and the markets in which we operate may be limited; and |
• | we may default on our indebtedness by failure to make required payments or to comply with certain covenants, which could result in an event of default entitling a creditor to declare all amounts owed to it to be due and payable, and possibly entitling other creditors (due to cross-default or cross-acceleration provisions) to accelerate the maturity of amounts owed to such other creditors or, if such indebtedness is secured, to foreclose on our assets that secure such obligation. |
The occurrence of any one of these events could have a material adverse effect on our financial condition, liquidity, results of operations and/or business.
Our ability to make interest and principal payments on our indebtedness, complete our development pipeline and fund other planned capital expenditures and expansion efforts (including any strategic acquisitions we may make in the future), will depend on our ability to generate cash. This, to a certain extent, is subject to general economic, financial, competitive, regulatory and other factors that are beyond our control. We cannot assure you that our business will generate sufficient cash flow from operations in the future or that future borrowings will be available to us in an amount sufficient to enable us to service our indebtedness, to refinance our indebtedness when it matures or to fund other liquidity needs. If our cash flows and capital resources are insufficient to fund our debt service obligations, we may be forced to reduce or delay investments and capital expenditures, or to sell assets, seek additional capital or restructure or refinance our indebtedness. Our ability to restructure or refinance our debt will depend on the condition of the capital markets and our financial condition at such time. Any refinancing of our debt could be at higher interest rates and may require us to comply with more onerous covenants, which could further restrict our business operations. The terms of our existing debt instruments restrict us from adopting some of these alternatives. These alternative measures may not be successful and may not permit us to meet our scheduled debt service obligations. We cannot assure you that we will be able to service or refinance our indebtedness on commercially reasonable terms or at all.
In particular, our 2017 Notes, with an aggregate outstanding principal amount of $75 million, mature on October 21, 2017. This significant maturity represents approximately 46.3% of our outstanding debt (including capital lease obligations but excluding intercompany liabilities) as of December 31, 2016. Our ability to satisfy this maturity when it becomes due will depend on our future operating performance and financial results, which will be subject, in part, to factors beyond our control, including interest rates and general economic, financial and competitive conditions. Our sources of capital to satisfy this maturity may include retained capital, the issuance of equity securities, debt financing and refinancing and asset sales or a combination of any of the foregoing. However, no assurance can be given that any of these sources of capital will be available to us on favorable terms, or at all, or that such sources will enable us to be able to satisfy this maturity. Any refinancing of the 2017 Notes may be on terms less favorable than those applicable to the 2017 Notes. As a result, we can provide no assurance that we will be able to refinance or repay our 2017 Notes as we currently anticipate or at all. Our failure to refinance or repay our 2017 Notes at their stated maturity would have a material adverse impact on
28
our financial condition, results of operations, cash flow, liquidity, the market price of our Class A common stock and our ability to achieve our objectives.
The agreements governing our indebtedness, including our indenture, contain various covenants and other provisions which limit management’s discretion in the operation of our business, reduce our operational flexibility and create default risks.
The agreements governing our existing indebtedness, including the indenture relating to the 2017 Notes, contain covenants and other provisions that impose significant restrictions on us and our subsidiaries. The indenture contains covenants that restrict, among other things, our and our subsidiaries’ ability to:
• | incur or guarantee additional unsecured and secured indebtedness; |
• | pay dividends and make certain investments and other restricted payments; |
• | acquire unimproved real property; |
• | create or incur certain liens; |
• | transfer or sell certain assets; and |
• | merge or consolidate with other companies or transfer or sell all or substantially all of our consolidated assets. |
These covenants could impair our ability to grow our business, take advantage of attractive business opportunities or successfully compete, and we may be unable to amend, or obtain a waiver of, any applicable covenant in any given situation. In addition, the indenture provides the holders thereof the right to require us to repurchase all or any part of their securities at a purchase price in cash equal to 101% of the principal amount of such securities plus accrued and unpaid interest to the date of purchase in the event a change of control occurs (which the indenture generally defines as certain persons (excluding PICO) having the right to acquire more than 35% of the voting power of our voting stock).
The indenture also requires, and certain of our and our subsidiaries’ acquisition, construction and development loan agreements require, us to maintain specified financial measures and ratios and satisfy financial condition tests. Our ability to comply with these ratios or tests may be affected by events beyond our control, including prevailing economic, financial and industry conditions. See "Management's Discussion and Analysis of Financial Condition and Results of Operations - Liquidity and Capital Resources - Senior Notes" included elsewhere in this report.
A breach of any of these covenants or covenants under any other agreements governing our indebtedness or our subsidiaries indebtedness could result in an event of default. Such a default may allow the creditors, if the agreements so provide, to declare the related debt immediately due and payable, as well as any other debt to which a cross-acceleration or cross-default provision applies. In addition, lenders may have the right in these circumstances to terminate any commitments they have to provide further borrowings. Our assets and cash flow may not be sufficient to fully repay borrowings under our outstanding debt agreements if accelerated upon an event of default. In addition, if we were unable to repay or refinance any secured debt that becomes accelerated, the lenders could proceed against any assets pledged to secure that debt, including foreclosing on or requiring the sale of our or our subsidiaries’ ownership interests in land parcels (and improvements thereon), and such assets may not be sufficient to repay such debt in full.
Secured indebtedness exposes us to the possibility of seizure of the pledged collateral.
Incurring mortgage and other secured indebtedness increases our risk of loss of our ownership interests in our pledged land parcels or other assets, because defaults under such indebtedness may result in foreclosure actions initiated by lenders. As of December 31, 2016, we had mortgage indebtedness of approximately $86.7 million. This debt is secured by project-level real estate (i.e., real estate held in special purpose entities formed to hold the real estate interests for particular projects).
Access to financing sources may not be available on favorable terms, or at all, which could adversely affect our ability to maximize our returns.
Our access to additional third-party sources of financing will depend, in part, on:
• | general market conditions; |
• | the market’s perception of our growth potential; |
• | with respect to acquisition and/or development financing, the market’s perception of the value of the land parcels to be acquired and/or developed; |
• | our debt levels; |
29
• | our expected results of operations; |
• | our cash flow; and |
• | the market price of our Class A common stock. |
Credit spreads for major sources of capital widened significantly during the U.S. credit crisis as investors demanded a higher risk premium. During periods of volatility and weakness in the capital and credit markets, potential lenders may be unwilling or unable to provide us with financing that is attractive to us or may charge us prohibitively high fees in order to obtain financing. Investment returns on our assets and our ability to make acquisitions could be adversely affected by our inability to secure additional financing on reasonable terms, if at all.
Depending on market conditions at the relevant time, we may have to rely more heavily on additional equity financings or on less efficient forms of debt financing that require a larger portion of our cash flow from operations, thereby reducing funds available for our operations, future business opportunities and other purposes. We may not have access to such equity or debt capital on favorable terms at the desired times, or at all.
Failure to hedge effectively against interest rate changes may adversely affect us.
We currently do not hedge against interest rate fluctuations. We may obtain in the future one or more forms of interest rate protection in the form of swap agreements, interest rate cap contracts or similar agreements to hedge against the possible negative effects of interest rate fluctuations. However, we cannot assure that any hedging will adequately relieve the adverse effects of interest rate increases or that counterparties under these agreements will honor their obligations thereunder. In addition, we may be subject to risks of default by hedging counterparties. Adverse economic conditions could also cause the terms on which we borrow to be unfavorable. We could be required to liquidate one or more of our assets at times which may not permit us to receive an attractive return on our assets in order to meet our debt service obligations.
RISKS RELATED TO OUR ORGANIZATION AND STRUCTURE
Our only material asset is our interest in UCP, LLC, and we are accordingly dependent upon distributions from UCP, LLC to pay dividends, if any, taxes and other expenses.
UCP, Inc. is a holding company and has no material assets other than its ownership of membership interests in UCP, LLC. UCP, Inc. has no independent means of generating revenue other than the operations of UCP, LLC that it owns and controls. We intend to cause UCP, LLC to make distributions to its members in an amount sufficient to cover all applicable taxes payable and dividends, if any, declared by us, as well as any payments due under the TRA, as described below. Future financing arrangements may contain negative covenants, limiting the ability of our operating subsidiaries to declare or pay dividends or make distributions. To the extent that UCP, Inc. needs funds, and UCP, LLC and/or its subsidiaries are restricted from making such distributions under applicable law or regulations, or otherwise unable to provide such funds, for example, due to restrictions contained in the indenture governing our 2017 Notes, certain of our subsidiary level project financings or in future financing arrangements that limit the ability of our operating subsidiaries to distribute funds, our liquidity and financial condition could be materially harmed.
We are required to pay PICO for a portion of the benefits relating to any additional tax depreciation or amortization deductions we may claim as a result of tax basis step-ups we receive in connection with future exchanges by PICO of its UCP, LLC Series A Units for shares of our Class A common stock.
The UCP, LLC Series A Units held by PICO may in the future be exchanged for shares of our Class A common stock. The exchanges may result in increases in the tax basis of the assets of UCP, LLC that otherwise would not have been available. These increases in tax basis may reduce the amount of tax that we would otherwise be required to pay in the future, although the IRS may challenge all or part of the tax basis increases, and a court could sustain such a challenge.
We entered into a TRA with PICO that provides for the payment by us to PICO of 85.0% of the amount of cash savings, if any, in U.S. federal, state and local income tax or franchise tax that we actually realize as a result of any such increases in tax basis (or are deemed to realize in the case of certain events, as discussed below). Any actual increases in tax basis, as well as the amount and timing of any payments under the TRA, cannot be predicted reliably at this time.
30
The increase in tax basis, as well as the amount and timing of any payments under this agreement, will vary depending upon a number of factors, including the timing of exchanges, the price of shares of our Class A common stock at the time of the exchange, the extent to which such exchanges are taxable, and the amount and timing of our income. As a result of the size of the increases in the tax basis of the tangible and intangible assets of UCP, LLC attributable to our interest in UCP, LLC, during the expected term of the TRA, we expect that the payments that we may make to PICO could be substantial.
We are not aware of any issue that would cause the IRS to challenge a tax basis increase; however, if the IRS were successful in making such a challenge, PICO would not reimburse us for any payments that may previously have been made under the TRA if it is later determined that we did not receive the anticipated corresponding tax benefit. As a result, in certain circumstances we could make payments to PICO under the TRA in excess of our cash tax savings. In addition, our ability to achieve benefits from any tax basis increase, and the payments to be made under the TRA, will depend upon a number of factors, as discussed above, including the timing and amount of our future income.
In certain cases, payments by us under the Tax Receivable Agreement may be accelerated and/or significantly exceed the benefits we realize in respect of the tax attributes subject to the Tax Receivable Agreement.
The TRA provides that upon certain changes of control, or if, at any time, we either materially breach our obligations under the TRA or elect an early termination of the TRA, our (or our successor’s) obligations with respect to UCP, LLC Series A Units would be based on certain assumptions, including that (a) all the UCP, LLC Series A Units are deemed exchanged for their fair value, (b) we would have sufficient taxable income to fully utilize the deductions arising from the increased tax deductions and tax basis and other benefits related to entering into the TRA and (c) the subsidiaries of UCP, LLC will sell certain non-amortizable assets (and realize certain related tax benefits) no later than a specified date. In each of these instances (based on the foregoing assumptions), we would be required to make an immediate payment to the holders of such UCP, LLC Series A Units equal to the present value of the anticipated future tax benefits (discounted over the applicable amortization and depreciation periods for the assets the tax bases of which are stepped up (which could be as long as fifteen years in respect of intangibles and goodwill) at a uniform discount rate equal to LIBOR plus 100 basis points). The benefits would be payable even though, in certain circumstances, no UCP, LLC Series A Units are actually exchanged at the time of the accelerated payment under the TRA, thereby resulting in no corresponding tax basis step up at the time of such accelerated payment under the TRA. Accordingly, payments under the TRA may be made years in advance of the actual realization, if any, of the anticipated future tax benefits and may be significantly greater than the benefits we realize in respect of the tax attributes subject to the TRA. In these situations, our obligations under the TRA could have a substantial negative impact on our liquidity. We may not be able to finance our obligations under the TRA and our existing indebtedness may limit our subsidiaries’ ability to make distributions to us to pay these obligations.
In addition, our obligations under the TRA could have the effect of delaying, deferring or preventing certain mergers, asset sales, other forms of business combinations or other changes of control that could be in the best interests of our public stockholders.
We may not be able to realize all or a portion of the tax benefits that are expected to result from exchanges of UCP LLC Series A Units for shares of our Class A common stock and payments made under the Tax Receivable Agreement itself.
Our ability to benefit from any depreciation or amortization deductions or to realize other tax benefits that we currently expect to be available as a result of the increases in tax basis created by exchanges of UCP LLC Series A Units for shares of our Class A common stock and our ability to realize certain other tax benefits attributable to payments under the TRA itself, depend on a number of assumptions, including that we earn sufficient taxable income each year during the period over which such deductions are available and that there are no adverse changes in applicable law or regulations. If our actual taxable income were insufficient and/or there were adverse changes in applicable law or regulations, we may be unable to realize all or a portion of these expected benefits and our cash flows and stockholders’ equity could be negatively affected.
In the event we acquire more than 50% of all outstanding units of UCP, LLC, we may become subject to additional state and local real estate taxes due to a reassessment of the value of our land holdings for California real estate tax purposes. We may also become subject to California and Washington state and local real estate transfer taxes.
We are subject to state and local real estate taxes in California on an annual basis, which are assessed on the basis of the value of our land holdings in the relevant counties. Under Article XIIIA of the California Constitution (known as Proposition 13), California real estate taxes are generally based upon a property’s historic cost (subject to an inflationary increase in value not to exceed 2.0% per year) until the property undergoes a change in ownership or the entity owning the property undergoes a change in control.
31
Because we have acquired our lots over time, the values currently used for assessing these real estate taxes (generally, the price we paid for the lots subject to the allowable inflationary increase in value described in the preceding paragraph) may not fully reflect current market values.
If we acquire more than 50.0% of all outstanding units of UCP, LLC (which might occur, for instance, upon an exchange of UCP, LLC Series A Units by PICO pursuant to the Exchange Agreement) it may be treated as triggering a “change in ownership” for such real estate tax purposes, which, in turn, will result in a reassessment of the values of our lots in California for purposes of our annual real estate tax payments. In such case, the values of our California lots would be reassessed at, and our California real estate taxes would be based on, the then current market value of such lots, which may significantly exceed the price we paid for such lots plus any previously allowed inflationary increase in value. If such reassessment results in an upward adjustment of the values of our California lots, our annual California real estate tax payments will increase. In addition, if we acquire more than 50.0% of the units in UCP, LLC, we may also become subject to one-time California and Washington State and local real estate transfer taxes in respect of our lots in such state. Such additional tax payments would have a negative impact on our earnings, cash flows and liquidity.
Termination of the employment agreements with the members of our management team could be costly and prevent a change in control of our Company.
The employment agreements entered into with our key management team members provide that if their employment with us terminates under certain circumstances, we may be required to pay them significant amounts of severance compensation, thereby making it costly to terminate their employment. Furthermore, these provisions could delay or prevent a transaction or a change in control of our Company that might involve a premium paid for shares of our Class A common stock or otherwise be in the best interests of our stockholders, which could adversely affect the market price of our Class A common stock.
Certain anti-takeover defenses, applicable law, and provisions of our Registration Rights Agreement, Tax Receivable
Agreement, Investor Rights Agreement and the indenture relating to our 2017 Notes may limit the ability of a third party to acquire control of us.
Our charter and bylaws and Delaware law contain provisions that may delay or prevent a transaction or a change in control of our Company that might involve a premium paid for shares of our Class A common stock or otherwise be in the best interests of our stockholders, which could adversely affect the market price of our Class A common stock. Certain of these provisions are described below.
Selected provisions of our charter and/or bylaws: Our charter and/or bylaws contain anti-takeover provisions that:
• | divide our directors into three classes, with the term of one class expiring each year, which could delay a change in our control; |
• | authorize our board of directors, without further action by the stockholders, to issue up to 50,000,000 shares of preferred stock in one or more series, and with respect to each series, to fix the number of shares constituting that series and establish the rights and other terms of that series; |
• | require that actions to be taken by our stockholders may be taken only at an annual or special meeting of our stockholders and not by written consent; |
• | specify that special meetings of our stockholders can be called only by our board of directors, the chairman of our board of directors or our chief executive officer; |
• | establish advance notice procedures for stockholders to submit nominations of candidates for election to our board of directors and other proposals to be brought before a stockholders meeting; |
• | provide that our bylaws may be amended by our board of directors without stockholder approval; |
• | allow our directors to establish the size of our board of directors by action of our board of directors, subject to a minimum of three members; |
• | provide that vacancies on our board of directors or newly created directorships resulting from an increase in the number of our directors may be filled only by a majority of directors then in office, even though less than a quorum; |
• | do not give the holders of our common stock cumulative voting rights with respect to the election of directors; and |
• | prohibit us from engaging in certain business combinations with any “interested stockholder” unless specified conditions are satisfied. |
32
Selected provisions of Delaware law: We have opted out of Section 203 of the Delaware General Corporation Law (the “DGCL”), which regulates corporate takeovers. However, our charter contains provisions that are similar to Section 203 of the DGCL. Specifically, our charter provides that we may not engage in certain “business combinations” with any “interested stockholder” for a three-year period following the time that the person became an interested stockholder, unless:
• | prior to the time that person became an interested stockholder, our board of directors approved either the business combination or the transaction which resulted in the person becoming an interested stockholder; |
• | upon consummation of the transaction which resulted in the person becoming an interested stockholder, the interested stockholder owned at least 85.0% of the voting stock of the corporation outstanding at the time the transaction commenced, excluding certain shares; or |
• | at or subsequent to the time the person became an interested stockholder, the business combination is approved by our board of directors and by the affirmative vote of at least 66 2/3% of the outstanding voting stock which is not owned by the interested stockholder. |
Generally, a business combination includes a merger, consolidation, asset or stock sale or other transaction resulting in a financial benefit to the interested stockholder. Subject to certain exceptions, an interested stockholder is a person who, together with that person’s affiliates and associates, owns, or within the previous three years owned, 15% or more of our voting stock. However, in the case of our Company, PICO and any of its affiliates and subsidiaries and any of their permitted transferees receiving 15% or more of our voting stock will not be deemed to be interested stockholders regardless of the percentage of our voting stock owned by them. This provision could prohibit or delay mergers or other takeover or change in control attempts with respect to us and, accordingly, may discourage attempts to acquire us.
Registration Rights Agreement, Investor Rights Agreement and Tax Receivable Agreement. We entered into a Registration Rights Agreement, an Investor Rights Agreement and a TRA with PICO. Pursuant to the Registration Rights Agreement and the Investor Rights Agreement, PICO may require us to file a registration statement with the SEC relating to the offer and sale of any Class A common stock PICO may receive pursuant to the Exchange Agreement, and PICO has the right to nominate two individuals for election to our board of directors for as long as PICO owns 25.0% or more of the combined voting power of our outstanding Class A and Class B common stock and one individual for as long as it owns at least 10.0%. In the event that any board member nominated by PICO shall for any reason cease to serve as a member of our board of directors during his or her term of office, the resulting vacancy on the board will be filled by an individual selected by PICO. The TRA provides that upon certain changes of control, PICO may be entitled to a significant early termination payment. These agreements could discourage someone from making a significant investment in us or discourage transactions involving a change in control.
Indenture Relating to Our Senior Notes. The indenture governing our 2017 Notes, with an aggregate outstanding principal amount of $75 million as of December 31, 2016, provides the holders thereof the right to require us to repurchase all or any part of their securities at a purchase price in cash equal to 101% of the principal amount of such securities plus accrued and unpaid interest to the date of purchase in the event a change of control occurs (which the indenture generally defines as certain persons (excluding PICO) having the right to acquire more than 35% of the voting power of our voting stock). This provision, which could result in a significant cash payment obligation, could discourage someone from making a significant investment in us or discourage a transaction involving a change in control.
We may change our operational policies, investment guidelines and our business and growth strategies without stockholder approval, which may subject us to different and more significant risks in the future.
Our board of directors determines our operational policies, investment guidelines and our business and growth strategies. Our board of directors may make changes to, or approve transactions that deviate from, those policies, guidelines and strategies without a vote of, or notice to, our stockholders. This could result in us conducting operational matters, making investments or pursuing different business or growth strategies. Under any of these circumstances, we may expose ourselves to different and more significant risks in the future, which could have a material adverse effect on our business, prospects, liquidity, financial condition and results of operations.
The obligations associated with being a public company require significant resources and management attention.
As a public company with listed equity securities, we must comply with numerous laws, regulations and requirements, including the requirements of the Exchange Act, certain corporate governance provisions of the Sarbanes-Oxley Act of 2002, or the “Sarbanes-Oxley Act,” related regulations of the SEC and requirements of the NYSE. The Exchange Act requires that we file annual, quarterly
33
and current reports with respect to our business and financial condition. The Sarbanes-Oxley Act requires, among other things, that we establish and maintain effective internal controls and procedures for financial reporting.
These reporting and other compliance obligations place significant demands on our management, administrative, operational and accounting resources and will cause us to incur significant expenses. We may need to upgrade our systems or create new systems, implement additional financial and management controls, reporting systems and procedures, create or outsource an internal audit function, and hire additional accounting and finance staff. If we are unable to accomplish these objectives in a timely and effective fashion, our ability to comply with the financial reporting requirements and other rules that apply to reporting companies could be impaired. Any failure to maintain effective internal control over financial reporting could have a material adverse effect on our business, prospects, liquidity, financial condition and results of operations.
If we fail to implement and maintain an effective system of internal controls, we may not be able to accurately determine our financial results or prevent fraud. As a result, our stockholders could lose confidence in our financial results, which could materially and adversely affect us.
Effective internal controls are necessary for us to provide reliable financial reports and effectively prevent fraud. We may in the future discover areas of our internal controls that need improvement. We cannot be certain that we will be successful in implementing or maintaining adequate internal control over our financial reporting and financial processes. Furthermore, as we grow our business, our internal controls will become more complex, and we will require significantly more resources to ensure our internal controls remain effective. Additionally, the existence of any material weakness or significant deficiency would require management to devote significant time and incur significant expense to remediate any such material weakness or significant deficiency and management may not be able to remediate any such material weakness or significant deficiency in a timely manner. The existence of any material weakness in our internal control over financial reporting could also result in errors in our financial statements that could require us to restate our financial statements, cause us to fail to meet our reporting obligations and cause stockholders to lose confidence in our reported financial information, all of which could materially and adversely affect us.
We are an “emerging growth company,” and, as a result of the reduced disclosure and governance requirements applicable to emerging growth companies, our Class A common stock may be less attractive to investors.
We are an “emerging growth company,” as defined in the JOBS Act, and we are eligible to take advantage of certain exemptions from various reporting requirements applicable to other public companies but not to emerging growth companies, including reduced disclosure about executive compensation arrangements pursuant to the rules applicable to smaller reporting companies and no requirement to seek non‑binding advisory votes on executive compensation or golden parachute arrangements. We have elected to adopt these reduced disclosure requirements.
We could be an emerging growth company until the last day of the fiscal year following the fifth anniversary of the completion of our IPO, although a variety of circumstances could cause us to lose that status earlier. We cannot predict if investors will find our Class A common stock less attractive as a result of our taking advantage of these exemptions. If some investors find our Class A common stock less attractive as a result of our choices, there may be a less active trading market for our Class A common stock and our stock price may be more volatile.
Any joint venture investments that we make could be adversely affected by our lack of sole decision making authority, our reliance on co-venturers’ financial condition and disputes between us and our co-venturers.
We may co-invest in the future with third parties through partnerships, joint ventures or other entities, acquiring non‑controlling interests in or sharing responsibility for managing the affairs of a land acquisition and/or a development. In this event, we would not be in a position to exercise sole decision-making authority regarding the acquisition and/or development, and our investment may be illiquid due to our lack of control. Investments in partnerships, joint ventures, or other entities may, under certain circumstances, involve risks not present were a third-party not involved, including the possibility that partners or co-venturers might become bankrupt, fail to fund their share of required capital contributions, make poor business decisions or block or delay necessary decisions. Partners or co-venturers may have economic or other business interests or goals which are inconsistent with our business interests or goals, and may be in a position to take actions contrary to our policies or objectives. Such investments may also have the potential risk of impasses on decisions, such as a sale, because neither we nor the partner or co-venturer would have full control over the partnership or joint venture. Disputes between us and partners or co-venturers may result in litigation or arbitration that would increase our expenses and prevent our officers and/or directors from focusing their time and effort on our business. In addition, we may in certain circumstances be liable for the actions of our third-party partners or co-venturers.
34
RISKS RELATED TO OUR OWNERSHIP OF OUR CLASS A COMMON STOCK
We do not intend to pay dividends on our Class A common stock for the foreseeable future.
We currently intend to retain our future earnings, if any, to finance the development and expansion of our business and, therefore, do not intend to pay cash dividends on our Class A common stock for the foreseeable future. Any future determination to pay dividends will be at the discretion of our board of directors and will depend on our financial condition, results of operations, capital requirements, restrictions contained in the indenture governing our 2017 and any other financing instruments and such other factors as our board of directors deems relevant. Accordingly, investors may need to sell their shares of our Class A common stock to realize a return on their investment, and they may not be able to sell their shares at or above the price paid for.
Future sales of our Class A common stock or other securities convertible into our Class A common stock could cause the market value of our Class A common stock to decline and could result in dilution of your shares.
Our board of directors is authorized, without stockholder approval, to cause us to issue additional shares of our Class A common stock or to raise capital through the issuance of preferred stock (including equity or debt securities convertible into Class A common stock), options, warrants and other rights, on terms and for consideration as our board of directors in its sole discretion may determine. Sales of substantial amounts of our Class A common stock could cause the market price of our Class A common stock to decrease significantly. We cannot predict the effect, if any, of future sales of our Class A common stock, or the availability of our Class A common stock for future sales, on the value of our Class A common stock. Sales of substantial amounts of our Class A common stock by PICO or another large stockholder or otherwise, or the perception that such sales could occur, may also adversely affect the market price of our Class A common stock.
Future offerings of debt securities, which would rank senior to our Class A common stock upon our bankruptcy or liquidation, and future offerings of equity securities that may be senior to our Class A common stock for the purposes of dividend and liquidating distributions, may adversely affect the market price of our Class A common stock.
In the future, we may attempt to increase our capital resources by making offerings of debt securities or additional offerings of equity securities. Upon bankruptcy or liquidation, our creditors including holders of our debt securities and shares of preferred stock and lenders with respect to other borrowings, and holders of any outstanding preferred stock will receive a distribution of our available assets prior to the holders of our Class A common stock. Additional equity offerings may dilute the holdings of our existing stockholders or reduce the market price of our Class A common stock, or both. Our preferred stock, if issued, could have a preference on liquidating distributions or a preference on dividend payments or both that could limit our ability to make a dividend distribution to the holders of our Class A common stock. Our decision to issue securities in any future offering will depend on market conditions and other factors beyond our control. As a result, we cannot predict or estimate the amount, timing or nature of our future offerings, and Class A common stock owners bear the risk of our future offerings reducing the market price of our Class A common stock and diluting their ownership interest in our Company.
Non-U.S. holders may be subject to United States federal income tax on gain realized on the sale or disposition of shares of our Class A common stock.
Because of our holdings in United States real property interests, we believe we are and will remain a “United States real property holding corporation” for United States federal income tax purposes. As a result, a non‑U.S. holder generally will be subject to United States federal income tax on any gain realized on a sale or disposition of shares of our Class A common stock unless our Class A common stock is regularly traded on an established securities market (such as the NYSE) and such non‑U.S. holder did not actually or constructively hold more than 5.0% of our Class A common stock at any time during the shorter of (a) the five-year period preceding the date of the sale or disposition and (b) the non-U.S. holder’s holding period in such stock. In addition, if our Class A common stock is not regularly traded on an established securities market, a purchaser of the stock generally will be required to withhold and remit to the IRS 10.0% of the purchase price. A non‑U.S. holder also will be required to file a United States federal income tax return for any taxable year in which it realizes a gain from the disposition of our Class A common stock that is subject to United States federal income tax. We believe that our Class A common stock is regularly traded on an established securities market. However, no assurance can be given in this regard and no assurance can be given that our Class A common stock will remain regularly traded in the future. Non-U.S. holders should consult their tax advisors concerning the consequences of disposing of shares of our Class A common stock.
35
THE FOREGOING FACTORS, INDIVIDUALLY OR IN AGGREGATE, COULD MATERIALLY ADVERSELY AFFECT OUR FINANCIAL CONDITION, RESULTS OF OPERATIONS, CASH FLOW, LIQUIDITY AND THE MARKET PRICE OF OUR CLASS A COMMON STOCK.
36
ITEM 1B. UNRESOLVED STAFF COMMENTS
None.
ITEM 2. PROPERTIES
Our principal executive office is located at 99 Almaden Boulevard, Suite 400, San Jose, CA 95113. We also lease office space in Fresno and Valencia, California; Bellevue, Washington; Charlotte and Raleigh, North Carolina; Myrtle Beach, South Carolina; and Nashville, Tennessee. We believe that our leased office space is adequate to support our business.
ITEM 3. LEGAL PROCEEDINGS
We are from time to time subject to various administrative and legal investigations, claims, and proceedings incidental to our business, including construction and development matters, environmental and safety matters, labor and employment matters, personal injury claims, contractual disputes and taxes. We establish reserves for claims and proceeding when it is probable that liabilities exist and where reasonable estimates can be made. We also maintain insurance that may limit our financial exposure for defense costs, as well as liability, if any, for claims covered by insurance (subject also to deductibles and self-insurance amounts). While any investigation, claim or proceeding has an element of uncertainty, and we cannot predict or assure the outcome of any claim or proceedings involving our Company, we believe the outcome of any pending or threatened proceeding (other than those that cannot be assessed due to their preliminary nature), or all of them combined, will not have material adverse effect on our results of operations, cash flows or financial condition.
The Company is not involved in any material litigation nor, to the Company's knowledge, is any material litigation threatened against it. At December 31, 2016, the Company did not have any accruals for asserted or unasserted matters. For a more detailed description of and financial information about our commitments and contingencies, see Note 13, "Commitments and Contingencies" to our consolidated financial statements included elsewhere in this Annual Report on Form 10-K.
ITEM 4. MINE SAFETY DISCLOSURES
Not applicable.
37
PART II
ITEM 5. MARKET FOR REGISTRANT’S COMMON EQUITY, RELATED STOCKHOLDER MATTERS AND ISSUER PURCHASES OF EQUITY SECURITIES
Our Class A common stock is traded on the New York Stock Exchange ("NYSE") under the symbol “UCP.” The following table sets forth the high and low sales prices per share of our Class A common stock for the quarterly periods indicated, as reported on the NYSE.
Year Ended December 31, 2016 | ||||||||
Period | High | Low | ||||||
First Quarter | $ | 8.40 | $ | 5.46 | ||||
Second Quarter | $ | 8.07 | $ | 7.00 | ||||
Third Quarter | $ | 9.11 | $ | 7.71 | ||||
Fourth Quarter | $ | 12.05 | $ | 8.45 | ||||
Year Ended December 31, 2015 | ||||||||
Period | High | Low | ||||||
First Quarter | $ | 10.77 | $ | 8.08 | ||||
Second Quarter | $ | 9.27 | $ | 7.20 | ||||
Third Quarter | $ | 8.44 | $ | 6.71 | ||||
Fourth Quarter | $ | 8.00 | $ | 6.39 | ||||
On March 1, 2017, there were two holders of record of our Class A common stock and one holder of record of our Class B common stock.
There is no public market for our Class B common stock.
The indenture governing our 2017 Notes contains certain restrictive covenants, including limitations on payment of dividends. We have not declared or paid any dividends since our IPO, and we do not expect to pay any dividends in the foreseeable future. Future cash dividends, if any, will depend upon our financial condition, results of operations, capital requirements, compliance with Delaware law, certain restrictive debt covenants, as well as other factors considered relevant by our board of directors.
Issuer Purchases of Equity Securities
The following table summarizes repurchases of our Class A common stock made during the year ended December 31, 2016:
Period | Total number of shares of Class A common stock purchased (a) | Average price paid per share of Class A common stock (a) | Total number of shares of Class A common stock purchased as part of publicly announced plans or programs (b) | Maximum dollar value of shares of Class A common stock that may yet be purchased under the plans or programs(c) | ||||||||||
June 1 to June 30, 2016 | 21,065 | $ | 7.58 | 21,065 | $ | 4,840,361 | ||||||||
July 1 to July 31, 2016 | 25,620 | $ | 8.08 | 25,620 | $ | 4,633,473 | ||||||||
August 1 to August 31, 2016 | 76,951 | $ | 8.23 | 76,951 | $ | 4,000,006 | ||||||||
September 1 to September 30, 2016 | — | — | — | $ | 4,000,006 | |||||||||
October 1 to October 31, 2016 | — | — | — | $ | 4,000,006 | |||||||||
November 1 to November 30, 2016 | — | — | — | $ | 4,000,006 | |||||||||
December 1 to December 31, 2016 | 22,710 | $ | 11.01 | 22,710 | $ | 3,750,011 | ||||||||
Total | 146,346 | $ | 8.54 | 146,346 | $ | 3,750,011 | ||||||||
(a) | Average price paid per share of Class A common stock repurchased, inclusive of commissions. |
(b) | These amounts represent shares repurchased by the Company under its Stock Repurchase Program. For additional information regarding stock repurchases, see Note 10, “Equity” to the accompanying consolidated financial statements included elsewhere in this Annual Report Form 10-K. |
(c) | Under the Stock Repurchase Program, which was established on June 6, 2016, management is authorized to purchase up to $5.0 million of Class A common stock through June 1, 2018. During the year ended December 31, 2016, there were an aggregate of 146,346 shares of Class A common stock repurchased for $1.2 million, inclusive of commissions. |
Stock Performance Graph
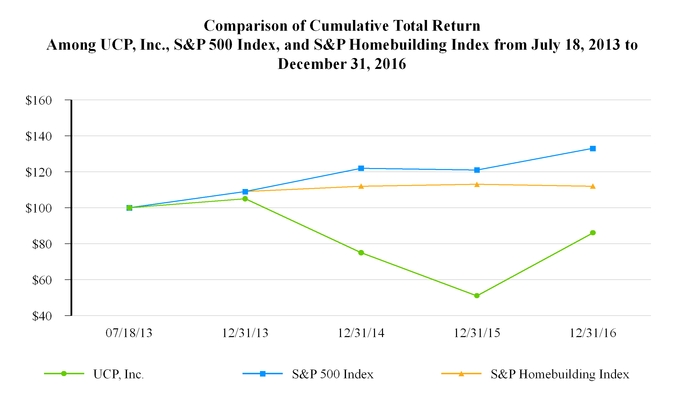
7/18/13 | 12/31/13 | 12/31/14 | 12/31/15 | 12/31/16 | |||||||||||
UCP, Inc. | $ | 100 | $ | 105 | $ | 75 | $ | 51 | $ | 86 | |||||
S&P 500 Index | 100 | 109 | 122 | 121 | 133 | ||||||||||
S&P Homebuilding Index | 100 | 109 | 112 | 113 | 112 | ||||||||||
The above graph compares the cumulative total stockholder return on UCP, Inc.'s Class A common stock against the cumulative total returns of the Standard and Poor's Corporation Composite 500 Index (the "S&P 500 Index") and the Standard and Poor's Homebuilding Index (the "S&P Homebuilding Index"). The graph assumes a $100 investment at the close of the market on July 18, 2013, the initial listing of UCP, Inc.'s Class A common stock on the NYSE, in each of UCP, Inc. Class A common stock, the S&P 500 Index and the S&P Homebuilding Index, held through December 31, 2016. Reinvestment of dividends is assumed in the case of each index.
The closing price of UCP, Inc. Class A common stock on the NYSE was $12.05 per share on December 31, 2016 and $7.20 per share on December 31, 2015. The performance of our common stock depicted in the graphs above represents past performance only and is not indicative of future performance.
38
ITEM 6. SELECTED FINANCIAL DATA
The following table presents certain selected consolidated financial data. The information set forth below is not necessarily indicative of the results of future operations and should be read in conjunction with Item 7, “Management’s Discussion and Analysis of Financial Condition and Results of Operations” and the consolidated financial statements and the related notes thereto included elsewhere in this Annual Report on Form 10-K.
We completed our IPO on July 23, 2013. Due to the timing of our IPO, we present herein certain combined consolidated historical financial data for UCP, LLC for periods prior to the IPO. As such the information for the year ended December 31, 2012 reflects the financial condition and results of operations of our predecessor and the information for the year ended December 31, 2013 reflects the financial condition and results of operations of our predecessor for the portion of the year preceding our IPO and of us for the remainder of 2013.
Year Ended December 31, | |||||||||||||||||||
(In thousands, except per share data) | 2016 | 2015 | 2014 | 2013 | 2012 | ||||||||||||||
Statement of Operations Data: | |||||||||||||||||||
Home sales | $ | 343,919 | $ | 252,597 | $ | 155,417 | $ | 72,511 | $ | 14,060 | |||||||||
Cost of home sales | 280,614 | 206,747 | 129,577 | 57,500 | 9,832 | ||||||||||||||
Impairment on real estate | 458 | 923 | — | — | — | ||||||||||||||
Homebuilding gross profit (a) | 62,847 | 44,927 | 25,840 | 15,011 | 4,228 | ||||||||||||||
Land sales | 5,449 | 21,134 | 32,513 | 20,215 | 44,066 | ||||||||||||||
Cost of land sales | 4,637 | 15,291 | 25,466 | 13,820 | 32,876 | ||||||||||||||
Impairment on real estate | 2,131 | — | — | — | — | ||||||||||||||
Land sales gross (loss) profit (a) | (1,319 | ) | 5,843 | 7,047 | 6,395 | 11,190 | |||||||||||||
Other revenue | — | 5,060 | 3,253 | — | — | ||||||||||||||
Cost of sales - other revenue | — | 4,363 | 2,828 | — | — | ||||||||||||||
Other revenue gross profit | — | 697 | 425 | — | — | ||||||||||||||
Total gross profit | 61,528 | 51,467 | 33,312 | 21,406 | 15,418 | ||||||||||||||
Sales and marketing | 19,257 | 18,943 | 13,748 | 6,647 | 2,875 | ||||||||||||||
General and administrative | 29,161 | 26,878 | 27,406 | 19,368 | 10,103 | ||||||||||||||
Goodwill impairment | 4,223 | — | — | — | — | ||||||||||||||
Total costs and expenses | 340,481 | 273,145 | 199,025 | 97,335 | 55,686 | ||||||||||||||
Other income | 276 | 206 | 121 | 322 | 578 | ||||||||||||||
Net income (loss) before income taxes | $ | 9,163 | $ | 5,852 | $ | (7,721 | ) | $ | (4,287 | ) | $ | 3,018 | |||||||
Benefit (provision) for income taxes | 5,285 | (69 | ) | — | — | — | |||||||||||||
Net income (loss) | $ | 14,448 | $ | 5,783 | $ | (7,721 | ) | $ | (4,287 | ) | $ | 3,018 | |||||||
Net income (loss) attributable to noncontrolling interest | $ | 5,210 | $ | 3,412 | $ | (2,728 | ) | $ | (2,346 | ) | $ | 3,018 | |||||||
Net income (loss) attributable to UCP, Inc. | $ | 9,238 | $ | 2,371 | $ | (4,993 | ) | $ | (1,941 | ) | — | ||||||||
Income (loss) per share | |||||||||||||||||||
Basic | $ | 1.16 | $ | 0.30 | $ | (0.63 | ) | $ | (0.25 | ) | — | ||||||||
Diluted | $ | 1.15 | $ | 0.30 | $ | (0.63 | ) | $ | (0.25 | ) | — | ||||||||
(a) Homebuilding and land sales gross profit includes the impairment on real estate.
39
Year Ended December 31, | |||||||||||||||||||
(In thousands, except unit data) | 2016 | 2015 | 2014 | 2013 | 2012 | ||||||||||||||
Operating Data-Owned Projects: | |||||||||||||||||||
Net new home orders | 933 | 860 | 473 | 205 | 61 | ||||||||||||||
New homes delivered | 820 | 701 | 432 | 196 | 41 | ||||||||||||||
Average sales price of homes delivered (in thousands) | $ | 419 | $ | 360 | $ | 360 | $ | 370 | $ | 343 | |||||||||
Cancellation rate | 12.1 | % | 10.0 | % | 8 | % | 12.8 | % | 12.9 | % | |||||||||
Average active selling communities (1) | 28 | 28 | 16 | 7 | 3 | ||||||||||||||
Active selling communities at end of period (2) | 28 | 28 | 21 | 9 | 4 | ||||||||||||||
Backlog at end of period, number of homes | 362 | 249 | 91 | 35 | 26 | ||||||||||||||
Backlog at end of period, aggregate sales value (in thousands) | $ | 149,639 | $ | 108,773 | $ | 32,499 | $ | 17,121 | $ | 9,182 | |||||||||
Average sales price of backlog (in thousands) | $ | 413 | $ | 437 | $ | 357 | $ | 489 | $ | 353 | |||||||||
(1) “Average active selling communities during the period” refers to the average number of open selling communities at the end of each month during the period.
(2) “Active selling communities” consists of those communities where we have more than 15 or more homes remaining to deliver.
(In thousands, except per share data) | As of December 31, | ||||||||||||||||||
FINANCIAL CONDITION | 2016 | 2015 | 2014 | 2013 | 2012 | ||||||||||||||
Cash and cash equivalents | $ | 40,931 | $ | 39,829 | $ | 42,033 | $ | 87,503 | $ | 10,324 | |||||||||
Real estate inventories | 373,207 | 360,989 | 321,693 | 176,848 | 125,367 | ||||||||||||||
Total assets (a) | 434,106 | 414,697 | 375,139 | 267,320 | 137,534 | ||||||||||||||
Debt (a)(b) | 160,994 | 155,966 | 133,139 | 30,950 | 29,112 | ||||||||||||||
Total liabilities (a) | 207,220 | 197,289 | 163,872 | 49,604 | 35,219 | ||||||||||||||
Total equity | $ | 226,886 | $ | 217,408 | $ | 211,267 | $ | 217,716 | $ | 102,315 | |||||||||
Total UCP, Inc. stockholders' equity | $ | 100,628 | $ | 90,200 | $ | 87,255 | $ | 91,254 | |||||||||||
Number of shares issued at period end (in 000s) | 8,043 | 8,014 | 7,922 | 7,750 | |||||||||||||||
Book value per share (c) | $ | 12.51 | $ | 11.26 | $ | 11.01 | $ | 11.77 | |||||||||||
(a) | As part of the Company’s adoption of Accounting Standards Update ("ASU 2015-03"), approximately $1.5 million and $2.4 million of unamortized debt issuance costs that were included in the prepaid expenses category of other assets as of December 31, 2015 and 2014 have been reclassified from other assets to notes payable and senior notes in the consolidated balance sheets. ASU 2015-03 did not have an impact on the consolidated balance sheets as of December 31, 2013 and 2012. |
(b) Debt comprises of the following:
(In thousands) | 2016 | 2015 | 2014 | 2013 | 2012 | |||||||||||||||
Acquisition (a) | $ | 19,061 | $ | 26,102 | $ | 20,254 | $ | 11,046 | 12,274 | |||||||||||
Development (a) | — | 4,701 | 544 | 6,018 | 12,906 | |||||||||||||||
Construction (a) | 67,597 | 51,683 | 39,711 | 13,886 | 3,932 | |||||||||||||||
Bonds (a) | 74,336 | 73,480 | 72,630 | — | — | |||||||||||||||
Total | $ | 160,994 | $ | 155,966 | $ | 133,139 | $ | 30,950 | $ | 29,112 | ||||||||||
(c) Book value per share is computed by dividing total UCP, Inc. stockholders’ equity by the net of total shares issued less shares held as treasury shares.
40
ITEM 7. MANAGEMENT’S DISCUSSION AND ANALYSIS OF FINANCIAL CONDITION AND RESULTS OF OPERATIONS
This section contains forward-looking statements that involve risks and uncertainties. Our actual results may vary materially from those discussed in the forward-looking statements as a result of various factors, including, without limitation, those set forth in "Risk Factors" and the other matters set forth in this Annual Report on Form 10-K. See "Special Note Regarding Forward-Looking Statements." In addition, the following Management’s Discussion and Analysis of Financial Condition and Results of Operations should be read in connection with the information presented in the Company’s consolidated financial statements and the related notes included elsewhere in this Annual Report on Form 10-K.
OVERVIEW
Select Operating Metrics
For the year ended December 31, 2016, as compared to 2015:
•Consolidated net income increased to $14.4 million as compared to $5.8 million;
•Basic earnings per share of Class A common stock (“EPS”) for the year was $1.16 as compared to $0.30;
•Net new home orders increased 8.5% to 933;
•Backlog value increased 37.6% to $149.6 million;
•Home deliveries increased 17.0% to 820;
•Average sales price ("ASP") of a home closed increased 16.4% to $419,000 per home;
•Homebuilding revenue increased by $91.3 million, or 36.2%, to $343.9 million;
•Consolidated gross margin decreased by 0.9% or 90 basis points to 17.6%;
•Homebuilding gross margin increased by 50 basis points to 18.3%;
•As a percentage of total revenue, sales and marketing expenses decreased to 5.5% from 6.8%; and
• | As a percentage of total revenue, general and administrative ("G&A") expenses decreased to 8.3% from 9.6% |
For the quarter ended December 31, 2016, as compared to the same period during 2015:
•Consolidated net income increased to $9.3 million as compared to $7.6 million;
•Basic EPS for the quarter was $0.90 as compared to $0.40;
•Net new home orders increased 26.1% to 232;
•Home deliveries increased 15.2% to 257;
•ASP of a home closed increased 1.8% to $406,000 per home;
•Homebuilding revenue increased by $15.5 million, or 17.5%, to $104.4 million;
•Consolidated gross margin decreased by 1.1% or 110 basis points to 18.5%;
•Homebuilding gross margin increased by 60 basis points to 18.6%;
•As a percentage of total revenue, sales and marketing expenses increased to 5.4% from 5.3%; and
•As a percentage of total revenue, G&A expenses increased to 9.6% from 7.1%
During the year ended December 31, 2016, our homebuilding revenues increased by $91.3 million, or 36.2%, to $343.9 million, as compared to $252.6 million for the year ended December 31, 2015. The growth in homebuilding revenue was primarily due to the 17.0% increase in homes delivered and the 16.4% increase in ASP of homes delivered during the year ended December 31, 2016 as
41
compared to during the year ended December 31, 2015. Homes delivered during the year ended December 31, 2016 increased to 820 homes delivered during the year ended December 31, 2016 as compared to 701 homes delivered for year ended December 31, 2015. The ASP of homes delivered increased to $419,000 during the year ended December 31, 2016 as compared to $360,000 during the year ended December 31, 2015.
As a result of strong market demand, we have been able to reduce our use of sales incentives. For the year ended December 31, 2016, sales incentives accounted for 2.1% of revenues down from 2.6% for the year ended December 31, 2015. The most significant decline in the use of sales incentives was in our Central Valley, Tennessee, the Pacific Northwest and North Carolina divisions, partially offset by increases in our South Carolina, and Southern California divisions. The Bay Area division remained relatively flat, with only a small increase. The major driver of reduced sales incentives is strong consumer demand. Sales incentives are used when opening new communities to spur initial sales activity or when consumer demand has not been as strong as expected. In the case of South Carolina, we opened a new community and a new product line in an existing community spurring slightly higher sales incentives. In the case of Southern California, our sales pace slowed and we used sales incentives to regain sales pace. Sales incentives are a reduction to revenue as we record sales incentives as a reduction in the sales price of a home.
Our land development segment revenues, given our opportunistic strategy towards this business segment, decreased by $15.7 million, or 74.2%, to $5.4 million during the year ended December 31, 2016, as compared to $21.1 million during the year ended December 31, 2015. We regularly analyze the highest and best use of each of our land holdings. In 2016, we determined that there were not the opportunities to sell land at margins that justified foregoing the margins available from building homes through our homebuilding operations, Benchmark Communities as compared to 2015.
Other income generated during the year ended December 31, 2015 of $5.1 million was from our construction management services provided to property owners primarily under “cost plus fee” contracts in Hilton Head, South Carolina. We acquired this business as a result of the Citizens Acquisition. The business was subsequently sold in the fourth quarter of 2015 and therefore, other revenues from construction management services were not generated during the year ended December 31, 2016.
Consolidated net income was $14.4 million during the year ended December 31, 2016, as compared to $5.8 million during the year ended December 31, 2015. The increase of $8.7 million in net income from the prior year was due mainly to an increase in home deliveries during the year ended December 31, 2016 that drove homebuilding revenue growth to $343.9 million from $252.6 million for the year ended December 31, 2015. The increase in consolidated net income in 2016 over 2015 was also driven by the removal of our valuation allowance on our deferred tax assets in the amount of $5.5 million. The increase in consolidated net income was partially offset by a decrease in our land sales gross margin to a loss of $1.3 million in 2016 as compared to a profit of $5.8 million in 2015.
Furthermore, our net income in 2016 was positively impacted by our ability to increase revenue while maintaining sales and marketing and general and administration expenses ("SG&A"), which improved by 15.2%, to 13.9% of revenue during the year ended December 31, 2016 from 16.4% of revenue during the year ended December 31, 2015. The combination of increasing unit deliveries and revenue throughout the year with a focus on managing our SG&A expenses reduced our operating expenses as a percentage of revenue.
We continued to focus our efforts on allocating capital in order to enhance our return metrics. Each new opportunity is evaluated on its ability to meet our risk-adjusted return thresholds. We require higher returns when we take additional risk by entitling and developing land, while we will accept slightly lower returns when we are purchasing finished lots on an option basis. Our focus is on return metrics including internal rate of return, return on assets, return on equity and return on invested capital.
Once underway, our focus is on effectively managing our existing communities, inventory and absorption pace in order to seek improved gross margins. Our approach is proactive and focused on identifying operational efficiencies across all of our operations, including our corporate office.
Backlog consists of homes under contract that have not yet been delivered. Our backlog value as of December 31, 2016 was $149.6 million, representing approximately a $40.9 million increase, or 37.6%, as compared to our December 31, 2015 backlog of $108.8 million. The increase in backlog value was primarily due to strong new orders growth for the year ended December 31, 2016 as compared to 2015 when new orders increased 8.5% on a year-over-year basis. The number of homes in backlog increased by 113 homes, representing 45.4%, as of December 31, 2016, as compared to 249 homes in backlog as of December 31, 2015. The ASP of each home in backlog decreased by 5.5% to $413,000 as of December 31, 2016 from $437,000 as of December 31, 2015 as a result of product and geographic mix.
As of December 31, 2016, we had $40.9 million of cash and cash equivalents, excluding restricted cash, on hand. We had outstanding debt of $161.0 million and equity of $226.9 million. As a result, our Debt-to-Capital and Net Debt-to-Capital was 41.5% and 37.3%, respectively. Our Net Debt-to-Capital is a non-GAAP financial measure. See “Liquidity and Capital Resources-Debt-to-
42
Capital and Net Debt-to-Capital Ratios” below for a reconciliation of this non-GAAP financial measure to the most directly comparable financial measure calculated and presented in accordance with GAAP.
We are focused on finding the proper balance between maintaining adequate land positions to provide for continued growth and prudently managing our balance sheet. In 2016, land investment opportunities that met our underwriting criteria were such that our total lots owned and controlled increased by 760 lots. As of December 31, 2016, we owned or controlled a total of 6,638 residential lots, representing an 8.1 year supply based on our delivery of 820 homes for the year ended December 31, 2016. We owned or controlled 4,075 lots in our West operating segment and 2,563 lots in our Southeast operating segment.
As of December 31, 2016, we had 521 homes in inventory. Excluding model homes, we had 395 homes under construction and 60 completed homes as shown in the charts below:
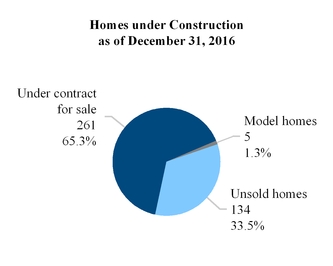
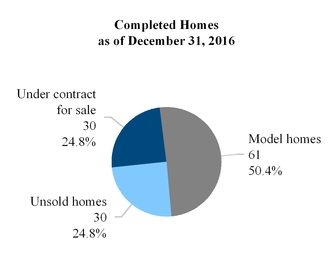
Our Business Environment and Current Outlook
During the year ended December 31, 2016, the overall U.S. housing market continued to show signs of improvement, driven by factors such as continued supply and demand imbalance, low mortgage rates, employment growth and rising consumer confidence. Individual markets continue to experience varying results, as local home inventories, affordability and employment factors strongly influence local markets.
Homebuilding and land development are local businesses. As a result, we expect local market conditions will affect our community count, revenue and operating performance. Local market trends are the principal factors that impact our revenue and our revenue-related expenses. For example, when these trends are favorable, we expect our revenues from homebuilding and land development, as well as the expenses that vary with revenue, to generally increase; conversely, when these trends are negative, we expect our revenue and expenses that vary with revenue to generally decline, although in each case the impact may not be immediate or directly proportional. When trends are favorable, we expect to increase our community count by opening additional communities and expanding existing communities; conversely, when these trends are negative, we expect to reduce or maintain our community count or decrease the pace at which we open additional communities and expand existing communities.
Our operations for the year ended December 31, 2016 reflect our continued focus on a number of initiatives, including growing our homebuilding operations and revenues (by seeking increased home sales at our existing communities), improving our gross margin percentage, improving our operating efficiency (by seeking to reduce non-revenue-related expenses as a percentage of revenue), and managing our balance sheet (by maintaining appropriate cash balances, real estate inventories and leverage).
We believe that our land position in markets where the approval process for land development and home construction is stringent and time consuming gives us a competitive advantage. We believe that by serving diverse market segments, including first-time, move-up, empty-nester, active-adult and second-home buyers, mitigates the risk associated with any one market segment. We also believe that we operate in geographic markets that currently have strong housing fundamentals. These markets include the San Francisco Bay area, San Jose and the South Bay, Monterey, greater Los Angeles and the Central Valley areas of California, Seattle, Washington, Charlotte, North Carolina, Myrtle Beach, South Carolina and Nashville, Tennessee.
43
During 2017, we intend to seek revenue growth and increased productivity from our homebuilding operations in both our West and Southeast operating segments, with significant focus on our Southeast operating divisions as well as our Pacific Northwest division as we work to more fully leverage our operating expense investment. We also intend to continue our strategy of selectively buying and selling land when we believe that it is opportunistic to do so. We also intend to seek additional regional and corporate-level operating efficiencies. Additionally, we intend to maintain appropriate cash balances and liquidity in order to meet our obligations and provide growth capital for our operations.
44
RESULTS OF OPERATIONS
Consolidated Financial Data - For the Years Ended December 31, 2016, 2015 and 2014:
Year ended December 31, | |||||||||||
(In thousands) | 2016 | 2015 | 2014 | ||||||||
Revenue: | |||||||||||
Homebuilding | $ | 343,919 | $ | 252,597 | $ | 155,417 | |||||
Land development | 5,449 | 21,134 | 32,513 | ||||||||
Other | — | 5,060 | 3,253 | ||||||||
Total revenue | 349,368 | 278,791 | 191,183 | ||||||||
Cost of sales: | |||||||||||
Homebuilding | 280,614 | 206,747 | 129,577 | ||||||||
Land development | 4,637 | 15,291 | 25,466 | ||||||||
Other | — | 4,363 | 2,828 | ||||||||
Impairment on real estate | 2,589 | 923 | — | ||||||||
Gross margin | 61,528 | 51,467 | 33,312 | ||||||||
Expenses: | |||||||||||
Sales and marketing | 19,257 | 18,943 | 13,748 | ||||||||
General and administrative | 29,161 | 26,878 | 27,406 | ||||||||
Goodwill impairment | 4,223 | — | — | ||||||||
Total expenses | 52,641 | 45,821 | 41,154 | ||||||||
Income (loss) from operations | 8,887 | 5,646 | (7,842 | ) | |||||||
Other income | 276 | 206 | 121 | ||||||||
Net income (loss) before tax | $ | 9,163 | $ | 5,852 | $ | (7,721 | ) | ||||
Benefit (provision) for income taxes | 5,285 | (69 | ) | — | |||||||
Net income (loss) | $ | 14,448 | $ | 5,783 | $ | (7,721 | ) | ||||
Non-GAAP Financial Measures
In addition to results reported in accordance with GAAP, we have provided information in this report derived from our consolidated financial statements but not prepared in accordance with GAAP. These are considered non-GAAP financial measures and should be construed as supplemental information along with our financial statements prepared in accordance with GAAP. Specifically, we refer to the following non-GAAP financial measures in various sections of this report:
•Adjusted gross margin; and
•Net debt-to-capital ratio
Our reasons for the use of non-GAAP financial measures and reconciliations to the most directly comparable GAAP financial measure calculated and presented in accordance with GAAP are included below in this Management's Discussion and Analysis of Financial Condition and Results of Operations.
45
Select Operating Metrics - For the Years Ended December 31, 2016, 2015 and 2014
Net New Home Orders and Cancellation Rate
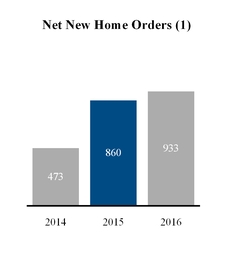
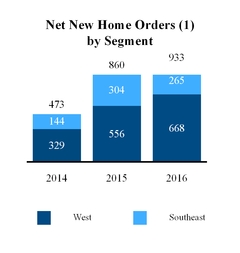
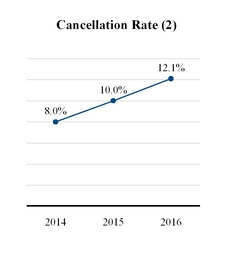
(1) “Net new home orders” refers to new home sales contracts reduced by the number of sales contracts canceled during the relevant period. (2) “Cancellation rate” refers to sales contracts canceled divided by sales contracts executed during the relevant period. |
Net new home orders during the year ended December 31, 2016 increased by 73 homes, or 8.5%, as compared to 2015. In our West operating segment, net new orders grew 20.1% primarily in our Bay Area division during the year ended December 31, 2016. This growth in our Bay Area division was a result of strong demand coupled with an increase in active selling communities in our Bay Area division to nine from six active selling communities during the years ended December 31, 2016 compared to 2015. Net new home orders in our West operating segment also increased in our Central Valley division during the year ended December 31, 2016. Our West operating segment continues to experience strong demand that is exceeding building capacity in many communities. As a result, we continue to limit sales to approximately a six-month supply of backlog. Our Southeast operating segment experienced a decline of 12.8% during the year ended December 31, 2016 in net new home orders across all divisions. During the year ended December 31, 2016, net new order activity in our Southeast operating segment was adversely impacted by weather that delayed community openings, the abandonment of a number of land positions that did not meet our underwriting criteria that resulted in a lack of available lots to build upon in Charlotte and Nashville. We intend to seek additional land purchases in our Southeast operating segment in 2017 to provide adequate land to increase new order activity.
For the year ended December 31, 2015, net new home orders increased by 387 homes, or 81.8%, as compared to 2014. Our West and Southeast operating segments grew 69.0% and 111.1%, respectively, during the year ended December 31, 2015 as compared to 2014. Our West operating segment continued to experience strong demand that exceeded building capacity in many communities. As a result, sales were limited to approximately a six-month supply of backlog. The increase in average number of active selling communities during the year ended December 31, 2015 accounted for 95.3% of the growth in net new orders. In addition, improvement in our absorption per community per month accounted for 4.7% of the increase in net new orders during the year ended December 31, 2015.
46
Active Selling Communities and Absorption
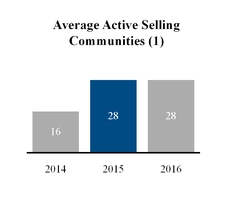
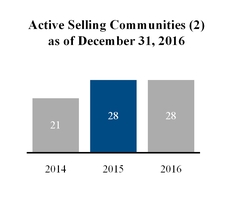
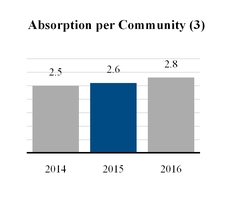
(1) “Average Active Selling Communities” refers to the average number of open selling communities at the end of each month during the period. (2) “Active Selling Communities” consists of those communities where we have more than 15 or more homes remaining to deliver. (3) “Absorption per Community” refers to the number of net new home orders sold per month in each active selling community for the period. |
The number of average active selling communities for the year ended December 31, 2016 remained constant as compared to 2015. During the year ended December 31, 2016, we closed-out ten communities, five in our Central Valley division, two in our Tennessee division and one in each of our SF Bay, Washington and South Carolina divisions. During the year ended December 31, 2016 we opened ten new communities, four in our SF Bay division, three in our Central Valley division and one in each of our North Carolina, South Carolina and Tennessee divisions.
For the year ended December 31, 2015, the number of average active selling communities increased by 12 communities, or 75.0%, as compared to 2014.
For both years ended December 31, 2016 and 2015, we had 18 average active selling communities located in our West operating segment and 10 in our Southeast operating segment.
Absorption per community per month during the year ended December 31, 2016 increased by 0.2 homes per community per month as compared to 2015. This was primarily due to growth in absorption in our West and Southeast operating segments to 3.1 and 2.2 homes per community per month, respectively, during the year ended December 31, 2016 as compared to 2.6 and 2.5 homes per community per month in 2015.
47
Backlog - As of December 31, 2016, 2015 and 2014
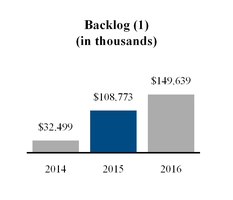
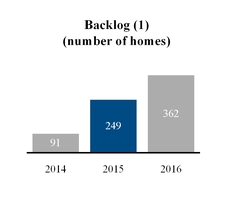
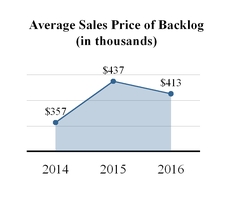
Our backlog value as of December 31, 2016 represented an increase of approximately $40.9 million, or 37.6%, as compared to our backlog value as of December 31, 2015. The increase as of December 31, 2016 was due to an increase of 113 unit homes in backlog, partially offset by a decrease of $24,000 in the ASP of homes in backlog as of December 31, 2016, as compared to 2015. The increase in the number of homes in backlog was a result of an increase of 72 homes in backlog in our West operating segment and an increase of 41 homes in backlog in our Southeast operating segment as of December 31, 2016, as compared to December 31, 2015.
As of December 31, 2015, our backlog value increased by $76.3 million as compared to 2014. The increase as of December 31, 2015 as compared to 2014 was related to the increase in net new orders resulting in an increase of 158 homes in backlog, and an $80,000 increase in ASP of homes in backlog. The change in backlog was attributable to a greater number of homes from the higher cost markets in the West homebuilding reporting segment.
The mix of homes in backlog between our two operating segments changed as of December 31, 2016 as compared to 2015 and 2014 (as shown in the charts below):
Percentage of Homes in Backlog by Segment
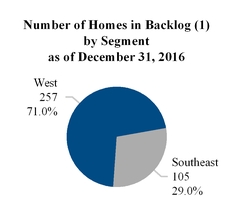
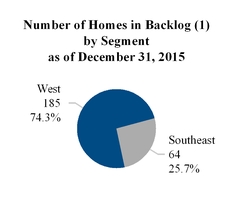
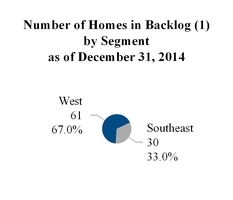
(1) | “Backlog” refers to homes under sales contracts that have not yet closed at the end of the relevant period. Sales contracts relating to homes in backlog may be canceled by the purchaser for a number of reasons, such as the prospective purchaser's inability to obtain mortgage financing. Upon a cancellation, the escrow deposit is returned to the prospective purchaser (other than with respect to certain design-related deposits, which we retain). Accordingly, backlog may not be indicative of our future revenue. |
48
Owned and Controlled Lots - As of December 31, 2016, 2015 and 2014
We owned or controlled, pursuant to purchase or option contracts, the number of lots set forth in the graphs below:
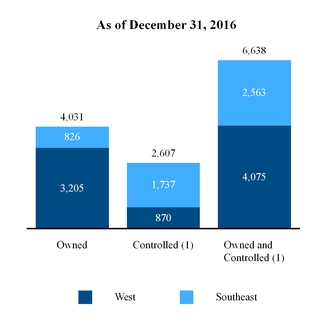
As of December 31, 2016, our total lots owned and controlled increased by 760 lots since December 31, 2015. Total owned decreased by 720 lots and total controlled increased by 1,480 lots. On a segment basis, our West operating segment decreased by 209 lots and our Southeast operating segments increased by 969 lots.
Of the 6,638 owned and controlled lots as of December 31, 2016, 1,048 lots were finished, 1,083 lots were under development, 3,747 lots were approved with primary entitlements and 760 lots were unentitled, of which 635 of the unentitled lots are under our control while we process entitlements. This increase in the number of controlled lots reflects our strategy of seeking to increase deliveries in our three Southeast divisions and the Pacific Northwest division in order to more fully leverage our operating expense investment. The decrease in owned lots during 2016 reflects our focus on managing our existing inventory across our geographies with a focus on improving our return metrics. On a segmented basis, our West operating segment decreased the number of owned lots by 664 and our Southeast operating segment decreased the number of owned lots by 56. Our West operating segment increased the number of controlled lots by 455 and our Southeast operating segments increased the number of controlled lots by 1,025.
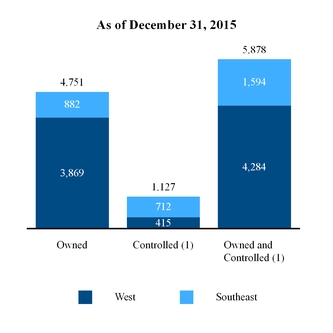
As of December 31, 2015, our total lots owned and controlled decreased by 490 lots since December 31, 2014. Total owned decreased by 692 lots and total controlled increased by 202 lots. On a segment basis, our West operating segment decreased by 595 lots and our Southeast operating segment increased by 105 lots.
Of the 5,878 owned and controlled lots as of December 31, 2015, 1,064 lots were finished, 3,973 lots were approved with primary entitlements and 841 lots were unentitled. Our controlled lot inventory of 1,127 consisted of five new projects as of December 31, 2015.
49
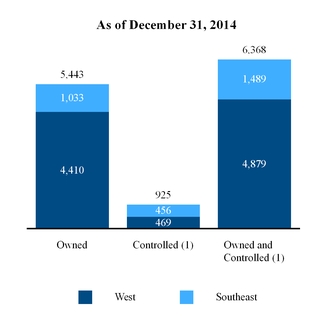
As of December 31, 2014, our lots owned and controlled totaled 6,368 lots. Southeast projects were added during 2014 as part of our Citizens Acquisition which added 113 owned and 445 controlled lots to our owned and controlled lot portfolio. Additionally, 1,300 lots were added to our owned portfolio, most of which were purchased from our controlled lots as of December 31, 2013. Moreover, as of December 31, 2014, our controlled lot inventory of 925 consisted of five new projects.
Of our 6,368 owned and controlled lots as of December 31, 2014, 1,382 lots were finished, 4,707 lots were approved with primary entitlements and 279 lots were unentitled.
(1) | Controlled lots are those subject to a purchase or option contract. |
50
Revenue
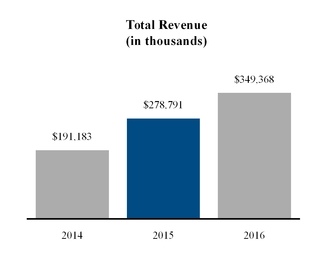
For the year ended December 31, 2016, total revenue increased by $70.6 million, or 25.3%, as compared to 2015. The increase in total revenue was the result of an increase of 119 homes in home deliveries, an increase of $48.4 million in the ASP of homes delivered during the 2016 period, partially offset with a decrease in land development revenue, as compared to 2015.
Total revenue for the year ended December 31, 2015 increased by $87.6 million, or 45.8%, as compared to 2014. The increase in revenue during 2015 was primarily the result of an increase in home deliveries, attributable to several factors, including an increase in sales absorption per community. These factors were favorably impacted during 2015, in part, by a continued housing recovery in the majority of our markets, which contributed to increased demand for homes by home-buyers and our ability to open new communities. The increase in total revenue was moderated by a decrease in land development revenue, as more fully described below.
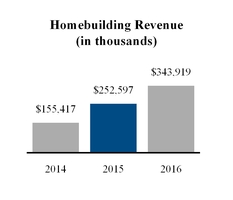
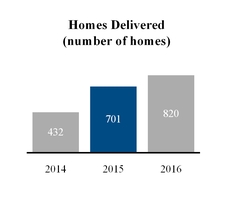
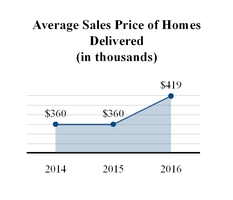
Homebuilding revenue for the year ended December 31, 2016 increased by $91.3 million, or 36.2%, as compared to 2015. The increase was primarily the result of a 17.0% increase in home deliveries and a 16.4% increase in the ASP of homes delivered to $419,000 during the 2016 period, as compared to 2015. Of this revenue increase, $48.4 million was related to the increase in ASP and $42.9 million was related to the increase in the number of homes delivered. The increase in the ASP during the 2016 period was primarily the result of an increase in the number of homes delivered in our West operating segment, which accounted for 72.7% of deliveries, or a 38.0% increase, during the year ended December 31, 2016, as compared to 2015.
For the year ended December 31, 2015, homebuilding revenue increased by $97.2 million, or 62.5%, as compared to 2014. This was primarily the result of a 62.3% increase in the number of homes delivered in 2015, as compared to 2014. The increase in number of homes delivered was mainly caused by a 75.0% increase in the number of average active selling communities in 2015 as compared to 2014. The ASP of a delivered home remained relatively constant at approximately $360,000 during 2015 and 2014, primarily due to the similar regional mix of homes sold.
51
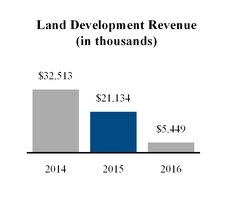
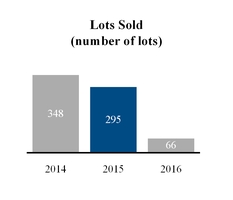
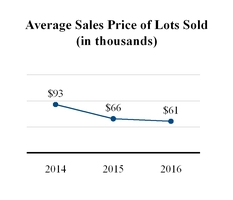
Land development revenue for the year ended December 31, 2016 decreased by $15.7 million, or 74.2%, as compared to 2015. During the year ended December 31, 2016, land development revenue consisted of the sale of 65 lots in our Sundance community for $3.9 million, as previously impaired and disclosed during the year. The remaining land development revenue during the year ended December 31, 2016 was related to the sale of two parcels of land in Fresno, California, for $1.5 million. The fluctuation in land development revenues from year to year, and quarter to quarter is consistent with our stated strategy of opportunistically selling land depending on a number of factors, including risk adjusted return metrics, opportunity costs, and local market dynamics.
For the year ended December 31, 2015, land development revenue decreased by $11.4 million, or 35.0%, as compared to 2014. This was primarily the result of a $27,000 decrease in the price per lot, or 29.2%, during 2015, as compared to 2014. Of the $11.4 million decrease in land development revenue, approximately $8.1 million was due to the decrease in pricing and $5.0 million was due to the decrease in number of lots sold, partially offset by $1.6 million of previously deferred revenue, recognized in 2015 as a result of partially satisfying certain performance obligations related to a land sale. The lots sold during 2015 were a mix of improved and unimproved parcels primarily in our Western land development segment within the Washington Puget Sound, Central Valley and Southern California areas, and our Southeast land development segment within North Carolina.
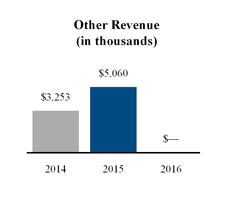
Other revenue for the year ended December 31, 2016 was zero and approximately $5.1 million and $3.3 million for years ended December 31, 2015 and 2014, respectively.
Other revenue during 2015 and 2014 was related to construction management services provided to third-party property owners primarily under “cost plus fee” contracts, which was conducted in our Southeast operations. We sold this business in the fourth quarter of 2015, and we no longer provide construction management services to third parties.
52
Cost of Sales
Cost of sales in our homebuilding segment for the year ended December 31, 2016 increased $73.9 million, or 35.7%, as compared to 2015. Of this increase, $35.3 million was due to the increase in the number of homes delivered, and $38.1 million was due to the increase in the ASP and therefore cost per home sold during 2016. In addition, we recognized real estate impairment charges on home inventory of $0.5 million resulting from $0.2 million that occurred during the third quarter of 2016 related to the remaining four completed homes available for sale in our Heathers at Westport community, and an additional $0.3 million that occurred during the second quarter of 2016 related to homes under construction at our Sundance community.
For the year ended December 31, 2015, the cost of sales for our homebuilding segment increased $78.1 million, or 59.6%, as compared to 2014. The increase was primarily due to the increase in the number of homes delivered, partially offset by the decrease in the average cost per home sold during 2015. In addition, we recorded real estate impairment charges of $0.9 million during the year ended December 31, 2015 on our real estate inventory at River Run, located in Bakersfield, California.
Cost of sales in our land development segment for the year ended December 31, 2016 decreased $10.7 million, or 69.7%, as compared to 2015. The was primarily due to a decrease in both the number of lots sold and the average cost per lot sold in 2016 as compared to 2015. In addition, during the year ended December 31, 2016 we recognized $2.1 million of real estate impairment loss on land inventory at our Sundance community for the 65 lots that were under contract for sale, which closed in 2016. Abandonment charges during 2016 were $0.5 million.
For the year ended December 31, 2015, the cost of sales for our land development segment decreased $10.2 million, or 40.0%, as compared to 2014. The decrease was primarily due to a decrease in both the number of lots sold and the average cost per home sold during 2015 as compared to 2014. For the year ended December 31, 2015, there were no real estate impairment charges to land inventory. Abandonment charges during 2015 were $0.2 million.
We continuously evaluate our real estate inventories for impairment when conditions exist suggesting that the carrying amount of real estate inventories is not fully recoverable and may exceed its fair value. Given the real estate impairment charge at our Heathers at Westport community, we are closely monitoring the potential future impairment on real estate inventories we have acquired through the Citizens Acquisition, specifically in our North Carolina division.
Non-GAAP Financial Measure
We have provided information in this report relating to “adjusted gross margin” which is a non-GAAP financial measure. The most directly comparable GAAP financial measure is gross margin. We calculate adjusted gross margin from GAAP gross margin by adding back capitalized interest, and impairment and abandonment charges. We use adjusted gross margin information as a supplemental measure when evaluating our operating performance. We believe this information is meaningful, because it isolates the impact that leverage and non-cash impairment and abandonment charges have on gross margin. However, because adjusted gross margin information excludes interest expense, and impairment and abandonment charges, all of which have real economic effects and could materially impact our results, the utility of adjusted gross margin information as a measure of our operating performance is limited.
Other companies may not calculate adjusted gross margin information in the same manner that we do. Accordingly, adjusted gross margin information should be considered only as a supplement to gross margin information as a measure of our performance.
53
Gross Margin (“GM”) and Adjusted Gross Margin (“Adjusted GM”)
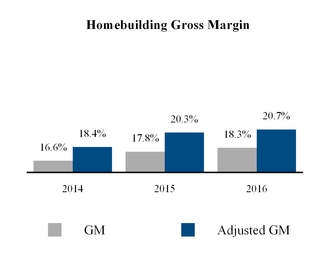
Homebuilding gross margin percentage during the year ended December 31, 2016, increased 0.5%, as compared to 2015. The increase in homebuilding gross margin during 2016 was primarily due to: (1) our ability to move sales prices higher coupled with our ability to contain the impact of increasing labor and material costs, and (2) the continued shift to more profitable pre-sales homes while reducing the number of sales of unsold homes. The increase in gross margin percentage in 2016 over 2015 was also partially impacted by a reduction in homebuilding impairments in 2016 as compared to 2015. In 2016, we incurred impairment of home inventory of $0.5 million as compared to $0.9 million in 2015.
For the year ended December 31, 2015, our homebuilding gross margin percentage increased 1.2%, as compared to 2014. In addition, we drove efficiency in our purchasing and field operations coupled with a focus on cost management and gaining additional incremental revenue from pre-sales, reducing the number of sales of unsold homes, increasing lot premiums where appropriate and more deliberate offerings of upgrades.
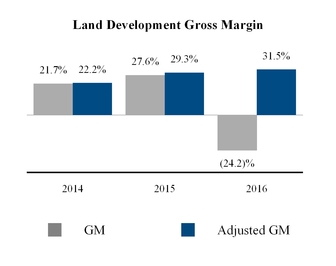
Land development gross margin percentage during the year ended December 31, 2016 decreased 51.8%, as compared to 2015, primarily due to $2.1 million in real estate impairment charges during 2016 coupled with a reduction in land development revenue and a decision to abandon a number of land acquisition opportunities resulting in $0.5 million in abandonment charges. The real estate impairment charges of $2.1 million during 2016 was related to a proposed land sale at Sundance, which closed during 2016.
For the year ended December 31, 2015, our land development gross margin percentage increased 5.9%, as compared to 2014, primarily attributable to a lower cost basis of the lots sold during 2015 relative to the sale price as compared to 2014.
54
The following table provides a reconciliation of adjusted gross margin information to gross margin information the most comparable GAAP financial measure:
Year Ended December 31, | ||||||||||||||||||||
(Dollars in thousands) | 2016 | % | 2015 | % | 2014 | % | ||||||||||||||
Consolidated Gross Margin & Adjusted Gross Margin | ||||||||||||||||||||
Revenue | $ | 349,368 | 100.0 | % | $ | 278,791 | 100.0 | % | $ | 191,183 | 100.0 | % | ||||||||
Cost of sales | 287,840 | 82.4 | % | 227,324 | 81.5 | % | 157,871 | 82.6 | % | |||||||||||
Gross margin | 61,528 | 17.6 | % | 51,467 | 18.5 | % | 33,312 | 17.4 | % | |||||||||||
Add: interest in cost of sales | 8,118 | 2.3 | % | 5,592 | 2.0 | % | 2,792 | 1.5 | % | |||||||||||
Add: impairment and abandonment charges | 3,112 | 0.9 | % | 1,075 | 0.4 | % | 173 | 0.1 | % | |||||||||||
Adjusted gross margin(1) | $ | 72,758 | 20.8 | % | $ | 58,134 | 20.9 | % | $ | 36,277 | 19.0 | % | ||||||||
Consolidated gross margin percentage | 17.6 | % | 18.5 | % | 17.4 | % | ||||||||||||||
Consolidated adjusted gross margin percentage(1) | 20.8 | % | 20.9 | % | 19.0 | % | ||||||||||||||
Homebuilding Gross Margin & Adjusted Gross Margin | ||||||||||||||||||||
Homebuilding revenue | $ | 343,919 | 100.0 | % | $ | 252,597 | 100.0 | % | $ | 155,417 | 100.0 | % | ||||||||
Cost of home sales | 281,072 | 81.7 | % | 207,670 | 82.2 | % | 129,577 | 83.4 | % | |||||||||||
Homebuilding gross margin | 62,847 | 18.3 | % | 44,927 | 17.8 | % | 25,840 | 16.6 | % | |||||||||||
Add: interest in cost of home sales | 7,737 | 2.2 | % | 5,275 | 2.1 | % | 2,789 | 1.8 | % | |||||||||||
Add: impairment and abandonment charges | 458 | 0.1 | % | 1,042 | 0.4 | % | — | — | % | |||||||||||
Adjusted homebuilding gross margin(1) | $ | 71,042 | 20.7 | % | $ | 51,244 | 20.3 | % | $ | 28,629 | 18.4 | % | ||||||||
Homebuilding gross margin percentage | 18.3 | % | 17.8 | % | 16.6 | % | ||||||||||||||
Adjusted homebuilding gross margin percentage(1) | 20.7 | % | 20.3 | % | 18.4 | % | ||||||||||||||
Land Development Gross Margin & Adjusted Gross Margin | ||||||||||||||||||||
Land development revenue | $ | 5,449 | 100.0 | % | $ | 21,134 | 100.0 | % | $ | 32,513 | 100.0 | % | ||||||||
Cost of land development sales | 6,768 | 124.2 | % | 15,291 | 72.4 | % | 25,466 | 78.3 | % | |||||||||||
Land development gross margin | (1,319 | ) | (24.2 | )% | 5,843 | 27.6 | % | 7,047 | 21.7 | % | ||||||||||
Add: interest in cost of land development | 381 | 7.0 | % | 317 | 1.5 | % | 3 | — | % | |||||||||||
Add: impairment and abandonment charges | 2,654 | 48.7 | % | 33 | 0.2 | % | 173 | 0.5 | % | |||||||||||
Adjusted land development gross margin(1) | $ | 1,716 | 31.5 | % | $ | 6,193 | 29.3 | % | $ | 7,223 | 22.2 | % | ||||||||
Land development gross margin percentage | (24.2 | )% | 27.6 | % | 21.7 | % | ||||||||||||||
Adjusted land development gross margin percentage(1) | 31.5 | % | 29.3 | % | 22.2 | % | ||||||||||||||
Other Revenue Gross and Adjusted Margin | ||||||||||||||||||||
Other revenue | — | — | % | $ | 5,060 | 100.0 | % | $ | 3,253 | 100.0 | % | |||||||||
Cost of revenue | — | — | % | 4,363 | 86.2 | % | 2,828 | 86.9 | % | |||||||||||
Other revenue gross margin | — | — | % | $ | 697 | 13.8 | % | $ | 425 | 13.1 | % | |||||||||
Other revenue gross margin percentage | — | % | 13.8 | % | 13.1 | % | ||||||||||||||
* | Percentages may not add due to rounding. |
(1) | Adjusted gross margin, adjusted homebuilding gross margin and adjusted land development gross margin are non-GAAP financial measures. |
55
Sales and Marketing, and General and Administrative Expenses
Our operating expenses for the years ended December 31, 2016, 2015 and 2014 were as follows:
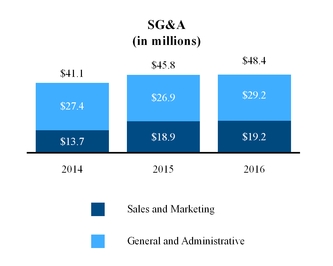
As a percentage of total revenue | |||||||||
Year ended December 31, | |||||||||
2016 | 2015 | 2014 | |||||||
Sales and marketing | 5.5 | % | 6.8 | % | 7.2 | % | |||
G&A | 8.3 | % | 9.6 | % | 14.3 | % | |||
Total SG&A | 13.9 | % | 16.4 | % | 21.5 | % | |||
* Percentages may not add due to rounding. | |||||||||
Sales and marketing expense for the year ended December 31, 2016 increased approximately $0.3 million, or 1.7%, as compared to 2015. The increase in sales and marketing expense was primarily attributable to the 17.0% increase in the number of homes delivered and the associated commission and closing cost expenses on these deliveries partially offset by a decrease in spending on marketing costs given strong demand, most notably in our West operating segment. As a percentage of total revenue, sales and marketing expenses decreased primarily due to the 25.3% increase in total revenue and a decrease in fixed sales and marketing expenses, during the year ended December 31, 2016, as compared to 2015.
For the year ended December 31, 2015, sales and marketing expense increased approximately $5.2 million, or 37.8%, as compared to 2014. The increase was primarily attributable to the 62.3% increase in the number of homes delivered and accounting for outside realtor commissions and closing related costs as a sales and marketing expense. In addition, the 75.0% increase in the number of average active selling communities led to an increase in the headcount of on-site sales professionals, the number of model homes and associated expenses as well as our marketing efforts to introduce our new communities.
G&A expenses for the for the year ended December 31, 2016 increased by approximately $2.3 million, or 8.5%, as compared to 2015. The primary reason for the increase in G&A expense during 2016 was the result of costs associated with a withdrawn notes offering of $1.3 million, an increase in compensation expense (largely due to severance costs of $1.4 million) and an increase in bonus expense for executive, divisional and corporate personnel (as a result of greater profitability), partially offset by a $2.3 million reduction in contingent consideration associated with the Citizens Acquisition. As a percentage of revenue, G&A expenses decreased to 8.3% primarily due to revenue growth and our continued focus on managing G&A expenses tightly.
For the year ended December 31, 2015, G&A expenses decreased approximately $0.5 million, or 1.9%, as compared to 2014. The reduction in G&A expenses during 2015 was achieved by reducing our stock-based compensation expense, converting temporary staff to full time employees and reducing the fees paid under the Transitional Services Agreement which was completed on July 31, 2015.
Other Income
Other income during the year ended December 31, 2016 increased by approximately $70,000, or 34.0%, as compared to 2015. For the year ended December 31, 2015, other income increased by approximately $85,000, or 70.2%, as compared to 2014.
56
Provision for Income Taxes
During the year ended December 31, 2016, we recorded a benefit from income taxes in the amount of $5.3 million. This was a result of recording $0.2 million for federal and state income taxes and the removal of the Company’s valuation allowance on its deferred tax asset as of December 31, 2016 of $5.5 million. See Note 14, “Income Taxes,” and Note 15, “Deferred Tax Asset Valuation Allowance" to the accompanying consolidated financial statements included elsewhere in this Annual Report on Form 10-K for a further discussion of income tax benefit and our deferred tax asset and valuation allowance.
For the year ended December 31, 2015, we reported a consolidated pre-tax book income of $5.9 million and reported minimum tax for the year of $69,000. While we recorded a tax deferred asset, we also recorded a full valuation allowance against the deferred tax asset. The full valuation allowance resulted after the Company considered whether it is more likely than not that any deferred income tax asset will be realized. The Company considered many factors when assessing the likelihood of future realization of its deferred tax assets, including recent cumulative earnings experience, expectations of future transactions, the carry-forward periods available and availability of tax planning strategies. The deferred tax asset valuation allowance as of December 31, 2015 was $7.6 million.
For the year ended December 31, 2014, the deferred tax asset valuation allowance was $8.6 million, and no provision for income taxes was recorded.
See Note 2, “Summary of Significant Accounting Policies--Income Taxes” to the accompanying consolidated financial statements included elsewhere in this Annual Report on Form 10-K for a further discussion of income taxes.
Net Income or Loss and Income or Loss per Share of Class A Common Stock
Our net income (or loss) and earnings (or loss) per share of Class A common stock for the years ended December 31, 2016, 2015 and 2014 were as follows:
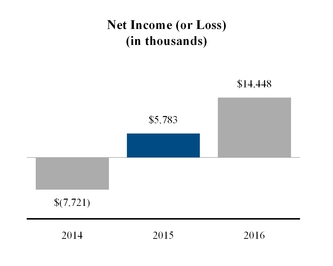
As a result of the foregoing factors, our net income for the year ended December 31, 2016 increased $8.7 million, as compared to 2015. The net income attributable to UCP, Inc. for the year ended December 31, 2016 was $9.2 million, as compared to net income of $2.4 million and net loss of $5.0 million for the years ended December 31, 2015 and 2014, respectively.
57
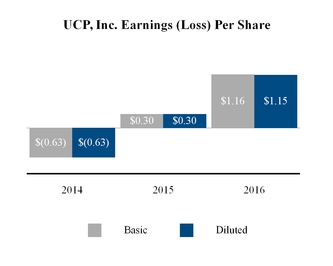
EPS of UCP, Inc. Class A common stock for the year ended December 31, 2016 was $1.16 per basic and $1.15 per diluted share, as compared to a positive $0.30 and negative $0.63 per basic share and per diluted share for the years ended December 31, 2015 and 2014, respectively.
REPORTING SEGMENTS
The Company periodically evaluates its homebuilding and land development operations in an effort to allocate resources properly. Based on this evaluation, the Company has classified its operating activities into two operating segments, West and Southeast, and two reportable segments, Homebuilding and Land development. See Note 12, “Segment Information” to the accompanying consolidated financial statements included elsewhere in this annual report Form 10-K. The following table presents financial information related to our homebuilding and land development reporting segments for the periods indicated:
For Years Ended December 31, | ||||||||||||||||||||||||||||||||
2016 | 2015 | 2014 | ||||||||||||||||||||||||||||||
(Dollars in thousands) | Revenues | Gross Margin | GM % | Revenues | Gross Margin | GM % | Revenues | Gross Margin | GM % | |||||||||||||||||||||||
Homebuilding | ||||||||||||||||||||||||||||||||
West | $ | 289,037 | $ | 54,392 | 18.8 | % | $ | 191,884 | $ | 35,666 | 18.6 | % | $ | 128,334 | $ | 21,858 | 17.0 | % | ||||||||||||||
Southeast | 54,882 | 8,455 | 15.4 | % | 60,713 | 9,261 | 15.3 | % | 27,083 | 3,982 | 14.7 | % | ||||||||||||||||||||
Total homebuilding | 343,919 | 62,847 | 18.3 | % | 252,597 | 44,927 | 17.8 | % | 155,417 | 25,840 | 16.6 | % | ||||||||||||||||||||
Land development | ||||||||||||||||||||||||||||||||
West | 5,449 | (930 | ) | (17.1 | )% | 21,074 | 5,853 | 27.8 | % | 32,513 | 7,047 | 21.7 | % | |||||||||||||||||||
Southeast | — | (389 | ) | — | % | 60 | (10 | ) | (16.7 | )% | — | — | — | % | ||||||||||||||||||
Total land development | 5,449 | (1,319 | ) | (24.2 | )% | 21,134 | 5,843 | 27.6 | % | 32,513 | 7,047 | 21.7 | % | |||||||||||||||||||
Other (a) | — | — | — | % | 5,060 | 697 | 13.8 | % | 3,253 | 425 | 13.1 | % | ||||||||||||||||||||
Total | $ | 349,368 | $ | 61,528 | 17.6 | % | $ | 278,791 | $ | 51,467 | 18.5 | % | $ | 191,183 | $ | 33,312 | 17.4 | % | ||||||||||||||
(a) | Other includes revenues from construction management services the Company acquired as part of the Citizens Acquisition and are not attributable to the homebuilding or land development operations. The business was sold in the fourth quarter of 2015, and the Company no longer provides construction management services to third parties. |
As previously discussed, the lower gross margin in our West land development segment for the year ended December 31, 2016 was the result of the Sundance land sale in Bakersfield, California. The 65 lots at Sundance were previously impaired and written down to fair value during the year ended December 31, 2016 and subsequently sold in 2016. As a result, the gross margin recorded related to this sale was minimal.
Homebuilding Operations
The following charts and tables present information concerning homes delivered, ASP and revenue for our homebuilding operations by our West and Southeast operating segments for the years ended December 31, 2016, 2015 and 2014:
58
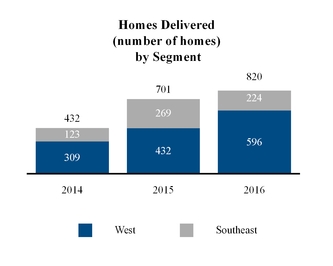
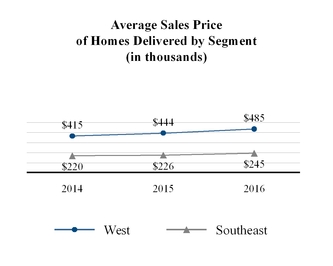
The increase in the ASP of a home delivered in our West operating segment for the year ended December 31, 2016 was largely a result of product mix with more expensive homes providing a higher percentage of home closings during this period.
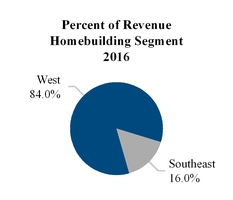
For the Year Ended December 31, 2016 | |||||||||||||||||
Segment | Homebuilding Revenue (in thousands) | % of Total Homebuilding Revenue | Homes Delivered | % of Total Homes Delivered | ASP (in thousands) | ||||||||||||
West | $ | 289,037 | 84.0 | % | 596 | 72.7 | % | $ | 485 | ||||||||
Southeast | 54,882 | 16.0 | % | 224 | 27.3 | % | 245 | ||||||||||
Total | $ | 343,919 | 100.0 | % | 820 | 100.0 | % | $ | 419 | ||||||||
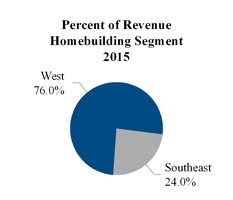
For the Year Ended December 31, 2015 | |||||||||||||||||
Segment | Homebuilding Revenue (in thousands) | % of Total Homebuilding Revenue | Homes Delivered | % of Total Homes Delivered | ASP (in thousands) | ||||||||||||
West | $ | 191,884 | 76.0 | % | 432 | 61.6 | % | $ | 444 | ||||||||
Southeast | 60,713 | 24.0 | % | 269 | 38.4 | % | 226 | ||||||||||
Total | $ | 252,597 | 100.0 | % | 701 | 100.0 | % | $ | 360 | ||||||||
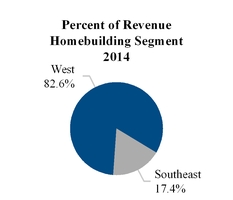
For the Year Ended December 31, 2014 | |||||||||||||||||
Segment | Homebuilding Revenue (in thousands) | % of Total Homebuilding Revenue | Homes Delivered | % of Total Homes Delivered | ASP (in thousands) | ||||||||||||
West | $ | 128,334 | 82.6 | % | 309 | 71.5 | % | $ | 415 | ||||||||
Southeast | 27,083 | 17.4 | % | 123 | 28.5 | % | 220 | ||||||||||
Total | $ | 155,417 | 100.0 | % | 432 | 100.0 | % | $ | 360 | ||||||||
59
For the years ended December 31, 2016, 2015 and 2014, our West operating segment accounted for a majority of the percentage of homes closed. For the year ended December 31, 2016, the increase in the percentage of homes closed in the West operating segment reflects strong demand in our West operating segment throughout 2016 coupled with delays in opening new communities as a result of wet weather that delayed land development efforts in our Southeast operating segment during late 2015 and continued into 2016.
Land Development Operations
The following charts and table present information concerning revenues and lots sold for our land development operations by our West and Southeast operating segments:
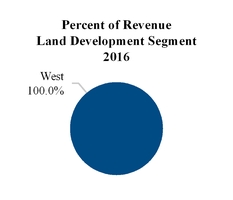
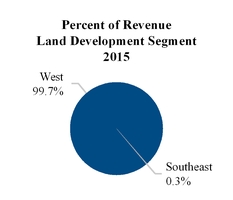

For Years Ended December 31, | |||||||||||||||||||||
2016 | 2015 | 2014 | |||||||||||||||||||
Segment | Land Development Revenue (in thousands) | Lots Sold | Land Development Revenue (in thousands) | Lots Sold | Land Development Revenue (in thousands) | Lots Sold | |||||||||||||||
West | $ | 5,449 | 66 | $ | 21,074 | 294 | $ | 32,513 | 348 | ||||||||||||
Southeast | — | — | 60 | 1 | — | — | |||||||||||||||
Total | $ | 5,449 | 66 | $ | 21,134 | 295 | $ | 32,513 | 348 | ||||||||||||
For the years ended December 31, 2016, 2015 and 2014, our West operating segment accounted for a majority of the lots sold.
60
CRITICAL ACCOUNTING POLICIES
The estimates, assumptions and judgments involved in the accounting policies below have the greatest potential impact on our financial statements. Management believes that the following critical accounting policies require its most significant judgments and estimates used in the preparation of the consolidated financial statements:
•Segment Reporting
•Capitalization of Interest
•Real Estate Inventories and Cost of Sales
•Impairment and Abandonment of Real Estate Inventories
•Impairment of Goodwill
•Homebuilding, Land Development Sales and Other Revenues Profit Recognition
•Warranty Reserves
•Income Taxes
•Noncontrolling Interest
For our fully described critical accounting policies, see Note 2, "Summary of Significant Accounting Policies" to the accompanying consolidated financial statements included in Item 8 of this Annual Report on Form 10-K.
RECENTLY ISSUED ACCOUNTING STANDARDS
See Note 2, "Summary of Significant Accounting Policies” to our consolidated financial statements included elsewhere in this Annual Report on Form 10-K regarding the impact of certain recent accounting pronouncements on our accompanying consolidated financial statements.
LIQUIDITY AND CAPITAL RESOURCES
Our principal uses of capital for the years ended December 31, 2016, 2015 and 2014 are funding our operating expenses, investing activities (principally acquiring and developing land, and building homes) and repaying liabilities. Our principal sources of liquidity are cash on hand, cash provided by operations and cash provided by financing activities (such as acquisition, development and construction financing). As of December 31, 2016, we had approximately $42.5 million of cash and cash equivalents, which includes $1.5 million of restricted cash. We also had available borrowing capacity on our acquisition, development and construction financing of $77.2 million, of which $10.6 million was immediately available and the remaining balance is available to fund project specific development activities as those progress during 2017.
Our 2017 Senior Notes with $75 million in principal outstanding mature in October of 2017, and an additional $45 million in acquisition, development and construction (ADC) loans are also set to mature in the ordinary course of business. With respect to the $45 million in ADC loans maturing in 2017, these loans are project specific loans and are scheduled to mature in the ordinary course of closing out of the sales phase for each of these projects and we anticipate the sales proceeds from the designated home closings will provide a more than adequate source of cash for the repayment of these loans. For the 2017 Senior Notes we have various alternatives to meet this obligation when it comes due in October 2017. We believe that we currently have sufficient capital resources to fund our operations for at least the next twelve months including the repayment of this debt obligation when it matures. The sources include available cash, available borrowing capacity and cash being generated from our backlog of home sales. As part of this consideration, we generally have the ability to defer future investment activity, such as acquiring and developing land, or building additional homes for sale where borrowing capacity is currently not available.
We also believe that we access to new sources of capital, as needed, to fund further investment in our business for land acquisitions and new development activities. As of December 31, 2016, our Debt to Total Capital and Net Debt to Total Capital, was 41.5% and 37.3%, respectively, providing us with significant financial flexibility. We recently demonstrated our ability to obtain financing on our portfolio of projects when we put a new $25 million borrowing base credit facility in place with a large regional commercial bank during the fourth quarter of 2016. As a result of this facility we are able to reduce our borrowing costs, fees
61
associated with the facility and our administrative costs as compared to our existing project level loans. As of December 31, 2016 we had drawn $10.5 million on this new facility leaving $14.5 million in available borrowing capacity. With unlevered real estate development inventory of $194.9 million as of December 31, 2016, we expect to continue to put in place similar new borrowing based credit facilities so that we can provide funds to support future project developments.
Long-term Funding Strategy
Our funding strategy contemplates the use of debt and the reinvestment of cash from operations. We generally attempt to match the duration of our real estate assets with the duration of the capital that finances each real estate asset. We generally look to finance our homes under construction, which have a short duration, with a combination of long-term capital (equity and long-term debt) and short-term bank financing. We generally look to finance our finished lots that will be put in production within one year, and therefore have a short duration, with a combination of long-term capital (equity and long-term debt) and short-term bank financing. We generally look to finance our assets with a long duration, such as land held for future development or finished lots that will not be put into production for more than one year, with long-term capital (equity and long-term debt).
For the foreseeable future, we expect our principal uses of cash to be similar to what they have been in the past. We anticipate funding future capital requirements in a manner similar to our historical funding. For a description of our outstanding indebtedness as of December 31, 2016, see Note 8, “Notes Payable and Senior Notes, net” to the consolidated financial statements included elsewhere in this Annual Report on Form 10-K.
Senior Notes
The 2017 Notes were issued under an Indenture, dated as of October 21, 2014 (the “Indenture”) and are guaranteed on an unsecured senior basis by each of our subsidiaries (the “Subsidiary Guarantors”). The 2017 Notes and the guarantees are the Company’s, and the Subsidiary Guarantors’, senior unsecured obligations and rank equally in right of payment with all of our and the Subsidiary Guarantors’ existing and future senior unsecured debt and senior in right of payment to all of our and the Subsidiary Guarantors’ future subordinated debt. The 2017 Notes and the guarantees are effectively subordinated to any of our and the Subsidiary Guarantors’ existing and future secured debt, to the extent of the value of the assets securing such debt.
We may redeem the 2017 Notes, in whole but not in part, at any time at a price equal to 100% of the principal amount, plus accrued and unpaid interest, plus a “make-whole” premium. The make-whole premium is approximately $531,000 per month for each month that we pre-pay the 2017 Notes in advance. Upon the occurrence of a change of control, we must offer to repurchase the 2017 Notes for cash at a price equal to 101% of the principal amount of the 2017 Notes to be repurchased plus accrued and unpaid interest to, but excluding, the repurchase date. Under the Indenture, a “change of control” generally means (i) any person or group of related persons acquires more than 35% of our voting stock or (ii) we transfer all or substantially all of our consolidated assets to any person or group of related persons, in each case other than PICO and its affiliates.
The Indenture provides for customary “events of default” which could cause, or permit, the acceleration of the 2017 Notes. Such events of default include: (i) a default in any payment of principal or interest on the 2017 Notes; (ii) failure to comply with certain covenants contained in the Indenture; (iii) defaults under certain other indebtedness or the acceleration of certain other indebtedness prior to maturity; (iv) the failure to pay certain final judgments; and (vi) certain events of bankruptcy or insolvency.
The Indenture limits our and our subsidiaries’ ability to, among other things, incur or guarantee additional unsecured and secured indebtedness (provided that we may incur indebtedness so long as our ratio of indebtedness to consolidated tangible assets (on a pro forma basis) would be equal to or less than 45% and provided that the aggregate amount of secured debt may not exceed the greater of $75 million or 30% of our consolidated tangible assets); pay dividends and make certain investments and other restricted payments, including purchase of our stock; acquire unimproved real property in excess of $75 million per fiscal year or in excess of $150 million over the term of the 2017 Notes, except to the extent funded with subordinated obligations or the proceeds of equity issuances; create or incur certain liens; transfer or sell certain assets; and merge or consolidate with other companies or transfer or sell all or substantially all of our consolidated assets.
Additionally, the Indenture requires us to: (i) maintain at least $50 million of consolidated tangible assets not subject to liens securing indebtedness (the “Minimum Unlevered Asset Pool Test”); (ii) maintain a minimum net worth of at least $175 million (the “Minimum Net Worth Test”); (iii) maintain a minimum of $15 million of unrestricted cash and/or cash equivalents (the “Minimum Liquidity Test”); and (iv) not permit decreases in the amount of consolidated tangible assets by more than $25 million in any fiscal year or more than $50 million at any time after the issuance of the 2017 Notes (the “Consolidated Tangible Assets Test”).
The foregoing is only a brief description of the 2017 Notes and is qualified in its entirety by reference to the Indenture.
62
As set forth below, as of December 31, 2016, we were in compliance with each of the Minimum Unlevered Asset Pool Test, the Minimum Net Worth Test, the Minimum Liquidity Test and the Consolidated Tangible Assets Test. Capitalized terms used in the following table shall have the meanings assigned thereto in the Indenture.
(In thousands, except percentages) | As of December 31, 2016 | Requirement | |||
Minimum Unlevered Asset Pool Test | |||||
Consolidated Tangible Assets | $ | 414,138 | |||
Consolidated Tangible Assets subject to Liens (1) | 219,275 | ||||
Consolidated Tangible Assets not subject to Liens (1) | $ | 194,863 | ≥ $ 50,000 | ||
Minimum Net Worth Test | |||||
Consolidated Tangible Assets | $ | 414,138 | |||
Total Indebtedness | 160,994 | ||||
Net Worth | $ | 253,144 | ≥ $ 175,000 | ||
Minimum Liquidity Test | |||||
Cash and Cash Equivalents | $ | 42,478 | |||
Restricted Cash (2) | 1,547 | ||||
Unrestricted Cash and Cash Equivalents (2) | $ | 40,931 | ≥ $ 15,000 | ||
Consolidated Tangible Assets Test | |||||
Consolidated Tangible Assets as of December 31, 2016 | $ | 414,138 | |||
Consolidated Tangible Assets as of January 1, 2016 | 400,818 | ||||
Increase in Consolidated Tangible Assets during 2016 (3) | $ | 13,320 | Δ ≤ ($25,000) | ||
Consolidated Tangible Assets as of December 31, 2016 | $ | 414,138 | |||
Consolidated Tangible Assets as of October 21, 2014 | 293,784 | ||||
Increase in Consolidated Tangible Assets since October 21, 2014 (3)(4) | $ | 120,354 | Δ ≤ ($50,000) | ||
Funded Debt to Tangible Assets Ratio Test | |||||
Funded Debt as of December 31, 2016 | $ | 160,994 | |||
Consolidated Tangible Assets as of December 31, 2016 | 414,138 | ||||
Funded Debt to Tangible Assets Ratio | 39 | % | ≤ 45% | ||
(1) | “Liens,” as used in this table, means Liens other than Liens of the type described in clauses (b), (c), (e), (f), (h), (i), (j), (t), (v), (w), (x) and (y) of the definition of “Permitted Liens” under the Indenture. In general, this excludes certain Liens securing obligations that are not indebtedness for money borrowed. |
(2) | Unrestricted cash and cash equivalents excludes restricted cash and other restricted cash balance requirements. Restricted cash excludes the $15 million requirement under the Indenture for purposes of the tests shown above. |
(3) | We may not permit our Consolidated Tangible Assets to decrease by more than $25 million in any fiscal year or more than $50 million in the aggregate at any time after October 21, 2014 (i.e. the date of issue of the 2017 Notes). |
(4) Based on Consolidated Tangible Assets as of September 30, 2014, the end of the quarter immediately preceding the issue of the 2017 Notes.
In addition, (i) as of December 31, 2016 no Default or Event of Default (as such terms are defined in the Indenture) had occurred under the Indenture; (ii) all Asset Dispositions (as defined in the Indenture) made under the “Asset Disposition” covenant contained in the Indenture (Section 3.10) during the three months ended December 31, 2016 were made in compliance with such covenant; and (iii) any Restricted Payments (as defined in the Indenture) made during the three months ended December 31, 2016 complied in all respects with the requirements of the “Restricted Payments” covenant contained in the Indenture (Section 3.19).
63
Non-GAAP Financial Measure
In addition to the results reported in accordance with GAAP, we have provided information in this report relating to “net debt-to-capital ratio” which is a non-GAAP financial measure. The most directly comparable GAAP financial measure is the ratio of debt-to-capital. We believe that our leverage ratios provide useful information to the users of our financial statements regarding our financial position and cash and debt management.
The ratio of net debt-to-capital is computed as the quotient obtained by dividing net debt (which is debt less unrestricted cash and cash equivalents) by the sum of net debt plus stockholders’ and member's equity. We believe the ratio of net debt-to-capital is a relevant financial measure for investors to understand the leverage employed in our operations and as an indicator of our ability to obtain financing. We reconcile this non-GAAP financial measure to the ratio of debt-to-capital in the table above.
In addition, other companies may not calculate net debt-to-capital ratios in the same manner that we do. Accordingly, the net debt-to-capital ratio should be considered only as a supplement to the ratio of debt-to-capital information as a measure of our financial leverage.
Debt-to-Capital and Net Debt-to-Capital Ratios
The following table provides a reconciliation of our net debt-to-capital ratio to the most comparable GAAP financial measure:
At December 31, | |||||||
(Dollars in thousands) | 2016 | 2015 | |||||
Debt | $ | 160,994 | $ | 155,966 | |||
Equity | 226,886 | 217,408 | |||||
Total capital | $ | 387,880 | $ | 373,374 | |||
Ratio of debt-to-capital | 41.5 | % | 41.8 | % | |||
Debt | $ | 160,994 | $ | 155,966 | |||
Net cash and cash equivalents | $ | 42,478 | $ | 40,729 | |||
Less: restricted cash and minimum liquidity requirement | 16,547 | 15,900 | |||||
Unrestricted cash and cash equivalents | 25,931 | 24,829 | |||||
Net debt | $ | 135,063 | $ | 131,137 | |||
Equity | 226,886 | 217,408 | |||||
Total adjusted capital | $ | 361,949 | $ | 348,545 | |||
Ratio of net debt-to-capital (1) | 37.3 | % | 37.6 | % | |||
(1) | The ratio of net debt-to-capital is a non-GAAP financial measure. |
64
Cash Flows - Year Ended December 31, 2016 Compared to the Years Ended December 31, 2015 and 2014
Our comparison of cash flows for the year ended December 31, 2016, as compared to the years ended December 31, 2015 and 2014, is as follow (in thousands):
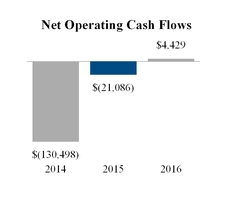
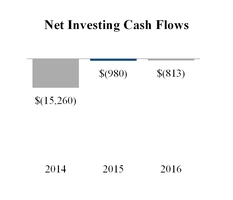
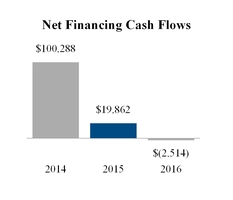
Cash flows used in operating activities were reduced by $25.5 million as compared to 2015 and $109.4 million during 2015 as compared to 2014 primarily due to the following:
• | We generated $21.2 million of net income before non-cash expenses of stock-based compensation, impairment and abandonment charges on real estate inventories, depreciation and amortization, goodwill impairment, as well as, an adjustment to the fair value of our contingent consideration as compared to net income and net loss before non-cash expenses of $8.4 million and $3.8 million for 2015 and 2014, respectively. |
• | We used $14.2 million to finance an increase in real estate inventories, a decrease of $24.3 million as compared to 2015. The decrease in inventories during the December 31, 2016 period was primarily attributable to a $26.5 million decrease in the amount of land held and land under development. For the year ended December 31, 2015, we used $38.5 million to finance an increase in real estate inventories, a decrease of $92.6 million as compared to 2014. As of December 31, 2016, we had 521 homes in inventory as compared to 426 and 350 homes in inventory as of December 31, 2015 and 2014, respectively. |
• | We generated $4.4 million in other assets and receivables during the year ended December 31, 2016, as compared to $2.4 million and $2.7 million we used to finance growth in other assets and receivables during 2015 and 2014, respectively. |
Cash flows used in investing activities decreased $0.2 million as compared to 2015 and $14.3 million during 2015 as compared to 2014 primarily due to the following:
• | We decreased our purchases of fixed assets by during the December 31, 2016 period, as compared to 2015 and 2014. |
Cash flows used in financing activities decreased $22.4 million as compared to 2015 and decreased by $80.4 million during 2015 as compared to 2014 primarily due to the following:
• | We decreased our net borrowings by $17.8 million as compared to 2015. The net borrowings during the year ended December 31, 2016 were proceeds from acquisition, development and construction loans which totaled $154.3 million while repayments on these loans totaled $150.1 million. During December 31, 2015, we decreased our net borrowings by $82.5 million as compared to 2014. |
• | We incurred $0.6 million in debt issuance costs for the year ended December 31, 2016, as compared to $0.8 million and $1.9 million for 2015 and 2014, respectively. |
• | We paid $4.8 million in a cash tax distribution to our noncontrolling interest (i.e. PICO) during the year ended December 31, 2016. During 2015 and 2014, we paid cash tax distributions to noncontrolling interest (i.e. PICO) of $1.0 million and $0.7 million, respectively. |
As of December 31, 2016, our cash and cash equivalents balance, excluding restricted cash, was $40.9 million.
65
OFF-BALANCE SHEET ARRANGEMENTS AND CONTRACTUAL OBLIGATIONS
Our off-balance sheet arrangements and contractual obligations have been disclosed in the accompanying consolidated financial statements as noted below:
Land Purchase and Land Option Contracts
For information regarding our land purchase and land option contracts, see Note 13, “Commitments and Contingencies--Purchase Commitments” to the accompanying consolidated financial statements included elsewhere in this report.
Loan Commitments
For information regarding our debt, see Note 8, “Notes Payable and Senior Notes, net” to the accompanying consolidated financial statements included elsewhere in this report.
Surety Bonds
For information regarding our surety bonds, see Note 13, “Commitments and Contingencies--Surety Bonds” to the accompanying consolidated financial statements included elsewhere in this report.
INFLATION AND SEASONALITY
Inflation
Our business can be adversely impacted by inflation, primarily from higher land, financing, labor, material and construction costs. In addition, inflation can lead to higher mortgage rates, which can significantly affect the affordability of mortgage financing to home buyers. While we attempt to pass on cost increases to customers through increased prices, when weak housing market conditions exist, we are often unable to offset cost increases with higher selling prices. Additionally, rising mortgage rates may result in a decrease in the number of homes we sell and a reduction in selling prices.
Seasonality
Historically, the homebuilding industry experiences seasonal fluctuations in quarterly operating results and capital requirements. We typically experience the highest new home order activity in spring and summer, although this activity is also highly dependent on the number of active selling communities, the timing of new community openings and other market factors. Since it typically takes four to six months to construct a new home, we generally deliver more homes in the second half of the year as spring and summer home orders convert to home deliveries. Because of this seasonality, home starts, construction costs and related cash outflows have historically been highest in the second and third quarters, and the majority of cash receipts from home deliveries occur during the second half of the year. We expect this seasonal pattern to continue over the long-term, although it may be affected by volatility in the homebuilding industry.
Aggregate Contractual Obligations
The following table provides a summary of our contractual cash obligations and other commitments and contingencies as of December 31, 2016:
(In thousands) | Payments Due by Period | ||||||||||||||||||
Contractual Obligations | Less than 1 year | 1-3 years | 3-5 years | More than 5 years | Total | ||||||||||||||
Debt | $ | 120,785 | $ | 40,943 | — | — | $ | 161,728 | |||||||||||
Interest on debt | 8,214 | 943 | — | — | 9,157 | ||||||||||||||
Operating leases | 928 | 1,232 | 364 | — | 2,524 | ||||||||||||||
Total | $ | 129,927 | $ | 43,118 | $ | 364 | — | $ | 173,409 | ||||||||||
We had no liabilities or potential interest for unrecognized tax benefits associated with uncertain tax positions at December 31, 2016.
66
ITEM 7A. QUANTITATIVE AND QUALITATIVE DISCLOSURES ABOUT MARKET RISKS
Market risk includes risks that arise from changes in interest rates, equity prices and other market changes that affect market sensitive instruments. Our primary market risk exposure is related to fluctuations in interest rates on our variable interest rate debt, which consists of our secured acquisition, construction and development loans. As of December 31, 2016, we had approximately $81.3 million of variable rate debt outstanding (or 50.2% of total indebtedness) with a weighted average interest rate of 4.48% per annum. As of December 31, 2015, we had approximately $75.2 million of variable rate debt outstanding (or 47.8% of total indebtedness) with a weighted average interest rate of 4.21% per annum.
We did not hedge our exposure to changes in interest rates with swaps, forward or option contracts on interest rates, or other types of derivative financial instruments during the year ended December 31, 2016. However, we may choose to hedge our exposure to changes in interest rates with these or other types of instruments in the future if, for example, we incur significant amounts of additional variable rate date. We have not entered into and currently do not hold derivatives for trading or speculative purposes.
Our interest rate risk objectives are to limit the impact of interest rate fluctuations on earnings and cash flows and to lower our overall borrowing costs. In seeking to achieve these objectives, we manage our exposure to fluctuations in market interest rates through the use of fixed rate debt instruments to the extent that reasonably favorable rates are obtainable.
We performed sensitivity analysis on our variable interest rate debt subject to the above risks. For our variable interest rate debt, we analyzed the impact on our financial statements of a 100 basis point, or 1.00% increase or decrease in interest rates, and determined that the impact on our interest expense, results of operations and balance sheet will increase or decrease by approximately $812,530 and $752,410, subject to applicable interest rate floors as of December 31, 2016 and 2015, respectively. Based on the current amount and terms of our variable interest rate debt, we do not believe that the future changes in interest rates will have a material adverse impact on our financial position, results of operations or liquidity.
The following table provides information about our financial instruments that are sensitive to changes in interest rates. For debt obligations outstanding as of December 31, 2016, the following table presents principal repayments and related weighted average interest rates by contractual maturity dates (dollars in thousands):
Variable interest debt | 2017 | 2018 | Total | |||||||||
Debt currently at LIBOR + 2.75% | — | $ | 10,500 | $ | 10,500 | |||||||
Debt currently at LIBOR + 3.50% | 4,693 | — | 4,693 | |||||||||
Debt currently at LIBOR + 3.75% | 31,533 | 26,444 | 57,977 | |||||||||
Debt currently at 5.00% | 5,607 | — | 5,607 | |||||||||
Debt currently at 5.50% | 2,476 | — | 2,476 | |||||||||
Total variable interest debt | $ | 44,309 | $ | 36,944 | $ | 81,253 | ||||||
Fixed interest debt | 2017 | 2018 | Total | |||||||||
Debt currently at 10.00% | $ | 1,604 | — | $ | 1,604 | |||||||
Debt currently at 8.50% | 74,871 | — | 74,871 | |||||||||
Debt currently at 8.00% | — | 4,000 | 4,000 | |||||||||
Total fixed interest debt | $ | 76,475 | $ | 4,000 | $ | 80,475 | ||||||
Total variable and fixed debt | $ | 120,784 | $ | 40,944 | $ | 161,728 | ||||||
The foregoing table reflects indebtedness outstanding as of December 31, 2016 and does not include indebtedness, if any, incurred or repaid after that date. Our ultimate realized gain or loss with respect to interest rate fluctuations will depend on the exposures that arise during future periods, prevailing interest rates, and any hedging strategies that we may use at that time.
Changes in market interest rates impact the fair value of our fixed rate debt, but such changes have no impact on our consolidated financial statements. If interest rates rise, and our fixed rate debt balance remains constant, we expect the fair value of our debt to decrease. As of December 31, 2016, the estimated fair value of our fixed rate debt was $80.7 million, which is based on having the same debt service requirements that could have been borrowed at the date presented, at prevailing current market interest rates.
Actual results may differ from the hypothetical results assumed in this disclosure due to possible actions we may take to mitigate adverse changes in fair value, and because the fair value of securities may be affected by market conditions.
67
ITEM 8. FINANCIAL STATEMENTS AND SUPPLEMENTARY DATA
REPORT OF INDEPENDENT REGISTERED PUBLIC ACCOUNTING FIRM
To the Board of Directors and Stockholders of
UCP, Inc.
San Jose, CA
We have audited the accompanying consolidated balance sheets of UCP, Inc. and subsidiaries (the "Company") as of December 31, 2016 and 2015, and the related consolidated statements of operations and comprehensive income or loss, equity, and cash flows for each of the three years in the period ended December 31, 2016. These consolidated financial statements are the responsibility of the Company's management. Our responsibility is to express an opinion on these consolidated financial statements based on our audits.
We conducted our audits in accordance with the standards of the Public Company Accounting Oversight Board (United States). Those standards require that we plan and perform the audit to obtain reasonable assurance about whether the financial statements are free of material misstatement. An audit includes examining, on a test basis, evidence supporting the amounts and disclosures in the financial statements. An audit also includes assessing the accounting principles used and significant estimates made by management, as well as evaluating the overall financial statement presentation. We believe that our audits provide a reasonable basis for our opinion.
In our opinion, such consolidated financial statements present fairly, in all material respects, the financial position of UCP, Inc. and subsidiaries as of December 31, 2016 and 2015, and the results of their operations and their cash flows for each of the three years in the period ended December 31, 2016, in conformity with accounting principles generally accepted in the United States of America.
We have also audited, in accordance with the standards of the Public Company Accounting Oversight Board (United States), the Company's internal control over financial reporting as of December 31, 2016, based on the criteria established in Internal Control - Integrated Framework (2013) issued by the Committee of Sponsoring Organizations of the Treadway Commission and our report dated March 2, 2017, expressed an unqualified opinion on the Company's internal control over financial reporting.
/s/ DELOITTE & TOUCHE LLP
San Diego, California
March 2, 2017
68
UCP, INC.
CONSOLIDATED BALANCE SHEETS
(In thousands, except shares and per share data)
December 31, 2016 | December 31, 2015 | |||||||
Assets | ||||||||
Cash and cash equivalents | $ | 40,931 | $ | 39,829 | ||||
Restricted cash | 1,547 | 900 | ||||||
Real estate inventories | 373,207 | 360,989 | ||||||
Fixed assets, net | 883 | 1,314 | ||||||
Intangible assets, net | 101 | 236 | ||||||
Goodwill | — | 4,223 | ||||||
Receivables | 5,628 | 1,317 | ||||||
Deferred tax assets, net | 5,482 | — | ||||||
Other assets | 6,327 | 5,889 | ||||||
Total assets | $ | 434,106 | $ | 414,697 | ||||
Liabilities and equity | ||||||||
Accounts payable | $ | 18,435 | $ | 14,882 | ||||
Accrued liabilities | 25,342 | 24,616 | ||||||
Customer deposits | 2,449 | 1,825 | ||||||
Notes payable, net | 86,658 | 82,486 | ||||||
Senior notes, net | 74,336 | 73,480 | ||||||
Total liabilities | 207,220 | 197,289 | ||||||
Commitments and contingencies (Note 13) | ||||||||
Equity | ||||||||
Preferred stock, par value $0.01 per share, 50,000,000 authorized, no shares issued and outstanding at December 31, 2016; no shares issued and outstanding at December 31, 2015 | — | — | ||||||
Class A common stock, $0.01 par value; 500,000,000 authorized, 8,042,834 issued and 7,896,488 outstanding at December 31, 2016; 8,014,434 issued and outstanding at December 31, 2015 | 80 | 80 | ||||||
Class B common stock, $0.01 par value; 1,000,000 authorized, 100 issued and outstanding at December 31, 2016; 100 issued and outstanding at December 31, 2015 | — | — | ||||||
Additional paid-in capital | 97,123 | 94,683 | ||||||
Treasury stock at cost; 146,346 shares as of December 31, 2016; none as of December 31, 2015 | (1,250 | ) | — | |||||
Accumulated earnings (deficit) | 4,675 | (4,563 | ) | |||||
Total UCP, Inc. stockholders’ equity | 100,628 | 90,200 | ||||||
Noncontrolling interest | 126,258 | 127,208 | ||||||
Total equity | 226,886 | 217,408 | ||||||
Total liabilities and equity | $ | 434,106 | $ | 414,697 | ||||
See accompanying notes to consolidated financial statements.
69
UCP, INC.
CONSOLIDATED STATEMENTS OF OPERATIONS AND COMPREHENSIVE INCOME OR LOSS
(In thousands, except shares and per share data)
Year Ended December 31, | |||||||||||
2016 | 2015 | 2014 | |||||||||
REVENUE: | |||||||||||
Homebuilding | $ | 343,919 | $ | 252,597 | $ | 155,417 | |||||
Land development | 5,449 | 21,134 | 32,513 | ||||||||
Other revenue | — | 5,060 | 3,253 | ||||||||
Total revenue | 349,368 | 278,791 | 191,183 | ||||||||
COSTS AND EXPENSES: | |||||||||||
Cost of sales - homebuilding | 280,614 | 206,747 | 129,577 | ||||||||
Cost of sales - land development | 4,637 | 15,291 | 25,466 | ||||||||
Cost of sales - other revenue | — | 4,363 | 2,828 | ||||||||
Impairment on real estate | 2,589 | 923 | — | ||||||||
Total cost of sales | 287,840 | 227,324 | 157,871 | ||||||||
Gross margin - homebuilding | 63,305 | 45,850 | 25,840 | ||||||||
Gross margin - land development | 812 | 5,843 | 7,047 | ||||||||
Gross margin - other revenue | — | 697 | 425 | ||||||||
Gross margin - impairment on real estate | (2,589 | ) | (923 | ) | — | ||||||
Total gross margin | 61,528 | 51,467 | 33,312 | ||||||||
Sales and marketing | 19,257 | 18,943 | 13,748 | ||||||||
General and administrative | 29,161 | 26,878 | 27,406 | ||||||||
Goodwill impairment | 4,223 | — | — | ||||||||
Total expenses | 52,641 | 45,821 | 41,154 | ||||||||
Income (loss) from operations | 8,887 | 5,646 | (7,842 | ) | |||||||
Other income, net | 276 | 206 | 121 | ||||||||
Net income (loss) before income taxes | $ | 9,163 | $ | 5,852 | $ | (7,721 | ) | ||||
Benefit (provision) for income taxes | 5,285 | (69 | ) | — | |||||||
Net income (loss) | $ | 14,448 | $ | 5,783 | $ | (7,721 | ) | ||||
Net income (loss) attributable to noncontrolling interest | $ | 5,210 | $ | 3,412 | $ | (2,728 | ) | ||||
Net income (loss) attributable to UCP, Inc. | 9,238 | 2,371 | (4,993 | ) | |||||||
Other comprehensive income (loss), net of tax | — | — | — | ||||||||
Comprehensive income (loss) | $ | 14,448 | $ | 5,783 | $ | (7,721 | ) | ||||
Comprehensive income (loss) attributable to noncontrolling interest | $ | 5,210 | $ | 3,412 | $ | (2,728 | ) | ||||
Comprehensive income (loss) attributable to UCP, Inc. | $ | 9,238 | $ | 2,371 | $ | (4,993 | ) | ||||
Earnings (loss) per share of Class A common stock: | |||||||||||
Basic | $ | 1.16 | $ | 0.30 | $ | (0.63 | ) | ||||
Diluted | $ | 1.15 | $ | 0.30 | $ | (0.63 | ) | ||||
Weighted average shares of Class A common stock: | |||||||||||
Basic | 7,969,028 | 7,966,765 | 7,870,269 | ||||||||
Diluted | 8,064,728 | 7,973,488 | 7,870,269 | ||||||||
See accompanying notes to consolidated financial statements.
70
UCP, INC.
CONSOLIDATED STATEMENTS OF EQUITY
(In thousands, except number of shares)
UCP, Inc. Shareholders’ Equity | |||||||||||||||||||||||||||||||||
Shares of common stock outstanding | Common stock | Additional paid-in capital | Treasury stock | Accumulated deficit | Noncontrolling interest | Total equity | |||||||||||||||||||||||||||
Class A | Class B | Class A | Class B | ||||||||||||||||||||||||||||||
Balance at December 31, 2013 | 7,750,000 | 100 | $ | 78 | $ | — | $ | 93,117 | $ | — | $ | (1,941 | ) | $ | 126,462 | $ | 217,716 | ||||||||||||||||
Class A - Issuance of common stock for RSUs, net of withholding taxes paid for vested RSUs | 172,216 | 1 | (819 | ) | (801 | ) | (1,619 | ) | |||||||||||||||||||||||||
Stock-based compensation expense | 1,812 | 1,753 | 3,565 | ||||||||||||||||||||||||||||||
Distribution to noncontrolling interest | (674 | ) | (674 | ) | |||||||||||||||||||||||||||||
Net loss | (4,993 | ) | (2,728 | ) | (7,721 | ) | |||||||||||||||||||||||||||
Balance at December 31, 2014 | 7,922,216 | 100 | $ | 79 | $ | — | $ | 94,110 | $ | — | $ | (6,934 | ) | $ | 124,012 | $ | 211,267 | ||||||||||||||||
Class A - Issuance of common stock for RSUs, net of withholding taxes paid for vested RSUs | 92,218 | 1 | (160 | ) | (211 | ) | (370 | ) | |||||||||||||||||||||||||
Stock-based compensation expense | 733 | 977 | 1,710 | ||||||||||||||||||||||||||||||
Distribution to noncontrolling interest | (982 | ) | (982 | ) | |||||||||||||||||||||||||||||
Net income | 2,371 | 3,412 | 5,783 | ||||||||||||||||||||||||||||||
Balance at December 31, 2015 | 8,014,434 | 100 | $ | 80 | $ | — | $ | 94,683 | $ | — | $ | (4,563 | ) | $ | 127,208 | $ | 217,408 | ||||||||||||||||
Class A - Issuance of common stock for RSUs, net of withholding taxes paid for vested RSUs | 28,400 | — | (20 | ) | (25 | ) | (45 | ) | |||||||||||||||||||||||||
Repurchase of common stock | (146,346 | ) | (1,250 | ) | (1,250 | ) | |||||||||||||||||||||||||||
Re-allocation from stock issuances | 1,962 | (1,962 | ) | — | |||||||||||||||||||||||||||||
Stock-based compensation expense | 498 | 657 | 1,155 | ||||||||||||||||||||||||||||||
Distribution to noncontrolling interest | (4,830 | ) | (4,830 | ) | |||||||||||||||||||||||||||||
Net income | 9,238 | 5,210 | 14,448 | ||||||||||||||||||||||||||||||
Balance at December 31, 2016 | 7,896,488 | 100 | $ | 80 | $ | — | $ | 97,123 | $ | (1,250 | ) | $ | 4,675 | $ | 126,258 | $ | 226,886 | ||||||||||||||||
See accompanying notes to consolidated financial statements.
71
UCP, INC.
CONSOLIDATED STATEMENTS OF CASH FLOWS
Year Ended December 31, | |||||||||||
(In thousands) | 2016 | 2015 | 2014 | ||||||||
Operating activities | |||||||||||
Net income (loss) | $ | 14,448 | $ | 5,783 | $ | (7,721 | ) | ||||
Adjustments to reconcile net income (loss) to net cash provided by (used in) operating activities: | |||||||||||
Stock-based compensation | 1,155 | 1,710 | 3,565 | ||||||||
Abandonment charges | 523 | 152 | 173 | ||||||||
Impairment on real estate inventories | 2,589 | 923 | — | ||||||||
Depreciation and amortization | 631 | 622 | 599 | ||||||||
Goodwill impairment | 4,223 | — | — | ||||||||
Fair value adjustment of contingent consideration | (2,347 | ) | (818 | ) | (377 | ) | |||||
Deferred income taxes, net | (5,482 | ) | — | — | |||||||
Changes in operating assets and liabilities: | |||||||||||
Real estate inventories | (14,200 | ) | (38,476 | ) | (131,045 | ) | |||||
Receivables | (4,311 | ) | (26 | ) | (444 | ) | |||||
Other assets | (50 | ) | (2,362 | ) | (2,293 | ) | |||||
Accounts payable | 3,553 | 12,907 | 1,383 | ||||||||
Accrued liabilities | 3,220 | (2,921 | ) | 5,638 | |||||||
Customer deposits | 624 | 1,351 | 24 | ||||||||
Income taxes payable | (147 | ) | 69 | — | |||||||
Net cash provided by (used in) operating activities | 4,429 | (21,086 | ) | (130,498 | ) | ||||||
Investing activities | |||||||||||
Purchases of fixed assets | (166 | ) | (330 | ) | (1,004 | ) | |||||
Citizens acquisition | — | — | (14,006 | ) | |||||||
Restricted cash | (647 | ) | (650 | ) | (250 | ) | |||||
Net cash used in investing activities | (813 | ) | (980 | ) | (15,260 | ) | |||||
Financing activities | |||||||||||
Distribution to noncontrolling interest | (4,830 | ) | (982 | ) | (674 | ) | |||||
Proceeds from notes payable | 154,315 | 134,470 | 78,313 | ||||||||
Proceeds from senior notes, net of discount | — | — | 74,550 | ||||||||
Repayment of notes payable | (150,077 | ) | (112,430 | ) | (48,362 | ) | |||||
Debt issuance costs | (627 | ) | (826 | ) | (1,920 | ) | |||||
Repurchase of common stock | (1,250 | ) | — | — | |||||||
Withholding taxes paid for vested RSUs | (45 | ) | (370 | ) | (1,619 | ) | |||||
Net cash (used in) provided by financing activities | (2,514 | ) | 19,862 | 100,288 | |||||||
Net decrease in cash and cash equivalents | 1,102 | (2,204 | ) | (45,470 | ) | ||||||
Cash and cash equivalents – beginning of period | 39,829 | 42,033 | 87,503 | ||||||||
Cash and cash equivalents – end of period | $ | 40,931 | $ | 39,829 | $ | 42,033 | |||||
Non-cash investing and financing activity | |||||||||||
Exercise of land purchase options acquired with acquisition of business | $ | 86 | $ | 196 | $ | 141 | |||||
Issuance of Class A common stock for vested restricted stock units | $ | 262 | $ | 1,050 | $ | 3,999 | |||||
Fair value of assets acquired from the acquisition of business | — | — | $ | 19,418 | |||||||
Cash paid for the acquisition of business | — | — | $ | (14,006 | ) | ||||||
Contingent consideration and liabilities assumed from the acquisition of business | — | — | $ | 5,412 | |||||||
Supplemental cash flow information | |||||||||||
Income taxes paid | $ | 344 | — | — | |||||||
Accrued offering and debt issuance costs | — | — | $ | 473 | |||||||
See accompanying notes to consolidated financial statements.
72
UCP, INC.
NOTES TO CONSOLIDATED FINANCIAL STATEMENTS
1. DESCRIPTION OF BUSINESS AND NATURE OF OPERATIONS
As used in this report, unless the context otherwise requires or indicates, references to “the Company,” "we," "our," and “UCP” refer to UCP, Inc. and its consolidated subsidiaries, including UCP, LLC.
Company’s Business:
The Company is a homebuilder and land developer with expertise in residential land acquisition, development and entitlement, as well as home design, construction and sales. The Company's homebuilding and land development operations are each segmented into two geographic regions, West and Southeast. We operate in the states of California, Washington, North Carolina, South Carolina and Tennessee.
Company’s History
The Company’s operations began in 2004, and principally focused on acquiring land, entitling and developing it for residential construction, and selling residential lots to third-party homebuilders. In January 2008, the Company’s business was acquired by PICO Holdings, Inc. (“PICO”), a NASDAQ -listed, diversified holding company, which allowed the Company to accelerate the development of its business and gain access to a capital partner capable of funding its growth. In 2010, the Company formed Benchmark Communities, LLC, its wholly owned homebuilding subsidiary, to design, construct and sell high quality single-family homes. The Company completed its IPO on July 23, 2013 and purchased a 42.3% economic interest in UCP, LLC with the net proceeds. On April 10, 2014, the Company completed the acquisition of the assets and liabilities of Citizens Homes, Inc. ("Citizens"), used in the purchase of real estate and the construction and marketing of residential homes in North Carolina, South Carolina and Tennessee (the "Citizens Acquisition"), in order to expand its operations into markets located in those states.
Company’s Reorganization and the IPO
UCP, Inc. was incorporated in the State of Delaware on May 7, 2013 as a wholly-owned subsidiary of PICO for the purpose of facilitating the IPO and to become a holding company owning, as its principal asset, membership interests in UCP, LLC. UCP, LLC is a holding company for the entities that directly or indirectly own and operate the Company’s business. The net proceeds of $105.5 million from the IPO were used by UCP, Inc. for acquiring the 42.3% ownership in UCP, LLC.
Upon completion of the IPO, UCP, Inc. issued 7,750,000 shares of Class A common stock (par value $0.01 per share) at a public offering price of $15.00 per share and received net proceeds of $105.5 million after deducting the underwriting discount and other offering costs. UCP, Inc. invested these net proceeds into UCP, LLC and acquired UCP, LLC’s newly-issued Series B Units, which represented a 42.3% economic interest in UCP, LLC; PICO, through its ownership of UCP, LLC Series A Units, retained the remaining 57.7% economic interest in UCP, LLC.
In connection with the IPO, UCP, LLC's Amended and Restated Limited Liability Company Operating Agreement (the "Operating Agreement") was amended and restated to, among other things, designate UCP, Inc. as the sole managing member of UCP, LLC and establish a new series of units (“UCP, LLC Series B Units”), which are held solely by UCP, Inc., and reclassify PICO's units into 10,593,000 UCP, LLC Series A Units (the “UCP, LLC Series A Units”), which are held solely by PICO (and its permitted transferees). UCP, Inc. purchased 7,750,000 UCP, LLC Series B Units through its investment in UCP, LLC with the net proceeds from the IPO. The UCP, LLC Series B Units rank on parity with the UCP, LLC Series A Units as to distribution rights and rights upon liquidation, winding up or dissolution. Subsequent to the IPO and related transactions, as the sole managing member of UCP, LLC, UCP, Inc. operates and controls all of the business and affairs and consolidates the financial results of UCP, LLC and its subsidiaries.
Tax Distribution
Pursuant to the Operating Agreement, UCP, Inc. has the right to determine when distributions (other than tax distributions) will be made to the members of UCP, LLC and the amount of any such distributions. If UCP, Inc. authorizes a distribution, such distribution generally will be made to the members of UCP, LLC pro rata in accordance with their respective percentage interests. During the years ended December 31, 2016 and December 31, 2015, UCP, LLC made distributions of $4.8 million and $1.0 million, respectively,
73
to PICO toward its tax liability as required by the Operating Agreement and a pro rata distribution of $3.7 million and $0.7 million, respectively, to UCP, Inc. There were no other distributions by UCP, LLC for the year ended December 31, 2016.
The amended and restated certificate of incorporation of UCP, Inc. authorizes two classes of common stock: Class A common stock and Class B common stock, par value $0.01 per share (“Class B common stock”). Shares of Class A common stock represent 100% of the economic rights of the holders of all classes of UCP, Inc.'s common stock. Shares of Class B common stock, which are held exclusively by PICO, are not entitled to any dividends paid by, or rights upon liquidation of, UCP, Inc. PICO holds 100 shares of Class B common stock of UCP, Inc., providing PICO with no economic rights but entitling PICO, without regard to the number of shares of Class B common stock held by PICO, to one vote on matters presented to stockholders of UCP, Inc. for each UCP, LLC Series A Unit (as defined below) held by PICO. Holders of the Company’s Class A common stock and Class B common stock will vote together as a single class on all matters presented to the Company’s stockholders for their vote or approval, except as otherwise required by applicable law. As of December 31, 2016, PICO held 10,593,000 UCP, LLC Series A Units and 100 shares of Class B common stock, which provided PICO with 56.8% of the aggregate voting power of UCP, Inc.'s outstanding Class A common stock and Class B common stock, which equals PICO’s economic interest in the Company. PICO effectively has control over the outcome of votes on all matters requiring approval by the Company’s stockholders.
The Company's charter provides that its board of directors has the authority, without action by the stockholders, to designate and issue up to 50,000,000 shares of preferred stock in one or more classes or series and to fix for each class or series the powers, rights, preferences and privileges of each series of preferred stock, including dividend rights, conversion rights, voting rights, terms of redemption, liquidation preferences and the number of shares constituting any class or series, which may be greater than the rights of the holders of the Class A common stock or Class B common stock.
Exchange Agreement
In connection with the IPO, UCP, Inc. entered into an Exchange Agreement dated July 23, 2013 by and among UCP, Inc., UCP, LLC and PICO (the "Exchange Agreement"), pursuant to which PICO (and its permitted transferees) have the right to cause UCP, Inc. to exchange PICO's UCP, LLC Series A Units for shares of UCP, Inc. Class A common stock on a one-for-one basis, subject to equitable adjustments for stock splits, stock dividends, stock repurchases and reclassifications. As of December 31, 2016, giving effect to the Class A common stock that the Company would issue if PICO were to elect to exchange all of its UCP, LLC Series A Units for shares of Class A common stock, the Company would have 18,635,834 shares of Class A common stock outstanding. Any UCP, LLC Series A Units being exchanged will be reclassified as UCP, LLC Series B Units in connection with such exchange.
In addition, in connection with and subsequent to the IPO, the Company issued an aggregate of 430,333 restricted stock units ("RSUs") in 2013, 66,561 in 2014, 1,237 in 2015, and 271,635 in 2016 to the members of its board of directors, executive officers and other employees. Additionally, no stock options ("Options") were awarded in 2016 and 71,429 and 166,081 Options were awarded in 2015 and 2014, respectively. These RSUs and Options vest at various points in time through 2018. The Company issues Class A common stock on a one-for-one basis in connection with the vesting of each RSU or exercise of an Option.
Any UCP, LLC Series A Units being exchanged will be reclassified as UCP, LLC Series B Units in connection with such exchange. Exchanges by PICO of its UCP, LLC Series A Units for shares of UCP, Inc. Class A common stock are expected to result, with respect to UCP, Inc., in increases in the tax basis of the assets of UCP, LLC that otherwise would not have been available. These increases in tax basis may reduce the amount of tax that UCP, Inc. would otherwise be required to pay in the future. These increases in tax basis may also decrease gains (or increase losses) on future dispositions of certain assets to the extent tax basis is allocated to those assets.
Tax Receivable Agreement
UCP, Inc., UCP, LLC and PICO are party to a Tax Receivable Agreement dated July 23, 2013 (the "TRA"). When PICO sells or exchanges its UCP, LLC Series A Units for shares of the Company’s Class A common stock, such a sale or exchange by PICO would result in an adjustment to the tax basis of the assets owned by UCP, LLC at the time of an exchange. An increase in tax basis is expected to increase the Company's depreciation and amortization income tax deductions and create other tax benefits and therefore may reduce the amount of income tax that the Company would otherwise be required to pay in the future. Under the TRA, the Company generally is required to pay to PICO 85% of the applicable cash savings in U.S. federal and state income tax that the Company actually realizes (or is deemed to realize in certain circumstances) as a result of sales or exchanges of the UCP, LLC Series A Units held by PICO for shares of Class A common stock, leaving the Company with 15% of the benefits of the tax savings. Cash savings in income tax will be computed by comparing the Company’s actual income tax liability to the amount of income taxes that the Company would have been required to pay had there been no increase in the tax basis of the tangible and intangible assets of UCP, LLC as a result of the exchanges. If the Company would not have reported taxable income in a given year had there been no increase
74
in the tax basis of assets as a result of the exchanges, no payment under the TRA for that taxable year is required because no tax savings will have been realized.
As of December 31, 2016, PICO has not exchanged any of its UCP, LLC Series A Units. Estimating the amount of future payments to be made under the TRA cannot be done reliably at this time because any increase in tax basis, as well as the amount and timing of any payments, will vary depending on a number of factors, including:
• | the timing of any exchanges of UCP, LLC Series A Units for shares of the Company’s Class A common stock by PICO, as the increase in any tax deductions will vary depending on the allocation of fair market value to the assets of UCP, LLC at the time of any such exchanges, and this value allocation may fluctuate over time; |
• | the price of the Company’s Class A common stock at the time of any exchanges of UCP, LLC Series A Units for shares of the Company’s Class A common stock (since the increase in the Company’s share of the basis in the assets of UCP, LLC, as well as the corresponding increase in any tax deductions, will be related to the price of the Company’s Class A common stock at the time of any such exchanges); |
• | the tax rates in effect at the time the Company uses the increased amortization and depreciation deductions or realize other tax benefits; and |
• | the amount, character and timing of the Company’s taxable income. |
The effects of the TRA on the Company’s consolidated balance sheet if PICO elects to exchange all or a portion of its UCP, LLC Series A Units for the Company’s Class A common stock are expected to be as follows:
• | an increase in deferred tax assets for the estimated income tax effects of the increase in the tax basis of the assets owned by UCP, LLC based on enacted federal, state and local income tax rates at the date of the relevant transaction. To the extent the Company believes that it is more likely than not that the Company will not realize the full tax benefit represented by the deferred tax asset, the Company will reduce the deferred tax asset with a valuation allowance; |
• | the Company may record 85% of the applicable cash tax savings in U.S. federal and state income taxes resulting from the increase in the tax basis of the UCP, LLC Series A Units and certain other tax benefits related to entering into the TRA, including tax benefits attributable to payments under the TRA as an increase in a payable due to PICO; and |
• | an increase to additional paid-in capital equal to the difference between the increase in deferred tax assets and the increase in the liability due to PICO. |
The Company has the right to terminate the TRA at any time. In addition, the TRA will terminate early if the Company breaches obligations under the TRA or upon certain mergers, asset sales, other forms of business combinations or other changes of control. In either case, the Company’s payment obligations under the TRA would be accelerated and would become due and payable based on certain assumptions, including that (a) all the UCP, LLC Series A Units are deemed exchanged for their fair value, (b) the Company would have sufficient taxable income to fully utilize the deductions arising from the increased tax deductions and tax basis and (c) the subsidiaries of UCP, LLC will sell certain non-amortizable assets (and realize certain related tax benefits) no later than a specified date. In each of these instances, the Company would be required to make an immediate payment to PICO equal to the present value of the anticipated future tax benefits (discounted over the applicable amortization and depreciation periods for the assets the tax bases of which are stepped up (which could be as long as fifteen years in respect of intangibles and goodwill) at a discount rate equal to the 30-day London Interbank Offered Rate ("LIBOR") plus 100 basis points). The benefits would be payable even though, in certain circumstances, no UCP, LLC Series A Units are actually exchanged at the time of the accelerated payment under the TRA, thereby resulting in no corresponding tax basis step up at the time of such accelerated payment under the TRA.
Investor Rights Agreement and Transition Services Agreement
Pursuant to an Investor Rights Agreement dated July 23, 2013 (the "Investor Rights Agreement"), PICO has the right to nominate two individuals for election to UCP, Inc.'s board of directors for as long as PICO owns 25% or more of the combined voting power of UCP, Inc.'s outstanding Class A and Class B common stock and one individual for as long as it owns at least 10% (in each case, excluding shares of any of UCP, Inc.'s common stock that are subject to issuance upon the exercise or exchange of rights of conversion or any options, warrants or other rights to acquire shares). However, the Investor Rights Agreement does not entitle PICO to nominate individuals for election to UCP, Inc.'s board of directors if their election would result in PICO nominees comprising more than two of UCP, Inc.'s directors (for as long as PICO owns 25% or more of the combined voting power of UCP, Inc.'s outstanding Class A and Class B common stock) or one of UCP, Inc.'s directors (for as long as PICO owns at least 10% of the combined voting power of UCP, Inc.'s outstanding Class A and Class B common stock).
75
UCP also entered into a Transition Services Agreement ("TSA"), dated July 23, 2013 with PICO, pursuant to which PICO provided UCP, Inc. with certain accounting, human resources and information technology services. This agreement was completed on July 31, 2015, and PICO no longer provides such services to UCP, Inc.
2. SUMMARY OF SIGNIFICANT ACCOUNTING POLICIES
Basis of Presentation
The accompanying consolidated financial statements include the accounts of the Company and its wholly-owned, majority-owned and controlled subsidiaries, and have been prepared in accordance with the accounting principles generally accepted in the United States of America ("GAAP"). All intercompany accounts have been eliminated upon consolidation.
As an “emerging growth company,” as defined in the Jumpstart Our Business Startups Act of 2012, the Company has taken advantage of certain temporary exemptions from various reporting requirements, including reduced disclosure obligations regarding executive compensation in its periodic reports and proxy statements. The Company could be an emerging growth company until the last day of the fiscal year following the fifth anniversary of the July 23, 2013 completion of its IPO, although a variety of circumstances could cause it to lose that status earlier.
Use of Estimates in Preparation of Financial Statements:
The preparation of financial statements in accordance with GAAP requires management to make estimates and assumptions that affect the disclosure and reported amounts of assets and liabilities reported in the consolidated financial statements and accompanying notes. Significant estimates relate to the assessment of real estate impairments, valuation of assets and liabilities acquired, cost capitalization, accrued obligations, warranty reserves, income taxes and contingent liabilities. While management believes that the carrying value of such assets and liabilities are appropriate as of December 31, 2016 and 2015, it is reasonably possible that actual results could differ from the estimates upon which the carrying values were based.
Related Party Transactions:
As of December 31, 2016, PICO holds an economic and voting interest in our Company equal to approximately 56.8%. The Company is party to certain agreements with PICO, including an Exchange Agreement (pursuant to which PICO has the right to cause the Company to exchange PICO’s interests in UCP, LLC for shares of the Company’s Class A common stock on a one-for-one basis, subject to equitable adjustments for stock splits, stock dividends, reclassifications and repurchases by UCP of Class A common stock), an Investor Rights Agreement (pursuant to which PICO has certain rights, including the right to select two individuals for nomination for election to the Company’s board of directors for as long as PICO owns at least a 25% voting interest in the Company), a TRA (pursuant to which PICO is entitled to 85% of any cash savings in U.S. federal, state and local income tax that the Company actually realizes as a result of any increase in tax basis caused by PICO’s exchange of UCP, LLC interests for shares of the Company’s Class A common stock), a Registration Rights Agreement, with respect to the shares of Class A common stock that PICO may receive in exchanges made pursuant to the Exchange Agreement and a TSA (pursuant to which PICO provides certain administrative support services to UCP, Inc.).
On July 31, 2015, the Company fully transitioned the services under the TSA, therefore, the balance due to PICO pursuant to the TSA and expense allocations of other amounts payable due to PICO was approximately zero for both years ended December 31, 2016 and 2015. For the years ended December 31, 2015 and 2014, the Company incurred $119,000 and $615,000 for services under the TSA.
Segment Reporting:
The Company has segmented its operating activities into two operating segments, West and Southeast, and two reportable segments, Homebuilding and Land development.
In accordance with the applicable accounting guidance, the Company considered similar economic and other characteristics, including geography, product types, average selling prices, gross margins, production processes, suppliers, subcontractors, regulatory environments, land acquisition results and underlying supply and demand in determining its reportable segments. Each reportable segment includes real estate with similar economic characteristics, including similar historical and expected long-term gross margin percentages, product types, geography, production processes and methods of distribution.
76
Cash and Cash Equivalents:
Cash and cash equivalents include highly liquid instruments purchased with original maturities of three months or less. The Company has approximately $15.1 million of cash held in money market accounts on its consolidated balance sheets as of December 31, 2016.
Cash items that are restricted as to withdrawal or usage included deposits of $1.5 million and $0.9 million for the years ended December 31, 2016 and 2015, respectively. For both periods, restricted cash items related to a construction loan, credit card agreements and a contractor's license. The year ended December 31, 2016 includes restricted cash related to a letter of credit.
Capitalization of Interest:
The Company capitalizes interest to real estate inventories during the period that real estate is undergoing development. Interest capitalized as a cost of real estate inventories is included in cost of sales-homebuilding or cost of sales-land development as related homes or real estate are delivered. To the extent the Company's debt exceeds the cost of the related qualifying asset under development, the Company expenses that portion of the interest incurred. Qualifying assets include projects that are actively under construction or under development.
Advertising Expenses:
The Company expenses advertising costs as incurred. Advertising expenses for the years ended December 31, 2016 and 2015 was $2.3 million for both periods and $2.0 million for the year ended December 31, 2014.
Real Estate Inventories and Cost of Sales:
The Company capitalizes pre-acquisition costs, the purchase price of real estate, development costs and other allocated costs, including interest, during development and home construction. Pre-acquisition costs, including non-refundable land deposits, are expensed to cost of sales when the Company determines continuation of the related project is not probable. Applicable costs incurred after development or construction is substantially complete are charged to sales and marketing or general and administrative ("G&A") expenses, as appropriate.
Land, development and other common costs are typically allocated to real estate inventories based on the number of homes to be constructed. Direct home construction costs are recorded using the specific identification method. Cost of sales-homebuilding includes the construction costs of each home and all applicable land acquisition, real estate development, capitalized interest and related allocated common costs. Changes to estimated total development costs subsequent to initial home closings in a community are allocated to remaining homes in the community. Cost of sales-land development includes land acquisition and development costs, capitalized interest, impairment charges, abandonment charges for projects that are no longer economically viable, and real estate taxes.
Real estate inventories are stated at cost, unless the carrying amount is determined not to be recoverable, in which case real estate inventories are written down to fair value.
All real estate inventories are classified as held until the Company commits to a plan to sell the real estate, the real estate can be sold in its present condition, the real estate is being actively marketed for sale and it is probable that the real estate will be sold within twelve months. Homes completed or under construction are included in real estate inventories in the accompanying consolidated balance sheets at the lower of cost or net realizable value.
Impairment and Abandonment of Real Estate Inventories:
The Company evaluates real estate inventories for impairment when conditions exist suggesting that the carrying amount of real estate inventories is not fully recoverable and may exceed its fair value. Indicators of impairment include, but are not limited to, significant decreases in local housing market values, decreases in the selling prices of comparable homes, significant decreases in gross margins and sales absorption rates, costs in excess of budget, and actual or projected cash flow losses. The Company prepares and analyzes cash flows at the lowest level for which there are identifiable cash flows that are independent of the cash flows of other groups of assets.
When estimating future cash flows of its real estate assets, the Company makes various assumptions, including: (i) expected sales prices and sales incentives (based on, among other things, an estimate of the number of homes available in the market, pricing and
77
incentives, and potential sales price adjustments based on market and economic trends); (ii) expected sales pace and cancellation rates (based on local housing market conditions, competition and historical trends); (iii) costs incurred to date and expected to be incurred (including, but not limited to, land and land development costs, home construction costs, indirect construction costs, and selling and marketing costs); (iv) alternative product offerings that may be offered that could have an impact on sales pace, sales price and/or building costs; and (v) alternative uses for the property.
If events or circumstances indicate that the carrying amount of real estate inventories may be impaired, such impairment will be measured based upon the difference between the carrying amount and the fair value of such asset(s) determined using the estimated future discounted cash flows, excluding interest charges, generated from the use and ultimate disposition of such asset(s). Such losses, if any, are reported within cost of sales for the period.
We estimate the fair value of each impaired community by determining the present value of the estimated future cash flows at a discount rate commensurate with the risk of the respective community. In determining the fair value of land held for sale, management considers, among other things, prices for land in recent comparable sale transactions, market analysis studies, which include the estimated price a willing buyer would pay for the land, and recent bona fide offers received from third parties.
During the year ended December 31, 2016, approximately $2.6 million of impairment losses were recorded. Approximately $2.4 million of impairment losses were recorded with respect to the Company’s real estate inventories at Sundance, located in Bakersfield, California ("Sundance"). The 65 lots remaining at the Sundance project were under contract for sale and resulted in an impairment loss of $2.1 million, as the carrying value of these lots was written down to the contractual sales price less costs to sell. In addition, homes under construction and completed homes at the Sundance project had a carrying value that exceeded their estimated undiscounted cash flows during the year ended December 31, 2016. As a result, the carrying values of those remaining lots not currently under contract at Sundance were adjusted to their estimated fair values resulting in an impairment loss of approximately $0.3 million. Furthermore, approximately $0.2 million of impairment loss was recorded during the year ended December 31, 2016 with respect to the Company’s real estate inventories at Heathers at Westport, located in Charlotte, North Carolina ("Heathers at Westport"). The four remaining completed homes at the Heathers at Westport project had a carrying value that exceeded their estimated undiscounted cash flow. As a result, the carrying values of those remaining homes were adjusted to their estimated fair values.
For the year ended December 31, 2015, approximately $0.9 million of impairment loss was recorded to homebuilding real estate inventory at the River Run project, located in Bakersfield, California ("River Run") to adjust its carrying value to its estimated fair value as of the date of the impairment. For the year ended December 31, 2014, no such real estate impairment loss was recorded. See Note 9, “Fair Value Disclosures--Non-Financial Instruments Carried at Fair Value--Non-Recurring Estimated Fair Value of Real Estate Inventories” to the consolidated financial statements included elsewhere in this Annual Report on Form 10-K for further discussion of the impairment of the real estate assets.
Abandonment charges during the years ended December 31, 2016, 2015 and 2014, were $523,000, $152,000, and $173,000, respectively. Abandonment charges are included in cost of sales in the accompanying consolidated statements of operations and comprehensive income or loss for the period in which they were recorded. These charges were related to the Company electing not to proceed with one or more land acquisitions after the incurrence of costs during due diligence.
Goodwill and Other Intangible Assets:
The purchase price of an acquired business is allocated between the net tangible assets and intangible assets of the acquired business with any residual purchase price recorded as goodwill. The determination of the value of the assets acquired and liabilities assumed involves certain judgments and estimates. These judgments can include, but are not limited to, the cash flows that an asset is expected to generate in the future and the appropriate weighted average cost of capital.
Intangible assets with determinable useful lives are amortized on a straight-line basis over the estimated remaining useful lives (ranging from six months to five years), added to the value of land when an intangible option is used to purchase the related land, or expensed in the period when the option is cancelled. Acquired intangible assets with contractual terms are generally amortized over their respective contractual lives. When certain events or changes in operating conditions occur, an impairment assessment is performed for the intangible assets. Goodwill is not amortized, but is evaluated annually for impairment or more frequently if events or circumstances indicate that goodwill may be impaired.
Impairment of Goodwill:
All goodwill has been attributed to the Southeast homebuilding reporting segment as part of the Citizens Acquisition, which was completed in 2014. In accordance with Financial Accounting Standards Board (“FASB”) issued Accounting Standards Codification
78
(“ASC”) Topic 350 - Goodwill, the Company evaluates goodwill for impairment annually or when conditions exist suggesting that the carrying amount of goodwill will more likely than not exceed its fair value. Indicators of impairment include, but are not limited to, significant decreases in economic conditions and market valuations, limitations on access to capital, and actual or projected cash flow losses or increases in cost factors that have a negative effect on earnings and cash flows. The Company prepares and analyzes cash flows at the project level for which there are identifiable cash flows.
If events or circumstances indicate that the carrying amount of goodwill may be impaired, such impairment will be measured based upon the difference between the carrying amount and the fair value and determined using the estimated future discounted cash flows, excluding interest charges. Such losses, if any, are reported as an expense in the accompanying consolidated statements of operations and comprehensive income or loss for the period.
We estimate the fair value of goodwill by applying the income approach and determining the present value of the estimated future cash flows at a discount rate. When estimating future cash flows, the Company makes various assumptions, including, but not limited to: (i) forecasted adjusted pre-tax net income over a ten-year period; (ii) weighted average cost of capital; (iii) terminal growth; and (iv) revenue growth and operating profit margin.
Based on the above factors, the Company determined that the carrying value of goodwill exceeded its fair value. As a result, the Company recorded goodwill impairment of $4.2 million during the year ended December 31, 2016 related to its Southeast operating segment. For the years ended December 31, 2015 and 2014, there was no impairment of goodwill. See Note 6, “Intangible Assets--Goodwill” to the consolidated financial statements included elsewhere in this Annual Report on Form 10-K for further discussion of the impairment of goodwill.
Fixed Assets, Net:
Fixed assets are carried at cost, net of accumulated depreciation. Depreciation is computed using the straight-line method over the estimated remaining useful lives of the assets. Computer software and hardware are depreciated over three to five years, office furniture and fixtures are depreciated over five years, vehicles are depreciated over five years and leasehold improvements are depreciated over the shorter of their useful life or lease term and range from one to five years. Maintenance and repairs are charged to expense as incurred, while significant improvements are capitalized. Depreciation expense is included in G&A expenses in the accompanying consolidated statements of operations and comprehensive income or loss.
Receivables:
The detail of receivables is set forth below (in thousands):
December 31, 2016 | December 31, 2015 | ||||||
Warranty insurance receivables | $ | 1,118 | $ | — | |||
Manufacturer rebates | 454 | 425 | |||||
Reimbursement for land development work | 4,016 | — | |||||
Other receivables | 40 | 892 | |||||
Total | $ | 5,628 | $ | 1,317 | |||
Receivables include amounts recoverable from warranty insurance, amounts due from utility companies for reimbursement of costs, manufacturer rebates and reimbursable land development costs under a fixed price contract. As of December 31, 2016, approximately $1.1 million of estimated recoverable from warranty insurance was included in receivables. In addition, approximately $4.0 million of reimbursable land development costs under an option and development agreement executed during the year ended December 31, 2016 was recorded as a receivable.
As of December 31, 2016, and 2015, the Company had no allowance for doubtful accounts recorded.
79
Other Assets:
The detail of other assets is set forth below (in thousands):
December 31, 2016 | December 31, 2015 | ||||||
Customer deposits in escrow | $ | 2,394 | $ | 1,834 | |||
Prepaid expenses | 1,098 | 2,099 | |||||
Other deposits and prepaid interest | 1,345 | 466 | |||||
Funds held in escrow | 1,490 | 1,490 | |||||
Total | $ | 6,327 | $ | 5,889 | |||
As part of the Company’s adoption of Accounting Standards Update (“ASU”) 2015-03, approximately $1.5 million of unamortized debt issuance costs that were included in the prepaid expenses category of other assets as of December 31, 2015 have been reclassified from other assets to notes payable and senior notes in the accompanying consolidated balance sheets. See Note 8, “Notes Payable and Senior Notes, net” to the consolidated financial statements included elsewhere in this Annual Report on Form 10-K for a further discussion of the change in accounting principle.
Homebuilding, Land Development Sales and Other Revenues Profit Recognition:
In accordance with applicable guidance under ASC Topic 360 - Property, Plant, and Equipment, revenue from home sales and other real estate sales is recorded and any profit is recognized when the respective sales are closed. Sales are closed when all conditions of escrow are met, title passes to the buyer, appropriate consideration is received and collection of associated receivables, if any, is reasonably assured and the Company has no continuing involvement with the sold asset. The Company does not offer financing to any buyers. Sales price incentives are accounted for as a reduction of revenues when the sale is recorded. If the earnings process is not complete, the sale and any related profits are deferred for recognition in future periods. Any profit recorded is based on the calculation of cost of sales, which is dependent on an allocation of costs.
In addition to homebuilding and land development, the Company previously provided construction management services, pursuant to which it built homes on behalf of third-party property owners. The Company entered into “cost plus fee” contracts where property owners were charged for all direct and indirect costs plus a negotiated management fee. In accordance with ASC Topic 605 - Revenue Recognition, revenues from construction management services are recognized based upon a cost-to-cost approach in applying the percentage-of-completion method. Under this approach, revenue is earned in proportion to total costs incurred, divided by total costs expected to be incurred. The total estimated cost plus the management fee represents the total contract value. The Company recognized revenue based on the actual costs incurred, plus the portion of the management fee it has earned to date. In the course of providing construction management services, the Company routinely subcontracts for services and incurs other direct costs on behalf of the property owners.
The business was acquired in connection with the Citizens Acquisition in 2014 and was sold during 2015. We no longer provide construction management services to third parties. Revenue and costs from providing these services for the year ended December 31, 2015 is included in other revenue and cost of sales-other revenue in the accompanying consolidated statements of operations and comprehensive income or loss.
Stock-Based Compensation:
Stock-based compensation expense is measured at the grant date based on the fair value of the award and is recognized as expense over the period during which the awards vest in accordance with applicable guidance under ASC 718 - Compensation - Stock Compensation. See Note 10, "Equity--Stock-Based Compensation" to the consolidated financial statements included elsewhere in this Annual Report on Form 10-K for further discussion on stock-based compensation.
Stock Repurchase Program:
Our Board of Directors authorized the Stock Repurchase Program on June 6, 2016 to repurchase up to $5.0 million of the Company’s Class A common stock between June 7, 2016 and June 1, 2018. Treasury stock represents shares repurchased under the Stock Repurchase Program, which are reflected as a reduction in Stockholders’ Equity in accordance with ASC Topic 505-30 - Equity - Treasury Stock. The number of shares repurchased is based on the settlement date and factored into our weighted average calculation for earnings per share ("EPS"). See Note 10, “Equity--Stock Repurchase Program” to the consolidated financial statements included elsewhere in this Annual Report on Form 10-K for additional information regarding the Stock Repurchase Program.
80
Warranty Reserves:
Estimated future direct warranty costs are accrued and charged to cost of sales-homebuilding in the period in which the related homebuilding revenue is recognized. Amounts accrued are based upon estimates of the amount the Company expects to pay for warranty work. The Company assesses the adequacy of its warranty reserves on a quarterly basis and adjusts the amounts recorded, if necessary, in the period in which the change in estimate occurs. Annually, or more frequently as needed, the Company engages a third-party actuary to assist in the analysis of warranty reserves based on historical data and industry trends for our communities. Warranty reserves are included in accrued liabilities in the accompanying consolidated balance sheets.
Changes in warranty reserves are detailed in the table set forth below (in thousands):
December 31, 2016 | December 31, 2015 | ||||||
Warranty reserves, beginning of period | $ | 2,852 | $ | 1,509 | |||
Warranty reserves accrued | 2,377 | 1,507 | |||||
Warranty expenditures | (705 | ) | (164 | ) | |||
Additional reserves where corresponding amounts are recorded as receivables from insurance carriers | 1,118 | — | |||||
Warranty reserves, end of period | $ | 5,642 | $ | 2,852 | |||
Consolidation of Variable Interest Entities:
The Company enters into purchase and option agreements for the purchase of real estate as part of the normal course of business. These purchase and option agreements enable the Company to acquire real estate at one or more future dates at pre-determined prices. The Company believes these acquisition structures reduce its financial risk associated with real estate acquisitions and holdings and allow the Company to better manage its cash position and return metrics.
In February 2015, the FASB issued ASU No. 2015-02, Consolidation (Topic 810): Amendments to the Consolidation Analysis (“ASU 2015-02”), to simplify consolidation accounting. The Company adopted the provisions of ASU 2015-02 as of January 1, 2016. In accordance with ASC Topic 810, "Consolidation," the Company assesses each purchase agreement to acquire real estate from an entity to determine if a variable interest entity ("VIE") may be created. Although the Company may not have legal title to the underlying land, if the Company determines that it is the primary beneficiary of the VIE, the Company would consolidate the VIE in its accompanying consolidated financial statements and reflect such assets and liabilities as “Real estate inventories not owned.” In determining if the Company is the primary beneficiary, the Company considers, among other things, whether it has the ability to control the activities of the VIE that most significantly impact its economic performance. Such activities include, but are not limited to: the ability to determine the budget or scope of the VIE; the ability to control financing decisions for the VIE; and the ability to acquire or dispose of property owned or controlled by the VIE.
Based on the current provisions of the relevant accounting guidance, the Company evaluated its purchase and option agreements for real estate in place as of December 31, 2016 or 2015. None met consolidation criteria under ASU 2015-02.
Income Taxes:
The Company’s provision for income tax expense includes federal and state income taxes currently payable and those deferred because of temporary differences between the income tax and financial reporting basis of the Company's assets and liabilities. The asset and liability method of accounting for income taxes also requires the Company to reflect the effect of a tax rate change on accumulated deferred income taxes in income in the period in which the change is enacted.
In assessing the realization of deferred income taxes, the Company considered whether it is more likely than not that any deferred income tax assets will be realized. The realization of deferred income tax assets is subject to the Company generating of sufficient taxable income during the periods in which the deferred tax assets become realizable. If it is more likely than not that some or all of the deferred income tax assets will not be realized, a valuation allowance is recorded. The Company considered many factors when assessing the likelihood of future realization of its deferred tax assets, including recent cumulative earnings experience by taxing jurisdiction, expectations of future transactions, the carry-forward periods available to the Company for tax reporting purposes and availability of tax planning strategies. These assumptions require significant judgment about future events. These judgments are consistent with the plans and estimates that the Company uses to manage the underlying businesses. In evaluating the objective
81
evidence that historical results provide, the Company considered three years of cumulative operating income or loss of the Company and its predecessor.
During the year ended December 31, 2016, the Company evaluated all available evidence in determining the likelihood that it will be able to realize all or some portion of its deferred tax assets prior to their expiration. Upon completing this evaluation, the Company concluded that it is more likely than not that the Company will be able to realize its deferred tax assets. Due to the Company's cumulative profitability during the years ended 2016, 2015 and 2014, a valuation allowance reversal against the Company’s deferred tax assets was approximately $5.5 million. As a result of the reversal of the valuation allowance, the Company realized a one-time, non-cash tax benefit in the period of reversal. Prospectively, the Company would then expect to report an effective U.S. income tax rate that is closer to its statutory rates, other than as a result of the impact from the timing differences inherent to UCP, Inc.'s investment in UCP, LLC. See Note 14, “Income Taxes” and Note 15, "Deferred Tax Asset Valuation Allowance" to the consolidated financial statements included elsewhere in this Annual Report on Form 10-K for a further discussion of the Company’s income taxes and the valuation allowance reversal for the applicable period.
As a result of the analysis of all available evidence as of December 31, 2015 and 2014 the Company's net deferred tax assets were subject to a full valuation allowance.
The Company recognizes any uncertain income tax positions on income tax returns at the largest amount that is more-likely-than-not to be sustained upon audit by the relevant taxing authority. An uncertain income tax position will not be recognized unless it has a greater than 50% likelihood of being sustained. The Company recognizes any interest and penalties related to uncertain tax positions in income tax expense. For each of the periods presented, the Company did not record any interest or penalties related to uncertain tax positions.
Price Participation Interests:
Certain land purchase contracts and other agreements include provisions for additional payments to the land sellers. These additional payments are contingent on certain future outcomes, such as selling homes above a certain preset price or achieving an internal rate of return above a certain preset level. These additional payments, if triggered, are accounted for as cost of sales when they become due, however, they are neither fully determinable, nor due, until the transfer of title to the buyer is complete. Accordingly, no liability is recorded until the sale is complete.
Noncontrolling Interest:
The Company reports the share of the results of operations that are attributable to other owners of its consolidated subsidiaries that are less than wholly-owned as noncontrolling interest in the accompanying consolidated financial statements. In the accompanying consolidated statements of operations and comprehensive income or loss, the income or loss attributable to the noncontrolling interest is reported separately, and the accumulated income or loss attributable to the noncontrolling interest, along with any changes in ownership of the subsidiary, is reported as a component of total equity.
For the years ended December 31, 2016 and 2015, the noncontrolling interest reported in the accompanying consolidated financial statements includes PICO's share of 56.8% and 56.9%, respectively, of the income related to UCP, LLC. See Note 10, "Equity--Noncontrolling Interest" to the consolidated financial statements included elsewhere in this Annual Report on Form 10-K for further discussion on noncontrolling interest.
82
Recently Issued Accounting Standards:
Standard | Description | Effective Date for the Company | Application | Effect on the Consolidated Financial Statements (or Other Significant Matters) | ||||
Intangibles - Goodwill and Other (Topic 350): Simplifying the Test for Goodwill Impairment (ASU 2017-04) | Simplifies the subsequent measurement of goodwill by eliminating Step 2 from the goodwill impairment test. Step 2 measures a goodwill impairment loss by comparing the implied fair value of a reporting unit’s goodwill with the carrying amount of that goodwill. Instead, an entity should perform its goodwill impairment test by comparing the fair value of a reporting unit with its carrying amount, considering income tax effects, and recognize an impairment charge for the amount by which the carrying amount exceeds the reporting unit’s fair value; however, the loss recognized should not exceed the total amount of goodwill allocated to that reporting unit. | January 1, 2020; early adoption permitted | Prospective | The Company currently has no goodwill recorded on its financial statements and will evaluate the method of adoption upon a future business combination when goodwill may be recorded. The Company does not expect to early adopt. | ||||
Business Combinations (Topic 805): Clarifying the Definition of a Business (ASU 2017-01) | Clarifies the definition of a business and the evaluation for determining whether transactions are accounted for as acquisitions (or disposals) of assets or businesses. The amendments provide a framework to assist entities in evaluating whether both an input and a substantive process are present to meet the definition of a business. The adoption of this standard will result in less real estate acquisitions qualifying as businesses and, accordingly, acquisition costs for those acquisitions that are not businesses will be capitalized rather than expensed. | January 1, 2018; early adoption permitted | Prospective | The Company will evaluate the method of adoption upon a future business combination. The Company does not expect to early adopt. | ||||
Technical Corrections and Improvements to Topic 606, Revenue from Contracts with Customers (ASU 2016-20) | The amendment provides updates to clarify narrow aspects of the ASU 2014-09 guidance. The update includes, but is not limited to, corrections or improvements to: loan guarantee fees, contract costs (impairment testing, interaction of impairment testing with guidance in other topics), provisions for losses on construction or production-type contracts, scope of Topic 606, disclosure of remaining performance obligations, disclosure of prior-period performance obligations, contract modifications, contract asset versus receivable, refund liability and advertising costs. | January 1, 2018; early adoption permitted | Alternative transition methods available (same transition requirements as ASU 2015-14) | The Company is evaluating the method of adoption and the effect on its future consolidated financial statements and related disclosures. The Company expects to adopt the standard as part of its adoption of ASU 2015-14. | ||||
Statement of Cash Flows (Topic 230): Restricted Cash (a consensus of the FASB Emerging Issues Task Force) (ASU 2016-18) | Improves the diversity in the classification and presentation of changes in restricted cash in the cash flow statement. Entities are required to explain the change during the period in the total of cash, cash equivalents and restricted cash in the statement of cash flows. Therefore, amounts generally described as restricted cash and restricted cash equivalents should be included with cash and cash equivalents when reconciling the beginning-of-period and end-of-period total amounts shown on the statement of cash flows. | January 1, 2018; early adoption permitted | Retrospective | The Company early adopted on January 1, 2017. There is no material effect on the Company's future consolidated financial statements and related disclosures. | ||||
Consolidation (Topic 810): Interests Held through Related Parties That Are under Common Control (ASU 2016-17) | Amends consolidation guidance on how the reporting entity that is the single decision maker of a VIE should treat indirect interests in the entity held through related parties that are under common control with the reporting entity when determining whether it is the primary beneficiary of that VIE. The primary beneficiary of a VIE is the reporting entity that has a controlling financial interest in a VIE and, therefore, consolidates the VIE. A reporting entity has an indirect interest in a VIE if it has a direct interest in a related party that, in turn, has a direct interest in the VIE. | January 1, 2017; early adoption permitted | Retrospective if ASU 2015-02 was previously adopted; or same method of transition elected for ASU 2015-02 upon adoption | The Company is evaluating the method of adoption and does not believe there will be a material effect on its future consolidated financial statements and related disclosures, specifically on indirect interests held through related parties under common control. | ||||
83
Standard | Description | Effective Date for the Company | Application | Effect on the Consolidated Financial Statements (or Other Significant Matters) | ||||
Income Taxes (Topic 740): Intra-Entity Transfers of Assets Other Than Inventory (ASU 2016-16) | Improves the accounting for income tax consequences of intra-entity transfers of assets other than inventory in which an entity should recognize at the occurrence of the transfer. Consequently, the amendments eliminate the exception for an intra-entity transfer of an asset other than inventory. Two common examples of assets included in the scope of the update are intellectual property and property, plant, and equipment. | January 1, 2018; early adoption permitted | Modified retrospective basis through a cumulative-effect adjustment to retained earnings | The Company is evaluating the method of adoption and does not believe there will be a material effect on its future consolidated financial statements and related disclosures. The Company does not expect to early adopt. | ||||
Statement of Cash Flows (Topic 230): Classification of Certain Cash Receipts and Cash Payments (ASU 2016-15) | Provides guidance on eight specific cash flow classification issues that are currently not clear or included under GAAP: (1) debt prepayment or debt extinguishment costs; (2) settlement of zero-coupon debt instruments or other debt instruments with coupon interest rates that are insignificant in relation to the effective interest rate of the borrowing; (3) contingent consideration payments made after a business combination; (4) proceeds from the settlement of insurance claims; (5) proceeds from the settlement of corporate-owned life insurance policies, including bank-owned life insurance policies; (6) distributions received from equity method investees; (7) beneficial interests in securitization transactions; and (8) separately identifiable cash flows and application of the predominance principle. | January 1, 2018; early adoption permitted | Retrospective | The Company is evaluating the method of adoption and the effect on its future consolidated financial statements and related disclosures. The Company does not expect to early adopt. | ||||
Revenue from Contracts with Customers (Topic 606): Narrow-Scope Improvements and Practical Expedients (ASU 2016-12) | Under ASU 2016-12, the core principal of Topic 606 has not changed and falls under the same guidance as ASU 2015-14. ASU 2016-12 provides clarification on new accounting guidance for revenue recognition replacing most existing guidance, including industry-specific guidance. Upon adoption, a company will recognize revenue for the transfer of goods or services to customers equal to the amount it expects to be entitled to receive for those goods or services. The guidance also requires additional disclosures about the nature, timing and uncertainty of revenue and cash flows arising from customer contracts, including significant judgments and changes in judgments. | January 1, 2018; early adoption permitted | Alternative transition methods available | The Company is evaluating the method of adoption and does not believe ASU 2016-12 will have a material effect on its future consolidated financial statements and related disclosures, specifically on collectability, sales taxes and noncash consideration based on industry-specific guidance. The Company expects to adopt the standard as part of its adoption of ASU 2015-14. | ||||
Revenue from Contracts with Customers (Topic 606): Identifying Performance Obligations and Licensing (ASU 2016-10) | Improves the implementation guidance on the new revenue standard. Under ASU 2016-10, the guidance provides clarification on the criteria to assess whether promises to transfer goods or services are distinct and separately identifiable before identifying performance obligations in a contract with a customer. ASU 2016-10 falls under the same guidance as ASU 2015-14. | January 1, 2018; early adoption permitted | Alternative transition methods available (same transition requirements as ASU 2015-14) | The Company is evaluating the method of adoption and the effect on its future consolidated financial statements and related disclosures. The Company expects to adopt the standard as part of its adoption of ASU 2015-14. | ||||
84
Standard | Description | Effective Date for the Company | Application | Effect on the Consolidated Financial Statements (or Other Significant Matters) | ||||
Compensation - Stock Compensation (Topic 718): Improvements to Employee Share-Based Payment Accounting (ASU 2016-09) | As part of the FASB's simplification initiative, the guidance simplifies the accounting for share-based payment transactions, including income tax consequences, award classification, and classification on the statement of cash flows. Certain amendment topics for simplification apply only to nonpublic entities. Adjustments are reflected as of the beginning of the fiscal year that includes that interim period adopted. Early adoption requires adoption in the same period for all amendments: (i) timing of when excess tax benefits are recognized, minimum statutory withholding requirements, forfeitures, and intrinsic value; (ii) presentation of employee taxes paid on the statement of cash flows when an employer withholds shares to meet the minimum statutory withholding requirement; (iii) requiring recognition of excess tax benefits and tax deficiencies in the income statement and the practical expedient for estimating expected term; (iv) An entity may elect to apply the amendments related to the presentation of excess tax benefits on the statement of cash flows. | January 1, 2018; early adoption permitted | (i) Modified retrospective, by means of cumulative effect adjustment; (ii) Retrospective; (iii) Prospective; (iv) Prospective or retrospective | The Company early adopted on January 1, 2017. There is no material effect on the Company's future consolidated financial statements and related disclosures. | ||||
Revenue from Contracts with Customers (Topic 606): Principal versus Agent Considerations (ASU 2016-08) | Improves the implementation guidance on the new revenue standard. Under ASU 2016-08, the guidance provides indicators to determine principal versus agent considerations for each distinct good or service provided to a customer. ASU 2016-08 falls under the same guidance as ASU 2015-14. | January 1, 2018; early adoption permitted | Alternative transition methods available (same transition requirements as ASU 2015-14) | The Company is evaluating the method of adoption and does not believe there will be a material effect on its future consolidated financial statements and related disclosures, based on industry standards. The Company expects to adopt the standard as part of its adoption of ASU 2015-14. | ||||
Leases (Topic 842) (ASU 2016-02) | Increases transparency and comparability among organizations. Under ASU 2016-02, presentation of the rights and obligations resulting from lease assets and lease liabilities are required to be recognized on the balance sheet. In addition, organizations are required to disclose key information regarding leasing arrangements. Lessees and lessors are required to use a modified retrospective transition method for existing leases. | January 1, 2019; early adoption permitted | Modified retrospective | The Company is evaluating the method of adoption and determined the effect on its liability will not have a material effect on its future consolidated financial statements and related disclosures. | ||||
Financial Instruments - Overall (Subtopic 825-10): Recognition and Measurement of Financial Assets and Financial Liabilities (ASU 2016-01) | Enhances the reporting model for financial instruments. The ASU addresses certain aspects of recognition, measurement, presentation, and disclosure of financial instruments. The guidance classifies equity securities with readily determinable fair values into categories and require equity securities to be measured at fair value with changes in the fair value recognized through net income. The amendments allow equity investments that do not have readily determinable fair values to be remeasured at fair value either upon the occurrence of an observable price change or upon identification of an impairment and require enhanced disclosures. The amendments improve relevant information about an entity’s equity investments and reducing the number of items that are recognized in other comprehensive income. | January 1, 2018; except for the early application guidance, early adoption is not permitted | Cumulative-effect adjustment to the balance sheet; prospectively for equity securities without readily determinable fair values | The Company is evaluating the method of adoption and does not expect the adoption of ASU 2016-02 to have a material effect on its future consolidated financial statements and related disclosures. | ||||
85
Standard | Description | Effective Date for the Company | Application | Effect on the Consolidated Financial Statements (or Other Significant Matters) | ||||
Revenue from Contracts with Customers (ASU 2015-14) | Provides guidance for revenue recognition. ASU 2015-14 affects any entity that either enters into contracts with customers to transfer goods or services or enters into contracts for the transfer of non-financial assets and supersedes the revenue recognition requirements in Topic 605, “Revenue Recognition,” and most industry-specific guidance. This ASU also supersedes some cost guidance included in Subtopic 605-35, “Revenue Recognition-Construction-Type and Production-Type Contracts.” The standard’s core principle is that a company will recognize revenue when it transfers promised goods or services to customers in an amount that reflects the consideration to which a company expects to be entitled in exchange for those goods or services. In doing so, companies will need to use more judgment and make more estimates than under today’s guidance. These may include identifying performance obligations in the contract, estimating the amount of variable consideration to include in the transaction price and allocating the transaction price to each separate performance obligation. | January 1, 2018; early adoption permitted | Alternative transition methods available | The Company is evaluating the method of adoption (full retrospective approach or modified retrospective approach). The primary impact of Topic 606 among homebuilders relates to accounting for common areas (community infrastructure, facilities, etc.) as a separate revenue producing activity. The completion or transfer of common areas to a third party is not considered a revenue recognition event and therefore, the Company does not expect the adoption of ASU 2015-14 to have material effect on its future consolidated financial statements and related disclosures. The Company does not expect to early adopt. | ||||
Presentation of Financial Statements—Going Concern (ASU 2014-15) | Requires management to assess a company’s ability to continue as a going concern for each of its interim and annual reporting periods and to provide related footnote disclosures in certain circumstances. Disclosures are required when conditions give rise to substantial doubt about a company’s ability to continue as a going concern. Substantial doubt is deemed to exist when it is probable that the company will be unable to meet its obligations within one year from the financial statement issuance date. | December 31, 2016; early adoption permitted | The Company adopted the standard and performed a formalized going concern analysis for the current reporting period. | |||||
Other than as described above, no new accounting pronouncement has had or is expected to have a material impact on the Company’s accompanying consolidated financial statements.
3. INCOME OR LOSS PER SHARE
Basic income or loss per share of Class A common stock is computed by dividing net income or loss attributable to UCP, Inc. by the weighted average number of shares of Class A common stock outstanding during the period. Diluted income or loss per share of Class A common stock is computed similarly to basic income or loss per share except that the weighted average number of shares of Class A common stock outstanding during the period is increased to include additional shares from the assumed exercise of any Class A common stock equivalents using the treasury stock method, if dilutive. The Company’s RSUs and Options are considered Class A common stock equivalents for this purpose. For the years ended December 31, 2016 and 2015, incremental common stock equivalents of 95,700 and 6,723 shares, respectively, were included in calculating diluted income per share. For the year ended December 31, 2014, no incremental common stock equivalents were included in calculating diluted loss per share because such inclusion would be anti-dilutive given the net loss attributable to UCP, Inc. during such period.
Basic and diluted net income or loss per share of Class A common stock for the years ended December 31, 2016, 2015 and 2014 have been computed as follows (in thousands, except share and per share amounts):
86
For the Year Ended December 31, | |||||||||||
2016 | 2015 | 2014 | |||||||||
Numerator | |||||||||||
Net income (loss) attributable to UCP, Inc. | $ | 9,238 | $ | 2,371 | $ | (4,993 | ) | ||||
Denominator | |||||||||||
Weighted average number of shares of Class A common stock outstanding - basic | 7,969,028 | 7,966,765 | 7,870,269 | ||||||||
Effect of dilutive securities: | |||||||||||
RSUs | 95,700 | 6,723 | — | ||||||||
Total shares for purpose of calculating diluted net income (loss) per share | 8,064,728 | 7,973,488 | 7,870,269 | ||||||||
Earnings (loss) per share: | |||||||||||
Net income (loss) per share of Class A common stock - basic | $ | 1.16 | $ | 0.30 | $ | (0.63 | ) | ||||
Net income (loss) per share of Class A common stock - diluted | $ | 1.15 | $ | 0.30 | $ | (0.63 | ) | ||||
The following RSUs and Options issued were excluded in the computation of diluted EPS for the years ended December 31, 2016, 2015 and 2014 because the effect would be anti-dilutive:
For the Year Ended December 31, | ||||||||
2016 | 2015 | 2014 | ||||||
Anti-dilutive securities | 250,380 | 270,718 | 419,150 | |||||
4. REAL ESTATE INVENTORIES
Real estate inventories consisted of the following (in thousands):
December 31, 2016 | December 31, 2015 | ||||||
Deposits and pre-acquisition costs | $ | 9,232 | $ | 3,836 | |||
Land held and land under development | 101,609 | 128,059 | |||||
Finished lots | 86,622 | 117,335 | |||||
Homes completed or under construction | 148,627 | 89,866 | |||||
Model homes | 27,117 | 21,893 | |||||
Total | $ | 373,207 | $ | 360,989 | |||
Deposits and pre-acquisition costs include costs relating to land purchase or option contracts. Land held and land under development includes costs incurred during site development, such as land, development, indirect costs and permits. Homes completed or under construction and model homes include all costs associated with home construction, including land, development, indirect costs, permits and fees, and vertical construction.
As of December 31, 2016, the Company had $9.2 million of deposits and pre-acquisition costs for 2,607 lots with an aggregate purchase price of approximately $106.0 million, net of deposits. As of December 31, 2015, the Company had $3.8 million of deposits pertaining to land purchase contracts for 1,127 lots with an aggregate purchase price of approximately $80.1 million, net of deposits.
As of December 31, 2016 and 2015, the Company had completed homes included in inventories of approximately $21.1 million and $31.4 million, respectively, as shown in the charts below ($ in millions):
87
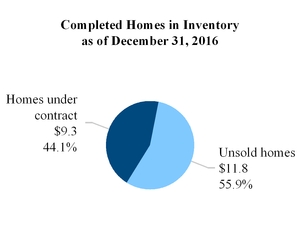
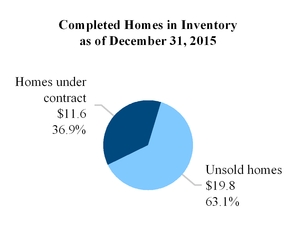
Interest Capitalization:
Amounts capitalized to home inventories and land inventories were as follows (in thousands):
December 31, | ||||||||||||
2016 | 2015 | 2014 | ||||||||||
Interest expense capitalized as cost of home inventory | $ | 10,500 | $ | 8,940 | $ | 3,176 | ||||||
Interest expense capitalized as cost of land inventory | 2,003 | 2,627 | 577 | |||||||||
Total interest expense capitalized | 12,503 | 11,567 | 3,753 | |||||||||
Previously capitalized interest expense included in cost of sales - homebuilding | (7,737 | ) | (5,275 | ) | (2,789 | ) | ||||||
Previously capitalized interest expense included in cost of sales - land development | (381 | ) | (317 | ) | (3 | ) | ||||||
Net activity of capitalized interest | 4,385 | 5,975 | — | 961 | ||||||||
Capitalized interest expense in beginning inventory | 13,274 | 7,299 | 6,338 | |||||||||
Capitalized interest expense in ending inventory | $ | 17,659 | $ | 13,274 | $ | 7,299 | ||||||
Interest is capitalized on real estate inventories during development. Interest capitalized is included in cost of sales in the Company's consolidated statement of operations and comprehensive income or loss as related sales are recognized. For the years ended December 31, 2016, 2015 and 2014, interest incurred of $12.5 million, $11.6 million, and $3.8 million, respectively, was capitalized in each respective period.
88
5. FIXED ASSETS, NET
Net fixed assets consisted of the following (in thousands):
December 31, 2016 | December 31, 2015 | ||||||
Computer hardware and software | $ | 2,043 | $ | 1,954 | |||
Office furniture and equipment and leasehold improvements | 911 | 834 | |||||
Vehicles | 83 | 83 | |||||
Total | 3,037 | 2,871 | |||||
Accumulated depreciation | (2,154 | ) | (1,557 | ) | |||
Fixed assets, net | $ | 883 | $ | 1,314 | |||
Depreciation expense for the years ended December 31, 2016, 2015 and 2014 was $597,000, $588,000 and $463,000, respectively. Depreciation expense is recorded in G&A expenses in the accompanying consolidated statements of operations and comprehensive income or loss.
6. INTANGIBLE ASSETS
Other purchased intangible assets consisted of the following:
December 31, 2016 | December 31, 2015 | ||||||||||||||||||||||
(in thousands) | Gross Carrying Amount | Accumulated Amortization | Ending Balance | Gross Carrying Amount | Accumulated Amortization | Ending Balance | |||||||||||||||||
Architectural plans | $ | 170 | $ | (94 | ) | $ | 76 | $ | 170 | $ | (60 | ) | $ | 110 | |||||||||
Land option | 583 | (558 | ) | 25 | 583 | (457 | ) | 126 | |||||||||||||||
Trademarks and trade names | 110 | (110 | ) | — | 110 | (110 | ) | — | |||||||||||||||
$ | 863 | $ | (762 | ) | $ | 101 | $ | 863 | $ | (627 | ) | $ | 236 | ||||||||||
Amortization expense for the years ended December 31, 2016 and 2015 related to the architectural plans and trademarks and trade names intangibles was approximately $34,000 for both periods. The architectural plans intangible amortization period is 5 years. Amortization expense is recorded in G&A expenses in the accompanying consolidated statements of operations and comprehensive income or loss. Future estimated amortization expense related to the architectural plans intangibles over the next five years is as follows:
(in thousands) | December 31, | ||
2017 | $ | 34 | |
2018 | 34 | ||
2019 | 8 | ||
Total | $ | 76 | |
Additionally, $86,000 and $196,000 related to land options was capitalized to real estate inventories during the years ended December 31, 2016 and 2015, respectively. For the years ended December 31, 2016 and 2015, $15,000 and $119,000, respectively, was related to abandonment.
89
Goodwill
The changes in the carrying amount of goodwill for the years ended December 31, 2016 and 2015 were as follows:
(in thousands) | Goodwill | ||
Balance at December 31, 2014 | $ | 4,223 | |
Goodwill impairment | — | ||
Balance as of December 31, 2015 | $ | 4,223 | |
Goodwill impairment | (4,223 | ) | |
Balance as of December 31, 2016 | $ | — | |
All goodwill has been attributed to the Southeast homebuilding reporting segment as part of the Citizens Acquisition, which was completed in 2014. For the year ended December 31, 2016, the Company evaluated goodwill for impairment in light of qualitative indicators. These indicators included revised financial forecasts for the Southwest operating segment as a result of items including weather that delayed new community openings, abandonment of certain opportunities to open new communities as the opportunities did not meet our underwriting criteria, and lower margins on older communities still in existence from the land purchased as part of the acquisition. The Company determined as a result of these qualitative factors, that it should conduct a Step One Test analysis of goodwill. As a result of the Step One Test and subsequent Step Two Test, the Company determined that the carrying value of goodwill exceeded its fair value, resulting in an impairment of goodwill. The fair value of goodwill was estimated by applying the income approach and determining the present value of the estimated future cash flows at a discount rate. When estimating future cash flows, the Company used key assumptions, including, but not limited to: (i) forecasted adjusted pre-tax net income over a ten-year period; (ii) weighted average cost of capital; (iii) terminal growth; and (iv) revenue growth and operating profit margin. The risk adjusted discount rate of 14.5% and terminal growth rate of 2.0% were applied to forecast adjusted pre-tax net income.
During the year ended December 31, 2016, the Company recorded goodwill impairment of $4.2 million. There was no goodwill impairment for the year ended December 31, 2015.
7. ACCRUED LIABILITIES
Accrued liabilities consisted of the following:
90
8. NOTES PAYABLE AND SENIOR NOTES, NET
The Company obtains various types of debt financing in connection with its acquisition, development and construction of real estate inventories and its construction of homes. Often, these debt obligations are secured by the underlying real estate. Certain loans are funded in full at the initial loan closing and others are revolving facilities under which the Company may borrow, repay and reborrow up to a specified amount during the term of the loan. Acquisition indebtedness matures on various dates, but is generally repaid when lots are released from the lien securing the relevant loan based upon a specific release price, as defined in the relevant loan agreement, or the loan is refinanced. Construction and development debt is required to be repaid with proceeds from home closings based upon a specific release price, as defined in the relevant loan agreement
Certain construction and development debt agreements include provisions that require minimum tangible net worth and liquidity; limit leverage and risk asset ratios; specify maximum loan-to-cost or loan-to-value ratios (whichever is lower). During the term of the loan, the lender may require the Company to obtain a third-party written appraisal of the fair value of the underlying real estate collateral. If the appraised fair value of the collateral securing the loan is below the specified minimum, the Company may be required to make principal payments in order to maintain the required loan-to-value ratios. As of December 31, 2016 and 2015, the Company had approximately $164.0 million and $157.9 million, respectively, of loan commitments related to its acquisition, development and construction loans (“ADC”). Of the total loan commitments, approximately $77.2 million and $75.1 million, respectively, was available to the Company. As of December 31, 2016 and 2015, the weighted average interest rate on the Company’s outstanding debt was 6.48% and 6.35%, respectively. Interest rates charged under the Company's variable rate debt are based on LIBOR plus a spread ranging from 2.75% to 3.75% or the U.S. Prime rate ("Prime") plus a spread of 1.75%.
The Company’s 2017 Senior Notes (the “2017 Notes”) with $75.0 million in principal outstanding mature in October of 2017, and an additional $46.0 million in ADC loans are also set to mature in the ordinary course of business during 2017. With respect to the $46.0 million in ADC loans, these loans are project specific loans and are scheduled to mature in the ordinary course of closing out of the sales phase for each of these projects and we anticipate the sales proceeds from the designated home closings will provide a more than adequate source of cash for the repayment of these loans. For the 2017 Senior Notes our existing available cash, available borrowing capacity and cash expected to be generated from our backlog of home sales will be sufficient to repay this obligation when due.
On October 21, 2014, the Company completed the private offering of $75.0 million in aggregate principal amount of the 8.5% 2017 Notes. The net proceeds from the offering were approximately $72.5 million, after paying the debt issuance costs and offering expenses. The net proceeds from the offering were used for general corporate purposes, including financing construction of homes, acquisition of entitled land, development of lots and working capital.
Under the Indenture, the 2017 Notes bear interest at 8.5% per annum, payable on March 31, June 30, September 30 and December 31 of each year. The 2017 Notes mature on October 21, 2017, unless earlier redeemed or repurchased.
The 2017 Notes are guaranteed on an unsecured senior basis by each of the Company’s Subsidiary Guarantors. The 2017 Notes and the guarantees are the Company’s and the Subsidiary Guarantors’ senior unsecured obligations and rank equally in right of payment with all of the Company’s and the Subsidiary Guarantors’ existing and future senior unsecured debt and senior in right of payment to all of the Company’s and the Subsidiary Guarantors’ future subordinated debt. The 2017 Notes and the guarantees are effectively subordinated to any of the Company’s and the Subsidiary Guarantors’ existing and future secured debt, to the extent of the value of the assets securing such debt.
The Company may redeem the 2017 Notes, in whole but not in part, at a price equal to 100% of the principal amount, plus accrued and unpaid interest, plus a “make-whole” premium. Upon the occurrence of a change of control, the Company must offer to repurchase the 2017 Notes for cash at a price equal to 101% of the principal amount of the 2017 Notes to be repurchased plus accrued and unpaid interest to, but excluding, the repurchase date. Under the Indenture, a “change of control” generally means (i) any person or group of related persons acquires more than 35% of the voting stock of the Company or (ii) the Company transfers all or substantially all of its consolidated assets to any person or group of related persons, in each case other than PICO Holdings, Inc. and its affiliates.
The Indenture provides for customary “events of default” which could cause, or permit, the acceleration of the 2017 Notes. Such events of default include (i) a default by any payment of principal or interest; (ii) failure to comply with certain covenants contained in the Indenture; (iii) defaults in failure to pay certain other indebtedness or the acceleration of certain other indebtedness prior to maturity; (iv) the failure to pay certain final judgments; and (vi) certain events of bankruptcy or insolvency.
91
The Indenture limits the Company’s and its subsidiaries’ ability to, among other things, incur or guarantee additional unsecured and secured indebtedness (provided that the Company may incur indebtedness so long as the Company’s ratio of indebtedness to consolidated tangible assets (on a pro forma basis) would be equal to or less than 45% and provided that the aggregate amount of secured debt may not exceed the greater of $75 million or 30% of the Company’s consolidated tangible assets); pay dividends and make certain investments and other restricted payments; acquire unimproved real property in excess of $75 million per fiscal year or in excess of $150 million over the term of the 2017 Notes, except to the extent funded with subordinated obligations or the proceeds of equity issuances; create or incur certain liens; transfer or sell certain assets; and merge or consolidate with other companies or transfer or sell all or substantially all of the Company’s consolidated assets. Additionally, the Indenture requires the Company to maintain at least $50 million of consolidated tangible assets not subject to liens securing indebtedness; maintain a minimum net worth of $175 million; maintain a minimum of $15 million of unrestricted cash and/or cash equivalents; and not permit decreases in the amount of consolidated tangible assets by more than $25 million in any fiscal year or more than $50 million at any time after the issuance of the 2017 Notes.
As of December 31, 2016, the Company was in compliance with the applicable financial covenants under the Indenture and all of its loan agreements.
Notes payable and 2017 Notes consisted of the following (in thousands):
Variable Interest Rate: | December 31, 2016 | December 31, 2015 | |||||
LIBOR + 3.75% through 2016 (a) | $ | — | $ | 34,528 | |||
Prime+ 1.75% through 2016 (b) | — | 717 | |||||
LIBOR + 3.00% through 2016 (a) | — | 4,832 | |||||
LIBOR + 3.50% through 2017 (a) | 4,693 | 9,785 | |||||
LIBOR + 3.75% through 2017 (a) | 31,533 | 18,456 | |||||
LIBOR + 2.75% through 2018 (a) | 10,500 | — | |||||
LIBOR + 3.75% through 2018 (a) | 26,444 | — | |||||
5.50% through 2016 | — | 2,342 | |||||
5.50% through 2017 | 2,476 | — | |||||
5.00% through 2017 | 5,607 | 4,581 | |||||
Total variable notes payable | $ | 81,253 | $ | 75,241 | |||
Fixed Interest Rate: | December 31, 2016 | December 31, 2015 | |||||
10.00% through 2017 | $ | 1,604 | $ | 1,604 | |||
0.00% through 2017 | — | 1,935 | |||||
8.00% through 2018 | 4,000 | 4,000 | |||||
Total fixed notes payable | $ | 5,604 | $ | 7,539 | |||
Senior notes, net of discount | 74,871 | 74,710 | |||||
Total notes payable and senior notes | $ | 161,728 | $ | 157,490 | |||
Debt issuance costs (c) | (734 | ) | (1,524 | ) | |||
Total notes payable and senior notes, net | $ | 160,994 | $ | 155,966 | |||
(a) As of December 31, 2016, the 30-day LIBOR rate was 0.77167%.
(b) At December 31, 2016, the U.S. Prime rate was 3.75%.
(c) | Debt issuance costs for non-revolver loans were $0.7 million and $1.5 million as of December 31, 2016 and 2015, respectively; and $0.6 million and $0.2 million for revolver loans as of December 31, 2016 and 2015, respectively. |
92
As of December 31, 2016, principal maturities of notes payable and senior notes for the years ending December 31 are as follows (in thousands):
2017 | $ | 120,785 | |
2018 | 40,943 | ||
2019 and thereafter | — | ||
Total | $ | 161,728 | |
9. FAIR VALUE DISCLOSURES
The accounting guidance regarding fair value disclosures defines fair value as the price that would be received for selling an asset or the price paid to transfer a liability in an orderly transaction between market participants at the measurement date under current market conditions.
The Company determines the fair values of its financial instruments based on the fair value hierarchy established in accordance with ASC Topic 820 - Fair Value Measurements, which requires an entity to maximize the use of observable inputs and minimize the use of unobservable inputs when measuring fair value. The classification of a financial asset or liability within the hierarchy is based upon the lowest level input that is significant to the fair value measurement. The fair value hierarchy prioritizes the inputs into three levels that may be used to measure fair value:
• | Level 1—Quoted prices for identical instruments in active markets |
• | Level 2—Quoted prices for similar instruments in active markets; quoted prices for identical or similar instruments in markets that are inactive; and model-derived valuations in which all significant inputs and significant value drivers are observable in active markets at measurement date |
• | Level 3—Valuations derived from techniques where one or more significant inputs or significant value drivers are unobservable in active markets at measurement date |
Estimated Fair Value of Financial Instruments Not Carried at Fair Value
As of December 31, 2016 and 2015, the fair values of cash and cash equivalents, accounts payable and receivable approximated their carrying values because of the short-term nature of these assets or liabilities. The estimated fair value of the Company’s debt is based on cash flow models discounted at current market interest rates for similar instruments, which are based on Level 3 inputs. There were no transfers between fair value hierarchy levels during the years ended December 31, 2016 and 2015.
The following presents the carrying value and fair value of the Company’s financial instruments which are not carried at fair value:
December 31, 2016 | December 31, 2015 | ||||||||||||||||
(in thousands) | Level in Fair Value Hierarchy | Carrying Value | Estimated Fair Value | Carrying Value | Estimated Fair Value | ||||||||||||
Notes payable | Level 3 | $ | 86,857 | $ | 86,843 | $ | 82,780 | $ | 84,712 | ||||||||
2017 notes | Level 3 | 74,871 | 74,838 | 74,710 | 82,057 | ||||||||||||
Total debt | $ | 161,728 | $ | 161,681 | $ | 157,490 | $ | 166,769 | |||||||||
The estimated fair value of the Company's debt is the present value of the contractual debt payments, based on cash flow models, discounted at the then-current interest rates, plus an estimate of the then-current credit spread, which is an estimate of the rate at which the Company could obtain replacement debt. These parameters are Level 3 inputs in the fair value hierarchy. To estimate the contractual cash flows, discount rates, and thereby the debt fair value, the Company considers various internal and external factors, including: (1) loan economic data, (2) collateral performance, (3) market interest rate data, (4) the discount curve and implied forward rate curve, and (5) other factors, which may include market, region and asset type evaluations. While the Company considered rates on existing and recently closed loan facilities in addition to the current refinancing fixed rate as of December 31, 2016, these unobservable were not incorporated into its final estimate of fair value.
93
Recurring Financial Instruments Carried at Fair Value
The following presents the Company’s recurring financial instruments that are carried at fair value (in thousands):
Description | Level 1 | Level 2 | Level 3 | Balance at December 31, 2016 | ||||||||||
Contingent consideration | — | — | $ | 360 | $ | 360 | ||||||||
Description | Level 1 | Level 2 | Level 3 | Balance at December 31, 2015 | ||||||||||
Contingent consideration | — | — | $ | 2,707 | $ | 2,707 | ||||||||
Estimated Fair Value of Contingent Consideration
The change in estimated fair value of the contingent consideration relating to the Citizens Acquisition for the years ended December 31, 2016 and 2015 consisted of the following (in thousands):
Contingent Consideration | ||||
Balance as of December 31, 2014 | $ | 3,525 | ||
Change in fair value | (818 | ) | ||
Balance as of December 31, 2015 | $ | 2,707 | ||
Change in fair value | (2,347 | ) | ||
Balance as of December 31, 2016 | $ | 360 | ||
The contingent consideration arrangement relating to Citizens Acquisition requires the Company to pay up to a maximum of $6.0 million of additional consideration based upon the achievement of various pre-tax net income performance milestones ("performance milestones") by the assets acquired in the Citizens Acquisition over a five-year period that commenced on April 1, 2014. Payout calculations are made based on calendar year performance except for the sixth payout calculation which will be calculated based on the achievement of performance milestones from January 1, 2019 through March 25, 2019. Payouts are made on an annual basis. The potential undiscounted amount of all future payments that the Company could be required to make under the contingent consideration arrangement is between $0 and $6 million.
The fair value of the contingent consideration of $0.4 million as of December 31, 2016 was estimated based on applying the weighted probability of achievement of the performance milestones. The fair value of the contingent consideration of $2.7 million as of December 31, 2015 was estimated using a Monte Carlo simulation in an options pricing framework. The change in estimated fair value of the contingent consideration was $2.3 million and $0.8 million for the years ended December 31, 2016 and 2015.
During the year ended December 31, 2016, the Company had a recurring fair value measurement for the contingent consideration and was reduced by $2.3 million. The fair value of the contingent consideration of $0.4 million as of December 31, 2016 was estimated based on significant inputs that are not observable in the market, which ASC Topic 820 - Fair Value Measurements, refers to as Level 3 inputs. Key assumptions include: (1) forecast adjusted pre-tax net income over the contingent consideration period, (2) revenue appreciation, (3) cost inflation, and (4) sales and marketing and general and administrative ("SG&A") expenses. The estimated revenue appreciation of 4.5%, cost inflation of 1.5% and SG&A expenses were applied to forecast adjusted net income over the contingent consideration period.
The fair value of the contingent consideration of $2.7 million as of December 31, 2015 was estimated using a Monte Carlo simulation in an options pricing framework. The measurement is based on significant inputs that are not observable in the market, which ASC Topic 820 - Fair Value Measurements, refers to as Level 3 inputs. Key assumptions include: (1) forecast adjusted net income over the contingent consideration period; (2) risk-adjusted discount rate reflecting the risk inherent in the forecast adjusted net income; (3) risk-free interest rates; (4) volatility of adjusted net income; and (5) the Company’s credit spread. The risk adjusted discount rate applied to forecast adjusted net income was 13.5% plus the applicable risk-free rate, resulting in a discount rate ranging from 13.5% to 14.2% over the contingent consideration period. The estimated volatility rate of 19.1% was used to simulate future adjusted net income over the contingent consideration period, and the Company's estimated credit spread of 11.0% was applied to the simulated contingent consideration cash-flows as an incremental discount rate to allow for the counter-party credit risk associated with the Company making the cash payments in the future.
94
Non-Financial Instruments Carried at Fair Value
Non-financial assets and liabilities include items such as inventory and long lived assets that are measured at fair value, on a nonrecurring basis, when events and circumstances indicate the carrying value is not recoverable. See Note 13, “Commitments and Contingencies” to the consolidated financial statements included elsewhere in this Annual Report on Form 10-K for a discussion of the non-financial measurements applied to the Citizens Acquisition.
Non-Recurring Estimated Fair Value of Real Estate Inventories
The following presents the Company’s non-financial instruments that were measured at fair value, on a non-recurring basis, by level within the fair value hierarchy (in thousands):
Description | Level 1 | Level 2 | Level 3 | Total Impairment During the Year Ended December 31, 2016 | ||||||||
Real estate and development costs - Heathers at Westport project | $ | 1,066 | $ | 192 | ||||||||
Real estate and development costs - Sundance project | $ | 5,782 | $ | 2,397 | ||||||||
Description | Level 1 | Level 2 | Level 3 | Total Impairment During the Year Ended December 31, 2015 | ||||||||
Real estate and development costs - River Run project | $ | 5,960 | $ | 923 | ||||||||
For the year ended December 31, 2016, the company had non-recurring fair value measurements that resulted from real estate impairment losses. During the year ended December 31, 2016, the Company had a non-recurring fair value measurement for the construction of Heathers at Westport. The Company recorded an impairment loss of $0.2 million with respect to the Company’s real estate inventories at Heathers at Westport for the remaining four homes and the carrying value of these homes was written down to their fair value. Key assumptions include: (1) forecast adjusted pre-tax net income, (2) risk adjusted discount rate, and (3) selling expenses. The estimated risk adjusted discount rate of 12.0% and selling expenses were applied to forecast adjusted net income.
In addition, the Company had a non-recurring fair value measurement for a land development real estate asset located in Bakersfield, California, the Sundance project. During the year ended December 31, 2016, the Company entered into a contract to sell the remaining lots in the Sundance project for less than their carrying value at a future date. As a result of the execution of a contract to sell the remaining lots at a price lower than our carrying value, the Sundance project was written down to its fair value, less selling costs. The Company recorded an impairment loss of $2.1 million with respect to the Company’s land development real estate inventories at Sundance. Furthermore, homes under construction and completed homes in the Sundance project had a carrying value in excess of their estimated undiscounted cash flows. As a result, their carrying values were written down to their fair value and the Company recorded an additional impairment loss of $0.3 million at Sundance with respect to the Company’s homes under construction estate inventories. Key assumptions used in determining the impairment loss for homes under construction and completed homes for Sundance include: (1) forecast adjusted pre-tax net income, (2) risk adjusted discount rate, and (3) selling expenses. The estimated risk adjusted discount rate of 8.0% and selling expenses were applied to forecast adjusted net income.
For the year ended December 31, 2015, an impairment of $0.9 million was recorded to homebuilding real estate inventory in the River Run project, located in Bakersfield, California, to adjust its carrying value to its estimated fair value as of the date of the impairment. The Company utilized a discounted cash flow analysis in order to determine fair value for the River Run asset. Key inputs to the calculation include projections of the asset’s revenue and cost components, in addition to the timing of which these components will be realized. The Company utilized recent community performance and a combination of publicly-available research services to best evaluate future home sales revenue. Key elements of this research include the pricing of competitive new and existing homes in the local area. The forecasted cost to complete the remaining homes in the River Run asset were determined via negotiated values with the Company’s local vendors and sub-contractors, as well as the Company’s expertise as a local homebuilder. Timing of deliveries and production, as it relates to the timing of revenue and cost, was determined through market analysis of recent historical performance of the River Run asset, the survey of competitive new home community performance and Company experience. See Note 2, “Summary of Significant Accounting Policies” to the consolidated financial statements included elsewhere in this Annual Report on Form 10-K for further discussion on impairment of real estate inventories.
There were no other non-financial fair value measurements for the years ended December 31, 2016 and 2015.
95
10. EQUITY
Noncontrolling Interest
As of December 31, 2016 and 2015, the Company held approximately 43.2% and 43.1%, respectively, of the economic interest in UCP, LLC and is its sole managing member. The noncontrolling interest reported in the accompanying consolidated financial statements includes PICO's 56.8% and 56.9% share of the income related to UCP, LLC for the years ended December 31, 2016 and 2015, respectively.
The carrying value and ending balance as of December 31, 2016 and 2015 of the noncontrolling interest was calculated as follows (in thousands):
December 31, 2016 | December 31, 2015 | ||||||
Beginning balance of noncontrolling interest | $ | 127,208 | $ | 124,012 | |||
Net income attributable to noncontrolling interest | 5,210 | 3,412 | |||||
Re-allocation of stock issuances | (1,962 | ) | — | ||||
Stock-based compensation expense attributable to noncontrolling interest | 657 | 977 | |||||
Stock issuance attributable to noncontrolling interest | (25 | ) | (211 | ) | |||
Distribution to noncontrolling interest | (4,830 | ) | (982 | ) | |||
Ending balance | $ | 126,258 | $ | 127,208 | |||
The distribution to the noncontrolling interest relates to cash distributions, which we refer to as “tax distributions,” that UCP, LLC is obligated to make.
Stock Repurchase Program
As part of the Board approved Stock Repurchase Program, between June 7, 2016 and June 1, 2018, management is authorized to repurchase up to $5.0 million of the Company’s Class A common stock in open market purchases, privately negotiated transactions or other transactions. The Stock Repurchase Program is subject to prevailing market conditions and other considerations, including our liquidity, the terms of our debt instruments, planned land investment and development spending, acquisition and other investment opportunities and ongoing capital requirements.
Since inception of the program through December 31, 2016, the Company repurchased an aggregate of 146,346 shares of Class A common stock for total consideration of $1.2 million, inclusive of commissions. The remaining value of shares that may be repurchased under the Stock Repurchase Program as of December 31, 2016 is approximately $3.8 million. The Company previously did not have a stock repurchase program, therefore there were no stock repurchases for the year ended December 31, 2015.
Re-Allocation from Stock Issuances
The Company allocates Class A common stock issued in connection with the vesting of RSUs issued under the UCP, Inc. 2013 Long-Term Incentive Plan (the “LTIP”) and stock-based compensation expense between additional paid-in-capital and noncontrolling interest within its consolidated statements of equity. The equity allocations for the noncontrolling interest are based on the economic and voting interest percentages of the Company and its noncontrolling interest holder, PICO. Issuances of Class A common stock for RSUs affect the economic and voting interest percentages, which accordingly are adjusted at the end of each issuance period. The economic and voting interest percentages prevailing during the period are used to determine the current period equity allocations for the noncontrolling interest.
96
Stock-Based Compensation
The LTIP was adopted in July 2013 and provides for the grant of equity-based awards, including options to purchase shares of Class A common stock, Class A stock appreciation rights, Class A restricted stock, Class A RSUs and performance awards. The LTIP automatically expires on the tenth anniversary of its effective date. The Company’s board of directors may terminate or amend the LTIP at any time, subject to any stockholder approval required by applicable law, rule or regulation.
The number of shares of the Company’s Class A common stock authorized under the LTIP was 1,834,300 shares. To the extent that shares of the Company’s Class A common stock subject to an outstanding option, stock appreciation right, stock award or performance award granted under the LTIP are not issued or delivered by reason of the expiration, termination, cancellation or forfeiture of such award or the settlement of such award in cash, then such shares of the Company’s Class A common stock generally shall again be available under the LTIP, subject to certain exceptions.
The RSUs and Options granted to the Company’s employees during the year ended December 31, 2014 are subject to the following vesting schedule: a) 10% vested on the first anniversary of the grant date, b) 20% vest on second anniversary of the grant date, c) 30% vest on the third anniversary of the grant date, and d) 40% vest on the fourth anniversary of the grant date. The RSUs granted to certain members of the Company’s board of directors during the second quarter of 2016 fully vest on January 1, 2017. The RSUs granted to the Company’s employees during the second quarter of 2016 are subject to the following vesting schedule: a) 20% vest on January 1, 2017, b) 20% vest on January 1, 2018, c) 20% vest on January 1, 2019, d) 20% vest on January 1, 2020, and e) 20% vest on January 1, 2021. The RSUs granted to the Company’s board of directors during the third quarter of 2016 are subject to the following vesting schedule: a) 25% vested on August 5, 2016, b) 25% vest on November 4, 2016, c) 25% vest on February 3, 2017, and d) 25% vest on May 4, 2017. The grant-date fair value of the RSUs and Options granted during the periods ended December 31, 2016 and 2015 were $2.2 million and $0.4 million, respectively.
During the years ended December 31, 2016, 2015, and 2014, the Company recognized $1.2 million, $1.7 million, and $3.6 million of stock-based compensation expense, respectively, which was included in G&A expenses in the accompanying consolidated statements of operations and comprehensive income or loss.
The following table summarizes the RSU activity for the years ended December 31, 2016, 2015 and 2014:
Number of Shares | Weighted Average Grant Date Fair Value | |||||
Outstanding and unvested at December 31, 2013 | 289,555 | $ | 15.00 | |||
Granted | 66,561 | 16.00 | ||||
Vested | (148,778 | ) | 15.00 | |||
Forfeited | (16,898 | ) | 15.41 | |||
Outstanding and unvested at December 31, 2014 | 190,440 | $ | 15.31 | |||
Granted | 1,237 | 7.98 | ||||
Vested | (143,146 | ) | 15.02 | |||
Forfeited | — | — | ||||
Outstanding and unvested at December 31, 2015 | 48,531 | $ | 15.99 | |||
Granted | 271,635 | 8.04 | ||||
Vested | (35,853 | ) | 12.17 | |||
Forfeited | — | — | ||||
Outstanding and unvested at December 31, 2016 | 284,313 | $ | 8.88 | |||
97
The following table summarizes the Options activity for the years ended December 31, 2016, 2015, and 2014:
Shares | Weighted Average Exercise Price | Weighted Average Remaining Contractual Term (in years) | Aggregate Intrinsic Value (in thousands)(1) | |||||||
Outstanding at December 31, 2013 | — | — | — | — | ||||||
Options granted | 166,081 | $ | 16.20 | 9.16 | — | |||||
Options exercised | — | — | — | — | ||||||
Options forfeited | (16,476 | ) | — | — | — | |||||
Outstanding at December 31, 2014 | 149,605 | $ | 16.20 | 9.16 | — | |||||
Options granted | 71,429 | 8.97 | — | — | ||||||
Options exercised | — | — | — | — | ||||||
Options forfeited | (71,429 | ) | (8.97 | ) | — | — | ||||
Outstanding at December 31, 2015 | 149,605 | $ | 16.20 | 8.20 | — | |||||
Options granted | — | — | — | — | ||||||
Options exercised | — | — | — | — | ||||||
Options forfeited | — | — | — | — | ||||||
Options expired | (32,953 | ) | — | — | — | |||||
Outstanding at December 31, 2016 | 116,652 | $ | 16.20 | 7.20 | — | |||||
Options vested and exercisable as of December 31, 2016 | 34,996 | $ | 16.20 | — | — | |||||
Options expected to vest as of December 31, 2016 | 81,656 | |||||||||
(1) | The aggregate intrinsic value is calculated as the amount by which the fair value of the underlying stock exceeds the exercise price of the Option. The fair value of the Company’s Class A common stock as of December 31, 2016 was $12.05 per share. |
The weighted average grant date fair value of Options granted for the year ended December 31, 2015 was $4.94. There were no Options granted during the year ended December 31, 2016.
The Company uses the Black-Scholes option pricing model to determine the fair value of Options. During the year ended December 31, 2016, the Company had 32,953 vested Options that expired based on the Resignation Agreement with the Company’s former Chief Financial Officer and Treasurer.
The assumptions used to estimate the fair value of Options granted during the years ended December 31, 2015 and 2014 were as follows:
As of December 31, | |||||
2015 | 2014 | ||||
Expected term | 6.5 years | 6.5 years | |||
Expected volatility % | 55.00 | % | 53.46 | % | |
Risk free interest rate % | 1.61 | % | 1.81 | % | |
Dividend yield % | — | — | |||
Unrecognized compensation cost for RSUs and Options issued under the LTIP was $2.0 million (net of estimated forfeitures) as of December 31, 2016. Approximately $1.7 million of the unrecognized compensation costs related to RSUs and $0.3 million related to Options. The compensation expense is expected to be recognized over a weighted average period of 3.5 years for the RSUs and 1.2 years for the Options.
98
11. INCENTIVE COMPENSATION PLAN AND EMPLOYEE BENEFITS
Incentive Compensation Plan
Certain employees of the Company are eligible to receive an annual incentive compensation award based on various performance measures. The incentive compensation plan is discretionary. For the years ended December 31, 2016, 2015 and 2014, incentive expense awards of $2.2 million, $0.5 million and $0.3 million, respectively, were recorded within G&A expenses in the accompanying consolidated statement of operations and comprehensive income or loss.
Employee Benefits
The Company maintains a 401(k) defined contribution plan, covering substantially all employees of the Company. Matching contributions are based on a percentage of employee compensation. In addition, the Company may make a discretionary profit sharing contribution at the end of the fiscal year within limits established by the Employee Retirement Income Securities Act. Total contribution expense to the plan for the years ended December 31, 2016, 2015 and 2014 was $0.6 million, $0.4 million and $0.6 million, respectively.
12. SEGMENT INFORMATION
The Company segmented its operating activities into two operating segments, West and Southeast, and two reportable segments, Homebuilding and Land development.
Operating Segments | Reportable Segments | State | ||
West | Homebuilding | California, Washington | ||
Land development | California, Washington | |||
Southeast | Homebuilding | North Carolina, South Carolina, Tennessee | ||
Land development | North Carolina, South Carolina, Tennessee | |||
Each reportable segment includes real estate of similar economic characteristics, including similar historical and expected long-term gross margin percentages, product types, geography, production processes and methods of distribution.
The reportable segments follow the same accounting policies as the consolidated financial statements described in Note 2, "Summary of Significant Accounting Policies." Operating results of each reportable segment are not necessarily indicative of the results that would have been achieved had the reportable segment been an independent, stand-alone entity during the periods presented.
The Company evaluates the performance of the operating segments based upon gross margin. “Gross Margin” is defined as operating revenues less cost of sales (cost of construction and acquisition, interest, abandonment, impairment and other cost of sales related expenses). Corporate sales, G&A expense and non-segment gains or losses are reflected within overall corporate expenses as this constitutes the Company’s primary business objective, supporting all segments. Corporate expenses are not particularly identifiable to any one segment.
99
Financial information relating to reportable segments is as follows:
Revenues | Gross Margin | ||||||||||||||||||||||
(in thousands) | 2016 | 2015 | 2014 | 2016 | 2015 | 2014 | |||||||||||||||||
Homebuilding | |||||||||||||||||||||||
West | $ | 289,037 | $ | 191,884 | $ | 128,334 | $ | 54,392 | $ | 35,666 | $ | 21,858 | |||||||||||
Southeast | 54,882 | 60,713 | 27,083 | 8,455 | 9,261 | 3,982 | |||||||||||||||||
Total homebuilding | 343,919 | 252,597 | 155,417 | 62,847 | 44,927 | 25,840 | |||||||||||||||||
Land development | |||||||||||||||||||||||
West | 5,449 | 21,074 | 32,513 | (930 | ) | 5,853 | 7,047 | ||||||||||||||||
Southeast | — | 60 | — | (389 | ) | (10 | ) | — | |||||||||||||||
Total land development | 5,449 | 21,134 | 32,513 | (1,319 | ) | 5,843 | 7,047 | ||||||||||||||||
Other (a) | — | 5,060 | 3,253 | — | 697 | 425 | |||||||||||||||||
Total | $ | 349,368 | $ | 278,791 | $ | 191,183 | $ | 61,528 | $ | 51,467 | $ | 33,312 | |||||||||||
(a) | Other includes revenues from construction management services which relate to the Citizens Acquisition and is not attributable to the homebuilding and land development operations. |
Reconciliation of gross margin to net income (loss) is as follows:
For the Year Ended December 31, | |||||||||||
(in thousands) | 2016 | 2015 | 2014 | ||||||||
Gross margin | $ | 61,528 | $ | 51,467 | $ | 33,312 | |||||
Sales and marketing | 19,257 | 18,943 | 13,748 | ||||||||
General and administrative | 29,161 | 26,878 | 27,406 | ||||||||
Goodwill impairment | 4,223 | — | — | ||||||||
Income (loss) from operations | 8,887 | 5,646 | (7,842 | ) | |||||||
Other income, net | 276 | 206 | 121 | ||||||||
Net income (loss) before income taxes | 9,163 | 5,852 | (7,721 | ) | |||||||
Benefit (provision) for income taxes | 5,285 | (69 | ) | — | |||||||
Net income (loss) | $ | 14,448 | $ | 5,783 | $ | (7,721 | ) | ||||
Total assets for each reportable and operating segment as of December 31, 2016, 2015 and 2014, are shown in the table below:
At December 31, | |||||||||||
(in thousands) | 2016 | 2015 | 2014 | ||||||||
Homebuilding | |||||||||||
West | $ | 225,770 | $ | 231,624 | $ | 218,902 | |||||
Southeast | 53,359 | 49,464 | 47,004 | ||||||||
Total homebuilding | 279,129 | 281,088 | 265,906 | ||||||||
Land development | |||||||||||
West | 94,078 | 79,901 | 55,787 | ||||||||
Southeast | — | — | — | ||||||||
Total land development | 94,078 | 79,901 | 55,787 | ||||||||
Other (a) | 60,899 | 53,708 | 53,446 | ||||||||
Total | $ | 434,106 | $ | 414,697 | $ | 375,139 | |||||
(a) | Other assets primarily include cash and cash equivalents, deposits, fixed assets, receivables and deferred tax assets which are maintained centrally and used according to the cash flow requirements of all reportable segments. |
100
13. COMMITMENTS AND CONTINGENCIES
Legal and Regulatory Matters
Lawsuits, claims and proceedings have been or may be instituted or asserted against the Company in the normal course of business, including actions brought on behalf of various classes of claimants. The Company is also subject to local, state and federal laws and regulations related to land development activities, home construction standards, sales practices, employment practices and environmental protection. As a result, the Company is subject to periodic examinations or inquiries by agencies administering these laws and regulations.
The Company records a reserve for potential legal claims and regulatory matters when they are probable of occurring and a potential loss is reasonably estimable. The accrual for these matters is based on facts and circumstances specific to each matter and the Company revises these estimates when necessary.
In view of the inherent difficulty of predicting outcomes of legal claims and related contingencies, the Company generally cannot predict their ultimate resolution, related timing or any eventual loss. If the evaluations indicate loss contingencies that could be material are not probable, but are reasonably possible, disclosure of the nature with an estimate of possible range of losses or a statement that such loss is not reasonably estimable is made. The Company is not involved in any material litigation nor, to the Company's knowledge, is any material litigation threatened against it. As of December 31, 2016 and December 31, 2015, the Company did not have any accruals for asserted or unasserted matters.
Purchase Commitments
In the ordinary course of business, we may enter into purchase or option contracts to procure lots for development and construction of homes. We are subject to customary obligations associated with entering into contracts for the purchase of land. These contracts to purchase properties typically require a cash deposit and are generally contingent upon satisfaction of certain requirements by the sellers, including obtaining applicable property and development entitlements.
We may also utilize purchase or option contracts with land sellers as a method of acquiring land in staged takedowns to help us manage the financial and market risks associated with land holdings and to reduce the use of funds from corporate financing sources. Purchase or option contracts generally require a non-refundable deposit for the right to acquire lots over a specified period of time at pre-determined prices. We generally have the right to terminate obligations under both purchase or option contracts by forfeiting the cash deposit with no further financial responsibility to the land seller.
Purchase contracts provide the Company with an option to purchase land. The ability to enter into option purchase agreements depends on the availability of land that sellers are willing to sell under option takedown arrangements, the availability of capital from financial intermediaries to finance the development of land, general housing market conditions and local market dynamics.
On September 9, 2016, we entered into an Option and Development Agreement whereby we assigned the purchase of a land parcel in Hollister, California, located in San Benito County ("Option and Development Agreement"). Under the agreement, we will develop the land into finished lots with an option to purchase 241 finished lots on a monthly takedown basis that expires on April 25, 2020, subject to an extension. Land development costs we incur are reimbursable under a fixed price contract. As part of the agreement, we made a non-refundable deposit of $6.1 million in consideration of the purchase option. Because we do not own the land, costs that we incur up to the fixed price amount, for developing the finished lots will be treated as a receivable for the amounts due. Approximately $4.0 million of reimbursable land development costs under the Option and Development Agreement was recorded as a receivable for the year ended December 31, 2016. As of December 31, 2016, there are 226 lots remaining to be purchased under the agreement.
As of December 31, 2016, we had outstanding $9.2 million of cash deposits pertaining to purchase contracts for 2,607 optioned lots with an aggregate remaining purchase price of approximately $106.0 million. As of December 31, 2015, we had outstanding $3.8 million cash deposits pertaining to purchase contracts for 1,127 optioned lots with an aggregate remaining purchase price of approximately $80.1 million.
101
Endangered Species Act
The U.S. Fish and Wildlife Service (“USFWS”) has listed the pocket gopher as a threatened species under the Federal Endangered Species Act. This species is present on land owned by UCP in Washington State. The Company believes that this project will incur additional costs relating to the listing of the pocket gopher by USFWS, including potential costs related to (i) acquiring offsite mitigation property, (ii) redesigning the project to incorporate onsite mitigation, and (iii) processing the required approvals with USFWS and the city.
During meetings with USFWS in the year ended December 31, 2016, the Company discussed acquiring additional land in the same county to satisfy the mitigation requirements through the purchase and dedication of offsite property. Two specific pieces of agricultural property were identified, and the local USFWS office has informally indicated these properties appear to be suitable to satisfy the mitigation requirements. Based on these discussions, the Company is currently under contract to purchase approximately $955,000. However, the Company is unable to completely quantify the costs until the mitigation requirements are established by USFWS, either through its general modeling tool, or the approval of an individual habitat conservation plan for the project. The purchase costs of mitigation property are included in the appropriate project budgets. Accordingly, no liability has been recorded at December 31, 2016. The Company will continue to assess the impact of this regulatory action and will record any future liability as additional information becomes available.
Surety Bonds
The Company obtains surety bonds from third parties in the normal course of business to ensure completion of certain infrastructure improvements at its projects. The performance bonds secure the completion of projects and/or support of obligations to build community improvements, such as roads, sewers, water systems and other utilities. As of December 31, 2016 and 2015, the Company had outstanding surety bonds totaling $55.2 million and $37.1 million, respectively. In the event that any such surety bond issued by a third party is called because the required improvements are not completed, the Company could be obligated to reimburse the issuer of the bond. Performance bonds do not have stated expiration dates. Rather, the Company is released from a performance bond as the underlying performance is completed. We do not expect that a material amount of any currently outstanding performance bonds will be called.
Letter of Credit
As of December 31, 2016, the Company had $0.6 million outstanding in a letter of credit as part a bond offering at East Garrison, located in Monterey Bay, California. The Company had no outstanding in a letters of credit as of December 31, 2015.
Operating Leases
The Company leases some of its offices under non-cancellable operating leases that expire at various dates through 2021 and thereafter. Rent expense for the years ended December 31, 2016, 2015 and 2014, for office space was approximately $1.4 million, $1.3 million and $1.1 million, respectively.
Future minimum payments under all operating leases for the years ending December 31 are as follows (in thousands):
2017 | $ | 928 | |
2018 | 829 | ||
2019 | 403 | ||
2020 | 275 | ||
2021 | 89 | ||
thereafter | — | ||
Total | $ | 2,524 | |
102
14. INCOME TAXES
The components of continuing income or loss before income taxes were as follows for the years ended December 31, 2016, 2015 and 2014 (in thousands):
2016 | 2015 | 2014 | |||||||||
Current Expense: | |||||||||||
Federal | $ | 152 | $ | 58 | $ | — | |||||
State | 45 | 11 | — | ||||||||
Total Current Expense | $ | 197 | $ | 69 | $ | — | |||||
Deferred Expense: | |||||||||||
Federal | (4,795 | ) | — | — | |||||||
State | (687 | ) | — | — | |||||||
Total Deferred Expense | (5,482 | ) | — | — | |||||||
Total income tax expense (benefit) | $ | (5,285 | ) | $ | 69 | $ | — | ||||
For the year ended December 31, 2016, the Company recognized an income tax benefit of as a result of a reversal of the valuation allowance. See Note 15, "Deferred Tax Asset Valuation Allowance" to the consolidated financial statements included elsewhere in this Annual Report on Form 10-K for further discussion on the valuation allowance release.
A reconciliation of income tax computed at the statutory federal income tax rate to the provision (benefit) for income taxes included in the accompanying consolidated statements of operations and comprehensive income or loss is as follows for the years ended December 31, 2016, 2015 and 2014:
2016 | 2015 | 2014 | ||||||
Income tax (benefit) provision at federal statutory rate | 35 | % | 35 | % | 35 | % | ||
State income tax, net of federal benefit | (7 | )% | — | % | — | % | ||
Change in valuation allowance | (74 | )% | (12 | )% | (22 | )% | ||
Noncontrolling interest | (20 | )% | (20 | )% | (12 | )% | ||
Other permanent items | 8 | % | (2 | )% | (1 | )% | ||
Effective tax rate | (58 | )% | 1 | % | — | % | ||
Total deferred tax assets and liabilities consist of the following as of December 31, 2016, 2015 and 2014 (in thousands):
2016 | 2015 | 2014 | |||||||||
Deferred tax assets: | |||||||||||
Net operating loss and tax credit carry forwards | $ | 252 | $ | 2,213 | $ | 3,317 | |||||
Outside basis difference in partnership | 5,214 | 5,391 | 5,192 | ||||||||
Other | 16 | 26 | 83 | ||||||||
Total deferred tax assets | 5,482 | 7,630 | 8,592 | ||||||||
Valuation allowance | — | (7,630 | ) | (8,592 | ) | ||||||
Net deferred tax assets | $ | 5,482 | $ | — | $ | — | |||||
The Company's net deferred tax assets at December 31, 2016 was primarily the result of timing differences inherent in UCP, Inc.'s investment in UCP, LLC.
In assessing the recoverability of deferred tax assets, management considers whether it is more likely than not that a portion or all of the deferred tax assets will be realized. The ultimate realization of deferred tax assets is dependent upon the generation of sufficient
103
future taxable income during the periods in which those temporary differences become deductible or included in taxable income. The Company has considered the following possible sources of taxable income when assessing the realization of its deferred tax assets: (1) future reversals of existing taxable temporary differences; (2) taxable income in prior carryback years; (3) future taxable income exclusive of reversing temporary differences and carryforwards; and (4) tax planning strategies. In making this assessment, management is required to consider all available positive and negative evidence to determine whether it is more likely than not that some portion or all of the deferred tax assets will be realized in future periods.
Based upon the level of historical income and projections for future taxable income over the periods to which the deferred tax assets are applicable, the Company concluded that it is more likely than not that the Company will be able to realize the benefits of these temporary differences as of and for the year ended December 31, 2016.
As of December 31, 2016 the company has no valuation allowance established against deferred tax assets. Accordingly, for the year ended December 31, 2016, a release of the valuation allowance of $5.5 million is recorded. See Note 15, "Deferred Tax Asset Valuation Allowance" to the consolidated financial statements included elsewhere in this Annual Report on Form 10-K for further discussion on the valuation allowance release.
For the year ended December 31, 2015, the Company's deferred tax assets of $7.6 million related principally to net operating losses and the deductible temporary differences attributable to the Company’s investment in UCP, LLC. A significant piece of objective negative evidence evaluated was the cumulative loss incurred over the three-year period ended December 31, 2015. Such objective evidence limits the ability to consider other subjective evidence, such as the Company's projections for future growth. Therefore, the Company recorded a full valuation allowance of approximately $7.6 million, against its deferred tax assets as of December 31, 2015.
The Company has the following federal, California and other state net operating loss carryforwards, and federal and state minimum tax and general business credits, as of December 31, 2016, which will expire on various dates as follows (in thousands):
As of December 31, | |||||||||||
2016 | 2015 | 2014 | |||||||||
Federal net operating losses | $ | — | $ | 4,549 | $ | 7,286 | |||||
California net operating losses | 1,588 | 5,417 | 7,003 | ||||||||
Other state net operating losses | — | 232 | 725 | ||||||||
Federal general business credits | 84 | 291 | 290 | ||||||||
Federal AMT credits | 54 | 54 | — | ||||||||
State AMT credits | 36 | 11 | — | ||||||||
The net operating loss carryforwards and general business credits, if not utilized, will begin to expire in 2034. The minimum tax credits for federal and state income tax purposes carryforward indefinitely.
Measurement of uncertain tax positions is based on judgment regarding the largest amount that is greater than 50% likely of being realized upon the ultimate settlement with a taxing authority. As a result of the implementation of this guidance, the Company has not identified any uncertain tax positions and accordingly, has no unrecognized tax expense or benefit as of the tax years ended December 31, 2016, 2015 and 2014.
The Company recognizes interest or penalties related to uncertain tax positions in income tax expense. There were no interest or penalty accruals associated with any unrecognized tax benefits as of and for the periods ended December 31, 2016, 2015 and 2014.
The Company is subject to taxation in the U.S. and various state jurisdictions. The Company’s tax years starting from 2013 remain open in various tax jurisdictions. There are no ongoing examinations by taxing authorities at this time.
104
15. DEFERRED TAX ASSET VALUATION ALLOWANCE
As of December 31, 2015, the Company had a valuation allowance against its net deferred tax asset of $7.6 million as the Company believed it was more likely than not that some or all of the deferred tax assets would not be realized. This assessment was based on the Company's historical losses and uncertainties as to the amount of future taxable income.
During the year ended December 31, 2016, the Company evaluated all available evidence in determining the likelihood that it will be able to realize all or some portion of its deferred tax assets prior to their expiration. Upon completing this evaluation, the Company concluded that it is more likely than not that the Company will be able to realize its deferred tax assets and released all of its $5.5 million valuation allowance for the year ended December 31, 2016. The determination to reduce the valuation allowance for the year ended December 31, 2016, was based primarily on the Company's cumulative profitability during the years ended 2016, 2015 and 2014, in addition to the Company's projections of taxable income in future years that provide support for utilization of our deferred tax assets.
As a result of the reversal of the valuation allowance, the Company realized a one-time, non-cash tax benefit in the period of reversal. The related effect on the accompanying consolidated statements of operations and comprehensive income or loss resulted in the Company recording an income tax benefit of $5.3 million for the year ended December 31, 2016.
105
16. QUARTERLY FINANCIAL DATA (UNAUDITED)
The following tables present certain unaudited consolidated quarterly financial information for each of the four fiscal quarters in the fiscal year ended December 31, 2016 and December 31, 2015. This quarterly information has been prepared on the same basis as the audited consolidated financial statements and includes all adjustments, consisting only of normal recurring adjustments, necessary for a fair presentation of the information for the periods presented. The results for these quarterly periods are not necessarily indicative of the operating results for a full year or any future period.
Three Months Ended | ||||||||||||||||
March 31, 2016 | June 30, 2016 | September 30, 2016 | December 31, 2016 | |||||||||||||
(In thousands, except per share data) | (Unaudited) | |||||||||||||||
Homebuilding revenue | $ | 68,225 | $ | 81,415 | $ | 89,840 | $ | 104,438 | ||||||||
Land development revenue | — | 1,422 | 3,900 | 127 | ||||||||||||
Other revenue | — | — | — | — | ||||||||||||
Total revenue | 68,225 | 82,837 | 93,740 | 104,565 | ||||||||||||
Cost of sales – homebuilding | 56,206 | 66,370 | 72,984 | 85,053 | ||||||||||||
Cost of sales – land development | 461 | 225 | 3,834 | 118 | ||||||||||||
Cost of sales – other revenue | — | — | — | — | ||||||||||||
Impairment on real estate | — | 2,397 | 192 | — | (a) | |||||||||||
Total cost of sales | 56,667 | 68,992 | 77,010 | 85,171 | ||||||||||||
Gross margin – homebuilding | 12,019 | 15,045 | 16,856 | 19,385 | ||||||||||||
Gross margin – land development | (461 | ) | 1,197 | 66 | 9 | |||||||||||
Gross margin – other revenue | — | — | — | — | ||||||||||||
Gross margin - impairment on real estate | — | (2,397 | ) | (192 | ) | — | ||||||||||
Total gross margin | 11,558 | 13,845 | 16,730 | 19,394 | ||||||||||||
Sales and marketing expenses | 4,076 | 4,667 | 4,853 | 5,662 | ||||||||||||
General and administrative expenses | 7,275 | 7,234 | 4,592 | 10,060 | ||||||||||||
Goodwill impairment | — | — | 4,223 | — | ||||||||||||
Total expenses | 11,351 | 11,901 | 13,668 | 15,722 | ||||||||||||
Other income | 28 | 22 | 204 | 23 | ||||||||||||
Net income (loss) before income taxes | $ | 235 | $ | 1,966 | $ | 3,266 | $ | 3,695 | ||||||||
Benefit (provision) for income taxes | (5 | ) | (141 | ) | (124 | ) | 5,556 | (b) | ||||||||
Net income (loss) | $ | 230 | $ | 1,825 | $ | 3,142 | $ | 9,251 | ||||||||
Net income (loss) attributable to UCP, Inc. | $ | 96 | $ | 706 | $ | 1,285 | $ | 7,151 | ||||||||
Net income (loss) per common share: | ||||||||||||||||
Basic | $ | 0.01 | $ | 0.09 | $ | 0.16 | $ | 0.90 | ||||||||
Diluted | $ | 0.01 | $ | 0.09 | $ | 0.16 | $ | 0.89 | ||||||||
* | The quarterly financial data above may not total to the accompanying consolidated statements of operations and comprehensive income or loss or the accompanying gross margin schedule due to rounding. |
(a) | The impairment on real estate in which the carrying value of inventories were written down to its estimated fair values. See Note 2, “Summary of Significant Accounting Policies” and Note 9, “Fair Value Disclosures--Non-Financial Instruments Carried at Fair Value--Non-Recurring Estimated Fair Value of Real Estate Inventories” to the consolidated financial statements included elsewhere in this Annual Report on Form 10-K for further discussion of the impairment of real estate inventories. |
(b) | The tax benefit was primarily the result of the valuation allowance reversal against the Company’s deferred tax assets. See Note 14, “Income Taxes” and Note 15, "Deferred Tax Asset Valuation Allowance" to the consolidated financial statements included elsewhere in this Annual Report on Form 10-K for a further discussion of the Company’s income taxes and the valuation allowance reversal for the applicable period. |
106
Three Months Ended | ||||||||||||||||
March 31, 2015 | June 30, 2015 | September 30, 2015 | December 31, 2015 | |||||||||||||
(In thousands, except per share data) | (Unaudited) | |||||||||||||||
Homebuilding revenue | $ | 42,635 | $ | 50,785 | $ | 70,284 | $ | 88,892 | ||||||||
Land development revenue | 120 | 1,920 | 1,116 | 17,978 | ||||||||||||
Other revenue | 768 | 2,021 | 2,272 | — | ||||||||||||
Total revenue | 43,523 | 54,726 | 73,672 | 106,870 | ||||||||||||
Cost of sales – homebuilding | 35,618 | 42,120 | 57,006 | 72,003 | ||||||||||||
Cost of sales – land development | 5 | 1,543 | 716 | 13,027 | ||||||||||||
Cost of sales – other revenue | 663 | 1,742 | 1,958 | — | ||||||||||||
Impairment on real estate | — | — | — | 923 | ||||||||||||
Total cost of sales | 36,286 | 45,405 | 59,680 | 85,953 | ||||||||||||
Gross margin – homebuilding | 7,017 | 8,665 | 13,278 | 16,889 | ||||||||||||
Gross margin – land development | 115 | 377 | 400 | 4,951 | ||||||||||||
Gross margin – other revenue | 105 | 279 | 314 | — | ||||||||||||
Gross margin - impairment on real estate | — | — | — | (923 | ) | (a) | ||||||||||
Total gross margin | 7,237 | 9,321 | 13,992 | 20,917 | ||||||||||||
Sales and marketing expenses | 4,196 | 4,357 | 4,692 | 5,697 | ||||||||||||
General and administrative expenses | 7,320 | 6,453 | 5,539 | 7,567 | ||||||||||||
Total expenses | 11,516 | 10,810 | 10,231 | 13,264 | ||||||||||||
Other income | 102 | 30 | 45 | 29 | ||||||||||||
Net income (loss) before income taxes | $ | (4,177 | ) | $ | (1,459 | ) | $ | 3,806 | $ | 7,682 | ||||||
Benefit (provision) for income taxes | — | — | — | (69 | ) | |||||||||||
Net income (loss) | $ | (4,177 | ) | $ | (1,459 | ) | $ | 3,806 | $ | 7,613 | ||||||
Net income (loss) attributable to UCP, Inc. | $ | (1,840 | ) | $ | (668 | ) | $ | 1,639 | $ | 3,240 | ||||||
Net income (loss) per common share: | ||||||||||||||||
Basic | $ | (0.23 | ) | $ | (0.08 | ) | $ | 0.20 | $ | 0.40 | ||||||
Diluted | $ | (0.23 | ) | $ | (0.08 | ) | $ | 0.20 | $ | 0.40 | ||||||
* | The quarterly financial data above may not total to the accompanying consolidated statements of operations and comprehensive income or loss or the accompanying gross margin schedule due to rounding. |
(a) | The impairment on real estate in which the carrying value of inventories were written down to its estimated fair values. See Note 2, “Summary of Significant Accounting Policies” and Note 9, “Fair Value Disclosures--Non-Financial Instruments Carried at Fair Value--Non-Recurring Estimated Fair Value of Real Estate Inventories” to the consolidated financial statements included elsewhere in this Annual Report on Form 10-K for further discussion of the impairment of real estate inventories. |
107
ITEM 9. CHANGES IN AND DISAGREEMENTS WITH ACCOUNTANTS ON ACCOUNTING AND FINANCIAL DISCLOSURE
None.
ITEM 9A. CONTROLS AND PROCEDURES
Evaluation of Disclosure Controls and Procedures
The Company maintains disclosure controls and procedures (as defined in Rule 13a-15(e) under the Exchange Act) designed to provide reasonable assurance that the information required to be disclosed by the Company in the reports that it files or submits under the Exchange Act is recorded, processed, summarized, and reported within the time periods specified in the SEC’s rules and forms.
These include controls and procedures designed to ensure that this information is accumulated and communicated to the Company’s management, including its Chief Executive Officer and Chief Financial Officer, as appropriate, to allow timely decisions regarding required disclosure. Management, with the participation of the Chief Executive and Chief Financial Officers, evaluated the effectiveness of the Company’s disclosure controls and procedures as of December 31, 2016. Based on this evaluation, the Company’s Chief Executive Officer and Chief Financial Officer have concluded that the Company’s disclosure controls and procedures were effective as of December 31, 2016 at the reasonable assurance level.
Management's Report on Internal Control over Financial Reporting
Management is responsible for establishing and maintaining adequate internal control over financial reporting. Pursuant to the rules and regulations of the SEC, internal control over financial reporting is a process designed by, or under the supervision of, the Company's principal executive and principal financial officer and effected by the Company's Board of Directors, management and other personnel, to provide reasonable assurance regarding the reliability of financial reporting and the preparation of financial statements for external purposes in accordance with GAAP and includes those policies and procedures that:
Pertain to the maintenance of records that, in reasonable detail, accurately and fairly reflect the transactions and dispositions of the assets of the Company;
Provide reasonable assurance that transactions are recorded as necessary to permit preparation of financial statements in accordance with GAAP, and that receipts and expenditures of the Company are being made only in accordance with authorizations of management and directors of the Company; and
Provide reasonable assurance regarding prevention or timely detection of unauthorized acquisition, use or disposition of the Company's assets that could have a material effect on the financial statements.
Management performed an assessment of the effectiveness of the Company's internal control over financial reporting as of December 31, 2016, utilizing the criteria described in the “Internal Control - Integrated Framework” issued in 2013 by the Committee of Sponsoring Organizations of the Treadway Commission. The objective of this assessment was to determine whether the Company's internal control over financial reporting was effective as of December 31, 2016. Based on this assessment, management has determined that the Company's internal control over financial reporting was effective as of December 31, 2016.
The effectiveness of the Company's internal control over financial reporting as of December 31, 2016 has been audited by Deloitte & Touche LLP, an independent registered public accounting firm, as stated in their attestation report which is included below.
Changes in Internal Control over Financial Reporting
There were no changes in our internal control over financial reporting (as defined in Exchange Act Rule 13a-15(f)) during the year ended December 31, 2016 that have materially affected, or are reasonably likely to materially affect, our internal control over financial reporting.
108
REPORT OF INDEPENDENT REGISTERED PUBLIC ACCOUNTING FIRM
To the Board of Directors and Stockholders of
UCP, Inc.
San Jose, CA
We have audited the internal control over financial reporting of UCP, Inc. and subsidiaries (the "Company") as of December 31, 2016, based on criteria established in Internal Control - Integrated Framework (2013) issued by the Committee of Sponsoring Organizations of the Treadway Commission. The Company's management is responsible for maintaining effective internal control over financial reporting and for its assessment of the effectiveness of internal control over financial reporting, included in the accompanying Management’s Report on Internal Control over Financial Reporting. Our responsibility is to express an opinion on the Company's internal control over financial reporting based on our audit.
We conducted our audit in accordance with the standards of the Public Company Accounting Oversight Board (United States). Those standards require that we plan and perform the audit to obtain reasonable assurance about whether effective internal control over financial reporting was maintained in all material respects. Our audit included obtaining an understanding of internal control over financial reporting, assessing the risk that a material weakness exists, testing and evaluating the design and operating effectiveness of internal control based on the assessed risk, and performing such other procedures as we considered necessary in the circumstances. We believe that our audit provides a reasonable basis for our opinion.
A company's internal control over financial reporting is a process designed by, or under the supervision of, the company's principal executive and principal financial officers, or persons performing similar functions, and effected by the company's board of directors, management, and other personnel to provide reasonable assurance regarding the reliability of financial reporting and the preparation of financial statements for external purposes in accordance with generally accepted accounting principles. A company's internal control over financial reporting includes those policies and procedures that (1) pertain to the maintenance of records that, in reasonable detail, accurately and fairly reflect the transactions and dispositions of the assets of the company; (2) provide reasonable assurance that transactions are recorded as necessary to permit preparation of financial statements in accordance with generally accepted accounting principles, and that receipts and expenditures of the company are being made only in accordance with authorizations of management and directors of the company; and (3) provide reasonable assurance regarding prevention or timely detection of unauthorized acquisition, use, or disposition of the company's assets that could have a material effect on the financial statements.
Because of the inherent limitations of internal control over financial reporting, including the possibility of collusion or improper management override of controls, material misstatements due to error or fraud may not be prevented or detected on a timely basis. Also, projections of any evaluation of the effectiveness of the internal control over financial reporting to future periods are subject to the risk that the controls may become inadequate because of changes in conditions, or that the degree of compliance with the policies or procedures may deteriorate.
In our opinion, the Company maintained, in all material respects, effective internal control over financial reporting as of December 31, 2016, based on the criteria established in Internal Control - Integrated Framework (2013) issued by the Committee of Sponsoring Organizations of the Treadway Commission.
We have also audited, in accordance with the standards of the Public Company Accounting Oversight Board (United States), the consolidated financial statements as of and for the year ended December 31, 2016 of the Company and our report dated March 2, 2017 expressed an unqualified opinion on those financial statements.
/s/ DELOITTE & TOUCHE LLP
San Diego, California
March 2, 2017
109
ITEM 9B. OTHER INFORMATION
None.
110
PART III
ITEM 10. DIRECTORS, EXECUTIVE OFFICERS AND CORPORATE GOVERNANCE
The information required by this item will be set forth in the sections entitled “Proposal 1-Election of Directors,” “Corporate Governance” and “Executive Officers” in our definitive Proxy Statement for our 2017 Annual Meeting of Stockholders and is incorporated herein by reference.
Our Board of Directors has adopted a Code of Business Conduct and Ethics that applies to our directors, officers and employees. The Code of Business Conduct and Ethics is designed to deter wrongdoing and promote the following, among other matters:
• | honest and ethical conduct, including the ethical handling of actual or apparent conflicts of interest; |
• | full, fair, accurate, timely and understandable disclosure in our communications with and reports to our stockholders, including reports filed with the SEC, and other public communications; |
• | compliance with applicable governmental laws, rules and regulations; |
• | prompt internal reporting of violations of the Code of Business Conduct and Ethics to appropriate persons; and |
• | accountability for adherence to the Code of Business Conduct and Ethics. |
Any substantive amendment to or waiver of the Code of Business Conduct and Ethics particularly applicable to or directed at our directors or executive officers will be disclosed in a Current Report on Form 8-K filed with the SEC within four business days of such action and on the Company’s website for a period of not less than 12 months. A copy of the Code of Business Conduct and Ethics is available on our website at www.unioncommunityllc.com.
ITEM 11. EXECUTIVE COMPENSATION
The information required by this item will be set forth in the sections entitled “Corporate Governance,” “2016 Executive Compensation” and “2016 Director Compensation” in our definitive Proxy Statement for our 2017 Annual Meeting of Stockholders and is incorporated herein by reference.
ITEM 12. SECURITY OWNERSHIP OF CERTAIN BENEFICIAL OWNERS AND MANAGEMENT, AND RELATED STOCKHOLDER MATTERS
The information required by this item will be set forth in the sections entitled “Beneficial Ownership of Our Common Stock” and “Equity Compensation Plan Information” in our definitive Proxy Statement for our 2017 Annual Meeting of Stockholders and is incorporated herein by reference.
ITEM 13. CERTAIN RELATIONSHIPS AND RELATED TRANSACTIONS, AND DIRECTOR INDEPENDENCE
The information required by this item will be set forth in the section entitled “Corporate Governance” in our definitive Proxy Statement for our 2017 Annual Meeting of Stockholders and is incorporated herein by reference.
ITEM 14. PRINCIPAL ACCOUNTANT FEES AND SERVICES
The information required by this item will be set forth in the section entitled “Proposal 2-Ratification of Selection of Independent Registered Public Accounting Firm” in our definitive Proxy Statement for our 2017 Annual Meeting of Stockholders and is incorporated herein by reference.
111
PART IV
ITEM 15. EXHIBITS AND FINANCIAL STATEMENT SCHEDULES
The following is a list of documents filed as a part of this report
(a)(1) Financial Statements Included herein at pages 70 through 109.
(a)(2) Financial Statement Schedules
Schedules are omitted as the required information is not present or is not present in amounts sufficient to require submission of the schedule, or because the information required is included in the consolidated financial statements or notes thereto.
(a)(3) Exhibits
The Exhibit Index attached hereto is hereby incorporated by reference to the Item.
ITEM 16. FORM 10-K SUMMARY
None.
112
SIGNATURES
Pursuant to the requirements of Section 13 or 15(d) of the Securities Exchange Act of 1934, the Registrant has duly caused this report to be signed on its behalf by the undersigned, thereunto duly authorized.
Date: | March 2, 2017 | UCP, Inc. By: /s/ Dustin L. Bogue Dustin L. Bogue Chief Executive Officer President and Director |
Pursuant to the requirements of the Securities Exchange Act of 1934, this report has been signed below by the following persons on behalf of the registrant and in the capacities and on the dates indicated.
Signature | Title | Date |
/s/ Michael C. Cortney | Chairman of the Board of Directors | March 2, 2017 |
Michael C. Cortney | ||
/s/ Dustin L. Bogue | Chief Executive Officer, President and Director | March 2, 2017 |
Dustin L. Bogue | (Principal Executive Officer) | |
/s/ James M. Pirrello | Chief Financial Officer, Chief Accounting Officer and Treasurer | March 2, 2017 |
James M. Pirrello | (Principal Financial Officer and Principal Accounting Officer) | |
/s/ Peter H. Lori | Director | March 2, 2017 |
Peter H. Lori | ||
/s/ Eric H. Speron | Director | March 2, 2017 |
Eric H. Speron | ||
/s/ Kathleen R. Wade | Director | March 2, 2017 |
Kathleen R. Wade | ||
/s/ Maxim C. W. Webb | Director | March 2, 2017 |
Maxim C. W. Webb | ||
113
UCP, INC.
ANNUAL REPORT ON FORM 10-K
December 31, 2016
INDEX OF EXHIBITS
Exhibit Number | Exhibit Description | ||
3.1 | Amended & Restated Certificate of Incorporation of UCP, Inc. (incorporated by reference to Exhibit 3.1 to the Company’s Quarterly Report on Form 10-Q for the quarter ended March 31, 2014 (filed May 12, 2014)) | ||
3.2 | Amended and Restated Bylaws of UCP, Inc. (incorporated by reference to Exhibit 3.2 to the Company’s Quarterly Report on Form 10-Q for the quarter ended March 31, 2014 (filed May 12, 2014)) | ||
3.3 | Amendment to the Amended and Restated Bylaws of UCP, Inc., dated December 28, 2016 (incorporated by reference to Exhibit 3.1 to the Company’s Current Report on Form 8-K (filed December 30, 2016)) | ||
4.1 | Specimen Class A Common Stock Certificate of UCP, Inc. (incorporated by reference to Exhibit 4.1 to the Company’s Form S-1/A (filed May 21, 2013)) | ||
4.2 | Investor Rights Agreement between PICO Holdings, Inc. and UCP, Inc. (incorporated by reference to Exhibit 4.1 to the Company’s Quarterly Report on Form 10-Q for the quarter ended March 31, 2014 (filed May 12, 2014)) | ||
4.3 | Indenture, dated October 21, 2014, among UCP, Inc., the subsidiaries of the Company signatory thereto and Wilmington Trust, National Association, as trustee (incorporated by reference to Exhibit 4.1 to the Company’s Current Report on Form 8-K (filed October 23, 2014)) | ||
4.4 | Form of 8.5% Notes due 2017 (included in Exhibit 4.3) | ||
10.1* | UCP, Inc. 2013 Long-Term Incentive Plan (incorporated by reference to Exhibit 10.1 to the Company’s Quarterly Report on Form 10-Q for the quarter ended March 31, 2014 (filed May 12, 2014)) | ||
10.2* | Registration Rights Agreement between UCP, Inc. and PICO Holdings, Inc. (incorporated by reference to Exhibit 10.2 to the Company’s Quarterly Report on Form 10-Q for the quarter ended March 31, 2014 (filed May 12, 2014)) | ||
10.3* | Employment Agreement between UCP, Inc. and Dustin L. Bogue (incorporated by reference to Exhibit 10.3 to the Company’s Quarterly Report on Form 10-Q for the quarter ended March 31, 2014 (filed May 12, 2014)) | ||
10.4 | Tax Receivable Agreement among UCP, Inc., UCP, LLC and PICO Holdings, Inc. (incorporated by reference to Exhibit 10.7 to the Company’s Quarterly Report on Form 10-Q for the quarter ended March 31, 2014 (filed May 12, 2014)) | ||
10.5 | Exchange Agreement among UCP, Inc., UCP, LLC and PICO Holdings, Inc. (incorporated by reference to Exhibit 10.8 to the Company’s Quarterly Report on Form 10-Q for the quarter ended March 31, 2014 (filed May 12, 2014)) | ||
10.6 | Second Amended and Restated Limited Liability Company Operating Agreement of UCP, LLC (incorporated by reference to Exhibit 10.9 to the Company’s Quarterly Report on Form 10-Q for the quarter ended March 31, 2014 (filed May 12, 2014)) | ||
10.7 | Purchase and Sale Agreement, dated as of March 25, 2014, between UCP, LLC and Citizens Homes, Inc. (incorporated by reference to Exhibit 10.10 to the Company’s Quarterly Report on Form 10-Q for the quarter ended March 31, 2014 (filed May 12, 2014)) | ||
10.8* | UCP, Inc. 2014 Short-Term Incentive Plan (incorporated by reference to Exhibit 10.1 to the Company’s Current Report on Form 8-K (filed May 16, 2014)) | ||
10.9* | Employment Agreement between UCP, Inc. and James M. Pirrello (incorporated by reference to Exhibit 10.1 to the Company’s Current Report on Form 8-K (filed January 20, 2016)) | ||
10.10* | Resignation Agreement between UCP, Inc. and William J. La Herran (incorporated by reference to Exhibit 10.2 to the Company’s Current Report on Form 8-K (filed January 20, 2016)) | ||
10.11* | Amendment One to Employment Agreement, dated as of April 1, 2016, between UCP, Inc. and Dustin L. Bogue (incorporated by reference to Exhibit 10.1 to the Company’s Current Report on Form 8-K (filed April 6, 2016)) | ||
10.12 | Form of Conditional Resignation Letter (incorporated by reference to Exhibit 99.1 to the Company’s Current Report on Form 8-K (filed December 2, 2016)) | ||
10.13 | Amended and Restated Employment Agreement, dated as of February 1, 2017, between UCP, Inc. and Dustin L. Bogue (incorporated by reference to Exhibit 99.1 to the Company’s Current Report on Form 8-K (filed February 3, 2017)) | ||
114
10.14 | Amended and Restated Employment Agreement, dated as of February 1, 2017, between UCP, Inc. and James M. Pirrello (incorporated by reference to Exhibit 99.1 to the Company’s Current Report on Form 8-K (filed February 3, 2017)) | ||
21.1 | List of subsidiaries of UCP, Inc. | ||
23.1 | Consent of Deloitte & Touche LLP on UCP, Inc. | ||
31.1 | Certification of Dustin L. Bogue, Chief Executive Officer, pursuant to Rule 13a-14(a)/15d-14(a) of the Securities Exchange Act of 1934, as amended, as adopted pursuant to Section 302 of the Sarbanes-Oxley Act of 2002 | ||
31.2 | Certification of James M. Pirrello, Chief Financial Officer, pursuant to Rule 13a-14(a)/15d-14(a) of the Securities Exchange Act of 1934, as amended, as adopted pursuant to Section 302 of the Sarbanes-Oxley Act of 2002 | ||
32.1 | Certification of Dustin L. Bogue, Chief Executive Officer, pursuant to 18 U.S.C. Section 1350, as adopted pursuant to Section 906 of the Sarbanes-Oxley Act of 2002 | ||
32.2 | Certification of James M. Pirrello, Chief Financial Officer, pursuant to 18 U.S.C. Section 1350 as adopted pursuant to Section 906 of the Sarbanes-Oxley Act of 2002 | ||
101.INS | XBRL Instance Document | ||
101.SCH | XBRL Taxonomy Extension Schema Document | ||
101.CAL | XBRL Taxonomy Extension Calculation Linkbase Document | ||
101.DEF | XBRL Taxonomy Extension Definition Linkbase Document | ||
101.LAB | XBRL Taxonomy Extension Label Linkbase Document | ||
101.PRE | XBRL Taxonomy Extension Presentation Linkbase Document | ||
* | Management compensatory plan or arrangement | ||
115