Attached files
| file | filename |
|---|---|
| EX-32.1 - EXHIBIT 32.1 - Spark Energy, Inc. | a321certificationbytheceoa.htm |
| EX-31.2 - EXHIBIT 31.2 - Spark Energy, Inc. | a312certificationbycfo-q42.htm |
| EX-31.1 - EXHIBIT 31.1 - Spark Energy, Inc. | a311certificationbyceo-q42.htm |
| EX-23.1 - EXHIBIT 23.1 - Spark Energy, Inc. | a231consentofkpmg-q42016.htm |
| EX-21.1 - EXHIBIT 21.1 - Spark Energy, Inc. | a211listofsubsidiariesofsp.htm |
UNITED STATES SECURITIES AND EXCHANGE COMMISSION Washington, D.C. 20549 |
FORM 10-K | ||||
ý ANNUAL REPORT PURSUANT TO SECTION 13 OR 15(d) OF THE SECURITIES EXCHANGE ACT OF 1934
For the fiscal year ended December 31, 2016.
OR
o TRANSITION REPORT PURSUANT TO SECTION 13 OR 15(d) OF THE SECURITIES EXCHANGE ACT OF 1934
For the transition period from to
Commission File Number: 001-36559
Spark Energy, Inc.
(Exact name of registrant as specified in its charter)
Delaware | 46-5453215 | |||
(State or other jurisdiction of incorporation or organization) | (I.R.S. Employer Identification No.) | |||
12140 Wickchester Ln, Suite 100 | (713) 600-2600 | |||
Houston, Texas 77079 | ||||
(Address and zip code of principal executive offices) | (Registrant’s telephone number, including area code) | |||
Securities registered pursuant to Section 12(b) of the Act:
Title of each class | Name of exchange on which registered | |||
Class A common stock, par value $0.01 per share | The NASDAQ Global Select Market | |||
Securities registered pursuant to Section 12(g) of the Act: None
Indicate by check mark if the registrant is a well-known seasoned issuer, as defined in Rule 405 of the Securities Act
Yes o No x
Indicate by check mark if the registrant is not required to file reports pursuant to Section 13 or 15(d) of the Act.
Yes o No x
Indicate by check mark whether the registrant (1) has filed all reports required to be filed by Section 13 or 15(d) of the Securities Exchange Act of 1934 during the preceding 12 months (or for such shorter period that the registrant was required to file such reports), and (2) has been subject to such filing requirements for the past 90 days.
Yes x No o
Indicate by check mark whether the registrant has submitted electronically and posted on its corporate website, if any, every Interactive Data File required to be submitted and posted pursuant to Rule 405 of Regulation S-T (§232.405 of this chapter) during the preceding 12 months (or for such shorter period that the registrant was required to submit and post such files).
Yes x No o
Indicate by check mark if disclosure of delinquent filers pursuant to Item 405 of Regulation S-K (§ 229.405 of this chapter) is not contained herein, and will not be contained, to the best of the registrant’s knowledge, in definitive proxy or information statements incorporated by reference in Part III of this Form 10-K or any amendment to this Form 10-K. o
Indicate by check mark whether the registrant is a large accelerated filer, an accelerated filer, a non-accelerated filer or a smaller reporting company. See the definitions of “large accelerated filer,” “accelerated filer” and “smaller reporting company” in Rule 12b-2 of the Exchange Act.
Large accelerated filer o Accelerated filer x
Non-accelerated filer o (Do not check if a smaller reporting company) Smaller reporting company x
Indicate by check mark whether the registrant is a shell company (as defined in Rule 12b-2 of the Exchange Act).
Yes o No x
The aggregate market value of common stock held by non-affiliates of the registrant on June 30, 2016, the last business day of the registrant's most recently completed second fiscal quarter, based on the closing price on that date of $33.05, was $195.0 million. The registrant, solely for the purpose of this required presentation, had deemed its Board of Directors and Executive Officers to be affiliates, and deducted their stockholdings in determining the aggregate market value.
There were 6,496,559 shares of Class A common stock and 10,742,563 shares of Class B common stock outstanding as of February 28, 2017.
DOCUMENTS INCORPORATED BY REFERENCE
Portions of the Proxy Statement in connection with the 2017 Annual Meeting of Stockholders are incorporated by reference into Part III of this Form 10-K.
Table of Contents
Page | ||||
PART I | ||||
Items 1 & 2. | Business and Properties | |||
Item 1A. | Risk Factors | |||
Item 1B. | Unresolved Staff Comments | |||
Item 3. | Legal Proceedings | |||
Item 4. | Mine Safety Disclosures | |||
PART II | ||||
Item 5. | Market for Registrant’s Common Equity, Related Stockholder Matters and Issuer Purchases of Equity Securities | |||
Stock Performance Graph | ||||
Item 6. | Selected Financial Data | |||
Item 7. | Management’s Discussion and Analysis of Financial Condition and Results of Operations | |||
Overview | ||||
Drivers of Our Business | ||||
Factors Affecting Comparability of Historical Financial Results | ||||
How We Evaluate Our Operations | ||||
Combined and Consolidated Results of Operations | ||||
Operating Segment Results | ||||
Liquidity and Capital Resources | ||||
Cash Flows | ||||
Summary of Contractual Obligations | ||||
Off-Balance Sheet Arrangements | ||||
Related Party Transactions | ||||
Critical Accounting Policies and Estimates | ||||
Contingencies | ||||
Item 7A. | Quantitative and Qualitative Disclosures About Market Risk | |||
Item 8. | Financial Statements and Supplementary Data | |||
Index to Consolidated Financial Statements | ||||
Item 9. | Changes in and Disagreements with Accountants on Accounting and Financial Disclosure | |||
Item 9A. | Controls and Procedures | |||
Item 9B. | Other Information | |||
PART III | ||||
Item 10. | Directors, Executive Officers and Corporate Governance | |||
Item 11. | Executive Compensation | |||
Item 12. | Security Ownership of Certain Beneficial Owners and Management and Related Stockholder Matters | |||
Item 13. | Certain Relationships and Related Transactions, and Director Independence | |||
Item 14. | Principal Accounting Fees and Services | |||
PART IV | ||||
Item 15. | Exhibits, Financial Statement Schedules | |||
Item 16. | Form 10-K Summary | |||
SIGNATURES | ||||
EXHIBIT INDEX | ||||
Glossary
CFTC. The Commodity Futures Trading Commission.
CPUC. California Public Utility Commission.
ERCOT. The Electric Reliability Council of Texas, the independent system operator and the regional coordinator of various electricity systems within Texas.
ESCO. Energy service company.
FCC. Federal Communications Commission.
FERC. The Federal Energy Regulatory Commission, a regulatory body that regulates, among other things, the transmission and wholesale sale of electricity and the transportation of natural gas by interstate pipelines in the United States.
FTC. Federal Trade Commission.
ISO. An independent system operator. An ISO manages and controls transmission infrastructure in a particular region.
MMBtu. One million British Thermal Units, a standard unit of heating equivalent measure for natural gas. A unit of heat equal to 1,000,000 Btus, or 1 MMBtu, is the thermal equivalent of approximately 1,000 cubic feet of natural gas.
MWh. One megawatt hour, a unit of electricity equal to 1,000 kilowatt hours (kWh), or the amount of energy equal to one megawatt of constant power expended for one hour of time.
Non-POR Market. A non-purchase of accounts receivable market.
NYPSC. Public Service Commission of the State of New York.
POR Market. A purchase of accounts receivable market.
RCE. A residential customer equivalent, refers to a natural gas customer with a standard consumption of 100 MMBtus per year or an electricity customer with a standard consumption of 10 MWhs per year.
REP. A retail electricity provider.
RTO. A regional transmission organization. A RTO, similar to an ISO, is a third party entity that manages transmission infrastructure in a particular region.
TCPA. Telephone Consumer Protection Act of 1991.
Cautionary Note Regarding Forward Looking Statements
This report contains forward-looking statements that are subject to a number of risks and uncertainties, many of which are beyond our control. These statements within the meaning of Section 27A of the Securities Act of 1933, as amended (the “Securities Act”) and Section 21E of the Securities Exchange Act of 1934, as amended (the “Exchange Act”) can be identified by the use of forward-looking terminology including “may,” “should,” “likely,” “will,” “believe,” “expect,” “anticipate,” “estimate,” “continue,” “plan,” “intend,” “projects,” or other similar words. All statements, other than statements of historical fact included in this report, regarding strategy, future operations, financial position, estimated revenues and losses, projected costs, prospects, plans, objectives and beliefs of management are forward-looking statements. Forward-looking statements appear in a number of places in this report and may include statements about business strategy and prospects for growth, customer acquisition costs, ability to pay cash dividends, cash flow generation and liquidity, availability of terms of capital, competition and government regulation and general economic conditions. Although we believe that the expectations reflected in such forward-looking statements are reasonable, we cannot give any assurance that such expectations will prove correct.
The forward-looking statements in this report are subject to risks and uncertainties. Important factors that could cause actual results to materially differ from those projected in the forward-looking statements include, but are not limited to:
• | changes in commodity prices, |
• | extreme and unpredictable weather conditions, |
• | the sufficiency of risk management and hedging policies, |
• | customer concentration, |
• | federal, state and local regulation, including the industry's ability to prevail on its challenge to the New York Public Service Commission's order enacting new regulations that sought to impose significant new restrictions on retail energy providers operating in New York, |
• | key license retention, |
• | increased regulatory scrutiny and compliance costs, |
• | our ability to borrow funds and access credit markets, |
• | restrictions in our debt agreements and collateral requirements, |
• | credit risk with respect to suppliers and customers, |
• | level of indebtedness, |
• | changes in costs to acquire customers, |
• | actual customer attrition rates, |
• | actual bad debt expense in non-POR markets, |
• | accuracy of billing systems, |
• | ability to successfully navigate entry into new markets, |
• | whether our majority shareholder or its affiliates offers us acquisition opportunities on terms that are commercially acceptable to us, |
• | ability to successfully and efficiently integrate acquisitions into our operations, |
• | competition, and |
• | the “Risk Factors” in this report, and in our quarterly reports, other public filings and press releases. |
You should review the Risk Factors in Item 1A of Part I and other factors noted throughout this report that could cause our actual results to differ materially from those contained in any forward-looking statement. All forward-looking statements speak only as of the date of this report. Unless required by law, we disclaim any obligation to publicly update or revise these statements whether as a result of new information, future events or otherwise. It is not possible for us to predict all risks, nor can we assess the impact of all factors on the business or the extent to which any factor, or combination of factors, may cause actual results to differ materially from those contained in any forward-looking statements.
5
PART I.
Items 1 & 2. Business and Properties
General
We are a growing independent retail energy services company first founded in 1999 that provides residential and commercial customers in competitive markets across the United States with an alternative choice for their natural gas and electricity. We purchase our natural gas and electricity supply from a variety of wholesale providers and bill our customers monthly for the delivery of natural gas and electricity based on their consumption at either a fixed or variable price. Natural gas and electricity are then distributed to our customers by local regulated utility companies through their existing infrastructure.
We were formed as a Delaware corporation in April 2014 to act as a holding company for the retail natural gas business and asset optimization activities and the retail electricity business of our predecessor, Spark Energy Ventures, LLC. On August 1, 2014, we completed an initial public offering ("IPO") of 3,000,000 shares of our Class A common stock. References to us and our business prior to August 1, 2014 refer to the combined business of our operating subsidiaries before completion of our corporate reorganization in connection with our IPO. See Note 1 "Formation and Organization" to the audited combined and consolidated financial statements for a description of our corporate reorganization in connection with our IPO.
Our business consists of two operating segments:
• | Retail Natural Gas Segment. We purchase natural gas supply through physical and financial transactions with market counterparts and supply natural gas to residential and commercial consumers pursuant to fixed-price and variable-price contracts. For the years ended December 31, 2016, 2015 and 2014, approximately 24%, 36% and 45%, respectively, of our retail revenues were derived from the sale of natural gas. We also identify wholesale natural gas arbitrage opportunities in conjunction with our retail procurement and hedging activities, which we refer to as asset optimization. |
• | Retail Electricity Segment. We purchase electricity supply through physical and financial transactions with market counterparts and independent system operators ("ISOs") and supply electricity to residential and commercial consumers pursuant to fixed-price and variable-price contracts. For the years ended December 31, 2016, 2015 and 2014, approximately 76%, 64% and 55%, respectively, of our retail revenue were derived from the sale of electricity. |
See Note 14 "Segment Reporting" to the Company’s audited combined and consolidated financial statements in this report for financial information relating to our operating segments.
Recent Developments
See “Management's Discussion and Analysis of Financial Condition and Results of Operations—Recent Developments” for a discussion of recent developments affecting our business and operations.
Relationship with our Founder and Majority Shareholder
We leverage our relationship with affiliates of our founder, chairman and majority shareholder, W. Keith Maxwell III (our "Founder"), to execute on our growth strategy that includes sourcing of acquisitions, financing support, and operating cost efficiencies.
Our Founder formed National Gas & Electric, LLC (“NG&E”) in 2015 for the purpose of purchasing retail energy companies and retail customer books that could ultimately be resold to the Company. On August 23, 2016, we and Spark HoldCo completed the purchase of all of the outstanding membership interests in the Major Energy Companies from NG&E. Please see “Management’s Discussion and Analysis of Financial Condition and Results of
6
Operations—Drivers of Our Business—Acquisitions—Acquisition of the Major Energy Companies" for a more detailed discussion.
We may also engage in additional transactions with NG&E in the future. We currently expect that we would fund any future transactions with NG&E with some combination of cash, subordinated debt, or the issuance of Class A common stock or Class B common stock to NG&E. However, actual consideration paid for the assets will depend, among other things, on our capital structure and liquidity at the time of any transaction.
This relationship affords us access to opportunities that might not otherwise be available to us due to our size and availability of capital. Given our Founder's significant economic interest in us, we believe that he is incentivized to offer us opportunities to grow through this drop-down structure. However, our Founder and his affiliates are under no obligation to offer us acquisition opportunities, and we are under no obligation to buy assets from them. Additionally, as we grow and our access to capital and opportunities improves, we may rely less upon NG&E as a source of acquisitions and seek to enter into more transactions directly with third parties. Any acquisition activity involving NG&E or any other affiliate of our Founder will be subject to negotiation and approval by a special committee of the Board of Directors consisting solely of independent directors.
We entered into a Master Service Agreement (the “Master Service Agreement”) effective January 1, 2016 with Retailco Services, LLC ("Retailco Services"), which is a wholly owned subsidiary of W. Keith Maxwell III. The Master Service Agreement is for a one-year term and renews automatically for successive one-year terms unless the Master Service Agreement is terminated by either party. On January 1, 2017, the Master Service Agreement renewed automatically pursuant to its terms for a one year period ending on December 31, 2017.
Pursuant to the Master Service Agreement, Retailco Services provides us with operational support services such as: enrollment and renewal transaction services; customer billing and transaction services; electronic payment processing services; customer services and information technology infrastructure and application support services. As a result of this relationship, the Company realized per customer savings relative to its cost structure prior to the Master Services Agreement and a more stable operating cost model, and will position itself to effectively realize additional economies of scale over time. See “—Master Service Agreement with Retailco Services, LLC” for a more detailed summary of the terms and conditions of the Master Service Agreement.
On December 27, 2016, we entered into a $25.0 million subordinated debt facility (the "Subordinated Facility") with Retailco, LLC ("Retailco"), which is wholly owned by our Founder. Please see “Management's Discussion and Analysis of Financial Condition and Results of Operations—Liquidity and Capital Resources—Subordinated Debt Facility” for a description of the Subordinated Facility.
See “Risk Factors—Our future growth is dependent on successful execution of the growth strategy” and “—The provision of operational support services under the Master Service Agreement by our affiliate, Retailco Services, LLC, subjects us to a variety of risks” for a discussion of certain risks attributable to the drop down strategy and the related party transactions in which we are involved.
Our Operations
As of December 31, 2016, we operated in 90 utility service territories across 18 states and the District of Columbia and had approximately 774,000 RCEs. An RCE, or residential customer equivalent, is an industry standard measure of natural gas or electricity usage with each RCE representing annual consumption of 100 MMBtu of natural gas or 10 MWh of electricity. We serve natural gas customers in fifteen states (Arizona, California, Colorado, Connecticut, Florida, Illinois, Indiana, Maryland, Massachusetts, Michigan, Nevada, New Jersey, New York, Ohio and Pennsylvania) and electricity customers in eleven states (Connecticut, Illinois, Maine, Maryland, Massachusetts, New Hampshire, New Jersey, New York, Ohio, Pennsylvania and Texas) and the District of Columbia using eight brands (Spark Energy, CenStar Energy, Electricity Maine, ENH Power, Major Energy, Oasis Energy, Provider Power Mass, and Respond Power).
7
Customer Contracts and Product Offerings
Fixed and variable price contracts
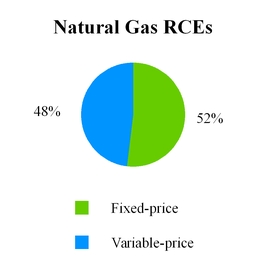
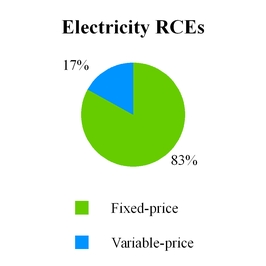
We offer a variety of fixed-price and variable-price service options to our natural gas and electricity customers. Under our fixed-price service options, our customers purchase natural gas and electricity at a fixed price over the life of the customer contract, which provides our customers with protection against increases in natural gas and electricity prices. Our fixed-price contracts typically have a term of one to two years for residential customers and up to three years for commercial customers and most provide for an early termination fee in the event that the customer terminates service prior to the expiration of the contract term. Our variable-price service options carry a month-to-month term and are priced based on our forecasts of underlying commodity prices and other market factors, including the competitive landscape in the market and the regulatory environment. In a typical market, we offer fixed-price electricity plans for 6, 12 and 24 months and fixed-price natural gas plans from 12 to 24 months, which may come with or without a monthly service fee and/or a termination fee. We also offer variable price natural gas and electricity plans that offer an introductory fixed price that is generally applied for a certain number of billing cycles, typically two billing cycles in our current markets, then switches to a variable price based on market conditions. Our variable plans may or may not provide for a termination fee, depending on the market and customer type.
As of December 31, 2016, approximately 52% of our natural gas RCEs were fixed-price, and the remaining 48% of our natural gas RCEs were variable-price. As of December 31, 2016, approximately 83% of our electricity RCEs were fixed-price, and the remaining 17% of our electricity RCEs were variable-price.
Green products and renewable energy credits
We offer renewable and carbon neutral (“green”) products in certain markets. Green energy products are a growing market opportunity and typically provide increased unit margins as a result of improved customer satisfaction and less competition. Renewable electricity products allow customers to choose electricity sourced from wind, solar, hydroelectric and biofuel sources, through the purchase of renewable energy credits (“RECs”). Carbon neutral gas products give customers the option to reduce or eliminate the carbon footprint associated with their energy usage through the purchase of carbon offset credits. These products typically provide for fixed or variable prices and generally follow the terms of our other products with the added benefit of carbon reduction and reduced environmental impact. We currently offer renewable electricity in all of our electricity markets and carbon neutral natural gas in several of our gas markets.
In addition to the RECs we purchase to satisfy our voluntary requirements under the terms of our green contracts with our customers, we must also purchase a specified amount of RECs based on the amount of electricity we sell
8
in a state in a year pursuant to individual state renewable portfolio standards. We forecast the price for the required RECs at the end of each month and incorporate this cost component into our customer pricing models.
Product Development Process
We identify market opportunities by developing price curves in each of the markets we serve and comparing the market prices and the price the local regulated utility is offering. We then determine if there is an opportunity in a particular market based on our ability to create an attractive customer value proposition that is also able to enhance our profitability. The attractiveness of a product from a consumer’s standpoint is based on a variety of factors, including overall pricing, price stability, contract term, sources of generation and environmental impact and whether or not the contract provides for termination and other fees. Product pricing is also based on a several other factors, including the cost to acquire customers in the market, the competitive landscape and supply issues that may affect pricing.
Customer Acquisition and Retention
Our customer acquisition strategy consists of significant customer growth obtained through opportunistic acquisitions complemented by traditional organic customer acquisition. We make decisions on how best to deploy capital on customer acquisition based on a variety of factors, including cost to acquire customers, availability of opportunities and our view of attractive commodity pricing in particular regions. For example, we may seek to make an acquisition of a large number of customers in a particular group of markets even though the initial acquisition cost may be higher because long-term margins are higher. Historically, a significant component of our customer acquisition strategy was the relationship and growth strategy structure with NG&E. See “—Relationship with our Founder and Majority Shareholder” for a discussion of this relationship. As we grow and our access to capital and opportunities improves, we may rely less upon NG&E as a source of acquisitions and seek to enter into more transactions directly with third parties. Since 2015, of our four largest acquisitions, two have been through NG&E and two have been directly from third parties.
Acquisition of new customers and sales channels
Our customer growth strategy includes acquiring customers through acquisitions as well as organically. We acquire both portfolios of customers as well as retail energy companies.
Once a product has been created for a particular market, we then develop a marketing campaign using a combination of sales channels, with an emphasis on door-to-door and web-based marketing. We identify and acquire customers through a variety of additional sales channels, including our inbound customer care call center, online marketing, email, direct mail, brokers and direct sales. We typically employ multiple vendors under short-term contracts and have not entered into any exclusive marketing arrangements with sales vendors. Our marketing team continuously evaluates the effectiveness of each customer acquisition channel and makes adjustments in order to achieve targeted growth and customer acquisition costs. We attempt to maintain a disciplined approach to recovery of our customer acquisition costs within defined periods.
During the year ended December 31, 2016, our RCE acquisitions were generated from the following sales channels:
Acquisitions | 61 | % |
Door to Door | 14 | % |
Indirect Sales Brokers | 12 | % |
Web Based | 5 | % |
Outbound | 5 | % |
Call Center | 2 | % |
Other | 1 | % |
9
Retaining customers and maximizing customer lifetime value
Our management and marketing teams devote significant attention to customer retention. We have developed a disciplined renewal communication process, which is designed to effectively reach our customers prior to the end of the contract term, and employ a team dedicated to managing this renewal communications process. Customers are contacted in each utility prior to the expiration of the customer's contract. Spark may elect to contact the customer through additional channels such as outbound telephone calls and electronic mail communication. We encourage retention and promote renewals by means of each of these contact methods.
We also apply a proprietary evaluation and segmentation process to optimize value both to us and the customer. We analyze historical usage, attrition rates and consumer behaviors to specifically tailor competitive products that aim to maximize the total expected return from energy sales to a specific customer, which we refer to as customer lifetime value.
Asset Optimization
Part of our business includes asset optimization activities in which we identify opportunities in the natural gas wholesale marketplace in conjunction with our retail procurement and hedging activities. Many of the competitive pipeline choice programs in which we participate require us and other retail energy suppliers to take assignment of and manage natural gas transportation and storage assets upstream of their respective city-gate delivery points. With respect to our allocated storage assets, we are also obligated to buy and inject gas in the summer season (April through October) and sell and withdraw gas during the winter season (November through March). These purchase and injection obligations in our allocated storage assets require us to take a seasonal long position in natural gas. Our asset optimization group determines whether market conditions justify hedging these long positions through additional derivative transactions.
Our asset optimization group utilizes these allocated transportation and storage assets for retail customer usage and to effect transactions in the wholesale market based on market conditions and opportunities. Our asset optimization group also contracts with third parties for transportation and storage capacity in the wholesale market. We are responsible for reservation and demand charges attributable to both our allocated and third-party contracted transportation and storage assets. Our asset optimization group utilizes these allocated and third-party transportation and storage assets in a variety of ways to either improve profitability or optimize supply-side counterparty credit lines.
We frequently enter into spot market transactions in which we purchase and sell natural gas at the same point or we purchase natural gas at one point or pool and ship it using our pipeline reservations for sale at another point or pool, in each case if we are able to capture a margin. We view these spot market transactions as low risk because we enter into the buy and sell transactions simultaneously on a back-to-back basis. We will also act as an intermediary for market participants who need assistance with short-term procurement requirements. Consumers and suppliers will contact us with a need for a certain quantity of natural gas to be bought or sold at a specific location. We are able to use our contacts in the wholesale market to source the requested supply, and we will capture a margin in these transactions.
The asset optimization group historically entered into long-term transportation and storage transactions. Our risk policies are now such that this business is limited to back-to-back purchase and sale transactions, or open positions subject to our aggregate net open position limits, which are not held for a period longer than two months. Furthermore, all additional capacity procured outside of a utility allocation of retail assets must be approved by our risk committee. Hedges on our firm transportation obligations are limited to two years or less and hedging of interruptible capacity is prohibited.
We also enter into back-to-back wholesale transactions to optimize our credit lines with third-party energy suppliers. With each of our third-party energy suppliers, we have certain contracted credit lines, within which we are able to purchase energy supply from these counterparties. If we desire to purchase supply beyond these credit
10
limits, we are required to post collateral, in the form of either cash or letters of credit. As we begin to approach the limits of our credit line with one supplier, we may purchase energy supply from another supplier and sell that supply to the original counterparty in order to reduce our net buy position with that counterparty and open up additional credit to procure supply in the future. Our sales of gas pursuant to these activities also enable us to optimize our credit lines with third-party energy suppliers by decreasing our net buy position with those suppliers.
Commodity Supply
We hedge and procure our energy requirements from various wholesale energy markets, including both physical and financial markets, through short and long term contracts. Our in-house energy supply team is responsible for managing our commodity positions (including energy procurement, capacity, transmission, renewable energy, and resource adequacy requirements) within risk tolerances defined by our risk management policies. We procure our natural gas and electricity requirements at various trading hubs, city gates and load zones. When we procure commodities at trading hubs, we are responsible for delivery to the applicable local regulated utility for distribution.
We periodically adjust our portfolio of purchase/sale contracts in the wholesale natural gas market based upon continual analysis of our forecasted load requirements. Natural gas is then delivered to the local regulated utility city-gate or other specified delivery points where the local regulated utility takes control of the natural gas and delivers it to individual customers’ locations. Additionally, we hedge our natural gas price exposure with financial products. During the year ended December 31, 2016, we transacted physical and financial settlement of natural gas with approximately 97 wholesale counterparties.
In most markets, we typically hedge our electricity exposure with financial products and then purchase the physical power directly from the ISO for delivery. From time to time, we use a combination of physical and financial products to hedge our electricity exposure before buying physical electricity in the day-ahead and real-time market from the ISO. During the year ended December 31, 2016, we transacted physical and financial settlement of electricity with approximately 15 suppliers.
We are assessed monthly for ancillary charges such as reserves and capacity in the electricity sector by the ISOs. For example, the ISOs will charge all retail electricity providers for monthly reserves that the ISO determines are necessary to protect the integrity of the grid. We attempt to estimate such amounts, but they are difficult to estimate because they are charged in arrears by the ISOs and are subject to fluctuations based on weather and other market conditions. Many of the utilities we serve also allocate natural gas transportation and storage assets to us as a part of their competitive choice program. We are required to fill our allocated storage capacity with natural gas, which creates commodity supply and price risk. Sometimes we cannot hedge the volumes associated with these assets because they are too small compared to the much larger bulk transaction volumes required for trades in the wholesale market or it is not economically feasible to do so.
Risk Management
Our management team operates under a set of corporate risk policies and procedures relating to the purchase and sale of electricity and natural gas, general risk management and credit and collections functions. Our in-house energy supply team is responsible for managing our commodity positions (including energy procurement, capacity, transmission, renewable energy, and resource adequacy requirements) within risk tolerances defined by our risk management policies. We attempt to increase the predictability of cash flows by following our various hedging strategies.
The risk committee has control and authority over all of our risk management activities. The risk committee establishes and oversees the execution of our credit risk management policy and our commodity risk policy. The risk management policies are reviewed at least annually and the risk committee typically meets quarterly to assure that we have followed its policies. The risk committee also seeks to ensure the application of our risk management policies to new products that we may offer. The risk committee is comprised of our Chief Executive Officer, our Chief Financial Officer and our Risk Manager who meet on a regular basis to review the status of the risk
11
management activities and positions. We employ a Risk Manager who reports directly to our Chief Financial Officer and whose compensation is unrelated to trading activity. Commodity positions are typically reviewed and updated daily based on information from our customer databases and pricing information sources. The risk policy sets volumetric limits on intra-day and end of day long and short positions in natural gas and electricity. With respect to specific hedges, we have established and approved a formal delegation of authority specifying each trader's authorized volumetric limits based on instrument type, lead time (time to trade flow), fixed price volume, index price volume and tenor (trade flow) for individual transactions. The Risk Manager reports to the risk committee any hedging transactions that exceed these delegated transaction limits.
Commodity Price and Volumetric Risk
Because our contracts require that we deliver full natural gas or electricity requirements to many of our customers and because our customers’ usage can be impacted by factors such as weather, we may periodically purchase more or less commodity than our aggregate customer volumetric needs. In buying or selling excess volumes, we may be exposed to commodity price volatility. In order to address the potential volumetric variability of our monthly deliveries for fixed-price customers, we implement various hedging strategies to attempt to mitigate our exposure.
Our commodity risk management strategy is designed to hedge substantially all of our forecasted volumes on our fixed-price customer contracts, as well as a portion of the near-term volumes on our variable-price customer contracts. We use both physical and financial products to hedge our fixed-price exposure. The efficacy of our risk management program may be adversely impacted by unanticipated events and costs that we are not able to effectively hedge, including abnormal customer attrition and consumption, certain variable costs associated with electricity grid reliability, pricing differences in the local markets for local delivery of commodities, unanticipated events that impact supply and demand, such as extreme weather, and abrupt changes in the markets for, or availability or cost of, financial instruments that help to hedge commodity price.
Customer demand is also impacted by weather. We use utility-provided historical and/or forward projected customer volumes as a basis for our forecasted volumes and mitigate the risk of seasonal volume fluctuation for some customers by purchasing excess fixed-price hedges within our volumetric tolerances. Should seasonal demand exceed our weather-normalized projections, we may experience a negative impact on financial results.
In addition to our forward price risk management approach described above, we may take further measures to reduce price risk and optimize our returns by: (i) maximizing the use of storage in our daily balancing market areas in order to give us the flexibility to offset volumetric variability arising from changes in winter demand; (ii) entering into daily swing contracts in our daily balancing markets over the winter months to enable us to increase or decrease daily volumes if demand increases or decreases; and (iii) purchasing out-of-the-money call options for contract periods with the highest seasonal volumetric risk to protect against steeply rising prices if our customer demands exceed our forecast. Being geographically diversified in our delivery areas also permits us, from time to time, to employ assets not being used in one area to other areas, thereby mitigating potential increased costs for natural gas that we otherwise may have had to acquire at higher prices to meet increased demand.
We utilize NYMEX-settled financial instruments to offset price risk associated with volume commitments under fixed-price contracts. The valuation for these financial instruments is calculated daily based on the NYMEX Exchange published Closing Price, and they are settled using the Exchange’s published Settlement Price at their Maturity.
Basis Risk
We are exposed to basis risk in our operations when the commodities we hedge are sold at different delivery points from the exposure we are seeking to hedge. For example, if we hedge our natural gas commodity price with Chicago basis but physical supply must be delivered to the individual delivery points of specific utility systems around the Chicago metropolitan area, we are exposed to basis risk between the Chicago basis and the individual utility system delivery points. These differences can be significant from time to time, particularly during extreme,
12
unforecasted cold weather conditions. Similarly, in certain of our electricity markets, customers pay the load zone price for electricity, so if we purchase supply to be delivered at a hub, we may have basis risk between the hub and the load zone electricity prices due to local congestion that is not reflected in the hub price. We attempt to hedge basis risk where possible, but hedging instruments are sometimes not economically feasible or available in the smaller quantities that we require.
Customer Credit Risk
Our credit risk management policies are designed to limit customer credit exposure. Credit risk is managed through participation in purchase of receivables ("POR") programs in utility service territories where such programs are available. In these markets, we monitor the credit ratings of the local regulated utilities and the parent companies of the utilities that purchase our customer accounts receivable. We also periodically review payment history and financial information for the local regulated utilities to ensure that we identify and respond to any deteriorating trends. In non-POR markets, we assess the creditworthiness of new applicants, monitor customer payment activities and administer an active collections program. Using risk models, past credit experience and different levels of exposure in each of the markets, we monitor our aging, bad debt forecasts and actual bad debt expenses and continually adjust as necessary.
In many of the utility services territories where we conduct business, POR programs have been established, whereby the local regulated utility purchases our receivables, and then becomes responsible for billing the customer and collecting payment from the customer. This service results in substantially all of our credit risk being linked to the applicable utility and not to our end-use customer in these territories. For the year ended December 31, 2016, approximately 67% of our retail revenues were derived from territories in which substantially all of our credit risk was directly linked to local regulated utility companies, all of which had investment grade ratings as of such date. During the same period, we paid these local regulated utilities a weighted average discount of approximately 1.3% of total revenues for customer credit risk. In certain of the POR markets in which we operate, the utilities limit their collections exposure by retaining the ability to transfer a delinquent account back to us for collection when collections are past due for a specified period. If our collection efforts are unsuccessful, we return the account to the local regulated utility for termination of service. Under these service programs, we are exposed to credit risk related to payment for services rendered during the time between when the customer is transferred to us by the local regulated utility and the time we return the customer to the utility for termination of service, which is generally one to two billing periods. We may also realize a loss on fixed-price customers in this scenario due to the fact that we will have already fully hedged the customer’s expected commodity usage for the life of the contract.
In non-POR markets (and in POR markets where we may choose to direct bill our customers), we manage commercial customer credit risk through a formal credit review and manage residential customer credit risk through a variety of procedures, which may include credit score screening, deposits and disconnection for non-payment. We also maintain an allowance for doubtful accounts, which represents our estimate of potential credit losses associated with accounts receivable from customers within non-POR markets.
We assess the adequacy of the allowance for doubtful accounts through review of the aging of customer accounts receivable and general economic conditions in the markets that we serve. Our bad debt expense for the year ended December 31, 2016 was $1.3 million, or 0.2% of retail revenues. See “Management’s Discussion and Analysis of Financial Condition and Results of Operations—Drivers of our Business—Customer Credit Risk” for a more detailed discussion of our bad debt expense during the year ended December 31, 2016.
We have limited exposure to high concentrations of sales volumes to individual customers. For the year ended December 31, 2016, our largest customer accounted for less than 1% of total retail energy sales volume.
Counterparty Credit Risk in Wholesale Market
We do not independently produce natural gas and electricity and depend upon third parties for our supply, which exposes us to wholesale counterparty credit risk in our retail and asset optimization activities. If the counterparties
13
to our supply contracts are unable to perform their obligations, we may suffer losses, including as a result of being unable to secure replacement supplies of natural gas or electricity on a timely and cost-effective basis or at all. At December 31, 2016, approximately 96% of our total exposure of $14.6 million was either with an investment grade customer or otherwise secured with collateral or a guarantee.
Operational Risk
As with all companies, the Company is at risk from cyber-attacks (breaches, unauthorized access, misuse, computer viruses, or other malicious code or other events) that could materially adversely affect our business, or otherwise cause interruptions or malfunctions in our operations.
We mitigate these risks through multiple layers of security controls including policy, hardware, and software security solutions. We also have engaged third parties to assist with both external and internal vulnerability scans and continue to enhance awareness with employee education and accountability. As of December 31, 2016, we have not experienced any material loss related to cyber-attacks or other information security breaches.
Master Service Agreement with Retailco Services, LLC for Operational Support Services
We entered into a Master Service Agreement effective January 1, 2016 with Retailco Services, a wholly owned subsidiary of W. Keith Maxwell III, and NuDevco Retail, LLC ("NuDevco Retail"), an affiliate of our Founder. The Master Service Agreement is for a one-year term and renews automatically for successive one-year terms unless the Master Service Agreement is terminated by either party. On January 1, 2017, the Master Service Agreement renewed automatically pursuant to its terms for a one year period ending on December 31, 2017.
Retailco Services provides operational support services to us such as: enrollment and renewal transaction services; customer billing and transaction services; electronic payment processing services; customer services and information technology infrastructure and application support services under the Master Service Agreement (collectively, the "Services").
Spark HoldCo pays Retailco Services a monthly fee consisting of a monthly fixed fee plus a variable fee per customer per month depending on market complexity. We meet with Retailco Services quarterly to discuss fees and Service Levels (as defined below) based on changes in assumptions; to date, we have not adjusted fees or the Service Levels. The Master Service Agreement provides that Retailco Services perform the Services in accordance with specified service levels (the “Service Levels”), and in the event Retailco Services fails to meet the Service Levels, Spark HoldCo receives a credit against invoices or a cash payment (the “Penalty Payment”). The amount of the Penalty Payment was initially limited to $0.1 million monthly, but adjusts annually based upon the amount of fees charged by Retailco Services for Services over the prior year. Furthermore, in the event that the Service Levels are not satisfied and Spark HoldCo suffers damages in excess of $0.5 million as a result of such failure, Retailco Services will make a payment (the “Damage Payment”) to Spark HoldCo for the amount of the damages (less the amount of any Penalty Payments also due). The Master Service Agreement provides that in no event may the Penalty Payments and Damage Payments exceed $2.5 million in any twelve-month period. For the year ended December 31, 2016, Penalty Payments and Damage Payments totaled $0.1 million and $1.4 million, respectively.
In connection with the Master Service Agreement, certain of Spark HoldCo’s employees who previously provided services similar to those to be provided under the Master Service Agreement have become employees of Retailco Services, and certain contracts, assets, and intellectual property have been assigned to Retailco Services. In addition, in order to facilitate the Services, Spark HoldCo has granted Retailco Services a non-transferable, non-exclusive, royalty-free, revocable and non-sub-licensable license to use certain of its intellectual property.
Either Spark HoldCo or Retailco Services is permitted to terminate the Master Service Agreement: (a) upon 30 days prior written notice for convenience and without cause; (b) upon a material breach and written notice to the breaching party when the breach has not been cured 30 days after such notice; (c) upon written notice if Retailco Services is unable for any reason to resume performance of the services within 60 days following the occurrence of
14
an event of force majeure; and (d) upon certain events of insolvency, assignment for the benefit of creditors, cessation of business, or filings of petitions for bankruptcy or insolvency proceedings by the other party. In the event the Master Service Agreement is terminated for any reason, Retailco Services will provide certain transition services to Spark HoldCo following the termination, not to exceed six months at the then-current fees.
Retailco Services and Spark HoldCo have agreed to indemnify each other from: (a) willful misconduct or negligence of the other; (b) bodily injury or death of any person or damage to real and/or tangible personal property caused by the acts or omission of the other; (c) any breach of any representation, warranty, covenant or other obligation of the other party under the Master Service Agreement, and (d) other standard matters. Subject to certain exceptions (including indemnification obligations, the obligations to pay fees and the Damage Payments and Penalty Payments), each parties’ liability is limited to $2.5 million of direct damages.
NuDevco Retail has entered into the Master Service Agreement for the limited purpose of guarantying payments that Retailco Services may be required to make under the Master Service Agreement up to a maximum of $2.0 million.
Competition
The markets in which we operate are highly competitive. In markets that are open to competitive choice of retail energy suppliers, our primary competition comes from the incumbent utility and other independent retail energy companies. In the electricity sector, these competitors include larger, well-capitalized energy retailers such as Direct Energy, Inc., FirstEnergy Solutions, Inc., Just Energy Group, Inc. and NRG Energy, Inc. We also compete with small local retail energy providers in the electricity sector that are focused exclusively on certain markets. Each market has a different group of local retail energy providers. With respect to natural gas, our national competitors are primarily Direct Energy and Constellation Energy. Our national competitors generally have diversified energy platforms with multiple marketing approaches and broad geographic coverage similar to us. Competition in each market is based primarily on product offering, price and customer service. The number of competitors in our markets varies. In well-established markets in the Northeast and Texas we have hundreds of competitors, while in others, the competition is limited to several participants.
The competitive landscape differs in each utility service area and within each targeted customer segment. Over the last several years, a number of utilities have spun off their retail marketing arms as part of the opening of retail competition in these markets. Markets that offer POR programs are generally more competitive than those markets in which retail energy providers bear customer credit risk. Market participants are significantly shielded from bad debt expense, thereby allowing easier entry into the POR markets. In these markets, we face additional competition as barriers to entry are less onerous.
Our ability to compete by increasing our market share depends on our ability to convince customers to switch to our products and services, and our ability to offer products at attractive prices. Many local regulated utilities and their affiliates may possess the advantages of name recognition, long operating histories, long-standing relationships with their customers and access to financial and other resources, which could pose a competitive challenge to us. As a result of these advantages, many customers of these local regulated utilities may decide to stay with their longtime energy provider if they have been satisfied with their service in the past. In addition, competitors may choose to offer more attractive short-term pricing to increase their market share.
Seasonality of our Business
Our overall operating results fluctuate substantially on a seasonal basis depending on: (i) the geographic mix of our customer base; (ii) the relative concentration of our commodity mix; (iii) weather conditions, which directly influence the demand for natural gas and electricity and affect the prices of energy commodities; and (iv) variability in market prices for natural gas and electricity. These factors can have material short-term impacts on monthly and quarterly operating results, which may be misleading when considered outside of the context of our annual operating cycle.
15
Our accounts payable and accounts receivable are impacted by seasonality due to the timing differences between when we pay our suppliers for accounts payable versus when we collect from our customers on accounts receivable. We typically pay our suppliers for purchases of natural gas on a monthly basis and electricity on a weekly basis. However, it takes approximately two months from the time we deliver the electricity or natural gas to our customers before we collect from our customers on accounts receivable attributable to those supplies. This timing difference could affect our cash flows, especially during peak cycles in the winter and summer months.
Natural gas accounted for approximately 24% of our retail revenues for the year ended December 31, 2016, which exposes us to a high degree of seasonality in our cash flows and income earned throughout the year as a result of the high concentration of heating load in the winter months. We utilize a considerable amount of cash from operations and borrowing capacity to fund working capital, which includes inventory purchases from April through October each year. We sell our natural gas inventory during the months of November through March of each year. We expect that the significant seasonality impacts to our cash flows and income will continue in future periods.
Regulatory Environment
We operate in the highly regulated natural gas and electricity retail sales industry in all of our respective jurisdictions. We must comply with the legislation and regulations in these jurisdictions in order to maintain our licensed status and to continue our operations, and to obtain the necessary licenses in jurisdictions in which we plan to compete. Licensing requirements vary by state, but generally involve regular, standardized reporting in order to maintain a license in good standing with the state commission responsible for regulating retail electricity and gas suppliers. There is potential for changes to state legislation and regulatory measures addressing licensing requirements that may impact our business model in the applicable jurisdiction. In addition, as further discussed below, our marketing activities and customer enrollment procedures are subject to rules and regulations at the state and federal level, and failure to comply with requirements imposed by federal and state regulatory authorities could impact our licensing in a particular market.
As of October 2015, the state of Connecticut no longer allows retail energy providers to offer variable rate plans even after the customer rolls off of a fixed rate plan. As a result of this change, we now offer customers who end their fixed terms with another fixed term of no less than four billing cycles. This regulatory change did not have a significant impact on our results of operations, and we expect that we can continue to manage the renewals in these markets to maintain profitability. Other states are currently examining the effectiveness of implementing such a restriction.
On February 23, 2016, the New York State Public Service Commission ("NYPSC") issued an order ("Resetting Order") resetting retail energy markets that, among other things, would have limited the types of competitive products that energy service companies ("ESCOs"), such as us, could offer in New York. The Resetting Order stated that all new customer enrollments or expiring agreements for mass market (residential and certain small commercial) customers must enroll or re-enroll in a contract that offers either: (i) a guarantee that the customer will pay no more than what the customer would pay as a full service utility customer, or (ii) an electricity product that is at least 30% derived from specific renewable sources either in the State of New York or in adjacent market areas. On July 22, 2016, most of the Resetting Order, including the provisions previously noted, was vacated by a New York state court. However, an appeal by certain ESCOs is ongoing as to whether the NYPSC has jurisdiction over ESCO pricing of products. The NYPSC cross appealed the decision as well. Currently, the NYPSC and ESCOs are engaged in certain evidentiary proceedings that are addressing, among other things, whether the NYPSC has sufficient cause to implement another similar Resetting Order. ESCOs are actively participating in these evidentiary proceedings and are vigorously contesting any efforts to restrict the industry given the anti-competitive effect of these efforts on the retail markets in New York.
We are evaluating the potential impact of the NYPSC's Resetting Order on our New York operations while preparing to operate in compliance with any new requirements that may come as a result of the evidentiary proceedings. Given the uncertainty of the outcome of these matters and the final requirements that may be
16
implemented, we are unable to predict at this time whether it will have a significant long-term impact on our operations in New York.
The NYPSC has also increased its scrutiny of individual ESCOs in 2016 and 2017. Many ESCOs, including one of the Company's subsidiaries, are the subject of a variety of investigative proceedings regarding their marketing efforts in New York. The Company's subsidiary is the subject of an investigative order by the NYPSC concerning a limited number of slamming allegations and late processing of customer refunds. The Company has responded to the order confirming that it has the requisite third party verifications in response to the allegations of slamming and that it has taken remediative measures to address the late refunds. While investigations of this nature have become common and are often resolved in a manner that allows the ESCO to continue operating in New York, there can be no assurance that the NYPSC will not take more severe action on individual ESCOs, including the Company's subsidiaries.
Our marketing efforts to consumers, including but not limited to telemarketing, door-to-door sales, direct mail and online marketing, are subject to consumer protection regulation including state deceptive trade practices acts, Federal Trade Commission ("FTC") marketing standards, and state utility commission rules governing customer solicitations and enrollments, among others. By way of example, telemarketing activity is subject to federal and state do-not-call regulation and certain enrollment standards promulgated by state regulators. Door-to-door sales are governed by the FTC’s “Cooling Off” Rule as well as state-specific regulation in many jurisdictions. In markets in which we conduct customer credit checks, these checks are subject to the requirements of the Fair Credit Reporting Act. Violations of the rules and regulations governing our marketing and sales activity could impact our license to operate in a particular market, result in suspension or otherwise limit our ability to conduct marketing activity in certain markets, and potentially lead to private actions against us. Moreover, there is potential for changes to legislation and regulatory measures applicable to our marketing measures that may impact our business models.
Recent interpretations of the Telephone Consumer Protection Act of 1991 (the "TCPA") by the Federal Communications Commission ("FCC") have introduced confusion regarding what constitutes an “autodialer” for purposes of determining compliance under the TCPA. Also, additional restrictions have been placed on wireless telephone numbers making compliance with the TCPA more costly. See “Risk Factors—Risks Associated with Violations of the Telephone Consumer Protection Act.”
As compliance with the TCPA gets more costly and as door-to-door marketing becomes increasingly risky both from a regulatory compliance perspective and from the risk of such activities drawing class action litigation claims, we and our peers who rely on these sales channels will find it more difficult than in the past to engage in direct marketing efforts. In response to these risks, the Company is experimenting with new technologies such as ringless messaging and door-to-door sales using tablets, both of which expand opportunities to market directly to customers.
Our participation in natural gas and electricity wholesale markets to procure supply for our retail customers and hedge pricing risk is subject to regulation by the Commodity Futures Trading Commission, including regulation pursuant to the Dodd-Frank Wall Street Reform and Consumer Protection Act. In order to sell electricity, capacity and ancillary services in the wholesale electricity markets, we are required to have market-based rate authorization, also known as “MBR Authorization”, from the Federal Energy Regulatory Commission ("FERC"). We are required to make status update filings to FERC to disclose any affiliate relationships and quarterly filings to FERC regarding volumes of wholesale electricity sales in order to maintain our MBR Authorization.
The transportation and sale for resale of natural gas in interstate commerce are regulated by agencies of the U.S. federal government, primarily FERC under the Natural Gas Act of 1938, the Natural Gas Policy Act of 1978 and regulations issued under those statutes. FERC regulates interstate natural gas transportation rates and service conditions, which affects our ability to procure natural gas supply for our retail customers and hedge pricing risk. Since 1985, FERC has endeavored to make natural gas transportation more accessible to natural gas buyers and sellers on an open and non-discriminatory basis. FERC’s orders do not attempt to directly regulate natural gas retail sales. As a shipper of natural gas on interstate pipelines, we are subject to those interstate pipelines tariff requirements and FERC regulations and policies applicable to shippers.
17
Changes in law and to FERC policies and regulations may adversely affect the availability and reliability of firm and/or interruptible transportation service on interstate pipelines, and we cannot predict what future action FERC will take. We do not believe, however, that any regulatory changes will affect us in a way that materially differs from the way they will affect other natural gas marketers and local regulated utilities with which we compete.
On December 26, 2007, FERC issued Order 704, a final rule on the annual natural gas transaction reporting requirements, as amended by subsequent orders on rehearing. Under Order 704, wholesale buyers and sellers of more than 2.2 million MMBtus of physical natural gas in the previous calendar year, including natural gas gatherers and marketers, are required to report, on May 1 of each year, aggregate volumes of natural gas purchased or sold at wholesale in the prior calendar year to the extent such transactions utilize, contribute to, or may contribute to the formation of price indices. It is the responsibility of the reporting entity to determine which individual transactions should be reported based on the guidance of Order 704. Order 704 also requires market participants to indicate whether they report prices to any index publishers, and if so, whether their reporting complies with FERC’s policy statement on price reporting. As a wholesale buyer and seller of natural gas, we are subject to the reporting requirements of Order 704.
Employees
We employed 143 people as of December 31, 2016. This number does not include employees of Retailco Services who provide services to us under the Master Service Agreement as described under “—Master Service Agreement with Retailco Services, LLC for Operational Support Services.”
We are not a party to any collective bargaining agreements and have not experienced any strikes or work stoppages. We consider our relations with our employees to be satisfactory. We also utilize the services of independent contractors and vendors to perform various services.
Facilities
Our corporate headquarters is located in Houston, Texas. We believe that our facilities are adequate for our current operations. We share our corporate headquarters with certain of our affiliates. NuDevco Midstream Development, LLC, an indirect subsidiary of TxEx Energy Investments, LLC, is the lessee under the lease agreement covering these facilities. NuDevco Midstream Development, LLC pays the entire lease payment on behalf of the affiliates of TxEx Energy Investments, LLC, and we reimburse NuDevco Midstream Development, LLC for our share of the leased space.
18
Available Information
Our principal executive offices are located at 12140 Wickchester Ln., Suite 100, Houston, Texas 77079, and our telephone number is (713) 600-2600. Our website is located at www.sparkenergy.com. We make available our periodic reports and other information filed with or furnished to the Securities and Exchange Commission (the “SEC”), free of charge through our website, as soon as reasonably practicable after those reports and other information are electronically filed with or furnished to the SEC. Any materials that we have filed with the SEC may be read and copied at the SEC’s Public Reference Room at 100 F Street, NE, Washington D.C. 20549, or accessed by calling the SEC at 1-800-SEC-0330 or visiting the SEC’s website at www.sec.gov.
19
Item 1A. Risk Factors
You should carefully consider the risks described below together with the other information contained in this report on Form 10-K. Our business, financial condition, cash flows, ability to pay dividends on our Class A common stock and results of operations could be adversely impacted due to any of these risks.
Risks Related to Our Business
We are subject to commodity price risk.
Our financial results are largely dependent on the prices at which we can acquire the commodities we resell. The prevailing market prices for natural gas and electricity have historically, and may continue to, fluctuate substantially over relatively short periods of time, potentially adversely impacting our results of operations, financial condition, cash flows and our ability to pay dividends to the holders of our Class A common stock. Changes in market prices for natural gas and electricity may result from many factors that are outside of our control, including the following:
— | weather conditions; |
— | seasonality; |
— | demand for energy commodities and general economic conditions; |
— | disruption of natural gas or electricity transmission or transportation infrastructure or other constraints or inefficiencies; |
— | reduction or unavailability of generating capacity, including temporary outages, mothballing, or retirements; |
— | the level of prices and availability of natural gas and competing energy sources, including the impact of changes in environmental regulations impacting suppliers; |
— | the creditworthiness or bankruptcy or other financial distress of market participants; |
— | changes in market liquidity; |
— | natural disasters, wars, embargoes, acts of terrorism and other catastrophic events; |
— | federal, state, foreign and other governmental regulation and legislation; and |
— | demand side management, conservation, alternative or renewable energy sources. |
Additionally, significant changes in the pricing methods in the wholesale markets in which we operate could affect our commodity prices. Regulatory policies concerning how markets are structured, how compensation is provided for service, and the kinds of different services that can or must be offered, may change and could have significant impacts on our costs of doing business. For example, the Electric Reliability Council of Texas ("ERCOT") has recently considered supplementing the existing energy and ancillary service markets with a mandate to purchase installed capacity, which could have the effect of increasing our supply costs. Similarly, ERCOT adopted a new reserve imbalance market that will increase prices in certain circumstances. Changes to the prices we pay to acquire commodities and that we are not able to pass along to our customers could materially adversely affect our operations, which could negatively impact our financial results and our ability to pay dividends to the holders of our Class A common stock.
Our financial results may be adversely impacted by weather conditions.
Weather conditions directly influence the demand for and availability of natural gas and electricity and affect the prices of energy commodities. Generally, on most utility systems, demand for natural gas peaks in the winter and demand for electricity peaks in the summer. Typically, when winters are warmer or summers are cooler, demand for energy is lower than expected, resulting in less natural gas and electricity consumption than forecasted. When demand is below anticipated levels due to weather patterns, we may be forced to sell excess supply at prices below our acquisition cost, which could result in reduced margins or even losses.
Conversely, when winters are colder or summers are warmer, consumption may outpace the volumes of natural gas and electricity against which we have hedged, and we may be unable to meet increased demand with storage or
20
swing supply. In these circumstances, we may experience reduced margins or even losses if we are required to purchase additional supply at higher prices. Our failure to accurately anticipate demand due to fluctuations in weather or to effectively manage our supply in response to a fluctuating commodity price environment could negatively impact our financial results and our ability to pay dividends to the holders of our Class A common stock.
Our risk management policies and hedging procedures may not mitigate risk as planned, and we may fail to fully or effectively hedge our commodity supply and price risk exposure against changes in consumption volumes or market rates.
To provide energy to our customers, we purchase the relevant commodity in the wholesale energy markets, which are often highly volatile. Our commodity risk management strategy is designed to hedge substantially all of our forecasted volumes on our fixed-price customer contracts, as well as a portion of the near-term volumes on our variable-price customer contracts. We use both physical and financial products to hedge our fixed-price exposure. The efficacy of our risk management program may be adversely impacted by unanticipated events and costs that we are not able to effectively hedge, including abnormal customer attrition and consumption, certain variable costs associated with electricity grid reliability, pricing differences in the local markets for local delivery of commodities, unanticipated events that impact supply and demand, such as extreme weather, and abrupt changes in the markets for, or availability or cost of, financial instruments that help to hedge commodity price.
We are exposed to basis risk in our operations when the commodities we hedge are sold at different delivery points from the exposure we are seeking to hedge. For example, if we hedge our natural gas commodity price with Chicago basis but physical supply must be delivered to the individual delivery points of specific utility systems around the Chicago metropolitan area, we are exposed to basis risk between the Chicago basis and the individual utility system delivery points. These differences can be significant from time to time, particularly during extreme, unforecasted cold weather conditions. Similarly, in certain of our electricity markets, customers pay the load zone price for electricity, so if we purchase supply to be delivered at a hub, we may have basis risk between the hub and the load zone electricity prices due to local congestion that is not reflected in the hub price. We attempt to hedge basis risk where possible, but hedging instruments are sometimes not economically feasible or available in the smaller quantities that we require.
In addition, we incur costs monthly for ancillary charges such as reserves and capacity in the electricity sector by ISOs. For example, the ISOs will charge all retail electricity providers for monthly reserves that the ISO determines are necessary to protect the integrity of the grid. We attempt to estimate such amounts but they are difficult to estimate because they are charged in arrears by the ISOs and are subject to fluctuations based on weather and other market conditions. We may be unable to fully pass the higher cost of ancillary reserves and reliability services through to our customers, and increases in the cost of these ancillary reserves and reliability services could negatively impact our results of operations.
Additionally, assumptions that we use in establishing our hedges may reduce the effectiveness of our hedging instruments. Considerations that may affect our hedging policies include, but are not limited to, human error, assumptions about customer attrition, the relationship of prices at different trading or delivery points, assumptions about future weather, and our load forecasting models.
Many of the natural gas utilities we serve allocate a share of transportation and storage capacity to us as a part of their competitive market operations. We are required to fill our allocated storage capacity with natural gas, which creates commodity supply and price risk. Sometimes we cannot hedge the volumes associated with these assets because they are too small compared to the much larger bulk transaction volumes required for trades in the wholesale market or it is not economically feasible to do so. In some regulatory programs or under some contracts, this capacity may be subject to recall by the utilities, which could have the effect of us being required to access the spot market to cover such recall.
In general, if we are unable to effectively manage our risk management policies and hedging procedures, our financial results and our ability to pay dividends to the holders of our Class A could be adversely affected.
21
We depend on consistent regulation within a particular utility territory (or state), as well as at the federal level, to permit us to operate in restructured, competitive segments of the natural gas and electricity industries. If competitive restructuring of the natural gas and electricity utility industries is altered, reversed, discontinued or delayed, our business prospects and financial results could be materially adversely affected.
We operate in the highly regulated natural gas and electricity retail sales industry. Regulations may be revised or reinterpreted or new laws and regulations may be adopted or become applicable to us or our operations. Such changes may have a detrimental impact on our business.
In certain restructured energy markets, state legislatures, governmental agencies and/or other interested parties have made proposals to fully or partially re-regulate these markets, which would interfere with our ability to do business. If competitive restructuring of natural gas or electricity markets is altered, reversed, discontinued or delayed, our financial results and our ability to pay dividends to the holders of our Class A common stock could be adversely affected.
The regulatory structure in California, where we have operations in three markets, is in the process of changing as the California Public Utility Commission (the "CPUC") is assuming greater regulatory responsibility over the core transportation aggregation market and marketers such as ourselves that operate in the natural gas markets in California. California Senate Bill 656, which became effective on January 1, 2014, established CPUC jurisdiction over core transportation aggregators and directed the CPUC to develop and publish consumer protection standards for core transportation aggregators. The new law requires, among other things, that the CPUC must set minimum standards of consumer protection and establish a mechanism to resolve customer complaints and award reparations. The CPUC is implementing rules on key issues that will affect retailers in these markets, such as complaint resolution processes; minimum standards for consumer protections; notice requirements detailing the terms and conditions of service and marketing practices. There can be no assurance that the CPUC will not enact new regulations that will make marketing and operating in California more difficult or that any such new regulations and requirements will not have an adverse impact on the Company’s operations in California.
We face risks due to increasing trends in regulation of the retail energy industry at the state level.
Some states are beginning to increase their regulation of their retail electricity and natural gas markets in an effort to eliminate deceptive marketing practices. For example, on June 23, 2015, the Connecticut Legislature passed Public Act 15-90 (“Act 15-90”), which was affirmed in an Interim Decision by the Public Utilities Regulatory Authority of Connecticut on September 30, 2015. Act 15-90 provides that effective October 1, 2015, licensed electric suppliers in Connecticut can no longer offer variable rate products. Upon expiration of current variable rate products, suppliers must either: (i) return the customer to the utility; (ii) keep the customer at the original fixed contract rate until a new contract is entered into or the supplier returns the customer to the utility; or (iii) renew the customer to a new fixed term of no less than four billing cycles. The Public Utilities Regulatory Authority of Connecticut has yet to rule on whether this ban on variable rates under Act 15-90 will become permanent. The inability to offer variable rate products in Connecticut could have the effect of reducing the profitability of operating in that state.
Additionally, on February 23, 2016, the NYPSC issued the Resetting Order, which, among other things, would have limited the types of competitive products that ESCOs, such as us, can offer in New York. The Resetting Order stated that all new customer enrollments or expiring agreements for mass market (residential and certain small commercial) customers must enroll or re-enroll in a contract that offers either: (i) a guarantee that the customer will pay no more than what the customer would pay as a full service utility customer, or (ii) an electricity product that is at least 30% derived from specific renewable sources either in the State of New York or in adjacent market areas. The types of renewable sources that might have been used to comply with the new standards might have been more expensive than sources historically used by ESCOs to fulfill these requirements.
In connection with their existing customers, under the Resetting Order, ESCOs would have been obligated to obtain “affirmative consent” from a customer prior to renewing that customer from a fixed rate or guaranteed savings contract into a contract that provides renewable energy but does not guarantee savings. ESCOs that served
22
customers through month-to-month variable rate agreements would have been required to enroll those customers in a compliant product at the end of the current billing cycle or return the customers to the utility supply service. ESCOs could have lost a significant portion of their customer base to the extent they had to seek affirmative consent upon renewal. Most of the original Resetting Order was vacated by a New York state court on July 22, 2016. However, an appeal by certain ESCOs is ongoing as to whether NYPSC has jurisdiction over ESCO pricing of products. The NYPSC cross appealed the decision as well. Currently, ESCOs and the NYPSC are involved in certain evidentiary proceedings that are addressing, among other things, whether the NYPSC has sufficient cause to implement another similar Resetting Order. ESCOs are actively participating in these evidentiary proceedings and are vigorously contesting any efforts to restrict the industry given the anti-competitive effect of these efforts on the retail markets in New York. In the event that all or significant components of the original Resetting Order are re-implemented, ESCOs, including us, could be obligated to, among other things, seek affirmative consent from their fixed and variable rate customers upon renewal, which may be very difficult to obtain. As of December 31, 2016, 20% of our customers on an RCE basis may be influenced by the original form of the Resetting Order issued by the NYPSC.
The NYPSC has also increased its scrutiny of individual ESCOs in 2016 and 2017. Many ESCOs, including one of the Company's subsidiaries, are the subject of a variety of investigative proceedings regarding their marketing efforts in New York. The Company's subsidiary is the subject of an investigative order by the NYPSC concerning a limited number of slamming allegations and late processing of customer refunds. The Company has responded to the order confirming that it has the requisite third party verifications in response to the allegations of slamming and that it has taken remediative measures to address the late refunds. While investigations of this nature have become common and are often resolved in a manner that allows the ESCO to continue operating in New York, there can be no assurance that the NYPSC will not take more severe action on individual ESCOs, including the Company's subsidiaries.
The retail energy business is subject to a high level of federal, state and local regulation.
State, federal and local rules and regulations affecting the retail energy business are subject to change, which may adversely impact our business model. Our costs of doing business may fluctuate based on these regulatory changes. For example, many electricity markets have rate caps, and changes to these rate caps by regulators can impact future price exposure. Similarly, regulatory changes can result in new fees or charges that may not have been anticipated when existing retail contracts were drafted, which can create financial exposure. For example, mandates to purchase a certain quantity or type of electricity capacity can create unanticipated costs. Our ability to manage cost increases that result from regulatory changes will depend, in part, on how the “change in law provisions” of our contracts are interpreted and enforced, among other factors.
Operators of systems providing for the delivery of natural gas and electricity maintain detailed tariffs that are kept on file with regulators. These tariffs and market rules applicable to operators are often very long and complex, and often are subject to service provider proposals to change them. We may not be able to prevent adoption of adverse tariff changes. Users of energy delivery systems also have rules and obligations applicable to them that are established by regulators. For example, transactions involving a shipper’s release of interstate pipeline capacity are subject to regulation at the federal level. Our failure to abide by tariffs, market rules or other delivery system rules may result in fines, penalties and damages.
We are also subject to regulatory scrutiny in all of our markets that can give rise to compliance fees, licensing fees, or enforcement penalties. Regulations vary widely in the markets in which we operate, and these regulations change from time to time. Failure to follow prescribed regulatory guidelines could result in customer complaints and regulatory sanctions.
In addition, door-to-door marketing and outbound telemarketing are a significant part of our marketing efforts. Each of these channels is continually under scrutiny by state and federal regulators and legislators. Additional regulation or restriction of these marketing practices could negatively impact our customer acquisition plan, and therefore our financial results and our ability to pay dividends to the holders of our Class A common stock.
23
Liability under the TCPA has increased significantly in recent years and we faces risks if we fail to comply with the TCPA.
Our outbound telemarketing efforts and use of mobile messaging to communicate with our customers subjects us to regulation under the TCPA. Over the last several years, companies have been subject to significant liabilities as a result of violations of the TCPA, including penalties, fines and damages under class action lawsuits. In addition, the increased use by us and other consumer retailers of mobile messaging to communicate with our customers has created new issues of application of the TCPA to these communications. In 2015, the Federal Communications Commission issued several rulings that made compliance with the TCPA more difficult and costly. Specifically, the definition of “autodialer” and the treatment of calls to reassigned mobile numbers have made compliance more difficult and costly. Our failure to effectively monitor and comply with our activities that are subject to the TCPA could result in significant penalties and the adverse effects of having to defend and ultimately suffer liability in a class action lawsuit related to such non-compliance.
We are also subject to liability under the TCPA for actions of our third party vendors who are engaging in outbound telemarketing efforts on our behalf. The issue of vicarious liability for the actions of third parties in violation of the TCPA remains unclear and has been the subject of conflicting precedent in the federal appellate courts. There can be no assurance that we may be subject to significant damages as a result of a class action lawsuit for actions of our vendors that we may not be able to control. If any violation of the TCPA were to occur, our financial results and our ability to pay dividends to the holders of our Class A common stock could be adversely affected.
We are subject to risks of significant liability resulting from class action law suits.
In recent years, retail energy providers have been named as defendants in class action lawsuits relating to pricing and sales practices, among other matters. A number of these lawsuits have resulted in substantial jury awards or settlements. We are currently a defendant in two class action lawsuits involving sales practices in Maine and New Jersey. A negative outcome could result in significant damages depending on whether a class is certified, and if so, the size of a such class.
Future litigation relating to our pricing and sales practices may negatively impact us by requiring us to pay substantial awards or settlements, increasing our legal costs, diverting management attention from other business issues or harming our reputation with customers, which may adversely affect our financial results and our ability to pay dividends to the holders of our Class A common stock.
Our business is dependent on retaining licenses in the markets in which we operate.
We generally must apply to the relevant state utility commission to become a retail marketer of natural gas and/or electricity in the markets that we serve. Approval by the state regulatory body is subject to our understanding of and compliance with various federal, state and local regulations that govern the activities of retail marketers. If we fail to comply with any of these regulations, we could suffer certain consequences, which may include:
— | higher customer complaints and increased unanticipated attrition; |
— | damage to our reputation with customers and regulators; and |
— | increased regulatory scrutiny and sanctions, including fines and termination of our license. |
Our business model is dependent on continuing to be licensed in existing markets. If we have a license revoked or are not granted renewal of a license, or if our license is adversely conditioned or modified (e.g., by increased bond posting obligations), our financial results could be materially negatively impacted, which could materially negatively impact our financial results and our ability to pay dividends to the holders of our Class A common stock.
In addition, FERC regulates the sale of wholesale electricity by requiring us and other companies who sell into the wholesale market to obtain market-based rate authority. If that authority were revoked, our financial results and our ability to pay dividends to the holders of our Class A common stock could be materially adversely affected.
24
We intend to grow our business in part through strategic acquisition opportunities from third parties and potentially from affiliates of our majority shareholder. If we are unable to make acquisitions on economically acceptable terms or we cannot consummate acquisitions due to capital constraints, our future growth may be limited.
Our ability to grow depends in part on our ability to make acquisitions that are accretive to our adjusted earnings before income taxes, depreciation and amortization ("Adjusted EBITDA"). We define “Adjusted EBITDA” as EBITDA less (i) customer acquisition costs incurred in the current period, (ii) net gain (loss) on derivative instruments, and (iii) net current period cash settlements on derivative instruments, plus (iv) non-cash compensation expense, and (v) other non-cash and non-recurring operating items.
If we are unable to make accretive acquisitions, whether because we are unable to identify attractive acquisition candidates or negotiate commercially acceptable terms for such acquisitions, unable to obtain financing for these acquisitions on economically feasible terms, or outbid by competitors, then our future growth may be limited to organic growth, which could adversely affect our financial results and our ability to pay dividends to the holders of our Class A common stock.
In connection with this acquisition strategy, we may need to issue equity or Retailco may periodically sell shares of our Class A common stock into the market for the purposes of financing the underlying transactions. Our prospects could be negatively impacted if Retailco was unable to make such sales to fund its acquisition of assets to ultimately sell to us, or we are unable to issue our equity into the market on commercially reasonable terms.
We may be subject to risks in connection with acquisitions, which could cause us to fail to realize many of the anticipated benefits of such acquisitions.
We believe that acquisitions that we complete, including our acquisitions of the Provider Companies and Major Energy Companies in 2016, will be beneficial to our company and our stockholders. Achieving the anticipated benefits of these and future transactions will depend in part upon our accuracy assessing the benefits of the acquisition prior to undertaking it, and our ability to integrate the acquired businesses in an efficient and effective manner.
The successful acquisition of a business requires assessing several factors, including anticipated cash flow and accretive value, regulatory challenges, our ability to retain customers and assumed liabilities. The accuracy of these assessments is inherently uncertain and our assessments may turn out incorrect.
Furthermore, even if we are accurate in our assessments, we may not be able to accomplish the integration process smoothly or successfully. The difficulties of integrating our acquisitions potentially will include, among other things:
• | coordinating geographically separate organizations and addressing possible differences in corporate cultures and management philosophies; |
• | dedicating significant management resources to the integration of acquisitions, which may temporarily distract management's attention from the day-to-day business of the combined company; |
• | operating in states and markets where we have not previously conducted business; |
• | managing different and competing brands and retail strategies in the same markets; |
• | coordinating customer information and billing systems and determining how to optimize those systems on a consolidated level; |
• | successfully transitioning acquired business operations to Retailco Services, LLC under the Master Service Agreement; and |
• | successfully recognizing expected cost savings and other synergies in overlapping functions. |
If any of the risks above were to occur, our financial results and our ability to pay dividends to the holders of our Class A common stock could be adversely affected.
Our future growth is dependent on the successful execution of our growth strategy.
25
Our growth strategy depends on our ability to make acquisitions that are accretive to our earnings. In addition to acquisitions from third parties, one of the sources of our anticipated growth is through the acquisition of businesses from NG&E, which is owned by our Founder. The success of this growth strategy is dependent on a variety of factors including:
• | successful identification of accretive acquisition targets by NG&E; |
• | material events or changes in the acquired companies that occur after NG&E acquires them, which may preclude us from completing any acquisitions; |
• | NG&E's ability to operate these acquired companies in a manner that causes them to retain their value prior to any acquisitions; |
• | NG&E’s willingness to offer the opportunities to us at prices that are commercially attractive and on terms that are acceptable to us; |
• | our ability to obtain financing for these acquisitions on economically feasible terms, which may depend on NG&E's willingness to accept shares of Class B common stock or other financing in consideration of these acquisitions; |
• | our ability to obtain approval by a special committee of independent directors of our Board of any such transaction; and |
• | Retailco's ability to sell shares of our Class A common stock for the purposes of financing the underlying transactions. |
If any of the risks above were to occur, it may impact our growth strategy, and our financial results and our ability to pay dividends to the holders of our Class A common stock could be adversely affected. We can provide no assurance that NG&E will offer us acquisition opportunities, or if it does offer us any acquisition opportunities, that it will do so on commercially reasonable terms. Neither NG&E nor any of its affiliates is obligated to offer us any acquisition opportunities. Further, we may not decide to accept any such opportunities presented by NG&E or its affiliates on the terms being offered. Any transaction between us and any of NG&E or its affiliates would be subject to review and approval of a special committee of independent directors. Investors should not place any reliance on any intention of NG&E and its affiliates to offer us acquisition opportunities.
We may not be able to manage our growth successfully, which could strain our liquidity and other resources and lead to poor customer satisfaction with our services.
The growth of our operations will depend upon our ability to expand our customer base in our existing markets and to enter new markets in a timely manner at reasonable costs. As we expand our operations, we may encounter difficulties implementing new product offerings or integrating new customers and employees as well as any legacy systems of acquired entities.
We may experience difficulty managing the growth of a portfolio of customers that is diverse with respect to the types of service offerings, applicable market rules and the infrastructure for product delivery. We also may experience difficulty integrating an acquired company’s personnel and operations, or key personnel of the acquired company may decide not to work for us. Furthermore, if we acquire the residential or commercial businesses of an incumbent local regulated utility or other energy provider in a particular market, the customers of that business may not be under any obligation to use our services. These difficulties could disrupt our ongoing business, distract our management and employees, increase our expenses and adversely affect our cash flows.
Expanding our operations could result in increased liquidity needs to support working capital for the purchase of natural gas and electricity supply to meet our customers’ needs, for the credit requirements of forward physical supply and for generally higher operating expenses. Expanding our operations also may require continued development of our operating and financial controls and may place additional stress on our management and operational resources. If we are unable to manage our growth and development successfully, this could affect our financial results and our ability to pay dividends to the holders of our Class A common stock.
The provision of operational support services under the Master Service Agreement by our affiliate Retailco Services, LLC subjects us to a variety of risks.
26
A significant portion of our operations, including enrollment and renewal transaction services, customer billing and transaction services, electronic payment processing services, customer services and information technology infrastructure and application support services is being provided to us by our affiliate, Retailco Services, LLC, under the Master Service Agreement. We are subject to a variety of risks under the Master Service Agreement, including:
• | conflicts of interest that may arise between our Founder, who owns Retailco Services, LLC, where he may favor the interests of Retailco Services, LLC over our interests; |
• | the charging of higher fees by Retailco Services, LLC than we originally anticipated, or the inability of Retailco Services, LLC to provide us with certain service levels, each of which may be renegotiated quarterly; |
• | failure of Retailco Services, LLC to perform or meet other obligations under the Master Service Agreement; |
• | counterparty credit risk for certain penalty payments that may be payable to us by Retailco Services, LLC; |
• | termination of the Master Service Agreement at a time earlier than we anticipate or at a time that is unfavorable to us, which could subject us to increased costs to transition those services elsewhere; |
• | a change of control in which Mr. Maxwell no longer controls or owns a significant interest in either of Retailco Services, LLC or us, which could impact Mr. Maxwell’s incentives to provide us services through Retailco Services, LLC; and |
• | a negative impact on our operations and financial reporting due to the outsourcing of certain of our internal controls and data accuracy processes. |
If any of the risks above were to occur, our financial results and our ability to pay dividends to the holders of our Class A common stock could be adversely affected.
Our financial results fluctuate on a seasonal and quarterly basis.
Our overall operating results fluctuate substantially on a seasonal basis depending on: (1) the geographic mix of our customer base; (2) the concentration of our product mix; (3) the impact of weather conditions on commodity pricing and demand, (4) variability in market prices for natural gas and electricity, and (5) changes in the cost of delivery of such commodities through energy delivery networks. These factors can have material short-term impacts on monthly and quarterly operating results, which may be misleading when considered outside of the context of our annual operating cycle. In addition, our accounts payable and accounts receivable are impacted by seasonality due to the timing differences between when we pay our suppliers for accounts payable versus when we collect from our customers on accounts receivable. We typically pay our suppliers for purchases of natural gas on a monthly basis and electricity on a weekly basis. However, it takes approximately two months from the time we deliver the electricity or natural gas to our customers before we collect from our customers on accounts receivable attributable to those supplies. This timing difference could affect our cash flows, especially during peak cycles in the winter and summer months. Furthermore, as a result of the seasonality of our business, we may reserve a portion of our excess cash available for distribution in the first and fourth quarters in order to fund our second and third quarter distributions. Because of the seasonal nature of our business and operating results, it may be difficult for investors to accurately and adequately value our business based on our interim result, which could materially negatively impact our financial results and our ability to pay dividends to the holders of our Class A common stock.
Pursuant to our cash dividend policy, we distribute a significant portion of our cash through regular quarterly dividends, and our ability to grow and make acquisitions with cash on hand could be limited.
Pursuant to our cash dividend policy, we have been distributing, and intend to distribute, a significant portion of our cash through regular quarterly dividends to holders of our Class A common stock. As such, our growth may not be as fast as that of businesses that reinvest their available cash to expand ongoing operations. To the extent we issue additional equity securities in connection with any acquisitions or growth capital expenditures, the payment of dividends on these additional equity securities may increase the risk that we will be unable to maintain our per share dividend rate. We may also rely upon external financing sources, including the issuance of debt, equity securities, convertible subordinated notes and borrowings under our Senior Credit Facility to fund our acquisitions and growth
27
capital expenditures. The incurrence of bank borrowings or other debt to finance our growth strategy will result in increased interest expense and the imposition of additional or more restrictive covenants, which, in turn, may impact our ability to pay dividends to holders of our Class A common stock. We may decide not to pursue otherwise attractive acquisitions if the projected short-term cash flow from the acquisition or investment is not adequate to service the capital raised to fund the acquisition or investment, after giving effect to our available cash reserves.
We may have difficulty retaining our existing customers or obtaining a sufficient number of new customers.
As of December 31, 2016, approximately 52% of our natural gas RCEs were fixed-price, and the remaining 48% of our natural gas RCEs were variable-price. As of December 31, 2016, approximately 83% of our electricity RCEs were fixed-price, and the remaining 17% of our electricity RCEs were variable-price. A significant decrease in the retail price of natural gas or electricity may cause our customers to switch retail energy service providers during their contract terms to obtain more favorable prices. Although we generally have a right to collect a termination fee from each customer on a fixed-price contract who terminates their contract following such an event, we may not be able to collect the termination fees in full or at all. Our variable-price contracts typically may be terminated by our customers at any time without penalty.
Furthermore, significant ongoing competition exists for customers in the markets where we operate, and we cannot guarantee that we will be able to retain our existing customers or obtain a sufficient number of new customers. We anticipate that we will incur significant costs as we enter new markets and pursue customers by utilizing a variety of marketing methods. In order for us to recover these expenses, we must attract and retain these customers on economic terms and for extended periods. We cannot be certain that our future efforts to retain our customers or secure additional customers will generate sufficient gross margins for us to expand into additional markets or that we will be able to prevent customer attrition and attract new customers in existing markets. If our marketing strategy is not successful, our financial results and our ability to pay dividends to the holders of our Class A common stock could be adversely affected.
We experience strong competition from local regulated utilities and other competitors.
The markets in which we compete are highly competitive, and we may not be able to compete effectively, especially against established industry competitors and new entrants with greater financial resources. We encounter significant competition from local regulated utilities or their retail affiliates and traditional and new retail energy providers with greater financial resources, well established brand names and/or large, existing installed customer bases. In most markets, our principal competitor may be the local regulated utility company or its affiliated retail arm. The local regulated utilities have the advantage of longstanding relationships with their customers, and they may have longer operating histories, better access to data, greater financial and other resources and greater name recognition in their markets than we do. Convincing customers to switch to a new company for the supply of a critical commodity such as natural gas or electricity is a challenge.
In certain markets, local regulated utilities may seek to decrease their tariffed retail rates to limit or to preclude opportunities for retail energy providers to acquire market share, and otherwise seek to establish rates, terms and conditions to the disadvantage of retail energy providers such that these retail energy providers cannot remain competitive in that market. Also, in states where the utility service rate is set through the procurement of energy over a period of months or years, the utility service rate will lag behind market conditions. If energy prices rise significantly above the utility service rate over a prolonged period of time, we may be forced to reduce our operating margins in order to price more competitively with the utility service rate and may experience increased customer attrition, as some customers may switch to the service offer from the utility.
In addition to competition from the local regulated utilities, we face competition from a number of other retail energy providers. We also may face competition from large corporations with similar billing and customer service capabilities, such as telecommunication service providers and nationally branded providers of consumer products and services that have a significant base of existing customers. Many of these competitors or potential competitors are larger than us and have access to more significant capital resources. For example, a larger competitor may be able to incur more costs to acquire customers if its cost of capital is lower than ours. Similarly, marketers with a
28
larger presence in the relevant market or that have interruptible load as part of their customer base may benefit from synergies or scale economies that smaller marketers, or marketers serving only firm customers, cannot obtain. In addition, product offerings that provide a consumer with an alternative source of energy, such as a solar panel, may become more common and indirectly compete with us. If our marketing strategy is not successful, it may affect our financial results and our ability to pay dividends to the holders of our Class A common stock.
Our affiliate, National Gas & Electric, LLC, competes with us in several markets.
Our Founder is also the sole owner and Chief Executive Officer of NG&E. NG&E was created to make acquisitions for the purpose of ultimately offering all or a portion of such acquisitions to us as a part of our growth strategy. NG&E may choose to retain all or a portion of these acquisitions for its own business, or it may operate the businesses it acquires for a lengthy period of time before offering them to us. In operating these businesses, NG&E will from time to time compete with us in various markets. We also may both be acquiring customers in the same markets and using the same pool of vendors. Such competition may adversely affect our ability to operate successfully in a given market, which could have a material adverse effect on our financial results and our ability to pay dividends to the holders of our Class A common stock.
The accounting method we use for our hedging activities results in volatility in our quarterly and annual financial results.
We enter into a variety of financial derivative and physical contracts to manage commodity price risk, and we use mark-to-market accounting to account for this hedging activity. Under the mark-to-market accounting method, changes in the fair value of our hedging instruments that are not qualifying or not designated as hedges under accounting rules are recognized immediately in earnings. As a result of this accounting treatment, changes in the forward prices of natural gas and electricity cause volatility in our quarterly and annual earnings, which we are unable to fully anticipate.
We could also incur volatility from quarter to quarter associated with gains and losses on settled hedges relating to natural gas held in inventory if we choose to hedge the summer-winter spread on our retail allocated storage capacity. We typically purchase natural gas inventory and store it from April to October for withdrawal from November through March. Since a portion of the inventory is used to satisfy delivery obligations to our fixed-price customers over the winter months, we hedge the associated price risk using derivative contracts. Any gains or losses associated with settled derivative contracts are reflected in the statement of operations as a component of retail cost of sales and net asset optimization.
Increased collateral requirements in connection with our supply activities may restrict our liquidity which could limit our ability to grow our business or pay dividends.
Our contractual agreements with certain local regulated utilities and our supplier counterparties require us to maintain restricted cash balances or letters of credit as collateral for credit risk or the performance risk associated with the future delivery of natural gas or electricity. These collateral requirements may increase as we grow our customer base. Collateral requirements will increase based on the volume or cost of the commodity we purchase in any given month and the amount of capacity or service contracted for with the local regulated utility. Significant changes in market prices also can result in fluctuations in the collateral that local regulated utilities or suppliers require.
The effectiveness of our operations and future growth, and our ability to pay dividends to the holders of our Class A common stock depend in part on the amount of cash and letters of credit available to enter into or maintain these contracts. The cost of these arrangements may be affected by changes in credit markets, such as interest rate spreads in the cost of financing between different levels of credit ratings. These liquidity requirements may be greater than we anticipate or are able to meet and therefore could limit our ability to grow our business or pay dividends to the holders of shares of our Class A common stock.
29
Our supply contracts expose us to counterparty credit risk.
We do not independently produce natural gas and electricity and depend upon third parties for our supply. If the counterparties to our supply contracts are unable to perform their obligations, we may suffer losses, including as a result of being unable to secure replacement supplies of natural gas or electricity on a timely and cost-effective basis or at all. If we cannot identify alternative supplies of natural gas or electricity, or secure natural gas or electricity in a timely fashion, our financial results and our ability to pay dividends to the holders of our Class A common stock could be adversely affected.
We are subject to direct credit risk for certain customers who may fail to pay their bills as they become due.
We bear direct credit risk related to our customers located in markets that have not implemented POR programs as well as indirect credit risk in those POR markets that pass collection efforts along to us after a specified non-payment period. For the year ended December 31, 2016, customers in non-POR markets represented approximately 33% of our retail revenues. We generally have the ability to terminate contracts with customers in the event of non-payment, but in most states in which we operate we cannot disconnect their natural gas or electricity service. In POR markets where the local regulated utility has the ability to return non-paying customers to us after specified periods, we may realize a loss for one to two billing periods until we can terminate these customers’ contracts. We may also realize a loss on fixed-price customers in this scenario due to the fact that we will have already fully hedged the customer’s expected commodity usage for the life of the contract. Even if we terminate service to customers who fail to pay their bill, we remain liable to our suppliers of natural gas and electricity for the cost of those commodities. Furthermore, in the Texas market, we are responsible for billing the distribution charges for the local regulated utility and are at risk for these charges, in addition to the cost of the commodity, in the event customers fail to pay their bills. Changing economic factors, such as rising unemployment rates and energy prices also result in a higher risk of customers being unable to pay their bills when due.
The failure of our customers to pay their bills or our failure to maintain adequate billing and collection procedures could adversely affect our financial results and our ability to pay dividends to the holders of our Class A common stock.
We are subject to credit, operational and financial risks related to certain local regulated utilities that provide billing services and guarantee the customer receivables for their markets.
In POR markets, we rely on the local regulated utility to purchase our customer accounts receivable and to perform timely and accurate billing. POR markets represented approximately 67% of our retail revenues for the year ended December 31, 2016. As our business grows, the portion of customers we serve in POR markets could increase. The bankruptcy of a local regulated utility could result in a default in such local regulated utility’s payment obligations to us, or efforts to reject contracts for service that they have with us if they believe there is a high value alternative opportunity.
In POR markets where local regulated utilities purchase our receivables and in certain other markets, local regulated utilities are responsible for billing services. Local regulated utilities that provide billing services rely on us for accurate and timely communication of contract rates and other information necessary for accurate billing to customers. The number of territories within which we provide natural gas and electricity supply poses a constant challenge that demands considerable management, personnel and information system resources. Each territory requires unique and often varied electronic data interface systems. Rules that govern the exchange of data may be changed by the local regulated utilities. In certain instances, we must rely on manual processes and procedures to communicate data to local regulated utilities for inclusion in customer bills. In addition, some utilities may experience difficulty in providing accurate, timely data when changing metering equipment (e.g., from manually-read to telemetry). Failure to provide accurate data to local regulated utilities on a timely basis could result in underpayment or nonpayment by our customers, and therefore adversely affect our financial results and our ability to pay dividends to the holders of our Class A common stock.
30
Our indebtedness could adversely affect our ability to raise additional capital to fund our operations or pay dividends. It could also expose us to the risk of increased interest rates and limit our ability to react to changes in the economy or our industry as well as impact our cash available for distribution.
We have $51.3 million of indebtedness outstanding and $29.6 million in issued letters of credit under our Senior Credit Facility, and $5.0 million in indebtedness outstanding under our Subordinated Facility as of December 31, 2016. Debt we incur under our Senior Credit Facility, Subordinated Facility or otherwise could have important negative consequences on our financial condition, including:
— | increasing our vulnerability to general economic and industry conditions; |
— | requiring cash flow from operations to be dedicated to the payment of principal and interest on our indebtedness, therefore reducing our ability to pay dividends to holders of our Class A common stock or to use our cash flow to fund our operations, capital expenditures and future business opportunities; |
— | limiting our ability to fund future acquisitions; |
— | restricting our ability to make certain distributions with respect to our capital stock and the ability of our subsidiaries to make certain distributions to us, in light of restricted payment and other financial covenants, including requirements to maintain certain financial ratios, in our credit facilities and other financing agreements; |
— | exposing us to the risk of increased interest rates because borrowings under our Senior Credit Facility will be at variable rates of interest; and |
— | limiting our ability to obtain additional financing for working capital including collateral postings, capital expenditures, debt service requirements, acquisitions and general corporate or other purposes. |
Our Senior Credit Facility contains financial and other restrictive covenants that may limit our ability to return capital to stockholders or otherwise engage in activities that may be in our long-term best interests. Our inability to satisfy certain financial covenants could prevent us from paying cash dividends, and our failure to comply with those and other covenants could result in an event of default that, if not cured or waived, may entitle the lenders to demand repayment or enforce their security interests, which could negatively impact our financial results and our ability to pay dividends to the holders of our Class A common stock.
Our Senior Credit Facility will mature on July 8, 2017. Our financial results could be negatively impacted to the extent we are unable to negotiate a new credit arrangement on commercially reasonable terms.
We depend on the accuracy of data in our billing systems. Inaccurate data could have a negative impact on our results of operations, financial condition, cash flows and reputation with customers and/or regulators.
We depend on the accuracy and timeliness of customer billing, collections and consumption information in our information systems. We rely on many internal and external sources for this information, including:
— | our marketing, pricing and customer operations functions; and |
— | various local regulated utilities and ISOs for volume or meter read information, certain billing rates and billing types (e.g., budget billing) and other fees and expenses. |
Inaccurate or untimely information, which may be outside of our direct control, could result in:
— | inaccurate and/or untimely bills sent to customers; |
— | inaccurate accounting and reporting of customer revenues, gross margin and accounts receivable activity; |
— | inaccurate measurement of usage rates, throughput and imbalances; |
— | customer complaints; and |
— | increased regulatory scrutiny. |
We may become liable for incorrectly calculating taxes, and certain of our charges may become uncollectable due to billing errors. Although customers are responsible for the payment of taxes related to the sales of natural gas and
31
electricity, we estimate the amount of taxes they owe and invoice our customers through our billing process. We subsequently remit those taxes to the relevant taxing authorities. If we were to later determine that the amount we billed them for taxes was insufficient, we would not be able to recover the difference from them and would ultimately be responsible for those costs. Additionally, some of the markets in which we operate require us to bill customers within a specific period of time. If we do not bill our customer within that period of time, the customer may not be obligated to pay us at all.
In connection with our obligations to remit sales taxes charged to our customers, the various states in which we operate undertake periodic audits of our remittance and collections of sales taxes. The Company is undergoing an audit in New York that spans several years for which the Company may have additional liabilities in connection with those years. States such as New York and Texas have particularly complex sales tax structures with varying rates depending on the city and county in which a taxpayer is located and the type of taxpayer. As a result of these complexities and due to errors on the part of the utilities in providing us with accurate information to properly assess these taxes, we are frequently assessed for additional sales taxes that we may have not remitted correctly. We cannot predict the impact of these sales tax audits on our financial results. The amounts we may be obligated to pay in connection with erroneous remittances of sales taxes could be material to our financial results and our ability to pay dividends to the holders of our Class A common stock.
Regulations in the restructured markets in which we operate require that meter reading be performed by the local regulated utility; and we are required to rely on the local regulated utility to provide us with our customers’ information regarding energy usage. Our inability to obtain this usage information or confirm information received from the utilities could negatively impact our billing systems and reputation with customers and, therefore, our financial results and our ability to pay dividends to the holders of our Class A common stock.
Information management systems could prove unreliable.
We operate in a high volume business with an extensive array of data interchanges and market requirements. We are highly dependent on our information management systems to track, monitor and correct or otherwise verify a high volume of data to ensure the reported financial results and our forecasting efforts are accurate. Our information management systems are designed to help us forecast new customer enrollments and their energy requirements, which helps ensure that we are able to supply new customers estimated average energy requirements without exposing us to excessive commodity price risk.
We may be subject to disruptions in our information flow arising out of events beyond our control, such as natural disasters, epidemics, failures in hardware or software, power fluctuations, telecommunications and other similar disruptions. In addition, our information management systems may be vulnerable to computer viruses, incursions by intruders or hackers and cyber terrorists and other similar disruptions. The failure of our information management systems to perform as anticipated for any reason or any significant breach of security could disrupt our business and result in numerous adverse consequences, including reduced effectiveness and efficiency of our operations, inappropriate disclosure of confidential information and increased overhead costs, all of which could impact our financial results and our ability to pay dividends to the holders of our Class A common stock.
The Company’s business is subject to cyber-attacks and data breaches, including the risk that sensitive customer data may be compromised, which could result in an adverse impact to its reputation and results of operations
The Company is dependent on information technology systems that we own and that are owned and managed by third parties. Parties that wish to disrupt the Company’s operations could view our computer systems or networks and those of our third party outsourced providers as attractive targets for cyber-attack. Our business requires access to sensitive customer data in the ordinary course of business. Examples of sensitive customer data are names, addresses, account information, historical electricity usage, expected patterns of use, payment history, credit bureau data, credit and debit card account numbers, drivers’ license numbers, social security numbers and bank account information. The Company provides sensitive customer data to vendors and service providers who require access to this information in order to provide billing and transaction services.
32
A successful cyber-attack on the systems that control the Company’s customer information systems could severely disrupt business operations, preventing the Company from billing and collecting revenues. A cyber-attack or security breach on us or our third party outsourced system providers could result in significant expenses to investigate and repair security breaches or system damage and could lead to litigation, fines, other remedial action, heightened regulatory scrutiny, diminished customer confidence and damage to the Company’s reputation. In addition, the misappropriation, corruption or loss of personally identifiable information and other confidential data could lead to significant breach notification expenses and mitigation expenses. The Company does not maintain cyber-liability insurance that covers certain damage caused by potential cyber incidents. A significant cyber incident could materially and adversely affect the Company’s business, financial condition and results of operations.
We depend on local transportation and transmission facilities of third parties to supply our customers. Our financial results may be adversely impacted if transportation and transmission availability is limited or unreliable.
We depend on transportation and transmission facilities owned and operated by local regulated utilities and other energy companies to deliver the natural gas and electricity we sell to customers. Under the regulatory structures adopted in most jurisdictions, we are required to enter into agreements with regulated local regulated utilities for use of the local distribution systems and to establish functional data interfaces necessary to serve our customers. Any delay in the negotiation of such agreements or inability to enter into reasonable agreements could delay or negatively impact our ability to serve customers in those jurisdictions. Additionally, failure to coordinate upstream and downstream receipts and deliveries on an energy transportation network can result in significant penalties. Any of these factors could have an adverse impact on our financial results and our ability to pay dividends to the holders of our Class A common stock.
We also depend on local regulated utilities for maintenance of the infrastructure through which we deliver natural gas and electricity to our customers. We are unable to control the level of service the utilities provide to our customers, including the timeliness and effectiveness of upkeep and repairs to infrastructure. Any infrastructure failure that interrupts or impairs delivery of electricity or natural gas to our customers could cause customer dissatisfaction, which could adversely affect our business. If transportation or transmission/distribution is disrupted, or if transportation or transmission/distribution capacity is inadequate, our ability to sell and deliver products may be hindered. Such disruptions could also hinder our providing electricity or natural gas to our customers and adversely impact our risk management policies, hedge contracts, our financial results and our ability to pay dividends to the holders of our Class A common stock.
In addition, the power generation and transmission/distribution infrastructure in the United States is very complex. Maintaining reliability of the infrastructure requires appropriate oversight by regulatory agencies, careful planning and design, trained and skilled operators, sophisticated information technology and communication systems, ongoing monitoring and, where necessary, improvements to various components of the infrastructure, including with regard to security. Major electric power blackouts are possible, which could disrupt electrical service for extended periods of time to large geographic regions of the United States. If such a major blackout were to occur, we may be unable to deliver electricity to our customers in the affected region, which would have an adverse impact our financial results and our ability to pay dividends to the holders of our Class A common stock.
The adoption of derivatives legislation by Congress will continue to have an adverse impact on our ability to hedge risks associated with our business.
The Dodd-Frank Wall Street Reform and Consumer Protection Act (the “Dodd-Frank Act”), enacted on July 21, 2010, established federal oversight and regulation of the over-the-counter derivatives market and entities, such as us, that participate in that market. Although we qualify for the end-user exception to the mandatory clearing and uncleared swap margin requirements for swaps to hedge our commercial risks, the application of such requirements to other market participants, such as swap dealers, has changed the cost and availability of the swaps that we use for hedging.
33
The Dodd-Frank Act and any new regulations promulgated under the Dodd-Frank Act could significantly increase the cost of derivative transactions, materially alter the terms of derivative contracts, reduce the availability of derivatives to protect against risks that we encounter, or reduce our ability to monetize or restructure our existing derivative contracts. If we reduce our use of derivatives as a result of the Dodd-Frank Act and related regulations, our results of operations may become more volatile and our cash flows may be less predictable, which could adversely affect our ability to plan for and fund capital expenditures. Any of these consequences could have a material adverse effect our financial results and our ability to pay dividends to the holders of our Class A common stock.
Our success depends on key members of our management, the loss of whom could disrupt our business operations.
We depend on the continued employment and performance of key management personnel. A number of our senior executives have substantial experience in consumer and energy markets that have undergone regulatory restructuring and have extensive risk management and hedging expertise. We believe their experience is important to our continued success. We do not maintain key life insurance policies for our executive officers. If our key executives do not continue in their present roles and are not adequately replaced, our financial results and our ability to pay dividends to the holders of our Class A common stock could be adversely affected.
We rely on a capable, well-trained workforce to operate effectively. Retention of employees with strong industry or operational knowledge is essential to our ongoing success.
Many of the employee positions within our customer operations, energy supply, information systems, pricing, marketing, risk management and finance functions require extensive industry, operational, regulatory or financial experience or skills that may not be easily replaced if an employee were to leave employment with us. While some normal employee turnover is expected, high turnover could strain our ability to manage our ongoing operations as well as inhibit organic and acquisition growth.
We rely on a third party vendor for our customer billing and transactions platform that exposes us to third party performance risk.
We have outsourced our back office customer billing and transactions functions to a third party, and we rely heavily on the continued performance of that vendor under the outsourcing agreement. Failure of our vendor to operate in accordance with the terms of the outsourcing agreement or the vendor’s bankruptcy or other event that prevents it from performing under our outsourcing agreement could have a material adverse effect on our financial results and our ability to pay dividends to the holders of our Class A common stock.
The failures or questionable activities of various local regulated utilities and other retail marketers within the markets that we serve adversely impact us.
A general positive perception on the part of customers and regulators of utilities and retail energy providers in general, and of us in particular, is essential for our continued growth and success. Questionable pricing, billing, collections, marketing or customer service practices on the part of any utility or retail marketer, or unsuccessful implementation of competitive energy programs can damage the reputation of all market participants, which could result in lower customer renewals and impact our ability to sign-on new customers. Any utility or retail marketer that defaults on its obligations to its customers, suppliers, lenders, hedge counterparties, or employees can have similar impacts on the retail energy industry as a whole and on our operations in particular. Any of these factors could affect our financial results and our ability to pay dividends to the holders of our Class A common stock.
A large portion of our current customers are concentrated in a limited number of states, making us vulnerable to customer concentration risks.
As of December 31, 2016, approximately 56% of our RCEs were located in five states. Specifically, 20%, 10%, 9%, 9% and 8% of our customers on an RCE basis were located in New York, Pennsylvania, Maine, Texas and New
34
Jersey, respectively. If we are unable to increase our market share across other competitive markets or enter into new competitive markets effectively, we may be subject to continued or greater customer concentration risk. In addition, if any of the states that contain a large percentage of our customers were to reverse regulatory restructuring or change the regulatory environment in a manner that causes us to be unable to economically operate in that state, our financial results and our ability to pay dividends to the holders of our Class A common stock could be adversely affected.
Increases in state renewable portfolio standards or an increase in the cost of renewable energy credit and carbon offsets may adversely impact the price, availability and marketability of our products.
Pursuant to state renewable portfolio standards, we must purchase a specified amount of renewable energy credits, or RECs, based on the amount of electricity we sell in a state in a year. In addition, we have contracts with certain customers that require us to purchase RECs or carbon offsets. If a state increases its renewable portfolio standards, the demand for RECs within that state will increase and therefore the market price for RECs could increase. We attempt to forecast the price for the required RECs and carbon offsets at the end of each month and incorporate this forecast into our customer pricing models, but the price paid for RECs and carbon offsets may be higher than forecasted. We may be unable to fully pass the higher cost of RECs through to our customers, and increases in the price of RECs may decrease our results of operations and affect our ability to compete with other energy retailers that have not contracted with customers to purchase RECs or carbon offsets. Further, a price increase for RECs or carbon offsets may require us to decrease the renewable portion of our energy products, which may result in a loss of customers. A further reduction in benefits received by local regulated utilities from production tax credits in respect of renewable energy may adversely impact the availability to us, and marketability by us, of renewable energy under our brands. Accordingly, such decrease may result in reduced revenue and may negatively impact our financial results and our ability to pay dividends to the holders of our Class A common stock.
The suppliers from which we purchase our natural gas and electricity are subject to environmental laws and regulations that impose extensive and increasingly stringent requirements on their operations.
The assets of the suppliers from which we purchase natural gas and electricity are subject to numerous and significant federal, state and local laws, including statutes, regulations, guidelines, policies, directives and other requirements governing or relating to, among other things: protection of wildlife, including threatened and endangered species; air emissions; discharges into water; water use; the storage, handling, use, transportation and distribution of dangerous goods and hazardous, residual and other regulated materials, such as chemicals; the prevention of releases of hazardous materials into the environment; the prevention, presence and remediation of hazardous materials in soil and groundwater, both on and offsite; land use and zoning matters; and workers’ health and safety matters. Environmental laws and regulations have generally become more stringent over time. Significant costs may be incurred for capital expenditures under environmental programs to keep the assets compliant with such environmental laws and regulations, which could have a material adverse impact on the businesses of our producers, which may increase the prices they charge us for natural gas and electricity and have a material adverse effect on our financial results and our ability to pay dividends to the holders of our Class A common stock.
Technological improvements and changing consumer preferences could reduce demand and alter consumption patterns.
Technological improvements in energy efficiency could potentially reduce the overall demand for natural gas and electricity. Additionally, increased competitiveness of alternative energy sources or consumer preferences that alter fuel choices could potentially reduce the demand for natural gas and electricity. A prolonged decrease in demand for natural gas and electricity in the retail energy markets would adversely affect our financial results and our ability to pay dividends to the holders of our Class A common stock.
Our access to marketing channels may be contingent upon the viability of our telemarketing and door-to-door agreements with our vendors.
35
Our vendors are essential to our telemarketing and door-to-door sales activities. Our ability to increase revenues in the future will depend significantly on our access to high quality vendors. If we are unable to attract new vendors and retain existing vendors to achieve our marketing targets, our growth may be materially reduced. There can be no assurance that competitive conditions will allow these vendors and their independent contractors to continue to successfully sign up new customers. Further, if our products are not attractive to, or do not generate sufficient revenue for our vendors, we may lose our existing relationships, which would have a material adverse effect on our business, revenues, results of operations and financial condition, as well as our ability to pay dividends to the holders of our Class A common stock. In addition, the decline in landlines reduces the number of potential customers that may be reached by our telemarketing efforts and as a result our telemarketing sales channel may become less viable, which may materially impact our financial results and our ability to pay dividends to the holders of our Class A common stock.
Our vendors may expose us to risks.
We are subject to reputational risks that may arise from the actions of our vendors and their independent contractors that are wholly or partially beyond our control, such as violations of our marketing policies and procedures as well as any failure to comply with applicable laws and regulations. If our vendors engage in marketing practices that are not in compliance with local laws and regulations, we may be in breach of applicable laws and regulations that may result in regulatory proceedings, disadvantageous conditioning of our energy retailer license, or the revocation of our energy retailer license, which could materially impact our financial results and our ability to pay dividends to the holders of our Class A common stock.
Unauthorized activities in connection with sales efforts by agents of our vendors, including calling consumers in violation of the TCPA and predatory door-to-door sales tactics and fraudulent misrepresentation could subject the Company to class action lawsuits against which the Company will be required to defend. Such defense efforts will be costly and time consuming.
In addition, the independent contractors of our vendors may consider us to be their employer and seek compensation.
Risks Related to our Class A Common Stock
We may have shortfalls of cash available for distribution from operating cash flows in certain quarters, and we may not be able to continue paying our targeted quarterly dividend to the holders of our Class A common stock in the future.
The amount of our cash available for distribution principally depends upon the amount of cash we generate from our operations, which fluctuates from quarter to quarter based on, among other things:
— | changes in commodity prices, which may be driven by a variety of factors, including, but not limited to, weather conditions, seasonality and demand for energy commodities and general economic conditions; |
— | the level and timing of customer acquisition costs we incur; |
— | the level of our operating and general and administrative expenses; |
— | seasonal variations in revenues generated by our business; |
— | our debt service requirements and other liabilities; |
— | fluctuations in our working capital needs; |
— | our ability to borrow funds and access capital markets; |
— | restrictions contained in our debt agreements (including our Senior Credit Facility); |
— management of customer credit risk;
— | abrupt changes in regulatory policies; and, |
— | other business risks affecting our cash flows. |
36
As a result of these and other factors, we cannot guarantee that we will have sufficient cash generated from operations to pay a specific level of cash dividends to holders of our Class A common stock.
Due to the seasonality of our retail natural gas business, we generate the substantial majority of our cash available for distribution in the first and fourth quarters of each year. As a result of seasonality and our customer acquisition costs, we may not have sufficient cash available for distribution to cover quarterly dividends for certain quarters.
Furthermore, holders of our Class A common stock should be aware that the amount of cash available for distribution depends primarily on our cash flow, and is not solely a function of profitability, which is affected by non-cash items. We may incur other expenses or liabilities during a period that could significantly reduce or eliminate our cash available for distribution and, in turn, impair our ability to pay dividends to holders of our Class A common stock during the period. Because we are a holding company, our ability to pay dividends on our Class A common stock is limited by restrictions on the ability of our subsidiaries to pay dividends or make other distributions to us. We are entitled to pay cash dividends to the holders of the Class A common stock and Spark HoldCo is entitled to make cash distributions to Retailco, LLC and NuDevco Retail, LLC ("NuDevco Retail") and us under our Senior Credit Facility so long as: (a) no default exists or would result from such a payment; (b) Spark HoldCo, SE, SEG, CenStar, Oasis and the Provider Companies are in pro forma compliance with all financial covenants before and after giving effect to such payment and (c) the outstanding amount of all loans and letters of credit does not exceed borrowing base limits. Finally, dividends to holders of our Class A common stock are paid at the discretion of our board of directors. Our board of directors may decrease the level of or entirely discontinue payment of dividends.
We are a holding company. Our sole material asset is our equity interest in Spark HoldCo and we are accordingly dependent upon distributions from Spark HoldCo to pay dividends, pay taxes, make payments under the Tax Receivable Agreement and cover our corporate and other overhead expenses under the Spark HoldCo LLC Agreement.
We are a holding company and have no material assets other than our equity interest in Spark HoldCo. We have no independent means of generating revenue. The Spark HoldCo LLC Agreement provides, to the extent Spark HoldCo has available cash and is not prevented by restrictions in any of its credit agreements, for distributions pro rata to its unitholders, including us, such that we receive an amount of cash sufficient to pay the estimated taxes payable by us, the targeted quarterly dividend we intend to pay holders of our Class A common stock, and payments under the Tax Receivable Agreement we entered into with Spark HoldCo, NuDevco Retail Holdings, LLC ("NuDevco Retail Holdings," predecessor-in-interest to Retailco, LLC) and NuDevco Retail. In addition, Spark HoldCo pays for our corporate and other overhead expenses pursuant to the Spark HoldCo LLC Agreement. To the extent that we need funds and Spark HoldCo or its subsidiaries are restricted from making such distributions under applicable law or regulation or under the terms of their financing arrangements, or are otherwise unable to provide such funds, it could materially adversely affect our financial results and our ability to pay dividends to the holders of our Class A common stock.
Market interest rates may have an effect on the value of our Class A common stock.
One of the factors that influences the price of shares of our Class A common stock is the effective dividend yield of such shares (i.e., the yield as a percentage of the then market price of our shares) relative to market interest rates. An increase in market interest rates, which are currently at low levels relative to historical rates, may lead prospective purchasers of shares of our Class A common stock to expect a higher dividend yield, and our inability to increase our dividend as a result of an increase in borrowing costs, insufficient cash available for distribution or otherwise, could result in selling pressure on, and a decrease in the market price of, our Class A common stock as investors seek alternative investments with higher yield.
An active, liquid and orderly trading market for our Class A common stock may not be maintained, and our stock price may be volatile.
37
An active, liquid and orderly trading market for our Class A common stock may not be maintained. Active, liquid and orderly trading markets usually result in less price volatility and more efficiency in carrying out investors’ purchase and sale orders. The market price of our Class A common stock could vary significantly as a result of a number of factors, some of which are beyond our control. In the event of a drop in the market price of our Class A common stock, you could lose a substantial part or all of your investment in our Class A common stock.
The stock markets in general have experienced extreme volatility that has often been unrelated to the operating performance of particular companies. These broad market fluctuations may adversely affect the trading price of our Class A common stock. Securities class action litigation has often been instituted against companies following periods of volatility in the overall market and in the market price of a company’s securities. Such litigation, if instituted against us, could result in very substantial costs, divert our management’s attention and resources and negatively impact our financial results and our ability to pay dividends to the holders of our Class A common stock.
Our Founder holds a substantial majority of the voting power of our common stock.
Holders of Class A common stock and Class B common stock vote together as a single class on all matters presented to our stockholders for their vote or approval, except as otherwise required by applicable law or our certificate of incorporation and bylaws. Our Founder controls 62.7% of the combined voting power of the Class A common stock and Class B common stock as of December 31, 2016 through his ownership of Retailco, LLC.
Retailco, LLC is entitled to act separately in its own interest with respect to its investment in us. Retailco, LLC has the ability to elect all of the members of our board of directors, and thereby to control our management and affairs. In addition, Retailco, LLC is able to determine the outcome of all matters requiring shareholder approval, including mergers and other material transactions, and is able to cause or prevent a change in the composition of our board of directors or a change in control of our company that could deprive our stockholders of an opportunity to receive a premium for their Class A common stock as part of a sale of our company. The existence of a significant shareholder, such as our Founder, may also have the effect of deterring hostile takeovers, delaying or preventing changes in control or changes in management, or limiting the ability of our other stockholders to approve transactions that they may deem to be in the best interests of our company.
So long as Retailco, LLC continues to control a significant amount of our common stock, it will continue to be able to strongly influence all matters requiring shareholder approval, regardless of whether other stockholders believe that a potential transaction is in their own best interests. In any of these matters, the interests of Retailco, LLC may differ or conflict with the interests of our other stockholders. Moreover, this concentration of stock ownership may also adversely affect the trading price of our Class A common stock to the extent investors perceive a disadvantage in owning stock of a company with a controlling shareholder.
We are a “controlled company” under NASDAQ Global Select Market rules, and as such we are entitled to an exemption from certain corporate governance standards of the NASDAQ Global Select Market, and you may not have the same protections afforded to shareholders of companies that are subject to all of the NASDAQ Global Market corporate governance requirements.
We qualify as a “controlled company” within the meaning of NASDAQ Global Market corporate governance standards because Retailco, LLC controls more than 50% of our voting power. Under NASDAQ Global Market rules, a company of which more than 50% of the voting power is held by an individual, a group or another company is a “controlled company” and may elect not to comply with certain corporate governance requirements, including (i) the requirement that a majority of the board of directors consist of independent directors, (ii) the requirement to have a nominating/corporate governance committee composed entirely of independent directors and a written charter addressing the committee’s purpose and responsibilities, (iii) the requirement to have a compensation committee composed entirely of independent directors and a written charter addressing the committee’s purpose and responsibilities and (iv) the requirement of an annual performance evaluation of the nominating/corporate governance and compensation committees.
38
In light of our status as a controlled company, our board of directors has determined to take partial advantage of the controlled company exemption. Our board of directors has determined not to have a nominating and corporate governance committee and that our compensation committee will not consist entirely of independent directors. As a result, non-independent directors may among other things, appoint future members of our board of directors, resolve corporate governance issues, establish salaries, incentives and other forms of compensation for officers and other employees and administer our incentive compensation and benefit plans.
Accordingly, you may not have the same protections afforded to shareholders of companies that are subject to all of NASDAQ Global Select Market corporate governance requirements.
We engage in transactions with our affiliates and expect to do so in the future. The terms of such transactions and the resolution of any conflicts that may arise may not always be in our or our stockholders’ best interests.
We have engaged in transactions and expect to continue to engage in transactions with affiliated companies. We will continue to enter into back-to-back transactions for purchases of commodities and derivatives on behalf of our affiliate. We will also continue to pay certain expenses on behalf of several of our affiliates for which we will seek reimbursement. We will also continue to share our corporate headquarters with certain affiliates. We cannot assure that our affiliates will reimburse us for the costs we have incurred on their behalf or perform their obligations under any of these contracts.
Our amended and restated certificate of incorporation and amended and restated bylaws, as well as Delaware law, contain provisions that could discourage acquisition bids or merger proposals, which may adversely affect the market price of our Class A common stock.
Our amended and restated certificate of incorporation authorizes our board of directors to issue preferred stock without shareholder approval. On October 7, 2016, we filed a registration statement under the Securities Act on Form S-3 allowing us to offer and sell, from time to time, shares of preferred stock. The registration statement was declared effective on October 20, 2016.
If our board of directors elects to issue preferred stock, it could be more difficult for a third party to acquire us.
In addition, some provisions of our amended and restated certificate of incorporation and amended and restated bylaws could make it more difficult for a third party to acquire control of us, even if the change of control would be beneficial to our stockholders. Among other things, our amended and restated certificate of incorporation and amended and restated bylaws:
— | provide for our board of directors to be divided into three classes of directors, with each class as nearly equal in number as possible, serving staggered three year terms. Our staggered board may tend to discourage a third party from making a tender offer or otherwise attempting to obtain control of us, because it generally makes it more difficult for shareholders to replace a majority of the directors; |
— | provide that the authorized number of directors may be changed only by resolution of the board of directors; |
— | provide that all vacancies in our board, including newly created directorships, may, except as otherwise required by law or, if applicable, the rights of holders of a series of preferred stock, be filled by the affirmative vote of a majority of directors then in office, even if less than a quorum; |
— | provide our board of directors the ability to authorize undesignated preferred stock. This ability makes it possible for our board of directors to issue, without shareholder approval, preferred stock with voting or other rights or preferences that could impede the success of any attempt to change control of us. These and other provisions may have the effect of deferring hostile takeovers or delaying changes in control or management of our company; |
— | provide that at any time after the first date upon which W. Keith Maxwell III no longer beneficially owns more than fifty percent of the outstanding Class A common stock and Class B common stock, any action required or permitted to be taken by the shareholders must be effected at a duly called annual or special meeting of shareholders and may not be effected by any consent in writing in lieu of a meeting of such |
39
shareholders, subject to the rights of the holders of any series of preferred stock with respect to such series (prior to such time, such actions may be taken without a meeting by written consent of holders of the outstanding stock having not less than the minimum number of votes that would be necessary to authorize or take such action at a meeting);
— | provide that at any time after the first date upon which W. Keith Maxwell III no longer beneficially owns more than fifty percent of the outstanding Class A common stock and Class B common stock, special meetings of our shareholders may only be called by the board of directors, the chief executive officer or the chairman of the board (prior to such time, special meetings may also be called by our Secretary at the request of holders of record of fifty percent of the outstanding Class A common stock and Class B common stock); |
— | provide that our amended and restated certificate of incorporation and amended and restated bylaws may be amended by the affirmative vote of the holders of at least two-thirds of our outstanding stock entitled to vote thereon; |
— | provide that our amended and restated bylaws can be amended by the board of directors; and |
— | establish advance notice procedures with regard to shareholder proposals relating to the nomination of candidates for election as directors or new business to be brought before meetings of our shareholders. These procedures provide that notice of shareholder proposals must be timely given in writing to our corporate secretary prior to the meeting at which the action is to be taken. These requirements may preclude shareholders from bringing matters before the shareholders at an annual or special meeting. |
In addition, in our amended and restated certificate of incorporation, we have elected not to be subject to the provisions of Section 203 of the Delaware General Corporation Law (the “DGCL”) regulating corporate takeovers until the date on which W. Keith Maxwell III no longer beneficially owns in the aggregate more than fifteen percent of the outstanding Class A common stock and Class B common stock. On and after such date, we will be subject to the provisions of Section 203 of the DGCL.
In addition, certain change of control events have the effect of accelerating the payment due under our Tax Receivable Agreement, which could be substantial and accordingly serve as a disincentive to a potential acquirer of our company.
Our amended and restated certificate of incorporation designates the Court of Chancery of the State of Delaware as the sole and exclusive forum for certain types of actions and proceedings that may be initiated by our stockholders, which could limit our stockholders’ ability to obtain a favorable judicial forum for disputes with us or our directors, officers, employees or agents.
Our amended and restated certificate of incorporation provides that, unless we consent in writing to the selection of an alternative forum, the Court of Chancery of the State of Delaware will, to the fullest extent permitted by applicable law, be the sole and exclusive forum for (i) any derivative action or proceeding brought on our behalf, (ii) any action asserting a claim of breach of a fiduciary duty owed by any of our directors, officers, employees or agents to us or our stockholders, (iii) any action asserting a claim against us or any director or officer or other employee of ours arising pursuant to any provision of the DGCL, our amended and restated certificate of incorporation or our bylaws, or (iv) any action asserting a claim against us or any director or officer or other employee of ours that is governed by the internal affairs doctrine, in each such case subject to such Court of Chancery having personal jurisdiction over the indispensable parties named as defendants therein. Any person or entity purchasing or otherwise acquiring any interest in shares of our capital stock will be deemed to have notice of, and consented to, the provisions of our amended and restated certificate of incorporation described in the preceding sentence. This choice of forum provision may limit a stockholder’s ability to bring a claim in a judicial forum that it finds favorable for disputes with us or our directors, officers, employees or agents, which may discourage such lawsuits against us and such persons. Alternatively, if a court were to find these provisions of our amended and restated certificate of incorporation inapplicable to, or unenforceable in respect of, one or more of the specified types of actions or proceedings, we may incur additional costs associated with resolving such matters in other jurisdictions, which could adversely affect our business, financial condition or results of operations.
40
Future sales of our Class A common stock in the public market could reduce our stock price, and any additional capital raised by us through the sale of equity or convertible securities may dilute your ownership in us.
Subject to certain limitations and exceptions, Retailco, LLC and its affiliate NuDevco Retail may exchange their Spark HoldCo units (together with a corresponding number of shares of Class B common stock) for shares of Class A common stock (on a one-for-one basis, subject to conversion rate adjustments for stock splits, stock dividends and reclassification and other similar transactions) and then sell those shares of Class A common stock. Additionally, we may issue additional shares of Class A common stock, preferred stock, depositary shares or warrants in subsequent public offerings.
On February 28, 2017, we had 6,496,559 outstanding shares of Class A common stock and 10,742,563 outstanding shares of Class B common stock.
On February 28, 2017, Retailco and NuDevco Retail owned 10,742,563 shares of Class B common stock and 397,000 shares of Class A common stock. Retailco, LLC and NuDevco Retail are each a party to a registration rights agreement with us that requires us to effect the registration of their shares in certain circumstances. On October 7, 2016, we filed a registration statement under the Securities Act on Form S-3 registering the offer and sale, from time to time, of the Class A common stock held by Retailco and NuDevco (including Class A common stock that may be obtained upon conversion of Class B common stock). The registration statement was declared effective on October 20, 2016. All of the shares held by Retailco and NuDevco and registered on the registration statement may be immediately resold. Subject to compliance with the Securities Act or exemptions therefrom, employees who have received Class A common stock as equity awards may also sell their shares into the public market.
We cannot predict the size of future issuances of our Class A common stock or securities convertible into Class A common stock or the effect, if any, that future issuances or sales of shares of our Class A common stock will have on the market price of our Class A common stock. Sales of substantial amounts of our Class A common stock (including shares issued in connection with an acquisition), or the perception that such sales could occur, may adversely affect prevailing market prices of our Class A common stock. Our amended and restated certificate of incorporation allows us to issue up to an additional 183,278,699 shares of equity securities, including securities ranking senior to our Class A common stock.
We will be required to make payments under the Tax Receivable Agreement for certain tax benefits we may claim, and the amounts of such payments could be significant.
We are party to a Tax Receivable Agreement with Spark HoldCo, NuDevco Retail Holdings and NuDevco Retail. This agreement generally provides for the payment by us to Retailco, LLC (as successor to NuDevco Retail Holdings) and NuDevco Retail of 85% of the net cash savings, if any, in U.S. federal, state and local income tax or franchise tax that we actually realize (or are deemed to realize in certain circumstances) in future periods as a result of (i) any tax basis increase resulting from the purchase by the Company of SparkHoldCo units from NuDevco Retail Holdings, (ii) any tax basis increases resulting from the exchange of Spark HoldCo units for shares of Class A common stock pursuant to the Exchange Right (or resulting from an exchange of Spark HoldCo units for cash pursuant to the Cash Option) and (iii) any imputed interest deemed to be paid by us as a result of, and additional tax basis arising from, any payments we make under the Tax Receivable Agreement. In addition, payments we make under the Tax Receivable Agreement will be increased by any interest accrued from the due date (without extensions) of the corresponding tax return. We retain the benefit of the remaining 15% of these tax savings. See Note 11 "Income Taxes" for further discussion.
Spark Energy, Inc. may be required to defer or partially defer any payment due to holders of rights under the Tax Receivable Agreement in certain circumstances during the five-year period commencing on October 1, 2014. Following the expiration of the five-year deferral period, Spark Energy, Inc. will be obligated to pay any outstanding deferred TRA Payments. While this payment obligation is subject to certain limitations, the obligation may nevertheless be significant and could adversely affect our liquidity and ability to pay dividends to the holders of our Class A common stock.
41
The payment obligations under the Tax Receivable Agreement are our obligations and not obligations of Spark HoldCo. For purposes of the Tax Receivable Agreement, cash savings in tax generally are calculated by comparing our actual tax liability to the amount we would have been required to pay had we not been able to utilize any of the tax benefits subject to the Tax Receivable Agreement. The term of the Tax Receivable Agreement continues until all such tax benefits have been utilized or expired, unless we exercise our right to terminate the Tax Receivable Agreement by making the termination payment specified in the agreement.
The actual increase in tax basis, as well as the amount and timing of any payments under the Tax Receivable Agreement, will vary depending upon a number of factors, including the timing of the exchanges of Spark HoldCo units, the price of Class A common stock at the time of each exchange, the extent to which such exchanges are taxable, the amount and timing of the taxable income we generate in the future and the tax rate then applicable, and the portion of our payments under the Tax Receivable Agreement constituting imputed interest or depletable, depreciable or amortizable basis. We expect that the payments that we will be required to make under the Tax Receivable Agreement could be substantial.
The payments under the Tax Receivable Agreement will not be conditioned upon a holder of rights under the Tax Receivable Agreement having a continued ownership interest in either Spark HoldCo or us.
We did not meet the threshold coverage ratio required to fund the first payment to NuDevco Retail Holdings under the Tax Receivable Agreement during the four-quarter period ending September 30, 2015. As such, the initial payment under the Tax Receivable Agreement due in late 2015 was deferred pursuant to the terms thereof.
We met the threshold coverage ratio required to fund the first TRA Payment to Retailco and NuDevco Retail under the Tax Receivable Agreement during the four-quarter period ending September 30, 2016, resulting in an initial TRA Payment of $1.4 million becoming due in December 2016. On November 6, 2016, Retailco and NuDevco Retail granted us the right to defer the TRA Payment until May 2018. During the period of time when we have elected to defer the TRA Payment, the outstanding payment amount will accrue interest at a rate calculated in the manner provided for under the Tax Receivable Agreement. The liability has been classified as non-current in our consolidated balance sheet at December 31, 2016. See also Note 13 "Transactions with Affiliates."
In certain cases, payments under the Tax Receivable Agreement may be accelerated and/or significantly exceed the actual benefits, if any, we realize in respect of the tax attributes subject to the Tax Receivable Agreement.
If we elect to terminate the Tax Receivable Agreement early or it is terminated early due to certain mergers or other changes of control, we would be required to make an immediate payment equal to the present value of the anticipated future tax benefits subject to the Tax Receivable Agreement, which calculation of anticipated future tax benefits will be based upon certain assumptions and deemed events set forth in the Tax Receivable Agreement, including the assumption that we have sufficient taxable income to fully utilize such benefits and that any Spark HoldCo units that Retailco, LLC, NuDevco Retail, or their permitted transferees own on the termination date are deemed to be exchanged on the termination date. Any early termination payment may be made significantly in advance of the actual realization, if any, of such future benefits.
In these situations, our obligations under the Tax Receivable Agreement could have a substantial negative impact on our liquidity and could have the effect of delaying, deferring or preventing certain mergers, asset sales, other forms of business combinations or other changes of control due to the additional transaction cost a potential acquirer may attribute to satisfying such obligations. For example, if the Tax Receivable Agreement had been terminated as of December 31, 2016, the estimated termination payment would be approximately $92.6 million (calculated using a discount rate equal to the one-year London Inter-Bank Offered Rate ("LIBOR"), plus 200 basis points). The foregoing number is merely an estimate and the actual payment could differ materially. There can be no assurance that we will be able to finance our obligations under the Tax Receivable Agreement.
Payments under the Tax Receivable Agreement will be based on the tax reporting positions that we will determine. The holders of rights under the Tax Receivable Agreement will not reimburse us for any payments previously made under the Tax Receivable Agreement if such basis increases or other benefits are subsequently disallowed, except
42
that excess payments made to any such holder will be netted against payments otherwise to be made, if any, to such holder after our determination of such excess. As a result, in such circumstances, we could make payments that are greater than our actual cash tax savings, if any, and may not be able to recoup those payments, which could adversely affect our liquidity.
We may issue preferred stock whose terms could adversely affect the voting power or value of our Class A common stock.
Our certificate of incorporation authorizes us to issue, without the approval of our stockholders, one or more classes or series of preferred stock having such designations, preferences, limitations and relative rights, including preferences over our Class A common stock respecting dividends and distributions, as our board of directors may determine. On October 7, 2016, we filed a registration statement under the Securities Act on Form S-3 allowing us to offer and sell, from time to time, shares of preferred stock. The registration statement was declared effective on October 20, 2016.
The terms of one or more classes or series of preferred stock we offer or sell could adversely impact the voting power or value of our Class A common stock. For example, we might grant holders of preferred stock the right to elect some number of our directors in all events or on the happening of specified events or the right to veto specified transactions. Similarly, the repurchase or redemption rights or liquidation preferences we might assign to holders of preferred stock could affect the residual value of the Class A common stock.
We incur increased costs as a result of being a public company.
As a publicly traded company with listed equity securities, we are required to comply with laws, regulations and requirements, including corporate governance provisions of the Sarbanes-Oxley Act of 2002, and rules and regulations of the SEC and the NASDAQ. Additional or new regulatory requirements may be adopted in the future. The requirements of existing and potential future rules and regulations increase our legal, accounting and financial compliance costs, make some activities more difficult, time-consuming or costly and may also place undue strain on our personnel, systems and resources, which could adversely affect our business, financial condition and ability to pay dividends to the holders of our Class A common stock.
For as long as we are an emerging growth company, we will not be required to comply with certain reporting requirements, including those relating to accounting standards and disclosure about our executive compensation, that apply to other public companies.
In April 2012, the Jumpstart Our Business Startups Act (the "JOBS Act") was signed into law. We are classified as an “emerging growth company” under the JOBS Act. For as long as we are an emerging growth company, which may be up to five full fiscal years, unlike other public companies, we will not be required to, among other things, (i) provide an auditor’s attestation report on management’s assessment of the effectiveness of our system of internal control over financial reporting pursuant to Section 404(b) of the Sarbanes-Oxley Act, (ii) comply with any new requirements adopted by the PCAOB requiring mandatory audit firm rotation or a supplement to the auditor’s report in which the auditor would be required to provide additional information about the audit and the financial statements of the issuer, (iii) provide certain disclosure regarding executive compensation required of larger public companies or (iv) hold nonbinding advisory votes on executive compensation. We will remain an emerging growth company until as late as December 31, 2019, although we will lose that status sooner if we have more than $1.0 billion of revenues in a fiscal year, have more than $700 million in market value of our Class A common stock held by non-affiliates, or issue more than $1.0 billion of non-convertible debt over a three-year period.
To the extent that we rely on any of the exemptions available to emerging growth companies, you will receive less information about our executive compensation and internal control over financial reporting than issuers that are not emerging growth companies. If some investors find our common stock to be less attractive as a result, there may be a less active trading market for our common stock and our stock price may be more volatile.
43
If our internal control over financial reporting is determined to be ineffective or we fail to meet financial reporting deadlines, investor confidence in our company, and our Class A common stock price, may be adversely affected.
We are required to comply with certain of the SEC’s rules that implement Section 404 of the Sarbanes-Oxley Act that require management to certify financial and other information in our quarterly and annual reports and provide an annual management report on the effectiveness of our internal control over financial reporting. This assessment also includes the disclosure of any material weakness in internal control over financial reporting identified by our management and our independent registered public accounting firm. A “material weakness” is a deficiency, or combination of deficiencies, in internal control over financial reporting such that there is a reasonable possibility that a material misstatement of our annual or interim financial statements will not be prevented or detected on a timely basis.
Our independent registered public accounting firm will not be required to formally attest to the effectiveness of our internal control over financial reporting until the end of the fiscal year after we are no longer an “emerging growth company” under the JOBS Act, which may be for up to five fiscal years after the completion of our IPO.
If we fail to comply with the requirements of Section 404 of the Sarbanes-Oxley Act, or if we or our auditor identify and report material weakness in our internal control over financial reporting, the accuracy or timeliness of the filing of our annual report and quarterly reports may be materially and adversely affected and could cause investors to lose confidence in our reported financial information, which could have a negative effect on the trading price of our Class A common stock.
Our amended and restated certificate of incorporation limits the fiduciary duties of one of our directors and certain of our affiliates and restricts the remedies available to our stockholders for actions taken by our Founder or certain of our affiliates that might otherwise constitute breaches of fiduciary duty.
Our amended and restated certificate of incorporation contains provisions that we renounce any interest in existing and future investments in other entities by, or the business opportunities of, NuDevco Partners, LLC, NuDevco Partners Holdings, LLC and W. Keith Maxwell III, or any of their officers, directors, agents, shareholders, members, affiliates and subsidiaries (other than a director or officer of the Company who is presented an opportunity solely in his capacity as a director or officer). Because of this provision, these persons and entities have no obligation to offer us those investments or opportunities that are offered to them in any capacity other than solely as an officer or director of the Company. If one of these persons or entities pursues a business opportunity instead of presenting the opportunity to the Company, we will not have any recourse against such person or entity for a breach of fiduciary duty.
Item 1B. Unresolved Staff Comments
None.
Item 3. Legal Proceedings
We are the subject of lawsuits and claims arising in the ordinary course of business from time to time. Management cannot predict the ultimate outcome of such lawsuits and claims. While the lawsuits and claims are asserted for amounts that may be material should an unfavorable outcome occur, management does not currently expect that any currently pending matters will have a material adverse effect on our financial position or results of operations except as described below. See Note 12 "Commitments and Contingencies" to the audited combined and consolidated financial statements, which are incorporated herein by reference to Part II, Item 8 “Financial Statements and Supplementary Data” of this Form 10-K.
The Company is the subject of the following lawsuits:
44
John Melville et al v. Spark Energy Inc. and Spark Energy Gas, LLC is a purported class action filed on December 17, 2015 in the United States District Court for the District of New Jersey alleging, among other things, that (i) sales representatives engaged as independent contractors for Spark Energy Gas, LLC engaged in deceptive acts in violation of the New Jersey Consumer Fraud Act, (ii) Spark Energy Gas, LLC breach its contract with plaintiff, including a breach of the covenant of good faith and fair dealing. Plaintiffs are seeking unspecified compensatory and punitive damages for the purported class, injunctive relief and/or declaratory relief, disgorgement of revenues and/or profits and attorneys’ fees. On March 14, 2016, Spark Energy Gas, LLC and Spark Energy, Inc. filed a Motion to Dismiss this case. On April 18, 2016, Plaintiff filed his Opposition to the Motion to Dismiss. On April 25, 2016, Spark Energy, Inc. and Spark Energy Gas, LLC filed a Reply in support of their Motion to Dismiss. On November 15, 2016, the Court entered an Order Granting Spark Energy, Inc. and Spark Energy Gas, LLC’s Motion to Dismiss in Part and dismissed Plaintiff’s breach of covenant of good faith and fair dealing claim as well as Plaintiff’s unjust enrichment claim. On February 15, 2017, Plaintiffs filed an Amended Complaint to try to expand the class to a nation-wide class. The response to this Amended Complaint for Spark Energy, Inc. and Spark Energy Gas, LLC is due on March 15, 2017. Initial discovery has begun. We cannot predict the outcome or consequences of this case.
Halifax-American Energy Company, LLC et al v. Provider Power, LLC, Electricity N.H., LLC, Electricity Maine, LLC, Emile Clavet and Kevin Dean is a lawsuit initially filed on June 12, 2014 in the Rockingham County Superior Court, State of New Hampshire, alleging various claims related to the Provider Companies’ employment of a sales contractor formerly employed with one or more of the plaintiffs, including misappropriation of trade secrets and tortious interference with a contractual relationship. The dispute occurred prior to the Company's acquisition of the Provider Companies. Portions of the original claim proceeded to trial and on January 19, 2016, a jury found in favor of the plaintiff. Damages totaling approximately $0.6 million and attorney’s fees totaling approximately $0.3 million were awarded to the plaintiff. On May 4, 2016, following post-verdict motions, the defendants filed an appeal in the State of New Hampshire Supreme Court, appealing, among other things the failure of the trial court to direct a verdict for the defendants, to set aside the verdict, or grant judgment for the defendants, and the trial court's award of certain attorneys' fees. On August 1, 2016, in connection with the Company’s closing of the acquisition of the Provider Companies, the Provider Companies entered into a joint defense agreement with the remaining defendants. The Provider Companies have posted an appeal bond of $1.0 million in connection with the appeal. On November 2, 2016, a briefing order was distributed by the court. The Provider Companies filed their brief and appendix on December 30, 2016. The opposition brief is due March 1, 2017, and the Provider Companies will have the opportunity to submit a reply brief thereafter. As of December 31, 2016, the Company has accrued approximately $1.0 million in contingent liabilities related to this litigation. Initial damages and attorney's fees have been factored into the purchase price for the Provider Companies and the Company has full indemnity coverage and set-off rights against future price installments for any actual exposure in the appeal.
Katherine Veilleux and Jennifer Chon, individually and on behalf of all other similarly situated v. Electricity Maine. LLC, Provider Power, LLC, Spark Holdco, LLC, Kevin Dean and Emile Clavet is a purported class action lawsuit filed on November 18, 2016 in the United States District Court of Maine, alleging that Electricity Maine, LLC, an entity acquired by Spark Holdco, LLC in 2016, enrolled customers through fraudulent and misleading advertising and promotions. Plaintiffs allege the following claims against all Defendants: violation of the Maine Unfair Trade Practices Act, violation of RICO, negligence, negligent misrepresentation, fraudulent misrepresentation, unjust enrichment and breach of contract. Plaintiffs seek unspecified damages for themselves and the purported class, rescission of contracts with Electricity Maine, injunctive relief, restitution, and attorney’s fees. Defendants’ initial responsive pleading was filed on February 6, 2017. In early February, Spark HoldCo filed a motion to dismiss the claims for which a hearing is expected in the second quarter. Discovery has not yet commenced in this matter but we anticipate it will commence soon. We cannot predict the outcome or consequences of this case. Under the terms of the acquisition, we are indemnified for losses and expenses in connection with this action subject to certain limits.
Item 4. Mine Safety Disclosures.
Not applicable.
45
PART II
Item 5. Market for Registrant’s Common Equity, Related Stockholder Matters and Issuer Purchases of Equity Securities
Our Class A common stock is traded on the NASDAQ Global Select Market under the symbol “SPKE." On February 28, 2017, the closing price of our stock was $27.00, and we had one holder of record of our Class A common stock and two holders of record of our Class B common stock, excluding stockholders for whom shares are held in “nominee” or “street name”. The following table presents the high and low sales prices for closing market transactions as reported on the NASDAQ for the periods presented.
2016 | 2015 | |||
Quarter Ended | Low | High | Low | High |
March 31 | $17.70 | $27.62 | $13.01 | $15.95 |
June 30 | $17.81 | $35.63 | $11.85 | $16.10 |
September 30 | $22.57 | $34.69 | $14.56 | $17.65 |
December 31 | $23.05 | $32.45 | $15.56 | $22.53 |
Dividends
We intend to pay a cash dividend each quarter to holders of our Class A common stock to the extent we have cash available for distribution and are permitted to do so under the terms of our Senior Credit Facility. Below is a summary of dividends paid on our Class A common stock for 2016 and 2015.
2016 | |||
Per Share Amount | Record Date | Payment Date | |
First Quarter | $0.3625 | 2/29/2016 | 3/14/2016 |
Second Quarter | $0.3625 | 5/31/2016 | 6/14/2016 |
Third Quarter | $0.3625 | 8/29/2016 | 9/13/2016 |
Fourth Quarter | $0.3625 | 12/1/2016 | 12/14/2016 |
2015 | |||
Per Share Amount | Record Date | Payment Date | |
First Quarter | $0.3625 | 3/2/2015 | 03/16/2015 |
Second Quarter | $0.3625 | 6/1/2015 | 06/15/2015 |
Third Quarter | $0.3625 | 8/31/2015 | 09/14/2015 |
Fourth Quarter | $0.3625 | 11/30/2015 | 12/14/2015 |
Please see "Management's Discussion and Analysis of Financial Condition and Results of Operations — Liquidity and Capital Resources — Senior Credit Facility" for a description of certain terms of our Senior Credit Facility that may impact our ability to pay dividends.
Issuer Purchases of Equity Securities
We have not repurchased any equity securities since our IPO, which closed on August 1, 2014.
Recent Sales of Unregistered Equity Securities
We have not sold any unregistered equity securities since our IPO other than as previously reported.
46
Stock Performance Graph
The following graph compares, since the IPO, the quarterly performance of our Class A common stock to the NASDAQ Composite Index (NASDAQ Composite) and the Dow Jones U.S. Utilities Index (IDU). The chart assumes that the value of the investment in our Class A common stock and each index was $100 at July 29, 2014 (the date our Class A common stock began trading on the NASDAQ Global Select Market), and that all dividends were reinvested. The stock performance shown on the graph below is not indicative of future price performance.
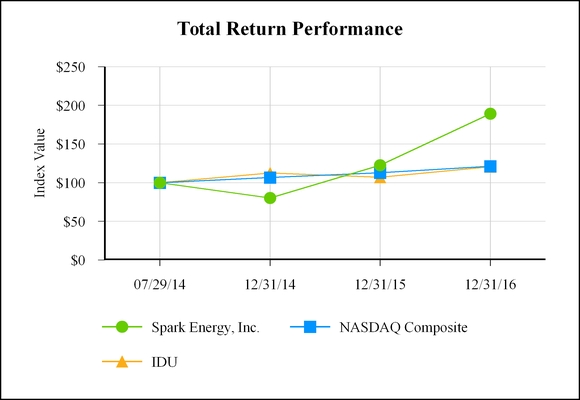
The performance graph above and related information shall not be deemed “soliciting material” or to be “filed” with the SEC, nor shall such information be incorporated by reference into any future filing under the Securities Act or the Exchange Act, except to the extent that we specifically incorporate by reference.
47
Item 6. Selected Financial Data
The following table sets forth selected historical financial information for each of the years in the four year period ended December 31, 2016. We have elected to utilize the reduced disclosure requirements available as an emerging growth company under the JOBS Act, including the presentation of only four years of historical financial data in the tables below.
This information is derived from our combined and consolidated financial statements and should be read in conjunction with “Management’s Discussion and Analysis of Financial Condition and Results of Operations - Emerging Growth Company Status” and “Financial Statements and Supplementary Data."
(in thousands, except per share and volumetric data) | Year Ended December 31, | ||||||||||||||
2016 | 2015 | 2014 | 2013 | ||||||||||||
Statement of Operations Data: | |||||||||||||||
Total Revenues | $ | 546,697 | $ | 358,153 | $ | 322,876 | $ | 317,090 | |||||||
Operating income (loss) | 84,001 | 29,905 | (3,841 | ) | 32,829 | ||||||||||
Net income (loss) | 65,673 | 25,975 | (4,265 | ) | 31,412 | ||||||||||
Net Income (Loss) Attributable to Non-Controlling Interests | 51,229 | 22,110 | (4,211 | ) | — | ||||||||||
Net income (loss) attributable to Spark Energy, Inc. stockholders | 14,444 | 3,865 | (54 | ) | 31,412 | ||||||||||
Net income (loss) attributable to Spark Energy, Inc. per share of Class A common stock | |||||||||||||||
Basic | $ | 2.53 | $ | 1.26 | $ | (0.02 | ) | N/A (1) | |||||||
Diluted | $ | 2.23 | $ | 1.06 | $ | (0.02 | ) | N/A (1) | |||||||
Weighted average common shares outstanding | |||||||||||||||
Basic | 5,701 | 3,064 | 3,000 | N/A (1) | |||||||||||
Diluted | 6,345 | 3,327 | 3,000 | N/A (1) | |||||||||||
Balance Sheet Data: | |||||||||||||||
Current assets | $ | 197,983 | $ | 102,680 | $ | 105,989 | $ | 101,291 | |||||||
Current liabilities | $ | 184,056 | $ | 84,188 | $ | 92,816 | $ | 73,142 | |||||||
Total assets | $ | 376,168 | $ | 162,234 | $ | 138,397 | $ | 109,073 | |||||||
Long-term liabilities | $ | 68,376 | $ | 44,727 | $ | 21,463 | $ | 18 | |||||||
Cash Flow Data: | |||||||||||||||
Cash flows from operating activities | $ | 67,793 | $ | 45,931 | $ | 5,874 | $ | 44,480 | |||||||
Cash flows used in investing activities | $ | (36,344 | ) | $ | (41,943 | ) | $ | (3,040 | ) | $ | (1,481 | ) | |||
Cash flows used in financing activities | $ | (16,963 | ) | $ | (3,873 | ) | $ | (5,664 | ) | $ | (42,369 | ) | |||
Other Financial Data: | |||||||||||||||
Adjusted EBITDA (2) | $ | 81,892 | $ | 36,869 | $ | 11,324 | $ | 33,533 | |||||||
Retail gross margin (2) | $ | 182,369 | $ | 113,615 | $ | 76,944 | $ | 81,668 | |||||||
Distributions paid to Class B non-controlling unit holders and dividends paid to Class A common shareholders | $ | (43,297 | ) | $ | (20,043 | ) | $ | (3,305 | ) | $ | — | ||||
Other Operating Data: | |||||||||||||||
RCEs (thousands) | 774 | 415 | 326 | 310 | |||||||||||
Natural gas volumes (MMBtu) | 16,819,713 | 14,786,681 | 15,724,708 | 16,598,751 | |||||||||||
Electricity volumes (MWh) | 4,170,593 | 2,075,479 | 1,526,652 | 1,829,657 | |||||||||||
(1) EPS and other per share data is not meaningful prior to the Company's IPO, effective August 1, 2014, as the Company operated under a sole-member ownership structure.
(2) Adjusted EBITDA and retail gross margin are non-GAAP financial measures. For a definition and reconciliation of each of Adjusted EBITDA and retail gross margin to their most directly comparable financial measures calculated and presented in accordance with GAAP, please see “Management's Discussion and Analysis of Financial Condition and Results of Operations - How We Evaluate Our Operations."
48
ITEM 7. MANAGEMENT’S DISCUSSION AND ANALYSIS OF FINANCIAL CONDITION
AND RESULTS OF OPERATIONS
The following discussion and analysis of our financial condition and results of operations should be read in conjunction with the combined and consolidated financial statements and the related notes thereto included elsewhere in this report. In this report, the terms “Spark Energy,” “Company,” “we,” “us” and “our” refer collectively to (i) the combined business and assets of the retail natural gas business and asset optimization activities of Spark Energy Gas, LLC and the retail electricity business of Spark Energy, LLC before the completion of our corporate reorganization in connection with the initial public offering of Spark Energy, Inc., which closed on August 1, 2014 (the “IPO”) and (ii) Spark Energy, Inc. and its subsidiaries as of the IPO and thereafter.
Overview
We are a growing independent retail energy services company founded in 1999 that provides residential and commercial customers in competitive markets across the United States with an alternative choice for their natural gas and electricity. We purchase our natural gas and electricity supply from a variety of wholesale providers and bill our customers monthly for the delivery of natural gas and electricity based on their consumption at either a fixed or variable-price. Natural gas and electricity are then distributed to our customers by local regulated utility companies through their existing infrastructure. As of December 31, 2016, we operated in 90 utility service territories across 18 states.
Our business consists of two operating segments:
• | Retail Natural Gas Segment. We purchase natural gas supply through physical and financial transactions with market counterparts and supply natural gas to residential and commercial consumers pursuant to fixed-price and variable-price contracts. For the years ended December 31, 2016, 2015 and 2014, approximately 24%, 36% and 45%, respectively, of our retail revenues were derived from the sale of natural gas. We also identify wholesale natural gas arbitrage opportunities in conjunction with our retail procurement and hedging activities, which we refer to as asset optimization. |
• | Retail Electricity Segment. We purchase electricity supply through physical and financial transactions with market counterparts and ISOs and supply electricity to residential and commercial consumers pursuant to fixed-price and variable-price contracts. For the years ended December 31, 2016, 2015 and 2014, approximately 76%, 64% and 55%, respectively, of our retail revenues were derived from the sale of electricity. |
Spark Energy, Inc. was formed in April 2014 and, as a result, has historical financial operating results only for the portions of the periods covered by this report that are subsequent to the closing of the IPO on August 1, 2014. The following discussion analyzes our historical combined financial condition and results of operations before the IPO, which is the combined businesses and assets of the retail natural gas business and asset optimization activities of Spark Energy Gas, LLC (“SEG”) and the retail electricity business of Spark Energy, LLC (“SE”), and the consolidated results of operations and financial condition of Spark Energy, Inc. and its subsidiaries after the IPO. SE and SEG are the operating subsidiaries through which we have historically operated our retail energy business and were commonly controlled by NuDevco Partners, LLC prior to the IPO.
Recent Developments
Acquisitions of Provider Companies and Major Energy Companies
On August 1, 2016, the Company and Spark HoldCo completed the purchase of all of the outstanding membership interests in the retail energy providers Electricity Maine, LLC, Electricity N.H., LLC, and Provider Power Mass, LLC, (the “Provider Companies”), which are all Maine limited liability companies. On August 23, 2016, the Company and Spark HoldCo completed the purchase of all of the outstanding membership interests in the retail energy providers Major Energy Services, LLC, Major Energy Electric Services, LLC, and Respond Power, LLC (the
49
"Major Energy Companies"), which are all New York limited liability companies. See “—Drivers of our Business—Acquisitions" for a discussion of these acquisitions.
Subordinated Debt Facility
On December 27, 2016, we entered into the $25.0 million Subordinated Facility with Retailco, LLC ("Retailco"), which is wholly owned by our Founder. See “—Liquidity and Capital Resources —Subordinated Debt Facility” for a description of the Subordinated Facility.
Residential Customer Equivalents
The following table shows our residential customer equivalents ("RCEs") as of December 31, 2016, 2015 and 2014:
RCEs: | ||||||
December 31, | December 31, | |||||
(In thousands) | 2016 | 2015 | % Increase (Decrease) | 2015 | 2014 | % Increase (Decrease) |
Retail Electricity | 571 | 257 | 122% | 257 | 157 | 64% |
Retail Natural Gas | 203 | 158 | 28% | 158 | 169 | (7)% |
Total Retail | 774 | 415 | 87% | 415 | 326 | 27% |
The following table details our count of RCEs by geographical location as of December 31, 2016:
RCEs by Geographic Location: | ||||||
(In thousands) | Electricity | % of Total | Natural Gas | % of Total | Total | % of Total |
East | 451 | 79% | 118 | 58% | 569 | 73% |
Midwest | 52 | 9% | 56 | 28% | 108 | 14% |
Southwest | 68 | 12% | 29 | 14% | 97 | 13% |
Total | 571 | 100% | 203 | 100% | 774 | 100% |
The geographical regions noted above include the following states:
• | East - Connecticut, Florida, Maine, Maryland (including the District of Columbia), Massachusetts, New Hampshire, New Jersey, New York and Pennsylvania; |
• | Midwest - Illinois, Indiana, Michigan and Ohio; and |
• | Southwest - Arizona, California, Colorado, Nevada and Texas. |
Drivers of Our Business
Customer Growth
Customer growth is a key driver of our operations. Our customer growth strategy includes acquiring customers through acquisitions as well as organically. We expect an emphasis on growth through acquisition to continue in 2017.
Acquisitions. Our acquisition strategy has two components. We independently acquire companies and portfolios of companies through some combination of cash, borrowings under the Acquisition Line of the Senior Credit Facility, or through the issuance of common stock, or through financing arrangements with our Founder and his affiliates. Additionally, our Founder formed National Gas & Electric, LLC (“NG&E”) in 2015 for the purpose of purchasing
50
retail energy companies and retail customer books that could ultimately be resold to us. We currently expect that we would fund any future transaction with some combination of cash, subordinated debt, or the issuance of Class A common stock or Class B common stock (and corresponding Spark HoldCo units) to NG&E. However, actual consideration will depend, among other things, on our capital structure and liquidity at the time of any transaction. This relationship affords us access to opportunities that might not otherwise be available to us due to our size and availability of capital. There is no guarantee that NG&E will continue to offer us opportunities. Additionally, as we grow and our access to capital and opportunities improves, we may rely less upon NG&E as a source of acquisitions and seek to enter into more transactions directly with third parties. See “Business and Properties—Relationship with our Founder and Majority Shareholder” for further discussion.
Our ability to grow at historic levels may be constrained if the market for acquisition candidates is limited and we are unable to make acquisitions of portfolios of customers and retail energy companies on commercially reasonable terms.
Organic Growth. Our organic sales strategies are used to both maintain and grow our customer base by offering competitive pricing, price certainty and/or green product offerings. We manage growth on a market-by-market basis by developing price curves in each of the markets we serve and comparing the market prices to the price the local regulated utility is offering. We then determine if there is an opportunity in a particular market based on our ability to create a competitive product on economic terms that satisfies our profitability objectives and provides customer value. We develop marketing campaigns using a combination of sales channels, with an emphasis on door-to-door marketing and outbound telemarketing given their flexibility and historical effectiveness. We identify and acquire customers through a variety of additional sales channels, including our inbound customer care call center, online marketing, email, direct mail, affinity programs, direct sales, brokers and consultants. Our marketing team continuously evaluates the effectiveness of each customer acquisition channel and makes adjustments in order to achieve desired growth and profitability targets.
We believe we can continue to grow organically, however achieving significant organic growth rates have become increasingly more difficult given our size, much of which is attributable to recent acquisitions. Additionally, increasing regulatory pressure on marketing channels such as door-to-door and outbound telemarketing and the ability to manage customer acquisition costs are significant factors in our ability to grow organically.
Integration of Acquisitions.
Effective integration of our acquisitions is a key driver of our business. We were able to integrate both CenStar and Oasis and begin recognizing synergies in 2015. The integration of the Provider Companies is progressing well and synergies are being recognized as of December 31, 2016. As the Major Energy Companies Earnout extends over multiple years, the Company is not able to achieve full synergies at this time; however we are working with the Major Energy Companies' management team to optimize supply and transition certain administrative responsibilities.
51
RCE and Customer Count Activity. The following table shows our RCE and customer count activity during the years ended December 31, 2016, 2015 and 2014.
(In thousands) | Retail Electricity | Retail Natural Gas | Total | % Annual Increase (Decrease) |
December 31, 2013 | 163 | 147 | 310 | |
Additions | 85 | 99 | 184 | |
Attrition | (91) | (77) | (168) | |
December 31, 2014 | 157 | 169 | 326 | 5% |
Additions (1) | 208 | 100 | 308 | |
Attrition | (108) | (111) | (219) | |
December 31, 2015 | 257 | 158 | 415 | 27% |
Additions (2) | 550 | 131 | 681 | |
Attrition | (236) | (86) | (322) | |
December 31, 2016 | 571 | 203 | 774 | 87% |
(1) Includes 40,000 RCEs from the acquisition of Oasis and 65,000 RCEs from the acquisition of CenStar.
(2) Includes 121,000 RCEs from the acquisition of Provider Companies and 220,000 RCEs from the acquisition of Major Energy Companies.
Our 87% net RCE growth in 2016 reflects our acquisitions of Major and Provider, which added approximately 341,000 RCEs, or 82% net growth. The remaining 5% net RCE growth in 2016 was the result of organic additions.
Our 27% net RCE growth in 2015 reflects our acquisitions of CenStar and Oasis, which resulted in an increase in the overall size of individual customers. This growth was partially offset by the slowing of organic additions as we shifted our focus to acquisitions and renegotiated our mass market vendor commission structure in the third quarter of 2015, which correlated commission payments with customer value. These efforts had the effect of resetting our vendor relationships, which in turn slowed organic growth as vendors adapted to the new structure.
Our 5% net RCE growth in 2014 reflected the overall success of our marketing campaigns, which were relaunched in the second half of 2013 after an 18 month reduction in customer acquisition spending as our Founder invested his capital in other businesses. The 2014 growth was primarily organic, but includes two acquisitions of customer contracts in Connecticut. See Note 15 "Customer Acquisitions" to the Company’s Audited Combined and Consolidated Financial Statements included elsewhere in this Report for a discussion of these acquisitions.
Acquisitions
During the first quarter of 2015, the Company entered into a purchase and sale agreement for the purchase of approximately 9,500 RCEs in Northern California for a purchase price of $2.0 million. The transaction closed in April 2015.
On July 8, 2015, the Company completed its acquisition of CenStar, a retail energy company based in New York with approximately 65,000 RCEs. CenStar serves natural gas and electricity customers in New York, New Jersey, and Ohio. The purchase price for the CenStar acquisition was $8.3 million, subject to working capital adjustments, plus a payment for positive working capital of $10.4 million and an earnout payment estimated as of the acquisition date to be $0.5 million, which was associated with a financial measurement attributable to the operations of CenStar for the year following the closing (the "CenStar Earnout"). See Note 8 "Fair Value Measurements" to the audited combined and consolidated financial statements for further discussion. The purchase price was financed with $16.6 million (including positive working capital of $10.4 million) in borrowings under our Senior Credit Facility and $2.1 million from the issuance of a convertible subordinated note (the "CenStar Note") from the Company and Spark HoldCo to Retailco Acquisition Co, LLC ("RAC"), an affiliate of the Company’s Founder.
52
On July 31, 2015, the Company completed its acquisition of Oasis, a retail energy company with approximately 40,000 RCEs in six states across 18 utilities. The purchase price for the Oasis acquisition was $20.0 million, subject to working capital adjustments. The purchase price was financed with $15.0 million of borrowings under our Senior Credit Facility, $5.0 million from the issuance of a convertible subordinated note (the "Oasis Note") from the Company and Spark HoldCo to RAC, and $2.0 million cash on hand.
Acquisition of the Provider Companies
On August 1, 2016, the Company and Spark HoldCo completed the purchase of all of the outstanding membership interests in the Provider Companies, which are all Maine limited liability companies. The Provider Companies serve electrical customers in Maine, New Hampshire and Massachusetts and had approximately 121,000 RCEs on August 1, 2016. The purchase price for the Provider Companies was approximately $34.1 million, which included $1.3 million in working capital, subject to adjustments, and up to $9.0 million in earnout payments, valued at $4.8 million as of the purchase date, to be paid by June 30, 2017, subject to the achievement of certain performance targets. The purchase price was funded by the issuance of 699,742 shares of Class B common stock (and a corresponding number of Spark HoldCo units) sold to Retailco, LLC ("Retailco"), valued at $14.0 million based on a value of $20 per share; borrowings under our Senior Credit Facility (defined below) of $10.6 million; and $3.8 million in installment consideration to be paid in nine monthly payments that commenced in August 2016. The first payment of $0.4 million was made with the initial consideration paid.
Acquisition of the Major Energy Companies
On August 23, 2016, the Company and Spark HoldCo completed the purchase of all of the outstanding membership interests in the retail energy providers Major Energy Services, LLC, Major Energy Electric Services, LLC, and Respond Power, LLC (the "Major Energy Companies"), which are all New York limited liability companies. The Major Energy Companies were purchased from National Gas & Electric, LLC ("NG&E"), which is owned by the Company's Founder. The Major Energy Companies serve natural gas and electricity customers in Connecticut, Illinois, Maryland (including the District of Columbia), Massachusetts, New Jersey, New York, Ohio, and Pennsylvania, and had 220,000 RCEs on August 23, 2016. The purchase price for the Major Energy Companies was approximately $63.2 million, which included $4.3 million in working capital, subject to adjustments; an assumed litigation reserve of $5.0 million, of which $3.9 million had been paid as of December 31, 2016, and up to $35.0 million in installment and earnout payments, valued at $13.1 million as of the purchase date, to be paid to the previous members of the Major Energy Companies, in annual installments on March 31, 2017, 2018 and 2019, subject to the achievement of certain performance targets (the “Major Earnout”). In addition, the Company is obligated to issue up to 200,000 shares of Class B common stock (and a corresponding number of Spark HoldCo units) to NG&E, subject to the achievement of certain performance targets, valued at $0.8 million (40,718 shares valued at $20 per share) as of the purchase date (the "Stock Earnout"). The purchase price was funded by the issuance of 2,000,000 shares of Class B common stock (and a corresponding number of Spark HoldCo units) valued at $40.0 million based on a value of $20 per share, to NG&E. NG&E is owned by our Founder.
See “—Cash Flows—Subordinated Debt to Affiliates” for a discussion of the terms of the aforementioned notes.
Customer Acquisition Costs Incurred
(In thousands) | 2016 | 2015 | 2014 | ||||||
Customer Acquisition Costs Incurred | $ | 24,934 | $ | 19,869 | $ | 26,191 | |||
Management of customer acquisition costs is a key component to our profitability. Customer acquisition costs are spending for organic customer acquisitions and does not include customer acquisitions through acquisitions of businesses or portfolios of customer contracts, which are recorded as customer relationships.
53
We attempt to maintain a disciplined approach to recovery of our customer acquisition costs within defined periods. We capitalize and amortize our customer acquisition costs over a two year period, which is based on the expected average length of a customer relationship. We factor in the recovery of customer acquisition costs in determining which markets we enter and the pricing of our products in those markets. Accordingly, our results are significantly influenced by our customer acquisition spending.
Customer acquisition costs incurred for the year ended December 31, 2016 was approximately $24.9 million, inclusive of costs attributable to the Provider Companies and Major Energy Companies incurred subsequent to their respective acquisition dates. During the first half of 2016, we reduced the amount we spent on organic customer acquisition costs in order to maintain, rather than grow, our current level of RCEs, and shifted our resources to acquiring companies and entire books of customers. During the second half of 2016, we increased our spending on organic customer acquisitions as we refocused on organic growth.
Our customer acquisition spending in the second half of 2015 slowed, resulting in customer acquisition costs of $19.9 million in 2015 as we shifted our focus to acquisitions and due to changes to our residential vendor commission payment structure to better align them with lifetime customer value.
In 2014, we invested $9.8 million acquiring customers in Southern California, or approximately 37% of total customer acquisition costs of $26.2 million in 2014. Given the abnormally high early termination and disconnect for non-payment attrition rates we faced in this market, this expenditure yielded significantly less net customer growth than in our other markets. As a result, we determined that a portion of our unamortized capitalized customer acquisition costs in Southern California in 2014 was impaired, and we accelerated amortization of these costs by $6.5 million for the year ended December 31, 2014 to reflect the reduced estimated future cash flows of the Southern California customer contracts. See “—Southern California Market Entry” below for more detailed discussion on our customer acquisition costs in Southern California. The $16.4 million customer acquisition costs outside of Southern California were invested in acquiring gas and electricity customers across our various other markets with economics that met or exceeded our targeted return thresholds.
Our Ability to Manage Customer Attrition
Attrition on RCE basis | |||||
Year Ended | Quarter Ended | ||||
December 31 | December 31 | September 30 | June 30 | March 31 | |
2014 | 4.9% | 4.8% | 4.8% | 4.9% | 4.9% |
2015 | 5.1% | 4.5% | 5.0% | 5.2% | 5.7% |
2016 | 4.3% | 4.8% | 3.8% | 4.1% | 4.4% |
Customer attrition is primarily due to: (i) customer initiated switches; (ii) residential moves and (iii) disconnection for customer payment defaults.
Customer attrition during the year ended December 31, 2016 was lower than in previous years as we increased our focus on the acquisition of higher lifetime value customers. We also increased our customer win-back efforts, and more aggressively pursued proactive renewals and other customer relationship strategies to maintain a low level of customer attrition.
Customer attrition during the year ended December 31, 2015 was higher than in previous years due to high attrition in the first half of 2015 driven by the reduction of the Southern California customer base and billing issues in the Midwest. Both of these issues were actively managed in the first half of 2015, and we saw attrition return to normal levels by the fourth quarter of 2015.
54
Customer Credit Risk
Year Ended December 31 | ||||||
2016 | 2015 | 2014 | ||||
Total Non-POR Bad Debt as % of Revenue | 0.6 | % | 5.0 | % | 5.7 | % |
Total Non-POR Bad Debt as % of Revenue, excluding Southern California | 0.5 | % | 3.8 | % | 3.2 | % |
For the years ended December 31, 2016, 2015 and 2014, approximately 67%, 56% and 44%, respectively, of our retail revenues were derived from territories in which substantially all of our credit risk was directly linked to local regulated utility companies. As of December 31, 2016, 2015 and 2014, respectively, all of these local regulated utility companies had investment grade ratings. During the same periods, we paid these local regulated utilities a weighted average discount of approximately 1.3%, 1.4% and 1.0%, respectively, of total revenues for customer credit risk protection, respectively.
Our bad debt expense for the years ended December 31, 2016, 2015 and 2014 was approximately 0.6%, 5.0% and 5.7% of non-POR market retail revenues, respectively. An increased focus on collection efforts and timely billing along with tighter credit requirements for new enrollments in non-POR markets have led to a reduction in the bad debt expense in 2016. We have also been able to collect on debt that we had previously written off, which further reduced our bad debt expense during 2016.
Bad debt expense as a percentage of non-POR market retail revenues remained high in 2015 due to the negative impact of higher attrition in the Midwest natural gas markets and continued disconnections for non-payment from our Southern California portfolio, where we stopped selling in January 2015. In early 2016, we introduced upfront credit screening to many of our natural gas sales campaigns in order to proactively identify potential at-risk customers.
Bad debt increased in 2014 as a result of several factors, one of which was our focus on customer acquisition in the Southern California gas market in which we bear customer credit risk. A larger than anticipated percentage of new customers in this market terminated service between 30 and 90 days of coming on flow or were not paying their invoices resulting in disconnect for non-payment, which left the Company attempting to recoup one to three months of outstanding balances from these customers. Our management of customer credit risk in this market was primarily through disconnection and aggressive collection efforts. See “—Southern California Market Entry” below. Bad debt expense attributable to the Northeast Region has also increased in 2014 as we have experienced greater difficulty in collecting higher than normal bills from commercial and residential customers following the extreme weather patterns in that region during the 2014 winter season.
Weather Conditions
Weather conditions directly influence the demand for natural gas and electricity and affect the prices of energy commodities. Our hedging strategy is based on forecasted customer energy usage, which can vary substantially as a result of weather patterns deviating from historical norms. We are particularly sensitive to this variability because of our current substantial concentration and focus on growth in the residential customer segment in which energy usage is highly sensitive to weather conditions that impact heating and cooling demand. In the first half of 2016, we experienced milder than anticipated weather conditions, which negatively impacted overall customer usage, but allowed us to optimize our costs of revenues as commodity prices fell. In the second half of 2016, we experienced marginally warmer than normal weather conditions.
In the early part of 2015, colder than anticipated weather increased volumes and thus positively impacted our first quarter earnings. Warmer than normal weather in the fourth quarter of 2015 in the Northeast negatively impacted natural gas volumes, while we also optimized our costs of revenues as commodity prices fell.
55
In the first quarter of 2014, extreme weather patterns caused commodity demand and prices to rise significantly beyond industry forecasts. As a result, the retail energy industry generally charged higher prices to its variable-price customers resulting in increased attrition and bad debt expense and was subject to decreased margins on fixed-price contracts due to unanticipated increases in volumetric demand that had to be purchased in the spot market at high prices. Our results during the first quarter of 2014 suffered as a result of this severe weather abnormality. After the first quarter 2014 extreme weather conditions, our major markets returned to historical norms for the remainder of the year.
Asset Optimization
Our natural gas business includes opportunistic transactions in the natural gas wholesale marketplace in conjunction with our retail procurement and hedging activities. Asset optimization opportunities primarily arise during the winter heating season when demand for natural gas is the highest. As such, the majority of our asset optimization profits are made in the winter. Given the opportunistic nature of these activities we experience variability in our earnings from our asset optimization activities from year to year. As these activities are accounted for using mark-to-market accounting, the timing of our revenue recognition often differs from the actual cash settlement.
During each of the years ended December 31, 2016 and 2015, we were obligated to pay demand charges of approximately $2.6 million under certain long-term legacy transportation assets that our predecessor entity acquired prior to 2013. Although these demand payments will decrease over time, a portion of the related capacity agreements extend through 2028. Net asset optimization results were a loss of $0.6 million, a gain of $1.5 million and a gain of $2.3 million for the year ended December 31, 2016, 2015 and 2014, respectively.
Southern California Market Entry
Starting in the second quarter of 2014 we accelerated our growth by acquiring carbon neutral gas customers in Southern California. Although we were successful in our acquisition of customers, the campaign faced significant challenges. These challenges resulted in higher than estimated customer attrition and bad debt expense. We attributed our high customer attrition and non-payment rates in the Southern California gas market to confusion and lack of awareness by consumers in an early stage competitive market that is also a “dual bill” market for which customers receive two bills, one from the local distribution utility for delivery and one from the retail energy provider for the product. These factors were exacerbated by the lack of an immediate savings from the utility price as the products that we are offering provided carbon neutral natural gas at a fixed price rather than an immediate savings claim. As a result, our monthly attrition in the Southern California gas market averaged 11.4% during the time we were actively marketing there (April 2014 to December 2014), as compared to an average attrition rate of 4.8% for the rest of our markets during 2014. Our bad debt expense in this market was heavily impacted by early stage customer attrition and non-payment rates. As noted above, a much larger than anticipated percentage of new customers in this market terminated or had their services disconnected for non-payment between 30 and 90 days of coming on flow, which left us attempting to recoup one to three months of outstanding balances from these customers. Our ability to manage customer credit risk in this market was primarily through disconnection and aggressive collection efforts. Our bad debt expense in the Southern California gas market during 2014 was $4.8 million, or an average of 51.0%, as compared to $5.4 million, or an average of 3.2%, for all other markets.
During the third quarter of 2014, we responded to the initial negative results in the Southern California gas market by reducing customer acquisition spending in this market, revamping our products, renegotiating our compensation structure with our primary sales vendor, and increasing our efforts to train the vendor and educate the customer, all with the goal of improving the overall economics for this market. By the end of the third quarter, we had significantly reduced customer acquisition spending as the mitigation efforts taken in the quarter were not providing the desired results. In the fourth quarter of 2014, we took further steps to reduce our sales in Southern California, such that we substantially ceased marketing efforts in the beginning of 2015. We focused our efforts on aggressive collection initiatives. We invested $9.8 million acquiring customers in Southern California in 2014, or approximately 37% of total customer acquisition spending of $26.2 million in 2014. We determined that a portion
56
of our unamortized customer acquisition costs in Southern California in 2014 was impaired, resulting in accelerated amortization of these costs of $6.5 million during the year ended December 31, 2014.
Although marketing efforts in Southern California substantially ceased by the end of 2014, new customers continued to come on-flow in the first quarter of 2015, which continued to negatively impact bad debt and attrition in the first half of 2015. We continued to manage the attrition, primarily due to non-payment, of Southern California customers in 2015. We had approximately 3,000 and 2,000 RCEs remaining in the Southern California market as of December 31, 2015 and 2016, respectively.
57
Factors Affecting Comparability of Historical Financial Results
Tax Receivable Agreement. The Tax Receivable Agreement between us and Spark Holdco, NuDevco Retail Holdings and NuDevco Retail, which the Company entered into concurrently with the IPO, between us and Spark HoldCo, NuDevco Retail Holdings and NuDevco Retail provides for the payment by us to Retailco, LLC (as successor to NuDevco Retail Holdings) and NuDevco Retail of 85% of the net cash savings, if any, in U.S. federal, state and local income tax or franchise tax that we actually realize (or are deemed to realize in certain circumstances) in future periods as a result of (i) any tax basis increases resulting from the purchase by us of Spark HoldCo units from NuDevco Retail Holdings, (ii) any tax basis increases resulting from the exchange of Spark HoldCo units for shares of Class A common stock pursuant to the Exchange Right set forth in the limited liability company agreement of Spark HoldCo (or resulting from an exchange of Spark HoldCo units for cash under the Spark HoldCo limited liability agreement) and (iii) any imputed interest deemed to be paid by us as a result of, and additional tax basis arising from, any payments we make under the Tax Receivable Agreement. In addition, payments we make under the Tax Receivable Agreement will be increased by any interest accrued from the due date (without extensions) of the corresponding tax return. We have recorded 85% of the estimated tax benefit as an increase to amounts payable under the Tax Receivable Agreement as a liability. We retain the benefit of the remaining 15% of these tax savings. See Note 11 "Income Taxes" for further discussion.
Executive Compensation Programs. Periodically the Company grants restricted stock units to our officers, employees, non-employee directors and certain employees of our affiliates who perform services for the Company. The restricted stock unit awards vest over approximately one year for non-employee directors and ratably over approximately three or four years for officers, employees and employees of affiliates, with the initial vesting date occurring in May of the subsequent year, and include tandem dividend equivalent rights that will vest upon the same schedule as the underlying restricted stock unit.
Financing. The total amounts outstanding under our credit agreement prior to our IPO included amounts used to fund equity distributions to our common control owner, which, subsequent to the IPO, we no longer make. Concurrently with the closing of the IPO, we entered into a $70.0 million Senior Credit Facility, which was subsequently amended and restated on July 8, 2015, and our prior credit agreement was terminated. As such, historical borrowings under our prior credit agreement may not provide an accurate indication of what we need to operate our natural gas and electricity business.
On June 1, 2016, the Company and the Co-Borrowers entered into Amendment No. 3 to the Senior Credit Facility to, among other things, increase the Working Capital Line from $60.0 million to $82.5 million in accordance with the Co-Borrowers' right to increase under the existing terms of the Senior Credit Facility. Amendment No. 3 also provides for the addition of new lenders and re-allocates working capital and revolving commitments among existing and new lenders. Amendment No. 3 also provides for additional representations of the Co-Borrowers and additional protections of the lenders of the Senior Credit Facility.
On August 1, 2016, the Company and the Co-Borrowers entered into Amendment No. 4 to the Senior Credit Facility to, among other things, amend the provisions under the Acquisition Line to allow for the Provider Companies acquisition. Amendment No. 4 also raises the minimum availability under the Working Capital Line to $40.0 million. In addition, Amendment No. 4 designates Major Energy Companies as "unrestricted subsidiaries" upon the closing of such acquisition on August 23, 2016. Refer to Note 3 "Acquisitions" for further discussion.
On September 30, 2016, the Company and the Co-Borrowers elected to reduce the capacity of the Working Capital Line from $82.5 million to $60.0 million. In December 2016, we elected up to the $70 million level. The Senior Credit Facility will mature on July 8, 2017. Borrowings under the Acquisition Line will be repaid 25% per year with the remainder due at maturity. The outstanding balances under the Working Capital Line and the Acquisition Line are classified as current debt as of December 31, 2016.
Presentation of the Acquisition of the Major Energy Companies. On April 15, 2016, NG&E completed its acquisition of the Major Energy Companies. On May 3, 2016, we and Spark HoldCo, entered into a Membership
58
Interest Purchase Agreement (the "Major Purchase Agreement") with Retailco and NG&E for the purchase of all the membership interests of the Major Energy Companies. We completed the acquisition of the Major Energy Companies from NG&E on August 23, 2016. Because the acquisition of the Major Energy Companies was a transfer of equity interests of entities under common control, our historical financial statements previously filed with the SEC have been recast in this Form 10-K to include the results attributable to the Major Energy Companies from April 15, 2016. The unaudited condensed consolidated financial statements for this recasted period have been prepared from NG&E's historical cost-basis and may not necessarily be indicative of the actual results of operations that would have occurred had the Company owned the Major Energy Companies during the recasted period.
How We Evaluate Our Operations
Year Ended December 31, | |||||||||||
(in thousands) | 2016 | 2015 | 2014 | ||||||||
Adjusted EBITDA | $ | 81,892 | $ | 36,869 | $ | 11,324 | |||||
Retail Gross Margin | $ | 182,369 | $ | 113,615 | $ | 76,944 | |||||
Adjusted EBITDA. We define “Adjusted EBITDA” as EBITDA less (i) customer acquisition costs incurred in the current period, (ii) net gain (loss) on derivative instruments, and (iii) net current period cash settlements on derivative instruments, plus (iv) non-cash compensation expense, and (v) other non-cash and non-recurring operating items. EBITDA is defined as net income (loss) before provision for income taxes, interest expense and depreciation and amortization.
We deduct all current period customer acquisition costs (representing spending for organic customer acquisitions) in the Adjusted EBITDA calculation because such costs reflect a cash outlay in the year in which they are incurred, even though we capitalize such costs and amortize them over two years in accordance with our accounting policies. The deduction of current period customer acquisition costs is consistent with how we manage our business, but the comparability of Adjusted EBITDA between periods may be affected by varying levels of customer acquisition costs. For example, our Adjusted EBITDA is lower in years of customer growth reflecting larger customer acquisition spending.
We do not deduct the cost of customer acquisitions through acquisitions of business or portfolios of customers in calculated Adjusted EBITDA.
We deduct our net gains (losses) on derivative instruments, excluding current period cash settlements, from the Adjusted EBITDA calculation in order to remove the non-cash impact of net gains and losses on derivative instruments. We also deduct non-cash compensation expense as a result of restricted stock units that are issued under our long-term incentive plan.
We believe that the presentation of Adjusted EBITDA provides information useful to investors in assessing our liquidity and financial condition and results of operations and that Adjusted EBITDA is also useful to investors as a financial indicator of our ability to incur and service debt, pay dividends and fund capital expenditures. Adjusted EBITDA is a supplemental financial measure that management and external users of our combined and consolidated financial statements, such as industry analysts, investors, commercial banks and rating agencies, use to assess the following:
• | our operating performance as compared to other publicly traded companies in the retail energy industry, without regard to financing methods, capital structure or historical cost basis; |
• | the ability of our assets to generate earnings sufficient to support our proposed cash dividends; and |
• | our ability to fund capital expenditures (including customer acquisition costs) and incur and service debt. |
Retail Gross Margin. We define retail gross margin as operating income (loss) plus (i) depreciation and amortization expenses and (ii) general and administrative expenses, less (i) net asset optimization revenues, (ii) net
59
gains (losses) on non-trading derivative instruments, and (iii) net current period cash settlements on non-trading derivative instruments. Retail gross margin is included as a supplemental disclosure because it is a primary performance measure used by our management to determine the performance of our retail natural gas and electricity business by removing the impacts of our asset optimization activities and net non-cash income (loss) impact of our economic hedging activities. As an indicator of our retail energy business’ operating performance, retail gross margin should not be considered an alternative to, or more meaningful than, operating income (loss), its most directly comparable financial measure calculated and presented in accordance with GAAP.
The GAAP measures most directly comparable to Adjusted EBITDA are net income (loss) and net cash provided by operating activities. The GAAP measure most directly comparable to Retail Gross Margin is operating income (loss). Our non-GAAP financial measures of Adjusted EBITDA and Retail Gross Margin should not be considered as alternatives to net income (loss), net cash provided by operating activities, or operating income (loss). Adjusted EBITDA and Retail Gross Margin are not presentations made in accordance with GAAP and have important limitations as analytical tools. You should not consider Adjusted EBITDA or Retail Gross Margin in isolation or as a substitute for analysis of our results as reported under GAAP. Because Adjusted EBITDA and Retail Gross Margin exclude some, but not all, items that affect net income (loss) and net cash provided by operating activities, and are defined differently by different companies in our industry, our definition of Adjusted EBITDA and Retail Gross Margin may not be comparable to similarly titled measures of other companies.
Management compensates for the limitations of Adjusted EBITDA and Retail Gross Margin as analytical tools by reviewing the comparable GAAP measures, understanding the differences between the measures and incorporating these data points into management’s decision-making process.
The following table presents a reconciliation of Adjusted EBITDA to net income (loss) for each of the periods indicated.
Year Ended December 31, | |||||||||||
(in thousands) | 2016 | 2015 | 2014 | ||||||||
Reconciliation of Adjusted EBITDA to Net Income (Loss): | |||||||||||
Net income | $ | 65,673 | $ | 25,975 | $ | (4,265 | ) | ||||
Depreciation and amortization | 32,788 | 25,378 | 22,221 | ||||||||
Interest expense | 8,859 | 2,280 | 1,578 | ||||||||
Income tax expense | 10,426 | 1,974 | (891 | ) | |||||||
EBITDA (1) | 117,746 | 55,607 | 18,643 | ||||||||
Less: | |||||||||||
Net, Gains (losses) on derivative instruments | 22,407 | (18,497 | ) | (14,535 | ) | ||||||
Net, Cash settlements on derivative instruments | (2,146 | ) | 20,547 | (3,479 | ) | ||||||
Customer acquisition costs | 24,934 | 19,869 | 26,191 | ||||||||
Plus: | |||||||||||
Non-cash compensation expense | 5,242 | 3,181 | 858 | ||||||||
Contract termination charge related to Major Energy Companies change of control | 4,099 | — | — | ||||||||
Adjusted EBITDA (1) | $ | 81,892 | $ | 36,869 | $ | 11,324 | |||||
(1) Includes $1.1 million related to the change in fair value as the result of the revaluation of the of the Major Earnout liability at December
31, 2016. Refer to Note 8 "Fair Value Measurements" for further discussion of the revaluation of the Major Earnout.
60
The following table presents a reconciliation of Adjusted EBITDA to net cash provided by operating activities for each of the periods indicated.
Year Ended December 31, | |||||||||||
(in thousands) | 2016 | 2015 | 2014 | ||||||||
Reconciliation of Adjusted EBITDA to net cash provided by operating activities: | |||||||||||
Net cash provided by operating activities | $ | 67,793 | $ | 45,931 | $ | 5,874 | |||||
Amortization of deferred financing costs | (668 | ) | (412 | ) | (631 | ) | |||||
Allowance for doubtful accounts and bad debt expense | (1,261 | ) | (7,908 | ) | (10,164 | ) | |||||
Interest expense | 8,859 | 2,280 | 1,578 | ||||||||
Income tax expense | 10,426 | 1,974 | (891 | ) | |||||||
Changes in operating working capital | |||||||||||
Accounts receivable, prepaids, current assets | 12,135 | (18,820 | ) | 13,332 | |||||||
Inventory | 542 | 4,544 | 3,711 | ||||||||
Accounts payable and accrued liabilities | (17,653 | ) | 13,008 | (2,466 | ) | ||||||
Other | 1,719 | (3,728 | ) | 981 | |||||||
Adjusted EBITDA | $ | 81,892 | $ | 36,869 | $ | 11,324 | |||||
Cash Flow Data: | |||||||||||
Cash flows provided by operating activity | $ | 67,793 | $ | 45,931 | $ | 5,874 | |||||
Cash flows used in investing activity | $ | (36,344 | ) | $ | (41,943 | ) | $ | (3,040 | ) | ||
Cash flows used in financing activity | $ | (16,963 | ) | $ | (3,873 | ) | $ | (5,664 | ) | ||
The following table presents a reconciliation of Retail Gross Margin to operating income (loss) for each of the periods indicated.
Year Ended December 31, | |||||||||||
(in thousands) | 2016 | 2015 | 2014 | ||||||||
Reconciliation of Retail Gross Margin to Operating Income (Loss): | |||||||||||
Operating income (loss) | $ | 84,001 | $ | 29,905 | $ | (3,841 | ) | ||||
Depreciation and amortization | 32,788 | 25,378 | 22,221 | ||||||||
General and administrative | 84,964 | 61,682 | 45,880 | ||||||||
Less: | |||||||||||
Net asset optimization revenue | (586 | ) | 1,494 | 2,318 | |||||||
Net, Gains (losses) on non-trading derivative instruments | 22,254 | (18,423 | ) | (8,713 | ) | ||||||
Net, Cash settlements on non-trading derivative instruments | (2,284 | ) | 20,279 | (6,289 | ) | ||||||
Retail Gross Margin | $ | 182,369 | $ | 113,615 | $ | 76,944 | |||||
Retail Gross Margin - Retail Natural Gas Segment | $ | 64,233 | $ | 53,360 | $ | 44,327 | |||||
Retail Gross Margin - Retail Electricity Segment | $ | 118,136 | $ | 60,255 | $ | 32,617 | |||||
61
Combined and Consolidated Results of Operations
Year Ended December 31, 2016 Compared to Year Ended December 31, 2015
In Thousands | Year Ended December 31, | ||||||||||
2016 | 2015 | Change | |||||||||
Revenues: | |||||||||||
Retail revenues | $ | 547,283 | $ | 356,659 | $ | 190,624 | |||||
Net asset optimization revenues | (586 | ) | 1,494 | (2,080 | ) | ||||||
Total Revenues | 546,697 | 358,153 | 188,544 | ||||||||
Operating Expenses: | |||||||||||
Retail cost of revenues | 344,944 | 241,188 | 103,756 | ||||||||
General and administrative | 84,964 | 61,682 | 23,282 | ||||||||
Depreciation and amortization | 32,788 | 25,378 | 7,410 | ||||||||
Total Operating Expenses | 462,696 | 328,248 | 134,448 | ||||||||
Operating income (loss) | 84,001 | 29,905 | 54,096 | ||||||||
Other (expense)/income: | |||||||||||
Interest expense | (8,859 | ) | (2,280 | ) | (6,579 | ) | |||||
Interest and other income | 957 | 324 | 633 | ||||||||
Total other (expenses)/income | (7,902 | ) | (1,956 | ) | (5,946 | ) | |||||
Income (loss) before income tax expense | 76,099 | 27,949 | 48,150 | ||||||||
Income tax expense (benefit) | 10,426 | 1,974 | 8,452 | ||||||||
Net income (loss) | $ | 65,673 | $ | 25,975 | $ | 39,698 | |||||
Adjusted EBITDA (1) | $ | 81,892 | $ | 36,869 | $ | 45,023 | |||||
Retail Gross Margin (1) | $ | 182,369 | $ | 113,615 | $ | 68,754 | |||||
Customer Acquisition Costs | $ | 24,934 | $ | 19,869 | $ | 5,065 | |||||
RCE Attrition | 4.3% | 5.1 | % | (0.8)% | |||||||
Distributions paid to Class B non-controlling unit holders and dividends paid to Class A common shareholders | $ | (43,297 | ) | $ | (20,043 | ) | $ | (23,254 | ) | ||
(1) | Adjusted EBITDA and Retail Gross Margin are non-GAAP financial measures. See “How We Evaluate Our Operations” for a reconciliation of Adjusted EBITDA and Retail Gross Margin to their most directly comparable financial measures presented in accordance with GAAP. |
Total Revenues. Total revenues for the year ended December 31, 2016 were approximately $546.7 million, an increase of approximately $188.5 million, or 53%, from approximately $358.2 million for the year ended December 31, 2015. This increase was primarily due to an increase in electricity and natural gas volumes driven by acquisitions of the Provider Companies and Major Energy Companies, partially offset by decreased electricity pricing and natural gas pricing.
Change in electricity volumes sold | $ | 231.7 | |
Change in natural gas volumes sold | 17.5 | ||
Change in electricity unit revenue per MWh | (44.0 | ) | |
Change in natural gas unit revenue per MMBtu | (14.6 | ) | |
Change in net asset optimization revenue (expense) | (2.1 | ) | |
Change in total revenues | $ | 188.5 | |
62
Retail Cost of Revenues. Total retail cost of revenues for the year ended December 31, 2016 was approximately $344.9 million, an increase of approximately $103.7 million, or 43%, from approximately $241.2 million for the year ended December 31, 2015. This increase was primarily due to additional volumes driven by the acquisitions of the Provider Companies and Major Energy Companies, partially offset by lower electricity and natural gas supply costs.
Change in electricity volumes sold | $ | 170.8 | |
Change in natural gas volumes sold | 10.1 | ||
Change in electricity unit cost per MWh | (41.0 | ) | |
Change in natural gas unit cost per MMBtu | (18.1 | ) | |
Change in value of retail derivative portfolio | (18.1 | ) | |
Change in retail cost of revenues | $ | 103.7 | |
General and Administrative Expense. General and administrative expense for the year ended December 31, 2016 was approximately $85.0 million, an increase of approximately $23.3 million, or 38%, as compared to $61.7 million for the year ended December 31, 2015. This increase was primarily due to increased billing and other variable costs associated with increased RCEs, including those added as a result of the acquisitions of Provider Companies and Major Energy Companies, increased stock-based compensation associated with higher stock prices and additional equity awards, and additional litigation expense. This increase was partially offset by cost reductions from the Master Service Agreement with Retailco Services and lower bad debt expense as we had better than anticipated collections as a result of new collection initiatives, and as the impact of attrition in the Southern California market was limited to 2015.
Depreciation and Amortization Expense. Depreciation and amortization expense for the year ended December 31, 2016 was approximately $32.8 million, an increase of approximately $7.4 million, or 29%, from approximately $25.4 million for the year ended December 31, 2015. This increase was primarily due to the increased amortization expense associated with customer intangibles from the acquisitions of Provider Companies and Major Energy Companies.
Customer Acquisition Cost. Customer acquisition cost for the year ended December 31, 2016 was approximately $24.9 million, an increase of approximately $5.0 million, or 25% from approximately $19.9 million for the year ended December 31, 2015. This increase was primarily due to customer acquisition costs of the Major Energy Companies of $7.0 million. The increase was partially offset by decreased organic sales in the first half of 2016 as we shifted our focus to growth through acquisitions.
63
Year Ended December 31, 2015 Compared to Year Ended December 31, 2014
In Thousands | Year Ended December 31, | ||||||||||
2015 | 2014 | Change | |||||||||
Revenues: | |||||||||||
Retail revenues | $ | 356,659 | $ | 320,558 | $ | 36,101 | |||||
Net asset optimization revenues | 1,494 | 2,318 | (824 | ) | |||||||
Total Revenues | 358,153 | 322,876 | 35,277 | ||||||||
Operating Expenses: | |||||||||||
Retail cost of revenues | 241,188 | 258,616 | (17,428 | ) | |||||||
General and administrative | 61,682 | 45,880 | 15,802 | ||||||||
Depreciation and amortization | 25,378 | 22,221 | 3,157 | ||||||||
Total Operating Expenses | 328,248 | 326,717 | 1,531 | ||||||||
Operating income (loss) | 29,905 | (3,841 | ) | 33,746 | |||||||
Other (expense)/income: | |||||||||||
Interest expense | (2,280 | ) | (1,578 | ) | (702 | ) | |||||
Interest and other income | 324 | 263 | 61 | ||||||||
Total other (expenses)/income | (1,956 | ) | (1,315 | ) | (641 | ) | |||||
Income (loss) before income tax expense | 27,949 | (5,156 | ) | 33,105 | |||||||
Income tax expense (benefit) | 1,974 | (891 | ) | 2,865 | |||||||
Net income (loss) | $ | 25,975 | $ | (4,265 | ) | $ | 30,240 | ||||
Adjusted EBITDA (1) | $ | 36,869 | $ | 11,324 | $ | 25,545 | |||||
Retail Gross Margin (1) | $ | 113,615 | $ | 76,944 | $ | 36,671 | |||||
Customer Acquisition Costs | $ | 19,869 | $ | 26,191 | $ | (6,322 | ) | ||||
RCE Attrition | 5.1 | % | 4.9% | 0.2% | |||||||
Distributions paid to Class B non-controlling unit holders and dividends paid to Class A common shareholders | $ | (20,043 | ) | $ | (3,305 | ) | $ | (16,738 | ) | ||
(1) | Adjusted EBITDA and Retail Gross Margin are non-GAAP financial measures. See “How We Evaluate Our Operations” for a reconciliation of Adjusted EBITDA and Retail Gross Margin to their most directly comparable financial measures presented in accordance with GAAP. |
Total Revenues. Total revenues for the year ended December 31, 2015 were approximately $358.2 million, an increase of approximately $35.3 million, or 11%, from approximately $322.9 million for the year ended December 31, 2014. This increase was primarily due to an increase in electricity volumes, partially offset by decreases in natural gas volumes, electricity pricing and natural gas pricing. The $63.4 million increase in revenues due to our increase in electricity volumes was primarily due to the acquisitions of Oasis and CenStar and organic growth in our electricity utility territories in the East. This increase was offset by a decrease of $18.7 million from decreases in electricity and natural gas pricing, which were driven by falling commodity prices as well as overall pricing decreases due to our increased commercial customer count after the acquisitions of CenStar and Oasis. Additionally, an $8.6 million decrease in revenues was due to our decrease in natural gas volumes in our natural gas utility territories in the East and Midwest and the shift of marketing efforts from commercial customers to residential customers.
Change in electricity volumes sold | $ | 63.4 | |
Change in natural gas volumes sold | (8.6 | ) | |
Change in electricity unit revenue per MWh | (10.3 | ) | |
Change in natural gas unit revenue per MMBtu | (8.4 | ) | |
Change in net asset optimization revenue (expense) | (0.8 | ) | |
Change in total revenues | $ | 35.3 | |
64
Retail Cost of Revenues. Total retail cost of revenues for the year ended December 31, 2015 was approximately $241.2 million, a decrease of approximately $17.4 million, or 7%, from approximately $258.6 million for the year ended December 31, 2014. This decrease was primarily due to lower electricity and natural gas supply costs and lower natural gas volumes, partially offset by higher electricity volumes.
The decreases due to lower electricity and natural gas supply costs were $26.3 million and $20.1 million, respectively. These supply cost decreases were due to the overall lower commodity price environment in 2015, compared with exacerbated pricing in early 2014 caused by extreme weather patterns in the Northeast. Additionally, lower natural gas volumes resulted in a $6.0 million decrease in retail cost of revenues, which was a driven by gas attrition outpacing the addition of new gas customers. We saw higher gas usage in 2014 resulting from the extreme weather conditions in the Northeast affecting the first quarter, while 2015 did not see this high usage pattern. We also recorded a $16.8 million loss due to the change in the value of our non-trading derivative portfolio used for hedging. These decreases were offset by an increase of $51.8 million due to higher electricity volumes, primarily from our acquisitions of Oasis and CenStar as well as increased electricity customers from organic sales strategies.
Change in electricity volumes sold | $ | 51.8 | |
Change in natural gas volumes sold | (6.0 | ) | |
Change in electricity unit cost per MWh | (26.3 | ) | |
Change in natural gas unit cost per MMBtu | (20.1 | ) | |
Change in value of retail derivative portfolio | (16.8 | ) | |
Change in retail cost of revenues | $ | (17.4 | ) |
General and Administrative Expense. General and administrative expense for the year ended December 31, 2015 was approximately $61.7 million, an increase of approximately $15.8 million or 34%, as compared to $45.9 million for the year ended December 31, 2014. This increase was primarily due to increased billing and other variable costs associated with increased RCEs, including those added as a result of the acquisitions of Oasis and CenStar, and increased costs associated with being a public company for a full year.
Depreciation and Amortization Expense. Depreciation and amortization expense for the year ended December 31, 2015 was approximately $25.4 million, an increase of approximately $3.2 million, or 14%, from approximately $22.2 million for the year ended December 31, 2014. This increase was primarily due to the amortization from higher average customer relationships and customer acquisition costs amortizing in 2015 than in 2014, primarily due to the acquisitions of Oasis, CenStar and other portfolios of customer contracts.
Customer Acquisition Cost. Customer acquisition cost for the year ended December 31, 2015 was approximately $19.9 million, a decrease of approximately $6.3 million, or 24% from approximately $26.2 million for the year ended December 31, 2014. This decrease was due to the slowing of organic additions as we shifted our focus to acquisitions and recent changes to our residential vendor commission payment structure in the third quarter of 2015, which resulted in decreased customer acquisition spending as vendors adapted to the new structure in the third and fourth quarters of 2015.
65
Operating Segment Results
Year Ended December 31, | |||||||||||
2016 | 2015 | 2014 | |||||||||
(in thousands, except volume and per unit operating data) | |||||||||||
Retail Natural Gas Segment | |||||||||||
Total Revenues | $ | 129,468 | $ | 128,663 | $ | 146,470 | |||||
Retail Cost of Revenues | 58,149 | 70,504 | 109,164 | ||||||||
Less: Net Asset Optimization Revenues | (586 | ) | 1,494 | 2,318 | |||||||
Less: Net Gains (Losses) on non-trading derivatives, net of cash settlements | 7,672 | 3,305 | (9,339 | ) | |||||||
Retail Gross Margin (1) —Gas | $ | 64,233 | $ | 53,360 | $ | 44,327 | |||||
Volumes—Gas (MMBtus) | 16,819,713 | 14,786,681 | 15,724,708 | ||||||||
Retail Gross Margin (2) —Gas per MMBtu | $ | 3.82 | $ | 3.61 | $ | 2.82 | |||||
Retail Electricity Segment | |||||||||||
Total Revenues | $ | 417,229 | $ | 229,490 | $ | 176,406 | |||||
Retail Cost of Revenues | 286,795 | 170,684 | 149,452 | ||||||||
Less: Net Gains (Losses) on non-trading derivatives, net of cash settlements | 12,298 | (1,449 | ) | (5,663 | ) | ||||||
Retail Gross Margin (1) —Electricity | $ | 118,136 | $ | 60,255 | $ | 32,617 | |||||
Volumes—Electricity (MWhs) | 4,170,593 | 2,075,479 | 1,526,652 | ||||||||
Retail Gross Margin (2) —Electricity per MWh | $ | 28.33 | $ | 29.03 | $ | 21.37 | |||||
(1) | Reflects the Retail Gross Margin attributable to our Retail Natural Gas Segment or Retail Electricity Segment, as applicable. Retail Gross Margin is a non-GAAP financial measures. See “How We Evaluate Our Operations” for a reconciliation of Adjusted EBITDA and Retail Gross Margin to their most directly comparable financial measures presented in accordance with GAAP. |
(2) | Reflects the Retail Gross Margin for the Retail Natural Gas Segment or Retail Electricity Segment, as applicable, divided by the total volumes in MMBtu or MWh, respectively. |
66
Year Ended December 31, 2016 Compared to the Year Ended December 31, 2015
Retail Natural Gas Segment
Total revenues for the Retail Natural Gas Segment for the year ended December 31, 2016 were approximately $129.5 million, an increase of approximately $0.8 million, or 1%, from approximately $128.7 million for the year ended December 31, 2015. This increase was primarily attributable to an increase in customer sales volumes resulting from the acquisition of Major Energy Companies, which increased total revenues by $17.5 million. This increase was largely offset by lower rates driven by the lower commodity pricing environment, which resulted in a decrease in total revenues of $14.6 million, and a decrease of $2.1 million in net optimization revenues.
Retail cost of revenues for the Retail Natural Gas Segment for the year ended December 31, 2016 were approximately $58.1 million, a decrease of approximately $12.4 million, or 18%, from approximately $70.5 million for the year ended December 31, 2015. This decrease was due to decreased supply costs, which resulted in a decrease of $18.1 million, and a decrease of $4.4 million in the value of our retail derivative portfolio used for hedging. These decreases were partially offset by an increase of $10.1 million related to increased volume resulting from the acquisition of the Major Energy Companies.
Retail gross margin for the Retail Natural Gas Segment for the year ended December 31, 2016 was approximately $64.2 million, an increase of approximately $10.8 million, or 20% from approximately $53.4 million for the year ended December 31, 2015, as indicated in the table below (in millions).
Change in volumes sold | $ | 7.3 | |
Change in unit margin per MMBtu | 3.5 | ||
Change in retail natural gas segment retail gross margin | $ | 10.8 | |
Unit margins were positively impacted by the overall lower commodity price environment.
The volumes of natural gas sold increased from 14,786,681 MMBtu for the year ended December 31, 2015 to 16,819,713 MMBtu for the year ended December 31, 2016. This increase was primarily due to our acquisition of Major Energy Companies.
Retail Electricity Segment
Retail revenues for the Retail Electricity Segment for the year ended December 31, 2016 was approximately $417.2 million, an increase of approximately $187.7 million, or 82%, from approximately $229.5 million for the year ended December 31, 2015. This increase was primarily due to an increase in volume from the acquisitions of the Major Energy Companies and the Provider Companies and the addition of several higher volume commercial customers in the East, which resulted in an increase in revenues of $231.7 million. This increase was partially offset by a decrease in electricity pricing, driven by the lower commodity pricing environment from milder than anticipated weather, which resulted in a decrease of $44.0 million.
Retail cost of revenues for the Retail Electricity Segment for the year ended December 31, 2016 was approximately $286.8 million, an increase of approximately $116.1 million, or 68%, from approximately $170.7 million for the year ended December 31, 2015. This increase was primarily due to an increase in volume as a result of the acquisitions of the Major Energy Companies and the Provider Companies, as well as organic growth in the East, resulting in an increase of $170.8 million. This increase was partially offset by a decrease of $13.7 million due to a change in the value of our retail derivative portfolio used for hedging and decreased commodity prices, resulting in a decrease in retail cost of revenues of $41.0 million.
Retail gross margin for the Retail Electricity Segment for the year ended December 31, 2016 was approximately $118.1 million, an increase of approximately $57.8 million, or 96%, as compared to $60.3 million for the year ended December 31, 2015 as indicated in the table below (in millions).
67
Change in volumes sold | $ | 60.8 | |
Change in unit margin per MWh | (3.0 | ) | |
Change in retail electricity segment retail gross margin | $ | 57.8 | |
Unit margins were positively impacted by an increase in volume as a result of the acquisitions of the Major Energy Companies and the Provider Companies.
The volumes of electricity sold increased from 2,075,479 MWh for the year ended December 31, 2015 to 4,170,593 MWh for the year ended December 31, 2016. This increase was primarily due to addition of customers through the acquisitions of Major Energy Companies and Provider Companies and organic growth in the East.
Year Ended December 31, 2015 Compared to the Year Ended December 31, 2014
Retail Natural Gas Segment
Total revenues for the Retail Natural Gas Segment for the year ended December 31, 2015 were approximately $128.7 million, a decrease of approximately $17.8 million, or 12%, from approximately $146.5 million for the year ended December 31, 2014. This decrease was primarily due to lower customer sales volumes primarily in the East and Midwest, lower average gas RCEs and a return to normalized weather patterns in 2015, resulting in a decrease in revenues of $8.6 million, and decreased pricing, in part due to a return to normalized weather patterns in 2015, resulting in a decrease in revenues of $8.4 million.
Retail cost of revenues for the Retail Natural Gas Segment for the year ended December 31, 2015 were approximately $70.5 million, a decrease of approximately $38.7 million, or 35%, from approximately $109.2 million for the year ended December 31, 2014. This decrease was primarily due to lower natural gas supply costs of $20.1 million, in part due to lower costs in 2015 compared to capacity constraints and higher usage from extreme weather conditions in the Northeast affecting the first quarter of 2014. Additionally, this we recorded a $12.6 million loss due to the decrease in the value of our non-trading derivative portfolio used for hedging and a decrease of $6.0 million resulting from lower customer sales volumes, primarily in the Midwest and East.
Retail gross margin for the Retail Natural Gas Segment for the year ended December 31, 2015 was approximately $53.4 million, an increase of approximately $9.1 million, or 21% as compared to $44.3 million for the year ended December 31, 2014, as indicated in the table below (in millions).
Change in volumes sold | $ | (2.6 | ) |
Change in unit margin per MMBtu | 11.7 | ||
Change in retail natural gas segment retail gross margin | $ | 9.1 | |
Unit margins were positively impacted by expanded spot margins from the overall lower commodity price environment.
The volumes of natural gas sold decreased from 15,724,708 MMBtu for the year ended December 31, 2014 to 14,786,681 MMBtu for the year ended December 31, 2015. This decrease was primarily due to our decreasing organic customer base and warmer than expected weather in fourth quarter of 2015, partially offset by the addition of customers through the acquisitions of CenStar and Oasis.
Retail Electricity Segment
Retail revenues for the Retail Electricity Segment for the year ended December 31, 2015 was approximately $229.5 million, an increase of approximately $53.1 million, or 30%, from approximately $176.4 million for the year ended
68
December 31, 2014. This increase was primarily due to higher customer sales volumes resulting in an increase in retail revenues of $63.4 million, primarily due to our acquisitions of Oasis and CenStar and from organic growth primarily in the East, partially offset by lower customer sales volumes in the Southwest due to a milder summer. This increase was partially offset by a decrease in retail revenues of $10.3 million due to the overall lower commodity pricing environment.
Retail cost of revenues for the Retail Electricity Segment for the year ended December 31, 2015 was approximately $170.7 million, an increase of approximately $21.2 million, or 14%, from approximately $149.5 million for the year ended December 31, 2014. This increase was primarily due to higher customer sales volumes, which resulted in an increase of approximately $51.7 million, primarily attributable to the acquisitions of Oasis and CenStar and organic growth in the East. This increase was offset by lower supply costs of $26.3 million due to the overall lower commodity price environment. Additionally, we recorded a loss of $4.2 million due to the decrease in the value of our non-trading derivative portfolio used for hedging.
Retail gross margin for the Retail Electricity Segment for the year ended December 31, 2015 was approximately $60.2 million, an increase of approximately $27.6 million, or 85%, as compared to $32.6 million for the year ended December 31, 2014 as indicated in the table below (in millions).
Change in volumes sold | $ | 11.7 | |
Change in unit margin per MWh | 15.9 | ||
Change in retail electricity segment retail gross margin | $ | 27.6 | |
Unit margins were positively impacted by the overall lower commodity price environment.
The volumes of electricity sold increased from 1,526,652 MWh for the year ended December 31, 2014 to 2,075,479 MWh for the year ended December 31, 2015. This increase was primarily due to the addition of customers through the acquisitions of Oasis and CenStar and organic growth in East.
Liquidity and Capital Resources
Our liquidity requirements fluctuate with our customer acquisition costs, acquisitions, collateral posting requirements on our derivative instruments portfolio, distributions, the effects of the timing between payments of payables and receipts of receivables, including bad debt receivables, and our general working capital needs for ongoing operations. Our borrowings under the Senior Credit Facility are also subject to material variations on a seasonal basis due to the timing of commodity purchases to satisfy required natural gas inventory purchases and to meet customer demands during periods of peak usage. Moreover, estimating our liquidity requirements is highly dependent on then-current market conditions, including forward prices for natural gas and electricity, and market volatility.
Our primary sources of liquidity are cash generated from operations and borrowings under our Senior Credit Facility. We believe that cash generated from these sources will be sufficient to sustain current operations and to pay required taxes and quarterly cash distributions including the quarterly dividend to the holders of the Class A common stock for the next twelve months.
We amended and restated the Senior Credit Facility on July 8, 2015. The amended covenants under the Senior Credit Facility requires us to hold increasing levels of net working capital over time. The Senior Credit Facility, as amended, includes a $25 million secured revolving line of credit ("Acquisition Line") for the purpose of financing permitted acquisitions, which enables us to pursue growth through mergers and acquisitions. We are obligated to make payments outstanding under the Acquisition Line of 25% per year, which in turn increases availability under the line, with the balance due at maturity. We will be constrained in our ability to grow through acquisitions using financing under the Senior Credit Facility to the extent we have utilized the capacity under this Acquisition Line. In addition, the Senior Credit Facility requires us to finance permitted acquisitions with at least 25% of either cash on hand, equity contributions or subordinated debt. In order to finance the acquisitions of Oasis and CenStar, we have
69
issued convertible subordinated notes to an affiliate of our Founder and majority shareholder. There can be no assurance that our Founder and majority shareholder and their affiliates will continue to finance our acquisition activities through such notes. The Senior Credit Facility will mature on July 8, 2017. We are in the process of negotiating a new credit facility.
On October 7, 2016, we filed a registration statement under the Securities Act on Form S-3 covering offers and sales, from time to time, by us of up to $200,000,000 of Class A common stock, preferred stock, depositary shares and warrants, and by the selling stockholders named therein of up to 11,339,563 shares of Class A common stock. The registration statement was declared effective on October 20, 2016.
On December 27, 2016, we entered into the $25.0 million Subordinated Facility with Retailco, which is wholly owned by our Founder. Please see "__Subordinated Debt Facility" below for a description of the Subordinated Facility.
Based upon our current plans, level of operations and business conditions, we believe that our cash on hand, cash generated from operations, and available borrowings under the Senior Credit Facility and Subordinated Debt Facility will be sufficient to meet our capital requirements and working capital needs. We believe that the financing of any additional growth through acquisitions in 2017 may require equity financing and/or further expansion of our Senior Credit Facility to accommodate such growth.
The following table details our total liquidity as of the date presented:
December 31, | |||
($ in thousands) | 2016 | ||
Cash and cash equivalents | $ | 18,960 | |
Senior Credit Facility Working Capital Line Availability (1) | 11,366 | ||
Senior Credit Facility Acquisition Line Availability (2) | 2,712 | ||
Subordinated Debt Availability | 20,000 | ||
Total Liquidity | $ | 53,038 | |
(1) Subject to Senior Credit Facility borrowing base restrictions. See " __ Cash Flows __ Senior Credit Facility."
(2) Subject to Senior Credit Facility covenant restrictions. See " __ Cash Flows __ Senior Credit Facility."
Capital expenditures for the year ended December 31, 2016 included approximately $24.9 million on customer acquisitions and approximately $2.3 million related to information systems improvements.
The Spark HoldCo, LLC Agreement provides, to the extent cash is available, for distributions pro rata to the holders of Spark HoldCo units such that we receive an amount of cash sufficient to cover the estimated taxes payable by us, the targeted quarterly dividend we intend to pay to holders of our Class A common stock, and payments under the Tax Receivable Agreement we have entered into with Spark HoldCo, Retailco and NuDevco Retail.
We paid dividends to holders of our Class A common stock for the year ended December 31, 2016 of approximately $1.45 per share or $8.4 million. On January 19, 2017, our Board of Directors declared a quarterly dividend of $0.3625 per share to holders of the Class A common stock as of March 1, 2017. This dividend will be paid on March 16, 2017. Our ability to pay dividends in the future will depend on many factors, including the performance of our business in the future and restrictions under our Senior Credit Facility. The financial covenants included in the Senior Credit Facility require the Company to retain increasing amounts of working capital over time, which may have the effect of restricting our ability to pay dividends. Management does not currently believe that the financial covenants in the Senior Credit Facility will cause any such restrictions.
As of December 31, 2016, in order to pay our stated dividends to holders of our Class A common stock and corresponding distributions to holders of our non-controlling interest, Spark HoldCo generally is required to distribute approximately $14.8 million on an annualized basis to holders of its Spark HoldCo units. If our business does not generate enough cash for Spark HoldCo to make such distributions, we may have to borrow to pay our
70
dividend. If our business generates cash in excess of the amounts required to pay an annual dividend of $1.45 per share of Class A common stock, we currently expect to reinvest any such excess cash flows in our business and not increase the dividends payable to holders of our Class A common stock. However, our future dividend policy is within the discretion of our board of directors and will depend upon various factors, including the results of our operations, our financial condition, capital requirements and investment opportunities.
We expect to make payments pursuant to the Tax Receivable Agreement that we have entered into with Retailco LLC (as assignee of NuDevco Retail Holdings), NuDevco Retail and Spark HoldCo in connection with our IPO. Except in cases where we elect to terminate the Tax Receivable Agreement early (or the Tax Receivable Agreement is terminated early due to certain mergers or other changes of control) or we have available cash but fail to make payments when due, generally we may elect to defer payments due under the Tax Receivable Agreement for up to five years if we do not have available cash to satisfy our payment obligations under the Tax Receivable Agreement or if our contractual obligations limit our ability to make these payments. Any such deferred payments under the Tax Receivable Agreement generally will accrue interest. If we were to defer substantial payment obligations under the Tax Receivable Agreement on an ongoing basis, the accrual of those obligations would reduce the availability of cash for other purposes, but we would not be prohibited from paying dividends on our Class A common stock.
We did not meet the threshold coverage ratio required to fund the first payment to NuDevco Retail Holdings under the Tax Receivable Agreement during the four-quarter period ending September 30, 2015. As such, the initial payment under the Tax Receivable Agreement due in late 2015 was deferred pursuant to the terms thereof.
We met the threshold coverage ratio required to fund the first TRA Payment to Retailco and NuDevco Retail under the Tax Receivable Agreement during the four-quarter period ending September 30, 2016, resulting in an initial TRA Payment of $1.4 million becoming due in December 2016. On November 6, 2016, Retailco and NuDevco Retail granted us the right to defer the TRA Payment until May 2018. During the period of time when we have elected to defer the TRA Payment, the outstanding payment amount will accrue interest at a rate calculated in the manner provided for under the Tax Receivable Agreement. The liability has been classified as non-current in our consolidated balance sheet at December 31, 2016. See Note 13 “Transactions with Affiliates” in the notes to our consolidated financial statements for additional details on the Tax Receivable Agreement. See also “Risk Factors—Risks Related to our Class A Common Stock” for risks related to the Tax Receivable Agreement.
Pacific Summit Energy LLC
The Major Energy Companies we acquired are party to three trade credit arrangements with Pacific Summit Energy LLC (“Pacific Summit”), which consist of purchase agreements, operating agreements relating to purchasing terms, security agreements, lockbox agreements and guarantees, providing for the exclusive supply of gas and electricity on credit by Pacific Summit to the Major Energy Companies for resale to end users.
The arrangements allow the Major Energy Companies to purchase gas and electricity on credit at fixed prices or prices to be determined at the time of the transaction confirmation. Under the arrangements, when the costs that Pacific Summit has paid to procure and deliver the gas and electricity exceed the payments that the Major Energy Companies have made attributable to the gas and electricity purchased, the Major Energy Companies incur interest on the difference at the floating 90-day LIBOR rate plus 300 basis points. The outstanding balance of the difference may not exceed $15.0 million for Major Energy Services, LLC, and $20.0 million for each of Major Energy Electric Services, LLC and Respond Power, LLC. The operating agreements also allow Pacific Summit to provide credit support, with a limit of $10.0 million for Major Energy Services, LLC and $20.0 million for each of Major Energy Electric Services, LLC and Respond Power, LLC, which also incurs interest at the floating 90-day LIBOR rate plus 300 basis points (except for certain credit support guaranties that do not bear interest). In connection with these arrangements, the Major Companies have granted first liens to Pacific Summit on a substantial portion of the Major Companies’ assets, including present and future accounts receivable, inventory, liquid assets, and control agreements relating to bank accounts. As of December 31, 2016, we had aggregate outstanding payables under these arrangements of approximately $15.5 million, bearing an interest rate of 4.0%. We are also the beneficiary of various credit support guarantees issued by Pacific Summit under these arrangements as of such date.
71
Pursuant to the operating agreements and the lockbox agreements, payments from the Major Energy Companies are placed into a secured lockbox. The Major Energy Companies are required to maintain a minimum balance in the lockbox accounts, and payments from the lockbox are made to Pacific Summit prior to any payment to the Major Energy Companies. To secure the payment obligations of the Major Energy Companies under the arrangements, Pacific Summit has a security interest, in among other things, funds in the lockbox account, certain accounts receivable and inventory supplied by Pacific Summit. Each of the Major Energy Companies has also guaranteed the payment obligations of the other Major Energy Companies under these arrangements.
Each of the arrangements has a primary term expiring on March 31, 2017, which term automatically renews for one year periods unless either party notifies the other 180 days prior to the expiration of the term. On September 27, 2016, we notified Pacific Summit of our election to trigger the expiration of these arrangements as of March 31, 2017, at the end of the primary term. Upon termination of the Pacific Summit arrangements, the Major Energy Companies will become co-borrowers under the Senior Credit Facility, and their credit requirements and support obligation will be absorbed under our Senior Credit Facility.
Cash Flows
Year Ended December 31, 2016 Compared to the Year Ended December 31, 2015
Our cash flows were as follows for the respective periods (in thousands):
Year Ended December 31, | |||||||||||
2016 | 2015 | Change | |||||||||
Net cash provided by operating activities | $ | 67,793 | $ | 45,931 | $ | 21,862 | |||||
Net cash used in investing activities | $ | (36,344 | ) | $ | (41,943 | ) | $ | 5,599 | |||
Net cash used in financing activities | $ | (16,963 | ) | $ | (3,873 | ) | $ | (13,090 | ) | ||
Cash Flows Used in Operating Activities. Cash flows provided by operating activities for the year ended December 31, 2016 increased by $21.9 million compared to the year ended December 31, 2015. The increase was primarily due to an increase in retail gross margin in 2016, including the acquisitions of the Provider Companies and the Major Energy Companies.
Cash Flows Used in Investing Activities. Cash flows used in investing activities decreased by $5.6 million for the year ended December 31, 2016, primarily driven by the decrease in cash used for acquisitions in 2016 compared to 2015.
Cash Flows Used in Financing Activities. Cash flows used in financing activities increased by $13.1 million for the year ended December 31, 2016 primarily due to additional dividends and distributions, respectively, made to holders of our Class A common stock and Class B common stock, partially offset by increased net utilization of our Senior Credit Facility and equity issuance to our affiliates of our Founder.
Year Ended December 31, 2015 Compared to the Year Ended December 31, 2014
Our cash flows were as follows for the respective periods (in thousands):
Year Ended December 31, | |||||||||||
2015 | 2014 | Change | |||||||||
Net cash provided by operating activities | $ | 45,931 | $ | 5,874 | $ | 40,057 | |||||
Net cash used in investing activities | $ | (41,943 | ) | $ | (3,040 | ) | $ | (38,903 | ) | ||
Net cash used in financing activities | $ | (3,873 | ) | $ | (5,664 | ) | $ | 1,791 | |||
72
Cash Flows Provided by Operating Activities. Cash flows provided by operating activities for the year ended December 31, 2015 increased by $40.1 million compared to the year ended December 31, 2014. The increase was primarily due to an increase in retail gross margin, due to the lower commodity price environment and operations from the acquisitions of CenStar and Oasis. Additionally, the Company spent less on customer acquisition spending in 2015 and instead focused on acquisitions as discussed below for investing activities. These increases were partially offset by higher settlements on derivative instruments and lower operating working capital.
Cash Flows Used in Investing Activities. Cash flows used in investing activities increased by $38.9 million for the year ended December 31, 2015, which was primarily due to the cash used in the acquisitions of CenStar and Oasis.
Cash Flows Used in Financing Activities. Cash flows used in financing activities decreased by $1.8 million for the year ended December 31, 2015 primarily due to a proceeds of $7.1 million from the issuance of the CenStar and Oasis Notes and a reduction in net distributions (member distributions prior to the IPO and distributions and dividends on common stock after the IPO) in 2015 of $19.7 million, offset by reduced net borrowings under the Senior Credit Facility of $25.1 million.
Senior Credit Facility
The Company, as guarantor, and Spark HoldCo (the “Borrower,” and together with Spark Energy, LLC, Spark Energy Gas, LLC, CenStar Energy Corp, CenStar Operating Company, LLC, Oasis Power Holdings, LLC and Oasis Power, LLC, Electricity Maine, LLC, Electricity N.H., LLC and Provider Power Mass, LLC, each a subsidiary of Spark HoldCo, the “Co-Borrowers”) are party to a senior secured revolving credit facility, as amended (“Senior Credit Facility”).
On June 1, 2016, the Company and the Co-Borrowers entered into Amendment No. 3 to the Senior Credit Facility to, among other things, increase the Working Capital Line from $60.0 million to $82.5 million in accordance with the Co-Borrowers' right to increase under the existing terms of the Senior Credit Facility. Amendment No. 3 also provides for the addition of new lenders and re-allocates working capital and revolving commitments among existing and new lenders. Amendment No. 3 also provides for additional representations of the Co-Borrowers and additional protections of the lenders of the Senior Credit Facility.
The Company and the Co-Borrowers entered into Amendment No. 4 to the Senior Credit Facility, effective August 1, 2016, to, among other things, provide for the acquisition of the Provider Companies and certain additional amendments automatically upon the closing of the acquisition of the Major Energy Companies. Upon the closing of the acquisition of the Major Energy Companies, the Major Energy Companies were designated unrestricted subsidiaries, as that term is defined in the Senior Credit Facility. Amendment No. 4 also raised the minimum availability under the Working Capital Line to $40.0 million.
At the Borrower's election, the interest rate under the Working Capital Line is generally determined by reference to:
• | the Eurodollar rate plus an applicable margin of up to 3.00% per annum (based upon the prevailing utilization); or |
• | the alternate base rate plus an applicable margin of up to 2.00% per annum (based upon the prevailing utilization). The alternate base rate is equal to the highest of (i) Société Générale’s prime rate, (ii) the federal funds rate plus 0.50% per annum, or (iii) the reference Eurodollar rate plus 1.00%; or |
• | the rate quoted by Société Générale as its cost of funds for the requested credit plus up to 2.50% per annum (based upon the prevailing utilization). |
The interest rate is generally reduced by 25 basis points if utilization under the Working Capital Line is below fifty percent.
Borrowings under the Acquisition Line are generally determined by reference to:
73
• | the Eurodollar rate plus an applicable margin of up to 3.75% per annum (based upon the prevailing utilization); or |
• | the alternate base rate plus an applicable margin of up to 2.75% per annum (based upon the prevailing utilization). The alternate base rate is equal to the highest of (i) Société Générale's prime rate, (ii) the federal funds rate plus 0.50% per annum, or (iii) the reference Eurodollar rate plus 1.00%. |
The Co-Borrowers pay an annual commitment fee of 0.375% or 0.50% on the unused portion of the Working Capital Line, depending upon the unused capacity, and 0.50% on the unused portion of the Acquisition Line. The lending syndicate under the Senior Credit Facility is entitled to several additional fees including an upfront fee, annual agency fee, and fronting fees based on a percentage of the face amount of letters of credit payable to any syndicate member that issues a letter of credit.
The Company has the ability to elect the availability under the Working Capital Line between $40.0 million to $82.5 million. On September 30, 2016, the Company and the Co-Borrowers elected to reduce the capacity of the Working Capital Line from $82.5 million to $60.0 million. On December 31, 2016, the Company and the Co-Borrowers elected an availability of $70 million under the Working Capital Line. Availability under the working capital line is subject to borrowing base limitations. The borrowing base is calculated primarily based on 80% to 90% of the value of eligible accounts receivable and unbilled product sales (depending on the credit quality of the counterparties) and inventory and other working capital assets. The Co-Borrowers must generally seek approval of the agent or the lenders for permitted acquisitions to be financed under the Acquisition Line.
The Senior Credit Facility is secured by pledges of the equity of the portion of Spark HoldCo owned by the Company and of the equity of Spark HoldCo’s subsidiaries (excluding the Major Energy Companies) and the Co-Borrowers’ present and future subsidiaries, all of the Co-Borrowers’ and their subsidiaries’ present and future property and assets, including accounts receivable, inventory and liquid investments, and control agreements relating to bank accounts. The Major Energy Companies are excluded from the definition of "Borrowers" under the Senior Credit Facility. Accordingly, we do not factor in their working capital into our working capital covenants.
The Senior Credit Facility also contains covenants that, among other things, require the maintenance of specified ratios or conditions as follows:
• | Minimum Net Working Capital. The Co-Borrowers must maintain minimum consolidated net working capital equal to the greater of $5.0 million or 15% of the elected availability under the Working Capital Line. |
• | Minimum Adjusted Tangible Net Worth. The Co-Borrowers must maintain a minimum consolidated adjusted tangible net worth at all times equal to the net cash proceeds from equity issuances occurring after the date of the Senior Credit Facility plus the greater of (i) 20% of aggregate commitments under the Working Capital Line plus 33% of borrowings under the Acquisition Line and (ii) $18.0 million. |
• | Minimum Fixed Charge Coverage Ratio. Spark Energy, Inc. must maintain a minimum fixed charge coverage ratio of 1.20 to 1.00 (1.25 to 1.00 commencing March 31, 2017). The Fixed Charge Coverage Ratio is defined as the ratio of (a) Adjusted EBITDA to (b) the sum of consolidated interest expense (other than interest paid-in-kind in respect of any Subordinated Debt), letter of credit fees, commitment fees, acquisition earn-out payments, distributions and scheduled amortization payments. |
• | Maximum Total Leverage Ratio. Spark Energy, Inc. must maintain a ratio of total indebtedness (excluding the Working Capital Facility and qualifying subordinated debt) to Adjusted EBITDA of a maximum of 2.50 to 1.00. |
The Senior Credit Facility contains various negative covenants that limit the Company’s ability to, among other things, do any of the following:
74
• | incur certain additional indebtedness; |
• | grant certain liens; |
• | engage in certain asset dispositions; |
• | merge or consolidate; |
• | make certain payments, distributions, investments, acquisitions or loans; |
• | enter into transactions with affiliates. |
Spark Energy, Inc. is entitled to pay cash dividends to the holders of the Class A common stock, and Spark HoldCo is entitled to make cash distributions to NuDevco Retail Holdings, LLC so long as: (a) no default exists or would result from such a payment; (b) the Co-Borrowers are in pro forma compliance with all financial covenants before and after giving effect to such payment and (c) the outstanding amount of all loans and letters of credit does not exceed the borrowing base limits. Spark HoldCo’s inability to satisfy certain financial covenants or the existence of an event of default, if not cured or waived, under the Senior Credit Facility could prevent the Company from paying dividends to holders of the Class A common stock.
The Senior Credit Facility contains certain customary representations and warranties and events of default. Events of default include, among other things, payment defaults, breaches of representations and warranties, covenant defaults, cross-defaults and cross-acceleration to certain indebtedness, change in control in which affiliates of our Founder own less than 40% of the outstanding voting interests in the Company, certain events of bankruptcy, certain events under ERISA, material judgments in excess of $5.0 million, certain events with respect to material contracts, actual or asserted failure of any guaranty or security document supporting the Senior Credit Facility to be in full force and effect and changes of control. If such an event of default occurs, the lenders under the Senior Credit Facility would be entitled to take various actions, including the acceleration of amounts due under the facility and all actions permitted to be taken by a secured creditor.
Master Service Agreement with Retailco Services, LLC
We entered into a Master Service Agreement (the “Master Service Agreement”), effective January 1, 2016, with Retailco Services, LLC ("Retailco Services"), which is wholly owned by our Founder. The Master Service Agreement is for a one-year term and renews automatically for successive one-year terms unless the Master Service Agreement is terminated by either party. On January 31, 2017, the Master Service Agreement renewed automatically pursuant to its terms for a one year period ending on December 31, 2017.
Retailco Services provides us with operational support services such as: enrollment and renewal transaction services; customer billing and transaction services; electronic payment processing services; customer services and information technology infrastructure and application support services under the Master Service Agreement.
During the year ended December 31, 2016, the Company recorded general and administrative expense of $14.7 million, in connection with the Master Service Agreement. For the year ended December 31, 2016, Penalty Payments and Damage Payments totaled $0.1 million and $1.4 million, respectively.
Additionally, under the Master Service Agreement, we capitalized $1.3 million during the year ended December 31, 2016 of property and equipment for software and consultant time used in the application, development and implementation of various systems including customer billing and resource management systems.
Ongoing Obligations in Connection with Acquisitions
The Company is obligated to make earnout and installment payments in connection with the acquisitions of the Major Energy Companies and Provider Companies as more fully described in this Annual Report on Form 10-K. In the case of the Major Energy Companies acquisition, these payments could be as much as $35 million depending upon operating results and the customer counts through 2019. See further discussion related to the valuation of the earnouts in Note 8 "Fair Value Measurements." See also "Management's Discussion and Analysis of Financial Condition and Results of Operations - Overview - Acquisition of the Major Energy Companies."
75
Convertible Subordinated Notes to Affiliate
The Company from time to time issues subordinated debt to affiliates of Retailco, which owns a majority of the Company’s outstanding common stock and is indirectly owned by our Founder, who serves as the Chairman of the Board of Directors of the Company. The Company’s Senior Credit Facility requires that at least 25% of permitted acquisitions thereunder be financed with either cash on hand or subordinated debt.
On July 8, 2015, the Company issued a convertible subordinated note to Retailco Acquisition Co, LLC ("RAC"), which is wholly owned by our Founder, for $2.1 million. The convertible subordinated note was scheduled to mature on July 8, 2020, and carried interest at an annual rate of 5%, payable semiannually. The convertible subordinated note was convertible into shares of the Company’s Class B common stock (and a related unit of Spark HoldCo) at a conversion price of $16.57, at any time following the eighteen month anniversary of issuance. Shares of Class A common stock resulting from the conversion of the shares of Class B common stock issued as a result of the conversion right under the convertible subordinated note are entitled to registration rights identical to the registration rights currently held by Retailco on shares of Class A common stock it receives upon conversion of its existing shares of Class B common stock. On October 5, 2016, RAC issued to the Company an irrevocable commitment to convert the convertible subordinated note into 134,731 shares of Class B common stock. RAC assigned the convertible subordinated note to Retailco on January 4, 2017, and on January 8, 2017, the convertible subordinate note was converted into 134,731 shares of Class B common stock.
On July 31, 2015, the Company issued a convertible subordinated note to RAC for $5.0 million. The convertible subordinated note was scheduled to mature on July 31, 2020, and carried interest at a rate of 5% per annum, payable semi-annually. The convertible subordinated note was convertible into shares of Class B common stock (and a related unit of Spark HoldCo) at a conversion rate of $14.00 per share, at any time following the eighteen month anniversary of issuance. Shares of Class A common stock resulting from the conversion of the shares of Class B common stock issued as a result of the conversion right under the convertible subordinated note are entitled to registration rights identical to the registration rights currently held by Retailco on shares of Class A common stock it receives upon conversion of its existing shares of Class B common stock. On October 5, 2016, RAC issued to the Company an irrevocable commitment to convert the convertible subordinated note into 383,090 shares of Class B common stock. RAC assigned the convertible subordinated note to Retailco on January 4, 2017, and on January 31, 2017, the convertible subordinated note was converted into 383,090 shares of Class B common stock.
Subordinated Debt Facility
On December 27, 2016, the Company and Spark HoldCo jointly issued to Retailco, an entity owned by our Founder, a 5% subordinated note in the principal amount of up to $25.0 million. The subordinated note allows us and Spark HoldCo to draw advances in increments of no less than $1.0 million per advance up to the maximum principal amount of the subordinated note. The subordinated note matures approximately 3 ½ years following the date of issuance, and advances thereunder accrue interest at 5% per annum from the date of the advance. We have the right to capitalize interest payments under the subordinated note. The subordinated note is subordinated in certain respects to our Senior Credit Facility pursuant to a subordination agreement. We may pay interest and prepay principal on the subordinated note so long as we are in compliance with our covenants under the Senior Credit Facility, are not in default under the Senior Credit Facility and have minimum availability of $5.0 million under our borrowing base under the Senior Credit Facility. Payment of principal and interest under the subordinated note is accelerated upon the occurrence of certain change of control transactions.
We plan to use the Subordinated Facility to enhance working capital, for growth initiatives, and for capital optimization. As of December 31, 2016, there were $5.0 million in outstanding borrowings under the subordinated note.
Investment in ESM
76
The Company and Spark HoldCo, together with eREX Co., Ltd., a Japanese company, are joint venture partners in eREX Spark Marketing Co., Ltd ("ESM"). Operations for ESM began on April 1, 2016 in connection with the deregulation of the Japanese power market. As of December 31, 2016, ESM has approximately 40,000 customers, which are currently excluded from our count of residential customer equivalents ("RCEs"). As of December 31, 2016, the Company had contributed 156.4 million Japanese Yen, or $1.4 million for 20% ownership of ESM.
Summary of Contractual Obligations
The following table discloses aggregate information about our contractual obligations and commercial commitments as of December 31, 2016 (in millions):
Total | 2017 | 2018 | 2019 | 2020 | 2021 | > 5 years | |||||||||||||||
Operating leases (1) | $ | 2.7 | $ | 1.5 | $ | 0.6 | $ | 0.4 | $ | 0.2 | $ | — | $ | — | |||||||
Purchase obligations: | |||||||||||||||||||||
Natural gas and electricity related purchase obligations (2) | 3.4 | 3.4 | — | — | — | — | — | ||||||||||||||
Pipeline transportation agreements | 14.7 | 7.3 | 1.6 | 0.8 | 0.6 | 0.6 | 3.8 | ||||||||||||||
Other purchase obligations (3) | 1.3 | 1.2 | 0.1 | — | — | — | — | ||||||||||||||
Total purchase obligations | $ | 22.1 | $ | 13.4 | $ | 2.3 | $ | 1.2 | $ | 0.8 | $ | 0.6 | $ | 3.8 | |||||||
Senior Credit Facility | $ | 51.3 | $ | 51.3 | $ | — | $ | — | $ | — | $ | — | $ | — | |||||||
Current portion of note payable | 15.5 | 15.5 | — | — | — | — | — | ||||||||||||||
Subordinated debt—affiliate | 5.0 | — | — | — | 5.0 | — | — | ||||||||||||||
Convertible subordinated notes to affiliates (4) | 6.6 | 6.6 | — | — | — | — | — | ||||||||||||||
Debt | $ | 78.4 | $ | 73.4 | $ | — | $ | — | $ | 5.0 | $ | — | $ | — | |||||||
(1) | Included in the total amount are future minimum payments for leases for services and equipment to support our operations and office rent. |
(2) | The amounts represent the notional value of capacity purchase contracts (electricity related) that are not accounted for as derivative financial instruments recorded at fair market value as capacity contracts do not meet the definition of a derivative, and therefore are not recognized as liabilities on the combined and consolidated balance sheet. |
(3) | The amounts presented here include contracts for billing services and other software agreements. |
(4) | On October 5, 2016 RAC issued an irrevocable commitment to convert the CenStar Note and Oasis Note into shares of Class B common stock. RAC assigned the notes to Retailco on January 4, 2017 and on January 8, 2017 and January 31, 2017, the CenStar Note and Oasis Note were converted into 134,731 and 383,090 shares of Class B common stock, respectively. |
Off-Balance Sheet Arrangements
As of December 31, 2016 we had no material off-balance sheet arrangements.
Related Party Transactions
For a discussion of related party transactions see Note 13 “Transactions with Affiliates” in the Company’s audited combined and consolidated financial statements.
Critical Accounting Policies and Estimates
Our significant accounting policies are described in Note 2 "Basis of Presentation and Summary of Significant Accounting Policies" to our audited combined and consolidated financial statements. We prepare our financial statements in conformity with accounting principles generally accepted in the United States of America and pursuant to the rules and regulations of the SEC, which require us to make estimates and assumptions that affect the amounts reported in the financial statements and accompanying footnotes. Actual results could differ from those estimates. We consider the following policies to be the most critical in understanding the judgments that are involved in preparing our financial statements and the uncertainties that could impact our financial condition and results of operations.
77
Revenue Recognition and Retail Cost of Revenues
Our revenues are derived primarily from the sale of natural gas and electricity to retail customers. We also record revenues from sales of natural gas and electricity to wholesale counterparties, including affiliates. Revenues are recognized by using the following criteria: (1) persuasive evidence of an exchange arrangement exists, (2) delivery has occurred or services have been rendered, (3) the buyer’s price is fixed or determinable and (4) collection is reasonably assured. Utilizing these criteria, revenue is recognized when the natural gas or electricity is delivered. Similarly, cost of revenues is recognized when the commodity is delivered.
Revenues for natural gas and electricity sales are recognized upon delivery under the accrual method. Natural gas and electricity sales that have been delivered but not billed by period end are estimated. Accrued unbilled revenues are based on estimates of customer usage since the date of the last meter read provided by the utility. Volume estimates are based on forecasted volumes and estimated customer usage by class. Unbilled revenues are calculated by multiplying these volume estimates by the applicable rate by customer class. Estimated amounts are adjusted when actual usage is known and billed.
The cost of natural gas and electricity for sale to retail customers is based on estimated supply volumes for the applicable reporting period. In estimating supply volumes, we consider the effects of historical customer volumes, weather factors and usage by customer class. Transmission and distribution delivery fees, where applicable, are estimated using the same method used for sales to retail customers. In addition, other load related costs, such as ISO fees, ancillary services and renewable energy credits are estimated based on historical trends, estimated supply volumes and initial utility data. Volume estimates are then multiplied by the supply rate and recorded as retail cost of revenues in the applicable reporting period. Estimated amounts are adjusted when actual usage is known and billed.
Our asset optimization activities, which primarily include natural gas physical arbitrage and other short term storage and transportation opportunities, meet the definition of trading activities and are recorded on a net basis in the combined and consolidated statements of operations in net asset optimization revenues as required by the Financial Accounting Standards Board (“FASB”) Accounting Standards Codification (“ASC”) Topic 815, Derivatives and Hedging.
Accounts Receivable
We accrue an allowance for doubtful accounts based upon estimated uncollectible accounts receivable considering historical collections, accounts receivable aging analysis, credit risk and other factors. We write off accounts receivable balances against the allowance for doubtful accounts when the accounts receivable is deemed to be uncollectible.
We conduct business in many utility service markets where the local regulated utility purchases our receivables, and then becomes responsible for billing the customer and collecting payment from the customer (“POR programs”). This POR service results in substantially all of our credit risk being linked to the applicable utility in these territories, which generally has an investment-grade rating, and not to the end-use customer. We monitor the financial condition of each utility and currently believe that our susceptibility to an individually significant write-off as a result of concentrations of customer accounts receivable with those utilities is remote.
In markets that do not offer POR services or when we choose to directly bill our customers, certain accounts receivable are billed and collected by us. We bear the credit risk on these accounts and record an appropriate allowance for doubtful accounts to reflect any losses due to non-payment by customers. Our customers are individually insignificant and geographically dispersed in these markets. We write off customer balances when we believe that amounts are no longer collectible and when we have exhausted all means to collect these receivables.
Capitalized Customer Acquisition Costs
78
Capitalized customer acquisition costs consist primarily of hourly and commission based telemarketing costs, door-to-door agent commissions and other direct advertising costs associated with proven customer generation, and are capitalized and amortized over the estimated two-year average life of a customer in accordance with the provisions of FASB ASC 340-20, Capitalized Advertising Costs.
Recoverability of customer acquisition costs is evaluated based on a comparison of the carrying amount of the customer acquisition costs to the future net cash flows expected to be generated by the customers acquired, considering specific assumptions for customer attrition, per unit gross profit, and operating costs. These assumptions are based on forecasts and historical experience.
Accounting for Derivative and Hedging Activities
We use derivative instruments such as futures, swaps, forwards and options to manage the commodity price risks of our business operations.
All derivatives, other than those for which an exception applies, are recorded in the combined and consolidated balance sheets at fair value. Derivative instruments representing unrealized gains are reported as derivative assets while derivative instruments representing unrealized losses are reported as derivative liabilities. We have elected to offset amounts on the combined and consolidated balance sheets for recognized derivative instruments executed with the same counterparty under a master netting arrangement. One of the exceptions to fair value accounting, normal purchases and normal sales, has been elected by us for certain derivative instruments when the contract satisfies certain criteria, including a requirement that physical delivery of the underlying commodity is probable and is expected to be used in normal course of business. Retail revenues and retail cost of revenues resulting from deliveries of commodities under normal purchase contracts and normal sales contracts are included in earnings at the time of contract settlement.
To manage commodity price risk, we hold certain derivative instruments that are not held for trading purposes and are not designated as hedges for accounting purposes. However, to the extent we do not hold offsetting positions for such derivatives, we believe these instruments represent economic hedges that mitigate our exposure to fluctuations in commodity prices. As part of our strategy to optimize our assets and manage related commodity risks, we also manage a portfolio of commodity derivative instruments held for trading purposes. We use established policies and procedures to manage the risks associated with price fluctuations in these energy commodities and use derivative instruments to reduce risk by generally creating offsetting market positions.
Changes in the fair value of and amounts realized upon settlement of derivative instruments not held for trading purposes are recognized currently in earnings in retail revenues or retail costs of revenues, respectively.
Changes in the fair value of and amounts realized upon settlement of derivative instruments held for trading purposes are recognized currently in earnings in net asset optimization revenues.
Goodwill
Goodwill represents the excess of cost over fair value of the assets of businesses acquired in accordance with FASB ASC Topic 350 Intangibles-Goodwill and Other ("ASC 350"). The goodwill on our consolidated balance sheet as of December 31, 2016 is associated with both our Retail Natural Gas and Retail Electricity reporting units. We determine our reporting units by identifying each unit that engaged in business activities from which it may earn revenues and incur expenses, had operating results regularly reviewed by the segment manager for purposes of resource allocation and performance assessment, and had discrete financial information.
Goodwill is assessed for impairment whenever events or circumstances indicate that impairment of the carrying value of goodwill is likely, but no less often than annually as of October 31, 2016. During the fourth quarter of 2016, we performed a qualitative assessment of goodwill in accordance with guidance from ASC 350, which permits an entity to first assess qualitative factors to determine whether it is more likely than not that the fair value of a reporting unit
79
is less than its carrying amount as a basis for determining whether it is necessary to perform the two-step goodwill impairment test. If we fail the qualitative test, then we must compare our estimate of the fair value of a reporting unit with its carrying value, including goodwill. If the carrying value of the reporting unit exceeds its fair value, we perform the second step of the goodwill impairment test to measure the amount of goodwill impairment loss to be recorded, as necessary. The second step compares the implied fair value of the reporting unit’s goodwill to the carrying value, if any, of that goodwill. We determine the implied fair value of the goodwill in the same manner as determining the amount of goodwill to be recognized in a business combination.
We completed our annual assessment of goodwill impairment at October 31, 2016, and the test indicated no impairment.
Recent Accounting Pronouncements
Adopted Standards
In August 2014, the FASB issued ASU No. 2014-15, Presentation of Financial Statements - Going Concern (Subtopic 205-40): Disclosure of Uncertainties about an Entity’s Ability to Continue as a Going Concern (“ASU 2014-15”). The new guidance clarifies management’s responsibility to evaluate whether there is substantial doubt about an entity’s ability to continue as a going concern and to provide related footnote disclosure. ASU 2014-15 is effective for annual periods ending after December 15, 2016 and for annual periods and interim periods thereafter. Early adoption is permitted. The Company adopted ASU 2014-15 effective January 1, 2016, and the adoption of this standard did not have a material impact on the Company's consolidated financial statements.
In November 2014, the FASB issued ASU No. 2014-16, Derivatives and Hedging ("ASU 2014-16"), which clarifies how current GAAP should be interpreted in evaluating the economic characteristics and risks of a host contract in a hybrid financial instrument that is issued in the form of a share. The amendments in this Update are effective for public business entities for fiscal years, and interim periods within those fiscal years, beginning after December 15, 2015. Early adoption, including adoption in an interim period, is permitted. The Update does not change the current criteria in GAAP for determining when separation of certain embedded derivative features in a hybrid financial instrument is required. The Company adopted ASU 2014-16 effective January 1, 2016, and the adoption of this standard did not have a material impact on the Company's consolidated financial statements.
In February 2015, the FASB issued ASU No. 2015-02, Consolidation (Topic 810) ("ASU 2015-02"). ASU 2015-02 changed the analysis that a reporting entity must perform to determine whether it should consolidate certain types of legal entities. On January 1, 2016, we adopted ASU No. 2015-02. Upon adoption, we continued to consolidate Spark HoldCo, but considered Spark HoldCo to be a variable interest entity requiring additional disclosures in the footnotes of our consolidated financial statements.
In April 2015, the FASB issued ASU No. 2015-03, Interest - Imputation of Interest (Subtopic 835-30) (“ASU 2015-03”). The new guidance requires that debt issuance costs related to a recognized debt liability be presented in the balance sheet as a direct deduction from the carrying amount of that debt liability, consistent with debt discounts. ASU 2015-03 is effective for fiscal years, and for interim periods within those fiscal years, beginning after December 15, 2015. Early adoption is permitted for financial statements that have not been previously issued. The Company adopted ASU 2015-03 effective January 1, 2016, and reclassification of any unamortized debt issuance costs as a direct deduction from the carrying amount of those associated debt liabilities relating to the prior period was not considered necessary at that time. The adoption of ASU 2015-03 had no material impact for the current period.
In August 2015, the FASB issued ASU No. 2015-15, Interest - Imputation of Interest (Subtopic 835-30): Presentation and Subsequent Measurement of Debt Issuance Costs Associated with Line-of-Credit Arrangements ("ASU 2015-15"). The amendment in ASU 2015-15 clarifies the presentation and subsequent measurement of debt issuance costs associated with lines of credit. The debt issuance cost associated with line-of-credit may be presented as an asset and amortized ratably over the term of the line of credit arrangement, regardless of whether there are outstanding borrowings on the arrangement. ASU 2015-15 is effective for fiscal years, and for interim periods
80
within those fiscal years, beginning after December 15, 2015. Early adoption is permitted for financial statements that have not been previously issued. The Company adopted ASU 2015-15 effective January 1, 2016 in conjunction with ASU 2015-03. The adoption of this standard did not have a material impact on the Company's consolidated financial statements.
In September 2015, the FASB issued ASU No. 2015-16, Business Combinations (Topic 805): Simplifying the Accounting for Measurement-Period Adjustments ("ASU 2015-16"). ASU 2015-16 eliminates the requirement that the acquirer in a business combination account for measurement period adjustments retrospectively. Instead, the acquirer will recognize adjustments to provisional amounts identified within the measurement period in the reporting period in which those adjustments are determined. ASU 2015-16 is effective for fiscal years, and for interim periods within those fiscal years, beginning after December 15, 2015. The guidance is to be applied prospectively for adjustments to provisional amounts that occur after the effective date. Early adoption is permitted for financial statements that have not been issued. The Company adopted ASU 2015-16 effective January 1, 2016, and the adoption of this standard did not have a material impact on the Company's consolidated financial statements.
In November 2015, the FASB issued ASU No. 2015-17, Income Taxes (Topic 740): Balance Sheet Classification of Deferred Taxes ("ASU 2015-17") that is intended to simplify the presentation of deferred taxes by requiring that all deferred taxes be classified as noncurrent and presented as a single noncurrent amount for each tax-payment component of an entity. The ASU 2015-17 is effective for fiscal years beginning after December 15, 2016; however, the Company elected early adoption on January 1, 2016, on a retrospective basis. The adoption of ASU 2015-17 resulted in the reclassification of previously-classified net current deferred taxes of approximately $0.9 million from other current liabilities, resulting in a $23.4 million noncurrent deferred tax asset and a $0.9 million noncurrent deferred tax liability on the Company’s consolidated balance sheet at December 31, 2015. There was no impact to our consolidated statements of operations for the year ended December 31, 2016.
Standards Being Evaluated/Standards Not Yet Adopted
In May 2014, the FASB issued ASU No. 2014-09, Revenue from Contracts with Customers, which requires an entity to recognize the amount of revenue to which it expects to be entitled for the transfer of promised goods or services to customers. ASU 2014-09 will replace most existing revenue recognition guidance in GAAP when it becomes effective on January 1, 2017. Early application is not permitted. The standard permits the use of either the retrospective or cumulative effect transition method. In August 2015, the FASB issued ASU No. 2015-14, Revenue from Contracts with Customers (Topic 606): Deferral of the Effective Date, which deferred the effective date to periods beginning after December 15, 2017. Early adoption is permitted only as of annual reporting periods beginning after December 15, 2016. In December 2016, the FASB further issued ASU No. 2016-20, Technical Corrections and Improvements to Topic 606, Revenue from Contracts with Customers, to increase stakeholders' awareness of the proposals and to expedite improvements to ASU 2014-09. After assessing the new standard, the Company expects that there will be no material impacts to our revenue recognition procedures.
The FASB issued additional amendments to ASU No. 2014-09, as amended by ASU No. 2015-14:
• | March 2016 - ASU No. 2016-08, Revenue from Contracts with Customers (Topic 606): Principal versus Agent Considerations (Reporting Revenue Gross versus Net) ("ASU 2016-08"). ASU 2016-08 clarifies the implementation guidance on principal versus agent considerations. The guidance includes indicators to assist an entity in determining whether it controls a specified good or service before it is transferred to customers. |
• | April 2016 - ASU No. 2016-10, Revenue from Contracts with Customers (Topic 606): Identifying Performance Obligations and Licensing ("ASU 2016-10"). ASU 2016-10 covers two specific topics: performance obligations and licensing. This amendment includes guidance on immaterial promised goods or services, shipping or handling activities, separately identifiable performance obligations, functional or symbolic intellectual property licenses, sales-based and usage-based royalties, license restrictions (time, use, geographical) and licensing renewals. |
81
• | May 2016 - ASU No. 2016-12, Revenue from Contracts with Customers (Topic 606): Narrow Scope Improvements and Practical Expedients ("ASU 2016-12"). ASU 2016-12 clarifies certain core recognition principles including collectability, sales tax presentation, noncash consideration, contract modifications and completed contracts at transition and disclosures no longer required if the full retrospective transition method is adopted. |
In July 2015, the FASB issued ASU No. 2015-11, Inventory (Topic 330): Simplifying the Measurement of Inventory (“ASU 2015-11”). ASU 2015-11 amends existing guidance to require subsequent measurement of inventory at the lower of cost and net realizable value. Net realizable value is the estimated selling prices in the ordinary course of business, less reasonably predictable costs of completion, disposal, and transportation. ASU 2015-11 is effective for fiscal years, and for interim periods within those fiscal years, beginning after December 15, 2016. Earlier application is permitted as of the beginning of an interim or annual reporting period. The Company does not expect the adoption of ASU 2015-11 will have a material effect on its consolidated financial statements.
In February 2016, the FASB issued ASU No. 2016-02, Leases (Topic 842) ("ASU 2016-02"). ASU 2016-02 amends existing accounting standard for lease accounting by requiring entities to include substantially all leases on the balance sheet by requiring the recognition of right-of-use assets and lease liabilities for all leases. Entities may elect to not recognize leases with a maximum possible term of less than 12 months. For lessees, a lease is classified as finance or operating and the asset and liability are initially measured at the present value of the lease payments. For lessors, accounting for leases is largely unchanged from previous guidance. ASU 2016-02 also requires qualitative disclosures along with certain specific quantitative disclosures for both lessees and lessors. The amendments in this ASU are effective for fiscal years beginning after December 15, 2018, with early adoption permitted, and is effective for interim periods in the year of adoption. The ASU should be applied using a modified retrospective approach, which requires lessees and lessors to recognize and measure leases at the beginning of the earliest period presented. The Company is currently evaluating the impact of adopting this guidance on its consolidated financial statements.
In March 2016, issued ASU No. 2016-09, Compensation - Stock Compensation (Topic 718) ("ASU 2016-09"). ASU 2016-09 includes provisions intended to simplify various aspects of accounting for shared-based payments, including income tax consequences, classification of awards as either equity or liability and classification on the statement of cash flows. Under current U.S. GAAP, excess tax benefits are currently recorded in equity and presented as a financing activity on the statement of cash flows. Upon adoption, excess tax benefits for share-based payments will be recorded as a reduction of income taxes and reflected in operating cash flows. This guidance is effective for annual and interim reporting periods of public entities beginning after December 15, 2016, with early adoption permitted.
The FASB issued an additional amendment to ASU No. 2016-09, as amended by ASU No. 2016-19:
• | December 2016 - ASU No. 2016-19, Compensation-Stock Compensation (Topic 718): Improvements to Share-Based Payment Accounting ("ASU 2016-19"). ASU 2016-19 simplifies several aspects of the accounting for share-based payment transactions, including the income tax consequences, classification of awards as either equity or liabilities, and classification on the statement of cash flows. The Company will adopt ASU 2015-19 on January 1, 2017 and does not expect the adoption of this standard will have a material impact on the Company's consolidated financial statements. |
In June 2016, the FASB issued ASU No. 2016-13, Financial Instruments - Credit Losses (Topic 326): Measurement of Credit Losses on Financial Instruments ("ASU 2016-13"). ASU 2016-13 requires entities to use a current expected credit loss ("CECL") model, which is a new impairment model based on expected losses rather than incurred losses. The model requires financial assets measured at amortized cost be presented at the net amount expected to be collected. The allowance for credit losses is a valuation account that is deducted from the amortized cost basis. The income statement reflects the measurement of credit losses for newly recognized financial assets, as well as the expected credit losses during the period. The measurement of expected losses is based upon historical experience, current conditions, and reasonable and supportable forecasts that affect the collectability of the reported
82
amount. This guidance is effective for interim and annual reporting periods beginning after December 15, 2019, with early adoption permitted for annual reporting periods beginning after December 15, 2018. The Company is currently evaluating the impact of adopting this guidance on its consolidated financial statements.
In August 2016, the FASB issued ASU No. 2016-15, Statement of Cash Flows (Topic 230), Classification of Certain Cash Receipts and Cash Payments ("ASU 2016-15"). ASU 2016-15 provides guidance on the presentation and classification of eight specific cash flow issues in the statement of cash flows. Those issues are cash payment for debt prepayment or debt extinguishment costs; settlement of zero-coupon debt instrument or other debt instrument with coupon interest rates that are insignificant in relation to the effective interest rate of the borrowing; contingent consideration payments made after a business combination; cash proceeds from the settlement of insurance claims, cash received from settlement of corporate-owned life insurance policies; distribution received from equity method investees; beneficial interest in securitization transactions; and classification of cash receipts and payments that have aspects of more than one class of cash flows. The guidance is effective for interim and annual reporting periods beginning after December 15, 2017, with early adoption permitted. This ASU should be applied using a retrospective transition method for each period presented. The Company is currently evaluating the impact of adopting this guidance on its consolidated financial statements.
In October 2016, the FASB issued ASU No. 2016-16, Income Taxes (Topic 740): Intra-Entity Transfers of Assets Other Than Inventory (“ASU 2016-16”). ASU 2016-16 requires immediate recognition of the current and deferred income tax consequences of intercompany asset transfers other than inventory. Current U.S. GAAP prohibits the recognition of current and deferred income taxes for an intra-entity asset transfer until the asset has been sold to an outside party. This guidance is effective for annual and interim reporting periods of public entities beginning after December 15, 2017, with early adoption permitted as of the beginning of an annual reporting period for which financial statements (interim or annual) have not been issued or made available for issuance. This ASU should be applied using a modified retrospective basis through a cumulative-effect adjustment directly to retained earnings as of the beginning of the period of adoption. The Company is currently evaluating the impact of adopting this guidance on its consolidated financial statements.
In October 2016, the FASB issued ASU No. 2016-17, Consolidation (Topic 810): Interests Held through Related Parties that Are under Common Control ("ASU 2016-17"). ASU 2016-17 amends the consolidation guidance on how a reporting entity that is the single decision maker of a variable interest entity (VIE) should treat indirect interests in the entity held through related parties that are under common control with the reporting entity when determining whether it is the primary beneficiary of that VIE. Under ASU 2016-17, a single decision maker of a VIE is required to consider indirect economic interests in the entity held through related parties on a proportionate basis when determining whether it is the primary beneficiary of that VIE. If a single decision maker and its related party are under common control, the single decision maker is required to consider indirect interests in the entity held through those related parties to be the equivalent of direct interests in their entirety. The amendments are effective for public business entities for fiscal years beginning after December 15, 2016 (the Company's first quarter of fiscal 2017), including interim periods within those fiscal years. Early adoption is permitted. The standard may be applied retrospectively or through a cumulative effect adjustment to retained earnings as of the beginning of the fiscal year of adoption. The Company is currently evaluating the impact of adopting this guidance on its consolidated financial statements.
In November 2016, the FASB issued ASU No. 2016-18, Statement of Cash Flows (Topic 230): Restricted Cash ("ASU 2016-18"). ASU 2016-18 is intended to add and clarify guidance on the classification and presentation of restricted cash on the statement of cash flows. ASU 2016-18 requires that a statement of cash flows explain the change during the period in the total of cash, cash equivalents, and amounts generally described as restricted cash or restricted cash equivalents. Therefore, amounts generally described as restricted cash and restricted cash equivalents should be included with cash and cash equivalents when reconciling the beginning-of-period and end-of-period total amounts shown on the statement of cash flows. The amendments are effective for public business entities for fiscal years beginning after December 15, 2017, and interim periods within those fiscal years. Early adoption is permitted, including adoption in an interim period. The Company is currently evaluating the impact of adopting this guidance on its consolidated financial statements.
83
In January 2017, the FASB issued ASU No. 2017-01, Business Combinations (Topic 805): Clarifying the Definition of a Business ("ASU 2017-01"). ASU 2017-01 clarifies the definition of a business with the objective of adding guidance to assist entities with evaluating whether transactions should be accounted for as acquisitions (or disposals) of assets or businesses. The definition of a business affects many areas of accounting, including acquisitions, disposals, goodwill, and consolidation. ASU 2017-01 is effective for annual periods beginning after December 15, 2017, including interim periods within those periods, and the amendments should be applied prospectively on or after the effective date. The Company is currently evaluating the impact of adopting this guidance on its consolidated financial statements.
In January 2017, the FASB issued ASU No. 2017-03, Accounting Changes and Error Corrections (Topic 250) and Investments - Equity Method and Joint Ventures (Topic 323) ("ASU 2017-03"). ASU 2017-03 offers amendments to SEC paragraphs pursuant to staff announcements at the September 22, 2016 and November 17, 2016 EITF meetings for clarification purposes. The Company is currently evaluating the impact of adopting this guidance on its consolidated financial statements.
In January 2017, the FASB issued ASU No. 2017-04, Intangibles - Goodwill and Other (Topic 350): Simplifying the Test for Goodwill Impairment ("ASU 2017-04"). ASU 2017-04 simplifies the subsequent measurement of goodwill by eliminating Step 2 from the goodwill impairment test. Under the amendments in this update, an entity should perform its annual or interim, goodwill impairment test by comparing the fair value of a reporting unit with its carrying amount. An entity should recognize an impairment charge for the amount by which the carrying amount exceeds the reporting unit's fair value. However, the loss recognized should not exceed the total amount of goodwill allocated to that reporting unit. ASU 2017-04 should be applied on a prospective basis and is effective for annual or any interim goodwill impairment tests in fiscal years beginning after December 15, 2019. Early adoption is permitted for interim or annual goodwill impairment tests performed on testing dates after January 1, 2017. The Company is currently evaluating the impact of adopting this guidance on its consolidated financial statements.
Contingencies
In the ordinary course of business, we may become party to lawsuits, administrative proceedings and governmental investigations, including regulatory and other matters. As of December 31, 2016, management does not believe that any of our outstanding lawsuits, administrative proceedings or investigations could result in a material adverse effect.
Liabilities for loss contingencies arising from claims, assessments, litigation, fines, penalties and other sources are recorded when it is probable that a liability has been incurred and the amount can be reasonably estimated.
For a discussion of the status of current litigation and governmental investigations, see Note 12 “Commitments and Contingencies” in the Company’s audited combined and consolidated financial statements.
Emerging Growth Company Status
We are an “emerging growth company” within the meaning of the federal securities laws. For as long as we are an emerging growth company, we will not be required to comply with certain requirements that are applicable to other public companies that are not “emerging growth companies” including, but not limited to, not being required to comply with the auditor attestation requirements of Section 404 of the Sarbanes-Oxley Act, the reduced disclosure obligations regarding executive compensation in our periodic reports and proxy statements and the exemptions from the requirements of holding a nonbinding advisory vote on executive compensation and shareholder approval of any golden parachute payments not previously approved. In addition, Section 107 of the JOBS Act provides that an emerging growth company can take advantage of the extended transition period provided in Section 7(a)(2)(B) of the Securities Act for complying with new or revised accounting standards, but we have irrevocably opted out of the extended transition period and, as a result, we will adopt new or revised accounting standards on the relevant dates on which adoption of such standards is required for other public companies.
84
We intend to take advantage of these exemptions until we are no longer an emerging growth company. We will cease to be an “emerging growth company” upon the earliest of: (i) the last day of the fiscal year in which we have $1.0 billion or more in annual revenues; (ii) the date on which we become a “large accelerated filer” (the fiscal year-end on which the total market value of our common equity securities held by non-affiliates is $700 million or more as of June 30); (iii) the date on which we issue more than $1.0 billion of non-convertible debt over a three-year period; or (iv) the last day of 2019.
85
ITEM 7A. QUANTITATIVE AND QUALITATIVE DISCLOSURES ABOUT MARKET RISK
Market risks relating to our operations result primarily from changes in commodity prices and interest rates, as well as counterparty credit risk. We employ established policies and procedures to manage our exposure to these risks.
Commodity Price Risk
We hedge and procure our energy requirements from various wholesale energy markets, including both physical and financial markets and through short and long term contracts. Our financial results are largely dependent on the margin we are able to realize between the wholesale purchase price of natural gas and electricity plus related costs and the retail sales price we charge our customers. We actively manage our commodity price risk by entering into various derivative or non-derivative instruments to hedge the variability in future cash flows from fixed-price forecasted sales and purchases of natural gas and electricity in connection with our retail energy operations. These instruments include forwards, futures, swaps, and option contracts traded on various exchanges, such as NYMEX and Intercontinental Exchange, or ICE, as well as over-the-counter markets. These contracts have varying terms and durations, which range from a few days to a few years, depending on the instrument. Our asset optimization group utilizes similar derivative contracts in connection with its trading activities to attempt to generate incremental gross margin by effecting transactions in markets where we have a retail presence. Generally, any of such instruments that are entered into to support our retail electricity and natural gas business are categorized as having been entered into for non-trading purposes, and instruments entered into for any other purpose are categorized as having been entered into for trading purposes. Our net gain (loss) on non-trading derivative instruments, net of cash settlements, was $20.0 million for the year ended December 31, 2016.
We have adopted risk management policies to measure and limit market risk associated with our fixed-price portfolio and our hedging activities. For additional information regarding our commodity price risk and our risk management policies, see “Item 1A—Risk Factors”.
We measure the commodity risk of our non-trading energy derivatives using a sensitivity analysis on our net open position. As of December 31, 2016, our Gas Non-Trading Fixed Price Open Position (hedges net of retail load) was a long position of 532,647 MMBtu. An increase in 10% in the market prices (NYMEX) from their December 31, 2016 levels would have increased the fair market value of our net non-trading energy portfolio by $0.1 million. Likewise, a decrease in 10% in the market prices (NYMEX) from their December 31, 2016 levels would have decreased the fair market value of our non-trading energy derivatives by $0.1 million. As of December 31, 2016, our Electricity Non-Trading Fixed Price Open Position (hedges net of retail load) was a short position of 160,040 MWhs. An increase in 10% in the forward market prices from their December 31, 2016 levels would have decreased the fair market value of our net non-trading energy portfolio by $1.0 million. Likewise, a decrease in 10% in the forward market prices from their December 31, 2016 levels would have increased the fair market value of our non-trading energy derivatives by $1.0 million.
We measure the commodity risk of our trading energy derivatives using a sensitivity analysis on our net open position. As of December 31, 2016, we did not have a Gas Trading Fixed Price Open Position.
Credit Risk
In many of the utility services territories where we conduct business, POR programs have been established, whereby the local regulated utility purchases our receivables, and becomes responsible for billing the customer and collecting payment from the customer. This service results in substantially all of our credit risk being linked to the applicable utility and not to our end-use customer in these territories. Approximately 67%, 56% and 44% of our retail revenues were derived from territories in which substantially all of our credit risk was directly linked to local regulated utility companies as of December 31, 2016, 2015 and 2014, respectively, all of which had investment grade ratings as of such date. During the same period, we paid these local regulated utilities a weighted average discount of approximately 1.3%, 1.4% and 1.0%, respectively, of total revenues for customer credit risk protection. In certain of the POR markets in which we operate, the utilities limit their collections exposure by retaining the ability to transfer a delinquent account back to us for collection when collections are past due for a specified period.
86
If our collection efforts are unsuccessful, we return the account to the local regulated utility for termination of service. Under these service programs, we are exposed to credit risk related to payment for services rendered during the time between when the customer is transferred to us by the local regulated utility and the time we return the customer to the utility for termination of service, which is generally one to two billing periods. We may also realize a loss on fixed-price customers in this scenario due to the fact that we will have already fully hedged the customer's expected commodity usage for the life of the contract.
In non-POR markets (and in POR markets where we may choose to direct bill our customers), we manage customer credit risk through formal credit review in the case of commercial customers, and credit score screening, deposits and disconnection for non-payment, in the case of residential customers. Economic conditions may affect our customers' ability to pay bills in a timely manner, which could increase customer delinquencies and may lead to an increase in bad debt expense. Our bad debt expense for the year ended December 31, 2016, 2015 and 2014 was approximately 0.6%, 5.0% and 5.7% of non-POR market retail revenues, respectively. See “Management's Discussion and Analysis of Financial Condition and Results of Operations—Drivers of our Business—Customer Credit Risk” for an analysis of our bad debt expense related to non-POR markets during 2016.
We are exposed to wholesale counterparty credit risk in our retail and asset optimization activities. We manage this risk at a counterparty level and secure our exposure with collateral or guarantees when needed. At December 31, 2016 and 2015, approximately 96% and 77% of our total exposure of $14.6 million and $4.3 million, respectively, was either with an investment grade customer or otherwise secured with collateral or a guarantee. The credit worthiness of the remaining exposure with other customers was evaluated with no material allowance recorded at December 31, 2016 and 2015.
Interest Rate Risk
We are exposed to fluctuations in interest rates under our variable-price debt obligations. At December 31, 2016, we were co-borrowers under the Senior Credit Facility, under which $51.3 million of variable rate indebtedness was outstanding. Based on the average amount of our variable rate indebtedness outstanding during the year ended December 31, 2016, a 1% percent increase in interest rates would have resulted in additional annual interest expense of approximately $0.5 million. We do not currently employ interest rate hedges, although we may choose to do so in the future.
87
Item 8. Financial Statements and Supplementary Data
ITEM 8. FINANCIAL STATEMENTS | ||
MANAGEMENT'S REPORT ON INTERNAL CONTROL OVER FINANCIAL REPORTING | ||
REPORT OF INDEPENDENT REGISTERED PUBLIC ACCOUNTING FIRM | ||
CONSOLIDATED BALANCE SHEETS AS OF DECEMBER 31, 2016 AND DECEMBER 31, 2015 | ||
COMBINED AND CONSOLIDATED STATEMENTS OF OPERATIONS AND COMPREHENSIVE INCOME (LOSS) FOR THE YEARS ENDED DECEMBER 31, 2016, 2015 AND 2014 | ||
COMBINED AND CONSOLIDATED STATEMENT OF CHANGES IN EQUITY FOR THE YEARS ENDED DECEMBER 31, 2016, 2015 AND 2014 | ||
COMBINED AND CONSOLIDATED STATEMENTS OF CASH FLOWS FOR THE YEARS ENDED DECEMBER 31, 2016, 2015 AND 2014 | ||
NOTES TO THE COMBINED AND CONSOLIDATED FINANCIAL STATEMENTS | ||
88
MANAGEMENT'S REPORT ON INTERNAL CONTROL OVER FINANCIAL REPORTING
It is the responsibility of the management of Spark Energy, Inc. to establish and maintain adequate internal control over financial reporting. Internal control over financial reporting is defined in Rule 13a-15(f) or 15d-15(f) promulgated under the Securities Exchange Act of 1934, as amended, as a process designed by, or under the supervision of, our principal executive and principal financial officers and effected by our board of directors, management, and other personnel, to provide reasonable assurance regarding the reliability of financial reporting and the preparation of financial statements for external purposes in accordance with generally accepted accounting principles and includes those policies and procedures that:
• | Pertain to the maintenance of records that in reasonable detail accurately and fairly reflect our transactions and dispositions of the assets; |
• | Provide reasonable assurance that transactions are recorded as necessary to permit preparation of financial statements in accordance with generally accepted accounting principles, and the receipts and expenditures are being made only in accordance with authorizations of our management and directors; and |
• | Provide reasonable assurance regarding prevention or timely detection of unauthorized acquisition, use, or disposition of our assets that could have a material effect on our financial statements. |
Because of its inherent limitations, internal control over financial reporting may not prevent or detect misstatements. Also, projections of any evaluation of effectiveness to future periods are subject to the risk that controls may become inadequate because of changes in conditions, or that the degree of compliance with the policies or procedures may deteriorate.
Management has assessed the effectiveness of the Company’s internal control over financial reporting as of December 31, 2016, utilizing the criteria in the Committee of Sponsoring Organizations of the Treadway Commission’s Internal Control-Integrated Framework (2013). Based on its assessment, our management concluded the Company’s internal control over financial reporting was effective as of December 31, 2016.
As permitted, the business of Major Energy Services, LLC, Major Energy Electric Services, LLC, and Respond Power, LLC (collectively, the "Major Energy Companies"), which the Company purchased on August 23, 2016, was excluded from the scope of management’s assessment of the effectiveness of our internal control over financial reporting as of December 31, 2016. The business constituted 27.0% of the Company’s total assets as of December 31, 2016 and 23.0% of the Company’s consolidated revenues for the year ended December 31, 2016.
89
REPORT OF INDEPENDENT REGISTERED PUBLIC ACCOUNTING FIRM
The Board of Directors and Stockholders
Spark Energy, Inc.:
We have audited the accompanying consolidated balance sheets of Spark Energy, Inc. and subsidiaries as of December 31, 2016 and 2015, and the related combined and consolidated statements of operations and comprehensive income (loss), changes in equity, and cash flows for each of the years in the three year period ended December 31, 2016. These combined and consolidated financial statements are the responsibility of the Company’s management. Our responsibility is to express an opinion on these combined and consolidated financial statements based on our audits.
We conducted our audits in accordance with the standards of the Public Company Accounting Oversight Board (United States). Those standards require that we plan and perform the audit to obtain reasonable assurance about whether the financial statements are free of material misstatement. An audit includes examining, on a test basis, evidence supporting the amounts and disclosures in the financial statements. An audit also includes assessing the accounting principles used and significant estimates made by management, as well as evaluating the overall financial statement presentation. We believe that our audits provide a reasonable basis for our opinion.
In our opinion, the combined and consolidated financial statements referred to above present fairly, in all material respects, the financial position of Spark Energy, Inc. and subsidiaries as of December 31, 2016 and 2015, and the results of their operations and their cash flows for each of the years in the three‑year period ended December 31, 2016, in conformity with U.S. generally accepted accounting principles.
/s/ KPMG LLP
Houston, Texas
March 2, 2017
90
AUDITED COMBINED AND CONSOLIDATED FINANCIAL STATEMENTS
SPARK ENERGY, INC.
CONSOLIDATED BALANCE SHEETS AS OF DECEMBER 31, 2016 AND DECEMBER 31, 2015 (in thousands)
December 31, 2016 | December 31, 2015 | ||||||
Assets | |||||||
Current assets: | |||||||
Cash and cash equivalents | $ | 18,960 | $ | 4,474 | |||
Accounts receivable, net of allowance for doubtful accounts of $2.3 million and $1.9 million as of December 31, 2016 and 2015, respectively | 112,491 | 59,936 | |||||
Accounts receivable—affiliates | 2,624 | 1,840 | |||||
Inventory | 3,752 | 3,665 | |||||
Fair value of derivative assets | 8,344 | 605 | |||||
Customer acquisition costs, net | 18,834 | 13,389 | |||||
Customer relationships, net | 12,113 | 6,627 | |||||
Prepaid assets (1) | 1,361 | 700 | |||||
Deposits | 7,329 | 7,421 | |||||
Other current assets | 12,175 | 4,023 | |||||
Total current assets | 197,983 | 102,680 | |||||
Property and equipment, net | 4,706 | 4,476 | |||||
Fair value of derivative assets | 3,083 | — | |||||
Customer acquisition costs, net | 6,134 | 3,808 | |||||
Customer relationships, net | 21,410 | 6,802 | |||||
Deferred tax assets | 55,047 | 23,380 | |||||
Goodwill | 79,147 | 18,379 | |||||
Other assets | 8,658 | 2,709 | |||||
Total Assets | $ | 376,168 | $ | 162,234 | |||
Liabilities and Stockholders' Equity | |||||||
Current liabilities: | |||||||
Accounts payable | $ | 52,309 | $ | 29,732 | |||
Accounts payable—affiliates | 3,775 | 1,962 | |||||
Accrued liabilities | 36,619 | 12,245 | |||||
Fair value of derivative liabilities | 680 | 10,620 | |||||
Current portion of Senior Credit Facility | 51,287 | 27,806 | |||||
Current contingent consideration for acquisitions | 11,827 | 500 | |||||
Current portion of note payable | 15,501 | — | |||||
Convertible subordinated notes to affiliates | 6,582 | — | |||||
Other current liabilities | 5,476 | 1,323 | |||||
Total current liabilities | 184,056 | 84,188 | |||||
Long-term liabilities: | |||||||
Fair value of derivative liabilities | 68 | 618 | |||||
Payable pursuant to tax receivable agreement—affiliates | 49,886 | 20,713 | |||||
Long-term portion of Senior Credit Facility | — | 14,592 | |||||
Subordinated debt—affiliate | 5,000 | — | |||||
Deferred tax liability | 938 | 853 | |||||
Convertible subordinated notes to affiliates | — | 6,339 | |||||
Contingent consideration for acquisitions | 10,826 | — | |||||
Other long-term liabilities | 1,658 | 1,612 | |||||
Total liabilities | 252,432 | 128,915 | |||||
Commitments and contingencies (Note 12) | |||||||
Stockholders' equity: | |||||||
Common Stock: | |||||||
Class A common stock, par value $0.01 per share, 120,000,000 shares authorized, 6,496,559 issued and outstanding at December 31, 2016 and 3,118,623 issued and outstanding at December 31, 2015 | 65 | 31 | |||||
Class B common stock, par value $0.01 per share, 60,000,000 shares authorized, 10,224,742 and 10,750,000 issued and outstanding at December 31, 2016 and 2015 | 103 | 108 | |||||
Preferred Stock: | |||||||
Preferred stock, par value $0.01 per share, 20,000,000 shares authorized, zero issued and outstanding at December 31, 2016 and 2015 | — | — | |||||
Additional paid-in capital | 25,413 | 12,565 | |||||
Accumulated other comprehensive loss | 11 | — | |||||
Retained earnings (deficit) | 4,711 | (1,366 | ) | ||||
Total stockholders' equity | 30,303 | 11,338 | |||||
Non-controlling interest in Spark HoldCo, LLC | 93,433 | 21,981 | |||||
Total equity | 123,736 | 33,319 | |||||
Total Liabilities and Stockholders' Equity | $ | 376,168 | $ | 162,234 | |||
91
(1) Prepaid assets includes prepaid assets—affiliates of $0 and $210 as of December 31, 2016 and 2015, respectively. See Note 13 “Transactions with
Affiliates" for further discussion.
(2) See Note 4 "Equity" for disclosure of our variable interest entity in Spark HoldCo, LLC.
The accompanying notes are an integral part of the combined and consolidated financial statements.
92
SPARK ENERGY, INC.
COMBINED AND CONSOLIDATED STATEMENTS OF OPERATIONS AND COMPREHENSIVE INCOME (LOSS) FOR THE YEARS ENDED DECEMBER 31, 2016, 2015 and 2014
(in thousands, except per share data)
Year Ended December 31, | |||||||||||
2016 (1) | 2015 (2) | 2014 | |||||||||
Revenues: | |||||||||||
Retail revenues (3) | $ | 547,283 | $ | 356,659 | $ | 320,558 | |||||
Net asset optimization (expense)/revenues (4) | (586 | ) | 1,494 | 2,318 | |||||||
Total Revenues | 546,697 | 358,153 | 322,876 | ||||||||
Operating Expenses: | |||||||||||
Retail cost of revenues (5) | 344,944 | 241,188 | 258,616 | ||||||||
General and administrative (6) | 84,964 | 61,682 | 45,880 | ||||||||
Depreciation and amortization | 32,788 | 25,378 | 22,221 | ||||||||
Total Operating Expenses | 462,696 | 328,248 | 326,717 | ||||||||
Operating income (loss) | 84,001 | 29,905 | (3,841 | ) | |||||||
Other (expense)/income: | |||||||||||
Interest expense | (8,859 | ) | (2,280 | ) | (1,578 | ) | |||||
Interest and other income | 957 | 324 | 263 | ||||||||
Total other expenses | (7,902 | ) | (1,956 | ) | (1,315 | ) | |||||
Income (loss) before income tax expense | 76,099 | 27,949 | (5,156 | ) | |||||||
Income tax expense (benefit) | 10,426 | 1,974 | (891 | ) | |||||||
Net income (loss) | 65,673 | 25,975 | (4,265 | ) | |||||||
Less: Net income (loss) attributable to non-controlling interests | 51,229 | 22,110 | (4,211 | ) | |||||||
Net income (loss) attributable to Spark Energy, Inc. stockholders | $ | 14,444 | $ | 3,865 | $ | (54 | ) | ||||
Other comprehensive income (loss): | |||||||||||
Currency translation gain | 41 | — | — | ||||||||
Other comprehensive income | 41 | — | — | ||||||||
Comprehensive income (loss) | $ | 65,714 | $ | 25,975 | $ | (4,265 | ) | ||||
Less: Comprehensive income attributable to non-controlling interests | 51,259 | 22,110 | (4,211 | ) | |||||||
Comprehensive income attributable to Spark Energy, Inc. stockholders | 14,455 | 3,865 | (54 | ) | |||||||
Net income (loss) attributable to Spark Energy, Inc. per common share | |||||||||||
Basic | $ | 2.53 | $ | 1.26 | $ | (0.02 | ) | ||||
Diluted | $ | 2.23 | $ | 1.06 | $ | (0.02 | ) | ||||
Weighted average commons shares outstanding | |||||||||||
Basic | 5,701 | 3,064 | 3,000 | ||||||||
Diluted | 6,345 | 3,327 | 3,000 | ||||||||
(1) Financial information has been recast to include results attributable to the acquisition of Major Energy Companies by an affiliate on April 15, 2016. See Notes 2 and 3 "Basis of Presentation and Summary of Significant Accounting Policies" and "Acquisitions," respectively, for further discussion.
(2) Financial information has been recast to include results attributable to the acquisition of Oasis Power Holdings LLC from an affiliate on May 12, 2015. See Notes 2 and 3 "Basis of Presentation and Summary of Significant Accounting Policies" and "Acquisitions", respectively, for further discussion.
(3) | Retail revenues includes retail revenues—affiliates of $0, $0 and $2,170 for the years ended December 31, 2016, 2015 and 2014, respectively. |
(4) | Net asset optimization revenues includes asset optimization (expense)/revenues—affiliates of $154, $1,101 and $12,842 for the years ended December 31, 2016, 2015 and 2014, respectively, and asset optimization revenues—affiliates cost of revenues of $1,633, $11,285 and $30,910 for the years ended December 31, 2016, 2015 and 2014, respectively. |
(5) | Retail cost of revenues includes retail cost of revenues—affiliates of $9, $17 and $13 for the years December 31, 2016, 2015 and 2014, respectively. |
(6) General and administrative includes general and administrative expense—affiliates of $15,700, $0 and less than $100 for the years ended December 31, 2016, 2015 and 2014, respectively.
The accompanying notes are an integral part of the combined and consolidated financial statements.
93
SPARK ENERGY, INC.
COMBINED AND CONSOLIDATED STATEMENT OF CHANGES IN EQUITY
FOR THE YEARS ENDED DECEMBER 31, 2016, 2015 and 2014
(in thousands)
Member's Equity | Issued Shares of Class A Common Stock | Issued Shares of Class B Common Stock | Issued Shares of Preferred Stock | Class A Common Stock | Class B Common Stock | Accumulated Other Comprehensive Income | Additional Paid-In Capital | Retained Earnings (Deficit) | Total Stockholders' Equity | Non-controlling Interest | Total Equity | ||||||||||||||||||||||
Balance at 12/31/2013: | $ | 35,913 | — | — | — | $ | — | $ | — | $ | — | $ | — | $ | — | $ | — | $ | — | $ | 35,913 | ||||||||||||
Capital contributions from member and liabilities retained by affiliate | 54,201 | — | — | — | — | — | — | — | — | — | — | 54,201 | |||||||||||||||||||||
Distributions to member | (61,607 | ) | — | — | — | — | — | — | — | — | — | — | (61,607 | ) | |||||||||||||||||||
Net loss prior to the IPO | (21 | ) | — | — | — | — | — | — | — | — | — | — | (21 | ) | |||||||||||||||||||
Balance prior to Corporate Reorganization and the IPO: | 28,486 | — | — | — | — | — | — | — | — | — | — | 28,486 | |||||||||||||||||||||
Reorganization Transaction: | |||||||||||||||||||||||||||||||||
Issuance of Class B common stock | (28,486 | ) | — | 10,750 | — | — | 108 | — | 28,378 | — | 28,486 | — | — | ||||||||||||||||||||
IPO Transactions: | |||||||||||||||||||||||||||||||||
IPO costs paid | — | — | — | — | — | — | — | (2,667 | ) | — | (2,667 | ) | — | (2,667 | ) | ||||||||||||||||||
Issuance of Class A Common Stock, net of underwriters discount | — | 3,000 | — | — | 30 | — | — | 50,190 | — | 50,220 | — | 50,220 | |||||||||||||||||||||
Distribution of IPO proceeds and payment of note payable to affiliate | — | — | — | — | — | — | — | (47,604 | ) | — | (47,604 | ) | — | (47,604 | ) | ||||||||||||||||||
Initial allocation of non-controlling interest of Spark Energy, Inc. effective on date of IPO | — | — | — | — | — | — | — | (22,232 | ) | — | (22,232 | ) | 22,232 | — | |||||||||||||||||||
Tax benefit from tax receivable agreement | — | — | — | — | — | — | — | 23,636 | — | 23,636 | — | 23,636 | |||||||||||||||||||||
Liability due to tax receivable agreement | — | — | — | — | — | — | — | (20,915 | ) | — | (20,915 | ) | — | (20,915 | ) | ||||||||||||||||||
Balance at inception of public company (8/1/2014): | $ | — | 3,000 | 10,750 | — | $ | 30 | $ | 108 | $ | — | $ | 8,786 | $ | — | $ | 8,924 | $ | 22,232 | $ | 31,156 | ||||||||||||
Stock based compensation | — | — | — | — | — | — | — | 510 | — | 510 | — | 510 | |||||||||||||||||||||
Consolidated net loss subsequent to the IPO | — | — | — | — | — | — | — | — | (54 | ) | (54 | ) | (4,190 | ) | (4,244 | ) | |||||||||||||||||
Distributions paid to Class B non-controlling unit holders | — | — | — | — | — | — | — | — | — | — | (2,584 | ) | (2,584 | ) | |||||||||||||||||||
Dividends paid to Class A common shareholders | — | — | — | — | — | — | — | — | (721 | ) | (721 | ) | — | (721 | ) | ||||||||||||||||||
Balance at 12/31/2014: | $ | — | 3,000 | 10,750 | — | $ | 30 | $ | 108 | $ | — | $ | 9,296 | $ | (775 | ) | $ | 8,659 | $ | 15,458 | $ | 24,117 | |||||||||||
Stock based compensation | — | — | — | — | — | — | — | 2,165 | — | 2,165 | — | 2,165 | |||||||||||||||||||||
94
Restricted stock unit vesting | — | 119 | — | — | 1 | — | — | 186 | — | 187 | — | 187 | |||||||||||||||||||||
Contribution from NuDevco | — | — | — | — | — | — | — | 129 | — | 129 | — | 129 | |||||||||||||||||||||
Consolidated net income | — | — | — | — | — | — | — | — | 3,865 | 3,865 | 22,110 | 25,975 | |||||||||||||||||||||
Beneficial conversion feature | — | — | — | — | — | — | — | 789 | — | 789 | — | 789 | |||||||||||||||||||||
Distributions paid to Class B non-controlling unit holders | — | — | — | — | — | — | — | — | — | — | (15,587 | ) | (15,587 | ) | |||||||||||||||||||
Dividends paid to Class A common shareholders | — | — | — | — | — | — | — | — | (4,456 | ) | (4,456 | ) | — | (4,456 | ) | ||||||||||||||||||
Balance at 12/31/2015: | $ | — | 3,119 | 10,750 | — | $ | 31 | $ | 108 | $ | — | $ | 12,565 | $ | (1,366 | ) | $ | 11,338 | $ | 21,981 | $ | 33,319 | |||||||||||
Stock based compensation | — | — | — | — | — | — | 2,270 | — | 2,270 | — | 2,270 | ||||||||||||||||||||||
Restricted stock unit vesting | — | 153 | — | — | 2 | — | — | 1,060 | — | 1,062 | — | 1,062 | |||||||||||||||||||||
Excess tax benefit related to restricted stock vesting | — | — | — | — | — | — | — | 186 | — | 186 | — | 186 | |||||||||||||||||||||
Consolidated net income (1) | — | — | — | — | — | — | — | — | 14,444 | 14,444 | 51,229 | 65,673 | |||||||||||||||||||||
Foreign currency translation adjustment for equity method investee | — | — | — | — | — | — | 11 | — | — | 11 | 30 | 41 | |||||||||||||||||||||
Beneficial conversion feature | — | — | — | — | — | — | — | 243 | — | 243 | — | 243 | |||||||||||||||||||||
Distributions paid to non-controlling unit holders | — | — | — | — | — | — | — | — | — | — | (34,931 | ) | (34,931 | ) | |||||||||||||||||||
Net contribution of the Major Energy Companies | — | — | — | — | — | — | — | — | — | — | 3,873 | 3,873 | |||||||||||||||||||||
Dividends paid to Class A common stockholders | — | — | — | — | — | — | — | — | (8,367 | ) | (8,367 | ) | — | (8,367 | ) | ||||||||||||||||||
Proceeds from disgorgement of stockholder short-swing profits | — | — | — | — | — | — | — | 1,605 | — | 1,605 | — | 1,605 | |||||||||||||||||||||
Tax impact from tax receivable agreement upon exchange of units of Spark HoldCo, LLC to shares of Class A Common Stock | — | — | — | — | — | — | — | 4,768 | — | 4,768 | — | 4,768 | |||||||||||||||||||||
Exchange of shares of Class B common stock to shares of Class A common stock | 3,225 | (3,225 | ) | — | 32 | (32 | ) | — | 2,716 | — | 2,716 | (2,716 | ) | — | |||||||||||||||||||
Issuance of Class B Common Stock | — | — | 2,700 | — | — | 27 | — | — | — | 27 | 53,967 | 53,994 | |||||||||||||||||||||
Balance at 12/31/2016: | $ | — | 6,497 | 10,225 | — | $ | 65 | $ | 103 | $ | 11 | $ | 25,413 | $ | 4,711 | $ | 30,303 | $ | 93,433 | $ | 123,736 | ||||||||||||
(1) Financial information has been recast to include results attributable to the acquisition of Major Energy Companies by an affiliate on April 15, 2016. See Notes 2 and 3 "Basis of Presentation and Summary of Significant Accounting Policies" and "Acquisitions," respectively, for further discussion.
The accompanying notes are an integral part of the combined and consolidated financial statements.
95
SPARK ENERGY, INC.
COMBINED AND CONSOLIDATED STATEMENTS OF CASH FLOWS
FOR THE YEARS ENDED DECEMBER 31, 2016, 2015 AND 2014
(in thousands)
Year Ended December 31, | |||||||||||
2016 (1) | 2015 (2) | 2014 | |||||||||
Cash flows from operating activities: | |||||||||||
Net income (loss) | $ | 65,673 | $ | 25,975 | $ | (4,265 | ) | ||||
Adjustments to reconcile net income (loss) to net cash flows provided by operating activities: | |||||||||||
Depreciation and amortization expense | 48,526 | 25,378 | 22,221 | ||||||||
Deferred income taxes | 3,382 | 1,340 | (1,064 | ) | |||||||
Stock based compensation | 5,242 | 3,181 | 858 | ||||||||
Amortization and write off of deferred financing costs | 668 | 412 | 631 | ||||||||
Change in fair value of earnout liabilities | (297 | ) | — | — | |||||||
Accretion on fair value of Major Earnout and Provider Earnout liabilities | 5,059 | — | — | ||||||||
Bad debt expense | 1,261 | 7,908 | 10,164 | ||||||||
(Gain) loss on derivatives, net | (22,407 | ) | 18,497 | 14,535 | |||||||
Current period cash settlements on derivatives, net | (24,427 | ) | (23,948 | ) | 3,479 | ||||||
Other | (407 | ) | (1,320 | ) | — | ||||||
Changes in assets and liabilities: | |||||||||||
Decrease (increase) in restricted cash | — | 707 | (707 | ) | |||||||
(Increase) decrease in accounts receivable | (12,088 | ) | 7,876 | (11,283 | ) | ||||||
(Increase) in accounts receivable—affiliates | (118 | ) | (608 | ) | 5,563 | ||||||
Decrease (increase) in inventory | 542 | 4,544 | (3,711 | ) | |||||||
Increase in customer acquisition costs | (21,907 | ) | (19,869 | ) | (26,191 | ) | |||||
Decrease (increase) in prepaid and other current assets | 71 | 10,845 | (6,905 | ) | |||||||
Decrease (increase) in other assets | 1,321 | (1,101 | ) | (90 | ) | ||||||
Increase in customer relationships and trademarks | — | (2,776 | ) | (1,545 | ) | ||||||
Increase (decrease) in accounts payable and accrued liabilities | 14,831 | (13,307 | ) | 1,449 | |||||||
Increase in accounts payable—affiliates | 458 | 944 | 1,017 | ||||||||
Increase (decrease) in other current liabilities | 2,364 | (645 | ) | 1,867 | |||||||
Decrease in other non-current liabilities | 46 | 1,898 | (149 | ) | |||||||
Net cash provided by operating activities | 67,793 | 45,931 | 5,874 | ||||||||
Cash flows from investing activities: | |||||||||||
Acquisitions of CenStar and Oasis | — | (39,847 | ) | — | |||||||
Acquisition of Major Energy Companies and Provider Companies net assets | (31,641 | ) | — | — | |||||||
Payment of CenStar Earnout | (1,343 | ) | — | — | |||||||
Purchases of property and equipment | (2,258 | ) | (1,766 | ) | (3,040 | ) | |||||
Contribution to equity method investment in eRex Spark | (1,102 | ) | (330 | ) | — | ||||||
Net cash used in investing activities | (36,344 | ) | (41,943 | ) | (3,040 | ) | |||||
Cash flows from financing activities: | |||||||||||
Borrowings on notes payable | 79,048 | 59,224 | 78,500 | ||||||||
Payments on notes payable | (66,652 | ) | (49,826 | ) | (44,000 | ) | |||||
Issuance of convertible subordinated notes to affiliate | — | 7,075 | — | ||||||||
Restricted stock vesting | (1,183 | ) | (432 | ) | — | ||||||
Contributions from NuDevco | — | 129 | — | ||||||||
Deferred financing costs | — | — | (402 | ) | |||||||
Member contribution (distributions), net | — | — | (36,406 | ) | |||||||
Proceeds from issuance of Class A common stock | — | — | 50,220 | ||||||||
Proceeds from issuance of Class B common stock | 13,995 | — | — | ||||||||
Proceeds from disgorgement of stockholders short-swing profits | 941 | — | — | ||||||||
Excess tax benefit related to restricted stock vesting | 185 | — | — | ||||||||
Distributions of proceeds from IPO to affiliate | — | — | (47,554 | ) | |||||||
Payment of note payable to NuDevco | — | — | (50 | ) | |||||||
IPO costs | — | — | (2,667 | ) | |||||||
Payment of distributions to Class B non-controlling unit holders | (34,930 | ) | (15,587 | ) | (2,584 | ) | |||||
Payment of dividends to Class A common shareholders | (8,367 | ) | (4,456 | ) | (721 | ) | |||||
Net cash used in financing activities | (16,963 | ) | (3,873 | ) | (5,664 | ) | |||||
Increase (decrease) in cash and cash equivalents | 14,486 | 115 | (2,830 | ) | |||||||
Cash and cash equivalents—beginning of period | 4,474 | 4,359 | 7,189 | ||||||||
Cash and cash equivalents—end of period | $ | 18,960 | $ | 4,474 | $ | 4,359 | |||||
Supplemental Disclosure of Cash Flow Information: | |||||||||||
Non-cash items: | |||||||||||
Issuance of Class B common stock to affiliates for Major Energy Companies acquisition | $ | 40,000 | $ | — | $ | — | |||||
Contingent consideration - earnout obligations incurred in connection with the Provider Companies and Major Energy Companies acquisitions | $ | 18,936 | $ | — | $ | — | |||||
Assumption of legal liability in connection with the Major Energy Companies acquisition | $ | 5,000 | $ | — | $ | — | |||||
96
Net contribution of the Major Energy Companies | $ | 3,873 | $ | — | $ | — | |||||
Installment consideration incurred in connection with the Provider Companies acquisition | $ | 1,890 | $ | — | $ | — | |||||
Issuance of Class B common stock | $ | — | $ | — | $ | 28,486 | |||||
Liabilities retained by affiliate | $ | — | $ | — | $ | 29,000 | |||||
Tax benefit from tax receivable agreement | $ | 31,490 | $ | (64 | ) | $ | 23,636 | ||||
Liability due to tax receivable agreement | $ | (26,722 | ) | $ | (55 | ) | $ | 20,767 | |||
Initial allocation of non-controlling interest | $ | — | $ | — | $ | 22,232 | |||||
Property and equipment purchase accrual | $ | (32 | ) | $ | 45 | $ | 19 | ||||
CenStar Earnout accrual | $ | — | $ | 500 | $ | — | |||||
Cash paid during the period for: | |||||||||||
Interest | $ | 2,280 | $ | 1,661 | $ | 860 | |||||
Taxes | $ | 7,326 | $ | 216 | $ | 85 | |||||
(1) Financial information has been recast to include results attributable to the acquisition of the Major Energy Companies from an affiliate on
August 23, 2016. See Notes 2 and 3 "Basis of Presentation and Summary of Significant Accounting Policies" and "Acquisitions," respectively, for further discussion.
(2) Financial information has been recast to include results attributable to the acquisition of Oasis Power Holdings LLC by an affiliate on
May 12, 2015. See Notes 2 "Basis of Presentation and Summary of Significant Accounting Policies" for further discussion.
The accompanying notes are an integral part of the combined and consolidated financial statements.
97
SPARK ENERGY, INC.
NOTES TO COMBINED AND CONSOLIDATED FINANCIAL STATEMENTS
1. Formation and Organization
Organization
Spark Energy, Inc. ("Spark Energy," the “Company,” "we," or "us") is an independent retail energy services company that provides residential and commercial customers in competitive markets across the United States with an alternative choice for natural gas and electricity. The Company is a holding company whose sole material asset consists of units in Spark HoldCo, LLC (“Spark HoldCo”). Spark HoldCo owns all of the outstanding membership interests in each of Spark Energy, LLC (“SE”), Spark Energy Gas, LLC (“SEG”), Oasis Power Holdings, LLC ("Oasis"), CenStar Energy Corp. ("CenStar"), Electricity Maine, LLC, Electricity N.H., LLC and Provider Power Mass, LLC (collectively, the "Provider Companies"); and Major Energy Services, LLC, Major Energy Electric Services, LLC, and Respond Power, LLC (collectively, the "Major Energy Companies"), the operating subsidiaries through which the Company operates. The Company is the sole managing member of Spark HoldCo, is responsible for all operational, management and administrative decisions relating to Spark HoldCo’s business and consolidates the financial results of Spark HoldCo and its subsidiaries.
The Company is a Delaware corporation formed on April 22, 2014 by Spark Energy Ventures, LLC (“Spark Energy Ventures”) for the purpose of succeeding to Spark Energy Ventures’ ownership in SE and SEG. Spark Energy Ventures, a single member limited liability company formed on October 8, 2007 under the Texas Limited Liability Company Act (“TLLCA”), is an affiliate of NuDevco Retail Holdings, LLC (“NuDevco Retail Holdings”), a single member Texas limited liability company formed by Spark Energy Ventures on May 19, 2014 under the Texas Business Organizations Code (“TBOC”). NuDevco Retail Holdings was formed by Spark Energy Ventures to hold its investment in Spark HoldCo, LLC, our subsidiary and the direct parent of SEG and SE. Retailco, LLC (“Retailco”) succeeded to the interest of NuDevco Retail Holdings in 10,612,500 shares of our Class B common stock and an equal number of Spark HoldCo units pursuant to a series of transfers that occurred in January 2016. NuDevco Retail Holdings is currently a direct wholly owned subsidiary of Electric Holdco, LLC, which is indirectly wholly owned by W. Keith Maxwell III ("Founder"). NuDevco Retail Holdings formed NuDevco Retail, LLC (“NuDevco Retail” and, together with NuDevco Retail Holdings (or its successor in interest), “NuDevco”), a single member limited liability company, on May 29, 2014 and it holds a 1% interest in Spark HoldCo formerly held by NuDevco Retail Holdings (or its predecessor-in-interest).
Prior to the closing of the Company’s initial public offering ("IPO") on August 1, 2014 of 3,000,000 shares of Class A common stock, par value $0.01 per share (the “Class A common stock”), representing a 21.82% interest in the Company, Spark Energy Ventures contributed all of its interest in each of SE and SEG to NuDevco Retail Holdings. NuDevco Retail Holdings in turn contributed all of its interest in each of SE and SEG to Spark HoldCo. The contribution of the interests in SE and SEG to Spark HoldCo is not considered a business combination accounted for under the purchase method, as it was a transfer of assets and operations under common control, and accordingly, balances were transferred at their historical cost. The Company’s historical combined financial statements prior to the IPO are prepared using SE’s and SEG’s historical basis in the assets and liabilities, and include all revenues, costs, assets and liabilities attributed to the retail natural gas and asset optimization and retail electricity businesses of SE and SEG.
SE is a licensed retail electric provider in multiple states. SE provides retail electricity services to end-use retail customers, ranging from residential and small commercial customers to large commercial and industrial users. SE was formed on February 5, 2002 under the Texas Revised Limited Partnership Act (as recodified by the TBOC) and was converted to a Texas limited liability company on May 21, 2014.
SEG is a retail natural gas provider and asset optimization business competitively serving residential, commercial and industrial customers in multiple states. SEG was formed on January 17, 2001 under the Texas Revised Limited Partnership Act (as recodified by the TBOC) and was converted to a Texas limited liability company on May 21, 2014.
98
Oasis, through its operating subsidiary, Oasis Power LLC, is a retail energy provider formed on August 28, 2009 as a limited liability company under the TBOC. We acquired Oasis on July 31, 2015 from an affiliate. See Note 3 “Acquisitions” for further discussion.
CenStar is a retail energy provider incorporated on July 18, 2008 under the New York Business Corporation Law. We acquired CenStar on July 8, 2015. See Note 3 “Acquisitions” for further discussion.
The Provider Companies operate as retail energy providers. Electricity Maine, LLC, Electricity N.H., LLC, and Provider Power Mass, LLC were formed on June 17, 2010, January 20, 2012 and August 22, 2012, respectively, as limited liability companies under the Maine Limited Liability Company Act. We acquired the Provider Companies on August 1, 2016.
The Major Energy Companies operate as retail energy providers. Major Energy Services, LLC, Major Energy Electric Services, LLC and Respond Power, LLC were formed on October 11, 2005, September 12, 2007 and July 11, 2008, respectively, as limited liability companies under the New York Limited Liability Company Law. We completed the purchase of all the outstanding membership interests of the Major Energy Companies on August 23, 2016 from an affiliate, as described in Note 3 "Acquisitions."
We are a Delaware corporation formed on April 22, 2014 for the purpose facilitating an initial public offering ("IPO") of our Class A common stock, par value $0.01 per share ("Class A common stock"), and to become the sole managing member of, and to hold an ownership interest in, Spark HoldCo. In connection with our IPO, NuDevco Retail Holdings LLC ("NuDevco Retail Holdings") formed NuDevco Retail, LLC (“NuDevco Retail”), a single member limited liability company, on May 29, 2014, to hold the remaining Spark HoldCo units and shares of our Class B common stock, par value $0.01 per share ("Class B common stock"). In January 2016, Retailco, LLC ("Retailco") succeeded to the interest of NuDevco Retail Holdings of its Class B common stock and an equal number of Spark HoldCo units it held pursuant to a series of transfers. See Note 4 “Equity” for further discussion.
Relationship with our Founder and Majority Shareholder
W. Keith Maxwell, III (our "Founder") is the owner of a majority in voting power of our common stock through his ownership of NuDevco Retail and Retailco. Retailco is a wholly owned subsidiary of TxEx Energy Investments, LLC ("TxEx"), which is wholly owned by Mr. Maxwell. NuDevco Retail is a wholly owned subsidiary of NuDevco Retail Holdings, which is a wholly owned subsidiary of Electric HoldCo, LLC, which is also a wholly owned subsidiary of TxEx.
We entered into a Master Service Agreement effective January 1, 2016 with Retailco Services, LLC, which is wholly owned by W. Keith Maxwell III. See Note 13 “Transactions with Affiliates” for further discussion.
Emerging Growth Company Status
As a company with less than $1.0 billion in revenues during its last fiscal year, the Company qualifies as an “emerging growth company” as defined in the Jumpstart Our Business Startups Act of 2012, or the JOBS Act. An emerging growth company may take advantage of specified reduced reporting and other regulatory requirements.
The Company will remain an “emerging growth company” until as late as the last day of the Company's 2019 fiscal year, or until the earliest of (i) the last day of the fiscal year in which the Company has $1.0 billion or more in annual revenues; (ii) the date on which the Company becomes a “large accelerated filer” (the fiscal year-end on which the total market value of the Company’s common equity securities held by non-affiliates is $700 million or more as of June 30); (iii) the date on which the Company issues more than $1.0 billion of non-convertible debt over a three-year period.
As a result of the Company's election to avail itself of certain provisions of the JOBS Act, the information that the Company provides may be different than what you may receive from other public companies in which you hold an equity interest.
99
Initial Public Offering of Spark Energy, Inc.
On August 1, 2014, the Company completed the IPO of 3,000,000 shares of its Class A common stock for $18.00 per share, representing a 21.82% voting interest in the Company.
Net proceeds from the IPO were $47.6 million, after underwriting discounts and commissions, structuring fees and offering expenses. The net proceeds from the IPO were used to acquire units of Spark HoldCo (the “Spark HoldCo units”) representing approximately 21.82% of the outstanding Spark HoldCo units after the IPO from NuDevco Retail Holdings and to repay a promissory note from the Company in the principal amount of $50,000 (the “NuDevco Note”). The Company did not retain any of the net proceeds from the IPO. The Company recorded $2.7 million of previously deferred incremental costs directly attributable to the IPO as a reduction in equity at the IPO date, which were funded by the IPO proceeds.
The Company also issued 10,750,000 shares of Class B common stock, par value 0.01 per share (the “Class B common stock”) to Spark HoldCo, 10,612,500 of which Spark HoldCo distributed to NuDevco Retail Holdings, and 137,500 of which Spark HoldCo distributed to NuDevco Retail.
At the consummation of the IPO, the Company's outstanding common stock is summarized in the table below:
Shares of | ||||||
common stock | ||||||
Number | Percent Voting Interest | |||||
Publicly held Class A common stock | 3,000,000 | 21.82 | % | |||
Class B common stock held by NuDevco | 10,750,000 | 78.18 | % | |||
Total | 13,750,000 | 100.00 | % | |||
Senior Credit Facility
Concurrently with the closing of the IPO, the Company entered into the Senior Credit Facility, which was amended and restated on July 8, 2015, June 1, 2016 and August 1, 2016, respectively. Refer to Note 7 "Debt" for further discussion.
Exchange and Registration Rights
The Spark HoldCo Limited Liability Company Agreement provides that anytime the Company issues a new share of Class A or Class B common stock (except for issuances of Class A common stock upon an exchange of Class B common stock), Spark HoldCo will concurrently issue a limited liability company unit either to the holder of the Class B common stock or to the Company in the case of the issuance of shares of Class A common stock. As a result, the number of Spark HoldCo units held by the Company always equals the number of shares of Class A common stock outstanding.
Each share of Class B common stock, all of which are held by NuDevco Retail and Retailco, has no economic rights but entitles the holder to one vote on all matters to be voted on by stockholders generally. Holders of Class A common stock and Class B common stock vote together as a single class on all matters presented to our stockholders for their vote or approval, except as otherwise required by applicable law or by our certificate of incorporation.
NuDevco Retail and Retailco have the right to exchange (the “Exchange Right”) all or a portion of their Spark HoldCo units (together with a corresponding number of shares of Class B common stock) for Class A common stock (or cash at Spark Energy, Inc.’s or Spark HoldCo’s election (the “Cash Option”)) at an exchange ratio of one share of Class A common stock for each Spark HoldCo unit (and corresponding share of Class B common stock) exchanged. In addition, NuDevco Retail and Retailco have the right, under certain circumstances, to cause the
100
Company to register the offer and resale of NuDevco Retail's and Retailco's shares of Class A common stock obtained pursuant to the Exchange Right. Retail Acquisition Co., LLC ("RAC") is entitled to similar registration rights under the CenStar and Oasis Note. Refer to Note 7 "Debt" for further information.
Tax Receivable Agreement
Concurrently with the closing of the IPO, the Company entered into a Tax Receivable Agreement with Spark HoldCo, NuDevco Retail Holdings and NuDevco Retail. Retailco, LLC became a party to this agreement in connection with the transfer by NuDevco Retail Holdings of its 10,612,500 shares of our Class B common stock and a corresponding number of Spark HoldCo units to Retailco, LLC in January 2016. See Note 13 “Transactions with Affiliates” for further discussion.
This agreement generally provides for the payment by the Company to Retailco, LLC (as successor to NuDevco Retail Holdings) and NuDevco Retail of 85% of the net cash savings, if any, in U.S. federal, state and local income tax or franchise tax that the Company actually realizes (or is deemed to realize in certain circumstances) in future periods as a result of (i) any tax basis increases resulting from the purchase by the Company of Spark HoldCo units from NuDevco Retail Holdings, (ii) any tax basis increases resulting from the exchange of Spark HoldCo units for shares of Class A common stock pursuant to the Exchange Right (or resulting from an exchange of Spark HoldCo units for cash pursuant to the Cash Option) and (iii) any imputed interest deemed to be paid by the Company as a result of, and additional tax basis arising from, any payments the Company makes under the Tax Receivable Agreement. The Company retains the benefit of the remaining 15% of these tax savings. See Note 11 “Income Taxes” for further discussion.
In certain circumstances, the Company may defer or partially defer any payment due (a “TRA Payment”) to the holders of rights under the Tax Receivable Agreement, which are currently Retailco and NuDevco Retail. During the five-year period ending September 30, 2019, the Company will defer all or a portion of any TRA Payment owed pursuant to the Tax Receivable Agreement to the extent that Spark HoldCo does not generate sufficient Cash Available for Distribution (as defined below) during the four-quarter period ending September 30th of the applicable year in which the TRA Payment is to be made in an amount that equals or exceeds 130% (the “TRA Coverage Ratio”) of the Total Distributions (as defined below) paid in such four-quarter period by Spark HoldCo. For purposes of computing the TRA Coverage Ratio:
• | “Cash Available for Distribution” is generally defined as the Adjusted EBITDA of Spark HoldCo for the applicable period, less (i) cash interest paid by Spark HoldCo, (ii) capital expenditures of Spark HoldCo (exclusive of customer acquisition costs) and (iii) any taxes payable by Spark HoldCo; and |
• | “Total Distributions” are defined as the aggregate distributions necessary to cause the Company to receive distributions of cash equal to (i) the targeted quarterly distribution the Company intends to pay to holders of its Class A common stock payable during the applicable four-quarter period, plus (ii) the estimated taxes payable by the Company during such four-quarter period, plus (iii) the expected TRA Payment payable during the calendar year for which the TRA Coverage Ratio is being tested. |
In the event that the TRA Coverage Ratio is not satisfied in any calendar year, the Company will defer all or a portion of the TRA Payment to NuDevco Retail or Retailco under the Tax Receivable Agreement to the extent necessary to permit Spark HoldCo to satisfy the TRA Coverage Ratio (and Spark HoldCo is not required to make and will not make the pro rata distributions to its members with respect to the deferred portion of the TRA Payment). If the TRA Coverage Ratio is satisfied in any calendar year, the Company is obligated to pay NuDevco Retail or Retailco the full amount of the TRA Payment.
Following the five-year deferral period ending September 30, 2019, the Company will be obligated to pay any outstanding deferred TRA Payments to the extent such deferred TRA Payments do not exceed (i) the lesser of the Company's proportionate share of aggregate Cash Available for Distribution of Spark HoldCo during the five-year deferral period or the cash distributions actually received by the Company during the five-year deferral period, reduced by (ii) the sum of (a) the aggregate target quarterly dividends (which, for the purposes of the Tax Receivable Agreement, will be $0.3625 per share per quarter) during the five-year deferral period, (b) the
101
Company's estimated taxes during the five-year deferral period, and (c) all prior TRA Payments and (y) if with respect to the quarterly period during which the deferred TRA Payment is otherwise paid or payable, Spark HoldCo has or reasonably determines it will have amounts necessary to cause the Company to receive distributions of cash equal to the target quarterly distribution payable during that quarterly period. Any portion of the deferred TRA Payments not payable due to these limitations will no longer be payable.
We met the threshold coverage ratio required to fund the first TRA Payment to Retailco and NuDevco Retail under the Tax Receivable Agreement during the four-quarter period ending December 31, 2016, resulting in an initial TRA Payment of $1.4 million in December 2016. On November 6, 2016, Retailco and NuDevco Retail granted the Company the right to defer the TRA Payment until May 2018. During the period of time when the Company has elected to defer the TRA Payment, the outstanding payment amount will accrue interest at a rate calculated in the manner provided for under the Tax Receivable Agreement. The liability has been classified as non-current in our consolidated balance sheet at December 31, 2016.
Other Transactions in Connection with the Consummation of the IPO
In connection with the IPO the following restructuring transactions occurred:
• | SEG and SE were converted from limited partnerships into limited liability companies; |
• | SEG, SE and an affiliate entered into an interborrower agreement, pursuant to which such affiliate agreed to be solely responsible for $29.0 million of the outstanding indebtedness. SE and SEG repaid their outstanding indebtedness of $10.0 million and borrowed $10.0 million under the Company's Senior Credit Facility, |
• | NuDevco Retail Holdings contributed all of its interests in SEG and SE to Spark HoldCo in exchange for all of the outstanding units of Spark HoldCo and transferred 1% of those Spark HoldCo units to NuDevco Retail; |
• | NuDevco Retail Holdings transferred Spark HoldCo units to the Company for the $50,000 NuDevco Note and the limited liability company agreement of Spark HoldCo was amended and restated to admit the Company as its sole managing member. |
Following the IPO, the Company purchased 2,997,222 Spark HoldCo units from NuDevco Retail Holdings and repaid the NuDevco Note. The 2,997,222 Spark HoldCo units we purchased with the proceeds from the IPO, together with the 2,778 Spark HoldCo units we purchased in exchange for the NuDevco Note prior to the IPO, represent a 21.82% ownership interest in Spark HoldCo. After giving effect to these transactions and the IPO, the Company owned an approximate 21.82% interest in Spark HoldCo. NuDevco Retail Holdings owned an approximate 77.18% interest in Spark HoldCo and 10,612,500 shares of Class B common stock, and NuDevco Retail owns a 1% interest in Spark HoldCo and 137,500 shares of Class B common stock.
Each share of Class B common stock, all of which is held by NuDevco, has no economic rights but entitles its holder to one vote on all matters to be voted on by shareholders generally. Holders of Class A common stock and Class B common stock vote together as a single class on all matters presented to our shareholders for their vote or approval, except as otherwise required by applicable law or by our certificate of incorporation.
2. Basis of Presentation and Summary of Significant Accounting Policies
The accompanying combined and consolidated financial statements have been prepared in accordance with accounting principles generally accepted in the United States of America (“GAAP”) and pursuant to the rules and regulations of the Securities and Exchange Commission (“SEC”). The Company's consolidated financial statements include the accounts of all wholly-owned and controlled subsidiaries. We account for investments over which we have significant influence but not a controlling financial interest using the equity method of accounting. All significant intercompany transactions and balances have been eliminated in the combined and consolidated financial statements.
102
The accompanying combined and consolidated financial statements have been prepared in accordance with Regulation S-X, Article 3, General Instructions as to Financial Statements and Staff Accounting Bulletin (“SAB”) Topic 1-B, Allocations of Expenses and Related Disclosures in Financial Statements of Subsidiaries, Divisions or Lesser Business Components of Another Entity on a stand-alone basis and are derived from SE’s and SEG’s historical basis in the assets and liabilities before the IPO and Spark Energy Inc.’s financial results after the IPO, and include all revenues, costs, assets and liabilities attributable to the retail natural gas and asset optimization and retail electricity businesses of SE and SEG for the periods prior to the IPO that are specifically identifiable or have been allocated to the Company. Management has made certain assumptions and estimates in order to allocate a reasonable share of expenses to the Company, such that the Company’s combined and consolidated financial statements reflect substantially all of its costs of doing business.
Transactions with Affiliates
The Company enters into transactions with and pays certain costs on behalf of affiliates that are commonly controlled by W. Keith Maxwell III, and these affiliates enter into transactions with and pay certain costs on our behalf, in order to reduce risk, reduce administrative expense, create economies of scale, create strategic alliances and supply goods and services among these related parties.
These transactions include, but are not limited to, certain services to the affiliated companies associated with the Company’s debt facility prior to the IPO, employee benefits provided through the Company’s benefit plans, insurance plans, leased office space, administrative salaries for management due diligence work, recurring management consulting, and accounting, tax, legal, or technology services based on services provided, departmental usage, or headcount, which are considered reasonable by management. As such, the accompanying combined and consolidated financial statements include costs that have been incurred by the Company and then directly billed or allocated to affiliates, and costs that have been incurred by our affiliates and then directly billed or allocated to us, and are recorded net in general and administrative expense on the combined and consolidated statements of operations with a corresponding accounts receivable—affiliates or accounts payable—affiliates, respectively, recorded in the consolidated balance sheets. Additionally, the Company enters into transactions with certain affiliates for sales or purchases of natural gas and electricity, which are recorded in retail revenues, retail cost of revenues, and net asset optimization revenues in the combined and consolidated statements of operations with a corresponding accounts receivable—affiliate or accounts payable—affiliate in the combined and consolidated balance sheets. The allocations and related estimates and assumptions are described more fully in Note 13 “Transactions with Affiliates.”
These costs are not necessarily indicative of the cost that the Company would have incurred had it operated as an independent stand-alone entity prior to the IPO. Affiliates also relied upon Spark Energy Ventures as a participant in the credit facility for periods prior to the IPO as described more fully in Note 7 “Debt.” As such, the Company’s combined and consolidated financial statements do not fully reflect what the Company’s financial position, results of operations and cash flows would have been had the Company operated as an independent stand-alone company prior to the IPO. As a result, historical financial information prior to the IPO is not necessarily indicative of what the Company’s results of operations, financial position and cash flows will be in the future. The Company’s combined and consolidated financial statements are presented on a consolidated basis and include all wholly-owned and controlled subsidiaries.
Cash and Cash Equivalents
Cash and cash equivalents consist of all unrestricted demand deposits and funds invested in highly liquid instruments with original maturities of three months or less. The Company periodically assesses the financial condition of the institutions where these funds are held and believes that its credit risk is minimal with respect to these institutions.
Accounts Receivable
103
Trade accounts receivable are recorded at the invoiced amount and do not bear interest. Accounts receivable in the combined and consolidated balance sheets are net of allowance for doubtful accounts of $2.3 million and $1.9 million as of December 31, 2016 and 2015, respectively.
The Company accrues an allowance for doubtful accounts based upon estimated uncollectible accounts receivable considering historical collections, accounts receivable aging analysis, credit risk and other factors. The Company writes off accounts receivable balances against the allowance for doubtful accounts when the accounts receivable is deemed to be uncollectible. Bad debt expense of $1.3 million, $7.9 million and $10.2 million was recorded in general and administrative expense in the combined and consolidated statements of operations for the years ended December 31, 2016, 2015 and 2014, respectively.
The Company conducts business in many utility service markets where the local regulated utility purchases our receivables, and then becomes responsible for billing the customer and collecting payment from the customer (“POR programs”). This POR service results in substantially all of the Company’s credit risk being linked to the applicable utility, which generally has an investment-grade rating, and not to the end-use customer. The Company monitors the financial condition of each utility and currently believes that its susceptibility to an individually significant write-off as a result of concentrations of customer accounts receivable with those utilities is remote. Trade accounts receivable that are part of a local regulated utility’s POR program are recorded on a gross basis in accounts receivable in the combined and consolidated balance sheets. The discount paid to the local regulated utilities is recorded in general and administrative expense in the combined and consolidated statements of operations.
In markets that do not offer POR services or when the Company chooses to directly bill its customers, certain receivables are billed and collected by the Company. The Company bears the credit risk on these accounts and records an appropriate allowance for doubtful accounts to reflect any losses due to non-payment by customers. The Company’s customers are individually insignificant and geographically dispersed in these markets. The Company writes off customer balances when it believes that amounts are no longer collectible and when it has exhausted all means to collect these receivables.
Inventory
Inventory consists of natural gas used to fulfill and manage seasonality for fixed and variable-price retail customer load requirements and is valued at the lower of weighted average cost or market. Purchased natural gas costs are recognized in the combined and consolidated statements of operations, within retail cost of revenues, when the natural gas is sold and delivered out of the storage facility. There were no inventory impairments recorded for the years ended December 31, 2016, 2015 and 2014. When natural gas is sold costs are recognized in the combined and consolidated statements of operations, within retail cost of revenues, at the weighted average cost value at the time of the sale.
Customer Acquisition Costs
The Company has retail natural gas and electricity customer acquisition costs, net of $18.8 million and $13.4 million recorded in current assets and $6.1 million and $3.8 million recorded in noncurrent assets representing direct response advertising costs as of December 31, 2016 and 2015, respectively. Customer acquisition costs are spending for organic customer acquisitions and do not include customer acquisitions through merger and acquisition activities, which are recorded as customer relationships. Amortization of customer acquisition costs, recorded in depreciation and amortization in the combined and consolidated statements of operations, was $17.5 million, $18.0 million and $18.5 million for the years ended December 31, 2016, 2015 and 2014, respectively. Capitalized direct response advertising costs consist primarily of hourly and commission based telemarketing costs, door-to-door agent commissions and other direct advertising costs associated with proven customer generation, and are capitalized and amortized over the estimated two-year average life of a customer in accordance with the provisions of FASB ASC 340-20, Capitalized Advertising Costs.
104
Recoverability of customer acquisition costs is evaluated based on a comparison of the carrying amount of the customer acquisition costs to the future net cash flows expected to be generated by the customers acquired, considering specific assumptions for customer attrition, per unit gross profit, and operating costs. These assumptions are based on forecasts and historical experience.
Based on the analysis described above, for the year ended December 31, 2014, the Company recorded accelerated amortization of such costs of $6.5 million associated with capitalized customer acquisition costs in California and $0.2 million associated with capitalized customer acquisition costs in Massachusetts. This accelerated amortization expense was included in “depreciation and amortization” on the combined and consolidated statement of operations. There were no such accelerated amortization charges recorded for the years ended December 31, 2016 or 2015.
Customer Relationships
Customer acquisitions through direct acquisitions of customer contracts or recorded as part of the acquisition method in accordance with FASB ASC Topic 805, Business Combinations ("ASC 805") are recorded as customer relationships and represent customer contract acquisitions not acquired through the direct response advertising discussed above at “Customer Acquisition Costs.” The Company has recorded $12.1 million and $6.6 million, net of amortization, as current assets as of December 31, 2016 and 2015, respectively, and $21.4 million and $6.8 million, net of amortization, as non-current assets as of December 31, 2016 and 2015, respectively, related to these intangible assets. These intangibles are amortized on a straight-line basis over the estimated average life of the related customer contracts acquired, which ranges from three years to six years.
The acquired customer relationships intangibles related to Oasis, CenStar, Major Energy Companies and the Provider Companies, are reflective of the acquired companies’ customer base, and were valued at the respective dates of acquisition using an excess earnings method under the income approach. Using this method, the Company estimated the future cash flows resulting from the existing customer relationships, considering attrition as well as charges for contributory assets, such as net working capital, fixed assets, and assembled workforce. These future cash flows were then discounted using an appropriate risk-adjusted rate of return by retail unit to arrive at the present value of the expected future cash flows. CenStar and Oasis customer relationships are amortized to depreciation and amortization based on the expected future net cash flows by year. The acquired customer relationship intangibles related to Major Energy Companies and Provider Companies were bifurcated between hedged and unhedged and amortized to depreciation and amortization based on the expected future cash flows by year and expensed to retail cost of revenue based on the expected term of the underlying fixed price contract in each reporting period, respectively.
Amortization expense was $28.6 million and $5.7 million for the years ended December 31, 2016 and 2015, respectively. Approximately $15.8 million of the $28.6 million customer relationships amortization expense for the twelve months ending December 31, 2016 was included in retail cost of revenue. We recorded less than $0.1 million amortization expense for the year ended December 31, 2014.
We review customer relationships for impairment whenever events or changes in business circumstances indicate the carrying value of the intangible assets may not be recoverable. Impairment is indicated when the undiscounted cash flows estimated to be generated by the intangible assets are less than their respective carrying value. If an impairment exists, a loss would be recognized for the difference between the fair value and carrying value of the intangible assets.
No impairments of customer relationships were recorded for the years ended December 31, 2016, 2015 and 2014.
Non-compete agreements
The non-compete agreements provide the Company with a certain level of assurance that acquired companies' expected earnings streams will not be disrupted by competition from the companies’ previous members. The fair values of non-compete agreements are determined using the differential valuation approach at acquisition date. Under this approach, the Company estimates the present value of expected future cash flows under two scenarios;
105
one scenario assumes the non-compete agreements are in place and the other scenario assumes the absence of non-compete agreements. The resulting difference between the two scenarios is the implied value of the non-compete agreements, which is further adjusted by an estimated probability factor representing the likelihood that previous members of acquired companies would be successful competitors.
As a result of the Provider Companies and Major Energy Companies acquisitions, the Company has recorded $1.2 million, net of amortization, as Acquired customer intangibles - current and $1.4 million, net of amortization, as Acquired customer intangibles - non-current as of December 31, 2016 related to these non-compete agreements. These non-compete agreements are amortized over their estimated three-year life on a straight-line basis. Amortization expense was $0.9 million for the year ended December 31, 2016. We recorded no amortization expense for the year ended December 31, 2015.
Trademarks
Trademarks recorded as part of the acquisition method in accordance with ASC 805 represent the value associated with the recognition and positive reputation of an acquired company to its target markets. This value would otherwise have to be internally developed through significant time and expense or by paying a third party for its use. The fair values of trademark assets were determined at the date of acquisition using a royalty savings method under the income approach. Under this approach, the Company estimates the present value of expected cash flows resulting from avoiding royalty payments to use a third party trademark. The Company analyzes market royalty rates charged for licensing trademarks and applied an expected royalty rate to a forecast of estimated revenue, which was then discounted using an appropriate risk adjusted rate of return.
The Company has recorded $6.3 million and $1.2 million, net of amortization, as other assets as of December 31, 2016 and 2015 related to these trademarks. These intangibles are amortized over the estimated five-year to twenty-year life of the trademarks on a straight-line basis. Amortization expense was $0.4 million and $0.1 million for the years ended December 31, 2016 and 2015. We recorded no amortization expense for the year ended December 31, 2014.
We review trademarks for impairment whenever events or changes in business circumstances indicate the carrying value of the intangible assets may not be recoverable. Impairment is indicated when the undiscounted cash flows estimated to be generated by the intangible assets are less than their respective carrying value. If an impairment exists, a loss would be recognized for the difference between the fair value and carrying value of the intangible assets.
No impairments of trademarks were recorded for the years ended December 31, 2016, 2015 and 2014.
Deferred Financing Costs
Costs incurred in connection with the issuance of long-term debt are capitalized and amortized to interest expense using the straight-line method over the life of the related long-term debt due to the variable nature of the Company’s long-term debt.
Property and Equipment
The Company records property and equipment at historical cost. Depreciation expense is recorded on a straight-line method based on estimated useful lives. When assets are placed into service, management makes estimates with respect to useful lives and salvage values of the assets.
When items of property and equipment are sold or otherwise disposed of, any gain or loss is recorded in the combined and consolidated statements of operations.
The Company capitalizes costs associated with internal-use software projects in accordance with FASB ASC Topic 350-40, Internal-Use Software. Capitalized costs are the costs incurred during the application development stage of
106
the internal-use software project such as software configuration, coding, installation of hardware and testing. Costs incurred during the preliminary or post-implementation stage of the internal-use software project are expensed in the period incurred. These types of costs include formulation of ideas and alternatives, training and application maintenance. After internal-use software projects are completed, the associated capitalized costs are depreciated over the estimated useful life of the related asset. Interest costs incurred while developing internal-use software projects are capitalized in accordance with FASB ASC Topic 835-20, Capitalization of Interest. Capitalized interest costs for the years ended December 31, 2016, 2015 and 2014 were not material.
Goodwill
Goodwill represents the excess of cost over fair value of the assets of businesses acquired in accordance with FASB ASC Topic 350 Intangibles-Goodwill and Other ("ASC 350"). The goodwill on our consolidated balance sheet as of December 31, 2016 is associated with both our Retail Natural Gas and Retail Electricity reporting units. We determine our reporting units by identifying each unit that engaged in business activities from which it may earn revenues and incur expenses, had operating results regularly reviewed by the segment manager for purposes of resource allocation and performance assessment, and had discrete financial information.
Goodwill is assessed for impairment whenever events or circumstances indicate that impairment of the carrying value of goodwill is likely, but no less often than annually as of October 31, 2016. On October 31, 2016, we performed a qualitative assessment of goodwill in accordance with guidance from ASC 350, which permits an entity to first assess qualitative factors to determine whether it is more likely than not that the fair value of a reporting unit is less than its carrying amount as a basis for determining whether it is necessary to perform the two-step goodwill impairment test. If we fail the qualitative test, then we must compare our estimate of the fair value of a reporting unit with its carrying value, including goodwill. If the carrying value of the reporting unit exceeds its fair value, we perform the second step of the goodwill impairment test to measure the amount of goodwill impairment loss to be recorded, as necessary. The second step compares the implied fair value of the reporting unit’s goodwill to the carrying value, if any, of that goodwill. We determine the implied fair value of the goodwill in the same manner as determining the amount of goodwill to be recognized in a business combination.
We completed our annual assessment of goodwill impairment as of October 31, 2016 during the fourth quarter of 2016, and the test indicated no impairment.
Equity Method Investment
The Company accounts for investments in unconsolidated entities using the equity method of accounting, as prescribed in FASB ASC Topic 323-10, Investments-Equity Method and Joint Venture, if the investment gives us the ability to exercise significant influence over, but not control, of an investee. Significant influence generally exists if we have an ownership interest representing between 20% and 50% of the voting stock of the investee. Under the equity method of accounting, investments are stated at initial cost and are adjusted for subsequent additional investments and our proportionate share of earnings or losses and distributions. Such investment is presented on the consolidated balance sheet under "Other assets" and our share of their income as "Interest and other income" on the combined and consolidated statements of operations. The Company determines its equity investment earnings using the Hypothetical Liquidation at Book Value (HLBV) method. Under the HLBV method, a calculation is prepared at each balance sheet date to determine the amount the Company would receive if the investee were to liquidate all of its assets, as valued in accordance with U.S. GAAP, and distribute that cash to the investors. The difference between the calculated liquidation distribution amounts at the beginning and the end of the reporting period, after adjusting for capital contributions and distributions, is the Company's share of the earnings or losses from the equity investment for the period. See Note 16 “Equity Method Investment” for further discussion.
Segment Reporting
107
The FASB ASC Topic 280, Segment Reporting, established standards for entities to report information about the operating segments and geographic areas in which they operate. The Company operates two segments, retail natural gas and retail electricity, and all of its operations are located in the United States.
Revenues and Cost of Revenues
The Company’s revenues are derived primarily from the sale of natural gas and electricity to retail customers. The Company also records revenue from sales of natural gas and electricity to wholesale counterparties, including affiliates. Revenues are recognized by the Company using the following criteria: (1) persuasive evidence of an exchange arrangement exists, (2) delivery has occurred or services have been rendered, (3) the buyer’s price is fixed or determinable and (4) collection is reasonably assured. Utilizing these criteria, revenue is recognized when the natural gas or electricity is delivered. Similarly, cost of revenues is recognized when the commodity is delivered.
Revenues for natural gas and electricity sales are recognized upon delivery under the accrual method. Natural gas and electricity sales that have been delivered but not billed by period end are estimated. Accrued unbilled revenues are based on estimates of customer usage since the date of the last meter read provided by the utility. Volume estimates are based on forecasted volumes and estimated customer usage by class. Unbilled revenues are calculated by multiplying these volume estimates by the applicable rate by customer class. Estimated amounts are adjusted when actual usage is known and billed.
The Company records gross receipts taxes on a gross basis in retail revenues and retail cost of revenues. During the years ended December 31, 2016, 2015 and 2014, the Company’s retail revenues and retail cost of revenues included gross receipts taxes of $5.3 million, $3.0 million and $3.0 million, respectively.
Costs for natural gas and electricity sales are recognized as the commodity is delivered to the customer under the accrual method. Natural gas and electricity costs that have not been billed to the Company by suppliers but have been incurred by period end are estimated. The Company estimates volumes for natural gas and electricity delivered based on the forecasted revenue volumes, estimated transportation cost volumes and estimation of other costs associated with retail load that varies by commodity utility territory. These costs include items like ISO fees, ancillary services and renewable energy credits. Estimated amounts are adjusted when actual usage is known and billed.
The Company’s asset optimization activities, which primarily include natural gas physical arbitrage and other short term storage and transportation opportunities, meet the definition of trading activities and are recorded on a net basis in the combined and consolidated statements of operations in net asset optimization revenues pursuant to FASB ASC Topic 815, Derivatives and Hedging. The Company recorded asset optimization revenues, primarily related to physical sales or purchases of commodities, of $133.0 million, $154.1 million and $284.6 million for the years ended December 31, 2016, 2015 and 2014, respectively, and recorded asset optimization costs of revenues of $133.6 million, $152.6 million and $282.3 million for the years ended December 31, 2016, 2015 and 2014, respectively, which are presented on a net basis in asset optimization revenues.
Natural Gas Imbalances
The combined and consolidated balance sheets include natural gas imbalance receivables and payables, which primarily results when customers consume more or less gas than has been delivered by the Company to local distribution companies (“LDCs”). The settlement of natural gas imbalances varies by LDC, but typically the natural gas imbalances are settled in cash or in kind on a monthly, quarterly, semi-annual or annual basis. The imbalances are valued at an estimated net realizable value. The Company recorded an imbalance receivable of $0.9 million and $0.7 million recorded in other current assets on the consolidated balance sheets as of December 31, 2016 and 2015, respectively. The Company recorded an imbalance payable of $0.1 million and $0.3 million recorded in other current liabilities on the combined and consolidated balance sheets as of December 31, 2016 and 2015, respectively.
Fair Value
108
FASB ASC Topic 820, Fair Value Measurement, established a single authoritative definition of fair value, set out a framework for measuring fair value, and requires disclosures about fair value measurements. The standard clarifies that fair value is an exit price, representing the amount that would be received to sell an asset or paid to transfer a liability in an orderly transaction between market participants. The standard utilizes a fair value hierarchy that prioritizes the inputs to the valuation techniques used to measure fair value into three broad levels based on quoted prices in active market, observable market prices, and unobservable market prices.
When the Company is required to measure fair value, and there is not a quoted or observable market price for a similar asset or liability, the Company utilizes the cost, income, or market valuation approach depending on the quality of information available to support management’s assumptions.
Derivative Instruments
The Company uses derivative instruments such as futures, swaps, forwards and options to manage the commodity price risks of its business operations.
All derivatives, other than those for which an exception applies, are recorded in the consolidated balance sheets at fair value. Derivative instruments representing unrealized gains are reported as derivative assets while derivative instruments representing unrealized losses are reported as derivative liabilities. The Company has elected to offset amounts in the consolidated balance sheets for derivative instruments executed with the same counterparty under a master netting arrangement. One of the exceptions to fair value accounting, normal purchases and normal sales, has been elected by the Company for certain derivative instruments when the contract satisfies certain criteria, including a requirement that physical delivery of the underlying commodity is probable and is expected to be used in normal course of business. Retail revenues and retail cost of revenues resulting from deliveries of commodities under normal purchase contracts and normal sales contracts are included in earnings at the time of contract settlement.
To manage commodity price risk, the Company holds certain derivative instruments that are not held for trading purposes and are not designated as hedges for accounting purposes. However, to the extent the Company does not hold offsetting positions for such derivatives, they believe these instruments represent economic hedges that mitigate their exposure to fluctuations in commodity prices. As part of the Company’s strategy to optimize its assets and manage related commodity risks, it also manages a portfolio of commodity derivative instruments held for trading purposes. The Company uses established policies and procedures to manage the risks associated with price fluctuations in these energy commodities and uses derivative instruments to reduce risk by generally creating offsetting market positions.
Changes in the fair value of and amounts realized upon settlement of derivative instruments not held for trading purposes are recognized currently in retail costs of revenues.
Changes in the fair value of and amounts realized upon settlement of derivative instruments held for trading purposes are recognized currently in earnings in net asset optimization revenues.
Income Taxes
The Company recognizes the amount of taxes payable or refundable for the year. In addition, the Company follows the asset and liability method of accounting for income taxes where deferred tax assets and liabilities are recognized for the expected future tax consequences of events that have been recognized in the financial statements or tax returns and operating loss carryforwards. Deferred tax assets and liabilities are measured using enacted tax rates expected to apply to taxable income in those years in which those temporary differences are expected to be recovered or settled. The effect on deferred tax assets and liabilities of a change in the tax rates is recognized in income in the period that includes the enactment date. A valuation allowance is provided for deferred tax assets if it is more likely than not that these items will not be realized.
109
In assessing the realizability of deferred tax assets, management considers whether it is more likely than not that some portion or all of the deferred tax assets will not be realized. The ultimate realization of deferred tax assets is dependent upon the generation of future taxable income during the periods in which those temporary differences become deductible. Management considers the projected future taxable income and tax planning strategies in making this assessment. Based upon the level of historical taxable income and projections for future taxable income over the periods in which the deferred tax assets are deductible, management believes it is more likely than not that we will realize the benefits of these deductible differences.
The Company recognizes interest and penalties related to unrecognized tax benefits within the provision for income taxes on continuing operations in our consolidated statements of operations.
Earnings per Share
Basic earnings per share (“EPS”) is computed by dividing net income attributable to shareholders (the numerator) by the weighted-average number of Class A common shares outstanding for the period (the denominator). Class B common shares are not included in the calculation of basic earnings per share because they are not participating securities and have no economic interest in the Company. Diluted earnings per share is similarly calculated except that the denominator is increased (1) using the treasury stock method to determine the potential dilutive effect of the Company’s outstanding unvested restricted stock units, (2) using the if-converted method to determine the potential dilutive effect of the Company’s Class B common stock and (3) using the if-converted method to determine the potential dilutive effect of the outstanding convertible subordinated notes into the Company's Class B common stock.
Non-controlling Interest
As a result of the IPO, the Company acquired a 21.82% economic interest in Spark HoldCo, and is the sole managing member in Spark HoldCo, with NuDevco retaining a 78.18% economic interest in Spark HoldCo at the IPO date. As a result, the Company has consolidated the financial position and results of operations of Spark HoldCo and reflected the economic interest retained by NuDevco as a non-controlling interest.
Subsequent to the IPO through December 31, 2016, the Company and NuDevco owned the following economic interests in Spark HoldCo:
The Company | NuDevco Retail and Retailco (1) | |
From the IPO to December 31, 2014 | 21.82% | 78.18% |
On December 31, 2015 | 22.49% | 77.51% |
On December 31, 2016 | 38.85% | 61.15% |
(1) In January 2016, Retailco succeeded to the interest of NuDevco Retail Holdings of its Class B common stock and in equal number of Spark HoldCo units it held pursuant to a series of transfers. | ||
See Note 4 "Equity" for further detail.
Net income attributable to non-controlling interest for the years ended December 31, 2016 and 2015 represents the net income attributable to NuDevco prior to the IPO and NuDevco’s retained interest subsequent to the IPO. The weighted average ownership percentages for the applicable reporting period are used to allocate income (loss) before income taxes to the non-controlling interest and the Company, which is then adjusted by the amount of income tax expense (benefit) attributable to each economic interest owner.
Commitments and Contingencies
110
The Company enters into various firm purchase and sale commitments for natural gas, storage, transportation, and electricity that do not meet the definition of a derivative instrument or for which the Company has elected the normal purchase or normal sales exception. Management does not anticipate that such commitments will result in any significant gains or losses based on current market conditions.
Liabilities for loss contingencies arising from claims, assessments, litigation, fines, penalties and other sources are recorded when it is probable that a liability has been incurred and the amount can be reasonably estimated. Legal costs incurred in connection with loss contingencies are expensed as incurred.
Use of Estimates and Assumptions
The preparation of the Company’s combined and consolidated financial statements requires estimates and assumptions that affect the reported amounts of assets and liabilities and disclosure of contingent assets and liabilities at the date of the combined financial statements and the reported amounts of revenues and expenses during the period. Actual results could materially differ from those estimates. Significant items subject to such estimates by the Company’s management include estimates for unbilled revenues and related cost of revenues, provisions for uncollectible receivables, valuation of customer acquisition costs, estimated useful lives of property and equipment, valuation of derivatives and reserves for contingencies.
Subsequent Events
Subsequent events have been evaluated through the date these financial statements are issued. Any material subsequent events that occurred prior to such date have been properly recognized or disclosed in the combined and consolidated financial statements. See Note 17 “Subsequent Events” for further discussion.
Reclassifications
Certain amounts in the prior period financial statements have been reclassified to conform to the current period presentation. These reclassifications had no effect on reported earnings.
Recent Accounting Pronouncements
Adopted Standards
In August 2014, the FASB issued ASU No. 2014-15, Presentation of Financial Statements - Going Concern (Subtopic 205-40): Disclosure of Uncertainties about an Entity’s Ability to Continue as a Going Concern (“ASU 2014-15”). The new guidance clarifies management’s responsibility to evaluate whether there is substantial doubt about an entity’s ability to continue as a going concern and to provide related footnote disclosure. ASU 2014-15 is effective for annual periods ending after December 15, 2016 and for annual periods and interim periods thereafter. Early adoption is permitted. The Company adopted ASU 2014-15 effective January 1, 2016, and the adoption of this standard did not have a material impact on the Company's consolidated financial statements.
In November 2014, the FASB issued ASU No. 2014-16, Derivatives and Hedging ("ASU 2014-16"), which clarifies how current GAAP should be interpreted in evaluating the economic characteristics and risks of a host contract in a hybrid financial instrument that is issued in the form of a share. The amendments in this Update are effective for public business entities for fiscal years, and interim periods within those fiscal years, beginning after December 15, 2015. Early adoption, including adoption in an interim period, is permitted. The Update does not change the current criteria in GAAP for determining when separation of certain embedded derivative features in a hybrid financial instrument is required. The Company adopted ASU 2014-16 effective January 1, 2016, and the adoption of this standard did not have a material impact on the Company's consolidated financial statements.
In February 2015, the FASB issued ASU No. 2015-02, Consolidation (Topic 810) ("ASU 2015-02"). ASU 2015-02 changed the analysis that a reporting entity must perform to determine whether it should consolidate certain types of legal entities. On January 1, 2016, we adopted ASU No. 2015-02. Upon adoption, we continued to consolidate
111
Spark HoldCo, but considered Spark HoldCo to be a variable interest entity requiring additional disclosures in the footnotes of our consolidated financial statements.
In August 2015, the FASB issued ASU No. 2015-15, Interest - Imputation of Interest (Subtopic 835-30): Presentation and Subsequent Measurement of Debt Issuance Costs Associated with Line-of-Credit Arrangements ("ASU 2015-15"). The amendment in ASU 2015-15 clarifies the presentation and subsequent measurement of debt issuance costs associated with lines of credit. The debt issuance cost associated with line-of-credit may be presented as an asset and amortized ratably over the term of the line of credit arrangement, regardless of whether there are outstanding borrowings on the arrangement. ASU 2015-15 is effective for fiscal years, and for interim periods within those fiscal years, beginning after December 15, 2015. Early adoption is permitted for financial statements that have not been previously issued. The Company adopted ASU 2015-15 effective January 1, 2016 in conjunction with ASU 2015-03. The adoption of this standard did not have a material impact on the Company's consolidated financial statements.
In September 2015, the FASB issued ASU No. 2015-16, Business Combinations (Topic 805): Simplifying the Accounting for Measurement-Period Adjustments ("ASU 2015-16"). ASU 2015-16 eliminates the requirement that the acquirer in a business combination account for measurement period adjustments retrospectively. Instead, the acquirer will recognize adjustments to provisional amounts identified within the measurement period in the reporting period in which those adjustments are determined. ASU 2015-16 is effective for fiscal years, and for interim periods within those fiscal years, beginning after December 15, 2015. The guidance is to be applied prospectively for adjustments to provisional amounts that occur after the effective date. Early adoption is permitted for financial statements that have not been issued. The Company adopted ASU 2015-16 effective January 1, 2016, and the adoption of this standard did not have a material impact on the Company's consolidated financial statements.
In November 2015, the FASB issued ASU No. 2015-17, Income Taxes (Topic 740): Balance Sheet Classification of Deferred Taxes ("ASU 2015-17") that is intended to simplify the presentation of deferred taxes by requiring that all deferred taxes be classified as noncurrent and presented as a single noncurrent amount for each tax-payment component of an entity. The ASU 2015-17 is effective for fiscal years beginning after December 15, 2016; however, the Company elected early adoption on January 1, 2016, on a retrospective basis. The adoption of ASU 2015-17 resulted in the reclassification of previously-classified net current deferred taxes of approximately $0.9 million from other current liabilities, resulting in a $23.4 million noncurrent deferred tax asset and a $0.9 million noncurrent deferred tax liability on the Company’s consolidated balance sheet at December 31, 2015. There was no impact to our consolidated statements of operations for the year ended December 31, 2016.
Standards Being Evaluated/Standards Not Yet Adopted
In February 2016, the FASB issued ASU No. 2016-02, Leases (Topic 842) ("ASU 2016-02"). ASU 2016-02 amends existing accounting standard for lease accounting by requiring entities to include substantially all leases on the balance sheet by requiring the recognition of right-of-use assets and lease liabilities for all leases. Entities may elect to not recognize leases with a maximum possible term of less than 12 months. For lessees, a lease is classified as finance or operating and the asset and liability are initially measured at the present value of the lease payments. For lessors, accounting for leases is largely unchanged from previous guidance. ASU 2016-02 also requires qualitative disclosures along with certain specific quantitative disclosures for both lessees and lessors. The amendments in this ASU are effective for fiscal years beginning after December 15, 2018, with early adoption permitted, and is effective for interim periods in the year of adoption. The ASU should be applied using a modified retrospective approach, which requires lessees and lessors to recognize and measure leases at the beginning of the earliest period presented. The Company is currently evaluating the impact of adopting this guidance on its consolidated financial statements.
In June 2016, the FASB issued ASU No. 2016-13, Financial Instruments - Credit Losses (Topic 326): Measurement of Credit Losses on Financial Instruments ("ASU 2016-13"). ASU 2016-13 requires entities to use a current expected credit loss ("CECL") model, which is a new impairment model based on expected losses rather than
112
incurred losses. The model requires financial assets measured at amortized cost be presented at the net amount expected to be collected. The allowance for credit losses is a valuation account that is deducted from the amortized cost basis. The income statement reflects the measurement of credit losses for newly recognized financial assets, as well as the expected credit losses during the period. The measurement of expected losses is based upon historical experience, current conditions, and reasonable and supportable forecasts that affect the collectability of the reported amount. This guidance is effective for interim and annual reporting periods beginning after December 15, 2019, with early adoption permitted for annual reporting periods beginning after December 15, 2018. The Company is currently evaluating the impact of adopting this guidance on its consolidated financial statements.
In August 2016, the FASB issued ASU No. 2016-15, Statement of Cash Flows (Topic 230), Classification of Certain Cash Receipts and Cash Payments ("ASU 2016-15"). ASU 2016-15 provides guidance on the presentation and classification of eight specific cash flow issues in the statement of cash flows. Those issues are cash payment for debt prepayment or debt extinguishment costs; settlement of zero-coupon debt instrument or other debt instrument with coupon interest rates that are insignificant in relation to the effective interest rate of the borrowing; contingent consideration payments made after a business combination; cash proceeds from the settlement of insurance claims, cash received from settlement of corporate-owned life insurance policies; distribution received from equity method investees; beneficial interest in securitization transactions; and classification of cash receipts and payments that have aspects of more than one class of cash flows. The guidance is effective for interim and annual reporting periods beginning after December 15, 2017, with early adoption permitted. This ASU should be applied using a retrospective transition method for each period presented. The Company is currently evaluating the impact of adopting this guidance on its consolidated financial statements.
In October 2016, the FASB issued ASU No. 2016-16, Income Taxes (Topic 740): Intra-Entity Transfers of Assets Other Than Inventory (“ASU 2016-16”). ASU 2016-16 requires immediate recognition of the current and deferred income tax consequences of intercompany asset transfers other than inventory. Current U.S. GAAP prohibits the recognition of current and deferred income taxes for an intra-entity asset transfer until the asset has been sold to an outside party. This guidance is effective for annual and interim reporting periods of public entities beginning after December 15, 2017, with early adoption permitted as of the beginning of an annual reporting period for which financial statements (interim or annual) have not been issued or made available for issuance. This ASU should be applied using a modified retrospective basis through a cumulative-effect adjustment directly to retained earnings as of the beginning of the period of adoption. The Company is currently evaluating the impact of adopting this guidance on its consolidated financial statements.
In October 2016, the FASB issued ASU No. 2016-17, Consolidation (Topic 810): Interests Held through Related Parties that Are under Common Control ("ASU 2016-17"). ASU 2016-17 amends the consolidation guidance on how a reporting entity that is the single decision maker of a variable interest entity (VIE) should treat indirect interests in the entity held through related parties that are under common control with the reporting entity when determining whether it is the primary beneficiary of that VIE. Under ASU 2016-17, a single decision maker of a VIE is required to consider indirect economic interests in the entity held through related parties on a proportionate basis when determining whether it is the primary beneficiary of that VIE. If a single decision maker and its related party are under common control, the single decision maker is required to consider indirect interests in the entity held through those related parties to be the equivalent of direct interests in their entirety. The amendments are effective for public business entities for fiscal years beginning after December 15, 2016 (the Company's first quarter of fiscal 2017), including interim periods within those fiscal years. Early adoption is permitted. The standard may be applied retrospectively or through a cumulative effect adjustment to retained earnings as of the beginning of the fiscal year of adoption. The Company is currently evaluating the impact of adopting this guidance on its consolidated financial statements.
In November 2016, the FASB issued ASU No. 2016-18, Statement of Cash Flows (Topic 230): Restricted Cash ("ASU 2016-18"). ASU 2016-18 is intended to add and clarify guidance on the classification and presentation of restricted cash on the statement of cash flows. ASU 2016-18 requires that a statement of cash flows explain the change during the period in the total of cash, cash equivalents, and amounts generally described as restricted cash or restricted cash equivalents. Therefore, amounts generally described as restricted cash and restricted cash equivalents
113
should be included with cash and cash equivalents when reconciling the beginning-of-period and end-of-period total amounts shown on the statement of cash flows. The amendments are effective for public business entities for fiscal years beginning after December 15, 2017, and interim periods within those fiscal years. Early adoption is permitted, including adoption in an interim period. The Company is currently evaluating the impact of adopting this guidance on its consolidated financial statements.
In January 2017, the FASB issued ASU No. 2017-01, Business Combinations (Topic 805): Clarifying the Definition of a Business ("ASU 2017-01"). ASU 2017-01 clarifies the definition of a business with the objective of adding guidance to assist entities with evaluating whether transactions should be accounted for as acquisitions (or disposals) of assets or businesses. The definition of a business affects many areas of accounting, including acquisitions, disposals, goodwill, and consolidation. ASU 2017-01 is effective for annual periods beginning after December 15, 2017, including interim periods within those periods, and the amendments should be applied prospectively on or after the effective date. The Company is currently evaluating the impact of adopting this guidance on its consolidated financial statements.
In January 2017, the FASB issued ASU No. 2017-03, Accounting Changes and Error Corrections (Topic 250) and Investments - Equity Method and Joint Ventures (Topic 323) ("ASU 2017-03"). ASU 2017-03 offers amendments to SEC paragraphs pursuant to staff announcements at the September 22, 2016 and November 17, 2016 EITF meetings for clarification purposes. The Company is currently evaluating the impact of adopting this guidance on its consolidated financial statements.
In January 2017, the FASB issued ASU No. 2017-04, Intangibles - Goodwill and Other (Topic 350): Simplifying the Test for Goodwill Impairment ("ASU 2017-04"). ASU 2017-04 simplifies the subsequent measurement of goodwill by eliminating Step 2 from the goodwill impairment test. Under the amendments in this update, an entity should perform its annual or interim, goodwill impairment test by comparing the fair value of a reporting unit with its carrying amount. An entity should recognize an impairment charge for the amount by which the carrying amount exceeds the reporting unit's fair value. However, the loss recognized should not exceed the total amount of goodwill allocated to that reporting unit. ASU 2017-04 should be applied on a prospective basis and is effective for annual or any interim goodwill impairment tests in fiscal years beginning after December 15, 2019. Early adoption is permitted for interim or annual goodwill impairment tests performed on testing dates after January 1, 2017. The Company is currently evaluating the impact of adopting this guidance on its consolidated financial statements.
3. Acquisitions
Acquisition of CenStar Energy Corp
On July 8, 2015, the Company completed its acquisition of CenStar, a retail energy company based in New York. CenStar serves natural gas and electricity customers in New York, New Jersey, and Ohio. The purchase price for the CenStar acquisition was $8.3 million, subject to working capital adjustments, plus a payment for positive working capital of $10.4 million and an earnout payment estimated as of the acquisition date to be $0.5 million, which was associated with a financial measurement attributable to the operations of CenStar for the year following the closing ("CenStar Earnout"). See Note 8 "Fair Value Measurements" for further discussion of the CenStar Earnout. The purchase price was financed with $16.6 million (including positive working capital of $10.4 million) under our Senior Credit Facility and $2.1 million from the issuance of a convertible subordinated note ("CenStar Note") from the Company and Spark HoldCo to Retailco Acquisition Co, LLC ("RAC"). See Note 7 "Debt" for further discussion of the Senior Credit Facility and the CenStar Note.
The acquisition of CenStar has been accounted for under the acquisition method in accordance with ASC 805. The allocation of purchase consideration was based upon the estimated fair value of the tangible and identifiable intangible assets acquired and liabilities assumed in the acquisition. The allocation was made to major categories of assets and liabilities based on management’s best estimates, supported by independent third-party analyses. The excess of the purchase price over the estimated fair value of tangible and intangible assets acquired and liabilities assumed was allocated to goodwill. The allocation of the purchase consideration is as follows (in thousands):
114
Final as of December 31, 2015 | ||||
Cash | $ | 371 | ||
Net working capital, net of cash acquired | 8,819 | |||
Property and equipment | 52 | |||
Intangible assets - customer relationships | 5,494 | |||
Intangible assets - trademark | 651 | |||
Goodwill | 6,396 | |||
Deferred tax liability | (191 | ) | ||
Fair value of derivative liabilities | (3,475 | ) | ||
Total | $ | 18,117 | ||
The fair values of intangible assets were measured primarily based on significant inputs that are not observable in the market and thus represent a Level 3 measurement as defined by ASC 820, "Fair Value Measurement" ("ASC 820"). The fair value of derivative liabilities were measured by utilizing readily available quoted market prices and non-exchange-traded contracts fair valued using market price quotations available through brokers or over-the-counter and on-line exchanges and represent a Level 2 measurement as defined by ASC 820. Refer to Note 8 "Fair Value Measurements" for further discussion on the fair values hierarchy. Significant inputs for Level 3 measurements related to customer relationships and trademarks are discussed in Note 2 "Basis of Presentation and Summary of Significant Accounting Policies". Significant inputs for Level 3 measurements related to goodwill were as follows:
Goodwill. The excess of the purchase consideration over the estimated fair value of the amounts initially assigned to the identifiable assets acquired and liabilities assumed was recorded as goodwill. Goodwill arose on the acquisition of CenStar primarily due to its strong brand and broker affinity relationships, along with access to new utility service territories. Goodwill recorded in connection with the acquisition of CenStar is not deductible for income tax purposes because CenStar was an acquisition of all outstanding equity interests.
The Company’s combined and consolidated statements of operations for the year ended December 31, 2015 included $21.4 million of revenue and a $1.4 million loss on operations of CenStar. The Company incurred $0.1 million of acquisition related costs for the year ended December 31, 2015, in connection with the acquisition of CenStar, which have been expensed as incurred and included in general and administrative expense in the combined and consolidated statement of operations.
Acquisition of Oasis Power Holdings, LLC
On July 31, 2015, the Company completed its acquisition of Oasis, a retail energy company operating in six states across 18 utilities. The purchase price for the Oasis acquisition was $20.0 million, subject to working capital adjustments. The purchase price was financed with $15.0 million in borrowings under our Senior Credit Facility, $5.0 million from the issuance of a convertible subordinated note ("Oasis Note") from the Company and Spark HoldCo to RAC, and $2.0 million cash on hand. See Note 7 "Debt" for further discussion of the Senior Credit Facility and the Oasis Note.
The acquisition of Oasis by the Company from RAC was a transfer of equity interests of entities under common control on July 31, 2015. Accordingly, the assets acquired and liabilities assumed were based on their historical values as of July 31, 2015 as follows (in thousands):
115
Final as of December 31, 2015 | ||||
Cash | $ | 271 | ||
Net working capital, net of cash acquired | 1,831 | |||
Property and equipment | 38 | |||
Intangible assets - customer relationships | 7,824 | |||
Intangible assets - trademark | 602 | |||
Goodwill | 11,983 | |||
Fair value of derivative liabilities | (819 | ) | ||
Total | $ | 21,730 | ||
The fair values of intangible assets were measured primarily based on significant inputs that are not observable in the market and thus represent a Level 3 measurement as defined by ASC 820, "Fair Value Measurement" ("ASC 820"). The fair value of derivative liabilities were measured by utilizing readily available quoted market prices and non-exchange-traded contracts fair valued using market price quotations available through brokers or over-the-counter and on-line exchanges and represent a Level 2 measurement as defined by ASC 820. Refer to Note 8 "Fair Value Measurements" for further discussion on the fair values hierarchy. Significant inputs for Level 3 measurements related to customer relationships and trademarks are discussed in Note 2 "Basis of Presentation and Summary of Significant Accounting Policies". Significant inputs for Level 3 measurements related to goodwill were as follows:
Goodwill
The excess of the purchase consideration over the estimated fair value of the amounts initially assigned to the identifiable assets acquired and liabilities assumed was recorded as goodwill. Goodwill arose on the acquisition of the Oasis by RAC primarily due the value of Oasis's brand strength, established vendor relationships and access to new utility service territories. Goodwill recorded in connection with the acquisition of Oasis is deductible for income tax purposes because the acquisition of Oasis was an acquisition of all of the assets of Oasis. The valuation and purchase price allocation of Oasis was based on a preliminary fair value analysis performed as of May 12, 2015, the date Oasis was acquired by RAC. Prior to the measurement period's expiration, the Company recorded adjustments to the working capital balances upon settlement of the final working capital balances per the terms of the purchase agreement.
Goodwill was transferred based on the acquisition of Oasis by RAC on May 12, 2015 and was primarily due to Oasis's brand strength, established vendor relationships and access to new utility service territories. Goodwill recorded in connection with the transfer of Oasis is deductible for income tax purposes.
The Company’s combined and consolidated statements of operations for year ended December 31, 2015 included $26.9 million of revenue and a $0.5 million loss on the operations of Oasis.
Acquisition of the Provider Companies
On August 1, 2016, the Company and Spark HoldCo completed the purchase of all of the outstanding membership interests of the Provider Companies. The Provider Companies serve electrical customers in Maine, New Hampshire and Massachusetts. The purchase price for the Provider Companies was approximately $34.1 million, which included $1.3 million in working capital, subject to adjustments, and up to $9.0 million in earnout payments, valued at $4.8 million as of the purchase date, to be paid by June 30, 2017, subject to the achievement of certain performance targets (the "Provider Earnout"). See Note 8 "Fair Value Measurements" for further discussion on the Provider Earnout. The purchase price was funded by the issuance of 699,742 shares of Class B common stock (and a corresponding number of Spark HoldCo units) sold to Retailco, valued at $14.0 million based on a value of $20 per share; borrowings under the Senior Credit Facility of $10.6 million; and $3.8 million in net installment consideration to be paid in ten monthly payments that commenced in August 2016. The first payment of $0.4
116
million was made with the initial consideration paid. See Note 7 "Debt" for further discussion of the Senior Credit Facility.
The acquisition of the Provider Companies has been accounted for under the acquisition method in accordance with ASC 805, Business Combinations (“ASC 805”). The allocation of purchase consideration was based upon the estimated fair value of the tangible and identifiable intangible assets acquired and liabilities assumed in the acquisition. The allocation was made to major categories of assets and liabilities based on management’s best estimates, supported by independent third-party analyses. The excess of the purchase price over the estimated fair value of tangible and intangible assets acquired and liabilities assumed was allocated to goodwill.
The allocation of the purchase consideration is as follows (in thousands):
Reported as of September 30, 2016 | Q4 2016 Adjustments (1) | Final as of December 31, 2016 | ||||||||||
Cash | $ | 51 | $ | 380 | $ | 431 | ||||||
Net working capital, net of cash acquired | 1,229 | (417 | ) | 812 | ||||||||
Intangible assets - customer relationships and non-compete agreements | 24,417 | — | 24,417 | |||||||||
Intangible assets - trademark | 529 | — | 529 | |||||||||
Goodwill | 26,040 | — | 26,040 | |||||||||
Fair value of derivative liabilities | (18,163 | ) | — | (18,163 | ) | |||||||
Total | 34,103 | (37 | ) | 34,066 | ||||||||
(1) | Changes to the purchase price allocation in the fourth quarter of 2016 were due to the settlement of final working capital balances per the purchase agreement. |
The fair values of intangible assets were measured primarily based on significant inputs that are not observable in the market and thus represent a Level 3 measurement as defined by ASC 820, Fair Value Measurement ("ASC 820"). The fair value of derivative liabilities were measured by utilizing readily available quoted market prices and non-exchange-traded contracts fair valued using market price quotations available through brokers or over-the-counter and on-line exchanges and represent a Level 2 measurement as defined by ASC 820. Refer to Note 8 "Fair Value Measurements" for further discussion on the fair values hierarchy. Significant inputs for Level 3 measurements related to customer relationships, non-compete agreements and trademarks are discussed in Note 2 "Basis of Presentation and Summary of Significant Accounting Policies". Significant inputs for Level 3 measurements related to goodwill were as follows:
Goodwill
The excess of the purchase consideration over the estimated fair value of the amounts initially assigned to the identifiable assets acquired and liabilities assumed was recorded as goodwill. Goodwill arose on the acquisition of the Provider Companies primarily due the value of its assembled workforce, along with access to new utility service territories. Goodwill recorded in connection with the acquisition of the Provider Companies is deductible for income tax purposes because the Provider Companies was an acquisition of all of the assets of the Provider Companies. The valuation and purchase price allocation of the Provider Companies was based on a preliminary fair value analysis. Prior to the measurement period's expiration, the Company recorded adjustments to the working capital balances upon settlement of the final working capital balances per the terms of the purchase agreement.
The Company’s consolidated statements of operations for the year ended December 31, 2016, respectively, included $46.8 million of revenue and $12.8 million of losses from operations related to the operations of the Provider Companies. We have not included pro forma information for the Provider Companies acquisition because it did not have a material impact on our financial position or results of operations.
Acquisition of the Major Energy Companies
117
On August 23, 2016, the Company and Spark HoldCo completed the transfer of all of the outstanding membership interests of the Major Energy Companies, which are retail energy companies operating in Connecticut, Illinois, Maryland (including the District of Columbia), Massachusetts, New Jersey, New York, Ohio, and Pennsylvania across 43 utilities, from NG&E in exchange for consideration of $63.2 million, which included $4.3 million in working capital, subject to adjustments; an assumed litigation reserve of $5.0 million, and up to $35.0 million in installment and earnout payments, valued at $13.1 million as of the purchase date, to be paid to the previous members of the Major Energy Companies, in annual installments on March 31, 2017, 2018 and 2019, subject to the achievement of certain performance targets (the “Major Earnout”). The Company is obligated to issue up to 200,000 shares of Class B common stock (and a corresponding number of Spark HoldCo units) to NG&E, subject to the achievement of certain performance targets, valued at $0.8 million (40,718 shares valued at $20 per share) as of the purchase date (the "Stock Earnout"). See Note 8 “Fair Value Measurements” for further discussion on the Major Earnout and Stock Earnout. The purchase price was funded by the issuance of 2,000,000 shares of Class B common stock (and a corresponding number of Spark HoldCo units) valued at $40.0 million based on a value of $20 per share, to NG&E. NG&E is owned by our Founder.
The acquisition of the Major Energy Companies by the Company and Spark HoldCo from NG&E was a transfer of equity interests of entities under common control on August 23, 2016. Accordingly, the assets acquired and liabilities assumed were based on their historical values as of August 23, 2016. NG&E acquired the Major Energy Companies on April 15, 2016 and the fair value of the net assets acquired were as follows (in thousands):
Reported as of September 30, 2016 | Q4 2016 Adjustments (1) | Final as of December 31, 2016 | ||||||||
Cash | 17,368 | — | $ | 17,368 | ||||||
Property and equipment | 14 | — | 14 | |||||||
Intangible assets - customer relationships & non-compete agreements | 24,271 | — | 24,271 | |||||||
Other assets - trademarks | 4,973 | — | 4,973 | |||||||
Non-current deferred tax assets | 1,042 | — | 1,042 | |||||||
Goodwill | 35,137 | (409 | ) | 34,728 | ||||||
Net working capital, net of cash acquired | (6,345 | ) | (401 | ) | (6,746 | ) | ||||
Fair value of derivative liabilities | (7,260 | ) | — | (7,260 | ) | |||||
Total | 69,200 | (810 | ) | 68,390 | ||||||
(1) Changes to the purchase price allocation in the fourth quarter of 2016 related to estimated working capital adjustments per the purchase agreement between NG&E and the Major Energy Companies as of December 31, 2016 and an adjustment to goodwill related to contingent consideration payable to NG&E.
The initial working capital estimate paid to the Major Energy Companies by NG&E was $10.3 million and is subject to adjustment and is being negotiated as of December 31, 2016. The Company subsequently paid $4.3 million in working capital to NG&E on August 23, 2016. Approximately $6.0 million was recorded as an equity transaction and treated as a contribution on August 23, 2016, revised to $4.7 million based on the estimated working capital true-up adjustment with NG&E as of December 31, 2016. Finalization of the Company's working capital adjustment with NG&E is still pending as of December 31, 2016, subject to finalization of the working capital estimate as of April 15, 2016. An estimated working capital adjustment between the Company and NG&E of $1.4 million was recorded as of December 31, 2016 and is included in accounts payable - affiliates. The Stock Earnout of $0.8 million due to NG&E is also reflected as a reduction to equity as of December 31, 2016.
The fair values of intangible assets were measured primarily based on significant inputs that are not observable in the market and thus represent a Level 3 measurement as defined by ASC 820, Fair Value Measurement ("ASC 820"). The fair value of derivative liabilities were measured by utilizing readily available quoted market prices and non-exchange-traded contracts fair valued using market price quotations available through brokers or over-the-counter and on-line exchanges and represent a Level 2 measurement as defined by ASC 820. Refer to Note 8 "Fair Value Measurements" for further discussion on the fair values hierarchy. Significant inputs for Level 3
118
measurements related to customer relationships, non-compete agreements and trademarks are discussed in Note 2 "Basis of Presentation and Summary of Significant Accounting Policies". Significant inputs for Level 3 measurements related to goodwill were as follows:
Goodwill
The excess of the purchase consideration over the estimated fair value of the amounts initially assigned to the identifiable assets acquired and liabilities assumed was recorded as goodwill. Goodwill arose on the acquisition of the Major Energy Companies by NG&E primarily due the value of the Major Energy Companies brand strength, established vendor relationships and access to new utility service territories. Goodwill recorded in connection with the acquisition of the Major Energy Companies is deductible for income tax purposes because the acquisition of the Major Energy Companies was an acquisition of all of the assets of the Major Energy Companies. The valuation and purchase price allocation of the Major Energy Companies was based on a preliminary fair value analysis performed as of April 15, 2016, the date the Major Energy Companies were acquired by NG&E. During the measurement period, the Company may record adjustments to the working capital balances upon settlement of the final working capital balances per the terms of the purchase agreement.
Goodwill was transferred to the Company based on the acquisition of the Major Energy Companies by NG&E on April 15, 2016. Goodwill recorded in connection with the transfer of the Major Energy Companies is deductible for income tax purposes.
In December 2016, certain executives of the Major Energy Companies exercised a change of control provision under employment agreements with the Major Energy Companies. As a result, the Company recorded employment contract termination costs of $4.1 million as of December 31, 2016, to be paid over a 22 month period beginning April 1, 2017. The Major Energy Companies contributed revenues of $125.6 million and earnings of $1.3 million to the Company for the year ended December 31, 2016.
The following unaudited pro forma revenue and earnings summary presents consolidated information of the Company as if the acquisition had occurred on January 1, 2015 (in thousands):
Year Ended December 31, | ||
2016 | 2015 | |
Revenue | $603,673 | $547,381 |
Earnings | $15,776 | $15,460 |
The pro forma results are not necessarily indicative of our consolidated results of operations in future periods or the results that actually would have been realized had the companies operated on a combined basis during the periods presented. The revenue and earnings for the twelve months ended December 31, 2016 reflects actual results of operations since the financial results were fully combined during that period. The pro forma results include adjustments primarily related to amortization of acquired intangibles, and certain accounting policy alignments as well as direct and incremental acquisition related costs reflected in the historical financial statements. The purchase price allocation was used to prepare the pro forma adjustments.
4. Equity
Non-controlling Interest
The Company holds an economic interest and is the sole managing member in Spark HoldCo, with NuDevco Retail and Retailco holding the remaining economic interest in Spark HoldCo. As a result, the Company has consolidated
119
the financial position and results of operations of Spark HoldCo and reflected the economic interest retained by NuDevco Retail and Retailco as a non-controlling interest.
The Company and NuDevco Retail and Retailco owned the following economic interests in Spark HoldCo at December 31, 2015 and December 31, 2016, respectively.
Non-controlling Interest Economic Interest | ||||
The Company | NuDevco Retail and Retailco (1) | |||
December 31, 2015 | 22.49 | % | 77.51 | % |
December 31, 2016 | 38.85 | % | 61.15 | % |
(1) In January 2016, Retailco succeeded to the interest of NuDevco Retail Holdings of its Class B common stock and in equal number of Spark HoldCo units it held pursuant to a series of transfers. | ||||
The following table summarizes the portion of net income and income tax expense (benefit) attributable to non-controlling interest (in thousands):
2016 | 2015 | |||||
Net income allocated to non-controlling interest | $ | 52,300 | $ | 21,779 | ||
Income tax expense (benefit) allocated to non-controlling interest | 1,071 | (331 | ) | |||
Net income attributable to non-controlling interest | $ | 51,229 | $ | 22,110 | ||
Class A Common Stock
The Company had a total of 6,496,559 and 3,118,623 shares of its Class A common stock outstanding at December 31, 2016 and 2015, respectively. Each share of Class A common stock holds economic rights and entitles its holder to one vote on all matters to be voted on by shareholders generally.
Issuance of Class A Common Stock Upon Vesting of Restricted Stock Units
On May 4, 2016, 101,210 restricted stock units vested, with 77,814 shares of common stock distributed to the holders of these units and with 23,396 shares of common stock withheld by the Company to cover taxes owed on the vesting of such units. On May 18, 2016, 53,853 restricted stock units vested, with 43,683 shares of common stock distributed to the holders of these units and with 10,170 shares of common stock withheld by the Company to cover taxes owed on the vesting of such units.
Conversion of Class B Common Stock to Class A Common Stock
On February 3, 2016, April 1, 2016 and June 8, 2016, Retailco exchanged 1,000,000, 1,725,000 and 500,000, respectively, of its Spark HoldCo units (together with a corresponding number of shares of Class B common stock) for shares of Class A common stock at an exchange ratio of one share of Class A common stock for each Spark HoldCo unit (and corresponding share of Class B common stock) exchanged. Refer to Note 11 "Income Taxes" for further discussion.
Class B Common Stock
The Company has a total of 10,224,742 and 10,750,000 shares of its Class B common stock outstanding at December 31, 2016 and 2015, respectively. Each share of Class B common stock, all of which are held by NuDevco
120
Retail and Retailco, have no economic rights but entitles its holder to one vote on all matters to be voted on by shareholders generally.
Holders of Class A common stock and Class B common stock vote together as a single class on all matters presented to our shareholders for their vote or approval, except as otherwise required by applicable law or by our certificate of incorporation.
Issuance of Class B Common Stock
On August 1, 2016, the Company issued 699,742 shares of Class B common stock to Retailco in connection with the acquisition of the Provider Companies. On August 23, 2016, the Company issued 2,000,000 shares of Class B common stock to Retailco in connection with the acquisition of Major Energy Companies.
Preferred Stock
The Company has 20,000,000 shares of authorized preferred stock for which there are no issued and outstanding shares at December 31, 2016 and 2015.
Earnings Per Share
Basic earnings per share (“EPS”) is computed by dividing net income attributable to stockholders (the numerator) by the weighted-average number of Class A common shares outstanding for the period (the denominator). Class B common shares are not included in the calculation of basic earnings per share because they are not participating securities and have no economic interest in the Company. Diluted earnings per share is similarly calculated except that the denominator is increased (1) using the treasury stock method to determine the potential dilutive effect of the Company's outstanding unvested restricted stock units, (2) using the if-converted method to determine the potential dilutive effect of the Company's Class B common stock and (3) using the if-converted method to determine the potential dilutive effect of the outstanding convertible subordinated notes into the Company's Class B common stock.
The following table presents the computation of earnings per share for the years ended December 31, 2016 and 2015 (in thousands, except per share data):
Year Ended December 31, | ||||||
2016 | 2015 | |||||
Net income attributable to stockholders of Class A common stock | $ | 14,444 | $ | 3,865 | ||
Basic weighted average Class A common shares outstanding | 5,701 | 3,064 | ||||
Basic EPS attributable to stockholders | $ | 2.53 | $ | 1.26 | ||
Net income attributable to stockholders of Class A common stock | $ | 14,444 | $ | 3,865 | ||
Effect of conversion of Class B common stock to shares of Class A common stock | — | — | ||||
Effect of conversion of convertible subordinated notes into shares of Class B common stock and shares of Class B common stock into shares of Class A common stock | (310 | ) | (334 | ) | ||
Diluted net income attributable to stockholders of Class A common stock | $ | 14,134 | $ | 3,531 | ||
Basic weighted average Class A common shares outstanding | 5,701 | 3,064 | ||||
Effect of dilutive Class B common stock | — | — | ||||
Effect of dilutive convertible subordinated notes into shares of Class B common stock and shares of Class B common stock into shares of Class A common stock | 505 | 210 | ||||
Effect of dilutive restricted stock units | 139 | 53 | ||||
Diluted weighted average shares outstanding | 6,345 | 3,327 | ||||
Diluted EPS attributable to stockholders | $ | 2.23 | $ | 1.06 | ||
121
The conversion of shares of Class B common stock to shares of Class A common stock was not recognized in dilutive earnings per share for the years ended December 31, 2016 and 2015 as the effect of the conversion was antidilutive.
Variable Interest Entity
On January 1, 2016, we adopted ASU No. 2015-02, Consolidation (Topic 810) (“ASU 2015-02”). ASU 2015-02 changed the analysis that a reporting entity must perform to determine whether it should consolidate certain types of legal entities. Upon adoption, we continued to consolidate Spark HoldCo, but considered Spark HoldCo to be a variable interest entity requiring additional disclosures in the footnotes of our consolidated financial statements.
Spark HoldCo is a variable interest entity due to its lack of rights to participate in significant financial and operating decisions and inability to dissolve or otherwise remove its management. Spark HoldCo owns all of the outstanding membership interests in each of the operating subsidiaries through which the Company operates. The Company is the sole managing member of Spark HoldCo, manages Spark HoldCo's operating subsidiaries through this managing membership interest, and is considered the primary beneficiary of Spark HoldCo.
The assets of Spark HoldCo cannot be used to settle the obligations of the Company except through distributions to the Company, and the liabilities of Spark HoldCo cannot be settled by the Company except through contributions to Spark HoldCo.
Conversion of CenStar and Oasis Notes
On October 5, 2016, RAC issued to the Company an irrevocable commitment to convert the CenStar Note and Oasis Note into 134,731 and 383,090 shares, respectively, of Class B common stock (and related Spark HoldCo units) on January 8, 2017 and January 31, 2017, respectively. Refer to Note 7 "Debt" and Note 17 "Subsequent Events" for further discussion.
122
The following table includes the carrying amounts and classification of the assets and liabilities of Spark HoldCo that are included in the Company's consolidated balance sheet as of December 31, 2016 (in thousands):
December 31, 2016 | |||
Assets | |||
Current assets: | |||
Cash and cash equivalents | $ | 18,945 | |
Accounts receivable | 112,491 | ||
Other current assets | 65,866 | ||
Total current assets | 197,302 | ||
Non-current assets: | |||
Goodwill | 79,147 | ||
Other assets | 43,991 | ||
Total non-current assets | 123,138 | ||
Total Assets | $ | 320,440 | |
Liabilities | |||
Current liabilities: | |||
Accounts Payable and Accrued Liabilities | 88,547 | ||
Intercompany payable with Spark Energy, Inc. | (3,399 | ) | |
Current portion of Senior Credit Facility | 51,287 | ||
Contingent consideration | 11,827 | ||
Convertible subordinated notes to affiliates | 6,582 | ||
Other current liabilities | 9,932 | ||
Total current liabilities | 164,776 | ||
Long-term liabilities: | |||
Subordinated debt—affiliate | 5,000 | ||
Contingent consideration | 10,826 | ||
Other long-term liabilities | 68 | ||
Total long-term liabilities | 15,894 | ||
Total Liabilities | $ | 180,670 | |
5. Property and Equipment
Property and equipment consist of the following amounts as of (in thousands):
Estimated useful lives (years) | December 31, 2016 | December 31, 2015 | |||||||
Information technology | 2 – 5 | $ | 29,675 | $ | 27,392 | ||||
Leasehold improvements | 2 – 5 | 4,568 | 4,568 | ||||||
Furniture and fixtures | 2 – 5 | 1,024 | 1,007 | ||||||
Total | 35,267 | 32,967 | |||||||
Accumulated depreciation | (30,561 | ) | (28,491 | ) | |||||
Property and equipment—net | $ | 4,706 | $ | 4,476 | |||||
Information technology assets include software and consultant time used in the application, development and implementation of various systems including customer billing and resource management systems. As of
123
December 31, 2016 and 2015, information technology includes $1.1 million and $0.5 million, respectively, of costs associated with assets not yet placed into service.
Depreciation expense recorded in the combined and consolidated statements of operations was $2.1 million, $1.6 million and $3.7 million for the years ended December 31, 2016, 2015 and 2014, respectively.
6. Goodwill, Customer Relationships and Trademarks
Goodwill, customer relationships and trademarks consist of the following amounts as of (in thousands):
December 31, 2016 | December 31, 2015 | ||||||
Goodwill | $ | 79,147 | $ | 18,379 | |||
Customer Relationships— Acquired (1) | |||||||
Cost | 63,571 | 14,883 | |||||
Accumulated amortization | (31,660 | ) | (4,503 | ) | |||
Customer Relationships—Acquired, net | $ | 31,911 | $ | 10,380 | |||
Customer Relationships— Other (2) | |||||||
Cost | 4,320 | 4,320 | |||||
Accumulated amortization | (2,708 | ) | (1,271 | ) | |||
Customer Relationships—Other, net | $ | 1,612 | $ | 3,049 | |||
Trademarks (3) | |||||||
Cost | 6,770 | 1,268 | |||||
Accumulated amortization | (431 | ) | (74 | ) | |||
Trademarks, net | $ | 6,339 | $ | 1,194 | |||
(1) | Customer relationships—Acquired represent those customer acquisitions accounted for under the acquisition method in accordance with ASC 805. See Note 3 "Acquisitions" for further discussion. |
(2) | Customer relationships—Other represent portfolios of customer contracts not accounted for in accordance with ASC 805 as these acquisitions were not in conjunction with the acquisition of businesses. See Note 15 "Customer Acquisitions" for further discussion. |
(3) | Trademarks reflect values associated with the recognition and positive reputation of acquired businesses accounted for as part of the acquisition method in accordance with ASC 805 through the acquisitions of CenStar, Oasis, the Provider Companies and the Major Energy Companies. These trademarks are recorded as other assets in the consolidated balance sheets. See Note 3 "Acquisitions" for further discussion. |
124
Changes in goodwill, customer relationships and trademarks consisted of the following (in thousands):
Goodwill | Customer Relationships— Acquired & Non-Compete Agreements | Customer Relationships— Other | Trademarks | ||||||||||||
Balance at December 31, 2013 | $ | — | $ | — | $ | — | $ | — | |||||||
Additions | — | — | 1,589 | — | |||||||||||
Amortization expense | — | — | (88 | ) | — | ||||||||||
Balance at December 31, 2014 | $ | — | $ | — | $ | 1,501 | $ | — | |||||||
Additions | $ | — | $ | — | $ | 2,731 | $ | — | |||||||
Acquisition of CenStar | 6,396 | 5,494 | — | 651 | |||||||||||
Acquisition of Oasis | 11,983 | 9,389 | — | 617 | |||||||||||
Amortization expense | — | (4,503 | ) | (1,183 | ) | (74 | ) | ||||||||
Balance at December 31, 2015 | $ | 18,379 | $ | 10,380 | $ | 3,049 | $ | 1,194 | |||||||
Additions | $ | — | $ | — | $ | — | $ | — | |||||||
Acquisition of Provider Companies | 26,040 | 24,417 | — | 529 | |||||||||||
Acquisition of Major Energy Companies | 34,728 | 24,271 | — | 4,973 | |||||||||||
Amortization expense | — | (27,157 | ) | (1,437 | ) | (357 | ) | ||||||||
Balance at December 31, 2016 | $ | 79,147 | $ | 31,911 | $ | 1,612 | $ | 6,339 | |||||||
The acquired customer relationship related to Major Energy Companies and Provider Companies were bifurcated between hedged and unhedged and amortized to depreciation and amortization based on the expected future cash flows by year and expensed to retail cost of revenue based on the expected term of the underlying fixed price contract in each reporting period, respectively. Approximately $15.8 million of the $27.2 million customer relationships amortization expense for the twelve months ending December 31, 2016 is included in cost of revenues.
Estimated future amortization expense for customer relationships and trademarks at December 31, 2016 is as follows (in thousands):
Year Ending December 31, | |||
2017 | $ | 12,913 | |
2018 | 10,337 | ||
2019 | 5,892 | ||
2020 | 2,894 | ||
2021 | 2,592 | ||
> 5 years | 5,234 | ||
Total | $ | 39,862 | |
7. Debt
Balance Sheet and Income Statement Summary
Debt consists of the following amounts as of (in thousands):
125
December 31, 2016 | December 31, 2015 | ||||||
Current portion of Senior Credit Facility—Working Capital Line (1) (2) | $ | 29,000 | $ | 22,500 | |||
Current portion of Senior Credit Facility—Acquisition Line (2) | 22,287 | 5,306 | |||||
Current portion of Note Payable - Pacific Summit Energy | 15,501 | — | |||||
Convertible subordinated notes to affiliate | 6,582 | — | |||||
Total current debt | 73,370 | 27,806 | |||||
Long-term portion of Senior Credit Facility—Acquisition Line (1) | — | 14,592 | |||||
Subordinated Debt | 5,000 | — | |||||
Convertible subordinated notes to affiliate | — | 6,339 | |||||
Total long-term debt | 5,000 | 20,931 | |||||
Total debt | $ | 78,370 | $ | 48,737 | |||
(1) | As of December 31, 2016 and 2015, the Company had $29.6 million and $21.5 million in letters of credit issued, respectively. |
(2) | As of December 31, 2016 and 2015, the weighted average interest rate on the current portion of our Senior Credit Facility was 4.93% and 3.90%, respectively. |
(3) | On October 5, 2016, RAC issued to the Company an irrevocable commitment to convert the CenStar Note and the Oasis Note into shares of Class B common stock on January 8, 2017 and January 31, 2017, respectively. RAC assigned the CenStar Note and Oasis Note to Retailco on January 4, 2017, and on January 8, 2017 and January 31, 2017, the CenStar Note and Oasis Note were converted into 134,731 and 383,090 shares of Class B common stock, respectively. |
Deferred financing costs were $0.4 million and $0.7 million as of December 31, 2016 and 2015, respectively, representing capitalized financing costs in connection with the amendment and restatement of our Senior Credit Facility on July 8, 2015. Of these amounts, $0.4 million and $0.5 million is recorded in other current assets in the combined and consolidated balance sheets as of December 31, 2016 and 2015, and zero and $0.2 million is recorded in other assets in the consolidated balance sheets as of December 31, 2016 and 2015, respectively, based on the terms of the Senior Credit Facility.
Interest expense consists of the following components for the periods indicated (in thousands):
Years Ended December 31, | |||||||||||
2016 | 2015 | 2014 | |||||||||
Interest incurred on Senior Credit Facility (1) | $ | 1,730 | $ | 1,144 | $ | 418 | |||||
Accretion related to Earnouts (2) | 5,059 | — | — | ||||||||
Commitment fees | 180 | 160 | 144 | ||||||||
Letters of credit fees | 704 | 357 | 385 | ||||||||
Amortization of deferred financing costs (3) | 668 | 412 | 631 | ||||||||
Interest incurred on convertible subordinated notes to affiliate (4) | 518 | 207 | — | ||||||||
Interest expense | $ | 8,859 | $ | 2,280 | $ | 1,578 | |||||
(1) Includes interest expense attributed to other revolving credit facilities prior to the IPO.
(2) Includes accretion related to the Provider Earnout of $0.1 million and the Major Earnout of $4.9 million for the year ended December 31,
2016.
(3) | Write offs of deferred financing costs included in the above amortization were $0.1 million in connection with the amended and restated Senior Credit Facility on July 8, 2015, $0.3 million upon extinguishment of the Seventh Amended Credit Facility and $0.1 million in connection with the execution of the Seventh Amended Credit Facility for the years ended December 31, 2015 and 2014, respectively. |
(4) Includes amortization of the discount on the convertible subordinated notes to affiliates of $0.2 million and less than $0.1 million for the
years ended December 31, 2016 and 2015.
Prior to the IPO - Working Capital Facility
126
The working capital facility was $150 million in 2012 under the Fifth Amended Credit Agreement and was later amended to $70 million on December 17, 2012 under the Sixth Amended Credit Agreement. On July 31, 2013, and in conjunction with the Seventh Amended Credit Agreement, the working capital facility was increased to $80 million.
The working capital facility was available for use by Spark Energy Ventures and its affiliates to finance the working capital requirements related to the purchase and sale of natural gas, electricity, and other commodity products not related to the retail natural gas and asset optimization and retail electricity businesses of the Company. The working capital facility was drawn upon and repaid on a monthly basis to fund working capital needs. Portions of the borrowings were used to fund equity distributions to the sole member of the Company to fund unrelated operations of an affiliate under the common control of the sole member prior to the IPO. The total amounts outstanding under the facility as of December 31, 2013 and through the IPO date included $29.0 million that was retained and paid off by an affiliate in connection with the IPO.
Further, through the issuance of letters of credit, the Company was able to secure payment to suppliers. No obligation is recorded for such outstanding letters of credit unless they are drawn upon by the suppliers and in the event a supplier draws on a letter of credit, repayment is due by the earlier of demand by the bank or at the expiration of the applicable Credit Agreement. Under the working capital facility, the Company paid a fee with respect to each letter of credit issued and outstanding.
Under the Sixth Amended Credit Agreement, the Company was able to elect to have loans under the working credit facility bear interest either (i) at a Eurodollar-based rate plus a margin ranging from 3.00% to 3.75% depending on the Company’s consolidated funded indebtedness ratio then in effect, or (ii) at a base rate loan plus a margin ranging from 2.00% to 2.75% depending on the Company’s consolidated funded indebtedness ratio then in effect. The Company also paid a nonutilization fee equal to 0.50% per annum.
Under the Seventh Amended Credit Agreement, the Company was able to elect to have loans under the working capital facility bear interest (i) at a Eurodollar-based rate plus a margin ranging from 3.00% to 3.25%, depending on the Spark Energy Ventures’ aggregate amount outstanding then in effect, (ii) at a base rate loan plus a margin ranging from 2.00% to 2.25%, depending on Spark Energy Ventures’ aggregate amount outstanding then in effect or (iii) a cost of funds rate loan plus a margin ranging from 2.50% to 2.75%, depending on Spark Energy Ventures’ aggregate amount outstanding then in effect. Each working capital loan made as a result of a drawing under a letter of credit bears interest on the outstanding principal amount thereof from the date funded at a floating rate per annum equal to the cost of funds rate plus the applicable margin until such loan has been outstanding for more than two business days and, thereafter, bears interest on the outstanding principal amount thereof at a floating rate per annum equal to the base rate plus the applicable margin, plus 2.00% per annum. The Company also paid a commitment fee equal to 0.50% per annum.
Prior to the IPO - NuDevco Note
NuDevco Retail Holdings transferred Spark HoldCo units to the Company for the $50,000 NuDevco Note, and the limited liability company agreement of Spark HoldCo was amended and restated to admit Spark Energy, Inc. as its sole managing member. This promissory note was repaid in connection with proceeds from the IPO.
Senior Credit Facility Executed at the IPO
Concurrently with the closing of the IPO, the Company entered into a new $70.0 million Senior Credit Facility, which was originally set to mature on August 1, 2016. If no event of default has occurred, the Company has the right, subject to approval by the administrative agent and each issuing bank, to increase the commitments under the Senior Credit Facility up to $120.0 million. The Company borrowed approximately $10.0 million under the Senior Credit Facility at the closing of the IPO to repay in full the outstanding indebtedness under the Seventh Amended Credit Agreement that SEG and SE agreed to be responsible for pursuant to an interborrower agreement between SEG, SE and an affiliate. The remaining $29.0 million of indebtedness outstanding under the Seventh Amended Credit Agreement at the IPO date was paid down by our affiliate with its own funds concurrent with the closing of
127
the IPO pursuant to the terms of the interborrower agreement. Following this repayment, the Seventh Amended Credit Agreement was terminated. The Company had $15.0 million in letters of credit issued under the Senior Credit Facility at inception.
On July 8, 2015, the Company as guarantor, and Spark HoldCo (the “Borrower," and together with the subsidiaries of Spark HoldCo, the “Co-Borrowers”) amended and restated the Senior Credit Facility to include a senior secured revolving working capital facility of $60.0 million ("Working Capital Line") and a secured revolving line of credit of $25.0 million ("Acquisition Line") to be used specifically for the financing of up to 75% of the cost of acquisitions with the remainder to be financed by the Company either through cash on hand, equity contributions or the issuance of subordinated debt and extended the maturity date. The Senior Credit Facility will mature on July 8, 2017. Borrowings under the Acquisition Line will be repaid 25% per year with the remaining 50% due at maturity. The outstanding balances under the Working Capital Line and the Acquisition Line are classified as current debt as of December 31, 2016.
Senior Credit Facility
The Company, as guarantor, and Spark HoldCo (the “Borrower,” and together with Spark Energy, LLC, Spark Energy Gas, LLC, CenStar Energy Corp, CenStar Operating Company, LLC, Oasis, Oasis Power, LLC, Electricity Maine, LLC, Electricity N.H., LLC, and Provider Power Mass, LLC, each a subsidiary of Spark HoldCo, the “Co-Borrowers”) are party to a senior secured revolving credit facility (“Senior Credit Facility”), which includes a senior secured revolving working capital facility up to $82.5 million ("Working Capital Line") and a secured revolving line of credit of $25.0 million ("Acquisition Line") to be used specifically for the financing of up to 75% of the cost of acquisitions with the remainder to be financed by the Company either through cash on hand or the issuance of subordinated debt or equity.
On June 1, 2016, the Company and the Co-Borrowers entered into Amendment No. 3 to the Senior Credit Facility to, among other things, increase the Working Capital Line from $60.0 million to $82.5 million in accordance with the Co-Borrowers' right to increase under the existing terms of the Senior Credit Facility. Amendment No. 3 also provides for the addition of new lenders and re-allocates working capital and revolving commitments among existing and new lenders. Amendment No. 3 also provides for additional representations of the Co-Borrowers and additional protections of the lenders of the Senior Credit Facility.
On August 1, 2016, the Company and the Co-Borrowers entered into Amendment No. 4 to the Senior Credit Facility to, among other things, amend the provisions under the Acquisition Line to allow for the Provider Companies acquisition. Amendment No. 4 also raises the minimum availability under the Working Capital Line to $40.0 million. In addition, Amendment No. 4 designates Major Energy Companies as "unrestricted subsidiaries" upon the closing of such acquisition on August 23, 2016. Refer to Note 3 "Acquisitions" for further discussion.
On September 30, 2016, the Company and the Co-Borrowers elected to reduce the capacity of the Working Capital Line from $82.5 million to $60.0 million. At year-end, we elected up to the $70.0 million level. The Senior Credit Facility will mature on July 8, 2017. Borrowings under the Acquisition Line will be repaid 25% per year with the remainder due at maturity. The outstanding balances under the Working Capital Line and the Acquisition Line are classified as current debt as of December 31, 2016.
At our election, the interest rate under the Working Capital Line is generally determined by reference to:
• | the Eurodollar-based rate plus an applicable margin of up to 3.00% per annum (based upon the prevailing utilization); or |
• | the alternate base rate plus an applicable margin of up to 2.00% per annum (based upon the prevailing utilization). The alternate base rate is equal to the highest of (i) Société Générale's prime rate, (ii) the federal funds rate plus 0.50% per annum, or (iii) the reference Eurodollar rate plus 1.00%; or |
• | the rate quoted by Société Générale as its cost of funds for the requested credit plus up to 2.50% per annum, (based upon the prevailing utilization). |
128
The interest rate is generally reduced by 25 basis points if utilization under the Working Capital Line is below fifty percent.
Borrowings under the Acquisition Line are generally determined by reference to:
• | the Eurodollar rate plus an applicable margin of up to 3.75% per annum (based upon the prevailing utilization); or |
• | the alternate base rate plus an applicable margin of up to 2.75% per annum (based upon the prevailing utilization). The alternate base rate is equal to the highest of (i) Société Générale's prime rate, (ii) the federal funds rate plus 0.50% per annum, or (iii) the reference Eurodollar rate plus 1.00%. |
The Co-Borrowers pay an annual commitment fee of 0.375% or 0.50% on the unused portion of the Working Capital Line depending upon the unused capacity and 0.50% on the unused portion of the Acquisition Line. The lending syndicate under the Senior Credit Facility is entitled to several additional fees including an upfront fee, annual agency fee, and fronting fees based on a percentage of the face amount of letters of credit payable to any syndicate member that issues a letter a credit.
The Company has the ability to elect the availability under the Working Capital Line between $40.0 million to $82.5 million. On September 30, 2016, the Company and the Co-Borrowers elected to reduce the capacity of the Working Capital Line from $82.5 million to $60.0 million. At year-end, we elected up to the $70 million level. Availability under the working capital line will be subject to borrowing base limitations. The borrowing base is calculated primarily based on 80% to 90% of the value of eligible accounts receivable and unbilled product sales (depending on the credit quality of the counterparties) and inventory and other working capital assets. The Co-Borrowers must generally seek approval of the agent or the lenders for permitted acquisitions to be financed under the Acquisition Line.
The Senior Credit Facility is secured by pledges of the equity of the portion of Spark HoldCo owned by the Company and of the equity of Spark HoldCo’s subsidiaries (excluding the Major Energy Companies) and the Co-Borrowers’ present and future subsidiaries, all of the Co-Borrowers’ and their subsidiaries’ present and future property and assets, including accounts receivable, inventory and liquid investments, and control agreements relating to bank accounts. The Major Energy Companies are excluded from the definition of "Borrowers" under the Senior Credit Facility. Accordingly, we do not factor in their working capital into our working capital covenants.
The Senior Credit Facility also contains covenants that, among other things, require the maintenance of specified ratios or conditions as follows:
• | Minimum Net Working Capital. The Co-Borrowers must maintain minimum consolidated net working capital equal to the greater of $5.0 million or 15% of the elected availability under the Working Capital Line. |
• | Minimum Adjusted Tangible Net Worth. The Co-Borrowers must maintain a minimum consolidated adjusted tangible net worth at all times equal to the net cash proceeds from equity issuances occurring after the date of the Senior Credit Facility plus the greater of (i) 20% of aggregate commitments under the Working Capital Line plus 33% of borrowings under the Acquisition Line and (ii) $18.0 million. |
• | Minimum Fixed Charge Coverage Ratio. Spark Energy, Inc. must maintain a minimum fixed charge coverage ratio of 1.20 to 1.00 (1.25 to 1.00 commencing March 31, 2017). The Fixed Charge Coverage Ratio is defined as the ratio of (a) Adjusted EBITDA to (b) the sum of consolidated interest expense (other than interest paid-in-kind in respect of any Subordinated Debt), letter of credit fees, commitment fees, acquisition earn-out payments, distributions and scheduled amortization payments. |
129
• | Maximum Total Leverage Ratio. Spark Energy, Inc. must maintain a ratio of total indebtedness (excluding the Working Capital Facility and qualifying subordinated debt) to Adjusted EBITDA of a maximum of 2.50 to 1.00. |
The Senior Credit Facility contains various negative covenants that limit the Company’s ability to, among other things, do any of the following:
• | incur certain additional indebtedness; |
• | grant certain liens; |
• | engage in certain asset dispositions; |
• | merge or consolidate; |
• | make certain payments, distributions, investments, acquisitions or loans; or |
• | enter into transactions with affiliates. |
Spark Energy, Inc. is entitled to pay cash dividends to the holders of the Class A common stock, and Spark HoldCo will be entitled to make cash distributions to NuDevco Retail and Retailco (or their successor in interest) so long as: (a) no default exists or would result from such a payment; (b) the Co- Borrowers are in pro forma compliance with all financial covenants before and after giving effect to such payment and (c) the outstanding amount of all loans and letters of credit does not exceed the borrowing base limits. Spark HoldCo’s inability to satisfy certain financial covenants or the existence of an event of default, if not cured or waived, under the Senior Credit Facility could prevent the Company from paying dividends to holders of the Class A common stock.
The Senior Credit Facility contains certain customary representations and warranties and events of default. Events of default include, among other things, payment defaults, breaches of representations and warranties, covenant defaults, cross-defaults and cross-acceleration to certain indebtedness, change in control in which affiliates of W. Keith Maxwell III own less than 40% of the outstanding voting interests in the Company, certain events of bankruptcy, certain events under ERISA, material judgments in excess of $5.0 million, certain events with respect to material contracts, actual or asserted failure of any guaranty or security document supporting the Senior Credit Facility to be in full force and effect and changes of control. If such an event of default occurs, the lenders under the Senior Credit Facility would be entitled to take various actions, including the acceleration of amounts due under the facility and all actions permitted to be taken by a secured creditor.
In addition, the Senior Credit Facility contains affirmative covenants that are customary for credit facilities of this type. The covenants include delivery of financial statements, including any filings made with the SEC, maintenance of property and insurance, payment of taxes and obligations, material compliance with laws, inspection of property, books and records and audits, use of proceeds, payments to bank blocked accounts, notice of defaults and certain other customary matters.
Convertible Subordinated Notes to Affiliate
In connection with the financing of the CenStar acquisition, the Company, together with Spark HoldCo, issued the CenStar Note to RAC for $2.1 million on July 8, 2015. The CenStar Note matures on July 8, 2020, and bears interest at an annual rate of 5%, payable semiannually. The Company has the right to pay interest in kind at its option. The CenStar Note is convertible into shares of the Company’s Class B common stock, par value $0.01 per share (and a related unit of Spark HoldCo) at a conversion price of $16.57 per share. RAC may not exercise conversion rights for the first eighteen months after the CenStar Note is issued. The CenStar Note is subject to automatic conversion upon a sale of the Company. The CenStar Note is subordinated in certain respects to the Senior Credit Facility pursuant to a subordination agreement. The Company may pay interest and prepay principal so long as the Company is in compliance with its covenants; is not in default under the Senior Credit Facility and has minimum availability of $5.0 million under its borrowing base under the Senior Credit Facility. Shares of Class A common stock resulting from the conversion of the shares of Class B common stock issued as a result of the conversion right under the CenStar Note will be entitled to registration rights identical to the registration rights currently held by NuDevco Retail and Retailco on shares of Class A common stock it receives upon conversion of
130
its existing shares of Class B common stock. On October 5, 2016, RAC issued to the Company an irrevocable commitment to convert the CenStar Note into 134,731 shares of Class B common stock. RAC assigned the CenStar Note to Retailco on January 4, 2017, and on January 8, 2017, the CenStar Note was converted into 134,731 shares of Class B common stock. Please see Note 17 "Subsequent Events."
In connection with the financing of the Oasis acquisition, the Company, together with Spark HoldCo, issued the Oasis Note to RAC for $5.0 million on July 31, 2015. The Oasis Note matures on July 31, 2020, and bears interest at an annual rate of 5%, payable semiannually. The Company has the right to pay-in-kind any interest at its option. The Oasis Note is convertible into shares of the Company's Class B common stock, par value $0.01 per share (and a related unit of Spark HoldCo) at a conversion price of $14.00 per share. RAC may not exercise conversion rights for the first eighteen months after the Oasis Note is issued. The Oasis Note is subject to automatic conversion upon a sale of the Company. The Oasis Note is subordinated in certain respects to the Senior Credit Facility pursuant to a subordination agreement. The Company may pay interest and prepay principal so long as the Company is in compliance with its covenants; is not in default under the Senior Credit Facility and has minimum availability of $5.0 million under its borrowing base under the Senior Credit Facility. Shares of Class A common stock resulting from the conversion of the shares of Class B common stock issued as a result of the conversion right under the Oasis Note will be entitled to registration rights identical to the registration rights currently held by NuDevco Retail and Retailco on shares of Class A common stock it receives upon conversion of its existing shares of Class B common stock. On October 5, 2016, RAC issued to the Company an irrevocable commitment to convert the Oasis Note into 383,090 shares of Class B common stock. RAC assigned the Oasis Note to Retailco on January 4, 2017, and on January 31, 2017 the Oasis Note was converted into 383,090 shares of Class B common stock. Please see Note 17 "Subsequent Events."
The conversion rate of $14.00 per share for the Oasis Note was fixed as of the date of the execution of the Oasis acquisition agreement on May 12, 2015. Due to a rise in the price of our common stock from May 12, 2015 to the closing of Oasis acquisition on July 31, 2015, the conversion rate of $14.00 per share was below the market price per share of Class A common stock of $16.21 on the issuance date of the Oasis Note on July 31, 2015. As a result, the Company assessed the Oasis Note for a beneficial conversion feature. Due to this conversion feature being "in-the-money" upon issuance, we recognized a beneficial conversion feature based on its intrinsic value of $0.8 million as a discount to the Oasis Note and as additional paid-in capital. This discount was amortized as interest expense under the effective interest method over the life of the Oasis Note through December 31, 2016.
Subordinated Debt Facility
On December 27, 2016, we and Spark HoldCo jointly issued to Retailco, an entity owned by our Founder, a 5%
subordinated note in the principal amount of up to $25.0 million. The subordinated note allows the Company and
Spark HoldCo to draw advances in increments of no less than $1.0 million per advance up to the maximum principal amount of the subordinated note. The subordinated note matures approximately 3 ½ years following the date of issuance, and advances thereunder accrue interest at 5% per annum from the date of the advance. The Company has the right to capitalize interest payments under the subordinated note. The subordinated note is subordinated in certain respects to the Company's Senior Credit Facility pursuant to a subordination agreement. The Company may pay interest and prepay principal on the subordinated note so long as it is in compliance with its covenants under the Senior Credit Facility, is not in default under the Senior Credit Facility and has minimum availability of $5.0 million under the borrowing base under the Senior Credit Facility. Payment of principal and interest under the subordinated note is accelerated upon the occurrence of certain change of control or sale transactions. As of December 31, 2016, there were $5.0 million in outstanding borrowings under the subordinated note.
Pacific Summit Energy LLC
The Major Energy Companies acquired by the Company are party to three trade credit arrangements with Pacific Summit Energy LLC (“Pacific Summit”), which consist of purchase agreements, operating agreements relating to purchasing terms, security agreements, lockbox agreements and guarantees, providing for the exclusive supply of gas and electricity on credit by Pacific Summit to the Major Energy Companies for resale to end users.
131
Under these arrangements, when the costs that Pacific Summit has paid to procure and deliver the gas and electricity exceed the payments that the Major Energy Companies have made attributable to the gas and electricity purchased, the Major Energy Companies incur interest on the difference. The operating agreements also allow Pacific Summit to provide credit support. Each form of borrowing incurs interest at the floating 90-day LIBOR rate plus 300 basis points (except for certain credit support guaranties that do not bear interest). In connection with these arrangements, the Major Companies have granted first liens to Pacific Summit on a substantial portion of the Major Companies’ assets, including present and future accounts receivable, inventory, liquid assets, and control agreements relating to bank accounts. As of December 31, 2016, the Company had aggregate outstanding amounts payable under these arrangements of approximately $15.5 million, bearing an interest rate of approximately 4.0%. The Company was also the beneficiary under various credit support guarantees issued by Pacific Summit under these arrangements as of such date. On September 27, 2016, we notified Pacific Summit of our election to trigger the expiration of these arrangements as of March 31, 2017, at the end of the primary term.
8. Fair Value Measurements
Fair value is defined as the price that would be received to sell an asset or paid to transfer a liability (exit price) in an orderly transaction between market participants at the measurement date. Fair values are based on assumptions that market participants would use when pricing an asset or liability, including assumptions about risk and the risks inherent in valuation techniques and the inputs to valuations. This includes not only the credit standing of counterparties involved and the impact of credit enhancements but also the impact of the Company’s own nonperformance risk on its liabilities.
The Company applies fair value measurements to its commodity derivative instruments and a contingent payment arrangement based on the following fair value hierarchy, which prioritizes the inputs to valuation techniques used to measure fair value into three broad levels:
• | Level 1—Quoted prices in active markets for identical assets and liabilities. Instruments categorized in Level 1 primarily consist of financial instruments such as exchange-traded derivative instruments. |
• | Level 2—Inputs other than quoted prices recorded in Level 1 that are either directly or indirectly observable for the asset or liability, including quoted prices for similar assets or liabilities in active markets, quoted prices for identical or similar assets or liabilities in inactive markets, inputs other than quoted prices that are observable for the asset or liability, and inputs that are derived from observable market data by correlation or other means. Instruments categorized in Level 2 primarily include non-exchange traded derivatives such as over-the-counter commodity forwards and swaps and options. |
• | Level 3—Unobservable inputs for the asset or liability, including situations where there is little, if any, observable market activity for the asset or liability. The Level 3 category includes estimated earnout obligations related to the Company's acquisitions. |
As the fair value hierarchy gives the highest priority to quoted prices in active markets (Level 1) and the lowest priority to unobservable data (Level 3), the Company maximizes the use of observable inputs and minimizes the use of unobservable inputs when measuring fair value. In some cases, the inputs used to measure fair value might fall in different levels of the fair value hierarchy. In these cases, the lowest level input that is significant to a fair value measurement in its entirety determines the applicable level in the fair value hierarchy.
Non-Derivative Financial Instruments
The carrying amount of cash and cash equivalents, accounts receivable, accounts receivable—affiliates, accounts payable, accounts payable—affiliates, and accrued liabilities recorded in the consolidated balance sheets approximate fair value due to the short-term nature of these items. The carrying amount of long-term debt recorded in the consolidated balance sheets approximates fair value because of the variable rate nature of the Company’s long-term debt. The fair value of our convertible subordinated notes to affiliates is not determinable for accounting
132
purposes due to the affiliate nature and terms of this instrument with the affiliate. The fair value of the payable pursuant to tax receivable agreement—affiliate is not determinable for accounting purposes due to the affiliate nature and terms of the associated agreement with the affiliate.
Assets and Liabilities Measured at Fair Value on a Recurring Basis
The following tables present assets and liabilities measured and recorded at fair value in the Company’s combined and consolidated balance sheets on a recurring basis by and their level within the fair value hierarchy as of (in thousands):
Level 1 | Level 2 | Level 3 | Total | ||||||||||||
December 31, 2016 | |||||||||||||||
Non-trading commodity derivative assets | $ | 1,511 | $ | 9,385 | $ | — | $ | 10,896 | |||||||
Trading commodity derivative assets | 101 | 430 | — | 531 | |||||||||||
Total commodity derivative assets | $ | 1,612 | $ | 9,815 | $ | — | $ | 11,427 | |||||||
Non-trading commodity derivative liabilities | $ | — | $ | (661 | ) | $ | — | $ | (661 | ) | |||||
Trading commodity derivative liabilities | — | (87 | ) | — | (87 | ) | |||||||||
Total commodity derivative liabilities | $ | — | $ | (748 | ) | $ | — | $ | (748 | ) | |||||
Contingent payment arrangement | $ | — | $ | — | $ | (22,652 | ) | $ | (22,652 | ) | |||||
Level 1 | Level 2 | Level 3 | Total | ||||||||||||
December 31, 2015 | |||||||||||||||
Non-trading commodity derivative assets | $ | — | $ | 200 | $ | — | $ | 200 | |||||||
Trading commodity derivative assets | — | 405 | — | 405 | |||||||||||
Total commodity derivative assets | $ | — | $ | 605 | $ | — | $ | 605 | |||||||
Non-trading commodity derivative liabilities | $ | (3,324 | ) | $ | (7,661 | ) | $ | — | $ | (10,985 | ) | ||||
Trading commodity derivative liabilities | — | (253 | ) | — | (253 | ) | |||||||||
Total commodity derivative liabilities | $ | (3,324 | ) | $ | (7,914 | ) | $ | — | $ | (11,238 | ) | ||||
Contingent payment arrangement | $ | — | $ | — | $ | (500 | ) | $ | (500 | ) | |||||
The Company had no transfers of assets or liabilities between any of the above levels during the years ended December 31, 2016, 2015 and 2014.
The Company’s derivative contracts include exchange-traded contracts fair valued utilizing readily available quoted market prices and non-exchange-traded contracts fair valued using market price quotations available through brokers or over-the-counter and on-line exchanges. In addition, in determining the fair value of the Company’s derivative contracts, the Company applies a credit risk valuation adjustment to reflect credit risk which is calculated based on the Company’s or the counterparty’s historical credit risks. As of December 31, 2016 and 2015, the credit risk valuation adjustment was not material.
The contingent payment arrangements referred to above reflect estimated earnout obligations incurred in relation to the Company's acquisitions. As of December 31, 2016, the estimated earnout obligations were $22.7 million, which was comprised of the Provider Earnout, the Major Earnout and the Stock Earnout in the amount of $4.9 million, $17.1 million, and $0.7 million, respectively. As of December 31, 2015, the estimated earnout obligations were attributed to the CenStar acquisition (the "CenStar Earnout") in the amount of $0.5 million, which was settled by December 31, 2016. As of December 31, 2016, the estimated earnout reside on our consolidated balance sheets in current liabilities - contingent consideration and long-term liabilities - contingent consideration in the amount of $11.8 million and $8.4 million, respectively; and as of December 31, 2015, in current liabilities - contingent consideration in the amount of $0.5 million.
133
The CenStar, Provider, and Major Earnouts are recorded in other current liabilities in the consolidated balance sheet and discussed in Note 3 "Acquisitions."
The CenStar Earnout was based on a financial measurement attributable to the operations of CenStar for the year following the closing of the acquisition. In determining the fair value of the CenStar Earnout, the Company forecasted a one year performance measurement, as defined by the CenStar stock purchase agreement. As this calculation was based on management's estimates of the liability, we had classified the CenStar Earnout as a Level 3 measurement. During the first quarter of 2016, our estimate of the CenStar Earnout was increased to $1.5 million, which was based on the results of operations during such period. In August 2016, we entered into a settlement and release agreement with the seller of CenStar in which the Company paid $1.3 million to such seller and released an additional $0.6 million from escrow in full satisfaction of the earnout obligation under the CenStar stock purchase agreement. During the year ended December 31, 2016, the remaining estimated earnout liability of $0.2 million was written off via a reduction to general and administrative expense in our consolidated statements of operations.
The Provider Earnout is based on achievement by the Provider Companies of a certain customer count criteria over the nine month period following the closing of the Provider Companies acquisition. The sellers of the Provider Companies are entitled to a maximum of $9.0 million and a minimum of $5.0 million in earnout payments based on the level of customer count attained, as defined by the Provider Companies membership interest purchase agreement. During the period from August 1, 2016 (acquisition date) through December 31, 2016, the Company recorded accretion of $0.1 million to reflect the impact of the time value of the liability. The Company has revalued the liability at December 31, 2016 with no expected change of the earnout payments. In determining the fair value of the Provider Earnout, the Company forecasted an expected customer count and certain other related criteria and calculated the probability of such forecast being attained. As this calculation is based on management's estimates of the liability, we classified the Provider Earnout as a Level 3 measurement.
The Major Earnout is based on the achievement by the Major Energy Companies of certain performance targets over the 33 month period following NG&E's closing of the Major Energy Companies acquisition (i.e., April 15, 2016). The previous members of Major Energy Companies are entitled to a maximum of $20.0 million in earnout payments based on the level of performance targets attained, as defined by the Major Purchase Agreement. The Stock Earnout obligation is contingent upon the Major Energy Companies achieving the Major Earnout's performance target ceiling, thereby earning the maximum Major Earnout payments. If the Major Energy Companies earn such maximum Major Earnout payments, NG&E would be entitled to a maximum of 200,000 shares of Class B common stock (and a corresponding number of Spark HoldCo units). In determining the fair value of the Major Earnout and the Stock Earnout, the Company forecasted certain expected performance targets and calculated the probability of such forecast being attained. During the period from April 15, 2016 (NG&E acquisition date) through December 31, 2016, the Company recorded accretion of $5.0 million to reflect the impact of the time value of the liability. The Company revalued the liability at December 31, 2016, resulting in the write-down of the fair value of the liability to $17.8 million. The impact of the $1.1 million decrease in fair value is recorded in general and administrative expenses. As this calculation is based on management's estimates of the liability, we classified the Major Earnout as a Level 3 measurement.
The following tables present reconciliations of liabilities measured at fair value on a recurring basis using significant unobservable inputs (Level 3) for the years ended December 31, 2016 and 2015, respectively.
134
CenStar Earnout | Major Earnout and Stock Earnout | Provider Earnout | Total | ||||||||||||
December 31, 2014 | $ | — | $ | — | $ | — | $ | — | |||||||
Purchase price contingent consideration | 500 | — | — | 500 | |||||||||||
Fair value at December 31, 2015 | $ | 500 | $ | — | $ | — | $ | 500 | |||||||
Purchase price contingent consideration | $ | — | $ | 13,910 | $ | 4,823 | $ | 18,733 | |||||||
Change in fair value of contingent consideration, net | 843 | (1,140 | ) | — | (297 | ) | |||||||||
Accretion of contingent earnout consideration (included within interest expense) | — | 4,990 | 69 | 5,059 | |||||||||||
Settlements (1) | (1,343 | ) | — | — | (1,343 | ) | |||||||||
Fair value at December 31, 2016 | $ | — | $ | 17,760 | $ | 4,892 | $ | 22,652 | |||||||
(1) Settlements include pay downs at maturity
Other Financial Instruments
The carrying amount of cash and cash equivalents, accounts receivable, accounts receivable—affiliates, accounts payable, accounts payable—affiliates, and accrued liabilities recorded in the consolidated balance sheets approximate fair value due to the short-term nature of these items. The carrying amount of the Senior Credit Facility recorded in the consolidated balance sheets approximates fair value because of the variable rate nature of the Company’s line of credit. The fair value of our convertible subordinated notes to affiliates is not determinable for accounting purposes due to the affiliate nature and terms of the associated debt instrument with the affiliate. The fair value of the payable pursuant to tax receivable agreement—affiliate is not determinable for accounting purposes due to the affiliate nature and terms of the associated agreement with the affiliate.
9. Accounting for Derivative Instruments
The Company is exposed to the impact of market fluctuations in the price of electricity and natural gas and basis costs, storage and ancillary capacity charges from independent system operators. The Company uses derivative instruments to manage exposure to these risks, and historically designated certain derivative instruments as cash flow hedges for accounting purposes. For derivatives designated in a qualifying cash flow hedging relationship, the effective portion of the change in fair value is recognized in accumulated other comprehensive income (“OCI”) and reclassified to earnings in the period in which the hedged item affects earnings. Any ineffective portion of the derivative’s change in fair value is recognized currently in earnings.
The Company also holds certain derivative instruments that are not held for trading purposes but are also not designated as hedges for accounting purposes. These derivative instruments represent economic hedges that mitigate the Company’s exposure to fluctuations in commodity prices. For these derivative instruments, changes in the fair value are recognized currently in earnings in retail revenues or retail costs of revenues.
As part of the Company’s strategy to optimize its assets and manage related risks, it also manages a portfolio of commodity derivative instruments held for trading purposes. The Company’s commodity trading activities are subject to limits within the Company’s Risk Management Policy. For these derivative instruments, changes in the fair value are recognized currently in earnings in net asset optimization revenues.
Derivative assets and liabilities are presented net in the Company’s consolidated balance sheets when the derivative instruments are executed with the same counterparty under a master netting arrangement. The Company’s derivative contracts include transactions that are executed both on an exchange and centrally cleared, as well as over-the-counter, bilateral contracts that are transacted directly with a third party. To the extent the Company has paid or received collateral related to the derivative assets or liabilities, such amounts would be presented net against the related derivative asset or liability’s fair value. As of December 31, 2016 and 2015, the Company had paid zero and
135
$0.1 million in collateral, respectively. The specific types of derivative instruments the Company may execute to manage the commodity price risk include the following:
•Forward contracts, which commit the Company to purchase or sell energy commodities in the future;
•Futures contracts, which are exchange-traded standardized commitments to purchase or sell a commodity or financial instrument;
•Swap agreements, which require payments to or from counterparties based upon the differential between two prices for a predetermined notional quantity; and,
•Option contracts, which convey to the option holder the right but not the obligation to purchase or sell a commodity.
The Company has entered into other energy-related contracts that do not meet the definition of a derivative instrument or qualify for the normal purchase or normal sale exception and are therefore not accounted for at fair value including the following:
•Forward electricity and natural gas purchase contracts for retail customer load; and,
•Natural gas transportation contracts and storage agreements.
Volumetric Underlying Derivative Transactions
The following table summarizes the net notional volume buy/(sell) of the Company’s open derivative financial instruments accounted for at fair value, broken out by commodity, as of (in thousands):
Non-trading
Commodity | Notional | December 31, 2016 | December 31, 2015 | ||||
Natural Gas | MMBtu | 8,016 | 7,543 | ||||
Natural Gas Basis | MMBtu | — | 455 | ||||
Electricity | MWh | 3,958 | 1,187 | ||||
Trading
Commodity | Notional | December 31, 2016 | December 31, 2015 | ||||
Natural Gas | MMBtu | (953 | ) | 8 | |||
Natural Gas Basis | MMBtu | (380 | ) | (455 | ) | ||
Gains (Losses) on Derivative Instruments
Gains (losses) on derivative instruments, net and current period settlements on derivative instruments were as follows for the periods indicated (in thousands):
136
Year Ended December 31, | |||||||||||
2016 | 2015 | 2014 | |||||||||
Gain (loss) on non-trading derivatives, net | 22,254 | (18,423 | ) | (8,713 | ) | ||||||
Gain (loss) on trading derivatives, net (including gain on trading derivatives—affiliates, net of $0, $0 and $203 for the years ended December 31, 2016, 2015 and 2014, respectively) | 153 | (74 | ) | (5,822 | ) | ||||||
Gain (loss) on derivatives, net | $ | 22,407 | $ | (18,497 | ) | $ | (14,535 | ) | |||
Current period settlements on non-trading derivatives (1) (2) | (2,284 | ) | 20,279 | (6,289 | ) | ||||||
Current period settlements on trading derivatives (including current period settlements on trading derivatives—affiliates, net of $0, $0 and $315 for the years ended December 31, 2016, 2015 and 2014, respectively) | 138 | 268 | 2,810 | ||||||||
Total current period settlements on derivatives (1) (2) | $ | (2,146 | ) | $ | 20,547 | $ | (3,479 | ) | |||
(1) | Excludes settlements of $1.0 million and $3.4 million, respectively, for the years ended December 31, 2016 and 2015, respectively related to non-trading derivative liabilities assumed in the acquisitions of CenStar and Oasis. |
(2) | Excludes settlements of $25.6 million for the year ended December 31, 2016 related to non-trading derivative liabilities assumed in the acquisitions of Provider Companies and Major Energy Companies. |
Gains (losses) on trading derivative instruments are recorded in net asset optimization revenues, and gains (losses) on non-trading derivative instruments are recorded in retail cost of revenues on the consolidated statements of operations.
Fair Value of Derivative Instruments
The following tables summarize the fair value and offsetting amounts of the Company’s derivative instruments by counterparty and collateral received or paid as of (in thousands):
December 31, 2016 | |||||||||||||||||||
Description | Gross Assets | Gross Amounts Offset | Net Assets | Cash Collateral Offset | Net Amount Presented | ||||||||||||||
Non-trading commodity derivatives | $ | 19,657 | $ | (11,844 | ) | $ | 7,813 | $ | — | $ | 7,813 | ||||||||
Trading commodity derivatives | 614 | (83 | ) | 531 | — | 531 | |||||||||||||
Total Current Derivative Assets | 20,271 | (11,927 | ) | 8,344 | — | 8,344 | |||||||||||||
Non-trading commodity derivatives | 7,874 | (4,791 | ) | 3,083 | — | 3,083 | |||||||||||||
Total Non-current Derivative Assets | 7,874 | (4,791 | ) | 3,083 | — | 3,083 | |||||||||||||
Total Derivative Assets | $ | 28,145 | $ | (16,718 | ) | $ | 11,427 | $ | — | $ | 11,427 | ||||||||
December 31, 2016 | |||||||||||||||||||
Description | Gross Liabilities | Gross Amounts Offset | Net Liabilities | Cash Collateral Offset | Net Amount Presented | ||||||||||||||
Non-trading commodity derivatives | $ | (662 | ) | $ | 69 | $ | (593 | ) | $ | (593 | ) | ||||||||
Trading commodity derivatives | (92 | ) | 5 | (87 | ) | — | (87 | ) | |||||||||||
Total Current Derivative Liabilities | (754 | ) | 74 | (680 | ) | — | (680 | ) | |||||||||||
Non-trading commodity derivatives | (305 | ) | 237 | (68 | ) | — | (68 | ) | |||||||||||
Total Non-current Derivative Liabilities | (305 | ) | 237 | (68 | ) | — | (68 | ) | |||||||||||
Total Derivative Liabilities | $ | (1,059 | ) | $ | 311 | $ | (748 | ) | $ | — | $ | (748 | ) | ||||||
137
December 31, 2015 | |||||||||||||||||||
Description | Gross Assets | Gross Amounts Offset | Net Assets | Cash Collateral Offset | Net Amount Presented | ||||||||||||||
Non-trading commodity derivatives | $ | 589 | $ | (389 | ) | $ | 200 | $ | — | $ | 200 | ||||||||
Trading commodity derivatives | 411 | (6 | ) | 405 | — | 405 | |||||||||||||
Total Current Derivative Assets | 1,000 | (395 | ) | 605 | — | 605 | |||||||||||||
Non-trading commodity derivatives | — | — | — | — | — | ||||||||||||||
Total Non-current Derivative Assets | — | — | — | — | — | ||||||||||||||
Total Derivative Assets | $ | 1,000 | $ | (395 | ) | $ | 605 | $ | — | $ | 605 | ||||||||
December 31, 2015 | |||||||||||||||||||
Description | Gross Liabilities | Gross Amounts Offset | Net Liabilities | Cash Collateral Offset | Net Amount Presented | ||||||||||||||
Non-trading commodity derivatives | $ | (13,618 | ) | $ | 3,151 | $ | (10,467 | ) | $ | 100 | $ | (10,367 | ) | ||||||
Trading commodity derivatives | (320 | ) | 67 | (253 | ) | — | (253 | ) | |||||||||||
Total Current Derivative Liabilities | (13,938 | ) | 3,218 | (10,720 | ) | 100 | (10,620 | ) | |||||||||||
Non-trading commodity derivatives | (950 | ) | 332 | (618 | ) | — | (618 | ) | |||||||||||
Total Non-current Derivative Liabilities | (950 | ) | 332 | (618 | ) | — | (618 | ) | |||||||||||
Total Derivative Liabilities | $ | (14,888 | ) | $ | 3,550 | $ | (11,338 | ) | $ | 100 | $ | (11,238 | ) | ||||||
10. Stock-Based Compensation
Restricted Stock Units
In connection with the IPO, the Company adopted the Spark Energy, Inc. Long-Term Incentive Plan for the employees, consultants and directors of the Company and its affiliates who perform services for the Company. The Long-Term Incentive Plan was amended and restated on September 1, 2016 (as amended and restated, the "LTIP"). The purpose of the LTIP is to provide a means to attract and retain individuals to serve as directors, employees and consultants who provide services to the Company by affording such individuals a means to acquire and maintain ownership of awards, the value of which is tied to the performance of the Company’s Class A common stock. The LTIP provides for grants of cash payments, stock options, stock appreciation rights, restricted stock or units, bonus stock, dividend equivalents, and other stock-based awards with the total number of shares of stock available for issuance under the LTIP not to exceed 1,375,000 shares.
Periodically the Company grants restricted stock units to our officers, employees, non-employee directors and certain employees of our affiliates who perform services for the Company. The restricted stock unit awards vest over approximately one year for non-employee directors and ratably over approximately three or four years for officers, employees, and employees of affiliates, with the initial vesting date occurring in May of the subsequent year. Each restricted stock unit is entitled to receive a dividend equivalent when dividends are declared and distributed to shareholders of Class A common stock. These dividend equivalents shall be retained by the Company, reinvested in additional restricted stock units effective as of the record date of such dividends and vested upon the same schedule as the underlying restricted stock unit.
In accordance with ASC 718, Compensation - Stock Compensation (“ASC 718”), the Company measures the cost of awards classified as equity awards based on the grant date fair value of the award, and the Company measures the cost of awards classified as liability awards at the fair value of the award at each reporting period. The Company has utilized an estimated 6% annual forfeiture rate of restricted stock units in determining the fair value for all awards excluding those issued to executive level recipients and non-employee directors, for which no
138
forfeitures are estimated to occur. The Company has elected to recognize related compensation expense on a straight-line basis over the associated vesting periods.
Although the restricted stock units allow for cash settlement of the awards at the sole discretion of management of the Company, management intends to settle the awards by issuing shares of the Company’s Class A common stock.
Total stock-based compensation expense for the years ended December 31, 2016, 2015 and 2014 was $5.2 million, $3.2 million and $0.9 million. Total income tax benefit related to stock-based compensation recognized in net income (loss) was $2.1 million, $1.2 million and $0.3 million for the years ended December 31, 2016, 2015 and 2014.
Equity Classified Restricted Stock Units
Restricted stock units issued to employees and officers of the Company are classified as equity awards. The fair value of the equity classified restricted stock units is based on the Company’s Class A common stock price as of the grant date. The Company recognized stock based compensation expense of $2.3 million, $2.2 million and $0.5 million for the years ended December 31, 2016, 2015 and 2014, respectively, in general and administrative expense with a corresponding increase to additional paid in capital.
The following table summarizes equity classified restricted stock unit activity and unvested restricted stock units for the year ended December 31, 2016:
Number of Shares (in thousands) | Weighted Average Grant Date Fair Value | ||||
Unvested at December 31, 2015 | 285 | $ | 16.33 | ||
Granted | 153 | 29.77 | |||
Dividend reinvestment issuances | 13 | 26.84 | |||
Vested | (115 | ) | 27.66 | ||
Forfeited | (73 | ) | 18.47 | ||
Unvested at December 31, 2016 | 263 | $ | 19.13 | ||
For the year ended December 31, 2016, 115,271 restricted stock units vested, with 81,864 shares of common stock distributed to the holders of these units and 33,407 shares of common stock withheld by the Company to cover taxes owed on the vesting of such units.
As of December 31, 2016, there was $4.7 million of total unrecognized compensation cost related to the Company’s equity classified restricted stock units, which is expected to be recognized over a weighted average period of approximately 2.9 years.
Liability Classified Restricted Stock Units
Restricted stock units issued to non-employee directors of the Company and employees of certain of our affiliates are classified as liability awards in accordance with ASC 718 as the awards are either to a) non-employee directors that allow for the recipient to choose net settlement for the amount of withholding taxes dues upon vesting or b) to employees of certain affiliates of the Company and are therefore not deemed to be employees of the Company. The fair value of the liability classified restricted stock units is based on the Company’s Class A common stock price as of the reported period ending date. The Company recognized stock based compensation expense of $3.0 million and $1.0 million and $0.3 million for years ended December 31, 2016, 2015 and 2014, respectively, in general and administrative expense with a corresponding increase to liabilities. As of December 31, 2016, the Company’s liabilities related to these restricted stock units recorded in current liabilities was $1.5 million. As of December 31, 2015, the Company's liabilities related to these restricted stock units recorded in current liabilities was $0.7 million.
139
The following table summarizes liability classified restricted stock unit activity and unvested restricted stock units for the year ended December 31, 2016:
Number of Shares (in thousands) | Weighted Average Reporting Date Fair Value | ||||
Unvested at December 31, 2015 | 100 | $ | 20.72 | ||
Granted | 106 | 30.30 | |||
Dividend reinvestment issuances | 7 | 30.30 | |||
Vested | (82 | ) | 27.18 | ||
Forfeited | (5 | ) | 30.30 | ||
Unvested at December 31, 2016 | 126 | $ | 30.30 | ||
For the year ended December 31, 2016, 82,257 restricted stock units vested, with 71,072 shares of common stock distributed to the holders of these units and 11,185 shares of common stock withheld by the Company to cover taxes owed on the vesting of such units.
As of December 31, 2016, there was $2.0 million of total unrecognized compensation cost related to the Company’s liability classified restricted stock units, which is expected to be recognized over a weighted average period of approximately 1.9 years.
11. Income Taxes
The Company is a C-corporation and subject to U.S. federal and state income taxes. The Company reports federal and state income taxes for its share of the partnership income attributable to its ownership in Spark HoldCo and for the income taxes attributable to CenStar, a C-corporation, which is owned by Spark HoldCo. The income tax liability for the partnership does not accrue to the partnership, but rather the investors are responsible for the income taxes based upon the investor's share of the partnership's income. Net income attributable to the non-controlling interest in CenStar includes the provision for income taxes.
The provision (benefit) for income taxes included the following components:
(in thousands) | 2016 | 2015 | 2014 | |||||||||
Current: | ||||||||||||
Federal | $ | 5,361 | $ | 268 | $ | — | ||||||
State | 1,683 | (277 | ) | 173 | ||||||||
Total Current | 7,044 | (9 | ) | 173 | ||||||||
Deferred: | ||||||||||||
Federal | 2,944 | 1,820 | (957 | ) | ||||||||
State | 438 | 163 | (107 | ) | ||||||||
Total Deferred | 3,382 | 1,983 | (1,064 | ) | ||||||||
Provision (benefit) for income taxes | $ | 10,426 | $ | 1,974 | $ | (891 | ) | |||||
The effective income tax rate was 13.7% and 7.1% for the years ended December 31, 2016 and 2015, respectively. The following table reconciles the income tax benefit included in the combined and consolidated statement of operations with income tax expense that would result from application of the statutory federal tax rate, 35% and 34% for the years ended December 31, 2016 and 2015, respectively, to loss before income tax expense (benefit):
140
(in thousands) | 2016 | 2015 | ||||
Expected provision at federal statutory rate | $ | 26,635 | $ | 9,503 | ||
Increase (decrease) resulting from: | ||||||
Non-controlling interest | (17,740 | ) | (7,356 | ) | ||
State income taxes, net of federal income tax effect | 1,346 | (222 | ) | |||
Other | 185 | 49 | ||||
Provision for income taxes | $ | 10,426 | $ | 1,974 | ||
Total income tax expense for the year ended December 31, 2016 differed from amounts computed by applying the U.S. federal statutory tax rates to pre-tax income primarily due to state taxes and the impact of permanent differences between book and taxable income, most notably the income attributable to non-controlling interest. The effective tax rate includes a rate benefit attributable to the fact that Spark HoldCo operates as a limited liability company treated as a partnership for federal and state income tax purposes and is not subject to federal and state income taxes. Accordingly, the portion of earnings attributable to non-controlling interest is subject to tax when reported as a component of the non-controlling interest’s taxable income. The February, April and June 2016 exchanges by Retailco decreased the effective tax rate benefit attributable to non-controlling interest.
The Company accounts for income taxes using the assets and liabilities method. Deferred tax assets and liabilities are recognized for future tax consequences attributable to differences between the financial statement carrying amounts of existing assets and liabilities and those assets and liabilities tax bases. The Company applies existing tax law and the tax rate that the Company expects to apply to taxable income in the years in which those differences are expected to be recovered or settled in calculating the deferred tax assets and liabilities. Effects of changes in tax rates on deferred tax assets and liabilities are recognized in income in the period of the tax rate enactment. A valuation allowance is recorded when it is not more likely than not that some or all of the benefit from the deferred tax asset will be realized.
The adoption of ASU 2015-17 resulted in the reclassification of previously-classified net current deferred taxes of approximately $0.9 million from other current liabilities, resulting in a $23.4 million noncurrent deferred tax asset and a $0.9 million noncurrent deferred tax liability on the Company’s consolidated balance sheet at December 31, 2015. There was no impact to our consolidated balance sheet for the year ended December 31, 2016.
The components of the Company’s deferred tax assets as of December 31, 2016 and 2015 are as follows:
(in thousands) | 2016 | 2015 | ||||
Deferred Tax Assets: | ||||||
Investment in Spark HoldCo | $ | 35,359 | $ | 14,901 | ||
Benefit of TRA Liability | 19,705 | 7,876 | ||||
Other | (17 | ) | 2 | |||
Total deferred tax assets | 55,047 | 22,779 | ||||
Deferred Tax Liabilities: | ||||||
Derivative liabilities | (1,849 | ) | (613 | ) | ||
Intangibles | (1,519 | ) | (1,400 | ) | ||
Property and equipment | (10 | ) | (18 | ) | ||
Federal net operating loss carryforward | 2,076 | 1,488 | ||||
State net operating loss carryforward | 366 | 290 | ||||
Other | (2 | ) | 1 | |||
Total deferred tax liabilities | (938 | ) | (252 | ) | ||
Total deferred tax assets/liabilities | $ | 54,109 | $ | 22,527 | ||
On the IPO date, the Company recorded a net deferred tax asset of $15.6 million related to the step up in tax basis resulting from the purchase by the Company of Spark HoldCo units from NuDevco. In addition, the Company had a long-term liability of $20.7 million to record the effect of the Tax Receivable Agreement liability and a
141
corresponding long-term deferred tax asset of $7.9 million. As of December 31, 2016 and 2015, the Company had a total liability of $49.9 million and $20.7 million, respectively, for the effect of the Tax Receivable Agreement liability classified as a long-term liability. The Company had a long-term deferred tax asset of approximately $20.0 million related to the Tax Receivable Agreement liability. See Note 13 “Transactions with Affiliates” for further discussion.
The Company has a federal net operating loss carry forward totaling $6.5 million expiring in 2036 and a state net operating loss of $6.4 million expiring through 2036. No valuation allowance has been recorded as management believes that there will be sufficient future taxable income to fully utilize deferred tax assets.
The Company periodically assesses whether it is more likely than not that it will generate sufficient taxable income to realize its deferred income tax assets. In making this determination, the Company considers all available positive and negative evidence and makes certain assumptions. The Company considers, among other things, its deferred tax liabilities, the overall business environment, its historical earnings and losses, current industry trends, and its outlook for future years. The Company believes it is more likely than not that the deferred tax assets will be utilized.
On February 3, 2016, Retailco exchanged 1,000,000 of its Spark HoldCo units (together with a corresponding number of shares of Class B common stock) for shares of Class A common stock. The exchange resulted in a step up in tax basis, which gave rise to a deferred tax asset of approximately $8.0 million on the exchange date. In addition, the Company recorded an additional long-term liability as a result of the exchange of approximately $10.3 million pursuant to the Tax Receivable Agreement and a corresponding long-term deferred tax asset of approximately $3.9 million. The initial estimate for the deferred tax asset, net of the liability, under the Tax Receivable Agreement was recorded within additional paid-in capital on our consolidated balance sheet at December 31, 2016.
On April 1, 2016, Retailco exchanged 1,725,000 of its Spark HoldCo units (together with a corresponding number of shares of Class B common stock) for shares of Class A common stock. The exchange resulted in a step up in tax basis, which gave rise to a deferred tax asset of approximately $7.6 million on the exchange date. In addition, the Company recorded an additional long-term liability as a result of the exchange of approximately $10.3 million pursuant to the Tax Receivable Agreement and a corresponding long-term deferred tax asset of approximately $3.9 million. The initial estimate for the deferred tax asset, net of the liability, under the Tax Receivable Agreement was recorded within additional paid-in capital on our consolidated balance sheet at December 31, 2016.
On June 8, 2016, Retailco exchanged 500,000 of its Spark HoldCo units (together with a corresponding number of shares of Class B common stock) for shares of Class A common stock. The exchange resulted in a step up in tax basis, which gave rise to a deferred tax asset of approximately $5.3 million on the exchange date. In addition, the Company recorded an additional long-term liability as a result of the exchange of approximately $6.9 million pursuant to the Tax Receivable Agreement and a corresponding long-term deferred tax asset of approximately $2.6 million. The initial estimate for the deferred tax asset, net of the liability, under the Tax Receivable Agreement was recorded within additional paid-in capital on our consolidated balance sheet at December 31, 2016.
Separate federal and state income tax returns are filed for Spark Energy, Inc., Spark HoldCo and CenStar. The tax years 2011 through 2014 remain open to examination by the major taxing jurisdictions to which the Company is subject to income tax. NuDevco would be responsible for any audit adjustments incurred in connection with transactions occurring up to July 31, 2014 for Spark Energy, Inc. and Spark HoldCo. The last closed audit period of exam was for the 2011 Spark Energy, LLC’s federal tax return and resulted in no adjustments by the IRS. Spark Energy, Inc., Spark HoldCo and CenStar are not currently under any income tax audits.
Accounting for uncertainty in income taxes prescribes a recognition threshold and measurement methodology for the financial statement recognition and measurement of a tax position taken or expected to be taken in a tax return. As of December 31, 2016 and 2015 there was no liability and for the years ended December 31, 2016, 2015 and 2014, there was no expense recorded for interest and penalties associated with uncertain tax positions or
142
unrecognized tax positions. Additionally, the Company does not have unrecognized tax benefits as of December 31, 2016 and 2015.
12. Commitments and Contingencies
From time to time, the Company may be involved in legal, tax, regulatory and other proceedings in the ordinary course of business. Other than proceedings discussed below, management does not believe that we are a party to any litigation, claims or proceedings that will have a material impact on the Company’s combined and consolidated financial condition or results of operations. Liabilities for loss contingencies arising from claims, assessments, litigations or other sources are recorded when it is probable that a liability has been incurred and the amount can be reasonably estimated.
Indirect Tax Audits
The Company is undergoing various types of indirect tax audits spanning from years 2006 to 2016 for which the Company may have additional liabilities arise. At the time of filing these consolidated financial statements, these indirect tax audits are at an early stage and subject to substantial uncertainties concerning the outcome of audit findings and corresponding responses. As of December 31, 2016 we have accrued of $1.8 million related to indirect tax audit. The outcome of these indirect tax audits may result in additional expense.
Legal Proceedings
The Company is the subject of the following lawsuits. At the time of filing these combined and consolidated financial statements, this litigation is at an early stage and subject to substantial uncertainties concerning the outcome of material factual and legal issues. Accordingly, we cannot currently predict the manner and timing of the resolution of this litigation or estimate a range of possible losses or a minimum loss that could result from an adverse verdict in a potential lawsuit.
John Melville et al v. Spark Energy Inc. and Spark Energy Gas, LLC is a purported class action filed on December 17, 2015 in the United States District Court for the District of New Jersey alleging, among other things, that (i) sales representatives engaged as independent contractors for Spark Energy Gas, LLC engaged in deceptive acts in violation of the New Jersey Consumer Fraud Act, (ii) Spark Energy Gas, LLC breach its contract with plaintiff, including a breach of the covenant of good faith and fair dealing. Plaintiffs are seeking unspecified compensatory and punitive damages for the purported class, injunctive relief and/or declaratory relief, disgorgement of revenues and/or profits and attorneys’ fees. On March 14, 2016, Spark Energy Gas, LLC and Spark Energy, Inc. filed a Motion to Dismiss this case. On April 18, 2016, Plaintiff filed his Opposition to the Motion to Dismiss. On April 25, 2016, Spark Energy, Inc. and Spark Energy Gas, LLC filed a Reply in support of their Motion to Dismiss. On November 15, 2016, the Court entered an order granting Spark Energy, Inc. and Spark Energy Gas, LLC’s Motion to Dismiss in Part and dismissed Plaintiff’s breach of covenant of good faith and fair dealing claim as well as Plaintiff’s unjust enrichment claim. On February 15, 2017, Plaintiffs filed an Amended Complaint to try to expand the class to a nation-wide class. The response to this Amended Complaint for Spark Energy, Inc. and Spark Energy Gas, LLC is due on March 15, 2017. Initial discovery has begun. We cannot predict the outcome or consequences of this case.
Halifax-American Energy Company, LLC et al v. Provider Power, LLC, Electricity N.H., LLC, Electricity Maine, LLC, Emile Clavet and Kevin Dean is a lawsuit initially filed on June 12, 2014 in the Rockingham County Superior Court, State of New Hampshire, alleging various claims related to the Provider Companies’ employment of a sales contractor formerly employed with one or more of the plaintiffs, including misappropriation of trade secrets and tortious interference with a contractual relationship. The dispute occurred prior to the Company's acquisition of the Provider Companies. Portions of the original claim proceeded to trial and on January 19, 2016, a jury found in favor of the plaintiff. Damages totaling approximately $0.6 million and attorney’s fees totaling approximately $0.3 million were awarded to the plaintiff. On May 4, 2016, following post-verdict motions, the defendants filed an appeal in the State of New Hampshire Supreme Court, appealing, among other things the failure of the trial court to direct a verdict for the defendants, to set aside the verdict, or grant judgment for the defendants, and the trial court's
143
award of certain attorneys' fees. On August 1, 2016, in connection with the Company’s closing of the acquisition of the Provider Companies, the Provider Companies entered into a joint defense agreement with the remaining defendants. The Provider Companies have posted an appeal bond of $1.0 million in connection with the appeal. On November 2, 2016, a briefing order was distributed by the court. The Provider Companies filed their brief and appendix on December 30, 2016. The opposition brief is due March 1, 2017, and the Provider Companies will have the opportunity to submit a reply brief thereafter. As of December 31, 2016, the Company has accrued approximately $1.0 million in contingent liabilities related to this litigation. Initial damages and attorney's fees have been factored into the purchase price for the Provider Companies and the Company has full indemnity coverage and set-off rights against future price installments for any actual exposure in the appeal.
Katherine Veilleux and Jennifer Chon, individually and on behalf of all other similarly situated v. Electricity Maine. LLC, Provider Power, LLC, Spark Holdco, LLC, Kevin Dean and Emile Clavet is a purported class action lawsuit filed on November 18, 2016 in the United States District Court of Maine, alleging that Electricity Maine, LLC, an entity acquired by Spark Holdco, LLC in 2016, enrolled customers through fraudulent and misleading advertising and promotions. Plaintiffs allege the following claims against all Defendants: violation of the Maine Unfair Trade Practices Act, violation of RICO, negligence, negligent misrepresentation, fraudulent misrepresentation, unjust enrichment and breach of contract. Plaintiffs seek unspecified damages for themselves and the purported class, rescission of contracts with Electricity Maine, injunctive relief, restitution, and attorney’s fees. Defendants’ initial responsive pleading was filed on February 6, 2017. In early February, Spark HoldCo filed a motion to dismiss the claims for which a hearing is expected in the second quarter. Discovery has not yet commenced in this matter but we anticipate it will commence soon. We cannot predict the outcome or consequences of this case. Under the terms of the acquisition, we are indemnified for losses and expenses in connection with this action subject to certain limits.
13. Transactions with Affiliates
The Company enters into transactions with and pays certain costs on behalf of affiliates that are commonly controlled in order to reduce risk, reduce administrative expense, create economies of scale, create strategic alliances and supply goods and services to these related parties. The Company also sells and purchases natural gas and electricity with affiliates. The Company presents receivables and payables with the same affiliate on a net basis in the consolidated balance sheets as all affiliate activity is with parties under common control.
Acquisition of Oasis Power Holdings, LLC
The acquisition of Oasis by the Company from RAC was a transfer of equity interests of entities under common control on July 31, 2015. Refer to Note 3 "Acquisitions" for further discussion.
Master Service Agreement with Retailco Services, LLC
We entered into a Master Service Agreement (the “Master Service Agreement”) effective January 1, 2016 with Retailco Services, LLC ("Retailco Services"), which is wholly owned by our Founder. The Master Service Agreement is for a one-year term and renews automatically for successive one-year terms unless the Master Service Agreement is terminated by either party. Retailco Services provides us with operational support services such as: enrollment and renewal transaction services; customer billing and transaction services; electronic payment processing services; customer services and information technology infrastructure and application support services under the Master Service Agreement. See "Cost Allocations" for further discussion of the fees paid in connection with the Master Service Agreement during the year ended December 31, 2016.
Accounts Receivable and Payable—Affiliates
The Company recorded current accounts receivable—affiliates of $2.6 million and $1.8 million as of December 31, 2016 and 2015, respectively, and current accounts payable—affiliates of $3.8 million and $2.0 million as of December 31, 2016 and 2015 for certain direct billings and cost allocations for services the Company provided to affiliates, services our affiliates provided to us, and sales or purchases of natural gas and electricity with affiliates.
144
Prepaid Assets—Affiliates
The Company prepaid NuDevco Retail and Retailco for costs of certain employee benefits to be provided through the Company’s benefit plans and recorded current prepaid assets—affiliates of zero and $0.2 million as of December 31, 2016 and 2015, respectively.
Convertible Subordinated Notes to Affiliate
In connection with the financing of the CenStar acquisition, the Company, together with Spark HoldCo, issued the CenStar Note to Retailco Acquisition Co, LLC ("RAC"), which is wholly owned by our Founder, for $2.1 million on July 8, 2015. In connection with the financing of the Oasis acquisition, the Company, together with Spark HoldCo, issued the Oasis Note to RAC for $5.0 million on July 31, 2015. On October 5, 2016, RAC became irrevocably bound to convert the CenStar Note and the Oasis Note into shares of Class B common stock on January 8, 2017 and January 31, 2017, respectively. Refer to Note 7 "Debt" for further discussion.
Revenues and Cost of Revenues—Affiliates
The Company and an affiliate are party to an agreement whereby the Company purchases natural gas from an affiliate. Cost of revenues—affiliates, recorded in net asset optimization revenues in the consolidated statements of operations for the years ended December 31, 2016, 2015 and 2014 related to this agreement were $1.6 million, $11.3 million and $30.3 million.
The Company also purchases natural gas at a nearby third party plant inlet that was then sold to the affiliate. Revenues—affiliates, recorded in net asset optimization revenues in the combined and consolidated statements of operations for the years ended December 31, 2016, 2015 and 2014 related to these sales were $0.2 million, $1.1 million, and $12.8 million, respectively.
Additionally, the Company entered into a natural gas transportation agreement with another affiliate at its pipeline, whereby the Company transports retail natural gas and pays the higher of (i) a minimum monthly payment or (ii) a transportation fee per MMBtu times actual volumes transported. The current transportation agreement renews annually on February 28 at a fixed rate per MMBtu without a minimum monthly payment. While this transportation agreement remains in effect, this entity is no longer an affiliate as our Founder terminated his interest in the affiliate on May 16, 2016. Cost of revenues —affiliates, recorded in retail cost of revenues in the consolidated statements of operations related to this activity, was less than $0.1 million for the years ended December 31, 2016, 2015 and 2014, respectively.
Also included in the Company’s results are cost of revenues—affiliates related to derivative instruments, recorded in net asset optimization revenues in the combined and consolidated statements of operations. There were no cost of revenues—affiliates related to derivative instruments for the years ended December 31, 2016 and 2015. We recognized a loss of $0.6 million for the year ended December 31, 2014.
Cost Allocations
The Company paid certain expenses on behalf of affiliates, which are reimbursed by the affiliates to the Company, and our affiliates paid certain expenses on our behalf, which are reimbursed by us. These transactions include costs that can be specifically identified and certain allocated overhead costs associated with general and administrative services, including executive management, due diligence work, recurring management consulting, facilities, banking arrangements, professional fees, insurance, information services, human resources and other support departments to the affiliates. Where costs incurred on behalf of the affiliate or us could not be determined by specific identification for direct billing, the costs were primarily allocated to the affiliated entities or us based on percentage of departmental usage, wages or headcount. The total net amount direct billed and allocated from affiliates was $17.0 million, $2.1 million and $5.1 million for the years ended December 31, 2016, 2015 and 2014, respectively.
145
Of the $17.0 million total net amount directly billed and allocated to affiliates, the Company recorded general and administrative expense of $14.7 million for the year ended December 31, 2016, in the consolidated statement of operations in connection with fees paid, net of damages charged, under the Master Service Agreement with Retailco Services. Additionally under the Master Service Agreement, we capitalized $1.3 million of property and equipment for the application, development and implementation of various systems during the year ended December 31, 2016. The remaining amount was direct billed and allocated from other affiliates and recorded as general and administrative expense in the consolidated statement of operations.
The total net amount direct billed and allocated to affiliates was $2.1 million and $5.1 million for the years ended December 31, 2015, and 2014, respectively, which was recorded as a reduction in general and administrative expense in the consolidated statement of operations.
Prior to May 2014, the Company paid residual commissions to an affiliate for all customers enrolled by the affiliate who pay their monthly retail gas or retail electricity bill. Commissions paid to the affiliate was less than $0.1 million for the year ended December 31, 2014, which is recorded in general and administrative expense in the combined and consolidated statements of operations. This agreement with the affiliate was terminated in May 2014.
Distributions to and Contributions from Affiliates
During the years ended December 31, 2016, 2015 and 2014, the Company made net capital distributions to NuDevco Retail and Retailco of $23.7 million, $15.6 million and $36.4 million, respectively, in conjunction with the payment of quarterly distributions attributable to its Spark HoldCo units. During the year ended December 31, 2016, the Company made distributions to NuDevco Retail and Retailco for gross-up distributions of $11.3 million in connection with distributions made between Spark HoldCo and Spark Energy, Inc. for payment of income taxes incurred by Spark Energy, Inc. Additionally, during the year ended December 31, 2015, the Company received a capital contribution from NuDevco of $0.1 million as NuDevco forgave an account payable due to NuDevco that arose from the payment of withholding taxes related to the vesting of restricted stock units of certain employees of NuDevco who perform services for the Company.
In contemplation of the Company’s IPO, the Company entered into an agreement with an affiliate in April 2014 to permanently forgive all net outstanding accounts receivable balances from the affiliate through the IPO date. As such, the accounts receivable balances from the affiliate have been eliminated and presented as a distribution to our Founder for the year ended December 31, 2014.
Proceeds from Disgorgement of Stockholder Short-swing Profits
During the year ended December 31, 2016, the Company recorded $1.6 million from Retailco for the disgorgement of stockholder short-swing profits under Section 16(b) under the Exchange Act. Of the $1.6 million, the Company received $0.9 million cash during the year ended December 31, 2016 and received $0.7 million cash in January 2017. The amount was recorded as an increase to additional paid-in capital in our consolidated balance sheet.
Class B Common Stock
In connection with the Major Energy Companies acquisition, the Company issued Retailco 2,000,000 shares of Class B common stock (and a corresponding number of Spark HoldCo units) to NG&E. In connection with the financing of the Provider Companies acquisition, the Company sold 699,742 shares of Class B common stock (and a corresponding number of Spark HoldCo units) to RetailCo, valued at $14.0 million based on a value of $20 per share. See Note 3 "Acquisitions" for further discussion.
Subordinated Debt Facility
On December 27, 2016, the Company and Spark HoldCo jointly issued to Retailco, an entity owned by our Founder, a 5% subordinated note in the principal amount of up to $25.0 million. The subordinated note allows the Company and Spark HoldCo to draw advances in increments of no less than $1.0 million per advance up to the
146
maximum principal amount of the subordinated note. The subordinated note matures approximately three and a half years following the date of issuance, and advances thereunder accrue interest at 5% per annum from the date of the advance. The Company has the right to capitalize interest payments under the subordinated note. The subordinated note is subordinated in certain respects to the Company's Senior Credit Facility pursuant to a subordination agreement. The Company may pay interest and prepay principal on the subordinated note so long as it is in compliance with its covenants under the Senior Credit Facility, is not in default under the Senior Credit Facility and has minimum availability of $5.0 million under its borrowing base under the Senior Credit Facility. Payment of principal and interest under the subordinated note is accelerated upon the occurrence of certain change of control or sale transactions. As of December 31, 2016, there were $5.0 million in outstanding borrowings under the subordinated note.
Tax Receivable Agreement
Concurrently with the closing of the IPO, the Company entered into a Tax Receivable Agreement with Spark HoldCo, NuDevco Retail Holdings and NuDevco Retail.
The Company is party to a Tax Receivable Agreement with Spark HoldCo, NuDevco Retail Holdings and NuDevco Retail. This agreement generally provides for the payment by the Company to Retailco, LLC (as the successor to NuDevco Retail Holdings) and NuDevco Retail of 85% of the net cash savings, if any, in U.S. federal, state and local income tax or franchise tax that the Company actually realizes (or is deemed to realize in certain circumstances) in future periods as a result of (i) any tax basis increases resulting from the purchase by the Company of Spark HoldCo units from NuDevco Retail Holdings, (ii) any tax basis increases resulting from the exchange of Spark HoldCo units for shares of Class A common stock pursuant to the Exchange Right (or resulting from an exchange of Spark HoldCo units for cash pursuant to the Cash Option) and (iii) any imputed interest deemed to be paid by the Company as a result of, and additional tax basis arising from, any payments the Company makes under the Tax Receivable Agreement. The Company retains the benefit of the remaining 15% of these tax savings. See Note 11 “Income Taxes” for further discussion.
In certain circumstances, the Company may defer or partially defer any payment due (a “TRA Payment”) to the holders of rights under the Tax Receivable Agreement, which are currently Retailco and NuDevco Retail. During the five-year period ending September 30, 2019, the Company will defer all or a portion of any TRA Payment owed pursuant to the Tax Receivable Agreement to the extent that Spark HoldCo does not generate sufficient Cash Available for Distribution (as defined below) during the four-quarter period ending September 30th of the applicable year in which the TRA Payment is to be made in an amount that equals or exceeds 130% (the “TRA Coverage Ratio”) of the Total Distributions (as defined below) paid in such four-quarter period by Spark HoldCo. For purposes of computing the TRA Coverage Ratio:
• | “Cash Available for Distribution” is generally defined as the Adjusted EBITDA of Spark HoldCo for the applicable period, less (i) cash interest paid by Spark HoldCo, (ii) capital expenditures of Spark HoldCo (exclusive of customer acquisition costs) and (iii) any taxes payable by Spark HoldCo; and |
• | “Total Distributions” are defined as the aggregate distributions necessary to cause the Company to receive distributions of cash equal to (i) the targeted quarterly distribution the Company intends to pay to holders of its Class A common stock payable during the applicable four-quarter period, plus (ii) the estimated taxes payable by the Company during such four-quarter period, plus (iii) the expected TRA Payment payable during the calendar year for which the TRA Coverage Ratio is being tested. |
In the event that the TRA Coverage Ratio is not satisfied in any calendar year, the Company will defer all or a portion of the TRA Payment to NuDevco Retail or Retailco under the Tax Receivable Agreement to the extent necessary to permit Spark HoldCo to satisfy the TRA Coverage Ratio (and Spark HoldCo is not required to make and will not make the pro rata distributions to its members with respect to the deferred portion of the TRA Payment). If the TRA Coverage Ratio is satisfied in any calendar year, the Company will pay NuDevco Retail or Retailco the full amount of the TRA Payment.
147
Following the five-year deferral period ending September 30, 2019, the Company will be obligated to pay any outstanding deferred TRA Payments to the extent such deferred TRA Payments do not exceed (i) the lesser of the Company’s proportionate share of aggregate Cash Available for Distribution of Spark HoldCo during the five-year deferral period or the cash distributions actually received by the Company during the five-year deferral period, reduced by (ii) the sum of (a) the aggregate target quarterly dividends (which, for the purposes of the Tax Receivable Agreement, will be $0.3625 per share per quarter) during the five-year deferral period, (b) the Company’s estimated taxes during the five-year deferral period, and (c) all prior TRA Payments and (y) if with respect to the quarterly period during which the deferred TRA Payment is otherwise paid or payable, Spark HoldCo has or reasonably determines it will have amounts necessary to cause the Company to receive distributions of cash equal to the target quarterly distribution payable during that quarterly period. Any portion of the deferred TRA Payments not payable due to these limitations will no longer be payable.
We did not meet the threshold coverage ratio required to fund the first payment to Retailco under the Tax Receivable Agreement during the four-quarter period ended September 30, 2015. As such, the initial payment under the Tax Receivable Agreement due in late 2015 was deferred pursuant to the terms thereof.
We met the threshold coverage ratio required to fund the first TRA Payment to Retailco and NuDevco Retail under the Tax Receivable Agreement during the four-quarter period ending September 30, 2016, resulting in an initial TRA Payment of $1.4 million becoming due in December 2016. On November 6, 2016, Retailco and NuDevco Retail granted the Company the right to defer the TRA Payment until May 2018. During the period of time when the Company has elected to defer the TRA Payment, the outstanding payment amount will accrue interest at a rate calculated in the manner provided for under the Tax Receivable Agreement. The liability has been classified as non-current in our consolidated balance sheet at December 31, 2016.
On November 6, 2016, Retailco and NuDevco Retail waived their right to receive an approximate $1.4 million payment for the Tax Receivable Agreement that was due from the Company on December 15, 2016. The Company has been given the right to defer this payment for up to eighteen months, subject to interest at the rate agreed to in the Tax Receivable Agreement. The liability has been classified as non-current as of December 31, 2016.
14. Segment Reporting
The Company’s determination of reportable business segments considers the strategic operating units under which the Company makes financial decisions, allocates resources and assesses performance of its retail and asset optimization businesses.
The Company’s reportable business segments are retail natural gas and retail electricity. The retail natural gas segment consists of natural gas sales to, and natural gas transportation and distribution for, residential and commercial customers. Asset optimization activities, considered an integral part of securing the lowest price natural gas to serve retail gas load, are part of the retail natural gas segment. The Company recorded asset optimization revenues of $133.0 million, $154.1 million and $284.6 million and asset optimization cost of revenues of $133.6 million, $152.6 million and $282.3 million for the years ended December 31, 2016, 2015 and 2014, respectively, which are presented on a net basis in asset optimization revenues. The retail electricity segment consists of electricity sales and transmission to residential and commercial customers. Corporate and other consists of expenses and assets of the retail natural gas and retail electricity segments that are managed at a consolidated level such as general and administrative expenses.
The acquisitions of CenStar, Oasis in 2015 and acquisitions of Major Energy Companies and Provider Energy Companies in 2016 had no impact on our reportable business segments as the portions of those acquisitions related to retail natural gas and retail electricity have been included in those existing business segments.
To assess the performance of the Company’s operating segments, the Chief Operating Decision Maker analyzes retail gross margin. The Company defines retail gross margin as operating income (loss) plus (i) depreciation and amortization expenses and (ii) general and administrative expenses, less (i) net asset optimization revenues (expenses), (ii) net gains (losses) on non-trading derivative instruments, and (iii) net current period cash settlements
148
on non-trading derivative instruments. The Company deducts net gains (losses) on non-trading derivative instruments, excluding current period cash settlements, from the retail gross margin calculation in order to remove the non-cash impact of net gains and losses on non-trading derivative instruments.
Retail gross margin is a primary performance measure used by our management to determine the performance of our retail natural gas and electricity business by removing the impacts of our asset optimization activities and net non-cash income (loss) impact of our economic hedging activities. As an indicator of our retail energy business’ operating performance, retail gross margin should not be considered an alternative to, or more meaningful than, operating income, as determined in accordance with GAAP.
Below is a reconciliation of retail gross margin to income before income tax expense (in thousands).
Years Ended December 31, | ||||||||||||
(in thousands) | 2016 | 2015 | 2014 | |||||||||
Reconciliation of Retail Gross Margin to Income before taxes | ||||||||||||
Income before income tax expense | $ | 76,099 | $ | 27,949 | $ | (5,156 | ) | |||||
Interest and other income | (957 | ) | (324 | ) | (263 | ) | ||||||
Interest expense | 8,859 | 2,280 | 1,578 | |||||||||
Operating Income | 84,001 | 29,905 | (3,841 | ) | ||||||||
Depreciation and amortization | 32,788 | 25,378 | 22,221 | |||||||||
General and administrative | 84,964 | 61,682 | 45,880 | |||||||||
Less: | ||||||||||||
Net asset optimization (expenses) revenue | (586 | ) | 1,494 | 2,318 | ||||||||
Net, Gain (losses) on non-trading derivative instruments | 22,254 | (18,423 | ) | (8,713 | ) | |||||||
Net, Cash settlements on non-trading derivative instruments | (2,284 | ) | 20,279 | (6,289 | ) | |||||||
Retail Gross Margin | $ | 182,369 | $ | 113,615 | $ | 76,944 | ||||||
The Company uses retail gross margin and net asset optimization revenues as the measure of profit or loss for its business segments. This measure represents the lowest level of information that is provided to the chief operating decision maker for our reportable segments.
Financial data for business segments are as follows (in thousands):
Year Ended December 31, 2016 | Retail Electricity | Retail Natural Gas | Corporate and Other | Eliminations | Spark Retail | ||||||||||||||
Total Revenues | $ | 417,229 | $ | 129,468 | $ | — | $ | — | $ | 546,697 | |||||||||
Retail cost of revenues | 286,795 | 58,149 | — | — | 344,944 | ||||||||||||||
Less: | |||||||||||||||||||
Net asset optimization revenues | — | (586 | ) | — | — | (586 | ) | ||||||||||||
Net, Gains (losses) on non-trading derivative instruments | 17,187 | 5,067 | — | — | 22,254 | ||||||||||||||
Current period settlements on non-trading derivatives | (4,889 | ) | 2,605 | — | — | (2,284 | ) | ||||||||||||
Retail gross margin | $ | 118,136 | $ | 64,233 | $ | — | $ | — | $ | 182,369 | |||||||||
Total Assets | $ | 577,695 | $ | 242,739 | $ | 169,404 | $ | (613,670 | ) | $ | 376,168 | ||||||||
Goodwill | $ | 76,617 | $ | 2,530 | $ | — | $ | — | $ | 79,147 | |||||||||
149
Year Ended December 31, 2015 | Retail Electricity | Retail Natural Gas | Corporate and Other | Eliminations | Spark Retail | ||||||||||||||
Total Revenues | $ | 229,490 | $ | 128,663 | $ | — | $ | — | $ | 358,153 | |||||||||
Retail cost of revenues | 170,684 | 70,504 | — | — | 241,188 | ||||||||||||||
Less: | |||||||||||||||||||
Net asset optimization revenues | — | 1,494 | — | — | 1,494 | ||||||||||||||
Net, Gains (losses) on non-trading derivative instruments | (13,348 | ) | (5,075 | ) | — | — | (18,423 | ) | |||||||||||
Current period settlements on non-trading derivatives | 11,899 | 8,380 | — | — | 20,279 | ||||||||||||||
Retail gross margin | $ | 60,255 | $ | 53,360 | $ | — | $ | — | $ | 113,615 | |||||||||
Total Assets | $ | 150,245 | $ | 113,583 | $ | 88,823 | $ | (190,417 | ) | $ | 162,234 | ||||||||
Goodwill | $ | 16,476 | $ | 1,903 | $ | — | $ | — | $ | 18,379 | |||||||||
Year Ended December 31, 2014 | Retail Electricity | Retail Natural Gas | Corporate and Other | Eliminations | Spark Retail | ||||||||||||||
Total Revenues | $ | 176,406 | $ | 146,470 | $ | — | $ | — | $ | 322,876 | |||||||||
Retail cost of revenues | 149,452 | 109,164 | — | — | 258,616 | ||||||||||||||
Less: | |||||||||||||||||||
Net asset optimization revenues | — | 2,318 | — | — | 2,318 | ||||||||||||||
Net, Gains (losses) on non-trading derivative instruments | (518 | ) | (8,195 | ) | — | — | (8,713 | ) | |||||||||||
Current period settlements on non-trading derivatives | (5,145 | ) | (1,144 | ) | — | — | (6,289 | ) | |||||||||||
Retail gross margin | $ | 32,617 | $ | 44,327 | $ | — | $ | — | $ | 76,944 | |||||||||
Total Assets | $ | 46,848 | $ | 101,711 | $ | 27,285 | $ | (37,447 | ) | $ | 138,397 | ||||||||
Significant Customers
For each of the years ended December 31, 2016, 2015 and 2014, the Company did not have any significant customers that individually accounted for more than 10% of the Company’s combined and consolidated retail revenue.
Significant Suppliers
For the years ended December 31, 2016, 2015 and 2014, the Company had two, one and one significant suppliers, respectively, that individually accounted for more than 10% of the Company’s combined and consolidated retail cost of revenues and net asset optimization.
15. Customer Acquisitions
During the first quarter of 2015, the Company entered into a purchase and sale agreement for the purchase of approximately 9,500 RCEs in Northern California for a purchase price of $2.0 million. The transaction closed in April 2015. The purchase price was capitalized as customer relationships in our consolidated balance sheet and is being amortized over a three-year period as customers use natural gas under a contract with the Company.
During the fourth quarter of 2014, the Company entered into two purchase and sale agreements for the purchase of approximately 12,500 RCEs in Connecticut for a purchase price of approximately $2.2 million. The purchase prices are capitalized as customer relationships to be amortized over a three year period as customers begin using electricity under a contract with the Company. As of December 31, 2014 the Company had paid and capitalized approximately $1.5 million related to these purchases.
150
16. Equity Method Investment
Investment in eREX Spark Marketing Co., Ltd
In September 2015, the Company and Spark HoldCo, together with eREX Co., Ltd., a Japanese company, entered into an agreement ("eREX JV Agreement") to form a new joint venture, eREX Spark Marketing Co., Ltd ("eREX Spark"). As part of this agreement, the Company made contributions of 156.4 million Japanese Yen, or $1.4 million, for 20% ownership of eREX Spark. The Company is entitled to share in 30% of the dividends distributed by eREX Spark for the first year a qualifying dividend is paid and for the subsequent four years thereafter. After this period, dividends will be distributed proportionately with the equity ownership of eREX Spark. eREX Spark's board of directors consists of four directors, one of whom is appointed by the Company.
Based on the Company's significant influence, as reflected by the 20% equity ownership and 25% control of the eREX Spark board of directors, we recorded the investment in eREX Spark as an equity method investment. Our investment in eREX Spark was $2.3 million as of December 31, 2016, reflecting contributions made by the Company through December 31, 2016 and our proportionate share of earnings as determined under the HLBV method as of December 31, 2016, and recorded in other assets in the consolidated balance sheet. There were no basis differences between our initial contribution and the underlying net assets of eREX Spark. We recorded our proportionate share of eREX Spark's earnings of $0.9 million in our combined and consolidated statement of operations for the year ended December 31, 2016.
17. Subsequent Events
Acquisition from NG&E
The Company has entered into a letter agreement with NG&E for the acquisition of approximately 19,000 RCEs with an option to acquire an additional 41,000 RCEs. The Company will pay approximately $2.2 million in cash, subject to working capital adjustments.
Declaration of Dividends
On January 19, 2017, the Company declared a dividend of $0.3625 per share to holders of record of our Class A common stock on March 1, 2017 that will be paid on March 16, 2017.
Conversion of CenStar and Oasis Notes
On October 5, 2016, RAC issued to the Company an irrevocable commitment to convert the CenStar Note and Oasis Note into 134,731 and 383,090 shares, respectively, of Class B common stock (and related Spark HoldCo units). RAC assigned the CenStar Note and Oasis Note to Retailco on January 4, 2017, and on January 8, 2017 and January 31, 2017, the CenStar Note and Oasis Note were converted into 134,731 and 383,090 shares of Class B common stock, respectively. See Note 7 "Debt."
151
Supplemental Quarterly Financial Data (unaudited)
Summarized unaudited quarterly financial data is as follows:
Quarter Ended | |||||||||||||||
2016 | |||||||||||||||
December 31, 2016 | September 30, 2016 | June 30, 2016 (1) | March 31, 2016 | ||||||||||||
(In thousands, except per share data) | |||||||||||||||
Total Revenues | $ | 168,676 | $ | 158,094 | $ | 109,381 | $ | 110,546 | |||||||
Operating income | 33,098 | 8,960 | 24,366 | 17,577 | |||||||||||
Net income | 24,137 | 6,801 | 18,994 | 15,741 | |||||||||||
Net income attributable to Spark Energy, Inc. stockholders | 7,747 | 183 | 2,341 | 4,173 | |||||||||||
Net income attributable to Spark Energy, Inc. per common share - basic | $ | 1.19 | $ | 0.03 | $ | 0.09 | $ | 1.11 | |||||||
Net (loss) income attributable to Spark Energy, Inc. per common share - diluted | $ | 1.04 | $ | (0.04 | ) | $ | 0.41 | $ | 0.68 | ||||||
(1) | Financial information has been recast to include results attributable to the acquisition of Major Energy Companies by an affiliate on April 15, 2016. See Notes 2 and 3 "Basis of Presentation and Summary of Significant Accounting Policies" and "Acquisitions," respectively, for further discussion. |
Quarter Ended | |||||||||||||||
2015 | |||||||||||||||
December 31, 2015 | September 30, 2015 | June 30, 2015 (1) | March 31, 2015 | ||||||||||||
(In thousands, except per share data) | |||||||||||||||
Total Revenues | $ | 94,840 | $ | 91,267 | $ | 70,243 | $ | 101,803 | |||||||
Operating income | 4,374 | 7,250 | 4,545 | 13,736 | |||||||||||
Net income | 3,132 | 5,875 | 4,039 | 12,929 | |||||||||||
Net (loss) income attributable to Spark Energy, Inc. stockholders | (19 | ) | 1,314 | 161 | 2,409 | ||||||||||
Net (loss) income attributable to Spark Energy, Inc. per common share - basic | $ | (0.01 | ) | $ | 0.42 | $ | 0.05 | $ | 0.80 | ||||||
Net (loss) income attributable to Spark Energy, Inc. per common share - diluted | $ | (0.01 | ) | $ | 0.31 | $ | 0.05 | $ | 0.80 | ||||||
(1) | Financial information has been recast to include results attributable to the acquisition of Oasis Power Holdings LLC on May 12, 2015 from an affiliate. See Note 3 "Acquisitions" for further discussion. |
152
Item 9. Changes in and Disagreements with Accountants on Accounting and Financial Disclosure
None.
Item 9A. Controls and Procedures
Evaluation of Disclosure Controls and Procedures
Our management, with the participation of our Chief Executive Officer and our Chief Financial Officer, has evaluated the effectiveness of our disclosure controls and procedures as of the end of the period covered by this Annual Report on Form 10-K. The term “disclosure controls and procedures,” as defined in Rules 13a-15(e) and 15d-15(e) under the Exchange Act means controls and other procedures of a company that are designed to ensure that information required to be disclosed by a company in the reports that it files or submits under the Exchange Act is recorded, processed, summarized and reported, within the time periods specified in the SEC’s rules and forms. Disclosure controls and procedures include, without limitation, controls and procedures designed to ensure that information required to be disclosed by a company in the reports that it files or submits under the Exchange Act is accumulated and communicated to the company’s management, including its principal executive and principal financial officers or persons performing similar functions, as appropriate to allow timely decisions regarding required disclosure. Management recognizes that any controls and procedures, no matter how well designed and operated, can provide only reasonable assurance of achieving their objectives, and management necessarily applies its judgment in evaluating the cost benefit relationship of possible controls and procedures. Based on this evaluation, management concluded that our disclosure controls and procedures were effective as of December 31, 2016 at the reasonable assurance level.
Management's Annual Report on Internal Control Over Financial Reporting
See "Management's Report on Internal Control Over Financial Reporting" under Item 8 of this Annual Report on Form 10-K.
Attestation Report of the Independent Registered Public Accounting Firm
This Annual Report on Form 10-K does not include an attestation report of our independent registered public accounting firm on our internal control over financial reporting because Section 103 of the JOBS Act provides that an emerging growth company is not required to provide an auditor's report on internal control over financial reporting for as long as we qualify as an emerging growth company.
Changes in Internal Control over Financial Reporting
Other than as described above, there was no change in our internal control over financial reporting identified in connection with the evaluation required by Rule 13a-15(d) and 15d-15(d) of the Exchange Act that occurred during the three months ended December 31, 2016 that has materially affected, or is reasonably likely to materially affect, our internal control over financial reporting.
Item 9B. Other Information
None.
153
PART III.
Item 10. Directors, Executive Officers and Corporate Governance
Information as to Item 10 will be set forth in the Proxy Statement for the 2017 Annual Meeting of Shareholders (the “Annual Meeting”) and is incorporated herein by reference.
Item 11. Executive Compensation
Information as to Item 11 will be set forth in the Proxy Statement for the Annual Meeting and is incorporated herein by reference.
Item 12. Security Ownership of Certain Beneficial Owners and Management and Related Stockholder Matters
Information as to Item 12 will be set forth in the Proxy Statement for the Annual Meeting and is incorporated herein by reference.
Item 13. Certain Relationships and Related Transactions, and Director Independence
Information as to Item 13 will be set forth in the Proxy Statement for the Annual Meeting and is incorporated herein by reference.
Item 14. Principal Accounting Fees and Services
Information as to Item 14 will be set forth in the Proxy Statement for the Annual Meeting and is incorporated herein by reference.
PART IV.
Item 15. Exhibits, Financial Statement Schedules
(1) The combined and consolidated financial statements of Spark Energy, Inc. and its subsidiaries and the report of the independent registered public accounting firm are included in Part II, Item 8 of this Form 10-K.
(2) All schedules have been omitted because they are not required under the related instructions, are not applicable or the information is presented in the combined and consolidated financial statements or related notes.
(3) The exhibits listed on the accompanying Exhibit Index are filed as part of, or incorporated by reference into, this Form 10-K.
154
Item 16. Form 10-K Summary
None.
SIGNATURES
Pursuant to the requirements of the Securities Exchange Act of 1934, as amended, the registrant has duly caused this report to be signed on its behalf by the undersigned, thereunto duly authorized.
March 2, 2017 | Spark Energy, Inc. | ||||
By: | /s/ Robert Lane | ||||
Robert Lane | |||||
Chief Financial Officer (Principal Financial Officer and Principal Accounting Officer) | |||||
Pursuant to the requirements of the Securities Exchange Act of 1934, this report has been signed by the following persons on behalf of the registrant in the capacities indicated on March 2, 2017: | |||||
By: | /s/ Nathan Kroeker | ||||
Nathan Kroeker | |||||
Director, President and Chief Executive Officer | |||||
/s/ W. Keith Maxwell III | |||||
W. Keith Maxwell III | |||||
Chairman of the Board of Directors, Director | |||||
/s/ Robert Lane | |||||
Robert Lane | |||||
Chief Financial Officer (Principal Financial Officer and Principal Accounting Officer) | |||||
/s/ James G. Jones II | |||||
James G. Jones II | |||||
Director | |||||
/s/ Nick Evans Jr. | |||||
Nick Evans Jr. | |||||
Director | |||||
/s/ Kenneth M. Hartwick | |||||
Kenneth M. Hartwick | |||||
Director | |||||
155
INDEX TO EXHIBITS | |||||||
Incorporated by Reference | |||||||
Exhibit | Exhibit Description | Form | Exhibit Number | Filing Date | SEC File No. | ||
2.1# | Membership Interest Purchase Agreement, by and among Spark Energy, Inc., Spark HoldCo, LLC, Provider Power, LLC, Kevin B. Dean and Emile L. Clavet, dated as of May 3, 2016. | 10-Q | 2.1 | 5/5/2016 | 001-36559 | ||
2.2# | Membership Interest Purchase Agreement, by and among Spark Energy, Inc., Spark HoldCo, LLC, Retailco, LLC and National Gas & Electric, LLC, dated as of May 3, 2016. | 10-Q | 2.2 | 5/5/2016 | 001-36559 | ||
2.3# | Amendment No. 1 to the Membership Interest Purchase Agreement, dated as of July 26, 2016, by and among Spark Energy, Inc., Spark HoldCo, LLC, Provider Power, LLC, Kevin B. Dean and Emile L. Clavet. | 8-K | 2.1 | 8/1/2016 | 001-36559 | ||
3.1 | Amended and Restated Certificate of Incorporation of Spark Energy, Inc. | 8-K | 3.1 | 8/4/2014 | 001-36559 | ||
3.2 | Amended and Restated Bylaws of Spark Energy, Inc. | 8-K | 3.2 | 8/4/2014 | 001-36559 | ||
4.1 | Class A Common Stock Certificate | S-1 | 4.1 | 6/30/2014 | 333-196375 | ||
4.2 | Convertible Subordinated Promissory Note of Spark HoldCo, LLC and Spark Energy, Inc. dated July 8, 2015 payable to Retailco Acquisition Co, LLC | 10-Q | 10.8 | 8/13/2015 | 001-36559 | ||
4.3 | Convertible Subordinated Promissory Note of Spark HoldCo, LLC and Spark Energy, Inc. dated July 31, 2015 payable to Retailco Acquisition Co, LLC | 10-Q | 10.9 | 8/13/2015 | 001-36559 | ||
10.1 | Amended and Restated Credit Agreement, dated as of July 8, 2015, among Spark Energy, Inc., as parent, Spark HoldCo, LLC, Spark Energy, LLC, Spark Energy Gas, LLC, CenStar Energy Corp, and CenStar Operating Company, LLC, as co-borrowers, Société Générale, as administrative agent, an Issuing Bank and a Bank, and SG Americas Securities, LLC and Compass Bank, as co-lead arranger, SG Americas Securities, LLC, as sole bookrunner, Compass Bank, as syndication agent, Cooperative Centrale Raiffeisen-Boerenleenbank B.A., “Rabobank Nederland,” New York Branch, as documentation agent, and the other financial institutions signatory thereto. | 8-K | 10.1 | 7/9/2015 | 001-36559 | ||
10.2 | Amendment No. 1 to Amended and Restated Credit Agreement, dated October 30, 2015 and effective as of October 31, 2015, by and among Spark HoldCo, LLC, Spark Energy, LLC, Spark Energy Gas, LLC, CenStar Energy Corp, CenStar Operating Company, LLC, Oasis Power Holdings, LLC, Oasis Power, LLC, Spark Energy, Inc., the Banks party thereto and Société Générale, as administrative agent. | 10-K | 10.2 | 3/24/2016 | 001-36559 | ||
10.3 | Amendment No. 2 to Amended and Restated Credit Agreement, dated and effective as of December 30, 2015, by and among Spark HoldCo, LLC, Spark Energy, LLC, Spark Energy Gas, LLC, CenStar Energy Corp, CenStar Operating Company, LLC, Oasis Power Holdings, LLC, Oasis Power, LLC, Spark Energy, Inc., the Banks party thereto and Société Générale, as administrative agent. | 10-K | 10.3 | 3/24/2016 | 001-36559 | ||
156
10.4 | Amendment No. 3 to Amended and Restated Credit Agreement, dated as of June 1, 2016, by and among the Company, Spark HoldCo, Spark Energy, LLC, Spark Energy Gas, LLC, CenStar Energy Corp, CenStar Operating Company, LLC, Oasis Power Holdings, LLC and Oasis Power, LLC, as co-borrowers, the banks party thereto and Société Générale, as administrative agent. | 10-Q | 10.4 | 8/11/2016 | 001-36559 | |
10.5 | Amendment No. 4 to Amended and Restated Credit Agreement, effective as of August 1, 2016, by and among the Company, Spark HoldCo, Spark Energy, LLC, Spark Energy Gas, LLC, CenStar Energy Corp, CenStar Operating Company, LLC, Oasis Power Holdings, LLC and Oasis Power, LLC, as co-borrowers, the banks party thereto and Société Générale, as administrative agent. | 8-K | 10.2 | 8/1/2016 | 001-36559 | |
10.6 | Credit Agreement, dated as of August 1, 2014, by and among Spark Energy, Inc., as parent, Spark HoldCo, LLC, Spark Energy, LLC, and Spark Energy Gas, LLC, as co-borrowers, Société Générale, as administrative agent, an issuing bank and a bank, SG Americas Securities, LLC, as sole lead arranger and sole bookrunner, Natixis, New York Branch, Cooperatieve Centrale Raiffeisen-Boerenleenbank B.A., New York Branch, and RB International Finance (USA) LLC, as co-documentation agent, Compass Bank, as senior managing agent and the other financial institutions party hereto from time to time. | 8-K | 10.1 | 8/4/2014 | 001-36559 | |
10.7 | Tax Receivable Agreement, dated as of August 1, 2014, by and among Spark Energy, Inc., Spark HoldCo LLC, NuDevco Retail Holdings, LLC, NuDevco Retail, LLC and W. Keith Maxwell III. | 8-K | 10.2 | 8/4/2014 | 001-36559 | |
10.8+ | Master Service Agreement, effective as of January 1, 2016, by and among Spark HoldCo, LLC, Retailco Services, LLC, and NuDevco Retail,. LLC. | 10-K | 10.6 | 3/24/2016 | 001-36559 | |
10.9† | Spark Energy, Inc. Long-Term Incentive Plan | S-8 | 4.3 | 7/31/2014 | 333-197738 | |
10.10† | Spark Energy, Inc. Amended and Restated Long-Term Incentive Plan. | 10-Q | 10.3 | 11/10/2016 | 001-36559 | |
10.11† | Form of Restricted Stock Unit Agreement | S-1 | 10.4 | 6/30/2014 | 333-196375 | |
10.12† | Form of Notice of Grant of Restricted Stock Unit | S-1 | 10.5 | 6/30/2014 | 333-196375 | |
10.13 | Spark HoldCo, LLC Second Amended and Restated Limited Liability Agreement, dated as of August 1, 2014, by and among Spark Energy, Inc., NuDevco Retail Holdings and NuDevco Retail. | 8-K | 10.3 | 8/4/2014 | 001-36559 | |
10.14† | Indemnification Agreement, dated August 1, 2014, by and between Spark Energy, Inc. and W. Keith Maxwell III. | 8-K | 10.5 | 8/4/2014 | 001-36559 | |
10.15† | Indemnification Agreement, dated August 1, 2014, by and between Spark Energy, Inc. and Nathan Kroeker. | 8-K | 10.6 | 8/4/2014 | 001-36559 | |
10.16† | Indemnification Agreement, dated August 1, 2014, by and between Spark Energy, Inc. and Allison Wall | 8-K | 10.7 | 8/4/2014 | 001-36559 | |
10.17† | Indemnification Agreement, dated August 1, 2014, by and between Spark Energy, Inc. and Georganne Hodges. | 8-K | 10.8 | 8/4/2014 | 001-36559 | |
8-K | 10.9 | 8/4/2014 | 001-36559 | |||
10.18† | Indemnification Agreement, dated August 1, 2014, by and between Spark Energy, Inc. and Gil Melman. | |||||
157
10.19† | Indemnification Agreement, dated August 1, 2014, by and between Spark Energy, Inc. and James G. Jones II. | 8-K | 10.10 | 8/4/2014 | 001-36559 | |
10.20† | Indemnification Agreement, dated August 1, 2014, by and between Spark Energy, Inc. and John Eads. | 8-K | 10.11 | 8/4/2014 | 001-36559 | |
10.21† | Indemnification Agreement, dated August 1, 2014, by and between Spark Energy, Inc. and Kenneth M. Hartwick. | 8-K | 10.12 | 8/4/2014 | 001-36559 | |
10.22† | Indemnification Agreement, dated May 25, 2016, by and between Spark Energy, Inc. and Jason Garrett. | 8-K | 10.2 | 5/27/2016 | 001-36559 | |
10.23† | Indemnification Agreement, dated May 25, 2016, by and between Spark Energy, Inc. and Nick W. Evans, Jr. | 8-K | 10.1 | 5/27/2016 | 001-36559 | |
10.24† | Indemnification Agreement, dated June 2, 2016, by and between Spark Energy, Inc. and Robert Lane. | 8-K | 10.3 | 6/3/2016 | 001-36559 | |
10.25 | Registration Rights Agreement, dated as of August 1, 2014, by and among Spark Energy, Inc., NuDevco Retail Holdings, LLC and NuDevco Retail LLC. | 8-K | 10.4 | 8/4/2014 | 001-36559 | |
10.26 | Transaction Agreement II, dated as of July 30, 2014, by and among Spark Energy, Inc., Spark HoldCo, LLC, NuDevco Retail LLC, NuDevco Retail Holdings, LLC, Spark Energy Ventures, LLC, NuDevco Partners Holdings, LLC and Associated Energy Services, LP. | 8-K | 4.1 | 8/4/2014 | 001-36559 | |
10.27† | Employment Agreement, dated April 15, 2015, by and between Spark Energy, Inc. and Nathan Kroeker. | 8-K | 10.1 | 4/20/2015 | 001-36559 | |
10.28† | Employment Agreement, dated April 15, 2015, by and between Spark Energy, Inc. and Allison Wall. | 8-K | 10.2 | 4/20/2015 | 001-36559 | |
10.29† | Employment Agreement, dated April 15, 2015, by and between Spark Energy, Inc. and Georganne Hodges. | 8-K | 10.3 | 4/20/2015 | 001-36559 | |
10.30† | Employment Agreement, dated April 15, 2015, by and between Spark Energy, Inc. and Gil Melman. | 8-K | 10.4 | 4/20/2015 | 001-36559 | |
10.31† | Employment Agreement, dated August 3, 2015, by and between Spark Energy, Inc. and Jason Garrett. | 8-K | 10.1 | 8/4/2015 | 001-36559 | |
10.32† | Amended and Restated Employment Agreement, dated June 2, 2016, by and between Spark Energy, Inc. and Robert Lane. | 8-K | 10.1 | 6/3/2016 | 001-36559 | |
10.33 | Membership Interest Purchase Agreement, dated as of May 12, 2015, by and between Retailco Acquisition Co, LLC and Spark HoldCo, LLC. | 10-Q | 10.5 | 5/14/2015 | 001-36559 | |
10.34† | Separation and Release Agreement, dated as of November 9, 2015, by and between Spark Energy, Inc. and Allison Wall. | 10-Q | 10.5 | 11/12/2015 | 001-36559 | |
10.35† | Employment Separation Agreement, dated June 2, 2016, by and between Spark Energy, Inc. and Georganne Hodges. | 8-K | 10.2 | 6/3/2016 | 001-36559 | |
10.36 | Subscription Agreement, by and between Spark Energy, Inc., Spark HoldCo, LLC and Retailco, LLC, dated as of May 3, 2016. | 8-K | 10.1 | 5/5/2016 | 001-36559 | |
10.37 | Amended and Restated Subscription Agreement, dated as of July 27, 2016, by and among Spark Energy, Inc., Spark HoldCo, LLC and Retailco, LLC. | 8-K | 10.1 | 8/1/2016 | 001-36559 | |
10.38 | Subordinated Promissory Note of Spark HoldCo, LLC and Spark Energy, Inc., dated December 27, 2016. | 8-K | 10.1 | 12/30/2016 | 001-36559 | |
21.1* | List of Subsidiaries of Spark Energy, Inc. | |||||
23.1* | Consent of KPMG | |||||
31.1* | Certification of Chief Executive Officer pursuant to Rule 13a-14(a) under the Securities Exchange Act of 1934. | |||||
158
31.2* | Certification of Chief Financial Officer pursuant to Rule 13a-14(a) under the Securities Exchange Act of 1934. | |||||
32** | Certifications pursuant to 18 U.S.C. Section 1350. | |||||
101.INS* | XBRL Instance Document. | |||||
101.SCH* | XBRL Schema Document. | |||||
101.CAL* | XBRL Calculation Document. | |||||
101.LAB* | XBRL Labels Linkbase Document. | |||||
101.PRE* | XBRL Presentation Linkbase Document. | |||||
101.DEF* | XBRL Definition Linkbase Document. | |||||
* Filed herewith
** Furnished herewith
† Compensatory plan or arrangement
+ Portions of this exhibit have been omitted and filed separately with the SEC pursuant to an order granting confidential treatment.
# The registrant agrees to furnish supplementally a copy of any omitted schedule to the Commission upon request.
159