Attached files
| file | filename |
|---|---|
| EX-99.12 - EXHIBIT 99.12 - SCIENTIFIC GAMES CORP | copyofexhibit9912gamingreg.htm |
| EX-99.2 - EXHIBIT 99.2 - SCIENTIFIC GAMES CORP | copyofexhibit992lnsaudited.htm |
| EX-99.1 - EXHIBIT 99.1 - SCIENTIFIC GAMES CORP | copyofexhibit991lnsauditre.htm |
| EX-32.2 - EXHIBIT 32.2 - SCIENTIFIC GAMES CORP | copyofexhibit322certificat.htm |
| EX-32.1 - EXHIBIT 32.1 - SCIENTIFIC GAMES CORP | copyofexhibit321certificat.htm |
| EX-31.2 - EXHIBIT 31.2 - SCIENTIFIC GAMES CORP | copyofexhibit312certificat.htm |
| EX-31.1 - EXHIBIT 31.1 - SCIENTIFIC GAMES CORP | copyofexhibit311certificat.htm |
| EX-23.2 - EXHIBIT 23.2 - SCIENTIFIC GAMES CORP | copyofexhibit232lnsconsent.htm |
| EX-23.1 - EXHIBIT 23.1 - SCIENTIFIC GAMES CORP | copyofexhibit231dtconsentl.htm |
| EX-21 - EXHIBIT 21 - SCIENTIFIC GAMES CORP | copyofexhbit21sgcsubsidiar.htm |
| EX-12 - EXHIBIT 12 - SCIENTIFIC GAMES CORP | copyofexhibit12ratioofearn.htm |
| EX-10.46 - EXHIBIT 10.46 - SCIENTIFIC GAMES CORP | exhibit1046agreementandgen.htm |
UNITED STATES
SECURITIES AND EXCHANGE COMMISSION
WASHINGTON, D.C. 20549
FORM 10-K
ý | ANNUAL REPORT PURSUANT TO SECTION 13 OR 15(d) OF THE SECURITIES EXCHANGE ACT OF 1934 | |
For the fiscal year ended: December 31, 2016 | ||
Or | ||
o | TRANSITION REPORT PURSUANT TO SECTION 13 OR 15(d) OF THE SECURITIES EXCHANGE ACT OF 1934 | |
For the transition period from to | ||
Commission file number: 0-13063
SCIENTIFIC GAMES CORPORATION
(Exact name of registrant as specified in its charter)
Delaware (State or other jurisdiction of incorporation or organization) | 81-0422894 (I.R.S. Employer Identification No.) | |
6650 S. El Camino Road
Las Vegas, Nevada 89118
(Address of principal executive offices) (Zip Code)
Registrant's telephone number, including area code: (702) 897-7150
Securities registered pursuant to Section 12(b) of the Act:
Title of each class | Name of each exchange on which registered | |
Class A Common Stock, $.01 par value | Nasdaq Global Select Market | |
Securities registered pursuant to Section 12(g) of the Act: None
Indicate by check mark if the registrant is a well-known seasoned issuer, as defined in Rule 405 of the Securities Act. Yes ý No o
Indicate by check mark if the registrant is not required to file reports pursuant to Section 13 or Section 15(d) of the Act. Yes o No ý
Indicate by check mark whether the registrant: (1) has filed all reports required to be filed by Section 13 or 15(d) of the Securities Exchange Act of 1934 during the preceding 12 months (or for such shorter period that the registrant was required to file such reports), and (2) has been subject to such filing requirements for the past 90 days. Yes ý No o
Indicate by check mark whether the registrant has submitted electronically and posted on its corporate Web site, if any, every Interactive Data File required to be submitted and posted pursuant to Rule 405 of Regulation S-T (§ 232.405 of this chapter) during the preceding 12 months (or for such shorter period that the registrant was required to submit and post such files). Yes ý No o
1
Indicate by check mark if disclosure of delinquent filers pursuant to Item 405 of Regulation S-K is not contained herein, and will not be contained, to the best of the registrant's knowledge, in definitive proxy or information statements incorporated by reference in Part III of this Form 10-K or any amendment to this Form 10-K. o
Indicate by check mark whether the registrant is a large accelerated filer, an accelerated filer, a non-accelerated filer, or a smaller reporting company. See definitions of "large accelerated filer," "accelerated filer," and "smaller reporting company" in Rule 12b-2 of the Exchange Act.
Large accelerated filer o | Accelerated filer ý | Non-accelerated filer o (Do not check if smaller reporting company) | Smaller reporting company o | |||
Indicate by check mark whether the registrant is a shell company (as defined in Rule 12b-2 of the Act). Yes o No ý
As of June 30, 2016, the market value of voting and non-voting common equity held by non-affiliates of the registrant was $471,153,471(1).
Common shares outstanding as of February 27, 2017 were 88,130,948.
DOCUMENTS INCORPORATED BY REFERENCE
Portions of the registrant's proxy statement relating to the 2017 annual meeting of stockholders are incorporated by reference in Part III. The proxy statement will be filed with the Securities and Exchange Commission no later than 120 days after the conclusion of the registrant's fiscal year ended December 31, 2016.
________________________________________________________________________________________________________________________________
(1) | For this purpose only, "non-affiliates" excludes directors and executive officers. |
EXHIBIT INDEX APPEARS ON PAGE 130
2
TABLE OF CONTENTS
PART I | ||
Item 1. | ||
Item 1A. | ||
Item 1B. | ||
Item 2. | ||
Item 3. | ||
Item 4. | ||
PART II | ||
Item 5. | ||
Item 6. | ||
Item 7. | ||
Item 7A. | ||
Item 8. | ||
Item 9. | ||
Item 9A. | ||
Item 9B. | ||
PART III | ||
Item 10. | ||
Item 11. | ||
Item 12. | ||
Item 13. | ||
Item 14. | ||
PART IV | ||
Item 15. | ||
3
Glossary of Terms | |
The following terms or acronyms used in this Form 10-K are defined below: | |
Term or Acronym | Definition |
2018 Notes | 8.125% senior subordinated notes due 2018 issued by Scientific Games Corporation |
2019 Notes | 9.250% senior subordinated notes due 2019 issued by SGI |
2020 Notes | 6.250% senior subordinated notes due 2020 issued by SGI |
2021 Notes | 6.625% senior subordinated notes due 2021 issued by SGI |
ADS | Technology and Gaming, Ltd. |
ASC | Accounting Standards Codification |
ASU | Accounting Standards Update |
Annual Meeting | the annual meeting of stockholders held on June 15, 2016 |
B2B | business to business model as it relates to Interactive social and real money online gaming |
B2C | business to consumer model as it relates to Interactive social gaming |
Bally | Bally Technologies, Inc. |
Bally acquisition | the acquisition of Bally by the Company on November 21, 2014 |
Barcrest | Barcrest Group Limited |
Coin-in | the amount wagered |
Company | refers to Scientific Games Corporation and its consolidated subsidiaries, unless otherwise specified or the context otherwise dictates |
CSG | Beijing CITIC Scientific Games Technology Co., Ltd. |
CSL | China Sports Lottery |
CSP | Cooperative Services Provider |
D&A | depreciation, amortization and impairments (excluding goodwill) |
ESPP | employee stock purchase plan |
EU | European Union |
FASB | Financial Accounting Standards Board |
F/X | Foreign currency exchange |
Global Draw | The Global Draw Limited |
GLB | Beijing Guard Libang Technology Co., Ltd. |
Guarantor Subsidiaries | refers to substantially all of SGC’s 100%-owned U.S. subsidiaries other than SGC’s 100%-owned U.S. Interactive social gaming subsidiaries |
Hellenic Lotteries | Hellenic Lotteries S.A. |
ICFR | internal controls over financial reporting |
ITL | International Terminal Leasing |
KPIs | Key Performance Indicators |
LAP | local-area progressive |
LBO | licensed betting office |
LNS | Lotterie Nazionali S.r.l. |
Net win | Coin-in less payouts |
Non-Guarantor Subsidiaries | refers to SGC’s U.S. subsidiaries that are not Guarantor Subsidiaries and SGC’s foreign subsidiaries |
Northstar Illinois | Northstar Lottery Group, LLC |
Northstar New Jersey | Northstar New Jersey Lottery Group, LLC |
Note | refers to a note to our Consolidated Financial Statements in this Annual Report on Form 10-K, unless otherwise indicated |
Parspro | PPC hf |
4
Participation | with respect to our Gaming business, refers to gaming machines provided to customers through service or leasing arrangements in which our revenues are calculated based on: (1) a percentage of Net win; (2) fixed daily fees; (3) a percentage of the Coin-in; or (4) a combination of a fixed daily fee and a percentage of the Coin-in, and with respect to our Lottery business, refers to a contract or arrangement in which the Company is paid based on a percentage of retail sales |
PMA | private management agreement |
PPU | price-per-unit |
Provoloto | SG Provoloto, S. de R.L. de C.V. |
PTG | Proprietary table games |
R&D | research and development |
Racing Business | racing and venue management businesses |
RCN | Roberts Communications Network, LLC |
RFP | request for proposal |
RMG | real-money gaming |
RSU | restricted stock unit |
SEC | Securities and Exchange Commission |
Secured Notes | 7.00% senior secured notes due 2022 issued by SGI |
Securities Act | Securities Act of 1933, as amended |
Senior Notes | the Secured Notes and the Unsecured Notes |
SG&A | selling, general and administrative |
SGC | Scientific Games Corporation |
SGI | Scientific Games International, Inc., a 100%-owned subsidiary of Scientific Games Corporation |
SHFL | SHFL entertainment, Inc. |
Shufflers | various models of automatic card shufflers, deck checkers and roulette chip sorters |
Sportech | Sportech plc |
Subordinated Notes | the 2018 Notes, 2020 Notes and 2021 Notes |
Unsecured Notes | 10.00% senior unsecured notes due 2022 issued by SGI |
U.K. | United Kingdom of Great Britain and Northern Ireland |
U.S. | United States of America |
U.S. GAAP | accounting principles generally accepted in the U.S. |
U.S. jurisdictions | the 50 states in the U.S. plus the District of Columbia and Puerto Rico |
VGT | video gaming terminal |
VLT | video lottery terminal |
WAP | wide-area progressive |
WMS | WMS Industries, Inc. |
WMS acquisition | the acquisition of WMS by the Company on October 18, 2013 |
Intellectual Property Rights
® and TM indicate U.S. trademarks. Marks are owned by their respective owners.
5
PART I
FORWARD-LOOKING STATEMENTS
Throughout this Annual Report on Form 10-K, we make "forward-looking statements" within the meaning of the U.S. Private Securities Litigation Reform Act of 1995. Forward-looking statements describe future expectations, plans, results or strategies and can often be identified by the use of terminology such as "may," "will," "estimate," "intend," "plan," "continue," "believe," "expect," "anticipate," "target," "should," "could," "potential," "opportunity," "goal" or similar terminology. The forward-looking statements contained in this Annual Report on Form 10-K are generally located in the material set forth under the headings "Business," "Risk Factors" and "Management's Discussion and Analysis of Financial Condition and Results of Operations" but may be found in other locations as well. These statements are based upon management's current expectations, assumptions and estimates and are not guarantees of timing, future results or performance. Therefore, you should not rely on any of these forward-looking statements as predictions of future events. Actual results may differ materially from those contemplated in these statements due to a variety of risks and uncertainties and other factors, including, among other things:
• | competition; |
• | U.S. and international economic and industry conditions; |
• | slow growth of new gaming jurisdictions, slow addition of casinos in existing jurisdictions and declines in the replacement cycle of gaming machines; |
• | ownership changes and consolidation in the gaming industry; |
• | opposition to legalized gaming or the expansion thereof; |
• | inability to adapt to, and offer products that keep pace with, evolving technology, including any failure of our investment of significant resources in our R&D efforts; |
• | inability to develop successful products and services and capitalize on trends and changes in our industries, including the expansion of internet and other forms of interactive gaming; |
• | laws and government regulations, including those relating to gaming licenses and environmental laws; |
• | dependence upon key providers in our social gaming business; |
• | inability to retain or renew, or unfavorable revisions of, existing contracts, and the inability to enter into new contracts; |
• | protection of our intellectual property, inability to license third party intellectual property and the intellectual property rights of others; |
• | security and integrity of our products and systems and reliance on or failures in information technology and other systems; |
• | challenges or disruptions relating to the implementation of a new global enterprise resource planning system; |
• | failure to maintain adequate internal control over financial reporting; |
• | natural events that disrupt our operations or those of our customers, suppliers or regulators; |
• | inability to benefit from, and risks associated with, strategic equity investments and relationships; |
• | failure to achieve the intended benefits of our acquisitions; |
• | incurrence of restructuring costs; |
• | implementation of complex revenue recognition standards or other new accounting standards; |
• | changes in estimates or judgments related to our impairment analysis of goodwill or other intangible assets; |
6
• | fluctuations in our results due to seasonality and other factors; |
• | dependence on suppliers and manufacturers; |
• | risks relating to foreign operations, including fluctuations in foreign currency exchange rates, restrictions on the payment of dividends from earnings, restrictions on the import of products and financial instability, including the potential impact to our business resulting from the affirmative vote in the U.K. to withdraw from the EU, and the potential impact to our instant lottery game concession or VLT lease arrangements resulting from the recent economic and political conditions in Greece; |
• | changes in tax laws or tax rulings, or the examination of our tax positions; |
• | dependence on key employees; |
• | litigation and other liabilities relating to our business, including litigation and liabilities relating to our contracts and licenses, our products and systems, our employees (including labor disputes), intellectual property, environmental laws and our strategic relationships; |
• | level of our indebtedness, higher interest rates, availability or adequacy of cash flows and liquidity to satisfy indebtedness, other obligations or future cash needs; |
• | inability to reduce or refinance our indebtedness; |
• | restrictions and covenants in debt agreements, including those that could result in acceleration of the maturity of our indebtedness; |
• | influence of certain stockholders, including decisions that may conflict with the interests of other stockholders; and |
• | stock price volatility. |
Additional information regarding risks and uncertainties and other factors that could cause actual results to differ materially from those contemplated in forward-looking statements is included from time to time in our filings with the SEC, including under Item 1A "Risk Factors" in this Annual Report on Form 10-K. Forward-looking statements speak only as of the date they are made and, except for our ongoing obligations under the U.S. federal securities laws, we undertake no obligation to publicly update any forward-looking statements whether as a result of new information, future events or otherwise.
You should also note that this Annual Report on Form 10-K may contain references to industry market data and certain industry forecasts. Industry market data and industry forecasts are obtained from publicly available information and industry publications. Industry publications generally state that the information contained therein has been obtained from sources believed to be reliable, but that the accuracy and completeness of that information is not guaranteed. Although we believe industry information to be accurate, it is not independently verified by us and we do not make any representation as to the accuracy of that information. In general, we believe there is less publicly available information concerning the international gaming, lottery and interactive gaming industries than the same industries in the U.S.
7
ITEM 1. BUSINESS
Unless otherwise specified or the context otherwise indicates, all references to the words "Scientific Games," "we," "us," "our" and the "Company" refer to SGC and its consolidated subsidiaries. Any references to "Notes" refers to the Notes to Consolidated Financial Statements contained in Item 15 for this Report.
General
Scientific Games Corporation was incorporated in the State of Delaware on July 2, 1984. We are a leading developer of technology‑based products and services and associated content for the worldwide gaming, lottery and interactive gaming industries. Our portfolio includes gaming machines and game content, casino management systems, table game products and services, instant and draw‑based lottery games, server‑based gaming and lottery systems, sports betting technology, lottery content and services, loyalty and rewards programs, interactive gaming and social casino solutions. We also gain access to technologies and pursue global expansion through strategic acquisitions and equity investments.
Strategy
We strive to provide high quality products and services to our customers across all three of our business segments -- Gaming, Lottery and Interactive.
To this end, we are focused on the following strategies:
• | Drive innovation— We place great emphasis on producing innovative and high-performing Gaming, Lottery and Interactive content, products and services that provide differentiated value to our customers. Our goal is to create “must have” products and complete systems and services with unique features and functionality through our innovation-centric corporate culture. We seek to leverage our expansive content library and portfolio of proprietary and licensed intellectual property, and use our extensive player and customer research in order to bring innovation to our products, services and processes. Also, we intend to take advantage of our state-of-the-art operating system development and game development tools to enhance our ideation and development processes and generate greater efficiencies in game production. |
• | Focus on prudent fiscal management to improve financial returns and cash flow from operations— In the fourth quarter of 2016, the Company commenced a global business improvement initiative to create a more efficient and seamless organization which was designed to address our cost structure and is expected to eliminate $75 million in annualized costs. The majority of the actions necessary to implement these cost savings were completed as of December 31, 2016. Setting the right operational and strategic priorities to support our customers, aligning our resources to achieve our targets and tracking our performance is our near term focus. All of these factors, if successful, should increase our cash flow from operations available to reduce our financial leverage above our contractually required payments. |
• | Build a corporate culture open to new ideas and opportunities that help to accelerate deleveraging— We are embarking on a journey to create a culture of discipline that aligns and uses our resources more effectively, and at the same time cultivates open minds willing to capitalize on additional opportunistic situations where we might be able to accelerate our deleveraging efforts. |
Segments
We report our operations in three business segments (Gaming, Lottery and Interactive) representing our different products and services. See "Business Segment Results" in Item 7 and Note 2 for additional business segment information.
Gaming Segment
The gaming industry is characterized by the continuous development of new technologies, products and game content. Gaming products and services are used by a diverse group of gaming operators and U.S. and international lotteries which may offer VLTs and other forms of gaming, such as bingo and sports wagering.
Our products are installed in all of the major regulated gaming jurisdictions in the U.S., as well as in approximately 146 international gaming jurisdictions. Growth of gaming in land-based venues is driven by the opening of new casinos in both new and existing jurisdictions and the expansion of existing casinos. In addition, the land-based gaming supply business is significantly impacted by the rate at which casinos and other gaming operators replace their gaming machines, which depends
8
upon a number of factors, including their capital budgets. Virtually all sectors of the gaming industry are impacted by changes in economic conditions that impact players’ disposable incomes.
Four large bookmakers operate approximately 88% of the LBOs in the U.K. For the year ended December 31, 2016, our contracts with two of the large U.K. bookmakers represented a significant portion of our U.K. LBO server-based gaming business. Our current contract with Ladbrokes plc (“Ladbrokes”) commenced on October 22, 2013 and is scheduled to expire on March 31, 2019. Our current contract with Gala Coral Group Ltd. (“Gala Coral”) commenced on January 1, 2010 and is set to expire on December 31, 2017. We expect to participate in the bidding process to continue to serve these customers after the expiration of their current contracts, although we cannot predict the outcome of that process. In October 2016, Ladbrokes and Gala Coral merged. The U.K. Competition and Markets Authority ("CMA") has reviewed and approved the merger pending these operators having completed the divestiture of the required number of betting shops. As these two operators are the largest customers of our U.K. gaming business, their merger and any divestitures relating thereto, could negatively impact our business.
Competition
The gaming machine sector is highly competitive and is characterized by the continuous introduction of new games, gaming machines and related technologies. We compete primarily with International Game Technology ("IGT"), a subsidiary of International Game Technology PLC (the successor of Gtech S.p.A), Ainsworth Game Technology, Aristocrat Leisure Ltd,. ("Aristocrat"), Aruze Gaming America, Inc., Franco Gaming Ltd., Inspired Gaming Group Limited, Konami Digital Entertainment, Inc. ("Konami"), Multimedia Games, Inc. (which is a subsidiary of EVERI Inc.) and the Novomatic Group of Companies. Our principal direct competitor in our U.K. LBO business is Inspired Gaming Group Limited.
The casino-management systems business is also highly competitive. Product features and functionality, accuracy, reliability, service level and pricing are among the factors that determine how successful systems providers are in selling their systems. Our principal competitors in casino-management systems include Aristocrat, IGT and Konami. Competition for these products is intense due to the number of providers and the limited number of casinos and jurisdictions in which they operate.
With respect to our table products, we compete on the basis of the breadth of our Shuffler products and services and PTGs, product reliability, service, the strength of our intellectual property and our extensive sales, regulatory and distribution channels. Our automated Shufflers also compete against hand shuffling, which remains the most competitive shuffling option for casino card games around the world. Finally, since the need for our Shuffler products depends upon the casino's use of live table games, our Shufflers also compete against any products that live table games compete against.
Competition for PTG content is based on player appeal, brand recognition, price and the strength of the underlying intellectual property. We compete on this basis, as well as on the strength of our extensive sales, service, marketing and distribution channels. We also compete with non-proprietary table games such as blackjack and baccarat, as well as several companies that primarily develop and license PTGs such as Galaxy Gaming, Inc. and Masque Publishing, Inc. Finally, some of our product lines may compete against each other for space on the casino floor.
Lottery Segment
There are approximately 180 lotteries throughout the world, operated by U.S. and international governmental authorities and their licensees. Governments typically authorize lotteries as a means of generating revenues without imposing additional taxes. Many jurisdictions have come to rely on the proceeds from lottery game sales as a significant source of funding for programs for which net lottery proceeds are designed to fund. Although there are many types of lottery games worldwide, the two principal categories of products offered are draw lottery games and instant lottery games. Currently, 44 U.S. jurisdictions offer instant game lotteries, and 46 U.S. jurisdictions offer draw lotteries. Lottery operations in international jurisdictions can vary widely depending on the number of new lotteries entering the market, the number of lottery licenses issued within each market and the discontinuance of lotteries and operating licenses.
An instant lottery game is typically played by removing a scratch-off protective coating from a preprinted ticket to reveal if it is a winner. Draw lottery games, such as POWERBALL® and MEGA MILLIONS®, are based on a random selection of a series of numbers, and prizes are generally based on the number of winners who share the prize pool, although set prizes are also offered. Draw lottery games are generally provided through a lottery system in which lottery terminals in retail outlets are continuously connected to a central computer system for the sale and validation of lottery games and related functions. A lottery system may also be used to activate, sell and validate instant lottery games to confirm that a ticket is a winner and prevent duplicate payments. In some jurisdictions, separate instant game validation systems may be installed.
9
Lotteries may offer a range of other games. In the U.S., some lotteries offer high frequency games such as keno, which is typically played every four to five minutes in restricted social settings, such as bars, and is usually offered as an extension of the lottery system.
The table below lists our more significant lottery contracts representing approximately 33% of our Lottery revenue. Also included are instant or draw lottery game retail sales (as applicable), if publicly available, for each jurisdiction.
Lottery/Operator | Fiscal 2016 State Instant Game or Lottery Systems Retail Sales (in millions) | Type of Contract | Commencement Date of Current Contract | Expiration Date of Current Contract (before any exercise of remaining renewal options) | Current Renewal Options Remaining | |||||||
Florida | $ | 3,960 | Instant Games - Participation | October 2008 | September 2018 | None | ||||||
Georgia | $ | 3,091 | Instant Games - Participation | September 2003 | September 2025 | None | ||||||
Pennsylvania | $ | 4,172 | Lottery Systems | January 2009 | December 2018 | None | ||||||
Pennsylvania | $ | 2,809 | Instant Games - Participation | August 2007 | August 2017 | None | ||||||
Maryland | $ | 1,921 | Lottery Systems | October 2005 | June 2017 | None | ||||||
LNS (Italy) | € | 8,978 | Instant Games - Price-per-unit | October 2010 | September 2019 | 1 nine-year | ||||||
Camelot Group plc (U.K.) | £ | 2,566 | Instant Games - Participation | November 2013 | January 2023 | None | ||||||
Competition
The instant lottery game sector is highly competitive and continues to be subject to intense price-based competition. Our principal instant games competitors in the U.S. are IGT and Pollard Banknote Limited. Internationally, a number of instant lottery game vendors compete with us including the competitors noted above as well as diversified printers in India, China and Latin America. Our principal competitors in the supply of lottery-related licensed games, promotional entertainment and loyalty or rewards programs are Alchemy3 LLC, ePrize LLC, IGT, Pollard Banknote Limited and Intralot S.A.
The lottery systems business is also highly competitive and continues to be subject to intense price-based competition. Our principal competitors in this business are IGT, Intralot S.A. and Tattersalls Group. We also compete with various suppliers of lottery system components, such as terminals and computer systems, as well as lottery operators that internally develop their own systems.
As countries liberalize gaming regulations, lotteries may expand their scope by offering sports wagering, gaming machines, interactive gaming or other forms of gaming, which may introduce new suppliers that compete with us for lottery customers. In some jurisdictions, the liberalization of gaming regulations has included the privatization or outsourcing of all or a portion of the lottery operations via a competitive bidding process. We believe Camelot Group plc, the Tattersalls Group, IGT and Intralot, S.A. to be among those competitors who may also bid on such opportunities.
Interactive Segment
Our Interactive business segment includes social (non-wagering) gaming and interactive RMG. Through our Interactive segment, we make available WMS®, Bally®, SHFL®, Barcrest™ and third-party branded content directly to players of social gaming, or—in the case of RMG—directly to online casino operators. Our SG UniverseTM service features multiple platforms which enable land-based casinos to increase engagement with their players. Our Interactive gaming business is increasingly focused on products and services that operate on both mobile and desktop products and platforms.
Competition
In our social gaming business, we compete for the leisure time and discretionary spending of consumers with other interactive gaming entertainment companies. Our primary competitors include DoubleDown Interactive, a subsidiary of IGT, Playtika (acquired by a group of investors led by Shanghai Giant Network Technology Co. in 2016), Big Fish Games Inc., a subsidiary of Churchill Downs, Inc., GSN/Bash Gaming, Product Madness, a subsidiary of Aristocrat and Zynga Inc. In our RMG business, our primary competitors are Playtech Limited, Net Entertainment, Microgaming Software Systems Ltd., IGT, NYX Gaming Group and High 5 Games.
Research and Product Development
We believe our ability to attract new gaming, lottery and interactive gaming customers and retain existing customers depends in part on our ability to evolve and continue to develop our product line by continually developing differentiating
10
products, hardware and systems technology and functionality to enhance player entertainment and customer profitability. We are also focused on expanding use of the internet and other interactive technologies to increase play. Our gaming machines are usually designed and programmed by our internal engineering staff and internal and external game development studios with the input and cooperation of our customers.
We have Gaming R&D personnel located in our Las Vegas and Chicago facilities. A large portion of our Lottery R&D team is based in our Alpharetta, Georgia facilities. We have Interactive personnel located primarily in Chicago, Illinois; Cedar Falls, Iowa; Austin, Texas; and Tel Aviv, Israel. We also have game development studios in Las Vegas, Nevada, Sydney, Australia, Manchester, England and India (including Bangalore, Chennai and Pune), with additional R&D staff in other locations, including Reno, Nevada and Vienna, Austria. During the years ended December 31, 2016, 2015 and 2014, our R&D expense totaled $204.8 million, $183.9 million and $117.0 million, respectively.
Intellectual Property
Many of our products use intellectual property rights, including trademarks, trade dress, copyrights, patents and trade secrets. We consider our intellectual property rights to be, in the aggregate, material to our business. We protect our investment in research and development by seeking intellectual property protection as appropriate for our technologies and content. We also acquire and license intellectual property from third parties.
The terms of our patents vary based on the date and jurisdiction of filing. The term of U.S. patents generally expires 20 years from the date of filing of the first non-provisional patent application in a family of patents. The actual protection afforded by a patent depends upon the type of patent, the scope of its coverage and the availability of legal remedies in the applicable country. Certain technologies, which are material to our businesses, are the subject of patents issued and patent applications currently pending in the U.S. and certain other countries. Our Lottery business uses our patented and patent-pending technologies in the production, secure printing, validation and distribution of instant lottery games. Our Gaming and Interactive businesses use our patented and patent-pending technologies in games and associated platforms and systems.
We market many of our products under trademarks and copyrights that provide product differentiation and recognition and promote our portfolio of product offerings. All of our games feature elements subject to copyright rights and protection. In addition, we generally obtain trademark protection and often seek to register trademarks for the names and designs under which we market and license our products and games. Protections for trademarks exist in many countries, including the U.S., for as long as the trademark is registered and/or used. Registrations are generally issued for fixed, but renewable terms, although trademark rights may exist whether or not a mark is registered and the duration of the registrations varies by country.
We believe that our use of both our own and third party licensed brand names and related intellectual property contributes to the appeal and success of our products, and that our future ability to license, acquire or develop new brand names is important to our continued success. Therefore, we continue to invest in the recognition of our brands and brands that we license. Certain of our games are based on popular brands licensed from third parties, such as Hasbro International, Inc., Fremantle Media North America, CBS Studios Inc., Turner Entertainment Co., Warner Bros. Consumer Products Inc., Harley-Davidson, Playboy Enterprises International, Inc., Paramount Pictures Corporation, Hearst Holdings Inc., King Features Syndicate Division, Twentieth Century Fox Licensing and Merchandising, Major League Baseball and National Basketball Association.
IGT administers a pool of patents relating to "ticket-in ticket-out" technology that enables casino patrons to cash out from a gaming machine and receive a printed ticket instead of coins. This technology is used in substantially all of our gaming machines. We have a license for certain patents related to this technology through the expiration date of the relevant patents.
From time to time we become aware of potential infringement of our intellectual property by competitors and other third parties and consider what action, if any, to take in that regard, including litigation where appropriate. We are also subject to threatened or actual intellectual property-related claims by third parties from time to time.
Production Processes, Sources and Availability of Components
We currently produce substantially all of our gaming machines at our facilities in Las Vegas, Nevada and Sydney, Australia. We also have finishing lines in our Barcelona, Spain facility, as well as in Midrand, South Africa, Buenos Aires, Argentina and Manchester, England. These finishing lines allow for the completion and testing of our gaming machine assemblies from our facilities in Las Vegas. We also refurbish used gaming machines primarily at our Las Vegas facilities.
Manufacturing commitments are generally based on expected quarterly sales orders from customers. Due to uneven order flow from customers, component parts common to all gaming machines are purchased and assembled into partial
11
products that are scheduled for just in time delivery to allow final assembly lead time to meet agreed customer delivery dates. Our gaming machine manufacturing processes generally consist of assembling component parts and sub-assemblies into a complete gaming machine.
Shufflers are assembled in one of our Las Vegas facilities and by a third party near Salzburg, Austria.
Hardware and component parts associated with our casino-management systems are purchased directly from the Contract Manufacturers and flow through our Las Vegas facilities with some assembly and testing. These parts do not require a significant amount of assembly and are used primarily in systems implementations, which take place at customer locations.
Our dedicated computer-controlled printing process is specifically designed to produce secure instant lottery games. We also have the capability to track instant games from the point of production through delivery to retailers. Instant lottery games are delivered finished and ready for distribution by the lottery authority (or by us under certain contracts). An instant lottery game that has been removed at any point in the distribution chain in an unauthorized manner can be flagged and invalidated in the event that it is used to claim winnings.
Production of our lottery terminals (and related component products) primarily involves the assembly of electronic and mechanical components into more complex systems and products. Third-party vendors generally manufacture and assemble our lottery terminals. We normally have sufficient lead time between reaching an agreement and the commencement of operations so that we are able to provide our Lottery customers with a fully functioning system that is customized to meet their requirements. We believe that this is consistent with our competitors' lead times and is also consistent with the needs of our customers. We place advance orders for those components that have long lead times in anticipation of firm purchase orders from our customers, provided that the investment in inventory and the risk of the customer order not materializing are deemed acceptable.
We believe we have an adequate supply of component parts and raw materials used in manufacturing our gaming machines and lottery terminals.
Seasonality
Our results of operations can fluctuate due to seasonal trends and other factors. Sales of our gaming machines to casinos are generally strongest in the spring and slowest in the summer, while revenue from our Participation gaming machines is generally highest in the spring and summer. Player activity in our Interactive business is generally slower in the second and third quarters of the year, particularly during the summer months. See the risk factor captioned "Our results of operations fluctuate due to seasonality and other factors, and, therefore, our periodic operating results are not guarantees of future performance" under the heading "Risk Factors" in Item 1A of this Annual Report on Form 10-K for additional information.
Employees
As of December 31, 2016, we employed approximately 8,400 persons worldwide, with approximately 4,600 employed domestically and 3,800 employed internationally.
Government Regulation
General
The gaming and lottery industries are generally subject to extensive and evolving regulation that customarily includes some form of licensing or regulatory screening of operators, suppliers, manufacturers and distributors and their applicable affiliates, as well as their major shareholders, officers, directors and key employees. In addition, certain of our gaming products and technologies must be certified or approved in certain jurisdictions in which we operate. Regulators review many facets of an applicant or holder of a license, including its financial stability, integrity and business experience. Any failure to receive a license or the loss of a license that we currently hold could have a material adverse effect on us or on our results of operations, cash flow or financial condition.
While we believe that we are in compliance with all material gaming and lottery laws and regulatory requirements applicable to us, we cannot assure that our activities or the activities of our customers will not become the subject of any regulatory or law enforcement proceeding or that any such proceeding would not have a material adverse impact on us or our results of operations, cash flow or financial condition.
12
We have developed and implemented a rigorous internal compliance program in an effort to ensure that we comply with legal requirements imposed in connection with our Gaming and Lottery activities, as well as legal requirements generally applicable to all publicly traded companies. The compliance program is run on a day-to-day basis by our chief compliance officer with legal advice provided by attorneys in our legal and compliance departments as well as outside experts. The compliance program is overseen by the compliance committee of our board of directors, which is comprised of employee and non-employee directors and a non-employee gaming law expert. While we are firmly committed to full compliance with all applicable laws, we cannot assure that our compliance program will prevent the violation of one or more laws or regulations, or that a violation by us or an employee will not result in the imposition of a monetary fine or suspension or revocation of one or more of our licenses.
In the EU, various judgments by the Court of Justice of the European Union ("CJEU") have addressed the approaches adopted by certain member states to restrict and/or regulate gaming. Topics addressed in those judgments include the ability of member states to grant, or to maintain, monopolies for gaming and lottery activities and the power of member states to limit access by gaming and/or lottery providers established elsewhere in the EU. Several cases on these subjects are currently pending in the CJEU.
While we believe that we have developed appropriate procedures and policies to comply with the requirements of these evolving laws and legal pronouncements, we cannot assure that our activities or the activities of our customers will not become the subject of law enforcement proceedings or that any such proceedings would not have a material adverse impact on us or our business plans. Furthermore, laws and regulations applicable to lotteries and gaming in U.S. and international jurisdictions are subject to change and the effect of such changes on our ongoing and potential operations cannot be predicted with certainty.
From time to time, we retain government affairs representatives in various U.S. and international jurisdictions to advise elected and appointed officials and the public concerning our views on gaming and lottery-related legislation, as well as to monitor such legislation and to advise us in our relations with gaming and lottery authorities.
Gaming
We provide our games, gaming machines, gaming systems, table products and related products and services in legal gaming jurisdictions worldwide. The manufacture, distribution, provision and operation of our gaming products and services is subject to regulation and approval by various city, county, state, provincial, federal, tribal and foreign agencies. The primary purposes of these rules are to (1) ensure the responsibility, financial stability and character of the parties involved in these activities through licensing requirements, (2) ensure the integrity and compliance of our gaming products and services and (3) prohibit the use of gaming products and services at unauthorized locations or for the benefit of undesirable parties.
Typically, gaming regulations in the jurisdictions in which we operate are established by statute and are administered by a regulatory agency with broad authority to interpret gaming regulations and to regulate gaming activities. Among other things, gaming authorities in the various jurisdictions in which we are licensed:
• | adopt additional rules and regulations under the implementing statutes; |
• | investigate violations of gaming regulations; |
• | enforce gaming regulations and impose disciplinary sanctions for violations of such laws, including fines, penalties and revocation of gaming licenses; |
• | review the character and fitness of manufacturers, distributors and operators of gaming products and services and make determinations regarding their suitability or qualification for licensure; |
• | grant licenses for the manufacture, distribution and operation of gaming products and services; |
• | review and approve transactions (such as acquisitions, material commercial transactions, securities offerings and debt transactions); and |
• | establish and collect related fees and/or taxes. |
We believe we hold all of the licenses and permits necessary to conduct our business. We are authorized to sell, lease or operate our gaming products and services in approximately 450 jurisdictions worldwide (including jurisdictions that do not require licensing), including approximately 170 international gaming jurisdictions.
13
In addition, a number of U.S. states authorize wagering on VLTs at state regulated and licensed facilities. Although some states restrict VLTs to already existing wagering facilities, others permit these machines to be placed at venues such as bars, restaurants, truck stops and other specifically licensed gaming facilities. In addition, all of the Canadian provinces and various other international jurisdictions have authorized VLTs.
Regulatory requirements vary among jurisdictions, but the majority of jurisdictions require licenses, permits or findings of suitability for our company, individual officers, directors, major stockholders and key employees. Our gaming hardware and software also must be approved either by a gaming authority laboratory or a private laboratory authorized by the gaming authority.
Lottery
Currently, 44 U.S. jurisdictions offer instant game lotteries, and 46 U.S. jurisdictions offer draw lotteries. The operation of lotteries in the U.S. and internationally is subject to extensive regulation. Although certain features of a lottery, such as the percentage of gross revenues that must be paid back to players in prize money, are usually set by legislation, lottery regulatory authorities generally exercise significant discretion, including with respect to the determination of the types of games played, the price of each wager, the manner in which the lottery is marketed and the selection of suppliers of equipment, technology and services and retailers of lottery products.
To ensure the integrity of contract awards and lottery operations, most jurisdictions require detailed background disclosure on a continuous basis from, and conduct background investigations of, vendors and their officers, directors, subsidiaries, affiliates and principal stockholders. Background investigations of the vendors' employees who will be directly responsible for the operation of lottery systems are also generally conducted and most states reserve the right to require the removal of employees who they deem to be unsuitable or whose presence they believe may adversely affect the operational security or integrity of the lottery. Certain jurisdictions also require extensive personal and financial disclosure and background checks from persons and entities beneficially owning a specified percentage (typically five percent or more) of a vendor's securities. The failure of such beneficial owners of our securities to submit to background checks and provide such disclosure could result in the imposition of penalties upon these beneficial owners and could jeopardize the award of a lottery contract to us or provide grounds for termination of an existing lottery contract.
The award of lottery contracts and ongoing operations of lotteries in international jurisdictions are also extensively regulated, although international regulations typically vary from those prevailing in the U.S. Restrictions are frequently imposed on foreign companies seeking to do business in such jurisdictions and, as a consequence, we have in a number of instances allied ourselves with local companies when seeking international lottery contracts.
Interactive
In the United States, the Unlawful Internet Gambling Enforcement Act of 2006 ("UIGEA") prohibits among other things, the acceptance by a business of a wager by means of the internet where such wager is prohibited by any applicable law where initiated, received or otherwise made. Under UIGEA severe criminal and civil sanctions may be imposed on the owners and operators of such systems and on financial institutions that process wagering transactions. The law contains a safe harbor for wagers placed within a single state (disregarding intermediate routing of the transmission) where the method of placing the bet and receiving the bet is authorized by that state's law, provided the underlying regulations establish appropriate age and location verification.
Within the past few years, state-authorized internet casino gaming has been launched in Delaware and New Jersey and state authorized online poker has been launched in Nevada. A number of other states are also considering adopting legislation to specifically authorize interactive gaming or online poker. Additionally, two state lotteries offer (and other lotteries are considering offering) internet instant game sales to in-state lottery customers and a number of other states allow subscription sales of draw games over the internet.
There have been various bills proposed recently in the U.S. to restrict or prohibit interactive gaming and lottery sales. Very significant resources are being devoted to supporting these efforts. Although these efforts have generally not been successful, we cannot assure that laws restricting interactive gaming or lottery sales will not be passed at either the federal or state level. For instance, in May 2015, the Minnesota legislature passed an amendment to the state’s lottery law prohibiting the sale of instant win lottery tickets over the internet. Furthermore, changes in the executive branches of government at the state and federal level could affect federal and state policies on gaming as well.
14
To varying degrees, a number of European governments have taken steps to change the regulation of internet wagering through the implementation of new or revised licensing and taxation regimes, some of which include the imposition of sanctions on unlicensed providers. Countries outside Europe and the U.S. have also begun evaluating interactive gaming regulation and an increase in regulated markets outside of the U.S. and Europe is likely to continue. Some of our competitors may be more willing to provide internet wagering in countries where the relevant laws and regulations are unclear or not uniformly enforced, putting us at a competitive disadvantage if we do not provide services related to internet wagering in such countries.
We continue to devote significant attention to monitoring these developments. However, we cannot predict the timing, scope or terms of any state, federal or foreign regulations relating to Interactive gaming and Lottery sales.
Additional Information Regarding Government Regulations
We are subject to specific gaming requirements in the different jurisdictions in which we operate. For additional information, we have filed a summary of the gaming regulations that govern our businesses as an exhibit to this Annual Report on Form 10-K. See Exhibit 99.12 (Gaming Regulations). In addition, see "Risk Factors" in Item 1A of this Annual Report on Form 10-K for a discussion of risk factors related to gaming, lottery and RMG regulations to which we may be subject.
Executive Officers of the Company
Certain information regarding each of our executive officers is set forth below.
Name | Age | Position | ||
Kevin Sheehan | 63 | Chief Executive Officer | ||
Karin-Joyce Tjon | 54 | Chief Operating Officer and President | ||
Michael A. Quartieri | 48 | Executive Vice President, Chief Financial Officer, Treasurer and Corporate Secretary | ||
Michael F. Winterscheidt | 46 | Chief Accounting Officer | ||
David W. Smail | 51 | Executive Vice President and Chief Legal Officer | ||
James C. Kennedy | 60 | Executive Vice President and Group Chief Executive, Lottery | ||
Derik J. Mooberry | 44 | Executive Vice President and Group Chief Executive, Gaming | ||
Larry A. Potts | 69 | Senior Vice President, Chief Compliance Officer and Director of Security | ||
Kevin Sheehan has served as Chief Executive Officer since August 2016. Previously he served as Chief Executive Officer and President of Norwegian Cruise Line Holding Ltd. Prior to that, Mr. Sheehan served as Chief Executive Officer of Vehicle Services, which included global responsibilities of Avis, Budget, PHH Vehicle Management Services and Wright Express. Earlier in his career, Mr. Sheehan served as President of STT Video Partners and was instrumental in the creation and launch of Telemundo.
Karin-Joyce Tjon has served as Chief Operating Officer and President since February 2017. Previously she served as Executive Vice President and Chief Financial Officer at Epiq Systems, Inc., a worldwide provider of legal services and technology. Prior to that, Ms. Tjon served as Chief Financial Officer of Hawker Beechcraft Corporation, an international manufacturer of business and special mission aircraft. Earlier in her career, Ms. Tjon served as Director, Senior Director and Managing Director at Alvarez & Marsal, LLC, a leading independent global professional services firm specializing in business turnaround and performance improvement.
Michael A. Quartieri serves as Executive Vice President, Chief Financial Officer, Treasurer and Corporate Secretary. Previously he served as the Company’s Vice President and Corporate Controller. Prior to joining SGC, Mr. Quartieri served nine years with Las Vegas Sands Corp., ending his tenure as Senior Vice President, Chief Accounting Officer and Global Controller. Prior to that, he had a 13‑year tenure at Deloitte & Touche LLP, rising to the position of Director of Audit and Assurance Services and specializing in gaming and hospitality clients.
Michael F. Winterscheidt has served as Chief Accounting Officer since February 2017. Previously he served as the Company's Vice President and Corporate Controller. Prior to joining SGC, Mr. Winterscheidt served three years with Caesars Entertainment Corporation, ending his tenure as Vice President and Corporate Controller. Prior to that, he had leadership roles leading the corporate accounting and financial reporting organizations of Delta Airlines, Inc. and Microsoft Corporation. He was previously a manager in the audit practice of the global accounting firm of Arthur Andersen LLP.
15
David W. Smail has served as Executive Vice President and Chief Legal Officer since August 2015. Prior to this role, he served as Executive Vice President and General Counsel of Morgans Hotel Group Co., an international hospitality company. Prior to that, he was Executive Vice President and Group General Counsel at Havas S.A., a Paris-based global advertising and communications services company. Earlier in his career, he was a partner with the international law firm Hogan Lovells, where he worked in Paris, France and Washington D.C.
James C. Kennedy has served as Executive Vice President and Group Chief Executive of Lottery since September 2013. Prior to this role, Mr. Kennedy served as President of Printed Products and Chief Marketing Officer. From 2005 to 2011, Mr. Kennedy served as Senior Vice President of SGI, and prior to that, Mr. Kennedy served as Vice President of U.S. Sales for SGI. Prior to joining SGC in 1985, Mr. Kennedy was a Systems Engineer for Computer Task Group.
Derik Mooberry serves as Executive Vice President and Group Chief Executive of Gaming. Mr. Mooberry joined SGC from Bally in November 2014. Previously, he served as Senior Vice President of Games, Table Game Products and Interactive Research & Development for Bally. He has also held roles as Bally’s Vice President of Systems Operations, Vice President of Strategic Planning, Vice President of System Sales-Western North America, Vice President of North America Game Sales, as well as Vice President of Sales-Americas since joining Bally in 2001.
Larry A. Potts has served as Senior Vice President, Chief Compliance Officer and Director of Corporate Security since March 2015. Previously he served as Vice President, Chief Compliance Officer and Director of Security since February 2006. Mr. Potts joined SGC in September 2004 as Vice President, Security and Compliance. Previously, he was the Chief Operating Officer of an international consulting and investigative company in Washington, D.C. Prior to that, he served as a Special Agent of the Federal Bureau of Investigation for over 23 years, where he served in a number of management positions, including Deputy Director.
Access to Public Filings
We file annual reports, quarterly reports, current reports, proxy statements and other documents with the SEC under the Securities Exchange Act of 1934, as amended (the "Exchange Act"). Copies of any materials we file with the SEC are also available at the SEC’s Public Reference Room at 100 F Street, N.E. Washington, D.C. 20549. Information on the operation of the Public Reference Room may be obtained by calling the SEC at 1-800-SEC-0330. In addition, the SEC maintains an Internet site that contains reports, proxy and information statements and other information regarding issuers that file electronically with the SEC at www.sec.gov.
We make the following information available free of charge through the Investors link on our website at www.scientificgames.com:
• | our annual reports on Form 10-K, quarterly reports on Form 10-Q, current reports on Form 8-K and amendments to those reports as soon as reasonably practicable after they are filed electronically with or furnished to the SEC; |
• | Section 16 ownership reports filed by our executive officers, directors and 10% stockholders on Forms 3, 4 and 5 and amendments to those reports as soon as reasonably practicable after they are filed electronically with the SEC; and |
• | our code of business conduct, which applies to all of our officers, directors and employees. |
ITEM 1A. RISK FACTORS
The risks described below are not the only risks facing us. Please be aware that additional risks and uncertainties not currently known to us or that we currently deem to be immaterial could also materially and adversely affect our business operations. You should also refer to the other information contained in our periodic reports, including the Forward-Looking Statements section, our consolidated financial statements and the related notes and Management’s Discussion and Analysis of Financial Condition and Results of Operations for a further discussion of the risks, uncertainties and assumptions relating to our business. Except where the context otherwise indicates, references below to the "Company," "we," "our," "ours" and "us" include all of our subsidiaries.
Risks Relating to our Business and our Industries
We operate in highly competitive industries, and our success depends on our ability to effectively compete with numerous domestic and foreign businesses.
16
Gaming
Our Gaming business faces significant competition, not only from traditional gaming suppliers, but also from a number of other domestic and foreign providers, some of which have substantially greater financial resources and/or experience than we do. In some cases, we compete against gaming operators, including illegal operators. Additionally, we face competition from an increased number of small gaming companies that have emerged in recent years and are able to focus their resources on developing a smaller number of high‑performing products.
We compete on the basis of the content, features, quality, functionality, accuracy, reliability, price and financing terms of our products and services, and the responsiveness of our services. We also compete based on the extent of our sales, service, marketing and distribution channels. We on occasion provide extended payment term financing for product purchases, and we expect to continue to provide extended payment term financing until the global economy and industry conditions improve and demand for such financing abates. We have also offered customers discounts and other offers and modified pricing and other contractual terms in connection with the sale or placement of our products and services. Our competitors may provide a greater amount of financing or better offers and terms than we do, and this may impact demand for our Gaming products and services. We cannot assure that competitive pressure will not cause us to increase the incentives that we offer to our customers or agree to modify contractual terms in ways that are unfavorable to us, which could adversely impact our results of operations, cash flows and financial condition.
We also compete to obtain space and favorable placement on casino gaming floors, and some of our product lines may compete against each other for this space. Consolidation of casino and other operators, increased competition among operators and reductions in capital expenditures by operators have significantly increased the level of competition among gaming suppliers. Casino operators focus on performance, longevity, player appeal and price when making their purchasing decisions. Competitors with a larger installed base of gaming machines and more game themes than ours may have an advantage in obtaining and retaining placements in casinos. Our Shufflers also compete against hand shuffling, which remains the most competitive shuffling option for casino card games around the world.
We also face high levels of competition in the supply of products and services for newly legalized gaming jurisdictions and for openings of new or expanded casinos. Our success depends on our ability to successfully enter new markets and compete successfully for new business, especially in the face of declining demand for gaming machine replacements.
Lottery
Our Lottery business faces competition from a number of domestic and foreign businesses, some of which have substantially greater financial resources than we do, which impacts our ability to win new contracts and renew existing contracts. In addition, the U.S. lottery industry has matured such that we believe the number of states conducting lotteries is unlikely to increase materially in the near‑term. As some jurisdictions seek to privatize or outsource lottery operations (including partial privatizations through private management agreements or otherwise), we face competition from both traditional and new competitors with respect to these opportunities. In some cases, we may find it necessary or desirable to enter into strategic relationships with third parties, including competitors, and may be required to commit significant sums of money in order to pursue these opportunities.
We continue to operate in a period of intense price‑based competition, which has affected and could continue to affect the number and the profitability of the lottery contracts we win. We believe our principal competitors in the instant lottery game business have increased, and are expected to continue to increase, their production capacity, resulting in pricing pressures in the instant lottery game business. This may adversely affect our ability to win or renew instant lottery game contracts or may reduce the profitability of instant lottery game contracts that we do win. We also compete in the international instant lottery game business with low-price printers whose quality we believe is lower than ours in regulated environments where laws are being reinterpreted to create competition from non‑traditional lottery vendors and products. Our U.S. instant lottery game business could be adversely affected if additional foreign competitors operating in Canada export their lottery products to the U.S. or if other foreign competitors establish printing facilities in the U.S. or Canada to supply the U.S.
We face increased price competition in our lottery systems business from our three principal competitors in that business. Since the beginning of 2013, we have lost lottery systems contracts in Colorado and Indiana to our competitors following the expiration or termination of our contracts.
Any future success of our Lottery business will also depend, in part, on the success of the lottery industry in attracting and retaining players in the face of increased competition for these players’ entertainment dollars, as well as our own success in
17
developing innovative products and systems to achieve this goal. Our failure to achieve this goal could reduce our revenue from our Lottery operations. Additionally, pressure on state and other government budgets could lead to other forms of gaming being legalized, which could adversely impact our Lottery business.
Interactive
Our Interactive social gaming and RMG businesses are also subject to significant competition. Our RMG business focuses on the supply of game content to online casino operators, and there are a number of competitors in that industry, including from illegal or unregulated operators. Additionally, we provide Interactive social gaming products and services, as do several of our competitors and our customers. This also causes us to compete with social gaming companies that have no connection to regulated RMG, and many of those companies have a base of existing users that is larger than ours. In order to stay competitive in both our Interactive social gaming and RMG businesses, we will need to continue to create and market game content that attracts players and invest in new and emerging technologies. Some of our competitors may be more willing to provide internet wagering in countries where the relevant laws and regulations are unclear or not uniformly enforced, putting us at a competitive disadvantage if we do not provide services related to internet wagering in such countries.
We have offered customers discounts, free trials and free spins in connection with the Interactive social gaming and RMG businesses. We cannot assure that competitive pressure will not cause us to increase the incentives that we offer to our customers, which could adversely impact our results of operations, cash flows and financial condition.
Unfavorable U.S. and international economic conditions may adversely affect our business, results of operations, cash flows or financial condition.
Unfavorable economic conditions, including recession, economic slowdown, decreased liquidity in the financial markets, decreased availability of credit and relatively high rates of unemployment, have had, and may continue to have, a negative effect on our business. We cannot fully predict the effects that unfavorable economic conditions and economic uncertainty will have on us as they also impact our customers, suppliers and business partners.
In our Gaming business, especially our Participation gaming business, our revenue is driven in large part by players’ disposable incomes and level of gaming activity. Unfavorable economic conditions have reduced the disposable incomes of casino patrons and resulted in fewer patrons visiting casinos, whether land‑based or online, and lower amounts spent per casino visit. A further or extended decline in disposable income could result in reduced play levels on our Participation gaming machines, causing our results of operations and cash flows from these products to decline. Additionally, higher airfares and other costs may adversely affect the number of players visiting our customers’ casinos. A decline in play levels may also negatively impact the results of operations, cash flows and financial condition of our casino customers and their ability to purchase or lease our products and services.
Unfavorable economic conditions have impacted, and could continue to impact, the ability of our Gaming customers to make timely payments to us. In addition, unfavorable economic conditions have caused, and could continue to cause, some of our Gaming customers to close gaming venues or ultimately declare bankruptcy, which would adversely affect our business. In recent years, our Gaming business has expanded the use of extended payment term financing for gaming machine purchases, and we expect to continue to provide a higher level of extended payment term financing in this business until demand from our customers for such financings abates. These financing arrangements may increase our collection risk, and if customers are not able to pay us, whether as a result of financial difficulties, bankruptcy or otherwise, we may incur provisions for bad debt related to our inability to collect certain receivables. In addition, both extended payment term financing and operating leases result in a delay in our receipt of cash, which reduces our cash balance, liquidity and financial flexibility to respond to changing economic events. Unfavorable economic conditions may also result in volatility in the credit and equity markets. The difficulty or inability of our customers to generate or obtain adequate levels of capital to finance their ongoing operations may reduce their ability to purchase our products and services.
In our Lottery business, we believe that the difficult economic conditions have contributed to reductions in spending on marketing by our customers and, in certain instances, less favorable terms under our contracts, as many of our customers face significant budget shortfalls and seek to cut costs.
There are ongoing concerns regarding the debt burden of certain countries, particularly in Europe and South America, and their ability to meet their future financial obligations, which have resulted in downgrades of the debt ratings for these countries. We currently operate in, and our growth strategy may involve pursuing expansion or business opportunities in certain of these jurisdictions, such as Argentina, Greece, Italy, Puerto Rico and the Ukraine. These sovereign debt concerns, whether
18
real or perceived, could result in a recession, prolonged economic slowdown, or otherwise negatively impact the general health and stability of the economies in these countries or more broadly. In more severe cases, this could result in a limitation on the availability or flow of capital, thereby restricting our liquidity and negatively impacting our results of operations, cash flows and financial condition. In March 2015, we signed a contract to provide OPAP S.A. ("OPAP") with 5,000 VLTs pursuant to OPAP's ten-year license to operate a network of 16,500 VLTs across Greece. While deployment was expected to begin in the second quarter of 2015 and conclude by the end of 2015, political and economic issues in Greece delayed the launch of the VLTs. In 2016, conditions stabilized and VLTs began to be deployed to OPAP in January 2017.
Our future results of operations may be negatively impacted by declines in the replacement cycle of gaming machines and by the slow growth of new gaming jurisdictions or slow addition of casinos in existing jurisdictions.
Demand for our Gaming products and services is driven by the replacement of existing gaming machines in existing casinos, the establishment of new jurisdictions, the opening of additional casinos in existing jurisdictions and the expansion of existing casinos. The replacement cycle of gaming machines has grown longer in recent years, which could reduce the demand for our products and negatively impact our results of operations, cash flows and financial condition.
The opening of new casinos and expansion of existing casinos fluctuate with demand, economic conditions, regulatory approvals and the availability of financing. In addition, the expansion of gaming into new jurisdictions can be a protracted process. In the U.S., governments usually require a public referendum and legislative action before establishing or expanding gaming. Any of these factors could delay, restrict or prohibit the expansion of our business and negatively impact our results of operations, cash flows and financial condition.
Our future results of operations may be negatively impacted by ownership changes and consolidation in the gaming industry, including by casino operators.
As repeat customers represent a substantial part of our revenue in our casino Gaming business, our business, results of operations, cash flow and financial condition could be negatively affected if our casino customers are sold to or merge with other entities. Such entities may purchase more products and services of our competitors, reduce spending on our products or cause downward pricing pressures. Consolidation among casino operators could result in order cancellations or a slowing in the replacement cycle for existing gaming machines, or could require our current customers to purchase our competitors’ products, any of which could negatively impact our Gaming business.
In October 2016, two of the largest betting shop operators in the U.K., Ladbrokes and Gala Coral, merged to form Ladbrokes Coral Plc. The U.K. Competition and Markets Authority required that these operators divest a certain number of betting shops prior to consummating the merger. As these two operators are the largest customers of our U.K. gaming business, if we are not able to continue to supply our products and services to the purchasers of the divested betting shops, it could negatively impact our business.
Gaming opponents persist in their efforts to curtail the expansion of legalized gaming, which, if successful, could limit the growth of our operations.
There is significant debate over, and opposition to, land‑based and interactive real money gaming. We cannot assure that this opposition will not succeed in preventing the legalization of gaming in jurisdictions where it is presently prohibited, prohibiting or limiting the expansion of gaming where it is currently permitted or causing the repeal of legalized gaming in any jurisdiction. Any successful effort to curtail the expansion of, or limit or prohibit, legalized gaming could have an adverse effect on our results of operations, cash flows and financial condition.
In addition, there is significant opposition to interactive social gaming. Some states or countries could introduce a regulatory framework to govern interactive social gaming. These regulations could result in a prohibition on interactive social gaming altogether or substantially increase our costs to comply with these regulations, all of which could have an adverse effect on our results of operations, cash flows and financial condition.
Our success depends upon our ability to adapt to, and offer products and services that keep pace with, changing technology and evolving industry standards.
Our ability to anticipate or respond to changing technology and evolving industry standards and to develop and introduce new and enhanced products and services, including, but not limited to, gaming and lottery content, gaming machines,
19
casino-management systems, table products and interactive gaming products and services, on a timely basis or at all is a significant factor affecting our ability to remain competitive, retain existing contracts or business and expand and attract new customers and players. We cannot assure that we will achieve the necessary technological advances or have the financial resources needed to introduce new products or services on a timely basis or at all.
Introducing new and innovative products and services requires us to adapt and refine our manufacturing, operations and delivery capabilities to meet the needs of our product innovation. If we cannot efficiently adapt our manufacturing infrastructure to meet the needs associated with our product innovations, or if we are unable to upgrade our production capacity in a timely manner, our business could be negatively impacted. In the past, we have experienced delays in launching new products and services due to the complex or innovative technologies embedded in our products and services. Such delays can adversely impact our results of operations, cash flows and financial condition.
We invest significant resources in our R&D efforts, which may not lead to successful or commercially viable new technologies or products.
We have invested, and intend to continue to invest, significant resources in R&D efforts. We invest in a number of areas, including product development for game and system‑based hardware, software and game content. In addition, because of the sophistication of our newer products and the resources committed to their development, they are generally more expensive to produce and, for our interactive products, to maintain. If our new products do not gain market acceptance or the increase in the average selling price of these new products is not proportionate to the increase in production cost, in each case as compared to our prior products, or if the average cost of production does not go down over time, whether by reason of long-term customer acceptance, our ability to find greater efficiencies in the manufacturing process as we refine our production capabilities or a general decrease in the cost of the technology, our margins will suffer and could negatively impact our business, results of operations, cash flows and financial condition. We cannot assure that our investment in R&D will lead to successful new technologies or products. If a new product is not successful, we may not recover our development, regulatory approval or promotion costs.
Our success depends on our ability to produce new and innovative products and services that respond to customer demand and create strong and sustained player appeal.
Our success depends upon our ability to respond to dynamic customer demand by producing new and innovative products and services. The process of developing new products and services is inherently complex and uncertain. If we fail to accurately anticipate customer needs and end user preferences through the development of new products and services, we could lose business to our competitors, which would adversely affect our results of operations, cash flows and financial condition.
Our businesses develop and source game content both internally and through third‑party suppliers. We also seek to secure third‑party brands for incorporation into our game content. We believe that creative and appealing game content produces more revenue for our gaming machine customers and provides them with a competitive advantage, which in turn enhances our revenue and our ability to attract new business and to retain existing business. In our Lottery business, we believe that innovative game concepts and game content, such as multiplier games and game content that incorporates licensed brands, can enhance the revenue of our lottery customers and distinguish us from our competitors. We cannot assure that we will be able to sustain the success of our existing game content or effectively develop or obtain from third parties game content or licensed brands that will be widely accepted both by our customers and players.
Our success also depends on creating products and services with strong and sustained player appeal. We are under continuous pressure to anticipate player reactions to, and acceptance of, our new products, avoid declining play levels on smaller jackpots and continue to provide successful products that generate a high level of play. In some cases, a new game or gaming machine will only be accepted by our casino or interactive gaming customers if we can demonstrate that it is likely to produce more revenue and Net win and/or has more player appeal than our existing products and services or our competitors’ products and services. WAP, premium and daily fee Participation gaming machines are replaced on short notice by casino operators if they do not meet and sustain revenue and profitability expectations. Customers may cancel pending orders with us if our products are not performing to expectations at other casinos.
In addition, the social gaming landscape is rapidly evolving and is characterized by major fluctuations in the popularity of social products and platforms, such as the dramatic increase in the popularity of mobile platforms. We may be unable to develop products at a rate necessary to respond to these changes, or at all, or that anticipate the interests of social players. Likewise, our social gaming offerings operate largely through Facebook, Google Play for Android devices, Apple iOS platform, Amazon Kindle platform and Microsoft Windows. If alternative platforms increase in popularity, we could be adversely impacted if we fail to timely create compatible versions of our products.
20
We and our industries are subject to strict government regulations that may limit our existing operations and have an adverse impact on our ability to grow.
In the U.S. and many other countries, the provision of Gaming and Lottery products and services is subject to extensive and evolving regulation. These regulatory requirements vary from jurisdiction to jurisdiction. Therefore, we are subject to a wide range of complex laws and regulations in the jurisdictions in which we are licensed or operate. Most jurisdictions require that we be licensed, that our key personnel and certain of our security holders be found suitable or be licensed, and that our products be reviewed and approved before placement. Licenses, approvals or findings of suitability may be revoked, suspended or conditioned. If a license, approval or finding of suitability is required by a regulatory authority and we fail to seek or do not receive the necessary approval, license or finding of suitability, or if it is granted and subsequently revoked, then we may be prohibited from providing our products or services for use in the particular jurisdiction. In addition, the loss of a license in one jurisdiction could trigger the loss of a license, or affect our eligibility for a license, in other jurisdictions. We may also become subject to regulation in any new jurisdictions in which we decide to operate in the future, including due to expansion of a customer’s operations. Gaming authorities may levy fines against us or seize certain of our assets if we violate gaming regulations. We cannot assure that we will be able to obtain or maintain the necessary licenses or approvals or that the licensing process will not result in delays or adversely affect our operations. The failure to obtain or retain a required license or approval in any jurisdiction would decrease the geographic areas where we are permitted to operate and generate revenue, may limit our ability to obtain a license in other jurisdictions and may put us at a disadvantage relative to our competitors.
We cannot assure that authorities will not seek to restrict our business in their jurisdictions or institute enforcement proceedings against us. We cannot assure that any instituted enforcement proceedings will be favorably resolved, or that such proceedings will not have a material adverse impact on our ability to retain and renew existing licenses or to obtain new licenses in other jurisdictions. Our reputation may also be damaged by any legal or regulatory investigation, regardless of whether or not we are ultimately accused of, or found to have committed, any violation.
Often, our games, Gaming product hardware and software and our Interactive RMG products and services must be approved in the jurisdictions in which they are operated, and we cannot assure you that such products or services will be approved in any jurisdiction. Our networked gaming technology requires regulatory approval in gaming jurisdictions prior to the shipment or implementation of any gaming machines, products or services and, although we have received approvals from the jurisdictions in which we currently operate this technology, we cannot assure you that we will receive the approvals necessary to offer it in additional gaming jurisdictions. Many of our customers are required to be licensed, and delays in approvals of our customers’ operations or expansions may adversely affect our results of operations, cash flows and financial condition. In addition, current regulations in a number of jurisdictions where our customers operate, such as Macau SAR and Singapore, limit the amount of space allocated to our products or limit the amount of new product available to operators to an amount that has been pre-approved by regulators. Substantial changes in any such regulations could adversely affect demand for our products.
The regulatory review process and licensing requirements also may preclude us from using technologies owned or developed by third parties if those parties are unwilling to subject themselves to regulatory review or do not meet regulatory requirements. Some gaming authorities require gaming manufacturers to obtain approval before engaging in certain transactions, such as acquisitions, mergers, reorganizations, financings, stock offerings and share repurchases. Obtaining such approvals can be costly and time consuming, and we cannot assure that such approvals will be granted or that the approval process will not result in delays or disruptions to our strategic objectives.
The U.K. government is currently in the process of undertaking a review of stakes and prizes for all gaming terminals, which may lead to additional regulations. Any changes to stakes and prizes could negatively impact our customers or our U.K. gaming business.
We and certain of our affiliates, major stockholders (generally persons and entities beneficially owning a specified percentage (typically 5% or more) of our equity securities), directors, officers and key employees are subject to extensive background investigations and suitability standards in our businesses. In some jurisdictions, these investigations may require extensive personal and financial disclosure from major stockholders, directors, officers and key employees. The failure of any such individuals or entities to submit to such background checks and provide the required disclosure could jeopardize the award of a contract or license to us or provide grounds for termination of an existing contract or license. Regulatory authorities generally have broad discretion when granting, renewing or revoking these approvals and licenses. Gaming and lottery authorities may require the removal of any of our directors or employees who are deemed to be unsuitable, and these authorities are generally empowered to disqualify us from receiving a Gaming or Lottery contract or offering our Gaming or Lottery products and services in that jurisdiction as a result of any such investigation. Our failure, or the failure of any of our major stockholders, directors, officers, key employees, products or technology, to obtain or retain a required license or approval
21
in one jurisdiction could negatively impact our ability (or the ability of any of our major stockholders, directors, officers, key employees, products or technology) to obtain or retain required licenses and approvals in other jurisdictions.
In light of these regulations and the potential impact on our business, our restated certificate of incorporation allows for the restriction of stock ownership by persons or entities who fail to comply with informational or other regulatory requirements under applicable gaming laws, who are found unsuitable to hold our stock by gaming authorities or whose stock ownership adversely affects our ability to obtain, maintain, renew or qualify for a license, contract, franchise or other regulatory approval from a gaming authority. The licensing procedures and background investigations of the authorities that regulate our businesses and the restriction in our certificate of incorporation may inhibit potential investors from becoming significant stockholders or inhibit existing stockholders from retaining or increasing their ownership.
There are instances where a state in which a Native American tribe conducts Class III gaming activities disagrees with such tribe regarding the regulation of gaming, including the regulation of gaming suppliers. In those instances, we make every effort to comply with both state and tribal regulation and fulfill our contractual obligations. However, there may be situations where any such disagreement impedes or creates uncertainty with respect to our ability to supply gaming products and services to such tribal customer or otherwise negatively impacts our relationship with such customer or gaming regulators. There are additional complexities that may impact disputes or other interactions with Native American tribe customers. For example, Native American tribes generally enjoy sovereign immunity from lawsuits, similar to the sovereign immunity enjoyed by the individual states and the U.S. In addition, certain commercial agreements with Native American tribes are subject to review by regulatory authorities such as the National Indian Gaming Commission, and, among other things, any such review could require substantial modifications to any such agreement we enter into with a Native American tribe customer.
Our businesses are subject to a number of federal, state, local and foreign laws and regulations governing data privacy and security, including with respect to the collection, storage, use, transmission and protection of personal information and other consumer data. In particular, the EU has adopted strict data privacy regulations. Following recent developments such as the European Court of Justice’s 2015 ruling that the transfer of personal data from the EU to the U.S. under the EU/U.S. Safe Harbor was an invalid mechanism of personal data transfer, the adoption of the EU-U.S. Privacy Shield as a replacement for the Safe Harbor, and the upcoming effective date of the EU’s General Data Protection Regulation, data privacy and security compliance in the EU are increasingly complex and challenging. The scope of data privacy and security regulations continues to evolve, and we believe that the adoption of increasingly restrictive regulations in this area is likely within the U.S. and other jurisdictions. Compliance with data privacy and security restrictions could increase the cost of our operations and failure to comply with such restrictions could subject us to criminal and civil sanctions as well as other penalties.
We are subject to the provisions of the Foreign Corrupt Practices Act and other anti‑corruption laws that generally prohibit U.S. persons and companies and their agents from offering, promising, authorizing or making improper payments to foreign government officials for the purpose of obtaining or retaining business. Certain of these anti‑corruption laws also contain provisions that require accurate record keeping and further require companies to devise and maintain an adequate system of internal accounting controls. Although we have policies and controls in place that are designed to ensure compliance with these laws, if those controls are ineffective or an employee or intermediary fails to comply with the applicable regulations, we may be subject to criminal and civil sanctions as well as other penalties. Any such violation could disrupt our business and adversely affect our reputation, results of operations, cash flows and financial condition.
We have developed and implemented an internal compliance program in an effort to ensure that we comply with legal requirements imposed in connection with our Gaming and Lottery activities, as well as legal requirements generally applicable to all publicly traded companies. The compliance program is run on a day‑to‑day basis by our chief compliance officer with legal advice provided by attorneys in our legal and compliance departments and outside experts. The compliance program is overseen by the compliance committee of our board of directors, consisting of our chief executive officer, three non-employee directors and a non-employee gaming law expert. We cannot assure that such steps will prevent the violation of one or more laws or regulations, or that a violation by us or an employee will not result in the imposition of a monetary fine, suspension or revocation of one or more of our licenses or other penalties.
The regulatory environment in any particular jurisdiction may change in the future, including changes that limit some or all of our existing operations in that jurisdiction, and any such change could materially and adversely affect our results of operations, cash flow, financial condition, business or prospects. Moreover, we cannot assure that our activities will be approved by additional jurisdictions or that those jurisdictions in which these activities are currently permitted will continue to permit such activities. Laws and regulations relating to our Interactive gaming businesses are evolving. For additional discussion regarding risks associated with the evolving interactive gaming regulatory landscape, see the risk factor below captioned "We may not be able to capitalize on the expansion of internet or other forms of interactive gaming or other trends and changes in the gaming and lottery industries, including due to laws and regulations governing these industries."
22
See Exhibit 99.12 (Gaming Regulations) for additional information regarding certain of the regulations that govern our Gaming business.
We may not be able to capitalize on the expansion of internet or other forms of interactive gaming or other trends and changes in the gaming and lottery industries, including due to laws and regulations governing these industries.
We participate in the new and evolving interactive gaming and lottery industries through our social, RMG and other interactive gaming and lottery products. Part of our strategy is to take advantage of the liberalization of interactive gaming, both within the U.S. and internationally. These industries involve significant risks and uncertainties, including legal, business and financial risks. The success of these industries and of our interactive gaming and lottery products and services may be affected by future developments in social networks, including Facebook, mobile platforms, regulatory developments, data privacy laws and other factors that we are unable to predict and are beyond our control. This fast‑changing environment can make it difficult to plan strategically and can provide opportunities for competitors to grow their businesses at our expense. Consequently, our future results of operations, cash flows and financial condition relating to our Interactive gaming and Lottery products and services are difficult to predict and may not grow at the rates we expect, and we cannot assure that these products and services will be successful in the long term.
In general, our ability to successfully pursue our interactive gaming and lottery strategy depends in part on the laws and regulations relating to wagering through interactive channels. Until 2011, there was uncertainty as to whether the Federal Wire Act of 1961 prohibited states from conducting intrastate lottery transactions via the internet if such transactions crossed state lines. In late 2011, the Office of Legal Counsel of the DOJ issued an opinion to the effect that state lottery ticket sales over the internet to in‑state adults do not violate the Wire Act. The opinion provided an impetus for some states to authorize forms of interactive gaming or interactive lottery in order to generate additional revenue. However, to the extent states wish to pursue interactive gaming or interactive lottery, such states may be required or otherwise deem it advisable to enact enabling legislation or new regulations addressing the sale of lottery tickets or the offering of other forms of gaming through interactive channels, such as the actions taken by Delaware, Nevada and New Jersey to authorize various forms of internet gaming. Despite the 2011 DOJ opinion, there are still very significant forces working to limit or prohibit interactive gaming and interactive lottery in the U.S. Although these efforts have generally not been successful, we cannot assure that laws restricting interactive gaming or interactive lottery sales will not be passed at either the federal or state level. For instance, in May 2015, the Minnesota legislature passed an amendment to the state’s lottery law prohibiting the sale of instant win lottery tickets over the internet. Furthermore, changes in the executive branches of government at the state and federal level could affect federal and state policies on interactive gaming and interactive lottery as well, including a reversal of the 2011 DOJ opinion. The enactment of internet gaming legislation that federalizes significant aspects of the regulation of internet gaming and/or limits the forms of internet wagering that are permissible at the state or federal level could have an adverse impact on our ability to pursue our interactive strategy in the U.S.
Internationally, laws relating to internet gaming are evolving, particularly in Europe. To varying degrees, a number of European governments have taken steps to change the regulation of internet wagering through the implementation of new or revised licensing and taxation regimes, including the possible imposition of sanctions on unlicensed providers. We cannot predict the timing, scope or terms of any such state, federal or foreign laws and regulations, or the extent to which any such laws and regulations will facilitate or hinder our interactive strategy.
With respect to our social gaming business, although largely unregulated at this time, there are movements in some jurisdictions to review social gaming and possibly implement social gaming regulations. We cannot predict the likelihood, timing, scope or terms of any such regulation or the extent to which they may affect our social gaming business. Both the social and RMG businesses are subject to evolving regulations and the status of any particular jurisdiction may change at any time. The regulatory structure surrounding certain aspects of these businesses is currently in flux in some jurisdictions.
In jurisdictions that authorize internet gaming, we cannot assure that we will be successful in offering our technology, content and services to internet gaming operators as we expect to face intense competition from our traditional competitors in the gaming and lottery industries as well as a number of other domestic and foreign providers (or, in some cases, the operators themselves), some of which have substantially greater financial resources and/or experience in this area than we do. In addition, there is a risk that the authorization of the sale of gaming and lottery offerings via interactive channels in a particular jurisdiction could, under certain circumstances, adversely impact our Gaming and Lottery offerings through traditional channels in such jurisdiction. Any such adverse impact would be magnified to the extent we are not involved in, and generating revenue from, the provision of interactive gaming and lottery products or services in such jurisdiction. Know-your-customer and geo-location programs and technologies supplied by third parties are an important aspect of certain internet and mobile gaming products and services because they confirm certain information with respect to players and prospective players, such as
23
age, identity and location. Payment processing programs and technologies, typically provided by third parties, are also a necessary feature of interactive wagering products and services. These programs and technologies are costly and may have an adverse impact on our results of operations, cash flows and financial condition. Additionally, we cannot assure that products containing these programs and technologies will be available to us on commercially reasonable terms, if at all, or that they will perform accurately or otherwise in accordance with our required specifications.
Our social gaming business largely depends upon our relationships with key providers, and changes in those relationships could negatively impact our social gaming business.
In our social gaming business, our services operate largely through Facebook, Google Play for Android devices, Apple iOS platform, Kindle platform and Microsoft Windows. Consequently, our expansion and prospects of our social gaming offerings depend on our continued relationships with these providers (and any emerging app store providers). Our relationships with Facebook, Google and Apple are not governed by contracts but rather by the provider’s standard terms and conditions for application developers. Our social gaming business will be adversely impacted if we are unable to continue these relationships in the future or if the terms and conditions offered by these providers are altered to our disadvantage. For instance, if any of these providers were to increase their fees, our results of operations, cash flows and financial condition would suffer. Likewise, if Facebook, Google or Apple were to alter their operating platforms, we could be adversely impacted as our offerings may not be compatible with the altered platforms or may require significant and costly modifications in order to become compatible. If Facebook, Google or Apple were to develop competitive offerings, either on their own or in cooperation with one or more competitors, our growth prospects would be negatively impacted.
We heavily depend on our ability to maintain and renew our customer contracts, including our long‑term lottery contracts, and we could lose substantial revenue and profits if we are unable to renew certain of our contracts on substantially similar terms or at all.
Generally, our Lottery contracts contain initial multi‑year terms, with optional renewal periods at the discretion of the customer. Upon the expiration of any such contract, including any extensions thereof, a new contract may be awarded through a competitive bidding process. Conversely, in some instances, Lottery customers are authorized to extend contracts beyond the term initially agreed in the applicable contract without subjecting the contract to competitive bidding, thereby eliminating the possibility of obtaining that new business. Since the beginning of 2013, we have lost lottery systems contracts in Colorado and Indiana to our competitors following the expiration or termination of our contracts.
We cannot assure that our current contracts will be extended or that we will be awarded new contracts as a result of competitive bidding processes or otherwise in the future. The termination, expiration or failure to renew one or more of our contracts could cause us to lose substantial revenue and profits, which could have an adverse effect on our ability to win or renew other contracts or pursue growth initiatives. We cannot assure that new or renewed contracts will contain terms that are as favorable as our current terms or will contemplate the same scope of products and services as our current contracts, and any less favorable contract terms or diminution in scope could negatively impact our results of operations, cash flows and financial condition. For additional information regarding the potential expiration dates of certain of our more significant Lottery contracts, see the table in "Business Segments-Lottery Segment" in Item 1 of this Annual Report on Form 10-K.
We are also required by certain of our customers to provide surety or performance bonds in connection with our contracts. As of December 31, 2016, we had $231.0 million of outstanding performance bonds. We cannot assure that we will continue to be able to obtain surety or performance bonds on commercially reasonable terms or at all. Our inability to provide such bonds would materially and adversely affect our ability to renew existing, or obtain new, Lottery contracts.
A substantial portion of our gaming revenue depends on repeat customers. In certain regions, our business may be concentrated with a small number of customers, such as our U.K. LBO business.
Our business depends on the protection of our intellectual property and proprietary information.
We believe that our success depends, in part, on protecting our intellectual property in the U.S. and in foreign countries. Our intellectual property includes certain patents, trademarks and copyrights relating to our products and services (including gaming machines, interactive gaming products, table games, Shufflers and accessories, instant lottery games and gaming and lottery systems), as well as proprietary or confidential information that is not subject to patent or similar protection. Our success may depend, in part, on our ability to obtain protection for the trademarks, names, logos or symbols under which we market our products and to obtain copyright and patent protection for our proprietary technologies, intellectual property and innovations. We cannot assure that we will be able to build and maintain consumer value in our trademarks, obtain patent, trademark or copyright protection or that any trademark, copyright or patent will provide us with competitive advantages. In
24
particular, a recent U.S. Supreme Court decision tightened the standard for patent eligibility of software patents, and other court decisions in recent years have trended towards a narrowing of patentable subject matter. These and similar decisions in the future may negatively impact the validity or enforceability of certain of our patents, our ability to protect our inventions, innovations and new technology and the value of our substantial patent portfolio.
Our intellectual property protects the integrity of our games, systems, products and services. For example, our intellectual property is designed to ensure the security of the printing of our instant lottery games and to provide simple and secure validation of our lottery tickets. Competitors may independently develop similar or superior products, software or systems, which could negatively impact our results of operations, cash flows and financial condition. In cases where our technology or product is not protected by enforceable intellectual property rights, such independent development may result in a significant diminution in the value of such technology or product.
We also rely on trade secrets and proprietary know‑how. We enter into confidentiality agreements with our employees and independent contractors regarding our trade secrets and proprietary information, but we cannot assure that the obligation to maintain the confidentiality of our trade secrets and proprietary information will be honored.
We are currently making, and in the future may make, claims of infringement, invalidity or enforceability against third parties. For example, with the emergence of interactive gaming, we have increased enforcement against parties that infringe our intellectual property. This enforcement could:
• | cause us to incur greater costs and expenses in the protection of our intellectual property; |
• | potentially negatively impact our intellectual property rights; |
• | cause one or more of our patents, trademarks, copyrights or other intellectual property interests to be ruled or rendered unenforceable or invalid; or |
• | divert management’s attention and our resources. |
We rely on the ability to use the intellectual property rights of third parties.
We rely on products, technologies and intellectual property that we license from third parties, including from our competitors, for use in our Gaming, Lottery and Interactive businesses. Substantially all of our Gaming machines and our Interactive products and services use intellectual property licensed from third parties. The future success of our business may depend, in part, on our ability to obtain, retain and/or expand licenses for popular technologies and games in a competitive market. We cannot assure that these third‑party licenses, or support for such licensed products and technologies, will continue to be available to us on commercially reasonable terms, if at all. In the event that we cannot renew and/or expand existing licenses, we may be required to discontinue or limit our use of the products that include or incorporate the licensed intellectual property.
Some of our license agreements contain minimum guaranteed royalty payments to the third party. If we are unable to generate sufficient revenue to offset the minimum guaranteed royalty payments, it could have a material adverse effect on our results of operations, cash flows and financial condition. Our license agreements typically contain restrictions on our ability to use or transfer the licensed rights in connection with certain strategic transactions. Certain of our license agreements grant the licensor rights to audit our use of their intellectual property. Disputes with licensors over uses or terms could result in the payment of additional royalties or penalties by us, cancellation or non‑renewal of the underlying license or litigation.
The intellectual property rights of others may prevent us from developing new products and services, entering new markets or may expose us to liability or costly litigation.
Our success depends in part on our ability to continually adapt our products and systems to incorporate new technologies and to expand into markets that may be created by new technologies. If technologies are protected by the intellectual property rights of others, including our competitors, we may be prevented from introducing products based on these technologies or expanding into markets created by these technologies. If the intellectual property rights of others prevent us from taking advantage of innovative technologies, our prospects, results of operations, cash flows and financial condition may be adversely affected.
We cannot assure that our business activities, games, products, services and systems will not infringe upon the proprietary rights of others, or that other parties will not assert infringement claims against us. In addition to infringement
25
claims, third parties may allege claims of invalidity or unenforceability against us or against our licensees or manufacturers in connection with their use of our technology. A successful challenge to, or invalidation of, one of our intellectual property interests, a successful claim of infringement by a third party against us, our products or services, or one of our licensees in connection with the use of our technologies, or an unsuccessful claim of infringement made by us against a third party or its products or services could adversely affect our business or cause us financial harm. Any such claim and any resulting litigation, should it occur, could:
• | be expensive and time consuming to defend or require us to pay significant amounts in damages; |
• | invalidate our proprietary rights; |
• | cause us to cease making, licensing or using products or services that incorporate the challenged intellectual property; |
• | require us to redesign, reengineer or rebrand our products or services or limit our ability to bring new products and services to the market in the future; |
• | require us to enter into costly or burdensome royalty, licensing or settlement agreements in order to obtain the right to use a product, process or component; |
• | impact the commercial viability of the products and services that are the subject of the claim during the pendency of such claim; or |
• | require us by way of injunction to remove products or services on lease or stop selling or leasing new products or services. |
We depend on the security and integrity of the systems and products we offer, and security breaches or other disruptions could compromise our information or the information of our customers and expose us to liability, which would cause our business and reputation to suffer.
We believe that our success depends, in large part, on providing secure products, services and systems to our customers. Despite our security measures, our products, services and systems may be vulnerable to attacks by hackers, customers, retailers, vendors or employees or breached due to malfeasance or other disruptions. Our ability to prevent anomalies and monitor and ensure the quality and integrity of our products and services is periodically reviewed and enhanced, but may not be sufficient to prevent future attacks, breaches or disruptions. Similarly, we regularly assess the adequacy of our security systems to protect against any material loss to any of our customers and the integrity of our products and services to end users. Expanded use of the internet and other interactive technologies may result in increased security risks for us and our customers. We cannot assure that our business will not be affected by a security breach or lapse, which could have a material adverse impact on our results of operations, cash flows and financial condition.
Our success depends on our ability to avoid, detect, replicate and correct software and hardware anomalies and fraudulent manipulation of our products and services. All of our products and services are designed with security features to prevent fraudulent activity. However, we cannot guarantee that these security features will effectively stop all fraudulent activities. If our security features do not prevent fraud, we could be adversely affected.
Our gaming machines have experienced anomalies and fraudulent manipulation in the past. Games and gaming machines may be replaced by casinos and other gaming machine operators if they do not perform according to expectations or they may be shut down by regulators. The occurrence of anomalies in, or fraudulent manipulation of, our gaming machines or our other Gaming and Lottery products and services (including our Interactive gaming products and services), may give rise to claims from players and claims for lost revenue and profits and related litigation by our customers and may subject us to investigation or other action by regulatory authorities, including suspension or revocation of our licenses or other disciplinary action. Additionally, in the event of the occurrence of any such issues with our products and services, substantial engineering and marketing resources may be diverted from other projects to correct these issues, which may delay other projects and the achievement of our strategic objectives.
We rely on information technology and other systems, and any failures in our systems could disrupt our business and adversely impact our results.
We rely on information technology systems that are important to the operation of our business, some of which are managed by third parties. These systems are used to process, transmit and store electronic information, to manage and support
26
our business operations and to maintain internal controls over our financial reporting. We could encounter difficulties in developing new systems, maintaining and upgrading current systems and preventing security breaches. Among other things, our systems are susceptible to outages due to fire, floods, power loss, break‑ins, cyber‑attacks, network penetration, denial of service attacks and similar events. While we have and will continue to implement network security measures and data protection safeguards, our servers and other computer systems are vulnerable to viruses, malicious software, hacking, break‑ins or theft, data privacy or security breaches, third‑party security breaches, employee error or malfeasance and similar events. Failures in our systems or services or unauthorized access to or tampering with our systems and databases could have a material adverse effect on our business, reputation, results of operations, cash flows and financial condition. Any failures in our computer systems or telecommunications services could affect our ability to operate our linked games or otherwise conduct business.
Portions of our information technology infrastructure also may experience interruptions, delays or cessations of service or produce errors in connection with systems integration or migration work that takes place from time to time. We may not be successful in implementing new systems and transitioning data, which could cause business disruptions and be more expensive, time consuming, disruptive and resource‑intensive. Such disruptions could materially and adversely impact our ability to deliver products to customers and interrupt other processes. If our information systems do not allow us to transmit accurate information, even for a short period of time, to key decision makers, the ability to manage our business could be disrupted and our results of operations, cash flows and financial condition could be materially and adversely affected. Failure to properly or adequately address these issues could impact our ability to perform necessary business operations, which could materially and adversely affect our reputation, competitive position, results of operations, cash flows and financial condition.
If we are unable to successfully implement our new global enterprise resource planning system, it could disrupt our business or have a material adverse effect on our results of operations, cash flows and financial condition.
We are engaged in a multi-year implementation of a new global enterprise resource planning system (“ERP”). The ERP system is designed to accurately maintain the Company’s books and records and provide information on our operations to the Company’s management. The Company’s ERP system implementation will continue to require significant investment of human and financial resources. There are inherent risks associated with upgrading or changing systems, including inaccurate data or reporting. The process of upgrading and standardizing our ERP system is complex, time‑consuming and expensive. Although we believe we are taking appropriate action to mitigate these risks through, among other things, testing, training and staging implementations, we cannot assure that we will not experience data loss, disruptions, delays or negative business impacts from the upgrades. Any operational disruptions during the course of this process and any delays or deficiencies in the design and implementation of the new ERP system or in the performance of our legacy systems could materially and adversely affect our ability to operate our businesses. Additionally, while we have spent considerable efforts to plan and budget for the implementation of the new ERP system, changes in scope, timeline or cost could have a material adverse effect on our results of operations, cash flows and financial condition.
If we are not able to maintain adequate internal control over our financial reporting, it could adversely affect our reputation and business.
Our management is responsible for establishing and maintaining adequate internal control over financial reporting. If we cannot maintain and execute adequate internal control over financial reporting or when necessary implement new or improved controls that provide reasonable assurance of the reliability of the financial reporting and preparation of our financial statements for external use, we may suffer harm to our reputation, fail to meet our public reporting requirements on a timely basis or be unable to properly report on our business and our results of operations, cash flows and financial condition. Additionally, the inherent limitations of internal controls over financial reporting may not prevent or detect all misstatements or fraud, regardless of the adequacy of those controls. We have previously reported material weaknesses; for instance in our 2015 Form 10-K, we concluded that our disclosure controls and procedures were not effective due to a material weakness in our goodwill impairment testing. As of the date of this Annual Report on Form 10-K, we have completed measures which successfully remediated this material weakness. However, we are currently undertaking an ERP implementation in our largest business segment which will materially change our controls. We therefore cannot assure that additional material weaknesses will not be identified in the future. Please refer to Item 9A “Controls and Procedures.”
Our results of operations, cash flows and financial condition could be affected by natural events in the locations in which we or our customers, suppliers or regulators operate.
We may be impacted by severe weather and other geological events, including hurricanes, earthquakes, floods or tsunamis that could disrupt our operations or the operations of our customers, suppliers, data service providers and regulators. Natural disasters or other disruptions at any of our facilities or our suppliers’ facilities may impair or delay delivery of our
27
products and services. Additionally, disruptions experienced by our regulators due to natural disasters or otherwise could delay our introduction of new products or entry into new jurisdictions where regulatory approval is necessary. While we insure against certain business interruption risks, we cannot assure that such insurance will compensate us for any losses incurred as a result of natural or other disasters. Any serious disruption to our operations, or those of our customers, our suppliers or our regulators, could have a material adverse effect on our results of operations, cash flows and financial condition.
We may not succeed in realizing the anticipated benefits of our strategic equity investments and relationships.
Under certain circumstances we pursue growth through strategic equity investments, including joint ventures, as a means to, among other things, gain access to new and important geographies, business opportunities and technical expertise, while simultaneously offering the potential for reducing capital requirements.
Our strategic equity relationships currently include investments in LNS, Northstar Illinois, Northstar New Jersey, Hellenic Lotteries, GLB, ITL, CSG and RCN. For additional information regarding our equity investments, see Note 13.
We may not realize the anticipated benefits of these strategic equity investments and relationships and other strategic investments and relationships that we may make or enter into, or may not realize them in the timeframes expected. These arrangements pose significant risks that could have a negative effect on our operations, including: the potential diversion of our management’s attention from our core business; the potential failure to realize anticipated synergies, economies of scale or other value associated with these arrangements; unanticipated costs and other unanticipated events or circumstances, including losses for which we may be responsible for our pro rata portion; possible adverse effects on our operating results during any integration process; impairment charges if our strategic equity investments or relationships are not as successful as we originally anticipate; and our potential inability to achieve the intended objectives of these arrangements.
Furthermore, our strategic equity investments and other strategic relationships pose risks arising from our reliance on our partners and our lack of sole decision‑making authority, which may give rise to disputes between us and our partners. For instance, our investments in LNS, Northstar Illinois and Northstar New Jersey are minority investments in ventures whose largest equity holder is Gtech and, although certain corporate actions require our prior consent, we do not unilaterally control decisions relating to the governance of these entities. We are party to strategic agreements with a subsidiary of Playtech Limited relating to gaming machines that contemplate our license of, and reliance on, the subsidiary’s back‑end technology platform in certain jurisdictions, particularly in the U.K. Our equity partners, licensors and other third parties with which we have strategic relationships may have economic or business interests or goals that are inconsistent with our interests and goals, take actions contrary to our objectives or policies, undergo a change of control, experience financial and other difficulties or be unable or unwilling to fulfill their obligations under our arrangements.
The failure to avoid or mitigate the risks described above or other risks associated with such arrangements could have a material adverse effect on our results of operations, cash flows and financial condition.
Our inability to complete acquisitions and integrate those businesses successfully could limit our growth or disrupt our plans and operations.
From time to time, we pursue strategic acquisitions. Our ability to succeed in implementing our strategy will depend to some degree upon our ability to identify and complete commercially viable acquisitions. We cannot assure that acquisition opportunities will be available on acceptable terms or at all, or that we will be able to obtain necessary financing or regulatory approvals to complete potential acquisitions.
We may not be able to successfully integrate any businesses that we acquire, or do so within the intended timeframes. We could face significant challenges in managing and integrating our acquisitions and our combined operations, including acquired assets, operations and personnel. In addition, the expected cost synergies associated with such acquisitions may not be fully realized in the anticipated amounts or within the contemplated timeframes or cost expectations, which could result in increased costs and have an adverse effect on our prospects, results of operations, cash flows and financial condition. We expect to incur incremental costs and capital expenditures related to our contemplated integration activities.
Acquisition transactions may disrupt our ongoing business. The integration of acquisitions will require significant time and focus from management and may divert attention from the day‑to‑day operations of the combined business or delay the achievement of our strategic objectives.
We have incurred, and may continue to incur, restructuring costs, the benefits of which are unpredictable and may not be achieved.
28
On November 3, 2016, we announced that we began implementing a new business improvement initiative, which we expect will streamline our organization, increase our efficiencies, and significantly reduce our operating costs. These expected cost savings will encompass a combination of headcount reductions, facilities streamlining, and reductions in other operating costs. We may also engage in additional restructuring initiatives in the future. Because we are not able to predict with certainty when we will reorganize portions of our business, we cannot predict the extent, timing and magnitude of additional restructuring charges. We may also not realize the anticipated reduction in operating costs.
Our products and services may be subject to complex revenue recognition standards, which could materially affect our financial results.
We may enter into transactions that include multiple‑element arrangements and/or software components and applicable accounting principles or regulatory product approval delays could impact when we recognize revenue with respect to such transactions and could adversely affect our financial results for any given period. In addition, fluctuations may occur in our revenue and related deferred revenue as a result of multiple‑element arrangements that include both hardware and software. See "Management's Discussion and Analysis of Financial Condition and Results of Operations-Critical Accounting Estimates- Revenue recognition for multiple-element arrangements" in Item 7 of this Annual Report on Form 10-K and Note 3 for additional information.
We may be required to recognize additional impairment charges.
We review our amortizable intangible assets for impairment when events or changes in circumstances indicate the carrying value may not be recoverable. We test goodwill and other indefinite-lived intangible assets for impairment at least annually. Factors that may indicate a change in circumstances, such that the carrying value of our goodwill or amortizable intangible assets may not be recoverable, include a decline in our stock price and market capitalization, reduced future cash flow estimates, and slower growth rates in industry segments in which we participate. We may be required to record a significant charge in our consolidated financial statements during the period in which any impairment of our goodwill or intangible assets is determined, which would negatively affect our results of operations. For example, during fiscal year 2016 we recorded a charge of $69.0 million, and during fiscal 2015 we recorded charges of $1,002.6 million and $128.6 million for the impairment of goodwill and trade name assets, respectively. We cannot predict the occurrence of impairments, and we cannot assure that we will not have to record additional impairment charges in the future.
Our results of operations fluctuate due to seasonality and other factors and, therefore, our periodic operating results are not guarantees of future performance.
Our results of operations can fluctuate due to seasonal trends and other factors. Sales of our gaming machines to casinos are generally strongest in the spring and slowest in the summer, while revenue from our Participation gaming machines is generally strongest in the spring and summer. Player activity in our Interactive business is generally slower in the second and third quarters of the year, particularly during the summer months. Certain other seasonal trends and factors that may cause our results to fluctuate include: the geographies where we operate; holiday and vacation seasons; climate; weather; economic and political conditions; timing of the release of new products; significant equipment sales or the introduction of gaming or lottery activities in new jurisdictions or to new customers; the size and duration of draw lottery game jackpots; and other factors.
In light of the foregoing, results for any quarter are not necessarily indicative of the results that may be achieved in another quarter or for the full fiscal year. We cannot assure that the seasonal trends and other factors that have impacted our historical results will repeat in future periods as we cannot influence or forecast many of these factors.
We depend on our suppliers and contract manufacturers, and any failure of these parties to meet our performance and quality standards or requirements could cause us to incur additional costs or lose customers.
Our production of instant lottery games, in particular, depends upon a continuous supply of raw materials, supplies, power and natural resources. Our operating results could be adversely affected by an interruption or cessation in the supply of these items or a serious quality assurance lapse, including as a result of the insolvency of any of our key suppliers.
Similarly, the operation of our instant ticket printing presses and the manufacture and maintenance of our gaming machines and gaming and lottery systems are dependent upon a regular and continuous supply of raw materials and components, many of which are manufactured or produced outside of the U.S. Certain of the components we use are customized for our products. The assembly of certain of our products and other hardware is performed by third parties. Any interruption or cessation in the supply of these items or services or any material quality assurance lapse with respect thereto could materially adversely affect our ability to fulfill customer orders, results of operations, cash flows and financial condition.
29
We may be unable to find adequate replacements for our suppliers within a reasonable time frame, on favorable commercial terms or at all. The impact of the foregoing may be magnified as we continue to seek to streamline our gaming supply chain by reducing the number of our suppliers. Further, manufacturing costs may unexpectedly increase and we may not be able to successfully recover any or all of such cost increases.
In our lottery systems business, we transmit certain wagering data using satellite transponders, generally pursuant to long‑term contracts. The technical failure of any of these satellites would require us to obtain other communication services, including other satellite access. In some cases, we employ backup systems to limit our exposure in the event of such a failure. We cannot assure access to such other satellites or, if available, the ability to obtain the use of such other satellites on favorable terms or in a timely manner. While satellite failures are infrequent, the operation of satellites is outside of our control.
In addition, in our Gaming business, we rely upon a number of significant third‑party suppliers and vendors delivering parts, equipment and services on schedule in order for us to meet our contractual commitments. Furthermore, we outsource the manufacturing of certain of our sub-assemblies to third parties in the U.S., Europe, Central America and Asia. Failure of these third parties to meet their delivery commitments could result in us being in breach of, and subsequently losing, the affected customer orders, which loss could have a material adverse effect on our results of operations, cash flows and financial condition. We rely on network and/or telecommunications services for certain of our products. For instance, any disruption to our network or telecommunications could impact our linked or networked games, which could reduce our revenue.
In our Interactive gaming business, we often rely on third-party data center providers to, among other things, host our remote game servers. Our Interactive gaming businesses could be adversely impacted by breaches of or disruptions to these third-party data centers, including through disruptions in our RMG business, potential service level penalties with respect to our customers, reputational harm, the disclosure of proprietary information or the information of our customers or the theft of our or our customers assets, and to the extent any such data center provider was unable or unwilling to continue to provide services to us.
In certain regions, we enter into agreements with local distributors for the distribution of our land-based gaming products to one or more customers. Changes to these distributor relationships, including modification or termination of our agreements or difficulties with any such distributor could prevent us from delivering products or services to our customers on a timely basis, or at all, and could negatively impact our business.
We have foreign operations, which subjects us to foreign currency exchange rate fluctuations and other risks.
We are a global business and derive a substantial portion of our revenue and profits from operations outside of the United States. For the year ended December 31, 2016, we derived approximately 32% of our revenue from sales to customers outside of the United States.
Our consolidated financial results are affected by foreign currency exchange rate fluctuations. We are exposed to currency exchange rate fluctuations because portions of our revenue and expenses are denominated in currencies other than the U.S. dollar, particularly the British Pound Sterling, the Australian dollar and the Euro. Exchange rate fluctuations have in the past adversely affected our results of operations, cash flows and financial condition and may adversely affect our results of operations, cash flows and financial condition and the value of our assets outside the U.S. in the future. If a foreign currency is devalued in a jurisdiction in which we are paid in such currency, we may require our customers to pay higher amounts for our products, which they may be unable or unwilling to pay.
Our operations in foreign jurisdictions subject us to additional risks customarily associated with such operations, including: the complexity of foreign laws, regulations and markets; the uncertainty of enforcement of remedies in foreign jurisdictions; the impact of foreign labor laws and disputes; the economic, tax and regulatory policies of local governments; compliance with applicable anti‑corruption laws; and the ability to attract and retain key personnel in foreign jurisdictions. In addition, our international business operations could be interrupted and negatively affected by terrorist activity, political unrest or other economic or political uncertainties. For example, recent government actions and challenges affecting the gaming industry in Mexico have increased the credit quality risk with respect to certain of our current Mexico customers. In addition, foreign jurisdictions could impose tariffs, quotas, trade barriers and other similar restrictions on our international sales.
In addition, our ability to expand successfully in foreign jurisdictions involves other risks, including difficulties in integrating foreign operations, risks associated with entering jurisdictions in which we may have little experience and the day‑to‑day management of a growing and increasingly geographically diverse company. Our investment in foreign
30
jurisdictions within the Lottery segment often entails entering into joint ventures or other business relationships with locally based entities, which can involve additional risks arising from our lack of sole decision‑making authority, our reliance on a partner’s financial condition, inconsistency between our business interests or goals and those of our partners and disputes between us and our partners.
We may not realize the operating efficiencies, competitive advantages or financial results that we anticipate from our investments in foreign jurisdictions and our failure to effectively manage the risks associated with our operations in foreign jurisdictions could have a material adverse effect on our business prospects, results of operations, cash flows and financial condition.
The affirmative vote in the U.K. to withdraw from the EU may adversely affect our business.
On June 23, 2016, the U.K. held a referendum in which voters approved an exit from the EU, commonly referred to as "Brexit". As a result of the referendum, it is expected that the British government will begin negotiating the terms of the U.K.'s future relationship with the EU. The Brexit vote may result in regulatory uncertainty throughout the region and could adversely affect business activity, restrict the movement of capital and the mobility of personnel, and otherwise impair political stability and economic conditions in the U.K., the EU and elsewhere. Any of these developments could have a material adverse effect on business activity in the U.K. or the EU. Given that we conduct a substantial portion of our business in continental Europe and the U.K. any of these developments could have a material adverse effect on our business prospects, results of operations, cash flows and financial condition.
The uncertainty concerning the timing and terms of the Brexit could have a negative impact on the growth of the U.K. and EU economies and cause greater volatility in the British Pound Sterling, the Euro and other currencies. Changes in currency exchange rates may reduce the reported value of our revenues outside the U.S. The announcement of Brexit has caused significant volatility in global stock markets and currency exchange rate fluctuations, including the strengthening of the U.S. dollar against foreign currencies.
Brexit could lead to legal uncertainty and potentially divergent national laws and regulations as the U.K. determines which EU laws to replace or replicate. Additionally, Brexit could allow the U.K. to significantly alter its regulations affecting our industry, which may result in significant costs and potentially lost opportunities for us. It may also be time-consuming and expensive for us to alter our internal operations in order to comply with new regulations. Changes to U.K. border and immigration policy could likewise occur as a result of Brexit, affecting our ability to recruit and retain employees from outside the U.K.
Changes in tax laws or tax rulings, or the examination of our tax positions, could materially affect our financial condition and results of operations.
The U.S. Congress and the current administration have expressed a desire to reform current U.S. corporate income tax laws. Our existing corporate structure and intercompany arrangements have been implemented in a manner we believe is in compliance with current prevailing tax laws. However, the tax benefits that we intend to eventually derive could be undermined due to potential U.S. tax reform. Certain contemplated changes to U.S. tax laws, if enacted, including a reduction to the 35 percent corporate income tax rate, limitations on the deductibility of interest expense, and changes to taxation of currently accumulated and/or future foreign earnings, could materially affect the U.S. tax treatment of both our domestic and foreign earnings. At this time, it is not possible to measure the potential impact on the value of our deferred tax assets, business, prospects or results of operations that might result upon enactment of any changes to these tax laws.
In addition, the taxing authorities in the U.S. and other jurisdictions where we do business regularly examine our income and other tax returns. The ultimate outcome of these examinations cannot be predicted with certainty. Should the IRS or other taxing authorities assess additional taxes as a result of examinations, we may be required to record charges to our operations, which could harm our business, results of operations and financial condition.
We depend on our key employees.
We depend on the continued performance of our executive officers and key personnel, including Kevin Sheehan, our president and chief executive officer. If we lose the services of any of our executive officers or key personnel and cannot find suitable replacements for such persons in a timely manner, it could have an adverse impact on our business. Our ability to expand is dependent on our ability to recruit and retain talented employees in the U.S. and internationally who are capable of leading our employees to achieve our strategic objectives.
31
We also rely on our highly skilled, technically trained and creative employees to develop new technologies and create innovative products. A lack of skilled technical workers could delay or negatively impact our business plans, ability to compete, results of operations, cash flows and financial condition.
We could incur costs in the event of violations of, or liabilities under, environmental laws, which may adversely affect our business and our results of operations, cash flows and financial condition.
Our operations and real property are subject to U.S. and foreign environmental laws and regulations, including those relating to air emissions, the management and disposal of hazardous substances and wastes and the cleanup of contaminated sites. We could incur costs, including cleanup costs, fines or penalties, and third‑party claims as a result of violations of, or liabilities under, environmental laws. Some of our operations require environmental permits and controls to prevent or reduce environmental pollution, and these permits are subject to review, renewal and modification by issuing authorities.
Litigation may adversely affect our business and our results of operations, cash flows and financial condition.
We may become subject to litigation claims in the operation of our business, including, but not limited to, with respect to employee matters, alleged product and system malfunctions, alleged intellectual property infringement and claims relating to our contracts, licenses and strategic investments. We may incur significant expense defending or settling any such litigation. Additionally, adverse judgments that may be decided against us could result in significant monetary damages or injunctive relief that could adversely affect our ability to conduct our business and our results of operations, cash flows and financial condition.
Litigation is pending in Colombia arising out of the termination of certain Colombian lottery contracts in 1993. An agency of the Colombian government has asserted claims against certain parties, including the Company, which owned a minority interest in Wintech de Colombia S.A., or Wintech (now liquidated), the former operator of the Colombian national lottery. The claims are for, among other things, contract penalties, interest and the amount of a bond issued by a Colombian surety. For additional information regarding this or other litigation, see "Legal Proceedings" in Item 3 of this Annual Report on Form 10-K. We cannot assure that this litigation will not be finally resolved adversely to us or result in material liability.
Failure to perform under our contracts may result in substantial monetary liquidated damages and contract termination.
Our contracts, including our Lottery contracts and our Gaming contracts relating to the provision of VLTs, typically permit a counterparty to terminate the contract at any time for a material failure to perform, other specified reasons and, in many cases, for no reason at all. Upon such a termination or failure to perform, we may be required to refund fees paid to us for services performed or allow our customers to return our products to us for a full refund. Lottery contracts to which we are a party also frequently contain exacting implementation schedules and performance requirements, and the failure to meet these schedules and requirements may result in substantial monetary liquidated damages, as well as possible contract termination. We are also required by certain of our Lottery customers to provide surety or performance bonds. In the past, we have paid or incurred liquidated damages and have been required to allow the return of VLTs for a full refund under our contracts, and material amounts of liquidated damages could be imposed on us in the future, which could, if imposed, have a material adverse effect on our business prospects, results of operations, cash flows and financial condition.
We may be liable for product defects or other claims relating to our products.
Our products could be defective, fail to perform as designed or otherwise cause harm to our customers, their equipment or their products. If any of our products are defective, we may be required to recall the products and/or repair or replace them, which could result in substantial expenses and affect our profitability. Any problem with the performance of our products, such as an instant lottery game misprint or false jackpot or other prize, could harm our reputation, which could result in a loss of sales to customers and/or potential customers. In addition, the occurrence of errors in, or fraudulent manipulation of, our products or software may give rise to claims by our customers or by our customers’ patrons, including claims by our customers for lost revenues and related litigation that could result in significant liability. Any claims brought against us by customers may result in diversion of management’s time and attention, expenditure of large amounts of cash on legal fees and payment of damages, lower demand for our products or services, or injury to our reputation. Our insurance may not sufficiently cover a judgment against us or a settlement payment and is subject to customary deductibles, limits and exclusions. In addition, a judgment against us or a settlement could make it difficult for us to obtain insurance in the coverage amounts necessary to adequately insure our businesses, or at all, and could materially increase our insurance premiums and deductibles. In addition, software bugs or malfunctions, errors in distribution or installation of our software, failure of our products to perform as approved by the appropriate regulatory bodies or other errors or malfunctions, may subject us to investigation or other action by gaming regulatory authorities, including fines.
32
Labor disputes and union organizing activities may have an adverse effect on our operations.
Certain of our employees are represented by unions or works councils, including employees in Europe, South America and Canada. In particular, the majority of our employees at our printing facilities in the U.K., Chile and Quebec and a small number of employees in the U.S. are represented by unions. While we believe our relations with our employees are satisfactory, we cannot predict whether we will be successful in negotiating new collective bargaining agreements without any disruptions in our operations or higher labor costs.
We cannot assure that we will not encounter conflicts or strikes with any labor unions that represent our employees or union organizing activities at our non-unionized facilities. Any of the foregoing could adversely impact our results of operations, cash flows and financial condition or our customers’ operations, could cause us to lose customers, or could increase our labor costs.
Risks Relating to our Capital Structure
Our level of indebtedness could adversely affect our results of operations, cash flows and financial condition.
We are a highly leveraged company. As of December 31, 2016, we had total indebtedness of $8,074.2 million, consisting primarily of borrowings under our credit agreement, Senior Notes and Subordinated Notes, net of unamortized discounts and deferred financing costs. In addition, as of December 31, 2016, there was approximately $516.5 million of availability under our revolving credit agreement.
Our level of indebtedness could affect our ability to obtain financing or refinance existing indebtedness; require us to dedicate a significant portion of our cash flow from operations to interest and principal payments on our indebtedness, thereby reducing the availability of cash flow to fund working capital, capital expenditures and other general corporate purposes; increase our vulnerability to adverse general economic, industry or competitive developments or conditions; and limit our flexibility in planning for, or reacting to, changes in our businesses and the industries in which we operate or in pursuing our strategic objectives. In addition, we are exposed to the risk of higher interest rates as a significant portion of our borrowings are at variable rates of interest. If interest rates increase, the interest payment obligations under our non‑hedged variable rate indebtedness would increase even if the amount borrowed remained the same, and our results of operations, cash flows and financial condition would be negatively impacted. All of these factors could place us at a competitive disadvantage compared to competitors that may have less debt than we do.
We may not have sufficient cash flows from operating activities, cash on hand and available borrowings under our credit agreement to finance required capital expenditures under new contracts and meet our other cash needs. These obligations require a significant amount of cash.
Our Gaming Participation and Lottery systems businesses generally require significant upfront capital expenditures for gaming machine or lottery terminal assembly, software customization and implementation, systems and equipment installation and telecommunications configuration. In connection with a renewal or bid of a Gaming machine or Lottery systems contract, a customer may seek to obtain new equipment or impose new service requirements, which may require additional capital expenditures in order to retain or win the contract. Historically, we have funded these upfront costs through cash flows generated from operations, available cash on hand and borrowings under our credit agreement. In addition, we have seen an increase in lottery RFPs, some involving PMAs, which include economic terms that expose the Company to increased risk, such as requiring the guarantee of specific income thresholds or significant upfront payments. Our ability to generate revenue and to continue to procure new contracts will depend on, among other things, our then present liquidity levels or our ability to obtain additional financing on commercially reasonable terms.
If we do not have adequate liquidity or are unable to obtain financing for these upfront costs and our other cash needs on favorable terms or at all, we may not be able to bid on certain contracts, which could result in our losing business or restrict our ability to grow which could have a material adverse effect on our results of operations, cash flows and financial condition. Moreover, we may not realize the return on investment that we anticipate on new or renewed contracts due to a variety of factors, including lower than anticipated retail sales or amounts wagered, higher than anticipated capital or operating expenses and unanticipated regulatory developments or litigation. We may not have adequate liquidity to pursue other aspects of our strategy, including bringing our products and services to new customers or new or underpenetrated geographies (including through equity investments) or pursuing strategic acquisitions. In the event we pursue significant acquisitions or other expansion opportunities, conduct significant repurchases of our outstanding securities, or refinance or repay existing debt, we may need to raise additional capital either through the public or private issuance of equity or debt securities or through
33
additional borrowings under our existing financing arrangements, which sources of funds may not necessarily be available on terms acceptable to us, if at all.
We may not have sufficient cash flows from operating activities to service all of our indebtedness and other obligations, and may be forced to take other actions to satisfy our obligations, which may not be successful.
Our ability to make payments on and to refinance our indebtedness and other obligations depends on our results of operations, cash flows and financial condition, which in turn are subject to general economic, financial, competitive, legislative, regulatory and other factors that are beyond our control. We may not be able to maintain a level of cash flows from operating activities sufficient to permit us to pay the principal, premium, if any, and interest on our indebtedness as well as our other obligations.
We are required to make scheduled payments of principal on the term loans borrowed under our credit agreement, and our credit agreement requires that a portion of our excess cash flow be applied to prepay amounts borrowed under our credit agreement. We may also, from time to time, repurchase, or otherwise retire or refinance our debt, through our subsidiaries or otherwise. Such activities, if any, will depend on prevailing market conditions, contractual restrictions and other factors, and the amounts involved may or may not be material. If we need to refinance all or part of our indebtedness at or before maturity, we cannot assure that we will be able to obtain new financing or to refinance any of our indebtedness on commercially reasonable terms or at all.
Our lenders, including the lenders participating in our revolving credit facility under our credit agreement, may become insolvent or tighten their lending standards, which could make it more difficult for us to borrow under our revolving credit facility or to obtain other financing on favorable terms or at all. Our results of operations, cash flows and financial condition would be adversely affected if we were unable to draw funds under our revolving credit facility because of a lender default or to obtain other cost‑effective financing. Any default by a lender in its obligation to fund its commitment under our revolving credit facility (or its participation in letters of credit) could limit our liquidity to the extent of the defaulting lender’s commitment. If we are unable to generate sufficient cash flow in the future to meet our commitments, we will be required to adopt one or more alternatives, such as refinancing or restructuring our indebtedness, selling material assets or operations or seeking to raise additional debt or equity capital. We cannot assure that any of these actions could be completed on a timely basis or on satisfactory terms or at all, or that these actions would enable us to continue to satisfy our capital requirements. Moreover, our existing debt agreements contain, and our future debt agreements may contain, restrictive covenants that may prohibit us from adopting these alternatives. Our failure to comply with these covenants could result in an event of default which, if not cured or waived, could result in the acceleration of all of our debt.
Agreements governing our indebtedness impose certain restrictions that may affect our ability to operate our business. Failure to comply with any of these restrictions could result in the acceleration of the maturity of our indebtedness and require us to make payments on our indebtedness. Were this to occur, we would not have sufficient cash to pay our accelerated indebtedness.
Agreements governing our indebtedness, including our credit agreement and the indentures governing our Senior Notes and Subordinated Notes, impose, and future financing agreements are likely to impose, operating and financial restrictions on our activities that may adversely affect our ability to finance future operations or capital needs or to engage in new business activities. In some cases, these restrictions require us to comply with or maintain certain financial tests and ratios. Subject to certain exceptions, our credit facilities and/or indentures restrict our ability to, among other things:
• | declare dividends or redeem or repurchase capital stock; |
• | prepay, redeem or purchase other debt; |
• | incur liens; |
• | make loans, guarantees, acquisitions and investments; |
• | incur additional indebtedness; |
• | engage in sale and leaseback transactions; |
• | amend or otherwise alter debt and other material agreements; |
34
• | engage in mergers, acquisitions or asset sales; |
• | engage in transactions with affiliates; |
• | enter into arrangements that would prohibit us from granting liens or restrict our ability to pay dividends, make loans or transfer assets among our subsidiaries; and |
• | alter the business we conduct. |
In addition, our credit agreement contains a covenant that is tested at the end of each fiscal quarter and requires us to not exceed a maximum consolidated net first lien leverage ratio of 5.5x Consolidated EBITDA (as defined in the credit agreement) for the quarter ended December 31, 2016, with this ratio stepping up to 6.0x for the quarter ended March 31, 2017, then stepping down to 5.5x for the quarter ended June 30, 2018 and 5.0x for the quarter ended June 30, 2019. As a result of these covenants, we will be limited in the manner in which we can conduct our business, and may be unable to engage in favorable business activities or finance future operations or capital needs.
Various risks, uncertainties and events beyond our control could affect our ability to comply with these covenants. Failure to comply with any of the covenants in our existing or future financing agreements could result in a default under those agreements and under other agreements containing cross‑default provisions. Such a default would permit lenders to accelerate the maturity of the debt under these agreements and other agreements containing cross-default provisions and to foreclose upon any collateral securing the debt. Under these circumstances, we might not have, or be able to obtain, sufficient funds or other resources to satisfy all of our obligations. In addition, the limitations imposed by financing agreements on our ability to incur additional debt and to take other actions might significantly impair our ability to obtain other financing.
We cannot assure that we will be granted waivers or amendments to these agreements if for any reason we are unable to comply with these obligations or that we will be able to refinance our debt on terms acceptable to us, or at all.
Certain holders of our common stock exert significant influence over the Company and may make decisions that conflict with the interests of other stockholders.
In August 2004, MacAndrews & Forbes Incorporated (formerly known as MacAndrews & Forbes Holdings Inc.) was issued approximately 25% of our outstanding common stock in connection with its conversion of our then outstanding Series A Convertible Preferred Stock. According to a Form 4 filed with the SEC on November 24, 2015, this holder beneficially owns 34,575,737 shares of our common stock, or approximately 39.2% of our outstanding common stock as of February 27, 2017. Pursuant to a stockholders’ agreement with us, which we originally entered into with holders of the Series A Convertible Preferred Stock, such holder is entitled to appoint up to four members of our board of directors and certain actions of our Company require the approval of such holder. As a result, this holder has the ability to exert significant influence over our business and may make decisions with which other stockholders may disagree, including, among other things, delaying, discouraging or preventing a change of control of our Company or a potential merger, consolidation, tender offer, takeover or other business combination.
ITEM 1B. UNRESOLVED STAFF COMMENTS
None.
35
SCIENTIFIC GAMES CORPORATION AND SUBSIDIARIES
NOTES TO CONSOLIDATED FINANCIAL STATEMENTS
(amounts in USD, table amounts in millions, except per share amounts)
ITEM 2. PROPERTIES
We occupy approximately 2,735,000 square feet of space in the U.S. Internationally, we occupy approximately 1,591,000 square feet of space. Set forth below is an overview of the principal owned and leased real estate properties that support our Gaming, Lottery and Interactive segments.
Location | Sq. Ft | Supports | Tenancy | |
Las Vegas, Nevada(1) | 493,000 | Gaming | Lease/Own | |
Chicago, Illinois(2) | 451,000 | Gaming, Interactive | Own | |
Alpharetta, Georgia | 355,000 | Gaming, Lottery | Own | |
India (Bangalore, Chennai, Pune) | 198,000 | Gaming, Lottery, Interactive | Lease | |
(1) Lease 213,000 sq. ft and own 280,000 sq. ft.
(2) 58,000 sq. ft held for sale.
Our owned Alpharetta, Chicago and Las Vegas facilities listed above are encumbered by mortgages securing indebtedness under our credit agreement and Secured Notes. In addition to those listed above, we own or lease a number of additional less significant properties in the U.S. and internationally that support our operations.
ITEM 3. LEGAL PROCEEDINGS
For discussion of the Company's legal proceedings, see Note 22, which is incorporated by reference into this Item 3 of this Annual Report on Form 10-K.
ITEM 4. MINE SAFETY DISCLOSURES
Not applicable.
PART II
ITEM 5. MARKET FOR REGISTRANT'S COMMON EQUITY, RELATED STOCKHOLDER MATTERS AND ISSUER PURCHASES OF EQUITY SECURITIES
Market for Our Common Stock
Our outstanding common stock is listed for trading on the Nasdaq Global Select Market under the symbol "SGMS." The following table sets forth, for the periods indicated, the range of high and low sales prices of our Class A common stock:
Sales Price of SGC Common Stock | ||||||||
High | Low | |||||||
Fiscal Year 2016 (January 1, 2016 - December 31, 2016) | ||||||||
First Quarter | $ | 10.24 | $ | 4.56 | ||||
Second Quarter | $ | 10.75 | $ | 7.90 | ||||
Third Quarter | $ | 11.42 | $ | 8.07 | ||||
Fourth Quarter | $ | 16.10 | $ | 10.90 | ||||
Fiscal Year 2015 (January 1, 2015 - December 31, 2015) | ||||||||
First Quarter | $ | 14.96 | $ | 9.96 | ||||
Second Quarter | $ | 17.12 | $ | 10.47 | ||||
Third Quarter | $ | 16.78 | $ | 9.57 | ||||
Fourth Quarter | $ | 12.83 | $ | 7.06 | ||||
On February 27, 2017, the last reported sale price for our common stock on the Nasdaq Global Select Market was $20.85 per share. There were 771 holders of record of our common stock as of February 27, 2017.
36
Dividend Policy
We have never paid any cash dividends on our Class A common stock and do not presently intend to pay cash dividends on our Class A common stock in the foreseeable future. Further, under the terms of certain of our debt agreements, we are limited in our ability to pay cash dividends or make certain other restricted payments (other than stock dividends) on our Class A common stock. For further discussion related to dividend restrictions, see Note 16.
Stockholder Return Performance Graph
The following graph compares the cumulative total stockholder return over the five-year period ended December 31, 2016 of our common stock, the Nasdaq Composite Index and indices of our peer group companies that operate in industries or lines of business similar to ours.
Our peer group companies consist of Aristocrat Leisure Limited (Australian Securities Exchange: ALL), International Games Technology Plc (New York Stock Exchange: IGT), Intralot, S.A (Athens Stock Exchange: IRLTY), Pollard Banknote Limited (Toronto Stock Exchange: PBL.UN-TO) and Everi Holdings Inc. (New York Stock Exchange: EVRI).
The companies in each peer group have been weighted based on their relative market capitalization each year. The graph assumes that $100 was invested in our common stock, the Nasdaq Composite Index and the peer group indices at the beginning of the five-year period and that all dividends were reinvested. The comparisons are not intended to be indicative of future performance of our common stock.
37
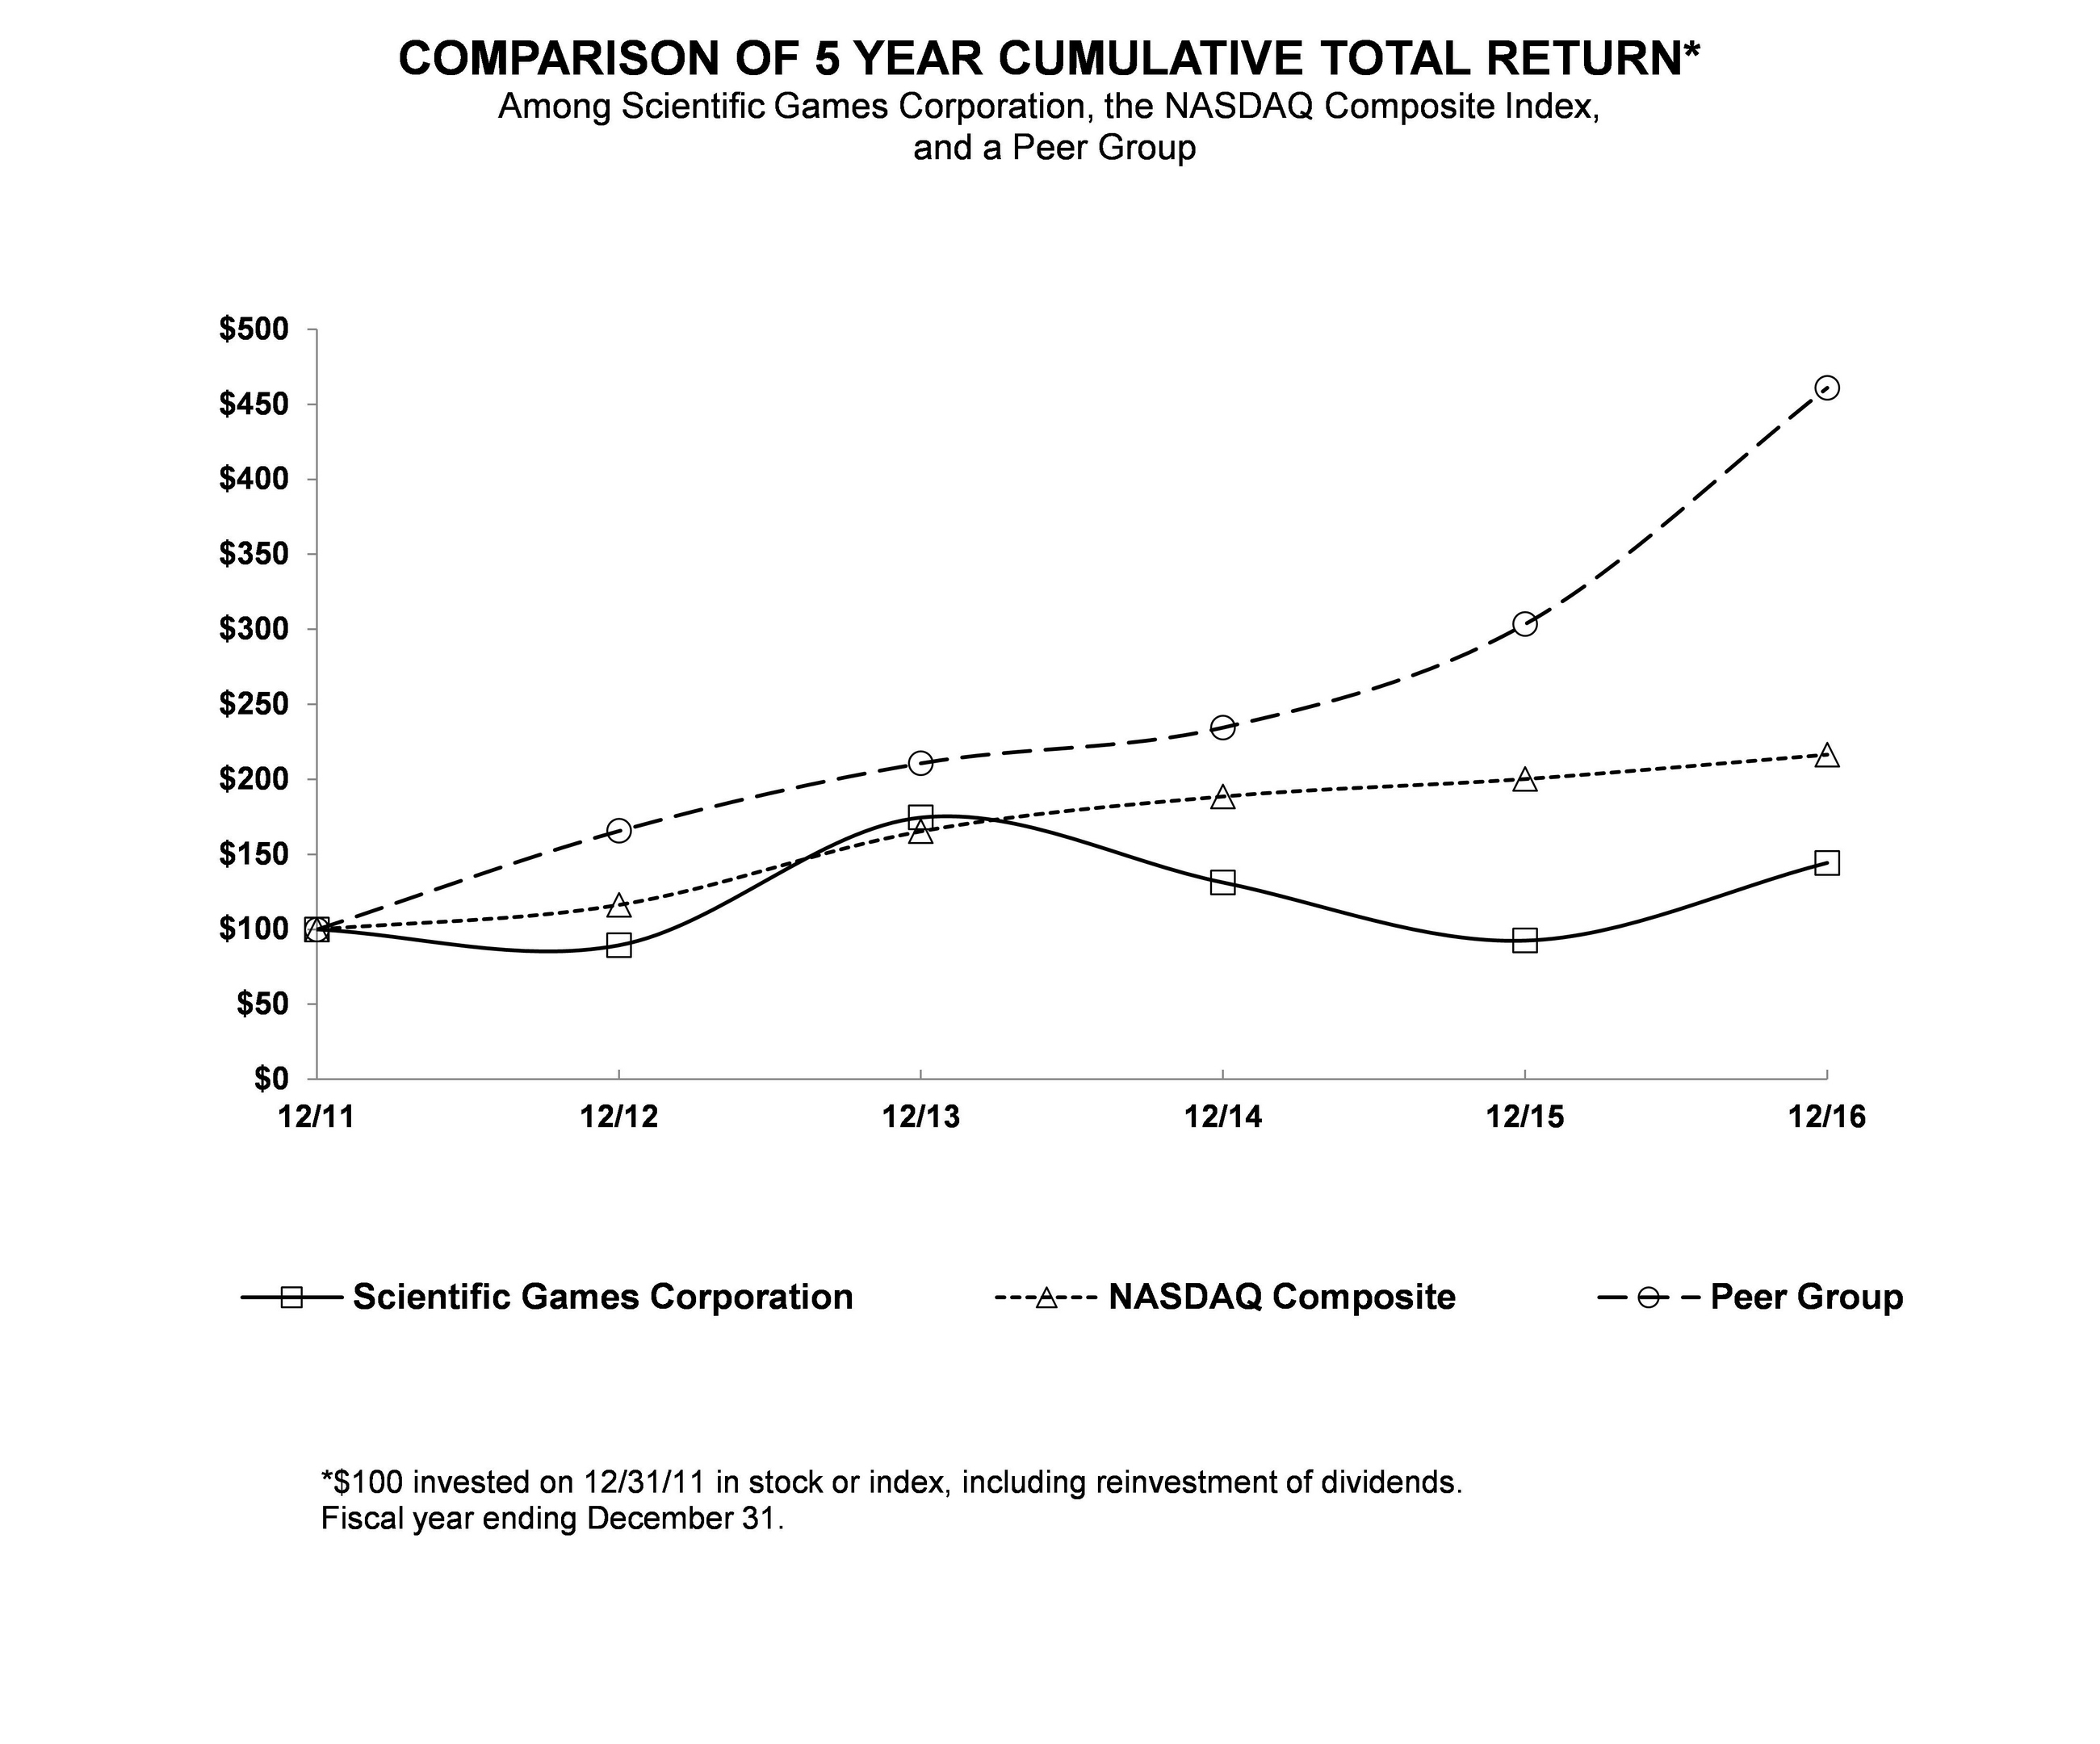
12/11 | 12/12 | 12/13 | 12/14 | 12/15 | 12/16 | |||||||||||||||||||
Scientific Games Corporation | $ | 100.00 | $ | 89.38 | $ | 174.54 | $ | 131.24 | $ | 92.47 | $ | 144.33 | ||||||||||||
NASDAQ Composite | $ | 100.00 | $ | 116.41 | $ | 165.47 | $ | 188.69 | $ | 200.32 | $ | 216.54 | ||||||||||||
Peer Group | $ | 100.00 | $ | 165.64 | $ | 210.78 | $ | 234.58 | $ | 303.51 | $ | 460.98 | ||||||||||||
38
ITEM 6. SELECTED FINANCIAL DATA
Selected financial data presented below as of and for each of the five years ended December 31, 2016 have been derived from our historical consolidated financial statements. The information below reflects the acquisitions and dispositions of certain businesses from 2012 through 2016, including the Bally acquisition in November 2014, the WMS acquisition in October 2013, the disposition of our equity investment in Sportech in January 2014, the disposition of our pub business in March 2013, the acquisition of substantially all of the assets of Parspro in July 2012, the acquisition of Provoloto in June 2012 and the exit of that business in February 2014, the acquisition of ADS in June 2012. This data should be read in conjunction with "Management's Discussion and Analysis of Financial Condition and Results of Operations" in Item 7 of this Annual Report on Form 10-K and our Consolidated Financial Statements and the Notes thereto included in Item 8 of this Annual Report on Form 10-K.
FIVE YEAR SUMMARY OF SELECTED FINANCIAL DATA
(in millions, except per share amounts)
As of and for the Year Ended December 31, | ||||||||||||||||||||
2016 | 2015 | 2014 | 2013 | 2012 | ||||||||||||||||
Total revenue | $ | 2,883.4 | $ | 2,758.8 | $ | 1,786.4 | $ | 1,090.9 | $ | 928.6 | ||||||||||
Net loss from continuing operations | $ | (353.7 | ) | $ | (1,394.3 | ) | $ | (234.3 | ) | $ | (25.6 | ) | $ | (43.9 | ) | |||||
Basic and diluted net loss per share from continuing operations | $ | (4.05 | ) | $ | (16.23 | ) | $ | (2.77 | ) | $ | (0.30 | ) | $ | (0.49 | ) | |||||
Balance Sheet Data | ||||||||||||||||||||
Total assets (1) | $ | 7,087.4 | $ | 7,732.2 | $ | 9,721.1 | $ | 4,109.6 | $ | 2,161.4 | ||||||||||
Total long-term debt, including current portion | $ | 8,074.2 | $ | 8,207.0 | $ | 8,312.9 | $ | 3,109.2 | $ | 1,442.7 | ||||||||||
(1) | Total assets as of December 31, 2012 does not reflect the adoption of ASU No. 2015-17. |
ITEM 7. MANAGEMENT'S DISCUSSION AND ANALYSIS OF FINANCIAL CONDITION AND RESULTS OF OPERATIONS
The following discussion is intended to enhance the reader's understanding of our operations and current business environment and should be read in conjunction with the description of our business (Item 1 of this Annual Report on Form 10-K) and our Consolidated Financial Statements and Notes (Item 8 of this Annual Report on Form 10-K).
This “Management’s Discussion and Analysis of Financial Condition and Results of Operations” (“MD&A”) contains forward-looking statements within the meaning of the Private Securities Litigation Reform Act of 1995 and should be read in conjunction with the disclosures and information contained and referenced under "Forward-Looking Statements" and "Risk Factors" at the beginning and in Item 1A, respectively, of this Annual Report on Form 10-K. As used in this MD&A, the terms "we," "us," "our" and the "Company" mean Scientific Games Corporation together with its consolidated subsidiaries.
BUSINESS OVERVIEW
We are a leading developer of technology‑based products and services and associated content for the worldwide gaming, lottery and interactive gaming industries. Our portfolio includes gaming machines and game content, casino management systems, table game products and services, instant and draw‑based lottery games, lottery systems, lottery content and services, interactive gaming and social casino solutions as well as other products and services. We also gain access to technologies and pursue global expansion through strategic acquisitions and equity investments.
Highlights:
• | On August 5, 2016, we announced that Kevin M. Sheehan joined Scientific Games as the Company's Chief Executive Officer, previously having served as Chief Executive Officer and President of Norwegian Cruise Line Holding Ltd. for seven years. |
39
• | In our Gaming segment, total annual worldwide new gaming machine shipments increased 10% to 31,610, and included the launch of the next-generation TwinStarTM Dual-Screen and J43 Video gaming machines, while we also introduced the innovative new GameScapeTM gaming machine dedicated exclusively for use in our gaming operations line of business. |
• | In our Lottery segment, we successfully launched our latest-generation lottery gaming system for the Arizona Lottery, displacing a competitor, and launched five innovative multi-channel cross-over lottery instant games, such as our Jackpot Party® instant game, which capitalizes on our extensive proprietary games library. |
• | In our Interactive segment, annual revenues grew 58% year over year, primarily from the popularity and increased play of our B2C social gaming apps, while successfully expanding our portfolio of social games with Blazing 7s® Slots. |
• | On November 3, 2016, we announced that we began implementing a new business improvement initiative, which we expect will streamline our organization, increase our efficiencies, and significantly reduce our operating costs once the initiative is fully implemented. |
• | During the second quarter of 2016, we voluntarily repurchased and cancelled $56.5 million and $9.4 million of principal amount of our 2020 Notes and 2021 Notes, respectively. |
• | Subsequent to December 31, 2016, we successfully completed a series of refinancing transactions, including a private offering of $1.15 billion in aggregate principal amount of 7.000% senior secured notes due 2022 and amended our credit agreement which extended the maturity of our term loans and revolving credit facility, and reduced the applicable interest rate on the term loans. These actions reduced the total principal value of our debt by $45.0 million, including payment of the remaining $45.0 million on our revolving credit facility, lowered annual cash interest cost, extended the maturity out to 2021 and 2022 for 95 percent of our debt, and significantly reduced our interest rate exposure to floating rates. |
Trends and Uncertainties
We continue to experience challenges that are representative of trends and uncertainties that may affect our business and results of operations. We are a highly leveraged company which presents several challenges, including the dedication of a significant portion of our cash flow from operations to service interest and principal payments on our indebtedness. Additional challenges we face relate to expanding our footprint within international markets and the related process of obtaining regulatory approvals to provide services and products within these new and emerging markets. A third set of challenges relates to changes in the competitive landscape. Our major competitors are expanding their product and service offerings with integrated products and solutions. We are also faced with challenges related to foreign currency risk. Our international operations provide a significant portion of our total revenue and expenses. Many of these revenue and expenses are denominated in currencies other than the U.S. dollar. As a result, changes in foreign exchange rates may significantly affect revenue and expenses. The strengthening of the U.S. dollar relative to certain foreign currencies throughout fiscal year 2016 negatively impacted reported revenue and reduced reported expenses from our international operations.
Reportable Segments
The segment amounts included in MD&A are presented on a basis consistent with our internal management reporting. Segment information appearing in Note 2 is also presented on this basis. As of December 31, 2016, we had three segments for financial reporting purposes - Gaming, Lottery and Interactive.
40
CONSOLIDATED RESULTS
(in millions) | Year Ended December 31, | Variance | ||||||||||||||||||||||||
2016 | 2015 | 2014 | 2016 vs. 2015 | 2015 vs. 2014 | ||||||||||||||||||||||
Total revenue | $ | 2,883.4 | $ | 2,758.8 | $ | 1,786.4 | $ | 124.6 | 5 | % | $ | 972.4 | 54 | % | ||||||||||||
Operating expenses | 2,752.8 | 3,783.4 | 1,959.1 | (1,030.6 | ) | (27 | )% | 1,824.3 | 93 | % | ||||||||||||||||
Operating income (loss) | 130.6 | (1,024.6 | ) | (172.7 | ) | 1,155.2 | (113 | )% | (851.9 | ) | 493 | % | ||||||||||||||
Net loss before income tax | (478.7 | ) | (1,694.2 | ) | (494.9 | ) | 1,215.5 | (72 | )% | (1,199.3 | ) | 242 | % | |||||||||||||
Net loss | (353.7 | ) | (1,394.3 | ) | (234.3 | ) | 1,040.6 | (75 | )% | (1,160.0 | ) | 495 | % | |||||||||||||
Revenue
Year Ended December 31, | Variance | Variance | ||||||||||||||||||||||||
(in millions) | 2016 | 2015 | 2014 | 2016 vs. 2015 | 2015 vs. 2014 | |||||||||||||||||||||
Gaming | $ | 1,772.7 | $ | 1,773.6 | $ | 806.4 | $ | (0.9 | ) | — | $ | 967.2 | 120 | % | ||||||||||||
Lottery | 777.9 | 775.2 | 835.5 | 2.7 | — | (60.3 | ) | (7 | )% | |||||||||||||||||
Interactive | 332.8 | 210.0 | 144.5 | 122.8 | 58 | % | 65.5 | 45 | % | |||||||||||||||||
Total revenue | $ | 2,883.4 | $ | 2,758.8 | $ | 1,786.4 | $ | 124.6 | 5 | % | $ | 972.4 | 54 | % | ||||||||||||
Year Ended December 31, 2016 Compared to Year Ended December 31, 2015
Gaming revenue slightly decreased in 2016, primarily due to a decrease in WAP and premium game revenue and lower systems hardware and software sales, which was offset by higher gaming machine sales. The gaming revenue decrease included the negative impact of $22.4 million from foreign currency.
Lottery revenue increased in 2016 primarily due to higher U.S revenue, mostly driven by an increase in U.S. instant game sales revenue with particular strength in Participation contracts and from CSP customers for whom we provide our integrated CSP offerings as well as increased retail sales of multi-state games including sales leading up to the record $1.6 billion POWERBALL jackpot in January 2016. These increases were offset by an unfavorable $21.7 million impact from the expiration of the CSL validation contract in January 2016 and a negative $9.1 million impact from foreign currency.
Interactive revenue increased in 2016 primarily due to 60.8% growth in our social gaming B2C business reflecting the ongoing popularity of Jackpot Party Social Casino and the success of our recently launched Quick Hit® Slots, Hot Shot CasinoTM and Blazing 7s Slots social gaming apps.
Operating expenses
Year Ended December 31, | Variance | Variance | |||||||||||||||||||||||
(in millions) | 2016 | 2015 | 2014 | 2016 vs. 2015 | 2015 vs. 2014 | ||||||||||||||||||||
Operating expenses: | |||||||||||||||||||||||||
Cost of services(1) | $ | 396.5 | $ | 372.7 | $ | 283.7 | $ | 23.8 | 6 | % | $ | 89.0 | 31 | % | |||||||||||
Cost of product sales(1) | 424.6 | 405.5 | 274.3 | 19.1 | 5 | % | 131.2 | 48 | % | ||||||||||||||||
Cost of instant games(1) | 285.2 | 325.9 | 291.4 | (40.7 | ) | (12 | )% | 34.5 | 12 | % | |||||||||||||||
Selling, general and administrative | 577.0 | 567.7 | 507.7 | 9.3 | 2 | % | 60.0 | 12 | % | ||||||||||||||||
Research and development | 204.8 | 183.9 | 117.0 | 20.9 | 11 | % | 66.9 | 57 | % | ||||||||||||||||
Depreciation, amortization and impairments | 738.7 | 903.2 | 454.3 | (164.5 | ) | (18 | )% | 448.9 | 99 | % | |||||||||||||||
Goodwill impairments | 69.0 | 1,002.6 | — | (933.6 | ) | (93 | )% | 1,002.6 | nm | ||||||||||||||||
Restructuring and other | 57.0 | 21.9 | 30.7 | 35.1 | 160 | % | (8.8 | ) | (29 | )% | |||||||||||||||
Total operating expenses | $ | 2,752.8 | $ | 3,783.4 | $ | 1,959.1 | $ | (1,030.6 | ) | (27 | )% | $ | 1,824.3 | 93 | % | ||||||||||
(1) Exclusive of D&A.
nm = not meaningful
41
Cost of revenue
Consolidated cost of revenue increased by $2.2 million in 2016, including (1) a $26.7 million increase in cost of unit shipments in Gaming resulting from the introduction of the TwinStar Dual-Screen and J43 Video gaming machines which generally carry higher costs at launch and trend lower as they mature; (2) a $48.9 million increase in the cost of Interactive services primarily related to volume-driven increase in the third party platform fees on the $122.8 million increase in Interactive revenues, which was offset by; (3) a decrease of $25.1 million in gaming costs primarily associated with placement of WAP, premium and other leased machines as operators have removed more of these machines from their gaming floors; (4) an $11.0 million decrease in costs related to systems and hardware sales; and (5) a $40.7 million reduction in cost of instant games primarily due to the cancellation of the MONOPOLYTM MILLIONAIRES' CLUB (MMC) game.
SG&A
The increase in SG&A of $9.3 million in 2016 was primarily due to the following: (1) a $34.9 million increase in marketing primarily driven by Interactive marketing and player acquisition costs related to new games launched in 2016 and the increased marketing related to our Jackpot Party Social Casino app; (2) a $9.9 million increase in stock-based compensation, primarily attributable to the accelerated recognition of certain stock based compensation, which was offset by (3) a $15.4 million decrease in salaries and benefits resulting from headcount actions; and (4) a $21.2 million decrease in professional and legal fees, which includes a $7.5 million credit related to insurance proceeds received during the second quarter of 2016 in connection with the settlement of a legal matter.
R&D
R&D increased by $20.9 million in 2016, primarily driven by higher investments in new product and app development across each of our business segments.
Depreciation, amortization and impairments
D&A decreased by $164.5 million in 2016 and was primarily due to the following: (1) the non-recurrence of $128.6 million of intangible asset impairment charges recognized in 2015 which reduced the carrying value of two trade name assets to their fair value; (2) the impact from the expiration of the CSL validation contract in January 2016; and (3) an $11.9 million impairment of the MMC game studio recognized in 2015 which did not recur in 2016.
Goodwill impairments
During 2016, we recorded an impairment charge of $69.0 million to reduce the carrying value of our International Lottery Systems reporting unit's goodwill balance to its implied fair value. During 2015, we recorded an aggregate goodwill impairment charges of $1,002.6 million to reduce the carrying value of our SG Gaming and U.S. Lottery Systems reporting units' goodwill balances to their implied fair value. See Note 11 for additional information.
Restructuring and other
Restructuring and other costs increased $35.1 million in 2016 primarily associated with the business improvement initiative which was announced on November 3, 2016. See Note 4 for additional information.
Other Factors Affecting 2016 Net Loss
Gain on early extinguishment of debt
During the second quarter of 2016, we repurchased and cancelled an aggregate principal amount of $65.9 million of our 2020 Notes and 2021 Notes for $39.9 million in cash, which resulted in a $25.2 million gain on early extinguishment of debt.
Income tax benefit
We recorded an income tax benefit of $125.0 million for the year ended December 31, 2016 compared to an income tax benefit of $299.9 million in 2015. The Company’s 2016 effective tax rate was impacted by the recording of valuation allowances totaling $37.1 million against domestic (federal and state) net deferred tax assets. For additional information regarding the changes in our effective tax rates and the variance in our income tax benefit, see Note 21.
42
Foreign exchange
Our results are impacted by changes in foreign currency exchange rates used in the translation of foreign functional currencies into USD and the re-measurement of foreign currency transactions or balances. The impact of foreign currency exchange rate fluctuations represents the difference between current rates and prior-period rates applied to current activity. Our exposure to foreign currency volatility on revenue is as follows:
Year Ended December 31, | |||||||||||
2016 | 2015 | ||||||||||
(in millions) | Revenue | % Consolidated Revenue | Revenue | % Consolidated Revenue | |||||||
Foreign Currency: | |||||||||||
British Pound Sterling | $ | 237.8 | 8.2 | % | $ | 235.9 | 9.0 | % | |||
Euro | 131.6 | 4.6 | % | 115.8 | 4.0 | % | |||||
Australian Dollar | 134.0 | 4.6 | % | 123.0 | 4.0 | % | |||||
Other income (expense), net increased due to a $31.1 million change in foreign currency transaction gains and losses as 2016 results reflect a $2.2 million gain compared to a $28.9 million loss in 2015, primarily due to the weakening of the British Pound Sterling and the Euro.
We also have foreign currency exposure related to certain of our equity investments. Our earnings from our Euro-denominated equity investment in LNS were $14.0 million and $14.9 million for the years ended December 31, 2016 and 2015, respectively.
See "--Business Segment Results--" below for a more detailed explanation of the significant changes in our components of revenue and expenses within the individual segment results of operations.
Year Ended December 31, 2015 Compared to Year Ended December 31, 2014
Revenue
Consolidated revenue increased in each of our categories of revenues (services, product sales and instant games) resulting in total revenues increasing by $972.4 million in 2015, despite an $83.2 million unfavorable foreign currency translation impact. Services and product sales revenue increased by $961.4 million in 2015, primarily due to $1,100.3 million from the incremental impact of the Bally acquisition reflecting a full year of results as compared to the 40 days in 2014 and a $16.7 million increase in legacy services revenue (service revenues which existed before the Bally acquisition), partially offset by a decrease of $155.6 million in legacy product sales revenue in our Gaming and Lottery segments. Instant games revenue increased by $11.0 million from 2014 to 2015.
Services revenue increased by $563.3 million in 2015, primarily reflecting a $546.6 million increase in Bally services revenue (including a full year of results as compared to 40 days in 2014) combined with a net increase of $16.7 million in services revenue primarily related to increases in our legacy Interactive gaming business partially offset by decreases in our legacy Gaming business. The impact of Bally service revenue was $63.2 million for the 40-day post-acquisition period in 2014. Product sales revenue increased by $398.1 million in 2015, primarily reflecting a $553.7 million increase in Bally product sales revenue (including a full year of results as compared to 40 days in 2014), partially offset by a $100.2 million decrease in our legacy Gaming business primarily due to lower overall demand for gaming machines and a $55.4 million decrease in our Lottery business primarily due to lower international product sales demand and an unfavorable foreign currency impact. The impact of Bally product sales revenue was $88.3 million for the 40-day post-acquisition period in 2014. Instant games revenue increased by $11.0 million in 2015, reflecting higher revenue from our U.S. and international Participation contracts and higher revenue from our international price-per-unit contracts.
Cost of revenue
Consolidated cost of revenue increased by $254.7 million in 2015, including $332.4 million attributable to Bally (reflecting a full year of results as compared to 40 days in 2014), which was partially offset by a decrease of $77.7 million from our Lottery and legacy Gaming businesses primarily due to decreased revenues. Cost of revenue attributable to Bally was $52.9 million for the 40-day post-acquisition period in 2014.
Cost of services revenue increased by $89.0 million in 2015 including an incremental $102.0 million attributable to Bally (reflecting a full year of results as compared to 40 days in 2014) and an increase in our legacy Interactive gaming business of $10.2
43
million, partially offset by a decrease of $23.2 million primarily due to the lower revenues generated by our Lottery and legacy Gaming businesses. Cost of services revenue attributable to Bally was $11.0 million for the 40-day post-acquisition period in 2014. Cost of product sales increased by $131.2 million in 2015, including an incremental $230.3 million attributable to Bally (reflecting a full year of results as compared to 40 days in 2014), partially offset by a decrease of $99.1 million attributable to our Lottery and legacy Gaming businesses, primarily related to the same items that caused the reduction in revenues as described above. Cost of product sales attributable to Bally was $41.9 million for the 40-day post-acquisition period in 2014. Cost of instant games increased by $34.5 million in 2015, primarily due to a $35.5 million charge related to other asset impairments and contract cancellation costs.
SG&A
SG&A increased by $60.0 million in 2015, including an incremental $169.5 million increase attributable to Bally (reflecting a full year of SG&A as compared to 40 days in 2014), which was partially offset by $109.5 million of lower SG&A, primarily attributable to the legacy Gaming business, which reflected the impact of lower legacy revenues, certain acquisition and legal costs incurred in 2014 and the realization of cost synergies from our acquisitions. The 2014 period included $25.8 million of additional acquisition-related charges related to the Bally acquisition, $24.8 million related to legal contingencies and settlements and $4.0 million for the write-down of certain receivables from international customers. SG&A attributable to Bally was $81.2 million for the 40-day post-acquisition period in 2014 (including $41.0 million related to the acceleration of Bally equity awards in connection with the acquisition).
R&D
R&D increased by $66.9 million in 2015, including an incremental $81.8 million increase attributable to Bally (reflecting a full year of R&D as compared to 40 days in 2014), which was partially offset by $14.9 million of lower R&D primarily attributable to the legacy Gaming business which reflected the realization of cost synergies from acquisitions. R&D attributable to Bally was $13.0 million for the 40-day post-acquisition period in 2014.
D&A
D&A increased by $448.9 million in 2015, including an incremental $413.5 million increase attributable to Bally (reflecting a full year of D&A as compared to 40 days in 2014). D&A in the 2014 period included $37.0 million attributable to Bally for the 40-day post-acquisition period in 2014. D&A also reflected charges of $169.7 million related to the impact of impairment charges for certain long-term assets, including $128.6 million in D&A to reduce the carrying values of two trade name assets to their fair values, $11.5 million in D&A to adjust the carrying value of certain of our facilities to their fair value less expected selling costs, $12.9 million in accelerated D&A related to gaming operations equipment, $11.9 million in accelerated D&A of property and equipment related to our instant games business and $4.8 million of other accelerated D&A. For additional information regarding these charges, see Note 11.
Goodwill impairments
During 2015, we recorded an aggregate goodwill impairment charge of $1,002.6 million, consisting of a $935.0 million non-cash impairment charge to reduce the carrying value of our SG Gaming reporting unit goodwill to its implied fair value and a $67.6 million non-cash impairment charge to write off the recorded amount of our U.S. Lottery Systems reporting unit goodwill. For additional information regarding these charges, see Note 11.
Restructuring and other
Restructuring and other costs decreased $8.8 million in 2015 to $21.9 million, including $16.9 million related to employee termination costs following the Bally acquisition and the WMS acquisition, $2.0 million in facility termination costs and $3.0 million of additional corporate costs unrelated to the Bally acquisition and the WMS acquisition.
Other income and expense
Interest expense increased by $357.7 million in 2015, due primarily to the additional indebtedness that we incurred to finance the Bally acquisition, reflecting a full year of interest expense as compared to 40 days in 2014. For additional information regarding our indebtedness, see Note 16.
Earnings (loss) from equity investments increased by $24.5 million in 2015, due primarily to the non-recurrence of a $19.7 million non-cash impairment charge we recorded during the year ended December 31, 2014 to write down our Northstar Illinois equity investment and higher overall performance from our equity investments. For additional information regarding our equity investments, see Note 13.
44
Loss on early extinguishment in 2014 related primarily to the tender and redemption premiums and related write-off of deferred financing costs in connection with the refinancing of our 2019 Notes in June 2014.
Other expense increased by $25.6 million in 2015, due primarily to $21.2 million of incremental losses on foreign currency translation during the year.
Income tax benefit
We recorded an income tax benefit of $299.9 million for the year ended December 31, 2015, compared to an income tax benefit of $260.6 million for the year ended December 31, 2014. The effective income tax rates for the years ended December 31, 2015 and 2014 were 17.7% and 52.6% respectively. The U.S. federal tax impact of the non-deductibility of $935.0 million of our goodwill impairment charges in 2015 was 19.4%.
Our 2015 effective income tax rate on foreign earnings was impacted by the mix of income and the statutory tax rates in our foreign jurisdictions, which ranged from a low of 0% to a high of 48%. The foreign jurisdictions that had the most impact on our foreign income tax benefit in 2015 included Australia, Bermuda, Canada, India, Ireland and the U.K.
Our income tax benefit may change from period to period based on, among other factors, the mix of earnings between U.S. and foreign jurisdictions and among foreign jurisdictions, the effect of any valuation allowance related to any of our deferred tax assets (or the release thereof), state and local taxes, specific events such as the settlement of income tax audits and changes in tax law, and the effects of our global income tax strategies. Based on our existing net deferred tax liability position at December 31, 2015 and anticipated net operating losses in 2016, we expect to have to provide a valuation allowance against our deferred tax assets in 2016 which will mostly offset the tax benefit we otherwise would record in our Consolidated Statements of Operations and Comprehensive Loss. Refer to Note 21 for additional information regarding our foreign and domestic pre-tax income (loss), our foreign and domestic income tax benefit (expense), deferred tax assets and liabilities and the effect foreign taxes have on our overall effective tax rate.
See "--Business Segment Results--" below for a more detailed explanation of the significant changes in our components of revenue within the individual segment results of operations.
BUSINESS SEGMENT RESULTS
The types of products and services from which our segments derive their revenues are further discussed in Notes 2 and 3. Certain financial information relating to our segments, including segment revenue, operating income (loss) and total assets for the last three fiscal years and certain financial information relating to our revenue derived from and assets located in the U.S. and other geographic areas is included in Note 2.
GAMING
Our Gaming business segment designs, develops, manufactures, markets and distributes a comprehensive portfolio of gaming products and services. We provide our Gaming portfolio of products and services to commercial casinos, Native American casinos, wide-area gaming operators such as LBOs, arcade and bingo operators in the U.K. and continental Europe, and government agencies and their affiliated operators. Our equity investments in RCN and ITL are part of our Gaming business segment.
The following table summarizes the primary business activities included in our Gaming business segment.
45
Services | Product sales | |||
Gaming operations | Service revenues from gaming operations are derived from WAP, premium and daily-fee Participation gaming machines and other leased gaming machines (including VLTs and electronic table games) and other services revenue from leasing game themes or other licensing arrangements | N/A | ||
Gaming machine sales | N/A | Sale of new and used gaming machines, electronic table systems ("ETS") and VLTs, conversion game kits and spare parts | ||
Gaming systems | We provide services which include installation and support of casino management systems, including ongoing hardware maintenance and software upgrade services | We offer core slot, casino and table-management systems (collectively, "casino-management systems") that help our customers improve communication with players, add excitement to the gaming floor and enhance operating efficiencies. We also provide ongoing software maintenance of customer casino management systems | ||
Table products | Revenue is generated from leased table products and services (including Shufflers) and proprietary table game licensing | Sale of table products (including Shufflers) and perpetual licenses to proprietary table games | ||
Gaming Machine Sales
The majority of our product sales are derived from sales of gaming machines and VLTs that use a combination of advanced graphics, mechanical reels, digital music and sounds and secondary bonus games. We also sell electronic table systems ("ETS") to either meet the needs of particular locations where live tables are not allowed or as productivity-enhancing solutions for other jurisdictions.
Our services revenue includes revenue earned from Participation games, other gaming machine services and table product leasing and licensing. We categorize our Participation gaming machines as (1) WAP, premium and daily fee Participation games and (2) other leased and Participation games.
WAP, premium and daily fee Participation games
• | WAP Participation games: WAP Participation games are electronically linked gaming machines that are located across multiple casinos within a single gaming jurisdiction or across Native American gaming jurisdictions. Players across linked gaming machines contribute to and compete for system-wide progressive jackpots that are designed to increase gaming machine play for participating casinos by giving the players the opportunity to win a larger jackpot than on a non-WAP gaming machine. We are responsible for funding WAP jackpots. We create WAP games using our proprietary brands and also using licensed brands. We operate our WAP systems in six states throughout the U.S. as well as in certain Native American casinos. |
Premium and daily fee Participation games: We offer two categories of non-WAP premium and daily fee Participation games: LAP and standalone. LAP games are gaming machines that are located within a single casino and are electronically linked to a progressive jackpot for that specific casino. Our LAP gaming machines feature games including those offered as WAP as well as our proprietary brands such as Jackpot Party Progressive®, Life of Luxury® Progressive, 88 Fortunes®, 5 Treasures®, and Cash Spin. Our LAP products leverage both exclusive brand names and game play intellectual property, and typically offer players the chance to win multiple progressive jackpots, all of which tend to result in higher play volumes. We also provide certain standalone Participation games that are not linked to other gaming machines. Our standalone games feature titles, among others, under the licensed MONOPOLY brand and our proprietary brands, as well as other licensed brands in those jurisdictions where we do not operate a WAP system. Our standalone Participation gaming machines generally feature larger, more elaborate top-boxes and provide game play experiences not possible on a single screen game or on gaming machines that we sell.
Other leased and Participation games
• | Server-based gaming: We provide wide-area gaming operators, such as LBOs, bingo halls and arcades, a comprehensive package of server-based products and services under long term contracts that typically include gaming machines, remote management of game content and management information, central computer systems, secure data communication and field support services. We are typically paid a fee based on the Net win generated by |
46
these gaming machines (subject to certain adjustments as may be specified in a particular contract, including adjustments for taxes and other fees). Our business in this category is primarily based in the U.K.
• | VLTs: Certain customers lease our multi-game and single-game VLTs, which include video gaming machines, mechanical reel gaming machines and video poker games. Our VLTs may be operated as standalone units or may interface with central monitoring systems operated by government agencies. Our VLTs are typically located in places where casino-style gaming is not the only attraction, such as racetracks, bars and restaurants. |
• | Class II and centrally determined systems: We offer video and mechanical-reel gaming machines and VLTs for Class II and certain VLT jurisdictions where the game outcome is determined by a central server system that we provide. These Class II and centrally determined systems primarily operate in Native American casinos in Washington, Florida, Alabama and Oklahoma. We receive either a fixed daily fee or a percentage of the Net win generated by the gaming machines or VLTs connected to the central determination system and a small daily fee for the central determination system. |
Gaming Systems
Our comprehensive suite of technology solutions provides gaming operations of every size with a wide range of marketing, data management and analysis, accounting, player tracking, security and other applications and tools to more effectively manage their operations. Gaming systems revenues are highly dependent on new installations.
Table Products
Our table product sales are generated primarily from the sale of products designed to enhance table game speed, productivity, profitability and security. Our product offerings include various models of Shufflers to suit specific games.
We offer Shuffler products under month-to-month lease arrangements that contain Participation rates or fixed monthly lease rates. These arrangements include service of the product with back-up and replacement products available at the customer’s request.
We license our PTG content to commercial, tribal and governmental casino operators typically under month to month lease arrangements based on fixed monthly rates. PTGs which are designed to enhance operators' table-game operations, include our internally developed and acquired PTGs, side bets, add-ons and progressive features. Our proprietary content and features are also added to public domain games such as poker, baccarat, pai gow poker, craps and blackjack table games and to electronic platforms.
Revenues from our Gaming products and services to external customers accounted for 61%, 64% and 45% of our total revenues in 2016, 2015 and 2014, respectively.
Current year update
We believe that challenging market conditions impacted our Gaming results during 2016 and could continue in the near term. These challenges included: (1) restrained investment in new replacement gaming machines by our existing customers; (2) increased competition for new systems, gaming operations, gaming machines and table products businesses; (3) political and economic conditions in various locations, including Greece, resulting in a delay in the deployment of our VLTs; and (4) other economic and regulatory pressures that affect our business operations globally.
For 2017, we expect to continue to face pricing pressure in our Gaming segment. We anticipate that replacement demand for gaming machines and constraints on capital spending by gaming operators will continue at current levels and that demand for gaming machines will continue to be negatively impacted by the continued consolidation of casino and other gaming operators. We anticipate that demand for our gaming systems products and services will continue at current levels due to fewer large, multi-site installation opportunities, system replacements and new casino openings anticipated in 2017. We have experienced a decrease in our installed base of WAP gaming machines but anticipate that our installed base of WAP, premium and daily-fee Participation gaming machines will begin to stabilize, benefiting from the release of a number of new games, including the launch of our new GameScape™ cabinet in the third quarter of 2016. The GameScape cabinet, a dedicated Participation platform, features a player-favorite branded WILLY WONKA™ WORLD OF WONKA™ game.
47
Results of Operations and Key Performance Indicators for Gaming
(in millions) | Year Ended December 31, | Variance | ||||||||||||||||||||||||
2016 | 2015 | 2014 | 2016 vs. 2015 | 2015 vs. 2014 | ||||||||||||||||||||||
Revenue: | ||||||||||||||||||||||||||
Services | $ | 921.8 | $ | 956.3 | $ | 442.6 | $ | (34.5 | ) | (4 | )% | $ | 513.7 | 116 | % | |||||||||||
Product sales | 850.9 | 817.3 | 363.8 | 33.6 | 4 | % | 453.5 | 125 | % | |||||||||||||||||
Total revenue | 1,772.7 | 1,773.6 | 806.4 | (0.9 | ) | — | 967.2 | 120 | % | |||||||||||||||||
Total operating expenses | 1,560.7 | 2,675.1 | 974.7 | (1,114.4 | ) | (42 | )% | 1,700.4 | 174 | % | ||||||||||||||||
Operating income (loss) | $ | 212.0 | $ | (901.5 | ) | $ | (168.3 | ) | $ | 1,113.5 | (124 | )% | $ | (733.2 | ) | 436 | % | |||||||||
Year Ended December 31, 2016 Compared to Year Ended December 31, 2015
Revenue
(in millions, except for unit and per unit revenue information) | Year Ended December 31, | Variance | ||||||||||||||||||||||||
2016 | 2015 | 2014 | 2016 vs. 2015 | 2015 vs. 2014 | ||||||||||||||||||||||
Revenue: | ||||||||||||||||||||||||||
Gaming operations | $ | 725.3 | $ | 763.2 | $ | 414.0 | $ | (37.9 | ) | (5 | )% | $ | 349.2 | 84 | % | |||||||||||
Gaming machine sales | 618.2 | 571.1 | 335.0 | 47.1 | 8 | % | 236.1 | 70 | % | |||||||||||||||||
Gaming systems | 240.8 | 273.0 | 37.4 | (32.2 | ) | (12 | )% | 235.6 | 630 | % | ||||||||||||||||
Table products | 188.4 | 166.3 | 20.0 | 22.1 | 13 | % | 146.3 | 732 | % | |||||||||||||||||
Total revenue | $ | 1,772.7 | $ | 1,773.6 | $ | 806.4 | $ | (0.9 | ) | — | $ | 967.2 | 120 | % | ||||||||||||
F/X impact on revenue | $ | (22.4 | ) | $ | (47.7 | ) | $ | 7.1 | $ | 25.3 | (53 | )% | $ | (54.8 | ) | (772 | )% | |||||||||
KPIs: | ||||||||||||||||||||||||||
WAP, premium and daily fee Participation units: | ||||||||||||||||||||||||||
Installed base at period end | 21,465 | 22,252 | 23,554 | (787 | ) | (4 | )% | (1,302 | ) | (6 | )% | |||||||||||||||
Average daily revenue per unit | $ | 51.73 | $ | 55.21 | $ | 68.25 | $ | (3.48 | ) | (6 | )% | $ | (13.04 | ) | (19 | )% | ||||||||||
Other Participation and leased units: | ||||||||||||||||||||||||||
Installed base at period end | 47,474 | 47,949 | 45,867 | (475 | ) | (1 | )% | 2,082 | 5 | % | ||||||||||||||||
Average daily revenue per unit | $ | 15.29 | $ | 15.78 | $ | 12.95 | $ | (0.49 | ) | (3 | )% | $ | 2.83 | 22 | % | |||||||||||
Gaming machine sales: | ||||||||||||||||||||||||||
U.S. and Canadian new unit shipments | 18,180 | 17,417 | 10,573 | 763 | 4 | % | 6,844 | 65 | % | |||||||||||||||||
International new unit shipments | 13,430 | 11,365 | 6,439 | 2,065 | 18 | % | 4,926 | 77 | % | |||||||||||||||||
Total new unit shipments | 31,610 | 28,782 | 17,012 | 2,828 | 10 | % | 11,770 | 69 | % | |||||||||||||||||
Average sales price per new unit | $ | 16,647 | $ | 16,349 | $ | 15,127 | $ | 298 | 2 | % | $ | 1,222 | 8 | % | ||||||||||||
Gaming Operations
Gaming operations revenue decreased in 2016 in part due to: (1) a 787 unit decrease in the installed base of WAP, premium and daily-fee Participation gaming machines; (2) a decrease in the average daily revenue per WAP, premium and daily-fee Participation units primarily reflecting a lower mix of high-yielding WAP games; (3) a 475 unit decrease in the ending installed base for Other Participation and leased units; and (4) a decrease in the average daily revenue per Other Participation and leased units. As a result of the third quarter release of our GameScape cabinet, our WAP installed base at the end of the fourth quarter of 2016 was up approximately 1% on a sequential quarter basis.
48
Gaming Machine Sales
Gaming machine unit sales increased due to higher global unit shipments primarily resulting from sales of the Pro Series WAVE (released in 2014), and the TwinStar and Dualos cabinets, both released in 2015.
U.S. and Canadian shipments encompassed 13,969 replacement units including 1,271 Oregon VLT units (which completed the contract), and 4,211 units for new casino openings and expansions, including 1,700 Illinois VGT units. International shipments encompassed 11,956 replacement units and 1,474 units for new casino openings and expansions. The average sales price increased to $16,647 per unit reflecting a greater mix of higher-performing premium gaming machines sold during the period.
Gaming Systems
Gaming systems sales decreased in 2016 due to lower hardware, software and services sales resulting from fewer large, multi-site opportunities, system replacements and new casino openings in 2016. The decreases were partially offset by a 5% increase in systems maintenance revenue.
Table Products
Table products revenue increased due to increased Shuffler sales driven by sales into Asian markets and a 5% increase in revenue from leased Shufflers, PTGs and progressives primarily due to the success of the Blazing 7s BlackjackTM Progressive.
Operating income
The increase in operating income was primarily attributable to the following: (1) the non-recurrence of a 2015 goodwill impairment charge; (2) a decrease in overall operating expenses primarily due to realized integration cost synergies largely implemented in prior periods, including lower SG&A expense of $37.1 million for the year which benefited from $7.5 million of insurance proceeds received in connection with the settlement of a legal matter; and (3) lower D&A expense of $143.3 million, driven by the non-recurrence of 2015 intangible asset impairments which totaled $128.6 million; partially offset by (4) a less profitable revenue mix, which was due to an increase in lower-margin Gaming machine sales revenue and a decline in higher-margin Gaming systems and Gaming operations revenue.
Year Ended December 31, 2015 Compared to Year Ended December 31, 2014
All results for 2015 referenced below reflect the results of operations of Bally for the full period. All results for 2014 referenced below reflect the results of operations of Bally following the November 21, 2014 closing of the Bally acquisition.
Impact of 2014 Bally acquisition on Gaming revenue | Year Ended December 31, | Variance | ||||||||||
2015(2) | 2014(1) | 2015 vs. 2014 | ||||||||||
Revenue: | ||||||||||||
Gaming operations | $ | 396.2 | $ | 43.9 | $ | 352.3 | 803 | % | ||||
Gaming machine sales | 397.7 | 61.0 | 336.7 | 552 | % | |||||||
Gaming systems | 257.3 | 23.9 | 233.4 | 977 | % | |||||||
Table products | 166.3 | 20.0 | 146.3 | 732 | % | |||||||
Total revenue | $ | 1,217.5 | $ | 148.8 | $ | 1,068.7 | 718 | % | ||||
(1) 40 days following the Bally acquisition.
(2) Results are for a full year.
Revenue
Total revenue increased by $967.2 million reflecting $1,068.7 million from the Bally acquisition as set forth above, partially offset by a reduction in legacy Gaming revenues of $101.5 million primarily due to lower new gaming machine unit demand. This change in revenue includes an unfavorable foreign currency impact of $47.7 million.
49
The $513.7 million increase in services revenue consisted of incremental revenue of $515.0 million from Bally growth in our legacy gaming service revenue and also reflects $18.3 million of unfavorable foreign currency impact. Bally revenue was $60.3 million for the 2014 post-acquisition period. Our average installed base of WAP, premium and daily-fee Participation units increased 127% to 22,720 units in 2015, due to the impact of the Bally units for a full year of results as compared to 40 days in 2014, partially offset by a reduction in the legacy Gaming average installed base of 751 units. The average daily revenue per WAP, premium and daily-fee Participation units decreased 19% due primarily to the impact of the inclusion of the Bally leased units, which have a lower leased rate and reflect a full year of results as compared to 40 days in 2014. Our average installed base of other Participation and leased units rose 15,898 units to 45,791 units, reflecting the addition of 17,991 other Participation and leased units within the Bally footprint, partially offset by a decline mostly in the U.K. gaming installed base. The ending installed base as of December 31, 2015 increased by 2,082 units from December 31, 2014, due primarily to previously excluded installed units in 2014 for one customer that are now included in the installed base total given that the customer has resumed consistent payments. Average daily revenue for our other leased and Participation units increased 22% compared to the prior-year period, primarily due to the addition of the Bally units which have a higher average daily rate.
The $453.5 million increase in product sales revenue reflected $553.7 million of incremental Bally revenue partially offset by a reduction in legacy Gaming revenues of $100.2 million. Bally product sales revenue was $88.3 million for the 40-day post-acquisition period in 2014. The decrease in legacy Gaming revenue was due primarily to abated demand for our dual screen video cabinets, which we believe resulted from our customers' knowledge of our intention to launch new dual screen video cabinets in the second half of 2015. The 69% increase in new unit sales reflected 18,234 of new unit sales of Bally units (reflecting a full year of results as compared to 40 days in 2014) partially offset by a decrease of 6,464 in legacy Gaming new unit sales. Bally had 3,101 new unit sales for the 40-day post-acquisition period in 2014.
Operating loss
The operating loss of $901.5 million increased by $733.2 million in 2015, primarily reflecting a goodwill impairment charge of $935.0 million, and trade name asset impairment charges of $128.6 million. This was partially offset by the impact from the inclusion of Bally results for a full year in 2015 (as compared to 40 days in 2014) and benefits from cost synergies realized from our integration initiatives, which reduced our operating expenses. For additional information regarding these charges, see Note 11.
LOTTERY
The Lottery segment is primarily comprised of our systems-based services and product sales business and our instant games business. Our systems-based services and product sales business provides customized computer software, software support, equipment and data communication services, sports wagering systems and keno to lotteries. In the U.S., we typically provide the necessary point-of-sale terminals and equipment, software and maintenance services on a Participation basis under long-term contracts that typically have an initial term of at least five years. Internationally, we typically sell point-of-sale terminals and/or computer software to lottery authorities and may provide ongoing fee-based systems maintenance and software support services.
Our instant games business generates revenue from the manufacture and sale of instant games, as well as the provision of value-added services such as game design, sales and marketing support, specialty games and promotions, inventory management, warehousing, fulfillment services, as well as full instant game category management. In addition, we provide licensed games, promotional entertainment and internet-based marketing services to the lottery industry. These revenues are presented as instant games revenue.
Our equity investments in LNS, Northstar Illinois, Northstar New Jersey, CSG, Hellenic Lotteries and GLB are included in the Lottery segment.
The following table summarizes the primary business activities included in the Lottery business segment.
50
Services | Product Sales | Instant Games | ||||
Instant products - participation and price-per-unit(1) | N/A | N/A | Designing, printing and selling instant lottery games Providing instant game-related services, such as game design, sales and marketing support and inventory management | |||
Instant products - licensing and player loyalty | N/A | N/A | Supplying player loyalty programs, merchandising services and interactive marketing campaigns Sublicensing brands for lottery products and providing lottery-related promotional products | |||
Lottery systems - services | Providing software, hardware and related services for lottery operations: including draw systems, instant ticket validation systems, sports wagering and keno systems | Providing lottery systems hardware to customers where we have an ongoing services arrangement | N/A | |||
Lottery systems - sales | Lottery systems software maintenance and support | Providing lottery systems, including hardware, software, and instant game validation systems | N/A | |||
(1) See Instant Lottery Games below.
Instant Lottery Games
We generate revenue from the sale of instant lottery games. Some of our contracts bundle the design and manufacturing of instant lottery games, instant game management systems and marketing and other services, such as the design and installation of game management software, inventory and distribution, sales, accounting, training and advisory services, market research and retailer training and recruitment. We are typically paid on a Participation basis under these contracts. We believe these services help lotteries effectively manage and support their operations, achieve higher retail sales and lower operating costs. We also provide licensed games and promotional and interactive marketing services to the lottery industry.
We market instant lottery games and related services to U.S. and international lotteries and commercial customers. We supply instant lottery games to 38 of the 44 U.S. jurisdictions that sell instant lottery games and have sold instant lottery games to customers in approximately 50 countries. Our U.S. instant lottery game contracts customarily have an initial term of three to five years and frequently include multiple renewal options for additional periods ranging from one to five years, which our customers have generally exercised in the past. We usually sell our instant lottery games on a price-per-unit (meaning instant games sold to customer at a fixed price per unit) or Participation basis. Certain of our international customers purchase instant lottery games as needed rather than under multi-game supply contracts.
We provide lotteries with access to some of the world's most popular entertainment brands on lottery products, which we believe helps increase our customers' instant game sales. Our licensed entertainment brands include AMC®- THE WALKING DEAD®, HARLEY-DAVIDSON®, LOTERIATM, MAJOR LEAGUE BASEBALL®, MARGARITAVILLE®, MONOPOLY, NATIONAL BASKETBALL ASSOCIATION®, THE PRICE IS RIGHT® and SLINGO®. We also provide branded merchandise, advertising, promotional support, drawing management services and prize fulfillment programs. In addition, we offer lotteries interactive marketing services through our Properties Plus® program which features players clubs, reward programs, second chance promotional websites, interactive games and subscription systems that enable players to purchase lottery games securely over the internet.
Lottery Systems
We are a leading provider of lottery systems including customized computer software, software support, equipment, and data communication services, to lotteries in the U.S. and internationally. In the U.S., our arrangements ordinarily include the following: (1) provision of the necessary equipment (including point-of-sale terminals) and (2) software and maintenance services pursuant to long-term contracts that typically have an initial term of at least five years under which we are generally paid a fee equal to a percentage of the lottery's total retail sales. Our U.S. contracts commonly include multiple renewal options that generally have been exercised by our customers in the past. Internationally, we primarily sell: (1) point-of-sale terminals and/or computer software and hardware to lottery authorities; and (2) provide ongoing fee-based systems and software support services.
Our lottery systems use proprietary technology that facilitates high-speed processing of draw lottery game wagers as well as validation of winning draw and instant lottery games. This business includes the supply of proprietary transaction-processing
51
software, draw lottery games, keno, point-of-sale terminals, central site computers and communication platforms as well as ongoing operational support and maintenance services. We have contracts to operate lottery systems for 10 of the 46 U.S. jurisdictions that operate draw lotteries. Internationally, we have lottery systems operating in 14 countries including Canada and China.
The fees we earn under our lottery systems contracts are generally included in our services revenue. Revenue from the sale of our point-of-sale terminals and/or computer software is included in our product sales revenue, while the fees we generate from ongoing systems and software support are generally included in our services revenue.
We have equity investments in LNS, Northstar Illinois, Northstar New Jersey, Hellenic Lotteries, CSG and GLB, which entities operate or assist in the operation of lotteries. We are also the primary provider of instant lottery games to LNS and Northstar New Jersey and the exclusive provider of instant lottery games to Northstar Illinois and Hellenic Lotteries. Additional information regarding these equity investments is included in Note 13.
Revenues from our Lottery products and services to external customers accounted for 27%, 28% and 47% of our total revenues in 2016, 2015 and 2014, respectively.
Current year update
We were the exclusive instant game validation network provider to the CSL under an agreement that expired in January 2016 and was subsequently not renewed or extended. We have also seen a decline in the instant game printing revenue of CSG, our printing joint venture in China, which continues to service the CSL. We believe a decrease in retail sales is due in part to competition from other wagering products. We continue to actively seek multiple opportunities to continue to provide value-added services to the CSL, as well as developing additional business initiatives to replace our revenue and profits previously generated by the CSL validation agreement. Until we are able to achieve these other opportunities and initiatives, or to the extent we are not able to do so, our operating results relating to our China lottery business will continue to be adversely affected.
In April, we signed a lottery instant games CSP agreement with the North Carolina lottery, which is anticipated to begin in March 2017 and has a term of eight years. The contract may be extended by the lottery for up to two additional years.
During the first quarter of 2016, we also launched innovative, multi-channel cross-over games, such as our Jackpot Party instant game, for several customers. These new launches capitalize on our extensive proprietary games library and our expertise in mobile applications and second-chance promotional games and activities.
During the second quarter of 2016, we were awarded a new agreement by the Georgia Lottery that provided for a seven-year extension of the current instant games contract.
During the third quarter of 2016, we were awarded a new three-year contract by the South Dakota Lottery as primary instant game provider and a one-year contract extension by the Massachusetts Lottery to continue as the primary instant game provider.
We believe we will continue to face intense price-based competition in our Lottery business in 2017. In the near term, we also expect to see an increase in the number of jurisdictions that seek to privatize or outsource lottery operations and to face strong competition from both traditional and new competitors with respect to these opportunities. In addition, we anticipate that lottery RFPs, specifically those for PMA arrangements and certain of our international customers, could increasingly include terms that expose us to increased risk, such as requiring the guarantee of specific income thresholds or significant upfront payments.
Results of Operations and Key Performance Indicators for Lottery
(in millions) | Year Ended December 31, | Variance | ||||||||||||||||||||||||
2016 | 2015 | 2014 | 2016 vs. 2015 | 2015 vs. 2014 | ||||||||||||||||||||||
Total revenue | $ | 777.9 | $ | 775.2 | $ | 835.5 | 2.7 | — | $ | (60.3 | ) | (7 | )% | |||||||||||||
Operating expenses | 655.0 | 708.0 | 669.5 | (53.0 | ) | (7 | )% | 38.5 | 6 | % | ||||||||||||||||
Operating income | $ | 122.9 | $ | 67.2 | $ | 166.0 | $ | 55.7 | 83 | % | $ | (98.8 | ) | (60 | )% | |||||||||||
52
Year Ended December 31, 2016 Compared to Year Ended December 31, 2015
Revenue
(in millions) | Year Ended December 31, | Variance | ||||||||||||||||||||||||
2016 | 2015 | 2014 | 2016 vs. 2015 | 2015 vs. 2014 | ||||||||||||||||||||||
Revenue: | ||||||||||||||||||||||||||
Instant products | $ | 573.7 | $ | 557.2 | $ | 546.3 | $ | 16.5 | 3 | % | $ | 10.9 | 2 | % | ||||||||||||
Lottery systems | 204.2 | 218.0 | 289.2 | (13.8 | ) | (6 | )% | (71.2 | ) | (25 | )% | |||||||||||||||
Total revenue | $ | 777.9 | $ | 775.2 | $ | 835.5 | $ | 2.7 | — | $ | (60.3 | ) | (7 | )% | ||||||||||||
F/X impact on revenue | $ | (9.1 | ) | $ | (31.8 | ) | $ | (0.9 | ) | $ | 22.7 | (71 | )% | $ | (30.9 | ) | 3,433 | % | ||||||||
KPIs:(4) | ||||||||||||||||||||||||||
Change in retail sales of U.S. lottery instant games customers(1)(2) | 4 | % | 8 | % | 6 | % | (4)pp | nm | 2pp | nm | ||||||||||||||||
Change in retail sales of U.S. lottery systems contract customers(1)(3) | 7 | % | (2 | )% | (2 | )% | 9pp | nm | -pp | nm | ||||||||||||||||
Change in Italy retail sales of instant games(1) | (1 | )% | (4 | )% | (2 | )% | 3pp | nm | (2)pp | nm | ||||||||||||||||
nm = not meaningful
pp = percentage points
(1) Information provided by third-party lottery operators.
(2) U.S. instant games customers' retail sales include only sales of instant games.
(3) U.S. lottery systems customers' retail sales primarily include sales of draw games, keno and instant games validated by the relevant system.
(4) Retail sales may not have a direct correlation to our revenue due to terms of our contracts, the impact of changes in our contracts or other factors.
Primary factors affecting the slight increase in total Lottery revenue in 2016 were: (1) continued strength in Participation and PPU contracts (especially with customers having a CSP contract) which increased instant games revenue by $27.4 million; and (2) U.S. revenue from retail sales of multi-state games which increased total revenue by $6.6 million, which were partially offset by; (3) the expiration of the CSL validation contract which had a negative $21.7 million impact on services revenue; (4) an unfavorable impact on revenue from foreign currency (primarily in the U.K.) totaling $9.1 million; and (5) a decrease of $2.7 million in other product sales revenues.
Operating income
Operating income increased primarily due to: (1) a more profitable revenue mix and the non-recurrence of a $35.5 million charge related to other asset impairments and certain cancellation costs of MMC included in cost of instant games sales in 2015, which reduced cost of sales by $42.0 million; and (2) a decrease in D&A totaling $29.5 million. The decreases in cost of sales and D&A are primarily attributable to the cancellation of the MONOPOLY MILLIONAIRES' CLUB TV game show in 2015.
Earnings from equity investments
The decrease in earnings from equity investments of $5.1 million was primarily due to an $11.3 million impairment charge recorded during the year ended December 31, 2016 related to an equity investment in China.
Year Ended December 31, 2015 Compared to Year Ended December 31, 2014
Revenue
Total revenue decreased by $60.3 million reflecting $55.4 million in lower U.S. and international product sales of hardware and software due to lower demand and a lower level of requests for bids by international lotteries as compared to the prior year, a decline in service revenue due to lower instant lottery game validation revenue from the CSL and lower services revenue from U.S. customers due to lower retail sales and unfavorable contract revisions. This was partially offset by $11.0 million in higher instant game revenues in 2015. Lottery revenues also reflect an unfavorable foreign currency translation impact on revenue of $31.8 million.
53
Services revenue decreased by $15.9 million in 2015, primarily due to a decline in instant lottery game validation revenue from the CSL and lower revenue from U.S. customers, reflecting lower retail sales and unfavorable contract revisions. Services revenue also reflected an unfavorable foreign currency translation impact of $5.8 million. The $55.4 million decrease in product sales revenue primarily reflected lower U.S. and international sales of hardware and software due to lower demand and a lower level of requests for bids by international lotteries as compared to the prior year. Product sales revenue is inclusive of an unfavorable foreign currency translation impact of $12.3 million. The $11.0 million increase in instant games revenue reflected higher revenue from our U.S. and international Participation contracts driven by an increase in retail sales and conversions from price-per-unit contracts to Participation contracts and higher revenue from our international price-per-unit contracts due primarily to new customers and the mix of orders. This was partially offset by lower revenue from our U.S. price-per-unit contracts due to conversions to Participation contracts. Instant game revenue also reflected an unfavorable foreign currency translation impact of $13.7 million.
Operating income
Operating income decreased by $98.8 million in 2015, primarily due to a $67.6 million non-cash impairment charge to write off the recorded amount of our U.S. Lottery Systems reporting unit goodwill, $35.5 million charge related to other asset impairments and certain cancellation costs included in cost of instant games sales and $11.9 million in accelerated D&A of property and equipment, partially offset by a more favorable mix of business and lower SG&A.
Earnings from equity investments
The increase in earnings from equity investments of $24.3 million was primarily due to the non-recurrence of the $19.7 million non-cash impairment charge we recorded during the year ended December 31, 2014 to write down our Northstar Illinois equity investment coupled with higher performance of equity investments.
INTERACTIVE
The following table summarizes the primary business activities included in the Interactive business segment.
Services | ||
Social | Operating social casino-style, slot-based games through Facebook, iOS, Android and various other desktop and mobile platforms | |
RMG | Provision of content, via remote game server technology, to licensed online casino operators on both desktop and mobile platforms | |
SG Universe | Provision of play-for-fun and play-for-free white-label gaming for traditional land-based casinos through SG Universe | |
Social Gaming
In our social gaming business, we generate revenue from the sale of virtual coins or chips, which players can use to play slot and table games (i.e., spin in the case of slot games, bet in the case of table games). The games are primarily our WMS, Bally, Barcrest™, SHFL and Dragonplay® branded games. In addition, we also offer third-party branded games as well as original content.
Our apps include Jackpot Party Social Casino ("JPSC"), Gold Fish Casino Slots ("GFC"), Quick Hit Slots (“QHS”) and Hot Shot Casino (“HSC”), Dragonplay Slots® (“DPS”), Dragonplay Poker® (“DPP”) and Blazing 7s Slots ("BHS") on various platforms which include: Facebook, Apple, Google Play, Amazon Kindle, Yahoo (through March 2016) and Microsoft Windows.
RMG
In our RMG business, we provide game content to real-money online casino operators, primarily in Europe. We host the play of our game content on our centrally-located servers (often referred to as remote game servers) that are integrated with the online casino operators' websites and mobile applications. We typically earn a percentage of the operator's net gaming revenue generated by the games we host.
54
SG Universe
SG Universe includes Play4Fun NetworkTM interactive services for land based casino operators under which we provide our customers the ability to customize marketing to players while giving players access to their loyalty reward credits and the ability to make on-property reservations. We host play-for-fun and play-for-free services for traditional land-based casinos and earn revenue based on fixed fees, a share of the proceeds from the sale of virtual coins, or a mix of fixed fees and a share of such proceeds. We also earn revenue from fees for hosting on-premises interactive gaming. We provide a social casino platform delivered through a land based casino operator’s branded website and mobile application.
We believe that growth in our Interactive gaming business is driven largely through new channels of distribution, such as the various types of mobile gaming platforms, the expansion of legal interactive RMG jurisdictions, the addition of social gaming products, such as our newest social games Blazing 7s Slots, the number and quality of our proprietary and third-party branded games released and available to players, the addition of traditional land-based casino operators and RMG operators that are not currently customers, the effectiveness of our marketing efforts designed to engage new players and re-engage existing players, and the prominence of our offerings on operators’ websites, which we do not control.
Revenues from our Interactive services to external customers accounted for 12%, 8% and 8% of our total revenues in 2016, 2015 and 2014, respectively.
Current year update
In early 2016, our Hot Shot Casino became one of the top 30 grossing apps on Facebook and, in the third quarter of 2016, we launched the mobile version of this product worldwide. We have continued to expand our RMG business with the launch of RMG products at 18 additional online casino operators in 2016.
Results of Operations and Key Performance Indicators for Interactive
(in millions) | Year Ended December 31, | Variance | ||||||||||||||||||||||||
2016 | 2015 | 2014 | 2016 vs. 2015 | 2015 vs. 2014 | ||||||||||||||||||||||
Total revenue | $ | 332.8 | $ | 210.0 | $ | 144.5 | $ | 122.8 | 58 | % | $ | 65.5 | 45 | % | ||||||||||||
Operating expenses | 284.3 | 182.9 | 143.3 | 101.4 | 55 | % | 39.6 | 28 | % | |||||||||||||||||
Operating income | $ | 48.5 | $ | 27.1 | $ | 1.2 | $ | 21.4 | 79 | % | $ | 25.9 | 2,158 | % | ||||||||||||
Year Ended December 31, 2016 Compared to Year Ended December 31, 2015
Revenue
(in millions, except ARPDAU) | Year Ended December 31, | Variance | ||||||||||||||||||||||||
2016 | 2015 | 2014 | 2016 vs. 2015 | 2015 vs. 2014 | ||||||||||||||||||||||
Revenue: | ||||||||||||||||||||||||||
Social Gaming B2C | $ | 274.4 | $ | 170.6 | $ | 125.5 | $ | 103.8 | 61 | % | $ | 45.1 | 36 | % | ||||||||||||
Other | 58.4 | 39.4 | 19.0 | 19.0 | 48 | % | 20.4 | 107 | % | |||||||||||||||||
Total revenue | $ | 332.8 | $ | 210.0 | $ | 144.5 | $ | 122.8 | 58 | % | $ | 65.5 | 45 | % | ||||||||||||
KPIs: | ||||||||||||||||||||||||||
Social gaming: | ||||||||||||||||||||||||||
Mobile Penetration(1) | 68 | % | 66 | % | 58 | % | 2pp | nm | 8.2pp | nm | ||||||||||||||||
Average MAU(2) | 7.9 | 7.7 | 5.6 | 0.2 | 3 | % | 2.1 | 38 | % | |||||||||||||||||
Average DAU(3) | 2.5 | 2.2 | 1.5 | 0.3 | 14 | % | 0.7 | 47 | % | |||||||||||||||||
ARPDAU(4) | $ | 0.31 | $ | 0.21 | $ | 0.22 | $ | 0.10 | 48 | % | $ | (0.01 | ) | (5 | )% | |||||||||||
___________________________________________________________________________________________________________________________
nm = not meaningful
pp = percentage points
(1) Mobile penetration is defined by percentage of B2C social gaming revenue generated from mobile platforms.
(2) MAU = Monthly Active Users and is a count of unique visitors to our sites during a month.
55
(3) DAU = Daily Active Users, a count of unique visitors to our sites during a day.
(4) ARPDAU = Average revenue per DAU is calculated by dividing revenue for a period by the DAU for the period by the number of days for the period.
The increase in revenue compared to 2015 reflects growth of $103.8 million or 61% from social gaming revenue which is attributable to the ongoing popularity of Jackpot Party Social Casino and the success of the recently launched Quick Hit Slots, Hot Shot Casino, and Blazing 7s Slots social gaming apps.
Operating income
The increase in operating income reflects greater profitability as a result of revenue growth. SG&A expense and R&D expense increased as a result of higher marketing and player acquisition costs, coupled with new product development costs to support ongoing growth initiatives for which revenue has not yet been recognized.
Year Ended December 31, 2015 Compared to Year Ended December 31, 2014
Revenue
The $65.5 million increase in services revenue reflects $31.6 million of incremental revenue from the Bally acquisition. Total services revenue reflects 47% growth in the average DAU and $16.4 million growth in RMG revenue. Bally had $2.9 million of revenue for the 40-day post-acquisition period in 2014.
Operating income
The $25.9 million increase in operating income reflects greater profitability as a result of revenue growth, a reduction in restructuring and other costs and cost synergies resulting from our integration efforts.
RECENTLY ISSUED ACCOUNTING GUIDANCE
For a description of recently issued accounting pronouncements, see Note 1.
CRITICAL ACCOUNTING ESTIMATES
Information regarding significant accounting policies is included in Note 1 and in the relevant sections of applicable Notes. As stated in Note 1, the preparation of financial statements in accordance with U.S. GAAP requires management to make estimates and assumptions that affect the reported amounts of assets, liabilities, revenue and expenses, and related disclosure of contingent assets and liabilities. Management bases its estimates on historical experience and on various assumptions that are believed to be reasonable under the circumstances, the results of which form the basis for making judgments about the carrying values of assets and liabilities that are not readily apparent from other sources. Actual results may differ from these estimates. We believe that the estimates, assumptions, and judgments involved in the following accounting policies have the greatest potential impact on our consolidated financial statements:
• | Revenue recognition for multiple-element arrangements; |
• | Goodwill and other indefinite lived intangibles, long lived assets and finite lived intangible assets- impairment assessment; |
• | Allowance for doubtful accounts - Notes receivable; |
• | Income taxes; and |
• | Legal contingencies. |
Revenue recognition for multiple-element arrangements
Some of our arrangements include multiple elements. As a result, significant contract interpretation may be required to determine the appropriate accounting, including the identification of deliverables considered to be separate units of accounting, the allocation of the transaction price among elements in the arrangement and the timing of revenue recognition for each of those elements.
We recognize revenue for delivered elements as separate units of accounting when the delivered elements have standalone value to the customer. For elements with no standalone value, we recognize revenue consistent with the pattern of
56
the delivery of the final deliverable. In arrangements with combined units of accounting, changes in the allocation of the transaction price among elements may impact the timing of revenue recognition for the contract but will not change the total revenue recognized for the contract.
We establish the selling prices used for each non-software deliverable based on vendor specific objective evidence (“VSOE”) of selling price, if available, third-party evidence (“TPE”), if VSOE of selling price is not available, or estimated selling price (“ESP”), if neither VSOE of selling price nor TPE is available. We establish VSOE of selling price using the price charged for a deliverable when sold separately and, in rare instances, using the price established by management having the relevant authority. We evaluate TPE of selling price by reviewing largely similar and interchangeable competitor products or services in standalone sales to similarly situated customers. ESP is established based on management’s judgment considering internal factors such as margin objectives, pricing practices, customer segment pricing strategies and the product life cycle. Consideration is also given to market conditions such as competitor pricing strategies and industry technology life cycles. In most arrangements with multiple elements, the transaction price is allocated to the individual units of accounting at inception of the arrangement based on their relative selling price. However, change to any of the aforementioned factors may result in a different allocation of the transaction price to deliverables in multiple element arrangements entered into in future periods. This may materially change the pattern and timing of revenue recognition for identical arrangements executed in future periods, but will not change the total revenue recognized for any given arrangement.
For software elements, we follow the industry specific software guidance which only allows for the use of VSOE in establishing fair value. Generally, VSOE of fair value is the price charged when the deliverable is sold separately or the price established by management for a product that is not yet sold. ESPs are established as best estimates of what the selling prices would be if the deliverables were sold regularly on a stand-alone basis. The ESP for software elements is based on the criteria explained in the preceding paragraph. We are required to use judgment and consider multiple factors that may vary over time depending upon the unique facts and circumstances related to each deliverable. If we were to change any of these judgments or estimates, it could cause a material increase or decrease in the amount of revenue that we report in a particular period. Amounts for fees collected or invoiced and due relating to arrangements where revenue cannot be recognized are reflected on our balance sheet as deferred revenue and recognized when the applicable revenue recognition criteria are satisfied.
Goodwill and other indefinite lived intangibles
We allocate goodwill to reporting units based on the reporting unit expected to benefit from the business combination. We evaluate our reporting units on at least an annual basis and, if necessary, reassign goodwill using a relative fair value allocation approach. Goodwill is tested for impairment at the reporting unit level (operating segment or one level below an operating segment) on an annual basis (October 1 for us) and between annual tests if an event occurs or circumstances change that would more likely than not reduce the fair value of a reporting unit below its carrying value. These events or circumstances could include a significant change in the business climate, legal factors, operating performance indicators, competition, or sale or disposition of a significant portion of a reporting unit.
Application of the goodwill impairment test requires judgment, including the identification of reporting units, assignment of assets and liabilities to reporting units, assignment of goodwill to reporting units, and determination of the fair value of each reporting unit. The estimates used to calculate the fair value of a reporting unit change from year to year based on operating results, market conditions, and other factors. Changes in these estimates and assumptions could materially affect the determination of fair value and goodwill impairment, if any, for each reporting unit. This is especially true for reporting units where goodwill has been partially impaired as a result of recent impairment assessments, and accordingly, is at risk of additional partial or total impairment should we experience relatively minor adverse changes in our significant assumptions. Recent goodwill impairments (see Note 11) are as follows:
Reporting Unit | Year | Impairment charge | Tax benefit | Goodwill (at December 31, 2016) |
SG Gaming | 2015 | $935.0 | None | $1,074.7 |
U.S. Lottery Systems | 2015 | $67.6 | $24.9 | $— |
International Lottery Systems | 2016 | $69.0 | $14.5 | $21.0 |
Other than the reporting units with recent partial impairments noted in the table above, we have no other reporting units where we currently believe significant risk of impairment exists.
Goodwill is reviewed for impairment using either a qualitative assessment or a two-step process. If we choose to perform a qualitative assessment and determine that the fair value of a reporting unit more likely than not exceeds the carrying
57
value, no further evaluation is necessary. For reporting units where we perform the two-step process, the first step requires us to compare the fair value of each reporting unit, which we primarily determine using an income approach based on the present value of discounted cash flows, as well as a market approach to the respective carrying value, which includes goodwill. If the fair value of the reporting unit exceeds its carrying value, the goodwill is not considered impaired. If the carrying value is higher than the fair value, there is an indication that an impairment may exist and the second step is required. In step two, the implied fair value of goodwill is calculated as the excess of the fair value of a reporting unit over the fair values assigned to its assets and liabilities. If the implied fair value of goodwill is less than the carrying value of the reporting unit's goodwill, the difference is recognized as an impairment loss.
Discounted cash flow analysis requires significant judgments, including estimation of future cash flows, which is dependent on internal forecasts, estimation of the long-term rate of growth for our business, the relative risk of achieving those cash flows, and determination of our weighted average cost of capital. When using the market approach, we make judgments about the comparability of publicly traded companies engaged in similar businesses or public transactions information for similar businesses. We base our judgments on factors such as size, growth rates, profitability, risk, and return on investment. We also make judgments when adjusting market multiples of revenue, and earnings for these companies to reflect their relative similarity to our business. Our analysis also includes comparison of our reporting units' total estimated fair values to the total enterprise value and assessing the implied control premium, supporting the reasonableness of our concluded estimated fair values determined under the combination of income and market approaches as of our testing date. Refer to Note 11 for key estimates and assumptions used in the discounted cash flow analysis for SG Gaming, U.S. Lottery Systems and International Lottery Systems reporting units.
We conduct impairment tests of our indefinite-lived assets annually in the fourth quarter of each fiscal year, or more frequently if events or changes in circumstances indicate that it is more likely than not that the fair value of an indefinite-lived asset is less than its carrying value or when circumstances no longer continue to support an indefinite useful life. We estimate the fair value of our indefinite-lived assets using the relief-from-royalty method, which uses several significant assumptions, including an assumed royalty rate, revenue projections that consider historical and estimated future results and general economic and market conditions, as well as the impact of planned business and operational strategies. If the indicated fair value of the indefinite-lived asset is in excess of its carrying value, the asset is not considered impaired. In the event that the fair value of the indefinite-lived asset is less than its carrying value, the difference is recorded as an impairment charge.
Long-lived assets and finite lived intangible assets
We evaluate the recoverability of intangible assets and other long-lived assets that have finite useful lives by comparing the carrying value of the asset group to the future undiscounted cash flows that we expect the asset to generate. If an impairment is indicated, the amount of the impairment is measured as the amount by which the carrying value of the asset exceeds the fair market value. Fair value is determined using a discounted cash flow approach where projections of future cash flows generated by those assets are discounted using an estimated discount rate. Significant judgment is required to estimate the amount and timing of future cash flows and the relative risk of achieving those cash flows. We also make judgments about the remaining useful lives of intangible assets and other long-lived assets that have finite lives. While we believe our estimates of future operating results and projected cash flows are reasonable, any significant adverse changes in key assumptions (i.e., adverse change in the extent or manner which an asset (asset group) is being used or expectation that, more likely than not, an asset (asset group) will be sold or otherwise disposed of before the end of its useful life) or adverse changes in economic and market conditions may cause a change in our evaluation of recoverability or our estimation of fair value and could result in an impairment charge that could be material to our financial statements.
Allowance for doubtful accounts - Notes receivable
We reserve an estimated amount for notes receivables that may not be collected to reduce our receivables to their net carrying value. Methodologies for estimating the allowance for doubtful accounts range from specific reserves to various percentages applied to aged receivables. Estimations of doubtful accounts are focused on receivables which are greater than 90 days outstanding. We review a variety of relevant qualitative information such as collection experience, economic conditions and customer-specific financial conditions to evaluate credit risk in recording the allowance for doubtful accounts or as an indicator of an impaired loan. We also evaluate the macroeconomic and political environment of our customers to determine if these factors are an indication that a contractual obligation may be at risk to be collected in full. We may be required to make judgments related to the above factors if the information is not easily accessible. There may also be instances where we do not have an established history with a customer which also limits our ability to evaluate customer specific factors. Unexpected changes in the underlying financial condition of our customers or in the macroeconomic and political environment of a specific geographic region could result in a material impact on our consolidated results of operations and financial position. As of
58
December 31, 2016, a 10% increase or decrease to the allowance determined within notes receivable would change the reserve by approximately $1.5 million.
Income taxes
We are subject to the income tax laws of the many jurisdictions in which we operate. These tax laws are complex, and the manner in which they apply to our facts is sometimes open to interpretation. In establishing the provision for income taxes, we must make judgments about the application of these inherently complex tax laws.
Despite our belief that our tax return positions are consistent with applicable tax laws, we believe that taxing authorities could challenge certain positions. Settlement of any challenge can result in no change, a complete disallowance, or some partial adjustment reached through negotiations or litigation. We record tax benefits for uncertain tax positions based upon management’s evaluation of the information available at the reporting date. To be recognized in the financial statements, a tax benefit must be at least more likely than not of being sustained based on technical merits. The benefit for positions meeting the recognition threshold is measured as the largest benefit more likely than not of being realized upon ultimate settlement with a taxing authority that has full knowledge of all relevant information. Significant judgment is required in making these determinations and adjustments to uncertain tax positions may be necessary to reflect actual taxes payable upon settlement. Adjustments related to positions impacting the effective tax rate affect the provision for income taxes. Adjustments related to positions impacting the timing of deductions impact deferred tax assets and liabilities.
Our income tax positions and analysis are based on currently enacted tax law. Future changes in tax law could significantly impact the provision for income taxes, the amount of taxes payable, and the deferred tax asset and liability balances in future periods. Deferred tax assets generally represent tax benefits for tax deductions or credits available in future tax returns. Certain estimates and assumptions are required to determine whether it is more likely than not that all or some portion of the benefit of a deferred tax asset will not be realized. In making this assessment, management analyzes and estimates the impact of future taxable income, available carry-backs and carry-forwards, reversing temporary differences and available prudent and feasible tax planning strategies. Should a change in facts or circumstances lead to a change in judgment about the ultimate realizability of a deferred tax asset, we record or adjust the related valuation allowance in the annual period that the change in facts and circumstances occurs, along with a corresponding increase or decrease in the provision for income taxes.
A provision for U.S. income taxes has not been recorded on historical undistributed profits of certain of our non-U.S. subsidiaries that we have determined to be indefinitely reinvested outside the U.S. If management intentions or U.S. tax law changes in the future, there may be a significant negative impact on the provision for income taxes to record an incremental tax liability in the period the change occurs.
Legal contingencies
We are subject to certain legal proceedings, as well as demands, claims and threatened litigation that arise in the normal course of our business. We review the status of each significant matter quarterly and assess our potential financial exposure. If the potential loss from any claim or legal proceeding is considered probable and the amount can be reasonably estimated, we record a liability and an expense for the estimated loss. If we determine that a loss is reasonably possible and the range of the loss can be reasonably estimated, then we disclose the range of the possible loss. Significant judgment is required in the determination of whether a potential loss is probable, reasonably possible, or remote as well as in the determination of whether a potential exposure is reasonably estimable. Our accruals are based on the best information available at the time. As additional information becomes available, we reassess the liabilities and disclosures related to our pending claims and litigation and may revise our estimates. Potential legal liabilities and the revision of estimates of legal liabilities could have a material impact on our results of operations, cash flows and financial position.
59
LIQUIDITY, CAPITAL RESOURCES AND WORKING CAPITAL
Sources of liquidity
As of December 31, 2016, our principal sources of liquidity, other than cash flows provided by operating activities, were cash and cash equivalents and amounts available under our revolving credit facility discussed below under "Credit Agreement and Other Debt."
Subsequent to December 31, 2016, we successfully completed a series of financing transactions, including a private offering of $1.15 billion in aggregate principal amount of 7.000% senior secured notes due 2022 and amended our credit agreement which extended the maturity of our term loans and revolving credit facility, and reduced the applicable interest rate on the term loans. These actions reduced the total principal value of our debt by $45.0 million, including payment of the remaining $45.0 million on our revolving credit facility, lowered annual cash interest cost, extended the maturity out to 2021 and 2022 for 95 percent of our debt, and significantly reduced our interest rate exposure to floating rates.
Cash and unused revolver capacity
As of December 31, | ||||||||
(in millions) | 2016 | 2015 | ||||||
Cash and cash equivalents | $ | 115.1 | $ | 128.7 | ||||
Revolver capacity | 592.6 | 592.6 | ||||||
Revolver capacity drawn or committed to letters of credit | (76.1 | ) | (138.3 | ) | ||||
Total | $ | 631.6 | $ | 583.0 | ||||
The amount of our available cash and cash equivalents fluctuates principally based on borrowings or repayments under our credit facilities, investments, acquisitions and changes in our working capital position. The borrowing capacity under our revolving credit facility will depend on the amount of outstanding borrowings and letters of credit issued and on us remaining in compliance with the covenants under our credit agreement, including a maintenance covenant based on consolidated net first lien leverage. We were in compliance with the covenants under our credit agreement as of December 31, 2016. The 2017 financing transactions, among other things, reduced the commitments on the revolving credit facility to $556.2 million through October 18, 2018 with a step-down to $381.7 million until the maturity in 2020.
We believe that our cash flow from operations, available cash and cash equivalents and available borrowing capacity under our existing or anticipated financing arrangements will be sufficient to meet our liquidity needs for the foreseeable future; however, we cannot assure that this will be the case. We believe that substantially all cash held outside the U.S. is free from legal encumbrances or similar restrictions that would prevent it from being available to meet our global liquidity needs.
Total cash held by our foreign subsidiaries was $75.0 million as of December 31, 2016. To the extent that a portion of our foreign cash was required to meet liquidity needs in the U.S. we might incur a tax liability to repatriate it, the timing and amount of which would depend on a variety of factors.
Our Gaming Participation and Lottery Systems businesses generally require significant upfront capital expenditures. In connection with a renewal or bid of a Gaming machine or Lottery systems contract, a customer may seek to obtain new equipment or impose new service requirements, which may require additional capital expenditures in order to retain or win the contract. Our ability to generate revenue and to continue to procure new contracts will depend on, among other things, our then present liquidity levels or our ability to obtain additional financing on commercially reasonable terms. If we do not have adequate liquidity or are unable to obtain financing for these upfront cash payments on favorable terms or at all, we may not be able to bid on certain contracts, which could restrict our ability to grow and have a material adverse effect on our results of operations, cash flows and financial condition. Our ability to make payments on and to refinance our indebtedness and other obligations depends on our ability to generate cash in the future. We may also, from time to time, repurchase, or otherwise retire or refinance our debt, through our subsidiaries or otherwise. Such activities, if any, will depend on prevailing market conditions, contractual restrictions and other factors, and the amounts involved may or may not be material. If we need to refinance all or part of our indebtedness at or before maturity, we cannot assure that we will be able to obtain new financing or to refinance any of our indebtedness on commercially reasonable terms or at all. During the second quarter of 2016, we repurchased and cancelled a portion of our 2020 Notes and 2021 Notes (see Note 16 for more information). In the event we pursue significant acquisitions or other expansion opportunities, conduct significant repurchases of our outstanding securities, or refinance or repay existing debt, we may need to raise additional capital either through the public or private issuance of equity or debt securities or through additional borrowings under our existing financing arrangements, which sources of funds may not necessarily be available on terms acceptable to us, if at all.
60
In addition, lottery customers in the U.S. generally require service providers to provide performance bonds in connection with the relevant contract. As of December 31, 2016, our outstanding performance bonds totaled
$231.0 million. Our ability to obtain performance bonds on commercially reasonable terms is subject to our financial condition and to prevailing market conditions, which may be impacted by economic and political events. Although we have not experienced difficulty in obtaining such bonds to date, we cannot assure that we will continue to be able to obtain performance bonds on commercially reasonable terms, or at all.
Cash Flow Summary
(in millions) | Year Ended December 31, | Variance | ||||||||||||||||||
2016 | 2015 | 2014 | 2016 vs. 2015 | 2015 vs. 2014 | ||||||||||||||||
Net cash provided by operating activities | $ | 419.0 | $ | 414.2 | $ | 203.5 | $ | 4.8 | $ | 210.7 | ||||||||||
Net cash used in investing activities | (231.7 | ) | (263.8 | ) | (3,332.9 | ) | 32.1 | 3,069.1 | ||||||||||||
Net cash (used in) provided by financing activities | (196.0 | ) | (183.2 | ) | 3,157.4 | (12.8 | ) | (3,340.6 | ) | |||||||||||
Effect of exchange rates on cash and cash equivalents | (4.9 | ) | (10.3 | ) | (9.9 | ) | 5.4 | (0.4 | ) | |||||||||||
(Decrease) increase in cash and cash equivalents | $ | (13.6 | ) | $ | (43.1 | ) | $ | 18.1 | $ | 29.5 | $ | (61.2 | ) | |||||||
Year Ended December 31, 2016 Compared to Year Ended December 31, 2015
Cash flows from operating activities
Net cash provided by operating activities for the year ended December 31, 2016 increased $4.8 million over the prior year. The increase in net cash provided by operating activities was primarily due to the incremental net earnings, net of non-cash items of $97.3 million and an $92.5 million decrease in working capital and other items.
Cash flows from investing activities
The decrease in net cash used in investing activities of $32.1 million for the year ended December 31, 2016 primarily reflected (1) a decrease of $13.4 million in distributions of capital on equity investments; (2) a decrease of capital expenditures of $50.7 million; (3) an incremental change in restricted cash of $9.6 million; and (4) an increase in proceeds from asset sales of $10.0 million compared to 2015. Capital expenditures are composed of investments in systems, equipment and other assets related to contracts, property and equipment, intangible assets and software.
Cash flows from financing activities
The increase in net cash used in financing activities of $12.8 million for the year ended December 31, 2016 was primarily due to: (1) an increase in the payments on license obligations of $9.7 million, and; (2) an increase in the net redemptions of common stock under stock-based compensation plans of $5.2 million, partially offset by; (3) a decrease in net payments of long-term debt of $1.6 million.
Year Ended December 31, 2015 Compared to Year Ended December 31, 2014
Cash flows from operating activities
Net cash provided by operating activities for the year ended December 31, 2015 increased $210.7 million over the prior year, reflecting the inclusion of a full year of results for Bally in 2015, as compared to 40 days in 2014. The increase in net cash provided by operating activities was primarily due to the increase in incremental net earnings after adjusting for non-cash items of $222.8 million and was partially offset by a decrease in working capital and other items.
Cash flows from investing activities
The decrease in net cash used in investing activities of $3,069.1 million for the year ended December 31, 2015 primarily reflected a decrease of $3,140.6 million in cash that was used to complete the Bally acquisition, net of cash acquired, and lower additions to equity method investments of $45.5 million. This was partially offset by an increase in capital expenditures of $85.3 million in 2015, reflecting the inclusion of a full year of results for Bally in 2015, as compared to 40 days in 2014, and the non-recurrence of $44.9 million in proceeds from the sale of our equity interests in Sportech in 2014.
61
Cash flows from financing activities
The decrease in net cash provided by financing activities of $3,340.6 million for the year ended December 31, 2015 was due to decrease in net borrowings of $3,536.5 million and an increase in the payment on license obligations of $26.9 million, partially offset by a decrease in the payment of deferred financing fees of $163.1 million in 2014, due primarily to the Bally acquisition, a decrease in contingent earnout payments of $12.7 million, a decrease in common stock repurchases of $29.5 million and a decrease in net redemptions of common stock of $17.8 million. We made payments on long-term debt of $141.3 million during the year ended December 31, 2015.
Credit Agreement and Other Debt
For additional information regarding our credit agreement and other debt, interest rate risk and interest rate hedging instruments, see "Contractual Obligations" in this Item 7 below, Item 7A "Quantitative and Qualitative Disclosures About Market Risk" and Note 16.
Off-Balance Sheet Arrangements
As of December 31, 2016, we did not have any significant off-balance sheet arrangements, as defined in Item 303(a)(4)(ii) of Regulation S-K.
62
Contractual Obligations
Our contractual obligations and commercial commitments principally include obligations associated with our outstanding indebtedness, contractual purchase obligations and future minimum operating lease obligations and other long-term liabilities as set forth in the table below as of December 31, 2016:
Cash Payments Due By Period | ||||||||||||||||||||
in millions | ||||||||||||||||||||
Total | Less than 1 year | 1 - 3 years | 3 - 5 years | More than 5 years | ||||||||||||||||
Debt, face value (1) | $ | 8,235.3 | $ | 49.3 | $ | 389.9 | $ | 4,646.1 | $ | 3,150.0 | ||||||||||
Interest payments (2) | 2,964.6 | 597.2 | 1,163.7 | 917.2 | 286.5 | |||||||||||||||
License royalty minimum guaranteed payments | 195.5 | 48.7 | 81.8 | 51.2 | 13.8 | |||||||||||||||
Purchase obligations (3) | 282.7 | 282.7 | — | — | — | |||||||||||||||
Operating leases (4) | 107.8 | 27.6 | 34.8 | 22.7 | 22.7 | |||||||||||||||
Other liabilities (5) | 76.3 | 37.3 | 8.0 | 7.0 | 24.0 | |||||||||||||||
Total contractual obligations | $ | 11,862.2 | $ | 1,042.8 | $ | 1,678.2 | $ | 5,644.2 | $ | 3,497.0 | ||||||||||
________________________________________________________________________________________________________________________________
(1) | See Note 16 for information regarding long-term and other debt, including capital leases which totaled $15.2 million. |
(2) | Based on rates in effect on December 31, 2016. |
(3) | Includes, among other contractual obligations, estimated obligations and/or capital commitments in connection with our Gaming and Lottery supply contracts. |
(4) | See Note 15 for information regarding our operating leases. |
(5) | Includes certain other liabilities reflected in our Consolidated Balance Sheet as of December 31, 2016, including pension, restructuring and other, and DEQ acquisition costs. See Note 9 for information regarding acquisition costs. |
ITEM 7A. QUANTITATIVE AND QUALITATIVE DISCLOSURES ABOUT MARKET RISK
Market risk is the risk of loss arising from adverse changes in market rates and prices, such as interest rates, foreign currency exchange rates and commodity prices. Our primary exposure to market risk is interest rate risk associated with our debt. As of December 31, 2016, the face value of long term debt was $8,235.3 million, including $4,236.0 million of variable-rate obligations. Assuming a constant outstanding balance for our variable-rate long term debt, a hypothetical 1% decrease in interest rates would not have a material impact on interest expense because of our Libor floor on related debt, while a hypothetical 1% increase in interest rates would increase interest expense approximately $42.4 million. All our interest rate sensitive financial instruments are held for purposes other than trading purposes.
We have attempted to limit our exposure to interest rate risk by using interest rate swap contracts to mitigate interest rate risk associated with a portion of our variable rate debt instruments. The objective of our interest rate swap contracts, which are designated as cash flow hedges of the future interest payments, is to eliminate the variability of cash flows attributable to the LIBOR component of interest expense to be paid on a portion of our variable rate debt. For additional information regarding interest rate swap contracts, see Note 17.
ITEM 8. FINANCIAL STATEMENTS AND SUPPLEMENTARY DATA
The financial statements and other information required by this item are included in Part IV, Item 15 of this Annual Report on Form 10-K and are presented beginning on page 68.
ITEM 9. CHANGES IN AND DISAGREEMENTS WITH ACCOUNTANTS ON ACCOUNTING AND FINANCIAL DISCLOSURE
None.
ITEM 9A. CONTROLS AND PROCEDURES
63
Disclosure Controls and Procedures
An evaluation was performed under the supervision and with the participation of management, including the Chief Executive Officer (“CEO”) and Chief Financial Officer (“CFO”), of the effectiveness of the design and operation of our disclosure controls and procedures, as that term is defined in Rule 13a-15(e) under the Exchange Act, as of the end of the period covered by this annual report. Based on that evaluation, the CEO and CFO concluded that our disclosure controls and procedures are effective as of the end of the period covered by this annual report.
Management’s Report on Internal Control Over Financial Reporting
The management of SGC is responsible for establishing and maintaining adequate internal control over financial reporting as such term is defined in Rule 13a-15(f) under the Exchange Act. Our internal control over financial reporting is a process designed to provide reasonable assurance regarding the reliability of our financial reporting and the preparation of financial statements for external purposes in accordance with generally accepted accounting principles. Our internal control over financial reporting includes those policies and procedures that (i) pertain to the maintenance of records that, in reasonable detail, accurately and fairly reflect the transactions and dispositions of the assets of SGC; (ii) provide reasonable assurance that transactions are recorded as necessary to permit preparation of financial statements in accordance with generally accepted accounting principles, and that receipts and expenditures are being made only in accordance with authorizations of management and directors; and (iii) provide reasonable assurance regarding prevention or timely detection of unauthorized acquisition, use, or disposition of the company’s assets that could have a material effect on the financial statements.
Because of its inherent limitations, internal control over financial reporting may not prevent or detect misstatements. Also, projections of any evaluation of effectiveness to future periods are subject to the risk that controls may become inadequate because of changes in conditions, or that the degree of compliance with the policies or procedures may deteriorate. Management assessed the effectiveness of our internal control over financial reporting as of December 31, 2016. In making this assessment, we used the criteria set forth by the Committee of Sponsoring Organizations of the Treadway Commission (COSO) in Internal Control-Integrated Framework (2013). Based on our assessment we concluded that, as of December 31, 2016, our internal control over financial reporting was effective based on those criteria.
The effectiveness of our internal control over financial reporting as of December 31, 2016 has been audited by Deloitte & Touche LLP, an independent registered public accounting firm. Their report is included below.
Changes in Internal Control over Financial Reporting
As previously disclosed, we identified a material weakness in our ICFR, pertaining to the step two goodwill impairment testing in 2015 for our SG Gaming reporting unit that we performed in accordance with ASC 350, Intangibles- Goodwill and Other. As of December 31, 2016 we have completed the following remediation measures designed to correct this material weakness and, in the view of the Company's management, the material weakness has been remediated:
• | Reviewed the processes and controls related to the fair value modeling in the step two goodwill impairment assessment. |
• | Designed and documented a new review control with enhanced precision related to the review of the fair value modeling of the step two goodwill impairment assessment. |
• | Conducted a training program for relevant personnel and developed specific review procedures for the step two goodwill impairment assessment. |
• | ICFR directly impacting goodwill impairment testing was deemed to be operating effectively based on testing as of December 31, 2016. |
The completion of the remediation steps described above were changes made in our ICFR during the quarter ended December 31, 2016 that have materially affected, or are reasonably likely to materially affect, our ICFR.
64
REPORT OF INDEPENDENT REGISTERED PUBLIC ACCOUNTING FIRM
To the Board of Directors and Stockholders of Scientific Games Corporation
Las Vegas, Nevada
We have audited the internal control over financial reporting of Scientific Games Corporation and subsidiaries (the "Company") as of December 31, 2016, based on criteria established in Internal Control - Integrated Framework (2013) issued by the Committee of Sponsoring Organizations of the Treadway Commission. The Company's management is responsible for maintaining effective internal control over financial reporting and for its assessment of the effectiveness of internal control over financial reporting, included in the accompanying Management Report on Internal Control over Financial Reporting. Our responsibility is to express an opinion on the Company's internal control over financial reporting based on our audit.
We conducted our audit in accordance with the standards of the Public Company Accounting Oversight Board (United States). Those standards require that we plan and perform the audit to obtain reasonable assurance about whether effective internal control over financial reporting was maintained in all material respects. Our audit included obtaining an understanding of internal control over financial reporting, assessing the risk that a material weakness exists, testing and evaluating the design and operating effectiveness of internal control based on the assessed risk, and performing such other procedures as we considered necessary in the circumstances. We believe that our audit provides a reasonable basis for our opinion.
A company's internal control over financial reporting is a process designed by, or under the supervision of, the company's principal executive and principal financial officers, or persons performing similar functions, and effected by the company's board of directors, management, and other personnel to provide reasonable assurance regarding the reliability of financial reporting and the preparation of financial statements for external purposes in accordance with generally accepted accounting principles. A company's internal control over financial reporting includes those policies and procedures that (1) pertain to the maintenance of records that, in reasonable detail, accurately and fairly reflect the transactions and dispositions of the assets of the company; (2) provide reasonable assurance that transactions are recorded as necessary to permit preparation of financial statements in accordance with generally accepted accounting principles, and that receipts and expenditures of the company are being made only in accordance with authorizations of management and directors of the company; and (3) provide reasonable assurance regarding prevention or timely detection of unauthorized acquisition, use, or disposition of the company's assets that could have a material effect on the financial statements.
Because of the inherent limitations of internal control over financial reporting, including the possibility of collusion or improper management override of controls, material misstatements due to error or fraud may not be prevented or detected on a timely basis. Also, projections of any evaluation of the effectiveness of the internal control over financial reporting to future periods are subject to the risk that the controls may become inadequate because of changes in conditions, or that the degree of compliance with the policies or procedures may deteriorate.
In our opinion, the Company maintained, in all material respects, effective internal control over financial reporting as of December 31, 2016, based on the criteria established in Internal Control - Integrated Framework (2013) issued by the Committee of Sponsoring Organizations of the Treadway Commission.
We have also audited, in accordance with the standards of the Public Company Accounting Oversight Board (United States), the consolidated financial statements and financial statement schedule as of and for the year ended December 31, 2016 of the Company and our report dated March 3, 2017, expressed an unqualified opinion on those financial statements.
/s/ DELOITTE & TOUCHE LLP
Las Vegas, Nevada
March 3, 2017
65
ITEM 9B. OTHER INFORMATION.
None.
66
PART III
ITEM 10. DIRECTORS, EXECUTIVE OFFICERS AND CORPORATE GOVERNANCE
We have adopted a Code of Business Conduct that applies to all of our officers, directors and employees (including our chief executive officer and chief financial officer) and have posted the Code on our website at www.scientificgames.com. In the event that we have any amendments to or waivers from any provision of the Code applicable to our chief executive officer and chief financial officer, we intend to satisfy the disclosure requirement under Item 5.05 of Form 8-K by posting such information on our website.
Information relating to our executive officers is included in Part I, Item 1 of this Annual Report on Form 10-K. The other information called for by this item is incorporated by reference to our definitive proxy statement relating to our 2017 Annual Meeting of Stockholders, which will be filed with the SEC. If such proxy statement is not filed on or before April 30, 2017, the information called for by this item will be filed as part of an amendment to this Annual Report on Form 10-K on or before such date.
ITEM 11. EXECUTIVE COMPENSATION
The information called for by this item is incorporated herein by reference to our definitive proxy statement relating to our 2017 Annual Meeting of Stockholders, which will be filed with the SEC. If such proxy statement is not filed on or before April 30, 2017, the information called for by this item will be filed as part of an amendment to this Annual Report on Form 10-K on or before such date.
ITEM 12. SECURITY OWNERSHIP OF CERTAIN BENEFICIAL OWNERS AND MANAGEMENT AND RELATED STOCKHOLDER MATTERS
The information called for by this item is incorporated herein by reference to our definitive proxy statement relating to our 2017 Annual Meeting of Stockholders, which will be filed with the SEC. If such proxy statement is not filed on or before April 30, 2017, the information called for by this item will be filed as part of an amendment to this Annual Report on Form 10-K on or before such date.
ITEM 13. CERTAIN RELATIONSHIPS AND RELATED TRANSACTIONS, AND DIRECTOR INDEPENDENCE
The information called for by this item is incorporated herein by reference to our definitive proxy statement relating to our 2017 Annual Meeting of Stockholders, which will be filed with the SEC. If such proxy statement is not filed on or before April 30, 2017, the information called for by this item will be filed as part of an amendment to this Annual Report on Form 10-K on or before such date.
ITEM 14. PRINCIPAL ACCOUNTING FEES AND SERVICES
The information called for by this item is incorporated herein by reference to our definitive proxy statement relating to our 2017 Annual Meeting of Stockholders, which will be filed with the SEC. If such proxy statement is not filed on or before April 30, 2017, the information called for by this item will be filed as part of an amendment to this Annual Report on Form 10-K on or before such date.
67
PART IV
ITEM 15. EXHIBITS, FINANCIAL STATEMENT SCHEDULES
Form 10-K Page | |
1. Financial Statements: | |
2. Financial Statement Schedule: | |
3. Exhibits | |
68
REPORT OF INDEPENDENT REGISTERED PUBLIC ACCOUNTING FIRM
To the Board of Directors and Stockholders of Scientific Games Corporation
Las Vegas, Nevada
We have audited the accompanying consolidated balance sheets of Scientific Games Corporation and subsidiaries (the "Company") as of December 31, 2016 and 2015, and the related consolidated statements of operations and comprehensive loss, stockholders' (deficit) equity, and cash flows for each of the three years in the period ended December 31, 2016. Our audits also included the financial statement schedule listed in the Index at Item 15. These financial statements and financial statement schedule are the responsibility of the Company's management. Our responsibility is to express an opinion on the financial statements and financial statement schedule based on our audits. We did not audit the financial statements of Lotterie Nazionali S.r.l. (“LNS”), the Company's investment in which is accounted for by use of the equity method, for the year ended December 31, 2014. The accompanying 2014 consolidated financial statements of the Company include its equity earnings in LNS of $17.6 million for the year ended December 31, 2014. The financial statements of LNS for the year ended December 31, 2014, prepared in accordance with International Financial Reporting Standards as issued by the International Accounting Standards Board, were audited by other auditors whose report has been furnished to us, and our opinion, insofar as it relates to the amounts included for the Company's equity earnings in LNS, on the basis of International Financial Reporting Standards as issued by the International Accounting Standards Board, is based on the report of the other auditors. We have applied auditing procedures to the adjustments to reflect the Company's equity earnings in LNS in accordance with accounting principles generally accepted in the United States of America.
We conducted our audits in accordance with the standards of the Public Company Accounting Oversight Board (United States). Those standards require that we plan and perform the audit to obtain reasonable assurance about whether the financial statements are free of material misstatement. An audit includes examining, on a test basis, evidence supporting the amounts and disclosures in the financial statements. An audit also includes assessing the accounting principles used and significant estimates made by management, as well as evaluating the overall financial statement presentation. We believe that our audits and the report of the other auditors provide a reasonable basis for our opinion.
In our opinion, based on our audits and the report of the other auditors, such consolidated financial statements present fairly, in all material respects, the financial position of Scientific Games Corporation and subsidiaries as of December 31, 2016 and 2015, and the results of their operations and their cash flows for each of the three years in the period ended December 31, 2016, in conformity with accounting principles generally accepted in the United States of America. Also, in our opinion, such financial statement schedule, when considered in relation to the basic consolidated financial statements taken as a whole, presents fairly, in all material respects, the information set forth therein.
We have also audited, in accordance with the standards of the Public Company Accounting Oversight Board (United States), the Company's internal control over financial reporting as of December 31, 2016, based on the criteria established in Internal Control - Integrated Framework (2013) issued by the Committee of Sponsoring Organizations of the Treadway Commission and our report dated March 3, 2017 expressed an unqualified opinion on the Company's internal control over financial reporting based on our audit.
/s/ DELOITTE & TOUCHE LLP
Las Vegas, Nevada
March 3, 2017
69
SCIENTIFIC GAMES CORPORATION AND SUBSIDIARIES
CONSOLIDATED STATEMENTS OF OPERATIONS AND COMPREHENSIVE LOSS
(in millions, except per share amounts)
Years Ended December 31, | ||||||||||||
2016 | 2015 | 2014 | ||||||||||
Revenue: | ||||||||||||
Services | $ | 1,424.0 | $ | 1,351.8 | $ | 788.5 | ||||||
Product sales | 896.2 | 863.0 | 464.9 | |||||||||
Instant games | 563.2 | 544.0 | 533.0 | |||||||||
Total revenue | 2,883.4 | 2,758.8 | 1,786.4 | |||||||||
Operating expenses: | ||||||||||||
Cost of services (1) | 396.5 | 372.7 | 283.7 | |||||||||
Cost of product sales (1) | 424.6 | 405.5 | 274.3 | |||||||||
Cost of instant games (1) | 285.2 | 325.9 | 291.4 | |||||||||
Selling, general and administrative | 577.0 | 567.7 | 507.7 | |||||||||
Research and development | 204.8 | 183.9 | 117.0 | |||||||||
Depreciation, amortization and impairments | 738.7 | 903.2 | 454.3 | |||||||||
Goodwill impairments | 69.0 | 1,002.6 | — | |||||||||
Restructuring and other | 57.0 | 21.9 | 30.7 | |||||||||
Operating income (loss) | 130.6 | (1,024.6 | ) | (172.7 | ) | |||||||
Other (expense) income: | ||||||||||||
Interest expense | (661.4 | ) | (664.9 | ) | (307.2 | ) | ||||||
Earnings (loss) from equity investments | 13.0 | 16.9 | (7.6 | ) | ||||||||
Gain (loss) on early extinguishment of debt | 25.2 | — | (25.9 | ) | ||||||||
Gain on sale of equity interest | — | — | 14.5 | |||||||||
Other income (expense), net | 13.9 | (21.6 | ) | 4.0 | ||||||||
Total other expense, net | (609.3 | ) | (669.6 | ) | (322.2 | ) | ||||||
Net loss before income taxes | (478.7 | ) | (1,694.2 | ) | (494.9 | ) | ||||||
Income tax benefit | 125.0 | 299.9 | 260.6 | |||||||||
Net loss | $ | (353.7 | ) | $ | (1,394.3 | ) | $ | (234.3 | ) | |||
Other comprehensive (loss) income: | ||||||||||||
Foreign currency translation loss | (104.7 | ) | (136.2 | ) | (97.4 | ) | ||||||
Pension and post-retirement (loss) gain, net of tax | (9.7 | ) | 7.0 | (8.7 | ) | |||||||
Derivative financial instruments unrealized gain (loss), net of tax | 3.0 | 1.4 | (6.6 | ) | ||||||||
Other comprehensive loss | (111.4 | ) | (127.8 | ) | (112.7 | ) | ||||||
Comprehensive loss | $ | (465.1 | ) | $ | (1,522.1 | ) | $ | (347.0 | ) | |||
Basic and diluted net loss per share: | ||||||||||||
Basic | $ | (4.05 | ) | $ | (16.23 | ) | $ | (2.77 | ) | |||
Diluted | $ | (4.05 | ) | $ | (16.23 | ) | $ | (2.77 | ) | |||
Weighted average number of shares used in per share calculations: | ||||||||||||
Basic shares | 87.3 | 85.9 | 84.6 | |||||||||
Diluted shares | 87.3 | 85.9 | 84.6 | |||||||||
(1) Exclusive of D&A.
See accompanying notes to consolidated financial statements.
70
SCIENTIFIC GAMES CORPORATION AND SUBSIDIARIES
CONSOLIDATED BALANCE SHEETS
(in millions)
As of December 31, | |||||||
2016 | 2015 | ||||||
ASSETS | |||||||
Current assets: | |||||||
Cash and cash equivalents | $ | 115.1 | $ | 128.7 | |||
Restricted cash | 24.7 | 20.2 | |||||
Accounts receivable, net | 495.0 | 487.1 | |||||
Notes receivable, net | 125.4 | 167.7 | |||||
Inventories | 242.3 | 248.5 | |||||
Prepaid expenses, deposits and other current assets | 114.1 | 123.3 | |||||
Total current assets | 1,116.6 | 1,175.5 | |||||
Non-current assets: | |||||||
Restricted cash | 17.1 | 17.9 | |||||
Notes receivable, net | 48.1 | 51.3 | |||||
Property and equipment, net | 612.2 | 794.0 | |||||
Goodwill | 2,888.4 | 3,013.7 | |||||
Intangible assets, net | 1,768.3 | 1,920.0 | |||||
Software, net | 409.1 | 485.9 | |||||
Equity investments | 179.9 | 228.5 | |||||
Other assets | 47.7 | 45.4 | |||||
Total assets | $ | 7,087.4 | $ | 7,732.2 | |||
LIABILITIES AND STOCKHOLDERS' DEFICIT | |||||||
Current liabilities: | |||||||
Current portion of long-term debt | $ | 49.3 | $ | 50.3 | |||
Accounts payable | 188.9 | 159.8 | |||||
Accrued liabilities | 454.2 | 443.8 | |||||
Total current liabilities | 692.4 | 653.9 | |||||
Deferred income taxes | 70.2 | 228.2 | |||||
Other long-term liabilities | 235.6 | 188.9 | |||||
Long-term debt, excluding current portion | 8,024.9 | 8,156.7 | |||||
Total liabilities | 9,023.1 | 9,227.7 | |||||
Commitments and contingencies (see Note 15 and Note 22) | |||||||
Stockholders' deficit: | |||||||
Class A common stock, par value $0.01 per share, 199.3 shares authorized, 105.2 and 103.7 shares issued and 88.0 and 86.5 shares outstanding as of December 31, 2016 and 2015, respectively | 1.0 | 1.0 | |||||
Additional paid-in capital | 790.8 | 765.9 | |||||
Accumulated loss | (2,218.7 | ) | (1,865.0 | ) | |||
Treasury stock, at cost - 17.2 shares as of December 31, 2016 and 2015, respectively | (175.2 | ) | (175.2 | ) | |||
Accumulated other comprehensive loss | (333.6 | ) | (222.2 | ) | |||
Total stockholders' deficit | (1,935.7 | ) | (1,495.5 | ) | |||
Total liabilities and stockholders' deficit | $ | 7,087.4 | $ | 7,732.2 | |||
See accompanying notes to consolidated financial statements.
71
SCIENTIFIC GAMES CORPORATION AND SUBSIDIARIES
CONSOLIDATED STATEMENTS OF STOCKHOLDERS' (DEFICIT) EQUITY
(in millions)
Years Ended December 31, | |||||||||||
2016 | 2015 | 2014 | |||||||||
Common stock: | |||||||||||
Beginning balance | $ | 1.0 | $ | 1.0 | $ | 1.0 | |||||
Issuances and purchases of Class A common stock | — | — | — | ||||||||
Ending balance | 1.0 | 1.0 | 1.0 | ||||||||
Additional paid-in capital: | |||||||||||
Beginning balance | 765.9 | 743.2 | 737.8 | ||||||||
Issuance of Class A common stock in connection with employee stock purchase plan | — | 1.6 | 1.6 | ||||||||
Net redemption of Class A common stock in connection with stock options and RSUs | (6.1 | ) | (2.5 | ) | (20.6 | ) | |||||
Stock-based compensation | 33.7 | 25.4 | 24.1 | ||||||||
Tax effect from employee stock options and RSUs | (2.7 | ) | (1.8 | ) | 0.3 | ||||||
Ending balance | 790.8 | 765.9 | 743.2 | ||||||||
Accumulated loss: | |||||||||||
Beginning balance | (1,865.0 | ) | (470.7 | ) | (236.4 | ) | |||||
Net loss | (353.7 | ) | (1,394.3 | ) | (234.3 | ) | |||||
Ending balance | (2,218.7 | ) | (1,865.0 | ) | (470.7 | ) | |||||
Treasury stock: | |||||||||||
Beginning balance | (175.2 | ) | (175.2 | ) | (145.7 | ) | |||||
Purchase of Class A common stock | — | — | (29.5 | ) | |||||||
Ending balance | (175.2 | ) | (175.2 | ) | (175.2 | ) | |||||
Accumulated other comprehensive (loss) income: | |||||||||||
Beginning balance | (222.2 | ) | (94.4 | ) | 18.3 | ||||||
Other comprehensive loss | (111.4 | ) | (127.8 | ) | (112.7 | ) | |||||
Ending balance | (333.6 | ) | (222.2 | ) | (94.4 | ) | |||||
Total stockholders' (deficit) equity | $ | (1,935.7 | ) | $ | (1,495.5 | ) | $ | 3.9 | |||
See accompanying notes to consolidated financial statements.
72
SCIENTIFIC GAMES CORPORATION AND SUBSIDIARIES
CONSOLIDATED STATEMENTS OF CASH FLOWS
(in millions)
Years Ended December 31, | |||||||||||
2016 | 2015 | 2014 | |||||||||
Cash flows from operating activities: | |||||||||||
Net loss | $ | (353.7 | ) | $ | (1,394.3 | ) | $ | (234.3 | ) | ||
Adjustments to reconcile net loss to cash provided by operating activities: | |||||||||||
Depreciation, amortization and impairments | 738.7 | 903.2 | 454.3 | ||||||||
Goodwill impairments | 69.0 | 1,002.6 | — | ||||||||
Change in deferred income taxes | (164.6 | ) | (330.6 | ) | (264.3 | ) | |||||
Stock-based compensation | 35.3 | 25.4 | 24.1 | ||||||||
Non-cash interest expense | 40.4 | 40.2 | 19.4 | ||||||||
(Earnings) loss from equity investments, net | (13.0 | ) | (16.9 | ) | 7.6 | ||||||
Distributed earnings from equity investments | 26.4 | 24.9 | 28.5 | ||||||||
(Gain) loss on early extinguishment of debt | (25.2 | ) | — | 25.9 | |||||||
Gain on sale of equity interest | — | — | (14.5 | ) | |||||||
Changes in current assets and liabilities, net of effects of acquisitions: | |||||||||||
Accounts and notes receivable, net | 30.0 | 26.4 | 97.1 | ||||||||
Inventories | 2.5 | 29.3 | 12.4 | ||||||||
Other current assets and liabilities | 21.3 | 101.5 | 32.2 | ||||||||
Accounts payable and accrued liabilities | 14.7 | 4.6 | 13.6 | ||||||||
Other, net | (2.8 | ) | (2.1 | ) | 1.5 | ||||||
Net cash provided by operating activities | 419.0 | 414.2 | 203.5 | ||||||||
Cash flows from investing activities: | |||||||||||
Capital expenditures | (272.9 | ) | (323.6 | ) | (238.3 | ) | |||||
Proceeds from asset sales | 16.7 | 6.7 | 0.5 | ||||||||
Changes in other assets and liabilities and other | 4.1 | 11.2 | 0.4 | ||||||||
Proceeds from sale of equity interest | — | — | 44.9 | ||||||||
Additions to equity method investments | (1.2 | ) | (2.7 | ) | (48.2 | ) | |||||
Restricted cash | (3.7 | ) | 5.9 | (0.4 | ) | ||||||
Distributions of capital from equity investments | 25.3 | 38.7 | 48.8 | ||||||||
Business acquisitions, net of cash acquired | — | — | (3,140.6 | ) | |||||||
Net cash used in investing activities | (231.7 | ) | (263.8 | ) | (3,332.9 | ) | |||||
Cash flows from financing activities: | |||||||||||
Borrowings under revolving credit facility | 360.0 | 170.0 | 220.0 | ||||||||
Repayments under revolving credit facility | (410.0 | ) | (260.0 | ) | (35.0 | ) | |||||
Proceeds from issuance of long-term debt | — | — | 5,477.3 | ||||||||
Payments on long-term debt | (49.8 | ) | (51.3 | ) | (2,267.1 | ) | |||||
Payments of deferred financing fees | — | — | (163.1 | ) | |||||||
Repurchase of notes | (39.9 | ) | — | — | |||||||
Common stock repurchases | — | — | (29.5 | ) | |||||||
Payments on license obligations | (50.2 | ) | (40.5 | ) | (13.6 | ) | |||||
Contingent earnout payments | — | (0.5 | ) | (13.2 | ) | ||||||
(Redemptions) of common stock under stock-based compensation plans | (6.1 | ) | (0.9 | ) | (18.4 | ) | |||||
Net cash (used in) provided by financing activities | (196.0 | ) | (183.2 | ) | 3,157.4 | ||||||
Effect of exchange rate changes on cash and cash equivalents | (4.9 | ) | (10.3 | ) | (9.9 | ) | |||||
(Decrease) increase in cash and cash equivalents | (13.6 | ) | (43.1 | ) | 18.1 | ||||||
Cash and cash equivalents, beginning of period | 128.7 | 171.8 | 153.7 | ||||||||
Cash and cash equivalents, end of period | $ | 115.1 | $ | 128.7 | $ | 171.8 | |||||
73
Years Ended December 31, | |||||||||||
2016 | 2015 | 2014 | |||||||||
Supplemental cash flow information: | |||||||||||
Cash paid for interest | $ | 621.5 | $ | 596.3 | $ | 185.3 | |||||
Income tax refunds received | (21.9 | ) | (34.1 | ) | (24.7 | ) | |||||
Non-cash investing and financing transactions: | |||||||||||
Disposal of fully depreciated assets | 159.2 | 59.9 | — | ||||||||
Non-cash additions to intangible assets related to license agreements | 78.3 | 15.4 | 116.3 | ||||||||
Non-cash capital lease asset and minimum lease liability | — | — | 42.8 | ||||||||
Non-cash capital contribution | — | — | 10.8 | ||||||||
See accompanying notes to consolidated financial statements.
74
SCIENTIFIC GAMES CORPORATION AND SUBSIDIARIES
NOTES TO CONSOLIDATED FINANCIAL STATEMENTS
(amounts in USD, table amounts in millions, except per share amounts)
(1) Description of the Business and Summary of Significant Accounting Policies
Description of the business
We are a leading developer of technology-based products and services and associated content for the worldwide gaming, lottery and interactive gaming industries. Our portfolio includes gaming machines and game content, casino-management systems, table game products and services, instant and draw-based lottery games, server-based gaming and lottery systems, sports betting technology, lottery content and services, loyalty and rewards programs, interactive gaming and social casino solutions. We report our operations in three business segments—Gaming, Lottery and Interactive.
Basis of presentation and principles of consolidation
The accompanying consolidated financial statements have been prepared in accordance with U.S. GAAP. The accompanying consolidated financial statements include the accounts of SGC and its wholly owned subsidiaries, as well as those subsidiaries in which we have a controlling financial interest. Investments in other entities in which we do not have a controlling financial interest but we exert significant influence are accounted for in our consolidated financial statements using the equity method of accounting. All intercompany balances and transactions have been eliminated in consolidation.
Use of estimates
The preparation of financial statements in conformity with U.S. GAAP requires management to make estimates and assumptions that affect the reported amounts of assets and liabilities and disclosure of contingent assets and liabilities at the date of the financial statements and the reported amounts of revenues and expenses during the reporting period. Actual results could differ from those estimates.
Significant Accounting Policies
Additional accounting policy disclosures are provided within the applicable notes to the consolidated financial statements.
Cash and cash equivalents
Cash and cash equivalents include all cash balances and highly liquid investments with an original maturity of three months or less. We place our temporary cash investments with high credit quality financial institutions. At times, such investments in U.S. accounts may be in excess of the Federal Deposit Insurance Corporation insurance limit.
Restricted cash
We are required by gaming regulations to maintain sufficient reserves in restricted cash accounts to be used for the purpose of funding payments to WAP jackpot winners. Restricted cash balances are based primarily on the jackpot meters displayed to slot players or for previously won jackpots and vary by jurisdiction. Compliance with maintaining adequate restricted cash balances and complying with appropriate investment guidelines for jackpot funding is periodically reported to gaming authorities.
Minimum guarantees
We enter into long-term license agreements with third parties in which we are obligated to pay a minimum guaranteed amount of royalties, typically annually over the life of the contract. We account for the minimum guaranteed obligations within accrued and other long-term liabilities at the onset of the license arrangement and record a corresponding licensed asset within intangible assets, net. The licensed intangible assets related to the minimum guaranteed obligations are amortized over the term of the license agreement with the amortization expense recorded in D&A. The long-term liability related to the minimum guaranteed obligations is reduced as royalty payments are made as required under the license agreement. We assess the recoverability of license agreements whenever events arise or circumstances change that indicate the carrying value of the licensed asset may not be recoverable. Recoverability of the licensed asset and the amount of impairment, if any, are determined using our policy for intangible assets with finite useful lives.
The following are our total minimum guaranteed obligations for the periods presented:
75
SCIENTIFIC GAMES CORPORATION AND SUBSIDIARIES
NOTES TO CONSOLIDATED FINANCIAL STATEMENTS
(amounts in USD, table amounts in millions, except per share amounts)
As of December 31, | ||||||||
2016 | 2015 | |||||||
Accrued liabilities | $ | 48.7 | $ | 41.8 | ||||
Other long-term liabilities | 146.8 | 118.5 | ||||||
Total minimum guarantee obligations | $ | 195.5 | $ | 160.3 | ||||
Weighted average remaining term (in years) | 5.0 | 4.0 | ||||||
The following are our remaining expected future payments of minimum guarantee obligations:
Year Ending December 31, | |||||||||||
2017 | 2018 | 2019 | 2020 | 2021 | 2022 | ||||||
Expected future payments | $48.7 | $41.4 | $40.4 | $38.9 | $12.3 | $13.8 | |||||
Other assets
We capitalize debt issuance costs associated with long-term line-of-credit arrangements and amortize such amounts ratably over the term of the arrangement as an adjustment to interest expense.
We assess the recoverability of our other long-term assets whenever events arise or circumstances change that indicate the carrying value of the asset may not be recoverable.
Advertising costs
The cost of advertising is expensed as incurred and totaled $71.3 million, $41.1 million and $32.2 million in 2016, 2015 and 2014, respectively.
R&D
R&D related primarily to software product development costs and is expensed as incurred until technological feasibility has been established. Employee related costs associated with product development are included in R&D.
Foreign currency translation
We have significant operations where the local currency is the functional currency, including our operations in the U.K., Europe, Australia and Canada. Assets and liabilities of foreign operations are translated at period-end rates of exchange and results of operations are translated at the average rates of exchange for the period. Gains or losses resulting from translating the foreign currency financial statements are accumulated as a separate component of accumulated other comprehensive loss in stockholders' deficit. Gains or losses resulting from foreign currency transactions are included in other (expense) income, net. See Note 20.
Comprehensive loss
We include and separately classify in comprehensive loss unrealized gains and losses from our foreign currency translation adjustments, certain gains or losses associated with pension or other post-retirement benefits, including prior service costs or credits and transition assets or obligations, and the effective portion of derivative financial instruments designated as hedging instruments.
Business combinations
We account for business combinations in accordance with ASC 805. This standard requires the acquiring entity in a business combination to recognize all (and only) the assets acquired and liabilities assumed in the transaction and establishes the acquisition-date fair value as the measurement objective for all assets acquired and liabilities assumed in a business combination. Certain provisions of this standard prescribe, among other things, the determination of acquisition-date fair value of consideration paid in a business combination (including contingent consideration) and the exclusion of transaction and acquisition related restructuring costs from acquisition accounting.
76
SCIENTIFIC GAMES CORPORATION AND SUBSIDIARIES
NOTES TO CONSOLIDATED FINANCIAL STATEMENTS
(amounts in USD, table amounts in millions, except per share amounts)
New accounting guidance - Adopted
In August 2014, the FASB issued ASU No. 2014-15, Presentation of Financial Statements - Going Concern (Subtopic 205-40). The guidance is intended to define management’s responsibility to evaluate whether there is substantial doubt about an organization’s ability to continue as a going concern and to provide related footnote disclosures. This ASU provides guidance to an organization’s management, with principles and definitions that are intended to reduce diversity in the timing and content of disclosures that are commonly provided by organizations today in the financial statement footnotes. We adopted this guidance prospectively at the beginning of the fourth quarter of 2016. The adoption of this guidance did not have an effect on our financial condition, results of operations, cash flows, or disclosures.
New accounting guidance - Not yet adopted
In May 2014, the FASB issued ASU No. 2014-09, Revenue from Contracts with Customers. ASU 2014-09 combined with all subsequent amendments (collectively ASC 606) provides guidance outlining a single comprehensive revenue model in accounting for revenue from contracts with customers. ASC 606 supersedes existing revenue recognition guidance, including industry-specific guidance, and replaces it with a five-step revenue model with a core principle that "an entity recognizes revenue to depict the transfer of promised goods or services to customers in an amount that reflects the consideration to which the entity expects to be entitled in exchange for those goods or services." This guidance is effective for fiscal years beginning after December 15, 2017 and interim periods within those fiscal years. We will adopt this guidance at the beginning of the first quarter of 2018, using a modified retrospective application approach.
Our current assessment of the anticipated impact of adopting this guidance on revenue recognition for our business segments is as follows:
(1) Interactive - we do not anticipate a material impact on timing or amount of revenue.
(2) Gaming - we are currently assessing the adoption impact; however we do anticipate that WAP jackpot payments will no longer be treated as an expense but rather will be treated as a reduction to revenue. For the years ended December 31, 2016, 2015 and 2014 we recognized WAP jackpot expense of $29.8 million, $38.1 million and $26.7 million, respectively.
(3) Lottery - we are currently assessing the adoption impact.
ASC 606 will significantly increase revenue disclosure requirements; however, many of these newly required disclosures, including disaggregation of revenue, discussion of deferred revenue and certain required policy disclosures are included in our current Note 3. Upon adoption, we anticipate further increased disclosure requirements for new concepts arising from ASC 606 such as disclosures about variable consideration, contract assets, performance obligations, recognition over time versus at a point-in-time and when our customers control the goods or services delivered.
In February 2016, the FASB issued ASU No. 2016-02, Leases (Topic 842). The amended guidance is intended to increase transparency and comparability among organizations by recognizing lease assets and liabilities on the balance sheet and disclosing key information about leasing arrangements. The adoption of this guidance is expected to result in a significant portion of our operating leases, where we are the lessee, to be recognized on our Consolidated Balance Sheet. The guidance requires lessees and lessors to recognize and measure leases at the beginning of the earliest period presented using a modified retrospective approach. This guidance is effective for fiscal years beginning after December 15, 2018 and interim periods within those fiscal years, with earlier adoption permitted. We are currently evaluating the impact and timing of adopting this guidance.
In March 2016, the FASB issued ASU No. 2016-09, Compensation - Stock Compensation (Topic 718): Improvements to Employee Share-Based Payment Accounting. The amended guidance is intended to simplify several aspects of accounting for share-based payment award transactions, including income tax consequences, accounting for forfeitures, classification of awards as either equity or liabilities and classification in the statement of cash flows. ASU 2016-09 has separate transition guidance for each element of the new standard and will be adopted in the first quarter of 2017. We do not expect a material effect on our financial statements.
In June 2016, the FASB issued ASU No. 2016-13, Financial Instruments - Credit Losses (Topic 326). The new guidance replaces the incurred loss impairment methodology in current GAAP with a methodology that reflects expected credit losses and requires consideration of a broader range of reasonable and supportable information to inform credit loss estimates.
77
SCIENTIFIC GAMES CORPORATION AND SUBSIDIARIES
NOTES TO CONSOLIDATED FINANCIAL STATEMENTS
(amounts in USD, table amounts in millions, except per share amounts)
For trade and other receivables, loans, and other financial instruments, we will be required to use a forward-looking expected loss model rather than the incurred loss model for recognizing credit losses which reflects losses that are probable. The new standard will be effective for us beginning January 1, 2020, with early adoption permitted beginning January 1, 2018. Application of the amendments is through a cumulative-effect adjustment to retained earnings as of the effective date. We are currently evaluating the impact and timing of adopting this guidance.
In January 2017, the FASB issued ASU No. 2017-04, Intangibles-Goodwill and Other (Topic 350): Simplifying the Test for Goodwill Impairment. The amended guidance simplifies the subsequent measurement of goodwill by eliminating Step 2 from the goodwill impairment test. Under the amended guidance, we will perform our annual or interim goodwill impairment test by comparing the fair value of a reporting unit with its carrying value, and an impairment charge is recognized for the amount by which the carrying value exceeds the reporting unit’s fair value, not to exceed the total amount of goodwill allocated to that reporting unit. This guidance is effective for annual or any interim goodwill impairment tests in fiscal years beginning after December 15, 2021, with early adoption permitted for interim or annual goodwill impairment tests performed on testing dates after January 1, 2017. We are currently evaluating the impact and timing of adopting this guidance, but anticipate early adoption in 2017.
We do not expect that any other recently issued accounting guidance will have a significant effect on our financial statements.
(2) Business Segments
We report our operations in three business segments - Gaming, Lottery and Interactive - representing our different products and services. Our Gaming business segment generally sells gaming machines, VGTs, VLTs and conversion kits and parts, leases or otherwise provides gaming machines, server-based systems and content, sells and supports casino-management systems-based software and hardware, and sells and leases PTG content and Shufflers to commercial, tribal and governmental gaming operators. Our Lottery business segment provides instant and draw lottery games and related value-added services, as well as licensed brands used in instant lottery games and loyalty and reward services. Our Lottery business segment also provides systems products and services generally comprised of point-of-sale terminals, a central system, customized computer software, data communication services, support and/or related equipment. Our Interactive business segment provides social gaming services through our own B2C applications as well as our B2B SG Universe services, and RMG services to online casino operators through our remote game servers. The products and services from which each reportable segment derives its revenues are further discussed in Note 3.
In evaluating financial performance, we focus on operating income (loss) as a segment's measure of profit or loss. The accounting policies for our business segments are the same as those described in these Notes. The following tables present the Company's segment information:
78
SCIENTIFIC GAMES CORPORATION AND SUBSIDIARIES
NOTES TO CONSOLIDATED FINANCIAL STATEMENTS
(amounts in USD, table amounts in millions, except per share amounts)
Year Ended December 31, 2016 | |||||||||||||||||||
Gaming | Lottery | Interactive | Corporate(1) | Total | |||||||||||||||
Total revenue | $ | 1,772.7 | $ | 777.9 | $ | 332.8 | $ | — | $ | 2,883.4 | |||||||||
Depreciation, amortization and impairments | 585.2 | 66.5 | 14.9 | 72.1 | 738.7 | ||||||||||||||
Goodwill impairment | — | 69.0 | — | — | 69.0 | ||||||||||||||
Restructuring and other | 14.6 | 8.7 | 1.6 | 32.1 | 57.0 | ||||||||||||||
Operating income (loss) | 212.0 | 122.9 | 48.5 | (252.8 | ) | 130.6 | |||||||||||||
Interest expense | (661.4 | ) | |||||||||||||||||
Earnings from equity investments | 13.0 | ||||||||||||||||||
Gain on early extinguishment of debt | 25.2 | ||||||||||||||||||
Other income, net | 13.9 | ||||||||||||||||||
Net loss before income taxes | $ | (478.7 | ) | ||||||||||||||||
Assets at December 31, 2016 | $ | 5,506.6 | $ | 1,032.0 | $ | 205.8 | $ | 343.0 | $ | 7,087.4 | |||||||||
Capital expenditures for the year ended December 31, 2016 | $ | 184.4 | $ | 40.5 | $ | 8.9 | $ | 39.1 | $ | 272.9 | |||||||||
(1) Includes corporate amounts not allocated to the business segments.
Year Ended December 31, 2015 | |||||||||||||||||||
Gaming | Lottery | Interactive | Corporate(1) | Total | |||||||||||||||
Total revenue | $ | 1,773.6 | $ | 775.2 | $ | 210.0 | $ | — | $ | 2,758.8 | |||||||||
Depreciation, amortization and impairments | 728.6 | 95.9 | 19.6 | 59.1 | 903.2 | ||||||||||||||
Goodwill impairments | 935.0 | 67.6 | — | — | 1,002.6 | ||||||||||||||
Restructuring and other | 11.2 | 0.2 | 1.5 | 9.0 | 21.9 | ||||||||||||||
Operating (loss) income | (901.5 | ) | 67.2 | 27.1 | (217.4 | ) | (1,024.6 | ) | |||||||||||
Interest expense | (664.9 | ) | |||||||||||||||||
Earnings from equity investments | 16.9 | ||||||||||||||||||
Other expense, net | (21.6 | ) | |||||||||||||||||
Net loss before income taxes | $ | (1,694.2 | ) | ||||||||||||||||
Assets at December 31, 2015 | $ | 6,135.2 | $ | 1,116.6 | $ | 211.9 | $ | 268.5 | $ | 7,732.2 | |||||||||
Capital expenditures for the year ended December 31, 2015 | $ | 234.8 | $ | 43.9 | $ | 6.7 | $ | 38.2 | $ | 323.6 | |||||||||
(1) Includes corporate amounts not allocated to the business segments.
79
SCIENTIFIC GAMES CORPORATION AND SUBSIDIARIES
NOTES TO CONSOLIDATED FINANCIAL STATEMENTS
(amounts in USD, table amounts in millions, except per share amounts)
Year Ended December 31, 2014 | |||||||||||||||||||
Gaming | Lottery | Interactive | Corporate(1) | Total | |||||||||||||||
Total revenue | $ | 806.4 | $ | 835.5 | $ | 144.5 | $ | — | $ | 1,786.4 | |||||||||
Depreciation, amortization and impairments | 318.7 | 97.1 | 13.3 | 25.2 | 454.3 | ||||||||||||||
Restructuring and other | 15.5 | 3.5 | 7.1 | 4.6 | 30.7 | ||||||||||||||
Operating (loss) income | (168.3 | ) | 166.0 | 1.2 | (171.6 | ) | (172.7 | ) | |||||||||||
Interest expense | (307.2 | ) | |||||||||||||||||
Losses from equity investments | (7.6 | ) | |||||||||||||||||
Loss on early extinguishment of debt | (25.9 | ) | |||||||||||||||||
Gain on sale of equity interest | 14.5 | ||||||||||||||||||
Other income, net | 4.0 | ||||||||||||||||||
Net loss before income taxes | $ | (494.9 | ) | ||||||||||||||||
Assets at December 31, 2014 | $ | 7,853.0 | $ | 1,407.2 | $ | 185.5 | $ | 275.4 | $ | 9,721.1 | |||||||||
Capital expenditures for the year ended December 31, 2014 | $ | 160.5 | $ | 58.3 | $ | 5.4 | $ | 14.1 | $ | 238.3 | |||||||||
(1) Includes corporate amounts not allocated to the business segments.
The following tables present revenue by customer location and long-lived assets by geographic location:
Year Ended December 31, | ||||||||||||
2016 | 2015 | 2014 | ||||||||||
Revenue: | ||||||||||||
U.S. | $ | 1,959.0 | $ | 2,144.0 | $ | 1,070.1 | ||||||
Other | 924.4 | 614.8 | 716.3 | |||||||||
Total | $ | 2,883.4 | $ | 2,758.8 | $ | 1,786.4 | ||||||
As of December 31, | ||||||||
2016 | 2015 | |||||||
Property and equipment, net: | ||||||||
U.S. | $ | 461.1 | $ | 606.4 | ||||
Other | 151.1 | 187.6 | ||||||
Total | $ | 612.2 | $ | 794.0 | ||||
(3) Revenue Recognition
The following table summarizes our revenues by type within each of our business segments:
80
SCIENTIFIC GAMES CORPORATION AND SUBSIDIARIES
NOTES TO CONSOLIDATED FINANCIAL STATEMENTS
(amounts in USD, table amounts in millions, except per share amounts)
Revenue recognized for Year Ended December 31, | |||||||||||
Revenue category | 2016 | 2015 | 2014 | ||||||||
Gaming | |||||||||||
Gaming operations | $ | 725.3 | $ | 763.2 | $ | 414.0 | |||||
Gaming machine sales | 618.2 | 571.1 | 335.0 | ||||||||
Gaming systems(1) | 240.8 | 273.0 | 37.4 | ||||||||
Table products(1) | 188.4 | 166.3 | 20.0 | ||||||||
Total | $ | 1,772.7 | $ | 1,773.6 | $ | 806.4 | |||||
Lottery | |||||||||||
Instant products | $ | 573.7 | $ | 557.2 | $ | 546.2 | |||||
Lottery systems | 204.2 | 218.0 | 289.3 | ||||||||
Total | $ | 777.9 | $ | 775.2 | $ | 835.5 | |||||
Interactive | |||||||||||
Social B2C | $ | 274.4 | $ | 170.6 | $ | 125.5 | |||||
Other | 58.4 | 39.4 | 19.0 | ||||||||
Total | $ | 332.8 | $ | 210.0 | $ | 144.5 | |||||
(1) See General revenue recognition policy below.
General
We evaluate the recognition of revenue based on the criteria set forth in ASC 605 or ASC 985, as appropriate. Revenue is recognized when the risks and rewards of ownership have substantively transferred to customers. This condition normally is met when the product has been delivered or upon performance of services. Revenue is reported net of incentive rebates, discounts, sales taxes and all other items of a similar nature. Shipping and handling costs are included in cost of sales. Collectability is evaluated based on a review of the customer's creditworthiness and a review of historic collection experience under contracts with extended payment terms, as applicable. We separately assess whether pricing is fixed or determinable under arrangements with extended payment terms reflected in the issuance of a note receivable.
The majority of our sales agreements are for standard products and services with customer acceptance occurring upon delivery of the product or performance of the service. However, to a limited extent SGC also enters into agreements that involve multiple elements (such as gaming machines, systems hardware and software, installation and service as well as maintenance and product support), or non-standard terms and conditions.
For non-software multiple-element arrangements, we recognize revenue for delivered elements when they have stand-alone value to the customer, they have been accepted by the customer, and for which there are only customary refund or return rights. The transaction price is allocated to the deliverables by use of the relative selling price method. The selling price used for each deliverable is based on vendor-specific objective evidence (VSOE) if available, third-party evidence (TPE) if VSOE is not available, or estimated selling price (ESP) if neither VSOE nor TPE is available. ESP is determined in a manner consistent with that used to establish the price to sell the deliverable on a standalone basis. In addition to the preceding conditions, equipment revenue is not recorded until the installation has been completed if equipment acceptance is dependent upon installation or if installation is essential to the functionality of the equipment. Installation revenues are not recorded until installation has been completed.
For software elements not essential to functionality of related hardware, we follow the industry specific software guidance set forth in ASC 985, which only allows for the use of VSOE in establishing fair value if such elements remain undelivered. Generally, VSOE is the price charged when the deliverable is sold separately or the price established by management for a product that is not yet sold. For these types of arrangements (or portions of arrangements) falling within software revenue recognition standards and that do not involve significant production, modification, or customization, revenue for each software or software-related element is recognized when we have VSOE of the selling price of all of the undelivered
81
SCIENTIFIC GAMES CORPORATION AND SUBSIDIARIES
NOTES TO CONSOLIDATED FINANCIAL STATEMENTS
(amounts in USD, table amounts in millions, except per share amounts)
elements and applicable revenue recognition criteria have been met for the delivered elements. The establishment of VSOE requires judgment as to whether there is a sufficient quantity of items sold on a stand-alone basis or substantive post-contract customer support ("PCS") contract renewals and whether the prices or PCS renewal rates demonstrate an appropriate level of concentration to conclude that VSOE exists.
Gaming operations
Gaming operations revenues are generated by providing customers with proprietary land-based gaming equipment, table game products and VLTs under a variety of recurring revenue arrangements, including consideration based upon percentage of Coin-in, a percentage of Net win, or a fixed daily/monthly fee. Fees earned under operating contracts are recognized as revenue in the period earned and are classified as services revenue when all of the criteria outlined above are met. Payments from customers under operating contracts are typically due on a monthly basis.
Gaming machine sales
These arrangements include the sale of gaming machines, including game content, electronic table game products and parts (including game themes and electronics conversion kits). Our credit terms are predominately short term in nature. We also grant extended payment terms under contracts where the sale is secured by the related equipment sold. Revenue from the sale of gaming machines is recognized based upon the contractual terms of each arrangement, but predominately upon delivery or acceptance of gaming machines. If the sale of gaming machines includes multiple elements, these arrangements are accounted for under multiple element arrangement accounting described above.
Lottery instant games
Our instant games revenue (included in instant products) is primarily generated under long-term contracts to supply instant games and provide related services to our lottery customers. Revenue from the sale of instant games that are sold on a price-per-unit basis is recognized when the customer accepts the product pursuant to the terms of the contract. Revenue from the sale of instant games that are sold on a Participation basis is recognized as retail sales are generated. We believe that products and services provided under these arrangements are delivered contemporaneously and are not separate units of account; therefore, as the services offered are a comprehensive solution in exchange for Participation-based or price-per-unit based compensation, this revenue is recognized under the general revenue recognition policy above.
Lottery systems
Our Lottery segment offers our customers a number of related, value-added services as part of an integrated product offering. These services include lottery systems, including point-of-sale terminals and other equipment, software, data communication services and support and instant game validation systems, as well as software, hardware and related services for sports wagering and keno systems. Revenue related to lottery system sales is recognized based upon the contractual terms of each arrangement, but predominately upon delivery or acceptance of goods. The following are specific revenue recognition policies for our services revenue within our Lottery segment:
• | Revenue from the provision of lottery system services provided on a Participation basis is recognized when the retail sales of draw lottery games are generated. Some lottery systems contracts also result in recognition of revenue when retail sales of instant tickets through the system are generated. |
• | Revenue from the perpetual licensing of customized lottery software is recognized under the percentage of completion method of accounting, based on the ratio of costs incurred to estimated costs to complete. |
• | Revenue derived from maintenance on lottery software and lottery terminals is recognized ratably over the maintenance period. |
Interactive
Interactive revenues are principally generated from online social gaming. Social gaming revenues are generated from the sale of virtual coins to players that can be used for additional play or game enhancements. Revenues from player purchases are recognized ratably over the estimated average service period in which the virtual coins are consumed based on historical data analysis. Because we are responsible for substantially all aspects of the game services and sale of virtual goods to the player, we have determined we are the principal and as a result revenues are recorded on a gross basis. Payment processing fees
82
SCIENTIFIC GAMES CORPORATION AND SUBSIDIARIES
NOTES TO CONSOLIDATED FINANCIAL STATEMENTS
(amounts in USD, table amounts in millions, except per share amounts)
paid to platform providers (such as Facebook, Apple and Google) on a revenue participation basis are recorded within cost of services.
Deferred revenue and deferred cost of revenue
Deferred revenue arises primarily from the timing differences between the shipment or installation of Gaming and Lottery equipment and systems products and the satisfaction of all revenue recognition criteria consistent with our revenue recognition policy, as well as prepayment of contracts which are recognized ratably over a service period, such as maintenance or licensing revenue. Deferred cost of revenue primarily consists of the direct costs associated with the manufacture of Gaming and Lottery equipment and systems products for which revenue has been deferred. Deferred revenue and deferred cost of revenue expected to be realized within one year are classified as current liabilities and current assets, respectively.
The following table summarizes the deferred revenue activity for the reporting period:
Year Ended December 31, | |||||||||||
2016 | 2015 | 2014 | |||||||||
Deferred revenue balance, beginning of period | $ | 57.8 | $ | 59.0 | $ | 51.9 | |||||
New deferrals | 200.6 | 252.0 | 335.6 | ||||||||
Amounts recognized in revenue | (191.0 | ) | (253.2 | ) | (328.5 | ) | |||||
Deferred revenue balance, end of period | $ | 67.4 | $ | 57.8 | $ | 59.0 | |||||
Sales commissions
Any sales commissions associated with the sale or placement of our products are expensed as incurred.
Warranties
At the time a sale is recognized, we record estimated future warranty costs. The warranty liability is determined by applying historical claim rate experience to the current applicable population. Warranty costs may differ from those estimated if actual claim rates are higher or lower than our historical rates.
(4) Restructuring and Other
Restructuring and other includes charges or expenses attributable to: (i) employee severance; (ii) management restructuring and related costs; (iii) restructuring and integration; (iv) cost savings initiatives; and (v) other unusual items. The following table summarizes pre-tax restructuring and other costs for the periods presented:
Year Ended December 31, | ||||||||||||
2016 | 2015 | 2014 | ||||||||||
Employee severance (1) | $ | 36.2 | $ | 16.9 | $ | 25.8 | ||||||
Management restructuring and related costs | 5.9 | — | — | |||||||||
Restructuring, integration and other | 14.9 | 5.0 | 4.9 | |||||||||
Total | $ | 57.0 | $ | 21.9 | $ | 30.7 | ||||||
(1) Inclusive of employee severance and termination costs associated with restructuring activities.
We began integrating SGC and WMS subsequent to the WMS acquisition in October 2013 and began integrating SGC and Bally subsequent to the Bally acquisition in November 2014 by implementing our plans to streamline our operations and cost structure. We completed the restructuring actions related to these restructuring plans, and the following table presents a summary for restructuring charges and the changes in the restructuring accrual during 2015 and 2016, for these restructuring plans:
83
SCIENTIFIC GAMES CORPORATION AND SUBSIDIARIES
NOTES TO CONSOLIDATED FINANCIAL STATEMENTS
(amounts in USD, table amounts in millions, except per share amounts)
Year Ended December 31, | ||||||||
2016 | 2015 | |||||||
Beginning balance | $ | 9.5 | $ | 22.6 | ||||
Accrual additions | 6.9 | 21.9 | ||||||
Cash payments | (16.4 | ) | (35.0 | ) | ||||
Ending balance | $ | — | $ | 9.5 | ||||
On November 3, 2016, we announced that we began implementing a new business improvement initiative, which we expect will streamline our organization, increase our efficiencies, and significantly reduce our operating costs once the initiative is fully implemented. These cost savings are expected to be achieved across all our divisions and will encompass a combination of headcount reductions, facilities streamlining and reduction in other operating costs.
We do not expect to incur additional significant costs related to the November 2016 restructuring plan described above or any previously announced integration plans.
Restructuring and other costs by business segment
The following table presents a summary of restructuring and other costs by business segment related to the November 2016 restructuring plan described above, which primarily include severance and related expenses.
Gaming | Lottery | Interactive | Unallocated and Corporate | Total | ||||||||||||||||
Year ended December 31, 2016 | $ | 7.8 | $ | 6.8 | $ | 0.8 | $ | 7.0 | $ | 22.4 | ||||||||||
The following table presents a summary of restructuring charges and the changes in the restructuring accrual during 2016:
Restructuring Accrual | ||||
Balance as of January 1, 2016 | $ | — | ||
Accrual additions | 22.4 | |||
Cash payments | (6.0 | ) | ||
Balance as of December 31, 2016 | $ | 16.4 | ||
(5) Basic and Diluted Net Loss Per Share
Basic and diluted net loss per share were the same, as any additional common stock equivalents would be anti-dilutive. We excluded 2.9 million, 1.8 million and 1.6 million of stock options from the calculation of diluted weighted-average net loss per share for the years ended December 31, 2016, 2015 and 2014, respectively, which would be anti-dilutive due to the net loss in those periods. In addition, we excluded 4.9 million, 5.6 million and 5.0 million RSUs from the calculation of diluted weighted-average net loss per share for the years ended December 31, 2016, 2015 and 2014, respectively, which would be anti-dilutive due to the net loss in those periods.
(6) Accounts and Notes Receivable and Credit Quality of Notes Receivable
Accounts receivable
Accounts receivable are recorded at the invoiced amount and do not bear interest. The allowance for doubtful accounts and notes receivable is our best estimate of the amount of probable credit losses in our existing receivables. Changes in circumstances relating to the collectability of accounts and notes receivable may result in the need to increase or decrease our allowance for doubtful accounts and notes receivable in the future. We determine the allowances based on historical experience, current market trends and, for larger customer accounts, our assessment of the ability of the customers to pay outstanding balances. Past due balances and other higher risk amounts are reviewed individually for collectability. Account balances are
84
SCIENTIFIC GAMES CORPORATION AND SUBSIDIARIES
NOTES TO CONSOLIDATED FINANCIAL STATEMENTS
(amounts in USD, table amounts in millions, except per share amounts)
charged against the allowances after all collection efforts have been exhausted and the potential for recovery is considered remote.
The timing of our invoices do not always coincide with revenue recognized under the contract. We have unbilled accounts receivable which represent revenue recorded in excess of amounts invoiced under the contract and generally become billable at contractually specified dates. We had $59.7 million and $62.3 million of unbilled accounts receivable as of December 31, 2016 and 2015, respectively.
The following summarizes the components of current and long-term accounts and notes receivable, net:
As of December 31, | |||||||
2016 | 2015 | ||||||
Current: | |||||||
Accounts receivable | $ | 508.1 | $ | 497.7 | |||
Notes receivable | 140.0 | 180.4 | |||||
Allowance for doubtful accounts | (27.7 | ) | (23.3 | ) | |||
Current accounts and notes receivable, net | $ | 620.4 | $ | 654.8 | |||
Long-term: | |||||||
Notes receivable, net of allowance of $0.4 and $0.3 | 48.1 | 51.3 | |||||
Total accounts and notes receivable, net | $ | 668.5 | $ | 706.1 | |||
Notes receivable
We have provided extended payment terms and development financing to certain customers in the form of notes receivable. We carry our notes receivable at face amounts less an allowance for doubtful accounts and imputed interest, if any. Our notes receivable portfolio consists of domestic and international receivables with installment payment terms ranging from 90 days to three years or single payment terms greater than 12 months. Interest income, if any, is recognized ratably over the life of the note receivable and any related fees or costs to establish the notes are charged to selling, general and administrative expense as incurred, as they are immaterial. Actual or imputed interest, if any, is determined based on current market rates at the time the note originated and is recorded in other income and expense, net, ratably over the payment period, which approximates the effective interest method. We generally impute interest income on all notes receivable with terms greater than one year that do not contain a stated interest rate.
The interest rates on our outstanding notes receivable ranged from 3.3% to 10.4% at December 31, 2016 and 2015. Our general policy is to recognize interest on notes receivable until the note receivable is deemed non-performing, which we define as a note where payments have not been received within 180 days of the agreed-upon terms. When a note receivable is deemed to be non-performing, the note is placed on non-accrual status and interest income is recognized on a cash basis. The amount of our non-performing notes was immaterial at December 31, 2016 and 2015.
In certain international jurisdictions, we offer extended payment terms ranging between 18 to 36 months. Sales with extended payment terms typically result in a higher selling price and, if extended over periods longer than one year, incur interest.
In our Gaming machine sales business, we file UCC-1 financing statements domestically in order to retain a security interest in the gaming machines that underlie a significant portion of our domestic accounts and notes receivable until the receivable balance is fully paid. However, the value of the gaming machines, if repossessed, may be less than the balance of the outstanding receivable. For international customers, depending on the country and our historic collection experience with the customer, we may obtain pledge agreements, bills of exchange, guarantees, post-dated checks or other forms of security agreements designed to enhance our ability to collect the receivables, although a majority of our international accounts and notes receivables do not have these features. In our Gaming operations business, because we own the Participation gaming machines that are leased or otherwise provided to the customer, in a bankruptcy the customer has to generally either accept or reject the lease or other agreement and, if rejected, our gaming machines are returned to us. Our accounts and notes receivable related to revenue earned on Participation gaming machines and all other revenue sources are typically unsecured claims.
Due to the significance of our gaming machines to the on-going operations of our casino customers, we may be designated as a key vendor in any bankruptcy filing by a casino customer, which can enhance our position above other creditors
85
SCIENTIFIC GAMES CORPORATION AND SUBSIDIARIES
NOTES TO CONSOLIDATED FINANCIAL STATEMENTS
(amounts in USD, table amounts in millions, except per share amounts)
in the bankruptcy. Due to our successful collection experience and our continuing relationship with casino customers and their businesses, it is infrequent that we repossess gaming machines from a customer in partial settlement of outstanding accounts or notes receivable balances. In those unusual instances where repossession occurs to mitigate our exposure on the related receivable, the repossessed gaming machines are subsequently resold in the used gaming machine market; however, we may not fully recover the receivable from this re-sale.
We monitor the credit quality of our accounts and notes receivable by reviewing an aging of customer invoices. Invoices are considered past due if a scheduled payment is not received within agreed-upon terms. We also review a variety of other relevant qualitative information such as collection experience, economic conditions and customer-specific financial conditions to evaluate credit risk in recording the allowance for doubtful accounts or as an indicator of an impaired loan. Where possible, we seek payment deposits, collateral, pledge agreements, bills of exchange, foreign bank letters of credit, post-dated checks or personal guarantees with respect to notes receivable from our customers.
We continuously assess our notes receivable using the information stated above for impairment, especially in cases where macroeconomic conditions could indicate that our ability to collect all amounts due under our contractual agreements is unlikely. Consistent with our policy with respect to past due receivables, for impaired notes receivable, we generally recognize interest on notes receivable until the note receivable is deemed impaired, which we define as a note where payments have not been received within 180 days of the agreed-upon terms. When a note receivable is deemed to be impaired, we write the note down to its net realizable value, which approximates fair value. Accordingly, on impaired notes we cease recognizing interest income and instead recognize any payments on a cash basis.
We have certain concentrations of outstanding notes receivable in international locations that impact our assessment of the credit quality of our notes receivable. We monitor the macroeconomic and political environment in each of these locations in our assessment of the credit quality of our notes receivable. We have not identified changes in the aforementioned factors in the twelve months ended December 31, 2016 that require a reassessment of our receivable balances. The international locations with significant concentrations (generally deemed to be exceeding 10%) of our notes receivable are as follows:
• | Mexico - Our accounts and notes receivable, net, from certain customers in Mexico at December 31, 2016 was $33.9 million. We collected $30.9 million of outstanding receivables from these customers during the year ended December 31, 2016. |
• | Peru - Our accounts and notes receivable, net, from certain customers in Peru at December 31, 2016 was $31.7 million. We collected $24.8 million of outstanding receivables from these customers during the year ended December 31, 2016. |
• | Argentina - Our accounts and notes receivable, net, from customers in Argentina at December 31, 2016 was $15.8 million which are denominated in USD. Our customers are required to and have continued to pay us in pesos at the spot exchange rate on the date of payment. We collected $24.3 million of outstanding receivables from customers in Argentina during the year ended December 31, 2016. |
The following summarizes the components of total notes receivable, net:
December 31, 2016 | Balances over 90 days past due | December 31, 2015 | Balances over 90 days past due | ||||||||||||
Notes receivable: | |||||||||||||||
Domestic | $ | 45.1 | $ | 1.1 | $ | 62.4 | $ | 2.6 | |||||||
International | 143.0 | 38.7 | 169.8 | 26.6 | |||||||||||
Total notes receivable | 188.1 | 39.8 | 232.2 | 29.2 | |||||||||||
Notes receivable allowances | |||||||||||||||
Domestic | (1.0 | ) | (0.9 | ) | (2.6 | ) | (2.5 | ) | |||||||
International | (14.0 | ) | (14.0 | ) | (10.6 | ) | (9.5 | ) | |||||||
Total notes receivable allowances | (15.0 | ) | (14.9 | ) | (13.2 | ) | (12.0 | ) | |||||||
Notes receivable, net | $ | 173.1 | $ | 24.9 | $ | 219.0 | $ | 17.2 | |||||||
86
SCIENTIFIC GAMES CORPORATION AND SUBSIDIARIES
NOTES TO CONSOLIDATED FINANCIAL STATEMENTS
(amounts in USD, table amounts in millions, except per share amounts)
At December 31, 2016, 14.4% of our total notes receivable, net, was past due by over 90 days compared to 7.9% at December 31, 2015.
The following table details our evaluation of notes receivable for impairment as of December 31, 2016 and 2015:
December 31, 2016 | December 31, 2015 | ||||||||||||||||||||||
Ending Balance Individually Evaluated for Impairment | Ending Balance Collectively Evaluated for Impairment | Total | Ending Balance Individually Evaluated for Impairment | Ending Balance Collectively Evaluated for Impairment | Total | ||||||||||||||||||
Notes receivable: | |||||||||||||||||||||||
Domestic | $ | 10.3 | $ | 34.8 | $ | 45.1 | $ | 20.7 | $ | 41.7 | $ | 62.4 | |||||||||||
International | 112.3 | 30.7 | 143.0 | 101.8 | 68.0 | 169.8 | |||||||||||||||||
Total notes receivable | 122.6 | 65.5 | 188.1 | 122.5 | 109.7 | 232.2 | |||||||||||||||||
Allowance for notes receivable | (14.6 | ) | (0.4 | ) | (15.0 | ) | (12.9 | ) | (0.3 | ) | (13.2 | ) | |||||||||||
Total notes receivable, net | $ | 108.0 | $ | 65.1 | $ | 173.1 | $ | 109.6 | $ | 109.4 | $ | 219.0 | |||||||||||
Year Ended December 31, 2016 | Year Ended December 31, 2015 | ||||||||||||||||||||||
Ending Balance Individually Evaluated for Impairment | Ending Balance Collectively Evaluated for Impairment | Total | Ending Balance Individually Evaluated for Impairment | Ending Balance Collectively Evaluated for Impairment | Total | ||||||||||||||||||
Provision | $ | 4.9 | $ | 0.4 | $ | 5.3 | $ | 8.7 | $ | 0.4 | $ | 9.1 | |||||||||||
Charge-offs and recoveries | (3.2 | ) | (0.3 | ) | (3.5 | ) | (1.7 | ) | (0.1 | ) | (1.8 | ) | |||||||||||
We estimate the fair value of notes receivable by discounting expected future cash flows using current interest rates at which similar loans would be made to borrowers with similar credit ratings and remaining maturities. At December 31, 2016 and 2015, the fair value of the notes receivable, net, approximated the carrying value due to contractual terms of notes receivable generally being under 24 months.
(7) Inventories
Inventories are stated at the lower of cost or net realizable value. Cost is determined on the first-in, first-out or weighted moving average method. Our inventory primarily consists of gaming machines and table products for sale and related parts, instant games for our Participation and price-per-unit arrangements and our licensed brand merchandise. We determine the lower of cost or net realizable value of our inventory based on estimates of potentially excess and obsolete inventories after considering historical and forecasted demand and average selling prices.
Inventories consisted of the following:
As of December 31, | ||||||||
2016 | 2015 | |||||||
Parts and work-in-process | $ | 110.5 | $ | 118.3 | ||||
Finished goods | 131.8 | 130.2 | ||||||
Total inventories | $ | 242.3 | $ | 248.5 | ||||
Parts and work-in-process include parts for gaming machines, lottery terminals and instant lottery ticket materials, as well as labor and overhead costs for work-in-process associated with the manufacturing of gaming machines, instant lottery games and lottery terminals. Our finished goods inventory primarily consists of gaming machines for sale, instant games for our Participation arrangements and licensed branded merchandise.
87
SCIENTIFIC GAMES CORPORATION AND SUBSIDIARIES
NOTES TO CONSOLIDATED FINANCIAL STATEMENTS
(amounts in USD, table amounts in millions, except per share amounts)
(8) Property and Equipment, net
Property and equipment are stated at cost, and when placed into service, are depreciated using the straight-line method over the estimated useful lives of the assets as follows:
Item | Estimated Life in Years | |
Lottery and other machinery and equipment | 3 - 15 | |
Gaming equipment | 1 - 5 | |
Transportation equipment | 3 - 8 | |
Furniture and fixtures | 5 - 10 | |
Buildings and improvements | 15 - 40 | |
Costs incurred for equipment associated with specific gaming and lottery contracts and internal use software projects not yet placed into service are classified as construction in progress and are not depreciated until placed into service. Leasehold improvements are amortized over the lesser of the term of the corresponding lease or their useful life.
We periodically review the estimated useful lives of our fixed assets and assess the recoverability of long-lived assets (or asset groups) whenever events or changes in circumstances indicate that the carrying value of such an asset (or asset groups) may not be recoverable.
Property and equipment, net consisted of the following:
As of December 31, | ||||||||
2016 | 2015 | |||||||
Land | $ | 36.5 | $ | 38.5 | ||||
Buildings and leasehold improvements | 182.2 | 185.2 | ||||||
Gaming and lottery machinery and equipment | 993.3 | 1,084.6 | ||||||
Furniture and fixtures | 28.6 | 36.0 | ||||||
Construction in progress | 21.2 | 25.5 | ||||||
Other property and equipment | 239.3 | 271.0 | ||||||
Less: accumulated depreciation | (888.9 | ) | (846.8 | ) | ||||
Total property and equipment, net | $ | 612.2 | $ | 794.0 | ||||
Depreciation expense is excluded from Cost of services, Cost of product sales, Cost of instant games and other operating expenses and is separately presented within D&A.
Year Ended December 31, | |||||||||||
2016 | 2015 | 2014 | |||||||||
Depreciation expense | $ | 323.1 | $ | 313.6 | $ | 238.4 | |||||
Capitalized installation costs
Certain Participation contracts require us to perform installation activities. Direct installation activities, which include costs for installing gaming machines, terminals, facilities wiring, computers, internal labor and travel, are performed at the inception of the contract to enable us to perform under the terms of the contract. Such activities do not represent a separate earnings process and, therefore, the installation costs are capitalized and amortized over the expected life of the contract, which we define as the original life of the contract plus all available extensions in the case of lottery-related contracts and typically over the life of the equipment when no long-term contract exists, as is often the case within our gaming Participation business. We had $23.7 million and $29.6 million of capitalized installation costs, net of accumulated depreciation, included within lottery machinery and equipment included within Property and equipment, net as of December 31, 2016 and 2015, respectively.
88
SCIENTIFIC GAMES CORPORATION AND SUBSIDIARIES
NOTES TO CONSOLIDATED FINANCIAL STATEMENTS
(amounts in USD, table amounts in millions, except per share amounts)
(9) Acquisitions and Dispositions
Bally acquisition
On November 21, 2014, the Company acquired all of the outstanding common stock of Bally for $5.1 billion (including the refinancing of approximately $1.9 billion of existing Bally indebtedness). We completed the allocation of the purchase price, which resulted in the purchase price exceeding the aggregate fair value of the acquired assets and assumed liabilities at the acquisition date by $2,956.1 million. Such excess amount was recognized as goodwill within our Gaming and Interactive business segments. We attributed this goodwill to enhanced financial and operational scale, market diversification, opportunities for synergies, assembled workforce and other strategic benefits.
DEQ acquisition
During the third quarter of 2016, we entered into a definitive agreement to acquire all of the issued and outstanding common shares of DEQ Systems Corp. (DEQ) for approximately $21.0 million in cash. The transaction closed on January 18, 2017. Substantially all of the purchase price is expected to be allocated to acquired intellectual property.
Disposition
In January 2014, we completed the sale of our equity interest in Sportech for cash proceeds of $44.9 million, resulting in a gain of approximately $14.5 million, which is reflected as a gain on sale of equity interest for the year ended December 31, 2014.
(10) Intangible Assets, net and Goodwill
The following tables present certain information regarding our intangible assets as of December 31, 2016 and 2015. Amortizable intangible assets are being amortized on a straight-line basis over their estimated useful lives with no estimated residual values, which materially approximates the expected pattern of use.
89
SCIENTIFIC GAMES CORPORATION AND SUBSIDIARIES
NOTES TO CONSOLIDATED FINANCIAL STATEMENTS
(amounts in USD, table amounts in millions, except per share amounts)
Gross Carrying Value | Accumulated Amortization | Impairment Charges | Net Balance | ||||||||||||
Balance as of December 31, 2016 | |||||||||||||||
Amortizable intangible assets: | |||||||||||||||
Customer relationships | $ | 875.8 | $ | 163.9 | $ | — | $ | 711.9 | |||||||
Intellectual property | 726.0 | 218.2 | — | 507.8 | |||||||||||
Licenses | 413.2 | 153.5 | — | 259.7 | |||||||||||
Brand names | 123.7 | 32.1 | — | 91.6 | |||||||||||
Trade names | 97.4 | 8.1 | — | 89.3 | |||||||||||
Patents and other | 28.0 | 14.2 | — | 13.8 | |||||||||||
2,264.1 | 590.0 | — | 1,674.1 | ||||||||||||
Non-amortizable intangible assets: | |||||||||||||||
Trade names | 96.3 | 2.1 | — | 94.2 | |||||||||||
Total intangible assets | $ | 2,360.4 | $ | 592.1 | $ | — | $ | 1,768.3 | |||||||
Balance as of December 31, 2015 | |||||||||||||||
Amortizable intangible assets: | |||||||||||||||
Customer relationships | $ | 877.7 | $ | 109.1 | $ | — | $ | 768.6 | |||||||
Intellectual property (1) | 731.1 | 124.5 | — | 606.6 | |||||||||||
Licenses | 326.1 | 91.6 | — | 234.5 | |||||||||||
Brand names | 124.0 | 18.9 | — | 105.1 | |||||||||||
Trade names | 226.1 | 1.9 | 128.6 | 95.6 | |||||||||||
Patents and other | 27.1 | 12.8 | — | 14.3 | |||||||||||
2,312.1 | 358.8 | 128.6 | 1,824.7 | ||||||||||||
Non-amortizable intangible assets: | |||||||||||||||
Trade names | 97.4 | 2.1 | — | 95.3 | |||||||||||
Total intangible assets | $ | 2,409.5 | $ | 360.9 | $ | 128.6 | $ | 1,920.0 | |||||||
(1) December 31, 2015 net balance includes $33.0 million of in-process R&D assets that were not subject to amortization. These assets reached commercial feasibility at the end of the third quarter 2016, with amortization commencing October 2016.
The following reflects intangible amortization expense included within D&A:
Year Ended December 31, | |||||||||||
2016 | 2015 | 2014 | |||||||||
Amortization expense | $ | 251.9 | $ | 245.5 | $ | 83.0 | |||||
Estimated intangible asset amortization expense for the year ending December 31, 2017 and each of the subsequent four years:
Year Ending December 31, | |||||||||||||||||||
2017 | 2018 | 2019 | 2020 | 2021 | |||||||||||||||
Amortization expense | $ | 258.7 | $ | 252.9 | $ | 205.5 | $ | 137.1 | $ | 134.8 | |||||||||
90
SCIENTIFIC GAMES CORPORATION AND SUBSIDIARIES
NOTES TO CONSOLIDATED FINANCIAL STATEMENTS
(amounts in USD, table amounts in millions, except per share amounts)
The table below reconciles the change in the carrying value of goodwill, by business segment, for the period from December 31, 2014 to December 31, 2016.
Gaming | Lottery | Interactive | Totals | |||||||||||||
Balance as of December 31, 2014(1) | $ | 3,499.7 | $ | 498.8 | $ | 109.8 | $ | 4,108.3 | ||||||||
Foreign currency adjustments | (78.7 | ) | (13.3 | ) | — | (92.0 | ) | |||||||||
Impairment charges | (935.0 | ) | (67.6 | ) | — | (1,002.6 | ) | |||||||||
Balance as of December 31, 2015 | 2,486.0 | 417.9 | 109.8 | 3,013.7 | ||||||||||||
Foreign currency adjustments | (57.4 | ) | 1.1 | — | (56.3 | ) | ||||||||||
Impairment charges | — | (69.0 | ) | — | (69.0 | ) | ||||||||||
Balance as of December 31, 2016 | $ | 2,428.6 | $ | 350.0 | $ | 109.8 | $ | 2,888.4 | ||||||||
(1) We had no goodwill impairment charges in the preceding periods.
(11) Impairments and Assets Held for Sale
Impairments and accelerated D&A charges recognized within D&A are summarized below:
Year Ended December 31, | ||||||||||||
Asset | 2016 | 2015 | 2014 | |||||||||
Trade names (1)(2) | $ | — | $ | 128.6 | $ | 6.0 | ||||||
Buildings (3) | 4.8 | 11.5 | 9.4 | |||||||||
Lottery other assets (4) | — | 13.8 | 4.2 | |||||||||
Gaming equipment (5) | — | 15.8 | 21.4 | |||||||||
Total | $ | 4.8 | $ | 169.7 | $ | 41.0 | ||||||
(1) During the second quarter of 2015, as a result of an interim review of indefinite-lived trade name assets, we recorded an impairment charge of $25.0 million, with a $9.5 million tax benefit, to reduce the carrying value of one of our trade name assets to fair value.
(2) During the third quarter of 2015, we determined that circumstances no longer continued to support an indefinite useful life for certain of our indefinite-lived trade name assets in our Gaming business segment. We estimated the fair value of the trade name assets using the relief-from-royalty method, which uses several significant assumptions, including an estimated royalty rate, revenue projections that consider historical and estimated future results and general economic and market conditions, as well as the impact of planned business and operational strategies. The following estimates and assumptions were used in applying the relief-from-royalty method:
• | Royalty rates between 0.5% and 1.0% based on market-observed royalty rates; and |
• | A discount rate of 9.0% based on the required rate of return for the trade name assets. |
Based on the estimated fair value of the trade name assets, we recorded an impairment charge of $103.6 million with a tax benefit of $38.8 million during the third quarter of 2015. The change in useful life determination was treated as a change in estimate with the new $97.5 million carrying value of the trade name assets being amortized on a straight-line basis over a fifteen-year period beginning in the fourth quarter of 2015, which materially approximates the expected pattern of use over the remaining useful life. The fifteen-year estimated useful life is a matter of management judgment, which we believe materially represents the period over which the trade name assets will contribute to the future cash flows of the respective asset group and is consistent with our policies for assigning useful lives.
(3) We recorded a non-cash charge of $4.8 million, $6.6 million and $9.4 million during 2016, 2015 and 2014, respectively, to adjust the carrying value of the Waukegan facility to fair value less expected selling costs.
(4) During the fourth quarter of 2015, we recorded $11.9 million in accelerated D&A of property and equipment related to our instant games operations.
91
SCIENTIFIC GAMES CORPORATION AND SUBSIDIARIES
NOTES TO CONSOLIDATED FINANCIAL STATEMENTS
(amounts in USD, table amounts in millions, except per share amounts)
(5) During 2015 and 2014, we recorded $15.8 million and $14.5 million, respectively, of accelerated depreciation on certain equipment assets included in our Gaming business segment.
Goodwill and intangible assets with indefinite useful lives
Goodwill represents the excess of the purchase price over the fair value of the assets acquired and liabilities assumed of acquired companies. We test goodwill for impairment annually as of October 1 of each fiscal year or more frequently if events arise or circumstances change that indicate that it is more likely than not that the fair value of a reporting unit is less than its carrying value. We evaluate goodwill at the reporting unit level by comparing the carrying value of each reporting unit to its fair value using a quantitative two step impairment test in accordance with ASC 350. We also have the option to first assess qualitative factors to determine whether the fair value of a reporting unit is not "more than likely" less than its carrying value, which is commonly referred to as "Step 0". If the fair value of the reporting unit is greater than its carrying value, goodwill is not considered impaired. If the fair value of the reporting unit is less than its carrying value, the amount of the impairment loss, if any, will be measured by comparing the fair value of goodwill to its carrying value.
We reviewed our operating segments in accordance with ASC 350 to determine if additional reporting units exist within our operating segments based on the availability of discrete financial information that is regularly reviewed by segment management. For additional business segment information, see Note 2. We determined that we have eight reporting units as of our October 1, 2016 goodwill impairment testing date: Instant Products, U.S. Lottery Systems, International Lottery Systems, SG Gaming, legacy U.K. Gaming, Casino Management Systems, Table Products, and Interactive. There were no subsequent changes to this determination through December 31, 2016. These are the same reporting units that we determined at December 31, 2015.
Our annual goodwill impairment tests as of October 1, 2016 indicated estimated fair values in excess of their carrying values for each of our instant products, SG Gaming, legacy U.K. Gaming, Casino Management Systems, Table Products and Interactive reporting units. See below for discussion related to the impairment testing results of International Lottery Systems reporting unit.
We conduct impairment tests of our indefinite-lived assets annually in the fourth quarter of each fiscal year, or more frequently if events or changes in circumstances indicate that it is more likely than not that the fair value of an indefinite-lived asset is less than its carrying value or when circumstances no longer continue to support an indefinite useful life.
Our annual impairment tests as of October 1, 2016 produced estimated fair values in excess of the carrying values for all of our remaining indefinite-lived intangible assets.
2016 International Lottery Systems Impairment Charge
Based on the results of our annual goodwill impairment test for our International Lottery Systems reporting unit, we recorded a goodwill impairment charge of $69.0 million, which resulted in a tax benefit of $14.5 million, during the fourth quarter of 2016. The impairment charge resulted from an accumulation of various internal and external factors, including the loss of our China Sports Lottery validation contract, the inability to receive regulatory approval in 2016 on certain games resulting in lower than anticipated replacement revenues, and the underlying factors driving the assumptions used in our model for goodwill valuation purposes, which were based on normalized historical results as described below.
For purposes of the step one test under ASC 350-20, we estimated the fair value of the International Lottery Systems reporting unit using both an income approach that analyzed projected discounted cash flows and a market approach that considered comparable public companies. In determining the fair value of our International Lottery Systems reporting unit, we have given equal weight to the income and the market approach.
In calculating the fair value of our International Lottery Systems reporting unit using the income approach, we used projections of revenues, profit margin, operating costs, capital expenditures and cash flows that primarily considered historical results, but also considered estimated future results and general economic and market conditions. In developing these projections, as large system installations and related hardware and terminal sales are inherently unpredictable, we used normalized historical results, even though such installations have occurred in the past and may reoccur in the future. The following estimates and assumptions were used in the discounted cash flow analysis:
92
SCIENTIFIC GAMES CORPORATION AND SUBSIDIARIES
NOTES TO CONSOLIDATED FINANCIAL STATEMENTS
(amounts in USD, table amounts in millions, except per share amounts)
• | A terminal revenue growth rate of 2.0%; |
• | A terminal profit margin percentage reflecting our historical normalized profit margins; |
• | Assumptions regarding future capital expenditures reflective of maintaining and renewing our current customer contracts under normalized operations; and |
• | An overall discount rate of 8% based on our weighted average cost of capital for the International Lottery Systems reporting unit. |
As the step one test indicated a possible impairment in the carrying value of our International Lottery Systems reporting unit goodwill, we performed step two of the impairment test to determine the amount of goodwill impairment to be recorded. The amount of the impairment was calculated by using assumptions consistent with our step one assumptions described above and the resulting implied fair value of the goodwill after allocating the fair value determined in the step one test to the individual assets and liabilities of the reporting unit, including the fair value of identified intangible assets which are not included in the existing carrying value of the reporting unit. The International Lottery Systems reporting unit fair value from our step one test was primarily allocated to our existing recorded assets and liabilities and our unrecorded identified intangible assets, including our proprietary Lottery systems platform and our existing customer relationships, resulting in an unallocated excess amount of $22.9 million, which was the implied fair value of the goodwill and was used in determining the impairment charge. The International Lottery Systems reporting unit is included in our Lottery business segment.
2015 SG Gaming Impairment Charge
During the third quarter of 2015, we identified certain events and circumstances, which impacted our SG Gaming reporting unit and required the performance of an interim goodwill impairment test. Specifically, market-related factors negatively impacting gaming machine unit demand and the number of gaming machines leased by our customers coupled with fewer than anticipated new casino openings and expansions had resulted in continued declines in our gaming machine sales and participation game revenues. A prolonged reduction in customer spending on new gaming machine units, a lack of new casino openings, economic and political conditions impacting unit sales and participation game revenues in certain international jurisdictions and cost reduction initiatives undertaken by certain of our customers during the third quarter of 2015 had all negatively impacted our SG Gaming reporting unit.
We estimated the fair value of the SG Gaming reporting unit using both an income approach that analyzed projected discounted cash flows and a market approach that considered both comparable public companies as well as comparable industry transactions. In determining the fair value of our SG Gaming reporting unit, we had given more weight to the income approach than to the market approach due to a relatively small number of comparable companies within our industry and absence of a significant volume of recent comparable industry transactions. Additionally, under the market approach, we used other significant observable inputs including various peer company comparisons.
The following key estimates and assumptions were used in the discounted cash flow analysis:
• | A terminal revenue growth rate of 2.0% based on long term nominal growth rate potential; |
• | A terminal profit margin percentage reflecting our historical and forecasted profit margins; |
• | Assumptions regarding future capital expenditures reflective of maintaining our installed base of leased gaming machines and facilities under normalized operations; and |
• | An overall discount rate of 9% based on our weighted average cost of capital for the SG Gaming reporting unit. |
Based on the results of our goodwill impairment analysis for our SG Gaming reporting unit, we recorded a $935.0 million non-cash impairment charge with no tax benefit for the year ended December 31, 2015.
2015 U.S. Lottery Systems Impairment Charge
93
SCIENTIFIC GAMES CORPORATION AND SUBSIDIARIES
NOTES TO CONSOLIDATED FINANCIAL STATEMENTS
(amounts in USD, table amounts in millions, except per share amounts)
Based on the results of our annual goodwill impairment test for our U.S. Lottery Systems reporting unit, we recorded a goodwill impairment charge of $67.6 million, which resulted in a tax benefit of $24.9 million during the fourth quarter of 2015. The impairment charge resulted from an accumulation of various internal and external factors, including our consideration of the U.S lottery industry outlook, our failure to win anticipated new U.S. lottery system contracts, intense price-based competition and requirements for up-front cash-based payments.
We estimated the fair value of the U.S. Lottery Systems reporting unit using both an income approach that analyzed projected discounted cash flows and a market approach that considered comparable public companies. In determining the fair value of our U.S. Lottery Systems reporting unit, we had given more weight to the income approach than to the market approach due to a relatively small number of comparable companies within our industry. The key estimates and assumptions used in the discounted cash flows analysis included a 2.0% terminal revenue growth rate and an overall discount rate of 8%.
Other long-lived assets and intangible assets with finite useful lives
Intangible assets with finite useful lives are amortized over two to sixteen years using the straight-line method, which materially approximates the pattern of the assets' use. Factors considered when assigning useful lives include legal, regulatory and contractual provisions, product obsolescence, demand, competition and other economic factors.
We assess the recoverability of long-lived assets and intangible assets with finite useful lives whenever events arise or circumstances change that indicate the carrying value of an asset may not be recoverable. Recoverability of long-lived assets (or asset groups) to be held and used is measured by a comparison of the carrying value of the asset (or asset group) to the expected net future undiscounted cash flows to be generated by that asset (or asset group). The amount of impairment of other long-lived assets and intangible assets with finite lives is measured by the amount by which the carrying value of the asset exceeds the fair market value of the asset.
Assets held for sale
As of December 31, 2016 and 2015, we had $6.5 million and $16.7 million of assets held for sale, respectively. These assets held for sale are included within Prepaid expenses, deposits and other current assets and are reported at the lower of the carrying value or fair market value, less expected costs to sell.
We measured the fair value of assets held for sale under a market approach and have categorized such measurements as Level 3 in the fair value hierarchy.
(12) Software, net
We capitalize direct costs of services used in the development of internal-use software. Amounts capitalized are amortized over a period of two to ten years on a straight-line basis.
We purchase, license and incur costs to develop external use software to be used in the products we sell or provide to customers. Costs incurred in creating software are expensed when incurred as R&D until technological feasibility has been established, after which costs are capitalized up to the date the software is available for general release to customers. Generally, the software we develop reaches technological feasibility when a working model of the software is available. We capitalize the payments made for software that we purchase or license for use in our products that has previously met the technological feasibility criteria prior to our purchase or license. Amortization of capitalized software costs is recorded over the estimated economic life, which is typically eight to ten years.
For our game themes, we have determined that such products reach technological feasibility when internal testing is complete and the product is ready to be submitted to gaming regulators for approval. We incur and capitalize regulatory approval costs for our game themes after technological feasibility is achieved. Amortization of regulatory approval costs is recorded over the estimated economic life, which is typically two to four years.
94
SCIENTIFIC GAMES CORPORATION AND SUBSIDIARIES
NOTES TO CONSOLIDATED FINANCIAL STATEMENTS
(amounts in USD, table amounts in millions, except per share amounts)
Software, net consisted of the following:
As of December 31, | ||||||||
2016 | 2015 | |||||||
Software | $ | 924.8 | $ | 854.2 | ||||
Accumulated amortization | (515.7 | ) | (368.3 | ) | ||||
Software, net | $ | 409.1 | $ | 485.9 | ||||
In the years ended December 31, 2016 and 2015, we capitalized $74.4 million and $70.9 million, respectively, of software.
The following reflects amortization of software included within D&A:
Year Ended December 31, | |||||||||||
2016 | 2015 | 2014 | |||||||||
Amortization expense | $ | 158.9 | $ | 174.4 | $ | 91.9 | |||||
(13) Equity Investments
We account for our equity investments where we own a non-controlling interest, but exercise significant influence, under the equity method of accounting. Under the equity method of accounting, our original cost of the investment is adjusted for our share of equity in the earnings of the equity investee and reduced by dividends and distributions of capital received.
We evaluate our investments in unconsolidated affiliates for impairment whenever events or changes in circumstances indicate that the carrying value of the investment may have experienced an "other-than-temporary" decline in value. If such conditions exist, we compare the estimated fair value of the investment to its carrying value to determine if an impairment is indicated and determine whether the impairment is "other-than-temporary" based on an assessment of all relevant factors, including consideration of our intent and ability to retain our investment until the recovery of the unrealized loss. We estimate fair value using a discounted cash flow analysis based on estimated future results of, or cash distributions from, the investee. Impairment charges, if any, are recorded in Earnings (loss) from equity investment.
During the fourth quarter of 2016, we recorded an impairment charge of $11.3 million related to our investment in GLB. During the third quarter of 2014, we concluded that indicators of impairment were present related to our investment in Northstar Illinois as we understood that the Governor's office of the State of Illinois directed the Illinois Department of Lottery to end the PMA with Northstar Illinois, which termination agreement was signed during the third quarter of 2015. We recorded an impairment charge of $19.7 million in the third quarter of 2014, which is reflected in earnings (loss) from equity investments for the year ended December 31, 2014.
At December 31, 2016, we had investments in a number of entities (principally in our lottery business segment) which are accounted for under the equity method of accounting because we do not have a controlling financial interest but we have the ability to exercise significant influence. Equity method income (loss) is recorded in “Earnings (loss) from equity investments”, with our investment recorded in “Equity investments”. See the tables below for details of our equity investments:
95
SCIENTIFIC GAMES CORPORATION AND SUBSIDIARIES
NOTES TO CONSOLIDATED FINANCIAL STATEMENTS
(amounts in USD, table amounts in millions, except per share amounts)
Equity Investment | Purpose | Term | Ownership Interest | Segment |
LNS (1) | Exclusive operator of Italian instant game lottery | Initial term of nine years beginning October 2010 | 20% | Lottery |
Northstar IL (2) | Private manager of Illinois lottery under a PMA | 10 years beginning January 2011, see below | 20% | Lottery |
Northstar NJ (3) | Provision of marketing and sales services to New Jersey Lottery | October 1, 2013 through 2029 | 17.69% | Lottery |
Northstar SupplyCo New Jersey LLC (NJ SupplyCo) | Separate agreement under which we provide instant games to Northstar NJ | October 1, 2013 through 2029 | 30% | Lottery |
(1) Other members of consortium are Gtech S.p.A, a subsidiary of IGT and Arianna 2001. LNS succeeded Consorzio Lotterie Nazionali, a consortium comprised of essentially the same group that owns LNS, as holder of the concession as the exclusive operator of the Italian Gratta e Vinci instant game lottery.
(2) Other member of Northstar Illinois is Gtech corporation, a subsidiary of IGT.
(3) Other members are Gtech and a subsidiary of the administrator of the Ontario Municipal Employees Retirement System, this agreement provides us substantive participating rights.
Equity investment Balance as of December 31, | Equity earnings (loss) recognized for the Year Ended December 31, | Cash distributions and dividends received for the Year Ended December 31, | |||||||||||||||||||||||||||||
Equity Investment | 2016 | 2015 | 2016 | 2015 | 2014 | 2016 | 2015 | 2014 | |||||||||||||||||||||||
LNS | $ | 80.0 | $ | 104.5 | $ | 14.0 | $ | 14.8 | $ | 17.5 | $ | 34.3 | $ | 31.5 | $ | 49.9 | |||||||||||||||
Northstar IL | — | — | (0.4 | ) | (2.7 | ) | (34.8 | ) | — | — | — | ||||||||||||||||||||
Northstar NJ and NJ Supply Co | 24.8 | 27.3 | 1.0 | (4.0 | ) | (3.7 | ) | 4.8 | — | — | |||||||||||||||||||||
GLB and CSG | 38.3 | 51.2 | (8.0 | ) | 3.5 | 7.8 | 1.7 | 4.7 | 6.4 | ||||||||||||||||||||||
ITL | 12.3 | 20.9 | — | 1.0 | 0.3 | 5.9 | 10.0 | 17.4 | |||||||||||||||||||||||
Other | 24.5 | 24.6 | 6.4 | 4.3 | 5.3 | 5.0 | 17.4 | 3.6 | |||||||||||||||||||||||
Total | $ | 179.9 | $ | 228.5 | $ | 13.0 | $ | 16.9 | $ | (7.6 | ) | $ | 51.7 | $ | 63.6 | $ | 77.3 | ||||||||||||||
Revenue recognized from sales to investee for the Year Ended December 31, | |||||||||||
Equity Investment | 2016 | 2015 | 2014 | ||||||||
LNS | $ | 45.3 | $ | 46.6 | $ | 47.1 | |||||
Northstar IL | 22.6 | 20.8 | 24.5 | ||||||||
Northstar NJ and NJ Supply Co | 20.9 | 18.3 | 12.7 | ||||||||
Other | 4.9 | 6.0 | 6.3 | ||||||||
Total | $ | 93.7 | $ | 91.7 | $ | 90.6 | |||||
LNS
In 2010, we paid $97.7 million (our pro-rata share of the $1,089.8 million LNS paid to obtain this concession) in upfront fees which are being amortized on a straight-line basis over the term of the concession, thereby reducing our investment balance.
As of December 31, 2016 we had accounts receivable of $13.1 million from LNS.
Northstar Illinois
96
SCIENTIFIC GAMES CORPORATION AND SUBSIDIARIES
NOTES TO CONSOLIDATED FINANCIAL STATEMENTS
(amounts in USD, table amounts in millions, except per share amounts)
In August 2015, Northstar Illinois, the State of Illinois, SGI and Gtech entered into a termination agreement with respect to the PMA (the “Termination Agreement”). The Termination Agreement contemplated, among other things, (1) a $10.0 million net income shortfall payment for the lottery’s 2015 fiscal year, (2) termination of the PMA in January 2017 (subject to possible extension by mutual agreement of the State of Illinois and Northstar Illinois in 3- to 6-month increments), (3) that, following December 2014, Northstar Illinois will no longer be entitled to any incentive compensation payments and will no longer be liable for any shortfall payments following the $10.0 million shortfall payment for the lottery's 2015 fiscal year, (4) reimbursement of Northstar Illinois for certain costs it incurs in transitioning its obligations under the PMA, (5) continuation of our instant lottery game supply agreement (and Gtech’s lottery systems supply agreement) with Northstar Illinois until July 2017, subject to a reduced rate structure, and (6) our right to negotiate a new supply agreement with any manager that replaces Northstar Illinois and our ability to participate in the procurement process for such replacement manager. In September 2016, Northstar Illinois, the State of Illinois, SGI and IGT (formerly Gtech) entered into a letter agreement that (a) extended the term of the PMA to July 2017 and (b) extended our instant lottery game supply agreement (and IGT’s lottery systems supply agreement) with Northstar Illinois until January 2018.
Northstar New Jersey
Northstar New Jersey is entitled to receive annual incentive compensation payments from the State of New Jersey to the extent the lottery's net income for the applicable year exceeds specified target levels, subject to a cap of 3% of the applicable year's net income. Northstar New Jersey is responsible for payments to the State of New Jersey to the extent certain net income targets are not achieved by the New Jersey Lottery, subject to a cap of 2% of the applicable year’s net income and a $20.0 million shortfall payment credit that was fully used by the end of the fourth quarter of 2015. In addition, pursuant to a December 2015 amendment to the Northstar New Jersey services agreement, the State of New Jersey will be entitled to additional amounts for each of the lottery’s 2016-2018 fiscal years to the extent the sum of the New Jersey Lottery’s net income and the net income shortfall payments paid to the State of New Jersey by Northstar New Jersey (if any) for the applicable year fall below certain guaranteed amounts. We may be required to make capital contributions to Northstar New Jersey to fund our pro rata share of any shortfall payments that are payable to the State of New Jersey under the services agreement.
In December 2015, pursuant to the terms of the amendment to its services agreement discussed above, (i) Northstar New Jersey made a $15.4 million payment to the State of New Jersey, of which we contributed our pro rata portion of $2.7 million, representing consideration in connection with the terms and conditions of the amendment, and (ii) Northstar New Jersey satisfied the $5.9 million net income shortfall payment owed to the State of New Jersey for the lottery’s fiscal year ended June 30, 2015 with the remainder of the $20.0 million shortfall payment credit.
(14) Accrued Liabilities
Accrued liabilities consisted of the following:
As of December 31, | ||||||||
2016 | 2015 | |||||||
Accrued interest | $ | 96.0 | $ | 97.4 | ||||
Compensation and benefits | 134.6 | 80.1 | ||||||
Deferred revenue | 58.8 | 47.5 | ||||||
Taxes, other than income | 25.2 | 28.0 | ||||||
Legal accruals | 8.1 | 26.5 | ||||||
Other | 131.5 | 164.3 | ||||||
Total | $ | 454.2 | $ | 443.8 | ||||
(15) Leases
At December 31, 2016, we were obligated under operating leases covering office equipment, office and warehouse space, transponders and transportation equipment expiring at various dates. Future minimum lease payments required under our operating leases at December 31, 2016 were approximately as follows:
97
SCIENTIFIC GAMES CORPORATION AND SUBSIDIARIES
NOTES TO CONSOLIDATED FINANCIAL STATEMENTS
(amounts in USD, table amounts in millions, except per share amounts)
2017 | 2018 | 2019 | 2020 | 2021 | Thereafter | |||||||||||||||||||
Future minimum lease payments | $ | 27.6 | $ | 20.3 | $ | 14.5 | $ | 12.5 | $ | 10.2 | $ | 22.7 | ||||||||||||
Total rental expense under operating leases was $32.7 million, $47.0 million and $44.5 million for the years ended December 31, 2016, 2015 and 2014, respectively.
Some of our operating leases contain provisions for future rent increases, rent-free periods or periods in which rent payments are reduced. The total amount of rental payments due over the lease term is being charged to rent expense on a straight-line method over the term of the lease. The difference between rent expense recorded and the amount paid is credited or charged to deferred rent obligation, which is included in accrued liabilities and other long-term liabilities.
(16) Long-Term and Other Debt
February 2017 Financing Transactions
On February 14, 2017, we entered into an amendment to our credit agreement which provides for a $3,291.0 million senior secured term B-3 loan facility which matures in 2021 and reduces the commitments on the revolving credit facility to $556.2 million through October 2018, with a step-down in availability at that time to $381.7 million until the maturity in October 2020. We also successfully completed an additional offering of our Secured Notes in the aggregate principal amount of $1.15 billion (the "additional Secured Notes"). The net proceeds of the term B-3 loan facility and the additional Secured Notes were used to prepay the balances on the term B-1 and term B-2 loans and the existing revolving credit facility, as well as related fees and expenses (the "February 2017 Financing"). We plan to use the remaining net proceeds to redeem all of the outstanding 2018 Notes including payment of any accrued and unpaid interest thereon plus any related premiums, fees and costs. Subsequent to the February 2017 Financing, the aggregate principal amount of Secured Notes outstanding was $2.1 billion.
Outstanding debt and capital leases
The following reflects outstanding debt as of the dates indicated below:
98
SCIENTIFIC GAMES CORPORATION AND SUBSIDIARIES
NOTES TO CONSOLIDATED FINANCIAL STATEMENTS
(amounts in USD, table amounts in millions, except per share amounts)
As of December 31, | |||||||||||||||||||||||||
2016 | 2015 | ||||||||||||||||||||||||
Final Maturity | Rate(s) | Face Value | Unamortized debt discount | Unamortized deferred financing costs | Book Value | Book Value | |||||||||||||||||||
Senior Secured Credit Facilities (1): | |||||||||||||||||||||||||
Revolver | 2018 | variable | $ | 45.0 | $ | — | $ | — | $ | 45.0 | $ | 95.0 | |||||||||||||
Term Loan B-1 | 2020 | variable | 2,231.0 | (6.1 | ) | (41.4 | ) | 2,183.5 | 2,193.7 | ||||||||||||||||
Term Loan B-2 | 2021 | variable | 1,960.0 | (13.7 | ) | (40.5 | ) | 1,905.8 | 1,914.1 | ||||||||||||||||
Senior Notes: | |||||||||||||||||||||||||
Secured Notes (1) | 2022 | 7.000 | % | 950.0 | — | (13.7 | ) | 936.3 | 933.6 | ||||||||||||||||
Unsecured Notes | 2022 | 10.000 | % | 2,200.0 | — | (36.0 | ) | 2,164.0 | 2,157.9 | ||||||||||||||||
Subordinated Notes: | |||||||||||||||||||||||||
2018 Notes (1) | 2018 | 8.125 | % | 250.0 | — | (1.3 | ) | 248.7 | 248.0 | ||||||||||||||||
2020 Notes | 2020 | 6.250 | % | 243.5 | — | (2.3 | ) | 241.2 | 296.4 | ||||||||||||||||
2021 Notes | 2021 | 6.625 | % | 340.6 | (1.5 | ) | (4.6 | ) | 334.5 | 342.6 | |||||||||||||||
Capital lease obligations | 2019 | 3.900 | % | 15.2 | — | — | 15.2 | 25.7 | |||||||||||||||||
Total long-term debt outstanding | $ | 8,235.3 | $ | (21.3 | ) | $ | (139.8 | ) | $ | 8,074.2 | $ | 8,207.0 | |||||||||||||
Less: current portion of long-term debt | (49.3 | ) | (50.3 | ) | |||||||||||||||||||||
Long-term debt, excluding current portion | $ | 8,024.9 | $ | 8,156.7 | |||||||||||||||||||||
Fair value of debt (2) | $ | 8,221.8 | |||||||||||||||||||||||
______________________________________
(1) Refer to the discussion relating to the February 2017 Financing described herein.
(2) Fair value of our fixed rate and variable interest rate debt as of December 31, 2016 approximated $8,221.8 million based on quoted market prices for our securities. We classify the fair value of debt within level 2 in the fair value hierarchy.
The following reflects debt and capital lease payments due over the next five years and beyond as of December 31, 2016:
99
SCIENTIFIC GAMES CORPORATION AND SUBSIDIARIES
NOTES TO CONSOLIDATED FINANCIAL STATEMENTS
(amounts in USD, table amounts in millions, except per share amounts)
Total | 2017 | 2018 | 2019 | 2020 | 2021 | After 2021 | ||||||||||||||||||||||
Senior Secured Credit Facilities | $ | 4,236.0 | $ | 43.0 | $ | 88.0 | $ | 43.0 | $ | 2,182.0 | $ | 1,880.0 | $ | — | ||||||||||||||
Senior Notes | 3,150.0 | — | — | — | — | — | 3,150.0 | |||||||||||||||||||||
Subordinated Notes | 834.1 | — | 250.0 | — | 243.5 | 340.6 | — | |||||||||||||||||||||
Capital lease obligations, payable monthly through 2019 | 15.2 | 6.3 | 6.5 | 2.4 | — | — | — | |||||||||||||||||||||
Total long-term debt outstanding | $ | 8,235.3 | $ | 49.3 | $ | 344.5 | $ | 45.4 | $ | 2,425.5 | $ | 2,220.6 | $ | 3,150.0 | ||||||||||||||
Unamortized deferred financing costs and discount | (161.1 | ) | ||||||||||||||||||||||||||
Total debt book value | $ | 8,074.2 | ||||||||||||||||||||||||||
Senior secured credit facilities
SGC and certain of its subsidiaries are party to a credit agreement dated as of October 18, 2013, by and among SGI, as the borrower, SGC, as a guarantor, Bank of America, N.A., as administrative agent, and the lenders and other agents party thereto. The credit agreement provided for senior secured credit facilities in an aggregate principal amount of $2.6 billion, consisting of a $300.0 million revolving credit facility, which has dollar and multi-currency tranches and a $2.3 billion term B-1 loan facility.
On October 1, 2014, we amended our credit agreement pursuant to which our $300.0 million revolving credit facility was increased by $267.6 million. In addition, we entered into an escrow credit agreement providing for a $2.0 billion senior secured incremental term B-2 loan facility (which became an incremental term B-2 loan facility under our existing credit agreement).
On February 11, 2015, SGI entered into a lender joinder agreement to the credit agreement with an additional revolving commitment lender. Pursuant to the joinder agreement, the amount of the revolving credit facility under the credit agreement was increased by $25.0 million to $592.6 million. Up to $350.0 million of the revolving credit facility is available for issuances of letters of credit.
All of the debt incurred under the credit agreement is subject to accelerated maturity depending on our liquidity at the time our 2018 Notes, 2020 Notes and 2021 Notes become due.
The term B-1 loans and the term B-2 loans under the credit agreement amortize in equal quarterly installments in an amount equal to 1.00% per annum of the stated principal amount thereof, with the remaining balance due at final maturity. The new term B-3 loans that were entered into as part of the February 2017 Financing will amortize in equal quarterly installments in an amount equal to 1.00% per annum of the stated principal amount thereof, with the remaining balance due at final maturity.
SGI is required to pay commitment fees to revolving lenders on the actual daily unused portion of the revolving commitments at a rate of 0.50% per annum through maturity, subject to a step-down to 0.375% based upon the achievement of certain net first lien leverage ratios. SGI may voluntarily prepay all or any portion of outstanding amounts under the credit facilities at any time, in whole or in part, without premium or penalty, subject to redeployment costs in the case of a prepayment of euro currency loans on a day that is not the last day of the relevant interest period.
Borrowings under the credit agreement are guaranteed by us and each of our current and future direct and indirect wholly owned domestic subsidiaries (other than SGI, the unrestricted social gaming business entities and immaterial subsidiaries), subject to certain customary exceptions as set forth in the credit agreement. The obligations under the credit agreement are secured by a first priority lien on (1) substantially all the property and assets (real and personal, tangible and intangible) of SGI and the other guarantors, and (2) 100% of the capital stock (or other equity interests) of the direct domestic subsidiaries of SGC, SGI and the guarantors and 65% of the capital stock (or other equity interests) of the direct foreign subsidiaries of SGC, SGI and the guarantors, in each case, subject to certain customary exceptions.
100
SCIENTIFIC GAMES CORPORATION AND SUBSIDIARIES
NOTES TO CONSOLIDATED FINANCIAL STATEMENTS
(amounts in USD, table amounts in millions, except per share amounts)
Senior notes
Unsecured Notes
In connection with the Bally acquisition in 2014, SGI issued $2.2 billion in aggregate principal amount of the Unsecured Notes in a private offering. The Unsecured Notes were issued pursuant to an indenture dated as of November 21, 2014 (the "Unsecured Notes Indenture"). In May 2015, SGI completed an exchange offer in which all of the unregistered Unsecured Notes were exchanged for a like amount of Unsecured Notes registered under the Securities Act.
SGI may redeem some or all of the Unsecured Notes at any time prior to December 1, 2018 at a redemption price equal to 100% of the principal amount of the Unsecured Notes plus accrued and unpaid interest, if any, to the date of redemption plus a "make whole" premium. SGI may redeem some or all of the Unsecured Notes at any time on or after December 1, 2018 at the prices specified in the Unsecured Notes indenture.
The Unsecured Notes are senior unsecured obligations of SGI and rank equally to all of SGI’s existing and future senior debt and rank senior to all of SGI's existing and future senior subordinated debt. The Unsecured Notes are guaranteed on a senior unsecured basis by SGC and all of its wholly owned U.S. subsidiaries (other than SGI, the unrestricted social gaming business entities and immaterial subsidiaries). The Unsecured Notes are structurally subordinated to all of the liabilities of our non-guarantor subsidiaries.
Secured Notes
In connection with the Bally acquisition in 2014, SGI issued $950.0 million in aggregate principal amount of the Secured Notes in a private offering. The Secured Notes were issued pursuant to an indenture dated as of November 21, 2014 (the "Secured Notes Indenture"). SGI may redeem some or all of the Secured Notes at any time prior to January 1, 2018 at a redemption price equal to 100% of the principal amount of the Secured Notes plus accrued and unpaid interest, if any, to the date of redemption plus a "make whole" premium. SGI may redeem some or all of the Secured Notes at any time on or after January 1, 2018 at the prices specified in the Secured Notes indenture. The $1.15 billion of additional Secured Notes that were issued as part of the February 2017 Financing were issued under the Secured Notes Indenture and therefore have the same terms as the Secured Notes except for the issue date and offering price.
The Secured Notes are senior secured obligations of SGI and are equally and ratably secured with SGI’s obligations under the credit agreement. The Secured Notes are equal in rank to all of SGI’s existing and future senior debt and rank senior to all of SGI's existing and future senior subordinated debt. The Secured Notes are guaranteed on a senior secured basis by SGC and all of its wholly-owned U.S. subsidiaries (other than SGI, the unrestricted social gaming business entities and immaterial subsidiaries). The Secured Notes are structurally subordinated to all of the liabilities of our non-guarantor subsidiaries.
Subordinated notes
2018 Notes
The 2018 Notes were issued pursuant to an indenture dated as of September 22, 2010 (the "2018 Notes Indenture"). SGC may redeem some or all of the 2018 Notes for cash at any time at the prices specified in the 2018 Notes Indenture.
The 2018 Notes are unsecured senior subordinated obligations of SGC and are subordinated to all of our existing and future senior debt, rank equally with all of our future senior subordinated debt and rank senior to all of our future debt that is expressly subordinated to the 2018 Notes. The 2018 Notes are guaranteed on an unsecured senior subordinated basis by all of SGC's wholly-owned U.S. subsidiaries (including SGI, the unrestricted social gaming business entities and immaterial subsidiaries). The 2018 Notes are structurally subordinated to all of the liabilities of our non-guarantor subsidiaries. We plan to use a portion of the proceeds from the February 2017 Financing to redeem all of the outstanding 2018 Notes.
2020 Notes
The 2020 Notes were issued pursuant to an August 20, 2012 indenture (the "2020 Notes Indenture"). SGI may redeem some or all of the 2020 Notes at any time at the prices specified in the 2020 Notes Indenture.
The 2020 Notes are unsecured senior subordinated obligations of SGI and are subordinated to all of SGI's existing and future senior debt, rank equally with all of SGI's existing and future senior subordinated debt and rank senior to all of SGI's future debt that is expressly subordinated to the 2020 Notes. The 2020 Notes are guaranteed on an unsecured senior
101
SCIENTIFIC GAMES CORPORATION AND SUBSIDIARIES
NOTES TO CONSOLIDATED FINANCIAL STATEMENTS
(amounts in USD, table amounts in millions, except per share amounts)
subordinated basis by SGC and all of its wholly owned U.S. subsidiaries (other than SGI and the unrestricted social gaming business entities). The 2020 Notes are structurally subordinated to all of the liabilities of our non-guarantor subsidiaries.
2021 Notes
In 2014, SGI issued $350.0 million in aggregate principal amount of 2021 Notes at a price of 99.321% of the principal amount thereof in a private offering. The 2021 Notes were issued pursuant to an indenture dated as of June 4, 2014 (the "2021 Notes Indenture"). In May 2015, SGI completed an exchange offer in which all of the unregistered 2021 Notes were exchanged for a like amount of 2021 Notes that had been registered under the Securities Act.
SGI may redeem some or all of the 2021 Notes at any time prior to May 15, 2017 at a redemption price equal to 100% of the principal amount of the 2021 Notes plus accrued and unpaid interest, if any, to the date of redemption plus a "make whole" premium. SGI may redeem some or all of the 2021 Notes at any time on or after May 15, 2017 at the prices specified in the 2021 Notes Indenture.
The 2021 Notes are unsecured senior subordinated obligations of SGI and are subordinated to all of SGI’s existing and future senior debt, rank equally with all of SGI's existing and future senior subordinated debt and rank senior to all of SGI's future debt that is expressly subordinated to the 2021 Notes. The 2021 Notes are guaranteed on an unsecured senior subordinated basis by SGC and all of its wholly owned U.S. subsidiaries (other than SGI and the unrestricted social gaming business entities). The 2021 Notes are structurally subordinated to all of the liabilities of our non-guarantor subsidiaries.
2020 and 2021 notes repurchase
During the second quarter of 2016, we repurchased and cancelled $56.5 million and $9.4 million of principal amount of the 2020 Notes and 2021 Notes, respectively, for $34.2 million and $5.7 million in cash, respectively, through separate open market purchases. In connection with these transactions, we recorded a $25.2 million gain on early extinguishment of debt, net of a $0.8 million charge related to the write-off of unamortized debt discount and deferred financing costs associated with the extinguished debt.
Social gaming unrestricted subsidiary designation
In order to provide flexibility for potential future growth opportunities with respect to our social gaming business, during the third quarter of 2016 we designated certain of our wholly owned direct and indirect subsidiaries, which hold substantially all of the assets of, and operate, our social gaming business, as “Unrestricted Subsidiaries” under our credit agreement and each of the indentures governing the 2018 Notes, 2020 Notes, 2021 Notes, Secured Notes and Unsecured Notes. As a result of such designations, these social gaming subsidiaries are not guarantors under our credit agreement and indentures and are not obligated to comply with many of the covenants set forth in those agreements and that remain applicable to us and our restricted subsidiaries. In addition, except to the extent of cash distributions from these social gaming subsidiaries to us or our restricted subsidiaries, the assets, liabilities and financial results of these social gaming subsidiaries will be excluded from the calculation of the applicable financial metrics required by these agreements, including our credit agreement’s maintenance covenant, which is based on our consolidated net first lien leverage. Following these designations, the social gaming subsidiaries remain wholly owned direct and indirect subsidiaries of the Company.
Debt issuance costs
We capitalize debt issuance costs associated with long-term financing arrangements and amortize ratably the deferred debt issuance costs over the term of the arrangement. The capitalized debt issuance costs associated with long-term debt financing, other than line-of-credit arrangements, is presented as a direct reduction from the carrying value of long-term debt, consistent with the treatment of unamortized debt discount.
Terms of Outstanding Debt
Restrictive covenants
Our only financial maintenance covenant is contained in our credit agreement. This covenant is tested at the end of each fiscal quarter and requires us to not exceed a maximum consolidated net first lien leverage ratio of 5.5x Consolidated EBITDA (as defined in the credit agreement) for the quarter ended December 31, 2016. In connection with the amendments to the credit agreement as part of the February 2017 Financing, this ratio will be 6.0x for the quarter ended March 31, 2017, then stepping down to 5.5x for the quarter ended June 30, 2018 and 5.0x for the quarter ended June 30, 2019.
102
SCIENTIFIC GAMES CORPORATION AND SUBSIDIARIES
NOTES TO CONSOLIDATED FINANCIAL STATEMENTS
(amounts in USD, table amounts in millions, except per share amounts)
The credit agreement, 2018 Notes Indenture, 2020 Notes Indenture, 2021 Notes Indenture, Unsecured Notes Indenture, and Secured Notes Indenture also contain certain covenants that, among other things and subject to certain exceptions, limit SGC's and its restricted subsidiaries' (including SGI) ability to incur additional indebtedness or guarantees, pay dividends or make distributions or certain other restricted payments, purchase or redeem capital stock, prepay junior indebtedness or modify certain debt instruments, make investments or extend credit, engage in certain transactions with affiliates, engage in sale-leaseback transactions, consummate certain assets sales, effect a consolidation or merger, sell, transfer, lease or otherwise dispose of assets, create certain liens and other encumbrances on assets, enter into arrangements that restrict the ability to pay dividends or change fiscal years. These agreements also contain events of default customary for agreements of their type (with customary grace periods, as applicable).
We were in compliance with the financial covenants under our debt agreements as of December 31, 2016.
(17) Fair Value Measurements
Fair value is defined as the exchange price that would be received for an asset or paid to transfer a liability (an exit price) in the principal or most advantageous market for the asset and liability in an orderly transaction between market participants at the measurement date. We estimate the fair value of our assets and liabilities when required using an established three-level hierarchy in accordance with ASC 820.
The fair value of our financial assets and liabilities is determined by reference to market data and other valuation techniques as appropriate. We believe the fair value of our financial instruments, which are principally cash and cash equivalents, accounts receivable, other current assets, accounts payable and accrued liabilities, approximates their recorded values. Our assets and liabilities measured at fair value on a recurring basis are described below.
Interest rate swap contracts
We record derivative financial instruments on the balance sheet at their respective fair values. We currently use swap contracts as described below to mitigate gains or losses associated with the change in expected cash flows due to fluctuations in interest rates on our variable rate debt.
We hedge a portion of our interest expense associated with our variable rate debt to effectively fix the interest rates that we pay. We have interest rate swap contracts designated as cash flow hedges under ASC 815. Under these hedges, we pay interest at a weighted-average fixed rate of 2.151% and receive interest at the greater of 1% or the prevailing three-month LIBOR rate. The total notional amount of interest rate swaps outstanding was $700.0 million as of both December 31, 2016 and 2015.
These hedges are highly effective in offsetting changes in our future expected cash flows due to the fluctuation in the three-month LIBOR rate associated with our variable rate debt. The effectiveness of these hedges is measured quarterly on a retrospective basis. As a result of the effective matching of the critical terms on our variable rate interest expense being hedged to the hedging instruments being used, we have not measured any hedge ineffectiveness to date. All gains and losses from these hedges are recorded in Other comprehensive income (loss) until the future underlying payment transactions occur. Any realized gains or losses resulting from the hedges will be recognized (together with the hedged transaction) as interest expense. We estimate the fair value of our interest rate swap contracts by discounting the future cash flows of both the fixed rate and variable rate interest payments based on market yield curves. The inputs used to measure the fair value of our interest rate swap contracts are categorized as Level 2 in the fair value hierarchy.
The following table shows the losses (gains) on our interest rate swap contracts:
Year Ended December 31, | ||||||||||||
2016 | 2015 | 2014 | ||||||||||
Losses (gains) recorded in accumulated other comprehensive loss, net of tax | $ | (3.0 | ) | $ | (1.6 | ) | $ | 5.0 | ||||
Realized losses recorded in interest expense | 8.2 | 5.2 | — | |||||||||
We expect to reclassify additional losses of $6.7 million from accumulated other comprehensive loss to interest expense in the next twelve months. The following table shows the fair value of our hedges:
103
SCIENTIFIC GAMES CORPORATION AND SUBSIDIARIES
NOTES TO CONSOLIDATED FINANCIAL STATEMENTS
(amounts in USD, table amounts in millions, except per share amounts)
As of December 31, | |||||||
2016 | 2015 | ||||||
Accrued liabilities | $ | 6.7 | $ | 7.9 | |||
Other long-term liabilities | 0.2 | 4.0 | |||||
Total fair value | $ | 6.9 | $ | 11.9 | |||
Set forth below are the classes of assets and liabilities measured at fair value on a non-recurring basis at December 31, 2015:
Level 1 | Level 2 | Level 3 | Book Value as of December 31, 2015 | Total Loss | Valuation Technique | Weighted-Average Discount Rate | ||||||||
Property and Equipment - Waukegan facility (1) | $— | $— | $15.0 | $14.5 | $(6.6) | Market Approach | n/a | |||||||
Intangibles - Trade Names(2) | $— | $— | $97.5 | $95.6 | $(128.6) | Relief From Royalty Method | 9% | |||||||
(1) The book value was reduced by estimate selling costs of $0.5 million. See Note 11.
(2) The book value of the trade name assets as of December 31, 2015 includes additional amortization of $1.9 million recorded after the fair value measurement dates as of June 30, 2015 and September 30, 2015. See Note 11.
There were no assets or liabilities that were measured at fair value on a non-recurring basis as of December 31, 2016.
(18) Stockholders' Deficit
Shares outstanding
The following table sets forth the change in the number of shares of Class A common stock outstanding during the fiscal years ended December 31, 2016 and 2015:
December 31, | ||||||
2016 | 2015 | |||||
Shares outstanding as of beginning of period | 86.5 | 85.1 | ||||
Shares issued as part of equity-based compensation plans and the ESPP, net of shares surrendered | 1.5 | 1.4 | ||||
Shares outstanding as of end of period | 88.0 | 86.5 | ||||
Stock-based and other incentive compensation
Pursuant to our incentive stock plans we offer stock-based compensation in the form of stock options and RSUs to employees and our non-employee directors. The terms of the stock option and RSU awards, including the vesting schedule of such awards, are determined at our discretion subject to the terms of the applicable equity-based compensation plan. We also offered an ESPP through June 30, 2015, at which point in time the shares allocated to this plan were fully issued and the ESPP terminated in accordance with its terms. At the Annual Meeting, our stockholders approved the adoption of a new ESPP. The first offering period under the new ESPP commenced on January 1, 2017.
Options granted over the last several years have generally become exercisable in four equal installments beginning on the first anniversary of the date of grant with a maximum term of ten years or when certain performance targets are determined to have been met. RSUs typically vest in four equal installments beginning on the first anniversary of the date of grant or when certain performance targets are determined to have been met.
104
SCIENTIFIC GAMES CORPORATION AND SUBSIDIARIES
NOTES TO CONSOLIDATED FINANCIAL STATEMENTS
(amounts in USD, table amounts in millions, except per share amounts)
We recognize expense for stock-based compensation plans based on the estimated fair value of the related awards in accordance with ASC 718. Stock options are granted with exercise prices that are not less than the fair market value of our common stock on the date of grant. We periodically grant certain stock-based awards that are contingent upon SGC or certain of our subsidiaries achieving certain pre-determined financial performance targets. Upon determining that the performance target is probable, the fair value of the award is recognized over the service period. Determining the probability of achieving a performance target requires estimates and judgment.
On August 5, 2016, we announced that Kevin Sheehan succeeded M. Gavin Isaacs as President and Chief Executive Officer of the Company. On August 10, 2016, Mr. Sheehan received sign-on equity awards consisting of (a) 400,000 performance-conditioned restricted stock units that will vest based on achievement of specified performance conditions over a three-year period and (b) equity awards with a grant date value equal to approximately 250% of his base salary, prorated based on the number of days Mr. Sheehan will be employed in 2016, and consisting of (i) restricted stock units and stock options, each with a four-year vesting schedule and (ii) performance-conditioned stock options vesting over a four-year period. The remaining unamortized expense related to all unvested equity awards held by Mr. Isaacs as of December 31, 2016 was recognized during 2016.
As of December 31, 2016, we had approximately 21.3 million shares of common stock authorized for awards under the 2003 Plan (plus available shares from a pre-existing equity-based compensation plan). As of December 31, 2016, we had approximately 4.0 million shares available for future grants of equity awards under the 2003 Plan plus available shares from a pre-existing equity-based compensation plan (excluding shares underlying outstanding awards). We also have outstanding stock options and RSUs granted as part of inducement awards that were not approved by our stockholders, as permitted by applicable stock exchange rules.
Stock options
For the years ended December 31, 2016, 2015 and 2014, we recognized stock-based compensation expense of $6.4 million, $2.2 million and $2.2 million, respectively, related to the vesting of stock options. During 2016 we issued 1.5 million stock options with a weighted average exercise price $9.56 and a total grant date fair value of $7.2 million. At December 31, 2016, we had $5.1 million of unrecognized stock-based compensation expense relating to approximately 2.0 million unvested stock options that will be amortized over a weighted-average period of approximately two years and have an average remaining contract term of 8.9 years with a weighted average exercise price of $10.78. During the year ended December 31, 2016, we received $2.0 million in cash from the exercise of stock options.
Restricted stock units
A summary of the changes in RSUs outstanding under our equity-based compensation plans during 2016 is presented below:
Number of Restricted Stock Units | Weighted Average Grant Date Fair Value | ||||||
Unvested RSUs as of December 31, 2015 | 5.6 | $ | 13.05 | ||||
Granted | 2.1 | $ | 9.35 | ||||
Vested | (1.9 | ) | $ | 12.73 | |||
Cancelled | (0.9 | ) | $ | 12.63 | |||
Unvested RSUs as of December 31, 2016 | 4.9 | $ | 11.68 | ||||
The weighted-average grant date fair value of RSUs granted during 2016 and 2015 was $9.35 and $12.95, respectively. The fair value of each RSU grant is based on the market value of our common stock at the time of grant. During the years ended December 31, 2016, 2015 and 2014, we recognized stock-based compensation expense of $28.8 million, $22.9 million and $21.5 million, respectively, related to the vesting of RSUs. At December 31, 2016, we had $37.1 million of unrecognized stock-based compensation relating to unvested RSUs that will be amortized over a weighted-average period of approximately two years. The fair value at vesting date of RSUs vested during the years ended December 31, 2016, 2015 and 2014 was $24.2 million, $19.2 million and $35.2 million, respectively.
105
SCIENTIFIC GAMES CORPORATION AND SUBSIDIARIES
NOTES TO CONSOLIDATED FINANCIAL STATEMENTS
(amounts in USD, table amounts in millions, except per share amounts)
(19) Employee Benefit Plans
We have defined benefit pension plans for our U.K.-based union employees (the "U.K. Plan") and certain Canadian-based employees (the "Canadian Plan"). Collectively these two plans are referred to as the "Pension Plans". Retirement benefits under the U.K. Plan are generally based on an employee's average compensation over the two years preceding retirement. Retirement benefits under the Canadian Plan are generally based on the number of years of credited service. Our policy is to fund the minimum contribution permissible by the applicable authorities. We estimate that $2.6 million will be contributed to the Pension Plans in fiscal year 2017.
Our pension benefit costs are calculated using various actuarial assumptions and methodologies. These assumptions include discount rates, inflation, compensation increase rates, expected returns on plan assets, mortality rates and other factors. The assumptions used in recording the obligations under our plans represent our best estimates, and we believe that they are reasonable, based on information as to historical experience and performance as well as other factors that might cause future expectations to differ from past trends. Differences in actual experience or changes in assumptions may affect our pension obligations and future expense. The primary factors contributing to actuarial gains and losses each year are (1) changes in the discount rate used to value pension benefit obligations as of the measurement date and (2) differences between the expected and the actual return on plan assets.
The following table sets forth the combined funded status of the Pension Plans and their reconciliation to the related amounts recognized in our Consolidated Financial Statements at our December 31, 2016 and 2015 measurement dates:
106
SCIENTIFIC GAMES CORPORATION AND SUBSIDIARIES
NOTES TO CONSOLIDATED FINANCIAL STATEMENTS
(amounts in USD, table amounts in millions, except per share amounts)
December 31, | ||||||||
2016 | 2015 | |||||||
Change in benefit obligation: | ||||||||
Benefit obligation at beginning of year | $ | 115.1 | $ | 126.6 | ||||
Service cost | 2.2 | 2.5 | ||||||
Interest cost | 4.1 | 4.3 | ||||||
Participant contributions | 0.9 | 1.0 | ||||||
Curtailments | 0.2 | — | ||||||
Actuarial loss (gain) | 17.2 | (6.0 | ) | |||||
Benefits paid | (3.0 | ) | (2.1 | ) | ||||
Settlement payments | (3.8 | ) | — | |||||
Other, principally foreign exchange | (11.9 | ) | (11.2 | ) | ||||
Benefit obligation at end of year | $ | 121.0 | $ | 115.1 | ||||
Change in plan assets: | ||||||||
Fair value of plan assets at beginning of year | $ | 104.5 | $ | 106.4 | ||||
Actual gain on plan assets | 4.8 | 6.3 | ||||||
Employer contributions | 2.8 | 2.6 | ||||||
Participant contributions | 0.9 | 1.0 | ||||||
Benefits paid | (3.0 | ) | (2.1 | ) | ||||
Other, principally foreign exchange | (10.7 | ) | (9.7 | ) | ||||
Fair value of assets at end of year | $ | 99.3 | $ | 104.5 | ||||
Amounts recognized in the consolidated balance sheets: | ||||||||
Funded status (current) | $ | — | $ | — | ||||
Funded status (non-current) | (21.6 | ) | (10.5 | ) | ||||
Accumulated other comprehensive loss: | ||||||||
Unrecognized actuarial loss | 28.3 | 13.9 | ||||||
Unrecognized prior service cost | (3.7 | ) | (2.2 | ) | ||||
Deferred taxes | (4.9 | ) | (1.7 | ) | ||||
Net amount recognized | $ | (1.9 | ) | $ | (0.5 | ) | ||
The following table presents the components of our net periodic pension benefit cost:
Year Ended December 31, | ||||||||||||
2016 | 2015 | 2014 | ||||||||||
Components of net periodic pension benefit cost: | ||||||||||||
Service cost | $ | 2.2 | $ | 2.5 | $ | 2.2 | ||||||
Interest cost | 4.1 | 4.3 | 4.9 | |||||||||
Expected return on plan assets | (5.8 | ) | (5.9 | ) | (6.6 | ) | ||||||
Amortization of actuarial losses | 0.3 | 1.1 | 0.5 | |||||||||
Net periodic cost | $ | 0.8 | $ | 2.0 | $ | 1.0 | ||||||
The accumulated benefit obligation for the Pension Plans was $127.0 million and $115.0 million as of December 31, 2016 and 2015, respectively. The underfunded status of the Pension Plans recorded as a long-term liability in our Consolidated Balance Sheets as of December 31, 2016 and 2015 was $21.6 million and $10.5 million, respectively.
The amounts included in accumulated other comprehensive (loss) income as of December 31, 2016 expected to be recognized as components of net periodic pension benefit cost during the fiscal year ending December 31, 2017 are presented below:
107
SCIENTIFIC GAMES CORPORATION AND SUBSIDIARIES
NOTES TO CONSOLIDATED FINANCIAL STATEMENTS
(amounts in USD, table amounts in millions, except per share amounts)
Unrecognized loss | $ | 1.7 | ||
Unrecognized prior service cost | (0.4 | ) | ||
Net amount expected to be recognized | $ | 1.3 | ||
The U.K. Plan is closed to new participants and pensionable earnings used to calculate retirement benefits are limited to a 2% annual increase while the plan is less than 100% funded.
The investment policy is to maximize long-term financial return commensurate with security and minimizing risk. This is achieved by holding a portfolio of marketable investments that avoids over-concentration of investment and spreads assets both over industries and geographies. In setting investment strategy, the Company considered the lowest risk strategy that it could adopt in relation to the plan's liabilities and designed the asset allocation to achieve a higher return while maintaining a cautious approach to meeting the plan's liabilities. The Company considered a full range of asset classes, the risks and rewards of a range of alternative asset allocation strategies, the suitability of each asset class and the need for appropriate diversification.
The current strategy in the U.K. Plan is to hold approximately 28% in a global return fund, approximately 23% in U.K. equities, approximately 19% in real estate, approximately 19% in non-U.K. equities and approximately 11% in corporate bonds. The current strategy in the Canadian Plan is to hold approximately 20% in Canadian equities, approximately 40% in non-Canadian equities and approximately 40% in bonds.
The fair value of the Plan assets for the Pension Plans at December 31, 2016 by asset category is presented below:
Asset Category | Market Value at December 31, 2016 | Quoted Prices in Active Markets for Identical Assets (Level 1) | Significant Observable Inputs (Level 2) | Significant Unobservable Inputs (Level 3) | ||||||||||||
Equity securities (a) | $ | 50.1 | $ | 26.2 | $ | 23.9 | $ | — | ||||||||
Global return fund (a) | 15.7 | — | 15.7 | — | ||||||||||||
Corporate bonds (a) | 11.4 | — | 11.4 | — | ||||||||||||
Government bonds | 9.0 | — | 9.0 | — | ||||||||||||
Real estate | 10.9 | — | — | 10.9 | ||||||||||||
Cash and Other short-term investments (b)(c) | 2.2 | 2.2 | — | — | ||||||||||||
Total pension assets | $ | 99.3 | $ | 28.4 | $ | 60.0 | $ | 10.9 | ||||||||
(a) | The assets are invested through managed funds that are valued using inputs derived principally from quoted prices in active markets for the underlying assets in the fund. |
(b) | Other short-term investments are investments in pooled money market funds that are valued using inputs derived principally from the quoted prices in active markets for the underlying assets in the pool. |
(c) | The carrying value of cash and cash equivalents approximates fair value because of the short-term maturity of these instruments. |
The fair value of the Plan assets for both of these Plans at December 31, 2015 by asset category is presented below:
108
SCIENTIFIC GAMES CORPORATION AND SUBSIDIARIES
NOTES TO CONSOLIDATED FINANCIAL STATEMENTS
(amounts in USD, table amounts in millions, except per share amounts)
Asset Category | Market Value at December 31, 2015 | Quoted Prices in Active Markets for Identical Assets (Level 1) | Significant Observable Inputs (Level 2) | Significant Unobservable Inputs (Level 3) | ||||||||||||
Equity securities (a) | $ | 51.3 | $ | 24.4 | $ | 26.9 | $ | — | ||||||||
Global return fund (a) | 19.3 | — | 19.3 | — | ||||||||||||
Corporate bonds (a) | 13.7 | — | 13.7 | — | ||||||||||||
Government bonds | 5.7 | — | 5.7 | — | ||||||||||||
Real estate | 12.9 | — | — | 12.9 | ||||||||||||
Cash and Other short-term investments (b)(c) | 1.6 | 1.6 | — | — | ||||||||||||
Total pension assets | $ | 104.5 | $ | 26.0 | $ | 65.6 | $ | 12.9 | ||||||||
(a) | The assets are invested through managed funds that are valued using inputs derived principally from quoted prices in active markets for the underlying assets in the fund. |
(b) | Other short-term investments are investments in pooled money market funds that are valued using inputs derived principally from the quoted prices in active markets for the underlying assets in the pool. |
(c) | The carrying value of cash and cash equivalents approximates fair value because of the short-term maturity of these instruments. |
The change in fair value of the Pension Plan assets valued using significant unobservable inputs (Level 3) is presented below:
2016 | 2015 | ||||||
Significant unobservable inputs (Level 3), beginning of period | $ | 12.9 | $ | 12.5 | |||
Unrealized gain (loss) on asset still held | (2.0 | ) | 0.4 | ||||
Significant unobservable inputs (Level 3), end of period | $ | 10.9 | $ | 12.9 | |||
The table below presents the weighted-average actuarial assumptions used to determine the benefit obligation and net periodic benefit cost for the Pension Plans.
U.K. Plan | Canadian Plan | |||||||||||||||||
2016 | 2015 | 2014 | 2016 | 2015 | 2014 | |||||||||||||
Discount rates: | ||||||||||||||||||
Benefit obligation | 2.80 | % | 4.00 | % | 3.70 | % | 4.00 | % | 4.15 | % | 4.00 | % | ||||||
Net periodic pension cost | 4.00 | % | 3.65 | % | 4.40 | % | 4.15 | % | 4.00 | % | 5.00 | % | ||||||
Rate of compensation increase | 1.00 | % | 2.00 | % | 2.00 | % | 3.00 | % | 3.00 | % | 3.00 | % | ||||||
Expected return on assets | 5.70 | % | 6.30 | % | 7.50 | % | 6.25 | % | 6.25 | % | 6.50 | % | ||||||
The overall expected long-term rate of return on assets assumption for the U.K. Plan has been determined as a weighted-average of the expected returns on the above asset classes for the U.K. Plan. The expected return on bonds is taken as the current redemption yield on the appropriate index. The expected return on equities and property is determined by assuming a measure of outperformance over the gilt-yield. The expected return on cash is related to the Bank of England base rate. Returns so determined are reduced to allow for investment manager expenses.
The overall expected long-term rate of return on assets assumption for the Canadian Plan has been determined by consideration of the current level of expected returns on risk-free investments (primarily government bonds), the historical level of the risk premium associated with the other asset classes in which the portfolio is invested and the expectations for future returns of each asset class based on our active management of certain portfolio classes.
We expect benefit payments between $2.3 million and $3.6 million annually, which reflect expected future service, for each of the next five years. Additionally, we expect benefit payments of $24.0 million for benefit payments during the five years from 2022 - 2026.
109
SCIENTIFIC GAMES CORPORATION AND SUBSIDIARIES
NOTES TO CONSOLIDATED FINANCIAL STATEMENTS
(amounts in USD, table amounts in millions, except per share amounts)
U.S. plan
We have a 401(k) plan for U.S.-based employees. Those employees who participate in our 401(k) plan are eligible to receive matching contributions from us for the first 6% of participant contributions. We match contributions of 35.0% of any participant's contributions, up to the first 6% of their compensation (as defined in the plan document). Contribution expense for the years ended December 31, 2016, 2015 and 2014 amounted to $10.7 million, $6.8 million and $2.1 million, respectively.
(20) Accumulated Other Comprehensive (Loss) Income
The accumulated balances for each classification of comprehensive (loss) income are presented below:
Foreign Currency Items | Derivative Financial Instruments (1) | Unrecognized pension benefit costs, net of taxes (2) | Accumulated Other Comprehensive (Loss) Income | |||||||||||||
Balance at January 1, 2014 | $ | 28.0 | $ | (1.4 | ) | $ | (8.3 | ) | $ | 18.3 | ||||||
Change during period | (97.4 | ) | (6.6 | ) | (8.5 | ) | (112.5 | ) | ||||||||
Reclassified into operations | — | — | (0.2 | ) | (0.2 | ) | ||||||||||
Balance at December 31, 2014 | $ | (69.4 | ) | $ | (8.0 | ) | $ | (17.0 | ) | $ | (94.4 | ) | ||||
Change during period | (136.2 | ) | (3.8 | ) | 5.9 | (134.1 | ) | |||||||||
Reclassified into operations | — | 5.2 | 1.1 | 6.3 | ||||||||||||
Balance at December 31, 2015 | $ | (205.6 | ) | $ | (6.6 | ) | $ | (10.0 | ) | $ | (222.2 | ) | ||||
Change during period | (104.7 | ) | (5.2 | ) | (10.0 | ) | (119.9 | ) | ||||||||
Reclassified into operations | — | 8.2 | 0.3 | 8.5 | ||||||||||||
Balance at December 31, 2016 | $ | (310.3 | ) | $ | (3.6 | ) | $ | (19.7 | ) | $ | (333.6 | ) | ||||
_______________________________________________________________________________
(1) | The change during the period is net of income taxes of $(2.0) million, $4.6 million and $0.0 million in 2016, 2015 and 2014, respectively. |
(2) | The change during the period is net of income taxes of $(3.2) million, $(2.1) million and $(2.6) million in 2016, 2015 and 2014, respectively. |
(21) Income Taxes
Income taxes are determined using the liability method of accounting for income taxes, under which deferred tax assets and liabilities are recognized for the expected future tax consequences of temporary differences between the financial reporting and tax basis of assets and liabilities. If, based upon all available evidence, both positive and negative, it is more likely than not such deferred tax assets will not be realized, a valuation allowance is recorded.
Management assessed the available positive and negative evidence to estimate whether sufficient future taxable income will be generated to permit use of existing deferred tax assets. A significant piece of objective negative evidence evaluated was the cumulative loss incurred over the three-year period ended December 31, 2016. Such objective evidence limits the ability to consider other subjective evidence, such as our projections for future growth. On the basis of this evaluation, as of December 31, 2016, a valuation allowance of $119.0 million has been recorded to recognize only the portion of the deferred tax assets that are more likely than not to be realized. The amount of the deferred tax assets considered realizable, however, could be adjusted if estimates of future taxable income during the carryforward period are reduced or increased or if objective negative evidence in the form of cumulative losses is no longer present and additional weight is given to subjective evidence such as projections for future growth.
We apply a recognition threshold and measurement attribute related to uncertain tax positions taken or expected to be taken on our tax returns. We recognize a tax benefit for financial reporting of an uncertain income tax position when it has a greater than 50% likelihood of being sustained upon examination by the taxing authorities. We measure the tax benefit of an uncertain tax position based on the largest benefit that has a greater than 50% likelihood of being ultimately realized including evaluation of settlements.
The components of net loss before income taxes are presented below:
110
SCIENTIFIC GAMES CORPORATION AND SUBSIDIARIES
NOTES TO CONSOLIDATED FINANCIAL STATEMENTS
(amounts in USD, table amounts in millions, except per share amounts)
Year Ended December 31, | ||||||||||||
2016 | 2015 | 2014 | ||||||||||
United States | $ | (563.7 | ) | $ | (1,662.5 | ) | $ | (595.1 | ) | |||
Foreign | 85.0 | (31.7 | ) | 100.2 | ||||||||
Net loss before income tax benefit | $ | (478.7 | ) | $ | (1,694.2 | ) | $ | (494.9 | ) | |||
The components of income tax benefit are presented below:
Year Ended December 31, | ||||||||||||
2016 | 2015 | 2014 | ||||||||||
Current | ||||||||||||
U.S. Federal | $ | 10.2 | $ | (24.6 | ) | $ | (14.4 | ) | ||||
U.S. State | (0.3 | ) | (0.8 | ) | 0.3 | |||||||
Foreign | 32.0 | 36.4 | 17.8 | |||||||||
Total | 41.9 | 11.0 | 3.7 | |||||||||
Deferred | ||||||||||||
U.S. Federal | (129.5 | ) | (287.4 | ) | (234.6 | ) | ||||||
U.S. State | (8.5 | ) | (22.0 | ) | (21.2 | ) | ||||||
Foreign | (28.9 | ) | (1.5 | ) | (8.5 | ) | ||||||
Total | (166.9 | ) | (310.9 | ) | (264.3 | ) | ||||||
Total income tax benefit | $ | (125.0 | ) | $ | (299.9 | ) | $ | (260.6 | ) | |||
The reconciliation of the U.S. federal statutory tax rate to the actual tax rate is presented below:
Year Ended December 31, | |||||||||
2016 | 2015 | 2014 | |||||||
Statutory U.S. federal income tax rate | 35.0 | % | 35.0 | % | 35.0 | % | |||
U.S. state income taxes, net of federal benefit | (0.4 | )% | 1.4 | % | 4.3 | % | |||
Foreign earnings at lower rates than U.S. federal rate | (1.5 | )% | 0.2 | % | (0.5 | )% | |||
Impact of goodwill impairments | (0.1 | )% | (19.4 | )% | — | % | |||
Valuation allowance adjustments | (6.5 | )% | 0.7 | % | 13.2 | % | |||
Other | (0.4 | )% | (0.2 | )% | 0.6 | % | |||
Effective income tax rate | 26.1 | % | 17.7 | % | 52.6 | % | |||
The Company’s 2016 effective tax rate was impacted by the recording of valuation allowances totaling $37.1 million against domestic (federal and state) net deferred tax assets. The Company’s 2015 effective tax rate was impacted by the SG Gaming reporting unit goodwill impairment of $935.0 million for which there was no associated tax benefit.
Deferred income taxes reflect the net tax effects of temporary differences between the carrying values of assets and liabilities for financial reporting purposes and the amounts used for income tax purposes. The deferred income tax balances are established using the enacted statutory tax rates and are adjusted for changes in such rates in the period of change.
111
SCIENTIFIC GAMES CORPORATION AND SUBSIDIARIES
NOTES TO CONSOLIDATED FINANCIAL STATEMENTS
(amounts in USD, table amounts in millions, except per share amounts)
As of December 31, | ||||||||
2016 | 2015 | |||||||
Deferred tax assets: | ||||||||
Inventory valuation | $ | 23.4 | $ | 17.6 | ||||
Reserves and other accrued expenses | 59.8 | 61.4 | ||||||
Net operating loss carry forwards | 530.4 | 494.6 | ||||||
Tax credit carry forwards | 44.5 | 45.0 | ||||||
Valuation allowance | (119.0 | ) | (95.6 | ) | ||||
Other | 36.6 | 19.4 | ||||||
Realizable deferred tax assets | 575.7 | 542.4 | ||||||
Deferred tax liabilities: | ||||||||
Deferred costs and prepaid expenses | (29.8 | ) | (31.9 | ) | ||||
Differences in financial reporting and tax basis for: | ||||||||
Property and equipment | 5.6 | (8.2 | ) | |||||
Identifiable intangible assets | (597.1 | ) | (709.8 | ) | ||||
Total deferred tax liabilities | (621.3 | ) | (749.9 | ) | ||||
Net deferred tax liabilities on balance sheet | (45.6 | ) | (207.5 | ) | ||||
Reported As: | ||||||||
Non-current deferred tax assets | 24.6 | 20.7 | ||||||
Non-current deferred tax liabilities | (70.2 | ) | (228.2 | ) | ||||
Net deferred tax liabilities on the balance sheet | $ | (45.6 | ) | $ | (207.5 | ) | ||
At December 31, 2016, we had the following NOL carry forwards (tax-effected) and foreign tax credit carry forwards:
December 31, 2016 | |||||||||||
Federal | State | Foreign | |||||||||
NOL carry forwards | $ | 428.8 | $ | 62.1 | $ | 46.6 | |||||
FTC, R&D, AMT carry forwards | 43.6 | 2.3 | — | ||||||||
The Federal and state tax loss carryforwards will expire through 2037. The foreign NOL carryforwards can be carried forward for periods that vary from ten years to indefinitely. Foreign tax credit carryforwards will expire through 2025, R&D tax credit carryforwards will expire through 2036, alternative minimum tax credit carryforwards can be carried forward indefinitely and state tax credits expire through 2023.
At December 31, 2016 and 2015, we had the following valuation allowances:
December 31, | ||||||||
2016 | 2015 | |||||||
Federal | $ | 27.3 | $ | — | ||||
State | 41.3 | 34.1 | ||||||
FTC | 12.7 | 12.7 | ||||||
Foreign | 37.7 | 48.8 | ||||||
Our financial statements reflect the tax liability associated with the repatriation of foreign earnings of certain foreign subsidiaries in which the Company does not intend to be indefinitely reinvested outside the U.S. The estimated cumulative amount of earnings from foreign subsidiaries that have been indefinitely reinvested outside of the U.S. was $606.9 million as of December 31, 2016. The determination of the potential net tax liability on repatriations of such amount is not practicable due to
112
SCIENTIFIC GAMES CORPORATION AND SUBSIDIARIES
NOTES TO CONSOLIDATED FINANCIAL STATEMENTS
(amounts in USD, table amounts in millions, except per share amounts)
the complexities of the hypothetical calculation. Substantially all of our current year foreign cash flows are not intended to be indefinitely reinvested offshore, and therefore the tax effects of repatriation of such cash flows are provided for in our financial reporting. As of December 31, 2016, and 2015, $75.0 million and $80.8 million, respectively, of our cash and cash equivalents were held by foreign subsidiaries. Amounts held by foreign subsidiaries are generally subject to US taxation on repatriation.
Unrecognized Tax Benefits
We apply a recognition threshold and measurement attribute related to uncertain tax positions taken or expected to be taken on our tax returns. We recognize a tax benefit for financial reporting of an uncertain income tax position when it has a greater than 50% likelihood of being sustained upon examination by the taxing authorities. We measure the tax benefit of an uncertain tax position based on the largest benefit that has a greater than 50% likelihood of being ultimately realized including evaluation of settlements. The total amount of unrecognized tax benefits as of December 31, 2016 was $27.4 million. Of this amount, $27.4 million, if recognized, would be included in our Consolidated Statements of Operations and Comprehensive Loss and have an impact on our effective tax rate. SGC does not anticipate a material change of its liability for unrecognized tax benefits before December 31, 2017.
We recognize interest and penalties for unrecognized tax benefits in income tax expense. The amount recognized for interest and penalties during the years ended December 31, 2016, 2015 and 2014 was not material. We had $1.0 million and $0.8 million for the payment of interest and penalties accrued at December 31, 2016 and 2015, respectively.
We file income tax returns in the U.S. federal and various states, local, and foreign jurisdictions. We are currently under examination by the IRS for years 2013 and 2014. There are no material state, local, or non-U.S. income tax examinations for years prior to 2013.
SGC had the following activity for unrecognized tax benefits:
Year Ended December 31, | ||||||||||||
2016 | 2015 | 2014 | ||||||||||
Balance at beginning of period | $ | 10.8 | $ | 13.9 | $ | 8.1 | ||||||
Tax positions related to current year additions | 8.4 | 2.0 | 0.5 | |||||||||
Additions for tax positions of prior years | 9.7 | 2.4 | — | |||||||||
Tax positions related to prior years reductions | (0.3 | ) | (3.0 | ) | (3.5 | ) | ||||||
Reductions due to lapse of statute of limitations on tax positions | (0.4 | ) | (0.1 | ) | — | |||||||
Current year business combinations | — | — | 9.8 | |||||||||
Settlements | (0.8 | ) | (4.4 | ) | (1.0 | ) | ||||||
Balance at end of period | $ | 27.4 | $ | 10.8 | $ | 13.9 | ||||||
(22) Litigation
The Company is involved in various legal proceedings, including those discussed below. We record an accrual for legal contingencies when it is both probable that a liability has been incurred and the amount or range of the loss can be reasonably estimated (although, as discussed below, there may be an exposure to loss in excess of the accrued liability). We evaluate our accruals for legal contingencies at least quarterly and, as appropriate, establish new accruals or adjust existing accruals to reflect (1) the facts and circumstances known to us at the time, including information regarding negotiations, settlements, rulings and other relevant events and developments, (2) the advice and analyses of counsel and (3) the assumptions and judgment of management. Legal costs associated with our legal proceedings are expensed as incurred. We had accrued liabilities of $7.7 million and $16.4 million for all of our legal matters that were contingencies as of December 31, 2016 and 2015, respectively.
Substantially all of our legal contingencies are subject to significant uncertainties and, therefore, determining the likelihood of a loss and/or the measurement of any loss involves a series of complex judgments about future events. Consequently, the ultimate outcomes of our legal contingencies could result in losses in excess of amounts we have accrued. We may be unable to estimate a range of possible losses for some matters pending against the Company or its subsidiaries, even when the amount of damages claimed against the Company or its subsidiaries is stated because, among other things: (1) the claimed amount may be exaggerated or unsupported; (2) the claim may be based on a novel legal theory or involve a large
113
SCIENTIFIC GAMES CORPORATION AND SUBSIDIARIES
NOTES TO CONSOLIDATED FINANCIAL STATEMENTS
(amounts in USD, table amounts in millions, except per share amounts)
number of parties; (3) there may be uncertainty as to the likelihood of a class being certified or the ultimate size of the class; (4) there may be uncertainty as to the outcome of pending appeals or motions; (5) the matter may not have progressed sufficiently through discovery or there may be significant factual or legal issues to be resolved or developed; and/or (6) there may be uncertainty as to the enforceability of legal judgments and outcomes in certain jurisdictions. Other matters have progressed sufficiently that we are able to estimate a range of possible loss. For those legal contingencies disclosed below, as well as those related to the previously disclosed settlement agreement entered into in February 2015 with SNAI S.p.a., as to which a loss is reasonably possible, whether in excess of a related accrued liability or where there is no accrued liability, and for which we are able to estimate a range of possible loss, the current estimated range is up to approximately $12.5 million in excess of the accrued liabilities (if any) related to those legal contingencies. This aggregate range represents management’s estimate of additional possible loss in excess of the accrued liabilities (if any) with respect to these matters based on currently available information, including any damages claimed by the plaintiffs, and is subject to significant judgment and a variety of assumptions and inherent uncertainties. For example, at the time of making an estimate, management may have only preliminary, incomplete, or inaccurate information about the facts underlying a claim; its assumptions about the future rulings of the court or other tribunal on significant issues, or the behavior and incentives of adverse parties, regulators, indemnitors or co‑defendants, may prove to be wrong; and the outcomes it is attempting to predict are often not amenable to the use of statistical or other quantitative analytical tools. In addition, from time to time an outcome may occur that management had not accounted for in its estimate because it had considered that outcome to be remote. Furthermore, as noted above, the aggregate range does not include any matters for which the Company is not able to estimate a range of possible loss. Accordingly, the estimated aggregate range of possible loss does not represent our maximum loss exposure. Any such losses could have a material adverse impact on our results of operations, cash flows or financial condition. The legal proceedings underlying the estimated range will change from time to time, and actual results may vary significantly from the current estimate.
Colombia litigation
Our subsidiary, SGI, owned a minority interest in Wintech de Colombia S.A., or Wintech (now liquidated), which formerly operated the Colombian national lottery under a contract with Empresa Colombiana de Recursos para la Salud, S.A. (together with its successors, "Ecosalud"), an agency of the Colombian government. The contract provided for a penalty against Wintech, SGI and the other shareholders of Wintech of up to $5.0 million if certain levels of lottery sales were not achieved. In addition, SGI delivered to Ecosalud a $4.0 million surety bond as a further guarantee of performance under the contract. Wintech started the instant lottery in Colombia but, due to difficulties beyond its control, including, among other factors, social and political unrest in Colombia, frequently interrupted telephone service and power outages, and competition from another lottery being operated in a province of Colombia that we believe was in violation of Wintech’s exclusive license from Ecosalud, the projected sales level was not met for the year ended June 30, 1993.
In 1993, Ecosalud issued a resolution declaring that the contract was in default. In 1994, Ecosalud issued a liquidation resolution asserting claims for compensation and damages against Wintech, SGI and other shareholders of Wintech for, among other things, realization of the full amount of the penalty, plus interest, and the amount of the bond. SGI filed separate actions opposing each resolution with the Tribunal Contencioso of Cundinamarca in Colombia (the "Tribunal"), which upheld both resolutions. SGI appealed each decision to the Council of State. In May 2012, the Council of State upheld the contract default resolution, which decision was notified to us in August 2012. In October 2013, the Council of State upheld the liquidation resolution, which decision was notified to us in December 2013.
In July 1996, Ecosalud filed a lawsuit against SGI in the U.S. District Court for the Northern District of Georgia asserting many of the same claims asserted in the Colombia proceedings, including breach of contract, and seeking damages. In March 1997, the District Court dismissed Ecosalud’s claims. Ecosalud appealed the decision to the U.S. Court of Appeals for the Eleventh Circuit. The Court of Appeals affirmed the District Court’s decision in 1998.
In June 1999, Ecosalud filed a collection proceeding against SGI to enforce the liquidation resolution and recover the claimed damages. In May 2013, the Tribunal denied SGI’s merit defenses to the collection proceeding and issued an order of payment of approximately 90 billion Colombian pesos, or approximately $29.9 million, plus default interest (potentially accrued since 1994 at a 12% statutory interest rate). SGI has filed an appeal to the Council of State, which appeal has stayed the payment order.
SGI believes it has various defenses, including on the merits, against Ecosalud’s claims. Although we believe these claims will not result in a material adverse effect on our consolidated results of operations, cash flows or financial position, it is
114
SCIENTIFIC GAMES CORPORATION AND SUBSIDIARIES
NOTES TO CONSOLIDATED FINANCIAL STATEMENTS
(amounts in USD, table amounts in millions, except per share amounts)
not feasible to predict the final outcome, and we cannot assure that these claims will not ultimately be resolved adversely to us or result in material liability.
SNAI litigation
On April 16, 2012, certain VLTs operated by SNAI S.p.a. ("SNAI") in Italy and supplied by Barcrest erroneously printed what appeared to be winning jackpot and other tickets with a face amount in excess of €400.0 million. SNAI has stated, and system data confirms, that no jackpots were actually won on that day. The terminals were deactivated by the Italian regulatory authority. Following the incident, we understand that the Italian regulatory authority revoked the certification of the version of the gaming system that Barcrest provided to SNAI and fined SNAI €1.5 million, but determined to not revoke SNAI’s concession to operate VLTs in Italy.
In October 2012, SNAI filed a lawsuit in the Court of First Instance of Rome in Italy against Barcrest and Global Draw, our subsidiary which acquired Barcrest from IGT‑UK Group Limited, a subsidiary of IGT, claiming liability based on breach of contract and tort. The lawsuit sought to terminate SNAI’s agreement with Barcrest and damages arising from the deactivation of the terminals, including among other things, lost profits, expenses and costs, potential awards to players who have sought to enforce what appeared to be winning jackpot and other tickets, compensation for lost profits sought by managers of the gaming locations where SNAI VLTs supplied by Barcrest were installed, damages to commercial reputation and any future damages arising from SNAI’s potential loss of its concession or inability to obtain a new concession.
In September 2013, Global Draw brought an action against IGT‑UK Group Limited and IGT in the High Court of Justice (Commercial Court) in London, England seeking indemnification for liability arising out of the April 2012 incident under the agreement pursuant to which Barcrest was acquired from IGT‑UK Group and addressing other ancillary matters. The action against IGT was resolved in May 2015, pursuant to a settlement agreement in which neither party admitted liability. The settlement did not have a material impact on our results of operations.
In February 2015, we entered into a settlement agreement with SNAI that provides, among other things, for us to make a €25.0 million upfront payment to SNAI, which payment was made in February 2015, and to indemnify SNAI against certain potential future losses. In connection with the settlement, the parties’ pending claims in the Court of First Instance of Rome were dismissed on February 19, 2015.
In May 2015, certain underwriters at Lloyd’s of London filed a complaint against the Company, Barcrest and Global Draw in the Supreme Court of the State of New York seeking a declaratory judgment that such underwriters do not owe insurance coverage for the matters that are the subject of the settlement agreement with SNAI. In May 2015, the Company filed its counterclaims and also filed a third-party complaint against three excess insurers. In June 2015, the plaintiffs filed a motion to dismiss the counterclaims. The excess insurers filed a similar motion to dismiss in July 2015. In June 2016, we entered into a settlement agreement with the underwriters and excess insurers, pursuant to which the Supreme Court of the State of New York dismissed the lawsuit with prejudice in July 2016.
Oregon State Lottery matter
On December 31, 2014, a representative of a purported class of persons alleged to have been financially harmed by relying on the "auto hold" feature of various manufacturers' video lottery terminals played in Oregon, filed suit in the Circuit Court of Multnomah County, Oregon, against the Oregon State Lottery and various manufacturers, including WMS Gaming Inc. The suit alleges that the auto hold feature of video poker games is perceived by players as providing the best possible playing strategy that will maximize the odds of the player winning, when such auto hold feature does not maximize the players' odds of winning. The plaintiffs are seeking in excess of $134.0 million in monetary damages.
In April 2015, the court granted the Oregon State Lottery’s motion to dismiss, stating the plaintiffs had not satisfied the Oregon Tort Claims Act. As a result of the dismissal, the court indicated that all claims against WMS Gaming Inc. were moot. In June 2015, plaintiffs filed an appeal and in August 2016 oral arguments were held on the appeal. The parties are awaiting the court's ruling.
We intend to vigorously defend against the claims asserted in the lawsuit.
Shuffle Tech matter
In April 2015, Shuffle Tech International, LLC, Aces Up Gaming, Inc. and Poydras-Talrick Holdings LLC brought a civil action in the United States District Court for the Northern District of Illinois against the Company, Bally Technologies, Inc. and Bally Gaming, Inc., alleging monopolization of the market for card shufflers in violation of federal antitrust laws,
115
SCIENTIFIC GAMES CORPORATION AND SUBSIDIARIES
NOTES TO CONSOLIDATED FINANCIAL STATEMENTS
(amounts in USD, table amounts in millions, except per share amounts)
fraudulent procurement of patents on card shufflers, unfair competition and deceptive trade practices. Specifically, the plaintiffs claim that the defendants used certain shuffler patents in a predatory manner to create and maintain a monopoly in the relevant shuffler market. The plaintiffs seek no less than $100.0 million in compensatory damages; treble damages; and injunctive and declaratory relief. In June 2015, the defendants filed a motion to dismiss. In October 2015, the court dismissed all of the plaintiffs’ claims against Bally Technologies, Inc. and Bally Gaming, Inc. with prejudice, except for the claims of violation of antitrust laws related to the fraudulent procurement of patents on card shufflers. We intend to vigorously defend against the claims asserted in the lawsuit.
(23) Financial Information for Guarantor Subsidiaries and Non-Guarantor Subsidiaries
We conduct substantially all of our business through our U.S. and foreign subsidiaries. As of December 31, 2016, SGI's obligations under the 2020 Notes, the 2021 Notes, the Secured Notes and the Unsecured Notes were fully and unconditionally and jointly and severally guaranteed by SGC and the Guarantor Subsidiaries other than SGI. As of December 31, 2016, our 2018 Notes, which were issued by SGC, were fully and unconditionally and jointly and severally guaranteed by the Guarantor Subsidiaries. The guarantees of our 2018 Notes, 2020 Notes, 2021 Notes, Secured Notes and Unsecured Notes will terminate under the following customary circumstances: (1) the sale or disposition of the capital stock of the guarantor (including by consolidation or merger of the guarantor into another person); (2) the liquidation or dissolution of the guarantor; (3) the defeasance or satisfaction and discharge of the notes; (4) the release of the guarantor from any guarantees of indebtedness of SGC and SGI (or, in the case of the 2018 Notes, the release of the guarantor from any guarantees of indebtedness of SGC); and (5) in the case of the 2020 Notes, the 2021 Notes and the Secured Notes and the Unsecured Notes, the proper designation of the guarantor as an unrestricted subsidiary pursuant to the indenture governing the respective Notes.
Presented below is condensed consolidating financial information for (1) SGC, (2) SGI, (3) the Guarantor Subsidiaries and (4) the Non-Guarantor Subsidiaries as of December 31, 2016 and December 31, 2015 and for the years ended December 31, 2016, 2015 and 2014. The condensed consolidating financial information has been presented to show the nature of assets held, results of operations and cash flows of SGC, SGI, the Guarantor Subsidiaries and the Non-Guarantor Subsidiaries assuming the current guarantee structures of the 2018 Notes, the 2020 Notes, the 2021 Notes, the Secured Notes and the Unsecured Notes were in effect at the beginning of the periods presented.
The condensed consolidating financial information reflects the investments of SGC in SGI and in the Guarantor Subsidiaries and Non-Guarantor Subsidiaries using the equity method of accounting. They also reflect the investments of the Guarantor Subsidiaries in the Non-Guarantor Subsidiaries. Net changes in intercompany due from/due to accounts are reported in the accompanying Supplemental Condensed Consolidating Statements of Cash Flows as investing activities if the applicable entities have a net investment (asset) in intercompany accounts and as a financing activity if the applicable entities have a net intercompany borrowing (liability) balance.
116
SCIENTIFIC GAMES CORPORATION AND SUBSIDIARIES
NOTES TO CONSOLIDATED FINANCIAL STATEMENTS
(amounts in USD, table amounts in millions, except per share amounts)
SUPPLEMENTAL CONDENSED CONSOLIDATING BALANCE SHEET
December 31, 2016
SGC (Parent and Issuer1) | SGI (Issuer2) | Guarantor Subsidiaries | Non-Guarantor Subsidiaries | Eliminating Entries | Consolidated | |||||||||||||||||||
Assets | ||||||||||||||||||||||||
Cash and cash equivalents | $ | 32.7 | $ | 1.7 | $ | — | $ | 81.8 | $ | (1.1 | ) | $ | 115.1 | |||||||||||
Restricted cash | — | — | 24.6 | 0.1 | — | 24.7 | ||||||||||||||||||
Accounts receivable, net | — | 61.4 | 199.2 | 234.4 | — | 495.0 | ||||||||||||||||||
Notes receivable, net | — | — | 94.4 | 31.0 | — | 125.4 | ||||||||||||||||||
Inventories | — | 40.3 | 83.1 | 138.1 | (19.2 | ) | 242.3 | |||||||||||||||||
Prepaid expenses, deposits and other current assets | 11.6 | 15.7 | 45.6 | 41.2 | — | 114.1 | ||||||||||||||||||
Property and equipment, net | 5.6 | 98.4 | 369.3 | 154.9 | (16.0 | ) | 612.2 | |||||||||||||||||
Investment in subsidiaries | 3,000.7 | 926.7 | 944.0 | — | (4,871.4 | ) | — | |||||||||||||||||
Goodwill | — | 188.3 | 1,931.6 | 768.5 | — | 2,888.4 | ||||||||||||||||||
Intangible assets, net | 185.8 | 37.5 | 1,343.0 | 202.0 | — | 1,768.3 | ||||||||||||||||||
Intercompany balances | — | 5,415.1 | — | 116.6 | (5,531.7 | ) | — | |||||||||||||||||
Software, net | 74.7 | 21.4 | 264.6 | 48.4 | — | 409.1 | ||||||||||||||||||
Other assets | 233.6 | 236.5 | 50.8 | 173.5 | (401.6 | ) | 292.8 | |||||||||||||||||
Total assets | $ | 3,544.7 | $ | 7,043.0 | $ | 5,350.2 | $ | 1,990.5 | $ | (10,841.0 | ) | $ | 7,087.4 | |||||||||||
Liabilities and stockholders’ (deficit) equity | ||||||||||||||||||||||||
Current portion of long-term debt | $ | — | $ | 43.0 | $ | — | $ | 6.3 | $ | — | $ | 49.3 | ||||||||||||
Other current liabilities | 100.5 | 158.7 | 216.3 | 168.7 | (1.1 | ) | 643.1 | |||||||||||||||||
Long-term debt, excluding current portion | 248.7 | 7,767.3 | — | 8.9 | — | 8,024.9 | ||||||||||||||||||
Other long-term liabilities | 159.0 | 12.4 | 468.8 | 67.2 | (401.6 | ) | 305.8 | |||||||||||||||||
Intercompany balances | 4,972.2 | — | 559.5 | — | (5,531.7 | ) | — | |||||||||||||||||
Stockholders’ (deficit) equity | (1,935.7 | ) | (938.4 | ) | 4,105.6 | 1,739.4 | (4,906.6 | ) | (1,935.7 | ) | ||||||||||||||
Total liabilities and stockholders’ (deficit) equity | $ | 3,544.7 | $ | 7,043.0 | $ | 5,350.2 | $ | 1,990.5 | $ | (10,841.0 | ) | $ | 7,087.4 | |||||||||||
1 - Issuer of obligations under the 2018 Notes.
2 - Issuer of obligations under the 2020 Notes, the 2021 Notes, the Secured Notes and the Unsecured Notes.
117
SCIENTIFIC GAMES CORPORATION AND SUBSIDIARIES
NOTES TO CONSOLIDATED FINANCIAL STATEMENTS
(amounts in USD, table amounts in millions, except per share amounts)
SUPPLEMENTAL CONDENSED CONSOLIDATING BALANCE SHEET
December 31, 2015
SGC (Parent and Issuer1) | SGI (Issuer2) | Guarantor Subsidiaries | Non-Guarantor Subsidiaries | Eliminating Entries | Consolidated | |||||||||||||||||||
Assets | ||||||||||||||||||||||||
Cash and cash equivalents | $ | 43.2 | $ | — | $ | 0.5 | $ | 85.0 | $ | — | $ | 128.7 | ||||||||||||
Restricted cash | — | — | 20.0 | 0.2 | — | 20.2 | ||||||||||||||||||
Accounts receivable, net | — | 94.6 | 223.0 | 169.5 | — | 487.1 | ||||||||||||||||||
Notes receivable, net | — | — | 114.2 | 53.5 | — | 167.7 | ||||||||||||||||||
Inventories | — | 36.9 | 104.2 | 119.6 | (12.2 | ) | 248.5 | |||||||||||||||||
Prepaid expenses, deposits and other current assets | 26.8 | 7.0 | 51.0 | 38.5 | — | 123.3 | ||||||||||||||||||
Property and equipment, net | 8.2 | 106.4 | 501.1 | 189.8 | (11.5 | ) | 794.0 | |||||||||||||||||
Investment in subsidiaries | 3,319.6 | 838.1 | 819.0 | — | (4,976.7 | ) | — | |||||||||||||||||
Goodwill | — | 186.0 | 1,934.0 | 893.7 | — | 3,013.7 | ||||||||||||||||||
Intangible assets, net | 138.3 | 39.8 | 1,505.0 | 236.9 | — | 1,920.0 | ||||||||||||||||||
Intercompany balances | — | 5,857.1 | — | — | (5,857.1 | ) | — | |||||||||||||||||
Software, net | 35.6 | 32.7 | 358.0 | 59.6 | — | 485.9 | ||||||||||||||||||
Other assets | 232.5 | 123.4 | 51.8 | 241.7 | (306.3 | ) | 343.1 | |||||||||||||||||
Total assets | $ | 3,804.2 | $ | 7,322.0 | $ | 5,681.8 | $ | 2,088.0 | $ | (11,163.8 | ) | $ | 7,732.2 | |||||||||||
Liabilities and stockholders’ (deficit) equity | ||||||||||||||||||||||||
Current portion of long-term debt | $ | — | $ | 43.0 | $ | — | $ | 7.3 | $ | — | $ | 50.3 | ||||||||||||
Other current liabilities | 63.7 | 150.5 | 238.8 | 150.6 | — | 603.6 | ||||||||||||||||||
Long-term debt, excluding current portion | 248.0 | 7,890.3 | — | 18.4 | — | 8,156.7 | ||||||||||||||||||
Other long-term liabilities | 119.1 | 14.5 | 502.1 | 87.7 | (306.3 | ) | 417.1 | |||||||||||||||||
Intercompany balances | 4,868.9 | — | 966.8 | 21.4 | (5,857.1 | ) | — | |||||||||||||||||
Stockholders’ (deficit) equity | (1,495.5 | ) | (776.3 | ) | 3,974.1 | 1,802.6 | (5,000.4 | ) | (1,495.5 | ) | ||||||||||||||
Total liabilities and stockholders’ (deficit) equity | $ | 3,804.2 | $ | 7,322.0 | $ | 5,681.8 | $ | 2,088.0 | $ | (11,163.8 | ) | $ | 7,732.2 | |||||||||||
1 - Issuer of obligations under the 2018 Notes.
2 - Issuer of obligations under the 2020 Notes, the 2021 Notes, the Secured Notes and the Unsecured Notes.
118
SCIENTIFIC GAMES CORPORATION AND SUBSIDIARIES
NOTES TO CONSOLIDATED FINANCIAL STATEMENTS
(amounts in USD, table amounts in millions, except per share amounts)
SUPPLEMENTAL CONDENSED CONSOLIDATING STATEMENT OF
OPERATIONS AND COMPREHENSIVE LOSS (INCOME)
Year Ended December 31, 2016
SGC (Parent and Issuer1) | SGI (Issuer2) | Guarantor Subsidiaries | Non-Guarantor Subsidiaries | Eliminating Entries | Consolidated | |||||||||||||||||||
Revenue | $ | — | $ | 469.5 | $ | 1,583.5 | $ | 1,148.6 | $ | (318.2 | ) | $ | 2,883.4 | |||||||||||
Cost of instant games, cost of services and cost of product sales (3) | — | 328.6 | 480.9 | 553.8 | (257.0 | ) | 1,106.3 | |||||||||||||||||
Selling, general and administrative | 121.0 | 46.9 | 213.8 | 235.9 | (40.6 | ) | 577.0 | |||||||||||||||||
Research and development | 6.1 | 10.7 | 145.2 | 42.8 | — | 204.8 | ||||||||||||||||||
Depreciation, amortization and impairments | 53.5 | 40.9 | 534.6 | 116.0 | (6.3 | ) | 738.7 | |||||||||||||||||
Goodwill impairment | — | — | — | 69.0 | — | 69.0 | ||||||||||||||||||
Restructuring and other | 32.6 | 4.6 | 11.7 | 8.1 | — | 57.0 | ||||||||||||||||||
Operating (loss) income | (213.2 | ) | 37.8 | 197.3 | 123.0 | (14.3 | ) | 130.6 | ||||||||||||||||
Interest expense | (21.0 | ) | (640.2 | ) | — | (0.2 | ) | — | (661.4 | ) | ||||||||||||||
Other income (expense), net | 64.0 | 219.6 | (227.3 | ) | (4.2 | ) | — | 52.1 | ||||||||||||||||
Net (loss) income before equity in (loss) income of subsidiaries and income taxes | (170.2 | ) | (382.8 | ) | (30.0 | ) | 118.6 | (14.3 | ) | (478.7 | ) | |||||||||||||
Equity in (loss) income of subsidiaries | (180.1 | ) | 48.5 | 61.1 | — | 70.5 | — | |||||||||||||||||
Income tax (expense) benefit | (3.4 | ) | 138.2 | 15.9 | (25.7 | ) | — | 125.0 | ||||||||||||||||
Net (loss) income | $ | (353.7 | ) | $ | (196.1 | ) | $ | 47.0 | $ | 92.9 | $ | 56.2 | $ | (353.7 | ) | |||||||||
Other comprehensive loss | (111.4 | ) | (1.7 | ) | (43.1 | ) | (135.1 | ) | 179.9 | (111.4 | ) | |||||||||||||
Comprehensive loss (income) | $ | (465.1 | ) | $ | (197.8 | ) | $ | 3.9 | $ | (42.2 | ) | $ | 236.1 | $ | (465.1 | ) | ||||||||
1 - Issuer of obligations under the 2018 Notes.
2 - Issuer of obligations under the 2020 Notes, the 2021 Notes, the Secured Notes and the Unsecured Notes.
3 - Exclusive of D&A.
119
SCIENTIFIC GAMES CORPORATION AND SUBSIDIARIES
NOTES TO CONSOLIDATED FINANCIAL STATEMENTS
(amounts in USD, table amounts in millions, except per share amounts)
SUPPLEMENTAL CONDENSED CONSOLIDATING STATEMENT OF
OPERATIONS AND COMPREHENSIVE LOSS
Year Ended December 31, 2015
SGC (Parent and Issuer1) | SGI (Issuer2) | Guarantor Subsidiaries | Non-Guarantor Subsidiaries | Eliminating Entries | Consolidated | |||||||||||||||||||
Revenue | $ | — | $ | 446.9 | $ | 1,540.5 | $ | 1,110.0 | $ | (338.6 | ) | $ | 2,758.8 | |||||||||||
Cost of instant games, cost of services and cost of product sales (3) | — | 322.1 | 522.7 | 597.9 | (338.6 | ) | 1,104.1 | |||||||||||||||||
Selling, general and administrative | 62.0 | 67.6 | 244.0 | 194.1 | — | 567.7 | ||||||||||||||||||
Research and development | — | 5.5 | 139.3 | 39.1 | — | 183.9 | ||||||||||||||||||
Depreciation, amortization and impairments | 33.7 | 40.4 | 681.4 | 147.7 | — | 903.2 | ||||||||||||||||||
Goodwill impairments | — | 67.6 | 802.9 | 132.1 | — | 1,002.6 | ||||||||||||||||||
Restructuring and other | 6.1 | 1.3 | 11.2 | 3.3 | — | 21.9 | ||||||||||||||||||
Operating loss | (101.8 | ) | (57.6 | ) | (861.0 | ) | (4.2 | ) | — | (1,024.6 | ) | |||||||||||||
Interest expense | (21.0 | ) | (643.2 | ) | — | (0.7 | ) | — | (664.9 | ) | ||||||||||||||
Other (expense) income, net | (21.0 | ) | 204.9 | (167.3 | ) | (21.3 | ) | — | (4.7 | ) | ||||||||||||||
Net loss before equity in (loss) income of subsidiaries and income taxes | (143.8 | ) | (495.9 | ) | (1,028.3 | ) | (26.2 | ) | — | (1,694.2 | ) | |||||||||||||
Equity in (loss) income of subsidiaries | (1,288.3 | ) | 6.5 | (137.2 | ) | — | 1,419.0 | — | ||||||||||||||||
Income tax benefit (expense) | 37.8 | 16.6 | 290.0 | (44.5 | ) | — | 299.9 | |||||||||||||||||
Net loss | (1,394.3 | ) | (472.8 | ) | (875.5 | ) | (70.7 | ) | 1,419.0 | (1,394.3 | ) | |||||||||||||
Other comprehensive loss | (127.8 | ) | (11.0 | ) | (4.4 | ) | (131.0 | ) | 146.4 | (127.8 | ) | |||||||||||||
Comprehensive loss | $ | (1,522.1 | ) | $ | (483.8 | ) | $ | (879.9 | ) | $ | (201.7 | ) | $ | 1,565.4 | $ | (1,522.1 | ) | |||||||
1 - Issuer of obligations under the 2018 Notes.
2 - Issuer of obligations under the 2020 Notes, the 2021 Notes, the Secured Notes and the Unsecured Notes.
3 - Exclusive of D&A.
120
SCIENTIFIC GAMES CORPORATION AND SUBSIDIARIES
NOTES TO CONSOLIDATED FINANCIAL STATEMENTS
(amounts in USD, table amounts in millions, except per share amounts)
SUPPLEMENTAL CONDENSED CONSOLIDATING STATEMENT OF
OPERATIONS AND COMPREHENSIVE LOSS
Year Ended December 31, 2014
SGC (Parent and Issuer1) | SGI (Issuer2) | Guarantor Subsidiaries | Non-Guarantor Subsidiaries | Eliminating Entries | Consolidated | |||||||||||||||||||
Revenue | $ | — | $ | 432.0 | $ | 850.0 | $ | 764.3 | $ | (259.9 | ) | $ | 1,786.4 | |||||||||||
Cost of instant games, cost of services and cost of product sales (3) | — | 325.5 | 358.6 | 425.1 | (259.8 | ) | 849.4 | |||||||||||||||||
Selling, general and administrative | 86.7 | 67.0 | 200.8 | 153.2 | — | 507.7 | ||||||||||||||||||
Research and development | — | 4.0 | 88.6 | 24.4 | — | 117.0 | ||||||||||||||||||
Depreciation, amortization and impairments | 7.9 | 46.9 | 294.9 | 104.6 | — | 454.3 | ||||||||||||||||||
Restructuring and other | 3.5 | 1.8 | 17.5 | 7.9 | — | 30.7 | ||||||||||||||||||
Operating (loss) income | (98.1 | ) | (13.2 | ) | (110.4 | ) | 49.1 | (0.1 | ) | (172.7 | ) | |||||||||||||
Interest expense | (21.1 | ) | (285.3 | ) | — | (0.8 | ) | — | (307.2 | ) | ||||||||||||||
Other (expense) income, net | (57.9 | ) | 4.3 | (14.2 | ) | 52.8 | — | (15.0 | ) | |||||||||||||||
Net (loss) income before equity in (loss) income of subsidiaries and income taxes | (177.1 | ) | (294.2 | ) | (124.6 | ) | 101.1 | (0.1 | ) | (494.9 | ) | |||||||||||||
Equity in (loss) income of subsidiaries | (312.0 | ) | 55.9 | 9.2 | — | 246.9 | — | |||||||||||||||||
Income tax benefit (expense) | 254.8 | (0.3 | ) | 19.7 | (13.6 | ) | — | 260.6 | ||||||||||||||||
Net (loss) income | (234.3 | ) | (238.6 | ) | (95.7 | ) | 87.5 | 246.8 | (234.3 | ) | ||||||||||||||
Other comprehensive (loss) income | (112.7 | ) | (7.5 | ) | 6.5 | (111.2 | ) | 112.2 | (112.7 | ) | ||||||||||||||
Comprehensive loss | $ | (347.0 | ) | $ | (246.1 | ) | $ | (89.2 | ) | $ | (23.7 | ) | $ | 359.0 | $ | (347.0 | ) | |||||||
1 - Issuer of obligations under the 2018 Notes.
2 - Issuer of obligations under the 2020 Notes, the 2021 Notes, the Secured Notes and the Unsecured Notes.
3 - Exclusive of D&A.
121
SCIENTIFIC GAMES CORPORATION AND SUBSIDIARIES
NOTES TO CONSOLIDATED FINANCIAL STATEMENTS
(amounts in USD, table amounts in millions, except per share amounts)
SUPPLEMENTAL CONDENSED CONSOLIDATING STATEMENT OF CASH FLOWS
Year Ended December 31, 2016
SGC (Parent and Issuer1) | SGI (Issuer2) | Guarantor Subsidiaries | Non- Guarantor Subsidiaries | Eliminating Entries | Consolidated | |||||||||||||||||||
Net cash (used in) provided by operating activities | $ | (90.4 | ) | $ | (259.8 | ) | $ | 535.0 | $ | 235.3 | $ | (1.1 | ) | $ | 419.0 | |||||||||
Cash flows from investing activities: | ||||||||||||||||||||||||
Capital expenditures | (39.1 | ) | (22.8 | ) | (149.5 | ) | (61.5 | ) | — | (272.9 | ) | |||||||||||||
Distributions of capital on equity investments | — | — | — | 25.3 | — | 25.3 | ||||||||||||||||||
Restricted cash | — | — | (3.6 | ) | (0.1 | ) | — | (3.7 | ) | |||||||||||||||
Changes in other assets and liabilities and other | — | (1.2 | ) | 16.8 | 4.0 | — | 19.6 | |||||||||||||||||
Other, principally change in intercompany investing activities | — | 418.4 | — | (194.5 | ) | (223.9 | ) | — | ||||||||||||||||
Net cash (used in) provided by investing activities | (39.1 | ) | 394.4 | (136.3 | ) | (226.8 | ) | (223.9 | ) | (231.7 | ) | |||||||||||||
Cash flows from financing activities: | ||||||||||||||||||||||||
Net payments of long-term debt | — | (132.9 | ) | — | (6.8 | ) | — | (139.7 | ) | |||||||||||||||
Net (redemptions) issuances of common stock under stock-based compensation plans | (6.1 | ) | — | — | — | — | (6.1 | ) | ||||||||||||||||
Payments on license obligations | (38.0 | ) | — | (12.2 | ) | — | — | (50.2 | ) | |||||||||||||||
Other, principally change in intercompany financing activities | 163.1 | — | (387.0 | ) | — | 223.9 | — | |||||||||||||||||
Net cash provided by (used in) financing activities | 119.0 | (132.9 | ) | (399.2 | ) | (6.8 | ) | 223.9 | (196.0 | ) | ||||||||||||||
Effect of exchange rate changes on cash and cash equivalents | — | — | — | (4.9 | ) | — | (4.9 | ) | ||||||||||||||||
(Decrease) increase in cash and cash equivalents | (10.5 | ) | 1.7 | (0.5 | ) | (3.2 | ) | (1.1 | ) | (13.6 | ) | |||||||||||||
Cash and cash equivalents, beginning of period | 43.2 | — | 0.5 | 85.0 | — | 128.7 | ||||||||||||||||||
Cash and cash equivalents, end of year | $ | 32.7 | $ | 1.7 | $ | — | $ | 81.8 | $ | (1.1 | ) | 115.1 | ||||||||||||
1 - Issuer of obligations under the 2018 Notes.
2 - Issuer of obligations under the 2020 Notes, the 2021 Notes, the Secured Notes and the Unsecured Notes.
122
SCIENTIFIC GAMES CORPORATION AND SUBSIDIARIES
NOTES TO CONSOLIDATED FINANCIAL STATEMENTS
(amounts in USD, table amounts in millions, except per share amounts)
SUPPLEMENTAL CONDENSED CONSOLIDATING STATEMENT OF CASH FLOWS
Year Ended December 31, 2015
SGC (Parent and Issuer1) | SGI (Issuer2) | Guarantor Subsidiaries | Non- Guarantor Subsidiaries | Eliminating Entries | Consolidated | |||||||||||||||||||
Net cash (used in) provided by operating activities | $ | (112.2 | ) | $ | (350.3 | ) | $ | 603.2 | $ | 273.5 | $ | — | $ | 414.2 | ||||||||||
Cash flows from investing activities: | ||||||||||||||||||||||||
Capital expenditures | (36.6 | ) | (24.0 | ) | (225.8 | ) | (37.2 | ) | — | (323.6 | ) | |||||||||||||
Distributions of capital on equity investments | — | 1.0 | — | 37.7 | — | 38.7 | ||||||||||||||||||
Restricted cash | — | — | 6.5 | (0.6 | ) | — | 5.9 | |||||||||||||||||
Proceeds from asset sales | — | — | 6.9 | (0.2 | ) | — | 6.7 | |||||||||||||||||
Changes in other assets and liabilities and other | — | (2.9 | ) | 5.9 | 5.5 | — | 8.5 | |||||||||||||||||
Other, principally change in intercompany investing activities | — | 509.6 | — | — | (509.6 | ) | — | |||||||||||||||||
Net cash (used in) provided by investing activities | (36.6 | ) | 483.7 | (206.5 | ) | 5.2 | (509.6 | ) | (263.8 | ) | ||||||||||||||
Cash flows from financing activities: | ||||||||||||||||||||||||
Net proceeds (payments) of long-term debt | — | (133.0 | ) | — | (8.3 | ) | — | (141.3 | ) | |||||||||||||||
Net (redemptions) issuances of common stock under stock-based compensation plans | (0.8 | ) | — | (35.6 | ) | 23.7 | 11.8 | (0.9 | ) | |||||||||||||||
Contingent earnout payments | — | — | (0.5 | ) | — | — | (0.5 | ) | ||||||||||||||||
Payments on license obligations | (26.0 | ) | — | (14.5 | ) | — | — | (40.5 | ) | |||||||||||||||
Other, principally change in intercompany financing activities | 180.9 | — | (376.0 | ) | (302.7 | ) | 497.8 | — | ||||||||||||||||
Net cash provided by (used in) financing activities | 154.1 | (133.0 | ) | (426.6 | ) | (287.3 | ) | 509.6 | (183.2 | ) | ||||||||||||||
Effect of exchange rate changes on cash and cash equivalents | — | (0.5 | ) | 3.1 | (12.9 | ) | — | (10.3 | ) | |||||||||||||||
Increase (decrease) in cash and cash equivalents | 5.3 | (0.1 | ) | (26.8 | ) | (21.5 | ) | — | (43.1 | ) | ||||||||||||||
Cash and cash equivalents, beginning of period | 37.9 | 0.1 | 27.3 | 106.5 | — | 171.8 | ||||||||||||||||||
Cash and cash equivalents, end of year | $ | 43.2 | $ | — | $ | 0.5 | $ | 85.0 | $ | — | $ | 128.7 | ||||||||||||
1 - Issuer of obligations under the 2018 Notes.
2 - Issuer of obligations under the 2020 Notes, the 2021 Notes, the Secured Notes and the Unsecured Notes.
123
SCIENTIFIC GAMES CORPORATION AND SUBSIDIARIES
NOTES TO CONSOLIDATED FINANCIAL STATEMENTS
(amounts in USD, table amounts in millions, except per share amounts)
SUPPLEMENTAL CONDENSED CONSOLIDATING STATEMENT OF CASH FLOWS
Year Ended December 31, 2014
SGC (Parent and Issuer1) | SGI (Issuer2) | Guarantor Subsidiaries | Non-Guarantor Subsidiaries | Eliminating Entries | Consolidated | |||||||||||||||||||
Net cash provided by (used in) operating activities | $ | 92.2 | $ | (103.3 | ) | $ | 129.6 | $ | 85.0 | $ | — | $ | 203.5 | |||||||||||
Cash flows from investing activities: | ||||||||||||||||||||||||
Capital expenditures | (12.9 | ) | (30.1 | ) | (156.2 | ) | (39.1 | ) | — | (238.3 | ) | |||||||||||||
Additions to equity method investments | — | (7.6 | ) | — | (40.6 | ) | — | (48.2 | ) | |||||||||||||||
Proceeds from sale of equity interest | — | — | — | 44.9 | — | 44.9 | ||||||||||||||||||
Distribution of capital on equity investments | — | 1.6 | — | 47.2 | — | 48.8 | ||||||||||||||||||
Restricted cash | — | — | (0.4 | ) | — | — | (0.4 | ) | ||||||||||||||||
Business acquisitions, net of cash acquired | — | — | (3,140.6 | ) | — | — | (3,140.6 | ) | ||||||||||||||||
Changes in other assets and liabilities and other | (3,210.2 | ) | 29.3 | 4.3 | 49.3 | 3,128.2 | 0.9 | |||||||||||||||||
Other, principally change in intercompany investing activities | — | (5,016.5 | ) | 296.3 | — | 4,720.2 | — | |||||||||||||||||
Net cash (used in) provided by investing activities | (3,223.1 | ) | (5,023.3 | ) | (2,996.6 | ) | 61.7 | 7,848.4 | (3,332.9 | ) | ||||||||||||||
Cash flows from financing activities: | ||||||||||||||||||||||||
Net proceeds (payments) of long-term debt | — | 5,289.2 | (1,882.9 | ) | (11.1 | ) | — | 3,395.2 | ||||||||||||||||
Payments of deferred financing fees | — | (163.1 | ) | — | — | — | (163.1 | ) | ||||||||||||||||
Net (redemptions) issuances of common stock under stock-based compensation plans | (18.7 | ) | — | 3,196.3 | (67.8 | ) | (3,128.2 | ) | (18.4 | ) | ||||||||||||||
Common stock repurchases | (29.5 | ) | — | — | — | — | (29.5 | ) | ||||||||||||||||
Contingent earnout payments | — | — | (3.0 | ) | (10.2 | ) | — | (13.2 | ) | |||||||||||||||
Payments on license obligations | — | — | (13.6 | ) | — | — | (13.6 | ) | ||||||||||||||||
Other, principally change in intercompany financing activities | 3,159.7 | — | 1,571.1 | (10.6 | ) | (4,720.2 | ) | — | ||||||||||||||||
Net cash provided by (used in) financing activities | 3,111.5 | 5,126.1 | 2,867.9 | (99.7 | ) | (7,848.4 | ) | 3,157.4 | ||||||||||||||||
Effect of exchange rate changes on cash and cash equivalents | — | 0.6 | 0.4 | (10.9 | ) | — | (9.9 | ) | ||||||||||||||||
(Decrease) increase in cash and cash equivalents | (19.4 | ) | 0.1 | 1.3 | 36.1 | — | 18.1 | |||||||||||||||||
Cash and cash equivalents, beginning of period | 57.3 | — | 26.0 | 70.4 | — | 153.7 | ||||||||||||||||||
Cash and cash equivalents, end of year | $ | 37.9 | $ | 0.1 | $ | 27.3 | $ | 106.5 | $ | — | $ | 171.8 | ||||||||||||
1 - Issuer of obligations under the 2018 Notes.
2 - Issuer of obligations under the 2020 Notes, the 2021 Notes, the Secured Notes and the Unsecured Notes.
124
SCIENTIFIC GAMES CORPORATION AND SUBSIDIARIES
NOTES TO CONSOLIDATED FINANCIAL STATEMENTS
(amounts in USD, table amounts in millions, except per share amounts)
(24) Selected Quarterly Financial Data, Unaudited
Quarter Ended 2016 | ||||||||||||||||
March 31 | June 30 (a) | September 30 | December 31 (b) | |||||||||||||
Total operating revenues | $ | 682.0 | $ | 729.2 | $ | 720.0 | $ | 752.2 | ||||||||
Total cost of revenues (1) | 256.3 | 276.2 | 274.3 | 299.5 | ||||||||||||
Selling, general and administrative | 142.3 | 144.9 | 152.8 | 137.0 | ||||||||||||
Research and development | 49.8 | 51.7 | 53.9 | 49.4 | ||||||||||||
Restructuring and other | 2.7 | 4.2 | 13.8 | 36.3 | ||||||||||||
Depreciation, amortization and impairments | 180.6 | 193.1 | 191.7 | 173.3 | ||||||||||||
Goodwill impairment | — | — | — | 69.0 | ||||||||||||
Operating income (loss) | 50.3 | 59.1 | 33.5 | (12.3 | ) | |||||||||||
Net loss | $ | (92.3 | ) | $ | (51.7 | ) | $ | (98.9 | ) | $ | (110.8 | ) | ||||
Basic and diluted net loss per share | $ | (1.07 | ) | $ | (0.59 | ) | $ | (1.13 | ) | $ | (1.26 | ) | ||||
Weighted average number of shares used in per share calculations: | ||||||||||||||||
Basic shares | 86.6 | 87.3 | 87.5 | 87.7 | ||||||||||||
Diluted shares | 86.6 | 87.3 | 87.5 | 87.7 | ||||||||||||
(1) Exclusive of D&A
(a) | Includes a gain recorded of $25.2 million on early extinguishment of debt in connection with the 2020 and 2021 notes repurchase transactions and $7.5 million of insurance proceeds related to a settlement of a legal matter. |
(b) | Includes a goodwill impairment charge of $69.0 million, which resulted in a tax benefit of $14.5 million, for our International Lottery Systems reporting unit and a $22.4 million charge related to the November 2016 restructuring plan. |
125
SCIENTIFIC GAMES CORPORATION AND SUBSIDIARIES
NOTES TO CONSOLIDATED FINANCIAL STATEMENTS
(amounts in USD, table amounts in millions, except per share amounts)
Quarter Ended 2015 | ||||||||||||||||
March 31 (a) | June 30 (b) | September 30 (c) | December 31 (d) | |||||||||||||
Total operating revenues | $ | 658.7 | $ | 691.5 | $ | 671.6 | $ | 737.0 | ||||||||
Total cost of revenues (1) | 255.4 | 275.3 | 250.0 | 323.4 | ||||||||||||
Selling, general and administrative | 145.9 | 140.9 | 136.8 | 144.1 | ||||||||||||
Research and development | 46.9 | 48.0 | 45.9 | 43.1 | ||||||||||||
Restructuring and other | 8.2 | 5.2 | 5.6 | 2.9 | ||||||||||||
Depreciation, amortization and impairments | 184.2 | 222.2 | 286.5 | 210.3 | ||||||||||||
Goodwill impairments | — | — | 935.0 | 67.6 | ||||||||||||
Operating income (loss) | 18.1 | (0.1 | ) | (988.2 | ) | (54.4 | ) | |||||||||
Net loss | $ | (86.4 | ) | $ | (102.2 | ) | $ | (1,078.2 | ) | $ | (127.5 | ) | ||||
Basic and diluted net loss per share | $ | (1.01 | ) | $ | (1.19 | ) | $ | (12.52 | ) | $ | (1.48 | ) | ||||
Weighted average number of shares used in per share calculations: | ||||||||||||||||
Basic shares | 85.3 | 85.9 | 86.1 | 86.3 | ||||||||||||
Diluted shares | 85.3 | 85.9 | 86.1 | 86.3 | ||||||||||||
(1) Exclusive of D&A.
(a) | Includes accelerated D&A charges of $4.6 million related to long term asset impairments and write-downs. |
(b) | Includes inventory write-downs for discontinued product lines of $5.9 million and accelerated D&A charges of $35.1 million related to long-term asset impairments and write-downs, including $25.0 million of trade name assets. |
(c) | Includes an impairment charge of $935.0 million to reduce the carrying value of our SG Gaming reporting unit goodwill and accelerated D&A charges of $103.6 million related to long-term asset impairments and write-downs of trade name assets. |
(d) | Includes an impairment charge of $67.6 million, which resulted in a tax benefit of $24.9 million, to write-off our U.S. Lottery Systems reporting unit goodwill, legal contingencies and settlements of $2.5 million, a $35.5 million charge related to other asset impairments and contract cancellation costs included in cost of instant games sales and accelerated D&A charges of $26.4 million related to long-term asset impairments and write-downs. |
SCHEDULE II
SCIENTIFIC GAMES CORPORATION AND SUBSIDIARIES
Valuation and Qualifying Accounts
Year Ended December 31, 2016, 2015 and 2014
(in millions)
Allowance for doubtful accounts | Balance at beginning of period | Additions | Deductions (1) | Balance at end of period | ||||||||||
Year ended December 31, 2016 | $ | 23.8 | 8.6 | (4.3 | ) | $ | 28.1 | |||||||
Year ended December 31, 2015 | $ | 17.0 | 9.1 | (2.3 | ) | $ | 23.8 | |||||||
Year ended December 31, 2014 | $ | 20.0 | 6.4 | (9.4 | ) | $ | 17.0 | |||||||
126
Tax-related valuation allowance | Balance at beginning of period | Added (charged) to tax benefit | Balance at end of period | ||||||||
Year ended December 31, 2016 | $ | 95.6 | 23.4 | $ | 119.0 | ||||||
Year ended December 31, 2015 | $ | 107.3 | (11.7 | ) | $ | 95.6 | |||||
Year ended December 31, 2014 | $ | 178.7 | (71.4 | ) | $ | 107.3 | |||||
(1) | Amounts written off, net of recovery, and related impact of foreign currency exchange. |
SIGNATURES
Pursuant to the requirements of Section 13 or 15(d) of the Securities Exchange Act of 1934, the registrant has duly caused this report to be signed on its behalf by the undersigned, thereunto duly authorized.
March 3, 2017 | SCIENTIFIC GAMES CORPORATION | |||
By: | /s/ Michael A. Quartieri | |||
Michael A. Quartieri, Chief Financial Officer | ||||
By: | /s/ Michael F. Winterscheidt | |||
Michael F. Winterscheidt, Chief Accounting Officer | ||||
Pursuant to the requirements of the Securities Exchange Act of 1934, this Report has been signed below by the following persons on behalf of the Registrant and in the capacities indicated on March 3, 2017.
127
Signature | Title | |
/s/ Kevin M. Sheehan | Chief Executive Officer and Director (principal executive officer) | |
Kevin M. Sheehan | ||
/s/ Michael A. Quartieri | Executive Vice President, Chief Financial Officer, Treasurer and Corporate Secretary (principal financial officer) | |
Michael A. Quartieri | ||
/s/ Michael F. Winterscheidt | Chief Accounting Officer (principal accounting officer) | |
Michael F. Winterscheidt | ||
/s/ Ronald O. Perelman | Chairman of the Board of Directors and Director | |
Ronald O. Perelman | ||
/s/ Richard M. Haddrill | Executive Vice Chairman of the Board of Directors and Director | |
Richard M. Haddrill | ||
/s/ Peter A. Cohen | Vice Chairman of the Board of Directors and Director | |
Peter A. Cohen | ||
/s/ M. Gavin Isaacs | Vice Chairman of the Board of Directors and Director | |
M. Gavin Isaacs | ||
/s/ David L. Kennedy | Director | |
David L. Kennedy | ||
128
Signature | Title | |
/s/ Paul M. Meister | Director | |
Paul M. Meister | ||
/s/ Gerald J. Ford | Director | |
Gerald J. Ford | ||
/s/ Michael J. Regan | Director | |
Michael J. Regan | ||
/s/ Barry F. Schwartz | Director | |
Barry F. Schwartz | ||
/s/ Frances F. Townsend | Director | |
Frances F. Townsend | ||
/s/ Gabrielle K. McDonald | Director | |
Gabrielle K. McDonald | ||
129
(3). Exhibits.
EXHIBIT INDEX
Exhibit Number | Description | |
2.1 | Agreement and Plan of Merger, dated as of January 30, 2013, entered into by and among Scientific Games Corporation, Scientific Games International, Inc., SG California Merger Sub, Inc. and WMS Industries Inc. (incorporated by reference to Exhibit 2.1 to Scientific Games Corporation's Current Report on Form 8-K filed on February 5, 2013). | |
2.2 | Agreement and Plan of Merger, dated as of August 1, 2014, by and among the Scientific Games Corporation, Scientific Games International, Inc., Scientific Games Nevada, Inc. and Bally Technologies, Inc. (incorporated by reference to Exhibit 2.1 to Scientific Games Corporation’s Current Report on Form 8-K filed on August 4, 2014). | |
3.1(a) | Restated Certificate of Incorporation of Scientific Games Corporation, filed with the Secretary of State of the State of Delaware on March 20, 2003 (incorporated by reference to Exhibit 3(i) to Scientific Games Corporation’s Annual Report on Form 10-K for the fiscal year ended December 31, 2002). | |
3.1(b) | Certificate of Amendment of the Restated Certificate of Incorporation of Scientific Games Corporation, filed with the Secretary of State of the State of Delaware on June 7, 2007 (incorporated by reference to Exhibit 3.1(b) to Scientific Games Corporation's Quarterly Report on Form 10-Q for the quarter ended June 30, 2007). | |
3.2 | Amended and Restated Bylaws of Scientific Games Corporation (incorporated by reference to Exhibit 3.1 to Scientific Games Corporation's Current Report on Form 8-K filed on November 1, 2010). | |
4.1 | Indenture, dated as of September 22, 2010, among Scientific Games Corporation, as issuer, the guarantors party thereto and The Bank of Nova Scotia Trust Company of New York, as trustee, relating to the 8.125% Senior Subordinated Notes due 2018 (incorporated by reference to Exhibit 4.1 to Scientific Games Corporation's Current Report on Form 8-K filed on September 23, 2010). | |
4.2 | Form of 8.125% Senior Subordinated Notes due 2018 (incorporated by reference to Exhibits 4.3(a) and 4.3(b) to Scientific Games Corporation's Registration Statement on Form S-4 (No. 333-172600) filed on March 3, 2011 and included in Exhibit 4.1 above). | |
4.3 | Supplemental Indenture, dated as of August 20, 2012, among Scientific Games Corporation, as issuer, Sciplay Inc. and the other guarantors party thereto, and The Bank of Nova Scotia Trust Company of New York, as trustee, relating to the Indenture, dated as of September 22, 2010, by and among Scientific Games Corporation, as issuer, the guarantors party thereto and The Bank of Nova Scotia Trust Company of New York, as trustee, relating to the 8.125% Senior Subordinated Notes due 2018 (incorporated by reference to Exhibit 4.2 to Scientific Games Corporation's Quarterly Report on Form 10-Q for the quarter ended March 31, 2013). | |
4.4 | Supplemental Indenture, dated as of April 16, 2013, among Scientific Games Corporation, as issuer, SG California Merger Sub, Inc., Scientific Games New Jersey, LLC and the other guarantors party thereto, and The Bank of Nova Scotia Trust Company of New York, as trustee, relating to the Indenture, dated as of September 22, 2010, by and among Scientific Games Corporation, as issuer, the guarantors party thereto and The Bank of Nova Scotia Trust Company of New York, as trustee, relating to the 8.125% Senior Subordinated Notes due 2018 (incorporated by reference to Exhibit 4.3 to Scientific Games Corporation's Quarterly Report on Form 10-Q for the quarter ended March 31, 2013). | |
130
4.5 | Supplemental Indenture, dated as of October 18, 2013, among Scientific Games Corporation, as issuer, WMS Industries Inc., WMS Gaming Inc., WMS International Holdings Inc., Phantom EFX, LLC, Lenc-Smith Inc., Williams Electronics Games, Inc., WMS Finance Inc., Lenc Software Holdings LLC, Williams Interactive LLC and the other guarantors party thereto, and Deutsche Bank Trust Company Americas, as trustee, relating to the Indenture, dated as of September 22, 2010, by and among Scientific Games Corporation, as issuer, the guarantors party thereto and The Bank of Nova Scotia Trust Company of New York, as trustee, relating to the 8.125% Senior Subordinated Notes due 2018 (incorporated by reference to Exhibit 4.2 to Scientific Games Corporation's Current Report on Form 8-K filed on October 18, 2013). | |
4.6 | Supplemental Indenture, dated as of September 15, 2014, among Scientific Games Corporation, as issuer, Scientific Games Productions, LLC, Scientific Games Distribution, LLC and the other guarantors party thereto, and Deutsche Bank Trust Company Americas, as successor trustee, relating to the Indenture, dated as of September 22, 2010, by and among Scientific Games Corporation, as issuer, the guarantors party thereto and Deutsche Bank Trust Company Americas, as successor trustee, relating to the 8.125% Senior Subordinated Notes due 2018 (incorporated by reference to Exhibit 4.1 to Scientific Games Corporation's Quarterly Report on Form 10-Q for the quarter ended September 30, 2014). | |
4.7 | Supplemental Indenture, dated as of November 21, 2014, among Scientific Games Corporation, as issuer, Bally Technologies, Inc., Casino Electronics, Inc., Alliance Holding Company, Bally Gaming International, Inc., Bally Gaming, Inc., Bally Gaming GP, LLC, Bally Gaming LP, LLC, Bally Properties East, LLC, Bally Properties West, LLC, Compudigm Services, Inc., SHFL Properties, LLC, Sierra Design Group, Arcade Planet, Inc. and the other guarantors party thereto, and Deutsche Bank Trust Company Americas, as successor trustee, relating to the Indenture, dated as of September 22, 2010, by and among Scientific Games Corporation, as issuer, the guarantors party thereto and Deutsche Bank Trust Company Americas, as successor trustee, relating to the 8.125% Senior Subordinated Notes due 2018 (incorporated by reference to Exhibit 4.6 to Scientific Games Corporation's Current Report on Form 8-K filed on November 26, 2014). | |
4.8 | Supplemental Indenture, dated as of October 2, 2015, among Scientific Games Corporation, as issuer, Go For A Million Productions, LLC and the other guarantors party thereto, and Deutsche Bank Trust Company Americas, as successor trustee, relating to the Indenture, dated as of September 22, 2010, by and among Scientific Games Corporation, as issuer, the guarantors party thereto and Deutsche Bank Trust Company Americas, as successor trustee, relating to the 8.125% Senior Subordinated Notes due 2018 (incorporated by reference to Exhibit 4.1 to Scientific Games Corporation's Quarterly Report on Form 10-Q for the quarter ended September 30, 2015). | |
4.9 | Indenture, dated as of August 20, 2012, among Scientific Games International, Inc., as issuer, Scientific Games Corporation and the other guarantor party thereto and The Bank of Nova Scotia Trust Company of New York, as trustee, relating to the 6.250% Senior Subordinated Notes due 2020 (incorporated by reference to Exhibit 4.1 to Scientific Games Corporation's Current Report on Form 8-K filed on August 21, 2012). | |
4.10 | Form of 6.250% Senior Subordinated Notes due 2020 (incorporated by reference to Exhibits 4.3(a) and 4.3(b) to Scientific Games Corporation's Registration Statement on Form S-4 (No. 333-184835) filed on November 8, 2012 and included in Exhibit 4.9 above). | |
4.11 | Supplemental Indenture, dated as of April 16, 2013, among Scientific Games International, Inc., as issuer, Scientific Games Corporation, SG California Merger Sub, Inc., Scientific Games New Jersey, LLC and the other guarantors party thereto, and The Bank of Nova Scotia Trust Company of New York, as trustee, relating to the Indenture, dated as of August 20, 2012, among Scientific Games International, Inc., as issuer, Scientific Games Corporation and the other guarantors party thereto and The Bank of Nova Scotia Trust Company of New York, as trustee, relating to the 6.250% Senior Subordinated Notes due 2020 (incorporated by reference to Exhibit 4.5 to Scientific Games Corporation's Quarterly Report on Form 10-Q for the quarter ended March 31, 2013). | |
131
4.12 | Supplemental Indenture, dated as of October 18 2013, among Scientific Games International, Inc., as issuer, Scientific Games Corporation, WMS Industries Inc., WMS Gaming Inc., WMS International Holdings Inc., Phantom EFX, LLC, Lenc-Smith Inc., Williams Electronics Games, Inc., WMS Finance Inc., Lenc Software Holdings LLC, Williams Interactive LLC and the other guarantors party thereto, and Deutsche Bank Trust Company Americas, as trustee, relating to the Indenture, dated as of August 20, 2012, among Scientific Games International, Inc., as issuer, Scientific Games Corporation and the other guarantors party thereto and The Bank of Nova Scotia Trust Company of New York, as trustee, relating to the 6.250% Senior Subordinated Notes due 2020 (incorporated by reference to Exhibit 4.3 to Scientific Games Corporation's Current Report on Form 8-K filed on October 18, 2013). | |
4.13 | Supplemental Indenture, dated as of September 15, 2014, among Scientific Games International, Inc., as issuer, Scientific Games Corporation, Scientific Games Productions, LLC, Scientific Games Distribution, LLC and the other guarantors party thereto, and Deutsche Bank Trust Company Americas, as trustee, relating to the Indenture, dated as of August 20, 2012, among Scientific Games International, Inc., as issuer, Scientific Games Corporation and the other guarantors party thereto and Deutsche Bank Trust Company Americas, as successor trustee, relating to the 6.250% Senior Subordinated Notes due 2020 (incorporated by reference to Exhibit 4.2 to Scientific Games Corporation's Quarterly Report on Form 10-Q for the quarter ended September 30, 2014). | |
4.14 | Supplemental Indenture, dated as of November 21, 2014, among Scientific Games International, Inc., as issuer, Scientific Games Corporation, Bally Technologies, Inc., Casino Electronics, Inc., Alliance Holding Company, Bally Gaming International, Inc., Bally Gaming, Inc., Bally Gaming GP, LLC, Bally Gaming LP, LLC, Bally Properties East, LLC, Bally Properties West, LLC, Compudigm Services, Inc., SHFL Properties, LLC, Sierra Design Group, Arcade Planet, Inc. and the other guarantors party thereto, and Deutsche Bank Trust Company Americas, as successor trustee, relating to the Indenture, dated as of August 20, 2012, among Scientific Games International, Inc., as issuer, Scientific Games Corporation and the other guarantors party thereto and Deutsche Bank Trust Company Americas, as successor trustee, relating to the 6.250% Senior Subordinated Notes due 2020 (incorporated by reference to Exhibit 4.7 to Scientific Games Corporation's Current Report on Form 8-K filed on November 26, 2014). | |
4.15 | Supplemental Indenture, dated as of October 2, 2015, among Scientific Games International, Inc., as issuer, Scientific Games Corporation, Go For A Million Productions, LLC and the other guarantors party thereto, and Deutsche Bank Trust Company Americas, as trustee, relating to the Indenture, dated as of August 20, 2012, by and among Scientific Games International, Inc., as issuer, Scientific Games Corporation and the other guarantors party thereto and Deutsche Bank Trust Company Americas, as successor trustee, relating to the 6.250% Senior Subordinated Notes due 2020 (incorporated by reference to Exhibit 4.2 to Scientific Games Corporation's Quarterly Report on Form 10-Q for the quarter ended September 30, 2015). | |
4.16 | Indenture, dated as of June 4, 2014, among Scientific Games International, Inc., as issuer, Scientific Games Corporation and the other guarantors party thereto and Deutsche Bank Trust Company Americas, as trustee, relating to the 6.625% Senior Subordinated Notes due 2021 (incorporated by reference to Exhibit 4.1 to Scientific Games Corporation's Current Report on Form 8-K filed on June 6, 2014). | |
4.17 | Supplemental Indenture, dated as of September 15, 2014, among Scientific Games International, Inc., as issuer, Scientific Games Corporation, Scientific Games Productions, LLC, Scientific Games Distribution, LLC and the other guarantors party thereto, and Deutsche Bank Trust Company Americas, as trustee, relating to the Indenture, dated as of June 4, 2014, among Scientific Games International, Inc., as issuer, Scientific Games Corporation and the other guarantors party thereto and Deutsche Bank Trust Company Americas, as trustee, relating to the 6.625% Senior Subordinated Notes due 2021 (incorporated by reference to Exhibit 4.3 to Scientific Games Corporation's Quarterly Report on Form 10-Q for the quarter ended September 30, 2014). | |
132
4.18 | Supplemental Indenture, dated as of November 21, 2014, among Scientific Games International, Inc., as issuer, Scientific Games Corporation, Bally Technologies, Inc., Casino Electronics, Inc., Alliance Holding Company, Bally Gaming International, Inc., Bally Gaming, Inc., Bally Gaming GP, LLC, Bally Gaming LP, LLC, Bally Properties East, LLC, Bally Properties West, LLC, Compudigm Services, Inc., SHFL Properties, LLC, Sierra Design Group, Arcade Planet, Inc. and the other guarantors party thereto, and Deutsche Bank Trust Company Americas, as successor trustee, relating to the Indenture, dated as of June 4, 2014, among Scientific Games International, Inc., as issuer, Scientific Games Corporation and the other guarantors party thereto and Deutsche Bank Trust Company Americas, as trustee, relating to the 6.625% Senior Subordinated Notes due 2021 (incorporated by reference to Exhibit 4.8 to Scientific Games Corporation's Current Report on Form 8-K filed on November 26, 2014). | |
4.19 | Supplemental Indenture, dated as of October 2, 2015, among Scientific Games International, Inc., as issuer, Scientific Games Corporation, Go For A Million Productions, LLC and the other guarantors party thereto, and Deutsche Bank Trust Company Americas, as trustee, relating to the Indenture, dated as of June 4, 2014, by and among Scientific Games International, Inc., as issuer, Scientific Games Corporation and the other guarantors party thereto and Deutsche Bank Trust Company Americas, as trustee, relating to the 6.625% Senior Subordinated Notes due 2021 (incorporated by reference to Exhibit 4.3 to Scientific Games Corporation's Quarterly Report on Form 10-Q for the quarter ended September 30, 2015). | |
4.20 | Indenture, dated as of November 21, 2014, between SGMS Escrow Corp., as issuer, and Deutsche Bank Trust Company Americas, as trustee, relating to the 10.000% Senior Unsecured Notes due 2022 (incorporated by reference to Exhibit 4.1 to Scientific Games Corporation's Current Report on Form 8-K filed on November 26, 2014). | |
4.21 | Supplemental Indenture, dated as of November 21, 2014, among Scientific Games International, Inc., as issuer, Scientific Games Corporation and the other guarantors party thereto and Deutsche Bank Trust Company Americas, as trustee, relating to the Indenture, dated as of November 21, 2014, between SGMS Escrow Corp., as issuer, and Deutsche Bank Trust Company Americas, as trustee, relating to the 10.000% Senior Unsecured Notes due 2022 (incorporated by reference to Exhibit 4.2 to Scientific Games Corporation's Current Report on Form 8-K filed on November 26, 2014). | |
4.22 | Supplemental Indenture, dated as of October 2, 2015, among Scientific Games International, Inc., as issuer, Scientific Games Corporation, Go For A Million Productions, LLC and the other guarantors party thereto, and Deutsche Bank Trust Company Americas, as trustee, relating to the Indenture, dated as of November 21, 2014, between SGMS Escrow Corp., as issuer, Scientific Games Corporation and the other guarantors party thereto and Deutsche Bank Trust Company Americas, as trustee, relating to the 10.000% Senior Unsecured Notes due 2022 (incorporated by reference to Exhibit 4.4 to Scientific Games Corporation's Quarterly Report on Form 10-Q for the quarter ended September 30, 2015). | |
4.23 | Indenture, dated as of November 21, 2014, between SGMS Escrow Corp., as issuer, and Deutsche Bank Trust Company Americas, as collateral agent and trustee, related to the 7.000% Senior Secured Notes due 2022 (incorporated by reference to Exhibit 4.3 to Scientific Games Corporation's Current Report on Form 8-K filed on November 26, 2014). | |
4.24 | Supplemental Indenture, dated as of November 21, 2014, among Scientific Games International, Inc., as issuer, Scientific Games Corporation, and the other guarantors party thereto and Deutsche Bank Trust Company Americas, as trustee, relating to the Indenture dated as of November 21, 2014, between SGMS Escrow Corp., as escrow issuer, and Deutsche Bank Trust Company relating to the 7.000% Senior Secured Notes due 2022 (incorporated by reference to Exhibit 4.4 to Scientific Games Corporation's Current Report on Form 8-K filed on November 26, 2014). | |
133
4.25 | Supplemental Indenture, dated as of October 2, 2015, among Scientific Games International, Inc., as issuer, Scientific Games Corporation, Go For A Million Productions, LLC and the other guarantors party thereto, and Deutsche Bank Trust Company Americas, as trustee, relating to the Indenture, dated as of November 21, 2014, between SGMS Escrow Corp., as issuer, Scientific Games Corporation and the other guarantors party thereto and Deutsche Bank Trust Company Americas, as trustee, relating to the 7.000% Senior Secured Notes due 2022 (incorporated by reference to Exhibit 4.5 to Scientific Games Corporation's Quarterly Report on Form 10-Q for the quarter ended September 30, 2015). | |
10.1 | Credit Agreement, dated as of October 18, 2013, among Scientific Games International, Inc., as the borrower, Scientific Games Corporation, the lenders and other agents party thereto from time to time, Bank of America, N.A., as administrative agent, collateral agent, issuing lender and swingline lender, JPMorgan Chase Bank, N.A., as issuing lender, Bank of America, N.A., Credit Suisse Securities (USA) LLC and UBS Securities LLC, as joint lead arrangers, Bank of America, N.A., Credit Suisse Securities (USA) LLC, UBS Securities LLC, J.P. Morgan Securities LLC, RBS Securities Inc., Deutsche Bank Securities Inc., Goldman Sachs Bank USA and HSBC Securities (USA) Inc., as joint bookrunners, Credit Suisse Securities (USA) LLC and UBS Securities LLC, as co-syndication agents, and J.P. Morgan Securities LLC, The Royal Bank of Scotland plc, Deutsche Bank Securities Inc., Goldman Sachs Bank USA and HSBC Securities (USA) Inc., as co-documentation agents (incorporated by reference to Exhibit 10.1 to Scientific Games Corporation's Current Report on Form 8-K filed on October 18, 2013). | |
10.2 | Amendment No. 1 to Credit Agreement, dated as of October 1, 2014, by and among Scientific Games International, Inc., as the borrower, Scientific Games Corporation, the lenders and other agents from time to time party thereto, and Bank of America, N.A., as administrative agent, collateral agent, issuing lender and swingline lender, which amended and restated the Credit Agreement, dated as of October 18, 2013 among such parties, as set forth in Exhibit A and Exhibit B to such Amendment No. 1. to Credit Agreement (incorporated by reference to Exhibit 10.1 to Scientific Games Corporation's Current Report on Form 8-K filed on October 7, 2014). | |
10.3 | Escrow Credit Agreement, dated as of October 1, 2014, among SGMS Escrow Corp., the lenders and other agents from time to time party thereto, and Bank of America, N.A., as administrative agent (incorporated by reference to Exhibit 10.2 to Scientific Games Corporation's Current Report on Form 8-K filed on October 7, 2014). | |
10.4 | Guarantee and Collateral Agreement, dated as of October 18, 2013, by and among Scientific Games Corporation, Scientific Games International, Inc., the guarantor parties named therein and Bank of America, N.A. as collateral agent (incorporated by reference to Exhibit 10.2 to Scientific Games Corporation's Current Report on Form 8-K filed on October 18, 2013). | |
10.5 | Collateral Agreement, dated as of November 21, 2014, among Scientific Games International, Inc., as grantor. Scientific Games Corporation, as guarantor, the subsidiary guarantors party thereto and Deutsche Bank Trust Company Americas, as collateral agent, related to the 7.000% Senior Secured Notes due 2022 (incorporated by reference to Exhibit 10.1 to Scientific Games Corporation's Current Report on Form 8-K filed on November 26, 2014). | |
10.6 | Stockholders' Agreement, dated as of September 6, 2000, among Scientific Games Corporation, MacAndrews & Forbes Holdings Inc. (formerly known as Mafco Holdings Inc.) ("MacAndrews") (as successor-in-interest under the agreement to Cirmatica Gaming S.A.) and Ramius Securities, LLC (incorporated by reference to Exhibit 10.38 to Scientific Games Corporation's Quarterly Report on Form 10-Q for the quarter ended July 31, 2000). | |
10.7 | Supplemental Stockholders' Agreement, dated as of June 26, 2002, among Scientific Games Corporation and MacAndrews (as successor-in-interest to Cirmatica Gaming S.A.) (incorporated by reference to Exhibit 4.2 to Scientific Games Corporation's Quarterly Report on Form 10-Q for the quarter ended June 30, 2002). | |
134
10.8 | Letter Agreement, dated as of October 10, 2003, by and between Scientific Games Corporation and MacAndrews further supplementing the Stockholders' Agreement (incorporated by reference to Exhibit 3 to the Schedule 13D jointly filed by MacAndrews and SGMS Acquisition Corporation on November 26, 2003). | |
10.9 | Letter Agreement dated February 15, 2007 between Scientific Games Corporation and MacAndrews (incorporated by reference to Exhibit 10.1 to Scientific Games Corporation's Current Report on Form 8-K filed on February 16, 2007). | |
10.10 | Share Purchase Agreement, dated as of April 26, 2011, by and among Scientific Games Corporation, Global Draw Limited, IGT-UK Group Limited, Cyberview International, Inc. and International Game Technology (incorporated by reference to Exhibit 10.1 to Scientific Games Corporation's Quarterly Report on Form 10-Q for the quarter ended June 30, 2011). | |
10.11 | 2003 Incentive Compensation Plan, as amended and restated (incorporated by reference to Appendix A to Scientific Games Corporation’s Proxy Statement on Schedule 14A filed on April 30, 2015).* | |
10.12 | 1995 Equity Incentive Plan, as amended (incorporated by reference to Exhibit 10.14 to Scientific Games Corporation’s Annual Report on Form 10-K for the fiscal year ended October 31, 1997).* | |
10.13 | Scientific Games Corporation Nonqualified Deferred Compensation Plan, as amended and restated (incorporated by reference to Exhibit 10.15 to Scientific Games Corporation's Annual Report on Form 10-K for the year ended December 31, 2014).* | |
10.14 | Asia-Pacific Business Incentive Compensation Program (incorporated by reference to Exhibit 10.4 to Scientific Games Corporation's Current Report on Form 8-K filed on December 3, 2010).* | |
10.15 | Employment Agreement dated as of August 4, 2016 by and between Scientific Games Corporation and Kevin Sheehan (incorporated by reference to Exhibit 10.1 to Scientific Games Corporation's Quarterly Report on Form 10-Q for the quarter ended September 30, 2016).* | |
10.16 | Form of Inducement Equity Award Agreement between Scientific Games Corporation and Kevin Sheehan (incorporated by reference to Exhibit 4.4 to Scientific Games Corporation’s Registration Statement on Form S-8 (No. 000-13063) filed on September 1, 2016).* | |
10.17 | Form of Inducement Equity Award Agreement between Scientific Games Corporation and Kevin Sheehan (incorporated by reference to Exhibit 4.5 to Scientific Games Corporation’s Registration Statement on Form S-8 (No. 000-13063) filed on September 1, 2016).* | |
10.18 | Amended and Restated Employment Agreement dated as of December 15, 2015 by and between Scientific Games Corporation and Michael Quartieri (incorporated by reference to Exhibit 10.47 to Scientific Games Corporation’s Annual Report on Form 10-K for the year ended December 31, 2015).* | |
10.19 | Employment Agreement dated as of July 14, 2015 by and between Scientific Games Corporation and David W. Smail (incorporated by reference to Exhibit 10.1 to Scientific Games Corporation's Quarterly Report on Form 10-Q for the quarter ended September 30, 2015).* | |
10.20 | Employment Agreement dated as of December 18, 2012 (effective as of January 1, 2013) by and between Scientific Games International, Inc. and James C. Kennedy (incorporated by reference to Exhibit 10.20 to Scientific Games Corporation's Annual Report on Form 10-K for the year ended December 31, 2014).* | |
10.21 | Amendment to Employment Agreement dated as of January 14, 2016 by and between Scientific Games International, Inc. and James C. Kennedy, which amended Mr. Kennedy’s Employment Agreement dated as of December 18, 2012 (incorporated by reference to Exhibit 10.48 to Scientific Games Corporation’s Annual Report on Form 10-K for the year ended December 31, 2015).* | |
135
10.22 | Employment Agreement dated as of January 5, 2015 by and between Scientific Games Corporation and Derik Mooberry (incorporated by reference to Exhibit 10.28 to Scientific Games Corporation's Annual Report on Form 10-K for the year ended December 31, 2014).* | |
10.23 | Employment Agreement dated as of January 1, 2006 by and between Scientific Games Corporation and Larry A. Potts (executed on August 2, 2006) (incorporated by reference to Exhibit 10.4 to Scientific Games Corporation's Quarterly Report on Form 10-Q for the quarter ended September 30, 2006).* | |
10.24 | Letter Agreement dated as of October 2, 2008 by and between Scientific Games Corporation and Larry A. Potts, which amended Mr. Potts' Employment Agreement dated as of January 1, 2006 (incorporated by reference to Exhibit 10.36 to Scientific Games Corporation's Annual Report on Form 10-K for the year ended December 31, 2008).* | |
10.25 | Amendment to Employment Agreement dated as of December 30, 2008 by and between Scientific Games Corporation and Larry A. Potts, which amended Mr. Potts' Employment Agreement dated as of January 1, 2006, as amended by the Letter Agreement dated as of October 2, 2008 (incorporated by reference to Exhibit 10.37 to Scientific Games Corporation's Annual Report on Form 10-K for the year ended December 31, 2008).* | |
10.26 | Letter Agreement, dated as of September 28, 2011, by and between Scientific Games Corporation and Larry A. Potts, which amended Mr. Potts' Employment Agreement dated as of January 1, 2006, as amended by the Letter Agreement dated as of October 2, 2008 and the Amendment dated as of December 30, 2008 (incorporated by reference to Exhibit 10.2 to Scientific Games Corporation's Current Report on Form 8-K filed on October 3, 2011).* | |
10.27 | Letter Agreement, dated as of April 30, 2014, by and between Scientific Games Corporation and Larry A. Potts, which amended Mr. Potts' Employment Agreement dated as of January 1, 2006, as amended by the Letter Agreement dated as of October 2, 2008, the Amendment dated as of December 30, 2008 and the Letter Agreement dated as of September 28, 2011(incorporated by reference to Exhibit 10.26 to Scientific Games Corporation's Annual Report on Form 10-K for the year ended December 31, 2014).* | |
10.28 | Letter Agreement, dated as of May 1, 2015, by and between Scientific Games Corporation and Larry A. Potts, which amended Mr. Potts' Employment Agreement dated as of January 1, 2006, as amended by the Letter Agreement dated as of October 2, 2008, the Amendment dated as of December 30, 2008, the Letter Agreement dated as of September 28, 2011, and the Letter Agreement dated as of April 30, 2014 (incorporated by reference to Exhibit 10.1 to Scientific Games Corporation's Current Report on Form 8-K filed on May 6, 2015).* | |
10.29 | Employment Agreement dated as of December 5, 2013 by and between Scientific Games Corporation and David L. Kennedy (incorporated by reference to Exhibit 10.44 to Scientific Games Corporation's Annual Report on Form 10-K for the year ended December 31, 2013).* | |
10.30 | Employment Agreement, dated as of June 9, 2014, by and between Scientific Games Corporation and David L. Kennedy (incorporated by reference to Exhibit 10.2 to Scientific Games Corporation's Current Report on Form 8-K filed on June 10, 2014).* | |
10.31 | Letter Agreement dated as of July 31, 2014 between Scientific Games Corporation and David L. Kennedy (incorporated by reference to Exhibit 10.3 to Scientific Games Corporation's Quarterly Report on Form 10-Q for the quarter ended September 30, 2014).* | |
10.32 | Employment Agreement, dated as of June 9, 2014, by and between Scientific Games Corporation and M. Gavin Isaacs (incorporated by reference to Exhibit 10.1 to Scientific Games Corporation's Current Report on Form 8-K filed on June 10, 2014).* | |
136
10.33 | Form of Inducement Equity Award Agreement between Scientific Games Corporation and M. Gavin Isaacs (incorporated by reference to Exhibit 4.4 to Scientific Games Corporation's Registration Statement on Form S-8 (No. 333-197948) filed on August 7, 2014).* | |
10.34 | Amendment to Employment Agreement dated as of October 29, 2015 by and between Scientific Games Corporation and M. Gavin Isaacs, which amended Mr. Isaacs’ Employment Agreement dated as of June 9, 2014 (incorporated by reference to Exhibit 10.45 to Scientific Games Corporation’s Annual Report on Form 10-K for the year ended December 31, 2015).* | |
10.35 | Modification Agreement dated as of August 4, 2016 by and between Scientific Games Corporation and M. Gavin Isaacs, which modified Mr. Isaacs’ Employment Agreement dated as of June 9, 2014 and amended on October 29, 2015 (incorporated by reference to Exhibit 10.4 to Scientific Games Corporation's Quarterly Report on Form 10-Q for the quarter ended September 30, 2016).* | |
10.36 | Employment Agreement dated as of December 8, 2014 between Scientific Games Corporation and Richard Haddrill (incorporated by reference to Exhibit 10.29 to Scientific Games Corporation's Annual Report on Form 10-K for the year ended December 31, 2014).* | |
10.37 | Letter Agreement, dated as of October 29, 2015, by and between Scientific Games Corporation and Richard Haddrill, which amended Mr. Haddrill's Employment Agreement dated as of December 8, 2014 (incorporated by reference to Exhibit 10.2 to Scientific Games Corporation's Quarterly Report on Form 10-Q for the quarter ended September 30, 2015).* | |
10.38 | Amended and Restated Executive Employment Agreement, dated April 1, 2014, by and among Scientific Games Corporation, WMS Industries Inc. and Scott D. Schweinfurth (incorporated by reference to Exhibit 10.1 to Scientific Games Corporation's Quarterly Report on Form 10-Q for the quarter ended March 31, 2014).* | |
10.39 | Separation Agreement dated as of November 12, 2015 by and between Scientific Games Corporation, Bally Gaming, Inc. and Scott D. Schweinfurth (incorporated by reference to Exhibit 10.46 to Scientific Games Corporation’s Annual Report on Form 10-K for the year ended December 31, 2015).* | |
10.40 | Employment Agreement made as of August 1, 2011 by and between Scientific Games Corporation and Jeffrey Johnson (incorporated by reference to Exhibit 10.1 to Scientific Games Corporation's Current Report on Form 8-K filed on July 26, 2011).* | |
10.41 | First Amendment to Employment Agreement, dated as of May 28, 2015, by and between Scientific Games Corporation and Jeffrey Johnson, which amended Mr. Johnson’s Employment Agreement dated as of August 1, 2011 (incorporated by reference to Exhibit 10.3 to Scientific Games Corporation's Quarterly Report on Form 10-Q for the quarter ended June 30, 2015).* | |
10.42 | Agreement and General Release dated as of October 1, 2016 by and between Scientific Games Corporation and Jeffrey Johnson, which modified Mr. Johnson’s Employment Agreement dated as of August 2, 2011 and amended on May 28, 2015 (incorporated by reference to Exhibit 10.5 to Scientific Games Corporation's Quarterly Report on Form 10-Q for the quarter ended September 30, 2016).* | |
10.43 | Agreement and General Release dated as of August 28, 2015 by and between Bally Gaming, Inc., Scientific Games Corporation and Kathryn Lever (incorporated by reference to Exhibit 10.49 to Scientific Games Corporation’s Annual Report on Form 10-K for the year ended December 31, 2015).* | |
10.44 | Written Summary of Amendments 1 through 5, by and between Bally Gaming, Inc., Scientific Games Corporation and Kathryn Lever and entered into via electronic mail, to the Agreement and General Release dated as of August 28, 2015 by and between the same parties (incorporated by reference to Exhibit 10.50 to Scientific Games Corporation’s Annual Report on Form 10-K for the year ended December 31, 2015).* | |
137
10.45 | Sixth Amendment to Agreement and General Release dated as of November 3, 2015 by and between Bally Gaming, Inc., Scientific Games Corporation and Kathryn Lever (incorporated by reference to Exhibit 10.51 to Scientific Games Corporation’s Annual Report on Form 10-K for the year ended December 31, 2015).* | |
10.46 | Employment Agreement dated as of August 28, 2014 between Scientific Games Corporation and Steven W. Beason (incorporated by reference to Exhibit 10.7 to Scientific Games Corporation's Quarterly Report on Form 10-Q for the quarter ended September 30, 2014).* | |
10.47 | Agreement and General Release dated as of November 15, 2016 by and between Scientific Games Corporation and Steve Wayne Beason, which modified Mr. Beason’s Employment Agreement dated as of August 28, 2014.*(†) | |
10.48 | Scientific Games Corporation 2016 Employee Stock Purchase Plan (incorporated by reference to Appendix A to Scientific Games Corporation’s Proxy Statement on Schedule 14A filed on April 29, 2016).* | |
12 | Computation of Ratio of Earnings to Fixed Charges.(†) | |
21 | List of Subsidiaries.(†) | |
23.1 | Consent of Deloitte & Touche LLP, Independent Registered Public Accounting Firm.(†) | |
23.2 | Consent of EY S.p.A., Independent Registered Public Accounting Firm.(†) | |
31.1 | Certification of Chief Executive Officer pursuant to Rule 13a-14(a) under the Securities Exchange Act of 1934.(†) | |
31.2 | Certification of Chief Financial Officer pursuant to Rule 13a-14(a) under the Securities Exchange Act of 1934.(†) | |
32.1 | Certification of Chief Executive Officer pursuant to 18 U.S.C. Section 1350, as adopted pursuant to Section 906 of the Sarbanes-Oxley Act of 2002.(†) | |
32.2 | Certification of Chief Financial Officer pursuant to 18 U.S.C. Section 1350, as adopted pursuant to Section 906 of the Sarbanes-Oxley Act of 2002.(†) | |
99.1 | Report of Reconta Ernst & Young S.p.A., Independent Registered Public Accounting Firm.(†) | |
99.2 | Financial Statements of Lotterie Nazionali S.r.l.(†) | |
99.3 | Form of Equity Award Notice-RSUs-Employees under the Scientific Games Corporation 2003 Incentive Compensation Plan (incorporated by reference to Exhibit 99.(d)(2) to Scientific Games Corporation's Schedule TO filed on July 19, 2011).* | |
99.4 | Form of Equity Award Notice-RSUs-Non-Employee Directors under the Scientific Games Corporation 2003 Incentive Compensation Plan (incorporated by reference to Exhibit 99.(d)(3) to Scientific Games Corporation's Schedule TO filed on July 19, 2011).* | |
99.5 | Terms and Conditions of Equity Awards to Key Employees under the Scientific Games Corporation 2003 Incentive Compensation Plan (incorporated by reference to Exhibit 99.(d)(4) to Scientific Games Corporation's Schedule TO filed on July 19, 2011).* | |
138
99.6 | Terms and Conditions of Equity Awards to Non-Employee Directors under the Scientific Games Corporation 2003 Incentive Compensation Plan (incorporated by reference to Exhibit 99.(d)(5) to Scientific Games Corporation's Schedule TO filed on July 19, 2011).* | |
99.7 | Form of Equity Awards Notice (Stock Options, Restricted Stock Units and Performance-Conditioned Restricted Stock Units) under the Scientific Games Corporation 2003 Incentive Compensation Plan (as amended and restated June 11, 2014) (incorporated by reference to Exhibit 99.8 to Scientific Games Corporation's Annual Report on Form 10-K for the year ended December 31, 2014).* | |
99.8 | Terms and Conditions of Equity Awards to Employees under the Scientific Games Corporation 2003 Incentive Compensation Plan (as amended and restated June 11, 2014) (incorporated by reference to Exhibit 99.9 to Scientific Games Corporation's Annual Report on Form 10-K for the year ended December 31, 2014).* | |
99.9 | Terms and Conditions of Equity Awards to Non-Employee Directors under the Scientific Games Corporation 2003 Incentive Compensation Plan (as amended and restated June 11, 2014) (incorporated by reference to Exhibit 99.10 to Scientific Games Corporation's Annual Report on Form 10-K for the year ended December 31, 2014).* | |
99.10 | Terms and Conditions of Equity Awards to Consultants under the Scientific Games Corporation 2003 Incentive Compensation Plan (as amended and restated June 11, 2014) (incorporated by reference to Exhibit 99.11 to Scientific Games Corporation's Annual Report on Form 10-K for the year ended December 31, 2014).* | |
99.11 | Terms and Conditions of Equity Awards to Key Employees under the Scientific Games Corporation 2003 Incentive Compensation Plan (incorporated by reference to Exhibit 99.1 to Scientific Games Corporation's Quarterly Report on Form 10-Q for the quarter ended June 30, 2016).* | |
99.12 | Gaming Regulations.(†) | |
101.INS | XBRL Instance Document | |
101.SCH | XBRL Taxonomy Extension Schema | |
101.CAL | XBRL Taxonomy Extension Calculation Linkbase | |
101.DEF | XBRL Taxonomy Definition Label Linkbase | |
101.LAB | XBRL Taxonomy Extension Label Linkbase | |
101.PRE | XBRL Taxonomy Extension Presentation Linkbase | |
* Management contracts and compensation plans and arrangements.
(†) Filed herewith.
139