Attached files
| file | filename |
|---|---|
| EX-32 - EXHIBIT 32 - NATIONAL RESEARCH CORP | ex32.htm |
| EX-31.2 - EXHIBIT 31.2 - NATIONAL RESEARCH CORP | ex31-2.htm |
| EX-31.1 - EXHIBIT 31.1 - NATIONAL RESEARCH CORP | ex31-1.htm |
| EX-23 - EXHIBIT 23 - NATIONAL RESEARCH CORP | ex23.htm |
| EX-21 - EXHIBIT 21 - NATIONAL RESEARCH CORP | ex21.htm |
UNITED STATES
SECURITIES AND EXCHANGE COMMISSION
Washington, D.C. 20549
FORM 10-K
|
[X] |
ANNUAL REPORT PURSUANT TO SECTION 13 OR 15(d) OF THE SECURITIES EXCHANGE ACT OF 1934 |
For the fiscal year ended December 31, 2016
or
|
[ ] |
TRANSITION REPORT PURSUANT TO SECTION 13 OR 15(d) OF THE SECURITIES EXCHANGE ACT OF 1934 |
For the transition period from _______________ to _______________
Commission file number: 0-29466
National Research Corporation
(Exact name of registrant as specified in its charter)
|
Wisconsin (State or other jurisdiction of incorporation or organization) |
47-0634000 (I.R.S. Employer Identification No.) |
|
1245 Q Street Lincoln, Nebraska (Address of principal executive offices) |
68508 (Zip code) |
Registrant’s telephone number, including area code: (402) 475-2525
Securities registered pursuant to Section 12(b) of the Act:
| Title of Class | Name of Each Exchange on Which Registered |
|
Class A Common Stock, $.001 par value Class B Common Stock, $.001 par value |
The NASDAQ Stock Market The NASDAQ Stock Market |
Securities registered pursuant to Section 12(g) of the Act: None
Indicate by check mark if the registrant is a well-known seasoned issuer, as defined in Rule 405 of the Securities Act.
Yes ☐ No ☒
Indicate by check mark if the registrant is not required to file reports pursuant to Section 13 or Section 15(d) of the Act.
Yes ☐ No ☒
Indicate by check mark whether the registrant (1) has filed all reports required to be filed by Section 13 or 15(d) of the Securities Exchange Act of 1934 during the preceding 12 months (or for such shorter period that the registrant was required to file such reports), and (2) has been subject to such filing requirements for the past 90 days. Yes ☒ No ☐
Indicate by check mark whether the registrant has submitted electronically and posted on its corporate Web site, if any, every Interactive Data File required to be submitted and posted pursuant to Rule 405 of Regulation S-T during the preceding 12 months (or for such shorter period that the registrant was required to submit and post such files). Yes ☒ No ☐
Indicate by check mark if disclosure of delinquent filers pursuant to Item 405 of Regulation S-K is not contained herein, and will not be contained, to the best of registrant’s knowledge, in definitive proxy or information statements incorporated by reference in Part III of this Form 10-K or any amendment to this Form 10-K. ☒
Indicate by check mark whether the registrant is a large accelerated filer, an accelerated filer, a non-accelerated filer or a smaller reporting company. See the definitions of “large accelerated filer,” “accelerated filer” and “smaller reporting company” in Rule 12b-2 of the Exchange Act.
Large accelerated filer ☐ Accelerated filer ☒ Non-accelerated filer ☐ Smaller reporting company ☐
Indicate by check mark whether the registrant is a shell company (as defined in Rule 12b-2 of the Act.) Yes ☐ No ☒
Aggregate market value of the class A common stock and the class B common stock held by non-affiliates of the registrant at June 30, 2016: $239,916,362.
Indicate the number of shares outstanding of each of the issuer’s classes of common stock, as of the latest practicable date.
Class A Common Stock, $0.001 par value, outstanding as of February 17, 2017: 20,911,579 shares
Class B Common Stock, $0.001 par value, outstanding as of February 17, 2017: 3,541,026 shares
DOCUMENTS INCORPORATED BY REFERENCE
Portions of the Proxy Statement for the 2017 Annual Meeting of Shareholders are incorporated by reference into Part III.
TABLE OF CONTENTS
|
Page |
||
|
PART I |
||
|
Item 1. |
Business |
1 |
|
Item 1A. |
Risk Factors |
9 |
|
Item 1B. |
Unresolved Staff Comments |
14 |
|
Item 2. |
Properties |
14 |
|
Item 3. |
Legal Proceedings |
14 |
|
Item 4. |
Mine Safety Disclosures |
14 |
|
PART II |
||
|
Item 5. |
Market for Registrant’s Common Equity, Related Stockholder Matters and Issuer Purchases of Equity Securities |
15 |
|
Item 6. |
Selected Financial Data |
17 |
|
Item 7. |
Management’s Discussion and Analysis of Financial Condition and Results of Operations |
18 |
|
Item 7A. |
Quantitative and Qualitative Disclosure About Market Risk |
28 |
|
Item 8. |
Financial Statements and Supplementary Data |
29 |
|
Item 9. |
Changes in and Disagreements with Accountants on Accounting and Financial Disclosure |
58 |
|
Item 9A. |
Controls and Procedures |
58 |
|
Item 9B. |
Other Information |
58 |
|
PART III |
||
|
Item 10. |
Directors, Executive Officers and Corporate Governance |
60 |
|
Item 11. |
Executive Compensation |
60 |
|
Item 12. |
Security Ownership of Certain Beneficial Owners and Management and Related Shareholder Matters |
60 |
|
Item 13. |
Certain Relationships and Related Transactions, and Director Independence |
61 |
|
Item 14. |
Principal Accountant Fees and Services |
61 |
|
PART IV |
||
|
Item 15. |
Exhibits and Financial Statement Schedules |
62 |
|
Signatures |
65 |
|
PART I
Item 1. Business
Special Note Regarding Forward-Looking Statements
Certain matters discussed in this Annual Report on Form 10-K are “forward-looking statements” within the meaning of Section 21E of the Securities Exchange Act of 1934, as amended. These forward-looking statements can generally be identified as such because the context of the statement includes phrases such as National Research Corporation, doing business as NRC Health (“NRC Health,” the “Company,” “we,” “our,” “us” or similar terms), “believes,” “expects,” or other words of similar import. Similarly, statements that describe the Company’s future plans, objectives or goals are also forward-looking statements. Such forward-looking statements are subject to certain risks and uncertainties which could cause actual results or outcomes to differ materially from those currently anticipated. Factors that could affect actual results or outcomes include, without limitation, the following factors:
|
● |
The possibility of non-renewal of the Company’s client service contracts and retention of key clients; |
|
● |
The Company’s ability to compete in its markets, which are highly competitive, and the possibility of increased price pressure and expenses; |
|
● |
The effects of an economic downturn; |
|
● |
The impact of consolidation in the healthcare industry; |
|
● |
The impact of federal healthcare reform legislation or other regulatory changes; |
|
● |
The Company’s ability to attract and retain key managers and other personnel; |
|
● |
The possibility that the Company’s intellectual property and other proprietary information technology could be copied or independently developed by its competitors; |
|
● |
The possibility that the Company could be subject to security breaches or computer viruses; and |
|
● |
The factors set forth under the caption “Risk Factors” in Part I, Item 1A of this Annual Report on Form 10-K. |
Shareholders, potential investors and other readers are urged to consider these and other factors in evaluating the forward-looking statements, and are cautioned not to place undue reliance on such forward-looking statements. The forward-looking statements included are only made as of the date of this Annual Report on Form 10-K and the Company undertakes no obligation to publicly update such forward-looking statements to reflect subsequent events or circumstances.
General
The Company is a leading provider of analytics and insights that facilitate measurement and improvement of the patient and employee experience while also increasing patient engagement and customer loyalty for healthcare providers, payers and other healthcare organizations. The Company’s solutions enable its clients to understand the voice of the customer with greater clarity, immediacy and depth. NRC Health’s heritage, proprietary methods, and holistic approach enable our partners to better understand the people they care for and design experiences that inspire loyalty and trust, while also facilitating regulatory compliance and the shift to population-based health management. The Company’s ability to measure what matters most and systematically capture, analyze and deliver insights based on self-reported information from patients, families and consumers is critical in today’s healthcare market. NRC Health believes that access to and analysis of its extensive consumer-driven information is becoming more valuable as healthcare providers increasingly need to more deeply understand and engage patients and consumers in an effort towards effective population-based health management.
NRC Health’s expertise includes the efficient capture, interpretation, transmittal and benchmarking of critical data elements from millions of healthcare consumers. Using its portfolio of solutions through internet-based business intelligence tools, the Company’s clients gain insights into what people think and feel about their organizations in real-time, allowing them to build on their strengths and resolve service issues with greater speed and personalization. The Company’s clients are also able to access networking groups, on-line education and an extensive library of performance improvement material that can be tailored to each of their unique needs.
The Company’s portfolio of subscription-based solutions provide actionable information and analysis to healthcare organizations and payers across a range of mission-critical, constituent-related elements, including patient experience and satisfaction, community population health risks, workforce engagement, community perceptions, and physician engagement. NRC Health partners with clients across the continuum of healthcare services. The Company’s clients range from integrated health systems and post-acute providers, such as home health, long term care and hospice, to numerous payer organizations. The Company believes this cross-continuum positioning is a unique and an increasingly important capability as evolving payment models drive healthcare providers and payers towards a more collaborative and integrated service model.
NRC Health has achieved a market leadership position through its more than 35 years of industry innovation and experience, as well as its long-term, recurring revenue relationships (solutions that are used or required by a client each year) with many of the healthcare industry’s largest organizations. Since its founding in 1981, the Company has focused on meeting the evolving information needs of the healthcare industry through internal product development, as well as select acquisitions. The Company is a Wisconsin corporation headquartered in Lincoln, Nebraska.
Industry and Market Opportunity
According to the Centers for Medicare and Medicaid Services (“CMS”), health expenditures in the United States were approximately $3.2 trillion in 2015, or $9,990 per person. In total, health spending accounted for 17.8% of the nation’s Gross Domestic Product in 2015. Addressing this growing expenditure burden continues to be a major policy priority at both federal and state levels. In addition, continued unemployed and underemployed rates and lower incomes for many Americans coupled with increased co-pays and deductibles in healthcare plans have focused even more consumer attention on health spending and affordability. In the public sector, Medicare provides health coverage for individuals aged 65 and older, while Medicaid provides coverage for low income families and other individuals in need. Both programs are administered by the CMS. With the aging of the U.S. population, Medicare enrollment has increased significantly. In addition, longer life spans and greater prevalence of chronic illnesses among both the Medicare and Medicaid populations have placed tremendous demands on the health care system.
Driven by escalating costs and a growing recognition of the challenges of chronic care and unnecessary hospitalizations, Medicare reimbursement for healthcare providers is shifting from a volume-based approach (fees paid for each element of service rendered, independent of outcome) to a more value-based model, where reimbursement is based on the value (or quality) of the healthcare service delivered. The establishment of standardized quality-focused datasets and the requirement that providers capture and transmit this data to CMS has enabled this shift.
An increasing percentage of Medicare reimbursement and reimbursement from commercial payers will be determined under value payment models, based on factors such as patient readmission rates and provider adherence to certain quality-related protocols. At the same time, many hospitals and other providers are creating new models of care delivery to improve patient experience, reduce cost and provide better clinical outcomes. These new models are based on sharing financial risk and managing the health and behaviors of large populations of patients and consumers. Certain of these new models are known as accountable care organizations, or ACOs, and medical homes, in which multiple provider organizations are coordinated in providing care and bearing shared financial risk in serving a defined patient population. This transformation towards value-based payment models and increased engagement of healthcare consumers is resulting in a greater need for providers to deliver more customer-centric healthcare.
NRC Health believes that its current portfolio of solutions is aligned to address this evolving market opportunity. The Company provides tools and solutions to capture, interpret and improve the data required by CMS as well as enhanced capabilities that capture insights about patient health risks, behaviors and perceptions. The information and analytics provided through these solutions enable payers and providers to better understand what matters most to people at key moments in their relationship with a health organization. NRC Health’s solutions enable its clients to design experiences to improve the wellbeing of the people and communities they care for. In addition, the Company’s portfolio of experience solutions helps providers address and impact the types of behaviors that could result in reduced hospital re-admission rates, and a direct and measurable impact on providers’ revenue.
Finally, the Company believes that its ability to offer these insights across the entire care continuum is particularly relevant as new reimbursement models reward collaboration amongst different types of providers. Bundled payments, medical home, ACOs and other models of reimbursement for population-based health management all require effective coordination of care both within and outside of the traditional acute care settings.
NRC Health’s Solutions
NRC Health’s portfolio of solutions are designed to help healthcare companies understand the totality of how their organizations are experienced by the people they serve. NRC Health’s solutions address specific needs around market insight, experience, transparency, and governance for healthcare providers, payers and other healthcare organizations. While each distinct solution provides discernible value on a stand-alone basis, the Company believes that in combination, its solutions provide value through a comprehensive view of healthcare consumers both within healthcare settings and outside of those settings—creating a differentiated solution set to address the emerging needs for population-based health management.
NRC Health’s Market Insights Solutions – NRC Health’s Market Insights solutions are subscription-based services that allow for improved tracking of awareness, perception, and consistency of healthcare brands; real-time assessment of competitive differentiators; and enhanced segmentation tools to evaluate the needs, wants, and behaviors of communities through real-time competitive assessments and enhanced segmentation tools. NRC Health’s Market Insights is the largest U.S. healthcare consumer database of its kind, measuring the opinions and behaviors of 310,000 healthcare consumers in the top 300 markets across the country annually. NRC Health’s Market Insights is a syndicated survey that provides clients with an independent third-party source of information that is used to understand consumer perception and preferences and optimize marketing strategies. NRC Health’s Market Insights solutions provide clients with on-demand tools to measure brand value and build brand equity in their markets, evaluate and optimize advertising efficacy and consumer recall, and tailor research to obtain the real time voice of customer feedback to support branding and loyalty initiatives. The Company’s Market Insights solutions were historically marketed under the Healthcare Market Guide and Ticker brands.
NRC Health’s Experience Solutions – NRC Health’s Experience solutions provide hospitals and healthcare providers the ability to receive and take action on customer and employee feedback across all care settings in real-time. Experience solutions include patient and resident experience, workforce engagement, health risk assessments, transitions, and improvement tools. These solutions enable clients to comply with regulatory requirements and to improve their reimbursement under value-based purchasing models. More importantly, NRC Health’s Experience solutions provide quantitative and qualitative real-time feedback, improvement plans, and coaching tools to enable clients to improve the experiences of patients, residents, physicians and staff. By illuminating the complete care journey in real time, the Company’s clients are able to ensure each individual receives the care, respect, and experience he or she deserves. Developing a longitudinal profile of what healthcare customers want and need allows for organizational improvement, increased clinician and staff engagement, loyal relationships and personal well-being.
NRC Health’s Experience solutions are provided on a subscription basis via a cross-continuum platform that collects and measures data and then delivers business intelligence that the Company’s clients utilize to improve patient experience, engagement and loyalty. Patient data can be collected on a longitudinal basis for improvement and regulatory compliance purposes as well as on a real time basis to support service recovery, rapid cycle improvement, and engagement activities. NRC Health provides these performance results and prescriptive analytics to its clients via web-based improvement planning and business intelligence portals. These solutions have previously been marketed under NRC Picker, My InnerView (“MIV”), Customer-Connect LLC (doing business as Connect), and NRC Canada.
NRC Health’s Transitions solutions are provided to healthcare organizations on a subscription basis to drive effective communication between healthcare providers and patients in the critical 24-72 hours post discharge using a discharge call program. Through preference-based communications and real-time alerts, these solutions enable organizations to identify and manage high-risk patients to reduce readmissions, increase patient satisfaction and support safe care transitions. Tracking, trending and benchmarking tools isolate the key areas for process improvement allowing organizations to implement changes and reduce future readmissions. NRC Health’s Transitions solutions were previously provided by Connect. Connect was formed in June 2013 to develop and provide patient outreach and discharge call solutions. NRC Health originally had a 49% ownership interest in Connect but by March 2016 had acquired all of the remaining interest and subsequently dissolved Customer-Connect LLC in June 2016.
NRC Health’s Health Risk Assessment solutions (formerly Payer Solutions) enable the Company’s clients to understand the health risks associated with populations of patients, analyze and address readmission risks, and efficiently reach out to patients to impact their behaviors outside of the healthcare provider settings. These health risk assessment solutions enable clients to effectively segment populations and manage care for those who are most at-risk, engage individuals, increase preventative care and manage wellness programs to improve patient experience and outcomes.
NRC Health’s Transparency Solutions – NRC Health’s Transparency solutions allow healthcare organizations to share a picture of their organization and ensure that timely and relevant content informs better consumer decision-making. NRC Health’s star ratings solution (formerly Reputation) enables clients to publish a five-star rating metric and verified patient feedback derived from actual patient survey data to complement their online physician information. Sharing this feedback not only results in better-informed consumer decision-making but also has the ability to drive new patient acquisition and grow online physician reputation. NRC Health’s reputation monitoring solution alerts clients to ratings and reviews on third-party websites and provides workflows for response and service recovery. These solutions raise physician awareness of survey results and provide access to improvement resources and educational development opportunities designed to improve the way care is delivered.
NRC Health’s Governance Solutions – NRC Health’s Governance solutions, branded as The Governance Institute (“TGI”), serves not-for-profit hospital and health system boards of directors, executives, and physician leadership. TGI’s subscription-based, value-driven membership services are provided through national conferences, publications, advisory services, and an on-line portal designed to improve the effectiveness of hospital and healthcare systems by continually strengthening their board governance, strategic planning, medical leadership, management performance, and transparency positioning. TGI also conducts research studies and tracks industry trends showcasing emerging healthcare trends and best practice solutions of healthcare boards across the country.
NRC Health’s Competitive Strengths
The Company believes that its competitive strengths include the following:
A leading provider of patient experience solutions for healthcare providers, payers and other healthcare organizations. The Company’s history is based on capturing the voice of the consumer in healthcare markets. The Company’s solutions build on the “Eight Dimensions of Patient-Centered Care,” a philosophy developed by noted patient advocate Harvey Picker, who believed patients’ experiences are integral to quality healthcare. NRC Health has extended this philosophy to include families, caregivers, employees and other stakeholders.
Premier client portfolio across the care continuum. NRC Health’s client portfolio encompasses leading healthcare organizations across the healthcare continuum, from acute care hospitals and post-acute providers to healthcare payers. The Company’s client base is diverse, with its top ten clients representing approximately 17% of total revenue for the year ended December 31, 2016 and no single client representing more than 5% of the Company’s revenue.
Highly scalable and visible revenue model. The Company’s solutions are offered to healthcare providers, payers and other healthcare organizations primarily through subscription-based service agreements. The solutions NRC Health provides are also recurring in nature, which enables an ongoing relationship with its clients. This combination of subscription-based revenue, a base of ongoing client renewals and automated platforms creates a highly visible and scalable revenue model for the Company.
Comprehensive portfolio of solutions. Since NRC Health offers solutions encompassing market insights, experience, transparency, and governance, its clients can engage with the Company at multiple levels and, over time, increase their commitment and the financial value of their business relationship.
Exclusive focus on healthcare. The Company focuses exclusively on healthcare and serving the unique needs of healthcare organizations across the continuum, which NRC Health believes gives it a distinct competitive advantage compared to other survey and analytics software providers. The Company’s platform includes features and capabilities built specifically for healthcare providers, including a library of performance improvement content which can be tailored to the provider based on their specific customer feedback profile.
Experienced senior management team led by NRC Health’s founder. NRC Health’s senior management team has extensive industry and leadership experience. Michael D. Hays, the Company’s Chief Executive Officer, founded NRC Health in 1981. Prior to launching the Company, Mr. Hays served as Vice President and as a Director of SRI Research Center, Inc. (now known as the Gallup Organization). The Chief Financial Officer, Kevin Karas, CPA, has extensive financial experience having served as CFO at two previous companies, along with healthcare experience at Rehab Designs of America, Inc. and NovaCare, Inc. Steven D. Jackson, the Company’s President, served as Chief Strategy Officer for Vocera Communications, and he also served as Chief Operating Officer for ExperiaHealth.
Competition
The healthcare information and market research services industry is highly competitive. The Company has traditionally competed with healthcare organizations’ internal marketing, market research, and/or quality improvement departments which create their own performance measurement tools, and with relatively small specialty research firms which provide survey-based healthcare market research and/or performance assessment. The Company’s primary competitors among such specialty firms include Press Ganey, which has significantly higher annual revenue than the Company, and three or four other organizations that NRC Health believes have less annual revenue than the Company. The Company, to a certain degree, currently competes with, and anticipates that in the future it may increasingly compete with, (1) traditional market research firms which are significant providers of survey-based, general market research and (2) firms which provide services or products that complement healthcare performance assessments such as healthcare software or information systems. Although only a few of these competitors have offered specific services that compete directly with the Company’s solutions, many of these competitors have substantially greater financial, information gathering, and marketing resources than the Company and could decide to increase their resource commitments to the Company’s market. There are relatively few barriers to entry into the Company’s market, and the Company expects increased competition in its market which could adversely affect the Company’s operating results through pricing pressure, increased marketing expenditures, and market share losses, among other factors. There can be no assurance that the Company will continue to compete successfully against existing or new competitors.
The Company believes the primary competitive factors within its market include quality of service, timeliness of delivery, unique service capabilities, credibility of provider, industry experience, and price. NRC Health believes that its industry leadership position, exclusive focus on the healthcare industry, cross-continuum presence, comprehensive portfolio of solutions and relationships with leading healthcare payers and providers position the Company to compete in this market.
Growth Strategy
NRC Health believes that the value proposition of its current solutions, combined with the favorable alignment of its solutions with emerging market demand, positions the Company to benefit from multiple growth opportunities. The Company believes that it can accelerate its growth through (1) increasing sales of its existing solutions to its existing clients (or cross-selling), (2) winning additional new clients through market share growth in existing market segments, (3) developing and introducing new solutions to new and existing clients, and (4) pursuing acquisitions of, or investments in, firms providing products, solutions or technologies which complement those of the Company.
Selling additional solutions to existing clients. Approximately 20% of the Company’s existing clients purchase more than one of its solutions. NRC Health’s sales organization actively identifies and pursues these cross-sell opportunities in order to accelerate the growth of the Company.
Adding new clients. NRC Health believes that there is an opportunity to add new clients in each of the acute care, post-acute care and health plan market segments. The Company’s sales organization is actively identifying and engaging new client prospects in each of the segments noted above, with a focus on featuring its comprehensive cross continuum portfolio of solutions.
Adding new solutions. The need for growth, engagement and informing solutions in the market segments that NRC Health serves is evolving to align with emerging healthcare regulatory and reimbursement trends. The evolving market creates an opportunity for the Company to introduce new solutions that leverage its existing core competencies. The Company believes that there is an opportunity to drive sales growth with both existing and new clients, across all of the market segments that it serves, through the introduction of new solutions.
Pursue Strategic Acquisitions. The Company has historically complemented its organic growth with strategic acquisitions, having completed seven such transactions over the past fifteen years. These transactions have added new capabilities and access to market segments that are adjacent and complementary to the Company’s existing solutions and market segments. NRC Health believes that additional strategic acquisition opportunities exist for the Company to complement its organic growth by further expanding its service capabilities, technology offerings and end markets.
Sales and Marketing
The Company generates the majority of its revenue from the renewal of subscription-based client service agreements, supplemented by sales of other solutions to existing clients and the addition of new clients. NRC Health sales activities are carried out by a direct sales organization staffed with professional, trained sales associates. As compared to the typical industry practice of compensating sales associates with relatively high base pay and a relatively small sales commission, NRC Health compensates its sales staff with relatively low base pay and a relatively high commission component. The Company believes this compensation structure provides incentives to its sales associates to surpass sales goals and increases the Company’s ability to attract top-quality sales associates.
NRC Health conducts various marketing programs to generate new opportunities for its sales organization. The Company also maintains an active public relations program which includes (1) an ongoing presence in leading industry trade press and in the mainstream press, (2) public speaking at strategic industry conferences, (3) fostering relationships with key industry constituencies, and (4) annual awards programs that recognize top-ranking healthcare organizations.
Clients
NRC Health’s clients include many of the nation’s largest healthcare systems. The Company provides solutions to over 61 payer health plans and 145 of the 200 largest health systems.
The Company’s ten largest clients accounted for 17%, 15%, and 16% of the Company’s total revenue in 2016, 2015 and 2014, respectively. Approximately 5% of the Company’s revenue was derived from foreign customers in 2016 and 2015 and 7% in 2014.
For financial information by geographic area, see Note 14 to the Company’s consolidated financial statements.
Intellectual Property and Other Proprietary Rights
The Company’s success depends in part upon its data collection processes, research methods, data analysis techniques and internal systems, and procedures that it has developed specifically to serve clients in the healthcare industry. The Company has no patents. Consequently, it relies on a combination of copyright and trade secret laws and associate nondisclosure agreements to protect its systems, survey instruments and procedures. There can be no assurance that the steps taken by the Company to protect its rights will be adequate to prevent misappropriation of such rights or that third parties will not independently develop functionally equivalent or superior systems or procedures. The Company believes that its systems and procedures and other proprietary rights do not infringe upon the proprietary rights of third parties. There can be no assurance, however, that third parties will not assert infringement claims against the Company in the future or that any such claims will not result in protracted and costly litigation, regardless of the merits of such claims or whether the Company is ultimately successful in defending against such claims.
Associates
As of December 31, 2016, the Company employed a total of 372 persons on a full-time basis. In addition, as of such date, the Company had 32 part-time associates primarily in its survey operations, representing approximately 16 full-time equivalent associates. None of the Company’s associates are represented by a collective bargaining unit. The Company considers its relationship with its associates to be good.
Executive Officers of the Company
The following table sets forth certain information as of February 1, 2017, regarding the executive officers of the Company:
|
Name |
Age |
Position |
|
Michael D. Hays |
62 |
Chief Executive Officer |
|
Steven D. Jackson |
41 |
President |
|
Kevin R. Karas |
59 |
Senior Vice President Finance, Chief Financial Officer, Treasurer and Secretary |
Michael D. Hays has served as Chief Executive Officer and a director since he founded the Company in 1981. He also served as President of the Company from 1981 to 2004 and from July 2008 to July 2011. Prior to founding the Company, Mr. Hays served for seven years as a Vice President and a director of SRI Research Center, Inc. (n/k/a the Gallup Organization).
Steven D. Jackson has served as President of the Company since October 2015. He served as Group President from October 2014 until September 2015, during which time he oversaw the Company’s Market Insights, Transparency, and Predictive Analytics business units. Prior to joining the Company, Mr. Jackson served as Chief Strategy Officer for Vocera Communications where he was employed from 2007 to 2014. He also served as Chief Operating Officer for ExperiaHealth, a subsidiary of Vocera. Earlier in his career, Mr. Jackson held positions of increasing responsibility at The Advisory Board Company, Neoforma, and Stockamp & Associates.
Kevin R. Karas has served as Chief Financial Officer, Treasurer and Secretary of the Company since September 2011, and as Senior Vice President Finance since he joined the Company in December 2010. From 2005 to 2010, he served as Vice President of Finance for Lifetouch Portrait Studios, Inc., a national retail photography company. Mr. Karas also previously served as Chief Financial Officer at CARSTAR, Inc., an automobile collision repair franchise business, from 2000 to 2005, Chief Financial Officer at Rehab Designs of America, Inc., a provider of orthotic and prosthetic services, from 1993 to 2000, and as a regional Vice President of Finance and Vice President of Operations at Novacare, Inc., a provider of physical rehabilitation services, from 1988 to 1993. He began his career as a Certified Public Accountant at Ernst & Young.
Executive officers of the Company are elected by and serve at the discretion of the Company’s Board of Directors. There are no family relationships between any directors or executive officers of NRC Health.
Available Information
More information regarding NRC Health is available on the Company's website at www.nrchealth.com. NRC Health is not including the information contained on or available through its website as part of, or incorporating such information by reference into, this Annual Report on Form 10-K. The Company's Annual Reports on Form 10-K, Quarterly Reports on Form 10-Q, Current Reports on Form 8-K and any amendments to those reports are made available to the public at no charge through a link appearing on the Company's website. NRC Health provides access to such materials through its website as soon as reasonably practicable after electronically filing such material with, or furnishing it to, the Securities and Exchange Commission. Reports and amendments posted on the Company’s website do not include access to exhibits and supplemental schedules electronically filed with the reports or amendments.
Item 1A. Risk Factors
You should carefully consider each of the risks described below, together with all of the other information contained in this Annual Report on Form 10-K, before making an investment decision with respect to our securities. If any of the following risks develop into actual events, our business, financial condition or results of operations could be materially and adversely affected and you may lose all or part of your investment.
We depend on contract renewals, including retention of key clients, for a large share of our revenue and our operating results could be adversely affected.
We expect that a substantial portion of our revenue for the foreseeable future will continue to be derived from renewable service contracts. Substantially all contracts are renewable annually at the option of our clients, although a client generally has no minimum purchase commitment under a contract and the contracts are generally cancelable on short or no notice without penalty. To the extent that clients fail to renew or defer their renewals, we anticipate our results may be materially adversely affected. We rely on a limited number of key clients for a substantial portion of our revenue. The Company’s ten largest clients accounted for 17%, 15%, and 16% of the Company’s total revenue in 2016, 2015, and 2014, respectively. Our ability to secure renewals depends on, among other things, our ability to gather and analyze performance data in a consistent, high-quality, and timely fashion. In addition, the service needs of our clients are affected by accreditation requirements, enrollment in managed care plans, the level of use of satisfaction measures in healthcare organizations’ overall management and compensation programs, the size of operating budgets, clients’ operating performance, industry and economic conditions, and changes in management or ownership. As these factors are beyond our control, we cannot ensure that we will be able to maintain our renewal rates. Any material decline in renewal rates from existing levels would have an adverse effect on our revenue and a corresponding effect on our operating and net income.
Our operating results may fluctuate and this may cause our stock price to decline.
Our overall operating results may fluctuate as a result of a variety of factors, including the size and timing of orders from clients, client demand for our services (which, in turn, is affected by factors such as accreditation requirements, enrollment in managed care plans, operating budgets and clients’ operating performance), the hiring and training of additional staff, expense increases, and industry and general economic conditions. Because a significant portion of our overhead is fixed in the short-term, particularly some costs associated with owning and occupying our building and full-time personnel expenses, our results of operations may be materially adversely affected in any particular period if revenue falls below our expectations. These factors, among others, make it possible that in some future period our operating results may be below the expectations of securities analysts and investors which would have a material adverse effect on the market price of our class A common stock and/or our class B common stock.
We operate in a highly competitive market and could experience increased price pressure and expenses as a result.
The healthcare information and market research services industry is highly competitive. We have traditionally competed with healthcare organizations’ internal marketing, market research and/or quality improvement departments that create their own performance measurement tools, and with relatively small specialty research firms that provide survey-based healthcare market research and/or performance assessment. The Company’s primary competitors among such specialty firms include Press Ganey, which we believe has significantly higher annual revenue than us, and three or four other firms that we believe have lower annual revenue than us. To a certain degree, we currently compete with, and anticipate that in the future we may increasingly compete with, (1) traditional market research firms which are significant providers of survey-based, general market research, and (2) firms which provide services or products that complement healthcare performance assessments, such as healthcare software or information systems. Although only a few of these competitors have offered specific services that compete directly with our services, many of these competitors have substantially greater financial, information gathering, and marketing resources than the Company and could decide to increase their resource commitments to our market. There are relatively few barriers to entry into the Company’s market, and we expect increased competition in our market which could adversely affect our operating results through pricing pressure, increased marketing expenditures, and market share losses, among other factors. There can be no assurance that the Company will continue to compete successfully against existing or new competitors.
Because our clients are concentrated in the healthcare industry, our revenue and operating results may be adversely affected by changes in regulations, a business downturn or consolidation with respect to the healthcare industry.
Substantially all of our revenue is derived from clients in the healthcare industry. As a result, our business, financial condition and results of operations are influenced by conditions affecting this industry, including changing political, economic, competitive and regulatory influences that may affect the procurement practices and operation of healthcare providers and payers. The 2010 Federal comprehensive healthcare reform plan, which includes provisions to control healthcare costs, improve healthcare quality and expand access to affordable health insurance, could result in lower reimbursement rates and otherwise change the environment in which providers and payers operate. In addition, large private purchasers of healthcare services are placing increasing cost pressure on providers. Healthcare providers may react to these cost pressures and other uncertainties by curtailing or deferring purchases, including purchases of our services. Moreover, there has been consolidation of companies in the healthcare industry, a trend which we believe will continue to grow. Consolidation in this industry, including the potential acquisition of certain of our clients, could adversely affect aggregate client budgets for our services or could result in the termination of a client’s relationship with us. The impact of these developments on the healthcare industry is difficult to predict and could have an adverse effect on our revenue and a corresponding effect on our operating and net income.
We rely on third parties whose actions could have a material adverse effect on our business.
We outsource certain operations and engage third parties to perform work needed to fulfill our client services. For example, we use vendors to perform certain printing, mailing, information transmittal and other services related to our survey operations. If any of these vendors cease to operate or fail to adequately perform the contracted services and alternative resources and processes are not utilized in a timely manner, our business could be adversely affected. The loss of any of our key vendors could impair our ability to perform our client services and result in lower revenues and income. It would also be time-consuming and expensive to replace, either directly or through other vendors, the services performed by these vendors, which could adversely impact revenues, expenses and net income. Furthermore, our ability to monitor and direct our vendors’ activities is limited. If their actions and business practices violate policies, regulations or procedures otherwise considered illegal, we could be subject to reputational damage or litigation which would adversely affect our business.
We face several risks relating to our ability to collect the data on which our business relies.
Our ability to provide timely and accurate performance measurement and improvement services to our clients depends on our ability to collect large quantities of high-quality data through surveys and interviews. If our mail survey operations are disrupted and we are unable to mail our surveys in a timely manner, then our revenue and net income could be negatively impacted. If receptivity to our survey and interview methods by respondents declines, or, for some other reason, their willingness to complete and return surveys declines, or if we, for any reason, cannot rely on the integrity of the data we receive, then our revenue could be adversely affected with a corresponding effect on our operating and net income. We also rely on third-party panels of pre-recruited consumer households to produce NRC Health’s Market Insights in a timely manner. If we are not able to continue to use these panels, or the time period in which we use these panels is altered and we cannot find alternative panels on a timely, cost-competitive basis, we could face an increase in our costs or an inability to effectively produce NRC Health’s Market Insights. In either case, our operating and net income could be negatively affected.
Our principal shareholder effectively controls the Company, and holders of class A common stock are not able to independently elect directors of NRC Health or control any of the Company's management policies or business decisions because the holders of class A common stock have substantially less voting power than the holders of the Company's class B common stock, a majority of which is beneficially owned by our principal shareholder.
The Company's outstanding stock is divided into two classes of common stock: class A common stock and class B common stock. The class B common stock has one vote per share on all matters and the class A common stock has one-one-hundredth (1/100th) of one vote per share. As of February 17, 2017, the class B common stock constituted approximately 94% of NRC Health's total voting power. As a result, holders of class B common stock are able to exercise a controlling influence over the Company's business, have the power to elect its directors and indirectly control decisions such as whether to issue additional shares, declare and pay dividends or enter into significant corporate transactions. A majority of the class B common stock is owned by Michael D. Hays, our Chief Executive Officer.
As of February 17, 2017, approximately 56% of the outstanding class B common stock and approximately 26% of the outstanding class A common stock was owned by Mr. Hays, and that collectively constituted approximately 54% of the Company's total voting power. As a result, Mr. Hays can control matters requiring shareholder approval, including the election of directors and the approval of significant corporate matters such as change of control transactions. The effects of such influence could be to delay or prevent a change of control of the Company unless the terms are approved by Mr. Hays.
The market prices of our two classes of common stock may be volatile and shareholders may be unable to resell shares at or above the price at which the shares were acquired.
The market price of stock can be highly volatile. As a result, the market prices and trading volumes of each of our two classes of common stock may also be highly volatile, and investors in our common stock may experience a decrease in the value of their shares, including decreases that are in response to factors beyond our control, including, but not limited to:
|
● |
Variations in our financial performance and that of similar companies; |
|
● |
Regulatory and other developments that may impact the demand for our services; |
|
● |
Reaction to our press releases, public announcements and filings with the Securities and Exchange Commission; |
|
● |
Client, market and industry perception of our services and performance; |
|
● |
Actions of our competitors; |
|
● |
Changes in earnings estimates or recommendations by analysts who follow our stock; |
|
● |
Loss of key personnel; |
|
● |
Investor or management team sales of our stock; |
|
● |
Changes in accounting principles; and |
|
● |
Variations in general market, economic and political conditions or financial markets. |
Any of these factors, among others, may result in changes in the trading volumes and/or market prices of each of our classes common stock. Following periods of volatility in the market price of a company’s securities, shareholders have often filed securities class-action lawsuits. Our involvement in a class-action lawsuit would result in substantial legal fees and divert our senior management’s attention from operating our business, which could harm our business and net income.
Our business and operating results could be adversely affected if we are unable to attract or retain key managers and other personnel.
Our future performance may depend, to a significant extent, upon the efforts and ability of our key personnel who have expertise in gathering, interpreting and marketing survey-based performance information for healthcare markets. Although client relationships are managed at many levels within our company, the loss of the services of Michael D. Hays, our Chief Executive Officer, or one or more of our other senior managers, could have a material adverse effect, at least in the short to medium term, on most significant aspects of our business, including strategic planning, product development, and sales and customer relations. Our success will also depend on our ability to hire, train and retain skilled personnel in all areas of our business. Currently, we do not have employment agreements with our officers or our other key personnel. Competition for qualified personnel in our industry is intense, and many of the companies that compete with us for qualified personnel have substantially greater financial and other resources than us. Furthermore, we expect competition for qualified personnel to become more intense as competition in our industry increases. We cannot assure you that we will be able to recruit, retain and motivate a sufficient number of qualified personnel to compete successfully.
If intellectual property and other proprietary information technology were copied or independently developed by our competitors, our operating results could be negatively affected.
Our success depends in part upon our data collection process, research methods, data analysis techniques, and internal systems and procedures that we have developed specifically to serve clients in the healthcare industry. We have no patents. Consequently, we rely on a combination of copyright, trade secret laws and associate nondisclosure agreements to protect our systems, survey instruments and procedures. We cannot assure you that the steps we have taken to protect our rights will be adequate to prevent misappropriation of such rights, or that third parties will not independently develop functionally equivalent or superior systems or procedures. We believe that our systems and procedures and other proprietary rights do not infringe upon the proprietary rights of third parties. We cannot assure you, however, that third parties will not assert infringement claims against us in the future, or that any such claims will not result in protracted and costly litigation, regardless of the merits of such claims, or whether we are ultimately successful in defending against such claims.
Our business and operating results could be adversely affected if we experience business interruptions or failure of our information technology and communication systems.
Security breaches or computer viruses could harm our business.
In connection with our client services, we receive, process, store and transmit sensitive business information electronically over the Internet. Computer viruses could spread throughout our systems and disrupt operations and service delivery. Unauthorized access to our computer systems or databases could result in the theft or publication of confidential information or the deletion or modification of records or could otherwise cause interruption in our operations. We cannot be certain that the technology protecting our networks and information will successfully prevent computer viruses, data thefts, release of confidential information or security breaches. A compromise in our data security systems that results in inappropriate disclosure of our associates', customers' or vendors' confidential information, could harm our reputation and expose us to regulatory action and claims. Changes in privacy and information security laws and standards may require we incur significant expense to ensure compliance due to increased technology investment and operational procedures. An inability to prevent security breaches or computer viruses or failure to comply with privacy and information security laws could result in litigation and regulatory risk, loss of customers, damage to customer relationships, reduced revenue and profits, refunds of customer charges and damage our reputation, which could adversely affect our business, financial condition, results of operations and reputation.
Reputational harm could have a material adverse effect on our business, financial condition and results of operations.
Our ability to maintain a good reputation is critical to selling our services. Our reputation could be adversely impacted by any of the following (whether or not valid): the failure to maintain high ethical and social standards; the failure to perform our client services in a timely manner; violations of laws and regulations; and the failure to maintain an effective system of internal controls or to provide accurate and timely financial information. Damage to our reputation or loss of our clients’ confidence in our services for any of these, or any other reasons, could adversely impact our business, revenues, financial condition, and results of operations, as well as require additional resources to rebuild our reputation.
Our operations are subject to laws and regulations that impose significant compliance costs and create reputational and legal risk.
Due to the nature of the services we offer, we are subject to significant commercial, trade and privacy regulations. We cannot predict the nature, scope or effect of future regulatory requirements to which our operations might be subject or the manner in which existing laws might be administered or interpreted, which could have a material and negative impact on our business and our results of operation. For example, recent years have seen an increase in the development or enforcement of legislation related to healthcare reform, privacy, trade compliance and anti-corruption. Additionally, some of the services we provide include information our clients need to fulfill regulatory reporting requirements. If our services result in errors or omissions in our clients’ regulatory reporting, we may be subject to loss of clients, reputational harm or litigation, each potentially adversely impacting our business. Furthermore, although we maintain a variety of internal policies and controls designed to educate, discourage, prevent and detect violations of such laws, we cannot guarantee that such actions will be effective or sufficient or that individual employees will not engage in inappropriate behavior in breach of our policies. Such conduct, or even an allegation of misbehavior, could result in material adverse reputational harm, costly investigations, severe criminal or civil sanctions, or could disrupt our business, and could negatively affect our results of operations or financial condition.
Failure to comply with public company regulations could adversely impact our profitability.
As a public company, we are subject to the reporting requirements of the Securities Exchange Act of 1934, the Sarbanes-Oxley Act of 2002, the Dodd-Frank Act Wall Street Reform and Consumer Protection Act, the listing requirements of NASDAQ and other applicable securities rules and regulations. Additionally, laws, regulations and standards relating to corporate governance and public disclosure are subject to varying interpretations and continue to develop and change. If we misinterpret or fail to comply with these rules and regulations, our legal and financial compliance costs and net income may be adversely affected.
Our growth strategy includes future acquisitions which involve inherent risk.
In order to expand services or technologies to existing clients and increase our client base, we have historically, and may in the future, make strategic business acquisitions that we believe complement our business. Acquisitions have inherent risks which may have material adverse effects on our business, financial condition, or results of operations, including, among other things: (1) failure to successfully integrate the purchased operations, technologies, products or services and maintain uniform standard controls, policies and procedures; (2) substantial unanticipated integration costs; (3) loss of key associates including those of the acquired business; (4) diversion of management’s attention from other operations; (5) failure to retain the customers of the acquired business; (6) failure to achieve any projected synergies and performance targets; (7) additional debt and/or assumption of known or unknown liabilities; (8) dilutive issuances of equity securities; and (9) a write-off of goodwill, software development costs, client lists, other intangibles and amortization of expenses. If we fail to successfully complete acquisitions or integrate acquired businesses, we may not achieve projected results and there may be a material adverse effect on our business, financial condition and results of operations.
Item 1B. Unresolved Staff Comments
The Company has no unresolved staff comments to report pursuant to this item.
Item 2. Properties
The Company’s headquarters is located in an owned office building in Lincoln, Nebraska, of which 62,000 square feet are used for the Company’s operations. This facility houses all the capabilities necessary for NRC Health’s survey programming, printing and distribution, data processing, analysis and report generation, marketing, and corporate administration. The Company’s term note is secured by this property, among other things.
The Company is leasing 4,000 square feet of office space in Markham, Ontario, 3,900 square feet of office space in San Diego, California, 8,100 square feet of office space in Seattle, Washington and 1,500 square feet of office space in Atlanta, Georgia.
Item 3. Legal Proceedings
The Company is not subject to any material pending litigation.
Item 4. Mine Safety Disclosures
Not applicable.
PART II
Item 5. Market for the Registrant’s Common Equity, Related Stockholder Matters and Issuer Purchases of Equity Securities
In May 2013, the Company consummated a recapitalization (the “May 2013 Recapitalization”) pursuant to which the Company established two classes of common stock (class A common stock and class B common stock), issued a dividend of three shares of class A common stock for each share of the Company’s then existing common stock and reclassified each then existing share of common stock as one-half of one share of class B common stock. Following the May 2013 Recapitalization, the Company’s class A common stock and the Company’s class B common stock are traded on the NASDAQ Global Market under the symbols “NRCIA” and “NRCIB,” respectively.
The following table sets forth the range of high and low sales prices for, and dividends declared on the class A common stock and class B common stock for the period from January 1, 2015, through December 31, 2016:
|
Class A |
Class B |
|||||||||||||||||||||||
|
High |
Low |
Dividends Declared Per Common Share |
High |
Low |
Dividends Declared Per Common Share |
|||||||||||||||||||
|
2015 Quarter Ended: |
||||||||||||||||||||||||
|
March 31 |
$ | 16.67 | $ | 13.00 | $ | 0.06 | $ | 36.20 | $ | 31.26 | $ | 0.36 | ||||||||||||
|
June 30 |
$ | 15.25 | $ | 13.29 | $ | 0.06 | $ | 35.50 | $ | 31.50 | $ | 0.36 | ||||||||||||
|
September 30 |
$ | 15.21 | $ | 10.72 | $ | 0.06 | $ | 35.50 | $ | 27.54 | $ | 0.36 | ||||||||||||
|
December 31 |
$ | 17.42 | $ | 11.32 | $ | 0.44 | $ | 38.22 | $ | 31.88 | $ | 2.64 | ||||||||||||
|
2016 Quarter Ended |
||||||||||||||||||||||||
|
March 31 |
$ | 16.10 | $ | 13.70 | $ | 0.08 | $ | 36.87 | $ | 32.99 | $ | 0.48 | ||||||||||||
|
June 30 |
$ | 16.67 | $ | 12.53 | $ | 0.08 | $ | 44.60 | $ | 33.19 | $ | 0.48 | ||||||||||||
|
September 30 |
$ | 17.14 | $ | 13.26 | $ | 0.08 | $ | 38.50 | $ | 32.18 | $ | 0.48 | ||||||||||||
|
December 31 |
$ | 20.00 | $ | 14.35 | $ | 0.10 | $ | 46.37 | $ | 32.57 | $ | 0.60 | ||||||||||||
Cash dividends in the aggregate amount of $14.3 million were declared in 2016 with $10.1 million paid in 2016 and the remaining $4.2 million paid in January 2017. Cash dividends in the aggregate amount of $26.0 million were declared in 2015 with $7.6 million paid in 2015 and the remaining $18.4 million paid in January 2016. The payment and amount of future dividends, if any, is at the discretion of the Company’s Board of Directors and will depend on the Company’s future earnings, financial condition, general business conditions, alternative uses of the Company’s earnings and other factors.
On February 17, 2017, there were approximately 16 shareholders of record and approximately 1,224 beneficial owners of the class A common stock and approximately 14 shareholders of record and approximately 1,157 beneficial owners of the class B common stock.
In February 2006, the Board of Directors of the Company authorized the repurchase of 2,250,000 shares of class A common stock and 375,000 shares of class B common stock (on a post-May 2013 Recapitalization basis) in the open market or in privately negotiated transactions. Unless terminated earlier by resolution of the Company’s Board of Directors, the repurchase program will expire when the Company has repurchased all shares authorized for repurchase thereunder. As of February 17, 2017, 1,969,509 shares of class A common stock and 305,509 shares of class B common stock have been repurchased under that authorization. No class A or class B common stock was repurchased during the three-month period ended December 31, 2016. The remaining shares that may be purchased under that authorization are 280,491 and 69,491 for class A and class B common stock, respectively.
The following graph compares the cumulative 5-year total return provided shareholders on the Company’s common stock relative to the cumulative total returns of the NASDAQ Composite Index and the Russell 2000 Index. An investment of $100 (with reinvestment of all dividends) is assumed to have been made in our common stock and in each of the indexes on December 31, 2011 (or on May 23, 2013 for our class A common stock which was the first day it was traded), and its relative performance is tracked through December 31, 2016. In accordance with Securities and Exchange Commission guidance, in calculating the cumulative 5-year total return on our class B common stock, we gave retroactive effect to the May 2013 Recapitalization (i.e., as if it had occurred on December 31, 2011).
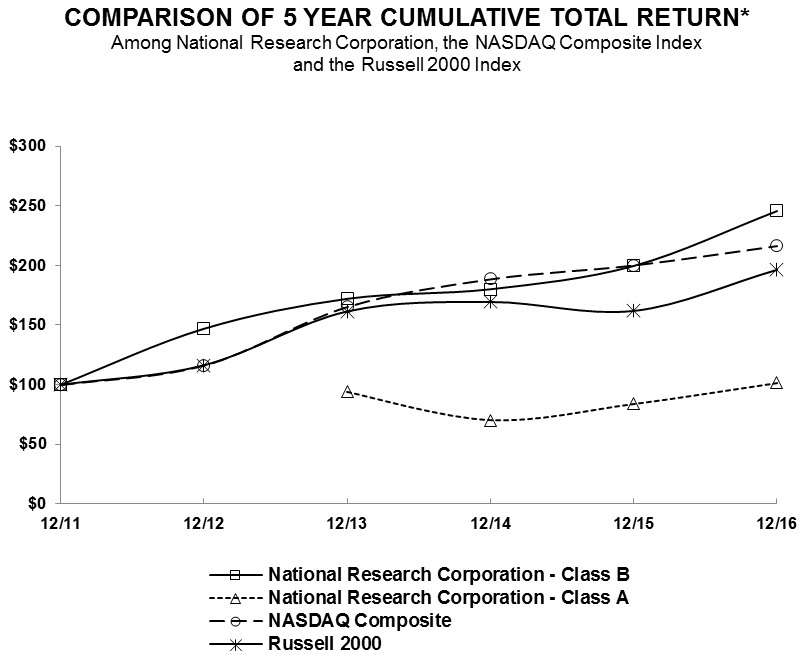
The stock price performance included in this graph is not necessarily indicative of future stock price performance.
|
12/11 |
12/12 |
5/23/13 |
12/13 |
12/14 |
12/15 |
12/16 |
||||||||||||||||||||||
|
National Research Corporation - Class B |
100.00 | 146.97 | --- | 172.09 | 180.14 | 199.70 | 245.75 | |||||||||||||||||||||
|
National Research Corporation - Class A |
--- | --- | 100.00 | 94.10 | 70.25 | 83.85 | 101.51 | |||||||||||||||||||||
|
NASDAQ Composite |
100.00 | 116.41 | --- | 165.47 | 188.69 | 200.32 | 216.54 | |||||||||||||||||||||
|
Russell 2000 |
100.00 | 116.35 | --- | 161.52 | 169.43 | 161.95 | 196.45 | |||||||||||||||||||||
Item 6. Selected Financial Data
The selected statement of income data for the years ended December 31, 2016, 2015 and 2014, and the selected balance sheet data at December 31, 2016 and 2015, are derived from, and are qualified by reference to, the audited consolidated financial statements of the Company included elsewhere in this Annual Report on Form 10-K. The selected statement of income data for the year ended December 31, 2013 and 2012, and the balance sheet data at December 31, 2014, 2013 and 2012, are derived from audited consolidated financial statements not included herein. The Company acquired Digital Assent, LLC (“Digital Assent”) on October 28, 2014 and disposed of selected assets and liabilities related to the clinical workflow product of its Predictive Analytics operating segment on December 21, 2015. The acquisition and disposal did not have a significant impact on the Company’s financial results, therefore, the historical data in the table below have not been adjusted.
|
Year Ended December 31, (a) |
||||||||||||||||||||
|
2016 |
2015 |
2014 |
2013 |
2012 |
||||||||||||||||
|
(In thousands, except per share data) |
||||||||||||||||||||
|
Statement of Income Data: |
||||||||||||||||||||
|
Revenue |
$ | 109,384 | $ | 102,343 | $ | 98,837 | $ | 92,590 | $ | 86,421 | ||||||||||
|
Operating expenses: |
||||||||||||||||||||
|
Direct |
45,577 | 44,610 | 41,719 | 38,844 | 35,461 | |||||||||||||||
|
Selling, general and administrative |
28,385 | 27,177 | 25,018 | 25,208 | 23,542 | |||||||||||||||
|
Depreciation and amortization |
4,225 | 4,109 | 3,804 | 3,732 | 4,699 | |||||||||||||||
|
Total operating expenses |
78,187 | 75,896 | 70,541 | 67,784 | 63,702 | |||||||||||||||
|
Operating income |
31,197 | 26,447 | 28,296 | 24,806 | 22,719 | |||||||||||||||
|
Other income (expense) |
159 | 913 | (204 | ) | (318 | ) | (512 | ) | ||||||||||||
|
Income before income taxes |
31,356 | 27,360 | 28,092 | 24,488 | 22,207 | |||||||||||||||
|
Provision for income taxes |
10,838 | 9,750 | 9,936 | 9,004 | 7,139 | |||||||||||||||
|
Net income |
$ | 20,518 | $ | 17,610 | $ | 18,156 | $ | 15,484 | $ | 15,068 | ||||||||||
|
Earnings per share common stock: |
||||||||||||||||||||
| Basic Earnings per share: | ||||||||||||||||||||
|
Class A |
$ | 0.49 | $ | 0.42 | $ | 0.44 | $ | 0.37 | $ | 0.37 | ||||||||||
|
Class B |
$ | 2.93 | $ | 2.52 | $ | 2.62 | $ | 2.25 | $ | 2.22 | ||||||||||
|
Diluted Earnings per share: |
||||||||||||||||||||
|
Class A |
$ | 0.48 | $ | 0.41 | $ | 0.43 | $ | 0.37 | $ | 0.36 | ||||||||||
|
Class B |
$ | 2.88 | $ | 2.49 | $ | 2.57 | $ | 2.20 | $ | 2.17 | ||||||||||
| Weighted average share and share equivalents outstanding: | ||||||||||||||||||||
|
Class A – basic |
20,713 | 20,741 | 20,764 | 20,677 | 20,325 | |||||||||||||||
|
Class B – basic |
3,505 | 3,478 | 3,473 | 3,447 | 3,388 | |||||||||||||||
|
Class A – diluted |
21,037 | 20,981 | 21,076 | 21,099 | 20,854 | |||||||||||||||
|
Class B – diluted |
3,560 | 3,522 | 3,536 | 3,514 | 3,476 | |||||||||||||||
|
2016 |
2015 |
2014 |
2013 |
2012 |
||||||||||||||||
|
(In thousands) |
||||||||||||||||||||
|
Balance Sheet Data: |
||||||||||||||||||||
|
Working capital surplus (deficiency) |
$ | 15,551 | $ | 10,890 | $ | 25,262 | $ | 12,784 | $ | (11,483 | ) | |||||||||
|
Total assets |
120,624 | 128,049 | 129,510 | 111,088 | 100,046 | |||||||||||||||
|
Total debt and capital lease obligations, including current portion |
3,732 | 5,917 | 8,386 | 10,546 | 12,763 | |||||||||||||||
|
Total shareholders’ equity |
$ | 82,806 | $ | 74,222 | $ | 87,748 | $ | 71,755 | $ | 56,742 | ||||||||||
|
(a) |
All share and per share data have been retroactively adjusted to give effect to the May 2013 Recapitalization as further described in Item 5. |
|
|
|
Item 7. Management’s Discussion and Analysis of Financial Condition and Results of Operations
Overview
The Company is a leading provider of analytics and insights that facilitate measurement and improvement of the patient and employee experience while also increasing patient engagement and customer loyalty for healthcare providers, payers and other healthcare organizations. The Company’s solutions enable its clients to understand the voice of the customer with greater clarity, immediacy and depth. NRC Health’s heritage, proprietary methods, and holistic approach enable our partners to better understand the people they care for and design experiences that inspire loyalty and trust, while also facilitating regulatory compliance and the shift to population-based health management. The Company’s ability to measure what matters most and systematically capture, analyze and deliver insights based on self-reported information from patients, families and consumers is critical in today’s healthcare market. NRC Health believes that access to and analysis of its extensive consumer-driven information is becoming more valuable as healthcare providers increasingly need to more deeply understand and engage patients and consumers in an effort towards effective population-based health management.
The Company’s portfolio of subscription-based solutions provide actionable information and analysis to healthcare organizations and payers across a range of mission-critical, constituent-related elements, including patient experience and satisfaction, community population health risks, workforce engagement, community perceptions, and physician engagement. NRC Health partners with clients across the continuum of healthcare services. The Company’s clients range from integrated health systems and post-acute providers, such as home health, long term care and hospice, to numerous payer organizations. The Company believes this cross-continuum positioning is a unique and an increasingly important capability as evolving payment models drive healthcare providers and payers towards a more collaborative and integrated service model.
Acquisitions/ Investments
In October 2014, NRC Health acquired Digital Assent, a company with a healthcare technology platform. The acquisition created a Center of Excellence in Atlanta, Georgia, responsible for developing novel solutions to enhance consumer decision-making in the selection of healthcare providers. The all-cash consideration paid at closing was $2.6 million.
Divestitures
On December 21, 2015, the Company completed the sale of selected assets and liabilities related to the clinical workflow product of the former Predictive Analytics operating segment, for a net cash amount of approximately $1.6 million. The Company recorded a gain of approximately $1.1 million from the sale in the fourth quarter of 2015, which is included in other income on the Consolidated Statement of Income. An additional gain was recorded in December 2016, when $223,000 was received from proceeds placed in escrow at the time of sale.
Critical Accounting Policies and Estimates
The preparation of financial statements requires management to make estimates and assumptions that affect amounts reported therein. The most significant of these areas involving difficult or complex judgments made by management with respect to the preparation of the Company’s consolidated financial statements for 2016 include:
|
● |
Revenue recognition; |
|
● |
Valuation of goodwill and identifiable intangible assets; |
|
● |
Income taxes; and |
|
● |
Business combinations. |
Revenue Recognition
The Company derives a majority of its operating revenue from its annually renewable services, which include performance measurement and improvement services, healthcare analytics and governance education services. The Company provides these services to its clients under annual client service contracts, although such contracts are generally cancelable on short or no notice without penalty.
Services are provided under subscription-based service agreements. The Company recognizes subscription-based service revenue over the period of time the service is provided. Generally, the subscription periods are for twelve months and revenue is recognized equally over the subscription period.
Certain contracts are fixed-fee arrangements with a portion of the project fee billed in advance and the remainder billed periodically over the duration of the project. Revenue and direct expenses for services provided under these contracts are recognized under the proportional performance method. Under the proportional performance method, the Company recognizes revenue based on output measures or key milestones such as survey set-up, survey mailings, survey returns and reporting. The Company measures its progress based on the level of completion of these output measures and recognizes revenue accordingly. Management judgments and estimates must be made and used in connection with revenue recognized using the proportional performance method. If management made different judgments and estimates, then the amount and timing of revenue for any period could differ materially from the reported revenue.
The Company’s revenue arrangements with a client may include combinations of performance measurement and improvement services, healthcare analytics or governance education services which may be executed at the same time, or within close proximity of one another (referred to as a multiple-element arrangement). Each element of a multiple-element arrangement is accounted for as a separate unit of accounting provided each delivered element is sold separately by the Company or another vendor; and for an arrangement that includes a general right of return relative to the undelivered elements, delivery or performance of the undelivered services are considered probable and substantially in the control of the Company. The Company’s arrangements generally do not include a general right of return related to the delivered services. If these criteria are not met, the arrangement is accounted for as a single unit of accounting with revenue generally recognized equally over the subscription period or recognized under the proportional performance method.
Revenue is allocated to each separate unit of accounting based on relative selling price using a selling price hierarchy: vendor specific objective evidence (“VSOE”), if available, third-party evidence (“TPE”) if VSOE is not available, or estimated selling price if VSOE nor TPE is available. VSOE is established based on the services normal selling price and discounts for the specific services when sold separately. TPE is established by evaluating similar competitor services in standalone arrangements. If neither exists for a deliverable, the best estimate of the selling price (“ESP”) is used for that deliverable based on list price, representing a component of management’s market strategy, and an analysis of historical prices for bundled and standalone arrangements. Revenue allocated to an element is limited to revenue that is not subject to refund or otherwise represents contingent revenue. VSOE, TPE, and ESP are periodically adjusted to reflect current market conditions. These adjustments are not expected to differ significantly from historical results.
Valuation of Goodwill and Identifiable Intangible Assets
Intangible assets include customer relationships, trade names, technology, non-compete agreements and goodwill. Intangible assets with estimable useful lives are amortized over their respective estimated useful lives to their estimated residual values and reviewed for impairment whenever events or changes in circumstances indicate that the carrying amount of the assets may not be recoverable. The Company reviews intangible assets with indefinite lives for impairment annually as of October 1 and whenever events or changes in circumstances indicate that the carrying value of an asset may not be recoverable.
When performing the impairment assessment, the Company first assesses qualitative factors to determine whether it is necessary to recalculate the fair value of our intangible assets with indefinite lives. If the Company believes, as a result of the qualitative assessment, that it is more likely than not that the fair value of the indefinite-lived intangibles is less than their carrying amount, the Company calculates the fair value using a market approach. If the carrying value of an intangible asset with an indefinite life exceeds its fair value, then the intangible asset is written-down to their fair values. The Company did not recognize any impairment related to our indefinite-lived intangible assets during 2016, 2015 or 2014.
Goodwill is an asset representing the future economic benefits arising from other assets acquired in a business combination that are not individually identified and separately recognized. All of the Company’s goodwill is allocated to its reporting units, which are the same as its operating segments. Goodwill is reviewed for impairment at least annually as of October 1 and whenever events or changes in circumstances indicate that the carrying value of goodwill may not be recoverable.
The Company reviews for goodwill impairment by first assessing qualitative factors to determine whether any impairment may exist. If we believe, as a result of the qualitative assessment that it is more likely than not that the fair value of a reporting unit is less than its carrying amount, a quantitative two-step test is required; otherwise, no further testing is required. Under the first step of the quantitative test, the fair value of the reporting unit is compared with its carrying value (including goodwill). If the fair value of the reporting unit exceeds its carrying value, step two is not performed. If the fair value of the reporting unit is less than its carrying value, an indication of goodwill impairment exists for the reporting unit and the Company performs step two of the impairment test (measurement). Under step two, an impairment loss is recognized for any excess of the carrying amount of the reporting unit’s goodwill over the fair value of that goodwill. The fair value of goodwill is determined by allocating the fair value of the reporting unit in a manner similar to a purchase price allocation and the residual fair value after this allocation is the fair value of the reporting unit goodwill.
In instances when a step two is required, the fair value of the reporting unit is determined using an income approach and comparable market multiples. Under the income approach, there are a number of inputs used to calculate the fair value using a discounted cash flow model, including operating results, business plans, projected cash flows and a discount rate. Discount rates, growth rates and cash flow projections are the most sensitive and susceptible to change as they require significant management judgment. Discount rates are determined by using a weighted average cost of capital, which considers market and industry data. Management develops growth rates and cash flow projections for each reporting unit considering industry and Company-specific historical and projected information. Terminal value rate determination follows common methodology of capturing the present value of perpetual cash flow estimates beyond the last projected period assuming a constant weighted average cost of capital and low long-term growth rates. Under the market approach, the Company considers its market capitalization, comparisons to other public companies’ data, and recent transactions of similar businesses within the Company’s industry.
The Company performed a qualitative analysis as of October 1, 2016, which did not indicate that it was more likely than not that the carrying values of the reporting units exceeded fair value. No impairments were recorded during the years ended December 31, 2016, 2015 or 2014.
Income Taxes
The Company uses the asset and liability method of accounting for income taxes. Under that method, deferred income tax assets and liabilities are recognized for the future tax consequences attributable to differences between the financial statement carrying amounts of existing assets and liabilities and their respective tax bases using enacted tax rates. The effect on deferred tax assets and liabilities of a change in tax rates is recognized in income in the period that includes the enactment date. Valuation allowances, if any, are established when necessary to reduce deferred tax assets to the amount that is more likely than not to be realized. The Company recognizes the effect of income tax positions only if those positions are more likely than not of being sustained. Recognized income tax positions are measured at the largest amount that is greater than 50% likely of being realized. Changes in recognition or measurement are reflected in the period in which the change in judgment occurs. Management judgment is required to determine the provision for income taxes and to determine whether deferred income taxes will be realized in full or in part. Such judgments include, but are not limited to, the likelihood we would realize the benefits of net operating loss carryforwards, the adequacy of valuation allowances, the election to capitalize or expense costs incurred, and the probability of outcomes of uncertain tax positions. It is possible that the various taxing authorities could challenge those judgments or positions and reach conclusions that would cause us to incur tax liabilities in excess of, or realize benefits less than, those currently recorded. In addition, changes in the geographical mix or estimated amount of annual pretax income could impact our overall effective tax rate.
Business Combinations
The Company uses the acquisition method of accounting for acquired businesses. Under the acquisition method, the financial statements reflect the operations of an acquired business starting from the completion of the acquisition. The assets acquired and liabilities assumed are recorded at their respective estimated fair values at the date of the acquisition. Any excess of the purchase price over the estimated fair values of the identifiable net assets acquired is recorded as goodwill. Significant judgment is required in estimating the fair value of assets acquired, especially intangible assets. As a result, in the case of significant acquisitions we typically engage third-party valuation specialists in estimating fair values of tangible and intangible assets. The fair value estimates are based on available historical information and on expectations and assumptions about the future, considering the perspective of marketplace participants. While management believes those expectations and assumptions are reasonable, they are inherently uncertain. Unanticipated market or macroeconomic events and circumstances may occur, which could impact the accuracy or validity of the estimates and assumptions.
Results of Operations
The following table and graphs set forth, for the periods indicated, selected financial information derived from the Company’s consolidated financial statements, including amounts expressed as a percentage of total revenue and the percentage change in such items versus the prior comparable period (please note that all columns may not add up to 100% due to rounding). The trends illustrated in the following table and graphs may not necessarily be indicative of future results. The discussion that follows the information should be read in conjunction with the Company’s consolidated financial statements.
|
Percentage of Total Revenue |
Percentage Increase (Decrease) |
|||||||||||||||||||
|
2016 |
2015 |
2014 |
2016 over 2015 |
2015 over 2014 |
||||||||||||||||
|
Revenue |
100.0 | % | 100.0 | % | 100.0 | % | 6.9 | % | 3.5 | % | ||||||||||
|
Operating expenses: |
||||||||||||||||||||
|
Direct |
41.7 | 43.6 | 42.2 | 2.2 | 6.9 | |||||||||||||||
|
Selling, general and administrative |
25.9 | 26.6 | 25.3 | 4.4 | 8.6 | |||||||||||||||
|
Depreciation and amortization |
3.9 | 4.0 | 3.8 | 2.8 | 8.0 | |||||||||||||||
|
Total operating expenses |
71.5 | 74.2 | 71.4 | 3.0 | 7.6 | |||||||||||||||
|
Operating income |
28.5 | % | 25.8 | % | 28.6 | % | 18.0 | % | (6.5% | ) | ||||||||||
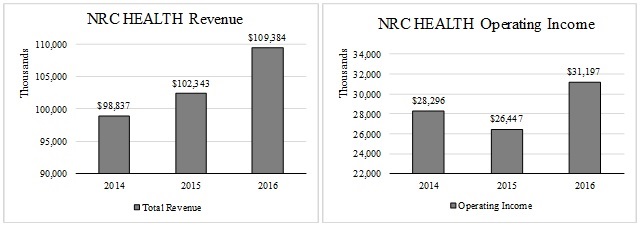
Year Ended December 31, 2016, Compared to Year Ended December 31, 2015
Revenue. Revenue in 2016 increased 6.9% to $109.4 million, compared to $102.3 million in 2015, which was driven primarily by a combination of continued gains in market share and vertical growth in our existing client base. Revenue from subscription-based agreements comprised 88.0% of the total revenue in 2016, compared to 86.6% of total revenue in 2015.
Direct expenses. Direct expenses increased 2.2% to $45.6 million in 2016, compared to $44.6 million in 2015. Variable expenses increased by $327,000 due to higher survey volumes and increased contracted survey costs, partially offset by decreased survey operations expenses due to a reduction in postage fees and changes in survey methodologies. Fixed expenses increased $641,000 as a result of higher salary and benefit costs in the client service area, increased travel expenses and increased software license amortization. Direct expenses decreased as a percentage of revenue to 41.7% in 2016 from 43.6% in 2015 as expenses increased by 2.2% while revenue for the same period increased by 6.9%.
Selling, general and administrative expenses. Selling, general and administrative expenses increased 4.4% to $28.4 million in 2016 compared to $27.2 million in 2015, primarily due to increased salary and benefits of $991,000 (mainly from increased incentives and share based compensation expense), increased marketing expenses of $510,000, higher annual incentive trip expenses of $348,000, Securities and Exchange Commission registration fees expensed in 2016 of $177,000, and increased professional development costs for associates of $172,000. These were partially offset by a reduction of $238,000 in repairs and maintenance on the Company’s headquarters building and the $657,000 write off of a purchase option in 2015 when the Company chose not to exercise the option and it expired. Selling, general, and administrative expenses decreased as a percentage of revenue to 25.9% in 2016, from 26.6% for the same period in 2015 as expenses increased by 4.4% while revenue increased by 6.9% during the same period.
Depreciation and amortization. Depreciation and amortization expenses increased 2.8% to $4.2 million in 2016 compared to $4.1 million in 2015 primarily due to increased depreciation and amortization from increased computer software investments and computer software license expense being included in depreciation and amortization in 2016, resulting from the adoption of Accounting Standards Update (“ASU”) 2015-05, Intangibles - Goodwill and Other - Internal-Use Software (Subtopic 350-40): Customer's Accounting for Fees Paid in a Cloud Computing Arrangement. These increases were offset by decreased amortization as a result of the sale of the clinical workflow product of the former Predictive Analytics operating segment in 2015 and other intangibles becoming fully amortized. Depreciation and amortization expenses as a percentage of revenue decreased to 3.9% in 2016 from 4.0% during in 2015.
Other income (expense). Other income (expense) decreased to $159,000 in 2016 compared to $913,000 in 2015. This was primarily due to the $1.1 million gain on the sale of selected assets and liabilities related to the clinical workflow product of the former Predictive Analytics operating segment in 2015. In December 2016, an additional $223,000 was recorded as a gain on the sale due to receipt of funds placed in escrow at the time of the sale.
Provision for income taxes. Provision for income taxes was $10.8 million (34.6% effective tax rate) in 2016, compared to $9.8 million (35.6% effective tax rate) in 2015. The decrease in the effective tax rate was mainly due to the prospective adoption of ASU 2016-09, Compensation – Stock Compensation (Topic 718) Improvements to Employee Share-Based Payment Accounting (“ASU 2016-09”), which reduced tax expense by $460,000 in 2016. ASU 2016-09 requires excess tax benefits and tax deficiencies to be recorded in the income statement when share based compensation awards vest or are settled rather than to additional paid-in capital.
Year Ended December 31, 2015, Compared to Year Ended December 31, 2014
Revenue. Revenue in 2015 increased 3.5% to $102.3 million, compared to $98.8 million in 2014, which was driven primarily by a combination of continued gains in market share and vertical growth in our existing client base. Revenue from subscription-based agreements comprised 86.6% of the total revenue in 2015, compared to 82.3% of total revenue in 2014.
Direct expenses. Direct expenses increased 6.9% to $44.6 million in 2015, compared to $41.7 million in 2014. Variable expenses increased $1.1 million primarily from increased postage and printing of $989,000, and contracted survey-related costs of $ 416,000, partially offset by a reduction in labor costs of $334,000. Fixed expenses increased $1.8 million primarily due to increased salary and benefit costs from the Digital Assent acquisition in 2014 and staffing additions in the customer service area, and increased equipment lease costs from the acquisition. Direct expenses increased as a percentage of revenue to 43.6% in 2015 from 42.2% in 2014 primarily due to the staffing additions from the acquisition and growth in customer service support.
Selling, general and administrative expenses. Selling, general and administrative expenses increased 8.6% to $27.2 million in 2015, compared to $25.0 million in 2014, primarily due to increased salary and benefit costs of $1.1 million (which includes $581,000 of increased share-based compensation expense), the $657,000 write-off of the purchase option for a potential acquisition in 2015, increased contracted service costs of $328,000, increased maintenance and repairs expense of $278,000 (primarily due to repairs to the Company’s headquarters building), and higher software license and computer supplies fees of $247,000. These were partially offset by decreased recruiting and bad debt expenses. Selling, general, and administrative expenses increased as a percentage of revenue to 26.6% in 2015, from 25.3% in 2014, due to expense growth of 8.6% while revenue grew at 3.5%.
Depreciation and amortization. Depreciation and amortization expenses increased 8.0% to $4.1 million in 2015 compared to $3.8 million in 2014 due to increased customer relationship and technology intangible amortization from the acquisition in October 2014 and increased depreciation costs from computer software investments. Depreciation and amortization expenses as a percentage of revenue increased to 4.0% in 2015 from 3.8% during in 2014.
Other income (expense). Other income (expense) increased to $913,000 of other income in 2015 compared to ($204,000) of other expense in 2014. This was primarily due to the $1.1 million gain on the sale of selected assets and liabilities related to the clinical workflow product of the former Predictive Analytics operating segment.
Provision for income taxes. Provision for income taxes was $9.8 million (35.6% effective tax rate) in 2015, compared to $9.9 million (35.4% effective tax rate) in 2014. The effective tax rate for the twelve-month period ended December 31, 2015, is higher than the rate in the same period of 2014 primarily due to slightly higher projected state tax rates and less benefit from the foreign tax rate differential.
Inflation and Changing Prices
Inflation and changing prices have not had a material impact on revenue or net income in the last three years.
Liquidity and Capital Resources
The Company believes that its existing sources of liquidity, including cash and cash equivalents, borrowing availability, and operating cash flows will be sufficient to meet its projected capital and debt maturity needs and dividend policy for the foreseeable future.
As of December 31, 2016, our principal sources of liquidity included $33.0 million of cash and cash equivalents and up to $6.5 million of unused borrowings under our revolving credit note. The amount of unused borrowings actually available under the revolving credit note varies in accordance with the terms of the agreement. Of this cash, $11.7 million was held in Canada. All of the amounts held in Canada are intended to be indefinitely reinvested in foreign operations. The amounts held outside of the U.S. are eligible for repatriation, but under current law, would be subject to U.S. federal income taxes less applicable foreign tax credits. The Company estimated at December 31, 2016, that an additional tax liability of $536,000 would become due if repatriation of undistributed earnings would occur.
Working Capital
The Company had a working capital surplus of $15.6 million and $10.9 million on December 31, 2016 and 2015, respectively.
The change was primarily due to decreases in dividends payable of $14.2 million and increases in trade accounts receivable of $1.1 million. This was partially offset by decreases in cash and cash equivalents of $9.1 million, increases in deferred revenue of $654,000 and increases in accrued expense of $363,000. Dividends payable and cash and cash equivalents changed mainly due to the payment of $18.4 million in dividends in 2016 that were declared in 2015. The payment and amount of future dividends are at the discretion of the Company’s Board of Directors. Trade accounts receivable increased due to the timing of billings and collections on new and renewal contracts. Accrued expenses changed due to the timing of vendor payments. The Company’s working capital is significantly impacted by its large deferred revenue balances which will vary based on the timing and frequency of billings on annual agreements. The deferred revenue balances as of December 31, 2016 and December 31, 2015, were $15.5 million and $14.8 million, respectively.
The deferred revenue balance is primarily due to timing of initial billings on new and renewal contracts. The Company typically invoices clients for performance tracking services and custom research projects before they have been completed. Billed amounts are recorded as billings in excess of revenue earned, or deferred revenue, on the Company’s consolidated financial statements, and are recognized as income when earned. In addition, when work is performed in advance of billing, the Company records this work as revenue earned in excess of billings, or unbilled revenue. Substantially all deferred revenue and all unbilled revenue will be earned and billed respectively, within 12 months of the respective period ends.
Cash Flow Analysis
A summary of operating, investing, and financing activities are shown in the following table:
|
For the Year Ended December 31, |
||||||||||||
|
2016 |
2015 |
2014 |
||||||||||
|
(In thousands) |
||||||||||||
|
Provided by operating activities |
$ | 26,843 | $ | 21,886 | $ | 26,197 | ||||||
|
Used in investing activities |
(3,750 | ) | (1,326 | ) | (5,723 | ) | ||||||
|
Used in financing activities |
(32,502 | ) | (16,869 | ) | (1,730 | ) | ||||||
|
Effect of exchange rate changes on cash |
285 | (1,588 | ) | (794 | ) | |||||||
|
Net (decrease) increase in cash and cash equivalents |
(9,124 | ) | 2,103 | 17,950 | ||||||||
|
Cash and cash equivalents at end of period |
$ | 33,021 | $ | 42,145 | $ | 40,042 | ||||||
Cash Flows from Operating Activities
Cash flows from operating activities consist of net income adjusted for non-cash items including depreciation and amortization, deferred taxes, share-based compensation and related taxes, gain on sale from operating segment and the effect of working capital changes.
Net cash provided by operating activities was $26.8 million for the year ended December 31, 2016, which included net income of $20.5 million, plus non-cash charges (benefits) for deferred tax expense, depreciation and amortization, reserve for uncertain tax positions, gain on sale from operating segment, loss on disposal of property and equipment and non-cash stock compensation totaling $6.8 million. Changes in working capital decreased cash flows from operating activities by $499,000, primarily due to the timing of payments on accounts payable and increases in prepaid expenses, accounts receivables, and unbilled revenue, which fluctuate due to the timing and frequency of billings on new and renewal contracts. These decreases to cash flows were partially offset by decreases income taxes recoverable, and timing of payments related to accrued expenses, wages, bonus and profit sharing and deferred revenue.
Net cash provided by operating activities was $21.9 million for the year ended December 31, 2015, which included net income of $17.6 million, plus non-cash charges (benefits) for deferred tax expense, depreciation and amortization, reserve for uncertain tax positions, gain on sale from operating segment, write off of purchase option, tax benefit from exercise of stock options, and non-cash stock compensation totaling $3.8 million. Changes in working capital increased cash flows from operating activities by $472,000, primarily due to decreases in income taxes recoverable, and timing of payments related to accrued expenses, wages, bonus and profit sharing and deferred revenue. These increases were offset in part by decreases in accounts payable, and increases in accounts receivables and unbilled revenues which fluctuate due to the timing and frequency of billings on new and renewal contracts and increases in prepaid expenses.
Net cash provided by operating activities was $26.2 million for the year ended December 31, 2014, which included net income of $18.2 million, plus non-cash charges (benefits) for deferred tax expense, depreciation and amortization, reserve for uncertain tax positions, loss on disposal of property and equipment, tax benefit from exercise of stock options, and non-cash stock compensation totaling $4.9 million. Changes in working capital increased 2014 cash flows from operating activities by $3.1 million, primarily due to decreases in trade accounts receivable and timing of billings on new or renewal contracts increasing cash flows provided from deferred revenue and unbilled revenue. The increase was partially offset by timing of payments on accrued expenses, wages, bonus and profit sharing and income taxes.
Cash Flows from Investing Activities
Net cash of $3.8 million was used for investing activities in the year ended December 31, 2016. Purchases of property and equipment totaled $4.0 million. The Company received $223,000 in cash from funds put in escrow at the time of the December 21, 2015 sale of selected assets and liabilities related to the clinical workflow product of the former Predictive Analytics operating segment.
Net cash of $1.3 million was used for investing activities in the year ended December 31, 2015. Purchases of property and equipment totaled $2.9 million. The Company received $1.6 million in cash for the December 21, 2015 sale of selected assets and liabilities related to the clinical workflow product of the former Predictive Analytics operating segment.
Net cash of $5.7 million was used for investing activities in the year ended December 31, 2014. Purchases of property and equipment totaled $2.5 million. The Company paid $2.6 million in cash for the October 2014 acquisition of Digital Assent and $657,000 for the option to purchase a partner company.
Cash Flows from Financing Activities
Net cash used in financing activities was $32.5 million in the year ended December 31, 2016. Cash was used to repay borrowings under the term note totaling $2.2 million and for capital lease obligations of $95,000. Cash was used to pay $28.6 million of dividends, purchase non-controlling interests in Connect totaling $2.0 million, and repurchase shares for payroll tax withholdings related to share-based compensation of $204,000. These were partially offset by the cash provided from the proceeds from the exercise of stock options of $548,000.
Net cash used in financing activities was $16.9 million in the year ended December 31, 2015. Cash was used to repay borrowings under the term note totaling $2.3 million and for capital lease obligations of $173,000. Cash was used to pay $10.1 million of dividends, purchase non-controlling interests in Connect totaling $2.8 million, purchase treasury stock totaling $1.7 million and repurchase shares for payroll tax withholdings related to share-based compensation of $92,000. These were partially offset by the cash provided from the excess tax benefit from share-based compensation of $240,000.
Net cash used in financing activities was $1.7 million in the year ended December 31, 2014. Proceeds from the exercise of stock options and the excess tax benefit of share-based compensation provided cash of $408,000 and $622,000, respectively, partially offset by repurchases of shares for payroll tax withholdings related to share-based compensation of $348,000. Cash was used to repay borrowings under the term note totaling $2.3 million and capital lease obligations of $156,000.
The effect of changes in foreign exchange rates increased (decreased) cash and cash equivalents by $285,000, ($1.6 million), and ($794,000) in the years ended December 31, 2016, 2015, and 2014, respectively.
Capital Expenditures
Capital expenditures for the year ended December 31, 2016 were $4.0 million. These expenditures consisted mainly of computer equipment and software. The Company expects similar capital expenditure purchases in 2017 consisting primarily of computer equipment and software and other equipment, to be funded through cash generated from operations.
Debt and Equity
The Company’s term note is payable in monthly installments of $212,468. Borrowings under the term note bear interest at an annual rate of 3.12%. The outstanding balance of the term note at December 31, 2016 was $3.5 million.
The Company also has a revolving credit note that was renewed in June 2016 to extend the term to June 30, 2017. The maximum aggregate amount available under the revolving credit note is $6.5 million, subject to a borrowing base equal to 75.0% of the Company’s eligible accounts receivable. Borrowings under the revolving credit note bear interest at a variable annual rate, with three rate options at the discretion of management as follows: (1) 2.5% plus the daily reset one-month London Interbank Offered Rate (“LIBOR”) or (2) 2.2% plus the one-, two- or three- month LIBOR rate, or (3) the bank’s one-, two, three, six, or twelve month Money Market Loan Rate. As of December 31, 2016 the revolving credit note did not have a balance. According to the borrowing base requirements, the Company had the capacity to borrow $6.5 million as of December 31, 2016.
The term note and revolving credit note are secured by certain of the Company’s assets, including the Company’s land, building, accounts receivable and intangible assets. The term note and the revolving credit note contain various restrictions and covenants applicable to the Company, including requirements that the Company maintain certain financial ratios at prescribed levels and restrictions on the ability of the Company to consolidate or merge, create liens, incur additional indebtedness or dispose of assets. As of December 31, 2016, the Company was in compliance with the financial covenants.
The Company has capital leases for computer equipment, office equipment, printing and inserting equipment. The balance of the capital leases as of December 31, 2016 was $192,000.
Contractual Obligations
The Company had contractual obligations to make payments in the following amounts in the future as of December 31, 2016:
|
Contractual Obligations(1) |
Total Payments |
Less than One Year |
One to Three Years |
Three to Five Years |
After Five Years |
|||||||||||||||
|
(In thousands) |
||||||||||||||||||||
|
Operating leases |
$ | 1,505 | $ | 603 | $ | 796 | $ | 106 | $ | -- | ||||||||||
|
Capital leases |
209 | 96 | 81 | 32 | -- | |||||||||||||||
|
Uncertain tax positions(2) |
-- | -- | -- | -- | -- | |||||||||||||||
|
Long-term debt |
3,625 | 2,762 | 863 | -- | -- | |||||||||||||||
|
Total |
$ | 5,339 | $ | 3,461 | $ | 1,740 | $ | 138 | $ | -- | ||||||||||
| (1) |
Amounts are inclusive of interest payments, where applicable. |
| (2) | We have $467,000 in liabilities associated with uncertain tax positions. We are unable to reasonably estimate the expected cash settlement dates of these uncertain tax positions with the taxing authorities. |
The Company generally does not make unconditional, non-cancelable purchase commitments. The Company enters into purchase orders in the normal course of business, but these purchase obligations do not exceed one year.
Shareholders’ equity increased by $8.6 million to $82.8 million in 2016, from $74.2 million in 2015. The increase was mainly due to net income of $20.5 million, changes in the cumulative translation adjustment of $369,000, share-based compensation of $1.9 million and $945,000 from the exercise of stock options. This was partially offset by dividends declared of $14.3 million, the acquisition of Customer-Connect LLC non-controlling interests of a net $252,000, and share repurchases of $601,000. The Customer-Connect LLC non-controlling interests net amounts consists of $2.0 million paid for the controlling interest, offset by the addition of a $1.7 million deferred tax asset from the purchase of these remaining interests, which resulted in an increase to additional paid-in capital.
Stock Repurchase Program
In February 2006, the Board of Directors of the Company authorized the repurchase of 2,250,000 shares of class A common stock and 375,000 shares of class B common stock (on a post-May 2013 Recapitalization basis) in the open market or in privately negotiated transactions. As of December 31, 2016, the remaining number of shares that could be purchased under this authorization was 280,491 shares of class A common stock and 69,491 shares of class B common stock.
Off-Balance Sheet Obligations
The Company has no significant off-balance sheet obligations other than the operating lease commitments disclosed in “Liquidity and Capital Resources.”
Recent Accounting Pronouncements
See Note 13 to the Company’s consolidated financial statements for a description of recently issued accounting pronouncements.
Item 7A. Quantitative and Qualitative Disclosure About Market Risk
The Company’s primary market risk exposure is changes in foreign currency exchange rates and interest rates.
The Company’s Canadian subsidiary uses as its functional currency the local currency of the country in which it operates. It translates its assets and liabilities into U.S. dollars at the exchange rate in effect at the balance sheet date. It translates its revenue and expenses at the average exchange rate during the period. The Company includes translation gains and losses in accumulated other comprehensive income (loss), a component of shareholders’ equity. Foreign currency translation gains (losses) were $369,000, ($2.2 million), and ($1.1 million) in 2016, 2015 and 2014, respectively. Gains and losses related to transactions denominated in a currency other than the functional currency of the countries in which the Company operates and short-term intercompany accounts are included in other income (expense) in the consolidated statements of income. A portion of our cash in our Canadian subsidiary is denominated in foreign currencies, where fluctuations in exchange rates will impact our cash balances in U.S. dollar terms. A sensitivity analysis assuming a hypothetical 10% change in the value of the U.S. dollar would impact our reported cash balance by approximately $1.6 million. We have not entered into any foreign currency hedging transactions. We do not purchase or hold any derivative financial instruments for the purpose of speculation or arbitrage.
We are exposed to interest rate risk with both our fixed-rate term debt and variable rate revolving line of credit facility. Interest rate changes for borrowings under our fixed-rate term debt would impact the fair value of such debt, but do not impact earnings or cash flow. At December 31, 2016, our fixed-rate term debt totaled $3.5 million. Based on a sensitivity analysis, a one percent change in market interest rates as of December 31, 2015, would not have a material effect on the estimated fair value of our fixed-rate debt outstanding at December 31, 2016.
Borrowings under our revolving credit note bear interest at a variable annual rate, with three rate options at the discretion of management. Borrowings under the revolving credit note may not exceed the lesser of a calculated borrowing base or $6.5 million. There were no borrowings outstanding under our revolving credit note at December 31, 2016, or at any time during 2016. A sensitivity analysis assuming a hypothetical 10% movement in interest rates applied to the average daily borrowings and the maximum borrowings available under the revolving credit note indicated that such a movement would not have a material impact on our consolidated financial position, results of operations or cash flows.
Item 8. Financial Statements and Supplementary Data
Quarterly Financial Data (Unaudited)
The following table sets forth selected financial information for each of the eight quarters in the two-year period ended December 31, 2016. This unaudited information has been prepared by the Company on the same basis as the consolidated financial statements and includes all normal recurring adjustments necessary to present fairly this information when read in conjunction with the Company’s audited consolidated financial statements and the notes thereto.
|
(In thousands, except per share data) |
||||||||||||||||||||||||||||||||
|
Quarter Ended |
||||||||||||||||||||||||||||||||
|
Dec. 31, 2016 |
Sept 30, 2016 |
June 30, 2016 |
Mar. 31, 2016 |
Dec. 31, 2015 |
Sept 30, 2015 |
June 30, 2015 |
Mar. 31, 2015 |
|||||||||||||||||||||||||
|
Revenue |
$ | 28,368 | $ | 27,032 | $ | 26,114 | $ | 27,870 | $ | 26,365 | $ | 25,244 | $ | 24,464 | $ | 26,270 | ||||||||||||||||
|
Direct expenses |
11,836 | 11,468 | 10,734 | 11,539 | 11,365 | 11,006 | 10,440 | 11,799 | ||||||||||||||||||||||||
|
Selling, general and administrative expenses |
6,619 | 7,139 | 7,270 | 7,357 | 6,294 | 6,620 | 6,636 | 7,627 | ||||||||||||||||||||||||
|
Depreciation and amortization |
1,079 | 1,086 | 1,092 | 968 | 1,000 | 1,070 | 1,024 | 1,015 | ||||||||||||||||||||||||
|
Operating income |
8,834 | 7,339 | 7,018 | 8,006 | 7,706 | 6,548 | 6,364 | 5,829 | ||||||||||||||||||||||||
|
Other income (expense) |
171 | (30 | ) | 18 | -- | 1,062 | (63 | ) | (39 | ) | (47 | ) | ||||||||||||||||||||
|
Provision for income taxes |
3,280 | 2,580 | 2,478 | 2,500 | 2,841 | 2,346 | 2,261 | 2,302 | ||||||||||||||||||||||||
|
Net income |
$ | 5,725 | $ | 4,729 | $ | 4,558 | $ | 5,506 | $ | 5,927 | $ | 4,139 | $ | 4,064 | $ | 3,480 | ||||||||||||||||
|
Earnings per share of common stock: |
||||||||||||||||||||||||||||||||
|
Basic earnings per share |
||||||||||||||||||||||||||||||||
|
Class A |
$ | 0.14 | $ | 0.11 | $ | 0.11 | $ | 0.13 | $ | 0.14 | $ | 0.10 | $ | 0.10 | $ | 0.08 | ||||||||||||||||
|
Class B |
$ | 0.82 | $ | 0.67 | $ | 0.65 | $ | 0.79 | $ | 0.85 | $ | 0.59 | $ | 0.58 | $ | 0.50 | ||||||||||||||||
|
Dilutive earnings per share |
||||||||||||||||||||||||||||||||
|
Class A |
$ | 0.13 | $ | 0.11 | $ | 0.11 | $ | 0.13 | $ | 0.14 | $ | 0.10 | $ | 0.10 | $ | 0.08 | ||||||||||||||||
|
Class B |
$ | 0.80 | $ | 0.66 | $ | 0.64 | $ | 0.77 | $ | 0.84 | $ | 0.59 | $ | 0.57 | $ | 0.49 | ||||||||||||||||
|
Weighted average shares outstanding – basic |
||||||||||||||||||||||||||||||||
|
Class A |
20,717 | 20,716 | 20,711 | 20,710 | 20,656 | 20,726 | 20,790 | 20,792 | ||||||||||||||||||||||||
|
Class B |
3,511 | 3,511 | 3,508 | 3,489 | 3,478 | 3,478 | 3,478 | 3,478 | ||||||||||||||||||||||||
|
Weighted average shares outstanding - diluted |
||||||||||||||||||||||||||||||||
|
Class A |
21,118 | 21,068 | 20,992 | 21,012 | 20,936 | 20,937 | 21,029 | 21,033 | ||||||||||||||||||||||||
|
Class B |
3,569 | 3,556 | 3,565 | 3,549 | 3,523 | 3,521 | 3,522 | 3,524 | ||||||||||||||||||||||||
Report of Independent Registered Public Accounting Firm
The Board of Directors and Shareholders
National Research Corporation:
We have audited the accompanying consolidated balance sheets of National Research Corporation and subsidiary as of December 31, 2016 and 2015, and the related consolidated statements of income, comprehensive income, shareholders’ equity, and cash flows for each of the years in the three-year period ended December 31, 2016. In connection with our audits of the consolidated financial statements, we have also audited the financial statement schedule listed in Item 15(2) of this Form 10-K. These consolidated financial statements and the financial statement schedule are the responsibility of the Company’s management. Our responsibility is to express an opinion on these consolidated financial statements and financial statement schedule based on our audits.
We conducted our audits in accordance with the standards of the Public Company Accounting Oversight Board (United States). Those standards require that we plan and perform the audit to obtain reasonable assurance about whether the financial statements are free of material misstatement. An audit includes examining, on a test basis, evidence supporting the amounts and disclosures in the financial statements. An audit also includes assessing the accounting principles used and significant estimates made by management, as well as evaluating the overall financial statement presentation. We believe that our audits provide a reasonable basis for our opinion.
In our opinion, the consolidated financial statements referred to above present fairly, in all material respects, the financial position of National Research Corporation and subsidiary as of December 31, 2016 and 2015, and the results of their operations and their cash flows for each of the years in the three-year period ended December 31, 2016, in conformity with U.S. generally accepted accounting principles. Also in our opinion, the related financial statement schedule, when considered in relation to the basic consolidated financial statements taken as a whole, present fairly, in all material respects, the information set forth therein.
We also have audited, in accordance with the standards of the Public Company Accounting Oversight Board (United States), National Research Corporation and subsidiary’s internal control over financial reporting as of December 31, 2016, based on criteria established in Internal Control – Integrated Framework (2013) issued by the Committee of Sponsoring Organizations of the Treadway Commission (COSO), and our report dated March 3, 2017 expressed an unqualified opinion on the effectiveness of the Company’s internal control over financial reporting.
/s/ KPMG LLP
Lincoln, Nebraska
March 3, 2017
NATIONAL RESEARCH CORPORATION AND SUBSIDIARY
Consolidated Balance Sheets
(In thousands, except share amounts)
|
2016 |
2015 |
|||||||
| Assets | ||||||||
|
Current assets: |
||||||||
|
Cash and cash equivalents |
$ | 33,021 | $ | 42,145 | ||||
|
Trade accounts receivable, less allowance for doubtful accounts of $169 and $173, respectively |
10,864 | 9,808 | ||||||
|
Unbilled revenue |
1,546 | 1,435 | ||||||
|
Prepaid expenses |
1,585 | 1,482 | ||||||
|
Income taxes receivable |
14 | 157 | ||||||
|
Other current assets |
35 | 34 | ||||||
|
Total current assets |
47,065 | 55,061 | ||||||
|
Net property and equipment |
11,806 | 11,125 | ||||||
|
Intangible assets, net |
3,124 | 3,778 | ||||||
|
Goodwill |
57,861 | 57,792 | ||||||
|
Other |
768 | 293 | ||||||
|
Total assets |
$ | 120,624 | $ | 128,049 | ||||
|
Liabilities and Shareholders’ Equity |
||||||||
|
Current liabilities: |
||||||||
|
Current portion of notes payable |
$ | 2,683 | $ | 2,402 | ||||
|
Accounts payable |
765 | 614 | ||||||
|
Accrued wages, bonus and profit sharing |
4,543 | 4,391 | ||||||
|
Accrued expenses |
3,069 | 2,706 | ||||||
|
Current portion of capital lease obligations |
82 | 74 | ||||||
|
Income taxes payable |
662 | 701 | ||||||
|
Dividends payable |
4,213 | 18,440 | ||||||
|
Deferred revenue |
15,497 | 14,843 | ||||||
|
Total current liabilities |
31,514 | 44,171 | ||||||
|
Notes payable, net of current portion |
857 | 3,337 | ||||||
|
Deferred income taxes |
4,861 | 5,744 | ||||||
|
Other long term liabilities |
586 | 575 | ||||||
|
Total liabilities |
37,818 | 53,827 | ||||||
|
Shareholders’ equity: |
||||||||
|
Preferred stock, $0.01 par value, authorized 2,000,000 shares, none issued |
-- | -- | ||||||
|
Class A Common stock, $0.001 par value; authorized 60,000,000 shares, issued 25,656,760 in 2016 and 25,592,812 in 2015, outstanding 20,891,069 in 2016 and 20,848,168 in 2015 |
26 | 26 | ||||||
|
Class B Common stock, $0.001 par value; authorized 80,000,000 shares, issued 4,308,875 in 2016 and 4,271,413 in 2015, outstanding 3,539,931 in 2016 and 3,510,150 in 2015 |
4 | 4 | ||||||
|
Additional paid-in capital |
46,725 | 44,103 | ||||||
|
Retained earnings |
71,507 | 65,313 | ||||||
|
Accumulated other comprehensive (loss) income, foreign currency translation adjustment |
(2,626 | ) | (2,995 | ) | ||||
|
Treasury stock, at cost; 4,765,691 Class A shares, 768,944 Class B shares in 2016 and 4,744,644 Class A shares, 761,263 Class B shares in 2015 |
(32,830 | ) | (32,229 | ) | ||||
|
Total shareholders’ equity |
82,806 | 74,222 | ||||||
|
Total liabilities and shareholders’ equity |
$ | 120,624 | $ | 128,049 | ||||
See accompanying notes to consolidated financial statements.
NATIONAL RESEARCH CORPORATION AND SUBSIDIARY
Consolidated Statements of Income
(In thousands, except for per share amounts)
|
2016 |
2015 |
2014 |
||||||||||
|
Revenue |
$ | 109,384 | $ | 102,343 | $ | 98,837 | ||||||
|
Operating expenses: |
||||||||||||
|
Direct |
45,577 | 44,610 | 41,719 | |||||||||
|
Selling, general and administrative |
28,385 | 27,177 | 25,018 | |||||||||
|
Depreciation and amortization |
4,225 | 4,109 | 3,804 | |||||||||
|
Total operating expenses |
78,187 | 75,896 | 70,541 | |||||||||
|
Operating income |
31,197 | 26,447 | 28,296 | |||||||||
|
Other income (expense): |
||||||||||||
|
Interest income |
47 | 60 | 83 | |||||||||
|
Interest expense |
(190 | ) | (220 | ) | (305 | ) | ||||||
|
Other, net |
302 | 1,073 | 18 | |||||||||
|
Total other expense |
159 | 913 | (204 | ) | ||||||||
|
Income before income taxes |
31,356 | 27,360 | 28,092 | |||||||||
|
Provision for income taxes |
10,838 | 9,750 | 9,936 | |||||||||
|
Net income |
$ | 20,518 | $ | 17,610 | $ | 18,156 | ||||||
| Earnings per share of common stock: | ||||||||||||
|
Basic earnings per share: |
||||||||||||
|
Class A |
$ | 0.49 | $ | 0.42 | $ | 0.44 | ||||||
|
Class B |
$ | 2.93 | $ | 2.52 | $ | 2.62 | ||||||
| Diluted earnings per share: | ||||||||||||
|
Class A |
$ | 0.48 | $ | 0.41 | $ | 0.43 | ||||||
|
Class B |
$ | 2.88 | $ | 2.49 | $ | 2.57 | ||||||
|
Weighted average shares and share equivalents outstanding |
||||||||||||
|
Class A - basic |
20,713 | 20,741 | 20,764 | |||||||||
|
Class B - basic |
3,505 | 3,478 | 3,473 | |||||||||
|
Class A - diluted |
21,037 | 20,981 | 21,076 | |||||||||
|
Class B - diluted |
3,560 | 3,522 | 3,536 | |||||||||
See accompanying notes to consolidated financial statements.
NATIONAL RESEARCH CORPORATION AND SUBSIDIARY
Consolidated Statements of comprehensive income
(In thousands)
|
2016 |
2015 |
2014 |
||||||||||
|
Net Income |
$ | 20,518 | $ | 17,610 | $ | 18,156 | ||||||
|
Other comprehensive income (loss): |
||||||||||||
|
Cumulative translation adjustment |
$ | 369 | $ | (2,222 | ) | $ | (1,075 | ) | ||||
|
Other comprehensive income (loss) |
$ | 369 | $ | (2,222 | ) | $ | (1,075 | ) | ||||
|
Comprehensive Income |
$ | 20,887 | $ | 15,388 | $ | 17,081 | ||||||
See accompanying notes to consolidated financial statements.
NATIONAL RESEARCH CORPORATION AND SUBSIDIARY
Consolidated Statements of Shareholders’ Equity
(In thousands except share and per share amounts)
|
Common |
Common |
Additional |
Retained |
Accumulated Other |
Treasury Stock |
Total |
||||||||||||||||||||||
|
Balances at December 31, 2013 |
$ | 25 | $ | 4 | $ | 42,192 | $ | 58,042 | $ | 302 | $ | (28,810 | ) | $ | 71,755 | |||||||||||||
|
Purchase of 65,131 shares of class A and 4,317 shares of class B treasury stock |
-- | -- | -- | -- | -- | (1,248 | ) | (1,248 | ) | |||||||||||||||||||
|
Issuance of 140,595 class A common shares and 23,432 class B shares for the exercise of stock options |
-- | -- | 1,308 | -- | -- | -- | 1,308 | |||||||||||||||||||||
|
Tax benefit from the exercise of options and restricted stock |
-- | -- | 622 | -- | -- | -- | 622 | |||||||||||||||||||||
|
Issuance of restricted common shares, net of forfeitures (50,038 class A and 8,340 class B) |
-- | -- | -- | -- | -- | -- | -- | |||||||||||||||||||||
|
Non-cash stock compensation expense |
-- | -- | 742 | -- | -- | -- | 742 | |||||||||||||||||||||
|
Dividends declared of $0.06 and $0.36 per A and B common share, respectively |
-- | -- | -- | (2,512 | ) | -- | -- | (2,512 | ) | |||||||||||||||||||
|
Other comprehensive loss, foreign currency translation adjustment |
-- | -- | -- | -- | (1,075 | ) | -- | (1,075 | ) | |||||||||||||||||||
|
Net income |
-- | -- | -- | 18,156 | -- | -- | 18,156 | |||||||||||||||||||||
|
Balances at December 31, 2014 |
$ | 25 | $ | 4 | $ | 44,864 | $ | 73,686 | $ | (773 | ) | $ | (30,058 | ) | $ | 87,748 | ||||||||||||
|
Purchase of 163,268 shares of class A and 4,239 shares of class B treasury stock |
-- | -- | -- | -- | -- | (2,171 | ) | (2,171 | ) | |||||||||||||||||||
|
Issuance of 43,983 class A common shares and 7,330 class B shares for the exercise of stock options |
-- | -- | 406 | -- | -- | -- | 406 | |||||||||||||||||||||
|
Tax benefit from the exercise of options and restricted stock |
-- | -- | 240 | -- | -- | -- | 240 | |||||||||||||||||||||
|
Issuance of restricted common shares, net of forfeitures (73,168 class A and 12,194 class B) |
1 | -- | (1 | ) | -- | -- | -- | -- | ||||||||||||||||||||
|
Non-cash stock compensation expense |
-- | -- | 1,383 | -- | -- | -- | 1,383 | |||||||||||||||||||||
|
Dividends declared of $0.62 and $3.72 per A and B common share, respectively |
-- | -- | -- | (25,983 | ) | -- | -- | (25,983 | ) | |||||||||||||||||||
|
Acquisition of non-controlling interest |
-- | -- | (2,789 | ) | -- | -- | -- | (2,789 | ) | |||||||||||||||||||
|
Other comprehensive loss, foreign currency translation adjustment |
-- | -- | -- | -- | (2,222 | ) | -- | (2,222 | ) | |||||||||||||||||||
|
Net income |
-- | -- | -- | 17,610 | -- | -- | 17,610 | |||||||||||||||||||||
|
Balances at December 31, 2015 |
$ | 26 | $ | 4 | $ | 44,103 | $ | 65,313 | $ | (2,995 | ) | $ | (32,229 | ) | $ | 74,222 | ||||||||||||
|
Purchase of 21,047 shares of class A and 7,681 shares of class B treasury stock |
-- | -- | -- | -- | -- | (601 | ) | (601 | ) | |||||||||||||||||||
|
Issuance of 52,383 class A common shares and 35,534 class B shares for the exercise of stock options |
-- | -- | 945 | -- | -- | -- | 945 | |||||||||||||||||||||
|
Issuance of restricted common shares, net of forfeitures (11,565 class A and 1,928 class B) |
-- | -- | -- | -- | -- | -- | -- | |||||||||||||||||||||
|
Non-cash stock compensation expense |
-- | -- | 1,929 | -- | -- | -- | 1,929 | |||||||||||||||||||||
|
Dividends declared of $0.34 and $2.04 per A and B common share, respectively |
-- | -- | -- | (14,324 | ) | -- | -- | (14,324 | ) | |||||||||||||||||||
|
Acquisition of non-controlling interest |
-- | -- | (252 | ) | -- | -- | -- | (252 | ) | |||||||||||||||||||
|
Other comprehensive income, foreign currency translation adjustment |
-- | -- | -- | -- | 369 | -- | 369 | |||||||||||||||||||||
|
Net income |
-- | -- | -- | 20,518 | -- | -- | 20,518 | |||||||||||||||||||||
|
Balances at December 31, 2016 |
$ | 26 | $ | 4 | $ | 46,725 | $ | 71,507 | $ | (2,626 | ) | $ | (32,830 | ) | $ | 82,806 | ||||||||||||
See accompanying notes to consolidated financial statements.
NATIONAL RESEARCH CORPORATION AND SUBSIDIARY
Consolidated Statements of Cash Flows
(In thousands)
|
2016 |
2015 |
2014 |
||||||||||
|
Cash flows from operating activities: |
||||||||||||
|
Net income |
$ | 20,518 | $ | 17,610 | $ | 18,156 | ||||||
|
Adjustments to reconcile net income to net cash provided by operating activities: |
||||||||||||
|
Depreciation and amortization |
4,225 | 4,109 | 3,804 | |||||||||
|
Deferred income taxes |
865 | (1,361 | ) | 107 | ||||||||
|
Reserve for uncertain tax positions |
6 | 93 | 182 | |||||||||
|
Loss on disposal of property and equipment |
22 | - | 2 | |||||||||
|
Gain on sale from operating segment |
(223 | ) | (1,102 | ) | - | |||||||
|
Write-off of purchase option |
-- | 657 | - | |||||||||
|
Tax benefit from exercise of stock options |
-- | 25 | 93 | |||||||||
|
Non-cash share-based compensation expense |
1,929 | 1,383 | 742 | |||||||||
|
Change in assets and liabilities, net of effect of acquisition and disposal: |
||||||||||||
|
Trade accounts receivable |
(1,044 | ) | (1,777 | ) | 2,914 | |||||||
|
Unbilled revenue |
(93 | ) | (390 | ) | 66 | |||||||
|
Prepaid expenses and other current assets |
(535 | ) | 207 | (2 | ) | |||||||
|
Accounts payable |
(15 | ) | (224 | ) | 163 | |||||||
|
Accrued expenses, wages, bonus and profit sharing |
440 | 755 | (367 | ) | ||||||||
|
Income taxes receivable and payable |
105 | 1,504 | (715 | ) | ||||||||
|
Deferred revenue |
643 | 397 | 1,052 | |||||||||
|
Net cash provided by operating activities |
26,843 | 21,886 | 26,197 | |||||||||
|
Cash flows from investing activities: |
||||||||||||
|
Purchases of property and equipment |
(3,973 | ) | (2,939 | ) | (2,492 | ) | ||||||
|
Option purchase |
-- | -- | (657 | ) | ||||||||
|
Acquisition, net of cash acquired |
-- | -- | (2,574 | ) | ||||||||
|
Net proceeds from sale of operating segment |
223 | 1,613 | -- | |||||||||
|
Net cash used in investing activities |
(3,750 | ) | (1,326 | ) | (5,723 | ) | ||||||
|
Cash flows from financing activities: |
||||||||||||
|
Payments on notes payable |
(2,199 | ) | (2,328 | ) | (2,256 | ) | ||||||
|
Payments on capital lease obligations |
(95 | ) | (173 | ) | (156 | ) | ||||||
|
Cash paid for non-controlling interest |
(2,000 | ) | (2,789 | ) | -- | |||||||
|
Proceeds from exercise of stock options |
548 | - | 408 | |||||||||
|
Excess tax benefit from share-based compensation |
- | 240 | 622 | |||||||||
|
Repurchase of shares for payroll tax withholdings related to share-based compensation |
(204 | ) | (92 | ) | (348 | ) | ||||||
|
Purchase of Treasury Stock |
-- | (1,673 | ) | -- | ||||||||
|
Payment of dividends on common stock |
(28,552 | ) | (10,054 | ) | -- | |||||||
|
Net cash used in financing activities |
(32,502 | ) | (16,869 | ) | (1,730 | ) | ||||||
|
Effect of exchange rate changes on cash |
285 | (1,588 | ) | (794 | ) | |||||||
|
Net (decrease) increase in cash and cash equivalents |
(9,124 | ) | 2,103 | 17,950 | ||||||||
|
Cash and cash equivalents at beginning of period |
42,145 | 40,042 | 22,092 | |||||||||
|
Cash and cash equivalents at end of period |
$ | 33,021 | $ | 42,145 | $ | 40,042 | ||||||
|
Supplemental disclosure of cash paid for: |
||||||||||||
|
Interest expense, net of $10, $14, and $10 capitalized, respectively |
$ | 192 | $ | 207 | $ | 284 | ||||||
|
Income taxes |
$ | 9,963 | $ | 9,377 | $ | 9,874 | ||||||
Supplemental disclosures of non-cash investing and financing activities:
Capital lease obligations for property and equipment originating during the years ended December 31, 2016, 2015 and 2014 was $109, $32, and $248, respectively.
In connection with the Company’s equity incentive plans, certain optionees tendered to the Company previously owned shares to pay for the option strike price. The total non-cash stock options exercised was $397, $406 and $900 for the years ended December 31, 2016, 2015, and 2014, respectively.
See accompanying notes to consolidated financial statements.
NATIONAL RESEARCH CORPORATION AND SUBSIDIARY
Notes to Consolidated Financial Statements
(1) Summary of Significant Accounting Policies
Description of Business and Basis of Presentation
National Research Corporation, doing business as NRC Health (“NRC Health,” the “Company,” “we,” “our,” “us” or similar terms), is a leading provider of analytics and insights that facilitate measurement and improvement of the patient and employee experience while also increasing patient engagement and customer loyalty for healthcare providers, payers and other healthcare organizations in the United States and Canada. The Company’s solutions enable its clients to understand the voice of the customer with greater clarity, immediacy and depth. The Company’s ten largest clients accounted for 17%, 15%, and 16% of the Company’s total revenue in 2016, 2015, and 2014, respectively.
Principles of Consolidation
The consolidated financial statements include the accounts of the Company and its wholly-owned subsidiary, National Research Corporation Canada. Prior to becoming a wholly-owned subsidiary in March 2016, the accounts of Customer-Connect LLC (“Connect”), then a variable interest entity for which NRC Health was deemed the primary beneficiary, were included in the consolidated financial statements of the Company. On June 30, 2016, Customer-Connect LLC was dissolved. All significant intercompany transactions and balances have been eliminated.
Use of Estimates
The preparation of financial statements in conformity with accounting principles generally accepted in the United States of America requires management to make certain estimates and assumptions that affect the reported amounts of assets and liabilities at the date of the financial statements and the reported amounts of revenue and expenses during the reporting period. Actual results could differ from those estimates.
Translation of Foreign Currencies
The Company’s Canadian subsidiary uses as its functional currency the local currency of the country in which it operates. It translates its assets and liabilities into U.S. dollars at the exchange rate in effect at the balance sheet date. It translates its revenue and expenses at the average exchange rate during the period. The Company includes translation gains and losses in accumulated other comprehensive income (loss), a component of shareholders’ equity. Gains and losses related to transactions denominated in a currency other than the functional currency of the country in which the Company operates and short-term intercompany accounts are included in other income (expense) in the consolidated statements of income. Since the undistributed earnings of the Company’s foreign subsidiary are considered to be indefinitely reinvested, the components of accumulated other comprehensive income (loss) have not been tax effected.
Revenue Recognition
The Company derives a majority of its operating revenue from its annually renewable services, which include performance measurement and improvement services, healthcare analytics and governance education services. The Company provides these services to its clients under annual client service contracts, although such contracts are generally cancelable on short or no notice without penalty. Services are provided under subscription-based service agreements. The Company recognizes subscription-based service revenue over the period of time the service is provided. Generally, the subscription periods are for twelve months and revenue is recognized equally over the subscription period.
Certain contracts are fixed-fee arrangements with a portion of the project fee billed in advance and the remainder billed periodically over the duration of the project. Revenue for services provided under these contracts are recognized under the proportional performance method. Under the proportional performance method, the Company recognizes revenue based on output measures or key milestones such as survey set-up, survey mailings, survey returns and reporting. The Company measures its progress based on the level of completion of these output measures and recognizes revenue accordingly. Management judgments and estimates must be made and used in connection with revenue recognized using the proportional performance method. If management made different judgments and estimates, then the amount and timing of revenue for any period could differ materially from the reported revenue.
The Company’s revenue arrangements with a client may include combinations of NRC Health’s Experience, Transparency, Governance, and Market Insights solutions which may be executed at the same time, or within close proximity of one another (referred to as a multiple-element arrangement). Each element of a multiple-element arrangement is accounted for as a separate unit of accounting provided each delivered element is sold separately by the Company or another vendor; and for an arrangement that includes a general right of return relative to the undelivered elements, delivery or performance of the undelivered services are considered probable and substantially in the control of the Company. The Company’s arrangements generally do not include a general right of return related to the delivered services. If these criteria are not met, the arrangement is accounted for as a single unit of accounting with revenue generally recognized equally over the subscription period or recognized under the proportional performance method.
Revenue is allocated to each separate unit of accounting based on relative selling price using a selling price hierarchy: vendor-specific objective evidence (“VSOE”), if available, third-party evidence (“TPE”) if VSOE is not available, or estimated selling price if VSOE nor TPE is available. VSOE is established based on the services normal selling price and discounts for the specific services when sold separately. TPE is established by evaluating similar competitor services in standalone arrangements. If neither exists for a deliverable, the best estimate of the selling price (“ESP”) is used for that deliverable based on list price, representing a component of management’s market strategy, and an analysis of historical prices for bundled and standalone arrangements. Revenue allocated to an element is limited to revenue that is not subject to refund or otherwise represents contingent revenue. VSOE, TPE and ESP are periodically adjusted to reflect current market conditions. These adjustments are not expected to differ significantly from historical results.
Business Combinations
The Company uses the acquisition method of accounting for acquired businesses. Under the acquisition method, the financial statements reflect the operations of an acquired business starting from the completion of the acquisition. The assets acquired and liabilities assumed are recorded at their respective estimated fair values at the date of the acquisition. Any excess of the purchase price over the estimated fair values of the identifiable net assets acquired is recorded as goodwill. Significant judgment is required in estimating the fair value of assets acquired, especially intangible assets. As a result, in the case of significant acquisitions we typically engage third-party valuation specialists in estimating fair values of tangible and intangible assets. The fair value estimates are based on available historical information and on expectations and assumptions about the future, considering the perspective of marketplace participants.
Segment Information
In 2016, the Company had six operating segments comprised of Experience, The Governance Institute, Market Insights, Transparency, National Research Corporation Canada and Connect, which offer a portfolio of solutions that address specific needs around market insight, experience, transparency and governance for healthcare providers, payers and other healthcare organizations. The Company’s six operating segments are aggregated into one reporting segment because they have similar economic characteristics and meet the other aggregation criteria from the Financial Accounting Standards Board (“FASB”) guidance on segment disclosure. As discussed in Note 3, on December 21, 2015, selected assets and liabilities were sold from the former Predictive Analytics operating segment, reducing the number of operating segments from seven to six in December 2015.
Trade Accounts Receivable
Trade accounts receivable are recorded at the invoiced amount. The allowance for doubtful accounts is the Company’s best estimate of the amount of probable credit losses in the Company’s existing accounts receivable. The Company determines the allowance based on the Company’s historical write-off experience and current economic conditions. The Company reviews the allowance for doubtful accounts monthly. Account balances are charged off against the allowance after all means of collection have been exhausted and the potential for recovery is considered remote.
Property and Equipment
Property and equipment is stated at cost. Major expenditures to purchase property or to substantially increase useful lives of property are capitalized. Maintenance, repairs and minor renewals are expensed as incurred. When assets are retired or otherwise disposed of, their costs and related accumulated depreciation are removed from the accounts and resulting gains or losses are included in income.
For costs of software developed for internal use, the Company expenses computer software costs as incurred in the preliminary project stage, which involves the conceptual formulation, evaluation and selection of technology alternatives. Costs incurred related to the design, coding, installation and testing of software during the application project stage are capitalized. Costs for training and application maintenance are expensed as incurred. The Company has capitalized approximately $2.5 million and $2.0 million of internal and external costs incurred for the development of internal-use software for the years ended December 31, 2016 and 2015, respectively, with such costs classified as property and equipment.
The Company provides for depreciation and amortization of property and equipment using annual rates which are sufficient to amortize the cost of depreciable assets over their estimated useful lives. The Company uses the straight-line method of depreciation and amortization over estimated useful lives of three to ten years for furniture and equipment, three to five years for computer equipment, one to five years for capitalized software, and seven to forty years for the Company’s office building and related improvements.
Leases are categorized as operating or capital at the inception of the lease. Assets under capital lease obligations are reported at the lower of fair value or the present value of the aggregate future minimum lease payments at the beginning of the lease term. The Company depreciates capital lease assets without transfer-of-ownership or bargain-purchase-options using the straight-line method over the lease terms, excluding any lease renewals, unless the lease renewals are reasonably assured. Capital lease assets with transfer-of-ownership or bargain-purchase-options are depreciated using the straight-line method over the assets’ estimated useful lives.
Impairment of Long-Lived Assets and Amortizing Intangible Assets
Long-lived assets, such as property and equipment and purchased intangible assets subject to depreciation or amortization, are reviewed for impairment whenever events or changes in circumstances indicate that the carrying amount of an asset may not be recoverable. If circumstances require a long-lived asset or asset group be tested for possible impairment, the Company first compares undiscounted cash flows expected to be generated by that asset or asset group to its carrying value. If the carrying value of the long-lived asset or asset group is not recoverable on an undiscounted cash flow basis, an impairment is recognized to the extent that the carrying value exceeds its fair value. Fair value is determined through various valuation techniques including discounted cash flow models, quoted market values and third-party independent appraisals, as considered necessary. No impairments were recorded during the years ended December 31, 2016, 2015, or 2014.
Among others, management believes the following circumstances are important indicators of potential impairment of such assets and as a result may trigger an impairment review:
|
● |
Significant underperformance in comparison to historical or projected operating results; |
|
● |
Significant changes in the manner or use of acquired assets or the Company’s overall strategy; |
|
● |
Significant negative trends in the Company’s industry or the overall economy; |
|
● |
A significant decline in the market price for the Company’s common stock for a sustained period; and |
|
● |
The Company’s market capitalization falling below the book value of the Company’s net assets. |
Goodwill and Intangible Assets
Intangible assets include customer relationships, trade names, technology, non-compete agreements and goodwill. Intangible assets with estimable useful lives are amortized over their respective estimated useful lives to their estimated residual values and reviewed for impairment whenever events or changes in circumstances indicate that the carrying amount of the assets may not be recoverable. The Company reviews intangible assets with indefinite lives for impairment annually as of October 1 and whenever events or changes in circumstances indicate that the carrying value of an asset may not be recoverable.
When performing the impairment assessment, the Company will first assess qualitative factors to determine whether it is necessary to recalculate the fair value of the intangible assets with indefinite lives. If the Company believes, as a result of the qualitative assessment, that it is more likely than not that the fair value of the indefinite-lived intangibles is less than their carrying amount, the Company calculates the fair value using a market approach. If the carrying value of intangible assets with indefinite lives exceeds their fair value, then the intangible assets are written-down to their fair values. The Company did not recognize any impairments related to indefinite-lived intangibles during 2016, 2015 or 2014.
Goodwill is an asset representing the future economic benefits arising from other assets acquired in a business combination that are not individually identified and separately recognized. All of the Company’s goodwill is allocated to its reporting units, which are the same as its operating segments. Goodwill is reviewed for impairment at least annually, as of October 1, and whenever events or changes in circumstances indicate that the carrying value of goodwill may not be recoverable.
The Company reviews for goodwill impairment by first assessing qualitative factors to determine whether any impairment may exist. If the Company believes, as a result of the qualitative assessment, that it is more likely than not that the fair value of a reporting unit is less than its carrying amount, a quantitative two-step test is required; otherwise, no further testing is required. Under the first step of the quantitative test, the fair value of the reporting unit is compared with its carrying value (including goodwill). If the fair value of the reporting unit exceeds its carrying value, step two is not performed. If the fair value of the reporting unit is less than its carrying value, an indication of goodwill impairment exists for the reporting unit and the Company performs step two of the impairment test (measurement). Under step two, an impairment loss is recognized for any excess of the carrying amount of the reporting unit’s goodwill over the fair value of that goodwill. The fair value of goodwill is determined by allocating the fair value of the reporting unit in a manner similar to a purchase price allocation and the residual fair value after this allocation is the fair value of the reporting unit goodwill.
In instances when a step two is required, the fair value of the reporting unit is determined using an income approach and comparable market multiples. Under the income approach, there are a number of inputs used to calculate the fair value using a discounted cash flow model, including operating results, business plans, projected cash flows and a discount rate. Discount rates, growth rates and cash flow projections are the most sensitive and susceptible to change as they require significant management judgment. Discount rates are determined by using a weighted average cost of capital, which considers market and industry data. Management develops growth rates and cash flow projections for each reporting unit considering industry and Company-specific historical and projected information. Terminal value rate determination follows common methodology of capturing the present value of perpetual cash flow estimates beyond the last projected period assuming a constant weighted average cost of capital and low long-term growth rates. Under the market approach, the Company considers its market capitalization, comparisons to other public companies’ data, and recent transactions of similar businesses within the Company’s industry.
The Company performed a qualitative analysis as of October 1, 2016 which did not indicate that it was more likely than not that the carrying values of the reporting units exceeded fair value. No impairments were recorded during the years ended December 31, 2016, 2015 or 2014.
Income Taxes
The Company uses the asset and liability method of accounting for income taxes. Under that method, deferred income tax assets and liabilities are recognized for the future tax consequences attributable to differences between the financial statement carrying amounts of existing assets and liabilities and their respective tax basis using enacted tax rates. The effect on deferred tax assets and liabilities of a change in tax rates is recognized in income in the period that includes the enactment date. Valuation allowances, if any, are established when necessary to reduce deferred tax assets to the amount that is more likely than not to be realized. The Company uses the deferral method of accounting for its investment tax credits related to state tax incentives. During the years ended December 31, 2016, 2015 and 2014, the Company recorded income tax benefits relating to these tax credits of $77,000, $156,000, and $224,000, respectively.
The Company recognizes the effect of income tax positions only if those positions are more likely than not of being sustained. Recognized income tax positions are measured at the largest amount that is greater than 50% likely of being realized. Changes in recognition or measurement are reflected in the period in which the change in judgment occurs.
Share-Based Compensation
The compensation expense on share-based payments is recognized based on the grant-date fair value of those awards. All of the Company’s existing stock option awards and non-vested stock awards have been determined to be equity-classified awards.
Amounts recognized in the financial statements with respect to these plans:
|
2016 |
2015 |
2014 |
||||||||||
|
(In thousands) |
||||||||||||
|
Amounts charged against income, before income tax benefit |
$ | 1,929 | $ | 1,383 | $ | 742 | ||||||
|
Amount of related income tax benefit |
(704 | ) | (505 | ) | (269 | ) | ||||||
|
Total impact to net income |
$ | 1,225 | $ | 878 | $ | 473 | ||||||
Cash and Cash Equivalents
The Company considers all highly liquid investments with original maturities of three months or less to be cash equivalents. Cash equivalents were $32.7 million and $39.8 million as of December 31, 2016, and 2015, respectively, consisting primarily of money market accounts and funds invested in commercial paper. At certain times, cash equivalent balances may exceed federally insured limits.
Fair Value Measurements
The Company’s valuation techniques are based on maximizing observable inputs and minimizing the use of unobservable inputs when measuring fair value. Observable inputs reflect readily obtainable data from independent sources, while unobservable inputs reflect the Company’s market assumptions. The inputs are then classified into the following hierarchy: (1) Level 1 Inputs—quoted prices in active markets for identical assets and liabilities; (2) Level 2 Inputs—observable market-based inputs other than Level 1 inputs, such as quoted prices for similar assets or liabilities in active markets, quoted prices for similar or identical assets or liabilities in markets that are not active, or other inputs that are observable or can be corroborated by observable market data; (3) Level 3 Inputs—unobservable inputs.
Commercial paper included in cash equivalents is valued at amortized cost, which approximates fair value due to its short-term nature. These are included as a Level 2 measurement in the table below.
The following details the Company’s financial assets within the fair value hierarchy at December 31, 2015 and 2014:
| Level 1 | Level 2 | Level 3 | Total | |||||||||||||
| (In thousands) | ||||||||||||||||
| As of December 31, 2016 | ||||||||||||||||
|
Money Market Funds |
$ | 11,200 | $ | -- | $ | -- | $ | 11,200 | ||||||||
| Commercial Paper | -- | 21,450 | -- | 21,450 | ||||||||||||
| Total Cash Equivalents | $ | 11,200 | $ | 21,450 | $ | -- | $ | 32,650 | ||||||||
| As of December 31, 2015 | ||||||||||||||||
|
Money Market Funds |
$ | 8,954 | $ | -- | $ | -- | $ | 8,954 | ||||||||
| Commercial Paper | -- | 30,872 | -- | 30,872 | ||||||||||||
| Total Cash Equivalents | $ | 8,954 | $ | 30,872 | $ | -- | $ | 39,826 | ||||||||
There were no transfers between levels during the years ended December 31, 2016 and 2015.
The Company's long-term debt described in Note 8 is recorded at historical cost. The fair value of long-term debt is classified in Level 2 of the fair value hierarchy and was estimated based primarily on estimated current rates available for debt of the same remaining duration and adjusted for nonperformance and credit.
The following are the carrying amount and estimated fair values of long-term debt:
|
December 31, 2016 |
December 31, 2015 |
|||||||
|
(In thousands) |
||||||||
|
Total carrying amount of long-term debt |
$ | 3,540 | $ | 5,739 | ||||
|
Estimated fair value of long-term debt |
$ | 3,533 | $ | 5,708 | ||||
The carrying amounts of accounts receivable, accounts payable, and accrued expenses approximate their fair value. All non-financial assets that are not recognized or disclosed at fair value in the financial statements on a recurring basis, which includes goodwill and non-financial long-lived assets, are measured at fair value in certain circumstances (for example, when there is evidence of impairment). As of December 31, 2016 and 2015, there was no impairment related to property and equipment, goodwill and other intangible assets.
Contingencies
From time to time, the Company is involved in certain claims and litigation arising in the normal course of business. Management assesses the probability of loss for such contingencies and recognizes a liability when a loss is probable and estimable. At December 31, 2016, the Company was not engaged in any legal proceedings that are expected, individually or in the aggregate, to have a material effect on the Company.
Earnings Per Share
Net income per share of class A common stock and class B common stock is computed using the two-class method. Basic net income per share is computed by allocating undistributed earnings to common shares and using the weighted-average number of common shares outstanding during the period.
Diluted net income per share is computed using the weighted-average number of common shares and, if dilutive, the potential common shares outstanding during the period. Potential common shares consist of the incremental common shares issuable upon the exercise of stock options and vesting of restricted stock. The dilutive effect of outstanding stock options is reflected in diluted earnings per share by application of the treasury stock method.
The liquidation rights and the rights upon the consummation of an extraordinary transaction are the same for the holders of class A common stock and class B common stock. Other than share distributions and liquidation rights, the amount of any dividend or other distribution payable on each share of class A common stock will be equal to one-sixth (1/6th) of the amount of any such dividend or other distribution payable on each share of class B common stock. As a result, the undistributed earnings for each year are allocated based on the contractual participation rights of the class A and class B common stock as if the earnings for the year had been distributed.
At December 31, 2016, 2015, and 2014, the Company had 156,610, 487,639 and 162,391 options of class A shares and 49,262, 58,429, and 19,561 options of class B shares, respectively, which have been excluded from the diluted net income per share computation because the exercise price exceeds the fair market value. At December 31, 2016, 2015, and 2014 an additional 390,299, 68,779, and 185,461 options of class A shares and 34,178, 1,101, and 1,687 options of class B shares, respectively were excluded as their inclusion would be anti-dilutive.
| 2016 | 2015 | 2014 | ||||||||||||||||||||||
|
Class A |
Class B |
Class A |
Class B |
Class A |
Class B |
|||||||||||||||||||
|
(In thousands, except per share data) |
||||||||||||||||||||||||
|
Numerator for net income per share - basic: |
||||||||||||||||||||||||
|
Net income |
$ | 10,178 | $ | 10,341 | $ | 8,759 | $ | 8,851 | $ | 9,062 | $ | 9,094 | ||||||||||||
|
Allocation of distributed and undistributed income to unvested restricted stock shareholders |
(88 | ) | (88 | ) | (76 | ) | (77 | ) | -- | -- | ||||||||||||||
|
Net income attributable to common shareholders |
$ | 10,090 | $ | 10,253 | $ | 8,683 | $ | 8,774 | $ | 9,062 | $ | 9,094 | ||||||||||||
|
Denominator for net income per share - basic: |
||||||||||||||||||||||||
|
Weighted average common shares outstanding - basic |
20,713 | 3,505 | 20,741 | 3,478 | 20,764 | 3,473 | ||||||||||||||||||
|
Net income per share - basic |
$ | 0.49 | $ | 2.93 | $ | 0.42 | $ | 2.52 | $ | 0.44 | $ | 2.62 | ||||||||||||
|
Numerator for net income per share - diluted: |
||||||||||||||||||||||||
|
Net income attributable to common shareholders for basic computation |
$ | 10,090 | $ | 10,253 | $ | 8,683 | $ | 8,774 | $ | 9,062 | $ | 9,094 | ||||||||||||
|
Denominator for net income per share - diluted: |
||||||||||||||||||||||||
|
Weighted average common shares outstanding - basic |
20,713 | 3,505 | 20,741 | 3,478 | 20,764 | 3,473 | ||||||||||||||||||
|
Weighted average effect of dilutive securities – stock options: |
324 | 55 | 240 | 44 | 312 | 63 | ||||||||||||||||||
|
Denominator for diluted earnings per share – adjusted weighted average shares |
21,037 | 3,560 | 20,981 | 3,522 | 21,076 | 3,536 | ||||||||||||||||||
|
Net income per share - diluted |
$ | 0.48 | $ | 2.88 | $ | 0.41 | $ | 2.49 | $ | 0.43 | $ | 2.57 | ||||||||||||
(2) Acquisitions
On October 28, 2014, the Company acquired Digital Assent, LLC (“Digital Assent”), a company with a healthcare technology platform. The acquisition created a Center of Excellence in Atlanta, Georgia, responsible for developing novel solutions to enhance consumer decision-making in the selection of healthcare providers. The all-cash consideration paid at closing was $2.6 million.
The following table summarizes the fair value of assets acquired and liabilities assumed at the acquisition date, and the weighted average life of the long-lived assets.
|
Amount of Identified Assets Acquired and Liabilities Assumed |
|
($ in thousands) |
|
Current Assets |
$ | 36 | ||
|
Property and equipment |
16 | |||
|
Customer relationships |
382 | |||
|
Technology |
1,110 | |||
|
Goodwill |
1,124 | |||
|
Other Long Term Assets |
23 | |||
|
Total acquired assets |
2,691 | |||
|
Current liabilities |
(117 | ) | ||
|
Net assets acquired |
$ | 2,574 |
The identifiable intangible assets are being amortized over their estimated useful lives and have a total weighted average amortization period of 7.26 years. The goodwill and identifiable intangible assets are deductible for tax purposes. Goodwill related to the acquisition was primarily attributable to anticipated synergies and other intangibles that do not qualify for separate recognition.
The consolidated financial statements as of December 31, 2016 and 2015 and for the years ended December 31, 2016, 2015, and 2014 include amounts acquired from, as well as the results of operations of the acquired entity from October 28, 2014 forward. Results of operations for the year ended December 31, 2014 include revenue of $95,000 and an operating loss of $548,000 attributable to the acquired entity since acquisition. Acquisition-related costs of $52,000 are included in selling, general and administrative expenses for the year ended December 31, 2014.
The following unaudited pro forma information for the Company has been prepared as if the acquisition had occurred on January 1, 2014. The information is based on the historical results of the separate companies and may not necessarily be indicative of the results that could have been achieved or of results that may occur in the future. The pro forma adjustments include the impact of depreciation and amortization of property and equipment and intangible assets acquired, interest expense of debt not assumed in the acquisition and income tax benefits of the acquired entity.
|
Year Ended December 31, |
||||
|
2014 |
||||
|
(In thousands, |
||||
|
Revenue |
$ | 99,266 | ||
|
Net income |
$ | 17,642 | ||
|
Basic Earnings per share – Class A |
$ | 0.42 | ||
|
Basic Earnings per share – Class B |
$ | 2.54 | ||
|
Diluted Earnings per share – Class A |
$ | 0.42 | ||
|
Diluted earnings per share – Class B |
$ | 2.50 | ||
During October 2014, the Company also made an investment which included an option for a potential acquisition of a partner company that had developed a talent-matching solution to accelerate the formation of high-performing teams. The cash consideration paid was $800,000, of which $657,000 was allocated to the purchase option and the remaining $143,000 to a license and work to be performed. The option provided NRC Health with the right to acquire the partner company for $4.1 million on or before March 31, 2015. The option was extended until June 30, 2015. The Company did not exercise the option and, accordingly, it expired in June 2015. The $657,000 option was written off in 2015.
(3) Divestitures
On December 21, 2015, the Company completed the sale of selected assets and liabilities related to the clinical workflow product of the Predictive Analytics operating segment, for a net cash amount of approximately $1.6 million. The Company recorded a gain of approximately $1.1 million from the sale, which is included in other income on the Statement of Income. In connection with the closing of the transaction, $300,000 was placed in escrow to cover certain indemnification claims for one year following the transaction pursuant to the purchase agreement. Due to the uncertainty related to the settlement of the claims, escrowed amounts were recognized when the contingency was removed and the cash was released from escrow rather than at the time of sale. The Company received $223,000 of the escrow funds in December 2016 upon final resolution of the claims and recorded an additional gain on the sale from these funds. The lack of operating results from this business due to its divestiture will not have a major effect on our operations and financial results, and, accordingly, it was not classified as a discontinued operation for any of the periods presented. The following assets and liabilities were included in the sale:
|
Assets and Liabilities Sold |
||
|
($ in thousands) |
|
Assets: |
||||
|
Prepaid Expenses |
$ | 3 | ||
|
Software and Technology |
161 | |||
|
Other intangible assets |
819 | |||
|
Goodwill |
276 | |||
|
Liabilities: |
||||
|
Deferred Revenue |
(748 | ) | ||
|
Net assets sold |
$ | 511 |
(4) Connect
Customer-Connect LLC was formed in June 2013 to develop and commercialize the Connect programs. Connect programs provide healthcare organizations the technology to engage patients through real-time identification and management of individual patient needs, preferences, risks, and experiences. The platform ensures that organizations have access to a longitudinal view of the patient to more effectively manage patient engagement across the continuum of care. At inception, NRC Health had a 49% ownership interest in Connect. NG Customer-Connect, LLC held a 25% interest, and the remaining 26% was held by Illuminate Health, LLC. Profits and losses were allocated under the hypothetical liquidation at book value approach.
In July 2015, the Company acquired all of NG Customer-Connect, LLC’s interest in Connect and a portion of Illuminate Health LLC’s interest in Connect for combined consideration of $2.8 million. As a result, as of December 31, 2015, the Company owned approximately 89% of Connect and Illuminate Health, LLC owned 11%. Under the amended operating agreement, NRC Health had the option to acquire additional equity units from Illuminate Health when new annual recurring contract value reached targeted levels. On March 7, 2016, the Company elected to exercise its first option to acquire one-third of the outstanding non-controlling interest for $1.0 million. Subsequently, on March 28, 2016, NRC Health and Illuminate Health reached an agreement whereby NRC Health acquired the remaining interest held by Illuminate Health for $1.0 million. Following these transactions, Customer-Connect LLC was a wholly owned subsidiary of NRC Health. All of Connect’s previous net income (losses) had been attributable to NRC Health. Since the Company previously consolidated Connect, the transactions to acquire additional ownership interests in Connect were accounted for as equity transactions, resulting in a reduction to additional paid-in capital of $252,000 and $2.8 million in 2016 and 2015, respectively. The acquisition of the remaining interest resulted in differences between the book and tax basis of Connect’s assets. As a result, the Company recorded deferred tax assets of $1.7 million, with a corresponding increase to additional paid-in capital during 2016. On June 30, 2016, Customer-Connect LLC was dissolved.
(5) Property and Equipment
At December 31, 2016, and 2015, property and equipment consisted of the following:
|
2016 |
2015 |
|||||||
|
(In thousands) |
||||||||
|
Furniture and equipment |
$ | 4,737 | $ | 4,738 | ||||
|
Computer equipment and software |
23,342 | 20,042 | ||||||
|
Building |
9,386 | 9,386 | ||||||
|
Land |
425 | 425 | ||||||
| Property and equipment at cost | 37,890 | 34,591 | ||||||
|
Less accumulated depreciation and amortization |
26,084 | 23,466 | ||||||
|
Net property and equipment |
$ | 11,806 | $ | 11,125 | ||||
Depreciation and amortization expense related to property and equipment, including assets under capital lease, for the years ended December 31, 2016, 2015, and 2014 was $3.6 million, $3.1 million, and $3.0 million, respectively.
Property and equipment included the following amounts under capital lease:
|
2016 |
2015 |
|||||||
|
(In thousands) |
||||||||
|
Furniture and equipment |
$ | 769 | $ | 787 | ||||
|
Computer equipment and software |
-- | 56 | ||||||
| Property and equipment under capital lease, gross | 769 | 843 | ||||||
|
Less accumulated amortization |
530 | 567 | ||||||
|
Net assets under capital lease |
$ | 239 | $ | 276 | ||||
(6) Goodwill and Intangible Assets
Goodwill and intangible assets consisted of the following at December 31, 2016:
|
|
|
Accumulated Amortization |
|
||||||||||||||
|
(In years) |
(In thousands) |
||||||||||||||||
|
Goodwill |
$ | 57,861 | $ | 57,861 | |||||||||||||
|
Non-amortizing intangible assets: |
|||||||||||||||||
|
Indefinite trade name |
1,191 | 1,191 | |||||||||||||||
|
Amortizing intangible assets: |
|||||||||||||||||
|
Customer related |
5 | - | 15 | 9,331 | 8,164 | 1,167 | |||||||||||
|
Technology |
7 | 1,110 | 344 | 766 | |||||||||||||
|
Trade names |
5 | - | 10 | 1,572 | 1,572 | -- | |||||||||||
|
Total amortizing intangible assets |
12,013 | 10,080 | 1,933 | ||||||||||||||
|
Total intangible assets other than goodwill |
$ | 13,204 | $ | 10,080 | $ | 3,124 | |||||||||||
Goodwill and intangible assets consisted of the following at December 31, 2015:
|
|
|
Accumulated Amortization |
|
||||||||||||||
|
(In years) |
(In thousands) |
||||||||||||||||
|
Goodwill |
$ | 57,792 | $ | 57,792 | |||||||||||||
|
Non-amortizing intangible assets: |
|||||||||||||||||
|
Indefinite trade name |
1,191 | 1,191 | |||||||||||||||
|
Amortizing intangible assets: |
|||||||||||||||||
|
Customer related |
5 | - | 15 | 9,323 | 7,726 | 1,597 | |||||||||||
|
Technology |
7 | 1,110 | 185 | 925 | |||||||||||||
|
Trade names |
5 | - | 10 | 1,572 | 1,507 | 65 | |||||||||||
|
Total amortizing intangible assets |
12,005 | 9,418 | 2,587 | ||||||||||||||
|
Total intangible assets other than goodwill |
$ | 13,196 | $ | 9,418 | $ | 3,778 | |||||||||||
The following represents a summary of changes in the Company’s carrying amount of goodwill for the years ended December 31, 2016, and 2015 (in thousands):
|
Balance as of December 31, 2014 |
$ | 58,489 | ||
|
Sale of certain assets and liabilities of operating segment |
(276 | ) | ||
|
Foreign currency translation |
(421 | ) | ||
|
Balance as of December 31, 2015 |
$ | 57,792 | ||
|
Foreign currency translation |
69 | |||
|
Balance as of December 31, 2016 |
$ | 57,861 |
Aggregate amortization expense for customer related intangibles, trade names, technology and non-competes for the years ended December 31, 2016, 2015 and 2014 was $654,000, $995,000, and $876,000, respectively. Estimated amortization expense for the next five years is: 2017—$589,000; 2018—$579,000; 2019—$290,000; 2020—$255,000; 2021---$180,000; thereafter $40,000.
(7) Income Taxes
For the years ended December 31, 2016, 2015, and 2014, income before income taxes consists of the following:
|
2016 |
2015 |
2014 |
||||||||||
|
(In thousands) |
||||||||||||
|
U.S. Operations |
$ | 29,848 | $ | 25,536 | $ | 25,338 | ||||||
|
Foreign Operations |
1,508 | 1,824 | 2,754 | |||||||||
| Income before income taxes | $ | 31,356 | $ | 27,360 | $ | 28,092 | ||||||
Income tax expense consisted of the following components:
| 2016 | 2015 | 2014 | ||||||||||
| (In thousands) | ||||||||||||
| Federal: | ||||||||||||
|
Current |
$ | 8,930 | $ | 9,955 | $ | 8,578 | ||||||
|
Deferred |
847 | (1,232 | ) | 99 | ||||||||
|
Total |
$ | 9,777 | $ | 8,723 | $ | 8,677 | ||||||
|
Foreign: |
||||||||||||
|
Current |
$ | 409 | $ | 455 | $ | 714 | ||||||
|
Deferred |
(18 | ) | (23 | ) | 34 | |||||||
|
Total |
$ | 391 | $ | 432 | $ | 748 | ||||||
|
State: |
||||||||||||
|
Current |
$ | 634 | $ | 680 | $ | 448 | ||||||
|
Deferred |
36 | (85 | ) | 63 | ||||||||
|
Total |
$ | 670 | $ | 595 | $ | 511 | ||||||
|
Total |
$ | 10,838 | $ | 9,750 | $ | 9,936 | ||||||
The difference between the Company’s income tax expense as reported in the accompanying consolidated financial statements and the income tax expense that would be calculated applying the U.S. federal income tax rate of 35% for 2016, 2015, and 2014 on pretax income was as follows:
|
2016 |
2015 |
2014 |
||||||||||
|
(In thousands) |
||||||||||||
|
Expected federal income taxes |
$ | 10,975 | $ | 9,576 | $ | 9,832 | ||||||
|
Foreign tax rate differential |
(129 | ) | (139 | ) | (239 | ) | ||||||
|
State income taxes, net of federal benefit and state tax credits |
436 | 391 | 332 | |||||||||
|
Federal tax credits |
(165 | ) | (150 | ) | (150 | ) | ||||||
|
Uncertain tax positions |
6 | 93 | 182 | |||||||||
|
Deferred tax adjustment due to change in state tax law |
-- | 39 | 58 | |||||||||
|
Share based compensation |
(441 | ) |
-- |
-- | ||||||||
|
Expiration of capital loss carryforward |
-- | -- | 1,124 | |||||||||
|
Release of valuation allowance |
-- | -- | (1,124 | ) | ||||||||
|
Other |
156 | (60 | ) | (79 | ) | |||||||
|
Total |
$ | 10,838 | $ | 9,750 | $ | 9,936 | ||||||
Deferred tax assets and liabilities at December 31, 2016 and 2015, were comprised of the following:
|
2016 |
2015 |
|||||||
|
(In thousands) |
||||||||
|
Deferred tax assets: |
||||||||
|
Allowance for doubtful accounts |
$ | 62 | $ | 58 | ||||
|
Accrued expenses |
580 | 578 | ||||||
|
Share based compensation |
2,357 | 1,796 | ||||||
|
Accrued bonuses |
84 | 618 | ||||||
|
Other |
53 | 94 | ||||||
|
Deferred tax assets |
3,136 | 3,144 | ||||||
|
Deferred tax liabilities: |
||||||||
|
Prepaid expenses |
270 | 261 | ||||||
|
Property and equipment |
1,206 | 943 | ||||||
|
Intangible assets |
6,521 | 7,616 | ||||||
|
Other |
-- | 68 | ||||||
|
Deferred tax liabilities |
7,997 | 8,888 | ||||||
|
Net deferred tax liabilities |
$ | (4,861 | ) | $ | (5,744 | ) | ||
In November 2015, the FASB issued Accounting Standards Update (“ASU”) 2015-17, Balance Sheet Classification of Deferred Taxes (“ASU 2015-17”). ASU 2015-17 amends the current requirement for organizations to present deferred tax liabilities and assets as current and noncurrent in a classified balance sheet. Instead, organizations will now be required to classify all deferred tax assets and liabilities as noncurrent. The Company adopted ASU 2015-17 retrospectively effective January 1, 2016 and reclassified $1.1 million of current deferred tax assets to noncurrent, which was netted with deferred tax liabilities on the December 31, 2015 consolidated balance sheet.
In assessing the realizability of deferred tax assets, the Company considers whether it is more likely than not that some portion, or all, of the deferred tax assets will not be realized. The ultimate realization of deferred tax assets is dependent upon the generation of future taxable income during the periods in which those temporary differences become deductible. The Company considers projected future taxable income, carry-back opportunities, and tax planning strategies in making this assessment. Based upon the level of historical taxable income and projections for future taxable income over the periods which the deferred tax assets are deductible, the Company believes it is more likely than not that it will realize the benefits of these deductible differences. Therefore, the Company has not recorded a valuation allowance as of December 31, 2016 or 2015. The net impact on income tax expense related to changes in the valuation allowance for 2014 was $1.1 million.
The Company had domestic capital loss carryforwards that expired in 2014. The total $3.1 million of the capital loss carryforwards related to the pre-acquisition periods of acquired companies, and the Company had provided a $1.1 million valuation allowance against the $1.1 million tax benefit associated with the capital loss carryforwards.
The undistributed foreign earnings of the Company’s foreign subsidiary of approximately $15.2 million are considered to be indefinitely reinvested. Accordingly, no provision for U.S. federal and state income taxes or foreign withholding taxes has been provided for such undistributed earnings. The Company estimated at December 31, 2016, that an additional tax liability of $536,000 would become due if repatriation of undistributed earnings would occur.
The Company had an unrecognized tax benefit at December 31, 2016 and 2015, of $463,000 and $450,000, respectively, excluding interest of $4,000 and $10,000 at December 31, 2016 and 2015, respectively, and penalties of $7,000 at both December 31, 2016 and 2015. Of these amounts, $119,000 and $244,000 at December 31, 2016 and 2015, respectively, represents the net unrecognized tax benefits that, if recognized, would favorably impact the effective income tax rate. The remaining $344,000 and $206,000 at December 31, 2016 and 2015, respectively, would have no impact on the effective tax rate, if recognized. The Company accrues interest and penalties related to uncertain tax positions in the statements of income as income tax expense. The interest change (reduced) increased income tax expense by ($6,000) and $2,000 in 2016 and 2015, respectively.
The change in the unrecognized tax benefits for 2016 and 2015 is as follows:
| (In thousands) | ||||
|
Balance of unrecognized tax benefits at December 31, 2014 |
$ | 360 | ||
|
Reductions due to lapse of applicable statute of limitations |
(24 | ) | ||
|
Reductions due to tax positions of prior years |
(3 | ) | ||
|
Additions based on tax positions related to the current year |
117 | |||
|
Balance of unrecognized tax benefits at December 31, 2015 |
$ | 450 | ||
|
Reductions due to lapse of applicable statute of limitations |
(147 | ) | ||
|
Additions based on tax positions of prior years |
5 | |||
|
Additions based on tax positions related to the current year |
155 | |||
|
Balance of unrecognized tax benefits at December 31, 2016 |
$ | 463 | ||
The Company files a U.S. federal income tax return, various state jurisdictions and a Canada federal and provincial income tax return. All years prior to 2014 are now closed for US federal income tax and for years prior to 2013 for state income tax returns, and no exposure items exist for these years. The Company completed a United States federal tax examination for the tax year ended December 31, 2013 in the first quarter of 2016. The 2012 to 2016 Canada federal and provincial income tax returns remain open to examination.
|
(8) |
Notes Payable |
Notes payable consisted of the following:
|
2016 |
2015 |
|||||||
|
(In thousands) |
||||||||
|
Revolving credit note with U.S. Bank, maximum available $6.5 million subject to borrowing base, matures June 30, 2017 |
$ | -- | $ | -- | ||||
|
Note payable to U.S. Bank for $11.8 million, interest at a 3.12% fixed rate, monthly principal and interest payments of $212,468 through April 2018 |
3,540 | 5,739 | ||||||
|
Total notes payable |
3,540 | 5,739 | ||||||
|
Less current portion |
2,683 | 2,402 | ||||||
|
Note payable, net of current portion |
$ | 857 | $ | 3,337 | ||||
The maximum aggregate amount available under the revolving credit note is $6.5 million, subject to a borrowing base equal to 75.0% of the Company’s eligible accounts receivable. Borrowings under the revolving credit note bear interest at a variable annual rate, with three rate options at the discretion of management as follows: (1) 2.5% plus the daily reset one-month London Interbank Offered Rate (“LIBOR”) or (2) 2.2% plus the one-, two- or three- month LIBOR rate, or (3) the bank’s one-, two, three, six, or twelve month Money Market Loan Rate. As of December 31, 2016 the revolving credit note did not have a balance. According to the borrowing base requirements, the Company had the capacity to borrow $6.5 million as of December 31, 2016.
The term note and revolving credit note are secured by certain of the Company’s assets, including the Company’s land, building, accounts receivable and intangible assets. The term note and the revolving credit note contain various restrictions and covenants applicable to the Company, including requirements that the Company maintain certain financial ratios at prescribed levels and restrictions on the ability of the Company to consolidate or merge, create liens, incur additional indebtedness or dispose of assets. As of December 31, 2016, the Company was in compliance with the financial covenants.
The remaining note payable maturities for each year subsequent to December 31, 2016, are as follows:
|
Total |
2017 |
2018 |
||||||||||
|
Notes payable |
$ | 3,540 | $ | 2,683 | $ | 857 | ||||||
|
(9) |
Share-Based Compensation |
The Company measures and recognizes compensation expense for all share-based payments based on the grant-date fair value of those awards. All of the Company’s existing stock option awards and non-vested stock awards have been determined to be equity-classified awards.
The National Research Corporation 2001 Equity Incentive Plan (“2001 Equity Incentive Plan”) provided for the granting of stock options, stock appreciation rights, restricted stock, performance shares and other share-based awards and benefits up to an aggregate of 1,800,000 shares of class A common stock and 300,000 shares of class B common stock. Stock options granted could have been either nonqualified or incentive stock options. Stock options vest over one to five years following the date of grant and option terms are generally five to ten years following the date of grant. Due to the expiration of the 2001 Equity Incentive Plan, at December 31, 2015, there were no shares of stock available for future grants. The Company has accounted for grants of 1,683,309 class A and 280,552 class B options and restricted stock under the 2001 Equity Incentive Plan using the date of grant as the measurement date for financial accounting purposes.
The Company’s 2004 Non-Employee Director Stock Plan, as amended (the “2004 Director Plan”), is a nonqualified plan that provides for the granting of options with respect to 3,000,000 shares of class A common stock and 500,000 shares of class B common stock. The 2004 Director Plan provides for grants of nonqualified stock options to each director of the Company who is not employed by the Company. On the date of each annual meeting of shareholders of the Company, options to purchase 36,000 shares of class A common stock and 6,000 shares of class B common stock are granted to directors that are elected or retained as a director at such meeting. Stock options vest one year following the date of grant and option terms are generally ten years following the date of grant, or three years in the case of termination of the outside director’s service. At December 31, 2016, there were 1,065,000 shares of class A common stock and 177,500 shares of class B common stock available for issuance pursuant to future grants under the 2004 Director Plan. The Company has accounted for grants of 1,935,000 class A and 322,500 class B options under the 2004 Director Plan using the date of grant as the measurement date for financial accounting purposes.
The National Research Corporation 2006 Equity Incentive Plan (the “2006 Equity Incentive Plan”) provides for the granting of stock options, stock appreciation rights, restricted stock, performance shares and other share-based awards and benefits up to an aggregate of 1,800,000 shares of class A common stock and 300,000 shares of class B common stock. Stock options granted may be either incentive stock options or nonqualified stock options. Vesting terms vary with each grant and option terms are generally five to ten years following the date of grant. At December 31, 2016, there were 941,085 shares of class A common stock and 157,793 shares of class B common stock available for issuance pursuant to future grants under the 2006 Equity Incentive Plan. The Company has accounted for grants of 858,915 class A and 142,207 class B options and restricted stock under the 2006 Equity Incentive Plan using the date of grant as the measurement date for financial accounting purposes.
The Company granted options to purchase 315,620 shares of class A common stock and 52,603 shares of class B common stock during 2016. During 2015, the Company granted options to purchase 261,306 shares of class A common stock and 43,551 shares of class B common stock, and during 2014 granted options to purchase 204,166 shares of class A common stock and 32,217 shares of class B common stock. Options to purchase shares of common stock are typically granted with exercise prices equal to the fair value of the common stock on the date of grant. The Company does, in certain limited situations, grant options with exercise prices that exceed the fair value of the common shares on the date of grant. The fair value of stock options granted was estimated using a Black-Scholes valuation model with the following assumptions:
|
2016 |
2015 |
2014 |
||||||||||||||||||||||||||||
|
Class A |
Class B |
Class A |
Class B |
Class A |
Class B |
|||||||||||||||||||||||||
|
Expected dividend yield at date of grant |
2.96 | to | 3.02% | 6.67 | to | 8.12% | 2.00 | to | 2.57% | 5.29 | to | 5.72% | 1.47 | to | 1.97% | 4.03 | to | 4.87% | ||||||||||||
|
Expected stock price volatility |
31.33 | to | 34.61% | 27.64 | to | 31.77% | 30.86 | to | 34.87% | 29.72 | to | 33.94% | 27.52 | to | 32.03% | 30.13 | to | 32.65% | ||||||||||||
|
Risk-free interest rate |
1.36 | to | 2.12% | 1.36 | to | 2.12% | 1.41 | to | 1.78% | 1.41 | to | 1.78% | 1.63 | to | 2.37% | 1.63 | to | 2.37% | ||||||||||||
|
Expected life of options (in years) |
6 | to | 8 | 6 | to | 8 | 5 | to | 7 | 5 | to | 7 | 5 | to | 7 | 5 | to | 7 | ||||||||||||
The risk-free interest rate assumptions were based on the U.S. Treasury yield curve in effect at the time of the grant. The expected volatility was based on historical monthly price changes of the Company’s stock based on the expected life of the options at the date of grant. The expected life of options is the average number of years the Company estimates that options will be outstanding. The Company considers groups of associates that have similar historical exercise behavior separately for valuation purposes.
The following table summarizes stock option activity under the 2001 and 2006 Equity Incentive Plans and the 2004 Director Plan for the year ended December 31, 2016:
|
Number of |
Weighted Average Exercise Price |
Weighted Average Remaining Contractual Terms (Years) |
Aggregate Intrinsic Value (In thousands) |
|||||||||||||
|
Class A |
||||||||||||||||
|
Outstanding at December 31, 2015 |
1,485,738 | $ | 11.65 | |||||||||||||
|
Granted |
315,620 | $ | 14.64 | |||||||||||||
|
Exercised |
(52,383 | ) | $ | 6.59 | $ | 459 | ||||||||||
|
Forfeited |
(43,492 | ) | $ | 13.25 | ||||||||||||
|
Outstanding at December 31, 2016 |
1,705,483 | $ | 12.31 | 5.87 | $ | 11,404 | ||||||||||
|
Exercisable at December 31, 2016 |
1,250,793 | $ | 11.64 | 4.96 | $ | 9,203 | ||||||||||
|
Class B |
||||||||||||||||
|
Outstanding at December 31, 2015 |
240,673 | $ | 26.31 | |||||||||||||
|
Granted |
52,603 | $ | 36.16 | |||||||||||||
|
Exercised |
(35,534 | ) | $ | 16.88 | $ | 632 | ||||||||||
|
Forfeited |
(7,249 | ) | $ | 26.90 | ||||||||||||
|
Outstanding at December 31, 2016 |
250,493 | $ | 29.70 | 6.32 | $ | 3,066 | ||||||||||
|
Exercisable at December 31, 2016 |
175,659 | $ | 27.82 | 5.43 | $ | 2,500 | ||||||||||
During 2016, the weighted average grant date fair value of the stock options granted was $3.62 and $3.90 for class A common stock and class B common stock respectively. The weighted average grant date fair value of stock options granted during 2015 was $3.49 for class A common stock and $5.45 for class B common stock. The weighted average grant date fair value of stock options granted during 2014 was $2.14 for class A common stock and $2.16 for class B common stock. The total intrinsic value of stock options exercised during 2016, 2015, and 2014 was $459,000, $350,000 and $1.5 million for the shares of class A common stock and $632,000, $151,000 and $502,000 for the shares of class B common stock, respectively. The total intrinsic value of stock options vested during 2016, 2015 and 2014 was $1.6 million, $1.4 million and $528,000 for the shares of class A common stock and $535,000, $415,000 and $402,000 for the shares of class B common stock, respectively. As of December 31, 2016, the total unrecognized compensation cost related to non-vested stock option awards was approximately $820,000 and $152,000 for class A and class B common stock shares, respectively, which was expected to be recognized over a weighted average period of 2.78 years and 2.58 years for class A and class B common stock shares, respectively.
Cash received from stock options exercised for the years ended December 31, 2016 and 2014 was $548,000 and $408,000, respectively. There was no cash received from stock options exercised for the year ended December 31, 2015. The Company recognized $964,000, $828,000 and $707,000 of non-cash compensation for the years ended December 31, 2016, 2015, and 2014, respectively, related to options, which is included in selling, general and administrative expenses.
The actual tax benefit realized for the tax deduction from stock options exercised was $337,000, $157,000 and $622,000 for the years ended December 31, 2016, 2015 and 2014, respectively. The Company prospectively elected ASU 2016-09, Compensation – Stock Compensation (Topic 718) Improvements to Employee Share-Based Payment Accounting (“ASU 2016-09”) in 2016. As a result, the tax benefit from stock options exercised was recognized as a reduction to our provision for income taxes for the year ended December 31, 2016 rather than as an increase to additional paid-in capital for the years ended December 31, 2015 and 2014 prior to adoption (See Note 13).
During 2016, 2015, and 2014 the Company granted 20,578, 89,416, and 73,506 non-vested shares of class A and 3,430, 14,902, and 12,251 non-vested shares of class B common stock, respectively, under the 2006 Equity Incentive Plan. As of December 31, 2016, the Company had 174,487 and 29,081 non-vested shares of class A and class B common stock, respectively, outstanding under the 2006 Equity Incentive Plan. These shares vest over one to five years following the date of grant and holders thereof are entitled to receive dividends from the date of grant, whether or not vested. The fair value of the awards is calculated as the fair market value of the shares on the date of grant. The Company recognized $966,000, $555,000 and $35,000 of non-cash compensation for the years ended December 31, 2016, 2015, and 2014, respectively, related to this non-vested stock, which is included in selling, general and administrative expenses.
The following table summarizes information regarding non-vested stock granted to associates under the 2001 and 2006 Equity Incentive Plans for the year ended December 31, 2016:
|
Class A Shares Outstanding |
Class A Weighted Average Grant Date Fair Value Per Share |
Class B Shares Outstanding |
Class B Weighted Average Grant Date Fair Value Per Share |
|||||||||||||
|
Outstanding at December 31, 2015 |
183,814 | $ | 12.78 | 30,635 | $ | 36.93 | ||||||||||
|
Granted |
20,578 | $ | 15.23 | 3,430 | $ | 34.00 | ||||||||||
|
Vested |
(20,892 | ) | $ | 5.38 | (3,482 | ) | $ | 32.31 | ||||||||
|
Forfeited |
(9,013 | ) | $ | 13.17 | (1,502 | ) | $ | 35.48 | ||||||||
|
Outstanding at December 31, 2016 |
174,487 | $ | 13.93 | 29,081 | $ | 37.21 | ||||||||||
As of December 31, 2016, the total unrecognized compensation cost related to non-vested stock awards was approximately $1.8 million and is expected to be recognized over a weighted average period of 2.96 years.
(10) Leases
The Company leases printing equipment in the United States, and office space in Canada, California, Georgia, and Washington. The Company also leased additional office space in Nebraska through June 2016. The Company recorded rent expense in connection with its operating leases of $920,000, $1.0 million, and $840,000 in 2016, 2015, and 2014, respectively. The Company also has capital leases for production, mailing and computer equipment.
Payments under non-cancelable operating leases and capital leases at December 31, 2016 are:
|
Year Ending December 31, |
Capital |
Operating Leases |
||||||
|
(In thousands) |
||||||||
|
2017 |
$ | 96 | $ | 603 | ||||
|
2018 |
55 | 484 | ||||||
|
2019 |
26 | 312 | ||||||
|
2020 |
26 | 106 | ||||||
|
2021 |
6 | -- | ||||||
|
Total minimum lease payments |
209 | |||||||
|
Less: Amount representing interest |
17 | |||||||
|
Present value of minimum lease payments |
192 | |||||||
|
Less: Current maturities |
82 | |||||||
|
Capital lease obligations, net of current portion |
$ | 110 | ||||||
(11) Related Party
A director of the Company also serves as an officer of Ameritas Life Insurance Corp. In connection with the Company’s regular assessment of its insurance-based associate benefits and the costs associated therewith, in 2007 the Company began purchasing dental insurance for certain of its associates from Ameritas Life Insurance Corp. and, in 2009, the Company also began purchasing vision insurance for certain of its associates from Ameritas Life Insurance Corp. The total value of these purchases was $232,000, $227,000 and $207,000 in 2016, 2015 and 2014 respectively.
Mr. Hays, the Chief Executive Officer, majority shareholder and director of the Company, is an owner of 14% of the equity interest of Nebraska Global Investment Company LLC ("Nebraska Global"). The Company, directly or indirectly through its former subsidiary Customer-Connect LLC, purchased certain services from Nebraska Global, primarily consisting of software development services. The total value of these purchases were $488,000 in 2016 and $440,000 in 2015. There were no purchases from Nebraska Global in 2014.
(12) Associate Benefits
The Company sponsors a qualified 401(k) plan covering substantially all associates with no eligibility service requirement. Under the 401(k) plan, the Company matches 25.0% of the first 6.0% of compensation contributed by each associate. Employer contributions, which are discretionary, vest to participants at a rate of 20% per year. The Company contributed $291,000, $330,000 and $216,000 in 2016, 2015 and 2014, respectively, as a matching percentage of associate 401(k) contributions.
(13) Recent Accounting Pronouncements
In February 2015, the FASB issued ASU 2015-02, Consolidation (Topic 810): Amendments to the Consolidation Analysis (“ASU 2015-02”), which requires reporting entities to reevaluate whether certain legal entities should be consolidated under the revised consolidation model. ASU 2015-02 modifies the evaluation of whether limited partnerships and similar legal entities are variable interest entities (VIEs), eliminates the presumption that a general partner should consolidate a limited partnership, and affects the consolidation analysis of reporting entities that are involved with VIEs, especially those that have fee arrangements and related party relationships. The Company’s adoption of the standard effective January 1, 2016 did not significantly impact its consolidated financial statements.
In April 2015, the FASB issued ASU 2015-05, Intangibles - Goodwill and Other - Internal-Use Software (Subtopic 350-40): Customer's Accounting for Fees Paid in a Cloud Computing Arrangement ("ASU 2015-05"). ASU 2015-05 provides guidance to customers about whether a cloud computing arrangement includes a software license. If a cloud computing arrangement includes a software license, ASU 2015-05 specifies that the customer should account for the software license element of the arrangement consistent with the acquisition of other software licenses. ASU 2015-05 further specifies that the customer should account for a cloud computing arrangement as a service contract if the arrangement does not include a software license. The Company prospectively adopted ASU 2015-05 effective January 1, 2016. Beginning in 2016, if a software license is included in a cloud computing arrangement and the Company has the ability and feasibility to download the software, it is accounted for as software, included in property and equipment, and amortized. If a software license is not included or the Company does not have the ability or feasibility to download software included in a cloud computing arrangement, it is accounted for as a service contract, which is expensed to direct expenses or selling, general and administrative expenses during the service period.
In November 2015, the FASB issued ASU 2015-17. ASU 2015-17 amends the current requirement for organizations to present deferred tax liabilities and assets as current and noncurrent in a classified balance sheet. Instead, organizations will now be required to classify all deferred tax assets and liabilities as noncurrent. The current requirement that deferred tax liabilities and assets of a tax-paying component of an entity be offset and presented as a single amount is not affected by ASU 2015-17. The Company adopted ASU 2015-17 retrospectively effective January 1, 2016 and reclassified $1.1 million of current deferred tax assets to noncurrent, which was netted with deferred tax liabilities on the December 31, 2015 consolidated balance sheet.
In May 2014, the FASB issued ASU 2014-09, Revenue from Contracts with Customers (Topic 606) (“ASU 2014-09”). ASU 2014-09 requires an entity to recognize the amount of revenue to which it expects to be entitled for the transfer of promised goods or services to customers. ASU 2014-09 will replace most existing revenue recognition guidance in accounting principles generally accepted in the United States when it becomes effective. The standard is effective for annual and interim reporting periods in fiscal years beginning after December 15, 2017, with early adoption allowed for years beginning after December 15, 2016. An entity may choose to adopt ASU 2014-09 either retrospectively or through a cumulative effect adjustment as of the start of the first period for which it applies the standard. The Company is currently in the process of evaluating the impact that this new guidance will have on its consolidated financial statements and expects to adopt the guidance beginning January 1, 2018 through the retrospective transition method. We are in the process of developing and testing changes to our processes and systems. The Company currently expects the most significant changes to result from deferring commissions and recognizing the expense over the estimated life of the client relationship rather than expensing as incurred, which is the Company’s current practice, and estimating variable consideration at the outset of the contract.
In February 2016, the FASB issued ASU 2016-02, Leases (Topic 842). This ASU requires lessees to recognize a lease liability and a right-to-use asset for all leases, including operating leases, with a term greater than twelve months on its balance sheet. This ASU is effective in fiscal years beginning after December 15, 2018, with early adoption permitted, and requires a modified retrospective transition method. The Company is currently in the process of evaluating the impact that this new guidance will have on its consolidated financial statements.
In March 2016, the FASB issued ASU 2016-09. ASU 2016-09 requires excess tax benefits and tax deficiencies to be recorded in the income statement when the awards vest or are settled. In addition, cash flows related to excess tax benefits are no longer separately classified as a financing activity apart from other income tax cash flows. The Company elected to early adopt the new guidance in the second quarter of 2016 on a prospective basis which required us to reflect any adjustments as of January 1, 2016, the beginning of the annual period that includes the interim period of adoption. The primary impact of adoption was the recognition of excess tax benefits in our provision for income taxes rather than paid-in capital for all periods of 2016. As a result, excess tax benefits of $333,000 recorded to additional paid-in capital in the first quarter of 2016 have been reclassified to income tax expense in the year ended December 31, 2016. Additionally, as required by ASU 2016-09, when calculating diluted earnings per share, excess tax benefits were excluded from the calculation of assumed proceeds since such amounts are recognized in the income statement. The Company applied the cash flow presentation requirements for cash flows related to excess tax benefits prospectively, and the 2015 statement of cash flows was not adjusted. ASU 2016-09 also allows an entity to elect as an accounting policy either to estimate the total number of awards for which the requisite service period will not be rendered or to account for forfeitures for service based awards as they occur. The Company has elected to account for forfeitures as they occur. Adoption of ASU 2016-09 resulted in the recognition of excess tax benefits in our provision for income taxes rather than additional paid-in capital of $460,000 for the year ended December 31, 2016.
In June 2016, the FASB issued ASU 2016-13, Financial Instruments – Credit Losses (Topic 326): Measurement of Credit Losses on Financial Instruments. This ASU will require the measurement of all expected credit losses for financial assets, including trade receivables, held at the reporting date based on historical experience, current conditions, and reasonable and supportable forecasts. The guidance is effective for annual reporting periods beginning after December 15, 2019 and interim periods within those fiscal years. The Company believes its adoption will not significantly impact the Company’s results of operations and financial position.
In August 2016, the FASB issued ASU 2016-15, Statement of Cash Flows (Topic 230) Classification of Certain Cash Receipts and Cash Payments which eliminates the diversity in practice related to eight cash flow classification issues. This ASU is effective for the Company on January 1, 2018 with early adoption permitted. The Company believes its adoption will not significantly impact the Company’s results of operations and financial position.
In October 2016, the FASB issued ASU 2016-16, Intra-Entity Transfers of Asset Other Than Inventory “ASU 2016-16”), which requires entities to recognize the tax consequences of intercompany asset transfers other than inventory transfers in the period in which the transfer takes place. ASU 2016-16 is effective for fiscal years and interim periods within fiscal years beginning after December 15, 2017. ASU 2016-16 is to be adopted using a modified retrospective approach with a cumulative effect adjustment to retained earnings as of the beginning of the period of adoption. The cumulative effect adjustment will include recognition of the income tax consequences of intra-entity transfers of assets other than inventory that occur before the adoption date. Early adoption is permitted at the beginning of an annual period. The Company is currently evaluating the impact the adoption of this standard will have on its consolidated financial statements.
In November 2016, the FASB issued ASU 2016-18, Statement of Cash Flows (Topic 230), Restricted Cash (“ASU 2016-18”), which requires that the amounts generally described as restricted cash or restricted cash equivalents be included with cash and cash equivalents when reconciling the beginning-of-the period and end-of-period total amounts shown on the statement of cash flows. ASU 2016-18 does not provide a definition of restricted cash or restricted cash equivalents. ASU 2016-18 is effective for fiscal years and interim periods beginning after December 15, 2017. The Company does not expect the adoption of ASU 2016-18 to have any impact on the consolidated financial statements.
In January 2017, the FASB issued ASU 2017-04, Intangibles—Goodwill and Other (Topic 350), Simplifying the Test for Goodwill Impairment (“ASU 2017-04”). The new guidance eliminates Step 2 of the goodwill impairment testing which requires the fair value of individual assets and liabilities of a reporting unit to be determined when measuring goodwill impairment. The new guidance may result in different amounts of impairment that could be recognized compared to existing guidance. In addition, failing step 1 of the impairment test may not result in impairment under existing guidance. However, under the revised guidance, failing step 1 will always result in a goodwill impairment. ASU 2017-04 is to be applied prospectively for goodwill impairment testing performed in years beginning after December 15, 2019. The Company does not believe the adoption will significantly impact the Company's results of operations or financial position.
(14) Segment Information
The Company’s six operating segments are aggregated into one reporting segment because they have similar economic characteristics and meet the other aggregation criteria from the FASB guidance on segment disclosure. The six operating segments are Experience, The Governance Institute, Market Insights, Transparency, National Research Corporation Canada and Connect, which offer a portfolio of solutions that address specific needs around market insight, experience, transparency and governance for healthcare providers, payers and other healthcare organizations. On December 21, 2015, selected assets and liabilities were sold from a seventh operating segment, Predictive Analytics, reducing the number of operating segments to six as of December 31, 2015.
The table below presents entity-wide information regarding the Company’s revenue and assets by geographic area:
|
2016 |
2015 |
2014 |
||||||||||
|
(In thousands) |
||||||||||||
|
Revenue: |
||||||||||||
|
United States |
$ | 104,445 | $ | 97,097 | $ | 92,270 | ||||||
|
Canada |
4,939 | 5,246 | 6,567 | |||||||||
|
Total |
$ | 109,384 | $ | 102,343 | $ | 98,837 | ||||||
|
Long-lived assets: |
||||||||||||
|
United States |
$ | 71,192 | $ | 70,624 | $ | 73,328 | ||||||
|
Canada |
2,367 | 2,364 | 2,994 | |||||||||
|
Total |
$ | 73,559 | $ | 72,988 | $ | 76,322 | ||||||
|
Total assets: |
||||||||||||
|
United States |
$ | 106,288 | $ | 115,480 | $ | 115,730 | ||||||
|
Canada |
14,336 | 12,569 | 13,780 | |||||||||
|
Total |
$ | 120,624 | $ | 128,049 | $ | 129,510 | ||||||
Item 9. Changes in and Disagreements with Accountants on Accounting and Financial Disclosure
Not applicable.
Item 9A. Controls and Procedures
Evaluation of Disclosure Controls and Procedures
In accordance with Rule 13a-15(b) of the Securities Exchange Act of 1934 (the “Exchange Act”), the Company’s management evaluated, with the participation of the Company’s Chief Executive Officer and the Company’s Chief Financial Officer, the effectiveness of the design and operation of the Company’s disclosure controls and procedures (as defined in Rule 13a-15(e) and 15d-15(e) under the Exchange Act) as of December 31, 2016. Based upon their evaluation of these disclosure controls and procedures, the Chief Executive Officer and the Chief Financial Officer concluded that the disclosure controls and procedures were effective as of December 31, 2016.
Management’s Report on Internal Control over Financial Reporting
The Company’s management is responsible for establishing and maintaining adequate internal control over financial reporting (as defined in Rule 13a-15(f) of the Exchange Act). The Company’s internal control over financial reporting is designed to provide reasonable assurance regarding the reliability of financial reporting and the preparation of financial statements for external purposes in accordance with generally accepted accounting principles. Because of its inherent limitations, however, internal control over financial reporting may not prevent or detect misstatements. Also, projections of any evaluation of effectiveness to future periods are subject to the risk that controls may become inadequate because of changes in conditions, or that the degree of compliance with the policies of procedures may deteriorate.
The Company’s management, with the participation of the Company’s Chief Executive Officer and Chief Financial Officer, has evaluated the effectiveness of the Company’s internal control over financial reporting using the framework in Internal Control – Integrated Framework (2013) issued by the Committee of Sponsoring Organizations of the Treadway Commission (“COSO”). Based on such evaluation, the Company’s management concluded that the Company’s internal control over financial reporting was effective as of December 31, 2016.
The effectiveness of the Company’s internal control over financial reporting as of December 31, 2016, has been audited by KPMG LLP, an independent registered public accounting firm, as stated in their report, a copy of which is included in this Annual Report on Form 10-K.
Changes in Internal Control over Financial Reporting
There was no change in the Company’s internal control over financial reporting that occurred during the quarter ended December 31, 2016, that has materially affected, or is reasonably likely to materially affect, the Company’s internal control over financial reporting.
Item 9B. Other Information
The Company has no other information to report pursuant to this item.
Report of Independent Registered Public Accounting Firm
The Board of Directors and Shareholders
National Research Corporation:
We have audited National Research Corporation and subsidiary’s internal control over financial reporting as of December 31, 2016, based on criteria established in Internal Control – Integrated Framework (2013) issued by the Committee of Sponsoring Organizations of the Treadway Commission (COSO). National Research Corporation and subsidiary’s management is responsible for maintaining effective internal control over financial reporting and for its assessment of the effectiveness of internal control over financial reporting, included in the accompanying Management’s Report on Internal Control over Financial Reporting. Our responsibility is to express an opinion on the Company’s internal control over financial reporting based on our audit.
We conducted our audit in accordance with the standards of the Public Company Accounting Oversight Board (United States). Those standards require that we plan and perform the audit to obtain reasonable assurance about whether effective internal control over financial reporting was maintained in all material respects. Our audit included obtaining an understanding of internal control over financial reporting, assessing the risk that a material weakness exists, and testing and evaluating the design and operating effectiveness of internal control based on the assessed risk. Our audit also included performing such other procedures as we considered necessary in the circumstances. We believe that our audit provides a reasonable basis for our opinion.
A company’s internal control over financial reporting is a process designed to provide reasonable assurance regarding the reliability of financial reporting and the preparation of financial statements for external purposes in accordance with generally accepted accounting principles. A company’s internal control over financial reporting includes those policies and procedures that (1) pertain to the maintenance of records that, in reasonable detail, accurately and fairly reflect the transactions and dispositions of the assets of the company; (2) provide reasonable assurance that transactions are recorded as necessary to permit preparation of financial statements in accordance with generally accepted accounting principles, and that receipts and expenditures of the company are being made only in accordance with authorizations of management and directors of the company; and (3) provide reasonable assurance regarding prevention or timely detection of unauthorized acquisition, use, or disposition of the company’s assets that could have a material effect on the financial statements.
Because of its inherent limitations, internal control over financial reporting may not prevent or detect misstatements. Also, projections of any evaluation of effectiveness to future periods are subject to the risk that controls may become inadequate because of changes in conditions, or that the degree of compliance with the policies or procedures may deteriorate.
In our opinion, National Research Corporation and subsidiary maintained, in all material respects, effective internal control over financial reporting as of December 31, 2016, based on criteria established in Internal Control – Integrated Framework (2013) issued by the Committee of Sponsoring Organizations of the Treadway Commission (COSO).
We also have audited, in accordance with the standards of the Public Company Accounting Oversight Board (United States), the consolidated balance sheets of National Research Corporation and subsidiary as of December 31, 2016 and 2015, and the related consolidated statements of income, comprehensive income, shareholders’ equity, and cash flows for each of the years in the three-year period ended December 31, 2016, and our report dated March 3, 2017 expressed an unqualified opinion on those consolidated financial statements.
/s/ KPMG LLP
Lincoln, Nebraska
March 3, 2017
PART III
Item 10. Directors, Executive Officers and Corporate Governance
The information required by this Item with respect to directors and Section 16 compliance is included under the captions “Election of Directors” and “Section 16(a) Beneficial Ownership Reporting Compliance,” respectively, in the Company’s definitive Proxy Statement for its 2017 Annual Meeting of Shareholders (“Proxy Statement”) and is hereby incorporated herein by reference. Information with respect to the executive officers of the Company appears in Item 1 of this Annual Report on Form 10-K. The information required by this Item with respect to audit committees and audit committee financial experts is included under the caption “Corporate Governance” in the Proxy Statement and is incorporated herein by reference.
The Company has adopted a Code of Business Conduct and Ethics that applies to all of the Company’s associates, including the Company’s Chief Executive Officer and Chief Financial Officer and other persons performing similar functions. The Company has posted a copy of the Code of Business Conduct and Ethics on its website at www.nrchealth.com, and such Code of Business Conduct and Ethics is available, in print, without charge, to any shareholder who requests it from the Company’s Secretary. The Company intends to satisfy the disclosure requirements under Item 5.05 of Form 8-K regarding amendments to, or waivers from, the Code of Business Conduct and Ethics by posting such information on its website at www.nrchealth.com. The Company is not including the information contained on its website as part of, or incorporating it by reference into, this report.
Item 11. Executive Compensation
The information required by this Item is included under the captions “Compensation Discussion and Analysis,” “2016 Summary Compensation Table,” “Grants of Plan-Based Awards in 2016,” “Outstanding Equity Awards at December 31, 2016,” “2016 Director Compensation,” “Compensation Committee Report” and “Corporate Governance-Transactions with Related Persons” in the Proxy Statement and is hereby incorporated herein by reference.
Item 12. Security Ownership of Certain Beneficial Owners and Management and Related Shareholder Matters
The information required by this Item with respect to security ownership of certain beneficial owners and management is included under the caption “Principal Shareholders” in the Proxy Statement and is hereby incorporated by reference.
The following table sets forth information with respect to compensation plans under which equity securities of the Company are authorized for issuance as of December 31, 2016.
|
Plan Category Class A shares |
Number of securities to be issued upon the exercise of outstanding options, warrants and rights |
Weighted-average exercise price of outstanding options, warrants and rights |
Number of securities remaining available for future issuance under equity compensation plans (excluding securities reflected in the first column) |
|||||||||
|
Equity compensation plans approved by security holders (1) |
1,705,483 | $ | 12.31 | 2,006,085 | (2) | |||||||
|
Equity compensation plans not approved by security holders |
-- | -- | -- | |||||||||
|
Total |
1,705,483 | $ | 12.31 | 2,006,085 | ||||||||
|
Plan Category Class B shares |
Number of securities to be issued upon the exercise of outstanding options, warrants and rights |
Weighted-average exercise price of outstanding options, warrants and rights |
Number of securities remaining available for future issuance under equity compensation plans (excluding securities reflected in the first column) |
|||||||||
|
Equity compensation plans approved by security holders (1) |
250,493 | $ | 29.70 | 335,293 | (2) | |||||||
|
Equity compensation plans not approved by security holders |
-- | -- | -- | |||||||||
|
Total |
250,493 | $ | 29.70 | 335,293 | ||||||||
|
(1) |
Includes the Company’s 2006 Equity Incentive Plan, 2004 Director Plan, and the 2001 Equity Incentive Plan. |
|
(2) |
Under the 2006 Equity Incentive Plan, the Company had authority to award up to 308,275 additional shares of restricted class A common stock and 51,380 additional shares of restricted class B common stock to participants, provided that the total of such shares awarded may not exceed the total number of shares remaining available for issuance under the 2006 Equity Incentive Plan, which totaled 941,085 shares of class A common stock and 157,793 shares of class B common stock as of December 31, 2016. The Director Plan provides for granting options for 3,000,000 shares of Class A common stock and 500,000 shares of Class B common stock. Option awards through December 31, 2016 totaled 1,935,000 shares of Class A common stock and 322,500 of Class B common stock. No future awards are available under the 2001 Equity Incentive Plan due to its expiration. |
Item 13. Certain Relationships and Related Transactions, and Director Independence
The information required by this Item is included under the caption “Corporate Governance” in the Proxy Statement and is hereby incorporated by reference.
Item 14. Principal Accountant Fees and Services
The information required by this Item is included under the caption “Miscellaneous — Independent Registered Public Accounting Firm” in the Proxy Statement and is hereby incorporated by reference.
PART IV
|
Item 15. |
Exhibits, Financial Statement Schedules |
|
1. |
Consolidated financial statements. The consolidated financial statements listed in the accompanying index to the consolidated financial statements and financial statement schedule are filed as part of this Annual Report on Form 10-K. |
|
2. |
Financial statement schedule. The financial statement schedule listed in the accompanying index to the consolidated financial statements and financial statement schedule is filed as part of this Annual Report on Form 10-K. |
|
3. |
Exhibits. The exhibits listed in the accompanying exhibit index are filed as part of this Annual Report on Form 10-K. |
NATIONAL RESEARCH CORPORATION AND SUBSIDIARY
Schedule II — Valuation and Qualifying Accounts
(In thousands)
|
Balance at Beginning of Year |
Bad Debt Expense |
Write-offs Net of Recoveries |
Balance at End of Year |
|||||||||||||
|
Allowance for doubtful accounts: |
||||||||||||||||
|
Year Ended December 31, 2014 |
$ | 183 | $ | 305 | $ | 282 | $ | 206 | ||||||||
|
Year Ended December 31, 2015 |
$ | 206 | $ | 111 | $ | 144 | $ | 173 | ||||||||
|
Year Ended December 31, 2016 |
$ | 173 | $ | 218 | $ | 222 | $ | 169 | ||||||||
See accompanying report of independent registered public accounting firm.
INDEX TO CONSOLIDATED FINANCIAL STATEMENTS
AND FINANCIAL STATEMENT SCHEDULE
| Page in this Form 10-K |
| Report of Independent Registered Public Accounting Firm | 30 |
| Consolidated Balance Sheets as of December 31, 2016 and 2015 | 31 |
| Consolidated Statements of Income for the Three Years Ended December 31, 2016 | 32 |
| Consolidated Statements of Comprehensive Income for the Three Years Ended December 31, 2016 | 33 |
| Consolidated Statements of Shareholders’ Equity for the Three Years Ended December 31, 2016 | 34 |
| Consolidated Statements of Cash Flows for the Three Years Ended December 31, 2016 | 35 |
| Notes to Consolidated Financial Statements | 36 |
| Schedule II — Valuation and Qualifying Accounts | 63 |
All other financial statement schedules are omitted since the required information is not present or is not present in amounts sufficient to require submission of the schedules, or because the information required is included in the consolidated financial statements and notes thereto.
SIGNATURES
Pursuant to the requirements of Section 13 or 15(d) of the Securities Exchange Act of 1934, the Registrant has duly caused this report to be signed on its behalf by the undersigned, thereunto duly authorized, on this 3rd day of March 2017.
|
|
NATIONAL RESEARCH CORPORATION |
|
|
|
|
|
|
|
|
|
By |
/s/ Michael D. Hays |
|
|
|
|
Michael D. Hays Chief Executive Officer |
|
Pursuant to the requirements of the Securities Exchange Act of 1934, this report has been signed below by the following persons on behalf of the Registrant and in the capacities and on the dates indicated.
|
Signature |
Title |
Date |
||
|
/s/ Michael D. Hays |
Chief Executive Officer and Director (Principal |
March 3, 2017 |
||
| Michael D. Hays | Executive Officer) | |||
| /s/ Kevin R. Karas | Senior Vice President Finance, Chief Financial | March 3, 2017 | ||
|
Kevin R. Karas |
Officer, Treasurer and Secretary (Principal Financial and Accounting Officer) |
|
||
|
/s/ Donald M. Berwick |
Director |
March 3, 2017 |
||
| Donald M. Berwick | ||||
|
/s/ JoAnn M. Martin |
Director |
March 3, 2017 |
||
| JoAnn M. Martin | ||||
|
/s/ Barbara J. Mowry |
Director |
March 3, 2017 |
||
| Barbara J. Mowry | ||||
|
/s/ John N. Nunnelly |
Director |
March 3, 2017 |
||
| John N. Nunnelly | ||||
|
/s/ Gail L. Warden |
Director |
March 3, 2017 |
||
| Gail L. Warden |
EXHIBIT INDEX
|
Exhibit |
|
|
(3.1) |
Amended and Restated Articles of Incorporation of National Research Corporation, effective May 22, 2013 [Incorporated by reference to Exhibit (3.2) to National Research Corporation’s Current Report on Form 8-K dated May 22, 2013 and filed May 24, 2013 (File No. 0-29466)] |
|
(3.2) |
By-Laws of National Research Corporation, as amended to date [Incorporated by reference to Exhibit (3.2) to National Research Corporation’s Current Report on Form 8-K dated October 26, 2015 and filed on October 28, 2015 (File No. 0-29466)] |
|
(4) |
Installment Note, dated as of May 9, 2013, from National Research Corporation to U.S. Bank National Association [Incorporated by reference to Exhibit (4) to National Research Corporation’s Quarterly Report on Form 10-Q for the quarter ended June 30, 2013 (File No. 0-29466)] |
|
(10.1)* |
National Research Corporation 2001 Equity Incentive Plan [Incorporated by reference to Appendix A to National Research Corporation’s Proxy Statement for the 2002 Annual Meeting of Shareholders, filed with the Securities and Exchange Commission on April 3, 2002 (File No. 0-29466)] |
|
(10.2)*
|
National Research Corporation 2006 Equity Incentive Plan, as amended [Incorporated by reference to Exhibit (4.3) to National Research Corporation’s Registration Statement on Form S-8 (Registration No. 333-189141) filed on June 6, 2013] |
|
(10.3)* |
National Research Corporation 2004 Non-Employee Director Stock Plan, as amended [Incorporated by reference to Appendix A to National Research Corporation’s Proxy Statement for its 2015 Annual Meeting of Shareholders filed on April 1, 2015] |
|
(10.4)* |
Form of Nonqualified Stock Option Agreement (for new associates) used in connection with the 2001 Equity Incentive Plan [Incorporated by reference to Exhibit 4.4 to National Research Corporation’s Registration Statement on Form S-8 (Registration No. 333-120530)] |
|
(10.5)* |
Form of Nonqualified Stock Option Agreement (for officers) used in connection with the 2001 Equity Incentive Plan [Incorporated by reference to Exhibit 4.5 to National Research Corporation’s Registration Statement on Form S-8 (Registration No. 333-120530)] |
|
(10.6)* |
Form of Restricted Stock Agreement for executive officers used in connection with the 2001 Equity Incentive Plan [Incorporated by reference to Exhibit 10.2 to National Research Corporation’s Current Report on Form 8-K dated March 19, 2005 (File No. 0-29466)] |
|
(10.7)* |
Form of Restricted Stock Agreement (one year vesting) used in connection with the 2001 Equity Incentive Plan [Incorporated by reference to Exhibit 4.6 to National Research Corporation’s Registration Statement on Form S-8 (Registration No. 333-120530)] |
|
(10.8)* |
Form of Restricted Stock Agreement (five year vesting) used in connection with the 2001 Equity Incentive Plan [Incorporated by reference to Exhibit 4.7 to National Research Corporation’s Registration Statement on Form S-8 (Registration No. 333-120530)] |
|
(10.9)* |
Form of Nonqualified Stock Option Agreement used in connection with the 2006 Equity Incentive Plan [Incorporated by reference to Exhibit (10.14) to National Research Corporation’s Annual Report on Form 10-K for the year ended December 31, 2006 (File No. 0-29466)] |
|
(10.10)* |
Form of Restricted Stock Agreement used in connection with the 2006 Equity Incentive Plan [Incorporated by reference to Exhibit (10.15) to National Research Corporation’s Annual Report on Form 10-K for the year ended December 31, 2006 (File No. 0-29466)] |
|
Exhibit |
Exhibit Description |
|
(21) |
Subsidiary of National Research Corporation |
|
(23) |
Consent of Independent Registered Public Accounting Firm |
|
(31.1) |
Certification of the Chief Executive Officer pursuant to Section 302 of the Sarbanes-Oxley Act of 2002 |
|
(31.2) |
Certification of the Chief Financial Officer pursuant to Section 302 of the Sarbanes-Oxley Act of 2002 |
|
(32) |
Certification of Periodic Financial Report by the Chief Executive Officer and Chief Financial Officer pursuant to Section 906 of the Sarbanes-Oxley Act of 2002 |
|
(99) |
Proxy Statement for the 2017 Annual Meeting of Shareholders [To be filed with the Securities and Exchange Commission under Regulation 14A within 120 days after December 31, 2016; except to the extent specifically incorporated by reference, the Proxy Statement for the 2017 Annual Meeting of Shareholders shall not be deemed to be filed with the Securities and Exchange Commission as part of this Annual Report on Form 10-K] |
|
(101)** |
Financial statements from the Annual Report on Form 10-K of National Research Corporation for the year ended December 31, 2016, formatted in eXtensible Business Reporting Language (XBRL): (i) the Consolidated Balance Sheets, (ii) the Consolidated Statements of Income, (iii) Consolidated Statements of Comprehensive Income, (iv) Consolidated Statements of Shareholders’ Equity, (v) the Consolidated Statements of Cash Flows, (vi) the Notes to the Consolidated Financial Statements, and (vii) document and entity information. |
____________________
| * | A management contract or compensatory plan or arrangement. |
|
** |
In accordance with Rule 406T of Regulation S-T, the information in these exhibits shall not be deemed to be “filed” for purposes of Section 18 of the Securities Exchange Act of 1934, as amended, or otherwise subject to liability under that section, and shall not be incorporated by reference into any registration statement or other document filed under the Securities Act of 1933, as amended, except as expressly set forth by specific reference in such filing. |
67