Attached files
| file | filename |
|---|---|
| EX-32.2 - EX-32.2 - MARIN SOFTWARE INC | mrin-ex322_11.htm |
| EX-32.1 - EX-32.1 - MARIN SOFTWARE INC | mrin-ex321_6.htm |
| EX-31.2 - EX-31.2 - MARIN SOFTWARE INC | mrin-ex312_14.htm |
| EX-31.1 - EX-31.1 - MARIN SOFTWARE INC | mrin-ex311_9.htm |
| EX-23.1 - EX-23.1 - MARIN SOFTWARE INC | mrin-ex231_10.htm |
| EX-21.1 - EX-21.1 - MARIN SOFTWARE INC | mrin-ex211_7.htm |
UNITED STATES
SECURITIES AND EXCHANGE COMMISSION
Washington, D.C. 20549
FORM 10-K
|
☒ |
Annual Report pursuant to Section 13 or 15(d) of the Securities Exchange Act of 1934 |
For the fiscal year ended December 31, 2016
OR
|
☐ |
Transition report pursuant to Section 13 or 15(d) of the Securities Exchange Act of 1934 |
Commission File Number: 001-35838
Marin Software Incorporated
(Exact name of registrant as specified in its charter)
|
Delaware |
|
20-4647180 |
|
(State or other jurisdiction of incorporation or organization) |
|
(I.R.S. Employer Identification Number) |
123 Mission Street, 27th Floor
San Francisco, CA 94105
(415) 399-2580
(Address, including zip code, and telephone number, including area code, of registrant’s principal executive offices)
Securities registered pursuant to Section 12(b) of the Act:
|
Title of each class |
|
Name of each exchange on which registered |
|
Common stock, par value $0.001 per share |
|
New York Stock Exchange, |
Securities registered pursuant to section 12(g) of the Act:
Not applicable
Indicate by check mark if the Registrant is a well-known seasoned issuer, as defined in Rule 405 of the Securities Act. Yes ☐ No ☒
Indicate by check mark if the Registrant is not required to file reports pursuant to Section 13 or Section 15(d) of Act. Yes ☐ No ☒
Indicate by check mark whether the Registrant (1) has filed all reports required to be filed by Section 13 or 15(d) of the Securities Exchange Act of 1934 during the preceding 12 months (or for such shorter period that the Registrant was required to file such reports), and (2) has been subject to such filing requirements for the past 90 days: Yes ☒ No ☐
Indicate by check mark whether the Registrant has submitted electronically and posted on its corporate Web site, if any, every Interactive Data File required to be submitted and posted pursuant to Rule 405 of Regulation S-T (§232.405 of this chapter) during the preceding 12 months (or for such shorter period that the Registrant was required to submit and post such files). Yes ☒ No ☐
Indicate by check mark if disclosure of delinquent filers pursuant to Item 405 of Regulation S-K (§229.405 of this chapter) is not contained herein, and will not be contained, to the best of Registrant’s knowledge, in definitive proxy or information statements incorporated by reference in Part III of this Form 10-K or any amendment to this Form 10-K. ☒
Indicate by check mark whether the Registrant is a large accelerated filer, an accelerated filer, a non-accelerated filer or a smaller reporting company. See the definitions of “large accelerated filer,” “accelerated filer” and “smaller reporting company” in Rule 12b-2 of the Exchange Act. (Check one):
|
Large accelerated filer |
|
☐ |
|
Accelerated filer |
|
☒ |
|
|
|
|
|
|||
|
Non-accelerated filer |
|
☐ |
|
Smaller reporting company |
|
☐ |
Indicate by check mark whether the Registrant is a shell company (as defined in Rule 12b-2 of the Act). Yes ☐ No ☒
Based on the closing price of the Registrant’s Common Stock on the New York Stock Exchange of $2.35 on the last business day of the Registrant’s most recently completed second fiscal quarter, which was June 30, 2016, the aggregate market value of its shares held by non-affiliates was approximately $55 million. Shares of the Registrant’s Common Stock held by each executive officer and director and by each entity or person that owned 5% or more of the Registrant’s outstanding Common Stock were excluded in that such persons may be deemed to be affiliates. This determination of affiliate status is not necessarily a conclusive determination for other purposes.
As of February 24, 2017, there were approximately 39,250,359 shares of the Registrant’s Common Stock outstanding.
DOCUMENTS INCORPORATED BY REFERENCE
Portions of the Registrant’s definitive proxy statement for its 2016 Annual Meeting of Stockholders (“Proxy Statement”), to be filed within 120 days of the Registrant’s fiscal year ended December 31, 2016, are incorporated by reference in Part III of this Annual Report on Form 10-K. Except with respect to information specifically incorporated by reference in this Form 10-K, the Proxy Statement is not deemed to be filed as part of this Annual Report on Form 10-K.
FORM 10-K
For the Fiscal Year Ended December 31, 2016
TABLE OF CONTENTS
|
|
|
|
|
Page |
|
|
|
|
|
4 |
|
|||
|
Item 1. |
|
|
|
4 |
|
|
|
Item 1A. |
|
|
|
8 |
|
|
|
Item 1B. |
|
|
|
25 |
|
|
|
Item 2. |
|
|
|
25 |
|
|
|
Item 3. |
|
|
|
25 |
|
|
|
Item 4. |
|
|
|
25 |
|
|
|
|
|
26 |
|
|||
|
Item 5. |
|
|
|
26 |
|
|
|
Item 6. |
|
|
|
28 |
|
|
|
Item 7. |
|
Management’s Discussion and Analysis of Financial Condition and Results of Operations |
|
|
30 |
|
|
Item 7A. |
|
|
|
47 |
|
|
|
Item 8. |
|
|
|
48 |
|
|
|
Item 9. |
|
Changes in and Disagreements with Accountants on Accounting and Financial Disclosure |
|
|
48 |
|
|
Item 9A. |
|
|
|
48 |
|
|
|
Item 9B. |
|
|
|
49 |
|
|
|
|
|
50 |
|
|||
|
Item 10. |
|
|
|
50 |
|
|
|
Item 11. |
|
|
|
50 |
|
|
|
Item 12. |
|
Security Ownership of Certain Beneficial Owners and Management and Related Stockholder Matters |
|
|
50 |
|
|
Item 13. |
|
Certain Relationships and Related Transactions, and Director Independence |
|
|
50 |
|
|
Item 14. |
|
|
|
50 |
|
|
|
|
|
51 |
|
|||
|
Item 15. |
|
|
|
51 |
|
|
|
Item 16. |
|
|
|
51 |
|
|
|
|
|
|
|
52 |
|
|
|
|
|
77 |
|
|||
2
SPECIAL NOTE REGARDING FORWARD-LOOKING STATEMENTS
This Annual Report on Form 10-K, including the “Management’s Discussion and Analysis of Financial Condition and Results of Operations,” contains forward-looking statements regarding future events and our future results, including statements regarding the capabilities of our technology platform and upgrades to the platform, product capabilities and their benefits for our customers, and expectations as to financial performance, that are subject to the safe harbors created under the Securities Act of 1933, as amended, and the Securities Exchange Act of 1934, as amended. All statements contained in this Annual Report on Form 10-K other than statements of historical fact, including statements regarding our future results of operations and financial position, our business strategy and plans, and our objectives for future operations, are forward-looking statements within the meaning of the Private Securities Litigation Reform Act of 1995. The words “believe,” “may,” “potentially,” “will,” “estimate,” “continue,” “anticipate,” “intend,” “could,” “should,” “would,” “project,” “plan,” “predict,” “expect,” “seek,” and similar expressions are intended to identify forward-looking statements. We have based these forward-looking statements largely on our current expectations, estimates and projections about future events and trends that we believe may affect our financial condition, results of operations, business strategy, short-term and long-term business operations and objectives, and financial needs. These statements reflect our beliefs and certain assumptions based upon information available to us at the time we file this Annual Report on Form 10-K or the time of the documents incorporated by reference. Such forward-looking statements are only predictions, which may differ materially from actual results or future events. Although we believe that our expectations, estimates and projections reflected in the forward-looking statements are reasonable, we cannot be sure that they will be achieved. These forward-looking statements are subject to a number of risks, uncertainties and assumptions, including those described in the “Risk Factors” section. Moreover, we operate in a very competitive and rapidly changing environment. New risks emerge from time to time. It is not possible for our management to predict all risks, nor can we assess the impact of all factors on our business or the extent to which any factor, or combination of factors, may cause actual results to differ materially from those contained in any forward-looking statements we may make. In light of these risks, uncertainties and assumptions, the future events and trends discussed in this report may not occur and actual results could differ materially and adversely from those anticipated or implied in the forward-looking statements. We undertake no obligation to revise or publicly release the results of any revision to these forward-looking statements, except as required by law. Given these risks and uncertainties, readers are cautioned not to place undue reliance on such forward-looking statements.
As used in this report, the terms “Marin,” “Registrant,” “we,” “us,” “our,” and “the Company” mean Marin Software Incorporated and its subsidiaries unless the context indicates otherwise.
3
We provide a leading cross-channel advertising cloud platform that enables digital marketers to improve performance of their online advertising campaigns across devices, realize efficiencies and time savings, and make better business decisions. Our integrated platform is a software-as-a-service, or SaaS, analytics, workflow and optimization solution for marketing professionals, allowing them to effectively manage their digital advertising spend across search, social and display channels. Our software solution is designed to help our customers:
|
|
• |
measure the effectiveness of their advertising campaigns through our proprietary reporting and analytics capabilities; |
|
|
• |
manage and execute campaigns through our intuitive user interface and underlying technology that streamlines and automates key functions, such as ad creation and bidding, across multiple publishers and channels; and |
|
|
• |
optimize campaigns across multiple publishers and channels based on market and business data to achieve desired revenue outcomes using our predictive bid management technology. |
Advertisers use our platform to create, target and convert precise audiences based on recent buying signals from users’ search, social and display interactions. Our platform is integrated with leading publishers such as Baidu, Bing, Facebook, Google, Twitter, Yahoo!, Yahoo! Japan and Yandex. Additionally, we have integrations with more than 50 leading web analytics and ad-serving solutions and key enterprise applications, enabling our customers to more accurately measure the return on investment of their marketing programs.
Our software platform serves as an integration point for advertising performance, sales and revenue data, allowing advertisers to connect the dots between advertising spend and revenue outcomes. Through an intuitive interface, we enable our customers to simultaneously run large-scale digital advertising campaigns across multiple publishers and channels, making it easy for marketers to create, publish, modify and optimize campaigns.
Our predictive bid management and optimization technology also allows advertisers to forecast outcomes and optimize campaigns across multiple publishers and channels to achieve their business goals. Our optimization technology can help advertisers increase ad spend on those campaigns, publishers and channels that are performing well while reducing investment in those that are not. This category of solutions, which we refer to as cross-channel bid and campaign optimization, helps businesses intelligently and efficiently measure, manage, and optimize their digital advertising spend to achieve desired business results.
We completed our acquisitions of SocialMoov S.A.S., or SocialMoov, and NowSpots, Inc., which conducted business as Perfect Audience, or Perfect Audience, in February 2015 and June 2014, respectively, to complement our product offerings. SocialMoov provides a software platform that offers advertisers and agencies novel social advertising tools designed to increase engagement and return on investment, including Facebook video advertising, Twitter application program interface, or API, integration and television synchronization. Perfect Audience offers advertisers a SaaS demand-side platform to purchase display impressions and retarget audiences across the web, Facebook and Twitter. Perfect Audience expanded our cross-channel capabilities by adding new programmatic display and social advertising functionality while expanding our audience retargeting tools. These acquisitions are more fully described in Note 3 to the consolidated financial statements.
Headquartered in San Francisco, we were founded in 2006. The mailing address of our headquarters is 123 Mission Street, 27th Floor, San Francisco, California 94105 and our telephone number at that location is (415) 399-2580. Our customers collectively manage billions of dollars in ad spend on our platform, which we believe makes us the largest provider of independent advertising cloud solutions.
Offered Solutions
Our cloud-based platform helps our customers to measure, manage and optimize their digital marketing campaigns to improve performance of their online advertising campaigns, realize efficiencies and time savings, and make better business decisions. We offer solutions for direct advertisers of all sizes and the agencies that represent them, including enterprise, mid-market or small businesses. We offer SaaS solutions for search, social and display as well as managed services for display and social.
4
We offer two editions of our search platform that leverage the same underlying technology.
|
|
• |
Enterprise Edition. Targeting large advertisers and agencies, Marin Enterprise is designed to provide digital advertisers with the power, scale and flexibility required to manage large-scale advertising campaigns. |
|
|
• |
Professional Edition. Targeting mid-market advertisers and agencies, Marin Professional is designed for rapid deployment and offers customers a complete workflow, analysis and optimization solution for managing digital advertising. |
Our search platform is comprised of the following modules:
|
|
• |
Optimization. Our Optimization module helps advertisers manage bids across publishers to meet revenue goals and identify opportunities for campaign improvements, which we believe can improve financial performance and efficiencies. |
|
|
• |
Reporting and Analytics. Our Reporting and Analytics module enables advertisers to report results at a business level and analyze cross-channel performance trends, which we believe can lead to improved visibility and generate significant time savings. |
|
|
• |
Campaign Management. Our Campaign Management module provides the digital advertiser with a unified interface to create, manage and optimize campaigns across a broad range of publishers, creating greater efficiencies and increasing flexibility. |
|
|
• |
Connect. Our Connect module enables advertisers to automate and streamline the capture of revenue, cost and audience data from a range of sources such as ad servers, analytics systems, CRM platforms, publishers and third party databases. Through integrations across multiple data sources, our Connect module can help advertisers have a holistic picture of their digital advertising campaigns. |
Social
Targeting agencies and advertisers of all sizes, Marin Social is designed to provide digital marketers with the power, scale and flexibility to execute advertising campaigns across multiple social networks.
Display
We offer two editions of our display platform that leverage the same underlying technology.
|
|
• |
Marin Display. Targeting large advertisers and agencies, Marin Display is designed to provide digital advertisers with the power, scale and flexibility required to manage large-scale advertising campaigns across all major networks and across devices. |
|
|
• |
Perfect Audience. Targeting small businesses, Perfect Audience is designed for rapid deployment and offers customers an easy-to-use interface to implement and optimize campaigns across all major networks and across devices. |
Technology & Supporting Platform
We designed our cloud-based platform to support large global advertisers. The majority of our software is written in Java. Our hardware consists of industry-standard servers and network infrastructure. Our standard operating system is Linux. Our software platform is character-set, language, currency, and time-zone independent. Our technology platform has the following key benefits:
|
|
• |
Scalability. Our platform is designed to handle billions of ad units across thousands of advertisers, while delivering a responsive browsing and editing experience. As the number of advertisers and resulting computing and storage requirements grow, we can add hardware to our platform to accommodate growing demand. |
|
|
• |
Availability. Our customers are highly dependent on the availability of our platform, which is designed to be available 24x7, 365 days a year. We operate our own hardware and use third-party data centers that offer server redundancy, back-up communications and power and physical security. |
|
|
• |
Security. Our platform manages a large quantity of customer data. We employ technologies, policies and procedures to protect customer data. Our primary third-party data center has SSAE 16 attestations. |
We are in the process of upgrading our software platform, which we believe will cost-effectively extend the scalability, speed, resiliency and availability of our services and facilitate our ability to add new features to our products.
5
We market and sell our solutions to advertisers directly and through advertising agencies that use our platform on behalf of their customers. Advertisers that we serve through our relationships with agencies have historically represented about half our revenues. There were no customers that accounted for greater than 10% of our revenues, net in 2016, 2015 or 2014.
Competition
The digital advertising cloud market is highly competitive, fragmented, and subject to changes in both technology and customer behavior. We face significant competition today and expect competition to intensify in the future. To maintain and improve our competitive position, we must keep pace with the evolving needs of our customers and continue to develop and introduce new modules, features and services in a timely and efficient manner. We currently compete with large, well-established companies, such as Adobe Systems Incorporated and Google Inc. (through its wholly-owned subsidiary DoubleClick), and privately-held companies, such as Kenshoo Ltd. We also compete with in-house proprietary tools, tools from publishers and custom solutions, including spreadsheets. We believe the principal competitive factors in our market include the following:
|
|
• |
solution quality, breadth, stability, flexibility and functionality; |
|
|
• |
tangible platform benefits; |
|
|
• |
level of customer satisfaction and our ability to respond to customer needs rapidly; |
|
|
• |
breadth and quality of advertiser and agency relationships; |
|
|
• |
ability to innovate and develop new or improved products and features while maintaining platform speed and stability; |
|
|
• |
ability to respond to changes in publishers’ APIs; |
|
|
• |
brand awareness and reputation; and |
|
|
• |
size of customer base. |
Apart from cross-channel platform competitors, we also compete with channel solutions in the display and social advertising markets. Competitors in the display advertising market include public companies such as Criteo S.A. and Rocket Fuel Inc., as well as privately held companies such as AdRoll Inc. and MediaMath, Inc., while in the social advertising market we compete with public companies such as Salesforce.com (through its wholly-owned subsidiary Social.com), and privately-held companies such as Nanigans, Inc.
Our ability to remain competitive will largely depend on our ongoing performance in the areas of our solution breadth and depth as well as customer support.
Sales and Marketing
We sell our solutions directly to advertisers and to agencies in a wide range of industries through our global sales team. Our sales cycle can vary substantially by advertiser and agency, but can take up to nine months. We have a number of account executive sales teams organized by geography and market segments. We also have customer success professionals who are responsible for long-term customer satisfaction and retention, renewal, support and driving an increase in the volume of media managed by customers on our platform.
Our marketing team is focused on driving awareness and demand generation across major markets. This team provides thought leadership in the form of white papers, benchmarking reports, bylines, presenting at industry conferences and speaking to the press. In addition, they are responsible for the creation of field enablement assets such as case studies, blog posts and corporate and product collateral.
Research and Development
Our research and development team is responsible for the design, development, and maintenance of our platform. Our research and development process emphasizes frequent, iterative and incremental development cycles. Within our research and development organizations, we have several project teams that focus on platform and feature development for our integrated vertical offerings as part of our advertising cloud solutions. Each of these project teams includes engineers, quality engineers and product managers, as needed, responsible for the initial and ongoing development for their projects. Total research and development expense was $27.8 million, $33.3 million and $28.8 million and for the years ended December 31, 2016, 2015 and 2014, respectively.
6
As of December 31, 2016, we had a total of 437 regular full-time employees, including 171 employees located outside the United States. Although we have statutory employee representation obligations in certain countries, our U.S. employees are not represented by a labor union. We have not experienced any work stoppages, and we consider our relations with our employees to be good.
Intellectual Property
Our intellectual property rights are a key component of our success. We rely on a combination of patent, trademark, copyright, unfair competition and trade secret laws, as well as confidentiality procedures and contractual restrictions, to establish, maintain and protect our proprietary rights.
As of December 31, 2016, we had three issued patents and eight patent applications pending in the U.S.
We own and use trademarks on or in connection with our products and services, including two registered trademarks in the United States, the European Union, Australia, China and Japan, one registered mark in Canada and Russia, and unregistered common law marks and pending trademark applications in the United States, Canada, China, Russia, South Korea, and Singapore. We have also registered numerous Internet domain names.
Available Information
The mailing address of our headquarters is 123 Mission Street, 27th Floor, San Francisco, California 94105 and our telephone number at that location is (415) 399-2580. Our website is www.marinsoftware.com. Through a link on the Investor Center section of our website, we make available the following filings as soon as reasonably practicable after they are electronically filed with or furnished to the Securities and Exchange Commission (the “SEC”): our Annual Report on Form 10-K, Quarterly Reports on Form 10-Q, Current Reports on Form 8-K, and any amendments to those reports filed or furnished pursuant to Section 13(a) or 15(d) of the Securities Exchange Act of 1934, as amended. All such filings are free of charge. The information posted to our website is not incorporated into this Annual Report on Form 10-K. The public may read and copy any materials that we file with the SEC at the SEC’s Public Reference Room at 100 F Street, NE, Washington, DC 20549. The public may obtain information on the operation of the Public Reference Room by calling the SEC at 1-800-SEC-0330. The SEC also maintains an Internet site that contains reports, proxy and information statements, and other information regarding issuers that file electronically with the SEC at www.sec.gov.
7
Our operations and financial results are subject to various risks and uncertainties, including those described below, which could adversely affect our business, results of operations, cash flows, financial conditions, and the trading price of our common stock.
Risks Related to Our Business
We have a history of losses and we may not achieve or sustain profitability in the future.
We have incurred significant losses in each fiscal year since our incorporation in 2006. We experienced net losses of $16.5 million and $33.3 million during 2016 and 2015, respectively. As of December 31, 2016, we had an accumulated deficit of $196.2 million. The losses and accumulated deficit were due to the substantial investments we made to grow our business and acquire customers. Our cost of revenues and operating expenses could increase in the future due to investments to grow our business, acquire customers and develop our platform and new functionality. These efforts may prove more expensive than we currently anticipate, and we may not succeed in increasing our revenues sufficiently to offset these higher expenses. Many of our efforts to generate revenues from our business are new and unproven, and any failure to increase our revenues or generate revenues from new solutions or to maintain or increase revenues from existing products and customers could prevent us from attaining or increasing profitability. Furthermore, to the extent we are successful in increasing our customer base, we also could incur increased losses because costs associated with entering into customer contracts are generally incurred up front, while customers are billed over the term of the contract generally through our usage-based pricing model. We do not expect to be profitable in 2017 on the basis of generally accepted accounting principles in the United States, or GAAP, and we cannot be certain that we will be able to attain profitability on a quarterly or annual basis, or if we do, that we will sustain profitability.
We operate in a rapidly developing and changing industry, which makes it difficult to evaluate our current business and future prospects.
We have encountered and will continue to encounter risks and difficulties frequently experienced by companies in rapidly developing and changing industries, including challenges in forecasting accuracy, hiring and retaining qualified employees, determining appropriate investments of our limited resources, market acceptance of our existing and future solutions, effectively integrating acquired products, competition from established companies with greater financial and technical resources, acquiring and retaining customers, managing customer deployments, making improvements to our existing products and developing new solutions. Our current operations infrastructure may require changes in order for us to achieve profitability and scale our operations efficiently. For example, we may need to automate portions of our solution to decrease our costs, ensure our marketing infrastructure is designed to drive highly qualified leads cost effectively and implement changes in our sales model to improve the predictability of our sales and reduce our sales cycle. In addition, from time to time, we may need to make additional investments in product development to address market demands, which may increase our overall expenses and reduce our ability to achieve profitability. If we fail to implement these changes in a timely manner or are unable to implement them due to factors beyond our control, our business may suffer, our revenue may decline and we may not be able to achieve further growth or profitability. We cannot be assured that we will be successful in addressing these and other challenges we may face in the future.
Our usage-based pricing model makes it difficult to forecast revenues from our current customers and future prospects.
We primarily have a usage-based pricing model in which most of our fees are calculated as a percentage of customers’ advertising spend managed on our platform. This pricing model makes it difficult to accurately forecast revenues because our customers’ advertising spend managed by our platform may vary from month to month based on the variety of industries in which our advertisers operate, the seasonality of those industries and fluctuations in our customers’ advertising budgets or other factors. Our subscription contracts with our direct advertiser customers generally contain a minimum monthly platform fee, which is generally greater than one-half of our estimated monthly revenues from the customer at the time the contract is signed, and, as a result, the minimum monthly platform fee may not be a good indicator of our revenues from that customer. In addition, advertisers that use our platform through our agency customers typically do not have a minimum monthly spend amount or a minimum term during which they must use our platform, and as a result, our ability to forecast revenues from these advertisers is difficult. If we incorrectly forecast revenues for these advertisers and the amount of revenue is less than projections we provide to investors, the price of our common stock could decline substantially. Additionally, if we overestimate usage, we may incur additional expenses in adding infrastructure, without a commensurate increase in revenues, which would harm our gross margins and other operating results.
8
We must develop and introduce enhancements and new features that achieve market acceptance or that keep pace with technological developments to remain competitive in our evolving industry.
We operate in a dynamic market characterized by rapidly changing technologies and industry and legal standards. The introduction of new advertising platform solutions by our competitors, the market acceptance of solutions based on new or alternative technologies, or the emergence of new industry standards could render our platform obsolete. Our ability to compete successfully, attract new customers and increase revenues from existing customers depends in large part on our ability to enhance and improve our existing cross-channel, cross-device, enterprise marketing software platform and to continually introduce or acquire new features that are in demand by the market we serve. We also must update our software to reflect changes in publishers’ APIs and terms of use. We are in the process of a significant upgrade to our software platform infrastructure, and the success of this project or any other enhancement or new solution depends on several factors, including timely completion, adequate quality testing, effective migration of existing customers with minimal disruption and appropriate introduction and market acceptance. Any new platform or feature that we develop or acquire may not be introduced in a timely manner, may contain defects, may be more costly to compete than we anticipate or may not achieve the broad market acceptance necessary to generate significant revenues. If we are unable to complete the upgrade to our software platform infrastructure effectively or in a timely manner, or to anticipate or timely and successfully develop or acquire new offerings or features or enhance our existing platform to meet customer requirements, our business and operating results will be adversely affected.
If the market for digital advertising slows or declines, our business, growth prospects, and financial condition would be adversely affected.
The future growth of our business could be constrained by the level of acceptance and expansion of emerging cloud-based advertising channels, as well as the continued use and growth of existing channels, such as search and display advertising. Even if these channels become widely adopted, advertisers and agencies may not make significant investments in solutions such as ours that help them manage their digital advertising spend across publisher platforms and advertising channels. It is difficult to predict customer adoption rates, customer demand for our platform, the future growth rate and size of the advertising cloud solutions market or the entry of competitive solutions. The continued expansion of the market for advertising cloud solutions depends on a number of factors, including the continued growth of the cloud-based advertising market, the growth of social and mobile as advertising channels and the cost, performance and perceived value associated with advertising cloud solutions, as well as the ability of cloud computing companies to address security and privacy concerns. Further, the cloud computing market is less developed in many jurisdictions outside the United States. If we or other cloud computing providers experience security incidents, loss of customer data, disruptions in delivery or other problems, the market for cloud computing as a whole, including our applications, may be negatively affected.
If we are unable to maintain our relationships with, and access to, publishers, advertising exchange platforms and other platforms that aggregate the supply of advertising inventory, our business will suffer.
We currently depend on relationships with various publishers, including Baidu, Bing, Facebook, Google, Twitter, Yahoo! and Yahoo! Japan, as well as advertising exchange platforms and aggregators of advertising inventory, including Google’s DoubleClick Ad Exchange, Yahoo! Gemini, Facebook’s Exchange, Microsoft’s Ad Exchange, Twitter’s MoPub, OpenX, The Rubicon Project, PubMatic and AppNexus. Our subscription services interface with these publishers’ platforms through APIs, such as the Google AdWords API or Facebook API. We are subject to the respective platforms’ standard API terms and conditions, which govern the use and distribution of data from these platforms. Our business significantly depends on having access to these APIs, particularly the Google AdWords API, which the substantial majority of our customers use, on commercially reasonable terms and our business would be harmed if any of these publishers, advertising exchanges or aggregators of advertising inventory discontinues or limits access to their platforms, modifies their terms of use or other policies or place additional restrictions on us as API users, or charges API license fees for API access. Moreover, some of these publishers, such as Google, market competitive solutions for their platforms. Because the advertising inventory suppliers control their APIs, they may develop competitive offerings that are not subject to the limits imposed on us through the API terms and conditions. Currently, restrictions in these API agreements limit our ability to implement certain functionality, require us to implement functionality in a particular manner or require us to implement certain required minimum functionality, causing us to devote development resources to implement certain functionality that we would not otherwise include in our subscription services and to incur costs for personnel to provide services to implement functionality that we are prohibited from automating. Publishers, advertising exchanges and advertising inventory aggregators update their API terms of use from time to time and new versions of these terms could impose additional restrictions on us. In addition, publishers, advertising exchanges and advertising inventory aggregators continually update their APIs and may update or modify functionality, which requires us to modify our software to accommodate these changes and to devote technical resources and personnel to these efforts which could otherwise be used to focus on other priorities. Any of these outcomes could cause demand for our products to decrease, our research and development costs to increase, and our results of operations and financial condition to be harmed.
9
Our growth depends in part on the success of our relationships with advertising agencies.
Our future growth will depend, in part, on our ability to enter into successful relationships with advertising agencies. Identifying agencies and negotiating and documenting relationships with them requires significant time and resources. These relationships may not result in additional customers or enable us to generate significant revenues. Our contracts for these relationships are typically non-exclusive and do not prohibit the agency from working with our competitors or from offering competing services. Frequently, these agencies do in fact work with our competitors and compete with us. In addition, we often work with, or seek to work with, high-profile brands directly. This may not be possible where, for example, those brands obtain advertising services exclusively or primarily from advertising agencies.
We generally bill agencies for their customers’ use of our platform, but in most cases the agency’s customer has no direct contractual commitment to make payment to us. Furthermore, some of these agency contracts include provisions whereby the agency is not liable for making payment to us for our subscription services if the agency does not receive a corresponding payment from its client on whose behalf the subscription services were rendered. These provisions may result in longer collections periods or our inability to collect payment for some of our subscription services. If we are unsuccessful in establishing or maintaining our relationships with these agencies on commercially reasonable terms, or if these relationships are not profitable for us, our ability to compete in the marketplace or to grow our revenues could be impaired and our operating results would suffer.
We may not be able to compete successfully against current and future competitors.
The overall market for advertising cloud solutions is rapidly evolving, highly competitive, complex, fragmented, and subject to changing technology and shifting customer needs. We face significant competition in this market and we expect competition to intensify in the future. We currently compete with large, well-established companies, such as Adobe Systems Incorporated and Google Inc. (through its wholly-owned subsidiary DoubleClick), and privately-held companies, such as Kenshoo Ltd. We also compete with channel-specific offerings, in-house proprietary tools, tools from publishers and custom solutions, including spreadsheets. Increased competition may result in reduced pricing for our solutions, longer sales cycles or a decrease of our market share, any of which could negatively affect our revenues and future operating results and our ability to grow our business.
A number of competitive factors could cause us to lose potential sales or to sell our solutions at lower prices or at reduced margins, including, among others:
|
|
• |
potential customers may choose to develop or continue to use internal solutions rather than paying for our solutions or may choose to use a competitor’s solution that has different or additional technical capabilities; |
|
|
• |
companies may enter our market by expanding their platforms or acquiring a competitor; |
|
|
• |
some of our competitors, such as Adobe and Google, have greater financial, marketing and technical resources than we do, allowing them to leverage a larger installed customer base, adopt more aggressive pricing policies, and devote greater resources to the development, promotion and sale of their products and services than we can; |
|
|
• |
channel-specific competitors, such as AdRoll Inc., Criteo S.A., MediaMath Inc., Nanigans, Inc., Rocket Fuel Inc. and Salesforce.com (through its wholly-owned subsidiary Social.com), may devote greater resources to the development, promotion and sale of their channel-specific products and services than we can; and |
|
|
• |
publishers generally offer their tools for free, or at a reduced price, as their primary compensation is via the sale of advertising on their own or syndicated websites. |
We cannot assure you that we will be able to compete successfully against current and future competitors. If we cannot compete successfully, our business, results of operations and financial condition could be negatively impacted.
Our business depends on our customers’ continued willingness to manage advertising spend on our platform.
In order for us to improve our operating results, it is important that our customers continue to manage their advertising spend on our platform, increase their usage and also purchase additional solutions from us. In the case of our direct advertiser customers, we offer our solutions primarily through subscription contracts and generally bill customers over the related subscription period, which is generally one year or longer. During the term of their contracts, our direct advertiser customers generally have no obligation to maintain or increase their advertising spend on our platform beyond a specified minimum monthly platform fee, which is typically set at the time the contract is signed and is generally greater than half of the monthly amount we anticipate the customer will spend. Our direct advertiser customers generally have no renewal obligation after the initial or then-current renewal subscription period expires, and even if customers renew contracts, they may decrease the level of their digital advertising spend managed through our platform, resulting in lower revenues from that customer. Advertisers that we serve through our arrangements with our advertising agencies generally do not have any contractual commitment to use our platform. Our customers’ usage may decline or fluctuate as a result of a
10
number of factors, including, but not limited to, their satisfaction with our platform and our customer support, the frequency and severity of outages, the pricing of our, or competing, solutions, the effects of global economic conditions and reductions in spending levels or changes in our customers’ strategies regarding digital advertising. We may not be able to accurately predict future usage trends. If our customers renew on less favorable terms or reduce their advertising spend on our platform, our revenues may grow more slowly than expected or decline.
We incur upfront costs associated with onboarding advertisers to our platform and may not recoup our investment if we do not maintain the advertiser relationship over time.
Our operating results may be negatively affected if we are unable to recoup our upfront costs for onboarding new advertisers to our platform. Upfront costs when adding new advertisers generally include sales commissions for our sales force, expenses associated with entering customer data into our platform and other implementation-related costs. Because our customers, including direct advertisers and agencies, are billed over the term of the contract, if new customers sign contracts with short initial subscription periods and do not renew their subscriptions, or otherwise do not continue to use our platform to a level that generates revenues in excess of our upfront expenses, our operating results could be negatively impacted. In cases in which the implementation process is particularly complex, the revenues resulting from the customer under our contract may not cover the upfront investment, so if a significant number of these customers do not renew their contracts, it could negatively affect our operating results.
Because we generally bill our customers over the term of the contract, near term decline in new or renewed subscriptions may not be reflected immediately in our operating results.
Most of our revenues in each quarter are derived from contracts entered into with our customers during previous quarters. Consequently, a decline in new or renewed subscriptions in any one quarter may not be fully reflected in our revenues for that quarter. Such declines, however, would negatively affect our revenues in future periods and the effect of significant downturns in sales and market acceptance of our solutions, and potential changes in our rate of renewals or renewal terms, may not be fully reflected in our results of operations until future periods. In addition, we may be unable to adjust our cost structure rapidly, or at all, to take account of reduced revenues. Our subscription model also makes it difficult for us to rapidly increase our total revenues through additional sales in any period, as revenues from new customers must be earned over the applicable subscription term based on the value of their monthly advertising spend.
We have been dependent on our customers’ use of search advertising. Any decrease in the use of search advertising or our inability to further penetrate social and display advertising channels would harm our business, growth prospects, operating results and financial condition.
Historically, our customers have primarily used our solutions for managing their search advertising, including mobile search advertising, and the substantial majority of our revenue is derived from advertisers that use our platform to manage their search advertising. We expect that search advertising will continue to be the primary channel used by our customers for the foreseeable future. Should our customers lose confidence in the value or effectiveness of search advertising, or if search advertising growth moderates or declines, the demand for our solutions may decline, and it may negatively impact our revenues. In addition, our failure to achieve market acceptance of our solution for the management of social and display advertising spend would harm our growth prospects, operating results and financial condition.
Our sales cycle can be long and unpredictable and require considerable time and expense, which may cause our operating results to fluctuate.
The sales cycle for our solutions, from initial contact with a potential lead to contract execution and implementation, varies widely by customer, but can take up to nine months. Some of our customers undertake a significant evaluation process that frequently involves not only our solutions but also those of our competitors, which has in the past resulted in extended sales cycles. Our sales efforts involve educating our customers about the use, technical capabilities and benefits of our platform. In addition, under certain circumstances, we sometimes offer an initial term, typically of a few months in duration, to new customers who may terminate their subscription at any time during this initial period before the fixed term contract commences. We have no assurance that the substantial time and money spent on our sales efforts will produce any sales. If our sales efforts result in a new customer subscription, the customer may terminate its subscription during the initial period, after we have incurred the expenses associated with entering the customer’s data in our platform and related training and support. If sales expected from a customer are not realized in the time period expected or not realized at all, or if a customer terminates during the initial period, our business, operating results and financial condition could be adversely affected.
11
Our ability to generate revenue depends on our collection of significant amounts of data from various sources.
Our ability to optimize the delivery of Internet advertisements for our customers depends on our ability to successfully leverage data, including data that we collect from our customers as well as data provided by publishers and from third parties. Using cookies and similar tracking technologies, we collect information about the interaction of users with our advertisers’ and publishers’ websites. Our ability to successfully leverage such data is dependent upon our continued ability to access and utilize such data. Our ability to access and use such data could be restricted by a number of factors, including consumer choice, restrictions imposed by advertisers and publishers, changes in technology, and new developments in laws, regulations, and industry standards.
If consumer resistance to the collection and sharing of the data used to deliver targeted advertising, increased visibility of consent / Do Not Track mechanisms as a result of industry regulatory and/or legal developments, and/or the development and deployment of new technologies result in a material impact on our ability to collect data, this will materially impair the results of our operations.
Material defects or errors in our software platform could harm our reputation, result in significant costs to us and impair our ability to sell our subscription services.
The software applications underlying our subscription services are inherently complex and may contain material defects or errors, which may cause disruptions in availability, misallocation of advertising spend or other performance problems. Any such errors, defects, disruptions in service or other performance problems with our software platform, including those resulting from new versions or updates, could negatively impact our customers’ businesses or the success of their advertising campaigns and cause harm to our reputation. If we have any errors, defects, disruptions in service or other performance problems with our software platform, customers could elect not to renew or reduce their usage or delay or withhold payment to us, which could result in an increase in our provision for doubtful accounts or an increase in the length of collection cycles for accounts receivable. Errors, defects, disruptions in service or other performance problems could also result in customers making warranty or other claims against us, our giving credits to our customers toward future advertising spend or costly litigation. As a result, material defects or errors in our platform could have a material adverse impact on our business and financial performance.
The costs incurred in correcting any material defects or errors in our software platform may be substantial and could adversely affect our operating results. After the release of new versions of our software, defects or errors may be identified from time to time by our internal team and by our customers. We implement bug fixes and upgrades as part of our regularly scheduled system maintenance. If we do not complete this maintenance according to schedule or if customers are otherwise dissatisfied with the frequency and/or duration of our maintenance services, customers could elect not to renew, or delay or withhold payment to us, or cause us to issue credits, make refunds or pay penalties.
We primarily derive our revenues from a single software platform and any factor adversely affecting subscriptions to our platform could harm our business and operating results.
We primarily derive our revenues from sales of a single software platform. As such, any factor adversely affecting subscriptions to our platform, including product release cycles, market acceptance, product competition, performance and reliability, reputation, price competition, and economic and market conditions, could harm our business and operating results.
If mobile connected devices, their operating systems or content distribution channels, including those controlled by our competitors, develop in ways that prevent our advertising campaigns from being delivered to their users, our ability to grow our business will be impaired.
Our success in the mobile channel depends upon the ability of our technology platform to integrate with mobile inventory suppliers and provide advertising for most mobile connected devices, as well as the major operating systems that run on them and the applications that are downloaded onto them. The design of mobile devices and operating systems is controlled by third parties with whom we do not have any formal relationships. These parties frequently introduce new devices, and from time to time they may introduce new operating systems or modify existing ones. Network carriers may also impact the ability to access specified content on mobile devices. If our solution were unable to work on these devices or operating systems, either because of technological constraints or because an operating system or app developer, device maker or carrier wished to impair our ability to purchase inventory and provide advertisements, our ability to generate revenue could be significantly harmed.
We primarily use third-party data centers to deliver our services. Any disruption of service at these facilities could harm our business.
While we utilize two third-party data centers, we manage a significant portion of our services and serve substantially all of our customers from only a single third-party data center facility. While we control the actual computer, network and storage systems upon
12
which our platform runs, and deploy them to the data center facility, we do not control the operation of the facility. The owner of the facility has no obligation to renew the agreement with us on commercially reasonable terms, or at all. If we are unable to renew the agreement on commercially reasonable terms, we may be required to transfer to a new facility or facilities, and we may incur significant costs and possible service interruption in connection with doing so.
The facility is vulnerable to damage or service interruption resulting from human error, intentional bad acts, earthquakes, hurricanes, floods, fires, war, terrorist attacks, power losses, hardware failures, systems failures, telecommunications failures and similar events. Moreover, while we have a disaster recovery plan in place, we do not maintain a “hot failover” instance of our software platform permitting us to immediately switch over in the event of damage or service interruption at our data center. The occurrence of a natural disaster or an act of terrorism, any outages or vandalism or other misconduct, or a decision to close the facility without adequate notice or other unanticipated problems could result in lengthy interruptions in our services.
Any changes in service levels at the facility or any errors, defects, disruptions or other performance problems at or related to the facility that affect our services could harm our reputation and may damage our customers’ businesses. Interruptions in our services might reduce our revenues, subject us to potential liability, or result in reduced usage of our platform. In addition, some of our customer contracts require us to issue credits for downtime in excess of certain levels and in some instances give our customers the ability to terminate their subscriptions.
We also depend on third-party Internet-hosting providers and continuous and uninterrupted access to the Internet through third-party bandwidth providers to operate our business. If we lose the services of one or more of our Internet-hosting or bandwidth providers for any reason or if their services are disrupted, for example due to viruses or “denial-of-service” or other attacks on their systems, or due to human error, intentional bad acts, power loss, hardware failures, telecommunications failures, fires, wars, terrorist attacks, floods, earthquakes, hurricanes, tornadoes or similar events, we could experience disruption in our ability to offer our solutions or we could be required to retain the services of replacement providers, which could increase our operating costs and harm our business and reputation.
If we cannot efficiently implement our solutions for customers, we may lose customers.
Our customers have a variety of different data formats, enterprise applications and infrastructure and our platform must support our customers’ data formats and integrate with complex enterprise applications and infrastructures. If our platform does not currently support a customer’s required data format or appropriately integrate with a customer’s applications and infrastructure, then we may choose to configure our platform to do so, which would increase our expenses. Additionally, we do not control our customers’ implementation schedules. As a result, as we have experienced in the past, if our customers do not allocate internal resources necessary to meet their implementation responsibilities or if we face unanticipated implementation difficulties, the implementation may be delayed. Further, in the past, our implementation capacity has at times constrained our ability to successfully implement our solutions for our customers in a timely manner, particularly during periods of high demand. If the customer implementation process is not executed successfully or if execution is delayed, we could incur significant costs, customers could become dissatisfied and decide not to increase usage of our platform, not to use our platform beyond an initial period prior to their term commitment and revenue recognition could be delayed. In addition, competitors with more efficient operating models with lower implementation costs could penetrate our customer relationships.
Additionally, large customers may request or require specific features or functions unique to their particular business processes, which increase our upfront investment in sales and deployment efforts and the revenues resulting from the customers under our typical contract length may not cover the upfront investments. If prospective large customers require specific features or functions that we do not offer, then the market for our solution will be more limited and our business could suffer. In addition, supporting large customers could require us to devote significant development services and support personnel and strain our personnel resources and infrastructure. If we are unable to address the needs of these customers in a timely fashion or further develop and enhance our solution, these customers may not renew their subscriptions, seek to terminate their relationship with us, renew on less favorable terms, or reduce their advertising spend on our platform. If any of these were to occur, our revenues may decline and our operating results could be adversely affected.
If we are unable to maintain or expand our sales and marketing capabilities, we may not be able to generate anticipated revenues.
Increasing our customer base and achieving broader market acceptance of our software platform will depend to a significant extent on our ability to expand our sales and marketing operations and activities. We are substantially dependent on our sales force to obtain new customers and our marketing organization to generate a sufficient pipeline of qualified sales leads. We may expand our sales team in order to increase revenues from new and existing customers and to further penetrate our existing markets and expand into new markets, but may not be able to attract and hire qualified sales personnel quickly enough or at all. Our solutions require a sophisticated sales force with specific sales skills and technical knowledge. Competition for qualified sales personnel is intense, and we may not be able to retain our existing sales personnel or attract, integrate, train or retain sufficient highly qualified sales personnel.
13
In addition, we need to invest in lead generation activities to develop our pipeline of qualified opportunities for our salesforce, which could increase our marketing expenses. If our lead generation activities do not increase our pipeline or if our salesforce is unable to close opportunities at a high rate, then we may not generate an increase in revenues.
Any failure to offer high-quality technical support services may adversely affect our relationships with our customers and harm our financial results.
Our customers depend on our support organization to resolve any technical issues relating to our solutions. In addition, our sales process is highly dependent on the quality of our solutions, our business reputation and on strong recommendations from our existing customers. Any failure to maintain high-quality technical support, or a market perception that we do not maintain high-quality support, could harm our reputation, adversely affect our ability to sell our solutions to existing and prospective customers, and harm our business, operating results and financial condition.
We offer technical support services with our solutions and may be unable to respond quickly enough to accommodate short-term increases in customer demand for support services. We also may be unable to modify the format of our support services to compete with changes in support services provided by competitors. It is difficult to predict customer demand for technical support services and if customer demand increases significantly, we may be unable to provide satisfactory support services to our customers. Additionally, increased customer demand for these services, without corresponding revenues, could increase costs and adversely affect our operating results.
If our security measures are breached or unauthorized access to customer data or our data is otherwise obtained, our solutions may be perceived as not being secure, customers may reduce the use of or stop using our solutions and we may incur significant liabilities.
In the ordinary course of our business, we maintain sensitive data on our networks, including our intellectual property and proprietary or confidential business information relating to our business and that of our customers and business partners. The secure maintenance of this information is critical to our business and reputation. We believe that companies have been increasingly subject to a wide variety of security incidents, cyber-attacks and other attempts to gain unauthorized access. These threats can come from a variety of sources, ranging in sophistication from an individual hacker to a state-sponsored attack. Cyber threats may be generic, or they may be custom-crafted against our information systems. Over the past year, cyber-attacks have become more prevalent and much harder to detect and defend against. Our network and storage applications may be subject to unauthorized access by hackers or breached due to operator error, malfeasance or other system disruptions. It is often difficult to anticipate or immediately detect such incidents and the damage caused by such incidents. These data breaches and any unauthorized access or disclosure of our information or intellectual property could result in the loss of information, litigation, indemnity obligations and other liability. While we have security measures in place, our systems and networks are subject to ongoing threats and therefore these security measures may be breached as a result of third-party action, including cyber-attacks or other intentional misconduct by computer hackers, employee error, malfeasance or otherwise. This could result in one or more third parties obtaining unauthorized access to our customers’ data or our data, including intellectual property and other confidential business information. Because techniques used to obtain unauthorized access or to sabotage systems change frequently and generally are not recognized until launched against a target, we may be unable to anticipate these techniques or to implement adequate preventative measures. Third parties may also attempt to fraudulently induce employees or customers into disclosing sensitive information such as user names, passwords or other information in order to gain access to our customers’ data or our data, including intellectual property and other confidential business information. If an actual or perceived breach of our security occurs, the market perception of the effectiveness of our security measures could be harmed, we could lose potential sales and existing customers or we could incur other liabilities, which could adversely affect our business.
Our growth depends in part on the success of our strategic relationships with third parties.
Our future growth will depend on our ability to enter into and retain successful strategic relationships with third parties. For example, we are seeking to establish relationships with third parties to develop integrations with complementary technology and content. These relationships may not result in additional customers or enable us to generate significant revenues. Identifying partners and negotiating and documenting relationships with them require significant time and resources. Our contracts for these relationships are typically non-exclusive and do not prohibit the other party from working with our competitors or from offering competing services. If we are unsuccessful in establishing or maintaining our relationships with these third parties, our ability to compete in the marketplace or to grow our revenues could be impaired and our operating results would suffer.
As a result of our customers’ usage of our software platform, we will need to continually improve our hosting infrastructure to avoid service interruptions or slower system performance.
We have experienced growth in the number of transactions and data that our hosting infrastructure supports. We seek to maintain sufficient excess capacity in our infrastructure to meet the needs of all of our customers. We also seek to maintain excess
14
capacity to facilitate the rapid provision of new customer deployments and the expansion of existing customer deployments. For example, if we secure a large customer or a group of customers that require significant amounts of bandwidth or storage, we may need to increase bandwidth, storage, power or other elements of our application architecture and our infrastructure, and our existing systems may not be able to scale in a manner satisfactory to our existing or prospective customers.
The amount of infrastructure needed to support our customers is based on our estimates of anticipated usage. If we were to experience unforeseen increases in usage, we could be required to increase our infrastructure investments resulting in increased costs or reduced gross margins, and if we do not accurately predict our infrastructure capacity requirements, our customers could experience service outages that may subject us to financial penalties and liabilities and result in customer losses. If our hosting infrastructure capacity fails to keep pace with increased sales, customers may experience service interruptions or slower system performance as we seek to obtain additional capacity, which could harm our reputation and adversely affect our revenue growth. As use of our software platform grows and as customers use it for more complicated tasks, we will need to devote additional resources to improving our application architecture and our infrastructure in order to maintain the performance of our software platform. We may need to incur additional costs to upgrade or expand our computer systems and architecture in order to accommodate increased demand if our systems cannot handle current or higher volumes of usage. In addition, increasing our systems and infrastructure in advance of new customers would cause us to have increased cost of revenues, which can adversely affect our gross margins until we increase revenues that are spread over the increased costs.
Any failure to protect our intellectual property rights could impair our ability to protect our proprietary technology and our brand.
Our success and ability to compete depends in part upon our intellectual property. We primarily rely on a combination of copyright, trade secret and trademark laws, as well as confidentiality procedures and contractual restrictions with our employees, customers, partners and others to establish and protect our intellectual property rights. However, the steps we take to protect our intellectual property rights may be inadequate or we may be unable to secure intellectual property protection for all of our solutions. In particular, we have three issued U.S. patents.
If we are unable to protect our intellectual property, our competitors could use our intellectual property to market products and services similar to ours and our ability to compete effectively would be impaired. Moreover, others may independently develop technologies that are competitive to ours or infringe our intellectual property. The enforcement of our intellectual property rights depends on our legal actions against these infringers being successful, but we cannot be sure these actions will be successful, even when our rights have been infringed. In addition, defending our intellectual property rights might entail significant expense and diversion of management resources. Any of our intellectual property rights may be challenged by others or invalidated through administrative processes or litigation. Any patents issued in the future may not provide us with competitive advantages or may be successfully challenged by third parties.
Furthermore, legal standards relating to the validity, enforceability and scope of protection of intellectual property rights are uncertain. Effective protection of our intellectual property may not be available to us in every country in which our solutions are available. The laws of some foreign countries may not be as protective of intellectual property rights as those in the United States, and mechanisms for enforcement of intellectual property rights may be inadequate. Accordingly, despite our efforts, we may be unable to prevent third parties from infringing upon or misappropriating our intellectual property.
We might be required to spend significant resources to monitor and protect our intellectual property rights, and our efforts to enforce our intellectual property rights may be met with defenses, counterclaims and countersuits attacking the validity and enforceability of our intellectual property rights. Litigation to protect and enforce our intellectual property rights could be costly, time-consuming and distracting to management, whether or not it is resolved in our favor, and could ultimately result in the impairment or loss of portions of our intellectual property.
We could incur substantial costs as a result of any claim of infringement of another party’s intellectual property rights.
In recent years, there has been significant litigation in the United States involving patents and other intellectual property rights. Companies in the Internet and technology industries are increasingly bringing and becoming subject to suits alleging infringement of proprietary rights, particularly patent rights, and our competitors may hold patents or have pending patent applications, which could be related to our business. These risks have been amplified by the increase in third parties, which we refer to as non-practicing entities, whose sole primary business is to assert such claims. We have received in the past, and expect to receive in the future, notices that claim we or our customers using our solutions have misappropriated or misused other parties’ intellectual property rights. If we are sued by a third party that claims that our technology infringes its rights, the litigation could be expensive and could divert our management resources. We do not currently have an extensive patent portfolio of our own, which may limit the defenses available to us in any such litigation.
15
In addition, in most instances, we have agreed to indemnify our customers against certain claims that our subscription services infringe the intellectual property rights of third parties. Our business could be adversely affected by any significant disputes between us and our customers as to the applicability or scope of our indemnification obligations to them. The results of any intellectual property litigation to which we might become a party, or for which we are required to provide indemnification, may require us to do one or more of the following:
|
|
• |
cease offering or using technologies that incorporate the challenged intellectual property; |
|
|
• |
make substantial payments for legal fees, settlement payments or other costs or damages; |
|
|
• |
obtain a license, which may not be available on reasonable terms, to sell or use the relevant technology; or |
|
|
• |
redesign technology to avoid infringement. |
If we are required to make substantial payments or undertake any of the other actions noted above as a result of any intellectual property infringement claims against us or any obligation to indemnify our customers for such claims, such payments or costs could have a material adverse effect upon our business and financial results.
Our use of open source technology could impose limitations on our ability to commercialize our software platform.
We use open source software in our platform. Some open source software licenses require users who distribute open source software as part of their software to publicly disclose all or part of the source code to such software and/or make available any derivative works of the open source code on unfavorable terms or at no cost. The terms of various open source licenses have not been interpreted by the U.S. courts, and there is a risk that such licenses could be construed in a manner that imposes unanticipated conditions or restrictions on our ability to market our software platform. While we monitor our use of open source software and try to ensure that none is used in a manner that would require us to disclose our source code or that would otherwise breach the terms of an open source agreement, such use could inadvertently occur and we may be required to release our proprietary source code, pay damages for breach of contract, re-engineer our applications, discontinue sales in the event re-engineering cannot be accomplished on a timely basis or take other remedial action that may divert resources away from our development efforts, any of which could cause us to breach customer contracts, harm our reputation, result in customer losses or claims, increase our costs or otherwise adversely affect our business and operating results.
Because our long-term success depends, in part, on our ability to expand our sales to customers outside the United States, our business will be susceptible to risks associated with international operations.
We currently have personnel and customers in Australia, China, England, France, Germany, Ireland, Japan and Singapore, as well as the U.S. Due to our international exposure, our business is susceptible to risks associated with international operations. However, we have a limited operating history outside the United States, and our ability to manage our business and conduct our operations internationally requires considerable management attention and resources and is subject to particular challenges of supporting a rapidly growing business in an environment of diverse cultures, languages, customs, tax laws, legal systems, alternate dispute systems and regulatory systems. The risks and challenges associated with international expansion include:
|
|
• |
the need to support and integrate with local publishers and partners; |
|
|
• |
continued localization of our platform, including translation into foreign languages and associated expenses; |
|
|
• |
competition with companies that have greater experience in the local markets than we do or who have pre-existing relationships with potential customers in those markets; |
|
|
• |
compliance with multiple, potentially conflicting and changing governmental laws and regulations, including employment, tax, privacy and data protection laws and regulations; |
|
|
• |
compliance with anti-bribery laws, including compliance with the Foreign Corrupt Practices Act; |
|
|
• |
difficulties in invoicing and collecting in foreign currencies and associated foreign currency exposure; |
|
|
• |
difficulties in staffing and managing foreign operations and the increased travel, infrastructure and legal compliance costs associated with international operations; |
|
|
• |
different or lesser protection of our intellectual property rights; |
|
|
• |
difficulties in enforcing contracts and collecting accounts receivable, longer payment cycles and other collection difficulties; |
16
|
|
• |
regional economic and political conditions. |
We have limited experience in marketing, selling and supporting our subscription services internationally, which increases the risk that any potential future expansion efforts that we may undertake will not be successful.
Fluctuations in the exchange rate of foreign currencies could result in currency transactions losses.
We currently have foreign sales denominated in Australian Dollars, British Pound Sterling, Canadian Dollars, Chinese Yuan, Euros, Japanese Yen and Singapore Dollars. In addition, we incur a portion of our operating expenses in the currencies of the countries where we have offices. We face exposure to adverse movements in currency exchange rates, which may cause our revenues and operating results to differ materially from expectations. If the U.S. Dollar strengthens relative to foreign currencies as it did during 2015 and 2016, our non-U.S. revenues would be adversely affected. Conversely, a decline in the U.S. Dollar relative to foreign currencies would increase our non-U.S. revenues when translated into U.S. Dollars. Our operating results could be negatively impacted depending on the amount of expense denominated in foreign currencies. As exchange rates vary, revenues, cost of revenues, operating expenses and other operating results, when translated, may differ materially from expectations. In addition, our revenues and operating results are subject to fluctuation if our mix of U.S. and foreign currency-denominated transactions or expenses changes in the future because we do not currently hedge our foreign currency exposure. Even if we were to implement hedging strategies to mitigate foreign currency risk, these strategies might not eliminate our exposure to foreign exchange rate fluctuations and would involve costs and risks of their own, such as ongoing management time and expertise, external costs to implement the strategies and potential accounting implications.
Unfavorable conditions in the market for digital advertising or the global economy or reductions in digital advertising spend could limit our ability to grow our business and negatively affect our operating results.
Revenue growth and potential profitability of our business depends on digital advertising spend by advertisers in the markets we serve. Our operating results may vary based on changes in the market for digital advertising or the global economy. To the extent that weak economic conditions cause our customers and potential customers to freeze or reduce their advertising budgets, particularly digital advertising, demand for our solution may be negatively affected.
Historically, economic downturns have resulted in overall reductions in advertising spend. If economic conditions deteriorate or the rise of geopolitical instability and military hostilities causes economic uncertainty, our customers and potential customers may elect to decrease their advertising budgets or defer or reconsider software and service purchases, which would limit our ability to grow our business and negatively affect our operating results.
Our business depends on retaining and attracting qualified personnel, and turnover may result in operational inefficiencies that could negatively affect our business.
Our success depends upon the continued service of our talented management, operational and key technical employees, as well as our ability to continue to attract additional highly qualified talent. Turnover amongst our employees, including among our senior executives, which we have experienced recently, could result in operational and administrative inefficiencies and added costs, which could adversely impact our results of operations, stock price and customer relationships. In addition, we must successfully integrate any new personnel that we hire within our organization in order to achieve our operating objectives, and changes in other key positions may temporarily affect our financial performance and results of operations as new employees become familiar with our business.
We do not maintain key person life insurance policies on any of our employees. Each of our executive officers, key technical personnel and other employees could terminate his or her relationship with us at any time. Our business also requires skilled technical, sales and other personnel, who are in high demand and are often subject to competing offers. As we expand into additional geographic markets, we will require personnel with expertise in these new areas. Competition for qualified employees is intense in our industry and particularly in San Francisco, California. An inability to retain, attract, relocate and motivate employees required for our business, including the planned expansion of our business, could delay or prevent the achievement of our business objectives and could materially harm our business and our customer relationships.
17
Managing a global organization has placed, and may continue to place, significant demands on our management and infrastructure. If we fail to manage our operations effectively, we may be unable to execute our business plan, maintain high levels of service or address competitive challenges adequately.
Managing a global and geographically dispersed workforce and operation has required substantial management effort, the allocation of valuable management resources and significant additional investment in our infrastructure. We will be required to continue to improve our operational, financial and management controls and operations reporting procedures, and we may not be able to do so effectively. Moreover, we may from time to time decide to undertake cost savings initiatives, such as additional restructurings, such as our 2016 Restructuring Plan, disposing of, and/or otherwise discontinuing certain products, in an effort to focus our resources on key strategic initiatives and streamline our business. Further, supporting our customers and operations, and driving future growth, we must continually improve and maintain our technology, systems and network infrastructure. As such, we may be unable to manage our expenses effectively in the future, which may negatively impact our gross margins or operating expenses in any particular quarter. If we fail to manage our anticipated growth or change in a manner that does not preserve the key aspects of our corporate culture, the quality of our solutions may suffer, which could negatively affect our brand and reputation and harm our ability to retain and attract customers.
Domestic and foreign government regulation and enforcement of data practices and data tracking technologies is expansive, not clearly defined and rapidly evolving. Such regulation could directly restrict portions of our business or indirectly affect our business by constraining our customers’ use of our platform or limiting the growth of our markets.
Federal, state, municipal and/or foreign governments and agencies have adopted and could in the future adopt, modify, apply or enforce laws, policies, and regulations covering user privacy, data security, technologies such as cookies that are used to collect, store and/or process data, the taxation of products and services, unfair and deceptive practices, and/or the collection, use, processing, transfer, storage and/or disclosure of data associated with a unique individual. The categories of data regulated under these laws vary widely and are often ill-defined and subject to new applications or interpretation by regulators. Our subscription services enable our customers to display digital advertisements to targeted population segments, as well as collect, manage and store data regarding the measurement and valuation of their digital advertising and marketing campaigns, which may include data that is directly or indirectly obtained or derived through the activities of online or mobile visitors. The uncertainty and inconsistency among these laws, coupled with a lack of guidance as to how these laws will be applied to current and emerging Internet and mobile analytics technologies, creates a risk that regulators, lawmakers or other third parties, such as potential plaintiffs, may assert claims, pursue investigations or audits, or engage in civil or criminal enforcement. These actions could limit the market for our subscription services or impose burdensome requirements on our services and/or customers’ use of our services, thereby rendering our business unprofitable.
Some features of our subscription services use cookies, which trigger the data protection requirements of certain foreign jurisdictions, such as the EU Cookie Directive and the EU Data Privacy Directive. In addition, our services collect data about visitors’ interactions with our advertiser clients that may be subject to regulation under current or future laws or regulations. If our privacy or data security measures fail to comply with these current or future laws and regulations in any of the jurisdictions in which we collect information, we may be subject to litigation, regulatory investigations, civil or criminal enforcement, audits or other liabilities in such jurisdictions, or our advertisers may terminate their relationships with us. In addition, foreign court judgments or regulatory actions could impact our ability to transfer, process and/or receive transnational data that is critical to our operations, including data relating to users, clients, or partners outside the United States. Such judgments or actions could affect the manner in which we provide our services or adversely affect our financial results if foreign clients and partners are not able to lawfully transfer data to us.
This area of the law is currently under intense government scrutiny and many governments, including the U.S. government, are considering a variety of proposed regulations that would restrict or impact the conditions under which data obtained from or through the activities of visitors could be collected, processed or stored. In addition, regulators such as the Federal Trade Commission and the California Attorney General are continually proposing new regulations and interpreting and applying existing regulations in new ways. Changes to existing laws or new laws regulating the solicitation, collection or processing of personal and consumer information, truth-in-advertising and consumer protection could affect our customers’ utilization of digital advertising and marketing, potentially reducing demand for our subscription services, or impose restrictions that make it more difficult or expensive for us to provide our services.
If legislation dampens the growth in web and mobile usage or access to the Internet, our results of operations could be harmed.
Legislation enacted in the future could dampen the growth in web and mobile usage and decrease its acceptance as a medium of communications and commerce or result in increased adoption of new modes of communication and commerce that may not be serviced by our products. In addition, government agencies or private organizations may begin to impose taxes, fees or other charges for accessing the Internet, which could result in slower growth or a decrease in ecommerce, use of social media and/or use of mobile devices. Any of these outcomes could cause demand for our platform to decrease, our costs to increase, and our results of operations and financial condition to be harmed.
18
If our customers fail to abide by applicable privacy laws or to provide adequate notice and/or obtain consent from end users, we could be subject to litigation or enforcement action or reduced demand for our services. Industry self-regulatory standards may be implemented in the future that could affect demand for our platform and our ability to access data we use to provide our platform.
Our customers utilize our services to support and measure their direct interactions with visitors, and although we provide notice and choice mechanisms on our websites for our subscription services, we also must rely on our customers to implement and administer notice and choice mechanisms required under applicable laws. If we or our customers fail to abide by these laws, it could result in litigation or regulatory or enforcement action against our customers or against us directly.
In addition, self-regulatory organizations (such as the Digital Advertising Network or Network Advertising Initiative) to which our customers, partners and suppliers may belong, may impose opt-in or opt-out requirements on our customers, which may in the future require our customers to provide various mechanisms for users to opt-in or opt-out of the collection of any data, including anonymous data, with respect to such users’ web or mobile activities. The online and/or mobile industries may adopt technical or industry standards, or federal, state, local or foreign laws may be enacted that allow users to opt-in or opt-out of data that is necessary to our business. In particular, some government regulators and standard-setting organizations have suggested a “Do Not Track” standard that allows users to express a preference, independent of cookie settings in their browser, not to have website browsing recorded. All the major Internet browsers have implemented some version of a “Do Not Track” setting. Furthermore, publishers may implement alternative tracking technologies that make it more difficult to access the data necessary to our business or make it more difficult for us to compete with the publisher’s own advertising management solutions. If any of these events were to occur in the future, it could have a material effect on our ability to provide services and for our customers to collect the data that is necessary to use our services.
Our revenues may be adversely affected if we are required to charge sales taxes in additional jurisdictions or other taxes for our solutions.
We collect or have imposed upon us sales or other taxes related to the solutions we sell in certain states and other jurisdictions. Additional states, countries or other jurisdictions may seek to impose sales or other tax collection obligations on us in the future, or states or jurisdictions in which we already pay tax may increase the amount of taxes we are required to pay. A successful assertion by any state, country or other jurisdiction in which we do business that we should be collecting sales or other taxes on the sale of our products and services could, among other things, create significant administrative burdens for us, result in substantial tax liabilities for past sales, discourage clients from purchasing solutions from us or otherwise substantially harm our business and results of operations.
We may experience quarterly fluctuations in our operating results due to a number of factors which make our future results difficult to predict and could cause our operating results to fall below expectations or our guidance.
Our quarterly operating results may fluctuate due to a variety of factors, many of which are outside of our control. As a result, comparing our operating results on a period-to-period basis may not be meaningful. You should not rely on our past results as indicative of our future performance. If our revenues or operating results fall below the expectations of investors or securities analysts, or below any guidance we may provide to the market, the price of our common stock could decline substantially.
In addition to other risk factors listed in this section, factors that may affect our quarterly operating results include the following:
|
|
• |
the level of advertising spend managed through our platform for a particular quarter; |
|
|
• |
customer renewal rates, and the pricing and usage of our platform in any renewal term; |
|
|
• |
demand for our platform and the size and timing of our sales; |
|
|
• |
customers delaying purchasing decisions in anticipation of new releases by us or of new products by our competitors; |
|
|
• |
delays in projects to upgrade our own software platform infrastructure and any resulting delays in releasing new features; |
|
|
• |
network outages, platform downtime, software bugs or security breaches and any associated credits, warranty claims or other expenses; |
|
|
• |
changes in the competitive dynamics of our industry, including consolidation among competitors or customers; |
|
|
• |
market acceptance of our current and future solutions; |
|
|
• |
changes in spending on digital advertising or information technology and software by our current and/or prospective customers; |
|
|
• |
budgeting cycles of our customers; |
|
|
• |
our potentially lengthy sales cycle; |
19
|
|
• |
the amount and timing of infrastructure costs and operating expenses related to the maintenance and expansion of our business, operations and infrastructure; |
|
|
• |
hiring or separation of employees; |
|
|
• |
foreign currency exchange rate fluctuations; and |
|
|
• |
general economic and political conditions in our domestic and international markets. |
Based upon all of the factors described above, we have a limited ability to forecast our future revenues, costs and expenses, and as a result, our operating results may from time to time fall below our estimates or the expectations of public market analysts and investors.
We might require additional capital to support business growth, and this capital might not be available on acceptable terms, if at all.
We intend to continue to make investments to support our business growth and may require additional funds to respond to business challenges, including the need to develop new features or enhance our existing platform, improve our operating infrastructure or acquire complementary businesses and technologies. Accordingly, we may need to engage in equity or debt financings to secure additional funds. If we raise additional funds through further issuances of equity or convertible debt securities, our existing stockholders could suffer significant dilution, and any new equity securities we issue could have rights, preferences and privileges superior to those of holders of our common stock. Any debt financing secured by us in the future could involve restrictive covenants relating to our capital raising activities and other financial and operational matters, which may make it more difficult for us to obtain additional capital and to pursue business opportunities, including potential acquisitions. In addition, we may not be able to obtain additional financing on terms favorable to us, if at all. If we are unable to obtain adequate financing or financing on terms satisfactory to us, when we require it, our ability to continue to support our business growth and to respond to business challenges could be significantly impaired.
Future acquisitions, strategic investments, partnerships or alliances could be difficult to integrate, divert the attention of key management personnel, disrupt our business, dilute shareholder value and adversely affect our results of operations and financial condition.
We acquired SocialMoov S.A.S. (“SocialMoov”) in February 2015, and NowSpots, Inc., doing business as Perfect Audience (“Perfect Audience”) in June 2014 and may seek to acquire additional businesses, products or technologies in the future. However, these are the only two acquisitions in the history of our company and we have limited experience in acquiring and integrating businesses, products and technologies. If we identify an appropriate acquisition candidate, we may not be successful in negotiating the terms and/or financing of the acquisition, and our due diligence may fail to identify all of the problems, liabilities or other shortcomings or challenges of an acquired business, product or technology, including issues related to intellectual property, product quality or architecture, regulatory compliance practices, revenue recognition or other accounting practices or employee or client issues.
Any acquisition or investment may require us to use significant amounts of cash, issue potentially dilutive equity securities or incur debt. In addition, acquisitions, including our acquisitions of SocialMoov and Perfect Audience, involve numerous risks, any of which could harm our business, including:
|
|
• |
regulatory and commercial risks relating to retargeting of online advertising and social advertising, the primary businesses of Perfect Audience and SocialMoov, respectively; |
|
|
• |
difficulties in integrating the operations, technologies, services and personnel of acquired businesses, especially if those businesses operate outside of our core competency and/or in foreign countries; |
|
|
• |
cultural challenges associated with integrating employees from the acquired company into our organization; |
|
|
• |
reputation and perception risks associated with the acquired product or technology by the general public; |
|
|
• |
ineffectiveness or incompatibility of acquired technologies or services; |
|
|
• |
potential loss of key employees of acquired businesses; |
|
|
• |
inability to maintain the key business relationships and the reputations of acquired businesses; |
|
|
• |
diversion of management’s attention from other business concerns; |
20
|
|
• |
litigation for activities of the acquired company, including claims from terminated employees, clients, former shareholders or other third parties; |
|
|
• |
failure to identify all of the problems, liabilities or other shortcomings or challenges of an acquired company, technology, or solution, including issues related to intellectual property, solution quality or architecture, regulatory compliance practices, revenue recognition or other accounting practices or employee or client issues; |
|
|
• |
in the case of foreign acquisitions such as SocialMoov, the need to integrate operations across different cultures and languages and to address the particular economic, currency, political and regulatory risks associated with specific countries; costs necessary to establish and maintain effective internal controls for acquired businesses; |
|
|
• |
failure to successfully further develop the acquired technology in order to recoup our investment; and |
|
|
• |
increased fixed costs. |
If we are unable to successfully integrate any future business, product or technology we acquire, our business and results of operations may suffer. In addition, a significant portion of the purchase price of companies we acquire may be allocated to acquired goodwill and other intangible assets, which must be assessed for impairment at least annually. If our acquisitions do not yield expected returns, we may be required to take charges to our operating results based on this impairment assessment process, which could adversely affect our results of operations.
Acquisitions could also result in dilutive issuances of equity securities or the incurrence of debt, which could adversely affect our operating results. For instance, in connection with our acquisition of Perfect Audience, we issued 1.7 million shares of our common stock, and in connection with our acquisition of SocialMoov, we issued an aggregate total of 1.6 million shares of our common stock in each of February 2015, February 2016 and February 2017.
If we are unable to implement and maintain effective internal control over financial reporting in the future, investors may lose confidence in the accuracy and completeness of our financial reports and the market price of our common stock may be negatively affected.
As a public company, we are required to maintain internal control over financial reporting and to report any material weaknesses in such internal control. Section 404 of the Sarbanes-Oxley Act of 2002 (the “Sarbanes-Oxley Act”) requires that we evaluate and determine the effectiveness of our internal control over financial reporting and provide a management report on the internal control over financial reporting and a report by our independent registered public accounting firm to the extent we decide not to avail ourselves of the exemption provided to an emerging growth company, as defined by The Jumpstart Our Business Act of 2012. If we have a material weakness in our internal control over financial reporting, we may not detect errors on a timely basis and our financial statements may be materially misstated. In addition, in the future if we identify material weaknesses in our internal control over financial reporting, if we are unable to comply with the requirements of Section 404 in a timely manner, if we are unable to assert that our internal control over financial reporting is effective or if our independent registered public accounting firm is unable to express an opinion as to the effectiveness of our internal control over financial reporting, investors may lose confidence in the accuracy and completeness of our financial reports and the market price of our common stock could be negatively affected, and we could become subject to investigations by the stock exchange on which our securities are listed, the SEC, or other regulatory authorities, which could require additional financial and management resources.
We are both a smaller reporting company and an emerging growth company, and we cannot be certain if the reduced disclosure requirements applicable to smaller reporting companies and emerging growth companies will make our common stock less attractive to investors.
For as long as we continue to be both a smaller reporting company and an emerging growth company, we intend to take advantage of certain exemptions from various reporting requirements that are applicable to other public companies including, but not limited to, the exemption from the requirement of a report on our internal control over financial reporting by our independent registered public accounting firm, reduced disclosure obligations regarding executive compensation in our periodic reports and proxy statements, and exemptions from the requirements of holding a nonbinding advisory vote on executive compensation and stockholder approval of any golden parachute payments not previously approved. We cannot predict if investors will find our common stock less attractive because we will rely on these exemptions. If some investors find our common stock less attractive as a result, there may be a less active trading market for our common stock and our stock price may be more volatile.
We will remain an emerging growth company until the earliest of (i) the end of the fiscal year in which the market value of our common stock that is held by non-affiliates exceeds $700 million as of June 30, (ii) the end of the fiscal year in which we have total annual gross revenues of $1 billion or more during such fiscal year, (iii) the date on which we issue more than $1 billion in non-convertible debt in a three-year period or (iv) March 21, 2018.
21
Even if we exit emerging growth company status, many of the exemptions available for emerging growth companies are also available to smaller reporting companies like us that have less than $75 million of worldwide common equity held by non-affiliates. In the event that we are still considered a smaller reporting company, at such time we cease being an emerging growth company, the disclosure we will be required to provide in our SEC filings will increase, but will still be less than it would be if we were not considered either an emerging growth company or a smaller reporting company. Specifically, similar to emerging growth companies, smaller reporting companies are able to provide simplified executive compensation disclosures in their filings; are exempt from the provisions of Section 404(b) of the Sarbanes-Oxley Act requiring that independent registered public accounting firms provide an attestation report on the effectiveness of internal control over financial reporting; and have certain other decreased disclosure obligations in their SEC filings, including, among other things, only being required to provide two years of audited financial statements in annual reports. Decreased disclosures in our SEC filings due to our status as an emerging growth company or smaller reporting company may make it harder for investors to analyze our results of operations and financial prospects.
We may not be able to utilize a significant portion of our net operating loss or research tax credit carryforwards, which could adversely affect our profitability.
As of December 31, 2016, we had federal and state net operating loss carryforwards due to prior period losses, which if not utilized will begin to expire in 2027 and 2017 for federal and state purposes, respectively. We also have federal research tax credit carryforwards, which if not utilized will begin to expire in 2026. These net operating loss and research tax credit carryforwards could expire unused and be unavailable to offset future income tax liabilities, which could adversely affect our profitability.
In addition, under Section 382 of the Internal Revenue Code of 1986, as amended (the “Code”), our ability to utilize net operating loss carryforwards or other tax attributes, such as research tax credits, in any taxable year may be limited if we experience an “ownership change.” A Section 382 “ownership change” generally occurs if one or more stockholders or groups of stockholders who own at least 5% of our stock increase their ownership by more than 50 percentage points over their lowest ownership percentage within a rolling three-year period. Similar rules may apply under state tax laws.
Future issuances of our stock could cause an “ownership change.” It is possible that any future ownership change could have a material effect on the use of our net operating loss carryforwards or other tax attributes, which could adversely affect our profitability.
Our reported financial results may be adversely affected by changes in accounting principles generally accepted in the United States.
Generally accepted accounting principles in the United States are subject to interpretation by the Financial Accounting Standards Board (“FASB”), the SEC, and various bodies formed to promulgate and interpret appropriate accounting principles. A change in these principles or interpretations could have a significant effect on our reported financial results, and could affect the reporting of transactions completed before the announcement of a change.
We may be required to record a significant charge to earnings if our goodwill or amortizable intangible assets become impaired.
We are required under GAAP to review our amortizable intangible assets for impairment when events or changes in circumstances indicate the carrying value may not be recoverable. Goodwill is required to be tested for impairment at least annually. Conditions that would necessitate an impairment assessment include a significant decline in the observable market value of an asset, a significant change in the extent or manner in which an asset is used, or any other significant adverse change that would indicate that the carrying amount of an asset or group of assets may not be recoverable. The events and circumstances we consider include the business climate, legal factors, operating performance indicators and competition. In the future we may be required to record a significant charge to earnings in our consolidated financial statements during the period in which any impairment of our goodwill or amortizable intangible assets is determined. This could adversely impact our results of operations and harm our business.
During the fourth quarter of 2016, the market capitalization of our publicly traded common stock sustained a decline to the extent that it fell below the book value of our net assets for a period of time before subsequently increasing and rising back above the book value of the net assets. Management considered the possible factors affecting the assessment of the fair value of our reporting unit for the purposes performing the goodwill impairment assessment, including those listed above. Ultimately, no goodwill impairment was identified in any of the years presented. If facts, circumstances or assumptions change in the future, however, we may be required to record an impairment charge to reduce the carrying value of our goodwill, intangible assets and other long-term assets.
22
Risks Related to the Ownership of Our Common Stock
The trading prices of the securities of technology companies have been highly volatile. Accordingly, the market price of our common stock has been, and is likely to continue to be, subject to wide fluctuations and could subject us to litigation.
Since our initial public offering, the closing sales price of our common stock on the New York Stock Exchange has been volatile. Factors affecting the market price of our common stock include:
|
|
• |
variations in, or forward looking guidance regarding, our revenues, gross margin, operating results, free cash flow, loss per share, revenue retention rates, annualized advertising spend on our platform, adjusted EBITDA and how these results compare to analyst expectations; |
|
|
• |
announcements of technological innovations, new products or services, strategic alliances, acquisitions or significant agreements by us or by our competitors; |
|
|
• |
disruptions in our cloud-based operations or services or disruptions of other prominent cloud-based operations or services; |
|
|
• |
the economy as a whole, market conditions in our industry, and the industries of our customers; and |
|
|
• |
any other factors discussed herein. |
In addition, the stock market in general has experienced substantial price and volume volatility that is often seemingly unrelated to the operating results of any particular companies. Moreover, if the market for technology stocks, especially software and cloud computing-related stocks, or the stock market in general experiences uneven investor confidence, the market price of our common stock could decline for reasons unrelated to our business, operating results or financial condition. The market price for our stock might also decline in reaction to events that affect other companies within, or outside, our industry, even if these events do not directly affect us. Some companies that have experienced volatility in the trading price of their stock have been subject of securities litigation. If we are the subject of such litigation, it could result in substantial costs and a diversion of management’s attention and resources.
From January 1, 2015 through December 31, 2016, the closing sales price of our common stock on the New York Stock Exchange ranged from $2.10 to $8.56 per share, and had a low closing price of $2.20 per share during the period from January 1, 2017 through February 24, 2017. Because our stock price has been volatile, investing in our common stock is risky.
We do not intend to pay dividends for the foreseeable future.
We have never declared nor paid cash dividends on our capital stock. We currently intend to retain any future earnings to finance the operation and expansion of our business, and we do not expect to declare or pay any dividends in the foreseeable future. Consequently, stockholders must rely on sales of their common stock after price appreciation, which may never occur, as the only way to realize any future gains on their investment.
If there are substantial sales of shares of our common stock, the price of our common stock could decline.
Sales of a substantial number of shares of our common stock in the public market, or the perception that these sales might occur could depress the market price of our common stock and may make it more difficult for you to sell your common stock at a time and price that you deem appropriate. We are unable to predict the effect that sales may have on the prevailing market price of our common stock. We have currently effective Registration Statements on Form S-3 registering for sale approximately 1.6 million and 1.7 million shares of our common stock issued or to be issued in connection with our acquisitions of SocialMoov and Perfect Audience, respectively. If the holders of these shares seek to sell their holdings, particularly in significant amounts in compressed time frames, the trading price of our common stock could be adversely impacted. After our initial public offering in March 2013, the holders of an aggregate of 18.8 million shares of our common stock had rights, subject to some conditions, to require us to file registration statements covering their shares or to include their shares in registration statements that we may file for ourselves or our stockholders. To the extent the holders of such shares have not sold the shares otherwise, such holders may continue to have registration rights. Registration of these shares under the Securities Act would result in the shares becoming freely tradable without restriction under the Securities Act. Any sales of securities by existing stockholders could adversely affect the trading price of our common stock.
Delaware law and provisions in our restated certificate of incorporation and restated bylaws could make a merger, tender offer, or proxy contest difficult, thereby depressing the trading price of our common stock.
Our status as a Delaware corporation and the anti-takeover provisions of the Delaware General Corporation Law may discourage, delay, or prevent a change in control by prohibiting us from engaging in a business combination with an interested stockholder for a period of three years after the person becomes an interested stockholder, even if a change of control would be
23
beneficial to our existing stockholders. In addition, our restated certificate of incorporation and restated bylaws contain provisions that may make the acquisition of our Company more difficult, including the following:
|
|
• |
our board of directors are classified into three classes of directors with staggered three-year terms and directors can only be removed from office for cause; |
|
|
• |
only our board of directors has the right to fill a vacancy created by the expansion of our board of directors or the resignation, death or removal of a director, which prevents stockholders from being able to fill vacancies on our board of directors; |
|
|
• |
only our chairman of the board, our lead independent director, our chief executive officer, our president, or a majority of our board of directors is authorized to call a special meeting of stockholders; |
|
|
• |
certain litigation against us can only be brought in Delaware; |
|
|
• |
our restated certificate of incorporation authorizes undesignated preferred stock, the terms of which may be established, and shares of which may be issued, without the approval of the holders of common stock; and |
|
|
• |
advance notice procedures apply for stockholders to nominate candidates for election as directors or to bring matters before an annual meeting of stockholders. |
If securities or industry analysts do not publish research or publish inaccurate or unfavorable research about our business, our stock price and trading volume could decline.
The trading market for our common stock depends in part on the research and reports that securities or industry analysts publish about us or our business. If one or more of the analysts who cover us downgrade our common stock or publish inaccurate or unfavorable research about our business, our common stock price would likely decline. If one or more of these analysts cease coverage of us or fail to publish reports on us regularly, demand for our common stock could decrease, which might cause our common stock price and trading volume to decline.
24
None.
Our corporate headquarters are located in San Francisco, California, where we occupy facilities totaling approximately 43,000 square feet under a lease which expires in July 2022. We use these facilities for administration, sales and marketing, research and development, engineering, customer support and professional services. In December 2015, we entered into an agreement to sublease approximately 14,300 square feet of this property to an unrelated third party, through December 2017.
We also lease office space in Austin, Chicago and New York in the United States, and Australia, England, France, Germany, Ireland, and Japan, which we use principally for sales and marketing, administration, customer support and to deliver professional services locally. We also lease office space in Portland, Oregon and Shanghai, China, which we use principally for engineering. We operate two data centers at third-party facilities located in the United States and Ireland.
We believe our facilities are in good condition and adequate for our current needs and for the foreseeable future. See Note 16 to the consolidated financial statements and “Management’s Discussion and Analysis of Financial Condition and Results of Operations – Contractual Obligations and Commitments” for information regarding our lease obligations.
From time to time, we may become involved in legal proceedings arising in the ordinary course of our business. We are not presently a party to any legal proceedings that, if determined adversely to us, would individually or taken together have a material adverse effect on our business, operating results, financial condition or cash flows.
Not applicable.
25
|
ITEM 5. |
MARKET FOR REGISTRANT’S COMMON EQUITY, RELATED STOCKHOLDER MATTERS AND ISSUER PURCHASES OF EQUITY SECURITIES |
Market Price of Our Common Stock
Our common stock has traded on the New York Stock Exchange (“NYSE”) since March 22, 2013, under the symbol MRIN. Prior to this date, there was no public market for our common stock. The following tables set forth, for the periods indicated, the high and low sales price of our common shares as reported by the NYSE.
|
|
|
High |
|
|
Low |
|
||
|
Year Ended December 31, 2016 |
|
|
|
|
|
|
|
|
|
First Quarter |
|
$ |
3.61 |
|
|
$ |
2.70 |
|
|
Second Quarter |
|
$ |
3.13 |
|
|
$ |
2.10 |
|
|
Third Quarter |
|
$ |
2.81 |
|
|
$ |
2.32 |
|
|
Fourth Quarter |
|
$ |
2.50 |
|
|
$ |
2.20 |
|
|
|
|
High |
|
|
Low |
|
||
|
Year Ended December 31, 2015 |
|
|
|
|
|
|
|
|
|
First Quarter |
|
$ |
8.56 |
|
|
$ |
5.94 |
|
|
Second Quarter |
|
$ |
7.58 |
|
|
$ |
5.47 |
|
|
Third Quarter |
|
$ |
6.76 |
|
|
$ |
3.11 |
|
|
Fourth Quarter |
|
$ |
4.04 |
|
|
$ |
3.15 |
|
Holders of our Common Stock
As of February 24, 2017, there were 83 stockholders of record. The actual number of stockholders is greater than the number of record holders, and includes stockholders who are beneficial owners, but whose shares are held in street name by brokers and other nominees. The number of holders of record also does not include stockholders whose shares may be held in trust by other entities.
Dividend Policy
We have never declared or paid any cash dividends on our common stock. We currently intend to retain any future earnings and do not expect to pay any cash dividends on our common stock for the foreseeable future. Any determination to pay dividends in the future will be at the discretion of our board of directors and will be dependent on a number of factors, including our earnings, capital requirements and overall financial conditions.
Securities Authorized for Issuance under Equity Compensation Plans
The information required by this item will be set forth under the heading “Equity Compensation Plan Information” in the definitive Proxy Statement for our 2017 Annual Meeting of Stockholders (the “Proxy Statement” is incorporated into this report by reference).
Unregistered Sales of Equity Securities
We made no sales of unregistered securities during the quarter ended December 31, 2016.
Use of Proceeds from Public Offering of Common Stock
There have been no material changes in our use of the proceeds from our initial public offering in March 2013.
Recent Issuer Purchases of Equity Securities
We made no purchases of equity securities during the quarter ended December 31, 2016.
26
The following shall not be deemed “filed” for purposes of Section 18 of the Securities and Exchange Act of 1934, as amended (the “Exchange Act”), or incorporated by reference into any of our other filings under the Exchange Act or the Securities Act of 1933, as amended, except to the extent we specifically incorporate it by reference into such filing.
The following graph shows a comparison from March 22, 2013 (the date our common stock commenced trading on the NYSE) through December 31, 2016, of the cumulative total return for our common stock, the NYSE Composite Index, and the S&P 1500 Data Processing & Outsourced Services Index. The graph assumes an investment of $100 on March 22, 2013 and reinvestment of any dividends. The comparisons in the graph below are required by the Securities and Exchange Commission and are not intended to forecast or be indicative of possible future performance of our common shares.
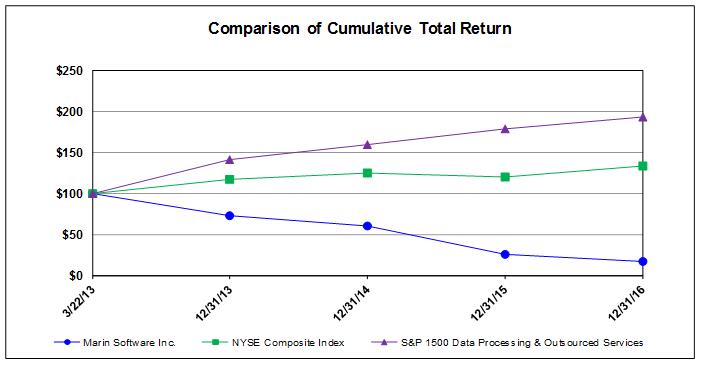
|
Company / Index |
|
3/22/13 |
|
|
12/31/13 |
|
|
12/31/14 |
|
|
12/31/15 |
|
|
12/31/16 |
|
|||||
|
Marin Software Incorporated |
|
$ |
100 |
|
|
$ |
73.14 |
|
|
$ |
60.43 |
|
|
$ |
25.57 |
|
|
$ |
16.79 |
|
|
NYSE Composite Index |
|
|
100 |
|
|
|
116.92 |
|
|
|
124.81 |
|
|
|
119.71 |
|
|
|
134.00 |
|
|
S&P 1500 Data Processing & Outsourced Services |
|
|
100 |
|
|
|
141.48 |
|
|
|
159.17 |
|
|
|
178.98 |
|
|
|
192.89 |
|
27
The following tables present selected historical financial data for our business. You should read this information together with “Management’s Discussion and Analysis of Financial Condition and Results of Operations” and the consolidated financial statements, related notes and other financial information included elsewhere in this Annual Report on Form 10-K. The selected consolidated financial data in this section are not intended to replace the consolidated financial statements and are qualified in their entirety by the consolidated financial statements and related notes included elsewhere in this Annual Report on Form 10-K.
We derived the consolidated statements of operations data for the years ended December 31, 2016, 2015 and 2014, and the consolidated balance sheet data as of December 31, 2016 and 2015 from our audited consolidated financial statements included elsewhere in this report. We derived the consolidated statements of operations data for the years ended December 31, 2013 and 2012 and the consolidated balance sheet data as of December 31, 2014, 2013 and 2012 from our audited financial statements not included in this report. Our historical results are not necessarily indicative of the results to be expected in the future. The selected consolidated financial data includes the impact of our acquisitions.
|
|
|
Years Ended December 31, |
|
|||||||||||||||||
|
|
|
2016 |
|
|
2015 |
|
|
2014 |
|
|
2013 |
|
|
2012 |
|
|||||
|
|
|
(in thousands, except per share data) |
|
|||||||||||||||||
|
Revenues, net |
|
$ |
99,878 |
|
|
$ |
108,530 |
|
|
$ |
99,354 |
|
|
$ |
77,315 |
|
|
$ |
59,558 |
|
|
Cost of revenues (1) (2) (3) |
|
|
35,203 |
|
|
|
40,137 |
|
|
|
35,614 |
|
|
|
31,109 |
|
|
|
24,764 |
|
|
Gross profit |
|
|
64,675 |
|
|
|
68,393 |
|
|
|
63,740 |
|
|
|
46,206 |
|
|
|
34,794 |
|
|
Operating expenses |
|
|
|
|
|
|
|
|
|
|
|
|
|
|
|
|
|
|
|
|
|
Sales and marketing (1) (2) (3) |
|
|
32,889 |
|
|
|
45,132 |
|
|
|
47,716 |
|
|
|
42,799 |
|
|
|
32,633 |
|
|
Research and development (1) (2) (3) |
|
|
27,841 |
|
|
|
33,318 |
|
|
|
28,751 |
|
|
|
20,715 |
|
|
|
14,014 |
|
|
General and administrative (1) (2) (3) |
|
|
19,890 |
|
|
|
22,391 |
|
|
|
21,257 |
|
|
|
17,028 |
|
|
|
13,432 |
|
|
Total operating expenses |
|
|
80,620 |
|
|
|
100,841 |
|
|
|
97,724 |
|
|
|
80,542 |
|
|
|
60,079 |
|
|
Loss from operations |
|
|
(15,945 |
) |
|
|
(32,448 |
) |
|
|
(33,984 |
) |
|
|
(34,336 |
) |
|
|
(25,285 |
) |
|
Interest expense, net |
|
|
(129 |
) |
|
|
(118 |
) |
|
|
(177 |
) |
|
|
(453 |
) |
|
|
(520 |
) |
|
Other income (expenses), net |
|
|
998 |
|
|
|
222 |
|
|
|
(466 |
) |
|
|
(571 |
) |
|
|
(456 |
) |
|
Loss before (provision for) benefit from income taxes |
|
|
(15,076 |
) |
|
|
(32,344 |
) |
|
|
(34,627 |
) |
|
|
(35,360 |
) |
|
|
(26,261 |
) |
|
(Provision for) benefit from income taxes |
|
|
(1,404 |
) |
|
|
(1,005 |
) |
|
|
1,456 |
|
|
|
(492 |
) |
|
|
(221 |
) |
|
Net loss available to common stockholders |
|
$ |
(16,480 |
) |
|
$ |
(33,349 |
) |
|
$ |
(33,171 |
) |
|
$ |
(35,852 |
) |
|
$ |
(26,482 |
) |
|
Net loss per share available to common stockholders, basic and diluted (4) |
|
$ |
(0.43 |
) |
|
$ |
(0.91 |
) |
|
$ |
(0.97 |
) |
|
$ |
(1.36 |
) |
|
$ |
(6.00 |
) |
|
Weighted-average shares used to compute net loss per share available to common stockholders, basic and diluted (4) |
|
|
38,318 |
|
|
|
36,580 |
|
|
|
34,210 |
|
|
|
26,312 |
|
|
|
4,417 |
|
|
(1) |
Stock-based compensation included in the consolidated statements of operations data above was allocated as follows: |
|
|
|
Years Ended December 31, |
|
|||||||||||||||||
|
|
|
2016 |
|
|
2015 |
|
|
2014 |
|
|
2013 |
|
|
2012 |
|
|||||
|
|
|
(in thousands) |
|
|||||||||||||||||
|
Cost of revenues |
|
$ |
1,314 |
|
|
$ |
1,171 |
|
|
$ |
765 |
|
|
$ |
887 |
|
|
$ |
439 |
|
|
Sales and marketing |
|
|
1,281 |
|
|
|
2,537 |
|
|
|
1,895 |
|
|
|
1,304 |
|
|
|
1,005 |
|
|
Research and development |
|
|
4,989 |
|
|
|
7,518 |
|
|
|
3,785 |
|
|
|
1,346 |
|
|
|
831 |
|
|
General and administrative |
|
|
2,711 |
|
|
|
4,393 |
|
|
|
2,797 |
|
|
|
1,681 |
|
|
|
2,673 |
|
|
|
|
$ |
10,295 |
|
|
$ |
15,619 |
|
|
$ |
9,242 |
|
|
$ |
5,218 |
|
|
$ |
4,948 |
|
|
(2) |
Amortization of intangible assets included in the consolidated statements of operations data above was allocated as follows: |
|
|
|
Years Ended December 31, |
|
|||||||||||||||||
|
|
|
2016 |
|
|
2015 |
|
|
2014 |
|
|
2013 |
|
|
2012 |
|
|||||
|
|
|
(in thousands) |
|
|||||||||||||||||
|
Cost of revenues |
|
$ |
1,027 |
|
|
$ |
1,033 |
|
|
$ |
399 |
|
|
$ |
— |
|
|
$ |
— |
|
|
Sales and marketing |
|
|
934 |
|
|
|
921 |
|
|
|
261 |
|
|
|
— |
|
|
|
— |
|
|
Research and development |
|
|
1,027 |
|
|
|
1,034 |
|
|
|
397 |
|
|
|
— |
|
|
|
— |
|
|
General and administrative |
|
|
92 |
|
|
|
146 |
|
|
|
74 |
|
|
|
— |
|
|
|
— |
|
|
|
|
$ |
3,080 |
|
|
$ |
3,134 |
|
|
$ |
1,131 |
|
|
$ |
— |
|
|
$ |
— |
|
28
|
(3) |
Restructuring related expenses included in the consolidated statements of operations data above was allocated as follows: |
|
|
|
Years Ended December 31, |
|
|||||||||||||||||
|
|
|
2016 |
|
|
2015 |
|
|
2014 |
|
|
2013 |
|
|
2012 |
|
|||||
|
|
|
(in thousands) |
|
|||||||||||||||||
|
Cost of revenues |
|
$ |
184 |
|
|
$ |
173 |
|
|
$ |
— |
|
|
$ |
— |
|
|
$ |
— |
|
|
Sales and marketing |
|
|
348 |
|
|
|
718 |
|
|
|
— |
|
|
|
— |
|
|
|
— |
|
|
Research and development |
|
|
44 |
|
|
|
53 |
|
|
|
— |
|
|
|
— |
|
|
|
— |
|
|
General and administrative |
|
|
20 |
|
|
|
270 |
|
|
|
— |
|
|
|
— |
|
|
|
— |
|
|
|
|
$ |
596 |
|
|
$ |
1,214 |
|
|
$ |
— |
|
|
$ |
— |
|
|
$ |
— |
|
|
(4) |
See Note 13 of the consolidated financial statements for an explanation of the calculations of basic and diluted net loss per share available to common stockholders. |
|
|
|
As of December 31, |
|
|||||||||||||||||
|
|
|
2016 |
|
|
2015 |
|
|
2014 |
|
|
2013 |
|
|
2012 |
|
|||||
|
|
|
(in thousands) |
|
|||||||||||||||||
|
Consolidated Balance Sheet Data |
|
|
|
|
|
|
|
|
|
|
|
|
|
|
|
|
|
|
|
|
|
Cash and cash equivalents |
|
$ |
34,420 |
|
|
$ |
37,326 |
|
|
$ |
68,253 |
|
|
$ |
104,407 |
|
|
$ |
31,540 |
|
|
Property and equipment, net |
|
|
20,581 |
|
|
|
21,817 |
|
|
|
16,274 |
|
|
|
14,417 |
|
|
|
9,224 |
|
|
Total assets |
|
|
107,093 |
|
|
|
116,192 |
|
|
|
128,307 |
|
|
|
137,377 |
|
|
|
57,224 |
|
|
Current portion of long-term debt |
|
|
1,015 |
|
|
|
1,384 |
|
|
|
2,587 |
|
|
|
3,253 |
|
|
|
1,572 |
|
|
Long-term debt, less current portion |
|
|
2,381 |
|
|
|
1,557 |
|
|
|
621 |
|
|
|
2,962 |
|
|
|
9,243 |
|
|
Convertible preferred stock, net of issuance costs |
|
|
— |
|
|
|
— |
|
|
|
— |
|
|
|
— |
|
|
|
105,710 |
|
|
Total stockholders’ equity (deficit) |
|
|
87,598 |
|
|
|
94,131 |
|
|
|
106,117 |
|
|
|
115,344 |
|
|
|
(72,706 |
) |
29
The following discussion and analysis of our financial condition, results of operations and cash flows should be read in conjunction with the consolidated financial statements and related notes thereto included elsewhere in this Annual Report on Form 10-K for the fiscal year ended December 31, 2016. This discussion contains forward-looking statements that involve risks and uncertainties. Our actual results could differ materially from those forward-looking statements below. Factors that could cause or contribute to those differences include, but are not limited to, those identified below and those discussed in the section entitled “Risk Factors” included elsewhere in this Annual Report on Form 10-K. This Annual Report on Form 10-K contains “forward-looking statements” within the meaning of Section 21E of the Securities Exchange Act of 1934, as amended, or the “Exchange Act”. These statements are often identified by the use of words such as “believe,” “may,” “potentially,” “will,” “estimate,” “continue,” “anticipate,” “intend,” “could,” “should,” “would,” “project,” “plan,” “predict,” “expect,” “seek” and similar expressions or variations. Such forward-looking statements are subject to risks, uncertainties and other factors that could cause actual results and the timing of certain events to differ materially from future results expressed or implied by such forward-looking statements. Factors that could cause or contribute to such differences include, but are not limited to, those identified herein, and those discussed in the section titled “Risk Factors”, set forth in Part I, Item 1A of this Annual Report on Form 10-K. Except as required by law, we disclaim any obligation to update any forward-looking statements to reflect events or circumstances after the date of such statements. References to “2016,” “2015” and “2014” refer to the year ended December 31, 2016, the year ended December 31, 2015 and the year ended December 31, 2014, respectively.
Overview
We provide a leading cross-channel advertising cloud platform that enables digital marketers to improve performance of their online advertising campaigns across devices, realize efficiencies and time savings, and make better business decisions. Our integrated platform is a software-as-a-service, or “SaaS,” analytics, workflow, and optimization solution for marketing professionals, allowing them to effectively manage their digital advertising spend across search, social and display channels. Our software solution is designed to help our customers:
|
|
• |
measure the effectiveness of their advertising campaigns through our proprietary reporting and analytics capabilities; |
|
|
• |
manage and execute campaigns through our intuitive user interface and underlying technology that streamlines and automates key functions, such as ad creation and bidding, across multiple publishers and channels; and |
|
|
• |
optimize campaigns across multiple publishers and channels based on market and business data to achieve desired revenue outcomes using our predictive bid management technology. |
In December 2016, our customers collectively managed billions of dollars in advertising spend on our platform globally across a wide range of industries. We market and sell our solutions to advertisers directly and through leading advertising agencies. For 2016, 2015 and 2014, our revenues were $99.9 million, $108.5 million and $99.4 million, respectively, representing period-over-period changes of (8)%, 9% and 29%, respectively. We incurred net losses of $16.5 million, $33.3 million and $33.2 million in 2016, 2015 and 2014, respectively.
The majority of our revenue is earned from subscription contracts under which we provide advertisers with access to our search, social and display advertising management platform, either directly or through the advertiser’s relationship with an agency that has a contract with us. In accordance with the subscription contracts, we charge fees generally based upon the amount of advertising spend that our customers manage through our platform. Our search subscription contracts are generally one year or longer in length, while initial social and display contracts may vary in duration. Under our subscription contracts with most of our direct advertisers and some of our agency customers, customers are contractually committed to a minimum monthly platform fee, which is payable on a monthly basis over the duration of the contract and is generally greater than one-half of our estimated monthly revenues from these customers, at the time the contract is signed. However, most of our subscription contracts with our advertising agency customers do not include a committed minimum monthly platform fee. Our contractual arrangement is with the advertising agency and the advertiser is not a party to the terms of the contract. Accordingly, most advertisers through our agency customers do not have a commitment to use our services and the advertisers may be added or removed from our platform at the discretion of the respective agency. We invoice the advertising agency for the amounts due under the contract. Historically, approximately half of our revenues have been earned from advertising agency customers. Our subscription fee under most contracts is variable based upon the value of advertising spend that our customers manage through our platform. Our deferred revenues consist of the unearned portion of billed subscription fees.
Under our subscription contracts, we generally begin invoicing our customers the first day of the month following the execution of the contract. We generally invoice the greater of the minimum monthly platform fee or the percentage of advertising spend on our platform. The implementation process for new advertisers is typically four to six weeks; however, we generally have not charged a separate implementation fee under our standard subscription contracts.
30
Our implementation and customer support personnel, as well as costs associated with our operating infrastructure, are included in our cost of revenues. Our cost of revenues and operating expenses are reflective of the headcount needed to grow our business and to increase data center capacity to support customer revenue growth on our platform. Our cost of revenues may increase in absolute dollars as we continue to invest in our growth.
To grow revenues, we need to invest in (1) sales activities by adding sales representatives globally to target new advertisers and agencies and (2) research and development to improve and further expand our platform and support for additional publishers. These activities will require us to make investments, particularly in research and development and sales and marketing, and if these investments do not generate additional customers or additional advertising spend managed by our platform, our future operating results could be harmed.
The majority of our revenues are derived from our advertisers in the United States. We believe the markets outside of the United States offer an opportunity for growth, and we continue investing in our international capabilities and operations to expand in these markets. Advertisers from outside of the United States represented 31%, 33% and 34% of total revenues for 2016, 2015 and 2014, respectively.
We were incorporated in 2006 and initially focused on building the core elements of our cloud-based platform, which we currently use to service our customers. In September 2007, we launched Marin Enterprise, which targets large advertisers and agencies. We released Marin Professional Edition in March 2011, which targets mid-market advertisers and agencies. We have an iterative development process and we typically release new features every month. Additionally, we have expanded internationally since our incorporation, opening our Hamburg, Paris and Sydney offices in 2011, our Dublin and Tokyo offices in 2012 and our Shanghai office in 2013. We completed our acquisitions of SocialMoov S.A.S. and NowSpots, Inc., which conducted business as Perfect Audience, in February 2015 and June 2014, respectively, to complement our product offerings. These acquisitions are more fully described in Note 3 to the consolidated financial statements.
Components of Results of Operations
Revenues
We generate revenues principally from subscription contracts under which we provide advertisers with access to our search, social and display advertising management platform, either directly or through the advertiser’s relationship with an agency with whom we have a contract. Under these subscription contracts, we charge fees generally based upon the amount of advertising spend that our customers manage through our platform. Our search subscription contracts are generally one year or longer in length, while initial social and display contracts may vary in duration.
Under our contracts with advertising agencies, the advertiser is not a party to the terms of the contract. Accordingly, most advertisers operating through agencies do not have a minimum commitment to use our services, and the advertisers may be added or removed from our platform at the discretion of the respective agency. We invoice the advertising agency for the amounts due under the contract. Under our subscription contracts with most direct advertisers and some of our agency customers, customers contractually commit to a minimum monthly platform fee, which is generally greater than one-half of our estimated monthly revenues from these customers, at the time the contract is signed. Most of our subscription contracts with advertising agency customers, however, do not include a committed minimum monthly platform fee. Our subscription fee under most contracts is variable based upon the value of advertising spend that our customers manage through our platform, although some customers pay a flat monthly rate over the term of their subscription contract.
Cost of Revenues
Cost of revenues primarily includes personnel costs, consisting of salaries, benefits, bonuses and stock-based compensation for employees associated with our cloud infrastructure and global services for implementation and ongoing customer service. Other costs of revenues include fees paid to contractors who supplement our support and data center personnel, expenses related to third-party data centers, depreciation of data center equipment, amortization of internally developed software, amortization of intangible assets and allocated overhead.
We intend to continue to invest in our global services and capacity of our hosting service infrastructure. As we continue to invest in technology innovation through research and development, we expect increased amortization of internally developed software. We expect that this investment in technology should not only expand the breadth and depth of our cross-channel, cross-device, enterprise marketing software platform but also increase the efficiency of how we deliver these solutions. The level and timing of investment in these areas could affect our cost of revenues in the future.
31
Sales and marketing expenses include personnel costs, sales commissions and other costs including travel and entertainment, marketing and promotional events, lead generation activities, public relations, marketing activities, professional fees and allocated overhead. All of these costs are expensed as incurred, including sales commissions. Our commission plans provide that commission payments to our sales representatives are paid based on the actual amounts we invoice customers over a period that is generally up to six months following the execution of the applicable customer contract.
We may continue investing in sales and marketing by expanding our domestic and international sales and marketing activities, building brand awareness and sponsoring marketing events, which we believe may enable us to add new customers and increase penetration within our existing customer base. We expect that, in the future, sales and marketing expenses will continue to be our largest operating expense category.
Research and Development Expenses
Research and development expenses consist primarily of personnel costs for our product development and engineering employees and executives, including salaries, benefits, stock-based compensation expense and bonuses. Also included are non-personnel costs such as professional fees payable to third-party development resources, amortization of intangible assets and allocated overhead.
Our research and development efforts are focused on enhancing our software architecture, adding new features and functionality to our platform and improving the efficiency with which we deliver these services to our customers. In the future, research and development expenses may increase in absolute dollars, partially offset by the capitalization of internally developed software. We believe that these investments are necessary to maintain and improve our competitive position.
General and Administrative Expenses
General and administrative expenses consist primarily of personnel costs, including salaries, benefits, stock-based compensation and bonuses for our administrative, legal, human resources, finance and accounting employees and executives. Also included are non-personnel costs, such as travel-related expenses, audit fees, tax services and legal fees, as well as professional fees, insurance and other corporate expenses, along with amortization of intangible assets and allocated overhead.
We may incur incremental costs associated with supporting the growth of our business, both in terms of size and geographic expansion, and to meet the increased compliance requirements associated with our continued operation as a public company. Such costs may include increases in our accounting and legal personnel, additional consulting, legal and audit fees, insurance costs, board of directors’ compensation and the costs of achieving and maintaining compliance with the Sarbanes-Oxley Act of 2002. As a result, our general and administrative expenses may increase in absolute dollars in future periods.
Other Income (Expenses), Net and Interest Expenses, Net
Other income (expenses), net, primarily consists of foreign currency transaction gains and losses. Interest expense, net, consists primarily of interest income earned on our cash equivalents offset by the interest expense for our capital lease payments and borrowings under our equipment advances and revolving line of credit.
(Provision for) Benefit from Income Taxes
The (provision for) benefit from income taxes consists of federal, state and foreign income taxes. Due to recent losses, we maintain a valuation allowance against our deferred tax assets as of December 31, 2016. We consider all available evidence, both positive and negative, in assessing the extent to which a valuation allowance should be applied against our deferred tax assets.
32
The following table is a summary of our consolidated statements of operations for the specified periods and results of operations as a percentage of revenues for those periods. The period-to-period comparisons of results are not necessarily indicative of results for future periods. Percentage of revenues figures are rounded and therefore may not subtotal exactly.
|
|
|
Years Ended December 31, |
|||||||||||||||||||||||||
|
|
|
2016 |
|
2015 |
|
2014 |
|||||||||||||||||||||
|
|
|
Amount |
|
|
% of Revenue |
|
Amount |
|
|
% of Revenue |
|
Amount |
|
|
% of Revenue |
||||||||||||
|
|
|
(dollars in thousands) |
|||||||||||||||||||||||||
|
Revenues, net |
|
$ |
99,878 |
|
|
|
100 |
|
% |
|
$ |
108,530 |
|
|
|
100 |
|
% |
|
$ |
99,354 |
|
|
|
100 |
|
% |
|
Cost of revenues (1) (2) (3) |
|
|
35,203 |
|
|
|
35 |
|
|
|
|
40,137 |
|
|
|
37 |
|
|
|
|
35,614 |
|
|
|
36 |
|
|
|
Gross profit |
|
|
64,675 |
|
|
|
65 |
|
|
|
|
68,393 |
|
|
|
63 |
|
|
|
|
63,740 |
|
|
|
64 |
|
|
|
Operating expenses |
|
|
|
|
|
|
|
|
|
|
|
|
|
|
|
|
|
|
|
|
|
|
|
|
|
|
|
|
Sales and marketing (1) (2) (3) |
|
|
32,889 |
|
|
|
33 |
|
|
|
|
45,132 |
|
|
|
42 |
|
|
|
|
47,716 |
|
|
|
48 |
|
|
|
Research and development (1) (2) (3) |
|
|
27,841 |
|
|
|
28 |
|
|
|
|
33,318 |
|
|
|
31 |
|
|
|
|
28,751 |
|
|
|
29 |
|
|
|
General and administrative (1) (2) (3) |
|
|
19,890 |
|
|
|
20 |
|
|
|
|
22,391 |
|
|
|
21 |
|
|
|
|
21,257 |
|
|
|
21 |
|
|
|
Total operating expenses |
|
|
80,620 |
|
|
|
81 |
|
|
|
|
100,841 |
|
|
|
93 |
|
|
|
|
97,724 |
|
|
|
98 |
|
|
|
Loss from operations |
|
|
(15,945 |
) |
|
|
(16 |
) |
|
|
|
(32,448 |
) |
|
|
(30 |
) |
|
|
|
(33,984 |
) |
|
|
(34 |
) |
|
|
Interest expense, net |
|
|
(129 |
) |
|
|
— |
|
|
|
|
(118 |
) |
|
|
— |
|
|
|
|
(177 |
) |
|
|
— |
|
|
|
Other income (expenses), net |
|
|
998 |
|
|
|
1 |
|
|
|
|
222 |
|
|
|
— |
|
|
|
|
(466 |
) |
|
|
— |
|
|
|
Loss before (provision for) benefit from income taxes |
|
|
(15,076 |
) |
|
|
(15 |
) |
|
|
|
(32,344 |
) |
|
|
(30 |
) |
|
|
|
(34,627 |
) |
|
|
(35 |
) |
|
|
(Provision for) benefit from income taxes |
|
|
(1,404 |
) |
|
|
(1 |
) |
|
|
|
(1,005 |
) |
|
|
(1 |
) |
|
|
|
1,456 |
|
|
|
1 |
|
|
|
Net loss |
|
$ |
(16,480 |
) |
|
|
(17 |
) |
% |
|
$ |
(33,349 |
) |
|
|
(31 |
) |
% |
|
$ |
(33,171 |
) |
|
|
(33 |
) |
% |
|
(1) |
Stock-based compensation expense included in the consolidated statements of operations data above was as follows: |
|
|
|
Years Ended December 31, |
|
|||||||||
|
|
|
2016 |
|
|
2015 |
|
|
2014 |
|
|||
|
|
|
(in thousands) |
|
|||||||||
|
Cost of revenues |
|
$ |
1,314 |
|
|
$ |
1,171 |
|
|
$ |
765 |
|
|
Sales and marketing |
|
|
1,281 |
|
|
|
2,537 |
|
|
|
1,895 |
|
|
Research and development |
|
|
4,989 |
|
|
|
7,518 |
|
|
|
3,785 |
|
|
General and administrative |
|
|
2,711 |
|
|
|
4,393 |
|
|
|
2,797 |
|
|
|
|
$ |
10,295 |
|
|
$ |
15,619 |
|
|
$ |
9,242 |
|
|
(2) |
Amortization of intangible assets included in the consolidated statements of operations data above was as follows: |
|
|
|
Years Ended December 31, |
|
|||||||||
|
|
|
2016 |
|
|
2015 |
|
|
2014 |
|
|||
|
|
|
(in thousands) |
|
|||||||||
|
Cost of revenues |
|
$ |
1,027 |
|
|
$ |
1,033 |
|
|
$ |
399 |
|
|
Sales and marketing |
|
|
934 |
|
|
|
921 |
|
|
|
261 |
|
|
Research and development |
|
|
1,027 |
|
|
|
1,034 |
|
|
|
397 |
|
|
General and administrative |
|
|
92 |
|
|
|
146 |
|
|
|
74 |
|
|
|
|
$ |
3,080 |
|
|
$ |
3,134 |
|
|
$ |
1,131 |
|
|
(3) |
Restructuring related expenses included in the consolidated statements of operations data above was as follows: |
|
|
|
Years Ended December 31, |
|
|||||||||
|
|
|
2016 |
|
|
2015 |
|
|
2014 |
|
|||
|
|
|
(in thousands) |
|
|||||||||
|
Cost of revenues |
|
$ |
184 |
|
|
$ |
173 |
|
|
$ |
— |
|
|
Sales and marketing |
|
|
348 |
|
|
|
718 |
|
|
|
— |
|
|
Research and development |
|
|
44 |
|
|
|
53 |
|
|
|
— |
|
|
General and administrative |
|
|
20 |
|
|
|
270 |
|
|
|
— |
|
|
|
|
$ |
596 |
|
|
$ |
1,214 |
|
|
$ |
— |
|
33
The following table sets forth our consolidated revenues by geographic area, as well as the related percentages of total revenues, for the specified periods.
|
|
|
Years Ended December 31, |
|||||||||||||||||||||||||
|
|
|
2016 |
|
2015 |
|
2014 |
|||||||||||||||||||||
|
|
|
Amount |
|
|
% of Revenue |
|
Amount |
|
|
% of Revenue |
|
Amount |
|
|
% of Revenue |
||||||||||||
|
|
|
(dollars in thousands) |
|||||||||||||||||||||||||
|
Revenues, net by geography |
|
|
|
|
|
|
|
|
|
|
|
|
|
|
|
|
|
|
|
|
|
|
|
|
|
|
|
|
United States of America |
|
$ |
69,220 |
|
|
|
69 |
|
% |
|
$ |
72,942 |
|
|
|
67 |
|
% |
|
$ |
65,745 |
|
|
|
66 |
|
% |
|
International |
|
|
30,658 |
|
|
|
31 |
|
|
|
|
35,588 |
|
|
|
33 |
|
|
|
|
33,609 |
|
|
|
34 |
|
|
|
Total revenues, net |
|
$ |
99,878 |
|
|
|
100 |
|
% |
|
$ |
108,530 |
|
|
|
100 |
|
% |
|
$ |
99,354 |
|
|
|
100 |
|
% |
Adjusted EBITDA
Adjusted EBITDA is a financial measure not calculated in accordance with generally accepted accounting principles in the United States (“GAAP”). We define Adjusted EBITDA as net loss, adjusted for stock-based compensation expense, depreciation, the amortization of internally developed software, the amortization of intangible assets, the capitalization of internally developed software, interest expense, net, the benefit from or provision for income taxes, other income or expenses, net, and costs associated with acquisitions and restructurings. Adjusted EBITDA should not be considered as an alternative to net loss, operating loss or any other measure of financial performance calculated and presented in accordance with GAAP. We prepare Adjusted EBITDA to eliminate the impact of items that we do not consider indicative of our core operating performance. Investors are encouraged to evaluate these adjustments and the reasons we consider them appropriate.
We believe Adjusted EBITDA is useful to investors in evaluating our operating performance for the following reasons:
|
|
• |
Adjusted EBITDA is widely used by investors and securities analysts to measure a company’s operating performance without regard to items, such as stock-based compensation expense, depreciation and amortization, capitalized software development costs, interest expense, net, benefit from or provision for income taxes, other income or expenses, net, costs associated with acquisitions and restructurings, that can vary substantially from company to company depending upon their financing, capital structures and the method by which assets were acquired; |
|
|
• |
Our management uses Adjusted EBITDA in conjunction with GAAP financial measures for bonus compensation and planning purposes, including the preparation of our annual operating budget, as a measure of operating performance and the effectiveness of our business strategies and in communications with our board of directors concerning our financial performance; and |
|
|
• |
Adjusted EBITDA provides consistency and comparability with our past financial performance, facilitates period-to-period comparisons of operations and also facilitates comparisons with other peer companies, many of which use similar non-GAAP financial measures to supplement their GAAP results. |
We understand that, although Adjusted EBITDA is frequently used by investors and securities analysts in their evaluations of companies, Adjusted EBITDA has limitations as an analytical tool, and investors should not consider it in isolation or as a substitute for analysis of our results of operations as reported under GAAP. These limitations include:
|
|
• |
Depreciation and amortization are non-cash charges, and the assets being depreciated or amortized will often have to be replaced in the future; Adjusted EBITDA does not reflect any cash requirements for these replacements; |
|
|
• |
Adjusted EBITDA does not reflect changes in, or cash requirements for, our working capital needs or contractual commitments; |
|
|
• |
Adjusted EBITDA does not reflect cash requirements for income taxes and the cash impact of other income or expense; and |
|
|
• |
Other companies may calculate Adjusted EBITDA differently than we do, limiting its usefulness as a comparative measure. |
34
The following table presents a reconciliation of net loss, the most comparable GAAP measure, to Adjusted EBITDA for each of the periods indicated:
|
|
|
Years Ended December 31, |
|
|||||||||
|
|
|
2016 |
|
|
2015 |
|
|
2014 |
|
|||
|
|
|
(in thousands) |
|
|||||||||
|
Net loss |
|
$ |
(16,480 |
) |
|
$ |
(33,349 |
) |
|
$ |
(33,171 |
) |
|
Depreciation |
|
|
6,035 |
|
|
|
6,993 |
|
|
|
5,669 |
|
|
Amortization of internally developed software |
|
|
2,988 |
|
|
|
2,550 |
|
|
|
1,905 |
|
|
Amortization of intangible assets |
|
|
3,080 |
|
|
|
3,134 |
|
|
|
1,131 |
|
|
Interest expense, net |
|
|
129 |
|
|
|
118 |
|
|
|
177 |
|
|
Provision for (benefit from) income taxes |
|
|
1,404 |
|
|
|
1,005 |
|
|
|
(1,456 |
) |
|
EBITDA |
|
|
(2,844 |
) |
|
|
(19,549 |
) |
|
|
(25,745 |
) |
|
Stock-based compensation expense |
|
|
10,295 |
|
|
|
15,619 |
|
|
|
9,242 |
|
|
Capitalization of internally developed software |
|
|
(4,712 |
) |
|
|
(5,568 |
) |
|
|
(3,146 |
) |
|
Acquisition related expenses |
|
|
40 |
|
|
|
635 |
|
|
|
351 |
|
|
Restructuring related expenses |
|
|
596 |
|
|
|
1,214 |
|
|
|
— |
|
|
Other (income) expenses, net |
|
|
(998 |
) |
|
|
(222 |
) |
|
|
466 |
|
|
Adjusted EBITDA |
|
$ |
2,377 |
|
|
$ |
(7,871 |
) |
|
$ |
(18,832 |
) |
Comparison of the Years Ended December 31, 2016 and 2015
Revenues
|
|
|
Years Ended December 31, |
|
|
|
Change |
|
|
|||||||||||
|
|
|
2016 |
|
|
|
2015 |
|
|
|
$ |
|
|
% |
|
|
||||
|
|
|
(dollars in thousands) |
|
|
|||||||||||||||
|
Revenues, net |
|
$ |
99,878 |
|
|
|
$ |
108,530 |
|
|
|
$ |
(8,652 |
) |
|
|
(8 |
) |
% |
Revenues in 2016 decreased $8.7 million, or 8%, as compared to 2015. This decrease is reflective of a decline in sales and advertising spend from new and existing customers, and customer turnover, particularly within network agencies. There were no customers that accounted for greater than 10% of our revenues in either 2016 or 2015.
Revenues in 2016 from the United States and all international locations represented 69% and 31%, respectively, of revenues, and in 2015, revenues from the United States and international locations represented 67% and 33%, respectively, of revenues.
Cost of Revenues and Gross Margin
|
|
|
Years Ended December 31, |
|
|
|
Change |
|
|
|||||||||||
|
|
|
2016 |
|
|
|
2015 |
|
|
|
$ |
|
|
% |
|
|
||||
|
|
|
(dollars in thousands) |
|
|
|||||||||||||||
|
Cost of revenues |
|
$ |
35,203 |
|
|
|
$ |
40,137 |
|
|
|
$ |
(4,934 |
) |
|
|
(12 |
) |
% |
|
Gross profit |
|
|
64,675 |
|
|
|
|
68,393 |
|
|
|
|
(3,718 |
) |
|
|
(5 |
) |
|
|
Gross margin |
|
|
65 |
|
% |
|
|
63 |
|
% |
|
|
|
|
|
|
|
|
|
Cost of revenues in 2016 decreased $5.0 million, or 12%, as compared to 2015. This decrease was largely driven by a reduction in the number of global services and cloud infrastructure personnel. As a result of this headcount reduction, compensation, benefits and travel expense in 2016 decreased $3.5 million as compared to 2015. During 2016, we also experienced decreases of $0.8 million in depreciation and amortization of internally developed software, and $0.4 million in professional consultant and contractor fees, as compared to 2015.
Our gross margin increased to 65% during 2016 from 63% during 2015. This was due primarily to the reduction in the number of global services and cloud infrastructure personnel, as compensation as a percentage of revenues decreased 2% period over period during 2016.
35
|
|
|
Years Ended December 31, |
|
|
|
Change |
|
|
|||||||||||
|
|
|
2016 |
|
|
|
2015 |
|
|
|
$ |
|
|
% |
|
|
||||
|
|
|
(dollars in thousands) |
|
|
|||||||||||||||
|
Sales and marketing |
|
$ |
32,889 |
|
|
|
$ |
45,132 |
|
|
|
$ |
(12,243 |
) |
|
|
(27 |
) |
% |
|
Percent of revenues, net |
|
|
33 |
|
% |
|
|
42 |
|
% |
|
|
|
|
|
|
|
|
|
Sales and marketing expenses in 2016 decreased $12.2 million, or 27%, as compared to 2015. This decrease was due primarily to a decline in the global sales support and marketing headcount, including reductions that were part of our restructuring activities in 2015 and 2016 (as described in Note 4 to the consolidated financial statements). This contributed to a net decrease of $10.0 million in personnel-related costs, consisting primarily of employee compensation, benefits and travel costs, during 2016. The remaining decrease during 2016 was primarily the result of lower indirect overhead of $0.7 million, lower restructuring expenses of $0.4 million and decreased marketing costs of $0.8 million, as compared to 2015.
Research and Development
|
|
|
Years Ended December 31, |
|
|
|
Change |
|
|
|||||||||||
|
|
|
2016 |
|
|
|
2015 |
|
|
|
$ |
|
|
% |
|
|
||||
|
|
|
(dollars in thousands) |
|
|
|||||||||||||||
|
Research and development |
|
$ |
27,841 |
|
|
|
$ |
33,318 |
|
|
|
$ |
(5,477 |
) |
|
|
(16 |
) |
% |
|
Percent of revenues, net |
|
|
28 |
|
% |
|
|
31 |
|
% |
|
|
|
|
|
|
|
|
|
Research and development expenses in 2016 decreased $5.5 million, or 16%, as compared to 2015. This primarily reflected a reduction in the number of full-time research and development personnel, resulting in a decrease of $5.8 million in compensation expense during 2016.
General and Administrative
|
|
|
Years Ended December 31, |
|
|
|
Change |
|
|
|||||||||||
|
|
|
2016 |
|
|
|
2015 |
|
|
|
$ |
|
|
% |
|
|
||||
|
|
|
(dollars in thousands) |
|
|
|||||||||||||||
|
General and administrative |
|
$ |
19,890 |
|
|
|
$ |
22,391 |
|
|
|
$ |
(2,501 |
) |
|
|
(11 |
) |
% |
|
Percent of revenues, net |
|
|
20 |
|
% |
|
|
21 |
|
% |
|
|
|
|
|
|
|
|
|
General and administrative expenses in 2016 decreased $2.5 million, or 11%, respectively, as compared to 2015. Compensation, benefits and other employee-related expenses decreased by $2.5 million during 2016, primarily due to a reduction in the number of general and administrative personnel. Restructuring expenses related to the organizational restructuring executed in 2016 were $0.2 million lower than those related to the organization restructuring executed in 2015, each as more fully described in Note 4 to our consolidated financial statements. Additionally, general and administrative expenses during 2015 were inclusive of $0.6 million in costs directly related to the acquisition of SocialMoov in February 2015. These decreases were partially offset by a $1.1 million increase in bad debt expense due to additions to the allowance for doubtful accounts during the year.
Interest Expense, Net and Other Expenses, Net
|
|
|
Years Ended December 31, |
|
|
|
Change |
|
|
|||||||||||
|
|
|
2016 |
|
|
|
2015 |
|
|
|
$ |
|
|
% |
|
|
||||
|
|
|
(dollars in thousands) |
|
|
|||||||||||||||
|
Interest expense, net and Other income (expenses), net |
|
$ |
869 |
|
|
|
$ |
104 |
|
|
|
$ |
(765 |
) |
|
|
736 |
|
% |
Other income (expenses), net, primarily consists of sublease income recorded under agreements for portions of our San Francisco and Portland office spaces, signed in December 2015 and June 2016, respectively, as well as foreign currency transaction gains and losses. During 2016, sublease income totaled $0.8 million, while foreign exchange losses were less than $0.1 million.
36
|
|
|
Years Ended December 31, |
|
|
|
Change |
|
|
|||||||||||
|
|
|
2016 |
|
|
|
2015 |
|
|
|
$ |
|
|
% |
|
|
||||
|
|
|
(dollars in thousands) |
|
|
|||||||||||||||
|
(Provision for) benefit from income taxes |
|
$ |
(1,404 |
) |
|
|
$ |
(1,005 |
) |
|
|
$ |
(399 |
) |
|
|
40 |
|
% |
The provision for income taxes for 2016 of $1.4 million was primarily the result of taxable profits generated in certain foreign jurisdictions.
Comparison of the Years Ended December 31, 2015 and 2014
Revenues
|
|
|
Years Ended December 31, |
|
|
|
Change |
|
|
|||||||||||
|
|
|
2015 |
|
|
|
2014 |
|
|
|
$ |
|
|
% |
|
|
||||
|
|
|
(dollars in thousands) |
|
|
|||||||||||||||
|
Revenues, net |
|
$ |
108,530 |
|
|
|
$ |
99,354 |
|
|
|
$ |
9,176 |
|
|
|
9 |
|
% |
Revenues increased $9.2 million, or 9%, in 2015 as compared to 2014. This increase was driven by growth in revenues from new advertisers and new product offerings, including those obtained from our acquisitions of SocialMoov and Perfect Audience in 2015 and 2014, respectively. There were no customers that accounted for greater than 10% of our revenues in either 2015 or 2014.
Revenues in 2015 from the United States and all international locations represented 67% and 33%, respectively, of revenues, and in 2014, revenues from the United States and international locations represented 66% and 34%, respectively, of revenues.
Cost of Revenues and Gross Margin
|
|
|
Years Ended December 31, |
|
|
|
Change |
|
|
|||||||||||
|
|
|
2015 |
|
|
|
2014 |
|
|
|
$ |
|
|
% |
|
|
||||
|
|
|
(dollars in thousands) |
|
|
|||||||||||||||
|
Cost of revenues |
|
$ |
40,137 |
|
|
|
$ |
35,614 |
|
|
|
$ |
4,523 |
|
|
|
13 |
|
% |
|
Gross profit |
|
|
68,393 |
|
|
|
|
63,740 |
|
|
|
|
4,653 |
|
|
|
7 |
|
|
|
Gross margin |
|
|
63 |
|
% |
|
|
64 |
|
% |
|
|
|
|
|
|
|
|
|
Cost of revenues increased $4.5 million, or 13%, as compared to 2014. This was largely driven by hosting costs, which increased $1.7 million to support the increased use of our hosted platform. We also experienced increases of $1.5 million in depreciation and amortization of internally developed software, and $0.6 million in amortization of intangible assets acquired as part of our acquisitions of Perfect Audience in June 2014 and SocialMoov in February 2015. In addition, compensation expense and allocated overhead increased $0.1 million and $0.4 million, respectively, during 2015 due to an increase in the number of global services and platform infrastructure personnel as compared to 2014.
Our gross margin decreased to 63% during 2015 from 64% during 2014. This decrease was due primarily to our continued investment in display and social advertising initiatives, and rising hosting and associated equipment costs, which were 6% of revenues during 2015, as compared to 4% during 2014.
Sales and Marketing
|
|
|
Years Ended December 31, |
|
|
|
Change |
|
|
|||||||||||
|
|
|
2015 |
|
|
|
2014 |
|
|
|
$ |
|
|
% |
|
|
||||
|
|
|
(dollars in thousands) |
|
|
|||||||||||||||
|
Sales and marketing |
|
$ |
45,132 |
|
|
|
$ |
47,716 |
|
|
|
$ |
(2,584 |
) |
|
|
(5 |
) |
% |
|
Percent of revenues, net |
|
|
42 |
|
% |
|
|
48 |
|
% |
|
|
|
|
|
|
|
|
|
Sales and marketing expenses decreased $2.6 million, or 5%, as compared to 2014. This decrease was due primarily to a reduction in the global sales support and marketing headcount, including those that were part of or restructuring in 2015 (as described in Note 4 to the consolidated financial statements), contributing to a net decrease of $3.1 million in personnel-related costs, consisting primarily of employee compensation, benefits and travel costs, as well as $0.7 million in marketing costs. These personnel and
37
marketing cost reductions were partially offset by $0.7 million in restructuring related expenses during 2015, which primarily consisted of employee severance, as well as an increase in amortization expense of $0.7 million related to the intangible assets acquired as part of the Perfect Audience and SocialMoov acquisitions.
Research and Development
|
|
|
Years Ended December 31, |
|
|
|
Change |
|
|
|||||||||||
|
|
|
2015 |
|
|
|
2014 |
|
|
|
$ |
|
|
% |
|
|
||||
|
|
|
(dollars in thousands) |
|
|
|||||||||||||||
|
Research and development |
|
$ |
33,318 |
|
|
|
$ |
28,751 |
|
|
|
$ |
4,567 |
|
|
|
16 |
|
% |
|
Percent of revenues, net |
|
|
31 |
|
% |
|
|
29 |
|
% |
|
|
|
|
|
|
|
|
|
Research and development expenses increased $4.6 million, or 16%, as compared to 2014. This increase partially reflected increases in the number of research and development personnel, resulting in an increase of $2.8 million in compensation expense during the year. The remaining $1.8 million increase during the year is primarily the result of an increase in professional fees of $0.6 million due to the usage of third-party resources to support the engineering and quality assurance functions; an increase in allocated overhead of $0.6 million due to the growth in headcount; and an increase in amortization expense of $0.6 million related to the intangible assets acquired as part of the Perfect Audience and SocialMoov acquisitions.
General and Administrative
|
|
|
Years Ended December 31, |
|
|
|
Change |
|
|
|||||||||||
|
|
|
2015 |
|
|
|
2014 |
|
|
|
$ |
|
|
% |
|
|
||||
|
|
|
(dollars in thousands) |
|
|
|||||||||||||||
|
General and administrative |
|
$ |
22,391 |
|
|
|
$ |
21,257 |
|
|
|
$ |
1,134 |
|
|
|
5 |
|
% |
|
Percent of revenues, net |
|
|
21 |
|
% |
|
|
21 |
|
% |
|
|
|
|
|
|
|
|
|
General and administrative expenses increased $1.1 million, or 5%, respectively, as compared to 2014. This was due primarily to an increase in compensation, benefits and other employee-related expenses of $0.9 million during 2015 due to fluctuations in the number of general and administrative personnel and the granting of additional equity awards to our existing employees. Facilities expenses increased $1.4 million from the prior year due to our global expansion and rent increases associated with certain of our leases, but were largely offset due to decreases in professional fees of $1.0 million, primarily as a result of efficiencies realized by our service providers, and recruiting costs of $0.4 million, due primarily to scaling back growth in headcount.
Interest Expense, Net and Other Income (Expenses), Net
|
|
|
Years Ended December 31, |
|
|
|
Change |
|
|
|||||||||||
|
|
|
2015 |
|
|
|
2014 |
|
|
|
$ |
|
|
% |
|
|
||||
|
|
|
(dollars in thousands) |
|
|
|||||||||||||||
|
Interest expense, net and Other income (expenses), net |
|
$ |
104 |
|
|
|
$ |
(643 |
) |
|
|
$ |
(747 |
) |
|
|
(116 |
) |
% |
Other income (expenses), net, primarily consists of foreign currency transaction gains and losses. During 2015, the decrease of $0.7 million in interest expense, net and other income (expenses), net, was primarily due to fluctuations in our net foreign currency gains and losses as a result of changes in foreign exchange rates.
(Provision for) Benefit from Income Taxes
|
|
|
Years Ended December 31, |
|
|
|
Change |
|
|
|||||||||||
|
|
|
2015 |
|
|
|
2014 |
|
|
|
$ |
|
|
% |
|
|
||||
|
|
|
(dollars in thousands) |
|
|
|||||||||||||||
|
(Provision for) benefit from income taxes |
|
$ |
(1,005 |
) |
|
|
$ |
1,456 |
|
|
|
$ |
(2,461 |
) |
|
|
(169 |
) |
% |
The provision for income taxes for 2015 of $1.0 million was primarily the result of increased profits generated from our foreign operations, while the benefit from income taxes for 2014 of $1.4 million was primarily due to a decrease in our valuation allowances as a result of deferred tax liabilities recorded as part of the acquisition of Perfect Audience.
38
Quarterly Results of Operations
The following table sets forth our unaudited quarterly consolidated statements of operations data for each of the eight quarters in the period ended December 31, 2016. We have prepared the quarterly data on a basis consistent with our audited annual financial statements, including, in the opinion of management, all normal recurring adjustments necessary for the fair statement of the financial information contained in these statements. The historical results are not necessarily indicative of future results and should be read in conjunction with our consolidated financial statements and the related notes included elsewhere in this Annual Report on Form 10-K.
|
|
|
Three Months Ended |
|
|||||||||||||||||||||||||||||
|
|
|
December 31, |
|
|
September 30, |
|
|
June 30, |
|
|
March 31, |
|
|
December 31, |
|
|
September 30, |
|
|
June 30, |
|
|
March 31, |
|
||||||||
|
|
|
2016 |
|
|
2016 |
|
|
2016 |
|
|
2016 |
|
|
2015 |
|
|
2015 |
|
|
2015 |
|
|
2015 |
|
||||||||
|
|
|
(in thousands) |
|
|||||||||||||||||||||||||||||
|
Revenues, net |
|
$ |
22,924 |
|
|
$ |
24,013 |
|
|
$ |
25,753 |
|
|
$ |
27,188 |
|
|
$ |
29,015 |
|
|
$ |
26,327 |
|
|
$ |
26,775 |
|
|
$ |
26,413 |
|
|
Cost of revenues (1) (2) (3) |
|
|
8,451 |
|
|
|
8,668 |
|
|
|
8,894 |
|
|
|
9,190 |
|
|
|
9,454 |
|
|
|
10,375 |
|
|
|
10,599 |
|
|
|
9,709 |
|
|
Gross profit |
|
|
14,473 |
|
|
|
15,345 |
|
|
|
16,859 |
|
|
|
17,998 |
|
|
|
19,561 |
|
|
|
15,952 |
|
|
|
16,176 |
|
|
|
16,704 |
|
|
Operating expenses |
|
|
|
|
|
|
|
|
|
|
|
|
|
|
|
|
|
|
|
|
|
|
|
|
|
|
|
|
|
|
|
|
|
Sales and marketing (1) (2) (3) |
|
|
6,916 |
|
|
|
7,581 |
|
|
|
9,285 |
|
|
|
9,107 |
|
|
|
9,076 |
|
|
|
10,835 |
|
|
|
13,064 |
|
|
|
12,157 |
|
|
Research and development (1) (2) (3) |
|
|
6,520 |
|
|
|
6,268 |
|
|
|
7,044 |
|
|
|
8,009 |
|
|
|
7,478 |
|
|
|
8,162 |
|
|
|
9,194 |
|
|
|
8,484 |
|
|
General and administrative (1) (2) (3) |
|
|
5,168 |
|
|
|
4,735 |
|
|
|
5,018 |
|
|
|
4,969 |
|
|
|
5,134 |
|
|
|
5,882 |
|
|
|
5,655 |
|
|
|
5,720 |
|
|
Total operating expenses |
|
|
18,604 |
|
|
|
18,584 |
|
|
|
21,347 |
|
|
|
22,085 |
|
|
|
21,688 |
|
|
|
24,879 |
|
|
|
27,913 |
|
|
|
26,361 |
|
|
Loss from operations |
|
|
(4,131 |
) |
|
|
(3,239 |
) |
|
|
(4,488 |
) |
|
|
(4,087 |
) |
|
|
(2,127 |
) |
|
|
(8,927 |
) |
|
|
(11,737 |
) |
|
|
(9,657 |
) |
|
Interest expense, net |
|
|
(38 |
) |
|
|
(39 |
) |
|
|
(34 |
) |
|
|
(18 |
) |
|
|
(36 |
) |
|
|
(63 |
) |
|
|
(8 |
) |
|
|
(11 |
) |
|
Other income (expenses), net |
|
|
366 |
|
|
|
188 |
|
|
|
411 |
|
|
|
33 |
|
|
|
356 |
|
|
|
(214 |
) |
|
|
(164 |
) |
|
|
244 |
|
|
Loss before (provision for) benefit from income taxes |
|
|
(3,803 |
) |
|
|
(3,090 |
) |
|
|
(4,111 |
) |
|
|
(4,072 |
) |
|
|
(1,807 |
) |
|
|
(9,204 |
) |
|
|
(11,909 |
) |
|
|
(9,424 |
) |
|
(Provision for) benefit from income taxes |
|
|
(793 |
) |
|
|
37 |
|
|
|
(307 |
) |
|
|
(341 |
) |
|
|
(331 |
) |
|
|
(300 |
) |
|
|
(138 |
) |
|
|
(236 |
) |
|
Net loss |
|
$ |
(4,596 |
) |
|
$ |
(3,053 |
) |
|
$ |
(4,418 |
) |
|
$ |
(4,413 |
) |
|
$ |
(2,138 |
) |
|
$ |
(9,504 |
) |
|
$ |
(12,047 |
) |
|
$ |
(9,660 |
) |
|
Net loss per share available to common stockholders, basic and diluted |
|
$ |
(0.12 |
) |
|
$ |
(0.08 |
) |
|
$ |
(0.12 |
) |
|
$ |
(0.12 |
) |
|
$ |
(0.06 |
) |
|
$ |
(0.26 |
) |
|
$ |
(0.33 |
) |
|
$ |
(0.27 |
) |
|
(1) |
Stock-based compensation expense included in the consolidated statements of operations data above was as follows: |
|
|
|
Three Months Ended |
|
|||||||||||||||||||||||||||||
|
|
|
December 31, |
|
|
September 30, |
|
|
June 30, |
|
|
March 31, |
|
|
December 31, |
|
|
September 30, |
|
|
June 30, |
|
|
March 31, |
|
||||||||
|
|
|
2016 |
|
|
2016 |
|
|
2016 |
|
|
2016 |
|
|
2015 |
|
|
2015 |
|
|
2015 |
|
|
2015 |
|
||||||||
|
|
|
(in thousands) |
|
|||||||||||||||||||||||||||||
|
Cost of revenues |
|
$ |
299 |
|
|
$ |
285 |
|
|
$ |
309 |
|
|
$ |
421 |
|
|
$ |
371 |
|
|
$ |
249 |
|
|
$ |
322 |
|
|
$ |
229 |
|
|
Sales and marketing |
|
|
198 |
|
|
|
162 |
|
|
|
422 |
|
|
|
499 |
|
|
|
433 |
|
|
|
435 |
|
|
|
954 |
|
|
|
715 |
|
|
Research and development |
|
|
840 |
|
|
|
852 |
|
|
|
1,275 |
|
|
|
2,022 |
|
|
|
1,687 |
|
|
|
1,864 |
|
|
|
2,340 |
|
|
|
1,627 |
|
|
General and administrative |
|
|
366 |
|
|
|
532 |
|
|
|
933 |
|
|
|
880 |
|
|
|
1,088 |
|
|
|
1,058 |
|
|
|
1,323 |
|
|
|
924 |
|
|
Total stock-based compensation expense |
|
$ |
1,703 |
|
|
$ |
1,831 |
|
|
$ |
2,939 |
|
|
$ |
3,822 |
|
|
$ |
3,579 |
|
|
$ |
3,606 |
|
|
$ |
4,939 |
|
|
$ |
3,495 |
|
|
(2) |
Amortization of intangible assets included in the consolidated statements of operations data above was as follows: |
|
|
|
Three Months Ended |
|
|||||||||||||||||||||||||||||
|
|
|
December 31, |
|
|
September 30, |
|
|
June 30, |
|
|
March 31, |
|
|
December 31, |
|
|
September 30, |
|
|
June 30, |
|
|
March 31, |
|
||||||||
|
|
|
2016 |
|
|
2016 |
|
|
2016 |
|
|
2016 |
|
|
2015 |
|
|
2015 |
|
|
2015 |
|
|
2015 |
|
||||||||
|
|
|
(in thousands) |
|
|||||||||||||||||||||||||||||
|
Cost of revenues |
|
$ |
247 |
|
|
$ |
246 |
|
|
$ |
263 |
|
|
$ |
271 |
|
|
$ |
271 |
|
|
$ |
271 |
|
|
$ |
276 |
|
|
$ |
215 |
|
|
Sales and marketing |
|
|
223 |
|
|
|
223 |
|
|
|
240 |
|
|
|
248 |
|
|
|
247 |
|
|
|
247 |
|
|
|
247 |
|
|
|
180 |
|
|
Research and development |
|
|
247 |
|
|
|
246 |
|
|
|
263 |
|
|
|
271 |
|
|
|
271 |
|
|
|
271 |
|
|
|
276 |
|
|
|
216 |
|
|
General and administrative |
|
|
13 |
|
|
|
15 |
|
|
|
28 |
|
|
|
36 |
|
|
|
37 |
|
|
|
37 |
|
|
|
37 |
|
|
|
35 |
|
|
Total amortization of intangible assets |
|
$ |
730 |
|
|
$ |
730 |
|
|
$ |
794 |
|
|
$ |
826 |
|
|
$ |
826 |
|
|
$ |
826 |
|
|
$ |
836 |
|
|
$ |
646 |
|
39
|
(3) |
Restructuring related expenses included in the consolidated statements of operations data above was as follows: |
|
|
|
Three Months Ended |
|
|||||||||||||||||||||||||||||
|
|
|
December 31, |
|
|
September 30, |
|
|
June 30, |
|
|
March 31, |
|
|
December 31, |
|
|
September 30, |
|
|
June 30, |
|
|
March 31, |
|
||||||||
|
|
|
2016 |
|
|
2016 |
|
|
2016 |
|
|
2016 |
|
|
2015 |
|
|
2015 |
|
|
2015 |
|
|
2015 |
|
||||||||
|
|
|
(in thousands) |
|
|||||||||||||||||||||||||||||
|
Cost of revenues |
|
$ |
9 |
|
|
$ |
24 |
|
|
$ |
151 |
|
|
$ |
— |
|
|
$ |
68 |
|
|
$ |
105 |
|
|
$ |
— |
|
|
$ |
— |
|
|
Sales and marketing |
|
|
135 |
|
|
|
2 |
|
|
|
211 |
|
|
|
— |
|
|
|
59 |
|
|
|
659 |
|
|
|
— |
|
|
|
— |
|
|
Research and development |
|
|
— |
|
|
|
(4 |
) |
|
|
48 |
|
|
|
— |
|
|
|
— |
|
|
|
53 |
|
|
|
— |
|
|
|
— |
|
|
General and administrative |
|
|
3 |
|
|
|
2 |
|
|
|
15 |
|
|
|
— |
|
|
|
6 |
|
|
|
264 |
|
|
|
— |
|
|
|
— |
|
|
Total restructuring related expenses |
|
$ |
147 |
|
|
$ |
24 |
|
|
$ |
425 |
|
|
$ |
— |
|
|
$ |
133 |
|
|
$ |
1,081 |
|
|
$ |
— |
|
|
$ |
— |
|
The following table sets forth our consolidated results of operations for the specified periods as a percentage of our revenues for those periods. Percentage of revenue figures are rounded and therefore may not subtotal exactly.
|
|
|
Three Months Ended |
|
|
|||||||||||||||||||||||||||||
|
|
|
December 31, |
|
|
September 30, |
|
|
June 30, |
|
|
March 31, |
|
|
December 31, |
|
|
September 30, |
|
|
June 30, |
|
|
March 31, |
|
|
||||||||
|
|
|
2016 |
|
|
2016 |
|
|
2016 |
|
|
2016 |
|
|
2015 |
|
|
2015 |
|
|
2015 |
|
|
2015 |
|
|
||||||||
|
|
|
(as a % of revenues, net) |
|
|
|||||||||||||||||||||||||||||
|
Revenues, net |
|
|
100 |
|
% |
|
100 |
|
% |
|
100 |
|
% |
|
100 |
|
% |
|
100 |
|
% |
|
100 |
|
% |
|
100 |
|
% |
|
100 |
|
% |
|
Cost of revenues |
|
|
37 |
|
|
|
36 |
|
|
|
35 |
|
|
|
34 |
|
|
|
33 |
|
|
|
39 |
|
|
|
40 |
|
|
|
37 |
|
|
|
Gross profit |
|
|
63 |
|
|
|
64 |
|
|
|
65 |
|
|
|
66 |
|
|
|
67 |
|
|
|
61 |
|
|
|
60 |
|
|
|
63 |
|
|
|
Operating expenses |
|
|
|
|
|
|
|
|
|
|
|
|
|
|
|
|
|
|
|
|
|
|
|
|
|
|
|
|
|
|
|
|
|
|
Sales and marketing |
|
|
30 |
|
|
|
32 |
|
|
|
36 |
|
|
|
33 |
|
|
|
31 |
|
|
|
42 |
|
|
|
49 |
|
|
|
46 |
|
|
|
Research and development |
|
|
28 |
|
|
|
26 |
|
|
|
27 |
|
|
|
29 |
|
|
|
26 |
|
|
|
31 |
|
|
|
34 |
|
|
|
32 |
|
|
|
General and administrative |
|
|
23 |
|
|
|
20 |
|
|
|
19 |
|
|
|
18 |
|
|
|
18 |
|
|
|
22 |
|
|
|
21 |
|
|
|
22 |
|
|
|
Total operating expenses |
|
|
81 |
|
|
|
77 |
|
|
|
83 |
|
|
|
81 |
|
|
|
75 |
|
|
|
95 |
|
|
|
104 |
|
|
|
100 |
|
|
|
Loss from operations |
|
|
(18 |
) |
|
|
(13 |
) |
|
|
(17 |
) |
|
|
(15 |
) |
|
|
(7 |
) |
|
|
(34 |
) |
|
|
(44 |
) |
|
|
(37 |
) |
|
|
Interest expense, net |
|
|
— |
|
|
|
— |
|
|
|
— |
|
|
|
— |
|
|
|
— |
|
|
|
— |
|
|
|
— |
|
|
|
— |
|
|
|
Other income (expenses), net |
|
|
2 |
|
|
|
1 |
|
|
|
2 |
|
|
|
— |
|
|
|
1 |
|
|
|
(1 |
) |
|
|
— |
|
|
|
1 |
|
|
|
Loss before (provision for) benefit from income taxes |
|
|
(17 |
) |
|
|
(13 |
) |
|
|
(16 |
) |
|
|
(15 |
) |
|
|
(6 |
) |
|
|
(35 |
) |
|
|
(44 |
) |
|
|
(36 |
) |
|
|
(Provision for) benefit from income taxes |
|
|
(3 |
) |
|
|
— |
|
|
|
(1 |
) |
|
|
(1 |
) |
|
|
(1 |
) |
|
|
(1 |
) |
|
|
(1 |
) |
|
|
(1 |
) |
|
|
Net loss |
|
|
(20 |
) |
% |
|
(13 |
) |
% |
|
(17 |
) |
% |
|
(16 |
) |
% |
|
(7 |
) |
% |
|
(36 |
) |
% |
|
(45 |
) |
% |
|
(37 |
) |
% |
Liquidity and Capital Resources
Since our incorporation in March 2006, we have relied primarily on sales of our capital stock to fund our operating activities. From incorporation until our IPO, we raised $105.7 million, net of related issuance costs, in funding through private placements of our preferred stock. In March and April 2013, we raised net proceeds of $109.3 million in our IPO. From time to time, we have also utilized equipment lines and entered into capital lease arrangements to fund capital purchases. As of December 31, 2016, our principal sources of liquidity were our unrestricted cash and cash equivalents of $34.4 million and our capital lease arrangements. The approximate weighted average interest rate on our outstanding borrowings as of December 31, 2016 was 5.6%. Our primary operating cash requirements include the payment of compensation and related costs, as well as costs for our facilities and information technology infrastructure.
In December 2016, we terminated our existing revolving credit facility, which provided access to borrowings at the lesser of $20.0 million or 80% of eligible accounts receivable. No amounts were outstanding under this revolving credit facility at the date of termination, and we determined that it was no longer necessary. We maintain a $1.3 million irrevocable letter of credit to secure the non-cancelable lease for our corporate headquarters in San Francisco, which was previously collateralized by the revolving credit facility. Following the termination of that facility, we were required to restrict $1.3 million of our cash and cash equivalents from use to secure this letter of credit. This balance is reflected as restricted cash on the consolidated balance sheets of the accompanying consolidated financial statements.
40
We presently maintain cash balances in our foreign subsidiaries. As of December 31, 2016, we had $34.4 million of unrestricted cash and cash equivalents in aggregate, of which $14.2 million was held by our foreign subsidiaries. We plan to re-invest the cash earned by our foreign subsidiaries to finance the growth of our foreign operations.
Based on our current level of operations and anticipated growth, we believe that our existing cash and cash equivalents will be sufficient to fund our operations for at least the next 12 months. Our future capital requirements will depend on many factors, including our revenue performance, the timing and extent of spending to support product development efforts and the timing of introductions of new features and enhancements to our platform. To the extent that existing cash and cash equivalents are insufficient to fund our future activities, we may need to raise additional funds through public or private equity or debt financing.
Summary of Cash Flows
The following table sets forth a summary of our cash flows for the periods indicated:
|
|
|
Years Ended December 31, |
|
|||||||||
|
|
|
2016 |
|
|
2015 |
|
|
2014 |
|
|||
|
|
|
(in thousands) |
|
|||||||||
|
Net cash provided by (used in) operating activities |
|
$ |
5,719 |
|
|
$ |
(7,081 |
) |
|
$ |
(24,390 |
) |
|
Net cash used in investing activities |
|
|
(5,914 |
) |
|
|
(21,890 |
) |
|
|
(12,614 |
) |
|
Net cash (used in) provided by financing activities |
|
|
(383 |
) |
|
|
(1,294 |
) |
|
|
850 |
|
|
Effect of foreign exchange rate changes on cash and cash equivalents and restricted cash |
|
|
(1,035 |
) |
|
|
(662 |
) |
|
|
— |
|
|
Net decrease in cash and cash equivalents and restricted cash |
|
$ |
(1,613 |
) |
|
$ |
(30,927 |
) |
|
$ |
(36,154 |
) |
Operating Activities
Cash provided by or used in operating activities is primarily influenced by the amount of cash we invest in personnel and infrastructure to support the anticipated growth of our business and the increase in the number of advertisers using our platform. Cash provided by or used in operating activities has typically been affected by net losses and further increased by changes in our operating assets and liabilities, particularly in the areas of accounts receivable, prepaid expenses and other current assets, deferred revenue, accounts payable and accrued expenses and other current liabilities, adjusted for non-cash expense items such as depreciation, amortization, stock-based compensation expense and deferred income tax benefits.
Cash provided by operating activities in 2016 of $5.7 million was primarily the result of a net loss of $16.5 million, adjusted for non-cash expenses of $24.0 million, which primarily included depreciation, amortization, unrealized foreign currency gains or losses, stock-based compensation expense and deferred income tax expenses or benefits. This was further offset by $0.1 million in contingent consideration paid for the SocialMoov acquisition from 2015, and a $1.7 million net change in working capital items, most notably (1) an increase in accounts receivable of $0.8 million due to the timing of related collections and changes in the estimated allowances for bad debts and credits; (2) a decrease in prepaid expenses and other current assets, and other (noncurrent) assets, of $0.2 million related to the timing of related disbursements; (3) a decrease in deferred revenues of $0.6 million related to the timing of the collection of minimum fees at the start of our subscription agreements; and (4) a net decrease in accounts payable and accrued expenses and other current and noncurrent liabilities of $2.1 million due to the timing of related disbursements and customer advances.
Cash used in operating activities in 2015 of $7.1 million was primarily the result of a net loss of: $33.3 million, offset by non-cash expenses of $29.2 million, which primarily included depreciation, amortization, unrealized foreign currency gain or loss, stock-based compensation expense and deferred income tax expenses or benefits. These non-cash expenses increased due to capital expenses and additional equity awards related to continued investment in our business, as well as the acquisition of SocialMoov in February 2015. This was further offset by a $2.9 million net change in working capital items (exclusive of changes due to net liabilities assumed from the acquisition of SocialMoov in February 2015), most notably (1) an increase in accounts receivable of $3.0 million due to the increase in sales and the timing of related collections; (2) a decrease in prepaid expenses and other current assets, and other (noncurrent) assets, of $0.9 million related to the growth of our operations and timing of related disbursements; (3) a decrease in deferred revenues of $0.6 million related to the timing of the collection of minimum fees at the start of our subscription agreements; and (4) a net decrease in accounts payable and accrued expenses and other current and noncurrent liabilities of $0.2 million due to the timing of related disbursements and customer advances.
Cash used in operating activities in 2014 of $24.4 million was primarily the result of a net loss of $33.2 million; a $7.7 million net change in working capital items (exclusive of changes due to net liabilities assumed from the acquisition of Perfect Audience in June 2014), most notably (1) an increase in accounts receivable of $4.6 million due to the increase in sales and the timing of related collections; (2) an increase in prepaid expenses and other current assets, and other (noncurrent) assets, of $2.5 million related to the growth of our operations and timing of related disbursements; (3) a decrease in deferred revenues of $0.5 million related to the timing
41
of the collection of minimum fees at the start of our subscription agreements; and (4) a net decrease in accounts payable and accrued expenses and other current and noncurrent liabilities of $0.1 million due to the timing of related disbursements and customer advances. This was partially offset by non-cash expenses of $16.5 million, which included depreciation, amortization, stock-based compensation expense and deferred income tax benefits, which increased primarily due to capital expenses and headcount growth, primarily related to continued investment in our business, as well as the acquisition of Perfect Audience.
Investing Activities
During 2016, 2015 and 2014, investing activities primarily consisted of purchases of property and equipment, including technology hardware and software to support our business, as well as capitalized internally developed software costs. Purchases of property and equipment may vary from period-to-period due to the timing of the expansion of our operations and the development cycles of our internally developed hosted software platform. We expect to continue to invest in property and equipment and developing our software platform for the foreseeable future. Investing activities during 2015 and 2014 are also inclusive of cash paid for the acquisitions of SocialMoov ($8.9 million, net of cash acquired of $1.2 million) and Perfect Audience ($5.3 million, net of cash acquired of $1.1 million), respectively.
Financing Activities
Cash used in financing activities in 2016 totaled $0.4 million. This was primarily due to $1.4 million in net repayments under our capital lease arrangements, partially offset by $1.1 million of proceeds from the exercise of stock options and contributions to our employee stock purchase plan.
Cash used in financing activities in 2015 totaled $1.3 million. This was primarily due to $3.6 million in net repayments under the loans assumed in the SocialMoov acquisition, our credit facility and our capital lease arrangements, partially offset by $2.4 million of proceeds from the exercise of stock options and contributions to our employee stock purchase plan.
Cash provided by financing activities in 2014 was $0.9 million. This was primarily related to $3.9 million of proceeds from the exercise of stock options and contributions to our employee stock purchase plan, partially offset by $3.1 million in net repayments under our credit facility and capital lease arrangement.
Contractual Obligations and Commitments
Our principal commitments consist of obligations under operating leases for office space, net of sublease income, and our capital leases for computer equipment. As of December 31, 2016, the future minimum payments under these commitments, were as follows:
|
|
|
Payments Due By Period |
|
|||||||||||||||||
|
|
|
Total |
|
|
Less Than 1 Year |
|
|
1 - 3 Years |
|
|
3 - 5 Years |
|
|
More Than 5 Years |
|
|||||
|
|
|
(in thousands) |
|
|||||||||||||||||
|
Capital lease obligations |
|
$ |
3,411 |
|
|
$ |
1,015 |
|
|
$ |
2,051 |
|
|
$ |
345 |
|
|
$ |
— |
|
|
Interest expense payments |
|
|
262 |
|
|
|
146 |
|
|
|
112 |
|
|
|
4 |
|
|
|
— |
|
|
Operating leases obligations, net |
|
|
23,821 |
|
|
|
6,086 |
|
|
|
8,423 |
|
|
|
6,731 |
|
|
|
2,581 |
|
|
Total |
|
$ |
27,494 |
|
|
$ |
7,247 |
|
|
$ |
10,586 |
|
|
$ |
7,080 |
|
|
$ |
2,581 |
|
The amounts in the table above are associated with agreements that are enforceable and legally binding, which specify significant terms including payment terms, related services and the approximate timing of the transaction. Purchase obligations under contracts that we can cancel without a significant penalty are not included in the table.
During the ordinary course of business, we include indemnification provisions within certain of our contracts. Pursuant to these arrangements, we may be obligated to indemnify, hold harmless and agree to reimburse the indemnified party for losses suffered or incurred by the indemnified party, generally parties with which we have commercial relations, in connection with certain intellectual property infringement claims by any third party with respect to our software. To date, there have not been any costs incurred in connection with such indemnification arrangements and therefore, there is no accrual for such amounts as of December 31, 2016.
In addition to the obligations in the table above, we have approximately $8.8 million of unrecognized tax benefits as of December 31, 2016. It is uncertain as to if or when such amounts may be settled.
42
Off-Balance Sheet Arrangements
During the periods presented, we did not have, nor do we currently have, any relationships with unconsolidated entities or financial partnerships, such as entities often referred to as structured finance or special purpose entities, which would have been established for the purpose of facilitating off-balance sheet arrangements or other contractually narrow or limited purposes. We are therefore not exposed to any financing, liquidity, market or credit risk that could arise if we had engaged in those types of relationships.
We have no obligations that meet the definition of an off-balance sheet arrangement as of December 31, 2016, other than operating leases, as described in the Notes to the consolidated financial statements.
Critical Accounting Policies and Significant Judgments and Estimates
The discussion and analysis of our financial condition and results of operations is based upon our consolidated financial statements, which have been prepared in accordance with accounting principles generally accepted in the United States. The preparation of these consolidated financial statements requires us to make estimates, assumptions and judgments that can have significant impact on the reported amounts of assets and liabilities, revenues and expenses, and related disclosure of contingent assets and liabilities at the date of the consolidated financial statements. These items are monitored and analyzed by us for changes in facts and circumstances, and material changes in these estimates could occur in the future.
We believe the estimates on historical experience and on various other assumptions that we believe to be reasonable under the circumstances, the results of which form the basis for making judgments about the carrying values of assets and liabilities. If actual results or events differ materially from those contemplated by us in making these estimates, our reported financial condition and results of operations for future periods could be materially affected. See “Risk Factors” for certain matters that may affect these estimates or our future financial condition or results of operations. An accounting policy is deemed to be critical if it requires an accounting estimate to be made based on assumptions about matters that are uncertain at the time the estimate is made, if different estimates reasonably could have been used, or if the changes in estimate that are reasonably likely to occur could materially impact the financial statements.
Our significant accounting policies are described in Note 2 to the consolidated financial statements included in this Annual Report on Form 10-K, and we believe that the accounting policies discussed below involve the greatest degree of complexity and exercise of judgment by our management. The methods, estimates and judgments that we use in applying our accounting policies have a significant impact on our results of operations and, accordingly, we believe the policies described below are the most critical for understanding and evaluating our financial condition and results of operations.
Revenue Recognition
We generate revenues principally from subscriptions either directly with advertisers or with advertising agencies to our platform for the management of search, social and display advertising. Our subscription agreements are generally one year or longer in length. The subscription fee under most contracts is variable based on the value of the advertising spend that our advertisers manage through our platform and is generally invoiced on a monthly basis. Contracts with direct advertisers and certain contracts with advertising agencies also include a minimum monthly fee that is payable over the duration of the contract. Our customers do not have the right to take possession of the software supporting the application service at any time, nor do the arrangements contain general rights of return. We commence revenue recognition for both direct advertisers and advertising agencies when all of the following conditions are met:
|
|
• |
persuasive evidence of an arrangement exists; |
|
|
• |
our platform is made available to the customer; |
|
|
• |
the fee is fixed or determinable, and; |
|
|
• |
collection is reasonably assured. |
We recognize the total minimum fee for both direct advertisers and advertising agencies, where applicable, over the duration of the contract, commencing on the date that our platform is made available to the customer, provided revenues recognized do not exceed amounts that are invoiced and due. The variable fee, which is based on a percentage of the value of the advertising spend managed through our platform, is recognized once the amount is fixed or determinable, which is generally on a monthly basis concurrent with the issuance of the customer invoice. Signed contracts are used as evidence of an arrangement. We assess collectability based on a number of factors such as past collection history with the customer and creditworthiness of the customer. Certain agreements with advertising agencies also contain sequential liability provisions, which provide that the agency has no obligation to pay us until the agency receives payment from its customers. In these circumstances, we evaluate the credit worthiness of the agency’s customers, in
43
addition to the agency itself, to conclude whether or not collectability is reasonably assured. If we determine collectability is not reasonably assured, we defer the revenue recognition until collectability becomes reasonably assured.
We apply the authoritative accounting guidance regarding revenue recognition for arrangements with multiple deliverables. Professional services and training, when sold with our platform subscription services, are accounted for separately when those services have standalone value. In determining whether professional services and training services can be accounted for separately from subscription services, we consider the following factors: availability of the services from other vendors; the nature of the services; the dependence of the subscription services on the customer’s decision to buy the professional services; and whether we sell our subscription services without professional services. If the deliverables have stand-alone value, we account for each deliverable separately and revenues are recognized for the respective deliverables as they are delivered. If one or more of the deliverables do not have stand-alone value, the deliverables that do not have stand-alone value are combined with the final deliverables within the arrangement and treated as a single unit of accounting. Revenues for arrangements treated as a single unit of accounting are recognized over the period of the contract commencing upon delivery of the final deliverable. As of December 31, 2016, we did not have stand-alone value for the professional services and training services. This is because we include professional services and training services with our subscription services and those services are not available from other vendors.
Stock-Based Compensation
We measure and recognize expense for stock-based compensation based on the grant date fair value of the award and generally recognize the expense, net of estimated forfeitures, on a straight-line basis over the requisite service period.
Prior to our IPO, we estimated the fair value of our common stock for purposes of determining the fair value of our option awards. Subsequent to the IPO, we use the closing stock price on the date of grant. Determining the fair value of stock-based awards at the grant date requires judgment. We use the Black-Scholes option pricing model to determine the fair value of our stock option awards. The determination of the grant date fair value of our stock option awards using an option pricing model is affected by the estimated fair value per share of the common stock underlying those options as well as assumptions regarding a number of other complex and subjective variables. These variables include our expected stock price volatility over the expected term of the options, stock option exercise and cancellation behaviors, risk-free interest rates and expected dividends, which are estimated as follows:
|
|
• |
Expected Volatility. As our common stock has been publicly traded for approximately four years, there is a lack of Company-specific historical and implied volatility data. Accordingly, we have estimated the expected stock price volatility for our common stock by taking the average historic price volatility for industry peers based on daily price observations over a period equivalent to the expected term of the stock option grants. Industry peers consist of public companies in the technology industry, primarily in the subscription software business. We intend to continue to consistently apply this process using the same or similar public companies until a sufficient amount of historical information regarding the volatility of our own common stock share price becomes available, or unless circumstances change such that the identified companies are no longer similar to us, in which case, more suitable companies whose share prices are publicly available would be utilized in the calculation. |
|
|
• |
Risk-Free Interest Rate. The risk-free interest rate assumption used is based on observed market interest rates appropriate for the expected term of employee options. |
|
|
• |
Expected Term. We estimated the expected term for a “plain vanilla” option using the simplified method allowed under current guidance, which uses the midpoint between the graded vesting period and the contractual termination date since we do not have sufficient historical exercise data to provide a reasonable basis upon which to estimate the expected term. |
|
|
• |
Dividend Yield. We have never declared or paid any cash dividends and do not presently plan to pay cash dividends in the foreseeable future. Consequently, we used an expected dividend yield of zero. |
We used the following assumptions in our application of the Black-Scholes option pricing model for the periods presented in the table below:
|
|
|
Years Ended December 31, |
|
|||||||||
|
|
|
2016 |
|
|
2015 |
|
|
2014 |
|
|||
|
Dividend yield |
|
|
— |
|
|
|
— |
|
|
|
— |
|
|
Expected volatility |
|
|
47.5 |
% |
|
|
49.1 |
% |
|
|
51.3 |
% |
|
Risk-free interest rate |
|
|
1.38 |
% |
|
|
1.75 |
% |
|
|
1.89 |
% |
|
Expected term (in years) |
|
|
6.25 |
|
|
|
6.25 |
|
|
|
6.25 |
|
44
In addition, stock-based compensation guidance requires forfeitures to be estimated at the time of grant and revised, if necessary, in subsequent periods if actual forfeitures differ from those estimates. We apply an estimated forfeiture rate based on our historical forfeiture experience.
Future expense amounts for any particular period could be affected by changes in our assumptions or changes in market conditions.
Stock-based compensation expense included in the consolidated financial statement line items is as follows:
|
|
|
Years Ended December 31, |
|
|||||||||
|
|
|
2016 |
|
|
2015 |
|
|
2014 |
|
|||
|
|
|
(in thousands) |
|
|||||||||
|
Cost of revenues |
|
$ |
1,314 |
|
|
$ |
1,171 |
|
|
$ |
765 |
|
|
Sales and marketing |
|
|
1,281 |
|
|
|
2,537 |
|
|
|
1,895 |
|
|
Research and development |
|
|
4,989 |
|
|
|
7,518 |
|
|
|
3,785 |
|
|
General and administrative |
|
|
2,711 |
|
|
|
4,393 |
|
|
|
2,797 |
|
|
|
|
$ |
10,295 |
|
|
$ |
15,619 |
|
|
$ |
9,242 |
|
Costs for equity instruments issued in exchange for the receipt of goods or services from non-employees are measured at the fair market value of the consideration received or the fair value of the equity instruments issued, whichever is more reliably measurable. The value of equity instruments issued for consideration other than employee services is determined on the earlier of the date on which there first exists a firm commitment for performance by the provider of goods or services or on the date performance is complete, using the Black-Scholes option pricing model.
Prior to our IPO, we were required to estimate the fair value of the common stock underlying our share-based awards when performing the fair value calculations with the Black-Scholes option-pricing model. The fair value of the common stock underlying our share-based awards was determined by our board of directors, with input from management and contemporaneous third-party valuations. Our board of directors determined the fair value of our common stock on the date of grant based on a number of factors, with input from management and third-party valuation analyses.
In valuing our common stock, our board of directors determined the equity value of our business generally using the income approach and market comparable approach valuation methods. The income approach consisted of a discounted cash flow analysis. The methodology we used derived equity values utilizing a probability-weighted expected return method. Under this approach, the value of our common stock was estimated based upon an analysis of values for our common stock assuming the various possible future events for the Company, including, but not limited to, initial public offering, strategic merger or sale or remaining a private company. In the market approach, the valuations and outcomes of comparable peer companies in the public market were reviewed.
Income Taxes
As a result of our current net operating loss position in the United States, income tax expense consists primarily of corporate income taxes resulting from profits generated in foreign jurisdictions by wholly-owned subsidiaries, along with state income taxes payable in the United States. As we have incurred operating losses in all periods to date and recorded a full valuation allowance against our deferred tax assets (except for deferred tax assets associated with our subsidiaries in China, Japan and the United Kingdom), we have not historically recorded a provision for federal income taxes. Realization of any of our deferred tax assets depends upon future earnings, the timing and amount of which are uncertain. We consider all available evidence, both positive and negative, in assessing the extent to which a valuation allowance should be applied against our deferred tax assets.
Utilization of our net operating losses may be subject to substantial annual limitation due to the ownership change limitations provided by the Code and similar state provisions. An analysis was conducted through December 31, 2016, to determine whether an ownership change had occurred since inception. The analysis indicated that because an ownership change occurred in a prior year, $0.2 million of each of our federal and state net operating losses were significantly limited pursuant to IRC Section 382. In the event we have subsequent changes in ownership or profitability is delayed, net operating losses and research and development credit carryovers could be further limited and may expire unutilized.
Allowance for Doubtful Accounts
We assess collectability based on a number of factors, including credit worthiness of the customer along with past transaction history; in addition, we perform periodic evaluations of our customers’ financial condition. Certain contracts with advertising agencies
45
contain sequential liability provisions, where the agency does not have an obligation to pay until payment is received from the agency’s customers. In these circumstances, we evaluate the credit worthiness of the agency’s customers, in addition to the agency itself. Credit losses historically have not been material, which is directly attributable to our subscription-based services model, enabling us to immediately discontinue the availability of the services in question in the event of non-payment. Through December 31, 2016, we have not experienced any material credit losses.
Business Combinations
In accordance with authoritative business combination accounting guidance, we allocate the fair value of purchase consideration to the tangible assets acquired, liabilities assumed and intangible assets acquired based on their estimated fair values. The excess of the fair value of purchase consideration over the fair values of these identifiable assets acquired and liabilities assumed is recorded as goodwill. While we use our best estimates and assumptions to accurately value assets acquired and liabilities assumed at the acquisition date as well as contingent consideration, where applicable, our estimates are inherently uncertain and subject to refinement. As a result, during the measurement period, which may be up to one year from the acquisition date, we may record adjustments to the assets acquired and liabilities assumed with the corresponding offset to goodwill. Upon the conclusion of the measurement period or final determination of the values of assets acquired or liabilities assumed, whichever comes first, any subsequent adjustments are recorded to our consolidated statements of comprehensive loss.
Accounting for business combinations requires our management to make significant estimates and assumptions, especially at the acquisition date, particularly our estimates for intangible assets, contractual obligations assumed, restructuring liabilities, pre-acquisition contingencies and contingent consideration, where applicable. Although we believe the assumptions and estimates we have made in the past have been reasonable and appropriate, they are based in part on historical experience and information obtained from the management of the acquired company and are inherently uncertain.
Examples of critical estimates in valuing certain of the intangible assets we have acquired include but are not limited to:
|
|
• |
future expected cash flows from customer relationships and developed technology; |
|
|
• |
the acquired company’s brand and competitive position, as well as assumptions about the period of time the acquired brand will continue to be used in the combined company’s product portfolio; and |
|
|
• |
discount rates; |
Unanticipated events and circumstances may occur that may affect the accuracy or validity of such assumptions, estimates or actual results.
For a given acquisition, we may identify certain pre-acquisition contingencies as of the acquisition date and may extend our review and evaluation of these pre-acquisition contingencies throughout the measurement period in order to obtain sufficient information to assess whether we include these contingencies as a part of the fair value estimates of assets acquired and liabilities assumed and, if so, to determine their estimated amounts.
If we cannot reasonably determine the fair value of a pre-acquisition contingency (non-income tax related) by the end of the measurement period, which is generally the case given the nature of such matters, we will recognize an asset or a liability for such pre-acquisition contingency if: (i) it is probable that an asset existed or a liability had been incurred at the acquisition date and (ii) the amount of the asset or liability can be reasonably estimated. Subsequent to the measurement period, changes in our estimates of such contingencies will affect earnings and could have a material effect on our results of operations and financial position.
In addition, uncertain tax positions and tax related valuation allowances assumed in connection with a business combination are initially estimated as of the acquisition date. We reevaluate these items quarterly based upon facts and circumstances that existed as of the acquisition date with any adjustments to our preliminary estimates being recorded to goodwill if identified within the measurement period. Subsequent to the measurement period or our final determination of the tax allowance’s or contingency’s estimated value, whichever comes first, changes to these uncertain tax positions and tax related valuation allowances will affect our provision for income taxes in our consolidated statements of comprehensive loss and could have a material impact on our results of operations and financial position.
Goodwill, Intangible Assets and Other Long-Lived Assets - Impairment Assessments
We review goodwill for impairment annually and whenever events or changes in circumstances indicate its carrying value may not be recoverable in accordance with authoritative accounting guidance. For the purposes of impairment testing, we have determined that we have one reporting unit. We perform the two-step impairment test, whereby we compare the fair value of each reporting unit to its carrying value. If the fair value of the reporting unit exceeds the carrying value of the net assets assigned to that unit, goodwill is
46
not considered impaired and we are not required to perform further testing. If the carrying value of the net assets assigned to the reporting unit exceeds the fair value of the reporting unit, then we must perform the second step of the impairment test in order to determine the implied fair value of the reporting unit’s goodwill. If the carrying value of a reporting unit’s goodwill exceeds its implied fair value, then we would record an impairment loss equal to the difference. No impairment has been noted to date.
We periodically review the carrying amounts of intangible assets and other long-lived assets for impairment whenever events or changes in circumstances indicate that the carrying value of these assets may not be recoverable. We measure the recoverability of these assets by comparing the carrying amount of such assets (or asset group) to the future undiscounted cash flow we expect the assets (or asset group) to generate. If we consider any of these assets to be impaired, the impairment to be recognized equals the amount by which the carrying value of the assets exceeds its fair value. We make judgments about the recoverability of purchased intangible assets whenever events or changes in circumstances indicate that an impairment may exist.
Each period we evaluate the estimated remaining useful lives of intangible assets and other long-lived assets to assess whether a revision to the remaining periods of amortization is required. Assumptions and estimates about remaining useful lives of our intangible and other long-lived assets are subjective. They can be affected by a variety of factors, including external factors such as industry and economic trends and internal factors such as changes in our business strategy. Although we believe the historical assumptions and estimates we have made are reasonable and appropriate, different assumptions and estimates could materially impact our reported financial results. We did not recognize any intangible asset impairment charges to date.
Recent Accounting Pronouncements
See “Note 2 – Summary of Significant Accounting Policies” to the consolidated financial statements included in this Annual Report on Form 10-K, regarding the impact of certain recent accounting pronouncements on our consolidated financial statements.
We have operations both within the United States and internationally and we are exposed to market risks in the ordinary course of our business. These risks primarily include interest rate, foreign exchange and inflation risks, as well as risks relating to changes in the general economic conditions in the countries where we conduct business. To reduce certain of these risks, we monitor the financial condition of our large customers and limit credit exposure by setting credit limits as we deem appropriate. In addition, our investment strategy has been to invest in financial instruments that are highly liquid and readily convertible into cash, with maturity dates within three months from the date of purchase. To date, we have not used derivative instruments to mitigate the impact of our market risk exposures. We have also not used, nor do we intend to use, derivatives for trading or speculative purposes.
Interest Rate Risk
We are exposed to market risk related to changes in interest rates. Our investments are considered cash equivalents and primarily consist of money market funds. As of December 31, 2016, we had unrestricted cash and cash equivalents of $34.4 million. The carrying amount of our cash and cash equivalents reasonably approximates fair value, due to the short maturities of these investments. The primary objectives of our investment activities are the preservation of capital, the fulfillment of liquidity needs and the fiduciary control of cash and investments. We do not enter into investments for trading or speculative purposes. Our investments are exposed to market risk due to a fluctuation in interest rates, which may affect our interest income and the fair market value of our investments. Due to the short-term nature of our investment portfolio, we believe only dramatic fluctuations in interest rates would have a material effect on our investments. As such we do not expect our operating results or cash flows to be materially affected by a sudden change in market interest rates.
As of December 31, 2016 we had borrowings outstanding in the aggregate of $3.4 million. Our outstanding long-term borrowings consist of fixed and variable interest rate financial instruments. The interest rates of our borrowings range from 5% to 6%. A hypothetical 10% increase or decrease in interest rates relative to our current interest rates would not have a material impact on the fair values of all of our outstanding borrowings. Changes in interest rates would, however, affect operating results and cash flows, because of the variable rate nature of our borrowings. A hypothetical 10% increase or decrease in interest rates relative to interest rates as of December 31, 2016 would result in an insignificant impact to interest expense for 2016.
Foreign Currency Exchange Risk
We have foreign currency risks related to our revenues and operating expenses denominated in currencies other than the U.S. Dollar, primarily the Euro, British Pound Sterling, Canadian Dollar, Singapore Dollar, Japanese Yen, Chinese Yuan, and Australian Dollar. Revenues outside of the United States as a percentage of consolidated revenues were 31%, 33% and 34% during 2016, 2015 and 2014, respectively. Changes in exchange rates may negatively affect our revenues and other operating results as
47
expressed in U.S. Dollars. Aggregate foreign currency (losses) gains included in determining net loss were $- million, $0.3 million and $(0.5) million during 2016, 2015 and 2014, respectively. Transaction gains and losses are included in other income (expenses), net.
As our international operations grow, our risks associated with fluctuation in currency rates will become greater, and we will continue to reassess our approach to managing this risk. In addition, currency fluctuations or a weakening U.S. Dollar can increase the costs of any potential international expansion, while a strengthening U.S. Dollar can negatively impact our international revenues. To date, we have not entered into any foreign currency hedging contracts, since exchange rate fluctuations have not had a material impact on our operating results and cash flows. Based on our current international structure, we do not plan on engaging in hedging activities in the near future, and we also do not expect that the effects of a 10% shift in foreign currency exchange rates would have a material impact on any financial instruments currently held by us.
Inflation Risk
We do not believe that inflation has had a material effect on our business, financial condition or results of operations. Nonetheless, if our costs were to become subject to significant inflationary pressures, we may not be able to fully offset such higher costs through price increases. Our inability or failure to do so could harm our business, financial condition and results of operations.
The information in response to this item is included in our consolidated financial statements, together with the report thereon of PricewaterhouseCoopers LLP, beginning on page F-1 of this Annual Report on Form 10-K, and in Item 7 under the heading Management’s Discussion and Analysis of Financial Condition and Results of Operations.
None.
Evaluation of Disclosure Controls and Procedures
Regulations under the Securities Exchange Act of 1934 (“Exchange Act”) require public companies, including us, to maintain “disclosure controls and procedures,” which are defined in Rule 13a-15(e) and Rule 15d-15(e) to mean a company’s controls and other procedures that are designed to ensure that information required to be disclosed in the reports that it files or submits under the Exchange Act is recorded, processed, summarized and reported, within the time periods specified in the SEC’s rules and forms. Disclosure controls and procedures include, without limitation, controls and procedures designed to ensure that information required to be disclosed in our reports filed under the Exchange Act is accumulated and communicated to management, including our Principal Executive Officer and Principal Financial Officer, or persons performing similar functions, as appropriate to allow timely decisions regarding required or necessary disclosures.
In designing and evaluating our disclosure controls and procedures, management recognizes that disclosure controls and procedures, no matter how well conceived and operated, can provide only reasonable, not absolute, assurance that the objectives of the disclosure controls and procedures are met. Additionally, in designing disclosure controls and procedures, our management necessarily was required to apply its judgment in evaluating the cost-benefit relationship of possible disclosure controls and procedures. Further, controls can be circumvented by the individual acts of some persons, by collusion of two or more people or by management override of the controls. The design of any system of controls also is based in part upon certain assumptions about the likelihood of future events, and there can be no assurance that any design will succeed in achieving its stated goals under all potential future conditions; over time, controls may become inadequate because of changes in conditions, or the degree of compliance with policies or procedures may deteriorate. Because of the inherent limitations in a cost effective control system, misstatements due to error or fraud may occur and not be detected.
Management, with the participation of our Principal Executive Officer and Principal Financial Officer have evaluated the effectiveness of the disclosure controls and procedures as of the end of the period. Based on such evaluation, the Principal Executive Officer and Principal Financial Officer have concluded that, as of December 31, 2016, our disclosure controls and procedures were not effective to provide reasonable assurance because of a material weakness in internal control over financial reporting, as described below.
48
Management’s Annual Report on Internal Control over Financial Reporting
Management is responsible for establishing and maintaining adequate internal control over financial reporting, as such term is defined in Exchange Act Rules 13a-15(f) and 15(d)-15(f). Our internal control over financial reporting includes those policies and procedures that (i) pertain to the maintenance of records that, in reasonable detail, accurately and fairly reflect the transactions and dispositions of our assets; (ii) provide reasonable assurance that transactions are recorded as necessary to permit preparation of the financial statements in accordance with generally accepted accounting principles, and that receipts and expenditures are being made only in accordance with authorizations of our management and directors; and (iii) provide reasonable assurance regarding prevention or timely detection of unauthorized acquisition, use, or disposition of our assets that could have a material effect on the financial statements.
Internal control over financial reporting is designed to provide reasonable assurance regarding the reliability of financial reporting and the preparation of financial statements prepared for external purposes in accordance with generally accepted accounting principles. Because of its inherent limitations, internal control over financial reporting may not prevent or detect misstatements. Also, projections of any evaluation of effectiveness to future periods are subject to the risk that controls may become inadequate because of changes in conditions, or that the degree of compliance with the policies or procedures may deteriorate.
Our management, with the participation of our Principal Executive Officer and Principal Financial Officer, conducted an evaluation of the effectiveness of our internal control over financial reporting based on the framework in Internal Control – Integrated Framework (2013) issued by the Committee of Sponsoring Organizations of the Treadway Commission (“COSO”). As a result of that evaluation of internal controls, management concluded that a material weakness exists as described below.
Material Weakness
A material weakness is a deficiency or a combination of deficiencies, in internal control over financial reporting, such that there is a reasonable possibility that a material misstatement of the registrant’s annual or interim financial statement will not be prevented or detected in a timely basis.
We did not maintain effective controls over the preparation and review of the annual income tax provision. Specifically, during the review of the annual income tax provision in connection with the preparation of our consolidated financial statements for the year ended December 31, 2016, an error was identified that related to the accounting for changes in uncertain tax positions at one of the Company’s subsidiaries in France. Once this error was identified, an accounting adjustment was recorded to the Company’s liability for uncertain tax positions and the provision for income taxes, as well as the related income tax disclosures, on the consolidated financial statements for the year ended December 31, 2016.
Although the error was identified prior to the completion of our 2016 consolidated financial statements, management determined that a design deficiency existed in a control intended to properly account for and present the accounting for income taxes in accordance with U.S. generally accepted accounting principles. The control deficiency did not result in a misstatement of any previously issued consolidated financial statements. Additionally, this control deficiency could result in misstatements of the aforementioned account balances, and such misstatement would have resulted in a material misstatement in our annual or interim consolidated financial statements. Accordingly, our management concluded that the control deficiency constitutes a material weakness.
Material Weakness Remediation Efforts
Management is in the process of developing and implementing a remediation plan in response to the identified material weakness described above. The remediation efforts in process or expected to be implemented include the following:
|
|
• |
Enhancing the formality and rigor of management’s review of the income tax provision; and |
|
|
• |
Engaging additional tax resources to assist in strengthening our income tax provision control through improved documentation, technical oversight and training. |
These efforts will take time to be fully integrated and confirmed to be effective and sustainable, and additional controls may also be required over time. Until the remediation efforts are fully implemented and tested, the material weakness described above will continue to exist. Management believes, however, that the actions described above will strengthen our internal controls over financial reporting related to the process of accounting for income taxes, and once completed will address the identified material weakness.
None.
49
The information required by this item concerning our directors, executive officers, Section 16 compliance and corporate governance matters will be set forth under the headings “Directors and Executive Officers” and “Section 16(a) Beneficial Ownership Compliance” in the Proxy Statement and is incorporated into this report by reference.
The information required by this item regarding executive compensation will be set forth under the headings “Executive Compensation” in the Proxy Statement and is incorporated into this report by reference.
|
ITEM 12. |
SECURITY OWNERSHIP OF CERTAIN BENEFICIAL OWNERS AND MANAGEMENT AND RELATED STOCKHOLDER MATTERS |
The information required by this item regarding security ownership of certain beneficial owners and management and related stockholder matters will be set forth under the headings “Security Ownership of Certain Beneficial Owners and Management” in the Proxy Statement and is incorporated into this report by reference.
The information required by this item regarding related party transactions and director independence will be set forth under the headings “Board of Directors and Committees of the Board,” “Related Party Transactions” in the Proxy Statement and is incorporated into this report by reference.
The information required by this item regarding principal accounting fees and services will be set forth under the headings “Ratification of Appointment of Independent Registered Public Accounting Firm” in the Proxy Statement and is incorporated into this report by reference.
50
(a)
(1) Financial Statements
The list of consolidated financial statements and schedules set forth in the accompanying Index to the Consolidated Financial Statements at page F-1 of this annual report is incorporated herein by reference. Such consolidated financial statements and schedules are filed as part of this annual report.
(2) Financial Statement Schedules
The schedule required by this item is included in Note 2 to the Consolidated Financial Statements. All other financial statement schedules are not required or are inapplicable and therefore have been omitted.
(b)
(3) Exhibits
The exhibits listed on the accompanying Index to Exhibits in Item 15(b) below are filed or incorporated by reference as part of this Annual Report on Form 10-K. See Exhibit Index immediately following the Signature Pages.
None.
51
INDEX TO CONSOLIDATED FINANCIAL STATEMENTS
|
|
|
Page |
|
|
|
|
|
53 |
|
|
|
|
|
54 |
|
|
|
|
|
55 |
|
|
|
|
|
56 |
|
|
|
|
|
57 |
|
|
|
|
|
58 |
|
|
The supplementary financial information required by this Item 8 is included in Part II, Item 7 under the caption “Quarterly Results of Operations Data,” which is incorporated herein by reference.
52
Report of Independent Registered Public Accounting Firm
To the Board of Directors and Stockholders of Marin Software Incorporated
In our opinion, the accompanying consolidated balance sheets and the related consolidated statements of comprehensive loss, of stockholders’ equity and of cash flows present fairly, in all material respects, the financial position of Marin Software Incorporated and its subsidiaries as of December 31, 2016 and 2015, and the results of their operations and their cash flows for each of the three years in the period ended December 31, 2016 in conformity with accounting principles generally accepted in the United States of America. These financial statements are the responsibility of the Company’s management. Our responsibility is to express an opinion on these financial statements based on our audits. We conducted our audits of these statements in accordance with the standards of the Public Company Accounting Oversight Board (United States). Those standards require that we plan and perform the audit to obtain reasonable assurance about whether the financial statements are free of material misstatement. An audit includes examining, on a test basis, evidence supporting the amounts and disclosures in the financial statements, assessing the accounting principles used and significant estimates made by management, and evaluating the overall financial statement presentation. We believe that our audits provide a reasonable basis for our opinion.
/s/ PricewaterhouseCoopers LLP
San Francisco, California
February 28, 2017
53
(in thousands, except per share data)
|
|
|
December 31, |
|
|||||
|
|
|
2016 |
|
|
2015 |
|
||
|
Assets |
|
|
|
|
|
|
|
|
|
Current assets |
|
|
|
|
|
|
|
|
|
Cash and cash equivalents |
|
$ |
34,420 |
|
|
$ |
37,326 |
|
|
Restricted cash |
|
|
1,293 |
|
|
|
— |
|
|
Accounts receivable, net |
|
|
18,761 |
|
|
|
21,718 |
|
|
Prepaid expenses and other current assets |
|
|
3,808 |
|
|
|
4,186 |
|
|
Total current assets |
|
|
58,282 |
|
|
|
63,230 |
|
|
Property and equipment, net |
|
|
20,581 |
|
|
|
21,817 |
|
|
Goodwill |
|
|
19,318 |
|
|
|
19,417 |
|
|
Intangible assets, net |
|
|
7,325 |
|
|
|
10,405 |
|
|
Other noncurrent assets |
|
|
1,587 |
|
|
|
1,323 |
|
|
Total assets |
|
$ |
107,093 |
|
|
$ |
116,192 |
|
|
Liabilities and Stockholders' Equity |
|
|
|
|
|
|
|
|
|
Current liabilities |
|
|
|
|
|
|
|
|
|
Accounts payable |
|
$ |
2,434 |
|
|
$ |
1,710 |
|
|
Accrued expenses and other current liabilities |
|
|
8,362 |
|
|
|
11,185 |
|
|
Deferred revenues |
|
|
795 |
|
|
|
1,430 |
|
|
Current portion of long-term debt |
|
|
1,015 |
|
|
|
1,384 |
|
|
Total current liabilities |
|
|
12,606 |
|
|
|
15,709 |
|
|
Long-term debt, less current portion |
|
|
2,381 |
|
|
|
1,557 |
|
|
Other long-term liabilities |
|
|
4,508 |
|
|
|
4,795 |
|
|
Total liabilities |
|
|
19,495 |
|
|
|
22,061 |
|
|
Commitments and contingencies (Note 16) |
|
|
|
|
|
|
|
|
|
Stockholders' equity |
|
|
|
|
|
|
|
|
|
Convertible preferred stock, $0.001 par value - 10,000 shares authorized, no shares issued and outstanding at December 31, 2016, and December 31, 2015, respectively |
|
|
— |
|
|
|
— |
|
|
Common stock, $0.001 par value - 500,000 shares authorized, 38,792 and 37,568 shares issued, 38,787 and 37,419 outstanding at December 31, 2016, and December 31, 2015, respectively |
|
|
39 |
|
|
|
37 |
|
|
Additional paid-in capital |
|
|
286,659 |
|
|
|
275,604 |
|
|
Accumulated deficit |
|
|
(196,213 |
) |
|
|
(179,733 |
) |
|
Accumulated other comprehensive loss |
|
|
(2,887 |
) |
|
|
(1,777 |
) |
|
Total stockholders' equity |
|
|
87,598 |
|
|
|
94,131 |
|
|
Total liabilities and stockholders' equity |
|
$ |
107,093 |
|
|
$ |
116,192 |
|
The accompanying notes are an integral part of these consolidated financial statements.
54
Consolidated Statements of Comprehensive Loss
(in thousands, except per share data)
|
|
|
Years Ended December 31, |
|
|||||||||
|
|
|
2016 |
|
|
2015 |
|
|
2014 |
|
|||
|
Revenues, net |
|
$ |
99,878 |
|
|
$ |
108,530 |
|
|
$ |
99,354 |
|
|
Cost of revenues |
|
|
35,203 |
|
|
|
40,137 |
|
|
|
35,614 |
|
|
Gross profit |
|
|
64,675 |
|
|
|
68,393 |
|
|
|
63,740 |
|
|
Operating expenses |
|
|
|
|
|
|
|
|
|
|
|
|
|
Sales and marketing |
|
|
32,889 |
|
|
|
45,132 |
|
|
|
47,716 |
|
|
Research and development |
|
|
27,841 |
|
|
|
33,318 |
|
|
|
28,751 |
|
|
General and administrative |
|
|
19,890 |
|
|
|
22,391 |
|
|
|
21,257 |
|
|
Total operating expenses |
|
|
80,620 |
|
|
|
100,841 |
|
|
|
97,724 |
|
|
Loss from operations |
|
|
(15,945 |
) |
|
|
(32,448 |
) |
|
|
(33,984 |
) |
|
Interest expense, net |
|
|
(129 |
) |
|
|
(118 |
) |
|
|
(177 |
) |
|
Other income (expenses), net |
|
|
998 |
|
|
|
222 |
|
|
|
(466 |
) |
|
Loss before (provision for) benefit from income taxes |
|
|
(15,076 |
) |
|
|
(32,344 |
) |
|
|
(34,627 |
) |
|
(Provision for) benefit from income taxes |
|
|
(1,404 |
) |
|
|
(1,005 |
) |
|
|
1,456 |
|
|
Net loss |
|
|
(16,480 |
) |
|
|
(33,349 |
) |
|
|
(33,171 |
) |
|
Foreign currency translation adjustments |
|
|
(1,110 |
) |
|
|
(1,030 |
) |
|
|
(747 |
) |
|
Comprehensive loss |
|
$ |
(17,590 |
) |
|
$ |
(34,379 |
) |
|
$ |
(33,918 |
) |
|
Net loss per share available to common stockholders, basic and diluted |
|
$ |
(0.43 |
) |
|
$ |
(0.91 |
) |
|
$ |
(0.97 |
) |
|
Weighted-average shares used to compute net loss per share available to common stockholders, basic and diluted |
|
|
38,318 |
|
|
|
36,580 |
|
|
|
34,210 |
|
|
Stock-based compensation is allocated as follows (Note 12): |
|
|
|
|
|
|
|
|
|
|
|
|
|
Cost of revenues |
|
$ |
1,314 |
|
|
$ |
1,171 |
|
|
$ |
765 |
|
|
Sales and marketing |
|
|
1,281 |
|
|
|
2,537 |
|
|
|
1,895 |
|
|
Research and development |
|
|
4,989 |
|
|
|
7,518 |
|
|
|
3,785 |
|
|
General and administrative |
|
|
2,711 |
|
|
|
4,393 |
|
|
|
2,797 |
|
|
Amortization of intangible assets is allocated as follows (Note 6): |
|
|
|
|
|
|
|
|
|
|
|
|
|
Cost of revenues |
|
$ |
1,027 |
|
|
$ |
1,033 |
|
|
$ |
399 |
|
|
Sales and marketing |
|
|
934 |
|
|
|
921 |
|
|
|
261 |
|
|
Research and development |
|
|
1,027 |
|
|
|
1,034 |
|
|
|
397 |
|
|
General and administrative |
|
|
92 |
|
|
|
146 |
|
|
|
74 |
|
|
Restructuring related expenses are allocated as follows (Note 4): |
|
|
|
|
|
|
|
|
|
|
|
|
|
Cost of revenues |
|
$ |
184 |
|
|
$ |
173 |
|
|
$ |
— |
|
|
Sales and marketing |
|
|
348 |
|
|
|
718 |
|
|
|
— |
|
|
Research and development |
|
|
44 |
|
|
|
53 |
|
|
|
— |
|
|
General and administrative |
|
|
20 |
|
|
|
270 |
|
|
|
— |
|
The accompanying notes are an integral part of these consolidated financial statements.
55
Consolidated Statements of Stockholders’ Equity
(in thousands)
|
|
|
Common Stock |
|
|
Additional Paid-In Capital |
|
|
Accumulated Deficit |
|
|
Accumulated Other Comprehensive Loss |
|
|
Total Stockholders' Equity |
|
|||||||||
|
|
|
Shares |
|
|
Amount |
|
|
Additional Paid-In Capital |
|
|
Accumulated Deficit |
|
|
Accumulated Other Comprehensive Loss |
|
|
Total Stockholders' Equity |
|
||||||
|
Balances at December 31, 2013 |
|
|
32,953 |
|
|
$ |
33 |
|
|
$ |
228,512 |
|
|
$ |
(113,201 |
) |
|
$ |
— |
|
|
$ |
115,344 |
|
|
Issuance of common stock from exercise of vested stock options and vesting of options and shares subject to repurchase |
|
|
938 |
|
|
|
— |
|
|
|
2,841 |
|
|
|
— |
|
|
|
— |
|
|
|
2,841 |
|
|
Issuance of common stock under employee stock purchase plan |
|
|
178 |
|
|
|
— |
|
|
|
1,402 |
|
|
|
— |
|
|
|
— |
|
|
|
1,402 |
|
|
Issuance of unrestricted common stock in connection with acquisition of NowSpots Inc. |
|
|
1,119 |
|
|
|
2 |
|
|
|
11,193 |
|
|
|
— |
|
|
|
— |
|
|
|
11,195 |
|
|
Stock issuance costs incurred in connection with acquisition of NowSpots Inc. |
|
|
— |
|
|
|
— |
|
|
|
(52 |
) |
|
|
— |
|
|
|
— |
|
|
|
(52 |
) |
|
Stock-based compensation expense |
|
|
— |
|
|
|
— |
|
|
|
9,242 |
|
|
|
— |
|
|
|
— |
|
|
|
9,242 |
|
|
Repurchase of unvested shares |
|
|
(7 |
) |
|
|
— |
|
|
|
(20 |
) |
|
|
— |
|
|
|
— |
|
|
|
(20 |
) |
|
Stock-based compensation tax benefits |
|
|
— |
|
|
|
— |
|
|
|
126 |
|
|
|
— |
|
|
|
— |
|
|
|
126 |
|
|
Net loss |
|
|
— |
|
|
|
— |
|
|
|
— |
|
|
|
(33,171 |
) |
|
|
— |
|
|
|
(33,171 |
) |
|
Foreign currency translation adjustments and other, net |
|
|
— |
|
|
|
— |
|
|
|
(23 |
) |
|
|
(20 |
) |
|
|
(747 |
) |
|
|
(790 |
) |
|
Balances at December 31, 2014 |
|
|
35,181 |
|
|
|
35 |
|
|
|
253,221 |
|
|
|
(146,392 |
) |
|
|
(747 |
) |
|
|
106,117 |
|
|
Issuance of common stock from exercise of vested stock options, vesting of restricted stock units and vesting of options and shares subject to repurchase (Note 11) |
|
|
1,345 |
|
|
|
1 |
|
|
|
2,013 |
|
|
|
— |
|
|
|
— |
|
|
|
2,014 |
|
|
Tax withholding related to vesting of restricted stock units |
|
|
— |
|
|
|
— |
|
|
|
(571 |
) |
|
|
— |
|
|
|
— |
|
|
|
(571 |
) |
|
Issuance of common stock under employee stock purchase plan |
|
|
257 |
|
|
|
— |
|
|
|
1,035 |
|
|
|
— |
|
|
|
— |
|
|
|
1,035 |
|
|
Issuance of unrestricted common stock in connection with acquisition of SocialMoov S.A.S. |
|
|
636 |
|
|
|
1 |
|
|
|
4,337 |
|
|
|
— |
|
|
|
— |
|
|
|
4,338 |
|
|
Stock issuance costs incurred in connection with acquisition of SocialMoov S.A.S. |
|
|
— |
|
|
|
— |
|
|
|
(51 |
) |
|
|
— |
|
|
|
— |
|
|
|
(51 |
) |
|
Stock-based compensation expense |
|
|
— |
|
|
|
— |
|
|
|
15,619 |
|
|
|
— |
|
|
|
— |
|
|
|
15,619 |
|
|
Repurchase of unvested shares |
|
|
— |
|
|
|
— |
|
|
|
(2 |
) |
|
|
— |
|
|
|
— |
|
|
|
(2 |
) |
|
Stock-based compensation tax benefits |
|
|
— |
|
|
|
— |
|
|
|
3 |
|
|
|
— |
|
|
|
— |
|
|
|
3 |
|
|
Net loss |
|
|
— |
|
|
|
— |
|
|
|
— |
|
|
|
(33,349 |
) |
|
|
— |
|
|
|
(33,349 |
) |
|
Foreign currency translation adjustments and other, net |
|
|
— |
|
|
|
— |
|
|
|
— |
|
|
|
8 |
|
|
|
(1,030 |
) |
|
|
(1,022 |
) |
|
Balances at December 31, 2015 |
|
|
37,419 |
|
|
|
37 |
|
|
|
275,604 |
|
|
|
(179,733 |
) |
|
|
(1,777 |
) |
|
|
94,131 |
|
|
Issuance of common stock from exercise of vested stock options, vesting of restricted stock units and vesting of options and shares subject to repurchase (Note 11) |
|
|
612 |
|
|
|
1 |
|
|
|
569 |
|
|
|
— |
|
|
|
— |
|
|
|
570 |
|
|
Tax withholding related to vesting of restricted stock units |
|
|
— |
|
|
|
— |
|
|
|
(362 |
) |
|
|
— |
|
|
|
— |
|
|
|
(362 |
) |
|
Issuance of common stock under employee stock purchase plan |
|
|
292 |
|
|
|
— |
|
|
|
547 |
|
|
|
— |
|
|
|
— |
|
|
|
547 |
|
|
Issuance of unrestricted common stock in connection with acquisition of SocialMoov S.A.S. |
|
|
464 |
|
|
|
1 |
|
|
|
— |
|
|
|
— |
|
|
|
— |
|
|
|
1 |
|
|
Stock-based compensation expense |
|
|
— |
|
|
|
— |
|
|
|
10,295 |
|
|
|
— |
|
|
|
— |
|
|
|
10,295 |
|
|
Net loss |
|
|
— |
|
|
|
— |
|
|
|
— |
|
|
|
(16,480 |
) |
|
|
— |
|
|
|
(16,480 |
) |
|
Foreign currency translation adjustments and other, net |
|
|
— |
|
|
|
— |
|
|
|
6 |
|
|
|
— |
|
|
|
(1,110 |
) |
|
|
(1,104 |
) |
|
Balances at December 31, 2016 |
|
|
38,787 |
|
|
$ |
39 |
|
|
$ |
286,659 |
|
|
$ |
(196,213 |
) |
|
$ |
(2,887 |
) |
|
$ |
87,598 |
|
The accompanying notes are an integral part of these consolidated financial statements.
56
Consolidated Statements of Cash Flows
(in thousands)
|
|
|
Years Ended December 31, |
|
|||||||||
|
|
|
2016 |
|
|
2015 |
|
|
2014 |
|
|||
|
Operating activities |
|
|
|
|
|
|
|
|
|
|
|
|
|
Net loss |
|
$ |
(16,480 |
) |
|
$ |
(33,349 |
) |
|
$ |
(33,171 |
) |
|
Adjustments to reconcile net loss to net cash provided by (used in) operating activities |
|
|
|
|
|
|
|
|
|
|
|
|
|
Depreciation |
|
|
6,035 |
|
|
|
6,993 |
|
|
|
5,669 |
|
|
Amortization of internally developed software |
|
|
2,988 |
|
|
|
2,550 |
|
|
|
1,905 |
|
|
Amortization of intangible assets |
|
|
3,080 |
|
|
|
3,134 |
|
|
|
1,131 |
|
|
(Gain) loss on disposal of property and equipment |
|
|
(3 |
) |
|
|
19 |
|
|
|
16 |
|
|
Unrealized foreign currency gains |
|
|
(419 |
) |
|
|
(216 |
) |
|
|
— |
|
|
Noncash interest expense related to debt agreements |
|
|
27 |
|
|
|
42 |
|
|
|
124 |
|
|
Stock-based compensation related to equity awards and restricted stock |
|
|
10,295 |
|
|
|
15,619 |
|
|
|
9,242 |
|
|
Provision for bad debts |
|
|
2,328 |
|
|
|
1,210 |
|
|
|
821 |
|
|
Deferred income tax benefits |
|
|
(305 |
) |
|
|
(177 |
) |
|
|
(2,258 |
) |
|
Excess tax benefits from stock-based award activities |
|
|
— |
|
|
|
(3 |
) |
|
|
(126 |
) |
|
Payment of contingent consideration for prior acquisition |
|
|
(93 |
) |
|
|
— |
|
|
|
— |
|
|
Changes in operating assets and liabilities, net of effect of acquisition |
|
|
|
|
|
|
|
|
|
|
|
|
|
Accounts receivable |
|
|
795 |
|
|
|
(2,986 |
) |
|
|
(4,561 |
) |
|
Prepaid expenses and other current assets |
|
|
546 |
|
|
|
575 |
|
|
|
(2,009 |
) |
|
Other assets |
|
|
(346 |
) |
|
|
348 |
|
|
|
(497 |
) |
|
Accounts payable |
|
|
741 |
|
|
|
(1,597 |
) |
|
|
1,387 |
|
|
Deferred revenues |
|
|
(628 |
) |
|
|
(625 |
) |
|
|
(540 |
) |
|
Accrued expenses and other current liabilities |
|
|
(2,842 |
) |
|
|
1,382 |
|
|
|
(1,523 |
) |
|
Net cash provided by (used in) operating activities |
|
|
5,719 |
|
|
|
(7,081 |
) |
|
|
(24,390 |
) |
|
Investing activities |
|
|
|
|
|
|
|
|
|
|
|
|
|
Purchases of property and equipment |
|
|
(1,207 |
) |
|
|
(8,584 |
) |
|
|
(5,317 |
) |
|
Proceeds from disposal of property and equipment |
|
|
5 |
|
|
|
— |
|
|
|
— |
|
|
Capitalization of internally developed software |
|
|
(4,712 |
) |
|
|
(5,568 |
) |
|
|
(3,146 |
) |
|
Acquisitions of business, net of cash acquired |
|
|
— |
|
|
|
(7,738 |
) |
|
|
(4,151 |
) |
|
Net cash used in investing activities |
|
|
(5,914 |
) |
|
|
(21,890 |
) |
|
|
(12,614 |
) |
|
Financing activities |
|
|
|
|
|
|
|
|
|
|
|
|
|
Repayment of notes payable |
|
|
(1,436 |
) |
|
|
(3,649 |
) |
|
|
(3,130 |
) |
|
Debt issuance costs |
|
|
— |
|
|
|
(53 |
) |
|
|
— |
|
|
Repurchase of unvested shares |
|
|
— |
|
|
|
(2 |
) |
|
|
(20 |
) |
|
Proceeds from exercise of common stock options |
|
|
390 |
|
|
|
1,439 |
|
|
|
2,472 |
|
|
Proceeds from employee stock purchase plan, net |
|
|
663 |
|
|
|
968 |
|
|
|
1,402 |
|
|
Excess tax benefits from stock-based award activities |
|
|
— |
|
|
|
3 |
|
|
|
126 |
|
|
Net cash (used in) provided by financing activities |
|
|
(383 |
) |
|
|
(1,294 |
) |
|
|
850 |
|
|
Effect of foreign exchange rate changes on cash and cash equivalents and restricted cash |
|
|
(1,035 |
) |
|
|
(662 |
) |
|
|
— |
|
|
Net decrease in cash and cash equivalents and restricted cash |
|
|
(1,613 |
) |
|
|
(30,927 |
) |
|
|
(36,154 |
) |
|
Cash and cash equivalents and restricted cash |
|
|
|
|
|
|
|
|
|
|
|
|
|
Beginning of year |
|
|
37,326 |
|
|
|
68,253 |
|
|
|
104,407 |
|
|
End of year |
|
$ |
35,713 |
|
|
$ |
37,326 |
|
|
$ |
68,253 |
|
|
Supplemental disclosures of other cash flow information |
|
|
|
|
|
|
|
|
|
|
|
|
|
Cash paid for interest |
|
$ |
189 |
|
|
$ |
106 |
|
|
$ |
106 |
|
|
Cash paid for income taxes |
|
|
728 |
|
|
|
404 |
|
|
|
221 |
|
|
Supplemental disclosure of noncash investing and financing activities |
|
|
|
|
|
|
|
|
|
|
|
|
|
Acquisition of equipment through capital leases |
|
$ |
1,864 |
|
|
$ |
2,350 |
|
|
$ |
— |
|
|
Purchases of property and equipment recorded in accounts payable and accrued expenses |
|
|
5 |
|
|
|
— |
|
|
|
1,364 |
|
|
Issuance of common stock under employee stock purchase plan |
|
|
547 |
|
|
|
1,035 |
|
|
|
1,402 |
|
|
Issuance of common stock in connection with acquisitions of businesses |
|
|
— |
|
|
|
4,338 |
|
|
|
11,195 |
|
The accompanying notes are an integral part of these consolidated financial statements.
57
Notes to Consolidated Financial Statements
(dollars and share numbers in thousands, except per share data)
1. Background
Marin Software Incorporated (the “Company”) was incorporated in Delaware in March 2006. The Company provides a leading cross-channel, cross-device, enterprise marketing software platform for search, display and social advertising channels, offered as an integrated software-as-a-service, or SaaS, solution for advertisers and agencies. The Company’s platform enables digital marketers to improve financial performance, realize efficiencies and time savings, and make better business decisions. The Company’s corporate headquarters are located in San Francisco, California, and the Company has additional offices in the following locations: Austin, Chicago, Dublin, Hamburg, London, New York, Paris, Portland, Shanghai, Sydney and Tokyo.
References to “2016,” “2015” and “2014” shall mean the year ended December 31, 2016, the year ended December 31, 2015 and the year ended December 31, 2014, respectively. All amounts presented in these notes to the consolidated financial statements are in thousands, except where noted.
2. Summary of Significant Accounting Policies
Basis of Presentation
The accompanying consolidated financial statements have been prepared on a going concern basis, which contemplates the realization of assets and the satisfaction of liabilities in the normal course of business.
Principles of Consolidation
The consolidated financial statements include the accounts of the Company and its wholly-owned subsidiaries. All intercompany accounts and transactions have been eliminated upon consolidation.
Accounting Estimates
The preparation of financial statements in conformity with accounting principles generally accepted in the United States (“GAAP”) requires management to make certain estimates and assumptions that affect the amounts reported in the financial statements and accompanying notes. The Company is subject to uncertainties such as the impact of future events, economic and political factors and changes in the Company’s business environment; therefore, actual results could differ from these estimates. Accordingly, the accounting estimates used in the preparation of the Company’s financial statements will change as new events occur, as more experience is acquired, as additional information is obtained and as the Company’s operating environment changes. Changes in estimates are made when circumstances warrant. Such changes in estimates and refinements in estimation methodologies are reflected in reported results of operations and if material, the effects of changes in estimates are disclosed in the notes to the consolidated financial statements. Significant estimates and assumptions by management affect the allowances for doubtful accounts and customer credits, the carrying value of long-lived assets (including goodwill and intangible assets), the useful lives of long-lived assets, the provision for income taxes and related deferred taxes, and stock-based compensation.
Certain Significant Risks and Uncertainties
The Company operates in a rapidly changing environment that involves a number of risks, some of which are beyond the Company’s control that could have a material adverse effect on the Company’s business, operating results, and financial condition. These risks include, among others, the Company’s: history of losses and ability to achieve profitability in the future; highly competitive environment; ability to maintain and increase usage rate of the Company’s platform; and ability to increase demand for its solutions.
Concentration of Credit Risk
Financial instruments that potentially subject the Company to concentrations of credit risk consist of cash, cash equivalents and accounts receivable. The Company’s cash and cash equivalents are placed with high-credit-quality financial institutions and issuers, and at times exceed federally insured limits. The Company limits its concentration of risk in cash equivalents and short-term investments by diversifying its investments among a variety of industries and issuers and by limiting the average maturity to one year or less. The Company has not experienced any loss relating to cash and cash equivalents in these accounts. The Company performs periodic credit evaluations of its customers and generally does not require collateral.
58
As of December 31, 2016 and 2015, no single customer accounted for greater than 10% of net accounts receivable. No single customer accounted for greater than 10% of consolidated revenues, net during the years ended December 31, 2016, 2015 and 2014.
Cash and Cash Equivalents and Restricted Cash
The Company considers all highly liquid investments with an original or remaining maturity from the Company’s date of purchase of 90 days or less to be cash equivalents. Deposits held with financial institutions are likely to exceed the amount of insurance on these deposits. Cash equivalents consist of money market funds, which are readily convertible into cash and are stated at cost, which approximates fair market value. Cash equivalents were $15,657 and $25,564 as of December 31, 2016 and 2015, respectively.
Restricted cash consists of deposits held with a financial institution to secure the Company’s non-cancelable lease for its corporate headquarters in San Francisco (see Note 8).
Fair Value of Financial Instruments
The Company’s financial instruments, including cash equivalents, accounts receivable, accounts payable and accrued expenses are carried at cost, which approximates fair value because of the short-term nature of those instruments. Based on borrowing rates available to the Company for loans with similar terms and maturities, and in consideration of the Company’s credit risk profile, the carrying value of borrowings (Note 8) approximates fair value (Level 2 within the fair value hierarchy).
The Company measures and reports certain financial assets at fair value on a recurring basis, including its investments in money market funds. The fair value hierarchy prioritizes the inputs into three broad levels:
|
Level 1 |
|
Inputs are unadjusted quoted prices in active markets for identical assets or liabilities. |
|
|
|
|
|
Level 2 |
|
Inputs are quoted prices for similar assets and liabilities in active markets or inputs that are observable for the asset or liability, either directly or indirectly through market corroboration, for substantially the full term of the financial instrument. |
|
|
|
|
|
Level 3 |
|
Inputs are unobservable inputs based on the Company’s assumptions. |
A financial instrument’s level within the fair value hierarchy is based on the lowest level of input that is significant to the fair value measurement.
Allowance for Doubtful Accounts and Revenue Credits
The allowance for doubtful accounts reflects the Company’s best estimate of probable losses inherent in the Company’s receivables portfolio determined on the basis of historical experience, specific allowances for known troubled accounts and other currently available evidence. The Company has not experienced significant credit losses from its accounts receivable. The Company performs a regular review of its customers’ payment histories and associated credit risks and it does not require collateral from its customers. Certain contracts with advertising agencies contain sequential liability provisions, whereby the agency does not have an obligation to pay the Company until payment is received from the agency’s customers. In these circumstances, the Company evaluates the credit worthiness of the agency’s customers, in addition to the agency itself. The following are changes in the allowance for doubtful accounts during 2016, 2015 and 2014, respectively.
|
|
|
Years Ended December 31, |
|
|||||||||
|
|
|
2016 |
|
|
2015 |
|
|
2014 |
|
|||
|
Balances at beginning of year |
|
$ |
2,188 |
|
|
$ |
989 |
|
|
$ |
417 |
|
|
Additions to expense or against goodwill |
|
|
2,328 |
|
|
|
1,652 |
|
|
|
821 |
|
|
Write-offs and other deductions |
|
|
(1,006 |
) |
|
|
(453 |
) |
|
|
(249 |
) |
|
Balances at end of year |
|
$ |
3,510 |
|
|
$ |
2,188 |
|
|
$ |
989 |
|
From time to time, the Company provides credits to customers and an allowance is made based on historical credit activity. As of December 31, 2016 and 2015, the Company recorded an allowance for potential customer credits in the amount of $1,947 and $2,274, respectively.
Property and Equipment
Property and equipment are stated at historical cost less accumulated depreciation and amortization. Depreciation and amortization are computed using the straight-line method over the estimated useful lives of the related assets.
59
The useful lives of the property and equipment are as follows:
|
Computer equipment |
|
3 to 5 years |
|
Office equipment, furniture and fixtures |
|
3 to 5 years |
|
Software |
|
3 years |
|
Leasehold improvements |
|
Shorter of useful life or lease term |
Upon retirement or sale, the cost and related accumulated depreciation are removed from the balance sheet and the resulting gain or loss is reflected in operations. Major additions and improvements are capitalized while repairs and maintenance that do not extend the life of the asset are charged to operations as incurred. Depreciation and amortization expense is allocated to both cost of revenues and operating expenses.
Internally Developed Software
Costs incurred in the development phase are capitalized and amortized over the product’s estimated useful life, which is three years. The Company expenses all costs incurred that relate to planning and post implementation phases of development. Capitalized costs related to internally developed software under development are treated as construction in progress until the program, feature or functionality is ready for its intended use, at which time amortization commences. For 2016, 2015 and 2014, the Company capitalized $4,712, $5,568, and $3,146 of costs related to internally developed software, respectively. Amortization of capitalized costs related to internally developed software was $2,988, $2,550, and $1,905 for 2016, 2015 and 2014, respectively. As of December 31, 2016 and 2015, unamortized internally developed software costs totaled $10,218 and $8,495, respectively. Amortization of internally developed software is reflected in cost of revenues. Costs associated with minor enhancements and maintenance are expensed as incurred.
Goodwill, Intangible Assets and Impairment Assessments
Goodwill represents the excess of the purchase price in a business combination over the fair value of net tangible and intangible assets acquired. Intangible assets that are not considered to have an indefinite useful life are amortized over their useful lives, which range from two to six years. Estimated remaining useful lives of purchased intangible assets are evaluated to assess whether events or changes in circumstances warrant a revision to the remaining periods of amortization.
The Company performs an annual goodwill impairment test during the fourth quarter of the Company’s fiscal year, and more frequently if an event or circumstances indicates that impairment may have occurred. For the purposes of impairment testing, the Company has determined that it has one reporting unit. The Company performs a two-step impairment test of goodwill whereby the fair value of the reporting unit is compared to its carrying value. If the fair value of the reporting unit exceeds the carrying value of the net assets assigned to that unit, goodwill is not considered impaired and further testing is not required. If the carrying value of the net assets assigned to the reporting unit exceeds the fair value of the reporting unit, then the Company must perform the second step of the impairment test in order to determine the implied fair value of the reporting unit’s goodwill. If the carrying value of a reporting unit’s goodwill exceeds its implied fair value, then impairment loss equal to the difference is recorded. The identification and measurement of goodwill impairment involves the estimation of the fair value of the Company. The estimate of fair value of the Company, based on the best information available as of the date of the assessment, is subjective and requires judgment, including management assumptions about expected future revenue forecasts and discount rates, changes in the overall economy, trends in the stock price, any estimated control premium and other operating conditions.
During the fourth quarter of 2016, the market capitalization of the Company’s publicly traded common stock sustained a decline to the extent that it fell below the book value of the Company’s net assets for a period of time before subsequently increasing and rising back above the book value of the net assets. Management considered the possible factors affecting the assessment of the fair value of the Company’s reporting unit for the purposes performing the goodwill impairment assessment, including those listed above. Ultimately it was determined that no goodwill impairment was identified in any of the years presented.
Impairment of Long-Lived Assets
The Company evaluates long-lived assets, excluding goodwill, for potential impairment whenever adverse events or changes in circumstances or business climate indicate that expected undiscounted future cash flows related to such long-lived assets may not be sufficient to support the net book value of such assets. An impairment exists when the carrying value of a long-lived asset exceeds its fair value. An impairment loss is recognized only if the carrying value of a long-lived asset is not recoverable and exceeds its fair value. The carrying value of a long-lived asset is not recoverable if it exceeds the sum of the undiscounted cash flows expected to result from the use and eventual disposition of the asset. There were no such impairment losses during 2016, 2015 or 2014.
60
The Company’s operating lease agreements include provisions for tenant improvement allowances, certain rent holidays and escalations in the base price of the rent payment. The Company defers tenant improvement allowances and amortizes the balance as a reduction to rent expense over the lease term. The Company records rent holidays and rent escalations on a straight-line basis over the lease term. Deferred rent is included in accrued expenses and other current liabilities, as well as other long-term liabilities in the accompanying consolidated balance sheets.
Revenue Recognition
The Company generates revenues principally from subscriptions either directly with advertisers or with advertising agencies to its platform for the management of search, social and display advertising. The Company’s subscription agreements are generally one year or longer in length. The Company’s subscription fee under most contracts is variable based on the value of the advertising spend that the Company’s advertisers manage through the Company’s platform and is generally invoiced on a monthly basis. Contracts with direct advertisers and certain contracts with advertising agencies also include a minimum monthly fee that is payable over the duration of the contract. The Company’s customers do not have the right to take possession of the software supporting the application service at any time, nor do the arrangements contain general rights of return. The Company commences revenue recognition for both direct advertisers and advertising agencies when all of the following conditions are met:
|
|
• |
persuasive evidence of an arrangement exists; |
|
|
• |
the Company’s platform is made available to the customer; |
|
|
• |
the fee is fixed or determinable, and; |
|
|
• |
collection is reasonably assured. |
The Company recognizes the total minimum fee for both direct advertisers and advertising agencies, where applicable, over the duration of the contract, commencing on the date that the Company’s platform is made available to the customer, provided revenues recognized do not exceed amounts that are invoiced and due. The variable fee, which is based on a percentage of the value of the advertising spend managed through the Company’s platform, is recognized once the amount is fixed or determinable, which is generally on a monthly basis concurrent with the issuance of the customer invoice. Signed contracts are used as evidence of an arrangement. The Company assesses collectability based on a number of factors such as past collection history with the customer and creditworthiness of the customer. Certain agreements with advertising agencies also contain sequential liability provisions, which provide that the agency has no obligation to pay the Company until the agency receives payment from its customers. In these circumstances, the Company evaluates the credit worthiness of the agency’s customers, in addition to the agency itself, to conclude whether or not collectability is reasonably assured. If the Company determines collectability is not reasonably assured, the Company defers the revenue recognition until collectability becomes reasonably assured.
The Company applies the authoritative accounting guidance regarding revenue recognition for arrangements with multiple deliverables. Professional services and training, when sold with the Company’s platform subscription services, are accounted for separately when those services have standalone value. In determining whether professional services and training services can be accounted for separately from subscription services, the Company considers the following factors: availability of the services from other vendors; the nature of the services; the dependence of the subscription services on the customer’s decision to buy the professional services; and whether the Company sells the Company’s subscription services without professional services. If the deliverables have stand-alone value, the Company accounts for each deliverable separately and revenues are recognized for the respective deliverables as they are delivered. If one or more of the deliverables do not have stand-alone value, the deliverables that do not have stand-alone value are combined with the final deliverables within the arrangement and treated as a single unit of accounting. Revenues for arrangements treated as a single unit of accounting are recognized over the period of the contract commencing upon delivery of the final deliverable. As of December 31, 2016, the Company did not have stand-alone value for the professional services and training services. This is because the Company includes professional services and training services with the Company’s subscription services and those services are not available from other vendors.
Cost of Revenues
Cost of revenues primarily consists of costs related to hosting the Company’s cloud-based platform, providing implementation and ongoing customer support, data communications expenses, salaries and benefits of operations and support personnel, software license fees, costs associated with website development activities, indirect overhead, amortization expense associated with capitalized internally developed software and intangible assets and property and equipment depreciation.
61
Stock-Based Compensation Expense
Stock-based compensation expense is measured at grant date based on the fair value of the award and is expensed on a straight-line basis over the requisite service period.
Fair values of stock option awards are determined on the date of grant using an option-pricing model. The Company has selected the Black-Scholes option pricing model to estimate the fair value of its stock option awards to employees and non-employees. In applying the Black-Scholes option pricing model, the Company’s determination of the fair value of the stock option award on the date of grant is affected by the Company’s fair value of its common stock, as well as assumptions regarding a number of subjective variables. These variables include, but are not limited to, the Company’s expected stock price volatility and the optionholders’ actual and projected stock option exercise and employment termination behaviors.
For stock option awards with time-based vesting, the Company recognizes stock-based compensation expense over the requisite service period using the straight-line method, based on awards ultimately expected to vest. The Company estimates future forfeitures at the date of grant and revises the estimates, if necessary, in subsequent periods if actual forfeitures differ from those estimates.
Restricted stock units (“RSUs”) are measured based on the fair market values of the underlying common stock on the dates of grant. Shares of common stock are issued on the vesting dates. For awards with time-based vesting, the Company recognizes stock-based compensation expense over the requisite service period using the straight-line method, based on awards ultimately expected to vest. The Company estimates future forfeitures at the date of grant and revises the estimates, if necessary, in subsequent periods if actual forfeitures differ from those estimates.
Stock options issued to non-employees such as consultants are recorded at their fair value on the measurement date. The measurement of stock-based compensation is subject to periodic adjustment as the underlying equity instruments vest. The fair value of options granted to consultants is expensed when vested, and such vested outstanding options are recognized as liabilities on the accompanying consolidated balance sheets. Non-employee stock-based compensation expense was not material for all periods presented.
See Note 10 and Note 11 for further information.
Research and Development
Research and development costs are expensed as incurred, except for certain internal software development costs, which may be capitalized as noted above. Research and development costs include salaries, stock-based compensation expense, benefits and other operating costs such as outside services, supplies and allocated overhead costs.
Advertising and Promotion
Advertising and promotional costs are expensed as incurred and included in sales and marketing expense in the accompanying consolidated statements of operations. Advertising and promotion expense totaled $876, $1,000, and $1,475 for 2016, 2015 and 2014, respectively.
Foreign Currency
For international subsidiaries whose functional currency is not the U.S. Dollar, we translate the monetary assets and liabilities of these subsidiaries to U.S. Dollars using rates of exchange in effect at the balance sheet date. Nonmonetary assets and liabilities are re-measured to U.S. Dollars using historical exchange rates, and other accounts are re-measured using average exchange rates in effect during each period presented. The effects of foreign currency translation adjustments are included in stockholders’ equity as a component of accumulated other comprehensive loss on the accompanying consolidated balance sheets, and related periodic movements are summarized as a line item in the consolidated statements of comprehensive loss.
The Company records net gains and losses resulting from foreign exchange transactions as a component of other income (expenses), net. Aggregate foreign currency gains (losses) included in determining net loss were $(3), $256 and $(490) during 2016, 2015 and 2014, respectively.
Income Taxes
The Company accounts for income taxes using the asset and liability method. Under this method, deferred tax assets and liabilities are determined based on differences between the financial statement and tax basis of assets and liabilities and net operating
62
loss and credit carryforwards using enacted tax rates in effect for the year in which the differences are expected to reverse. Valuation allowances are established when necessary to reduce deferred tax assets to the amounts expected to be realized.
The Company accounts for unrecognized tax benefits using a more-likely-than-not threshold for financial statement recognition and measurement of tax positions taken or expected to be taken in a tax return. The Company establishes a liability for tax-related uncertainties based on estimates of whether, and the extent to which, additional taxes will be due. The Company records an income tax liability, if any, for the difference between the benefit recognized and measured and the tax position taken or expected to be taken on the Company’s tax returns. To the extent that the assessment of such tax positions changes, the change in estimate is recorded in the period in which the determination is made. The liability is adjusted in light of changing facts and circumstances, such as the outcome of a tax audit. The provision for income taxes includes the impact of liability provisions and changes to the liabilities that are considered appropriate. The Company recognizes interest and penalties related to unrecognized tax benefits as income tax expense. As the Company maintained a full valuation allowance against its deferred tax assets in the United States, the adjustments resulted in no additional tax expense in 2016. The Company does not expect that changes in the liability for unrecognized tax benefits for the next twelve months will have a material impact on the Company’s consolidated financial position or results of operations.
Recent Accounting Pronouncements
In November 2016, the Financial Accounting Standards Board (“FASB”) issued Accounting Standards Update (“ASU”) 2016-18, Statement of Cash Flows: Restricted Cash (Topic 230), which requires that the statement of cash flows explain the change during the period in the total of cash, cash equivalents and amounts generally described as restricted cash or restricted cash equivalents. This new standard is effective for interim and annual reporting periods beginning after December 15, 2017, and early adoption is permitted. The Company early adopted this standard in the fourth quarter of 2016 on a retrospective basis, though there was no impact to periods prior to 2016. As a result, the Company’s consolidated statements of cash flows explains the changes in the combined total of balances classified as cash and cash equivalents and restricted cash on the consolidated balance sheets for all periods presented.
In March 2016, the FASB issued ASU 2016-09, Compensation - Stock Compensation: Improvements to Employee Share-Based Payment Accounting (Topic 718), which is intended to simplify several aspects of the accounting for employee share-based payment transactions, including the accounting for income taxes, forfeitures and statutory tax withholding requirements, as well as classification on the statement of cash flows. The update to this standard is effective for interim and annual reporting periods beginning after December 15, 2016. The Company expects to adopt the new guidance in the first quarter of 2017, and does not expect it to have a material impact on its consolidated financial statements.
In February 2016, the FASB issued ASU 2016-02, Leases (Topic 842), which will require lessees to recognize most leases on the balance sheet as lease assets and lease liabilities, as well as both quantitative and qualitative disclosures regarding key information about leasing arrangements. This new standard is effective for interim and annual reporting periods beginning after December 15, 2018, and early adoption is permitted. The Company is currently evaluating the impact of the adoption of ASU 2016-02 will have on the consolidated financial statements, as well as the expected adoption method.
In September 2015, the FASB issued ASU 2015-16, Business Combinations (Topic 805): Simplifying the Accounting for Measurement-Period Adjustments, which eliminates the requirement for an acquirer to retrospectively adjust provisional amounts recorded in a business combination to reflect new information about the facts and circumstances that existed as of the acquisition date and that, if known, would have affected measurement or recognition of amounts initially recognized. As an alternative, the standard requires that an acquirer recognize adjustments to provisional amounts that are identified during the measurement period in the reporting period in which the adjustment amounts are determined. It requires that the acquirer record, in the financial statements of the period in which adjustments to provisional amounts are determined, the effect on earnings of changes in depreciation, amortization or other income effects, if any, as a result of the change to the provisional amounts, calculated as if the accounting had been completed at the acquisition date. The new standard was effective prospectively for interim and annual reporting periods beginning after December 15, 2015, with early adoption permitted. The Company adopted ASU 2015-16 during the first quarter of 2016 on a prospective basis, and it did not have an effect on the Company’s financial position or results of operations. The new standard will be applied to future adjustments of provisional amounts as they occur.
In August 2014, the FASB issued ASU 2014-15, Disclosures of Uncertainties About an Entity’s Ability to Continue as a Going Concern, which provides guidance around management’s responsibility to evaluate whether there is substantial doubt about an entity’s ability to continue as a going concern and to provide related footnote disclosures. The new standard is effective for interim and annual reporting periods ending after December 15, 2016. The Company adopted this standard for the 2016 reporting period, and did not identify any conditions that raised substantial doubt about its ability to continue as a going concern as of the date of issuance of its consolidated financial statements. Accordingly, no further disclosures are required.
In May 2014, the FASB issued ASU 2014-09, Revenue from Contracts with Customers, which is the new comprehensive revenue recognition standard that will replace all current U.S. GAAP guidance on this topic and eliminate all industry-specific
63
guidance. The standard’s core principle is that a reporting entity will recognize revenue when it transfers promised goods or services to customers in an amount that reflects the consideration to which the entity expects to be entitled in exchange for those goods or services. In applying this new guidance to contracts within its scope, an entity will: (1) identify the contract(s) with a customer, (2) identify the performance obligations in the contract, (3) determine the transaction price, (4) allocate the transaction price to the performance obligations in the contract and (5) recognize revenue when (or as) the entity satisfies a performance obligation. Additionally, this new guidance will require significantly expanded disclosures about revenue recognition. This guidance will be effective for fiscal years and interim periods within those years beginning after December 15, 2017, and early adoption is permitted. The Company is currently utilizing a comprehensive approach to assess the impact of the guidance on existing and future contracts by reviewing current accounting policies and practices, and identifying potential differences that would result from applying the new guidance, including evaluation of performance obligations, principal versus agent factors and variable consideration arrangements. The implementation plan is in progress and the Company expects to adopt the new guidance on January 1, 2018 using the modified retrospective approach, which would result in an adjustment to accumulated deficit for the cumulative effect, if any, of applying this standard to contracts in process as of the adoption date. Under this approach, the Company would not restate the prior financial statements presented, but would provide additional disclosures of the amount by which each financial statement line item is affected in the current reporting period during 2018 as compared to the guidance that was in effect before the change, as well as an explanation for the reasons for significant changes, if any.
3. Business Combinations
The Company accounts for business combinations using the acquisition method of accounting in which the tangible and identifiable intangible assets and liabilities of each acquired company are recorded at their respective estimated fair values as of each acquisition date, including an amount for goodwill representing the difference between the respective purchase price and fair values of identifiable net assets.
Best estimates and assumptions are used in the purchase price allocation process to accurately value assets acquired and liabilities assumed at the business combination date. These estimates and assumptions are inherently uncertain and subject to change. As a result, during the measurement period, which may be up to one year from the business combination date, the Company may record adjustments to the assets acquired and liabilities assumed with the corresponding adjustment to goodwill. After the measurement period, adjustments are recorded in the operating results in the period in which the adjustments were determined.
SocialMoov S.A.S.
On February 12, 2015, pursuant to the terms of a Share Purchase Agreement, the Company acquired all outstanding shares of capital stock of SocialMoov S.A.S. (“SocialMoov”), with SocialMoov surviving as a wholly-owned subsidiary of the Company. Based in Paris, France, SocialMoov is a provider of social advertising tools for advertisers and agencies.
During the first quarter of 2016, the Company completed the valuation of the fair values of the acquired tangible and identifiable intangible assets and liabilities assumed at the acquisition date. The results of operations and the fair values of the assets acquired and liabilities assumed have been included in the accompanying consolidated financial statements since the acquisition date.
The total purchase price for the acquisition was $13,288, which consisted of 636 shares of the Company’s common stock valued at $4,337 upon the closing date using the weighted average of the Company’s closing date stock price for a short period of time preceding the closing date of the acquisition, $8,858 in cash and $93 in cash paid as contingent consideration during the first quarter of 2016. Of the cash consideration paid at the closing date, $1,894 is held in escrow to secure indemnification obligations of the shareholders of SocialMoov to the Company following the closing, and was released during the third quarter of 2016. Of the total purchase price, $1,761 was attributed to the fair value of net liabilities assumed, $1,120 was cash acquired, and $6,140 was the fair value of intangible assets acquired, with $7,789 as residual goodwill. The goodwill is primarily attributable to synergies expected to arise from the acquisition and is not expected to be deductible for tax purposes.
In addition, the Company agreed to issue 927 shares of common stock at future dates as defined in the Share Purchase Agreement, valued at $6,487 upon the closing date of the acquisition using the Company’s closing date stock price immediately preceding the acquisition, to existing employee shareholders of SocialMoov in connection with the acquisition, which are conditioned upon such employees’ continuous employment with the Company. These shares have been excluded from the purchase consideration and are being recognized as post-acquisition stock-based compensation expense over the employees’ requisite service periods. The Company issued half of these shares in February 2016 and the remaining half in February 2017. The Company also granted RSUs representing 219 shares of common stock, valued at $959 using the Company’s grant date stock price, with time-based vesting to employees of SocialMoov that continued employment with SocialMoov subsequent to the acquisition. The Company recognizes compensation expense equal to the grant date fair value of the common stock or stock-based awards on a straight-line basis over the employees’ requisite service periods.
64
The following table summarizes the fair values of tangible assets acquired, liabilities assumed, intangible assets and residual goodwill from the acquisition of SocialMoov (in thousands except years):
|
|
|
Estimated |
|
|
Estimated |
|
|
|
|
Fair Value |
|
|
Useful Life |
|
|
Tangible assets acquired |
|
$ |
2,741 |
|
|
N/A |
|
Liabilities assumed (see Note 8) |
|
|
(3,382 |
) |
|
N/A |
|
Developed technology |
|
|
3,800 |
|
|
5 years |
|
Customer relationships |
|
|
2,080 |
|
|
4 years |
|
Tradename |
|
|
260 |
|
|
3 years |
|
Goodwill |
|
|
7,789 |
|
|
Indefinite |
|
Total purchase price |
|
$ |
13,288 |
|
|
|
The values assigned to the intangible assets are based in part on a third-party valuation analysis, which includes estimates and judgments regarding expectations for success and the life cycle of solutions and technologies acquired.
NowSpots, Inc.
On June 2, 2014, pursuant to the terms of an Agreement and Plan of Reorganization, a wholly-owned subsidiary of the Company merged with and into NowSpots, Inc. (which conducted business as Perfect Audience (“Perfect Audience”)), with Perfect Audience surviving as a wholly-owned subsidiary of the Company. Perfect Audience provides audience retargeting in the display and social advertising channels.
In 2015 the Company completed the valuation of the fair values of the acquired tangible and identifiable intangible assets and liabilities assumed at the acquisition date, and the results of operations and the fair values of the acquired assets and liabilities assumed have been included in the consolidated financial statements since the acquisition date.
The total purchase price for the acquisition was $16,470, which consisted of 1,119 shares of the Company’s common stock valued at $11,195 based upon the closing date using the weighted average of the Company’s closing date stock price for a short period of time preceding the closing date of the acquisition, and $5,275 in cash. Of the total purchase price, $4,713 was attributed to the fair value of net liabilities assumed, $1,124 was cash acquired, and $8,530 was the fair value of intangible assets acquired, with $11,529 as residual goodwill. The goodwill is primarily attributable to the synergies expected to arise from the acquisition and is not deductible for tax purposes.
In addition, the Company issued 630 shares of common stock, valued at $6,301 upon the closing date of the acquisition using the weighted average of the Company’s closing date stock price for a short period of time preceding the closing date of the acquisition, to existing Perfect Audience employees in connection with the acquisition, which are conditioned upon such employees’ continuous employment with the Company. These shares were excluded from the purchase consideration and are being recognized as post-acquisition stock-based compensation expense over the employees’ requisite service periods.
The following table summarizes the fair values of tangible assets acquired, liabilities assumed, intangible assets and goodwill (in thousands except years):
|
|
|
Estimated |
|
|
Estimated |
|
|
|
|
Fair Value |
|
|
Useful Life |
|
|
Tangible assets acquired |
|
$ |
1,493 |
|
|
N/A |
|
Liabilities assumed |
|
|
(5,082 |
) |
|
N/A |
|
Developed technology |
|
|
6,110 |
|
|
6 years |
|
Customer relationships |
|
|
1,290 |
|
|
4 years |
|
Non-compete agreements and tradename |
|
|
1,130 |
|
|
2 - 3 years |
|
Goodwill |
|
|
11,529 |
|
|
Indefinite |
|
Total purchase price |
|
$ |
16,470 |
|
|
|
The values assigned to the intangible assets are based in part on a third-party valuation analysis, which includes estimates and judgments regarding expectations for success and the life cycle of solutions and technologies acquired.
65
2016 Restructuring Plan
During 2016, the Company executed an organizational restructuring (the “2016 Restructuring Plan”) primarily to improve cost efficiencies and effectiveness in sales. The Company recorded $642 of restructuring related expenses for the year ended December 31, 2016. As of December 31, 2016, approximately $135 in restructuring related expenses associated with the 2016 Restructuring Plan remained unpaid and were included in accrued expenses and other current liabilities on the Company’s consolidated balance sheets. Further costs associated with this 2016 Restructuring Plan are not expected to be material in future periods.
2015 Restructuring Plan
During 2015, the Company executed organizational restructurings (the “2015 Restructuring Plans”) primarily to improve cost efficiencies and realign its sales, customer success and marketing operations. The Company recorded $1,214 of restructuring related expenses in connection with the 2015 Restructuring Plans for the year ended December 31, 2015. Actions pursuant to the 2015 Restructuring Plans were substantially complete as of December 31, 2015, and the associated costs were not material for the year ended December 31, 2016.
5. Balance Sheet Components
The following table shows the components of property and equipment as of the dates presented:
|
|
|
December 31, |
|
|||||
|
|
|
2016 |
|
|
2015 |
|
||
|
Computer equipment |
|
$ |
28,905 |
|
|
$ |
26,279 |
|
|
Software |
|
|
21,323 |
|
|
|
16,602 |
|
|
Office equipment |
|
|
951 |
|
|
|
1,016 |
|
|
Furniture, fixtures and leasehold improvements |
|
|
5,946 |
|
|
|
6,049 |
|
|
|
|
|
57,125 |
|
|
|
49,946 |
|
|
Less: Accumulated depreciation and amortization |
|
|
(36,544 |
) |
|
|
(28,129 |
) |
|
|
|
$ |
20,581 |
|
|
$ |
21,817 |
|
Depreciation and amortization of internally developed software for 2016, 2015 and 2014 was $9,023, $9,543, and $7,574, respectively.
The following table shows the components of accrued expenses and other current liabilities as of the dates presented:
|
|
|
December 31, |
|
|||||
|
|
|
2016 |
|
|
2015 |
|
||
|
Accrued salary and payroll related expenses |
|
$ |
3,894 |
|
|
$ |
4,829 |
|
|
Accrued accounts payable |
|
|
1,915 |
|
|
|
3,417 |
|
|
Customer advances |
|
|
1,582 |
|
|
|
1,463 |
|
|
Income tax payable |
|
|
— |
|
|
|
236 |
|
|
Sales and use tax payable |
|
|
210 |
|
|
|
434 |
|
|
Deferred rent and other |
|
|
761 |
|
|
|
806 |
|
|
|
|
$ |
8,362 |
|
|
$ |
11,185 |
|
6. Goodwill and Intangible Assets
The goodwill balance as of December 31, 2016 of $19,318 was the result of the business acquisitions disclosed in Note 3 of these consolidated financial statements. The activity for the year ended December 31, 2016 consisted of the following:
|
Balance at December 31, 2015 |
|
$ |
19,417 |
|
|
Add: Payment of contingent consideration for SocialMoov acquisition |
|
|
93 |
|
|
Add: Other adjustments to goodwill including foreign currency translation |
|
|
(192 |
) |
|
Balance at December 31, 2016 |
|
$ |
19,318 |
|
66
Intangible assets consisted of the following as of the dates presented (in thousands except years):
|
|
|
December 31, 2016 |
|
|
December 31, 2015 |
|
|
Estimated Useful Life |
||
|
Developed technology |
|
$ |
9,910 |
|
|
$ |
9,910 |
|
|
5 - 6 years |
|
Customer relationships |
|
|
3,370 |
|
|
|
3,370 |
|
|
4 years |
|
Non-compete agreements and tradenames |
|
|
1,390 |
|
|
|
1,390 |
|
|
2 - 3 years |
|
|
|
|
14,670 |
|
|
|
14,670 |
|
|
|
|
Less: accumulated amortization |
|
|
(7,345 |
) |
|
|
(4,265 |
) |
|
|
|
|
|
$ |
7,325 |
|
|
$ |
10,405 |
|
|
|
Amortization expense for 2016, 2015 and 2014 was $3,080, $3,134, and $1,131.
Future estimated amortization of intangible assets as of December 31, 2016 is presented below:
|
Year ending December 31, 2017 |
|
$ |
2,850 |
|
|
Year ending December 31, 2018 |
|
|
2,537 |
|
|
Year ending December 31, 2019 |
|
|
1,843 |
|
|
Year ending December 31, 2020 |
|
|
95 |
|
|
|
|
$ |
7,325 |
|
7. Fair Value Measurements
Account balances measured at fair value on a recurring basis include the following as of the dates presented:
|
|
|
December 31, |
|
|||||||||||||||||||||
|
|
|
2016 |
|
|
2015 |
|
||||||||||||||||||
|
|
|
Level 1 |
|
|
Level 2 |
|
|
Level 3 |
|
|
Level 1 |
|
|
Level 2 |
|
|
Level 3 |
|
||||||
|
Cash equivalents |
|
|
|
|
|
|
|
|
|
|
|
|
|
|
|
|
|
|
|
|
|
|
|
|
|
Money market funds |
|
$ |
15,657 |
|
|
$ |
— |
|
|
$ |
— |
|
|
$ |
25,564 |
|
|
$ |
— |
|
|
$ |
— |
|
The Company’s cash equivalents as of December 31, 2016 and 2015 consisted of money market funds that are classified as Level 1. The fair value of the Company’s money market funds approximated amortized cost and, as such, there were no unrealized gains or losses on money market funds as of December 31, 2016 and 2015. As of December 31, 2016 and 2015, amounts of $18,763 and $11,763, respectively, were held in bank deposits.
8. Debt
Revolving Credit Facility and Equipment Advance Facilities
In January 2010, the Company signed an amendment to the Loan and Security Agreement, which provided for a revolving credit facility (the “Revolving Credit Facility”). In January 2011, the Company entered into an amendment to the Revolving Credit Facility pursuant to which Silicon Valley Bank agreed to extend an equipment advance facility of $2,000 (the “Equipment Advance Facility”). The Equipment Advance Facility could only be used to finance the purchase of equipment, accrued interest at a fixed per annum rate of 5.5%, was repayable in 36 consecutive monthly installments of principal and interest and expired on December 1, 2014. The Equipment Advance Facility was fully paid off on that date.
In December 2011, the Company entered into another amendment to its existing Revolving Credit Facility pursuant to which Silicon Valley Bank agreed to extend an additional equipment advance facility of $2,000 (the “Additional Equipment Advance Facility”). The Additional Equipment Advance Facility could only be used to finance the purchase of equipment. The Additional Equipment Advance Facility accrued interest at a fixed per annum rate of 5.5% and was repayable in 36 consecutive monthly installments of principal and interest. The Additional Equipment Advance Facility expired September 1, 2015 and was fully paid off on that date.
In December 2012, the Company entered into another amendment to its existing Revolving Credit Facility and Equipment Advance Facility pursuant to which Silicon Valley Bank agreed to extend an additional equipment advance facility of $3,000 (the “Supplemental Equipment Advance”). The Supplemental Equipment Advance could only be used to finance the purchase of equipment. The Supplemental Equipment Advance accrued interest at a fixed per annum rate of 3.0% and was repayable in 33
67
consecutive monthly installments of principal and interest. The Supplemental Equipment Advance expired March 1, 2016 and was fully paid off on that date.
In September 2013, the Company entered into an amendment to the Revolving Credit Facility pursuant to which Silicon Valley Bank agreed to increase the Revolving Credit Facility to the lesser of $15,000 or 80% of the Company’s eligible accounts receivable. Also, the expiration date of the Revolving Credit Facility was extended to July 31, 2015 and the annual interest rate was amended to 0.25% over the Prime Rate, payable on a monthly basis. Additionally, the Company’s obligation to meet certain financial covenants would be waived when the Company’s unrestricted cash balance exceeds $50,000.
In July 2015, the Company entered into an amendment to the Revolving Credit Facility pursuant to which Silicon Valley Bank agreed to increase the revolving credit facility of up to the lesser of $20,000 or 80% of the Company’s eligible accounts receivable. Also, the expiration date of the revolving credit facility was extended to July 31, 2017, and the annual interest rate was amended to (a) the prime rate or (b) the London interbank offered rate then in effect, plus a margin of 2.75%, payable on a monthly basis. The amendment contained affirmative and negative covenants, including covenants related to the delivery of financial and other information, the maintenance of certain financial covenants, as well as limitations on dispositions, changes in business or management, mergers or consolidations, dividends and other corporate actions.
In December 2016, the Company terminated the Revolving Credit Facility. No amounts were outstanding pursuant to the Revolving Credit Facility at the date of termination.
Capital Lease Arrangements
In February 2013, the Company entered into a capital lease arrangement with an equipment manufacturer to finance the acquisition of computer equipment. The lease had an effective interest rate of 6.0% and was repayable in 36 consecutive equal monthly installments of principal and interest. This capital lease arrangement matured in February 2016 and was fully paid off at that date.
At various dates between August 2015 and September 2016, the Company entered into seven separate capital lease arrangements with the same equipment manufacturer to finance the acquisition of additional computer equipment. These leases have an effective annual interest rate of 5.7% and are repayable in 48 consecutive equal monthly installments of principal and interest. At the end of the lease periods for these capital lease arrangements, the Company has the option to purchase the underlying equipment at the estimated fair market value or for a nominal amount.
In September and October 2016, the Company entered into two capital lease arrangements with a different equipment manufacturer to finance the acquisition of additional computer equipment. These leases have an effective annual interest rate of 5.2% and are repayable in 48 consecutive equal monthly installments of principal and interest. At the end of the lease periods of both leases, the Company has the option to purchase or renew the lease for the underlying equipment at the estimated fair market value.
As of December 31, 2016 and 2015, the net book value of the equipment under all capital leases was $3,158 and $2,446, respectively, and the remaining principal balance payable was $3,411 and $2,700, respectively. The capital leases are collateralized by the underlying computer equipment.
The Company’s outstanding balances under the capital leases and Equipment Advance Facilities as of December 31, 2016 and 2015 are as follows:
|
|
|
December 31, |
|
|||||
|
|
|
2016 |
|
|
2015 |
|
||
|
Capital leases |
|
$ |
3,411 |
|
|
$ |
2,700 |
|
|
Equipment Advance Facilities |
|
|
— |
|
|
|
283 |
|
|
|
|
|
3,411 |
|
|
|
2,983 |
|
|
Discount on long-term debt |
|
|
(15 |
) |
|
|
(42 |
) |
|
|
|
$ |
3,396 |
|
|
$ |
2,941 |
|
68
The maturities of debt as of December 31, 2016 are as follows:
|
Year Ending |
|
|
|
|
|
December 31, 2017 |
|
$ |
1,015 |
|
|
December 31, 2018 |
|
|
1,165 |
|
|
December 31, 2019 |
|
|
886 |
|
|
December 31, 2020 |
|
|
345 |
|
|
|
|
|
3,411 |
|
|
Less: |
|
|
|
|
|
Current portion |
|
|
(1,015 |
) |
|
Discount on long-term debt |
|
|
(15 |
) |
|
Noncurrent portion of debt |
|
$ |
2,381 |
|
In connection with the acquisition of SocialMoov in February 2015 (see Note 3), the Company assumed outstanding debt totaling approximately $1,043, which consisted primarily of individual loans payable to (a) an agency of the French government, (b) a French public-sector investment bank and (c) a French private-sector financial institution. As of December 31, 2016, these loans were fully repaid.
In December 2014, the Company entered into a standby letter of credit agreement for $1,293 with Silicon Valley Bank in connection with the non-cancelable lease for the Company’s corporate headquarters in San Francisco. Following the termination of the Revolving Credit Facility in December 2016, the Company was required to separately restrict from use $1,293 in cash held at Silicon Valley Bank to secure this letter of credit. This balance has been classified as restricted cash on the accompanying consolidated balance sheets.
9. Common Stock
On February 12, 2013, the Company’s Board of Directors approved a Restated Certificate of Incorporation, which became effective upon the consummation of the Company’s IPO. The Restated Certificate of Incorporation amends the authorized share capital to 500,000 shares of common stock ($0.001 par value per share) and 10,000 shares of blank-check preferred stock ($0.001 par value per share).
As of December 31, 2016 and 2015, reserved shares of common stock are as follows:
|
|
|
December 31, |
|
|||||
|
|
|
2016 |
|
|
2015 |
|
||
|
Options or RSUs available for future grant under stock option plans |
|
|
5,875 |
|
|
|
4,041 |
|
|
Options outstanding under stock option plans |
|
|
3,749 |
|
|
|
5,960 |
|
|
RSUs outstanding under stock option plans |
|
|
3,003 |
|
|
|
1,221 |
|
|
Shares available for future issuance under ESPP |
|
|
1,190 |
|
|
|
776 |
|
|
Shares to be issued in connection with acquisition of SocialMoov |
|
|
464 |
|
|
|
927 |
|
|
|
|
|
14,281 |
|
|
|
12,925 |
|
10. Equity Award Plans
In April 2006, the Company’s Board of Directors adopted and the stockholders approved the 2006 Stock Option Plan (“2006 Plan”). The 2006 Plan provides for the grant of incentive stock options under the federal tax laws and non-statutory stock options. Only employees may receive incentive stock options, but non-statutory stock options may be granted to employees, non-employee directors and consultants. The stock options are exercisable at a price equal to the market value of the underlying shares of common stock on the date of the grant as determined by the Company’s board of directors. The term of options granted under the 2006 Plan may not exceed ten years. Certain options are eligible for exercise prior to vesting. Exercised but unvested shares of common stock are subject to repurchase by the Company at the initial exercise price. The proceeds from the shares of common stock subject to repurchase are classified as a liability and reclassified to equity as the shares vest. Under the 2006 Plan’s early exercise feature, the Company had the right to repurchase 3 and 18 shares of common stock as of December 31, 2016 and 2015, respectively. The Company records cash received from the exercise of unvested stock options as a long-term liability, as well as the fair value of vested outstanding options to non-employee consultants. As of December 31, 2016 and 2015, $41 and $249, respectively, has been recorded as a long-term liability on the accompanying consolidated balance sheets.
69
In February 2013, the Company’s Board of Directors and stockholders approved the 2013 Equity Incentive Plan (“2013 Plan”), under which 4,500 shares of common stock were originally reserved for issuance. Additionally, all reserved and unissued shares under the 2006 Plan at the time the 2013 Plan became effective are eligible for issuance under the 2013 Plan. The 2013 Plan became effective on March 21, 2013, at which time the Company ceased to grant equity awards under the 2006 Plan. The 2013 Equity Incentive Plan authorizes the award of stock options, restricted stock awards, stock appreciation rights, RSUs, performance awards and stock bonuses to the Company’s employees, directors, consultants, independent contractors and advisors. On January 1 of each of the first 10 calendar years through 2023, the number of shares of common stock reserved under the 2013 Equity Incentive Plan will automatically increase by an amount equal to 5% of the total outstanding shares as of immediately preceding December 31, or such lesser number of shares as determined by the Company’s Board of Directors. Pursuant to the terms of the 2013 Plan, the shares available for issuance increased by approximately 1,940 shares of common stock on January 1, 2017.
Stock Options
Under the 2006 Plan and the 2013 Plan, the term of options granted may not exceed ten years. Unless the terms of an optionee’s stock option agreement provide otherwise, if an optionee’s service relationship with the Company, or any of its affiliates, ceases for any reason other than disability or death, the optionee may exercise the vested portion of any options for three months after the date of such termination. If an optionee’s service relationship with the Company, or any of its affiliates, ceases due to disability or death (or an optionee dies within a certain period following cessation of service), the optionee or a beneficiary may exercise any vested options for a period of 12 months. In no event, however, may an option be exercised beyond the expiration of its term.
A summary of activity under the 2006 Plan and the 2013 Plan is as follows (in thousands, except per share amounts and years):
|
|
|
Options Outstanding |
|
|||||||||||||
|
|
|
Number of Shares |
|
|
Weighted Average Exercise Price Per Share |
|
|
Weighted Average Remaining Contractual Term (in Years) |
|
|
Aggregate Intrinsic Value |
|
||||
|
Balance at December 31, 2013 |
|
|
4,855 |
|
|
$ |
6.56 |
|
|
|
7.85 |
|
|
$ |
20,593 |
|
|
Options granted |
|
|
3,558 |
|
|
|
9.39 |
|
|
|
8.35 |
|
|
|
|
|
|
Options exercised |
|
|
(791 |
) |
|
|
3.12 |
|
|
|
— |
|
|
|
|
|
|
Options forfeited and cancelled |
|
|
(1,246 |
) |
|
|
9.51 |
|
|
|
— |
|
|
|
|
|
|
Balance at December 31, 2014 |
|
|
6,376 |
|
|
$ |
7.99 |
|
|
|
7.82 |
|
|
$ |
9,697 |
|
|
Options granted |
|
|
2,303 |
|
|
|
5.85 |
|
|
|
7.70 |
|
|
|
|
|
|
Options exercised |
|
|
(727 |
) |
|
|
1.98 |
|
|
|
— |
|
|
|
|
|
|
Options forfeited and cancelled |
|
|
(1,992 |
) |
|
|
8.92 |
|
|
|
— |
|
|
|
|
|
|
Balance at December 31, 2015 |
|
|
5,960 |
|
|
$ |
7.58 |
|
|
|
7.85 |
|
|
$ |
957 |
|
|
Options granted |
|
|
1,202 |
|
|
|
2.66 |
|
|
|
6.82 |
|
|
|
|
|
|
Options exercised |
|
|
(264 |
) |
|
|
1.48 |
|
|
|
— |
|
|
|
|
|
|
Options forfeited and cancelled |
|
|
(3,149 |
) |
|
|
7.79 |
|
|
|
— |
|
|
|
|
|
|
Balance at December 31, 2016 |
|
|
3,749 |
|
|
$ |
6.26 |
|
|
|
7.48 |
|
|
$ |
194 |
|
|
Options exercisable as of December 31, 2016 |
|
|
2,178 |
|
|
$ |
7.70 |
|
|
|
6.49 |
|
|
$ |
110 |
|
|
Options vested as of December 31, 2016 |
|
|
2,174 |
|
|
$ |
7.69 |
|
|
|
6.49 |
|
|
$ |
110 |
|
|
Options vested and expected to vest as of December 31, 2016 |
|
|
3,636 |
|
|
$ |
6.33 |
|
|
|
7.44 |
|
|
$ |
192 |
|
The intrinsic value of options exercised during 2016, 2015 and 2014 was $328, $2,935, and $5,615, respectively. The total estimated fair value of options vested during 2016, 2015 and 2014 was $5,424, $7,573, and $5,447, respectively.
70
A summary of RSUs granted and unvested under the 2013 Plan during 2016 and 2015 is as follows (in thousands, except per unit amounts):
|
|
|
RSUs Outstanding |
|
|||||
|
|
|
Number of Shares |
|
|
Weighted Average Grant Date Fair Value Per Unit |
|
||
|
Granted and unvested at December 31, 2013 |
|
|
— |
|
|
$ |
— |
|
|
RSUs granted |
|
|
777 |
|
|
|
9.37 |
|
|
RSUs vested |
|
|
— |
|
|
|
— |
|
|
RSUs cancelled |
|
|
(8 |
) |
|
|
10.56 |
|
|
Granted and unvested at December 31, 2014 |
|
|
769 |
|
|
$ |
9.36 |
|
|
RSUs granted |
|
|
1,185 |
|
|
|
5.68 |
|
|
RSUs vested |
|
|
(143 |
) |
|
|
9.83 |
|
|
RSUs cancelled and withheld to cover taxes |
|
|
(590 |
) |
|
|
7.79 |
|
|
Granted and unvested at December 31, 2015 |
|
|
1,221 |
|
|
$ |
9.36 |
|
|
RSUs granted |
|
|
3,123 |
|
|
|
2.68 |
|
|
RSUs vested, net |
|
|
(209 |
) |
|
|
7.19 |
|
|
RSUs cancelled and withheld to cover taxes |
|
|
(1,132 |
) |
|
|
4.40 |
|
|
Granted and unvested at December 31, 2016 |
|
|
3,003 |
|
|
$ |
3.07 |
|
Employee Stock Purchase Plan
In February 2013, the Company’s Board of Directors and stockholders approved the 2013 Employee Stock Purchase Plan (“2013 ESPP”), under which 1,000 shares of common stock were originally reserved for issuance. The 2013 ESPP became effective on March 22, 2013. The 2013 ESPP provides generally for six-month purchase periods and the purchase price for shares of common stock purchased under the 2013 Employee Stock Purchase Plan will be 85% of the lesser of the fair market value of the common stock on (i) the first trading day of the applicable offering period and (ii) the last trading day of each purchase period in the applicable offering period. On January 1 of each of the first 10 calendar years following the first offering date, the number of shares reserved under the 2013 Employee Stock Purchase Plan will automatically increase by an amount equal to 1% of the total outstanding shares as of immediately preceding December 31, but not to exceed 700 shares. Pursuant to the terms of the 2013 ESPP, the shares available for issuance increased by approximately 388 shares on January 1, 2017. During 2016 and 2015, 292 and 257 shares, respectively, were issued under the 2013 ESPP.
11. Stock-Based Compensation Expense
For stock-based awards granted by the Company, stock-based compensation expense is measured at grant date based on the fair value of the award and is expensed over the requisite service period. The Company recorded stock-based compensation expense of $10,295, $15,619 and $9,242 for 2016, 2015 and 2014, respectively.
Stock Options
The Company uses the Black-Scholes option pricing model to estimate the fair value of options. This model requires the input of highly subjective assumptions including the expected volatility, risk-free interest rate, and the expected life of options. The Company used the following assumptions:
|
|
|
Years Ended December 31, |
|
|||||||||
|
|
|
2016 |
|
|
2015 |
|
|
2014 |
|
|||
|
Dividend yield |
|
|
— |
|
|
|
— |
|
|
|
— |
|
|
Expected volatility |
|
|
47.5 |
% |
|
|
49.1 |
% |
|
|
51.3 |
% |
|
Risk-free interest rate |
|
|
1.38 |
% |
|
|
1.75 |
% |
|
|
1.89 |
% |
|
Expected life of options (in years) |
|
|
6.25 |
|
|
|
6.25 |
|
|
|
6.25 |
|
|
Forfeiture rate |
|
|
7.0 |
% |
|
|
7.0 |
% |
|
|
7.0 |
% |
|
Weighted-average grant-date fair value |
|
$ |
1.26 |
|
|
$ |
2.88 |
|
|
$ |
4.77 |
|
|
Weighted-average grant-date exercise price |
|
$ |
2.66 |
|
|
$ |
5.85 |
|
|
$ |
9.39 |
|
71
As the Company has limited historical option exercise data, the expected term of the stock options granted to employees was calculated based on the simplified method. Under the simplified method, the expected term is equal to the average of an option’s weighted-average vesting period and its contractual term. Pursuant to the SEC Staff Accounting Bulletin (“SAB”) No. 110, the Company is permitted to continue using the simplified method until sufficient information regarding exercise behavior, such as historical exercise data or exercise information from external sources, becomes available. The Company estimates the expected volatility of its common stock on the date of grant based on the historical stock volatilities of similar publicly-traded entities over a period equal to the expected terms of the options, as the Company does not have sufficient trading history to use the volatility of its own common stock. The Company has no history or expectation of paying cash dividends on its common stock. The risk-free interest rate is based on the U.S. Treasury yield for a term consistent with the expected life of the options in effect at the time of grant.
Cash proceeds from the exercise of stock options were $390, $1,439, and $2,472 during 2016, 2015 and 2014, respectively.
Compensation expense is recognized ratably over the requisite service period. As of December 31, 2016 and 2015, there was $2,706 and $10,204, respectively, of unrecognized compensation cost related to options, which is expected to be recognized over a weighted-average period of 2.1 and 2.6 years, respectively.
Restricted Stock and RSUs
As of December 31, 2016 and 2015, there was $7,973 and $10,667 of unrecognized compensation cost related to restricted stock and RSUs, respectively, which is expected to be recognized over a weighted-average period of 2.3 and 2.0 years, respectively. The Company uses the fair market value of the underlying common stock on the dates of grant to determine the fair value of restricted stock and RSUs. Stock-based compensation expense related to these awards is recognized on a straight-line basis over the service period of the award for the estimated number of shares that are ultimately expected to vest.
Employee Stock Purchase Plan
The Company estimates the fair value of purchase rights under the ESPP using the Black-Scholes valuation model. The fair value of each purchase right under the ESPP was estimated on the date of grant using the Black-Scholes option valuation model and the straight-line attribution approach with assumptions substantially similar to those used for the valuation of our stock option awards.
12. Income Taxes
The components of the Company’s loss before provision for (benefit from) income taxes were as follows:
|
|
|
Years Ended December 31, |
|
|||||||||
|
|
|
2016 |
|
|
2015 |
|
|
2014 |
|
|||
|
United States of America |
|
$ |
(7,595 |
) |
|
$ |
(17,173 |
) |
|
$ |
(26,427 |
) |
|
International |
|
|
(7,481 |
) |
|
|
(15,171 |
) |
|
|
(8,200 |
) |
|
|
|
$ |
(15,076 |
) |
|
$ |
(32,344 |
) |
|
$ |
(34,627 |
) |
The components of the provision for (benefit from) income taxes were as follows:
|
|
|
Years Ended December 31, |
|
|||||||||
|
|
|
2016 |
|
|
2015 |
|
|
2014 |
|
|||
|
Current income tax provision |
|
|
|
|
|
|
|
|
|
|
|
|
|
Federal |
|
$ |
— |
|
|
$ |
— |
|
|
$ |
— |
|
|
State |
|
|
58 |
|
|
|
111 |
|
|
|
101 |
|
|
Foreign |
|
|
1,708 |
|
|
|
1,193 |
|
|
|
700 |
|
|
Total current income tax provision |
|
|
1,766 |
|
|
|
1,304 |
|
|
|
801 |
|
|
Deferred income tax benefit |
|
|
|
|
|
|
|
|
|
|
|
|
|
Federal |
|
|
— |
|
|
|
— |
|
|
|
(2,094 |
) |
|
State |
|
|
— |
|
|
|
— |
|
|
|
(191 |
) |
|
Foreign |
|
|
(362 |
) |
|
|
(299 |
) |
|
|
28 |
|
|
Total deferred income tax benefit |
|
|
(362 |
) |
|
|
(299 |
) |
|
|
(2,257 |
) |
|
Provision for (benefit from) income taxes |
|
$ |
1,404 |
|
|
$ |
1,005 |
|
|
$ |
(1,456 |
) |
The Company has taxable in the U.S. for the year ended December 31, 2016, which will be fully offset by net operating loss carryovers from prior years. The Company incurred operating losses in previous years and has recorded a full valuation allowance
72
against its deferred tax assets (except for the deferred tax assets associated with the Company’s subsidiaries in China, France, Ireland, Japan and the United Kingdom). Accordingly, the Company has not recorded a provision for income taxes for any of the periods presented other than provisions for foreign and state income taxes.
The differences in the total provision for (benefit from) income taxes that would result from applying the 34% federal statutory rate to loss before provision for (benefit from) income taxes and the reported provision for (benefit from) income taxes were as follows:
|
|
|
Years Ended December 31, |
|
|||||||||
|
|
|
2016 |
|
|
2015 |
|
|
2014 |
|
|||
|
Tax benefit at U.S. statutory rate |
|
$ |
(5,126 |
) |
|
$ |
(10,997 |
) |
|
$ |
(11,773 |
) |
|
State income taxes, net of federal benefit |
|
|
(147 |
) |
|
|
(104 |
) |
|
|
(105 |
) |
|
Foreign income and withholding taxes |
|
|
4,317 |
|
|
|
6,033 |
|
|
|
3,593 |
|
|
Stock-based compensation |
|
|
2,231 |
|
|
|
1,039 |
|
|
|
984 |
|
|
Change in valuation allowance |
|
|
155 |
|
|
|
3,807 |
|
|
|
5,982 |
|
|
Research and development credits |
|
|
(736 |
) |
|
|
(1,067 |
) |
|
|
(807 |
) |
|
Uncertain tax positions |
|
|
1,146 |
|
|
|
1,277 |
|
|
|
52 |
|
|
Provision to return adjustments |
|
|
(484 |
) |
|
|
848 |
|
|
|
(53 |
) |
|
Other |
|
|
48 |
|
|
|
169 |
|
|
|
671 |
|
|
|
|
$ |
1,404 |
|
|
$ |
1,005 |
|
|
$ |
(1,456 |
) |
Major components of the Company’s deferred tax assets (liabilities) as of December 31, 2016 and 2015 are as follows:
|
|
|
December 31, |
|
|||||
|
|
|
2016 |
|
|
2015 |
|
||
|
Net operating loss |
|
$ |
32,551 |
|
|
$ |
32,703 |
|
|
Accruals and reserves |
|
|
2,934 |
|
|
|
2,887 |
|
|
Research and development credits |
|
|
7,368 |
|
|
|
6,247 |
|
|
Stock-based compensation |
|
|
4,622 |
|
|
|
5,028 |
|
|
Property and equipment and intangible assets |
|
|
(1,855 |
) |
|
|
(2,036 |
) |
|
Other |
|
|
2,842 |
|
|
|
2,802 |
|
|
Net deferred tax assets |
|
|
48,462 |
|
|
|
47,631 |
|
|
Valuation allowance |
|
|
(49,382 |
) |
|
|
(48,913 |
) |
|
Total noncurrent net deferred tax liabilities, net of valuation allowance |
|
$ |
(920 |
) |
|
$ |
(1,282 |
) |
As a result of certain accounting guidance for stock compensation, the table of deferred tax assets and liabilities shown above does not include certain deferred tax assets at December 31, 2016 and 2015 that arose directly from tax deductions related to equity compensation in excess of compensation recognized for financial reporting. The provision for income taxes will be decreased by $1,423 if and when such benefits are ultimately realized and reduce taxes payable.
The Code, as amended, imposes restrictions on the utilization of net operating losses in the event of an “ownership change” of a corporation. Accordingly, a company’s ability to use net operating losses may be limited as prescribed under Internal Revenue Code Section 382 (“IRC Section 382”). Events which may cause limitations in the amount of the net operating losses that the Company may use in any one year include, but are not limited to, a cumulative ownership change of more than 50% over a three-year period. Utilization of the federal and state net operating losses may be subject to substantial annual limitation due to the ownership change limitations provided by the IRC Section 382 and similar state provisions. An analysis was conducted through December 31, 2016 to determine whether an ownership change had occurred since inception. The analysis indicated that because an ownership change occurred in a prior year, federal and state net operating losses of $184 and $214, respectively, were significantly limited pursuant to IRC Section 382. In the event the Company has subsequent changes in ownership, net operating losses and research and development credit carryovers could be further limited and may expire unutilized.
As of December 31, 2016, the Company had federal and state net operating loss carryforwards of approximately $99,675 and $80,937, respectively. The federal net operating loss carryforward will begin expiring in 2028 and the state net operating loss carryforward will begin expiring in 2017. As of December 31, 2016, the Company had federal and state research and development credits of approximately $5,751 and $5,644, respectively. The federal research and development credits will begin expiring in 2026. The state research and development credits are not currently subject to expiration.
73
The Company has recorded a full valuation allowance against its otherwise recognizable deferred income tax assets as of December 31, 2016 and 2015 (except for the deferred income tax assets associated with the Company’s subsidiaries in China, France, Ireland, Japan and the United Kingdom). The Company has determined, after evaluating all positive and negative historical and prospective evidence, that it is more likely than not that the deferred tax assets will not be realized. The valuation allowance increased by $469, $5,467 and $9,295 during the years ended December 31, 2016, 2015 and 2014, respectively.
The Company files U.S. state and foreign income tax returns in jurisdictions with varying statutes of limitations. In the normal course of business, the Company is subject to examination by taxing authorities throughout the world. These audits include questioning the timing and amount of deduction, the nexus of income among various tax jurisdictions and compliance with state, local and foreign tax laws. The Company is not currently under any examination by the U.S. state or foreign tax authorities. Because of net operating loss and credit carry forwards, all of the Company’s tax years dating to inception in 2006 remain open to examination.
As of December 31, 2016 and 2015, the Company had unrecognized tax benefits of $1,049 and $357, respectively, that if recognized would impact the annual effective tax rate. During 2016, 2015 and 2014, the Company did not recognize any interest or penalties related to unrecognized tax benefits. The aggregate changes in the balance of gross unrecognized tax benefits were as follows:
|
Ending balance as of December 31, 2013 |
|
$ |
1,088 |
|
|
Increase in balances related to tax positions taken during the current period |
|
|
394 |
|
|
Increase in balances related to tax positions taken during the prior period |
|
|
99 |
|
|
Ending balance as of December 31, 2014 |
|
|
1,581 |
|
|
Increase in balances related to tax positions taken during the current period |
|
|
3,196 |
|
|
Increase in balances related to tax positions taken during the prior period |
|
|
2,781 |
|
|
Ending balance as of December 31, 2015 |
|
|
7,558 |
|
|
Decrease in balances related to tax positions taken during the current period |
|
|
(2 |
) |
|
Increase in balances related to tax positions taken during the prior period |
|
|
1,240 |
|
|
Ending balance as of December 31, 2016 |
|
$ |
8,796 |
|
The Company does not anticipate that the amount of unrecognized tax benefits relating to tax positions existing at December 31, 2016 will materially increase or decrease within the next twelve months.
U.S. income taxes and foreign withholding taxes associated with the repatriation of earnings of foreign subsidiaries were not provided for on a cumulative total of $12,025 of undistributed earnings for certain foreign subsidiaries as of December 31, 2016. The Company intends to reinvest these earnings indefinitely in its foreign subsidiaries. If these earnings were distributed to the U.S. in the form of dividends or otherwise, or if the shares of the relevant foreign subsidiaries were sold or otherwise transferred, the Company would be subject to additional U.S. income taxes (subject to an adjustment for foreign tax credits) and foreign withholding taxes. Determination of the amount of unrecognized deferred income tax liability related to these earnings is not practicable.
13. Net Loss Per Share Available to Common Stockholders
Basic net loss per share available to common stockholders is calculated by dividing the net loss available to common stockholders by the weighted-average number of shares of common stock outstanding for the period. Net loss available to common stockholders is calculated using the two class method as net loss less the preferred stock dividend for the period less the amount of net loss, if any, allocated to the preferred stock based on weighted preferred stock outstanding during the period relative to total stock outstanding during the period. The weighted-average number of shares of common stock used to calculate the Company’s basic net loss per share available to common stockholders excludes those shares subject to repurchase related to unvested common shares, stock options that were exercised prior to vesting, restricted stock issued and RSUs settled for shares of common stock as these shares are not deemed to be outstanding for accounting purposes until they vest. The diluted net loss per share of common stock is computed by dividing the net loss using the weighted-average number of shares of common stock, excluding common stock subject to repurchase, and, if dilutive, potential shares of common stock outstanding during the period. Potential shares of common stock consist of common stock subject to repurchase, stock options to purchase common stock, restricted common stock issued, RSUs settled for shares of common stock, warrants to purchase convertible preferred stock (using the treasury stock method) and the conversion of the Company’s convertible preferred stock (using the “if converted” method).
74
The following table presents the calculation of basic and diluted net loss per share for the periods presented (in thousands except per share amounts):
|
|
|
Years Ended December 31, |
|
|||||||||
|
|
|
2016 |
|
|
2015 |
|
|
2014 |
|
|||
|
Numerator: |
|
|
|
|
|
|
|
|
|
|
|
|
|
Net loss available to common stockholders |
|
$ |
(16,480 |
) |
|
$ |
(33,349 |
) |
|
$ |
(33,171 |
) |
|
Denominator: |
|
|
|
|
|
|
|
|
|
|
|
|
|
Weighted average number of shares, basic and diluted |
|
|
38,318 |
|
|
|
36,580 |
|
|
|
34,210 |
|
|
Net loss per share available to common stockholders: |
|
|
|
|
|
|
|
|
|
|
|
|
|
Basic and diluted net loss per common share available to common stockholders |
|
$ |
(0.43 |
) |
|
$ |
(0.91 |
) |
|
$ |
(0.97 |
) |
The following table presents the potential common shares outstanding that were excluded from the computation of diluted net loss per share available to common stockholders for the periods presented because including them would have been anti-dilutive:
|
|
|
Years Ended December 31, |
|
|||||||||
|
|
|
2016 |
|
|
2015 |
|
|
2014 |
|
|||
|
Options to purchase common stock |
|
|
3,749 |
|
|
|
5,960 |
|
|
|
6,376 |
|
|
Restricted stock units |
|
|
3,003 |
|
|
|
1,221 |
|
|
|
769 |
|
|
Restricted common stock |
|
|
2 |
|
|
|
131 |
|
|
|
580 |
|
|
Common stock subject to repurchase |
|
|
3 |
|
|
|
18 |
|
|
|
85 |
|
|
|
|
|
6,757 |
|
|
|
7,330 |
|
|
|
7,810 |
|
14. Segment Reporting
The Company defines the term “chief operating decision maker” to be the Chief Executive Officer. The Chief Executive Officer reviews the financial information presented on a consolidated basis for purposes of allocating resources and evaluation of financial performance. Accordingly, the Company has determined that it operates as a single reportable and operating segment.
Revenues by geographic area, based on the billing location of the customer, were as follows:
|
|
|
Years Ended December 31, |
|
|||||||||
|
|
|
2016 |
|
|
2015 |
|
|
2014 |
|
|||
|
United States of America |
|
$ |
69,220 |
|
|
$ |
72,942 |
|
|
$ |
65,745 |
|
|
International |
|
|
30,658 |
|
|
|
35,588 |
|
|
|
33,609 |
|
|
Total revenues, net |
|
$ |
99,878 |
|
|
$ |
108,530 |
|
|
$ |
99,354 |
|
Long-lived assets, excluding goodwill and intangible assets, by geographic area were as follows:
|
|
|
December 31, |
|
|||||
|
|
|
2016 |
|
|
2015 |
|
||
|
United States of America |
|
$ |
19,861 |
|
|
$ |
20,825 |
|
|
International |
|
|
720 |
|
|
|
992 |
|
|
Total long-lived assets, net |
|
$ |
20,581 |
|
|
$ |
21,817 |
|
15. Commitments and Contingencies
Operating Leases
Rent expense for 2016, 2015 and 2014 was $8,760, $8,673, and $7,478, respectively.
The Company has leased office space in San Francisco, Austin, Chicago, Dublin, Hamburg, London, New York, Paris, Portland, Sydney, Shanghai and Tokyo under non-cancelable operating leases, which expire between 2016 and 2024. Additionally, the Company subleases a portion of its San Francisco office space, and leases the space utilized for data center operations.
75
Future minimum lease payments for significant operating leases, net of sublease payments, as of December 31, 2016 were as follows:
|
Year Ending |
|
|
|
|
|
December 31, 2017 |
|
$ |
6,086 |
|
|
December 31, 2018 |
|
|
4,417 |
|
|
December 31, 2019 |
|
|
4,006 |
|
|
December 31, 2020 |
|
|
3,333 |
|
|
December 31, 2021 |
|
|
3,398 |
|
|
Thereafter |
|
|
2,581 |
|
|
|
|
$ |
23,821 |
|
Legal Matters
From time to time, the Company may be involved in lawsuits, claims, investigations and proceedings, consisting of intellectual property, commercial, employment and other matters, which arise in the ordinary course of business. In accordance with GAAP, the Company records a liability when it is both probable that a liability has been incurred and the amount of the loss can be reasonably estimated. These provisions are reviewed at least quarterly and adjusted to reflect the impact of negotiations, settlements, ruling, advice of legal counsel and other information and events pertaining to a particular case. Litigation is inherently unpredictable. If any unfavorable ruling were to occur in any specific period or if a loss becomes probable and estimable, there exists the possibility of a material adverse impact on the Company’s results of operations, financial position or cash flows.
Indemnification
The Company enters into standard indemnification agreements in the ordinary course of business. Pursuant to the agreements, each party may indemnify, defend and hold the other party harmless with respect to such claim, suit or proceeding brought against it by a third party alleging that the indemnifying party’s intellectual property infringes upon the intellectual property of the third party, or results from a breach of the indemnifying party’s representations and warranties or covenants, or that results from any acts of negligence or willful misconduct. The term of these indemnification agreements is generally perpetual any time after execution of the agreement. The maximum potential amount of future payments the Company could be required to make under these indemnification agreements is unlimited. Historically, the Company has not been obligated to make significant payments for these obligations and no liabilities have been recorded for these obligations on the consolidated balance sheets as of December 31, 2016 and 2015.
The Company also indemnifies its officers and directors for certain events or occurrences, subject to certain limits, while the officer or director is or was serving at the Company’s request in such capacity. The maximum amount of potential future indemnification is unlimited; however, the Company has a Directors and Officers insurance policy that limits its exposure and enables the Company to recover a portion of any future amounts paid. Historically, the Company has not been obligated to make any payments for these obligations and no liabilities have been recorded for these obligations on the consolidated balance sheets as of December 31, 2016 and 2015.
Other Contingencies
The Company is subject to claims and assessments from time to time in the ordinary course of business. The Company’s management does not believe that any such matters, individually or in the aggregate, will have a material adverse effect on the Company’s financial position, results of operations or cash flows.
16. Employee Benefit Plans
The Company sponsors a 401(k) defined contribution plan covering all employees in the United States. The Board of Directors determines contributions made by the Company annually. The Company made no contributions under this plan for 2016, 2015 and 2014.
76
Pursuant to the requirements of Section 13 or 15(d) of the Securities Exchange Act of 1934, the Company has duly caused this report to be signed on its behalf by the undersigned, thereunto duly authorized, on February 28, 2017.
|
|
MARIN SOFTWARE INCORPORATED |
||
|
|
|
|
|
|
|
By: |
|
/s/ Catriona M. Fallon |
|
|
|
|
Catriona M. Fallon Chief Financial Officer |
77
KNOW ALL BY THESE PRESENTS, that each person whose signature appears below constitutes and appoints Christopher A. Lien and Catriona M. Fallon, and each of them, as his or her true and lawful attorneys-in-fact and agents, each with the full power of substitution, for him or her and in his or her name, place or stead, in any and all capacities, to sign any and all amendments to this report, and to file the same, with exhibits thereto and other documents in connection therewith, with the Securities and Exchange Commission, granting unto said attorneys-in-fact and agents, and each of them, full power and authority to do and perform each and every act and thing requisite and necessary to be done in and about the premises, as fully to all intents and purposes as he might or could do in person, hereby ratifying and confirming all that said attorneys-in-fact and agents, or their or his or her substitute or substitutes, may lawfully do or cause to be done by virtue hereof.
Pursuant to the requirements of the Securities Exchange Act of 1934, this report has been signed below by the following persons in the capacities and on the date indicated:
|
Name |
|
Title |
|
Date |
|
|
|
|
|
|
|
/s/ Christopher A. Lien |
|
Chief Executive Officer and Director |
|
February 28, 2017 |
|
Christopher A. Lien |
|
(Principal Executive Officer) |
|
|
|
|
|
|
|
|
|
/s/ Catriona M. Fallon |
|
Chief Financial Officer |
|
February 28, 2017 |
|
Catriona M. Fallon |
|
(Principal Financial and Accounting Officer) |
|
|
|
|
|
|
|
|
|
/s/ Paul Auvil |
|
Director |
|
February 28, 2017 |
|
Paul Auvil |
|
|
|
|
|
|
|
|
|
|
|
/s/ James Barrese |
|
Director |
|
February 28, 2017 |
|
James Barrese |
|
|
|
|
|
|
|
|
|
|
|
/s/ L. Gordon Crovitz |
|
Director |
|
February 28, 2017 |
|
L. Gordon Crovitz |
|
|
|
|
|
|
|
|
|
|
|
/s/ Donald Hutchison |
|
Director |
|
February 28, 2017 |
|
Donald Hutchison |
|
|
|
|
|
|
|
|
|
|
|
/s/ Allan Leinwand |
|
Director |
|
February 28, 2017 |
|
Allan Leinwand |
|
|
|
|
|
|
|
|
|
|
|
/s/ Daina Middleton |
|
Director |
|
February 28, 2017 |
|
Daina Middleton |
|
|
|
|
78
|
|
|
|
|
Incorporated by Reference |
|
|
||||||
|
Exhibit |
|
Description of Document |
|
Form |
|
File No. |
|
Exhibit |
|
Filing Date |
|
Filed |
|
|
|
|
|
|
|
|
|
|
|
|
|
|
|
3.1 |
|
Restated Certificate of Incorporation. |
|
10-Q |
|
001-35838 |
|
3.1 |
|
5/9/2013 |
|
|
|
|
|
|
|
|
|
|
|
|
|
|
|
|
|
3.2 |
|
Restated Bylaws. |
|
10-Q |
|
001-35838 |
|
3.2 |
|
5/9/2013 |
|
|
|
|
|
|
|
|
|
|
|
|
|
|
|
|
|
4.1 |
|
Form of Common Stock Certificate. |
|
S-1/A |
|
333-186669 |
|
4.1 |
|
3/15/2013 |
|
|
|
|
|
|
|
|
|
|
|
|
|
|
|
|
|
4.2 |
|
Amended and Restated Investors Rights’ Agreement, dated as of January 25, 2012, by and among the Registrant and certain of its stockholders, as amended. |
|
S-1 |
|
333-186669 |
|
4.2 |
|
2/13/2013 |
|
|
|
|
|
|
|
|
|
|
|
|
|
|
|
|
|
10.1 |
|
Form of Indemnification Agreement. |
|
S-1/A |
|
333-186669 |
|
10.1 |
|
3/4/2013 |
|
|
|
|
|
|
|
|
|
|
|
|
|
|
|
|
|
10.2# |
|
2006 Equity Incentive Plan and forms of stock option agreement and stock option exercise agreement. |
|
S-1 |
|
333-186669 |
|
10.2 |
|
2/13/2013 |
|
|
|
|
|
|
|
|
|
|
|
|
|
|
|
|
|
10.3# |
|
2013 Equity Incentive Plan and forms of stock option agreement, stock option exercise agreement, restricted stock agreement, and restricted stock unit award agreement. |
|
S-1/A |
|
333-186669 |
|
10.3 |
|
3/4/2013 |
|
|
|
|
|
|
|
|
|
|
|
|
|
|
|
|
|
10.4# |
|
2013 Employee Stock Purchase Plan and form of subscription agreement. |
|
S-1/A |
|
333-186669 |
|
10.4 |
|
3/4/2013 |
|
|
|
|
|
|
|
|
|
|
|
|
|
|
|
|
|
10.5 |
|
Master Services Agreement, dated as of August 3, 2009, by and between the Registrant and Switch Communications Group L.L.C. |
|
S-1 |
|
333-186669 |
|
10.7 |
|
2/13/2013 |
|
|
|
|
|
|
|
|
|
|
|
|
|
|
|
|
|
10.6# |
|
Form of Severance and Change in Control Agreement between the Registrant and each of the executive officers. |
|
S-1/A |
|
333-186669 |
|
10.9 |
|
3/11/2013 |
|
|
|
|
|
|
|
|
|
|
|
|
|
|
|
|
|
10.7# |
|
Executive Bonus Compensation Plan. |
|
10-K |
|
001-35838 |
|
10.11 |
|
2/20/2015 |
|
|
|
|
|
|
|
|
|
|
|
|
|
|
|
|
|
10.8# |
|
Offer Letter, dated May 4, 2014, by and between the Registrant and David. A. Yovanno. |
|
8-K |
|
001-35838 |
|
10.1 |
|
5/8/2014 |
|
|
|
|
|
|
|
|
|
|
|
|
|
|
|
|
|
10.10# |
|
Description of Director Compensation Program. |
|
10-K |
|
001-35838 |
|
10.14 |
|
2/20/2015 |
|
|
|
|
|
|
|
|
|
|
|
|
|
|
|
|
|
10.12# |
|
Offer Letter, dated as of July 1, 2015, by and between the Registrant and Catriona M. Fallon. |
|
10-Q |
|
001-35838 |
|
10.2 |
|
8/6/2015 |
|
|
|
|
|
|
|
|
|
|
|
|
|
|
|
|
|
10.13# |
|
Transition and Separation Agreement, dated as of September 14, 2015, by and between the Registrant and Christopher A. Lien. |
|
10-Q |
|
001-35838 |
|
10.4 |
|
11/5/2015 |
|
|
|
|
|
|
|
|
|
|
|
|
|
|
|
|
|
10.14# |
|
Offer Letter, dated as of August 14, 2014, by and between the Registrant and Stephen E. Kim. |
|
10-K |
|
001-35838 |
|
10.14 |
|
2/23/2016 |
|
|
|
|
|
|
|
|
|
|
|
|
|
|
|
|
|
10.16 |
|
Office Lease, dated as of January 7, 2011, by and between the Registrant and 123 Mission, LLC, as amended. |
|
10-K |
|
001-35838 |
|
10.16 |
|
2/23/2016 |
|
|
|
|
|
|
|
|
|
|
|
|
|
|
|
|
|
10.17# |
|
Offer Letter, dated as of August 23, 2016, by and between the Registrant and Christopher A. Lien. |
|
10-Q |
|
001-35838 |
|
10.1 |
|
11/9/2016 |
|
|
|
|
|
|
|
|
|
|
|
|
|
|
|
|
|
10.18# |
|
Separation Agreement, dated as of August 22, 2016, by and between the Registrant and David A. Yovanno. |
|
10-Q |
|
001-35838 |
|
10.2 |
|
11/9/2016 |
|
|
|
|
|
|
|
|
|
|
|
|
|
|
|
|
|
21.1 |
|
Subsidiaries of the Registrant. |
|
|
|
|
|
|
|
|
|
X |
|
|
|
|
|
|
|
|
|
|
|
|
|
|
|
23.1 |
|
Consent of independent registered public accounting firm. |
|
|
|
|
|
|
|
|
|
X |
|
|
|
|
|
|
|
|
|
|
|
|
|
|
79
|
|
|
|
|
Incorporated by Reference |
|
|
||||||
|
Exhibit |
|
Description of Document |
|
Form |
|
File No. |
|
Exhibit |
|
Filing Date |
|
Filed |
|
|
Certification of Principal Executive Officer pursuant to Rule 13a-14(a), as adopted pursuant to Section 302 of the Sarbanes-Oxley Act of 2002. |
|
|
|
|
|
|
|
|
|
X |
|
|
|
|
|
|
|
|
|
|
|
|
|
|
|
|
31.2 |
|
Certification of Principal Financial Officer pursuant to Rule 13a-14(a), as adopted pursuant to Section 302 of the Sarbanes-Oxley Act of 2002 |
|
|
|
|
|
|
|
|
|
X |
|
|
|
|
|
|
|
|
|
|
|
|
|
|
|
32.1* |
|
Certification of Principal Executive Officer pursuant to 18 U.S.C. Section 1350, as adopted pursuant to Section 906 of the Sarbanes-Oxley Act of 2002. |
|
|
|
|
|
|
|
|
|
X |
|
|
|
|
|
|
|
|
|
|
|
|
|
|
|
32.2* |
|
Certification of Principal Financial Officer pursuant to 18 U.S.C. Section 1350, as adopted pursuant to Section 906 of the Sarbanes-Oxley Act of 2002. |
|
|
|
|
|
|
|
|
|
X |
|
|
|
|
|
|
|
|
|
|
|
|
|
|
|
101.INS |
|
XBRL Instance Document |
|
|
|
|
|
|
|
|
|
X |
|
|
|
|
|
|
|
|
|
|
|
|
|
|
|
101.SCH |
|
XBRL Taxonomy Schema Linkbase Document |
|
|
|
|
|
|
|
|
|
X |
|
|
|
|
|
|
|
|
|
|
|
|
|
|
|
101.CAL |
|
XBRL Taxonomy Calculation Linkbase Document |
|
|
|
|
|
|
|
|
|
X |
|
|
|
|
|
|
|
|
|
|
|
|
|
|
|
101.DEF |
|
XBRL Taxonomy Definition Linkbase Document |
|
|
|
|
|
|
|
|
|
X |
|
|
|
|
|
|
|
|
|
|
|
|
|
|
|
101.LAB |
|
XBRL Taxonomy Labels Linkbase Document |
|
|
|
|
|
|
|
|
|
X |
|
|
|
|
|
|
|
|
|
|
|
|
|
|
|
101.PRE |
|
XBRL Taxonomy Presentation Linkbase Document |
|
|
|
|
|
|
|
|
|
X |
|
* |
As contemplated by SEC Release No. 33-8212, these exhibits are furnished with this Annual Report on Form 10-K and are not deemed filed with the Securities and Exchange Commission and are not incorporated by reference in any filing of the Registrant under the Securities Act of 1933 or the Exchange Act of 1934, whether made before or after the date hereof and irrespective of any general incorporation language in such filings. |
|
# |
Represents a management contract or compensatory plan. |
80