Attached files
| file | filename |
|---|---|
| EX-99.1 - EXHIBIT 99.1 - CASTLIGHT HEALTH, INC. | a2016-10kxexhibit991.htm |
| EX-32.2 - EXHIBIT 32.2 - CASTLIGHT HEALTH, INC. | a2016-10kxcfo906certificat.htm |
| EX-32.1 - EXHIBIT 32.1 - CASTLIGHT HEALTH, INC. | a2016-10kxceo906certificat.htm |
| EX-31.2 - EXHIBIT 31.2 - CASTLIGHT HEALTH, INC. | a2016-10kxcfo302certificat.htm |
| EX-31.1 - EXHIBIT 31.1 - CASTLIGHT HEALTH, INC. | a2016-10kxceo302certificat.htm |
| EX-23.1 - EXHIBIT 23.1 - CASTLIGHT HEALTH, INC. | a2016-consent.htm |
| EX-21.1 - EXHIBIT 21.1 - CASTLIGHT HEALTH, INC. | exhibit211.htm |
| EX-10.12 - EXHIBIT 10.12 - CASTLIGHT HEALTH, INC. | a2016-10kxexhibit1012.htm |
UNITED STATES
SECURITIES AND EXCHANGE COMMISSION
Washington, D.C. 20549
FORM 10-K
[x] ANNUAL REPORT PURSUANT TO SECTION 13 OR 15(d) OF THE SECURITIES EXCHANGE ACT OF 1934
For the year ended December 31, 2016
or
[ ] TRANSITION REPORT PURSUANT TO SECTION 13 OF 15(d) OF THE SECURITIES EXCHANGE ACT OF 1934
For the transition period from______ to ______
Commission File Number: 001-36330
CASTLIGHT HEALTH, INC.
(Exact name of registrant as specified in its charter)
Delaware (State or other jurisdiction of incorporation or organization) | 26-1989091 (I.R.S. Employer Identification Number) | |
150 Spear Street, Suite 400
San Francisco, CA 94105
(Address of principal executive offices)
(415) 829-1400
(Registrant’s telephone number, including area code)
Securities registered pursuant to Section 12(b) of the Act:
Title of each class | Name of each exchange on which registered | |
Class B Common Stock, par value $0.0001 per share | New York Stock Exchange | |
Securities registered pursuant to section 12(g) of the Act:
Not applicable
Indicate by check mark if the registrant is a well-known seasoned issuer, as defined in Rule 405 of the Securities Act. Yes [ ] No [x]
Indicate by check mark if the registrant is not required to file reports pursuant to Section 13 or Section 15(d) of the Act. Yes [ ] No [x]
Indicate by check-mark whether the registrant (1) has filed all reports required to be filed by Section 13 or 15 (d) of the Securities Exchange Act of 1934 during the preceding 12 months (or for such shorter period that the registrant was required to file such reports) and (2) has been subject to such filing requirements for the past 90 days. Yes [x ] No []
Indicate by check mark whether the registrant has submitted electronically and posted on its corporate Web site, if any, every Interactive Data File required to be submitted and posted pursuant to Rule 405 of Regulation S-T (§232.405 of this chapter) during the preceding 12 months (or for such shorter period that the registrant was required to submit and post such files). Yes [x] No [ ]
Indicate by check mark if disclosure of delinquent filers pursuant to Item 405 of Regulation S-K (§ 229.405 of this chapter) is not contained herein, and will not be contained, to the best of registrant’s knowledge, in definitive proxy or information statements incorporated by reference in Part III of this Form 10-K or any amendment to this Form 10-K. []
Indicate by check mark whether the registrant is a large accelerated filer, an accelerated filer, a non-accelerated filer, or a smaller reporting company. See definitions of "large accelerated filer," "accelerated filer," and "smaller reporting company" in Rule 12b-2 of the Exchange Act.
Large accelerated filer [ ] | Accelerated filer [x] | Non-accelerated filer [ ] (Do not check if a smaller reporting company) | Smaller reporting company [ ] |
Indicate by check mark whether the registrant is a shell company (as defined in Rule 12b-2 of the Act). Yes[ ] No [x]
Based on the closing price of the Registrant’s Common Stock on the last business day of the Registrant’s most recently completed second quarter, which was June 30, 2016, the aggregate market value of its shares (based on a closing price of $3.96 per share) held by non-affiliates was approximately $273.5 million. As of February 24, 2017, there were 54,288,009 shares of the Registrant’s Class A common stock outstanding and 51,106,127 shares of the Registrant’s Class B common stock outstanding.
DOCUMENTS INCORPORATED BY REFERENCE
Portions of the Registrant’s definitive proxy statement for its 2017 Annual Meeting of Stockholders (the “Proxy Statement”), to be filed within 120 days of the Registrant’s year ended December 31, 2016, are incorporated by reference in Part III of this Report on Form 10-K. Except with respect to information specifically incorporated by reference in this Form 10-K, the Proxy Statement is not deemed to be filed as part of this Form 10-K.
TABLE OF CONTENTS
Page | |
______________________________________
i
Special Note Regarding Forward Looking Statements and Industry Data
This Annual Report on Form 10-K includes forward-looking statements. All statements, other than statements of historical fact, contained in this Annual Report on Form 10-K, including statements regarding our non-GAAP revenue, backlog, revenue and other aspects of our future results of operations, financial position and cash flows, our business strategy and plans and our objectives for future operations, are forward-looking statements. The words “believe,” “may,” “will,” “estimate,” “continue,” “anticipate,” “would,” “could,” “should,” “intend” and “expect” and similar expressions are intended to identify forward-looking statements. We have based these forward-looking statements largely on our current expectations and projections about future events and financial trends that we believe may affect our financial condition, results of operations, business strategy, short-term and long-term business operations and objectives, and financial needs. These forward-looking statements are subject to a number of risks, uncertainties and assumptions, including those described in Part I, Item 1A “Risk Factors.” Moreover, we operate in a very competitive and rapidly changing environment. New risks emerge from time to time. It is not possible for our management to predict all risks, nor can we assess the impact of all factors on our business or the extent to which any factor, or combination of factors, may cause actual results to differ materially from those contained in any forward-looking statements we may make. In light of these risks, uncertainties and assumptions, the future events and trends discussed in this Annual Report on Form 10-K may not occur and actual results could differ materially and adversely from those anticipated or implied in the forward-looking statements.
Although we believe that the expectations reflected in the forward-looking statements are reasonable, we cannot guarantee future results, levels of activity, performance or achievements. We are under no duty to update any of these forward-looking statements after the date of this Annual Report on Form 10-K or to conform these statements to actual results or revised expectations.
Part I
Item 1. Business
Overview
Castlight offers a health benefits platform that engages employees to make better health decisions and enables employers to communicate and measure their benefit programs. We provide a simple, personalized and powerful experience that engages employees and helps guide them to the right care, right provider and right program at the right time. Meanwhile, we help enable employers to understand their employees’ needs with real-time insights into employee engagement with benefits and programs. This allows benefit leaders to monitor and adjust their strategies throughout the year. Our comprehensive health benefits platform offering aggregates complex, large-scale data and applies sophisticated analytics to make health care data transparent and useful. Our products deliver strong employee engagement and enable employers to integrate disparate benefit programs into a single platform available to employees and their families. Ultimately, we enable organizations and their employees to improve outcomes, lower health care costs, and increase benefits satisfaction.
U.S. health care spending is forecasted to total approximately $3.66 trillion in 2017, with $1.21 trillion of this amount to be paid by U.S. employers, according to the Centers for Medicare and Medicaid Services, or CMS. In addition, 73% of employees don’t fully understand their benefits and as a result they are not making good health decisions.
We believe that controlling costs and improving quality of care for employees and thereby driving efficiency in the overall health care market can be achieved by technology solutions that are capable of addressing the scale and complexity of the U.S. health care industry.
Our health benefits platform leverages complex external data and our substantial user base to provide a single, end-to-end solution that integrates benefit programs and engages employees through personalized, timely communications. Our offering provides employers the opportunity to communicate, measure, and get more value out of their benefits and programs on a real-time basis. We obtain external data from a diverse array of sources, such as health care providers, insurance companies, governmental agencies and quality-monitoring organizations, as well as internal data we generate from the usage of our products. Our team of engineers, data scientists, and clinicians applies sophisticated data science techniques, including predictive modeling and epidemiological analytics that leverage our database to drive insights and provide a deeply personalized experience for our users.
1
We believe that we are well positioned to leverage our use of large amounts of health care related data, sophisticated data analytics, strong customer portfolio and early-mover advantage to play a significant role in dramatically improving the efficiency of the U.S. health care system.
Our Opportunity
We believe there is a significant opportunity to offer a comprehensive, technology-based solution to reduce the massive waste and inefficiencies associated with the approximately $1.21 trillion that employers are projected to spend on health care in the United States in 2017. By combining innovations in big data analytics, software and services delivery models and consumer-oriented web and mobile products with deep health care domain knowledge and a platform for integrating third-party data and applications, we believe we are well positioned to play a central role in dramatically improving the efficiency of the U.S. health care system.
Our Solution
We have developed a new category of platform that helps engage employees to make better health decisions and enables employers to communicate and measure their benefit programs.
The key components of our health benefits platform include:
A Simple Way to Learn About and Access Benefits
We simplify the health care decision-making process for employees and their families by providing highly relevant, personalized and timely information that encourages informed choices before, during, and after receiving health care. Leveraging our robust data, analytics, and search capabilities, we deliver a highly personalized and differentiated health care shopping experience that includes individualized out-of-pocket cost estimates, clinical quality, patient satisfaction and provider demographic information. Employer programs are integrated into the platform and promoted to employees in relevant situations to help drive increased utilization of valuable benefits and services such as tele-health, second opinion programs and wellness offerings. Additional features include the ability to manage a care team, personalized tips, evidence-based clinical guidelines, educational content, benefit guides and real-time spend and deductible information. By empowering employees and their families with easy-to-use information, we enable them to make better, “market-based” decisions that avoid excessive prices and low quality or unnecessary care, creating significant value for both employees and employers.
Personalized Information When Employees Need It The Most
Our predictive analytics capabilities enable personalized and timely employee communications to impact behavioral change and create lasting employee engagement. Our platform identifies segments of the employee population with particular health needs and can automatically launch “one-click” campaigns to identified audiences, such as employees with back pain or diabetes. Campaigns include clinically validated and highly relevant information that has undergone rigorous testing to resonate with identified employee populations. In addition, our platform continually responds to employee “search and use” information to provide ongoing decision support and guidance. These real-time communications guide employees to the right care and right provider at the right time to improve health care outcomes. This level of automation allows benefit leaders to concentrate their time and resources on other business priorities while meeting the health benefit needs of their employee populations.
Timely Outreach to Guide Employees When They Need It The Most
We provide benefit leaders with real-time insight into employee population health needs and benefit utilization to evaluate and optimize health benefit programs year-round. Previously, benefit leaders have often relied on historic claims data, preventing them from responding to changing employee population health needs in a timely fashion. This data lag has dramatic consequences. Real-time insights into employee health needs allow employers to proactively help employees with information and appropriate care when they need it. Our engagement data also enables confidential real-time population segmentation for benefit leaders to understand the needs of specific employee populations, all while adhering to HIPAA standards. This segmentation allows benefits leaders to pilot programs to specific populations in need, such as second opinion programs for employees assessing back surgery options. Ultimately, real-time visibility helps enable our customers to drive employee engagement and evaluate the success of their plans, programs, and vendors to optimize their benefit strategies.
We are able to provide our solution in a unique way as a result of the following factors:
2
Trusted and Proven Market Leader
As an independent technology company in the health care industry, we believe we are a trusted source of health care decision support that is available to millions of employees across the U.S. We believe our impartiality is an important attribute for our relationships with our customers, as well as their employees and families, and allows us to collaborate with health plans, health care providers, and broader health care stakeholders. As of December 31, 2016, 211 customers were in contract with Castlight to provide their employees with a confidential platform to help make informed health care decisions. We have significant experience deploying its platform with large-scale employers. Our multi-disciplinary team of leading engineers, clinicians, developers and marketers enables us to continue to innovate and bring products to our customers that help enable employees to lead healthier lives and companies to get the most from their health benefits.
Unique Data and Proprietary Analytics
The foundation of our health benefits platform is the unique data and proprietary analytics that power our offering. Our platform integrates, organizes, and presents data from across the fragmented and complex health care landscape in an engaging, user-friendly way. Prior to our efforts in this area, much of this data had been inaccessible to employers, employees and their families. We work with all major health plans and many of the largest pharmacy benefits managers and dental carriers and have one of the broadest sets of pricing data in the industry. In addition to pricing, our data foundation includes data from numerous validated and nationally recognized quality sources, as well as real-time employee search and benefit utilization information. With this data, our team has developed proprietary analytic techniques to transform unstructured data from disparate sources into actionable information, including price and quality of thousands of health care products and services, population segmentation, employee engagement, and benefit performance. With real-time employee use and engagement data, we employ predictive modeling to identify patients who will most benefit from early intervention and outreach. Our platform uses this analytics engine to identify patterns of inefficient behavior for large populations of employees and their families, complying to strict HIPAA parameters, thereby enabling employers to take actions intended to optimize benefit plans, reduce health care costs, and drive behavioral change.
Integrated Platform for Both Employer and Employee
By bringing a company’s entire health benefits portfolio into a single platform, we help enable both employee and employers to manage and make the most out of their health benefits. We integrate our customers’ complete health benefits offerings into a single platform so that employees have easy access to all of their health benefits in one place. With this convenient and, comprehensive view, employees are better positioned to understand their benefit options and to increase engagement and utilization across all of their health benefits offerings. In addition to medical, dental, pharmacy, and behavioral health plans, our platform also integrates with many third-party vendors and programs, including health savings accounts, tele-medicine, tele-therapy, and disease management providers to provide a comprehensive health benefits experience. As employees use our product, our engagement tracking capabilities, coupled with claims data, enable us to segment populations of employees based on their health needs. This segment data is presented to benefit leaders as HIPAA-compliant, confidential real-time insights to enable highly personalized, automated, and relevant communications back to employees to further engage and motivate. The data exchange between employee and employer is designed to become a virtuous cycle, making the data more powerful, the experience more engaging, and the platform more robust.
Our Products
We offer a health benefits platform that engages employees to make better health care decisions and enables employers to communicate and measure their benefits programs. We provide a simple, integrated experience for employees that helps them understand and access their health benefits while guiding them to the right care, right provider, and right program at the right time; uses personalized, timely communications that proactively engage employees in their health and drive better decisions at their point of need; and provides real-time insight into employee engagement with benefits and programs, enabling employers to monitor and adjust their strategies throughout the year.
We sell the health benefits platform through two packages. Castlight Engage represents the full power of our platform. Castlight Connect represents our decision support solution for medical and pharmacy health decisions as well as integration of third-party programs.
All customers purchase our core health benefits technology:
3
• | Castlight Health Benefits Platform. The functionality of the core Castlight technology is available to all of our customers. Our core technology includes both an employee and a benefits professional experience. The employee-facing web and mobile experiences simplify health care decision making for employees and their families by providing highly relevant, personalized information for medical services that enable informed choices before, during and after receiving health care. The intuitive, natural language search experience includes personalized out-of-pocket cost estimates, clinical quality, patient satisfaction and provider demographic information. Employer programs are integrated into the platform and promoted to employees in relevant situations to drive increased utilization of valuable benefits and services like tele-health, second opinion programs and wellness offerings. Additional features include the ability to manage a tailored care team, personalized tips, evidence-based clinical guidelines, educational content, benefit guides and real-time spend and deductible information. The benefits professional experience empowers human resource leaders with real-time insights into employee engagement with the platform, benefits and programs to identify opportunities to drive better employee engagement and improved outcomes. |
Customers who purchase both Castlight Connect and Castlight Engage also receive decision support around pharmacy health decisions and Castlight Rewards:
• | Castlight Pharmacy. Castlight Pharmacy delivers information to guide employees and their families on how to manage their prescription drug spending. Our pharmacy product enables them to easily search for cost estimates for specific medications at convenient retail locations as well as mail order alternatives and presents multiple ways to save including using generic equivalents and therapeutic area alternatives. Additionally, Castlight Pharmacy is capable of driving improved drug compliance through prescription refill reminders and interfaces with other third-party applications to change and fulfill prescriptions. |
• | Castlight Rewards. Castlight Rewards is an incentive system to motivate employees to make better health care decisions. Employers can use Castlight Rewards to encourage employees to learn about their health care, engage with us and a variety of other desired behaviors. |
The Engage package includes Castlight Action, offering customers the full platform, in addition to the functionality offered in Castlight Connect:
• | Castlight Action. Castlight Action is a fully automated solution for benefits professionals to leverage data and predictive analytics to connect employees to the right benefits and programs throughout the year, in a HIPAA-compliant manner. It surfaces insights to the benefits leader, segments and targets the relevant population using personalized, multi-channel campaigns with specific behavior change goals, and delivers real-time aggregate reporting on the impact of those campaigns to the benefits leader. Castlight Action helps enable benefits leaders to unlock the full value of their benefits strategy by bringing the power of data to enable better employee decision-making. |
Additionally, all customers may purchase Castlight Elevate as a cross-sell product, and Castlight Dental is included as an add-on where available:
• | Castlight Elevate. Castlight Elevate helps employees working through behavioral health conditions or triggers such as depression, anxiety, substance use disorder, insomnia, and stress. Castlight Elevate breaks down the barriers to behavioral health treatment by enabling employees to research behavioral health services, make educated treatment choices, and begin care, all through a personalized experience. |
• | Castlight Dental. Castlight Dental provides a comprehensive solution for employees to understand and manage their oral health and dental spend. Our dental product enables employees to search for specific dental procedures, understand the coverage and overall cost of the care, and make optimal choices. Further, Castlight Dental educates employees about common oral health conditions, driving health, productivity, and increased benefit satisfaction for employees. |
Our Services
4
We provide a range of services to help employers implement and maximize the value of our offering, including:
• | Communication and Engagement Services. We offer communications services to drive employee engagement with our offering that span educational presentations, email campaigns, print collateral and employer-specific media. Communications initiatives are typically run during open enrollment, time of product launch and periodically post launch, and are designed to drive employee engagement and change management. The fees for these services are included as part of our contracts. |
• | Implementation Services. We provide implementation services to our customers to help ensure successful deployment of our offering, including executing required data feeds, loading customer data, configuring products, integrating with third-party and other applications and comprehensive testing. The fees for these services are included as part of our contracts. |
• | Customer Support. We offer end user support to help ensure effective employee use of our platform. We provide telephonic, live chat and email support for employees and their families in the areas of account maintenance, technical issue resolution, and navigation of online services. In addition, we assist employees with finding care, understanding their benefits, and interpreting past claims, bills, and total spend. We also enable employees who may have limited computer access to obtain their personalized health care information using our customer support personnel. The fees for these services are included as part of subscriptions to our products. |
Financial Information about Segments and Geographic Areas
We manage our operations and allocate resources as a single reportable segment. All of our revenue is recognized in the United States and all of our long-lived assets are located in the United States.
Customers
As of December 31, 2016, we had 211 signed customers. Together, our customers encompass millions of eligible employees and their families. Our customers consist primarily of large self-insured employers, representing a wide range of industries, such as education, manufacturing, retail, technology and government, and includes some of the largest employers in the United States. We also have customers in the mid-market which we define as ‘Growth’ customers. We define a customer as a separate and distinct buying entity, such as a company, an educational or government institution, or a distinct business unit of a large corporation, which has entered into a master subscription agreement with us to access our platform, including customers that are in the process of deploying our platform to employee populations.
For the year ended December 31, 2016, the Administrative Committee of the Wal-Mart Stores, Inc., Associates’ Health and Welfare Plan, or the Wal-Mart Plan, represented approximately 10% of our total revenue.
Employees and Culture
We view our employees and company culture as critical assets for our business and a source of competitive strength. Our leadership team is focused on supporting our employees and fostering our unique culture. We believe this has enabled us to attract and retain some of the best minds in technology and health care to build and advance our platform.
As of December 31, 2016, we had a total of 381 full-time employees. We also engage contractors and consultants. None of our employees are represented by a labor union or covered by a collective bargaining agreement. We have not experienced any work stoppages, and we consider our relations with our employees to be good.
Sales and Marketing
We have a hybrid sales model that leverages a national direct sales organization, supported by strong channel partner relationships. Our direct sales team comprises enterprise-focused field sales professionals who are organized by geography. Our field professionals are supported by a sales operations staff, including product technology experts, lead generation professionals and sales data experts. We have also increased our focus on indirect sales through a variety of channels. We are investing in our relationships with key industry participants including benefit consultants, brokers, group purchasing organizations, health plan partners and enterprise software providers. These channel partners can support our sales efforts to varying degrees by sourcing
5
prospects, and working in collaboration with our direct sales team during the sales process. Through these relationships, we are able to reach a broader set of potential customers and leverage existing relationships to promote our health benefits platform and products and potentially accelerate our sales cycle relative to what we have seen in the past.
We also generate customer leads, accelerate sales opportunities and build brand awareness through our marketing programs and strategic relationships. Our marketing programs target human resource executives and benefits leaders in addition to senior business leaders and health care and benefits channel partners. Our principal marketing programs include use of our website to provide information about our company and our software services, as well as learning opportunities for potential customers, demand generation, field marketing events, integrated marketing and direct e-mail campaigns and participation in, and sponsorship of, user conferences, industry events, trade shows and customer conferences.
Research and Development
Our ability to compete depends, in large part, on our continuous commitment to rapidly introduce new products services, technologies, features and functionality. Our research and development organization is responsible for the design, development, testing and certification of our offering. We focus our efforts on developing new products and core technologies and further enhancing the usability, engagement, perceived value, and retention and expansion of our installed base of customers.
Research and development expenses were $40.5 million, $30.1 million, and $22.9 million for the years ended December 31, 2016, 2015 and 2014, respectively.
Technology and Operations
We have designed our technology infrastructure to provide a highly available and secure multi-tenant cloud-based offering. Our multi-tenant platform allows us to use a common data model and consistent management practices for all customers with multiple possible configurations, while securely partitioning each customer’s application data. This approach provides significant operating leverage and improved efficiency as it helps us reduce our fixed cost base and minimize unused capacity on our hardware.
The architecture, deployment and management of our technology are focused on:
• | Scalability. We have developed a robust and scalable data architecture infrastructure, which allows for automated loading and normalization of numerous data sources, including billions of claim transactions in our data warehouse. |
• | Standardization. Our technology assimilates structured and unstructured data from disparate sources, and employs unique algorithms to convert these data into user-friendly information for our users. Additionally, we operate using Services Oriented Architecture principles, with a platform of services that serve to deliver the application in a scalable and standardized way. |
• | Security. We maintain a formal and comprehensive security program designed to ensure the security and integrity of customer data, protect against security threats or data breaches and prevent unauthorized access to our data or the data of our customers. We strictly regulate and limits all access to on-demand servers and networks at our production and remote backup facilities. All users are authenticated, authorized and validated before they can access our system. Users must have a valid user ID and associated password to log on to our services. We require Transport Layer Security between the user’s browser and our servers to protect data in transit. Encrypted backup files are transmitted over secure connections to redundant storage in a secondary data center. |
We currently host our products and serve all of our customers from data centers located in Arizona and Colorado. We rely on third-party vendors to provide infrastructure support for our data centers, which are designed to host computer systems that require high levels of availability and have redundant subsystems and compartmentalized security zones. We utilize commercially available hardware for our data center servers. Our data center facilities employ advanced measures to ensure physical integrity, including redundant power and cooling systems and advanced fire and flood prevention.
6
We apply a wide variety of strategies to achieve better than 99% uptime, excluding scheduled maintenance. We achieved over 99.9% uptime, excluding scheduled maintenance, over the last 12 months.
Compliance and Certifications
Our software services and data are located at independently managed facilities. We require those vendors to obtain third-party security examinations relating to security and data privacy. Statement on Standards for Attestation Engagements, SSAE, No. 16 SOC 1 or AT101 SOC 2, Reporting on Controls at a Service Organization, replaced SAS- 70 Type II examinations as the authoritative standard for reporting on service organizations. Our vendors’ examinations are conducted at least every 12 months by an independent third-party auditor, and address, among other areas, physical and environmental safeguards for production data centers, data availability and integrity procedures, change management procedures and logical security procedures. We conduct a SOC 2 audit performed by a third-party, and an internal audit based upon the ISO 27001 standard and criteria that addresses, among other things, security, data privacy and operational controls, annually.
Strategic Relationships
We have established a number of strategic relationships to deepen and complement our platform and products. These relationships include health care payers, consulting and implementation services provider and broader health care partners.
Data Collaborations. We work with health plans, pharmacy benefit managers, or PBMs and dental plans, behavioral health plans, and HSA providers to support our mutual customers. We have relationships with many national and regional health plans, PBMs, dental insurers, behavioral health plans, and health savings plans. These collaborations provide us with claims, balance integrations and other data on behalf of our employer customers. We have developed technologies in collaboration with several payers including real-time integrated APIs and our Castlight Protect product. The increasing number of data integrations we have in place is helping to position us as a health benefits platform for our customers, and enables employers to consolidate their myriad sources of benefits information toward a single point of reference.
Channel Relationships. We have relationships with channel partners, which complement our direct sales capabilities. These relationships and strategies include a focus on brokers, consultants, health plans and enterprise software providers. Through these relationships, we gain the leverage to reach a broader set of potential customers and leverage existing relationships to promote our health benefits platform and products to cross-pollenate customer opportunities.
We continue to take steps to expand our partnership with Anthem, Inc. to deliver greater shared value to our customers. Together, Castlight and Anthem are creating new and innovative solutions to offer enhanced technology, improved data sharing and easier, faster implementation processes for our joint customers. We are also working with Anthem to roll out a broader, highly integrated mobile-first engagement platform for new and existing Anthem accounts. Additionally, we have developed the base technology underlying Anthem’s core transparency offering, which Anthem is rolling out to its book of business in a phased approach.
We have also entered into a strategic partnership with SAP. As part of the partnership, SAP purchased 4.7 million shares of Class B common stock in Castlight Health, resulting in SAP holding 4.7% post-issuance of the currently-outstanding common shares of our company, at a price per share of $3.77, for approximately $18 million in cash. SAP also received a warrant in connection with its stock purchase, under which SAP has the right to purchase an additional 1.9 million shares of our Class B common stock subject to certain conditions, at $4.91 per share. In addition to the investment, SAP and our company intend to enter into a distribution relationship to complement the SAP Success Factors Human Capital Management (HCM) Suite with our health benefits platform. Finally, as part of the partnership, we are working with the SAP Connected Health platform to help develop their presence in the healthcare space.
Content and Product Relationships. We have relationships with leading content and product companies that complement our products by making specialized content and functionality available to our customers such as educational information. These include a variety of public and private data vendors and organizations. Additionally, we integrate with broader health care partners to provide a more integrated and streamlined experience for our users.
Implementation Relationships. We work directly with our customers to implement our offering and engage consulting firms to supplement our ability to provide customer implementation services and supply some of our communications services.
Competition
7
Our market is in an early stage of development, but is rapidly evolving and competitive. As our platform continues to mature, increased functionality is pushing us into direct competition with historically adjacent markets. We currently face competition from both existing and emerging vendors across a variety of categories. The three primary categories today are traditional healthcare cost and quality providers, employee benefits communications providers, and high touch advocacy/concierge services.
Traditional transparency competitors include independent third-party tool vendors, such as Change Healthcare Corporation and Healthcare Blue Book, as well as health plans or vendors selling primarily to health plans, such as Aetna Inc., Cigna Corporation, United Healthcare Group, Inc. Healthsparq Inc. and MDX Medical, Inc. doing business as Vitals.
In addition to traditional competitors, we are also beginning to encounter competitive pressure during sales opportunities in which a single platform, high touch concierge services, or employee communications is the primary focus for the customer. Vendors in this category include Evive Health, Compass and Health Advocate.
We expect competition to increase as other established and emerging companies enter our industry, as customer requirements evolve, and as new products and technologies are introduced.
The principal competitive factors in our industry include:
• | ability to curate complex data from multiple sources and present it through an easy to navigate user interface; |
• | capability for customization through configuration, integration, security, scalability and reliability of products; |
• | ease of use and rates of user engagement; |
• | complimentary technology platform and high touch services; |
• | breadth and depth of application functionality; |
• | competitive and understandable pricing; |
• | size of customer base and level of user engagement; |
• | depth of access to third-party data sources; |
• | ability to integrate with legacy enterprise infrastructures and third-party applications; |
• | ability to innovate and respond rapidly to customer needs and regulatory changes; |
• | domain expertise in benefits and health care consumerism; |
• | accessibility on any browser or mobile device; |
• | clearly defined implementation timeline; and |
• | customer branding and styling. |
While we believe that we compete favorably on the basis of these factors, many of our competitors have longer operating histories, significantly greater financial, technical, marketing, distribution or other resources and greater name recognition than we do. In addition, many of our competitors have strong relationships with current and potential customers and extensive knowledge of the health care industry. As a result, we may not always compare favorably with respect to certain of the above factors. We may not be able to compete successfully against current and future competitors, and our business, results of operations and financial condition may be harmed if we fail to meet these competitive pressures.
Intellectual Property
We rely on a combination of patent, trademark, copyright and trade secret laws, as well as confidentiality procedures and contractual restrictions, to establish, maintain and protect our proprietary rights. These laws, procedures and restrictions provide only limited protection and any of our intellectual property rights may be challenged, invalidated, circumvented, infringed or misappropriated. In addition, we may not be able to prevent others from developing technology that is similar to,
8
but not the same as our proprietary technology. We generally require employees, consultants, customers, suppliers and partners to execute confidentiality agreements with us that restrict the disclosure of our intellectual property. We also require our employees and consultants to execute invention assignment agreements with us that protect our intellectual property rights.
As of December 31, 2016, we had one issued patent and three patent applications pending in the United States. Our issued patent expires on July 27, 2031. We own and use trademarks on or in connection with our products and services, including both unregistered common law marks and issued trademark registrations in the United States. We have trademark applications pending to register marks in the United States. We have also registered numerous Internet domain names. Although we rely on intellectual property rights, including trade secrets, patents, copyrights and trademarks, as well as contractual protections to establish and protect our proprietary rights, we believe that factors such as the technological and creative skills of our personnel, creation of new modules, features and functionality, and frequent enhancements to our products are more essential to establishing and maintaining our technology leadership position.
Despite our efforts to protect our proprietary technology and our intellectual property rights, unauthorized parties may attempt to copy or obtain and use our technology to develop products with the same functionality as our offering. In addition, policing unauthorized use of our technology and intellectual property rights is difficult and may not be effective.
We expect that we and others in our industry may be subject to third-party infringement claims as the number of competitors grows and the functionality of products in different industry segments overlaps. Any of these third parties might make a claim of infringement against us at any time. Any such claim could pose a substantial distraction to the management of the company. A successful claim of this type may be costly and could require us to spend substantial time and effort in making our offering non infringing.
Strategic Acquisition
On January 4, 2017, we entered into an Agreement and Plan of Merger and Reorganization (which is referred to as the merger agreement) with Jiff, Inc. ("Jiff"), an enterprise health benefits platform provider. Jiff redefined the wellbeing industry with an exceptional, mobile-first user experience and a large ecosystem of health partnerships available in the market. Jiff serves as a central hub for wellbeing and other benefit programs, with a single point of access for employees. Jiff’s app-store approach integrates more than 50 health solutions that sync seamlessly with its back-end system. In addition, an employer can allow virtually any vendor to connect to the platform, whether or not Jiff has integrated with them in the past. Jiff then personalizes recommendations for each employee based on the most relevant tools for their health needs and preferences. This is all delivered through a user experience that brings together the latest advancements in incentive design, social theory, and game mechanics - optimizing engagement.
We intend to hold a special meeting of our stockholders on March 17, 2017 to ask for shareholder approval of the shares to be issued in this acquisition. For more information refer to the Company’s S4 statement filed with the Securities and Exchange Commission on February 2, 2017 and as amended on February 13, 2017.
Regulatory Environment
Participants in the health care industry are required to comply with extensive and complex U.S. laws and regulations at the federal and state levels. Although many regulatory and governmental requirements do not directly apply to our business, our customers are required to comply with a variety of U.S. laws, and we may be affected by these laws as a result of our contractual obligations. We have attempted to structure our operations to comply with applicable legal requirements, but there can be no assurance that our operations will not be challenged or impacted by enforcement initiatives.
Healthcare Reform
Our business could be affected by changes in health care laws, including without limitation, the Patient Protection and Affordable Care Act, or ACA, which was enacted in March 2010. ACA is changing how health care services are covered, delivered and reimbursed through expanded coverage of individuals, changes in Medicare program spending and insurance market reforms.
While most of the provisions of ACA and other health care reform legislation will not be directly applicable to us, they may affect the business of many of our customers, which may in turn affect our business. Although we are unable to predict
9
with any reasonable certainty or otherwise quantify the likely impact of ACA or other health care reform on our business model, financial condition, or results of operations, negative changes in the business of our customers and the number of individuals they insure may negatively impact our business.
Requirements Regarding the Privacy and Security of Personal Information
HIPAA and Other Privacy and Security Requirements. There are numerous U.S. federal and state laws and regulations related to the privacy and security of personal health information. In particular, regulations promulgated pursuant to the Health Insurance Portability and Accountability Act of 1996 and its implementing regulations, collectively HIPAA, establishes privacy and security standards that limit the use and disclosure of protected health information and require the implementation of administrative, physical and technical safeguards to ensure the confidentiality, integrity and availability of individually identifiable health information in electronic form. Our health plan customers, as well as health care clearinghouses and certain providers with which we may have or may establish business relationships, are covered entities that are regulated under HIPAA. The Health Information Technology for Economic and Clinical Health Act, or HITECH, which became effective on February 17, 2010, significantly expanded HIPAA’s privacy and security requirements. Among other things, HITECH makes HIPAA’s privacy and security standards directly applicable to “business associates,” who are independent contractors or agents of covered entities that create, receive, maintain, or transmit protected health information in connection with providing a service for or on behalf of a covered entity. Under HIPAA and our contractual agreements with our customers, we are considered a “business associate” to our customers and thus are directly subject to HIPAA’s privacy and security standards. In order to provide our covered entity customers with services that involve the use or disclosure of protected health information, HIPAA requires our customers to enter into business associate agreements with it. Such agreements must, among other things, require us to:
• | limit how we will use and disclose the protected health information; |
• | implement reasonable administrative, physical and technical safeguards to protect such information from misuse; |
• | enter into similar agreements with our agents and subcontractors that have access to the information; |
• | report security incidents, breaches and other inappropriate uses or disclosures of the information; and |
• | assist the customer in question with certain duties under the privacy standards. |
If we are unable to properly protect the privacy and security of health information entrusted to it, our offering may be perceived as unsecure, it may incur significant liabilities, and customers may curtail their use of or stop using our offering.
In addition to HIPAA regulations, we may be subject to other state and federal privacy laws, including laws that prohibit unfair or deceptive practices and laws that place specific requirements on use of data. We cannot provide assurance regarding how the various privacy and security laws will be interpreted, enforced or applied to our operations.
While we have implemented a privacy and security program, any perception of our practices as unfair or deceptive, whether or not consistent with current regulations and industry practices, may subject us to public criticism, private class actions, reputational harm or claims by regulators, which could disrupt our business and expose us to increased liability.
Data Protection and Breaches. In recent years, there have been a number of well-publicized data breaches involving the improper use and disclosure of individuals’ personal information. Many states have responded to these incidents by enacting laws requiring holders of personal information to maintain safeguards and to take certain actions in response to a data breach, such as providing prompt notification of the breach to affected individuals and state officials. In addition, under HIPAA, we must report breaches of unsecured protected health information to our contractual partners within 60 days of discovery of the breach. Notification must also be made to HHS and, in certain circumstances involving large breaches, to the media.
We have implemented and maintained physical, technical and administrative safeguards intended to protect all personal data, and have processes in place to assist it in complying with all applicable laws, regulations and contractual requirements regarding the protection of these data and properly responding to any security breaches or incidents. However, we cannot be sure that these safeguards are adequate to protect all personal data or to assist us in complying with all applicable laws and regulations regarding the privacy and security of personal data and responding to any security breaches or incidents. Furthermore, in many cases, applicable state laws, including breach notification requirements, are not preempted by the HIPAA privacy and security standards and are subject to interpretation by various courts and other governmental authorities, thereby
10
complicating our compliance efforts. Additionally, state and federal laws regarding deceptive practices may apply to public assurances we give to individuals about the security of services we provide on behalf of our contractual customers.
Other Requirements. In addition to HIPAA, numerous other U.S. state and federal laws govern the collection, dissemination, use, access to and confidentiality of individually identifiable health information and health care provider information. Some states also are considering new laws and regulations that further protect the confidentiality, privacy and security of medical records or other types of medical information. In many cases, these state laws are not preempted by the HIPAA privacy standards and may be subject to interpretation by various courts and other governmental authorities. Further, Congress and a number of states have considered or are considering prohibitions or limitations on the disclosure of medical or other information to individuals or entities located outside of the United States.
Available Information
You can obtain copies of our Form 10-K, Quarterly Reports on Form 10-Q, Current Reports on Form 8-K, and other filings with the SEC, and all amendments to these filings, free of charge from our website at www.castlighthealth.com as soon as reasonably practicable following our filing of any of these reports with the SEC. The public may read and copy any materials we have filed with the SEC at the SEC’s Public Reference Room at 100 F Street, NE, Room 1580, Washington, DC 20549. The public may obtain information on the operation of the Public Reference Room by calling the SEC at 1-800-SEC-0330. The SEC maintains an Internet site that contains reports, proxy and information statements and other information regarding issuers that file electronically with the SEC at www.sec.gov. The contents of these websites are not incorporated into this filing. Further, our references to the URLs for these websites are intended to be inactive textual references only.
Item 1A. Risk Factors
The risks and uncertainties described below are not the only ones we face. In addition, you should read and consider the risks associated with the proposed acquisition of Jiff, Inc., which can be found in our Prospectus dated February 22, 2017 filed on February 22, 2017 pursuant to Rule424(b)(3) relating to the Registration Statement on Form S-4, as amended (No. 333- 215861) in the sections entitled “Risk Factors-Risks Related to the Merger,” “Risk Factors-Risks Related to the Combined Company,” which sections are incorporated by reference into this Annual Report on Form 10-K and is filed as Exhibit 99.1 hereto. Additional risks and uncertainties that we are unaware of, or that we currently believe are not material, may also become important factors that adversely affect our business. If any of the following risks actually occur, our business, financial condition, results of operations and future prospects could be materially and adversely affected. In that event, the market price of our Class B common stock could decline, and you could lose part or all of your investment.
11
Risks Related to Our Business
We have a history of significant losses, which we expect to continue for the foreseeable future, and we may never achieve or sustain profitability in the future.
We have incurred significant net losses in each year since our incorporation in 2008 and expect to continue to incur net losses for the foreseeable future. We experienced net losses of $58.5 million, $79.9 million and $85.9 million, during the years ended December 31, 2016, 2015 and 2014, respectively. As of December 31, 2016, we had an accumulated deficit of $355.6 million. The losses and accumulated deficit were primarily due to the substantial investments we made to grow our business, enhance our technology and offering through research and development and acquire and support customers. We anticipate that cost of revenue and operating expenses will increase substantially in the foreseeable future as we seek to continue to grow our business, enhance our offering and acquire customers. These efforts may prove more expensive than we currently anticipate, and we may not succeed in increasing our revenue sufficiently to offset these higher expenses. Many of our efforts to generate revenue from our business are new and unproven, and any failure to increase our revenue or generate revenue from new products and services could prevent us from achieving or maintaining profitability. Furthermore, to the extent we are successful in increasing our customer base, we could also incur increased losses because costs associated with entering into customer agreements are generally incurred up front, while customers are generally billed over the term of the agreement. Our prior losses, combined with our expected future losses, have had and will continue to have an adverse effect on our stockholders’ equity and working capital. We expect to continue to incur operating losses for the foreseeable future and may never become profitable on a quarterly or annual basis, or if we do, we may not be able to sustain profitability in subsequent periods. As a result of these factors, we may need to raise additional capital through debt or equity financings in order to fund our operations, which could be dilutive to stockholders, and such capital may not be available on reasonable terms, if at all.
Our limited operating history makes it difficult to evaluate our current business and future prospects.
We were founded in 2008, began building the first version of our core Castlight platform in 2009, did not complete our first customer sale and implementation until 2010 and did not make substantial investments in sales and marketing until 2012. Our limited operating history limits our ability to forecast our future operating results and such forecasts are subject to a number of uncertainties, including our ability to plan for and model future growth.
We have encountered and will continue to encounter risks and uncertainties frequently experienced by new and growing companies in rapidly changing industries, such as determining appropriate investments of our limited resources, market adoption of our existing and future offerings, competition from other companies, acquiring and retaining customers, managing customer deployments, hiring, integrating, training and retaining skilled personnel, developing new products and services, determining prices for our products, handling unforeseen expenses and managing challenges in forecasting accuracy. If our assumptions regarding these and other similar risks and uncertainties, which we use to plan our business, are incorrect or change as we gain more experience operating our business or due to changes in our industry, or if we do not address these risks and uncertainties successfully, our operating and financial results could differ materially from our expectations and our business could suffer.
In addition, we may need to change our current operations infrastructure in order for us to achieve profitability and scale our operations efficiently, which makes our future prospects even more difficult to evaluate. For example, in order to grow sales of our health benefits platform to smaller customers in a financially sustainable manner, we may need to further automate implementations, tailor our offering and modify our go-to-market approaches to reduce our service delivery and customer acquisition costs. If we fail to implement these changes on a timely basis or are unable to implement them effectively, our business may suffer.
The market for our offering is immature and volatile, and if it does not develop, if it develops more slowly than we expect, or if our offering does not drive employee engagement, the growth of our business will be harmed.
Our market is new and unproven, and it is uncertain whether we will achieve and sustain high levels of demand and market adoption. Our success depends to a substantial extent on the willingness of employers to increase their use of our health benefits platform, the ability of our products to increase employee engagement, as well as on our ability to demonstrate the value of our offering to customers and their employees and to develop new products that provide value to customers and users. If employers do not perceive the benefits of our offering or our offering does not drive employee engagement, then our market might develop more slowly than we expect or even shrink, which could significantly adversely affect our operating results. In addition, we have limited insight into trends that might develop and affect our business. We might make errors in predicting and
12
reacting to relevant business, legal and regulatory trends, which could harm our business. If any of these events occur, it could materially adversely affect our business, financial condition or results of operations.
If our security measures are breached and unauthorized access to a customer’s data are obtained, our offering may be perceived as insecure, we may incur significant liabilities, our reputation may be harmed and we could lose sales and customers.
Our offering involves the storage and transmission of customers’ proprietary information, personally identifiable information, and protected health information of our customers’ employees and their dependents, which is regulated under the Health Insurance Portability and Accountability Act of 1996 and its implementing regulations, collectively HIPAA. Because of the extreme sensitivity of this information, the security features of our offering are very important. If our security measures, some of which are managed by third parties, are breached or fail, unauthorized persons may be able to obtain access to sensitive customer or employee data, including HIPAA-regulated protected health information. A security breach or failure could result from a variety of circumstances and events, including third-party action, employee negligence or error, malfeasance, computer viruses, attacks by computer hackers, failures during the process of upgrading or replacing software, databases or components thereof, power outages, hardware failures, telecommunication failures, user errors, and catastrophic events.
If our security measures were to be breached or fail, our reputation could be severely damaged, adversely affecting customer or investor confidence, customers may curtail their use of or stop using our offering and our business may suffer. In addition, we could face litigation, damages for contract breach, penalties and regulatory actions for violation of HIPAA and other laws or regulations applicable to data protection and significant costs for remediation and for measures to prevent future occurrences. In addition, any potential security breach could result in increased costs associated with liability for stolen assets or information, repairing system damage that may have been caused by such breaches, incentives offered to customers or other business partners in an effort to maintain the business relationships after a breach and implementing measures to prevent future occurrences, including organizational changes, deploying additional personnel and protection technologies, training employees and engaging third-party experts and consultants. While we maintain insurance covering certain security and privacy damages and claim expenses we may not carry insurance or maintain coverage sufficient to compensate for all liability and in any event, insurance coverage would not address the reputational damage that could result from a security incident.
We outsource important aspects of the storage and transmission of customer information, and thus rely on third parties to manage functions that have material cyber-security risks. These outsourced functions include services such as software design and product development, software engineering, database consulting, call center operations, co-location data centers, data-center security, IT, network security and Web application firewall services. We attempt to address these risks by requiring outsourcing subcontractors who handle customer information to sign business associate agreements contractually requiring those subcontractors to adequately safeguard personal health data and in some cases by requiring such outsourcing subcontractors to undergo third-party security examinations. However, we cannot assure you that these contractual measures and other safeguards will adequately protect us from the risks associated with the storage and transmission of customers proprietary and protected health information.
We may experience cyber-security and other breach incidents that may remain undetected for an extended period. Because techniques used to obtain unauthorized access or to sabotage systems change frequently and generally are not recognized until launched against us, we may be unable to anticipate these techniques or to implement adequate preventive measures. In addition, in the event that our customers authorize or enable third parties to access their data or the data of their employees on our systems, we cannot ensure the complete integrity or security of such data in our systems as we would not control that access. If an actual or perceived breach of our security occurs, or if we are unable to effectively resolve such breaches in a timely manner, the market perception of the effectiveness of our security measures could be harmed and we could lose sales and customers or suffer other reputational harm.
Our errors and omissions insurance may be inadequate or may not be available in the future on acceptable terms, or at all. In addition, our policy may not cover all claims made against us and defending a suit, regardless of its merit, could be costly and divert management’s attention from leading our business.
13
Our quarterly results may fluctuate significantly, which could adversely impact the value of our Class B common stock.
Our quarterly results of operations, including our revenue, gross margin, net loss and cash flows, may vary significantly in the future, and period-to-period comparisons of our operating results may not be meaningful. Accordingly, our quarterly results should not be relied upon as an indication of future performance. Our quarterly financial results may fluctuate as a result of a variety of factors, many of which are outside of our control, including, without limitation, those listed elsewhere in this “Risk Factors” section and those listed below:
• | the addition or loss of large customers, including through acquisitions or consolidations of such customers; |
• | seasonal and other variations in the timing of the sales of our offering, as a significantly higher proportion of our customers enter into new subscription agreements with us or renew previous agreements in the third and fourth quarters of the year compared to the first and second quarters. As we continue to leverage our channel relationships and expand our business, there is no assurance this seasonality will continue; |
• | the timing of recognition of revenue, including possible delays in the recognition of revenue due to lengthy and sometimes unpredictable implementation timelines; |
• | failure to meet our contractual commitments under service-level agreements with our customers; |
• | the amount and timing of operating expenses related to the maintenance and expansion of our business, operations and infrastructure; |
• | our access to pricing and claims data managed by health plans and other third parties, or changes to the fees we pay for that data; |
• | the timing and success of introductions of new products, services and pricing by us or our competitors or any other change in the competitive dynamics of our industry, including consolidation among competitors, customers or strategic partners; |
• | our ability to attract new customers; |
• | customer renewal rates and the timing and terms of customer renewals; |
• | network outages or security breaches; |
• | the mix of products and services sold or renewed during a period; |
• | general economic, industry and market conditions; |
• | the timing of expenses related to the development or acquisition of technologies or businesses and potential future charges for impairment of goodwill from acquired companies; and |
• | impact of new accounting pronouncements. |
We are particularly subject to fluctuations in our quarterly results of operations since the costs associated with entering into customer agreements and implementing our offerings are generally incurred prior to launch, while we generally recognize revenue over the term of the agreement beginning at launch. In addition, some of our contracts with customers provide for one-time bonus payments if our offering achieves certain metrics, such as a certain rate of employee engagement, which may lead to additional fluctuations in our quarterly operating results. In certain contracts, employee engagement may refer to the number of first time registrations by employees of our customers and in other cases it may refer to return usage of our products by employees. Any fluctuations in our quarterly results may not accurately reflect the underlying performance of our business and could cause a decline in the trading price of our Class B common stock.
If we fail to manage our growth effectively, our expenses could increase more than expected, our revenue may not increase and we may be unable to implement our business strategy.
We have experienced rapid growth in recent periods, which puts strain on our business, operations and employees. For example, our revenue has increased from $75.3 million for the year ended December 31, 2015 to $101.7 million for the year ended December 31, 2016. Our customer base grew to 211 customers as of December 31, 2016. To manage our current and anticipated future growth effectively, we must continue to maintain and enhance our IT infrastructure, financial and accounting
14
systems and controls. Moreover, we may from time to time decide to undertake cost savings initiatives, such as the reduction in workforce we implemented in 2016, or disposing of, or otherwise discontinuing certain products, in an effort to focus our resources on key strategic initiatives and streamline our business. We must also attract, train and retain a significant number of qualified personnel in key areas such as, sales and marketing, customer support, professional services, engineering and management, and the availability of such personnel, in particular software engineers, may be constrained. These and similar challenges, and the related costs, may be exacerbated by the fact that our headquarters are located in the San Francisco Bay Area.
A key aspect to managing our growth is our ability to scale our capabilities to implement our offering satisfactorily with respect to both large and demanding enterprise customers, who currently comprise the substantial majority of our customer base, as well as smaller customers. Large customers often require specific features or functions unique to their particular business processes, which at a time of rapid growth or during periods of high demand, may strain our implementation capacity and hinder our ability to successfully implement our offering to our customers in a timely manner. We may also need to make further investments in our technology and automate portions of our offering or services to decrease our costs, particularly as we grow sales of our health benefits platform to smaller customers. If we are unable to address the needs of our customers or their employees, or our customers or their employees are unsatisfied with the quality of our offering or services, they may not renew their agreements, seek to cancel or terminate their relationship with us or renew on less favorable terms. In addition, many of our customers adjust their benefit plan designs, benefits providers and eligibility criteria at the start of each new benefits plan year, requiring additional configurations for those customers. As our customer base grows, the complexity of these activities can increase. If we fail to automate these operations sufficiently and implement these changes on a timely basis or are unable to implement them effectively, our business may suffer.
Failure to effectively manage our growth could also lead us to over-invest or under-invest in development and operations, result in weaknesses in our infrastructure, systems or controls, give rise to operational mistakes, financial losses, loss of productivity or business opportunities and result in loss of employees and reduced productivity of remaining employees. Our growth is expected to require significant capital expenditures and might divert financial resources from other projects such as the development of new products and services. In addition, data and content fees, which are one of our primary operational costs, are not fixed as they vary based on the source and condition of the data we receive from third parties, and if they remain variable or increase over time, we would not be able to realize the economies of scale that we expect as we grow renewals and implementation of new customers, which would negatively impact our gross margin. If our management is unable to effectively manage our growth, our expenses might increase more than expected, our revenue may not increase or might grow more slowly than expected and we might be unable to implement our business strategy. The quality of our offering might also suffer, which could negatively affect our reputation and harm our ability to retain and attract customers.
We incur significant upfront costs in our customer relationships, and if we are unable to maintain and grow these customer relationships over time, we are likely to fail to recover these costs and our operating results will suffer.
We devote significant resources and incur significant upfront costs to establish relationships with our customers and implement our offering and related services, particularly in the case of large enterprises that, often request or require specific features or functions unique to their particular business processes. Accordingly, our operating results will depend in substantial part on our ability to deliver a successful customer experience and persuade our customers to maintain and grow their relationship with us over time. For example, if we are not successful in implementing our offering or delivering a successful customer experience, a customer could terminate or fail to renew their agreement with us, we would lose or be unable to recoup the significant upfront costs that we had expended on such customer and our operating results would suffer. As we grow, our customer acquisition costs could outpace our build-up of recurring revenue, and we may be unable to reduce our total operating costs through economies of scale such that we are unable to achieve profitability.
Our ability to deliver our full offering to customers depends in substantial part on our ability to access pricing and claims data managed by a limited number of health plans and other third parties.
In order to deliver the full functionality offered by our health benefits platform, we need continued access, on behalf of our customers, to sources of pricing and claims data, much of which is managed by a limited number of health plans and other third parties. We have developed various long-term and short-term processes to obtain data from certain health plans and other third parties. We are limited in our ability to offer the full functionality of our offering to customers of health plans with whom we do not have a data-sharing or joint customer support process or arrangement.
15
The terms of the arrangements under which we have access to data managed by health plans and other third parties vary, which can impact the offering we are able to deliver. Many of our arrangements with health plans and third parties have terms that limit our access to and permitted uses of claims or pricing data to the data associated with our mutual customers. Also, some agreements, processes, or arrangements may be terminated if the underlying customer contracts do not continue, or may otherwise be subject to termination or non-renewal in whole or in part.
The health plans and other third parties that we currently work with may, in the future, change their position and limit or eliminate our access to pricing and claims data, increase the costs for access to data, provide data to us in more limited or less useful formats, or restrict our permitted uses of data. Furthermore, some health plans have developed or are developing their own proprietary price and quality estimation tools and may perceive continued cooperation with us as a competitive disadvantage and choose to limit or discontinue our access to pricing and claims data. Failure to continue to maintain and expand our access to pricing and claims data may adversely impact our ability to continue to serve existing customers and expand our offering to new customers.
If our access to pricing and claims data is reduced or becomes more costly to us, our ability to compete in the marketplace or to grow our revenue could be impaired and our operating results would suffer.
We are investing in and expect to increasingly rely on channel partners for a portion of our sales, and if our channel partner relationships are unsuccessful then our sales results will be adversely affected and the growth of our business will be harmed.
Our sales strategy relies in part on relationships we have developed with health plans, benefits consultants, brokers and other industry participants, and we are continuing to invest in, and expect to increase our reliance on, these relationships with channel partners to access additional customer segments and grow our overall sales. However, we cannot be certain that we will be able to identify suitable channel partners and, if we identify such channel partners, there can be no assurance that our channel partner relationships will be successful, or will result in access to additional customers or growth in sales. Our channel partnerships could fail for a variety of reasons, including changes in our partners’ business priorities, insufficient or misaligned incentives for our partners’ to assist us with sales, competition, or other factors.
In addition, our reliance on sales through channel partners could put downward pressure on the total revenue we are able to generate, and could result in existing customers electing to use alternative or lower-functionality versions of our products that we may elect to provide through channel partners. The concentration of a material portion of business with any given channel partner could also create tensions with other companies we do business with, including health plans on whom we rely to receive data and offer our services.
Certain relationships we will enter or have entered into with channel partners will require substantial investments of our resources to support these initiatives. There can be no assurance that the investments we make to develop and support these channel relationships, or the effort required to do so, will provide a positive return on our investment in the near term, or at all. If any of these events materialize, our business and results of operations could be materially adversely affected.
If our existing customers do not continue or renew their agreements with us, renew at lower fee levels or decline to purchase additional products and services from us, our business and operating results will suffer.
We expect to derive a significant portion of our revenue from renewal of existing customer agreements and sales of additional products and services to existing customers. Revenue recognized in any quarter is largely derived from customer agreements signed in prior quarters. As a result, achieving a high renewal rate of our customer agreements and selling additional products and services is critical to our future operating results.
However, we have a limited operating history and do not yet have enough experience with customer renewals to predict our customer renewal rate. We may experience significantly more difficulty than we anticipate in renewing existing customer agreements or in renewing them upon favorable terms. Factors that may affect the renewal rate for our offering, terms of those renewals and our ability to sell additional products and services include:
• | the price, performance and functionality of our offering; |
• | our customers’ user counts and benefit design features; |
• | the availability, price, performance and functionality of competing or alternative solutions; |
16
• | the potential for customers that are able to access lower-functionality versions of our offering that we provide through health plans or other channel partners to opt to use the lower-functionality versions of our offering; |
• | our ability to develop complementary products and services; |
• | our continued ability to access the pricing and claims data necessary to enable us to deliver reliable data in our cost estimation and price transparency offering to customers; |
• | the stability, performance and security of our hosting infrastructure and hosting services; |
• | changes in health care laws, regulations or trends; and |
• | the business environment of our customers, in particular, headcount reductions by our customers. |
We enter into master services agreements with our customers. These agreements generally have stated terms of three years. Our customers have no obligation to renew their subscriptions for our offering after the term expires. In addition, our customers may negotiate terms less advantageous to us upon renewal, which may reduce our revenue from these customers. Factors that are not within our control may contribute to a reduction in our contract revenue. For instance, our customers may reduce their number of employees, which would result in a corresponding reduction in the number of employee users eligible for our offering and thus a lower aggregate monthly services fee. Our future operating results also depend, in part, on our ability to sell new products and services to our existing customers. If our customers fail to renew their agreements, renew their agreements upon less favorable terms or at lower fee levels, or fail to purchase new products and services from us, our revenue may decline or our future revenue may be constrained.
In addition, a significant number of our customer agreements allow customers to terminate such agreements for convenience at certain times, typically with one to three months advance notice. We typically incur the expenses associated with integrating a customer’s data into our health care database and related training and support prior to recognizing meaningful revenue from such customer. Customer subscription revenue is not recognized until our products are implemented for launch, which is generally from three to twelve months from contract signing. If a customer terminates its agreement early and revenue and cash flows expected from a customer are not realized in the time period expected or not realized at all, our business, operating results and financial condition could be adversely affected.
A significant portion of our revenue comes from a limited number of customers, the loss of which would adversely affect our financial results.
Historically, we have relied on a limited number of customers for a substantial portion of our total revenue. For the year ended December 31, 2016, our top 10 customers by revenue accounted for 33% of our total revenue and the Administrative Committee of the Wal-Mart Stores, Inc., Associates’ Health and Welfare Plan represented approximately 10% of our total revenue. We rely on our reputation and recommendations from key customers in order to promote our offering to potential customers. The loss of any of our key customers, or a failure of some of them to renew or expand user subscriptions, could have a significant impact on the growth rate of our revenue, reputation and our ability to obtain new customers. In addition, mergers and acquisitions involving our customers could lead to cancellation or non-renewal of our agreements with those customers or by the acquiring or combining companies, thereby reducing the number of our existing and potential customers.
Because we generally bill our customers and recognize revenue over the term of the contract, near term declines in new or renewed agreements may not be reflected immediately in our operating results and may be difficult to discern.
Most of our revenue in each quarter is derived from agreements entered into with our customers during previous quarters. Consequently, a decline in new or renewed agreements in any one quarter may not be fully reflected in our revenue for that quarter. Such declines, however, would negatively affect our revenue in future periods and the effect of significant downturns in sales of and market demand for our offering, and potential changes in our rate of renewals or renewal terms, may not be fully reflected in our results of operations until future periods. Accordingly, management measures sales performance and forecasts future subscription revenue based on signed annual recurring revenue, or ARR. ARR is a forward-looking metric based on contractual terms in existence as of the end of a reporting period and is subject to change resulting from a number of factors including, but not limited to, addition of new customers, changes in user counts, terminations or non-renewals, as well as upsells and cross-sells. For all of these reasons, the amount of subscription revenue we actually recognize may be different from ARR at the end of a period in which it was recorded. In addition, we may be unable to adjust our cost structure rapidly, or
17
at all, to take account of reduced revenue. Our subscription model also makes it difficult for us to rapidly increase our total revenue through additional sales in any period, as revenue from new customers must be recognized over the applicable term of the agreement. Accordingly, the effect of changes in the industry impacting our business or changes we experience in our new sales may not be reflected in our short-term results of operations.
Our sales and implementation cycle can be long and unpredictable and require considerable time and expense, which may cause our operating results to fluctuate.
The sales cycle for our health benefits platform, from initial contact with a potential lead to contract execution and implementation, varies widely by customer, ranging from three to 24 months. Some of our customers undertake a significant and prolonged evaluation process, including whether our offering meets a customer’s unique benefits program needs, that frequently involves not only the review of our offering but also of our competitors, which has in the past resulted in extended sales cycles. Our sales efforts involve educating our customers about the use, technical capabilities and benefits of our offering. Moreover, our large enterprise customers often begin to deploy our service on a limited basis, but nevertheless demand extensive configuration, integration services and pricing concessions, which increase our upfront investment in the sales effort with no guarantee that these customers will deploy our offering widely enough across their organization to justify our substantial upfront investment. It is possible that in the future we may experience even longer sales cycles, more complex customer needs, higher upfront sales costs and less predictability in completing some of our sales as we continue to expand our direct sales force and thereby increase the percentage of our sales personnel with less experience in selling our service, expand into new territories and add additional products and services. In addition, even after contracts are signed, our implementation timelines can delay recognition of related revenue for several periods. If our sales cycle lengthens or our substantial upfront sales and implementation investments do not result in sufficient sales or revenue to justify our investments, our operating results may be harmed.
The health care industry is heavily regulated. Our failure to comply with regulatory requirements could create liability for us, result in adverse publicity and otherwise negatively affect our business.
The health care industry is heavily regulated and is constantly evolving due to the changing political, legislative and regulatory landscape and other factors. Many health care laws are complex, and their application to specific services and relationships may not be clear. Further, some health care laws differ from state to state and it is difficult to ensure our business complies with evolving laws in all states. Our operations may be adversely affected by enforcement initiatives. Our failure to accurately anticipate the application of these laws and regulations to our business, or any other failure to comply with regulatory requirements, could create liability for us, result in adverse publicity and negatively affect our business. For example, failure to comply with these requirements could result in the unwillingness of current and potential customers to work with us. Federal and state legislatures and agencies periodically consider proposals to revise aspects of the legal rules applicable to the health care industry, or to revise or create additional statutory and regulatory requirements. Such proposals, if implemented, could impact our operations, the use of our offering and our ability to market new products and services, or could create unexpected liabilities for us. We cannot predict what changes to laws or regulations might be made in the future or how those changes could affect our business or our operating costs.
If we fail to comply with applicable health information privacy and security laws and other state and federal privacy and security laws, we may be subject to significant liabilities, reputational harm and other negative consequences, including decreasing the willingness of current and potential customers to work with us.
We are subject to data privacy and security regulation by both the federal government and the states in which we conduct our business; these regulations address matters central to our business, including privacy and data protection, personal information, content, data security, data retention and deletion, and user communications. The introduction of new products or expansion of our activities may subject us to additional laws and regulations. In particular, we are subject to the Health Insurance Portability and Accountability Act of 1996 and its implementing regulations, collectively HIPAA, which established uniform federal standards for certain “covered entities,” which include health care providers and health plans, governing the conduct of specified electronic health care transactions and protecting the security and privacy of protected health information, or PHI. The Health Information Technology for Economic and Clinical Health Act, or HITECH, which became effective on February 17, 2010, makes HIPAA’s privacy and security standards directly applicable to “business associates,” which are independent contractors or agents of covered entities that create, receive, maintain, or transmit PHI in connection with providing a service for or on behalf of a covered entity. HITECH also increased the civil and criminal penalties that may be imposed against covered entities, business associates and other persons, and gave state attorneys general new authority to file
18
civil actions for damages or injunctions in federal courts to enforce HIPAA’s requirements and seek attorney’s fees and costs associated with pursuing federal civil actions.
A portion of the data that we obtain and handle for or on behalf of our customers is considered PHI, subject to HIPAA. Under HIPAA and our contractual agreements with our HIPAA covered entity health plan customers, we are considered a “business associate” to those customers, and are required to maintain the privacy and security of PHI in accordance with HIPAA and the terms of our business associate agreements with customers, including by implementing HIPAA-required administrative, technical and physical safeguards. We have incurred, and will continue to incur, significant costs to establish and maintain these safeguards and, if additional safeguards are required to comply with HIPAA regulations or our customers’ requirements, our costs could increase further, which would negatively affect our operating results. Furthermore, if we fail to maintain adequate safeguards, or we or our agents and subcontractors use or disclose PHI in a manner prohibited or not permitted by HIPAA or our business associate agreements with our customers, or if the privacy or security of PHI that we obtain and handle is otherwise compromised, we could be subject to significant liabilities and consequences, including, without limitation:
• | breach of our contractual obligations to customers, which may cause our customers to terminate their relationship with us and may result in potentially significant financial obligations to our customers; |
• | investigation by the federal and state regulatory authorities empowered to enforce HIPAA, which include the U.S. Department of Health and Human Services and state attorneys general, and the possible imposition of civil penalties; |
• | private litigation by individuals adversely affected by any violation of HIPAA, HITECH or comparable state laws for which we are responsible; and |
• | negative publicity, which may decrease the willingness of current and potential future customers to work with us and negatively affect our sales and operating results. |
Further, we publish statements to end users of our services that describe how we handle and protect personal information. If federal or state regulatory authorities or private litigants consider any portion of these statements to be untrue, we may be subject to claims of deceptive practices, which could lead to significant liabilities and consequences, including, without limitation, costs of responding to investigations, defending against litigation, settling claims and complying with regulatory or court orders.
We also send SMS text messages to potential end users who are eligible to use our service through certain customers and partners. While we get consent from or on behalf of these individuals to send text messages, federal or state regulatory authorities or private litigants may claim that the notices and disclosures we provide, form of consents we obtain or our SMS texting practices are not adequate. These SMS texting campaigns are potential sources of risk for class action lawsuits and liability for our company. Numerous class-action suits under federal and state laws have been filed in recent years against companies who conduct SMS texting programs. Many of those suits have resulted in multi-million dollar settlements to the plaintiffs.
If our new products and services are not adopted by our customers, or if we fail to continue to innovate and develop new products and services that are adopted by customers, then our revenue and operating results will be adversely affected.
To date we have derived a substantial majority of our revenue from sales of our core Castlight platform, and our longer-term operating results and continued growth depend in part on our ability to successfully develop and sell new products and services that our new and existing customers want and are willing to purchase. In addition to our core Castlight platform, we have introduced a number of product cross-sells, such as our Castlight Pharmacy, Castlight Dental, Castlight Action, Castlight Elevate, Castlight Protect, and Castlight Rewards, but it is uncertain whether these products and services will result in significant revenue or comprise a significant portion of our total revenue. In addition, we have invested, and will continue to invest, significant resources in research and development to enhance our existing offering and introduce new high quality products and services. If existing customers are not willing to make additional payments for such new products, or if new customers do not value such new products, our business and operating results will be harmed. If we are unable to predict user preferences or our industry changes, or if we are unable to modify our offering and services on a timely basis, we might lose customers. Our operating results would also suffer if our innovations are not responsive to the needs of our customers, appropriately timed with market opportunity or effectively communicated and brought to market.
19
We operate in a competitive industry, and if we are not able to compete effectively, our business and operating results will be harmed.
The market for our products and services is competitive, and we expect the market to attract increased competition, which could make it hard for us to succeed. We currently face competition for sub-components of our offering from a range of companies, including specialized software and solution providers that offer similar solutions, often at substantially lower prices, and that are continuing to develop additional products and becoming more sophisticated and effective. These competitors include but are not limited to Change Healthcare Corporation, Healthcare Bluebook, HealthSparq Inc. and MDX Medical. In addition to traditional competitors, we are also beginning to encounter competitive pressure during sales opportunities in which a single platform, high touch concierge services, or employee communications is the primary focus for the customer. Vendors in this category include Evive Health, Compass and Health Advocate. In addition, large, well-financed health plans, with whom we cooperate and on whom we depend in order to obtain the pricing and claims data we need to deliver our offering to customers, have in some cases developed their own cost and quality estimation tools and provide these solutions to their customers at discounted prices or often for free. These health plans include, for example, Aetna Inc., Cigna Corporation, and UnitedHealth Group, Inc. Competition from specialized software and solution providers, health plans and other parties may result in pricing pressure, which may lead to price decline in certain product segments, which could negatively impact our sales, profitability and market share. In addition, if health plans perceive continued cooperation with us as a threat to their business interests, they may take steps that impair our access to pricing and claims data, or that otherwise make it more difficult or costly for us to deliver our offering to customers.
Some of our competitors, in particular health plans, have greater name recognition, longer operating histories and significantly greater resources than we do. Furthermore, our current or potential competitors may be acquired by third parties with greater available resources. As a result, our competitors might be able to respond more quickly and effectively than we can to new or changing opportunities, technologies, standards or customer requirements and may have the ability to initiate or withstand substantial price competition. In addition, current and potential competitors have established, and might in the future establish, cooperative relationships with vendors of complementary products, technologies or services to increase the availability of their solutions in the marketplace. Accordingly, new competitors or alliances might emerge that have greater market share, a larger customer base, more widely adopted proprietary technologies, greater marketing expertise, greater financial resources and larger sales forces than we have, which could put us at a competitive disadvantage. Our competitors could also be better positioned to serve certain segments of our market, such as customers that desire a more narrow solution, which could create additional price pressure. In light of these factors, even if our offering is more effective than those of our competitors, current or potential customers might accept competitive offerings in lieu of purchasing our offerings.
Shifts in health care benefits trends, including any potential decline in the number of self-insured employers, or the emergence of new technologies may render our offering obsolete or require us to expend significant resources in order to remain competitive.
The U.S. health care industry is massive, with a number of large market participants with conflicting agendas, is subject to significant government regulation and is currently undergoing significant change. Changes in our industry, for example, towards private health care exchanges or away from high deductible health plans, or the emergence of new technologies as more competitors enter our market, could result in our offering being less desirable or relevant.
For example, we currently derive substantially all of our revenue from sales to customers that are self-insured employers. The demand for our offering depends on the need of self-insured employers to manage the costs of health care services that they pay on behalf of their employees. While the percentage of employers who are self-insured has been increasing over the past decade, there is no assurance that this trend will continue. Various factors, including changes in the health care insurance market or in government regulation of the health care industry, could cause the percentage of self-insured employers to decline, which would adversely affect the market for our offering and would negatively affect our business and operating results. Furthermore, such trends and our business could be affected by changes in health care spending resulting from the Patient Protection and Affordable Care Act, or the ACA, which was enacted in March 2010 and is currently being implemented. For example, under the ACA the federal government and several state governments established public exchanges in which consumers can purchase health insurance. In the event that the implementation of the ACA causes our customers to change their health care benefits plans or move to use of exchanges such that it reduces the need for our offering, or if the number of self-insured employers otherwise declines, we would be forced to compete on additional product and service attributes or to expend significant resources in order to alter our offering to remain competitive.
20
If health care benefits trends shift or entirely new technologies are developed that replace existing offerings, our existing or future offerings could be rendered obsolete and our business could be adversely affected. In addition, we may experience difficulties with software development, industry standards, design or marketing that could delay or prevent our development, introduction or implementation of new products and enhancements
We may require additional capital to support business growth, and this capital might not be available to us on acceptable terms or at all.
Our operations have consumed substantial amounts of cash since inception and we intend to continue to make significant investments to support our business growth, respond to business challenges or opportunities, develop new products and services, enhance our existing offering and services, enhance our operating infrastructure and potentially acquire complementary businesses and technologies. For the years ended December 31, 2016 and 2015, our net cash used in operating activities was $37.0 million and $56.9 million, respectively. Our future capital requirements may be significantly different from our current estimates and will depend on many factors including our growth rate, new customer acquisitions, subscription renewal activity, the timing and extent of spending to support development efforts, the expansion of sales and marketing activities, the introduction of new and enhanced services offerings and the continuing market acceptance of our cloud-based subscription services. Accordingly, we might need to engage in equity or debt financings or collaborative arrangements to secure additional funds. If we raise additional funds through further issuances of equity or convertible debt securities, our existing stockholders could suffer significant dilution, and any new equity securities we issue could have rights, preferences and privileges superior to those of holders of our Class B common stock. Any debt financing secured by us in the future could involve restrictive covenants relating to our capital-raising activities and other financial and operational matters, which might make it more difficult for us to obtain additional capital and to pursue business opportunities, including potential acquisitions. We might have to obtain funds through arrangements with collaborative partners or others that may require us to relinquish rights to our technologies or offering that we otherwise would not relinquish. In addition, during the recent economic instability, it has been difficult for many companies to obtain financing in the public markets or to obtain debt financing, and we might not be able to obtain additional financing on commercially reasonable terms, if at all. If we are unable to obtain adequate financing or financing on terms satisfactory to us when we require it, our ability to continue to support our business growth and to respond to business challenges could be significantly limited.
Our proprietary software may not operate properly, which could damage our reputation, give rise to claims against us or divert application of our resources from other purposes, any of which could harm our business and operating results.
Proprietary software development is time-consuming, expensive and complex, and may involve unforeseen difficulties. We may encounter technical obstacles, and it is possible that we will discover additional problems that prevent our proprietary products from operating properly. In addition to our core Castlight platform, we are currently implementing software with respect to a number of new products and services, including our Castlight Pharmacy, Castlight Dental, Castlight Action, Castlight Elevate, Castlight Protect and Castlight Rewards. If our offering does not function reliably or fails to achieve customer expectations in terms of performance, customers could assert liability claims against us or attempt to cancel their contracts with us. This could damage our reputation and impair our ability to attract or maintain clients which would adversely affect our operating results
Moreover, data services that are as complex as those we offer have in the past contained, and may in the future develop or contain, undetected defects or errors. Material performance problems, defects or errors in our existing or new software and products and services may arise in the future and may result from interface of our offering with systems and data that we did not develop and the function of which is outside of our control or undetected in our testing. These defects and errors and any failure by us to identify and address them could result in loss of revenue or market share, diversion of development resources, injury to our reputation and increased service and maintenance costs. Defects or errors in our health benefits platform might discourage existing or potential customers from purchasing our offering from us. Correction of defects or errors could prove to be impossible or impracticable. The costs incurred in correcting any defects or errors may be substantial and could adversely affect our operating results.
If we cannot implement our offering for customers in a timely manner, we may lose customers and our reputation may be harmed.
21
Our customers have a variety of different data formats, enterprise applications and infrastructure and our offering must support our customers’ data formats and integrate with complex enterprise applications and infrastructures. If our platform does not currently support a customer’s required data format or appropriately integrate with a customer’s applications and infrastructure, or if an existing customer switches to unsupported infrastructure, then we must configure our platform to do so, which increases our expenses. Additionally, we do not control our customers’ implementation schedules. As a result, if our customers do not allocate internal resources necessary to meet their implementation responsibilities or if we face unanticipated implementation difficulties, the implementation may be delayed. Further, our implementation capacity has at times constrained our ability to successfully implement our offering for our customers in a timely manner, particularly during periods of high demand. If the customer implementation process is not executed successfully or if execution is delayed, we could incur significant costs, customers could become dissatisfied and decide not to increase usage of our offering, or not to use our offering beyond an initial period prior to their term commitment or, in some cases, revenue recognition could be delayed. Our data dependencies and implementation procedures differ for each new product that we launch. Accordingly, our ability to convert sales of new products into billings and revenue depends on our ability to create a scalable launch infrastructure in each case. In addition, competitors with more efficient operating models with lower implementation costs could penetrate our customer relationships.
Additionally, large and demanding enterprise customers, who currently comprise the majority of our customer base, may request or require specific features or functions unique to their particular business processes, which increase our upfront investment in sales and deployment efforts and the revenue resulting from the customers under our typical contract length may not cover the upfront investments. If prospective large customers require specific features or functions that we do not offer, then the market for our offering will be more limited and our business could suffer.
In addition, supporting large customers could require us to devote significant development services and support personnel and strain our personnel resources and infrastructure. Furthermore, if we are unable to address the needs of these customers in a timely fashion or further develop and enhance our offering, or if a customer or its employees are not satisfied with our quality of work, our offering or professional services then we could incur additional costs to address the situation. In addition, we may be required to issue credits or refunds for pre-paid amounts related to unused services, the timing of recognition of revenue for, and the profitability of, that work might be impaired and the customer’s dissatisfaction with our offering could damage our ability to expand the number of products and services purchased by that customer. These customers may not renew their agreements, seek to terminate their relationship with us or renew on less favorable terms. Moreover, negative publicity related to our customer relationships, regardless of its accuracy, may further damage our business by affecting our ability to retain or compete for new business with current and prospective customers. If any of these were to occur, our revenue may fail to grow at historical rates or at all, or may even decline, and our operating results could be adversely affected.
Any failure to offer high-quality technical support services may adversely affect our relationships with our customers and harm our financial results.
Our customers depend on our support organization to resolve any technical issues relating to our offering. In addition, our sales process is highly dependent on the quality of our offering, our business reputation and on strong recommendations from our existing customers. Any failure to maintain high-quality and highly-responsive technical support, or a market perception that we do not maintain high-quality and highly-responsive support, could harm our reputation, adversely affect our ability to sell our offering to existing and prospective customers, and harm our business, operating results and financial condition.
We offer technical support services with our offering and may be unable to respond quickly enough to accommodate short-term increases in customer demand for support services, particularly as we increase the size of our customer base. We also may be unable to modify the format of our support services to compete with changes in support services provided by competitors. It is difficult to predict customer demand for technical support services and if customer demand increases significantly, we may be unable to provide satisfactory support services to our customers and their employees. Additionally, increased customer demand for these services, without corresponding revenue, could increase costs and adversely affect our operating results.
We depend on data centers operated by third parties for our offering, and any disruption in the operation of these facilities could adversely affect our business.
22
We provide our health benefits platform through computer hardware that is currently located in two third-party data centers in Colorado and Arizona, each of which are operated by the same IT hosting company. While we control and have access to our servers and all of the components of our network that are located in these external data centers, we do not control the operation of these facilities. The owner of our data centers has no obligation to renew the agreements with us on commercially reasonable terms, or at all. If we are unable to renew these types of agreements on commercially reasonable terms, or if our data center operator is acquired or ceases operations, we may be required to transfer our servers and other infrastructure to new data center facilities, and we may incur significant costs and possible service interruption in connection with doing so.
Problems faced by our third-party data center locations could adversely affect the experience of our customers. The operator of the data centers could decide to close the facilities without adequate notice. In addition, any financial difficulties, such as bankruptcy, faced by the operator of the data centers or any of the service providers with whom we or they contract may have negative effects on our business, the nature and extent of which are difficult to predict. Additionally, if our data centers are unable to keep up with our growing needs for capacity, this could have an adverse effect on our business. For example, a rapid expansion of our business could affect the service levels at our data centers or cause such data centers and systems to fail. Any changes in third-party service levels at our data centers or any disruptions or other performance problems with our product offering could adversely affect our reputation and may damage our customers’ stored files or result in lengthy interruptions in our services. Interruptions in our services might reduce our revenue, increase our costs associated with remediation or cause us to issue refunds to customers for prepaid and unused subscriptions, subject us to potential liability or adversely affect our renewal rates
The information that we provide to our customers, and their employees and families, could be inaccurate or incomplete, which could harm our business, financial condition and results of operations.
We provide price, quality and other health care-related information for use by our customers, and their employees and families, to search and compare options for health care services. Third-party health plans and our customers provide us with most of these data. Because data in the health care industry is fragmented in origin, inconsistent in format and often incomplete, the overall quality of data in the health care industry is poor, and we frequently discover data issues and errors. If the data that we provide to our customers are incorrect or incomplete or if we make mistakes in the capture or input of these data, our reputation may suffer and our ability to attract and retain customers may be harmed.
In addition, a court or government agency may take the position that our storage and display of health information exposes us to personal injury liability or other liability for wrongful delivery or handling of health care services or erroneous health information. While we maintain insurance coverage, this coverage may prove to be inadequate or could cease to be available to us on acceptable terms, if at all. Even unsuccessful claims could result in substantial costs, harm to our reputation and diversion of management resources. A claim brought against us that is uninsured or under-insured could harm our business, financial condition and results of operations.
We depend on our senior management team, and the loss of one or more of our executive officers or key employees or an inability to attract and retain highly skilled employees or key subcontractor services could adversely affect our business.
Our success depends largely upon the continued services of our key executive officers. These executive officers are at-will employees and therefore may terminate employment with us at any time with no advance notice. We do not maintain “key person” insurance for any of these executive officers or any of our other key employees. We also rely on our leadership team in the areas of research and development, marketing, services and general and administrative functions. From time to time, there may be changes in our executive management team resulting from the hiring or departure of executives, which could disrupt our business. The replacement of one or more of our executive officers or other key employees would likely involve significant time and costs and may significantly delay or prevent the achievement of our business objectives.
To continue to execute our growth strategy, we also must attract and retain highly skilled personnel. Competition is intense for engineers with high levels of experience in designing and developing software and Internet-related services, particularly in the San Francisco Bay Area where we are located. We might not be successful in maintaining our unique culture and continuing to attract and retain qualified personnel. We have from time to time in the past experienced, and we expect to continue to experience in the future, difficulty in hiring and retaining highly skilled personnel with appropriate qualifications. The pool of qualified personnel with Software-as-a-Service, or SaaS, experience or experience working with the health care market is limited overall. In addition, many of the companies with which we compete for experienced personnel have greater
23
resources than we have. We supplement our hired skilled personnel through the use of subcontractors, particularly in the area of research and development, a significant portion of which perform services outside of the United States. If these subcontractors cease to perform services for us for any reason, our ability to meet our development goals may be impaired, and our business and future growth prospects could be severely harmed.
In addition, in making employment decisions, particularly in the Internet and high-technology industries, job candidates often consider the value of the stock options or other equity instruments they are to receive in connection with their employment. Volatility or performance trends in the price of our stock might, therefore, adversely affect our ability to attract or retain highly skilled personnel. Furthermore, the requirement to expense stock options and other equity instruments might discourage us from granting the size or type of stock option or equity awards that job candidates require to join our company. If we fail to attract new personnel or fail to retain and motivate our current personnel, our business and future growth prospects could be severely harmed.
If we cannot maintain our corporate culture as we grow, we could lose the elements of our culture that we believe contribute to our success and our business may be harmed.
We believe that a critical asset for our business, and a source of our competitive strength, is our unique company culture, which we believe fosters a high level of cross-functional collaboration and desire for excellence in our performance and product. As we grow and change, we may find it difficult to maintain these important aspects of our corporate culture. Any failure to preserve our culture could also negatively affect our ability to attract and retain personnel, our reputation and our ability to continue to build and advance our offering and may otherwise adversely affect our future success.
If we fail to develop widespread brand awareness cost-effectively, our business may suffer.
We believe that developing and maintaining widespread awareness of our brand in a cost-effective manner is critical to achieving widespread adoption of our offering and attracting new customers. Brand promotion activities may not generate customer awareness or increase revenue, and even if they do, any increase in revenue may not offset the expenses we incur in building our brand. If we fail to successfully promote and maintain our brand, or incur substantial expenses, we may fail to attract or retain customers necessary to realize a sufficient return on our brand-building efforts, or to achieve the widespread brand awareness that is critical for broad customer adoption of our offering.
Our marketing efforts depend significantly on our ability to receive positive references from our existing customers.
Our marketing efforts depend significantly on our ability to call on our current customers to provide positive references to new, potential customers. Given our limited number of long-term customers, the loss or dissatisfaction of any customer could substantially harm our brand and reputation, inhibit the market adoption of our offering and impair our ability to attract new customers and maintain existing customers. Any of these consequences could have a material adverse effect on our business, financial condition and results of operations
Any failure to protect our intellectual property rights could impair our ability to protect our proprietary technology and our brand.
Our success depends in part on our ability to enforce our intellectual property and other proprietary rights. We rely upon a combination of patent, trademark, copyright and trade secret laws, as well as license and access agreements and other contractual provisions, to protect our intellectual property and other proprietary rights. In addition, we attempt to protect our intellectual property and proprietary information by requiring certain of our employees, consultants and contractors to enter into confidentiality, noncompetition and assignment of inventions agreements. These laws, procedures and restrictions provide only limited protection and any of our intellectual property rights may be challenged, invalidated, circumvented, infringed or misappropriated. While we have three U.S. patent applications pending, and we currently have one issued U.S. patent, we cannot ensure that any of our pending patent applications will be granted or that our issued patent will adequately protect our intellectual property. In addition, if any patents are issued in the future, they may not provide us with any competitive advantages, or may be successfully challenged by third parties. To the extent that our intellectual property and other proprietary rights are not adequately protected, third parties might gain access to our proprietary information, develop and market solutions similar to ours, or use trademarks similar to ours, each of which could materially harm our business. Further, unauthorized parties may attempt to copy or obtain and use our technology to develop products with the same functionality as our offering, and policing unauthorized use of our technology and intellectual property rights is difficult and may not be effective. The failure to adequately protect our intellectual property and other proprietary rights could materially harm our business
24
We could incur substantial costs as a result of any claim of infringement of another party’s intellectual property rights.
In recent years, there has been significant litigation in the United States involving patents and other intellectual property rights. Companies in the Internet and technology industries are increasingly bringing and becoming subject to suits alleging infringement of proprietary rights, particularly patent rights, and our competitors and other third parties may hold patents or have pending patent applications, which could be related to our business. These risks have been amplified by the increase in third parties, which we refer to as non-practicing entities, whose sole primary business is to assert such claims. We expect that we may receive in the future notices that claim we or our customers using our offering have misappropriated or misused other parties’ intellectual property rights, particularly as the number of competitors in our market grows and the functionality of products amongst competitors overlaps. If we are sued by a third party that claims that our technology infringes its rights, the litigation, whether or not successful, could be extremely costly to defend, divert our management’s time, attention and resources, damage our reputation and brand and substantially harm our business. We do not currently have an extensive patent portfolio of our own, which may limit the defenses available to us in any such litigation.
In addition, in most instances, we have agreed to indemnify our customers against certain third-party claims, which may include claims that our offering infringes the intellectual property rights of such third parties. Our business could be adversely affected by any significant disputes between us and our customers as to the applicability or scope of our indemnification obligations to them. The results of any intellectual property litigation to which we might become a party, or for which we are required to provide indemnification, may require us to do one or more of the following:
• | cease offering or using technologies that incorporate the challenged intellectual property; |
• | make substantial payments for legal fees, settlement payments or other costs or damages; |
• | obtain a license, which may not be available on reasonable terms, to sell or use the relevant technology; or |
• | incur substantial costs and reallocate resources to redesign our technology to avoid infringement. |
If we are required to make substantial payments or undertake any of the other actions noted above as a result of any intellectual property infringement claims against us or any obligation to indemnify our customers for such claims, such payments or costs could have a material adverse effect upon our business and financial results.
Our use of open source technology could impose limitations on our ability to commercialize our software platform.
Our offering incorporates open source software components that are licensed to us under various public domain licenses. Some open source software licenses require users who distribute open source software as part of their software to publicly disclose all or part of the source code to such software or make available any derivative works of the open source code on unfavorable terms or at no cost. There is little or no legal precedent governing the interpretation of many of the terms of these licenses and therefore the potential impact of such terms on our business is somewhat unknown. There is a risk that such licenses could be construed in a manner that imposes unanticipated conditions or restrictions on our ability to market our software platform. While we monitor our use of open source software and try to ensure that none is used in a manner that would require us to disclose our source code or that would otherwise breach the terms of an open source agreement, such use could inadvertently occur and we may be required to release our proprietary source code, pay damages for breach of contract, re-engineer our offering, discontinue sales of our offering in the event re-engineering cannot be accomplished on a timely basis or take other remedial action that may divert resources away from our development efforts, any of which could cause us to breach customer contracts, harm our reputation, result in customer losses or claims, increase our costs or otherwise adversely affect our business and operating results.
We may face risks related to securities litigation that could result in significant legal expenses and settlement or damage awards.
We have been in the past and may in the future become subject to claims and litigation alleging violations of the securities laws or other related claims, which could harm our business and require us to incur significant costs. For example, in April and May, 2015, a series of purported securities class action lawsuits was filed in the Superior Court of the State of California, County of San Mateo, against us, certain of our current and former directors, executive officers, significant stockholders, and underwriters associated with our IPO. These lawsuits were brought by purported stockholders of Castlight seeking to represent a class consisting of all those who purchased our stock pursuant and/or traceable to the Registration Statement and Prospectus issued in connection with our IPO. We are generally obliged, to the extent permitted by law, to indemnify our current and former directors and officers who are named as defendants in these types of lawsuits. On March 28,
25
2016, the parties to the consolidated actions reached a mutually acceptable resolution by way of a mediated cash settlement. The aggregate amount of the settlement under the agreement in principle is $9.5 million. The Court entered final approval of the settlement on October 28, 2016. As a result of the settlement we recorded a net charge of $2.9 million to general and administrative expense in 2016, which was paid out by us in the third quarter of 2016. This amount represents the portion of settlement that was not covered by insurance and legal fees incurred in 2016 regarding this matter. Funds representing our portion of the settlement amount were moved to escrow in the third quarter of 2016. Future litigation may require significant attention from management and could result in significant legal expenses, settlement costs or damage awards that could have a material impact on our financial position, results of operations and cash flows.
Acquisitions of other companies or technologies could divert our management’s attention, result in dilution to our stockholders and otherwise disrupt our operations and adversely affect our operating results.
On January 4, 2017, we announced our intent to acquire Jiff, Inc., of Jiff. We will issue approximately 27 million shares and options at the closing of the transaction to former Jiff equity holders, representing approximately 20 percent of the combined company on a fully-diluted basis. The issuance of up to an additional 4 million shares is contingent on the achievement of specific growth objectives for the Jiff business in 2017. We intend to hold a special meeting of our stockholders on March 17, 2017 to ask for shareholder approval of the shares to be issued in this acquisition. The process of integrating an acquired company, business, or technology has created, and will continue to create, unforeseen operating difficulties and expenditures.
In addition, we may in the future seek to acquire or invest in businesses, products and services or technologies that we believe could complement or expand our offering, enhance our technical capabilities or otherwise offer growth opportunities. The pursuit of potential acquisitions may divert the attention of management and cause us to incur various expenses in identifying, investigating and pursuing suitable acquisitions, whether or not they are consummated.
We have limited experience in acquiring other businesses. If we complete the acquisition of Jiff or acquire additional businesses, we may not be able to integrate the acquired personnel, operations and technologies successfully, or effectively manage the combined business following the acquisition. We also may not achieve the anticipated benefits from the acquired business due to a number of factors, including:
• | inability to integrate or benefit from acquired technologies or services in a profitable manner; |
• | unanticipated costs or liabilities associated with the acquisition; |
• | difficulty integrating the accounting systems, operations and personnel of the acquired business; |
• | difficulties and additional expenses associated with supporting legacy products and hosting infrastructure of the acquired business; |
• | difficulty converting the customers of the acquired business onto our platform and contract terms, including disparities in the revenue, licensing, support or professional services model of the acquired company; |
• | diversion of management’s attention from other business concerns; |
• | adverse effects to our existing business relationships with business partners and customers as a result of the acquisition; |
• | the potential loss of key employees; |
• | use of resources that are needed in other parts of our business; and |
• | use of substantial portions of our available cash to consummate the acquisition. |
In addition, a significant portion of the purchase price of Jiff is, and other companies we acquire may be allocated to acquired goodwill and other intangible assets, which must be assessed for impairment at least annually. In the future, if our acquisitions do not yield expected returns, we may be required to take charges to our operating results based on this impairment assessment process, which could adversely affect our results of operations.
The acquisition of Jiff will result, and other acquisitions could also result, in dilutive issuances of equity securities or the incurrence of debt, which could adversely affect our operating results. In addition, if an acquired business fails to meet our expectations, our operating results, business and financial position may suffer.
26
If we are unable to implement and maintain effective internal control over financial reporting in the future, investors may lose confidence in the accuracy and completeness of our financial reports and the market price of our Class B common stock may be negatively affected.
As a public company, we are required to maintain internal control over financial reporting and to report any material weaknesses in such internal control. Section 404 of the Sarbanes-Oxley Act of 2002, or the Sarbanes-Oxley Act, requires that we evaluate and determine the effectiveness of our internal control over financial reporting and, provide a management report on the internal control over financial reporting. Our independent registered public accounting firm is not required to audit the effectiveness of our internal control over financial reporting until after we are no longer an “emerging growth company”, as defined in the JOBS Act. At such time, our independent registered public accounting firm may issue a report that is adverse in the event it is not satisfied with the level at which our internal control over financial reporting is documented, designed or operating. If we have a material weakness in our internal control over financial reporting, we may not detect errors on a timely basis and our financial statements may be materially misstated. We are in the process of designing and implementing the internal control over financial reporting required to comply with this obligation, which process will be time consuming, costly and complicated. If we identify material weaknesses in our internal control over financial reporting, if we are unable to comply with the requirements of Section 404 in a timely manner, if we are unable to assert that our internal control over financial reporting is effective, or if our independent registered public accounting firm concludes we have a material weakness in our internal control over financial reporting, investors may lose confidence in the accuracy and completeness of our financial reports, the market price of our Class B common stock could be negatively affected and we could become subject to investigations by the New York Stock Exchange, on which our securities are listed, the SEC or other regulatory authorities, which could require us to obtain additional financial and management resources.
We incur significantly increased costs and devote substantial management time as a result of operating as a public company.
As a public company, we incur significant legal, accounting and other expenses that we did not incur as a private company. For example, we are subject to the reporting requirements of the Exchange Act and are required to comply with the applicable requirements of the Sarbanes-Oxley Act and the Dodd-Frank Wall Street Reform and Consumer Protection Act, as well as rules and regulations subsequently implemented by the SEC and the New York Stock Exchange, including the establishment and maintenance of effective disclosure and financial controls, changes in corporate governance practices and required filing of annual, quarterly and current reports with respect to our business and operating results. Compliance with these requirements increases our legal and financial compliance costs and makes some activities more time consuming and costly. In addition, our management and other personnel divert attention from operational and other business matters to devote substantial time to these public company requirements. In particular, we incur significant expenses and devote substantial management effort toward ensuring compliance with the requirements of Section 404 of the Sarbanes-Oxley Act, which will increase when we are no longer an emerging growth company, as defined by the JOBS Act.
Operating as a public company makes it more expensive for us to obtain director and officer liability insurance, and in the future we may be required to accept reduced coverage or incur substantially higher costs to obtain coverage. This could also make it more difficult for us to attract and retain qualified people to serve on our board of directors, our board committees or as executive officers.
We are an emerging growth company and the reduced disclosure requirements applicable to emerging growth companies may make our Class B common stock less attractive to investors.
We are an emerging growth company, as defined under the JOBS Act. For as long as we continue to be an emerging growth company, we intend to take advantage of certain exemptions from various reporting requirements that are applicable to other public companies including, but not limited to, reduced disclosure obligations regarding executive compensation in our periodic reports and proxy statements and exemptions from the requirements of holding a nonbinding advisory vote on executive compensation and stockholder approval of any golden parachute payments not previously approved. We cannot predict if investors will find our Class B common stock less attractive because we will rely on these exemptions. If some investors find our Class B common stock less attractive as a result, there may be a less active trading market for our Class B common stock and our stock price may be more volatile.
We will remain an emerging growth company until the earliest of (i) the end of the year in which the market value of our Class B common stock that is held by non-affiliates exceeds $700 million as of June 30, (ii) the end of the year in which we have total annual gross revenue of $1 billion or more during such year, (iii) the date on which we issue more than $1 billion in non-convertible debt in a three-year period or (iv) December 31, 2019.
27
We may not be able to utilize a significant portion of our net operating loss or research tax credit carryforwards, which could adversely affect our profitability.
Our primary tax jurisdiction is the United States. All of our tax years are open to examination by U.S. federal and state tax authorities due to our history of tax losses. We have provided a full valuation allowance for our deferred tax assets due to the uncertainty surrounding the future realization of such assets. Therefore, no benefit has been recognized for the net operating loss carryforwards and other deferred tax assets. The net operating loss could expire unused and be unavailable to reduce future income tax liabilities, which could adversely affect our profitability.
Economic uncertainties or downturns in the general economy or the industries in which our customers operate could disproportionately affect the demand for our offering and negatively impact our results of operations.
General worldwide economic conditions have experienced a significant downturn, and market volatility and uncertainty remain widespread, making it extremely difficult for our customers and us to accurately forecast and plan future business activities. For example, in June 2016, the decision by referendum to withdraw the United Kingdom (U.K.) from the European Union caused significant volatility in global stock markets, including those in the U.S., and fluctuations in currency exchange rates. The results of this referendum, or other global events, may continue to create global economic uncertainty not only in the U.K., but in other regions, including where we do business. In addition, these conditions could cause our customers or prospective customers to decrease headcount, benefits or human resources budgets, which could decrease corporate spending on our products and services, resulting in delayed and lengthened sales cycles, a decrease in new customer acquisition and loss of customers. Furthermore, during challenging economic times, our customers may have difficulty gaining timely access to sufficient credit or obtaining credit on reasonable terms, which could impair their ability to make timely payments to us and adversely affect our revenue. If that were to occur, our financial results could be harmed. Further, challenging economic conditions might impair the ability of our customers to pay for the products and services they already have purchased from us and, as a result, our write-offs of accounts receivable could increase. We cannot predict the timing, strength, or duration of any economic slowdown or recovery. If the condition of the general economy or markets in which we operate worsens, our business could be harmed.
Our estimates of market opportunity and forecasts of market growth may prove to be inaccurate, and even if the market in which we compete achieves the forecasted growth, our business could fail to grow at similar rates, if at all.
Market opportunity estimates and growth forecasts are subject to significant uncertainty and are based on assumptions and estimates that may not prove to be accurate. Our estimates and forecasts relating to the size and expected growth of the market for our products and services may prove to be inaccurate. Even if the market in which we compete meets our size estimates and forecasted growth, our business could fail to grow at similar rates, if at all.
Natural or man-made disasters and other similar events may significantly disrupt our business and negatively impact our results of operations and financial condition.
Our offices may be harmed or rendered inoperable by natural or man-made disasters, including earthquakes, power outages, fires, floods, nuclear disasters and acts of terrorism or other criminal activities, which may render it difficult or impossible for us to operate our business for some period of time. For example, our headquarters are located in the San Francisco Bay Area, a region known for seismic activity. Any disruptions in our operations related to the repair or replacement of our office could negatively impact our business and results of operations and harm our reputation. In addition, we may not carry business insurance sufficient to compensate for losses that may occur. Any such losses or damages could have a material adverse effect on our business, results of operations and financial condition. In addition, the facilities of significant customers, health plans or major strategic partners may be harmed or rendered inoperable by such natural or man-made disasters, which may cause disruptions, difficulties or material adverse effects on our business.
Risks Related to Our Class B Common Stock
The stock price of our Class B common stock may be volatile or may decline regardless of our operating performance.
The market price of our Class B common stock has fluctuated significantly since our public offering and may continue to fluctuate. These fluctuations could cause you to lose all or part of your investment in our Class B common stock. Factors, many of which are beyond our control, that could cause additional fluctuations in the market price of our Class B common stock include the following:
28
• | overall performance of the equity markets; |
• | our operating performance and the performance of other similar companies; |
• | changes in the estimates of our operating results that we provide to the public or our failure to meet these projections; |
• | failure of securities analysts to maintain coverage of us, changes in financial estimates by securities analysts who follow our company or our failure to meet these estimates or the expectations of investors or changes in recommendations by securities analysts that elect to follow our Class B common stock; |
• | sales of shares of our Class B common stock by us or our stockholders; |
• | announcements of technological innovations, new products or enhancements to services, acquisitions, strategic alliances or significant agreements by us or by our competitors; |
• | disruptions in our services due to computer hardware, software or network problems; |
• | announcements of customer additions and customer cancellations or delays in customer purchases; |
• | recruitment or departure of key personnel; |
• | the economy as a whole, market conditions in our industry and the industries of our customers; |
• | litigation involving us, our industry or both, or investigations by regulators into our operations or those of our competitors; |
• | developments or disputes concerning our intellectual property or other proprietary rights; |
• | new laws or regulations or new interpretations of existing laws or regulations applicable to our business; and |
• | the size of our market float. |
In addition, the stock markets have experienced extreme price and volume fluctuations that have affected and continue to affect the market prices of equity securities of many technology companies. Stock prices of many technology companies have fluctuated in a manner unrelated or disproportionate to the operating performance of those companies. In the past, stockholders have filed securities class action litigation following periods of market volatility. If we were to become involved in new securities litigation, it could subject us to substantial costs, divert resources and the attention of management from our business and adversely affect our business.
If there are substantial sales of shares of our Class B common stock, the price of our Class B common stock could decline.
The price of our Class B common stock could decline if there are substantial sales of our Class B common stock, particularly sales by our directors, executive officers and significant stockholders, or the perception in the market that the holders of a large number of shares of our Class B common stock intend to sell their shares, and may make it more difficult for stockholders to sell Class B common stock at a time and price that they deem appropriate. We are unable to predict the effect that sales may have on the prevailing market price of our Class B common stock.
In addition, certain of our stockholders have rights, subject to some conditions, to require us to file registration statements covering their shares and to include their shares in registration statements that we may file for ourselves or our stockholders. Registration of the resale of these shares under the Securities Act would generally result in the shares becoming freely tradable without restriction. Any sales of securities by existing stockholders could adversely affect the trading price of our Class B common stock. We also registered shares of Class B common stock that we have issued and may issue under our employee equity incentive and employee stock purchase plans. These shares may be sold freely in the public market upon issuance.
The dual class structure of our Class A and Class B common stock will have the effect of concentrating voting control with our executive officers (including our Executive Chairman), directors and their affiliates; this will limit or preclude a stockholder's ability to influence corporate matters.
Each share of Class A common stock and each share of Class B common stock has one vote per share, except on the following matters (in which each share of Class A common stock has ten votes per share and each share of Class B common stock has one vote per share):
29
• | adoption of a merger or consolidation agreement involving our company; |
• | a sale, lease or exchange of all or substantially all of our property and assets; |
• | a dissolution or liquidation of our company; or |
• | every matter, if and when any individual, entity or “group” (as such term is used in Regulation 13D of the Exchange Act) has, or has publicly disclosed (through a press release or a filing with the SEC) an intent to have, beneficial ownership of 30% or more of the number of outstanding shares of Class A common stock and Class B common stock, combined. |
Because of our dual class common stock structure, the holders of our Class A common stock, who consist of our founders, directors, executives, employees, will continue to be able to control the corporate matters listed above if any such matter is submitted to our stockholders for approval even if they come to own less than 50% of the outstanding shares of our Class A and Class B common stock. As of December 31, 2016, our executive officers and directors and their affiliates own 35.1% of our outstanding Class A and Class B common stock, combined. However, because of our dual class common stock structure our executive officers and directors and their affiliates have 57.9% of the total votes in each of the matters identified in the list above. This concentrated control by holders of our Class A common stock will limit or preclude the ability of a holder of our Class B common stock to influence those corporate matters for the foreseeable future and, as a result, we may take actions that our stockholders do not view as beneficial. The market price of our Class B common stock could be adversely affected by the structure. In addition, this may prevent or discourage unsolicited acquisition proposals or offers for capital stock that a stockholder may feel are in its best interests.
Transfers by holders of our Class A common stock will generally result in those shares converting to our Class B common stock, subject to limited exceptions, such as certain transfers effected for estate planning purposes. The conversion of our Class A common stock to our Class B common stock will have the effect, over time, of increasing the relative voting power of those holders of Class A common stock who retain their shares in the long term. If, for example, our executive officers (including our Chief Executive Officer), directors and their affiliates retain a significant portion of their holdings of our Class A common stock for an extended period of time, they could continue to control a majority of the combined voting power of our Class A and Class B common stock with respect to each of the matters identified in the list above.
If securities or industry analysts do not publish research or publish inaccurate or unfavorable research about our business, our stock price and trading volume could decline.
The trading market for our Class B common stock depends in part on the research and reports that securities or industry analysts publish about us or our business. If one or more of the analysts who cover us downgrade our Class B common stock or publish inaccurate or unfavorable research about our business, our Class B common stock price would likely decline. If one or more of these analysts cease coverage of us or fail to publish reports on us regularly, demand for our Class B common stock could decrease, which might cause our Class B common stock price and trading volume to decline.
Anti-takeover provisions under Delaware law and in our restated certificate of incorporation and restated bylaws could make a merger, tender offer, or proxy contest difficult, limit attempts by our stockholders to replace or remove members of our board of directors or current management and depress the trading price of our Class B common stock.
Our status as a Delaware corporation and the anti-takeover provisions of the Delaware General Corporation Law may discourage, delay, or prevent a change in control by prohibiting us from engaging in a business combination with an interested stockholder for a period of three years after the person becomes an interested stockholder, even if a change of control would be beneficial to our existing stockholders.
In addition, our restated certificate of incorporation and restated bylaws contain provisions that may make the acquisition of our company or changes in our board of directors or management more difficult, including the following:
• | our board of directors is classified into three classes of directors with staggered three-year terms and directors are only able to be removed from office for cause, which may delay the replacement of a majority of our board of directors or impede an acquirer from rapidly replacing our existing directors with its own slate of directors; |
• | subject to the rights of the holders of any series of preferred stock to elect directors under specified circumstances, only our board of directors has the right to fill a vacancy created by the expansion of our board of directors or the |
30
resignation, death or removal of a director, which prevents stockholders from being able to fill vacancies on our board of directors;
• | our stockholders may not act by written consent or call special stockholders’ meetings; as a result, a holder, or holders, controlling a majority of our Class A and Class B common stock are not be able to take certain actions other than at annual stockholders’ meetings or special stockholders’ meetings, which special meetings may only be called by the chairman of our board, our chief executive officer, our president, or a majority of our board of directors; |
• | certain litigation against us can only be brought in Delaware; |
• | our restated certificate of incorporation authorizes undesignated preferred stock, the terms of which may be established and shares of which may be issued, by our board of directors without the approval of the holders of Class B common stock, which makes it possible for our board of directors to issue preferred stock with voting or other rights or preferences that could impede the success of any attempt to acquire us; |
• | advance notice procedures and additional disclosure requirements apply for stockholders to nominate candidates for election as directors or to bring matters before a meeting of stockholders, which may discourage or deter a potential acquirer from conducting a solicitation of proxies to elect the acquirer’s own slate of directors or otherwise attempting to obtain control of our company; |
• | our restated certificate of incorporation prohibits cumulative voting in the election of directors, which limits the ability of minority stockholders to elect director candidates; |
• | amendment of the anti-takeover provisions of our restated certificate of incorporation require super majority approval by holders of at least two-thirds of our outstanding Class A and Class B common stock, combined; and |
• | in certain circumstances pertaining to change in control, the sale of all or substantially all of our assets and liquidation matters, and on all matters if and when any individual, entity or group has, or has publicly disclosed an intent to have, beneficial ownership of 30% or more of the number of outstanding shares of our Class A and Class B common stock, combined, holders of our Class A common stock are entitled to ten votes per share and holders of our Class B common stock are entitled to one vote per share. As of December 31, 2016, holders of our Class A common stock owned 52.1% and holders of our Class B common stock owned 47.9% of the outstanding shares of our Class A and Class B common stock, combined. However, because of our dual class common stock structure these holders of our Class A common stock have 91.6% and holders of our Class B common stock have 8.4% of the total votes with respect to the matters specified above. In all other circumstances, holders of our Class A and Class B common stock are each entitled to one vote per share, and in these other circumstances the holders of our Class A common stock have 52.1% and holders of our Class B common stock have 47.9% of the total votes. |
31
Item 1B. Unresolved Staff Comments
Not applicable.
32
Item 2. Properties
Our corporate headquarters are located in San Francisco, California, where we occupy a facility totaling approximately 32,571 square feet under a sublease which expires in 2017 and another facility totaling approximately 44,580 square feet under a lease which expires in 2022. We use these facilities for administration, sales and marketing, research and development, engineering, customer support and professional services. As of November 2015, we also leased office space in Sunnyvale, California totaling 5,410 square feet under a sublease that expires in 2020. We use this facility primarily for research and development.
We believe that our existing facilities are adequate to meet our current needs, and we intend to procure additional space as needed as we add employees and expand our operations. We believe that, if required, suitable additional or substitute space would be available to accommodate any such expansion of our operations.
Item 3. Legal Proceedings
During the second quarter of 2015, four purported securities class action lawsuits, which were later consolidated into a single action, were filed in the Superior Court of the State of California, County of San Mateo, against Castlight, certain of our current and former directors, executive officers, significant stockholders and underwriters associated with our initial public offering (“IPO”). The lawsuits were brought by purported stockholders of Castlight seeking to represent a class consisting of all those who purchased our stock pursuant or traceable to the Registration Statement and Prospectus issued in connection with our IPO, alleging claims under Sections 11, 12(a)(2) and 15 of the Securities Act of 1933. On March 28, 2016, the parties to the consolidated actions reached a mutually acceptable resolution by way of a mediated cash settlement for an aggregate amount of $9.5 million, and the Court entered final approval of the settlement on October 28, 2016. As a result of the settlement we recorded a net charge of $2.9 million to general and administrative expense in 2016. This amount represents the portion of settlement that was not covered by insurance and legal fees incurred in 2016 regarding this matter.
From time to time, we may become subject to other legal proceedings, claims or litigation arising in the ordinary course of business. In addition, we may receive letters alleging infringement of patents or other intellectual property rights. If an unfavorable outcome were to occur in litigation, the impact could be material to our business, financial condition, cash flow or results of operations, depending on the specific circumstances of the outcome. We accrue for loss contingencies when it is both probable that it will incur the loss and when we can reasonably estimate the amount of the loss or range of loss.
Item 4. Mine Safety Disclosures
None.
33
PART II
Item 5. Market for Registrant’s Common Equity, Related Stockholder Matters, and Issuer Purchases of Equity Securities
(a) Market Information for Common Stock
Our common stock is listed on the New York Stock Exchange under the symbol “CSLT.”
The following table sets forth for the period beginning on January 1, 2015 through December 31, 2016 the high and low sales prices of our common stock for the periods indicated as reported by the New York Stock Exchange.
High | Low | ||||||
Year ended December 31, 2015 | |||||||
First Quarter | $ | 11.99 | $ | 6.52 | |||
Second Quarter | 10.36 | 6.96 | |||||
Third Quarter | 8.42 | 4.02 | |||||
Fourth Quarter | 5.39 | 3.59 | |||||
Year ended December 31, 2016 | |||||||
First Quarter | $ | 4.18 | $ | 2.54 | |||
Second Quarter | 4.97 | 3.15 | |||||
Third Quarter | 4.71 | 3.36 | |||||
Fourth Quarter | 5.50 | 3.60 | |||||
Dividend Policy
We have never declared or paid dividends on our capital stock. We do not expect to pay dividends on our capital stock for the foreseeable future. Instead, we anticipate that all of our earnings, if any, will be used for the operation and growth of our business. Any future determination to declare cash dividends would be subject to the discretion of our board of directors and would depend upon various factors, including our results of operations, financial condition and liquidity requirements, restrictions that may be imposed by applicable law and our contracts and other factors deemed relevant by our board of directors.
Stockholders
As of December 31, 2016, there were 50 stockholders of record of our Class A common stock (not including beneficial holders of stock held in street name), as well as 9 stockholders of record of our Class B common stock (not including beneficial holders of stock held in street name).
Securities Authorized for Issuance under Equity Compensation Plans
The information required by this item will be included in an amendment to this Annual Report on Form 10-K or incorporated by reference from our definitive proxy statement to be filed pursuant to Regulation 14A.
Stock Performance Graph
The following shall not be deemed incorporated by reference into any of our other filings under the Securities Exchange Act of 1934, as amended, or the Securities Act of 1933, as amended, except to the extent we specifically incorporate it by reference into such filing.
The graph below compares the cumulative total stockholder return on our common stock with the cumulative total return on the NYSE Composite Index and the Standard & Poor Systems Software Index for the period beginning on March 14, 2014 (the date our common stock commenced trading on the New York Stock Exchange) through December 31, 2016,
34
assuming an initial investment of $100. Data for the NYSE Composite Index and the Standard & Poor Systems Software Index assume reinvestment of dividends.
The comparisons in the graph below are based upon historical data and are not indicative of, nor intended to forecast, future performance of our common stock.
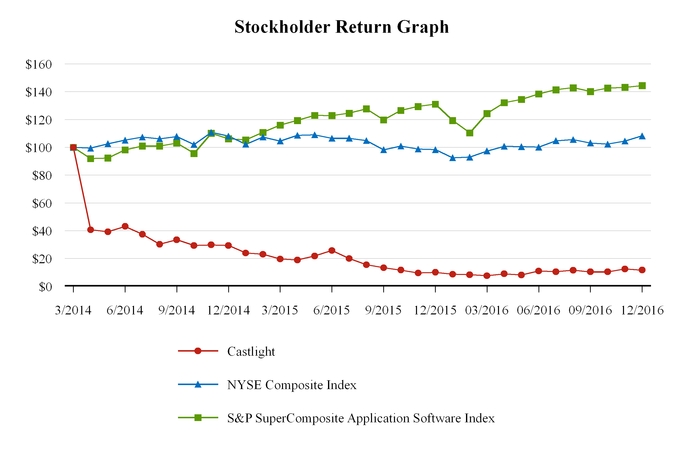
3/2015 | 6/2015 | 9/2015 | 12/2015 | 3/2015 | 6/2015 | 9/2015 | 12/2015 | 3/2016 | 6/2016 | 9/2016 | 12/2016 | ||||||||||||||||||||||||||||||||||||
Castlight Health, Inc. | $ | 19.7 | $ | 25.8 | $ | 13.4 | $ | 10.0 | $ | 19.7 | $ | 25.8 | $ | 13.4 | $ | 10.0 | $ | 7.7 | $ | 11.1 | $ | 10.4 | $ | 11.7 | |||||||||||||||||||||||
NYSE Composite | $ | 104.5 | $ | 106.5 | $ | 98.3 | $ | 98.3 | $ | 104.5 | $ | 106.5 | $ | 98.3 | $ | 98.3 | $ | 97.4 | $ | 100.1 | $ | 103.1 | $ | 108.2 | |||||||||||||||||||||||
S&P SuperComposite Application Software Index | $ | 116.0 | $ | 122.9 | $ | 119.8 | $ | 131.1 | $ | 116.0 | $ | 122.9 | $ | 119.8 | $ | 131.1 | $ | 124.4 | $ | 138.4 | $ | 140.2 | $ | 144.4 | |||||||||||||||||||||||
(b) Use of Proceeds from Public Offering of Common Stock
On March 19, 2014, we closed our initial public offering (IPO), in which we sold 12.8 million shares of Class B common stock at a price to the public of $16.00 per share. The aggregate offering price for shares sold in the offering was approximately $204.2 million. The offer and sale of all of the shares in the IPO were registered under the Securities Act pursuant to a registration statement on Form S-1 (File No. 333-193840), which was declared effective by the SEC on March 13, 2014. The offering commenced March 13, 2014 and did not terminate before all of the securities registered in the registration statement were sold. Goldman, Sachs & Co. and Morgan Stanley & Co. LLC acted as joint book running managers for the offering, and Allen & Company LLC, Stifel, Nicolaus & Company, Incorporated, Canaccord Genuity Inc., and Raymond James & Associates, Inc. acted as co-managers of the offering. We raised approximately $185.6 million in net proceeds from the offering, after deducting underwriter discounts and commissions of approximately $14.3 million and other offering expenses of approximately $4.3 million.
35
There has been no material change in the planned use of proceeds from our IPO as described in our final prospectus filed with the SEC on March 14, 2014 pursuant to Rule 424(b). No direct or indirect payments were made by us to any of our directors or officers or their associates, to persons owning ten percent or more of our common stock or to their associates, or to our affiliates, other than payments in the ordinary course of business to officers for salaries. Pending the uses described, we have invested the net proceeds in short-term, interest-bearing obligations, investment-grade instruments, certificates of deposit or direct or guaranteed obligations of the U.S. government.
(c) Issuer Purchases of Equity Securities
None.
Item 6. Selected Consolidated Financial Data
The following tables present selected historical consolidated financial data for our business. You should read this information in conjunction with “Management’s Discussion and Analysis of Financial Condition and Results of Operations” and the consolidated financial statements and related notes and other information included elsewhere in this prospectus.
We derived the consolidated statements of operations data for the years ended December 31, 2016, 2015 and 2014 and the consolidated balance sheet data as of December 31, 2016 and 2015, from our audited consolidated financial statements and the notes thereto included in Part IV, Item 15 in this Annual Report on Form 10-K. We derived the consolidated statement of operations data as of the years ended December 31, 2013 and 2012 and the consolidated balance sheet data as of December 31, 2014, 2013 and 2012 from our audited consolidated financial statements that are not included in this Annual Report on 10-K. Our historical results are not necessarily indicative of the results to be expected in the future.
Year Ended December 31, | |||||||||||||||||||
2016 | 2015 | 2014 | 2013 | 2012 | |||||||||||||||
(in thousands, except per share data) | |||||||||||||||||||
Consolidated Statements of Operations Data: | |||||||||||||||||||
Revenue: | |||||||||||||||||||
Subscription | $ | 95,016 | $ | 70,350 | $ | 41,602 | $ | 11,655 | $ | 3,395 | |||||||||
Professional services | 6,684 | 4,965 | 4,003 | 1,318 | 759 | ||||||||||||||
Total revenue | 101,700 | 75,315 | 45,605 | 12,973 | 4,154 | ||||||||||||||
Cost of revenue(1): | |||||||||||||||||||
Cost of subscription | 16,463 | 12,417 | 10,472 | 6,246 | 3,242 | ||||||||||||||
Cost of professional services | 18,098 | 21,351 | 17,300 | 11,058 | 5,286 | ||||||||||||||
Total cost of revenue | 34,561 | 33,768 | 27,772 | 17,304 | 8,528 | ||||||||||||||
Gross profit (loss) | 67,139 | 41,547 | 17,833 | (4,331 | ) | (4,374 | ) | ||||||||||||
Operating expenses: | |||||||||||||||||||
Sales and marketing(1) | 58,800 | 67,414 | 62,065 | 33,742 | 15,829 | ||||||||||||||
Research and development(1) | 40,460 | 30,077 | 22,917 | 15,219 | 9,718 | ||||||||||||||
General and administrative(1) | 26,859 | 24,274 | 19,009 | 9,047 | 5,212 | ||||||||||||||
Total operating expenses | 126,119 | 121,765 | 103,991 | 58,008 | 30,759 | ||||||||||||||
Operating loss | (58,980 | ) | (80,218 | ) | (86,158 | ) | (62,339 | ) | (35,133 | ) | |||||||||
Other income, net | 432 | 298 | 218 | 157 | 129 | ||||||||||||||
Net loss | $ | (58,548 | ) | $ | (79,920 | ) | $ | (85,940 | ) | $ | (62,182 | ) | $ | (35,004 | ) | ||||
Net loss per share, basic and diluted(2) | $ | (0.58 | ) | $ | (0.85 | ) | $ | (1.16 | ) | $ | (6.28 | ) | $ | (4.44 | ) | ||||
Weighted-average shares used to compute basic and diluted net loss per share(2) | 100,798 | 93,753 | 74,381 | 9,895 | 7,885 | ||||||||||||||
(1) | Includes stock-based compensation expense as follows: |
36
Year Ended December 31, | |||||||||||||||||||
2016 | 2015 | 2014 | 2013 | 2012 | |||||||||||||||
(in thousands) | |||||||||||||||||||
Cost of revenue | $ | 2,467 | $ | 2,458 | $ | 1,400 | $ | 125 | $ | 107 | |||||||||
Sales and marketing | 8,843 | 7,705 | 5,933 | 919 | 551 | ||||||||||||||
Research and development | 5,959 | 3,498 | 2,556 | 603 | 242 | ||||||||||||||
General and administrative | 4,743 | 4,169 | 4,312 | 780 | 411 | ||||||||||||||
(2) | Net loss per share is computed by dividing net loss by the weighted-average number of shares of our common stock outstanding during the period, less the weighted-average unvested shares of common stock subject to repurchase. |
As of December 31, | |||||||||||||||
2016 | 2015 | 2014 | 2013 | ||||||||||||
(in thousands) | |||||||||||||||
Consolidated Balance Sheets Data: | |||||||||||||||
Cash and cash equivalents | $ | 48,722 | $ | 19,150 | $ | 17,425 | $ | 25,154 | |||||||
Marketable securities | 65,882 | 101,274 | 175,057 | 42,017 | |||||||||||
Working capital | 92,287 | 96,384 | 170,559 | 54,944 | |||||||||||
Property and equipment, net | 5,285 | 6,896 | 3,630 | 2,631 | |||||||||||
Total assets | 157,166 | 173,274 | 223,274 | 83,517 | |||||||||||
Total deferred revenue | 35,868 | 34,112 | 27,360 | 11,473 | |||||||||||
Total liabilities | 55,204 | 54,920 | 47,084 | 27,444 | |||||||||||
Convertible preferred stock | — | — | — | 180,423 | |||||||||||
Total stockholders’ equity (deficit) | 101,962 | 118,354 | 176,190 | (124,350 | ) | ||||||||||
Item 7. Management's Discussion and Analysis of Financial Condition and Results of Operations
You should read the following discussion and analysis of our financial condition and results of operations together with our consolidated financial statements and the related notes appearing at the end of this filing. Some of the information contained in this discussion and analysis or set forth elsewhere in this filing, including information with respect to our plans and strategy for our business, includes forward-looking statements that involve risks and uncertainties. You should read the “Risk Factors” section of this filing for a discussion of important factors that could cause actual results and the timing of certain events to differ materially from future results expressed or implied by the forward-looking statements contained in the following discussion and analysis.
Overview
Castlight offers a health benefits platform that engages employees to make better health care decisions and enables employers to communicate and measure their benefit programs. We provide a simple, personalized, and powerful way for employees to shop for and manage their health care. At the same time, we enable employers to understand their employees’ needs and guide them to the right care, right providers and right programs at the right time. Our comprehensive technology offering aggregates complex, large-scale data and applies sophisticated analytics to make health care data transparent and useful. Our products are designed to deliver strong employee engagement and can be used to enable employers to integrate disparate benefit programs into a single platform available to employees and their families. Ultimately, we help enable organizations and their employees to improve outcomes, lower health care costs, and increase benefits satisfaction.
Since our inception in 2008, we have been committed to improving the efficiency of the U.S. health care industry. From 2008 to 2010, we focused efforts on research and development to build our consumer health care database, our analytic capabilities and the initial version of our cloud-based product which constitutes our core Castlight platform. After its release in 2010, we have continued to enhance that product, as well as release new products, including Castlight Pharmacy, Castlight Dental, Castlight Action, Castlight Elevate, Castlight Protect, and Castlight Rewards. These products are delivered to our customers, and their employees and families, via our cloud-based offering and leverage consumer-oriented design principles that drive engagement and ease of use.
37
We market and sell our health benefits platform to self-insured companies in a broad range of industries and to governmental entities. We sell our offering solely in the United States, and we market to our customers and potential customers through our direct sales force, as well as through relationships with health plans, benefits consultants and other channel partners. We intend to continue to invest aggressively in the success of our customers, expand our commercial operations and further develop our offering.
Key Factors Affecting Our Performance
Sales of New and Additional Products. Our revenue growth rate and long-term profitability are affected by our ability to sell new and additional products directly to our customer base and through our channel partners. Additionally, we believe that there is a significant opportunity to sell subscriptions to other products as our customers become more familiar with our offering and seek to address additional needs.
Renewals of Customer Contracts. We believe that our ability to retain our customers and expand their subscription revenue growth over time will be an indicator of the stability of our revenue base and the long-term value of our customer relationships.
Implementation Timelines. Our ability to convert backlog into revenue and improve our gross margin depends on how quickly we complete customer implementations. Our implementation timelines vary from customer to customer based on the source and condition of the data we receive from third parties, the configurations that we agree to provide and the size of the customer. Our implementation timelines for our core Castlight platform are typically three to nine months after entering into an agreement with a customer. Our implementation timelines for our other products currently range from approximately three to twelve months.
Professional Services Model. We believe our professional services capabilities support the adoption of our subscription offerings. As a result, our sales efforts have been focused primarily on our subscription offering, rather than the profitability of our professional services business. Our professional services are generally priced on a fixed-fee basis and the costs incurred to complete these services, which consist mainly of personnel-related costs, have been greater than the amount charged to the customer. We also do not have standalone value for our implementation services for accounting purposes. Accordingly, we recognize implementation services revenue in the same manner as the associated subscription revenue. Prior to launching an individual customer, we incur significant costs associated with implementation activities, which we record as cost of revenue. Since we do not recognize significant revenues from an individual customer until it launches, we generate a negative gross margin at the customer level during the implementation period.
Seasonality. We have historically observed seasonality related to employee benefits cycles as a significantly higher proportion of our customers enter into new subscription agreements with us in the third and fourth quarters of the year, compared to the first and second quarters. As we continue to leverage our channel relationships and expand our business, there is no assurance this seasonality will continue. The impact from any seasonality in our new customer agreements is not immediately apparent in our revenue because we do not begin recognizing revenue from new customer agreements until we have implemented our offering, based on the implementation timelines discussed above.
Revenue recognized in any quarter is primarily from customer agreements entered into in prior quarters. In addition, the mix of customers paying monthly, quarterly, or annually varies from quarter to quarter and impacts our deferred revenue balance. As a result of variability in our billing and implementation timelines, the deferred revenue balance does not represent the total value of our customer contracts, nor do changes in deferred revenue serve as a reliable indicator of our future subscription revenue.
Key Business Metrics
We review a number of operating metrics, including the following key metrics, to evaluate our business, measure our performance, identify trends affecting our business, and make strategic decisions.
Signed Annual Recurring Revenue
38
As of | |||||||
December 31, 2016 | December 31, 2015 | ||||||
(in millions) | |||||||
Signed Annual Recurring Revenue (ARR) | $ | 121.6 | $ | 110.0 | |||
Revenue recognized in any quarter is largely derived from customer agreements signed in prior quarters. Accordingly, management measures sales performance and forecasts future subscription revenue based on signed Annual Recurring Revenue (“ARR”). ARR is a forward-looking metric based on contractual terms in existence as of the applicable ARR measurement date and is subject to change resulting from a number of factors including, but not limited to, addition of new customers, changes in user counts, terminations or non-renewals, renewal terms as well as upsells and cross-sells. As discussed above, we begin recognizing revenue from new customer agreements when we have implemented our offering, which can take from approximately 3 to 12 months after entering into an agreement with a customer.
ARR represents the annualized value of subscription revenue under contract with customers at the end of a quarter, which we refer to for this purpose as a measurement date. To calculate ARR, we first calculate the annualized subscription value for each signed customer (whether implemented or not), as of the applicable measurement date, by multiplying the monthly contract value of the subscription services under contract by 12. We exclude from this calculation any customers that have provided us with formal notice of termination or non-renewal as of the measurement date. ARR does not take into account the (i) potential for customers to terminate, or decline to renew, their agreements with us, (ii) achievement of non-recurring or yet-to-be-earned performance guarantees, (iii) one-time engagement bonuses included within our customer contracts or (iv) revenues related to professional services, such as implementation and communications services. ARR is not determined in reference to GAAP.
Our ARR at December 31, 2016 was $121.6 million, compared to $110.0 million at December 31, 2015, representing an increase of approximately 11%. We expect ARR to increase as we sign additional customers and cross-sell to existing customers.
Annual Net Dollar Retention Rate
Year Ended December 31, | |||||
2016 | 2015 | ||||
Annual Net Dollar Retention Rate (NDR) | 94 | % | 116 | % | |
We assess our performance on customer retention by measuring our Annual Net Dollar Retention rate (“NDR”). We believe that our ability to retain our customers and expand their subscription revenue growth over time will be an indicator of the stability of our revenue base and the long-term value of our customer relationships. Our NDR provides a measurement of our ability to increase revenue across our existing customer base through expansion of our additional products to existing customers, increases in user count for existing customers and customer renewals, as offset by terminations or pricing changes. We observed an annual net dollar retention rate of 94% and 116% for our signed customer base, for the years ended December 31, 2016 and 2015, respectively. The year over year decrease in NDR was as a result of lower cross sales and churn, in particular weaker pricing related to certain customer renewals. We calculate NDR for a given period as the aggregate annualized subscription contract value as of the last day of that year from those customers that were also customers as of the last day of the prior year, divided by the aggregate annualized subscription contract value from all customers as of the last day of the prior year. In calculating NDR, we exclude one-time fees. NDR does not include subscriptions by new customers contracted since the end of the most recently completed year.
Components of Results of Operations
Revenue
We generate revenue from subscription fees from customers for access to the products they select, including basic customer service support. We also earn revenue from professional services primarily related to the implementation of our
39
offering, including extensive communications support to drive adoption by our customers’ employees and their dependents. Historically, we have derived a substantial majority of our subscription revenue from our core Castlight platform. Our subscription fees are based primarily on the number of employees and adult dependents that employers identify as eligible to use our offering, which typically includes all of our customers’ U.S. employees and adult dependents that receive health benefits.
We recognize subscription fees on a straight-line basis ratably over the contract term beginning when our products are implemented and ready for launch, which is based on the implementation timelines discussed above. Our customer agreements generally have a term of three years. We generally invoice our customers in advance on a monthly, quarterly or annual basis. Amounts that have been invoiced are initially recorded as deferred revenue. Amounts that have not been invoiced are not reflected in our condensed consolidated financial statements. We generally invoice our implementation services upon contract signing on a fixed-fee basis, which is generally when we commence work.
As a result of variability in our billing terms, the deferred revenue balance does not represent the total value of our customer contracts, nor do changes in deferred revenue serve as a reliable indicator of our future subscription revenue in a given period.
Cost of Revenue
Cost of revenue consists of the cost of subscription revenue and cost of professional services revenue.
Cost of subscription revenue primarily consists of data fees, employee-related expenses (including salaries, benefits and stock-based compensation), hosting costs of our cloud-based service, cost of subcontractors, expenses for service delivery (which includes call center support), allocated overhead, amortization of internal-use software and depreciation of owned computer equipment and software.
Cost of professional services revenue consists primarily of employee-related expenses (including salaries, bonuses, benefits and stock-based compensation) associated with these services, the cost of subcontractors and travel costs and allocated overhead. The time and costs of our customer implementations vary based on the source and condition of the data we receive from third parties, the configurations that we agree to provide and the size of the customer.
Our cost of revenue is expensed as we incur the costs. However, the related revenue is deferred until our products are ready for use by the customer and then recognized as revenue ratably over the related contract term. Therefore, we expense the cost incurred to provide our products and services prior to the recognition of the corresponding revenue.
Operating Expenses
Operating expenses consist of sales and marketing, research and development and general and administrative expenses.
Sales and Marketing. Sales and marketing expenses consist primarily of employee-related expenses (including salaries, sales commissions and bonuses, benefits and stock-based compensation), travel-related expenses, marketing programs and allocated overhead. Commissions earned by our sales force and broker fees that can be associated specifically with the noncancelable portion of a subscription contract are deferred and amortized over the noncancelable period. Accordingly, commission expense can be materially impacted by changes in the termination provisions of customer contracts that we execute in a given period compared with previous periods.
Research and Development. Research and development expenses consist primarily of employee-related expenses (including salaries, bonuses, benefits and stock-based compensation), costs associated with subcontractors and allocated overhead.
General and Administrative. General and administrative expenses consist primarily of employee-related expenses (including salaries, bonuses, benefits and stock-based compensation) for finance and accounting, legal, human resources and management information systems personnel, legal costs, professional fees, other corporate expenses and allocated overhead.
Overhead Allocation. Expenses associated with our facilities and IT costs are allocated between cost of revenues and operating expenses based on employee headcount determined by the nature of work performed.
40
Results of Operations
The following tables set forth selected consolidated statements of operations data and such data as a percentage of total revenue for each of the periods indicated:
Year Ended December 31, | ||||||||
2016 | 2015 | 2014 | ||||||
Revenue: | ||||||||
Subscription | 93 | % | 93 | % | 91 | % | ||
Professional services | 7 | % | 7 | % | 9 | % | ||
Total revenue | 100 | % | 100 | % | 100 | % | ||
Cost of revenue: | ||||||||
Cost of subscription | 16 | % | 17 | % | 23 | % | ||
Cost of professional services | 18 | % | 28 | % | 38 | % | ||
Total cost of revenue | 34 | % | 45 | % | 61 | % | ||
Gross margin (loss) percentage | 66 | % | 55 | % | 39 | % | ||
Operating expenses: | ||||||||
Sales and marketing | 58 | % | 90 | % | 136 | % | ||
Research and development | 40 | % | 40 | % | 50 | % | ||
General and administrative | 26 | % | 32 | % | 42 | % | ||
Total operating expenses | 124 | % | 162 | % | 228 | % | ||
Operating loss | (58 | )% | (107 | )% | (189 | )% | ||
Other income, net | — | % | — | % | — | % | ||
Net loss | (58 | )% | (107 | )% | (189 | )% | ||
Revenue
Year Ended December 31, | |||||||||||||||||
2016 | 2015 | 2014 | 2015 to 2016 % change | 2014 to 2015 % change | |||||||||||||
(in thousands, except percentages) | |||||||||||||||||
Revenue: | |||||||||||||||||
Subscription | $ | 95,016 | $ | 70,350 | $ | 41,602 | 35 | % | 69 | % | |||||||
Professional services | 6,684 | 4,965 | 4,003 | 35 | % | 24 | % | ||||||||||
Total revenue | $ | 101,700 | $ | 75,315 | $ | 45,605 | 35 | % | 65 | % | |||||||
2016 compared to 2015
Total revenue for the year ended December 31, 2016, increased $26.4 million, or 35%, The increase in total revenue was primarily attributable to revenue from customers launched during 2016 and 2015. Full year revenue from customers launched in 2015 accounted for $10.0 million of the increase and new customer launches in 2016 accounted for $9.8 million of the increase. Additionally, $4.6 million of the increase was attributable to higher user counts for existing customers and $2.3 million was attributable to launches of cross-sell products for existing customers. These increases were partially offset by customer terminations. Our launched customer base grew more than 15% year over year.
2015 compared to 2014
Total revenue for the year ended December 31, 2015, increased $29.7 million, or 65%. The increase in total revenue was primarily attributable to revenue from customers launched during 2015 as well as incremental revenue from customers launched in 2014. New customer launches in 2015 accounted for $15.4 million of the increase and customers launched in 2014 accounted for $14.5 million of the increase in total revenue. Our launched customer base grew more than 35% year over year.
41
Costs and Operating Expenses
Year Ended December 31, | |||||||||||||||||
2016 | 2015 | 2014 | 2015 to 2016 % change | 2014 to 2015 % change | |||||||||||||
(in thousands, except percentages) | |||||||||||||||||
Cost of revenue: | |||||||||||||||||
Subscription | $ | 16,463 | $ | 12,417 | $ | 10,472 | 33 | % | 19 | % | |||||||
Professional services | 18,098 | 21,351 | 17,300 | (15 | )% | 23 | % | ||||||||||
Total cost of revenue | $ | 34,561 | $ | 33,768 | $ | 27,772 | 2 | % | 22 | % | |||||||
Gross margin (loss) percentage | |||||||||||||||||
Subscription | 83 | % | 82 | % | 75 | % | |||||||||||
Professional services | (171 | )% | (330 | )% | (332 | )% | |||||||||||
Total gross margin (loss) percentage | 66 | % | 55 | % | 39 | % | |||||||||||
Gross profit (loss) | $ | 67,139 | $ | 41,547 | $ | 17,833 | 62 | % | 133 | % | |||||||
2016 compared to 2015
Cost of subscription revenue increased $4.0 million or 33%, primarily due to a $2.3 million increase in employee-related expenses as we realigned our operations to support our growing customer base, a $0.8 million increase in amortization expense of internally developed software related to our products, $0.6 million increase in third party service fees related to the expansion of our call center and a $0.2 million increase in data cost expense as we continue to invest in data infrastructure to enable more efficient implementations. Overhead expenses allocated into cost of subscription revenue accounted for $0.3 million of the increase, primarily related to an increase in rent expense attributable to new office spaces leased in the prior year.
Cost of professional services revenue decreased $3.3 million or 15%, primarily due to a $1.5 million decrease in third party service fees and contractor expenses as we gained efficiencies in use of internal resources to launch customers and a $1.5 million decrease in employee-related expenses as a result of the reduction in workforce in the second quarter of 2016.
Gross margin for the year ended December 31, 2016 improved primarily due to revenue growth of 35% compared to a 2% growth in the associated costs. We expect to continue to see favorable overall gross margin trends as we continue to grow the number of launched customers in relation to customers in the implementation phase.
2015 compared to 2014
Cost of subscription revenue increased $1.9 million or 19% primarily due to a $1.1 million increase in employee-related expenses as we continued to hire talent to support our growing customer base. Allocated overhead expenses accounted for $0.3 million of the increase, primarily related to an increase in headcount and rent expense attributable to new office spaces leased in the current year. This increase was offset by cost efficiencies gained from data center transition to two relatively lower cost data centers in Colorado and Arizona in mid-2014.
Cost of professional services revenue increased $4.1 million or 23% primarily due to a $3.5 million increase in employee-related expenses as we invested in people, resources and technology to enable more efficient implementations of our existing products and to further expand our ability to work with additional data sources associated with our newest products. In addition, allocated overhead expenses accounted for $0.7 million of the increase, primarily related to an increase in headcount and rent expense attributable to new office spaces leased in the current year.
Gross margin for the year ended December 31, 2015 improved primarily due to revenue growth of 65% compared to a 22% growth in the associated costs. Additionally, the cost of subscription revenue, as a percentage of total revenue, continued to decrease primarily due to certain fixed cost elements such as data center operations representing a smaller proportion of a growing revenue base. We expect to continue to see favorable overall gross margin trends as we continue to grow the number of launched customers in relation to customers in the implementation phase.
42
Sales and Marketing
Year Ended December 31, | |||||||||||||||||
2016 | 2015 | 2014 | 2015 to 2014 % change | 2014 to 2015 % change | |||||||||||||
(in thousands, except percentages) | |||||||||||||||||
Sales and marketing | $ | 58,800 | $ | 67,414 | $ | 62,065 | (13 | )% | 9 | % | |||||||
2016 compared to 2015
Sales and marketing decreased $8.6 million or 13%, primarily due to a $4.1 million decrease in employee-related expenses, a $1.0 million decrease in recruiting expense, and a $0.5 million decrease in travel expenditures, as a result of reduction in force in the second quarter of 2016. In addition, spending on marketing events decreased $3.1 million, as we leveraged our channel relationships in 2016.
2015 compared to 2014
Sales and marketing increased $5.3 million or 9%, primarily attributable to a $9.1 million increase in employee-related expenses as we continued to expand our sales force to address new opportunities and grow our customer base. In addition, allocated overhead expenses accounted for $1.3 million of the increase, primarily related to an increase in headcount and rent expense attributable to new office spaces leased in the current year. This increase was offset by $1.4 million in lower marketing expense due to increased efficiency in program spend and $0.3 million decrease in contractor expense. Also offsetting the increase was the non-recurrence of a $2.6 million charge related to warrants that was recorded in the first half of 2014.
Research and Development
Year Ended December 31, | |||||||||||||||||
2016 | 2015 | 2014 | 2015 to 2016 % change | 2014 to 2015 % change | |||||||||||||
(in thousands, except percentages) | |||||||||||||||||
Research and development | $ | 40,460 | $ | 30,077 | $ | 22,917 | 35 | % | 31 | % | |||||||
2016 compared to 2015
Research and development expense increased $10.4 million or 35%, primarily attributable to a $6.3 million increase in employee-related expenses as we continue to invest in R&D resources to drive innovation and a $2.6 million increase in expense resulting from the non-recurrence of capitalized expenditures that occurred in the prior year. Also contributing to the increase was increase in rent expense of $0.3 million as we entered into a new lease for an R&D facility in 2016 and a $0.3 million increase in expense related to the use of contractors to assist in our development efforts, such as the releases of new features and functionality on existing products.
2015 compared to 2014
Research and development expense increased $7.2 million or 31%, primarily attributable to a $5.6 million increase in employee-related expenses as we continued to hire engineering talent to drive innovation and new products and a $1.3 million increase in expenses related to the use of sub-contractors to assist in our development efforts, such as our monthly releases of new features and functionality on existing products, development of implementation tools and portions of new products such as Castlight Action and Castlight Elevate. In addition, allocated overhead expenses accounted for $1.4 million of the increase, primarily related to an increase in headcount and rent expense attributable to new office spaces leased in the current year. Also contributing to the increase was a $0.6 million reduction in the amount of research and development spend being allocated to launch activities, relative to 2014. These increases were offset by $2.3 million capitalized as internally developed software costs.
General and Administrative
43
Year Ended December 31, | |||||||||||||||||
2016 | 2015 | 2014 | 2015 to 2016 % change | 2014 to 2015 % change | |||||||||||||
(in thousands, except percentages) | |||||||||||||||||
General and administrative | $ | 26,859 | $ | 24,274 | $ | 19,009 | 11 | % | 28 | % | |||||||
2016 compared to 2015
General and administrative expense increased $2.6 million or 11%, primarily attributable to a $2.9 million increase in litigation expenses related to a litigation settlement in 2016 and $1.6 million increase for acquisition costs, related to the ongoing acquisition of Jiff, Inc. The increase was offset by a $1.1 million decrease in contractor expense as we gained the benefit of our systems and infrastructure investments and a $0.7 million decrease in recruiting expense as a result of a decrease in hiring efforts due to the reduction in workforce in the second quarter of 2016.
2015 compared to 2014
General and administrative expense increased $5.3 million or 28%, primarily attributable to a $3.2 million increase in employee-related expenses driven by an increase in headcount, a $2.6 million increase in facilities and IT-related expenses, and a $1.8 million increase in recruiting, accounting, legal and other professional services to support the growth of our business and public company infrastructure. Also contributing to the increase was $0.4 million in insurance fees, $0.3 million in travel and entertainment and $0.2 million in contractor expense. The increase was offset by $3.7 million in allocated overhead expenses, primarily related to an increase in headcount and rent expense attributable to new office spaces leased in the current year
Liquidity and Capital Resources
Year Ended December 31, | |||||||||||
2016 | 2015 | 2014 | |||||||||
(in thousands) | |||||||||||
Net cash used in operating activities | $ | (36,971 | ) | $ | (56,868 | ) | $ | (54,637 | ) | ||
Net cash provided by (used in) investing activities | 46,478 | 54,743 | (142,548 | ) | |||||||
Net cash provided by financing activities | 20,065 | 3,850 | 189,456 | ||||||||
Net increase (decrease) in cash and cash equivalents | $ | 29,572 | $ | 1,725 | $ | (7,729 | ) | ||||
As of December 31, 2016, our principal sources of liquidity were cash, cash equivalents and marketable securities totaling $114.6 million, which were held for working capital purposes. Our cash, cash equivalents and marketable securities are comprised primarily of U.S. agency obligations, U.S. treasury securities and money market funds.
Since our inception, we have financed our operations primarily through sales of equity securities and, to a lesser extent, payments from our customers. We believe that our existing cash, cash equivalents and marketable securities will be sufficient to meet our working capital and capital expenditure needs for at least the next 12 months. Our future capital requirements will depend on many factors including our growth rate, subscription renewal activity, the timing and extent of spending to support development efforts, our expansion of sales and marketing activities, the introduction of new and enhanced services offerings and the continuing market acceptance of our cloud-based products. Other than our agreement to acquire Jiff Inc., we currently are not a party to any agreement and do not have any understanding with any third parties with respect to potential investments in, or acquisitions of, businesses or technologies. However, we may in the future enter into these types of arrangements. We may be required to seek additional equity or debt financing. In the event that additional financing is required from outside sources, we may not be able to raise it on terms acceptable to us, or at all. If we are unable to raise additional capital when desired, our business, operating results and financial condition would be adversely affected.
Operating Activities
For the year ended December 31, 2016, cash used in operating activities was $37.0 million. The negative cash flows resulted primarily from our net loss of $58.5 million, adjusted for $30.7 million in non-cash expenses that primarily included stock-based compensation of $22.0 million, amortization of deferred commissions of $5.1 million, depreciation and
44
amortization of $3.2 million and accretion and amortization on marketable securities of $0.5 million. Working capital uses of cash included a decrease in accrued expenses and other liabilities of $0.3 million, primarily as a result of payout of annual bonuses to our employees, and an increase in accounts receivable of $2.1 million driven by 26% increase in billings year over year and the timing of billings and collections. Deferred commissions also increased by $8.0 million pertaining to the non cancellable portion of contracts signed in the year, as we increased our customer base. Additionally, deferred revenue increased by $1.8 million, primarily attributable to an increase in the amount billed year over year as a result of increased billings for launched customers.
For the year ended December 31, 2015, cash used in operating activities was $56.9 million. The negative cash flows resulted primarily from our net loss of $79.9 million, adjusted for $24.7 million in non-cash expenses that primarily included stock-based compensation of $17.8 million and amortization of deferred commissions of $3.5 million. Working capital uses of cash included a decrease in accrued expenses of $0.5 million, primarily as a result of payout of annual bonuses to our employees, and an increase in accounts receivable of $1.7 million driven by 32% increase in billings year over year and the timing of billings and collections. Additionally, deferred revenue increased by $6.8 million, primarily attributable to an increase in the amount billed year over year as a result of increased billings for launched customers.
For the year ended December 31, 2014, cash used in operating activities was $54.6 million. The negative cash flows resulted primarily from our net loss of $85.9 million, adjusted for $23.8 million in non-cash expenses that primarily included stock-based compensation of $14.2 million, warrant expense of $2.6 million and amortization of deferred commissions of $4.1 million. Working capital uses of cash included an increase in accounts receivable of $6.0 million primarily as a result of overall growth of our business and in part related to the timing of billings and collections. Deferred commissions also increased by $4.9 million pertaining to the noncancellable portion of contracts signed in the year, as we increased our customer base. These increases were offset by an increase in deferred revenue of $15.9 million, as a result of contracts signed in the period with associated upfront fees.
Investing Activities
Cash provided by (used in) investing activities for the years ended December 31, 2016, 2015, and 2014 was $46.5 million, $54.7 million, and $(142.5) million respectively. The increase in cash provided (used in) was primarily the result of the timing of purchases, sales and maturities of marketable securities, the net result of which was $48.3 million, $65.2 million and $(140.8) million for the years ended December 31, 2016, 2015 and 2014, respectively. This increase for 2016 was partially offset by $1.7 million in purchases of property, plant and equipment, which includes leasehold improvements for our new facilities. This increase for 2015 was partially offset by a total investment of $4.1 million in Lyra Health, a behavioral health technology company, and $5.4 million in purchases of property, plant and equipment, which includes leasehold improvements for our new facilities.
Financing Activities
For the year ended December 31, 2016, financing activities provided $20.1 million, primarily from cash proceeds resulting from issuance of stock under our equity incentive plans. For the year ended December 31, 2015, financing activities provided $3.9 million, primarily from cash proceeds resulting from issuance of stock under our equity incentive plans. For the year ended December 31, 2014, financing activities provided $189.5 million primarily related to the proceeds from our initial public offering in March 2014.
Backlog
We have generally signed multiple-year subscription contracts for our cloud-based subscription services. The timing of our invoices to the customer is a negotiated term and thus varies among our subscription contracts. For multiple-year agreements, it is common to invoice an initial amount at contract signing for implementation work that is deferred followed by subsequent annual, quarterly or monthly invoices, once we launch a customer, which is when our product is usable by the customer. At any point in the contract term, there can be amounts that we are not yet contractually able to invoice. Until such time as these amounts are invoiced, they are not recorded in revenue, deferred revenue or elsewhere in our consolidated financial statements and are considered by us to be backlog. The amount of our total backlog for subscription and professional services contracts, which we define as including both cancellable and noncancellable portions of our customer agreements that we have not yet billed, was approximately $197.6 million as of December 31, 2016 and $219.2 million as of December 31, 2015. Our total backlog does not take into account contractual provisions that give customers a right to terminate their agreements with us. The amount of our backlog for subscription and professional services contracts was approximately
45
$90.5 million at December 31, 2016 and $111.0 million as of December 31, 2015, respectively, for the noncancellable portions of our customer agreements that we have not yet billed. We fulfill backlog associated with a customer contract when the customer implementation process is complete. Our implementation timelines can vary between three and nine months for our core Castlight platform and from approximately three to twelve months for our other products, based on the source and condition of the data we receive from third parties, the configurations that we agree to provide and the size of the customer and therefore, are subject to significant uncertainties, which can have a material impact on our total backlog and noncancellable backlog that we fulfill in the current year.
We expect that the amount of our backlog relative to the total value of our contracts will change from period to period for several reasons, including the amount of cash collected early in the contract term, the specific timing and duration of large customer subscription agreements, varying invoicing cycles of subscription agreements, potential customer upsells dependent on our customer agreements, the specific timing of customer renewals and changes in customer financial circumstances. Accordingly, we believe that fluctuations in our backlog may not be a reliable indicator of our future revenue.
Contractual Obligations and Commitments
Our principal commitments primarily consist of obligations under leases for office space and co-location facilities for data center capacity. As of December 31, 2016, the future noncancelable minimum payments under these commitments were as follows (in thousands):
Total | Less Than 1 Year | 1-3 Years | 3-5 Years | More Than 5 Years | |||||||||||||||
Operating leases for facilities(1) | $ | 12,014 | $ | 2,651 | $ | 4,290 | $ | 4,102 | $ | 971 | |||||||||
Data center costs(2) | 1,963 | 714 | 1,249 | — | — | ||||||||||||||
Total | 13,977 | 3,365 | 5,539 | 4,102 | 971 | ||||||||||||||
(1) | Operating leases for facilities space represents our principal commitments, which consists of obligations under leases for office space. Minimum payments have not been reduced by sublease rentals of $1.3 million due in the future under a noncancelable sublease. |
(2) | Data center costs represent costs associated with service agreements for our data centers in Colorado and Arizona. |
Our existing lease agreements provide us with the option to renew and generally provide for rental payments on a graduated basis. Our future operating lease obligations would change if we entered into additional operating lease agreements as we expand our operations and if we exercised these options. Contractual obligations represent future cash commitments and liabilities under agreements with third parties and exclude purchase orders for goods and services. Purchase orders are not included in the table above. Our purchase orders represent authorizations to purchase rather than binding agreements. The contractual commitment amounts in the table above are associated with agreements that are enforceable and legally binding and that specify all significant terms, including fixed or minimum services to be used, fixed, minimum or variable price provisions and the approximate timing of the transaction. Obligations under contracts that we can cancel without a significant penalty are not included in the table above.
Off-Balance Sheet Arrangements
During the periods presented, we did not have, nor do we currently have, any relationships with unconsolidated entities or financial partnerships, such as entities often referred to as structured finance or special purpose entities, which would have been established for the purpose of facilitating off-balance sheet arrangements or other contractually narrow or limited purposes. We are therefore not exposed to the financing, liquidity, market or credit risk that could arise if we had engaged in those types of relationships.
Critical Accounting Policies and Estimates
Our consolidated financial statements are prepared in accordance with accounting principles generally accepted in the United States. The preparation of these consolidated financial statements requires us to make estimates and assumptions that affect the reported amounts of assets, liabilities, revenue, costs and expenses and related disclosures. On an ongoing basis, we
46
evaluate our estimates and assumptions. Our actual results may differ from these estimates under different assumptions or conditions.
We believe that of our significant accounting policies, which are described in Note 2 to our consolidated financial statements, involve a greater degree of judgment and complexity. Accordingly, these are the policies that we believe are the most critical to aid in fully understanding and evaluating our consolidated financial condition and results of operations.
Revenue Recognition
We derive our revenue from sales of cloud-based subscription service and professional services contracts. We sell subscriptions to our cloud-based subscription service through contracts that are generally three years in length.
Our cloud-based subscription service contracts do not provide customers with the right to take possession of the software supporting the cloud-based service and, as a result, are accounted for as service contracts.
We commence revenue recognition for our cloud-based subscription service and professional services when all of the following criteria are met:
• | there is persuasive evidence of an arrangement; |
• | the service has been provided to the customer; |
• | collection of the fees is reasonably assured; and |
• | the amount of fees to be paid by the customer is fixed or determinable. |
Our subscription and professional service arrangements do not contain refund provisions for fees earned related to services performed. We do, however, have commitments under service-level agreements, as discussed under "Warranties and Indemnification" in the Notes to Consolidated Financial Statements.
Subscription Revenue. Subscription revenue recognition commences on the date that our cloud-based service is made available to the customer, which is considered the launch date, provided all of the other criteria described above are met. Revenue is recognized based on usage or on a straight-line bases if fees are fixed.
Some of our cloud-based subscription arrangements include performance incentives that are generally based upon employee engagement. Fees for performance incentives are considered contingent revenue, and are recognized over the remaining term of the related subscription arrangement commencing at the time they are earned.
Professional Services Revenue. Professional services revenue is comprised of implementation services and communication services related to our cloud-based subscription service. Nearly all of our professional services are sold on a fixed-fee basis. We do not have standalone value for our implementation services. Accordingly, we recognize implementation services revenue in the same manner as the associated cloud-based subscription service, beginning on the launch date, provided all other criteria described above have been met. Communication services revenue is recognized over the contractual term, generally one year, commencing when the revenue recognition criteria have been met.
Multiple Deliverable Arrangements. To date, we have generated substantially all our revenue from multiple deliverable arrangements consisting of multi-year cloud-based subscription services and professional services, including implementation services and communication services. For arrangements with multiple deliverables, we evaluate whether the individual deliverables qualify as separate units of accounting. In order to treat deliverables in a multiple deliverable arrangement as separate units of accounting, the deliverables must have standalone value upon delivery. If the deliverables have standalone value upon delivery, we account for each deliverable separately and revenue is recognized for the respective deliverables as they are delivered. If one or more of the deliverables do not have standalone value upon delivery, the deliverables that do not have standalone value are generally combined with our cloud-based subscription service, and revenue for the combined unit is recognized over the remaining term of the cloud-based subscription service.
Our deliverables have standalone value if we or any other vendor sells a similar service separately. We have concluded that we have standalone value for our cloud-based subscription service as we sell these services separately through renewals and for our communication services as other vendors sell similar services separately. Conversely, we have concluded that our implementation services do not have standalone value, as we and others do not yet sell these services separately. Accordingly,
47
we consider the separate units of accounting in our multiple deliverable arrangements to be the communication services and a combined deliverable comprised of cloud-based subscription services and implementation services.
When multiple deliverables included in an arrangement are separable into different units of accounting, the arrangement consideration is allocated to the identified separate units of accounting based on their relative selling price. Multiple deliverable arrangements accounting guidance provides a hierarchy to use when determining the relative selling price for each unit of accounting. Vendor-specific objective evidence, or VSOE, of selling price, based on the price at which the item is regularly sold by the vendor on a standalone basis, should be used if it exists. If VSOE of selling price is not available, third-party evidence, or TPE, of selling price is used to establish the selling price if it exists. If TPE does not exist, we estimate the best estimated selling price, or BESP. VSOE does not currently exist for any of our deliverables. Additionally, we do not believe TPE is a practical alternative due to differences in our cloud-based subscription service compared to other parties and the availability of relevant third-party pricing information for our cloud-based subscription service and our other services. Accordingly, for arrangements with multiple deliverables that can be separated into different units of accounting, we allocate the arrangement fee to the separate units of accounting based on our BESP. The amount of arrangement fee allocated is limited by contingent revenue, if any.
We determine BESP for our deliverables by considering our overall pricing objectives and market conditions. This includes evaluating our pricing practices, our target prices, the size of our transactions, historical sales and our go-to-market strategy. The determination of BESP is made through consultation with and approval by management. For financial statement presentation purposes, we allocate the fees from our combined units of accounting to subscription and professional services based upon their relative selling price.
Deferred Commissions
Deferred commissions are the incremental costs that are directly associated with the noncancellable portion of cloud-based subscription service contracts with customers and consist of sales commissions paid to our direct sales force and channel partners. The commissions are deferred and amortized over the noncancellable terms of the related contracts. The deferred commission amounts are recoverable through the future revenue streams under the noncancellable customer contracts. Amortization of deferred commissions is included in sales and marketing expense in the consolidated statements of operations.
Stock-Based Compensation
Compensation expense related to stock-based transactions, including employee, consultant and non-employee director stock option awards, is measured and recognized in the financial statements based on fair value. The fair value of each option award is estimated on the grant date using the Black-Scholes option-pricing model. The stock-based compensation expense, net of forfeitures, is recognized using a straight-line basis over the requisite service periods of the awards, which is generally four years. For restricted stock units, fair value is based on the closing price of our Class B common stock on the grant date. For awards with performance based and service vesting conditions, compensation cost is recognized over the requisite service period if it is probable that the performance condition will be satisfied based on the accelerated attribution method.
Our option-pricing model requires the input of highly subjective assumptions, including the fair value of the underlying common stock, the expected term of the option, the expected volatility of the price of our common stock, risk-free interest rates and the expected dividend yield of our common stock. The assumptions used in our option-pricing model represent management’s best estimates. These estimates involve inherent uncertainties and the application of management’s judgment. If factors change and different assumptions are used, our stock-based compensation expense could be materially different in the future.
Please refer to Note 9 of the Notes to the Consolidated Financial Statements for assumptions used in our option-pricing model.
Adoption of New and Recently Issued Accounting Pronouncements
Please refer to Note 2 of the Notes to the Consolidated Financial Statements for a discussion of adoption of new and recently issued accounting pronouncements.
48
Item 7A. Quantitative and Qualitative Disclosures About Market Risk
Interest Rate Sensitivity
We had cash, cash equivalents and marketable securities totaling $114.6 million at December 31, 2016 and $133.8 million as of December 31, 2015. This amount was invested primarily in U.S. agency obligations, U.S. treasury securities and money market funds. The cash, cash equivalents and short-term marketable securities are held for working capital purposes. Our investments are made for capital preservation purposes. We do not enter into investments for trading or speculative purposes. All our investments are denominated in U.S. dollars.
Our cash equivalents and our portfolio of marketable securities are subject to market risk due to changes in interest rates. Fixed rate securities may have their market value adversely affected due to a rise in interest rates, while floating rate securities may produce less income than expected if interest rates fall. Due in part to these factors, our future investment income may fall short of expectations due to changes in interest rates or we may suffer losses in principal if we are forced to sell securities that decline in market value due to changes in interest rates. However, because we classify our marketable securities as “available for sale”, no gains or losses are recognized due to changes in interest rates unless such securities are sold prior to maturity or declines in fair value are determined to be other-than-temporary. Our fixed-income portfolio is subject to interest rate risk.
An immediate increase of 100-basis points in interest rates would have resulted in a $0.1 million market value reduction in our investment portfolio as of December 31, 2016. All of our investments earn less than 100-basis points and as a result, an immediate decrease of 100-basis points in interest rates would have increased the market value by $0.1 million as of December 31, 2016. This estimate is based on a sensitivity model that measures market value changes when changes in interest rates occur. Fluctuations in the value of our investment securities caused by a change in interest rates (gains or losses on the carrying value) are recorded in other comprehensive income, and are realized only if we sell the underlying securities.
49
Item 8. Financial Statements
CASTLIGHT HEALTH, INC. | |
INDEX TO CONSOLIDATED FINANCIAL STATEMENTS | |
Page | |
50
Report of Independent Registered Public Accounting Firm
The Board of Directors and Stockholders
Castlight Health, Inc.
We have audited the accompanying consolidated balance sheets of Castlight Health, Inc. as of December 31, 2016 and 2015, and the related consolidated statements of operations, comprehensive loss, convertible preferred stock and stockholders' (deficit)/equity and cash flows for each of the three years in the period ended December 31, 2016. These financial statements are the responsibility of the Company's management. Our responsibility is to express an opinion on these financial statements based on our audits.
We conducted our audits in accordance with the standards of the Public Company Accounting Oversight Board (United States). Those standards require that we plan and perform the audit to obtain reasonable assurance about whether the financial statements are free of material misstatement. We were not engaged to perform an audit of the Company’s internal control over financial reporting. Our audits included consideration of internal control over financial reporting as a basis for designing audit procedures that are appropriate in the circumstances, but not for the purpose of expressing an opinion on the effectiveness of the Company’s internal control over financial reporting. Accordingly, we express no such opinion. An audit also includes examining, on a test basis, evidence supporting the amounts and disclosures in the financial statements, assessing the accounting principles used and significant estimates made by management, and evaluating the overall financial statement presentation. We believe that our audits provide a reasonable basis for our opinion.
In our opinion, the financial statements referred to above present fairly, in all material respects, the consolidated financial position of Castlight Health, Inc. at December 31, 2016 and 2015, and the consolidated results of its operations and its cash flows for each of the three years in the period ended December 31, 2016, in conformity with U.S. generally accepted accounting principles.
/s/ Ernst & Young LLP
San Francisco, California
March 1, 2017
51
CASTLIGHT HEALTH, INC.
CONSOLIDATED BALANCE SHEETS
(In thousands)
As of December 31, | |||||||
2016 | 2015 | ||||||
Assets | |||||||
Current assets: | |||||||
Cash and cash equivalents | $ | 48,722 | $ | 19,150 | |||
Marketable securities | 65,882 | 101,274 | |||||
Accounts receivable, net | 14,806 | 12,751 | |||||
Deferred commissions | 8,218 | 5,438 | |||||
Prepaid expenses and other current assets | 3,382 | 3,772 | |||||
Total current assets | 141,010 | 142,385 | |||||
Property and equipment, net | 5,285 | 6,896 | |||||
Marketable securities, noncurrent | — | 13,335 | |||||
Restricted cash, noncurrent | 1,144 | 1,000 | |||||
Deferred commissions, noncurrent | 5,050 | 4,923 | |||||
Other assets | 4,677 | 4,735 | |||||
Total assets | $ | 157,166 | $ | 173,274 | |||
Liabilities and stockholders’ equity | |||||||
Current liabilities: | |||||||
Accounts payable | $ | 2,288 | $ | 3,384 | |||
Accrued expenses and other current liabilities | 6,369 | 4,550 | |||||
Accrued compensation | 9,443 | 11,477 | |||||
Deferred revenue | 30,623 | 26,590 | |||||
Total current liabilities | 48,723 | 46,001 | |||||
Deferred revenue, noncurrent | 5,245 | 7,522 | |||||
Other liabilities, noncurrent | 1,236 | 1,397 | |||||
Total liabilities | 55,204 | 54,920 | |||||
Commitments and contingencies | |||||||
Stockholders’ equity: | |||||||
Preferred stock, $0.0001 par value; 10,000,000 shares authorized as of December 31, 2016 and 2015; no shares issued and outstanding as of December 31, 2016 and 2015 | — | — | |||||
Class A common stock, $0.0001 par value; 200,000,000 shares authorized as of December 31, 2016 and 2015; 54,295,405 and 54,517,785 shares issued and outstanding as of December 31, 2016 and 2015 | 5 | 6 | |||||
Class B common stock, $0.0001 par value; 800,000,000 shares authorized as of December 31, 2016 and 2015; 50,015,518 and 41,100,307 shares issued and outstanding as of December 31, 2016 and 2015 | 5 | 4 | |||||
Additional paid-in capital | 457,596 | 415,519 | |||||
Accumulated other comprehensive loss | — | (79 | ) | ||||
Accumulated deficit | (355,644 | ) | (297,096 | ) | |||
Total stockholders’ equity | 101,962 | 118,354 | |||||
Total liabilities and stockholders’ equity | $ | 157,166 | $ | 173,274 | |||
See Notes to Consolidated Financial Statements.
52
CASTLIGHT HEALTH, INC.
CONSOLIDATED STATEMENTS OF OPERATIONS
(In thousands, except per share data)
Year Ended December 31, | |||||||||||
2016 | 2015 | 2014 | |||||||||
Revenue: | |||||||||||
Subscription | $ | 95,016 | $ | 70,350 | $ | 41,602 | |||||
Professional services | 6,684 | 4,965 | 4,003 | ||||||||
Total revenue | 101,700 | 75,315 | 45,605 | ||||||||
Cost of revenue: | |||||||||||
Cost of subscription (1) | 16,463 | 12,417 | 10,472 | ||||||||
Cost of professional services (1) | 18,098 | 21,351 | 17,300 | ||||||||
Total cost of revenue | 34,561 | 33,768 | 27,772 | ||||||||
Gross profit | 67,139 | 41,547 | 17,833 | ||||||||
Operating expenses: | |||||||||||
Sales and marketing (1) | 58,800 | 67,414 | 62,065 | ||||||||
Research and development (1) | 40,460 | 30,077 | 22,917 | ||||||||
General and administrative (1) | 26,859 | 24,274 | 19,009 | ||||||||
Total operating expenses | 126,119 | 121,765 | 103,991 | ||||||||
Operating loss | (58,980 | ) | (80,218 | ) | (86,158 | ) | |||||
Other income, net | 432 | 298 | 218 | ||||||||
Net loss | $ | (58,548 | ) | $ | (79,920 | ) | $ | (85,940 | ) | ||
Net loss per share, basic and diluted | $ | (0.58 | ) | $ | (0.85 | ) | $ | (1.16 | ) | ||
Weighted-average shares used to compute basic and diluted net loss per share | 100,798 | 93,753 | 74,381 | ||||||||
_______________________
(1) | Includes stock-based compensation expense as follows: |
Year Ended December 31, | |||||||||||
2016 | 2015 | 2014 | |||||||||
Cost of revenue: | |||||||||||
Cost of subscription | $ | 506 | $ | 283 | $ | 180 | |||||
Cost of professional services | 1,961 | 2,175 | 1,220 | ||||||||
Sales and marketing | 8,843 | 7,705 | 5,933 | ||||||||
Research and development | 5,959 | 3,498 | 2,556 | ||||||||
General and administrative | 4,743 | 4,169 | 4,312 | ||||||||
See Notes to Consolidated Financial Statements.
53
CASTLIGHT HEALTH, INC
CONSOLIDATED STATEMENTS OF COMPREHENSIVE LOSS
(In thousands)
Year Ended December 31, | |||||||||||
2016 | 2015 | 2014 | |||||||||
Net loss | $ | (58,548 | ) | $ | (79,920 | ) | $ | (85,940 | ) | ||
Other comprehensive loss: | |||||||||||
Net change in unrealized loss on available-for-sale marketable securities | 79 | (39 | ) | (40 | ) | ||||||
Other comprehensive gain (loss) | 79 | (39 | ) | (40 | ) | ||||||
Comprehensive loss | $ | (58,469 | ) | $ | (79,959 | ) | $ | (85,980 | ) | ||
See Notes to Consolidated Financial Statements.
54
CONSOLIDATED STATEMENTS OF CONVERTIBLE PREFERRED STOCK
AND STOCKHOLDERS’ (DEFICIT)/EQUITY
(In thousands, except share data)
Convertible Preferred Stock | Class A and B Common Stock | Additional Paid-In Capital | Accumulated Other Comprehensive Income (Loss) | Accumulated Deficit | Total Stockholders’ (Deficit)/Equity | ||||||||||||||||||||||||||
Shares | Amount | Shares | Amount | ||||||||||||||||||||||||||||
Balances as of December 31, 2013 | 64,475,633 | $ | 180,423 | 10,994,074 | $ | 1 | $ | 6,885 | $ | — | $ | (131,236 | ) | $ | (124,350 | ) | |||||||||||||||
Vesting of restricted common stock | — | — | — | 21 | — | — | 21 | ||||||||||||||||||||||||
Exercise of stock options, net | — | — | 2,956,676 | 3,294 | — | — | 3,294 | ||||||||||||||||||||||||
Vesting of early exercised warrant issued | — | — | — | — | 300 | — | — | 300 | |||||||||||||||||||||||
Stock-based compensation | — | — | — | — | 14,215 | — | — | 14,215 | |||||||||||||||||||||||
Expense related to warrant | — | — | — | — | 2,639 | — | — | 2,639 | |||||||||||||||||||||||
Conversion of preferred stock to common stock | (64,475,633 | ) | (180,423 | ) | 64,475,633 | 7 | 180,416 | — | — | 180,423 | |||||||||||||||||||||
Issuance of common stock upon initial public offering, net | — | — | 12,765,000 | 1 | 185,627 | — | — | 185,628 | |||||||||||||||||||||||
Comprehensive loss | — | — | — | — | — | (40 | ) | (85,940 | ) | (85,980 | ) | ||||||||||||||||||||
Balances as of December 31, 2014 | — | $ | — | 91,191,383 | $ | 9 | $ | 393,397 | $ | (40 | ) | $ | (217,176 | ) | $ | 176,190 | |||||||||||||||
Vesting of restricted stock units | — | — | 295,468 | — | — | — | — | — | |||||||||||||||||||||||
Exercise of stock options, net | — | — | 4,131,241 | 1 | 3,943 | — | — | 3,944 | |||||||||||||||||||||||
Stock-based compensation | — | — | — | — | 18,179 | — | — | 18,179 | |||||||||||||||||||||||
Comprehensive loss | — | — | — | — | — | (39 | ) | (79,920 | ) | (79,959 | ) | ||||||||||||||||||||
Balances as of December 31, 2015 | — | $ | — | 95,618,092 | $ | 10 | $ | 415,519 | $ | (79 | ) | $ | (297,096 | ) | $ | 118,354 | |||||||||||||||
Vesting of restricted stock units, net | — | — | 1,984,407 | — | — | — | — | ||||||||||||||||||||||||
Exercise of stock options, net | — | — | 1,945,766 | — | 2,829 | — | — | 2,829 | |||||||||||||||||||||||
Stock-based compensation | — | — | — | 22,012 | — | — | 22,012 | ||||||||||||||||||||||||
Issuance of common stock and warrants to SAP, net | — | — | 4,762,658 | 17,236 | — | — | 17,236 | ||||||||||||||||||||||||
Comprehensive loss | — | — | — | — | 79 | (58,548 | ) | (58,469 | ) | ||||||||||||||||||||||
Balances as of December 31, 2016 | — | $ | — | 104,310,923 | $ | 10 | $ | 457,596 | $ | — | $ | (355,644 | ) | $ | 101,962 | ||||||||||||||||
See Notes to Consolidated Financial Statements.
55
CASTLIGHT HEALTH, INC.
CONSOLIDATED STATEMENTS OF CASH FLOWS
(In thousands)
Year Ended December 31, | |||||||||||
2016 | 2015 | 2014 | |||||||||
Operating activities: | |||||||||||
Net loss | $ | (58,548 | ) | $ | (79,920 | ) | $ | (85,940 | ) | ||
Adjustments to reconcile net loss to net cash used in operating activities: | |||||||||||
Depreciation and amortization | 3,168 | 2,024 | 1,354 | ||||||||
Stock-based compensation | 22,012 | 17,830 | 14,201 | ||||||||
Amortization of deferred commissions | 5,070 | 3,510 | 4,092 | ||||||||
Accretion and amortization of marketable securities | 481 | 1,385 | 1,489 | ||||||||
Expense related to warrant | — | — | 2,639 | ||||||||
Changes in operating assets and liabilities: | |||||||||||
Accounts receivable | (2,055 | ) | (1,654 | ) | (6,032 | ) | |||||
Deferred commissions | (7,977 | ) | (7,633 | ) | (4,861 | ) | |||||
Prepaid expenses and other assets | 448 | 328 | (1,895 | ) | |||||||
Accounts payable | (1,035 | ) | 646 | 147 | |||||||
Accrued expenses and other liabilities | 1,743 | (1,158 | ) | 1,870 | |||||||
Deferred revenue | 1,756 | 6,752 | 15,887 | ||||||||
Accrued compensation | (2,034 | ) | 1,022 | 2,412 | |||||||
Net cash used in operating activities | (36,971 | ) | (56,868 | ) | (54,637 | ) | |||||
Investing activities: | |||||||||||
Restricted cash | (144 | ) | (1,000 | ) | 101 | ||||||
Investment in related party | — | (4,125 | ) | — | |||||||
Purchase of property and equipment, net | (1,702 | ) | (5,376 | ) | (1,860 | ) | |||||
Purchase of marketable securities | (98,184 | ) | (119,867 | ) | (230,316 | ) | |||||
Sales of marketable securities | — | 5,000 | 13,000 | ||||||||
Maturities of marketable securities | 146,508 | 180,111 | 76,527 | ||||||||
Net cash provided by (used in) investing activities | 46,478 | 54,743 | (142,548 | ) | |||||||
Financing activities: | |||||||||||
Proceeds from the exercise of stock options and warrants | 2,829 | 3,944 | 3,294 | ||||||||
Proceeds from the issuance of common stock and warrants to SAP | 17,358 | — | — | ||||||||
Proceeds from initial public offering | — | — | 189,943 | ||||||||
Payments of deferred financing costs | (122 | ) | (94 | ) | (3,781 | ) | |||||
Net cash provided by financing activities | 20,065 | 3,850 | 189,456 | ||||||||
Net increase (decrease) in cash and cash equivalents | 29,572 | 1,725 | (7,729 | ) | |||||||
Cash and cash equivalents at beginning of period | 19,150 | 17,425 | 25,154 | ||||||||
Cash and cash equivalents at end of period | $ | 48,722 | $ | 19,150 | $ | 17,425 | |||||
Noncash investing and financing activity: | |||||||||||
Vesting of early exercised stock options, restricted common stock, and warrants | $ | — | $ | — | $ | (321 | ) | ||||
Purchase of property and equipment, accrued but not paid | (20 | ) | (165 | ) | (600 | ) | |||||
Deferred offering costs, accrued but not paid | — | — | (94 | ) | |||||||
See Notes to Consolidated Financial Statements.
56
Note 1. Organization and Description of Business
Description of Business
Castlight Health Inc. ("the Company") offers a health benefits platform that engages employees to make better health care decisions and enables employers to communicate and measure their benefit programs. The Company provides a simple, personalized, and powerful way for employees to shop for and manage their health care. At the same time, the Company enables employers to understand their employees’ needs and guide them to the right care, right providers and right programs at the right time. The Company's comprehensive technology offering aggregates complex, large-scale data and applies sophisticated analytics to make health care data transparent and useful. The Company was incorporated in the State of Delaware in January 2008. The Company's principal executive offices are located in San Francisco, California.
Initial Public Offering
On March 19, 2014, the Company completed its initial public offering (IPO), in which it sold 12.8 million shares of Class B common stock at a price to the public of $16.00 per share. The aggregate offering price for shares sold in the offering was approximately $204.2 million. The Company raised approximately $185.6 million in net proceeds from the offering, after deducting underwriter discounts and commissions of approximately $14.3 million and other offering expenses of approximately $4.3 million.
Note 2. Summary of Significant Accounting Policies
Basis of Presentation and Principles of Consolidation
The consolidated financial statements were prepared in accordance with U.S. generally accepted accounting principles ("GAAP"). In the opinion of management, the information herein reflects all adjustments, consisting only of normal recurring adjustments, except as otherwise noted, considered necessary for a fair statement of results of operations, financial position and cash flows. The consolidated financial statements include the results of Castlight and its wholly owned U.S. subsidiary.
Use of Estimates
The preparation of consolidated financial statements in conformity with GAAP requires the Company to make certain estimates, judgments and assumptions that affect the reported amounts of assets and liabilities and disclosure of contingent assets and liabilities as of the date of the financial statements, as well as the reported amounts of revenue and expenses during the reporting period. These estimates include, but are not limited to, the determination of the relative selling prices for the Company's services and certain assumptions used in the valuation of its equity awards. Actual results could differ from those estimates, and such differences could be material to the Company's consolidated financial position and results of operations.
Segment Information
The Company's chief operating decision maker, its CEO, reviews the financial information presented on a consolidated basis for purposes of allocating resources and evaluating the Company's financial performance. Accordingly, the Company has determined that it operates in a single reportable segment, cloud-based products.
Revenue Recognition
The Company derives its revenue from sales of cloud-based subscription service and professional services contracts. The Company sells subscriptions to its cloud-based subscription service through contracts that are generally three years in length.
The Company's cloud-based subscription service contracts do not provide customers with the right to take possession of the software supporting the cloud-based service and, as a result, are accounted for as service contracts.
The Company commences revenue recognition for its cloud-based subscription service and professional services when all of the following criteria are met:
• | there is persuasive evidence of an arrangement; |
• | the service has been provided to the customer; |
• | collection of the fees is reasonably assured; and |
57
• | the amount of fees to be paid by the customer is fixed or determinable. |
The Company's subscription and professional service arrangements do not contain refund provisions for fees earned related to services performed. The Company does, however, have commitments under service-level agreements, as discussed under "Warranties and Indemnification" below.
Subscription Revenue. Subscription revenue recognition commences on the date that the Company's cloud-based service is made available to the customer, which is considered the launch date, provided all of the other criteria described above are met. Revenue is recognized based on usage or on a straight-line bases if fees are fixed.
Some of the Company's cloud-based subscription arrangements include performance incentives that are generally based upon employee engagement. Fees for performance incentives are considered contingent revenue, and are recognized over the remaining term of the related subscription arrangement commencing at the time they are earned.
Professional Services Revenue. Professional services revenue is primarily comprised of implementation services and communication services related to the Company's cloud-based subscription service. Nearly all of the Company's professional services are sold on a fixed-fee basis. The Company does not have standalone value for its implementation services. Accordingly, the Company recognizes implementation services revenue in the same manner as the associated cloud-based subscription service, beginning on the launch date, provided all other criteria described above have been met. Communication services have standalone value and the associated revenue is recognized over the contractual term, generally one year, commencing when the revenue recognition criteria have been met.
Multiple Deliverable Arrangements. To date, the Company has generated substantially all its revenue from multiple deliverable arrangements consisting of multi-year cloud-based subscription services and professional services, including implementation services and communication services. For arrangements with multiple deliverables, the Company evaluates whether the individual deliverables qualify as separate units of accounting. In order to treat deliverables in a multiple deliverable arrangement as separate units of accounting, the deliverables must have standalone value upon delivery. If the deliverables have standalone value upon delivery, the Company accounts for each deliverable separately and revenue is recognized for the respective deliverables as they are delivered. If one or more of the deliverables do not have standalone value upon delivery, the deliverables that do not have standalone value are generally combined with the Company's cloud-based subscription service, and revenue for the combined unit is recognized over the remaining term of the cloud-based subscription service.
The Company's deliverables have standalone value if we or any other vendor sells a similar service separately. The Company has concluded that it has standalone value for its cloud-based subscription service as it sells these services separately through renewals and for its communication services as other vendors sell similar services separately. Conversely, the Company has concluded that its implementation services do not have standalone value, as the Company and others do not yet sell these services separately. Accordingly, the Company considers the separate units of accounting in its multiple deliverable arrangements to be the communication services and a combined deliverable comprised of cloud-based subscription services and implementation services.
When multiple deliverables included in an arrangement are separable into different units of accounting, the arrangement consideration is allocated to the identified separate units of accounting based on their relative selling price. Multiple deliverable arrangements accounting guidance provides a hierarchy to use when determining the relative selling price for each unit of accounting. Vendor-specific objective evidence, or VSOE, of selling price, based on the price at which the item is regularly sold by the vendor on a standalone basis, should be used if it exists. If VSOE of selling price is not available, third-party evidence, or TPE, of selling price is used to establish the selling price if it exists. If TPE does not exist, the Company estimates the best estimated selling price, or BESP. VSOE does not currently exist for any of its deliverables. Additionally, the Company does not believe TPE is a practical alternative due to differences in its cloud-based subscription service compared to other parties and the availability of relevant third-party pricing information for its cloud-based subscription service and its other services. Accordingly, for arrangements with multiple deliverables that can be separated into different units of accounting, the Company allocates the arrangement fee to the separate units of accounting based on its BESP. The amount of arrangement fee allocated is limited by contingent revenue, if any.
The Company determines BESP for its deliverables by considering its overall pricing objectives and market conditions. This includes evaluating the Company's pricing practices, its target prices, the size of its transactions, historical sales and its go-
58
to-market strategy. The determination of BESP is made through consultation with and approval by management. For financial statement presentation purposes, the Company allocates the fees from its combined units of accounting to subscription and professional services based upon their relative selling price.
Costs of Revenue
Cost of revenue consists of the cost of subscription revenue and cost of professional services revenue.
Cost of subscription revenue primarily consists of data fees, employee-related expenses (including salaries, benefits and stock-based compensation) related to hosting costs of its cloud-based service, cost of subcontractors, expenses for service delivery (which includes call center support), allocated overhead, the costs of data center capacity, amortization of internal-use software and depreciation of owned computer equipment and software. Amortization of internal-use software was $0.9 million and $0.2 million for the years ended December 31, 2016 and 2015, respectively.
Cost of professional services revenue consists primarily of employee-related expenses associated with these services, the cost of subcontractors and travel costs. The time and costs of the Company's customer implementations vary based on the source and condition of the data the Company receive from third parties, the configurations that the Company agrees to provide and the size of the customer.
Cash and Cash Equivalents
Cash and cash equivalents consist of highly liquid investments with original maturities of three months or less from the date of purchase. The Company's cash and cash equivalents generally consist of investments in money market funds and U.S. agency obligations. Cash and cash equivalents are stated at fair value.
Marketable Securities
The Company's marketable securities consist of U.S. agency obligations and U.S. treasury securities, with maturities at the time of purchase of greater than three months. Marketable securities with remaining maturities in excess of one year are classified as noncurrent. The Company classifies its marketable securities as available-for-sale at the time of purchase based on its intent and are recorded at their estimated fair value. Unrealized gains and losses for available-for-sale securities are recorded in other comprehensive loss. The Company evaluates its investments to assess whether those with unrealized loss positions are other than temporarily impaired. The Company consider impairments to be other than temporary if they are related to deterioration in credit risk or if it is likely it will sell the securities before the recovery of their cost basis. Realized gains and losses and declines in value judged to be other than temporary are determined based on the specific identification method and are reported in other income, net in the consolidated statements of operations.
Accounts Receivable and Allowance for Doubtful Accounts
Accounts receivable are recorded at the invoiced amount, net of allowances for doubtful accounts. The allowance for doubtful accounts is based on the Company's assessment of the collectability of accounts. The Company regularly reviews the adequacy of the allowance for doubtful accounts by considering the age of each outstanding invoice and the collection history of each customer to determine whether a specific allowance is appropriate. Accounts receivable deemed uncollectable are charged against the allowance for doubtful accounts when identified. For all periods presented, the allowance for doubtful accounts was not significant.
Deferred Commissions
Deferred commissions are the incremental costs that are directly associated with the noncancellable portion of cloud-based subscription service contracts with customers and consist of sales commissions paid to the Company's direct sales force and channel partners. The commissions are deferred and amortized over the noncancellable terms of the related contracts. The deferred commission amounts are recoverable through the future revenue streams under the noncancellable customer contracts. Amortization of deferred commissions is included in sales and marketing expense in the consolidated statements of operations.
Property and Equipment
59
Property and equipment are stated at cost less accumulated depreciation. Depreciation is recorded using the straight-line method over the estimated useful lives of the respective asset as follows:
Software | 3–5 years | |
Computer equipment | 3 years | |
Furniture and equipment | 5–7 years | |
Leasehold improvements | Shorter of the lease term or the estimated useful lives of the improvements | |
Maintenance and repairs are charged to expense as incurred, and improvements are capitalized. When assets are retired or otherwise disposed of, the cost and accumulated depreciation are removed from the accounts, and any resulting gain or loss is reflected in the consolidated statement of operations for the period realized.
Restricted Cash
Restricted cash consists of a letter of credit related to the Company's leased office space.
Internal-use Software
For the Company's development costs related to its cloud-based service, the Company capitalizes costs incurred during the application development stage. Costs related to preliminary project and post-implementation stages are expensed as incurred. Capitalized software development costs are included as part of property, plant and equipment and are amortized on a straight-line basis over the technology's estimated useful life, which is generally three years. The amortization expense is recorded as a component of cost of subscription revenue.
The Company did not have any capitalized software development costs for the year ended December 31, 2016. Capitalized software development cost was $2.6 million for the year ended December 31, 2015.
Deferred Revenue
Deferred revenue consists of professional services and cloud-based subscription services that have been billed in advance of revenue being recognized. Additionally, deferred revenue consists of professional services that have been billed and delivered but the revenue is being deferred and recognized together with a cloud-based subscription contract as a combined unit of accounting. The Company invoices its customers for its cloud-based subscription services based on the terms of the contract, which can be annual, quarterly or monthly installments. The Company invoices its customers for its professional services and the first year of communication services generally at contract execution. Deferred revenue that is anticipated to be recognized during the succeeding 12-month period is recorded as current deferred revenue, and the remaining portion is recorded as noncurrent.
Stock-based Compensation
All stock-based compensation to employees is measured based on the grant-date fair value of the awards and recognized in the Company's consolidated statements of operations over the period during which the employee is required to perform services in exchange for the award (generally the vesting period of the award). The Company estimates the fair value of stock options granted using the Black-Scholes option valuation model. For restricted stock units, fair value is based on the closing price of the Company's Class B common stock on the grant date. Compensation expense is recognized over the vesting period of the applicable award using the straight-line method. For awards with performance based and service vesting conditions, compensation cost is recognized over the requisite service period if it is probable that the performance condition will be satisfied based on the accelerated attribution method.
Compensation expense for non-employee stock options and warrants is calculated using the Black-Scholes option-pricing model and is recorded as the options vest. Options subject to vesting are required to be periodically revalued over their service period, which is generally the same as the vesting period.
Income Taxes
The Company accounts for income taxes using the liability method, under which deferred tax assets and liabilities are determined based on the future tax consequences attributable to differences between the financial reporting carrying amounts of existing assets and liabilities and their respective tax bases and tax credit and net operating loss carryforwards. Deferred tax
60
assets and liabilities are measured using the enacted tax rates that are expected to be in effect when the differences are expected to reverse.
The Company assesses the likelihood that deferred tax assets will be recovered from future taxable income, and a valuation allowance is established when necessary to reduce deferred tax assets to the amounts more likely than not expected to be realized.
The Company recognizes and measures uncertain tax positions using a two-step approach. The first step is to evaluate the tax position taken or expected to be taken by determining if the weight of available evidence indicates that it is more likely than not that the tax position will be sustained in an audit, including resolution of any related appeals or litigation processes. The second step is to measure the tax benefit as the largest amount that is more than 50% likely to be realized upon ultimate settlement. Significant judgment is required to evaluate uncertain tax positions. The Company evaluates its uncertain tax positions on a regular basis. The Company's evaluations are based on a number of factors, including changes in facts and circumstances, changes in tax law, correspondence with tax authorities during the course of audit and effective settlement of audit issues.
Warranties and Indemnification
The Company's cloud-based service is generally warranted to be performed in a professional manner and in a manner that will comply with the terms of the customer agreements.
The Company's arrangements generally include certain provisions for indemnifying customers against liabilities if there is a breach of a customer’s data or if the Company's service infringes a third party’s intellectual property rights. To date, the Company has not incurred any material costs as a result of such indemnifications and have not accrued any liabilities related to such obligations in the financial statements. The Company has entered into service-level agreements with certain customers warranting, among other things, defined levels of performance and response times and permitting those customers to receive credits for prepaid amounts related to subscription services in the event that the Company fails to meet those levels. To date, the Company has not experienced any significant failures to meet defined levels of performance and response times as a result of those agreements.
The Company has also agreed to indemnify its directors and executive officers for costs associated with any fees, expenses, judgments, fines and settlement amounts incurred by any of these persons in any action or proceeding to which any of those persons is, or is threatened to be, made a party by reason of the person’s service as a director or officer, including any action by the Company, arising out of that person’s services as its director or officer or that person’s services provided to any other company or enterprise at the Company's request. The Company maintains director and officer insurance coverage that would generally enable the Company to recover a portion of any future amounts paid. The Company may also be subject to indemnification obligations by law with respect to the actions of its employees under certain circumstances and in certain jurisdictions.
Advertising Expenses
Advertising is expensed as incurred. Advertising expense was $0.6 million, $0.4 million and $0.7 million for the years ended December 31, 2016, 2015 and 2014, respectively.
Concentrations of Risk and Significant Customers
The Company's financial instruments that are exposed to concentrations of credit risk consist primarily of cash and cash equivalents, marketable securities and accounts receivable. Although the Company deposits its cash with multiple financial institutions, its deposits, at times, may exceed federally insured limits.
The Company serves its customers and users from outsourced data center facilities located in Colorado and Arizona. The Company has internal procedures to restore all of its production customer facing services in the event of disasters at the Colorado facility. Procedures utilizing currently deployed hardware, software and services at the Company's disaster recovery location in Arizona allow its cloud-based service to be restored within 48 hours during the implementation of the procedures to restore services.
Revenue from customers representing 10% or more of total revenue for the respective years, is summarized as follows:
61
Year Ended December 31, | |||||||
2016 | 2015 | 2014 | |||||
Revenue: | |||||||
Customer A | 10 | % | * | 14 | % | ||
* Less than 10%
During the years ended December 31, 2016, 2015 and 2014, all of the Company's revenue was generated by customers located in the United States.
Accounts receivable from customers representing 10% or more of total accounts receivable as of the respective dates is summarized as follows:
As of December 31, | |||||
2016 | 2015 | ||||
Accounts Receivable: | |||||
Customer B | 18 | % | 19 | % | |
* Less than 10%
Recently Issued and Adopted Accounting Pronouncements
Statement of Cash Flows
In November 2016, the Financial Accounting Standards Board (“FASB”) issued ASU 2016-18, “Statement of Cash Flows”. The standard requires that a statement of cash flows explain the change during the period in the total of cash, cash equivalents, and amounts generally described as restricted cash or restricted cash equivalents. The standard will become effective for the Company beginning January 1, 2018, and early adoption is permitted. At this point in time, the Company does not intend to adopt the standard early. Based on the Company’s evaluation, the standard will not have a material impact on its consolidated financial statements.
Consolidation
In October 2016, the Financial Accounting Standards Board (“FASB”) issued ASU 2016-17, “Consolidation”. The standard addresses how companies evaluate whether a reporting entity is the primary beneficiary of a VIE by changing how the reporting entity that is a single decision maker of a VIE treats indirect interests in the entity held through related parties that are under common control with the reporting entity. The standard will become effective for the Company beginning January 1, 2017. The Company has evaluated the accounting, transition and disclosure requirements of the standard and does not believe the standard will have a material impact on its consolidated financial statements.
Classification of Certain Cash Receipts and Cash Payments
In August 2016, the Financial Accounting Standards Board (“FASB”) issued Accounting Standards Update (“ASU”) 2016-1, “Classification of Certain Cash Receipts and Cash Payments.” The guidance clarifies how entities should classify certain cash receipts and cash payments on the statement of cash flows and how the predominance principle should be applied when cash receipts and cash payments have aspects of more than one class of cash flows. This guidance will be effective for the Company beginning January 1, 2018 and earlier adoption is permitted in any interim period. The Company is evaluating the accounting, transition and disclosure requirements of the standard and cannot currently estimate the financial statement impact of adoption. At this point in time, the Company does not intend to adopt the standard early.
Stock-based Compensation
In March 2016, the FASB issued ASU 2016-09, “Compensation-Stock Compensation: Improvements to Employee Share-Based Payment.” The guidance will change how companies account for certain aspects of share-based payments to employees. The standard is intended to simplify several areas of accounting for share-based compensation arrangements, including the income tax impact, classification on the statement of cash flows and forfeitures. The standard is effective for
62
fiscal years, and interim periods within those years, beginning after December 15, 2016, and early adoption is permitted in any interim or annual period. Accordingly, the standard is effective for the Company beginning January 1, 2017, and the Company has elected not to early adopt. Based on the Company’s evaluation, the standard will not have a material impact on its consolidated financial statements.
Leases
In February 2016, the FASB issued ASU 2016-02, “Leases.” The guidance will require lessees to put all leases on their balance sheets, whether operating or financing, while continuing to recognize the expenses on their income statements in a manner similar to current practice. The guidance states that a lessee would recognize a lease liability for the obligation to make lease payments and a right-to-use asset for the right to use the underlying asset for the lease term. The guidance will be effective for the Company beginning January 1, 2019 and early adoption is permitted. The Company is evaluating the accounting, transition and disclosure requirements of the standard and cannot currently estimate the financial statement impact of adoption. At this point in time, the Company does not intend to adopt the standard early.
Financial Instruments
In January 2016, the FASB issued ASU 2016-1, “Financial Instruments.” The guidance provides a new measurement alternative for equity investments that don’t have readily determinable fair values and don’t qualify for the net asset value practical expedient. Under this alternative, these investments can be measured at cost, less any impairment, plus or minus changes resulting from observable price changes in orderly transactions for the identical or a similar investment if the same issuer. This guidance will be effective for the Company beginning January 1, 2018 and earlier adoption is not permitted. The Company is evaluating the accounting, transition and disclosure requirements of the standard and cannot currently estimate the financial statement impact of adoption at this point in time.
Cloud Computing Arrangements
In April 2015, the FASB issued ASU 2015-05, “Customer’s Accounting for Fees Paid in a Cloud Computing Arrangement.” The guidance is intended to help entities evaluate the accounting for fees paid by a customer in a cloud computing arrangement, primarily to determine whether the arrangement includes a sale or license of software. The Company adopted this guidance on January 1, 2016 and the standard did not have a material impact on its consolidated financial statements.
Revenue Recognition
In May 2014, the FASB issued ASU 2014-09, Revenue from Contracts with Customers, and has since updated the ASU. This ASU replaces existing revenue recognition standards with a comprehensive revenue measurement and recognition standard and expanded disclosure requirements. The new standard will be effective for the Company beginning January 1, 2018 with early adoption permitted beginning January 1, 2017. The Company has elected not to early adopt the new standard.
The new standard permits two methods of adoption: retrospectively to each prior reporting period presented (full retrospective method), or retrospectively with the cumulative effect of initially applying the guidance recognized at the date of initial application (modified retrospective method). The Company currently plans to adopt under the full retrospective method. However, a final decision regarding the adoption method has not been finalized at this time.
The Company is in the initial stages of its assessment of the impact of the new standard on its accounting policies, processes, and controls, including system requirements. The Company has assigned internal resources and has also engaged a third party service provider to assist in its assessment.
Based on its assessment to date, the Company currently believes a significant impact from the adoption of the new standard will be related to the Company’s costs to fulfill as well as its costs to obtain contracts with customers. For fulfilment costs, the new standard states that an entity shall recognize an asset from the costs incurred to fulfill a contract if certain criteria are met. The Company believes these criteria will be met and these costs will be recognized as an asset under the new standard. The costs to fulfill a contract that are recognized as an asset are then amortized on a systematic basis that is consistent with the transfer to the customer of the goods or services to which the asset relates. The Company currently expenses costs to fulfill a contract when they are incurred. Similar to fulfillment costs, for costs to obtain a contract (which are primarily sales
63
commissions), the standard states that costs to obtain a contract shall be amortized on a systematic basis that is consistent with the transfer to the customer of the goods or services to which the asset relates. The Company currently capitalizes certain sales commissions and amortizes those costs over the non-cancelable portion of its subscription contracts. Under the new standard, the amortization period for the Company’s costs to obtain a contract could be longer. Lastly, based on its assessment, the Company currently believes areas of impact related to the Company’s revenue recognition will be related to the estimation of variable consideration, the accounting for contract modifications, and the allocation of the transaction price to the Company’s multiple performance obligations.
While the Company continues to assess the potential impacts of the new standard, including the areas described above, and anticipates the standard could have a material impact on its consolidated financial statements, the Company does not know or cannot reasonably estimate quantitative information related to the impact of the new standard on the Company’s financial statements at this time.
Note 3. Marketable Securities
At December 31, 2016 and December 31, 2015, respectively, marketable securities consisted of the following (in thousands):
Amortized Cost | Unrealized Gains | Unrealized Losses | Fair Value | ||||||||||||
December 31, 2016 | |||||||||||||||
U.S. treasury securities | $ | 37,864 | $ | — | $ | (2 | ) | $ | 37,862 | ||||||
U.S. agency obligations | 33,019 | 5 | (3 | ) | 33,021 | ||||||||||
Money market mutual funds | 7,965 | — | 7,965 | ||||||||||||
78,848 | 5 | (5 | ) | 78,848 | |||||||||||
Included in cash and cash equivalents | 12,966 | — | 12,966 | ||||||||||||
Included in marketable securities | $ | 65,882 | $ | 5 | $ | (5 | ) | $ | 65,882 | ||||||
Amortized Cost | Unrealized Gains | Unrealized Losses | Fair Value | ||||||||||||
December 31, 2015 | |||||||||||||||
U.S. agency obligations | $ | 83,763 | $ | — | $ | (48 | ) | $ | 83,715 | ||||||
U.S. treasury securities | 33,924 | — | (31 | ) | 33,893 | ||||||||||
Money market mutual funds | 1,038 | — | — | 1,038 | |||||||||||
118,725 | — | (79 | ) | 118,646 | |||||||||||
Included in cash and cash equivalents | 4,038 | — | (1 | ) | 4,037 | ||||||||||
Included in marketable securities | $ | 101,334 | $ | — | $ | (60 | ) | $ | 101,274 | ||||||
Included in marketable securities, noncurrent | $ | 13,353 | $ | — | $ | (18 | ) | $ | 13,335 | ||||||
Note 4. Fair Value Measurements
The Company measures its financial assets and liabilities at fair value at each reporting period using a fair value hierarchy that requires that the Company maximizes the use of observable inputs and minimize the use of unobservable inputs when measuring fair value. A financial instrument’s classification within the fair value hierarchy is based upon the lowest level of input that is significant to the fair value measurement. Three levels of inputs may be used to measure fair value:
Level 1—Observable inputs that reflect quoted prices (unadjusted) for identical assets or liabilities in active markets.
Level 2—Include other inputs that are directly or indirectly observable in the marketplace.
64
Level 3—Unobservable inputs that are supported by little or no market activity.
The fair value of marketable securities included in the Level 2 category is based on observable inputs, such as quoted prices for similar assets at the measurement date; quoted prices in markets that are not active; or other inputs that are observable, either directly or indirectly. These values were obtained from a third-party pricing service and were evaluated using pricing models that vary by asset class and may incorporate available trade, bid and other market information and price quotes from well-established third party pricing vendors and broker-dealers. There have been no changes in valuation techniques in the periods presented. The Company has no financial assets or liabilities measured using Level 3 inputs. There were no significant transfers between Levels 1 and 2 assets as of December 31, 2016 and December 31, 2015. The following tables present information about the Company's assets that are measured at fair value on a recurring basis using the above input categories (in thousands):
Level 1 | Level 2 | Total | |||||||||
December 31, 2016 | |||||||||||
Cash equivalents: | |||||||||||
Money market mutual funds | $ | 7,965 | $ | — | $ | 7,965 | |||||
U.S. treasury securities | — | 5,000 | 5,000 | ||||||||
Marketable securities: | |||||||||||
U.S. agency obligations | — | 33,021 | 33,021 | ||||||||
U.S. treasury securities | — | 32,862 | 32,862 | ||||||||
$ | 7,965 | $ | 70,883 | $ | 78,848 | ||||||
Level 1 | Level 2 | Total | |||||||||
December 31, 2015 | |||||||||||
Cash equivalents: | |||||||||||
Money market mutual funds | $ | 1,038 | $ | — | $ | 1,038 | |||||
U.S. agency obligations | — | 3,000 | 3,000 | ||||||||
Marketable securities: | |||||||||||
U.S. agency obligations | — | 80,715 | 80,715 | ||||||||
U.S. treasury securities | — | 33,893 | 33,893 | ||||||||
$ | 1,038 | $ | 117,608 | $ | 118,646 | ||||||
Gross unrealized gains and losses for cash equivalents and marketable securities as of December 31, 2016 and December 31, 2015 were not material. The Company does not believe the unrealized losses represent other-than-temporary impairments based on its evaluation of available evidence as of December 31, 2016.
There were no realized gains or losses for the years ended December 31, 2016 and 2015. As of December 31, 2016 and 2015 those securities with maturities at the time of purchase of greater than one year are reflected in the noncurrent portion of the Company's consolidated balance sheets. Marketable securities on the balance sheets consist of securities with original or remaining maturities at the time of purchase of greater than three months, and the remainder of the securities is reflected in cash and cash equivalents. As of December 31, 2016, all of the Company's marketable securities mature within one year.
Note 5. Property and Equipment
Property and equipment consisted of the following (in thousands):
65
As of December 31, | |||||||
2016 | 2015 | ||||||
Leasehold improvements | $ | 2,061 | $ | 2,046 | |||
Computer equipment | 5,487 | 4,345 | |||||
Software | 1,099 | 885 | |||||
Internal-use software | 2,925 | 2,925 | |||||
Furniture and equipment | 931 | 853 | |||||
Total | 12,503 | 11,054 | |||||
Accumulated depreciation | (7,218 | ) | (4,158 | ) | |||
Property and equipment, net | $ | 5,285 | $ | 6,896 | |||
Depreciation and amortization expense for the years ended December 31, 2016, 2015 and 2014 was $3.2 million, $2.0 million and $1.4 million, respectively. Depreciation is recorded on a straight-line basis.
Note 6. Related Party Transactions and Variable Interest Entity
In the second quarter of 2015, the Company announced a strategic alliance with Lyra Health ("Lyra"), to develop and bring to market an integrated behavioral health solution. In connection with this strategic alliance, the Company made an initial preferred stock investment in Lyra of $3.1 million and its chief executive officer, Dr. Colella, joined the Lyra board. Additionally, the Company made a subsequent preferred stock investment in Lyra of $1.0 million in August 2015. In March 2016, the Company amended the strategic alliance to modify the manner in which the Company collaborates with Lyra on the solution. In connection with this amendment, Dr. Colella ceased service on the Lyra board of directors.
Lyra is considered a related party to the Company because two of the Company’s directors, Dr. Roberts and Mr. Ebersman, serve on the Lyra board of directors and Mr. Ebersman is the Lyra chief executive officer. An independent committee of the Company’s board of directors, comprised of directors without any involvement in any external behavioral health business initiatives, approved the strategic alliance with and investment in Lyra.
The Company has evaluated all its transactions with Lyra and has determined that Lyra is a variable interest entity (“VIE”) for the Company. In determining that the Company is not the VIE's primary beneficiary, the Company considered qualitative and quantitative factors, including, but not limited to: which activities most significantly impact the VIE’s economic performance and which party controls such activities; the characteristics of the Company's involvement; and the obligation or likelihood for the Company to provide incremental financial support. Based on the Company's evaluation, the Company determined it is not required to consolidate the operations of the VIE. The Company's maximum exposure to loss as a result of its involvement with this unconsolidated VIE is limited to its investment of $4.1 million and it is not obligated to provide incremental financial support to Lyra.
The investment in Lyra is accounted for under the cost method and is included under other assets in the Company's consolidated financial statements. The Company has not estimated the fair value of its investment because there have been no identified events or changes in circumstances that may have a significant adverse effect on the fair value of the investment. The Company assesses its investment for impairment on a quarterly basis or based on facts or circumstances that may require it to reassess the fair value of its investment. Based on the facts and circumstances as of December 31, 2016, the Company concluded that its investment was appropriately valued.
Note 7. Accrued Compensation
Accrued compensation consisted of the following (in thousands):
66
As of December 31, | |||||||
2016 | 2015 | ||||||
Accrued commissions | $ | 3,637 | $ | 5,212 | |||
Accrued bonuses | 3,388 | 4,034 | |||||
Other employee and benefits payable | 2,418 | 2,231 | |||||
Total | $ | 9,443 | $ | 11,477 | |||
Note 8. Commitments and Contingencies
Leases and Contractual Obligations
We lease office space under noncancellable operating leases in San Francisco, California and Sunnyvale, California, including two office spaces in San Francisco with expiration dates in 2017 and 2021, respectively. In anticipation of the expiration of the lease in 2017, we executed an amendment in September 2016 to extend the term of our other lease to 2022 and add incremental rentable square feet (“RSF”). As a result of the amendment, our office space increased by 8,247 RSF.
Contractual obligations relate to our service agreements for our data centers in Colorado and Arizona and other third party service providers. As of December 31, 2015 , the future minimum lease payments under noncancellable operating leases are as follows (in thousands).
As of December 31, 2016, the future minimum lease payments under noncancellable operating leases are as follows (in thousands):
Operating Leases (1) | Contractual Obligations | ||||||
2017 | $ | 2,651 | $ | 714 | |||
2018 | 2,113 | 714 | |||||
2019 | 2,177 | 535 | |||||
2020 | 2,190 | — | |||||
2021 and later | 2,883 | — | |||||
$ | 12,014 | $ | 1,963 | ||||
(1) Minimum payments have not been reduced by sublease rentals of $1.3 million due in the future under a noncancelable sublease.
The Company's facility lease agreements generally provide for rental payments on a graduated basis and for options to renew, which could increase future minimum lease payments if exercised. The Company recognizes rent expense on a straight-line basis over the lease period and has accrued for rent expense incurred but not paid. Rent expense for the years ended December 31, 2016, 2015 and 2014 was $3.3 million, $2.1 million and $1.2 million, respectively.
Legal Matters
During the second quarter of 2015, four purported securities class action lawsuits, which were later consolidated into a single action, were filed in the Superior Court of the State of California, County of San Mateo, against the Company, certain of its current and former directors, executive officers, significant stockholders and underwriters associated with its initial public offering (“IPO”). The lawsuits were brought by purported stockholders of the Company seeking to represent a class consisting of all those who purchased the Company’s stock pursuant or traceable to the Registration Statement and Prospectus issued in connection with its IPO, alleging claims under Sections 11, 12(a)(2) and 15 of the Securities Act of 1933. On March 28, 2016, the parties to the consolidated actions reached a mutually acceptable resolution by way of a mediated cash settlement for an aggregate amount of $9.5 million, and the Court entered final approval of the settlement on October 28, 2016. As a result of the settlement Castlight recorded a net charge of $2.9 million to general and administrative expense in 2016. This amount represents the portion of settlement that was not covered by insurance and legal fees incurred in 2016 regarding this matter.
From time to time, the Company may become subject to other legal proceedings, claims or litigation arising in the ordinary course of business. In addition, the Company may receive letters alleging infringement of patents or other intellectual
67
property rights. If an unfavorable outcome were to occur in litigation, the impact could be material to the Company’s business, financial condition, cash flow or results of operations, depending on the specific circumstances of the outcome. The Company accrues for loss contingencies when it is both probable that it will incur the loss and when it can reasonably estimate the amount of the loss or range of loss
Note 9. Stock Compensation
Stock Options Activity
The following table summarizes activities for stock options:
Options Outstanding | ||||||||||||
Number of Shares Outstanding | Weighted- Average Exercise Price | Weighted- Average Remaining Contractual Life in Years | Aggregate Intrinsic Value | |||||||||
Balance at December 31, 2015 | 9,561,713 | $ | 5.62 | 6.9 | $ | 16,694 | ||||||
Stock options granted | 3,854,646 | $ | 3.16 | |||||||||
Stock options exercised | (1,945,766 | ) | $ | 1.45 | ||||||||
Stock options canceled and forfeited | (3,827,640 | ) | $ | 9.08 | ||||||||
Balance at December 31, 2016 | 7,642,953 | $ | 3.71 | 7.19 | $ | 18,537 | ||||||
Vested or expected to vest December 31, 2016 | 7,218,516 | $ | 3.70 | 7.09 | $ | 17,810 | ||||||
Exercisable as of December 31, 2016 | 4,378,055 | $ | 3.52 | 5.94 | $ | 12,940 | ||||||
The total grant-date fair value of stock options granted during the years ended December 31, 2016, 2015 and 2014 was $3.6 million, $2.5 million and $39.9 million, respectively.
The total grant-date fair value of stock options vested during the years ended December 31, 2016, 2015 and 2014 was $4.9 million, $10.8 million and $9.7 million, respectively.
The total intrinsic value of the options exercised during the years ended December 31, 2016, 2015 and 2014, was $4.7 million, $25.3 million and $31.1 million, respectively. The intrinsic value is the difference of the current fair value of the stock and the exercise price of the stock option.
As of December 31, 2016, the Company had $5.2 million in unrecognized compensation cost related to non-vested stock options, which is expected to be recognized over a weighted-average period of approximately 2.4 years.
The options granted and canceled in the year ended December 31, 2016 in the table above include options that were exchanged under the Company’s stock option exchange program. Pursuant to the stock option exchange program, 108 out of 132 eligible employees tendered options covering an aggregate of 2,685,396 shares of the Company’s Class A and Class B common stock at a weighted average exercise price of $11.03, in exchange for options to purchase 2,685,396 shares of its Class B common stock at an exercise price of $2.99 per share, the closing sale price reported on the New York Stock Exchange on February 24, 2016. Each new grant began a new vesting period commencing on the date of grant over five years in equal monthly installments. As of February 15, 2016 the incremental expense related to this offer was $1.8 million, which will be recognized over five years.
Restricted Stock Units
The following table summarizes activities for RSUs:
68
Restricted Stock Units Outstanding | ||||||
Number of shares | Weighted Average Grant-Date Fair Value | |||||
Balance at December 31, 2015 | 6,685,118 | $ | 7.63 | |||
Restricted Stock Units granted (1) | 7,759,565 | $ | 3.66 | |||
Restricted Stock Units vested | (1,984,407 | ) | $ | 7.80 | ||
Restricted Stock Units forfeited/canceled (2) | (1,918,610 | ) | $ | 6.82 | ||
Balance at December 31, 2016 | 10,541,666 | $ | 4.82 | |||
_______________________
(1) Includes performance stock units (“PSUs”) that were granted in 2016.
(2) Includes PSUs that were granted in the prior year, which were canceled because performance targets were not achieved.
The total grant-date fair value of RSUs granted during the years ended December 31, 2016 and 2015 was $28.4 million and $47.1 million, respectively.
The total grant-date fair value of RSUs vested during the year ended December 31, 2016 was $15.5 million. No RSUs vested during the year ended December 31, 2015.
As of December 31, 2016, the Company had $43.6 million in unrecognized compensation cost related to non-vested RSUs, which is expected to be recognized over a weighted-average period of approximately 2.8 years.
In February 2016, the Company awarded PSUs to certain employees. The number of shares that can eventually vest depends on achievement of performance targets for 2016, as determined by the compensation committee of the Company's board of directors, and may range from 0 to 150% of the targeted award amount. Once the performance is determined and a targeted award amount is fixed, the target number of PSUs, if any, will vest in eight quarterly installments, subject to recipients' continued service, beginning on February 16, 2017. As of December 31, 2016, vesting of these PSUs was not considered probable. As a result, no compensation expense was recognized.
Stock-Based Compensation to Employees
All stock-based compensation to employees is measured based on the grant-date fair value of the awards and is generally recognized in the Company's statement of operations over the period during which the employee is required to perform services in exchange for the award (generally the vesting period of the award). The Company estimates the fair value of stock options granted using the Black-Scholes option-valuation model. For restricted stock units, fair value is based on the closing price of the Company's Class B common stock on the grant date. Compensation cost is generally recognized over the vesting period of the applicable award using the straight-line method. For awards with performance based and service vesting conditions, compensation cost is recognized over the requisite service period if it is probable that the performance condition will be satisfied based on the accelerated attribution method.
The assumptions used in the Black-Scholes option-valuation model were determined as follows:
Volatility. Since the Company does not have a trading history for its Class B common stock, the expected volatility was derived from the historical stock volatilities of peer group companies within the Company's industry. In evaluating peer companies, the Company considered factors such as nature of business, customer base, service offerings and markets served.
Risk-Free Interest Rate. The risk-free rate that the Company used is based on U.S. Treasury zero-coupon issues with remaining terms similar to the expected term on the options.
Expected Life. The expected term represents the period that the Company's stock-based awards are expected to be outstanding. The expected term assumptions were determined based on the vesting terms, exercise terms and contractual lives of the options.
Dividend Yield. The Company has never declared or paid any cash dividends and do not plan to pay cash dividends in the foreseeable future, and therefore, the Company uses an expected dividend yield of zero.
69
Fair Value of Common Stock. Prior to the Company's initial public offering in March 2014, the Company's board of directors considered numerous objective and subjective factors to determine the fair value of the Company's Class A common stock at each grant date. These factors included, but were not limited to, (i) contemporaneous valuations of Class A common stock performed by unrelated third-party specialists; (ii) the prices for the Company's Preferred Stock sold to outside investors; (iii) the rights, preferences and privileges of the Company's Preferred Stock relative to its Class A common stock; (iv) the lack of marketability of the Company's Class A common stock; (v) developments in the business; and (vi) the likelihood of achieving a liquidity event, such as an initial public offering or a merger or acquisition of the Company, given prevailing market conditions.
Since the Company's initial public offering, the Company has used the market closing price for its Class B common stock as reported on the New York Stock Exchange to determine the fair value of the Company's common stock.
In addition to assumptions used in the Black-Scholes option-pricing model, the Company must also estimate a forfeiture rate to calculate the stock-based compensation for its awards. The Company's forfeiture rate is based on an analysis of its actual forfeitures. The Company uses historical data to estimate pre-vesting option forfeitures and record stock-based compensation expense only for those awards that are expected to vest.
The fair value of each option grant was estimated on the date of grant using the Black-Scholes option-valuation mode l with the following assumptions and fair value per share:
Year Ended December 31, | |||||
2016 | 2015 | 2014 | |||
Volatility | 45% - 47% | 53% | 60% | ||
Expected life (in years) | 5.31 - 6.12 | 6.2 | 5.0-6.3 | ||
Risk-free interest rate | 0.95 - 1.37% | 1.38%-1.91% | 1.53%-2.05% | ||
Dividend yield | —% | —% | —% | ||
Weighted-average fair value of underlying common stock | $3.16 | $8.95 | $14.74 | ||
Warrants
On December 11, 2013, the Company issued a warrant to purchase an aggregate of 175,000 shares of Class A common stock at an exercise price of $5.00 per share to a third-party service provider. The warrant provides for an early exercise right and has a 10 year term. As of December 31, 2014, the warrants were fully vested. Expense for the warrants is calculated using the Black-Scholes option-pricing model and is recorded over the service performance period, which is the same as the vesting period. For the year ended December 31, 2014, the Company recorded $2.6 million in expense associated with this warrant. During 2016, the Company issued an additional warrant to SAP Technologies, Inc. Refer to Note 10 for further discussion of this warrant.
Note 10. Stockholders' Equity
Initial Public Offering
On March 19, 2014, the Company completed its IPO, in which it sold 12.8 million shares of Class B common stock at a price to the public of $16.00 per share. Upon the consummation of the IPO, all outstanding shares of convertible preferred stock were converted into shares of Class A common stock.
Common Stock
As of December 31, 2016 , the Company had 54,295,405 shares of Class A common stock and 50,015,518 shares of Class B common stock outstanding.
Transactions with SAP Technologies, Inc.
In May 2016, the Company entered into a Securities Purchase Agreement (the “Securities Purchase Agreement”) with SAP Technologies, Inc. (“SAP”) pursuant to which it sold and issued to SAP 4.7 million shares (“Shares”) of its Class B Common
70
Stock and a warrant (“Warrant”) to purchase up to 1.9 million shares of its Class B Common Stock. The net proceeds from this transaction were $17.8 million and will be used for working capital and other general corporate purposes.
The exercise price of the Warrant is $4.91 per share and will expire four years from the date the Company enters into agreements with SAP related to both SAP’s Connected Health platform (the “Platform Agreement”) and SAP’s distribution of the Company’s solutions (the “Distribution Agreement”, and together, with the Platform Agreement, the “Alliance Agreements”). The Alliance Agreements will be focused on a strategic, multi-pronged business relationship aimed at delivering integrated healthcare technologies that can help lower healthcare costs, improve outcomes and increase benefits satisfaction for customers. If the Company does not enter into the Alliance Agreements with SAP by May 17, 2017, then the Warrant will become void.
The Shares and Warrant are considered freestanding instruments from each other and are classified within stockholders’ equity. The Company preliminarily allocated the net proceeds to the Shares and Warrant and also to a customer prepayment liability classified within accrued expenses and other current liabilities that represents the future benefits of the Alliance Agreements. Additional accounting for the Warrants and the customer prepayment liability is dependent on, if and when, the Alliance Agreements are executed.
Employee Equity Plans
The Company adopted a 2014 Equity Incentive Plan (EIP) that became effective on March 12, 2014 and serves as the successor to the Company's 2008 Stock Incentive Plan. Shares issued under the 2008 Stock Plan were Class A common stock and shares issued under the EIP are Class B common stock. The Company's 2014 Equity Incentive Plan authorizes the award of stock options, restricted stock awards (RSAs), stock appreciation rights (SARs), restricted stock units (RSUs), performance awards and stock bonuses. The Company began granting RSUs in the fourth quarter of 2014.
The Company adopted a 2014 Employee Stock Purchase Plan (ESPP) that became effective on March 13, 2014 that enables eligible employees to purchase shares of the Company's Class B common stock at a discount. The Company has not yet established a start date of the initial purchasing period under the ESPP.
Note 11. Income Taxes
The components of loss from continuing operations before income taxes were generated solely in the United States as follows (in thousands):
Year Ended December 31, | |||||||||||
2016 | 2015 | 2014 | |||||||||
United States | $ | (58,548 | ) | $ | (79,920 | ) | $ | (85,940 | ) | ||
As a result of the Company's history of net operating losses and full valuation allowance against its deferred tax assets, there was no current or deferred income tax provision for the years ended December 31, 2016, 2015 and 2014.
Reconciliations of the statutory federal income tax rate and the Company's effective tax rate consist of the following (in thousands):
Year Ended December 31, | |||||||||||
2016 | 2015 | 2014 | |||||||||
Tax at federal statutory rate | $ | (19,812 | ) | $ | (27,173 | ) | $ | (29,220 | ) | ||
State statutory rate (net of federal benefit) | (1,259 | ) | (1,560 | ) | (1,728 | ) | |||||
Non-deductible stock compensation | 1,594 | 2,334 | (19 | ) | |||||||
Change in valuation allowance | 14,365 | 24,332 | 30,571 | ||||||||
Other | 5,112 | 2,067 | 396 | ||||||||
$ | — | $ | — | $ | — | ||||||
Significant components of the Company's deferred tax assets and liabilities were as follows (in thousands):
71
As of December 31, | |||||||
Deferred tax assets: | 2016 | 2015 | |||||
Net operating loss carryforwards | $ | 105,100 | $ | 93,165 | |||
Deferred rent | 580 | 235 | |||||
Accrued compensation | 1,291 | 326 | |||||
Stock-based compensation | 6,369 | 6,224 | |||||
Other reserves and accruals | 3 | 4 | |||||
Property and equipment | 649 | 322 | |||||
Deferred revenue | 3,879 | 3,017 | |||||
117,871 | 103,293 | ||||||
Valuation allowance | (117,871 | ) | (103,293 | ) | |||
Net deferred tax assets | $ | — | $ | — | |||
The Company has provided a full valuation allowance for its deferred tax assets at December 31, 2016 and 2015, due to the uncertainty surrounding the future realization of such assets. Therefore, no benefit has been recognized for the net operating loss carryforwards and other deferred tax assets.
The valuation allowance increased by $14.6 million and $24.1 million during the years ended December 31, 2016 and 2015, respectively. For the years ended December 31, 2016 and 2015, the Company recorded no tax benefits related to stock-based compensation.
As of December 31, 2016, the Company had approximately $304.2 million of federal and $174.7 million of state net operating loss carryforwards available to offset future taxable income. If not utilized, the federal and state net operating loss carryforwards begin to expire in 2028 and 2017, respectively.
The deferred tax asset related to the Company's net operating losses does not include amounts relating to the tax benefit of stock option exercises, which, when realized, will be recorded as a credit to additional paid-in capital. As of December 31, 2016, the Company also had approximately $6.4 million and $7.2 million of research and development tax credit carryforwards available to reduce future taxable income if any, for federal and California purposes, respectively. The federal credit carryforwards expire beginning in 2028 and the California research credits do not expire and may be carried forward indefinitely.
The Company's ability to utilize the net operating loss and tax credit carryforwards in the future may be subject to substantial restrictions in the event of past or future ownership changes as defined in Section 382 of the Internal Revenue Code and similar state tax laws. In the event the Company should experience an ownership change, as defined, utilization of the Company's net operating loss carryforwards and tax credits could be limited.
The Company evaluates tax positions for recognition using a more-likely-than-not recognition threshold, and those tax positions eligible for recognition are measured as the largest amount of tax benefit that is greater than 50% likely of being realized upon the effective settlement with a taxing authority that has full knowledge of all relevant information.
A reconciliation of the beginning and ending amount of the gross unrecognized tax benefit is as follows (in thousands):
Year Ended December 31, | |||||||||||
2016 | 2015 | 2014 | |||||||||
Gross unrecognized tax benefits at the beginning of the year | $ | 9,540 | $ | 7,214 | $ | 4,513 | |||||
Increases for tax positions of prior years | — | 133 | 871 | ||||||||
Decreases for tax positions of prior years | (125 | ) | (346 | ) | (831 | ) | |||||
Increases for tax positions related to the current year | 4,153 | 2,539 | 2,661 | ||||||||
Gross unrecognized tax benefits at the end of the year | $ | 13,568 | $ | 9,540 | $ | 7,214 | |||||
72
At December 31, 2016, all unrecognized tax benefits are subject to a full valuation allowance and, if recognized, will not affect the Company's tax rate.
There were no material changes to the unrecognized tax benefits in the year ended December 31, 2016, and the Company does not anticipate that the total amounts of unrecognized tax benefits will significantly increase or decrease in the next 12 months.
The Company's policy is to include interest and penalties related to unrecognized tax benefits within its provision for income taxes. Due to the Company's net operating loss position, the Company has not recorded an accrual for interest or penalties related to uncertain tax positions for the years ended December 31, 2016, 2015 or 2014.
Note 12. Net Loss per Share
Basic net loss per share is computed by dividing the net loss by the weighted-average number of shares of common stock outstanding during the period, less the weighted-average unvested common stock subject to repurchase. Diluted net loss per share is computed by giving effect to all potential shares of common stock, including Preferred Stock and outstanding stock options and warrants, to the extent dilutive. Basic and diluted net loss per share was the same for each period presented as the inclusion of all potential shares of common stock outstanding would have been anti-dilutive.
When shares of both Class A and Class B common stock are outstanding, net loss is allocated based on the contractual participation rights of the Class A and Class B common stock as if the earnings for the year have been distributed. As the liquidation and dividend rights are identical, the net loss is allocated on a proportionate basis.
The following table presents the calculation of basic and diluted net loss per share for the Company's common stock (in thousands, except per share data):
Year Ended December 31, | |||||||||||||||||||||||
2016 | 2015 | 2014 | |||||||||||||||||||||
Class A | Class B | Class A | Class B | Class A | Class B | ||||||||||||||||||
Net loss | $ | (31,610 | ) | $ | (26,938 | ) | $ | (48,116 | ) | $ | (31,804 | ) | $ | (67,655 | ) | $ | (18,285 | ) | |||||
Weighted-average shares used to compute basic and diluted net loss per share | 54,421 | 46,377 | 56,444 | 37,309 | 58,555 | 15,826 | |||||||||||||||||
Basic and diluted net loss per share | $ | (0.58 | ) | $ | (0.58 | ) | $ | (0.85 | ) | $ | (0.85 | ) | $ | (1.16 | ) | $ | (1.16 | ) | |||||
The following securities were excluded from the calculation of diluted net loss per share for common stock because their effect would have been anti-dilutive for the periods presented (in thousands):
Year Ended December 31, | |||||||||||
2016 | 2015 | 2014 | |||||||||
Stock options and restricted common stock | 18,185 | 16,247 | 17,791 | ||||||||
Warrants | 2,020 | 115 | 115 | ||||||||
$ | 20,205 | $ | 16,362 | $ | 17,906 | ||||||
Note 13. 401(k) Plan
The Company has a qualified defined contribution plan under Section 401(k) of the Internal Revenue Code covering eligible employees. Under the plan, participating employees may defer up to 100% of their pre-tax earnings, subject to the Internal Revenue Service annual contribution limits. Effective January 1, 2015, the Company began matching a portion of the employee contributions. The Company's contribution expense in 2016 totaled $1.0 million.
Note 14. Reduction in Workforce
On May 10, 2016, the Company’s Board of Directors committed to a program to reduce the Company’s workforce in order to reduce expenses, align its operations with evolving business needs and improve efficiencies. Under this program, the Company undertook an initiative to reduce its workforce by approximately fourteen percent. For the year ended December 31, 2016 , the Company incurred charges of $0.8 million, all of which were related to severance costs. As of December 31, 2016, all costs have been fully paid out.
73
Note 15. Selected Quarterly Financial Data (unaudited)
The following tables set forth selected unaudited quarterly consolidated statements of operations data for each of the eight quarters in years 2016 and 2015 (in thousands, except per share data):
Quarter Ended | ||||||||||||||||||||||||||||||||
Mar 31, 2015 | Jun 30, 2015 | Sept 30, 2015 | Dec 31, 2015 | Mar 31, 2016 | Jun 30, 2016 | Sept 30, 2016 | Dec 31, 2016 | |||||||||||||||||||||||||
Total revenue | 15,951 | 18,510 | 19,539 | 21,315 | 22,717 | 23,585 | 25,501 | 29,897 | ||||||||||||||||||||||||
Gross profit | 8,779 | 10,256 | 10,852 | 11,660 | 13,468 | 14,641 | 17,535 | 21,496 | ||||||||||||||||||||||||
Net loss | $ | (19,643 | ) | $ | (21,212 | ) | $ | (20,007 | ) | $ | (19,058 | ) | $ | (21,355 | ) | $ | (16,692 | ) | $ | (11,403 | ) | $ | (9,098 | ) | ||||||||
Net loss per share, basic and diluted | $ | (0.21 | ) | $ | (0.23 | ) | $ | (0.21 | ) | $ | (0.20 | ) | $ | (0.22 | ) | $ | (0.17 | ) | $ | (0.11 | ) | $ | (0.09 | ) | ||||||||
Note 16. Subsequent Events
On January 4, 2017, the Company entered into an Agreement and Plan of Merger and Reorganization (which is referred to as the merger agreement) with Jiff, Inc. ("Jiff"), an enterprise health benefits platform provider and, as described further below, a related party to the Company, pursuant to which, among other things, subject to the satisfaction or waiver of the conditions set forth in the merger agreement, that a wholly owned subsidiary of the Company will merge with and into Jiff, with Jiff becoming a wholly-owned subsidiary of the Company and the surviving corporation following the completion of the merger. Upon the completion of the merger, all outstanding capital stock and vested options of Jiff will be exchanged for an aggregate of approximately 27 million shares, and options exercisable to purchase shares, of Class B common stock, subject to certain adjustments as set forth in the merger agreement. Additionally as part of the merger, certain stockholders and option holders have the right to receive up to 4 million shares of Class B common stock or options with rights to Class B common stock, respectively, upon the achievement by the Jiff business of certain milestones in 2017. Former Jiff stock and option holders will receive an aggregate of 1 million shares of the Company's Class B common stock or options if the Jiff business achieves at least $25 million in revenue in 2017 and an aggregate of 3 million shares of Class B common stock or options if the Jiff business achieves at least $25 million in net new bookings during 2017. All options for Jiff common stock and Jiff restricted stock units held by Jiff employees who become continuing employees of the combined company will be converted into options to purchase the Company's Class B common stock and restricted stock units, if any, respectively. As partial security for such indemnification obligations, the parties have agreed to deposit 2.7 million shares of Class B common stock in a separate escrow fund for a period of 12 months after the completion of the merger.
Bryan Roberts, Chairman of the board of directors of the Company prior to the completion of the merger, is a Partner at Venrock, which beneficially owns 16,825,301 shares of the Company's Class A and Class B common stock, or approximately 16% of Castlight’s total issued and outstanding capital stock. Venrock also owns 8,040,910 shares of Jiff capital stock, or approximately 18% of the total issued and outstanding Jiff capital stock. Accordingly, this is a related party transaction. The board of directors of the Company appointed a Special Committee, comprised solely of disinterested directors, to which it delegated the full and exclusive power, authority and discretion of the Company's board of directors to evaluate, assess, and approve the Jiff transaction on its behalf. The Special Committee engaged its own independent legal and financial advisors to assist the Special Committee in evaluating the merger. After deliberations, the Special Committee concluded that the transaction terms were fair to the Company and the transaction was in the best interests of the Company and its stockholders and unanimously approved the transaction.
We intend to hold a special meeting of our stockholders on March 17, 2017 to ask for shareholder approval of the shares to be issued in this merger. Upon the completion of the merger, the Company's board of directors will include two members designated by Jiff. Immediately following the effective time of the merger, the Company's equity holders are expected to own approximately 80% of the outstanding capital stock of the combined company on a fully diluted basis, with Jiff stockholders owning approximately 20% of the combined company immediately following the completion of the merger.
ITEM 9. Changes in and Disagreements with Accountants on Accounting and Financial Disclosure
None.
Item 9A. Controls and Procedures
Evaluation of Disclosure Controls and Procedures
Our management, with the supervision and participation of our principal executive officer and principal financial officer, evaluated the effectiveness of our disclosure controls and procedures, as defined in Rules 13a-15(e) and 15d-15(e) under the Securities Exchange Act of 1934, as amended (the Exchange Act), as of the end of the period covered by this report.
In designing and evaluating the disclosure controls and procedures, management recognizes that any controls and procedures, no matter how well designed and operated, can provide only reasonable assurance of achieving the desired control objectives. In addition, the design of disclosure controls and procedures must reflect the fact that there are resource constraints and that management is required to apply its judgment in evaluating the benefits of possible controls and procedures relative to their costs.
Based on our management’s evaluation, our principal executive officer and principal financial officer concluded that, as of December 31, 2016, our disclosure controls and procedures were designed at a reasonable assurance level and were effective to provide reasonable assurance that information we are required to disclose in reports that we file or submit under the
74
Exchange Act is recorded, processed, summarized, and reported within the time periods specified in Securities and Exchange Commission rules and forms, and that such information is accumulated and communicated to our management, including our chief executive officer and chief financial officer, as appropriate, to allow timely decisions regarding required disclosure.
Changes in Internal Control over Financial Reporting
There was no change in our internal control over financial reporting identified in connection with the evaluation required by Rule 13a-15(d) and 15d-15(d) of the Exchange Act that occurred during the period covered by this report that has materially affected, or is reasonably likely to materially affect, our internal control over financial reporting.
Management’s Report on Internal Control over Financial Reporting
Our management is responsible for establishing and maintaining adequate internal control over financial reporting, as such term is defined in Exchange Act Rule 13a-15(f) and Rule 15d-15(f). Our management, including our Chief Executive Officer and Chief Financial Officer conducted an evaluation of the effectiveness of our internal control over financial reporting based on the framework in Internal Control - Integrated Framework (2013) issued by the Committee of Sponsoring Organizations of the Treadway Commission. Management’s assessment included evaluation of elements such as the design and operating effectiveness of key financial reporting controls, process documentation, accounting policies, and our overall control environment. Based on its evaluation under the framework in Internal Control - Integrated Framework (2013), our management concluded that our internal control over financial reporting was effective as of December 31, 2016 to provide reasonable assurance regarding the reliability of financial reporting and the preparation of consolidated financial statements for external reporting purposes in accordance with U.S. generally accepted accounting principles. We reviewed the results of management’s assessment with the Audit Committee of our Board of Directors.
This Annual Report on Form 10-K does not include an attestation report of the company’s registered public accounting firm regarding internal control over financial reporting. Management’s report was not subject to attestation by the company’s registered public accounting firm pursuant to the rules of the SEC that permit emerging growth companies such as our company to provide only management’s report in the Annual Report on Form 10-K.
Item 9B. Other Information
None.
75
Part III
Item 10. Directors, Executive Officers and Corporate Governance
The information required by this item will be included in an amendment to this Annual Report on Form 10-K or incorporated by reference from our definitive proxy statement to be filed pursuant to Regulation 14A.
Item 11. Executive Compensation
The information required by this item will be included in an amendment to this Annual Report on Form 10-K or incorporated by reference from our definitive proxy statement to be filed pursuant to Regulation 14A.
Item 12. Security Ownership of Certain Beneficial Owners and Management and Related Stockholder Matters
The information required by this item will be included in an amendment to this Annual Report on Form 10-K or incorporated by reference from our definitive proxy statement to be filed pursuant to Regulation 14A.
Item 13. Certain Relationships and Related Transactions, and Director Independence
The information required by this item will be included in an amendment to this Annual Report on Form 10-K or incorporated by reference from our definitive proxy statement to be filed pursuant to Regulation 14A.
Item 14. Principal Accountant Fees and Services
The information required by this item will be included in an amendment to this Annual Report on Form 10-K or incorporated by reference from our definitive proxy statement to be filed pursuant to Regulation 14A.
76
PART IV
Item 15. Exhibits and Financial Statement Schedules.
(a) The following documents are filed as part of this Annual Report on Form 10-K:
(1) Financial Statements:
The information concerning our financial statements, and Report of Independent Registered Public Accounting Firm required by this Item is incorporated by reference herein to the section of this Annual Report on Form 10-K in Item 8, entitled “Financial Statements and Supplementary Data.”
(2) Financial Statement Schedules:
Financial statement schedules have been omitted because they are not required, not applicable, not present in amounts sufficient to require submission of the schedule, or the required information is shown in the Consolidated Financial Statements or Notes thereto.
(3) Exhibits:
See the Exhibit Index immediately following the signature page of this Annual Report on Form 10-K.
77
SIGNATURE
Pursuant to the requirements of Section 13 or 15(d) of the Securities Exchange Act of 1934, the Registrant has duly caused this Annual Report on Form 10-K to be signed on its behalf by the undersigned, thereunto duly authorized, in San Francisco, State of California, on this 1st day of March, 2017.
CASTLIGHT HEALTH, INC. | |||
By: | /s/ Giovanni M. Colella | ||
Giovanni M. Colella | |||
Chief Executive Officer, Co-Founder and Director | |||
POWER OF ATTORNEY
KNOW ALL PERSONS BY THESE PRESENTS, that each person whose signature appears below constitutes and appoints Giovanni M. Colella and Siobhan Nolan Mangini] or either of them his or her true and lawful attorney-in-fact and agents, each with the full power of substitution and re-substitution, for such person in such person’s name, place and stead, in any and all capacities, to sign any and all amendments to this Annual Report on Form 10-K, and to file the same, with all exhibits thereto and other documents in connection therewith, with the Securities and Exchange Commission, granting unto said attorneys-in-fact and agents, and each of them, full power and authority to do and perform each and every act and thing requisite and necessary to be done in connection therewith, as fully to all intents and purposes as he or she might do or could do in person, hereby ratifying and confirming all that each of said attorneys-in-fact and agents, or his substitute, may lawfully do or cause to be done by virtue hereof.
Pursuant to the requirements of the Securities Exchange Act of 1934, this Annual Report on Form 10-K has been signed below by the following persons on behalf of the registrant and in the capacities and on the dates indicated
Signature | Title | Date | ||
/s/ Giovanni M. Colella | Chief Executive Officer, Co-Founder and Director | March 1, 2017 | ||
Giovanni M. Colella | (Principal Executive Officer) | |||
/s/ Siobhan Nolan Mangini | Chief Financial Officer | March 1, 2017 | ||
Siobhan Nolan Mangini | (Principal Financial Officer) | |||
/s/ Priya Jain | Corporate Controller and Chief Accounting Officer | March 1, 2017 | ||
Priya Jain | (Principal Accounting Officer) | |||
/s/ Bryan Roberts | Chairman of the Board of Directors and Co-Founder | March 1, 2017 | ||
Bryan Roberts | ||||
/s/ David Ebersman | Director | March 1, 2017 | ||
David Ebersman | ||||
78
/s/ Ann Lamont | Director | March 1, 2017 | ||
Ann Lamont | ||||
/s/ Ed Park | Director | March 1, 2017 | ||
Ed Park | ||||
/s/ David B. Singer | Director | March 1, 2017 | ||
David B. Singer | ||||
/s/ Michael Eberhard | Director | March 1, 2017 | ||
Mike Eberhard | ||||
/s/ Kenny Van Zant | Director | March 1, 2017 | ||
Kenny Van Zant | ||||
79
EXHIBIT INDEX
Incorporate by Reference | ||||||||||||
Exhibit Number | Description of Document | Form | File No. | Filing Date | Exhibit | Filed Herewith | ||||||
2.1 | Agreement and Plan of Merger and Reorganization, dated as of January 4, 2017, by and among Castlight Health, Inc., Neptune Acquisition Subsidiary, Inc. and Jiff, Inc. | 8-K | 0001-36330 | January 4, 2017 | 2.1 | |||||||
3.1 | Restated Certificate of Incorporation. | 10-Q | 001-36330 | May 12, 2014 | 3.1 | |||||||
3.2 | Amended and Restated Bylaws. | 10-Q | 001-36330 | May 12, 2014 | 3.2 | |||||||
4.1 | Form of Class A Common Stock Certificate. | S-8 | 333-194566 | March 14, 2014 | 4.8 | |||||||
4.2 | Form of Class B Common Stock Certificate. | S-1 | 333-193840 | March 3, 2014 | 4.1 | |||||||
4.3 | Amended and Restated Investors’ Rights Agreement, dated as of April 26, 2012, by and among the Registrant and certain of its stockholders. | S-1 | 333-193840 | February 10, 2014 | 4.2 | |||||||
4.4 | Warrant issued to SAP Technologies, Inc. | 8-K | 001-36330 | May 18, 2016 | 4.1 | |||||||
4.5 | Securities Purchase Agreement dated May 16, 2016, between Castlight Health, Inc. and SAP Technologies, Inc. | 8-K | 001-36330 | May 18, 2016 | 10.1 | |||||||
10.1* | Form of Indemnification Agreement. | S-1 | 333-193840 | March 3, 2014 | 10.1 | |||||||
10.2* | 2008 Stock Incentive Plan and forms of stock option agreement thereunder and restricted stock agreement. | S-1 | 333-193840 | March 3, 2014 | 10.2 | |||||||
10.3* | 2014 Equity Incentive Plan and forms of stock option award agreement, restricted stock agreement, stock appreciation right award agreement, restricted stock unit award agreement, performance shares award agreement and stock bonus agreement. | S-1 | 333-193840 | March 3, 2014 | 10.3 | |||||||
10.4* | 2014 Employee Stock Purchase Plan and form of subscription agreement. | S-1 | 333-193840 | March 3, 2014 | 10.4 | |||||||
10.5* | Form of restricted stock unit agreement; performance based | 10-Q | 001-36330 | August 5, 2015 | 10.2 | |||||||
10.6* | Job Offer Letter, dated as of September 6, 2012, by and between the Registrant and John C. Doyle. | S-1 | 333-193840 | February 10, 2014 | 10.6 | |||||||
10.7* | Double Trigger Acceleration Policy. | S-1 | 333-193840 | February 10, 2014 | 10.9 | |||||||
10.8 | 2012 Sublease Agreement by and between National Union Fire Insurance Company of Pittsburgh, Pa. and the Registrant, with Consent to Sublease Agreement, dated as of August 9, 2012. | S-1 | 333-193840 | February 10, 2014 | 10.10 | |||||||
80
10.9 | Master Services Agreement, dated as of November 28, 2012; First Service Addendum, dated as of November 28, 2012; and Business Associate Agreement, dated as of September 11, 2012, in each case by and between the Registrant and the Administrative Committee of the Wal-Mart Stores, Inc., Associates’ Health and Welfare Plan. | S-1 | 333-193840 | March 3, 2014 | 10.11 | |||||||
10.10 | Lease Agreement by and between 150 Spear Street, LLC and the Registrant, dated May 21, 2015. | 10-Q | 001-36330 | August 5, 2015 | 10.1 | |||||||
10.11 | Amendment to the Lease Agreement by and between 150 Spear Street, LLC and the Company. | 10-Q | 001-36330 | November 2, 2016 | 10.15 | |||||||
10.12* | Job Offer Letter, dated as of October 7, 2014, by and between the Registrant and John McCracken | X | ||||||||||
10.13* | Form of Executive Severance Agreement | 8-K | 001-36330 | July 11, 2016 | 10.1 | |||||||
21.1 | Subsidiaries of the Registrant. | X | ||||||||||
23.1 | Consent of Independent Registered Public Accounting Firm. | X | ||||||||||
24.1 | Power of Attorney (see signature page of this annual report on Form 10-K). | X | ||||||||||
31.1 | Certification of Principal Executive Officer Required Under Rule 13a-14(a) and 15d-14(a) of the Securities Exchange Act of 1934, as amended. | X | ||||||||||
31.2 | Certification of Principal Financial Officer Required Under Rule 13a-14(a) and 15d-14(a) of the Securities Exchange Act of 1934, as amended. | X | ||||||||||
32.1 | Certification of Chief Executive Officer Required Under Rule 13a-14(b) of the Securities Exchange Act of 1934, as amended, and 18 U.S.C. §1350. | X | ||||||||||
32.2 | Certification of Chief Financial Officer Required Under Rule 13a-14(b) of the Securities Exchange Act of 1934, as amended, and 18 U.S.C. §1350. | X | ||||||||||
99.1 | Certain Excerpts from the Prospectus dated February 22, 2017 filed on February 22, 2017 pursuant to Rule424(b)(3) relating to the Registration Statement on Form S-4, as amended (No. 333- 215861) of the Registrant. | X | ||||||||||
101.INS | XBRL Instance Document | X | ||||||||||
101.SCH | XBRL Taxonomy Schema Linkbase Document | X | ||||||||||
101.CAL | XBRL Taxonomy Calculation Linkbase Document | X | ||||||||||
101.DEF | XBRL Taxonomy Definition Linkbase Document | X | ||||||||||
101.LAB | XBRL Taxonomy Labels Linkbase Document | X | ||||||||||
101.PRE | XBRL Taxonomy Presentation Linkbase Document | X | ||||||||||
_______________________
* | Indicates a management contract, compensatory plan or arrangement | ||
81
82