Attached files
| file | filename |
|---|---|
| EX-32.1 - EX-32.1 - Builders FirstSource, Inc. | bldr-ex321_10.htm |
| EX-31.2 - EX-31.2 - Builders FirstSource, Inc. | bldr-ex312_7.htm |
| EX-31.1 - EX-31.1 - Builders FirstSource, Inc. | bldr-ex311_8.htm |
| EX-23.1 - EX-23.1 - Builders FirstSource, Inc. | bldr-ex231_6.htm |
| EX-10.39 - EX-10.39 - Builders FirstSource, Inc. | bldr-ex1039_212.htm |
| EX-10.29 - EX-10.29 - Builders FirstSource, Inc. | bldr-ex1029_211.htm |
| EX-10.3 - EX-10.3 - Builders FirstSource, Inc. | bldr-ex103_578.htm |
UNITED STATES
SECURITIES AND EXCHANGE COMMISSION
Washington, D.C. 20549
Form 10-K
|
☑ |
ANNUAL REPORT PURSUANT TO SECTION 13 OR 15(d) OF THE SECURITIES EXCHANGE ACT OF 1934 |
For the fiscal year ended December 31, 2016
OR
|
☐ |
TRANSITION REPORT PURSUANT TO SECTION 13 OR 15(d) OF THE SECURITIES EXCHANGE ACT OF 1934 |
For the transition period from to
Commission File Number: 0-51357
BUILDERS FIRSTSOURCE, INC.
(Exact name of registrant as specified in its charter)
|
Delaware |
|
52-2084569 |
|
(State or other jurisdiction of |
|
(I.R.S. Employer |
|
|
|
|
|
2001 Bryan Street, Suite 1600 Dallas, Texas |
|
75201 |
|
(Address of principal executive offices) |
|
(Zip Code) |
Registrant’s telephone number, including area code:
(214) 880-3500
Securities registered pursuant to Section 12(b) of the Act:
|
Title of Each Class |
|
Name of Exchange on Which Registered |
|
Common stock, par value $0.01 per share |
|
NASDAQ Stock Market LLC |
Securities registered pursuant to Section 12(g) of the Act:
None
Indicate by check mark if the registrant is a well-known seasoned issuer, as defined in Rule 405 of the Securities Act. Yes ☑ No ☐
Indicate by check mark if the registrant is not required to file reports pursuant to Section 13 or Section 15(d) of the Act. Yes ☐ No ☑
Indicate by check mark whether the registrant (1) has filed all reports required to be filed by Section 13 or 15(d) of the Securities Exchange Act of 1934 during the preceding 12 months (or for such shorter period that the registrant was required to file such reports), and (2) has been subject to such filing requirements for the past 90 days. Yes ☑ No ☐
Indicate by check mark whether the registrant has submitted electronically and posted on its corporate Web site, if any, every Interactive Data File required to be submitted and posted pursuant to Rule 405 of Regulation S-T (Section 232.405 of this chapter) during the preceding 12 months (or for such shorter period that the registrant was required to submit and post such files). Yes ☑ No ☐
Indicate by check mark if disclosure of delinquent filers pursuant to Item 405 of Regulation S-K is not contained herein, and will not be contained, to the best of registrant’s knowledge, in definitive proxy or information statements incorporated by reference in Part III of this Form 10-K or any amendment to this Form 10-K. ☑
Indicate by check mark whether the registrant is a large accelerated filer, an accelerated filer, a non-accelerated filer, or a smaller reporting company. See the definitions of “large accelerated filer,” “accelerated filer” and “smaller reporting company” in Rule 12b-2 of the Exchange Act. (Check one):
|
Large accelerated filer ☑ |
|
Accelerated filer ☐ |
|
Non-accelerated filer ☐ |
|
Smaller reporting company ☐ |
|
|
|
(Do not check if a smaller reporting company) |
||||
Indicate by check mark whether the registrant is a shell company (as defined by Rule 12b-2 of the Act). Yes ☐ No ☑
The aggregate market value of the registrant’s common stock held by non-affiliates of the registrant as of June 30, 2016 was approximately $961.1 million based on the closing price per share on that date of $11.25 as reported on the NASDAQ Stock Market LLC.
The number of shares of the registrant’s common stock, par value $0.01, outstanding as of February 24, 2017 was 112,040,464.
DOCUMENTS INCORPORATED BY REFERENCE
Portions of the registrant’s definitive proxy statement for its annual meeting of stockholders to be held on May 24, 2017 are incorporated by reference into Part II and Part III of this Form 10-K.
Table of Contents to Form 10-K
|
|
|
|
|
Page |
|
|
|
|
|
|
|
Item 1. |
|
|
3 |
|
|
Item 1A. |
|
|
11 |
|
|
Item 1B. |
|
|
21 |
|
|
Item 2. |
|
|
21 |
|
|
Item 3. |
|
|
22 |
|
|
Item 4. |
|
|
22 |
|
|
|
|
|
|
|
|
Item 5. |
|
|
23 |
|
|
Item 6. |
|
|
25 |
|
|
Item 7. |
|
Management’s Discussion and Analysis of Financial Condition and Results of Operations |
|
26 |
|
Item 7A. |
|
|
39 |
|
|
Item 8. |
|
|
40 |
|
|
Item 9. |
|
Changes in and Disagreements with Accountants on Accounting and Financial Disclosure |
|
76 |
|
Item 9A. |
|
|
76 |
|
|
Item 9B. |
|
|
77 |
|
|
|
|
|
|
|
|
Item 10. |
|
|
78 |
|
|
Item 11. |
|
|
78 |
|
|
Item 12. |
|
Security Ownership of Certain Beneficial Owners and Management and Related Stockholder Matters |
|
78 |
|
Item 13. |
|
Certain Relationships and Related Transactions, and Director Independence |
|
79 |
|
Item 14. |
|
|
79 |
|
|
|
|
|
|
|
|
Item 15. |
|
|
80 |
|
|
Item 16 |
|
|
84 |
2
CAUTIONARY STATEMENT
Statements in this report and the schedules hereto that are not purely historical facts or that necessarily depend upon future events, including statements about expected market share gains, forecasted financial performance or other statements about anticipations, beliefs, expectations, hopes, intentions or strategies for the future, may be forward-looking statements within the meaning of Section 21E of the Securities Exchange Act of 1934, as amended. Readers are cautioned not to place undue reliance on forward-looking statements. In addition, oral statements made by our directors, officers and employees to the investor and analyst communities, media representatives and others, depending upon their nature, may also constitute forward-looking statements. As with the forward-looking statements included in this report, these forward-looking statements are by nature inherently uncertain, and actual results may differ materially as a result of many factors. All forward-looking statements are based upon information available to Builders FirstSource, Inc. on the date this report was submitted. Builders FirstSource, Inc. undertakes no obligation to publicly update or revise any forward-looking statements, whether as a result of new information, future events or otherwise. Any forward-looking statements involve risks and uncertainties that could cause actual events or results to differ materially from the events or results described in the forward-looking statements, including risks or uncertainties related to the Company’s growth strategies, including gaining market share, or the Company’s revenues and operating results being highly dependent on, among other things, the homebuilding industry, lumber prices and the economy. Builders FirstSource, Inc. may not succeed in addressing these and other risks. Further information regarding the risk factors that could affect our financial and other results are included as Item 1A of this annual report on Form 10-K.
OVERVIEW
In this annual report, unless otherwise stated or the context otherwise requires, references to the “company,” “we,” “our,” “ours” or “us” refer to Builders FirstSource, Inc. and its consolidated subsidiaries, including ProBuild Holdings LLC (“ProBuild”), as of July 31, 2015.
We are a leading supplier and manufacturer of building materials, manufactured components and construction services to professional homebuilders, sub-contractors, remodelers and consumers. Following our acquisition of ProBuild in July 2015, the Company operates 400 locations in 40 states across the United States. We offer an integrated solution to our customers providing manufacturing, supply and installation of a full range of structural and related building products. Our manufactured products include our factory-built roof and floor trusses, wall panels and stairs, vinyl windows, custom millwork and trim, as well as engineered wood that we design, cut, and assemble for each home. We also assemble interior and exterior doors into pre-hung units. Additionally, we supply our customers with a broad offering of professional grade building products not manufactured by us, such as dimensional lumber and lumber sheet goods and various window, door and millwork lines. Our full range of construction-related services includes professional installation, turn-key framing and shell construction, and spans all our product categories.
Given the span and depth of our geographical reach, our locations are organized into nine geographical regions (Regions 1 through 9), which are also our operating segments, further aggregated into four reportable segments: Northeast, Southeast, South and West. All of our segments have similar customers, products and services, and distribution methods as discussed below. Our financial statements contain additional information regarding segment performance which is discussed in Note 15 to the consolidated financial statements included in Item 8 of this annual report on Form 10-K.
Builders FirstSource, Inc. is a Delaware corporation formed in 1998 as BSL Holdings, Inc. On October 13, 1999, our name changed to Builders FirstSource, Inc. Our common stock is listed on the NASDAQ Stock Market LLC under the ticker symbol “BLDR”.
OUR INDUSTRY
We compete in the professional segment (“Pro Segment”) of the U.S. residential building products supply market. Suppliers in the Pro Segment primarily focus on serving professional customers such as homebuilders and remodeling contractors. The Pro Segment consists predominantly of small, privately owned suppliers, including framing and shell construction contractors, local and regional materials distributors, single or multi-site lumberyards, and truss manufacturing and millwork operations. Because of the predominance of smaller privately owned companies and the overall size and diversity of the target customer market, the Pro Segment remains fragmented. There were only five non-specialty building product suppliers in the Pro Segment that generated more than $500 million in sales, according to ProSales magazine’s 2015 ProSales 100 list. We were the largest non-specialty building product supplier on this list.
3
The residential building products industry is driven by the level of activity in both the U.S. residential new construction market and the U.S. residential repair and remodeling market. Growth within these markets is linked to a number of key factors, including demographic trends, housing demand, interest rates, employment levels, availability of credit, foreclosure rates, consumer confidence, the availability of qualified tradesmen, and the state of the economy in general.
The residential building products industry is characterized by several key trends, including greater utilization of manufactured components, an expanding role of the distributor in providing turn-key services and a consolidation of suppliers by homebuilders.
|
|
• |
Prefabricated components: Compared to conventional “stick-build” construction where builders cut and assemble lumber at the job site with their own labor, prefabricated components are engineered in an offsite location using specialized equipment and labor. This outsourced task allows for optimal material usage, lower overall labor costs and improved quality of structural elements. In addition, using prefabricated components typically results in faster construction because fabrication can be automated and performed more systematically. As such, we believe there is a long term trend towards increased use of prefabricated components by homebuilders. |
|
|
• |
Turn-key services: Many homebuilders have taken a more limited role in the homebuilding process and have outsourced certain key elements of the construction process, including process management, product selection, order input, scheduling, framing and installation. As such, we believe that many homebuilders are increasingly looking to suppliers in the Pro Segment to perform these critical functions, resulting in greater demand for integrated project services; and |
|
|
• |
Consolidation of suppliers by homebuilders: We believe that homebuilders are increasingly looking to consolidate their supplier base. Many homebuilders are seeking a more strategic relationship with suppliers that are able to offer a broad range of products and services and, as a result, are allocating a greater share of wallet to a select number of larger, full service suppliers. We believe this trend accelerated during the recent downturn and continues in the current housing market recovery. |
The homebuilding industry experienced a significant downturn which began in 2006. During the downturn, many homebuilders significantly decreased their housing starts because of lower demand and a surplus of both existing and new home inventory. The weakness in the homebuilding industry resulted in a significant reduction in demand for our products and services. Beginning in late 2011, the industry began to stabilize and housing and remodeling activity has steadily strengthened since then. According to the U.S. Census Bureau, the single-family residential construction market was an estimated $243.4 billion in 2016, which was 4.8% higher than 2015, though still down significantly from the historical high of $413.2 billion in 2006. Further, according to the Home Improvement Research institute (“HIRI”), the professional repair and remodel end market was an estimated $98.1 billion in 2016, which was 6.1% higher than 2015.
During the downturn mortgage financing and commercial credit for smaller homebuilders was severely constrained and continues to slow a recovery in our industry despite some recent improvement. However, we believe there are several meaningful trends that indicate U.S. housing demand will likely continue to recover to levels consistent with the historical average of the past fifty years. These trends include relatively low interest rates, the aging of housing stock, and population growth due to immigration and birthrate exceeding death rate. According to the U.S Census Bureau, U.S. single-family housing starts increased 9.4% in 2016 compared to 2015. A composite of third party sources, including the National Association of Homebuilders (“NAHB”), are predicting that U.S. single-family housing starts will increase to approximately 847,000 in 2017, which would represent an 8.4% increase from 2016 actual U.S. single-family housing starts of 781,500. In addition, the HIRI is forecasting sales in the professional repair and remodel end market to increase approximately 4.2% in 2017 compared to 2016.
OUR CUSTOMERS
We serve a broad customer base in 40 states across the United States. We have a diverse geographic footprint as we have operations in 75 of the top 100 U.S. Metropolitan Statistical Areas (“MSAs”), as ranked by single family housing permits based on 2016 U.S. Census data. In addition, approximately 83% of U.S. housing permits in 2016 were issued in MSAs in which we operate. Given the local nature of our business, we have historically and will continue to locate our facilities in close proximity to our key customers and co-locate multiple operations in one facility to improve efficiency.
We have a diversified customer base, ranging from large production builders to small custom homebuilders, as well as multi-family builders, repair and remodeling contractors and light commercial contractors. For the year ended December 31, 2016, our top 10 customers accounted for approximately 16.8% of sales, and no single customer accounted for more than 5% of sales. Our top 10 customers are comprised primarily of the largest production homebuilders, including publicly traded companies such as D.R. Horton, Inc., Pulte Homes, Inc., Lennar Corporation, Hovnanian Enterprises and CalAtlantic Group.
4
In addition to the largest production homebuilders, we also service and supply regional production and local custom homebuilders as well as repair and remodeling contractors. These customers require high levels of service and a broad product offering. Our sales team expects to work very closely with the designers on a day-to-day basis in order to ensure the appropriate products are identified, ordered or produced and delivered on time to the building site. To account for these increased service costs, pricing in the industry is tied to the level of service provided and the volumes purchased.
OUR PRODUCTS AND SERVICES
We group our building products and services into six product categories:
Lumber & Lumber Sheet Goods. Lumber & lumber sheet goods include dimensional lumber, plywood and oriented strand board (“OSB”) products used in on-site house framing. Lumber & lumber sheet goods are our largest sales volume product category. The products in this category are highly sensitive to fluctuations in market prices for such commodities.
Windows, Doors & Millwork. Windows & doors are comprised of the manufacturing, assembly and distribution of windows, and the assembly and distribution of interior and exterior door units. We manufacture a portion of the vinyl windows that we distribute in our plant in Houston, Texas which allows us to supply builders, primarily in the Texas market, with cost-competitive products. Our pre-hung interior and exterior doors consist of a door slab with hinges and door jambs attached, reducing on-site installation time and providing higher quality finished door units than those constructed on site. These products typically require a high degree of product knowledge and training to sell. Millwork includes interior trim and custom features that we manufacture under the Synboard ® brand name. Synboard is produced from extruded PVC and offers several advantages over traditional wood features, such as greater durability and no ongoing maintenance such as periodic caulking and painting.
Manufactured Products. Manufactured products are factory-built substitutes for job-site framing and include wood floor and roof trusses, steel roof trusses, wall panels, stairs, and engineered wood that we design, cut, and assemble for each home. Our manufactured products allow builders to build higher quality homes more efficiently. Roof trusses, floor trusses, wall panels and stair units are built in a factory controlled environment. Engineered floors and beams are cut to the required size and packaged for the given application at many of our locations. Without manufactured products, builders construct these items on site, where weather and variable labor quality can negatively impact construction cost, quality and installation time. In addition, engineered wood beams have greater structural strength than conventional framing materials, allowing builders to frame houses with more open space creating a wider variety of house designs. Engineered wood floors are also stronger and straighter than conventionally framed floors.
Gypsum, Roofing & Insulation. Gypsum, roofing, and insulation include wallboard, ceilings, joint treatment and finishes.
Siding, Metal, and Concrete. Siding, metal, and concrete includes vinyl, composite, and wood siding, exterior trim, other exteriors, metal studs and cement.
Other Building Products & Services. Other building products & services consist of various products, including cabinets and hardware. This category also includes services such as turn-key framing, shell construction, design assistance and professional installation of products spanning all our product categories. We provide professional installation and turn-key services as a solution for our homebuilder customers. Through our installation services program, we help homebuilders realize efficiencies through improved scheduling, resulting in reduced cycle time and better cost controls. By utilizing an energy efficiency software program, we also assist homebuilders in designing energy efficient homes in order to meet increasingly stringent energy rating requirements. Upgrading to our premium windows, doors, and insulating products reduces overall cost to the homebuilder by minimizing costs of the required heating/cooling system. We work closely with the homebuilder to select the appropriate mix of our products in order to meet current and forthcoming energy codes. We believe these services require scale, capital and sophistication that smaller competitors do not possess. We will continue to pursue profitable business in this category.
We compete in a fragmented marketplace. We believe our integrated approach and scale allow us to compete effectively through our comprehensive product lines, prefabricated components, and value-added services combined with the knowledge of our integrated sales forces to enable our homebuilder customers to complete construction more quickly, with higher quality and at a lower cost. While we expect these benefits to be particularly valuable to our customers in market environments characterized by labor shortages, sourcing challenges or sharply rising demand for new homes, we expect such benefits will also be increasingly valued and demanded by our customers operating under normal market conditions.
5
Our manufacturing facilities utilize the latest industry leading technology and the highest quality materials to improve product quality, increase efficiency, reduce lead times and minimize production errors. We manufacture products within two of our product categories: manufactured products, and windows, doors & millwork.
Manufactured Products — Trusses and Wall Panels. Truss and wall panel production has two steps — design and fabrication. Each house requires its own set of designed shop drawings, which vary by builder type: production versus custom builders. Production builders use prototype house plans as they replicate houses. These house plans may be minimally modified to suit individual customer demand. The number of changes made to a given prototype house, and the number of prototype houses used, varies by builder and their construction and sales philosophy. We maintain an electronic master file of trusses and wall panels for each builder’s prototype houses. There are three primary benefits to master filing. First, master filing is cost effective as the electronic master file is used rather than designing the components individually each time the prototype house is built. Second, it improves design quality as a house’s design is based on the proven prototype except for any minor builder modifications. Third, master filing allows us to change one file and update all related prototype house designs automatically as we improve the design over time or as the builder modifies the base prototype house. We do not maintain a master file for custom builders who do not replicate houses, as it is not cost effective. For these builders, the components are designed individually for each house.
After we design shop drawings for a given house, we download the shop drawings into a proprietary software system to review the design for potential errors and to schedule the job for production. The fabrication process begins by cutting individual pieces of lumber to required lengths in accordance with the shop drawings. We download the shop drawings from our design department to computerized saws. We assemble the cut lumber to form roof trusses, floor trusses or wall panels, and store the finished components by house awaiting shipment to the job site.
We generate fabrication time standards for each component during the design step. We use these standards to measure efficiency by comparing actual production time with the calculated standard. Each plant’s performance is benchmarked by comparing efficiency across plants.
Manufactured Products — Engineered Wood. As with trusses and wall panels, engineered wood components have a design and fabrication step. We design engineered wood floors using a master filing system similar to the truss and wall panel system. Engineered wood beams are designed to ensure the beam will be structurally sound in the given application. After the design phase, a printed layout is generated. We use this layout to cut the engineered wood to the required length and assemble all of the components into a house package. We design and fabricate engineered wood at many of our distribution locations.
Manufactured Products — Stairs. We manufacture box stairs at some of our locations. After a house is framed, our salesman takes measurements at the job site prior to manufacturing to account for any variation between the blueprints and the actual framed house. We fabricate box stairs based on these measurements.
Custom Millwork. Our manufactured custom millwork consists primarily of synthetic exterior trim, custom windows, features and box columns that we sell under our Synboard brand name and throughout our company.
We sand, cut, and shape sheets of 4 foot by 18 or 20 foot Celuka-blown, extruded PVC, or Synboard, to produce the desired product. We produce exterior trim boards by cutting the Synboard into the same industry-standard dimensions used for wood-based exterior trim boards. We form exterior features by assembling pieces of Synboard and other PVC-based moldings that have been cut, heated and bent over forms to achieve the desired shape. For custom windows, we build the frame from Synboard and glaze the glass into place. We fabricate box columns from sections of PVC that are cut on a 45 degree angle and mitered together.
Windows. We manufacture a full line of traditional vinyl windows at an approximately 200,000 square foot manufacturing facility located in Houston, Texas. The process begins by purchasing vinyl lineal extrusions. We cut these extrusions to size and join them together to form the window frame and sash. We then purchase sheet glass and cut it to size. We combine two pieces of identically shaped glass with a sealing compound to create a glass unit with improved insulating capability. We then insert the sealed glass unit and glaze it into the window frame and sash. The unit is completed when we install a balance to operate the window and add a lock to secure the window in a closed position.
Pre-hung Doors. We pre-hang interior and exterior doors at many of our locations. We insert door slabs and pre-cut door jambs into a door machine, which bores holes into the doors for the door hardware and applies the jambs and hinges to the door slab. We then apply the casing that frames interior doors at a separate station. Exterior doors do not have a casing, and instead may have sidelights applied to the sides of the door, a transom attached over the top of the door unit and a door sill applied to the threshold.
6
We intend to build on our strong market positions and increase our sales and profits by pursuing the following strategies:
Utilize our competitive strengths to capitalize on housing market recovery and growth
As the U.S. housing market recovery continues, we intend to increase sales through our scale, product portfolio and structural efficiencies. Our Pro Segment homebuilding customers continue to emphasize the importance of competitive pricing, a broad product portfolio, sales force knowledge, on-site services and overall “ease of use” of their building products suppliers. Our comprehensive product offering, experienced sales force and tenured senior management team position us well to capitalize on strong demand in the new home construction market as well as the repair and remodel segment. Our acquisition of ProBuild further developed the suite of products and services we provide to our customers, in addition to substantially expanding our national footprint. This comprehensive network of products, services and facilities provides a platform which we believe enhances our “one-stop-shop” strategy and more evenly distributes and promotes additional “pull through” of our value added products. We believe that homebuilders will continue to place an increased value on these capabilities, which will further differentiate us from our competitors.
Execute on identified cost saving strategies
Our management has shown the capability to effectively and efficiently integrate newly acquired businesses, ramping up productivity and driving value. Prior to the ProBuild acquisition, we successfully integrated 33 acquisitions since 1998. These integration capabilities should enable us to achieve annual run rate cost savings of $100 to $120 million within two years of the close date of the ProBuild acquisition. We have realized approximately $74 million in 2016 and $10 million in 2015 of the anticipated synergy cost savings. One-time costs to achieve these cost savings is estimated to be $90-$100 million, of which we incurred approximately $28 million and $43 million in 2016 and 2015, respectively. The remainder of these costs are expected to be incurred in 2017.
Maximize our share of wallet with individual customers across our service areas
We believe that Pro Segment customers will continue to consolidate the number of supplier relationships they utilize in the future. As a result, this will create the opportunity to win a greater share of wallet for remaining suppliers. By focusing on and developing our differentiated “one-stop-shop” strategy, which includes broadening our product mix, we will be able to offer a complete array of products and services that would otherwise need to be sourced from various distributors. Additionally, as the largest non-specialty distributor of building products, we will be capable of providing customers with a consistent partner on projects regardless of where they are located. This operational platform often will make us a preferred distributor relationship for large scale national homebuilders while still providing value to local and custom homebuilders looking for assistance with product selection, on-site installation and project management.
Continue to leverage strategic vendor relationships
Our acquisition of ProBuild made us the largest non-specialty distributor in the Pro Segment. We believe we will be able to leverage this size and our strong homebuilder relationships to provide our vendors access to a large customer base. We believe that our size, purchasing power, and strong financial position allows us to negotiate favorable pricing (including back-end rebates), savings in procurement costs and to receive a higher priority with our vendors when product supply is limited. We strive to continually enhance our role as a preferred partner for vendors and our size, strong liquidity position, and access to capital markets is expected to mitigate natural credit concerns. Furthermore, our broad product portfolio includes a variety of higher-margin products, which we believe will enhance our preferred partner status. This preferred status enables us to participate in mutually beneficial joint marketing programs with our vendors. These incremental efficiencies in procurement provide an opportunity to pass on additional value to our customers.
Optimize cash flow with highly scalable cost structure
Through the downturn we focused on standardizing processes and technology-based workflows to minimize costs, streamline our operations and enhance working capital efficiency. Significant investments in our technology infrastructure and reengineering of our business processes enabled us to centralize many corporate and field tasks. This standardization helps us to optimize our cost structure, allows our centralized operating team to make better purchasing and pricing decisions based on an accurate, up-to-the-minute understanding of costs and trends, and enables us to redeploy capital more strategically. We believe that these efficiencies will drive enhanced profit margins and cash flow conversion across our entire platform as we continue to grow with improving market conditions.
7
We seek to attract and retain customers through exceptional customer service, leading product quality, broad product and service offerings, and competitive pricing. This strategy is centered on building and maintaining strong customer relationships rather than traditional marketing and advertising. We strive to add value for the homebuilders through shorter lead times, lower material costs, faster project completion and higher quality. By executing this strategy, we believe we will continue to generate new business.
Our experienced, locally focused sales force is at the core of our sales effort. This sales effort involves deploying salespeople who are skilled in housing construction to meet with a homebuilder’s construction superintendent, local purchasing agent, or local executive with the goal of becoming their primary product supplier. If selected by the homebuilder, the salesperson and his or her team review blueprints for the contracted homes and advise the homebuilder in areas such as opportunities for cost reduction, increased energy efficiencies, and regional aesthetic preferences. Next, the team determines the specific package of products that are needed to complete the project and schedules a sequence of site deliveries. Our large delivery fleet and comprehensive inventory management systems enable us to provide “just-in-time” product delivery, ensuring a smoother and faster production cycle for the homebuilder. Throughout the construction process, the salesperson makes frequent site visits to ensure timely delivery and proper installation and to make suggestions for efficiency improvements. We believe this level of service is highly valued by our customers and generates significant customer loyalty. At December 31, 2016, we employed approximately 1,700 sales representatives, who are typically paid a commission based on gross margin dollars collected and work with approximately 1,400 sales coordinators and product specialists.
BACKLOG
Due to the nature of our business, backlog information is not meaningful. While our customers may provide an estimate of their future needs, in most cases we do not receive a firm order from them until just prior to the anticipated delivery dates. Accordingly, in many cases the time frame from receipt of a firm order to shipment does not exceed a few days.
MATERIALS AND SUPPLIER RELATIONSHIPS
We purchase inventory primarily for distribution, some of which is also utilized in our manufacturing plants. The key materials we purchase include dimensional lumber, plywood, OSB, engineered wood, windows, doors, and millwork. Our largest suppliers are national companies such as Weyerhaeuser Company, Boise Cascade Company, Canfor Corporation, Norbord, Inc., James Hardie Industries plc, National Gypsum Company, PlyGem Holdings, Inc., M I Windows and Doors, Inc., Andersen Corporation, Masonite International Corporation and JELD-WEN Inc. We believe there is sufficient supply in the marketplace to competitively source most of our requirements without reliance on any particular supplier and that our diversity of suppliers affords us purchasing flexibility. Due to our centralized procurement platform for commodity wood products and corporate oversight of purchasing programs we believe we are better able to maximize the advantages of both our and our suppliers’ broad geographic footprints and negotiate purchases across multiple markets to achieve more favorable contracts with respect to price, terms of sale, and supply than our regional competitors. Additionally, for certain customers, we institute purchasing programs on commodity wood products such as OSB and lumber to align portions of our procurement costs with our customer pricing commitments. We balance our OSB and lumber purchases with a mix of contract and spot market purchases to ensure consistent supply of product necessary to fulfill customer contracts, to source products at the lowest possible cost, and to minimize our exposure to the volatility of commodity lumber prices.
We currently source products from approximately 6,000 suppliers in order to reduce our dependence on any single company and to maximize purchasing leverage. Although no purchases from any single supplier represented more than 7% of our total materials purchases for the year ended December 31, 2016, we believe we are one of the largest customers for many suppliers, and therefore have significant purchasing leverage. We have found that using multiple suppliers ensures a stable source of products and the best purchasing terms as the suppliers compete to gain and maintain our business.
We maintain strong relationships with our suppliers, and we believe opportunities exist to improve purchasing terms in the future, including inventory storage or “just-in-time” delivery to reduce our inventory carrying costs. We will continue to pursue additional procurement cost savings and purchasing synergies which would further enhance our margins and cash flow.
8
We compete in the Pro Segment of the U.S. residential building products supply market. We have and will continue to experience competition for homebuilder business due to the highly fragmented nature of the Pro Segment. Most of our competitors in the Pro Segment are small, privately held local businesses. Most of these companies have limited access to capital and lack sophisticated information technology systems and large-scale procurement capabilities. We believe we have substantial competitive advantages over these smaller competitors due to our long-standing customer relationships, local market knowledge and competitive pricing. Our largest competitors in our markets include 84 Lumber Co., which is privately held, as well as BMC Stock Holdings, Inc., which is publicly held.
Our customers primarily consist of professional homebuilders and those that provide construction services to them, with whom we focus on developing strong relationships. The principal methods of competition in the Pro Segment are the development of long-term relationships with professional builders and retaining such customers by (i) delivering a full range of high-quality products on time, and (ii) offering trade credit, competitive pricing, flexibility in transaction processing, and integrated service and product packages, such as turn-key framing and shell construction, as well as manufactured components and installation. Our leading market positions in the highly competitive Pro Segment create economies of scale that allow us to cost-effectively supply our customers, which both enhances profitability and reduces the risk of losing customers to competitors.
EMPLOYEES
At December 31, 2016, we had approximately 14,000 full-time equivalent employees. Approximately 2% of the workforce at our company are members of ten different unions. We believe that we have good relations with our employees.
INFORMATION TECHNOLOGY SYSTEMS
Our operations are dependent upon our information technology systems, which encompass all of our major business functions. Our primary enterprise resource planning (“ERP”) system, which we currently use for approximately half of our operations, is a proprietary system that has been highly customized by our computer programmers. The materials required for thousands of standard builder plans are stored by the system for rapid quoting or order entry. Hundreds of price lists are maintained on thousands of SKUs, facilitating rapid price changes in a changing product cost environment. A customer’s order can be tracked at each stage of the process and billing can be customized to reduce a customer’s administrative costs and speed payment.
We have a customized financial reporting system which consolidates financial, sales and workforce data from our ERP systems and our human resource information system (“HRIS”). This technology platform provides management with robust corporate and location level performance management by leveraging standardized metrics and analytics allowing us to plan, track and report performance and compensation measures.
We have developed a proprietary program for use in our component plants. This software reviews product designs for errors, schedules the plants and provides the data used to measure plant efficiency. In addition, we have purchased several software products that have been integrated with our primary ERP system. These programs assist in analyzing blueprints to generate material lists and in purchasing lumber products at the lowest cost.
ProBuild maintained multiple ERP systems to manage its operations. We are in the process of integrating the legacy ProBuild information technology systems with ours, which we expect will be a multi-year process. Our initial area of focus has been where we have operations within the same geographic market. Once overlapping markets have been addressed, we will begin integration of the broader geographic footprint of our company.
SEASONALITY AND OTHER FACTORS
Our first and fourth quarters have historically been, and are generally expected to continue to be, adversely affected by weather causing reduced construction activity during these quarters. In addition, quarterly results historically have reflected, and are expected to continue to reflect, fluctuations from period to period arising from the following:
|
|
• |
The volatility of lumber prices; |
|
|
• |
The cyclical nature of the homebuilding industry; |
|
|
• |
General economic conditions in the markets in which we compete; |
|
|
• |
The pricing policies of our competitors; |
9
|
|
• |
The effects of weather. |
The composition and level of working capital typically change during periods of increasing sales as we carry more inventory and receivables. Working capital levels typically increase in the second and third quarters of the year due to higher sales during the peak residential construction season. These increases have in the past resulted in negative operating cash flows during this peak season, which historically have been financed through available cash and our borrowing availability under credit facilities. Collection of receivables and reduction in inventory levels following the peak building and construction season have in the past positively impacted cash flow.
AVAILABLE INFORMATION
We are subject to the informational requirements of the Securities Exchange Act of 1934, as amended, and in accordance therewith, we file reports, proxy and information statements and other information with the Securities and Exchange Commission (“SEC”). Our annual reports on Form 10-K, quarterly reports on Form 10-Q, current reports on Form 8-K, proxy and information statements and other information and amendments to those reports filed or furnished pursuant to Section 13(a) or 15(d) of the Securities Exchange Act of 1934 are available through the investor relations section of our website under the links to “Financial Information.” Our Internet address is www.bldr.com. Reports are available on our website free of charge as soon as reasonably practicable after we electronically file them with, or furnish them to, the SEC. In addition, our officers and directors file with the SEC initial statements of beneficial ownership and statements of change in beneficial ownership of our securities, which are also available on our website at the same location. We are not including this or any other information on our website as a part of, nor incorporating it by reference into, this Form 10-K or any of our other SEC filings.
In addition to our website, you may read and copy public reports we file with or furnish to the SEC at the SEC’s Public Reference Room at 100 F Street, N.E., Washington, DC 20549. You may obtain information on the operation of the Public Reference Room by calling the SEC at 1-800-SEC-0330. The SEC maintains an Internet site that contains our reports, proxy and information statements, and other information that we electronically file with, or furnish to, the SEC at www.sec.gov.
EXECUTIVE OFFICERS
Floyd F. Sherman, Chief Executive Officer and Director, age 77. Mr. Sherman has been our Chief Executive Officer and a director since 2001, when he joined the Company. He served as President of the Company from 2001 until October 2006 and also served from February 2008 until November 2014. Prior to joining the Company, he spent 28 years at Triangle Pacific/Armstrong Flooring, the last nine of which he served as Chairman and Chief Executive Officer. Mr. Sherman is currently a director of PGT, Inc. Mr. Sherman has over 40 years of experience in the building products industry. A native of Kerhonkson, New York and a veteran of the U.S. Army, Mr. Sherman is a graduate of the New York State College of Forestry at Syracuse University. He also holds an M.B.A. degree from Georgia State University.
M. Chad Crow, President and Chief Operating Officer, age 48. Mr. Crow joined the Company in September 1999 as Assistant Controller. He served as Vice President – Controller of the Company from May 2000 and was promoted to Senior Vice President and Chief Financial Officer in November 2009. In November 2014, he was appointed to the position of President, Chief Operating Officer and Chief Financial Officer. Mr. Crow continued in his position as President and Chief Operating Officer when Mr. Jackson joined the Company as Senior Vice President and Chief Financial Officer in November 2016. Prior to joining the Company, Mr. Crow served in a variety of positions at Pier One Imports. Mr. Crow also has five years of public accounting experience with Price Waterhouse LLP. Mr. Crow is a C.P.A. and received his B.B.A. degree from Texas Tech University.
Donald F. McAleenan, Senior Vice President and General Counsel, age 62. Mr. McAleenan has served as Senior Vice President and General Counsel of the Company since 1998. Prior to joining the Company, Mr. McAleenan served as Vice President and Deputy General Counsel of Fibreboard Corporation from 1992 to 1997. Mr. McAleenan was also Assistant General Counsel of AT&E Corporation and spent nine years as a securities lawyer at two New York City law firms. Mr. McAleenan has a B.S. from Georgetown University and a J.D. from New York University Law School.
Morris E. Tolly, Senior Vice President — Operations, age 73. Mr. Tolly has served as Senior Vice President — Operations of the Company since January 25, 2007. Mr. Tolly has been with Builders FirstSource since 1998 when the Company acquired Pelican Companies, Inc. (“Pelican”) and has over 40 years of experience in the building products industry. He served in a myriad of roles at Pelican, including sales, Sales Manager and General Manager. Mr. Tolly was an Area Vice President responsible for 12 locations at the time of Pelican’s acquisition. In 2000, he was promoted to President of the company’s Southeast Group, with responsibility for 48 locations.
10
Peter M. Jackson, Senior Vice President and Chief Financial Officer, age 45. Mr. Jackson joined the Company on November 4, 2016 as Senior Vice President and Chief Financial Officer. Prior to joining the Company, Mr. Jackson was employed by Lennox International, Inc. (“Lennox”), which manufactures and markets a broad range of heating, ventilation, air conditioning, and refrigeration products. Since July 2014, Mr. Jackson had served as Vice President and CFO of Lennox’s Refrigeration Segment. From March 2013 to June 2014, he was Vice President, Finance - Financial Planning and Analysis and Mergers and Acquisitions for Lennox. He also served as Vice President and Chief Financial Officer of Lennox’s Residential Heating and Cooling Segment from 2007 until 2013. Before joining Lennox, Mr. Jackson served in multiple financial leadership positions at SPX Corporation, General Electric, and Gerber Scientific. Mr. Jackson is a certified public accountant and a graduate of General Electric’s Experienced Financial Leadership program. He holds an M.B.A. degree from Rensselaer Polytechnic Institute and a B.S. from Bryant University.
Risks associated with our business, an investment in our securities, and with achieving the forward-looking statements contained in this report or in our news releases, websites, public filings, investor and analyst conferences or elsewhere, include, but are not limited to, the risk factors described below. Any of the risk factors described below could cause our actual results to differ materially from expectations and could have a material adverse effect on our business, financial condition or operating results. We may not succeed in addressing these challenges and risks.
The industry in which we operate is dependent upon the residential homebuilding industry, as well as the U.S. economy, the credit markets and other important factors.
The building products industry is highly dependent on new home and multifamily construction, which in turn are dependent upon a number of factors, including interest rates, consumer confidence, employment rates, foreclosure rates, housing inventory levels and occupancy, housing demand and the health of the U.S. economy and mortgage markets. Unfavorable changes in demographics, credit markets, consumer confidence, housing affordability, or housing inventory levels and occupancy, or a weakening of the U.S. economy or of any regional or local economy in which we operate could adversely affect consumer spending, result in decreased demand for our products, and adversely affect our business. Production of new homes and multifamily buildings may also decline because of shortages of qualified tradesmen, reliance on inadequately capitalized builders and sub-contractors, and shortages of suitable building lots and material. The homebuilding industry is currently experiencing a shortage of qualified, trained labor in many areas, including those served by us. In addition, the building industry is subject to various local, state, and federal statutes, ordinances, and regulations concerning zoning, building design and safety, construction, energy and water conservation and similar matters, including regulations that impose restrictive zoning and density requirements in order to limit the number of homes that can be built within the boundaries of a particular area or in order to maintain certain areas as primarily or exclusively residential. Regulatory restrictions may increase our operating expenses and limit the availability of suitable building lots for our customers, which could negatively affect our sales and earnings. Because we have substantial fixed costs, relatively modest declines in our customers’ production levels could have a significant adverse effect on our financial condition, operating results and cash flows.
The homebuilding industry is still recovering from a significant downturn that began in mid-2006 and began to stabilize in late 2011. Housing and remodeling activity has steadily strengthened since then. In 2016, U.S. homebuilding activity increased to approximately 781,500 single-family starts although it remains well below the historical average (from 1959 through 2016) of approximately 1.0 million single-family starts per year. According to the U.S. Census Bureau, actual U.S. single family housing starts in the U.S. during 2016 were 46.7% lower than in 2006. We believe that the slow recovery of the housing market is due to a variety of factors including: a severe economic recession, followed by a gradual economic recovery; limited credit availability; shortages of suitable building lots in many regions; shortages of experienced labor; rising home prices in many markets resulting in affordability issues for potential buyers; and soft housing demand in certain markets. The downturn in the homebuilding industry resulted in a substantial reduction in demand for our products and services.
During the downturn mortgage financing and commercial credit for smaller homebuilders was severely constrained and continues to slow a recovery in our industry despite some recent improvement. Since the housing industry is dependent upon the economy as well as potential homebuyers’ access to mortgage financing and homebuilders’ access to commercial credit, it is likely that the housing industry will not fully recover until conditions in the economy and the credit markets further improve.
11
The building supply industry is cyclical and seasonal.
The building products supply industry is subject to cyclical market pressures. Prices of building products are subject to fluctuations arising from changes in supply and demand, national and international economic conditions, labor costs, competition, market speculation, government regulation, and trade policies, as well as from periodic delays in the delivery of lumber and other products. For example, prices of wood products, including lumber and panel products, are subject to significant volatility and directly affect our sales and earnings. In particular, low prices for wood products over a sustained period can adversely affect our financial condition, operating results and cash flows, as can excessive spikes in prices. Our lumber and lumber sheet goods product category represented 33.5% of total sales for the year ended December 31, 2016. We have limited ability to manage the timing and amount of pricing changes for building products. In addition, the supply of building products fluctuates based on available manufacturing capacity. A shortage of capacity or excess capacity in the industry can result in significant increases or declines in prices for those building products, often within a short period of time. Such price fluctuations can adversely affect our financial condition, operating results and cash flows.
In addition, although weather patterns affect our operating results throughout the year, adverse weather historically has reduced construction activity in the first and fourth quarters in the regions where we operate. To the extent that hurricanes, severe storms, floods, other natural disasters or similar events occur in the regions in which we operate, our business may be adversely affected. We anticipate that fluctuations from period to period will continue in the future.
Our industry is highly fragmented and competitive, and increased competitive pressure may adversely affect our results.
The building products supply industry is highly fragmented and competitive. We face, and will continue to face, significant competition from local and regional building materials chains, as well as from privately-owned single site enterprises. Any of these competitors may (1) foresee the course of market development more accurately than we do, (2) develop products that are superior to our products, (3) have the ability to produce or supply similar products at a lower cost, (4) develop stronger relationships with local homebuilders or commercial builders, (5) adapt more quickly to new technologies or evolving customer requirements than we do, or (6) have access to financing on more favorable terms than we can obtain in the market. As a result, we may not be able to compete successfully with them. In addition, home center retailers, which have historically concentrated their sales efforts on retail consumers and small contractors, have intensified their marketing efforts to professional homebuilders in recent years and may continue to intensify these efforts in the future. Furthermore, certain product manufacturers sell and distribute their products directly to production homebuilders or commercial builders. The volume of such direct sales could increase in the future. Additionally, manufacturers of products distributed by us may elect to sell and distribute directly to homebuilders or commercial builders in the future or enter into exclusive supplier arrangements with other distributors. Consolidation of production homebuilders or commercial builders may result in increased competition for their business. Finally, we may not be able to maintain our operating costs or product prices at a level sufficiently low for us to compete effectively. If we are unable to compete effectively, our financial condition, operating results and cash flows may be adversely affected.
We are subject to competitive pricing pressure from our customers.
Production homebuilders and multi-family builders historically have exerted and will continue to exert significant pressure on their outside suppliers to keep prices low because of their market share and their ability to leverage such market share in the highly fragmented building products supply industry. The housing industry downturn and its aftermath have resulted in significantly increased pricing pressures from production homebuilders and other customers. Over the past few years, these pricing pressures have adversely affected our operating results and cash flows. In addition, continued consolidation among production homebuilders or commercial builders, and changes in production homebuilders’ or commercial builders’ purchasing policies or payment practices, could result in additional pricing pressure, and our financial condition, operating results and cash flows may be adversely affected.
Our level of indebtedness could adversely affect our ability to raise additional capital to fund our operations, limit our ability to react to changes in the economy or our industry, and prevent us from meeting our obligations under our debt instruments.
As of December 31, 2016, our debt totaled $1,831.2 million, including $246.0 million of lease finance obligations and capital lease obligations. We also have an $800 million senior secured revolving credit facility (“2015 facility”). As of December 31, 2016, we had $84.8 million of letters of credit outstanding under the 2015 facility. There were no outstanding borrowings under the 2015 facility as of December 31, 2016. In addition, we have significant obligations under ongoing operating leases that are not reflected on our balance sheet.
12
Our substantial debt could have important consequences to us, including:
|
|
• |
increasing our vulnerability to general economic and industry conditions; |
|
|
• |
requiring a substantial portion of our operating cash flow to be dedicated to the payment of principal and interest on our indebtedness, therefore reducing our liquidity and our ability to use our cash flow to fund our operations, capital expenditures, and future business opportunities; |
|
|
• |
exposing us to the risk of increased interest rates, and corresponding increased interest expense, because borrowings under the 2015 facility and the $600.0 million term loan credit agreement (“2015 term loan”) are at variable rates of interest; |
|
|
• |
limiting our ability to obtain additional financing for working capital, capital expenditures, debt service requirements, acquisitions, and general corporate or other purposes; |
|
|
• |
limiting our ability to adjust to changing marketplace conditions and placing us at a competitive disadvantage compared to our competitors who may have less debt. |
|
|
• |
limiting our attractiveness as an investment opportunity for potential investors. |
In addition, some of our debt instruments, including those governing the 2015 facility, the 2015 term loan, the 10.75% senior unsecured notes due 2023 (“2023 notes”) and the 5.625% senior secured notes due 2024 (“2024 notes”), contain cross-default provisions that could result in our debt being declared immediately due and payable under a number of debt instruments, even if we default on only one debt instrument. In such event, it is unlikely that we would be able to satisfy our obligations under all of such accelerated indebtedness simultaneously.
Our financial condition and operating performance including that of our subsidiaries are also subject to prevailing economic and competitive conditions and to certain financial, business and other factors beyond our control. There are no assurances that we will maintain a level of liquidity sufficient to permit us to pay the principal, premium and interest on our indebtedness.
If our cash flows and capital resources are insufficient to fund our debt service obligations, we may be forced to reduce or delay capital expenditures, sell assets, seek additional capital, or restructure or refinance our indebtedness. These alternative measures may not be successful and may not permit us to meet our scheduled debt service obligations. In the absence of such operating results and resources, we could face substantial liquidity problems and might be required to dispose of material assets or operations in an effort to meet our debt service and other obligations. The agreements governing the 2015 facility and the 2015 term loan and the indentures governing our 2023 notes and our 2024 notes restrict our ability to dispose of assets and to use the proceeds from such dispositions. We may not be able to consummate those dispositions or be able to obtain the proceeds that we could realize from them, and these proceeds may not be adequate to meet any debt service obligations then due.
We may have future capital needs and may not be able to obtain additional financing on acceptable terms.
We are substantially reliant on cash on hand and borrowing availability under the 2015 facility, which totaled $681.6 million at December 31, 2016, to provide working capital and fund our operations. Our working capital requirements are likely to grow assuming the housing industry improves. Our inability to renew, amend or replace the 2015 facility, the 2015 term loan, the 2023 notes or the 2024 notes when required or when business conditions warrant could have a material adverse effect on our business, financial condition and results of operations.
Economic and credit market conditions, the performance of our industry, and our financial performance, as well as other factors, may constrain our financing abilities. Our ability to secure additional financing, if available, and to satisfy our financial obligations under indebtedness outstanding from time to time will depend upon our future operating performance, the availability of credit, economic conditions and financial, business and other factors, many of which are beyond our control. Any worsening of current housing market conditions or the macroeconomic factors that affect our industry could require us to seek additional capital and have a material adverse effect on our ability to secure such capital on favorable terms, if at all.
We may be unable to secure additional financing, financing on favorable terms or our operating cash flow may be insufficient to satisfy our financial obligations under indebtedness outstanding from time to time, including the 2015 facility, the 2015 term loan, the 2023 notes and the 2024 notes. The agreements governing the 2015 facility and the 2015 term loan and the indentures governing the 2023 notes and the 2024 notes, moreover, restrict the amount of permitted indebtedness allowed. In addition, if financing is not available when needed, or is available on unfavorable terms, we may be unable to take advantage of business opportunities, including potential acquisitions, or respond to competitive pressures, any of which could have a material adverse effect on our business, financial condition, and results of operations. If additional funds are raised through the issuance of additional equity or convertible debt securities, our stockholders may experience significant dilution.
13
We may incur additional indebtedness.
We may incur additional indebtedness in the future, including collateralized debt, subject to the restrictions contained in the agreements governing the 2015 facility and the 2015 term loan and the indentures governing the 2023 notes and the 2024 notes. If new debt is added to our current debt levels, the related risks that we now face could intensify.
Our debt instruments contain various covenants that limit our ability to operate our business.
Our financing arrangements, including the agreements governing the 2015 facility and the 2015 term loan and the indentures governing the 2023 notes and the 2024 notes, contain various provisions that limit our ability to, among other things:
|
|
• |
transfer or sell assets, including the equity interests of our restricted subsidiaries, or use asset sale proceeds; |
|
|
• |
incur additional debt; |
|
|
• |
pay dividends or distributions on our capital stock or repurchase our capital stock; |
|
|
• |
make certain restricted payments or investments; |
|
|
• |
create liens to secure debt; |
|
|
• |
enter into transactions with affiliates; |
|
|
• |
merge or consolidate with another company or continue to receive the benefits of these financing arrangements under a “change in control” scenario (as defined in those agreements); and |
|
|
• |
engage in unrelated business activities. |
The agreement governing the 2015 facility contains a financial covenant requiring the satisfaction of a minimum fixed charge coverage ratio of 1.00 to 1.00 if our excess availability falls below the greater of $80.0 million or 10% of the maximum borrowing amount. As of December 31, 2016, our excess availability was $667.2 million. We do not anticipate excess availability falling below $80.0 million in 2017.
These provisions may restrict our ability to expand or fully pursue our business strategies. Our ability to comply with the agreements governing the 2015 facility and the 2015 term loan and the indentures governing the 2023 notes and the 2024 notes may be affected by changes in our operating and financial performance, changes in general business and economic conditions, adverse regulatory developments, a change in control or other events beyond our control. The breach of any of these provisions, including those contained in the 2015 facility and the 2015 term loan and the indentures governing the 2023 notes and the 2024 notes, could result in a default under our indebtedness, which could cause those and other obligations to become due and payable. If any of our indebtedness is accelerated, we may not be able to repay it.
In connection with the ProBuild acquisition, we incurred significant additional indebtedness which could adversely affect us, including by decreasing our business flexibility, and increased our interest expense.
Our consolidated indebtedness as of December 31, 2016 was approximately $1,831.2 million. We substantially increased our indebtedness in connection with the ProBuild acquisition, which has increased our interest expense and could have the effect of, among other things, reducing our flexibility to respond to changing business and economic conditions.
The amount of cash required to pay interest on our increased indebtedness level puts greater demands on our cash resources. The increased levels of indebtedness could also reduce funds available for working capital, capital expenditures, acquisitions and other general corporate purposes and may create competitive disadvantages for us relative to other companies with lower debt levels. If we do not achieve the expected benefits and cost savings from the ProBuild acquisition, or if the financial performance of the combined company does not meet current expectations, then our ability to service our indebtedness may be adversely impacted.
Moreover, we may be required to raise substantial additional financing to fund working capital, capital expenditures, acquisitions or other general corporate requirements. Our ability to arrange additional financing or refinancing will depend on, among other factors, our financial position and performance, as well as prevailing market conditions and other factors beyond our control. We cannot assure you that we will be able to obtain additional financing or refinancing on terms acceptable to us or at all.
14
Our variable rate indebtedness subjects us to interest rate risk, which could cause our indebtedness service obligations to increase significantly.
Interest rates may increase in the future. As a result, interest rates on our 2015 facility and our 2015 term loan could be higher or lower than current levels. As of December 31, 2016, we had approximately $467.7 million, or 25.5%, of our outstanding debt at variable interest rates. If interest rates increase, our debt service obligations on the variable rate indebtedness would increase even though the amount borrowed remained the same, and our net income and cash flows, including cash available for servicing our indebtedness, would correspondingly decrease. At December 31, 2016, a 1.0% increase in interest rates on the 2015 term loan would, subject to the interest rate floor specified in the agreement, result in approximately $3.6 million in additional interest expense annually. At December 31, 2016, a 1.0% increase in interest rates on the 2015 facility would result in no additional interest expense annually as we had no outstanding borrowings. The 2015 facility also assesses variable commitment and outstanding letter of credit fees based on quarterly average loan utilization.
The agreements that govern our indebtedness contain various covenants that impose restrictions on us and certain of our subsidiaries that may affect our ability to operate our businesses.
The agreements that govern our indebtedness contain various affirmative and negative covenants that may, subject to certain significant exceptions, restrict the ability of us and certain of our subsidiaries to, among other things, have liens on our property, and/or merge or consolidate with any other person or sell or convey certain of our assets to any one person. The ability of us and our subsidiaries to comply with these provisions may be affected by events beyond our control. Failure to comply with these covenants could result in an event of default, which, if not cured or waived, could accelerate our repayment obligations.
Concluding the integration of Builders FirstSource and ProBuild may be more difficult, costly or time consuming than expected and the anticipated additional benefits and cost savings of the ProBuild acquisition may not be realized.
We continue to assess additional synergies that we may realize as a consolidated company, the realization of which will depend on a number of factors. The success of the ProBuild acquisition, including expected additional benefits and cost savings, will depend, in part, on our ability to successfully conclude the integration of the two businesses. It is possible that the integration process could result in the loss of key employees, higher than expected costs, diversion of management attention, the disruption of the combined company’s ongoing businesses or inconsistencies in standards, controls, procedures and policies that adversely affect the company’s ability to maintain relationships with customers, suppliers, vendors and employees or to achieve the expected additional benefits and cost savings of the ProBuild acquisition. If we experience difficulties concluding the integration process, or if the operating or financial performance of the combined company is less than we expect, we may forfeit some or all of the cost savings achieved to date, and the expected additional benefits and costs savings of the ProBuild acquisition may not be realized fully or at all, or may take longer to realize than expected. The integration planning and implementation process has resulted and will continue to result in significant costs and diversion of management attention and resources. The integration process could have an adverse effect on the combined company for an undetermined period. Further, the actual additional cost savings of the ProBuild acquisition could be less than anticipated.
We are continuing to incur significant costs in connection with the integration of ProBuild and we may not achieve all of the anticipated cost savings.
We have incurred substantial fees and costs related to formulating and implementing integration plans, including facilities and systems consolidation costs and employment-related costs. At the time of the ProBuild acquisition in July 2015 we estimated these integration-related costs in the range of $90 to $100 million over the two-year period following the closing. Through December 31, 2016, we had incurred approximately $71 million of integration-related costs. The remainder of these costs are expected to be incurred in 2017. We continue to assess the magnitude of these costs, and additional unanticipated costs may be incurred in connection with the integration of the combined company’s businesses. Although we expect that the elimination of duplicative costs, as well as the realization of other efficiencies related to the integration of the businesses, should allow us to offset integration-related costs over time, this net benefit may not be achieved in the near term, or at all.
The loss of any of our significant customers or a reduction in the quantity of products they purchase could affect our financial health.
Our ten largest customers generated approximately 16.8% of our sales for the year ended December 31, 2016. We cannot guarantee that we will maintain or improve our relationships with these customers or that we will supply these customers at historical levels. Due to the relatively weak housing market over the past several years, many of our homebuilder customers substantially reduced their construction activity. Some homebuilder customers exited or severely curtailed building activity in certain of our regions during the downturn and in subsequent years.
15
In addition, production homebuilders, commercial builders and other customers may: (1) seek to purchase some of the products that we currently sell directly from manufacturers, (2) elect to establish their own building products manufacturing and distribution facilities or (3) give advantages to manufacturing or distribution intermediaries in which they have an economic stake. Continued consolidation among production homebuilders could also result in a loss of some of our present customers to our competitors. The loss of one or more of our significant customers or deterioration in our relations with any of them could significantly affect our financial condition, operating results and cash flows. Furthermore, our customers are not required to purchase any minimum amount of products from us. The contracts into which we have entered with most of our professional customers typically provide that we supply particular products or services for a certain period of time when and if ordered by the customer. Should our customers purchase our products in significantly lower quantities than they have in the past, such decreased purchases could have a material adverse effect on our financial condition, operating results and cash flows.
A range of factors may make our quarterly revenues and earnings variable.
We have historically experienced, and in the future will continue to experience, variability in revenues and earnings on a quarterly basis. The factors expected to contribute to this variability include, among others: (1) the volatility of prices of lumber, wood products and other building products, (2) the cyclical nature of the homebuilding industry, (3) general economic conditions in the various areas that we serve, (4) the intense competition in the industry, including expansion and growth strategies by competitors, (5) the production schedules of our customers, and (6) the effects of the weather. These factors, among others, make it difficult to project our operating results on a consistent basis, which may affect the price of our stock.
Our continued success will depend on our ability to retain our key employees and to attract and retain new qualified employees.
Our success depends in part on our ability to attract, hire, train and retain qualified managerial, operational, sales and other personnel. We face significant competition for these types of employees in our industry and from other industries. We may be unsuccessful in attracting and retaining the personnel we require to conduct and expand our operations successfully. In addition, key personnel may leave us and compete against us. Our success also depends to a significant extent on the continued service of our senior management team. We may be unsuccessful in replacing key managers who either resign or retire. The loss of any member of our senior management team or other experienced senior employees could impair our ability to execute our business plan, cause us to lose customers and reduce our net sales, or lead to employee morale problems and/or the loss of other key employees. In any such event, our financial condition, operating results and cash flows could be adversely affected.
Product shortages, loss of key suppliers, and our dependence on third-party suppliers and manufacturers could affect our financial health.
Our ability to offer a wide variety of products to our customers is dependent upon our ability to obtain adequate product supply from manufacturers and other suppliers. Generally, our products are obtainable from various sources and in sufficient quantities. However, the loss of, or a substantial decrease in the availability of, products from our suppliers or the loss of key supplier arrangements could adversely impact our financial condition, operating results, and cash flows.
Although in many instances we have agreements with our suppliers, these agreements are generally terminable by either party on limited notice. Failure by our suppliers to continue to supply us with products on commercially reasonable terms, or at all, could put pressure on our operating margins or have a material adverse effect on our financial condition, operating results and cash flows. Short-term changes in the cost of these materials, some of which are subject to significant fluctuations, are sometimes, but not always passed on to our customers. Our delayed ability to pass on material price increases to our customers could adversely impact our financial condition, operating results and cash flows.
If the housing market declines, we may be required to take impairment charges relating to our operations or temporarily idle or permanently close under-performing locations.
If conditions in the housing industry deteriorate we may need to take goodwill and/or asset impairment charges relating to certain of our reporting units. Any such non-cash charges would have an adverse effect on our financial results. In addition, in response to industry conditions, we may have to temporarily idle or permanently close certain facilities in under-performing regions. Any such facility closures could have a significant adverse effect on our financial condition, operating results and cash flows.
16
The nature of our business exposes us to product liability, product warranty, casualty, construction defect, asbestos, vehicle and other claims and legal proceedings.
We are involved in product liability, product warranty, casualty, construction defect, asbestos, vehicle and other claims relating to the products we manufacture and distribute, and services we provide that, if adversely determined, could adversely affect our financial condition, operating results, and cash flows. We rely on manufacturers and other suppliers to provide us with many of the products we sell and distribute. Because we have no direct control over the quality of such products manufactured or supplied by such third-party suppliers, we are exposed to risks relating to the quality of such products. In the fourth quarter of 2016, the Company has seen an increased occurrence of known and threatened legal claims, primarily related to construction defect type claims. We are also involved in several asbestos personal injury suits due to the alleged sale of asbestos-containing products by legacy businesses that we acquired. In addition, we are exposed to potential claims arising from the conduct of our respective employees and subcontractors, and builders and their subcontractors, for which we may be contractually liable. Although we currently maintain what we believe to be suitable and adequate insurance in excess of our self-insured amounts, there can be no assurance that we will be able to maintain such insurance on acceptable terms or that such insurance will provide adequate protection against potential liabilities. Product liability, product warranty, casualty, construction defect, asbestos, vehicle, and other claims can be expensive to defend and can divert the attention of management and other personnel for significant periods, regardless of the ultimate outcome. Claims of this nature could also have a negative impact on customer confidence in our products and our company. In addition, we are involved on an ongoing basis in other types of legal proceedings. We cannot assure you that any current or future claims against us will not adversely affect our financial condition, operating results and cash flows.
We occupy most of our facilities under long-term non-cancelable leases. We may be unable to renew leases at the end of their terms. If we close a facility, we are still obligated under the applicable lease.
Most of our facilities are leased. Many of our leases are non-cancelable, typically have initial expiration terms ranging from five to 15 years and most provide options to renew for specified periods of time. We believe that leases we enter into in the future will likely be of the same terms (five to 15 years), will be non-cancelable and will feature similar renewal options. If we close or idle a facility we would remain committed to perform our obligations under the applicable lease, which would include, among other things, payment of the base rent, insurance, taxes and other expenses on the leased property for the balance of the lease term. Management may explore offsets to remaining obligations such as subleasing opportunities or negotiated lease terminations. During the period from 2007 through 2016, we closed or idled a number of facilities for which we continue to remain liable. Our obligation to continue making rental payments with respect to leases for closed or idled facilities could have a material adverse effect on our business and results of operations. At the end of a lease term and any renewal period for a leased facility, for those locations where we have no renewal options remaining, we may be unable to renew the lease without additional cost, if at all. If we are unable to renew our facility leases, we may close or, if possible, relocate the facility, which could subject us to additional costs and risks which could have a material adverse effect on our business. Additionally, the revenue and profit generated at a relocated facility may not equal the revenue and profit generated at the former operation.
We are a holding company and conduct all of our operations through our subsidiaries.
We are a holding company that derives all of our operating income from our subsidiaries. All of our assets are held by our direct and indirect subsidiaries. We rely on the earnings and cash flows of our subsidiaries, which are paid to us by our subsidiaries in the form of dividends and other payments or distributions, to meet our debt service obligations. The ability of our subsidiaries to pay dividends or make other payments or distributions to us will depend on their respective operating results and may be restricted by, among other things, the laws of their jurisdiction of organization (which may limit the amount of funds available for the payment of dividends and other distributions to us), the terms of existing and future indebtedness and other agreements of our subsidiaries, the 2015 facility, the 2015 term loan, the terms of the indentures governing the 2023 notes and the 2024 notes and the covenants of any future outstanding indebtedness we or our subsidiaries incur.
17
We may be adversely affected by any disruption in our respective information technology systems.
Our operations are dependent upon our information technology systems, which encompass all of our major business functions. Our ProBuild subsidiary currently maintains multiple ERP systems to manage its operations. We plan to integrate ProBuild’s systems with ours over time and have commenced that process. We may encounter significant operational disruptions and higher than expected costs in connection with such integration process, which could have a material adverse effect on our financial condition, operating results and cash flows. Our primary ERP system is a proprietary system that has been highly customized by our computer programmers. Our centralized financial reporting system currently draws data from our ERP systems. We rely upon our information technology systems to manage and replenish inventory, to fill and ship customer orders on a timely basis, and to coordinate our sales activities across all of our products and services. A substantial disruption in our information technology systems for any prolonged time period (arising from, for example, system capacity limits from unexpected increases in our volume of business, outages, or delays in our service) could result in delays in receiving inventory and supplies or filling customer orders and adversely affect our customer service and relationships. Our systems might be damaged or interrupted by natural or man-made events or by computer viruses, physical or electronic break-ins, or similar disruptions affecting the global Internet. There can be no assurance that such delays, problems, or associated costs will not have a material adverse effect on our financial condition, operating results and cash flows.
We are subject to cybersecurity risks and may incur increasing costs in an effort to minimize those risks.
Our business employs systems that allow for the secure storage and transmission of customers’ proprietary information. Security breaches could expose us to a risk of loss or misuse of this information, litigation and potential liability. We may not have the resources or technical sophistication to anticipate or prevent rapidly evolving types of cyber-attacks. Any compromise of our security could result in a violation of applicable privacy and other laws, significant legal and financial exposure, damage to our reputation and a loss of confidence in our security measures, which could harm our business. The regulatory environment related to information security and privacy is increasingly rigorous, with new and constantly changing requirements applicable to our business, and compliance with those requirements could result in additional costs. Our computer systems have been, and will likely continue to be, subjected to computer viruses or other malicious codes, unauthorized access attempts and cyber- or phishing-attacks. These events could compromise our confidential information, impede or interrupt our business operations, and may result in other negative consequences, including remediation costs, loss of revenue, litigation and reputational damage. To date, we have not experienced a material breach of cybersecurity. As cyber-attacks become more sophisticated we may be required to incur significant costs to strengthen our systems from outside intrusions and/or maintain insurance coverage related to the threat of such attacks. While we have implemented administrative and technical controls and have taken other preventive actions to reduce the risk of cyber incidents and protect our information technology, they may be insufficient to prevent physical and electronic break-ins, cyber-attacks or other security breaches to our computer systems.
We are subject to payments-related risks that could increase our operating costs, expose us to fraud, subject us to potential liability and potentially disrupt our business.
We accept payments using a variety of methods, including credit card, debit card, gift cards, direct debit from a customer’s bank account, consumer invoicing, and physical bank checks, and we may offer different payment options over time. These payment options subject us to many compliance requirements, including, but not limited to, compliance with payment card association operating rules, including data security rules, certification requirements, rules governing electronic funds transfers and Payment Card Industry Data Security Standards. They also subject us to potential fraud by criminal elements seeking to discover and take advantage of security vulnerabilities that may exist in some of these payment systems. For certain payment methods, including credit and debit cards, we pay interchange and other fees, which may increase over time and raise our operating costs and lower profitability. We rely on third parties to provide payment processing services, including the processing of credit and debit cards, and it could disrupt our business if these companies become unwilling or unable to provide these services to us. If we fail to comply with these rules or requirements, or if our data security systems are breached or compromised, we may be liable for card issuing banks’ costs, subject to fines and higher transaction fees, and lose our ability to accept credit and debit card payments from our customers, process electronic funds transfers, or facilitate other types of online payments, and our business and operating results could be adversely affected.
We may be adversely affected by any natural or man-made disruptions to our distribution and manufacturing facilities.
We currently maintain a broad network of distribution and manufacturing facilities throughout the U.S. Any widespread disruption to our facilities resulting from fire, earthquake, weather-related events, an act of terrorism or any other cause could damage a significant portion of our inventory and could materially impair our ability to distribute our products to customers. Moreover, we could incur significantly higher costs and longer lead times associated with distributing our products to our customers during the time that it takes for us to reopen or replace a damaged facility. In addition, any shortages of fuel or significant fuel cost increases could disrupt our ability to distribute products to our customers. If any of these events were to occur, our financial condition, operating results and cash flows could be materially adversely affected.
18
We may be unable to successfully implement our growth strategy, which includes increasing sales of our prefabricated components and other value-added products, pursuing strategic acquisitions, opening new facilities and reducing our outstanding debt.
Our long-term strategy depends in part on growing our sales of prefabricated components and other value-added products and increasing our market share. If any of these initiatives are not successful, or require extensive investment, our growth may be limited, and we may be unable to achieve or maintain expected levels of growth and profitability.
Our long-term business plan also provides for continued growth through strategic acquisitions and organic growth through the construction of new facilities or the expansion of existing facilities. Failure to identify and acquire suitable acquisition candidates on appropriate terms could have a material adverse effect on our growth strategy. Moreover, reduced operating results during the historically slow economic recovery, our liquidity position, or the requirements of the 2015 facility, the 2015 term loan or the indentures governing the 2023 notes and the 2024 notes, could prevent us from obtaining the capital required to effect new acquisitions or expansions of existing facilities. Our failure to make successful acquisitions or to build or expand needed facilities, including manufacturing facilities, produce saleable product, or meet customer demand in a timely manner could adversely affect our financial condition, operating results, and cash flows A negative impact on our financial condition, operating results and cash flows, or our decision to invest in strategic acquisitions or new facilities, could adversely affect our ability to reduce our substantial outstanding debt.
In addition, although we have been successful in the past in integrating 33 acquisitions, we may not be able to fully integrate the operations of ProBuild or any future acquired businesses with our own in an efficient and cost-effective manner or without significant disruption to our or ProBuild’s existing operations. Moreover, acquisitions, including the ProBuild acquisition, involve significant risks and uncertainties, including uncertainties as to the future financial performance of the acquired business, the achievement of expected synergies, difficulties integrating acquired personnel and corporate cultures into our business, the potential loss of key employees, customers or suppliers, difficulties in integrating different computer and accounting systems, exposure to unforeseen liabilities of acquired companies and the diversion of management attention and resources from existing operations. We may be unable to successfully complete potential acquisitions due to multiple factors, such as issues related to regulatory review of the proposed transactions. We may also be required to incur additional debt in order to consummate acquisitions in the future. Potential new debt may be substantial and may limit our flexibility in using our cash flow from operations. Our failure to fully integrate ProBuild’s business or future acquired businesses effectively or to manage other consequences of our acquisitions, including increased indebtedness, could prevent us from remaining competitive and, ultimately, could adversely affect our financial condition, operating results and cash flows.
Federal, state, local and other regulations could impose substantial costs and/or restrictions on our operations that would reduce our net income.
We are subject to various federal, state, local and other regulations, including, among other things, regulations promulgated by the Department of Transportation and applicable to our fleet of delivery trucks, work safety regulations promulgated by the Department of Labor’s Occupational Safety and Health Administration, employment regulations promulgated by the United States Equal Employment Opportunity Commission, accounting standards issued by the Financial Accounting Standards Board (“FASB”) or similar entities, state and local regulations relating to our escrow business, and state and local zoning restrictions and building codes. More burdensome regulatory requirements in these or other areas may increase our general and administrative costs and adversely affect our financial condition, operating results and cash flows. Moreover, failure to comply with the regulatory requirements applicable to our business could expose us to substantial penalties that could adversely affect our financial condition, operating results and cash flows.
We are subject to potential exposure to environmental liabilities and are subject to environmental regulation.
We are subject to various federal, state and local environmental laws, ordinances and regulations. Although we believe that our facilities are in material compliance with such laws, ordinances, and regulations, as owners and lessees of real property, we can be held liable for the investigation or remediation of contamination on such properties, in some circumstances, without regard to whether we knew of or were responsible for such contamination. No assurance can be provided that remediation may not be required in the future as a result of spills or releases of petroleum products or hazardous substances, the discovery of unknown environmental conditions, more stringent standards regarding existing residual contamination, or changes in legislation, laws, rules or regulations. More burdensome environmental regulatory requirements may increase our general and administrative costs and adversely affect our financial condition, operating results and cash flows.
19
We may be adversely affected by uncertainty in the economy and financial markets, including as a result of terrorism or unrest in the Middle East, Europe or elsewhere.
Instability in the economy and financial markets, including as a result of terrorism or unrest in the Middle East, Europe or elsewhere, may result in a decrease in housing starts, which would adversely affect our business. In addition, such unrest or related adverse developments, including a retaliatory military strike or terrorist attack, may cause unpredictable or unfavorable economic conditions and could have a material adverse effect on our financial condition, operating results, and cash flows. Any shortages of fuel or significant fuel cost increases related to geopolitical conditions could seriously disrupt our ability to distribute products to our customers. In addition, domestic terrorist attacks may affect our ability to keep our operations and services functioning properly and could have a material adverse effect on our financial condition, operating results and cash flows.
Some Company Employees are Unionized.
Approximately 2% of the workforce at our company are members of ten different unions. There can be no assurance that additional employees of our company will not conduct union organization campaigns or become union members in the future.
The ownership position of affiliates of JLL Partners, Inc. limits other stockholders’ ability to influence corporate matters.
Affiliates of JLL Partners, Inc. (“JLL”) owned approximately 21.8% of our outstanding common stock as of December 31, 2016. Two of our eight directors hold positions with affiliates of JLL. Accordingly, JLL has significant influence over our management and affairs and over all matters requiring stockholder approval, including the election of directors and significant corporate transactions, such as a merger or other sale of our company or its assets. This ownership position limits other stockholders’ ability to influence corporate matters and, as a result, we may take actions that some of our stockholders do not view as beneficial. Additionally, JLL is in the business of making investments in companies and may, from time to time, acquire and hold interests in businesses that compete directly or indirectly with us. These entities may also pursue, for their own accounts, acquisition opportunities that may be complementary to our business, and, as a result, those acquisition opportunities may not be available to us. Further, certain provisions of our amended and restated certificate of incorporation and amended and restated bylaws may limit your ability to influence corporate matters, and, as a result, we may take actions that some of our stockholders do not view as beneficial.
If JLL were to sell a large portion of its ownership position the Company could experience a Section 382 Ownership Change, which is described more fully in Note 12 to the consolidated financial statements included in Item 8 of this annual report on Form 10-K. If the Company were to experience a Section 382 Ownership change annual limitations would be imposed on certain of the Company’s tax attributes, including net operating loss and capital loss carryforwards, and certain other losses, credits, deductions or tax basis.
The trading price of our common stock has been and may continue to be subject to wide fluctuations.
Between January 1, 2016 and December 31, 2016, the price of our common stock on the NASDAQ ranged from $6.50 to $14.09 per share. Our stock price may fluctuate in response to a number of events and factors, including those described in this “Risk Factors” section. Additionally, our substantial indebtedness may hinder the demand for our common stock, which could have a material adverse effect on the market price of our common stock.
The price of our common stock is volatile and may decline.
The market price of our common stock historically has experienced and may continue to experience significant price fluctuations similar to those experienced by the broader stock market in recent years. In addition, the price of our common stock may fluctuate significantly in response to various factors, including:
|
|
• |
actual or anticipated fluctuations in our results of operations; |
|
|
• |
announcements by us or our competitors of significant business developments, changes in customer relationships, acquisitions, or expansion plans; |
|
|
• |
changes in the prices of products we sell; |
|
|
• |
involvement in litigation; |
|
|
• |
our sale of common stock or other securities in the future; |
|
|
• |
market conditions in our industry; |
|
|
• |
changes in key personnel; |
|
|
• |
changes in market valuation or earnings of our competitors; |
20
|
|
• |
changes in the estimation of the future size and growth rate of our markets; and |
|
|
• |
general economic and market conditions; |
Broad market and industry factors may materially harm the market price of our common stock, regardless of our operating performance. In the past, following periods of volatility in the market price of a company’s securities, securities class action litigation has often been instituted against that company.
If we were involved in any similar litigation we could incur substantial costs and our management’s attention and resources could be diverted, which could adversely affect our financial condition, results of operations and cash flows. As a result, it may be difficult for you to resell your shares of common stock in the future.
Significant sales of our common stock, or the perception that significant sales may occur in the future, could adversely affect the market price of our common stock.
The sale of substantial amounts of our common stock could adversely affect the price of our common stock. Sales of substantial amounts of our common stock in the public market, and the availability of shares for future sale, including 3.5 million shares of our common stock issuable as of December 31, 2016, upon exercise of outstanding vested and unvested options to acquire shares of our common stock and through the conversion of 2.2 million restricted stock units under our stock incentive plans could adversely affect the prevailing market price of our common stock and could cause the market price of our common stock to remain low for a substantial time. Additional stock grants may also be made under our incentive plans, including our 2014 Incentive Plan, as it may be amended. Further, affiliates of JLL own approximately 21.8% of our outstanding common stock as of December 31, 2016, and may sell shares of our common stock in the future. We cannot foresee the effect of such potential sales on the market, but it is possible that if a significant percentage of such available shares were attempted to be sold within a short period of time, the market for our shares of common stock would be adversely affected. It is also unclear whether or not the market for our common stock could absorb a large number of attempted sales in a short period of time, regardless of the price at which they might be offered. Even if a substantial number of sales do not occur within a short period of time, the mere existence of this “market overhang” could have a negative effect on the market for our common stock and our ability to raise additional capital.
We do not have any current plan to pay, and are restricted in our ability to pay, any dividends on our common stock, and as a result, your only opportunity to achieve a return on your investment in our common stock is if the price of our common stock increases.
We anticipate that we will retain all future earnings and other cash resources for the future operation and development of our business. Accordingly, we do not intend to declare or pay regular cash dividends on our common stock in the near future. Payment of any future dividends will be at the discretion of our board of directors after taking into account many factors, including our operating results, financial condition, current and anticipated cash needs and plans for expansion. The declaration and payment of any dividends on our common stock is also restricted by the terms of our outstanding indebtedness.
Item 1B. Unresolved Staff Comments
None.
We have a broad network of distribution and manufacturing facilities in 40 states throughout the U.S. Based on 2016 U.S. Census data, we have operations in 75 of the top 100 U.S. Metropolitan Statistical Areas, as ranked by single family housing permits in 2016.
Distribution centers typically include 10 to 15 acres of outside storage, a 45,000 square foot warehouse, 4,000 square feet of office space, and 15,000 square feet of covered storage. The outside area provides space for lumber storage and a staging area for delivery while the warehouse stores millwork, windows and doors. The distribution centers are usually located in industrial areas with low cost real estate and easy access to freeways to maximize distribution efficiency and convenience. Many of our distribution centers are situated on rail lines for efficient receipt of goods.
Our manufacturing facilities produce trusses, wall panels, engineered wood, stairs, windows, pre-hung doors and custom millwork. In many cases, they are located on the same premises as our distribution facilities. Truss and panel manufacturing facilities
21
vary in size from 30,000 square feet to 60,000 square feet with 8 to 10 acres of outside storage for lumber and for finished goods. Our window manufacturing facility in Houston, Texas has approximately 200,000 square feet.
We contractually lease 309 facilities and own 91 facilities. These leases typically have an initial operating lease term of 5 to 15 years and most provide options to renew for specified periods of time. A majority of our leases provide for fixed annual rentals. Certain of our leases include provisions for escalating rent, as an example, based on changes in the consumer price index. Most of the leases require us to pay taxes, insurance and common area maintenance expenses associated with the properties. As described in Note 8 to the consolidated financial statements included in Item 8 of this annual report on Form 10-K, 150 of our leased facilities are subject to a sales-lease back transaction that is accounted for in our financial statements as owned assets with offsetting lease financing obligations.
We operate a fleet of approximately 10,700 rolling stock units, which primarily includes forklifts, trailers and approximately 4,600 trucks to deliver products from our distribution and manufacturing centers to our customer’s job sites. Through our emphasis on local market flexibility and strategically placed locations, we minimize shipping and freight costs while maintaining a high degree of local market expertise. Through knowledge of local homebuilder needs, customer coordination and rapid restocking ability, we reduce working capital requirements and guard against out-of-stock products. We believe that this reliability is highly valued by our customers and reinforces customer relationships.
We are involved in various claims and lawsuits incidental to the conduct of our business in the ordinary course. We carry insurance coverage in such amounts in excess of our self-insured retention as we believe to be reasonable under the circumstances, but such insurance does not cover all of our liabilities in respect of most claims and lawsuits. We do not believe that the ultimate resolution of these matters will have a material adverse effect on our consolidated financial position, cash flows or operating results.
Although our business and facilities are subject to federal, state and local environmental regulation, environmental regulation does not have a material effect on our operations. We believe that our facilities are in material compliance with such laws and regulations. As owners and lessees of real property, we can be held liable for the investigation or remediation of contamination on such properties, in some circumstances without regard to whether we knew of or were responsible for such contamination. Our current expenditures with respect to environmental investigation and remediation at our facilities are minimal, although no assurance can be provided that more significant remediation may not be required in the future as a result of spills or releases of petroleum products or hazardous substances or the discovery of unknown environmental conditions, or changes in legislation, laws, rules or regulations.
Item 4. Mine Safety Disclosures
Not applicable.
22
Item 5. Market for Registrant’s Common Equity, Related Stockholder Matters and Issuer Purchases of Equity Securities
Our common stock is traded on the NASDAQ Stock Market LLC under the symbol “BLDR”. On February 24, 2017, the closing price of our common stock as reported on the NASDAQ Stock Market LLC was $12.24. The approximate number of stockholders of record of our common stock on that date was 117, although we believe that the number of beneficial owners of our common stock is substantially greater.
The table below sets forth the high and low sales prices of our common stock for the periods indicated:
|
|
|
High |
|
|
Low |
|
||
|
2016 |
|
|
|
|
|
|
|
|
|
First quarter |
|
$ |
11.34 |
|
|
$ |
6.50 |
|
|
Second quarter |
|
$ |
12.77 |
|
|
$ |
10.15 |
|
|
Third quarter |
|
$ |
14.09 |
|
|
$ |
10.99 |
|
|
Fourth quarter |
|
$ |
12.28 |
|
|
$ |
9.04 |
|
|
2015 |
|
|
|
|
|
|
|
|
|
First quarter |
|
$ |
7.06 |
|
|
$ |
5.71 |
|
|
Second quarter |
|
$ |
14.24 |
|
|
$ |
6.54 |
|
|
Third quarter |
|
$ |
16.69 |
|
|
$ |
11.98 |
|
|
Fourth quarter |
|
$ |
15.72 |
|
|
$ |
10.02 |
|
We have not declared or paid cash dividends in the two most recent fiscal years. Any future determination relating to dividend policy will be made at the discretion of our board of directors and will depend on a number of factors, including restrictions in our debt instruments, as well as our future earnings, capital requirements, financial condition, prospects and other factors that our board of directors may deem relevant. Our debt agreements currently restrict our ability to pay dividends. See “Management’s Discussion and Analysis of Financial Condition and Results of Operations — Liquidity and Capital Resources” contained in Item 7 of this annual report on Form 10-K.
23
The graph below matches the cumulative 5-Year total return of holders of Builders FirstSource, Inc.'s common stock with the cumulative total returns of the Russell 2000 index and the S&P 600 Building Products index. The graph assumes that the value of the investment in our common stock and in each index (including reinvestment of dividends) was $100 on December 31, 2011 and tracks it through December 31, 2016.
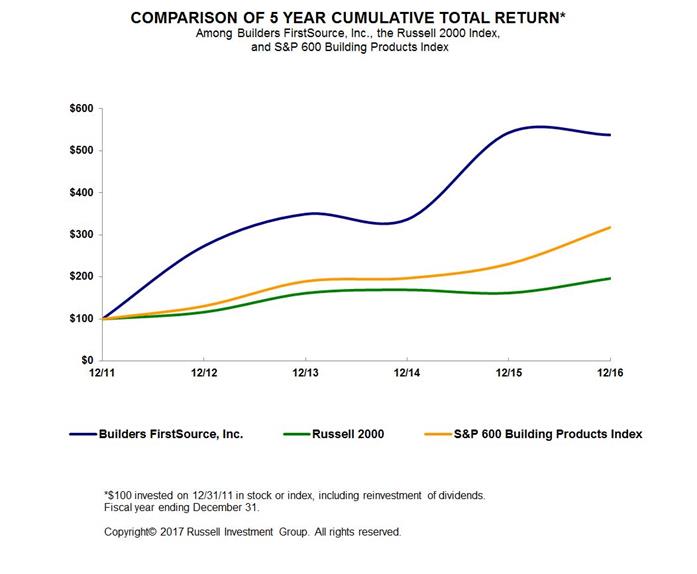
|
|
|
12/11 |
|
|
12/12 |
|
|
12/13 |
|
|
12/14 |
|
|
12/15 |
|
|
12/16 |
|
||||||
|
Builders FirstSource, Inc. |
|
|
100.00 |
|
|
|
273.53 |
|
|
|
349.51 |
|
|
|
336.76 |
|
|
|
543.14 |
|
|
|
537.75 |
|
|
Russell 2000 |
|
|
100.00 |
|
|
|
116.35 |
|
|
|
161.52 |
|
|
|
169.43 |
|
|
|
161.95 |
|
|
|
196.45 |
|
|
S&P 600 Building Products Index |
|
|
100.00 |
|
|
|
130.78 |
|
|
|
189.80 |
|
|
|
197.06 |
|
|
|
231.02 |
|
|
|
317.98 |
|
The stock price performance included in this graph is not necessarily indicative of future stock price performance.
The information regarding securities authorized for issuance under equity compensation plans appears in our definitive proxy statement for our annual meeting of stockholders to be held on May 24, 2017 under the caption “Equity Compensation Plan Information,” which information is incorporated herein by reference.
24
Item 6. Selected Financial Data
The following selected consolidated financial data for the years ended December 31, 2016, 2015 and 2014 and as of December 31, 2016 and 2015 were derived from our consolidated financial statements that have been audited by PricewaterhouseCoopers LLP, independent registered public accounting firm, and are included as Item 8 of this annual report on Form 10-K. Selected consolidated financial data as of December 31, 2014 and as of and for the years ended December 31, 2013 and 2012 were derived from our consolidated financial statements that have been audited by PricewaterhouseCoopers LLP, but are not included herein.
The following data should be read in conjunction with “Management’s Discussion and Analysis of Financial Condition and Results of Operations” contained in Item 7 of this annual report on Form 10-K and with our consolidated financial statements and related notes included as Item 8 of this annual report on Form 10-K.
|
|
|
Year Ended December 31, |
|
|
|||||||||||||||||
|
|
|
2016 |
|
|
2015 |
|
|
2014 |
|
|
2013 |
|
|
2012 |
|
|
|||||
|
|
|
(In thousands, except per share amounts) |
|
|
|||||||||||||||||
|
Statement of operations data: |
|
|
|
|
|
|
|
|
|
|
|
|
|
|
|
|
|
|
|
|
|
|
Sales |
|
$ |
6,367,284 |
|
|
$ |
3,564,425 |
|
|
$ |
1,604,096 |
|
|
$ |
1,489,892 |
|
|
$ |
1,070,676 |
|
|
|
Gross margin |
|
|
1,596,748 |
|
|
|
901,458 |
|
|
|
356,997 |
|
|
|
319,920 |
|
|
|
214,566 |
|
|
|
Selling, general and administrative expenses |
|
|
1,360,412 |
|
|
|
810,703 |
|
|
|
307,387 |
|
|
|
272,204 |
|
|
|
225,706 |
|
|
|
Net income (loss) (1)(2) |
|
|
144,341 |
|
|
|
(22,831 |
) |
|
|
18,150 |
|
|
|
(42,691 |
) |
|
|
(56,856 |
) |
|
|
Net income (loss) per share — basic |
|
$ |
1.30 |
|
|
$ |
(0.22 |
) |
|
$ |
0.19 |
|
|
$ |
(0.44 |
) |
|
$ |
(0.60 |
) |
|
|
Net income (loss) per share — diluted |
|
$ |
1.27 |
|
|
$ |
(0.22 |
) |
|
$ |
0.18 |
|
|
$ |
(0.44 |
) |
|
$ |
(0.60 |
) |
|
|
Balance sheet data (end of period): |
|
|
|
|
|
|
|
|
|
|
|
|
|
|
|
|
|
|
|
|
|
|
Cash and cash equivalents |
|
$ |
14,449 |
|
|
$ |
65,063 |
|
|
$ |
17,773 |
|
|
$ |
54,696 |
|
|
$ |
131,432 |
|
|
|
Total assets |
|
|
2,909,887 |
|
|
|
2,882,038 |
|
|
|
574,065 |
|
|
|
505,436 |
|
|
|
548,369 |
|
|
|
Total debt (including current portion) |
|
|
1,802,052 |
|
|
|
1,951,671 |
|
|
|
374,903 |
|
|
|
343,567 |
|
|
|
358,483 |
|
|
|
Stockholders’ equity |
|
|
309,620 |
|
|
|
149,195 |
|
|
|
40,200 |
|
|
|
15,368 |
|
|
|
48,096 |
|
|
|
Other financial data: |
|
|
|
|
|
|
|
|
|
|
|
|
|
|
|
|
|
|
|
|
|
|
Depreciation and amortization |
|
$ |
109,793 |
|
|
$ |
58,280 |
|
|
$ |
9,519 |
|
|
$ |
9,305 |
|
|
$ |
11,120 |
|
|
|
(1) |
As discussed in Note 12 to the consolidated financial statements included in Item 8 of this annual report on Form 10-K, net income included a reduction to our valuation allowance of $131.7 million as we released the valuation allowance against our net federal and certain state deferred tax assets for the year ended December 31, 2016. Net loss included a valuation allowance of $9.7 million against primarily all of our deferred tax assets for the year ended December 31, 2015. Net income included a reduction to our valuation allowance of $7.2 million due to the utilization of net operating loss carryforwards to reduce taxable income for the year ended December 31, 2014. Net loss included a valuation allowance of $15.3 million and $19.6 million against primarily all of our deferred tax assets for the years ended December 31, 2013 and 2012, respectively. |
|
(2) |
Net income for the year ended December 31, 2016 includes a loss on debt extinguishment and other financing costs of $56.9 million resulting from multiple debt transactions executed in the current year. Our 2016 debt transactions are discussed in detail in Note 8 to the consolidated financial statements included in Item 8 of this annual report on Form 10-K. Net loss for the year ended December 31, 2015 includes $38.6 million of acquisition and transaction related costs associated with the ProBuild acquisition, including $13.2 million in commitment fees related to bridge and backstop financing facilities incurred in connection with the financing of the ProBuild acquisition. In addition, net loss for the year ended December 31, 2015 also includes $10.3 million related to non-cash interest expense from the amortization of debt discount and deferred loan costs, and fair value adjustments related to our warrants. Net loss for the year ended December 31, 2013 included a $39.5 million prepayment penalty. |
25
Item 7. Management’s Discussion and Analysis of Financial Condition and Results of Operations
The following discussion of our financial condition and results of operations should be read in conjunction with the selected financial data and the consolidated financial statements and related notes contained in Item 6. Selected Financial Data and Item 8. Financial Statements and Supplementary Data of this annual report on Form 10-K, respectively. See “Risk Factors” contained in Item 1A. Risk Factors of this annual report on Form 10-K and “Cautionary Statement” contained in Item 1. Business of this annual report on Form 10-K for a discussion of the uncertainties, risks and assumptions associated with these statements.
OVERVIEW
We are a leading supplier of building materials, manufactured components and construction services to professional contractors, sub-contractors, and consumers. Following our acquisition of ProBuild in July 2015, the Company operates 400 locations in 40 states across the United States. We offer an integrated solution to our customers providing manufacturing, supply and installation of a full range of structural and related building products. Our manufactured products include our factory-built roof and floor trusses, wall panels and stairs, vinyl windows, custom millwork and trim, as well as engineered wood that we design, cut, and assemble for each home. We also assemble interior and exterior doors into pre-hung units. Additionally, we supply our customers with a broad offering of professional grade building products not manufactured by us, such as dimensional lumber and lumber sheet goods and various window, door and millwork lines. Our full range of construction-related services includes professional installation, turn-key framing and shell construction, and spans all our product categories.
We group our building products into six product categories:
|
|
• |
Lumber & Lumber Sheet Goods. Lumber & lumber sheet goods include dimensional lumber, plywood, and OSB products used in on-site house framing. |
|
|
• |
Windows, Door & Millwork. Windows & doors are comprised of the manufacturing, assembly, and distribution of windows and the assembly and distribution of interior and exterior door units. Millwork includes interior trim and custom features that we manufacture under the Synboard ® brand name. |
|
|
• |
Manufactured Products. Manufactured products consist of wood floor and roof trusses, steel roof trusses, wall panels, stairs, and engineered wood. |
|
|
• |
Gypsum, Roofing & Insulation. Gypsum, roofing, & insulation include wallboard, ceilings, joint treatment and finishes. |
|
|
• |
Siding, metal, and concrete. Siding, metal, and concrete includes vinyl, composite, and wood siding, exterior trim, other exteriors, metal studs and cement. |
|
|
• |
Other Building Products & Services. Other building products & services are comprised of products such as cabinets and hardware as well as services such as turn-key framing, shell construction, design assistance, and professional installation spanning the majority of our product categories. |
Our operating results are dependent on the following trends, events and uncertainties, some of which are beyond our control:
|
|
• |
Homebuilding Industry. Our business is driven primarily by the residential new construction market, which is in turn dependent upon a number of factors, including demographic trends, interest rates, consumer confidence, employment rates, foreclosure rates, the availability of skilled construction labor, and the health of the economy and mortgage markets. During the housing downturn, which began in 2006, many homebuilders significantly decreased their starts because of lower demand and an excess of home inventory. The housing market started to strengthen in 2011. According to the U.S. Census Bureau, annual U.S. single-family housing starts were 781,500 in 2016. However, single-family housing starts remain well below the historical average (from 1959 through 2016) of 1.0 million per year. The housing industry is currently experiencing a shortage of skilled construction labor, which we believe is constraining housing activity. Due to the lower levels in housing starts and increased competition for homebuilder business, we have and will continue to experience pressure on our gross margins. In addition to these factors, there has been a trend of consolidation within the building products supply industry. However, our industry remains highly fragmented and competitive and we will continue to face significant competition from local and regional suppliers. We still believe there are several meaningful trends that indicate U.S. housing demand will recover to the historical average in the long term and that the downturn in the housing industry was a trough in the cyclical nature of the residential construction industry. These trends include relatively low interest rates, the aging of housing stock, and normal population growth due to immigration and birthrate exceeding death rate. Industry forecasters, including the National Association of Homebuilders (“NAHB”), expect to see continued improvement in housing demand over the next few years. |
26
|
|
• |
Repair and remodel end market. Following the acquisition of ProBuild, the repair and remodel end market now comprises a larger portion of our business. Although it is influenced by housing starts to a lesser degree than the homebuilding market, the repair and remodel end market is still dependent upon some of the same factors as the homebuilding market, including demographic trends, interest rates, consumer confidence, employment rates, foreclosure rates, and the health of the economy and home financing markets. We expect that our ability to remain competitive in this space as well as grow our market share will depend on our continued ability to provide a high level of customer service coupled with a broad product offering. |
|
|
• |
Use of Prefabricated Components. Homebuilders are increasingly using prefabricated components in order to realize increased efficiency and improved quality. Shortening cycle time from start to completion is a key imperative of the homebuilders during periods of strong consumer demand. While the conversion of customers to this product offering slowed during the downturn we see the demand for prefabricated components increasing as the residential new construction market continues to strengthen and the availability of skilled construction labor remains limited. |
|
|
• |
Economic Conditions. Economic changes both nationally and locally in our markets impact our financial performance. The building products supply industry is highly dependent upon new home construction and subject to cyclical market changes. Our operations are subject to fluctuations arising from changes in supply and demand, national and local economic conditions, labor costs and availability, competition, government regulation, trade policies and other factors that affect the homebuilding industry such as demographic trends, interest rates, single-family housing starts, employment levels, consumer confidence, and the availability of credit to homebuilders, contractors, and homeowners. During the downturn mortgage financing and commercial credit for smaller homebuilders was severely constrained and continues to slow a recovery in our industry despite some recent improvement. As the housing industry is dependent upon the economy as well as potential homebuyers’ access to mortgage financing and homebuilders’ access to commercial credit, it is likely that the housing industry will not fully recover to the historical average until conditions in the economy and the credit markets further improve. |
|
|
• |
Cost of Materials. Prices of wood products, which are subject to cyclical market fluctuations, may adversely impact operating income when prices rapidly rise or fall within a relatively short period of time. We purchase certain materials, including lumber products, which are then sold to customers as well as used as direct production inputs for our manufactured and prefabricated products. Short-term changes in the cost of these materials, some of which are subject to significant fluctuations, are sometimes passed on to our customers, but our pricing quotation periods may limit our ability to pass on such price changes. We may also be limited in our ability to pass on increases on in-bound freight costs on our products. Our inability to pass on material price increases to our customers could adversely impact our operating results. |
|
|
• |
Controlling Expenses. Another important aspect of our strategy is controlling costs and striving to be the low-cost building materials supplier in the markets we serve. We pay close attention to managing our working capital and operating expenses. Further, we pay careful attention to our logistics function and its effect on our shipping and handling costs. |
|
|
▪ |
Expand into Multi-Family and Light Commercial Business. Our primary focus has been, and continues to be, on single-family residential new construction and the repair and remodel end market. However, we will continue to identify opportunities for profitable growth in the multi-family and light commercial markets. |
|
|
▪ |
Successful integration of the ProBuild business: The acquisition of ProBuild has substantially increased the scale of our company. Successfully integrating ProBuild will be critical to achieving our future objectives. Combining our two companies may be more difficult, costly, or time consuming than expected, which could result in the acquisition not achieving its intended results, including the expected operational synergies and cost savings. In addition, as a result of the ProBuild acquisition we have substantially increased indebtedness. Reduction of our outstanding debt will be a key imperative as we work to achieve the intended results of the acquisition. |
27
During the year ended December 31, 2016, the Company executed several debt transactions which are described in more detail below. These transactions include two debt exchanges, complete extinguishment of our 7.625% senior secured notes due 2021 (“2021 notes”), as well as repricing and partially repaying our $600.0 million term loan facility due 2022 (“2015 term loan”) and the repurchase of $50.0 million in aggregate principal amount of our 2023 notes. These transactions have extended our debt maturity profile and reduced our annual cash interest on a go forward basis.
On February 12, 2016, we completed separate privately negotiated note exchange transactions in which $218.6 million in outstanding aggregate principal amount of our 10.75% senior unsecured notes due 2023 (“2023 notes”) was exchanged for $207.6 million in aggregate principal amount of our 2021 notes. On February 29, 2016, we completed additional separate privately negotiated note exchange transactions in which $63.8 million in outstanding aggregate principal amount of our 2023 notes was exchanged for $60.0 million in aggregate principal amount of our 2021 notes. The additional 2021 notes were issued under the existing indenture dated as of May 29, 2013. These transactions resulted in a $7.8 million net gain on debt extinguishment, reducing interest expense in the first quarter of 2016.
In May 2016, the Company exercised its contractual right to redeem $35.0 million in aggregate principal amount of 2021 notes at a price of 103.0%. This transaction resulted in a $1.7 million loss on debt extinguishment, which increased interest expense in the second quarter of 2016.
In August 2016, the Company issued $750.0 million in aggregate principal amount of 5.625% senior secured notes due 2024 (“2024 notes”) in a private offering. At the same time the Company also repriced its $600.0 million term loan facility (“2015 term loan”). This repricing lowered the margin to 3.75% in the case of Eurodollar loans and 2.75% in the case of base rate loans. This reduction represents a 1.25% decrease in the applicable margin for both Eurodollar and base rate loans. The proceeds from the issuance of the 2024 notes were used, together with cash on hand and borrowings on our $800.0 million senior secured revolving credit facility (“2015 facility”), to fully redeem the $582.6 million in aggregate outstanding principal amount of 2021 notes, to pay down $125.9 million of the 2015 term loan and to pay related transaction fees and expenses. We recognized a $43.9 million loss on extinguishment of the 2021 notes and $8.2 million in write off of debt discount and debt issuance costs related to the 2015 term loan repricing as components of interest expense in the third quarter of 2016.
In October 2016, we repurchased $50.0 million in aggregate principal amount of our 2023 notes pursuant to the terms of a cash tender offer at a price of 117.0% of par value plus accrued and unpaid interest. The purchase of the 2023 notes was funded with cash on hand and borrowings under our 2015 facility. This transaction resulted in a $9.7 million loss on debt extinguishment which was recognized in interest expense in the fourth quarter of 2016. Following this transaction, we have $367.6 million in 2023 notes outstanding.
On February 23, 2017, we repriced our existing 2015 term loan through an amendment and extension of the term loan credit agreement providing for a $467.7 million senior secured term loan facility due 2024 (“2024 term loan”). This repricing reduces the interest rate by 0.75% and extends the maturity by 19 months to February 29, 2024.
The transactions described above will allow the Company to reduce its annual cash interest expense by approximately $37 million going forward.
CURRENT OPERATING CONDITIONS AND OUTLOOK
Though the level of housing starts remains below the historical average, the homebuilding industry has shown improvement since 2011. According to the U.S. Census Bureau, actual U.S. single-family housing starts for 2016 were 781,500, an increase of 9.4% compared to 2015. U.S single-family units under construction increased 12.4% during this same time period. While the housing industry has strengthened over the past few years, the limited availability of credit to smaller homebuilders and potential homebuyers, as well as the high demand for a limited supply of skilled construction labor and the slow economic recovery, among other factors, have hampered a stronger recovery. A composite of third party sources, including the NAHB, are forecasting 847,000 U.S. single-family housing starts for 2017, which is an increase of 8.4% from 2016. In addition the Home Improvement Research Institute (“HIRI”) is forecasting sales in the professional repair and remodel end market to increase approximately 4.2% in 2017 compared to 2016.
28
Our net sales for the year ended December 31, 2016 were up 78.6% over the same period last year largely due to the acquisition of ProBuild. Our gross margin percentage decreased by 0.2% during the year ended December 31, 2016 compared to the year ended December 31, 2015. Our gross margin percentage decreased primarily due to the impact of commodity price inflation relative to our short-term customer pricing commitments during the year ended December 31, 2016. However, this decrease was mostly offset by an increase in our gross margin percentage largely attributable to the ProBuild acquisition, the result of ProBuild’s higher mix of higher margin repair & remodel and retail sales. We continue to invest in our business to improve our operating efficiency, which has allowed us to better leverage our operating costs against changes in net sales. Our selling, general and administrative expenses, as a percentage of net sales, were 21.4% for the year ended December 31, 2016, a 1.3% decrease from 22.7% in 2015. The decrease in selling, general and administrative expenses, as a percentage of net sales, was largely due to the benefit of synergy cost savings. Synergy cost savings were primarily attributable to reduced payroll and benefits expense, as well as decreased delivery costs and location consolidations.
We still believe the long-term outlook for the housing industry is positive due to growth in the underlying demographics. We feel we are well-positioned to take advantage of the construction activity in our markets and to increase our market share, which may include strategic acquisitions. We will continue to focus on working capital by closely monitoring the credit exposure of our customers and by working with our vendors to improve our payment terms and pricing on our products. We will also continue to work diligently to achieve the appropriate balance of short-term expense control while maintaining the expertise and capacity to grow the business as market conditions improve. In addition, debt reduction will continue to be a key area of focus for the Company. We want to create long-term shareholder value and avoid taking steps that will limit our ability to compete.
RESULTS OF OPERATIONS
The following table sets forth the percentage relationship to sales of certain costs, expenses and income items for the years ended December 31:
|
|
|
2016 |
|
|
2015 |
|
|
2014 |
|
|||
|
Sales |
|
|
100.0 |
% |
|
|
100.0 |
% |
|
|
100.0 |
% |
|
Cost of sales |
|
|
74.9 |
% |
|
|
74.7 |
% |
|
|
77.7 |
% |
|
Gross margin |
|
|
25.1 |
% |
|
|
25.3 |
% |
|
|
22.3 |
% |
|
Selling, general and administrative expenses |
|
|
21.4 |
% |
|
|
22.7 |
% |
|
|
19.2 |
% |
|
Income from operations |
|
|
3.7 |
% |
|
|
2.6 |
% |
|
|
3.1 |
% |
|
Interest expense, net |
|
|
3.3 |
% |
|
|
3.1 |
% |
|
|
1.9 |
% |
|
Income tax expense (benefit) |
|
|
(1.9 |
)% |
|
|
0.1 |
% |
|
|
0.1 |
% |
|
Net income (loss) |
|
|
2.3 |
% |
|
|
(0.6 |
)% |
|
|
1.1 |
% |
2016 Compared with 2015
Sales. Sales for the year ended December 31, 2016 were $6,367.3 million, a 78.6% increase from sales of $3,564.4 million for 2015. Net sales increased $2,659.1 million, or approximately 75%, due to the ProBuild acquisition. Excluding the impact of the ProBuild acquisition, we estimate net sales increased $143.8 million, or approximately 4% due to increased volume. According to the U.S. Census Bureau, actual U.S. single-family housing starts increased 9.4% and single-family units under construction increased 12.4% in 2016 compared to 2015.
The following table shows sales classified by major product category (dollars in millions):
|
|
|
2016 |
|
|
2015 |
|
|
|
|
|||||||||||
|
|
|
Sales |
|
|
% of Sales |
|
|
Sales |
|
|
% of Sales |
|
|
% Change |
|
|||||
|
Lumber & lumber sheet goods |
|
$ |
2,131.4 |
|
|
|
33.5 |
% |
|
$ |
1,129.7 |
|
|
|
31.7 |
% |
|
|
88.7 |
% |
|
Windows, doors & millwork |
|
|
1,286.2 |
|
|
|
20.2 |
% |
|
|
818.1 |
|
|
|
23.0 |
% |
|
|
57.2 |
% |
|
Manufactured products |
|
|
1,097.7 |
|
|
|
17.2 |
% |
|
|
635.3 |
|
|
|
17.8 |
% |
|
|
72.8 |
% |
|
Gypsum, roofing & insulation |
|
|
520.0 |
|
|
|
8.2 |
% |
|
|
264.9 |
|
|
|
7.4 |
% |
|
|
96.3 |
% |
|
Siding, metal & concrete products |
|
|
622.3 |
|
|
|
9.8 |
% |
|
|
319.6 |
|
|
|
9.0 |
% |
|
|
94.7 |
% |
|
Other building products & services |
|
|
709.7 |
|
|
|
11.1 |
% |
|
|
396.8 |
|
|
|
11.1 |
% |
|
|
78.9 |
% |
|
Total sales |
|
$ |
6,367.3 |
|
|
|
100.0 |
% |
|
$ |
3,564.4 |
|
|
|
100.0 |
% |
|
|
78.6 |
% |
Due to the ProBuild acquisition, we achieved increased net sales across all product categories. Our sales classification by product categories has shifted as we diversified our product offerings to support a broader customer base across 40 states through the ProBuild acquisition.
29
Gross Margin. Gross margin increased $695.3 million to $1,596.7 million. Of this increase, $656.8 million is due to the ProBuild acquisition. Our gross margin percentage decreased to 25.1% in 2016 from 25.3% in 2015, a 0.2% decrease. Our gross margin percentage decreased primarily due to the impact of commodity price inflation relative to our short-term customer pricing commitments during the year ended December 31, 2016. However, this decrease was mostly offset by an increase in our gross margin percentage largely attributable to the ProBuild acquisition, the result of ProBuild’s higher mix of higher margin repair & remodel and retail sales.
Selling, General and Administrative Expenses. Selling, general and administrative expenses increased $549.7 million, or 67.8%, largely due to the ProBuild acquisition. Our salaries and benefits expense was $894.3 million, an increase of $383.7 million from 2015, largely due to increased full-time equivalent employees following the ProBuild acquisition. Delivery expense increased $65.9 million, office general and administrative expense increased $46.5 million, occupancy expense increased $45.9 million and intangible asset amortization increased $10.7 million. These increases were primarily a result of the ProBuild acquisition, the related integration activities and increased sales volume. These increases were partially offset by a $4.2 million decrease in facility closure costs.
As a percentage of net sales, selling, general and administrative expenses decreased from 22.7% in 2015 to 21.4% in 2016 largely due to the benefit of synergy cost savings. Synergy cost savings were primarily attributable to reduced payroll and benefits expense, as well as decreased delivery costs and location consolidations. As a percentage of net sales, salaries and benefits expense decreased 0.3%, office general and administrative expense decreased 0.6% and delivery expense decreased 0.4%. These decreases were partially offset by occupancy expense, as a percentage of net sales, increasing 0.1%.
Interest Expense, net. Interest expense was $214.7 million in 2016, an increase of $105.5 million from 2015. Of the $105.5 million increase, $49.6 million was attributable to increased interest expense associated with our increased debt balances following the ProBuild acquisition financing and subsequent refinancing transactions, $28.1 million was attributable to losses on debt extinguishment largely due to the payment of redemption premiums on our 2021 and 2023 notes, $17.6 million was related to increased amortization and write-off of debt discount and debt issuance costs largely due to our debt transactions during the year ended December 31, 2016, and $14.2 million was due to interest expense primarily related to lease obligations assumed in the ProBuild acquisition. These increases were partially offset by a $4.6 million decrease in interest expense due to non-cash fair value adjustments related to the exercise of all remaining stock warrants in 2015.
Income Tax Expense. We recorded an income tax benefit of $122.7 million during the year ended December 31, 2016 compared to income tax expense of $4.4 million during the year ended December 31, 2015. In the third quarter of 2016, we released the valuation allowance against our net federal and some state deferred tax assets. We recorded a reduction of the after-tax, non-cash valuation allowance on our net deferred tax assets of $131.7 million during the year ended December 31, 2016 compared to an increase of $9.7 million during the year ended December 31, 2015. Absent the valuation allowance our effective tax rate would have been 41.8% and 28.5% for the years ended December 31, 2016 and 2015, respectively.
2015 Compared with 2014
Sales. Sales for the year ended December 31, 2015 were $3,564.4 million, a 122.2% increase from sales of $1,604.1 million for 2014. Net sales increased $1,910.9 million, or 119.1%, due to recent acquisitions, primarily ProBuild. Excluding the impact of acquisitions, net sales increased $49.4 million, or 8.5% due to increased volume, which was partially offset by a 5.4% decrease due to the impact of commodity price deflation on net sales. According to the U.S. Census Bureau, actual U.S. single-family housing starts increased 10.3% and single-family units under construction increased 11.1% in 2015 compared to 2014.
The following table shows sales classified by major product category (dollars in millions):
|
|
|
2015 |
|
|
2014 |
|
|
|
|
|||||||||||
|
|
|
Sales |
|
|
% of Sales |
|
|
Sales |
|
|
% of Sales |
|
|
% Change |
|
|||||
|
Lumber & lumber sheet goods |
|
$ |
1,129.7 |
|
|
|
31.7 |
% |
|
$ |
535.3 |
|
|
|
33.4 |
% |
|
|
111.0 |
% |
|
Windows, doors & millwork |
|
|
818.1 |
|
|
|
23.0 |
% |
|
|
446.4 |
|
|
|
27.8 |
% |
|
|
83.3 |
% |
|
Manufactured products |
|
|
635.3 |
|
|
|
17.8 |
% |
|
|
312.0 |
|
|
|
19.5 |
% |
|
|
103.6 |
% |
|
Gypsum, roofing & insulation |
|
|
264.9 |
|
|
|
7.4 |
% |
|
|
61.1 |
|
|
|
3.8 |
% |
|
|
333.4 |
% |
|
Siding, metal & concrete products |
|
|
319.6 |
|
|
|
9.0 |
% |
|
|
81.9 |
|
|
|
5.1 |
% |
|
|
290.3 |
% |
|
Other building products & services |
|
|
396.8 |
|
|
|
11.1 |
% |
|
|
167.4 |
|
|
|
10.4 |
% |
|
|
137.0 |
% |
|
Total sales |
|
$ |
3,564.4 |
|
|
|
100.0 |
% |
|
$ |
1,604.1 |
|
|
|
100.0 |
% |
|
|
122.2 |
% |
30
Due to the ProBuild acquisition, we achieved increased net sales across all product categories. Our sales classification by product categories has shifted as we diversified our product offerings to support a broader customer base across 40 states through the ProBuild acquisition. Excluding ProBuild, net sales increased across all product categories, except lumber & lumber sheet goods, which decreased $12.4 million. This decline in net sales of lumber and lumber sheet goods, excluding ProBuild, was largely due to an 11.1% decrease in market prices for such commodities in 2015 compared to 2014, which was mostly offset by an increase in sales volume.
Gross Margin. Gross margin increased $544.5 million to $901.5 million. Of this increase, $493.3 million is due to the ProBuild acquisition. Excluding ProBuild, gross margin increased $51.2 million. Our gross margin percentage increased to 25.3% in 2015 from 22.3% in 2014, a 3.0% increase. Excluding ProBuild, our gross margin percentage increased 1.7%, primarily due to improved customer pricing relative to our costs and a higher mix of value-added sales from our manufactured products categories in 2015 compared to 2014.
Selling, General and Administrative Expenses. Selling, general and administrative expenses increased $503.9 million, or 164.1%. Excluding ProBuild, our selling, general, and administrative expense increased $68.0 million or 22.2%. Excluding ProBuild, our salaries and benefits expense was $218.4 million, an increase of $27.3 million from 2014, largely due to a 6.2% increase in full-time equivalent employees related to increased sales volume and other recent acquisitions. Office general and administrative expense increased $31.2 million, primarily due to a $30.2 million increase in professional service fees largely attributable to acquisition and integration costs related to the ProBuild acquisition. Facility closure costs increased $3.6 million primarily due to costs associated with location consolidations following the ProBuild acquisition. Intangible asset amortization increased $1.6 million due to other recent acquisitions. Delivery expense increased $1.7 million largely due to increased sales volume.
As a percentage of net sales, selling, general and administrative expenses increased from 19.2% in 2014 to 22.7% in 2015. Excluding ProBuild, selling, general and administrative expenses were 22.0% of net sales. As a percentage of net sales, salaries and benefits expense increased 0.9%, office general and administrative expense increased 1.7%, facility closure costs increased 0.2%, intangible asset amortization increased 0.1% and delivery expenses decreased 0.1%. The increase in selling, general and administrative expenses, as a percentage of net sales, was primarily due to the factors discussed above, and to a lesser degree, the negative impact of commodity price deflation on our net sales.
Interest Expense, net. Interest expense was $109.2 million in 2015, an increase of $78.9 million from 2014. Excluding interest expense attributable to ProBuild, which is primarily related to interest expense associated with lease finance obligations, our interest expense was $101.0 million, an increase of $70.7 million. The increase was primarily related to the financing transactions associated with the acquisition of ProBuild. Of the $70.7 million increase, $49.5 million was attributable primarily to increased interest expense related to our 2023 notes, 2015 term loan and 2015 facility, $13.2 million was due to commitment fees related to unutilized bridge and backstop facilities, $8.3 million was related to non-cash interest expense from the amortization of debt discount and deferred loan costs, and fair value adjustments related to our previously outstanding stock warrants in 2014.
Income Tax Expense. We recorded income tax expense of $4.4 million and $1.1 million during 2015 and 2014, respectively. We recorded an increase in the after-tax, non-cash valuation allowance on our net deferred tax assets of $9.7 million in 2015 and a $7.2 million reduction in the after-tax, non-cash valuation allowance on our net deferred tax assets in 2014. Absent the valuation allowance, our effective tax rate would have been 28.5% and 42.1% for 2015 and 2014, respectively. Absent the valuation allowance the change in our effective rate is largely attributable to permanent differences related to fair value adjustments on our previously outstanding stock warrants and 162(m) limitations.
Results by Reportable Segment
The following tables show net sales and income before income taxes by reportable segment (dollars in thousands):
|
|
|
Year ended December 31, |
|
|||||||||||||||||||||||||||||||||||||
|
|
|
Net sales |
|
|
Income before income taxes |
|
||||||||||||||||||||||||||||||||||
|
|
|
|
|
|
|
% of net |
|
|
|
|
|
|
% of net |
|
|
|
|
|
|
|
|
|
|
% of net |
|
|
|
|
|
|
% of net |
|
|
|
|
|
||||
|
|
|
2016 |
|
|
sales |
|
|
2015 |
|
|
sales |
|
|
% change |
|
|
2016 |
|
|
sales |
|
|
2015 |
|
|
sales |
|
|
% change |
|
||||||||||
|
Northeast |
|
$ |
1,204,099 |
|
|
|
19.4 |
% |
|
$ |
626,985 |
|
|
|
18.4 |
% |
|
|
92.0 |
% |
|
$ |
35,356 |
|
|
|
2.9 |
% |
|
$ |
28,862 |
|
|
|
4.6 |
% |
|
|
22.5 |
% |
|
Southeast |
|
|
1,367,933 |
|
|
|
22.0 |
% |
|
|
917,022 |
|
|
|
27.0 |
% |
|
|
49.2 |
% |
|
|
37,158 |
|
|
|
2.7 |
% |
|
|
14,607 |
|
|
|
1.6 |
% |
|
|
154.4 |
% |
|
South |
|
|
1,704,753 |
|
|
|
27.4 |
% |
|
|
1,073,240 |
|
|
|
31.5 |
% |
|
|
58.8 |
% |
|
|
69,846 |
|
|
|
4.1 |
% |
|
|
50,878 |
|
|
|
4.7 |
% |
|
|
37.3 |
% |
|
West |
|
|
1,939,206 |
|
|
|
31.2 |
% |
|
|
786,476 |
|
|
|
23.1 |
% |
|
|
146.6 |
% |
|
|
72,649 |
|
|
|
3.7 |
% |
|
|
35,170 |
|
|
|
4.5 |
% |
|
|
106.6 |
% |
|
|
|
$ |
6,215,991 |
|
|
|
100.0 |
% |
|
$ |
3,403,723 |
|
|
|
100.0 |
% |
|
|
|
|
|
$ |
215,009 |
|
|
|
3.5 |
% |
|
$ |
129,517 |
|
|
|
3.8 |
% |
|
|
|
|
31
|
|
|
Year ended December 31, |
|
|||||||||||||||||||||||||||||||||||||
|
|
|
Net sales |
|
|
Income before income taxes |
|
||||||||||||||||||||||||||||||||||
|
|
|
|
|
|
|
% of net |
|
|
|
|
|
|
% of net |
|
|
|
|
|
|
|
|
|
|
% of net |
|
|
|
|
|
|
% of net |
|
|
|
|
|
||||
|
|
|
2015 |
|
|
sales |
|
|
2014 |
|
|
sales |
|
|
% change |
|
|
2015 |
|
|
sales |
|
|
2014 |
|
|
sales |
|
|
% change |
|
||||||||||
|
Northeast |
|
$ |
626,985 |
|
|
|
18.4 |
% |
|
$ |
229,998 |
|
|
|
15.8 |
% |
|
|
172.6 |
% |
|
$ |
28,862 |
|
|
|
4.6 |
% |
|
$ |
3,464 |
|
|
|
1.5 |
% |
|
|
733.2 |
% |
|
Southeast |
|
|
917,022 |
|
|
|
27.0 |
% |
|
|
672,059 |
|
|
|
46.0 |
% |
|
|
36.4 |
% |
|
|
14,607 |
|
|
|
1.6 |
% |
|
|
5,465 |
|
|
|
0.8 |
% |
|
|
167.3 |
% |
|
South |
|
|
1,073,240 |
|
|
|
31.5 |
% |
|
|
558,446 |
|
|
|
38.2 |
% |
|
|
92.2 |
% |
|
|
50,878 |
|
|
|
4.7 |
% |
|
|
17,804 |
|
|
|
3.2 |
% |
|
|
185.8 |
% |
|
West |
|
|
786,476 |
|
|
|
23.1 |
% |
|
— |
|
|
— |
|
|
— |
|
|
|
35,170 |
|
|
|
4.5 |
% |
|
— |
|
|
— |
|
|
— |
|
||||||
|
|
|
$ |
3,403,723 |
|
|
|
100.0 |
% |
|
$ |
1,460,503 |
|
|
|
100.0 |
% |
|
|
|
|
|
$ |
129,517 |
|
|
|
3.8 |
% |
|
$ |
26,733 |
|
|
|
1.8 |
% |
|
|
|
|
As a result of our reorganization following the ProBuild acquisition, we have four reportable segments based on an aggregation of the geographic regions in which we operate. Our reportable segments do not necessarily align with any single region as defined by the U.S Census Bureau.
According to the U.S. Census Bureau, actual single-family housing starts during the year ended December 31, 2016 increased 8.8%, 9.5%, 8.7% and 12.8% in the South region, Northeast region, West region and Midwest region, respectively. For the year ended December 31, 2016, we achieved increased net sales and profitability across all our reportable segments, primarily due to the ProBuild acquisition and sales volume increases.
Excluding the impact of recent acquisitions, net sales for the year ended December 31, 2015 compared to the year ended December 31, 2014 increased 4.5% and 5.9% in our legacy Southeast and South reportable segments, respectively, primarily due to volume increases, which were partially offset by commodity price deflation. According to the U.S Census Bureau, the actual U.S. single-family housing starts increased 10.3% in 2015 as compared to 2014, with single family starts in the South region increasing 12.0% compared to 2014. Excluding ProBuild, net sales for our Northeast reportable segment decreased 2.7% for the year ended December 31, 2015 compared to 2014 due to slower regional sales growth, which was not enough to overcome the impact of commodity price deflation.
LIQUIDITY AND CAPITAL RESOURCES
Our primary capital requirements are to fund working capital needs and operating expenses, meet required interest and principal payments, and to fund capital expenditures and potential future acquisitions. Our capital resources at December 31, 2016 consist of cash on hand and borrowing availability under our 2015 facility.
Our 2015 facility will be primarily used for working capital, general corporate purposes, and funding acquisitions. In addition, we may use the 2015 facility to facilitate debt repayment and consolidation. Availability under the 2015 facility is determined by a borrowing base. Our borrowing base consists of trade accounts receivable, inventory, other receivables, including progress billings and credit card receivables, and qualified cash that all meet specific criteria contained within the credit agreement, minus agent specified reserves. Net excess borrowing availability is equal to the maximum borrowing amount minus outstanding borrowings and letters of credit.
32
The following table shows our borrowing base and excess availability as of December 31, 2016 and 2015 (in millions):
|
|
As of |
|
|||||
|
|
December 31, 2016 |
|
|
December 31, 2015 |
|
||
|
Accounts Receivable Availability |
$ |
403.5 |
|
|
$ |
384.5 |
|
|
Inventory Availability |
|
332.0 |
|
|
|
314.3 |
|
|
Other Receivables Availability |
|
27.9 |
|
|
|
27.0 |
|
|
Gross Availability |
|
763.4 |
|
|
|
725.8 |
|
|
Less: |
|
|
|
|
|
|
|
|
Agent Reserves |
|
(26.9 |
) |
|
|
(23.5 |
) |
|
Plus: |
|
|
|
|
|
|
|
|
Cash in Qualified Accounts |
|
15.5 |
|
|
|
55.5 |
|
|
Borrowing Base |
|
752.0 |
|
|
|
757.8 |
|
|
Aggregate Revolving Commitments |
|
800.0 |
|
|
|
800.0 |
|
|
Maximum Borrowing Amount (lesser of Borrowing Base and Aggregate Revolving Commitments) |
|
752.0 |
|
|
|
757.8 |
|
|
Less: |
|
|
|
|
|
|
|
|
Outstanding Borrowings |
|
— |
|
|
|
(60.0 |
) |
|
Letters of Credit |
|
(84.8 |
) |
|
|
(79.1 |
) |
|
Net Excess Borrowing Availability on Revolving Facility |
$ |
667.2 |
|
|
$ |
618.7 |
|
As of December 31, 2016, we had no outstanding borrowings under our 2015 facility and our net excess borrowing availability was $667.2 million after being reduced by outstanding letters of credit of approximately $84.8 million. Excess availability must equal or exceed a minimum specified amount, currently $80.0 million, or we are required to meet a fixed charge coverage ratio of 1:00 to 1:00. We were not in violation of any covenants or restrictions imposed by any of our debt agreements at December 31, 2016.
Liquidity
Our liquidity at December 31, 2016 was $681.6 million, which consists of net borrowing availability under the 2015 facility and cash on hand. We are expecting continued improvement in the housing industry in 2017. Beyond 2017, it is difficult for us to predict what will happen as our industry is dependent on a number of factors, including national economic conditions, employment levels, the availability of credit for homebuilders and potential home buyers, the level of foreclosures, existing home inventory, and interest rates.
We substantially increased our indebtedness following completion of the ProBuild acquisition in comparison to our indebtedness on a recent historical basis, which increased our interest expense and could have the effect of, among other things, reducing our flexibility to make acquisitions or to respond to changing business and economic conditions. From time to time, based on market conditions and other factors and subject to compliance with applicable laws and regulations, the Company may repurchase or call the 2023 notes or 2024 notes, repay debt, or otherwise enter into transactions regarding its capital structure.
Should the current industry conditions deteriorate or we pursue additional acquisitions, we may be required to raise additional funds through the sale of capital stock or debt in the public capital markets or in privately negotiated transactions. There can be no assurance that any of these financing options would be available on favorable terms, if at all. Alternatives to help supplement our liquidity position could include, but are not limited to, idling or permanently closing additional facilities, adjusting our headcount in response to current business conditions, attempts to renegotiate leases, and divesting of non-core businesses. There are no assurances that these steps would prove successful or materially improve our liquidity position.
33
Cash provided by operating activities was $158.2 million and $177.0 million in 2016 and 2015, respectively. Our working capital increased $43.9 million in 2016 compared to a decrease of $99.0 million in 2015. The change in working capital is largely due to the ProBuild acquisition, as well as increases in receivables and inventory and increased customer demand. These increases were partially offset by increases in accounts payable and accrued liabilities largely due to increased purchases and increased accounts payable days. Cash interest payments increased $99.5 million in 2016 compared to 2015. The remaining change is due to an increase in cash provided by operations primarily related to increased sales and profitability during the year ended December 31, 2016 as a result of the ProBuild acquisition and higher sales volume. In August 2016, the FASB issued an update to the existing guidance under the Statement of Cash Flows topic of the Codification. As a result of the Company’s election to early adopt this updated guidance in the fourth quarter of 2016, $42.9 million in payments of debt extinguishment costs made in 2016 which were previously reflected as operating cash outflows on our 2016 quarterly reports on Form 10-Q are now presented as financing cash outflows. Adoption of this guidance resulted in $1.1 million from the second quarter of 2016, $33.3 million from the third quarter of 2016 and $8.5 million from the fourth quarter of 2016 in payments of debt extinguishment costs being presented as cash outflows from financing activities for the year ended December 31, 2016. The adoption of this guidance had no impact to our statement of cash flows for the years ended December 31, 2015 or 2014. This updated guidance is described more fully in Note 2 to the consolidated financial statements included in Item 8 of this annual report on Form 10-K.
Cash provided by operating activities was $177.0 million and $27.5 million in 2015 and 2014, respectively. Our working capital decreased $99.0 million in 2015 compared to an increase of $7.8 million in 2014. The decrease in working capital is primarily due to a decrease in accounts receivable and an increase in accrued liabilities. The decrease in accounts receivable is due to increased collections largely attributable to the ProBuild acquisition in the fourth quarter of 2015. The increase in accrued liabilities is largely due to increased interest payable following the ProBuild acquisition financing transactions. The decrease in working capital was partially offset by an increase in cash interest payments of $26.7 million in 2015 compared to 2014. In addition, during 2015 we had $13.2 million in one-time cash interest payments attributable to commitment fees related to unutilized bridge and backstop financing facilities. The remaining increase in cash provided by operations is primarily related to increased sales and profitability during 2015 as a result of higher sales volume and the acquisition of ProBuild.
Cash used in investing activities was $38.3 million and $1,508.0 million in 2016 and 2015, respectively. The change is primarily due to $1,462.7 million in cash used for the ProBuild acquisition in 2015. The remaining change is largely due to an increase in proceeds from the sale of property, plant and equipment and a decrease in capital expenditures in 2016 compared to 2015.
Cash used in investing activities increased $1,413.2 million in 2015 compared to 2014. The change is primarily due to the $1,462.7 million ProBuild acquisition. In addition, we acquired Timber Tech for $5.8 million during 2015. In 2014, $69.3 million of cash was used for acquisitions. Capital expenditures for 2015 were $43.8 million compared to $25.7 million in 2014. The increase in capital expenditures primarily relates to purchasing machinery, equipment and vehicles to support sales growth and to increase capacity at existing locations.
Cash used in financing activities was $170.5 million in 2016 compared to cash provided by financing activities of $1,378.3 million in 2015. Cash used in financing activities in 2016 was primarily attributable to $807.5 million in payments of long-term debt, largely due to the extinguishment of our 2021 notes, the partial pay down of the 2015 term loan and 2023 notes. In addition, we repaid $60.0 million, net, under the 2015 facility, paid $42.9 million of debt extinguishment costs and $15.7 million in debt issuance costs. These payments were partially offset by $750.0 million in proceeds from the 2024 notes issuance.
Cash provided by financing activities was $1,378.3 million and $30.4 million for 2015 and 2014, respectively. During 2015 cash provided by financing activities was primarily due to financing activities related to the ProBuild acquisition, including $700.0 million of proceeds from the issuance of notes, $594.0 million of proceeds from a new term loan agreement, $320.0 million of borrowings under the revolving credit facilities, and $111.3 million of proceeds from the public offering of common stock, net of issuance costs. Slightly offsetting this, we repaid $290.0 million under the revolving credit facilities during 2015. In addition, we paid $58.5 million of deferred loan costs in 2015.
Capital Expenditures
Capital expenditures vary depending on prevailing business factors, including current and anticipated market conditions. Historically, capital expenditures have for the most part remained at relatively low levels in comparison to the operating cash flows generated during the corresponding periods. We expect our 2017 capital expenditures to be approximately $80-$90 million primarily related to rolling stock, equipment and facility improvements to support our operations.
34
DISCLOSURES OF CONTRACTUAL OBLIGATIONS AND COMMERCIAL COMMITMENTS
The following summarizes our contractual obligations as of December 31, 2016 (in thousands):
|
|
|
Payments Due by Period |
|
|||||||||||||||||
|
Contractual obligations |
|
Total |
|
|
Less than 1 year |
|
|
1-3 years |
|
|
3-5 years |
|
|
More than 5 years |
|
|||||
|
Long-term debt |
|
$ |
1,585,258 |
|
|
$ |
4,700 |
|
|
$ |
9,400 |
|
|
$ |
9,400 |
|
|
$ |
1,561,758 |
|
|
Interest on long-term debt(1) |
|
|
721,603 |
|
|
|
108,043 |
|
|
|
215,407 |
|
|
|
209,036 |
|
|
|
189,117 |
|
|
Lease finance obligations(2) |
|
|
356,562 |
|
|
|
19,009 |
|
|
|
37,949 |
|
|
|
37,123 |
|
|
|
262,481 |
|
|
Capital lease obligations(2) |
|
|
7,951 |
|
|
|
3,426 |
|
|
|
4,436 |
|
|
|
89 |
|
|
|
— |
|
|
Operating leases |
|
|
283,531 |
|
|
|
67,213 |
|
|
|
104,155 |
|
|
|
55,971 |
|
|
|
56,192 |
|
|
Total contractual cash obligations |
|
$ |
2,954,905 |
|
|
$ |
202,391 |
|
|
$ |
371,347 |
|
|
$ |
311,619 |
|
|
$ |
2,069,548 |
|
|
(1) |
We had no outstanding borrowings under the 2015 facility as of December 31, 2016. Borrowings under the 2015 facility bear interest at a variable rate. Therefore, actual interest may differ from the amounts presented above due to interest rate changes or any future borrowing activity under the 2015 facility. The 2015 term loan also bears interest at a variable rate, therefore actual interest may differ from the amounts presented above due to interest rate changes. |
|
(2) |
Future minimum commitments for lease finance obligations and capital lease obligations. |
The amounts reflected in the table above for operating leases represent future minimum lease payments under non-cancelable operating leases with an initial or remaining term in excess of one year at December 31, 2016. Purchase orders entered into in the ordinary course of business are excluded from the above table because they are payable within one year. Amounts for which we are liable under purchase orders are reflected on our consolidated balance sheet as accounts payable and accrued liabilities. We plan to lease additional delivery equipment during 2017 to support anticipated sales growth. These operating leases are not included in the table above.
OTHER CASH OBLIGATIONS NOT REFLECTED IN THE BALANCE SHEET
In accordance with accounting principles generally accepted in the United States, commonly referred to as GAAP, our operating leases are not recorded in our balance sheet. In addition to the lease obligations included in the above table, we have residual value guarantees on certain equipment leases. Under these leases we have the option of (1) purchasing the equipment at the end of the lease term, (2) arranging for the sale of the equipment to a third party, or (3) returning the equipment to the lessor to sell the equipment. If the sales proceeds in either case are less than the residual value, then we are required to reimburse the lessor for the deficiency up to a specified level as stated in each lease agreement. The guarantees under these leases for the residual values of equipment at the end of the respective operating lease periods approximated $3.9 million as of December 31, 2016.
Based upon the expectation that none of these leased assets will have a residual value at the end of the lease term that is materially less than the value specified in the related operating lease agreement or that we will purchase the equipment at the end of the lease term, we do not believe it is probable that we will be required to fund any amounts under the terms of these guarantee arrangements. Accordingly, no accruals have been recognized for these guarantees.
In addition, the Company is party to certain agreements related to its lease finance obligations which commit the Company to perform certain repairs and maintenance obligations under the leases in a specified manner and timeframe that generally will occur throughout the next year.
CRITICAL ACCOUNTING POLICIES AND ESTIMATES
Critical accounting policies are those that both are important to the accurate portrayal of a company’s financial condition and results, and require subjective or complex judgments, often as a result of the need to make estimates about the effect of matters that are inherently uncertain.
In order to prepare financial statements that conform to GAAP, we make estimates and assumptions that affect the amounts reported in our financial statements and accompanying notes. Certain estimates are particularly sensitive due to their significance to the financial statements and the possibility that future events may be significantly different from our expectations.
We have identified the following accounting policies that require us to make the most subjective or complex judgments in order to fairly present our consolidated financial position and results of operations.
35
Vendor Rebates. Many of our arrangements with our vendors provide for us to receive a rebate of a specified amount payable to us when we achieve any of a number of measures, generally related to the volume of purchases from our vendors. We account for these rebates as a reduction of the prices of the vendor’s products, which reduces inventory until we sell the product, at which time these rebates reduce cost of sales. Throughout the year, we estimate the amount of rebates based upon our historical level of purchases. We continually revise these estimates to reflect actual purchase levels.
If market conditions were to change, vendors may change the terms of some or all of these programs. Although these changes would not affect the amounts which we have recorded related to product already purchased, it may impact our gross margins on products we sell or sales earned in future periods.
Allowance for Doubtful Accounts and Related Reserves. We maintain an allowance for doubtful accounts for estimated losses due to the failure of our customers to make required payments. We perform periodic credit evaluations of our customers and typically do not require collateral. However, we have, in some cases, required customers to collateralize their debt with us. Consistent with industry practices, we typically require payment from most customers within 30 days. As our business is seasonal in certain regions, our customers’ businesses are also seasonal. Sales are lowest in the winter months, and our past due accounts receivable balance as a percentage of total receivables generally increases during this time. Throughout the year, we record estimated reserves based upon our historical write-offs of uncollectible accounts, taking into consideration certain factors, such as aging statistics and trends, customer payment history, independent credit reports, and discussions with customers. We regularly perform a specific analysis of all accounts past due and write off account balances when we have exhausted reasonable collection efforts and determined that the likelihood of collection is remote. We charge these write-offs against our allowance for doubtful accounts. Any future decline in the macroeconomic factors that affect the overall housing industry or our specific customers’ business could cause us to revise our estimate of expected losses and increase our allowance for doubtful accounts. In addition, we also establish reserves for credit memos and customer returns.
Impairment of Long-Lived Assets. Long-lived assets, including property and equipment and intangible assets with finite lives, are reviewed for possible impairment whenever events or circumstances indicate that the carrying amount of an asset may not be recoverable. The carrying amount of a long-lived asset group is not recoverable if it exceeds the sum of the undiscounted cash flows expected to result from the use and eventual disposition of the asset group. Our long-lived assets and liabilities are grouped at the lowest level for which identifiable cash flows are largely independent of the cash flows of other groups of assets and liabilities. Our facility related long-lived assets are grouped at a geographical location level, which is at a level below our operating segments. All of our other long-lived assets are grouped at a geographical region level, which is the equivalent of our operating segments. Our judgment regarding the existence of impairment indicators is based on market and operational performance. Determining whether impairment has occurred typically requires various estimates and assumptions, including determining which cash flows are directly related to the potentially impaired asset group, the useful life over which cash flows will occur, their amount, and the asset group’s residual value, if any. In turn, measurement of an impairment loss requires a determination of fair value, which is based on the best information available.
We use internal cash flow estimates, quoted market prices when available and independent appraisals, as appropriate, to determine fair value. We derive the required cash flow estimates from our historical experience and our internal business plans and apply an appropriate discount rate. These cash flow estimates are over the remaining useful lives of the asset groups. Forecasted housing starts are used to help estimate future revenue. Historical trends are then used to project gross margins and operating expenses based upon various revenue levels. If these projected cash flows are less than the carrying amount, an impairment loss is recognized based on the fair value of the asset group. Due to the uncertainties associated with these projections, actual results could differ from projected results, and further impairment of long-lived assets could be recorded. Future non-cash impairment of long-lived assets would have the effect of decreasing our earnings or increasing our losses in such period, but would not impact our current outstanding debt obligations or compliance with covenants contained in the related debt agreements.
For the year ended December 31, 2016 we recorded asset impairment charges on held-for-use assets of $2.7 million primarily related to intangible assets associated with a location closure and recorded $1.9 million related to fair value adjustments on held-for-sale assets during 2016. For the year ended December 31, 2015, we recorded asset impairment charges on held-for-use assets of $1.4 million related to customer relationship intangible assets associated with a location closure and recorded $0.7 million related to fair value adjustments on held-for-sale assets during 2015. We recorded no significant asset impairment charges in 2014.
Goodwill. Goodwill represents the excess of the amount we paid to acquire businesses over the estimated fair value of tangible assets and identifiable intangible assets acquired, less liabilities assumed. At December 31, 2016, our goodwill balance was $740.4 million, representing 25.4% of our total assets.
36
We test goodwill for impairment in the fourth quarter of each year or at any other time when impairment indicators exist by comparing the estimated implied value of a reporting units’ goodwill to its book value. Examples of such indicators that could cause us to test goodwill for impairment between annual tests include a significant change in the business climate, unexpected competition or a significant deterioration in market share. We may also consider market capitalization relative to our net assets. Housing starts are a significant sales driver for us. If there is a significant decline or an expected decline in housing starts, this could adversely affect our expectations for a reporting unit and the value of that reporting unit. We did not have any goodwill impairments in 2016, 2015 or 2014.
The process of evaluating goodwill for impairment involves the determination of the fair value of our reporting units. As a result of the reorganization following the ProBuild acquisition, our reporting units are aligned with our nine geographic regions which are also determined to be our operating segments. In evaluating goodwill for impairment, the Company first assesses qualitative factors to determine whether it is more likely than not that the fair value of the reporting unit is less than its carrying value. If it is concluded that it is not more likely than not that the fair value of the reporting unit is less than its carrying value, then no further testing of the goodwill is required.
However, if we determine that it is more likely than not that the fair value of the reporting unit is less than its carrying value, then we evaluate goodwill for impairment using a two-step process. The first step is to identify potential impairment by comparing the fair value of a reporting unit to the book value, including goodwill. If the fair value of a reporting unit exceeds the book value, goodwill is not impaired. If the book value exceeds the fair value, the second step of the process is performed to measure the amount of impairment. In step two, the estimated fair value of the reporting unit is allocated to all other assets and liabilities of that reporting unit based on their respective fair values. The excess of the fair value of the reporting unit over the amount allocated to its assets and liabilities is the implied fair value of goodwill. Goodwill impairment is measured as the excess of the carrying value over its implied fair value. The fair value of a reporting unit is estimated based upon the projected discounted cash flow expected to be generated from the reporting unit using a discounted cash flow methodology. Where available and appropriate, comparative market multiples are used to corroborate the results of the discounted cash flow.
In performing our annual impairment tests at December 31, 2016, we developed a range of fair values for our reporting units using a five-year discounted cash flow methodology. Inherent in such fair value determinations are estimates relating to future cash flows, including revenue growth, gross margins, operating expenses and long-term growth rates, and our interpretation of current economic indicators and market conditions and their impact on our strategic plans and operations. Due to the uncertainties associated with such estimates, interpretations and assumptions, actual results could differ from projected results, and further impairment of goodwill could be recorded.
Significant information and assumptions utilized in estimating future cash flows for our reporting units includes projections of market share gains as well as publicly available industry information on projected single-family housing starts and lumber commodity prices which are used to project revenue. Projected gross margins and operating expenses reflect current headcount levels and cost structure and are flexed in future years based upon historical trends at various revenue levels. Long-term growth was based upon terminal value earnings before interest, taxes, depreciation and amortization (EBITDA) multiples of 4.5x for all reporting units to reflect the relevant expected acquisition price. A discount rate of 12.5% was used for all reporting units and is intended to reflect the weighted average cost of capital for a potential market participant and includes all risks of ownership and the associated risks of realizing the stream of projected future cash flows. Decreasing the long-term growth to an EBITDA multiple of 3.5x, or increasing the discount rate by 1.0% to 13.5%, would not have changed the results of our impairment testing.
At December 31, 2016, the fair values of each of our reporting units were substantially in excess of their respective carrying values. The excess (or “cushion”) of the implied fair value of goodwill over the carrying value of goodwill for each of our nine reporting units ranged from $58.0 million to $238.0 million. Factors that could negatively impact the estimated fair value of our reporting units and potentially trigger additional impairment include, but are not limited to, unexpected competition, lower than expected housing starts, an increase in market participant weighted average cost of capital, increases in material or labor cost, and significant declines in our market capitalization. Future impairment of goodwill would have the effect of decreasing our earnings or increasing our losses in such period, but would not impact our current outstanding debt obligations or compliance with covenants contained in the related debt agreements.
Deferred Income Taxes. At December 31, 2016 and 2015, the Company had deferred tax assets, net of deferred tax liabilities, of $120.1 million and $127.1 million, respectively, offset by valuation allowances of $4.8 million and $136.5 million, respectively. We have $411.4 million of state net operating loss carry-forwards, which includes $2.5 million of state tax credit carry-forwards expiring at various dates through 2036. We also have $226.5 million of federal net operating loss carry-forwards that will expire at various dates through 2036. The federal and state net operating loss carry-forwards include approximately $23.3 million of gross windfall tax benefits from stock option exercises that have not been recorded as of December 31, 2016. At December 31, 2016, the Company needed to generate approximately $287.6 million of pre-tax income in future periods to realize its federal deferred tax assets.
37
We evaluate our deferred tax assets on a quarterly basis to determine whether a valuation allowance is required. In accordance with the Income Taxes topic of the Accounting Standards Codification (“Codification”), we assess whether it is more likely than not that some or all of our deferred tax assets will not be realized. Significant judgment is required in estimating valuation allowances for deferred tax assets and in making this determination, we consider all available positive and negative evidence. In the Company’s evaluation of its ability to realize its deferred tax assets, we gave more significant weight to evidence that was objective in nature as compared to subjective evidence. Also, more significant weight was given to evidence that relates to the Company’s current financial performance. The realization of a deferred tax asset ultimately depends on the existence of sufficient taxable income in the applicable carryback or carryforward periods. We consider the nature, frequency, and severity of current and cumulative losses, as well as historical and forecasted financial results, the overall business environment, our industry's historic cyclicality, the reversal of existing deferred tax liabilities, and tax planning strategies in our assessment. Changes in our estimates of future taxable income and tax planning strategies will affect our estimate of the realization of the tax benefits of these tax carryforwards.
We recorded a full valuation allowance in 2008 due to our cumulative three-year loss position at that time, compounded by the negative industry-wide business trends and outlook. At December 31, 2015, the Company had given significant weight to the negative objective evidence of the historically weak housing market conditions during the housing downturn that contributed to our three-year cumulative pre-tax loss position when reporting a valuation allowance of $136.5 million against our deferred income tax assets, representing a valuation allowance against substantially all of our net deferred income tax assets.
In the second quarter of 2016, we moved from a cumulative loss position over the previous three years to a cumulative income position for the first time since we established the full valuation allowance in 2008. We continued to maintain a cumulative income position over the previous three years into the third quarter of 2016. In the Company’s evaluation at September 30, 2016, we gave the most significant weight to this objective positive evidence related to its recent financial results. Additionally, even conservative projections of the Company’s estimated future annual pre-tax income would indicate realization of all of its federal net operating losses well in advance of the expiration of the Company’s NOL carryforwards and it would also absorb all federal deductible temporary differences as they reverse in future years. The Company considered, at a lower weighting, the subjective positive evidence that it expects to increase its pre-tax income in future years as the homebuilding industry continues to recover and strengthen as currently projected by a composite of third-party sources, including the NAHB. Therefore, at September 30, 2016, with this positive historical evidence and the projection of future profitability, management determined that there was sufficient positive evidence to conclude that it is more likely than not that we would realize our net federal and certain state deferred tax assets, resulting in $117.6 million and $3.2 million benefit being recognized in our provision for income taxes for the third and fourth quarter of 2016, respectively.
Prior to the quarter ended June 30, 2016, the Company had given significant weight to the negative objective evidence of its three-year cumulative pre-tax loss position as a result of losses incurred in prior years during the housing downturn. As of June 30, 2016 and September 30, 2016, the Company had generated positive cumulative pre-tax income for the past three years and therefore, the prior year losses were weighted less than the recent positive financial results in the Company’s evaluation at September 30, 2016. Other negative subjective evidence, such as the cyclical, slower-than-anticipated housing market recovery, was considered at a lower weighting because the Company’s recent financial performance has been achieved in this environment.
As of December 31, 2016, we have certain states where we are not currently projecting future taxable income levels that would be sufficient to utilize the carryover net operating losses and as such continue to maintain a valuation allowance against certain of these state deferred tax assets. We will continue to assess quarterly whether it is more likely than not that some or all of these state deferred tax assets will be realizable in the future. Changes in the positive and negative evidence, including differences in the Company’s future operating results as compared to the estimates utilized in the determination of the valuation allowance, could result in changes in the Company’s estimate of the valuation allowance related to its tax benefits for state net operating loss carryforwards.
In 2016 we recorded a reduction to the valuation allowance of $131.7 million against our net deferred tax assets as we released valuation allowances on our net deferred tax assets as noted above. In 2015, we recorded a valuation allowance of $9.7 million related to our continuing operations. In 2014, we reduced our valuation allowance by $7.2 million due to the utilization of net operating losses against federal and state taxable income.
We base our estimate of deferred tax assets and liabilities on current tax laws and rates. In certain cases, we also base our estimate on business plan forecasts and other expectations about future outcomes. Changes in existing tax laws or rates could affect our actual tax results, and future business results may affect the amount of our deferred tax liabilities or the valuation of our deferred tax assets over time. Due to uncertainties in the estimation process, particularly with respect to changes in facts and circumstances in future reporting periods, as well as the residential homebuilding industry’s cyclicality and sensitivity to changes in economic conditions, it is possible that actual results could differ from the estimates used in previous analyses.
38
Accounting for deferred taxes is based upon estimates of future results. Differences between the anticipated and actual outcomes of these future results could have a material impact on our consolidated results of operations or financial position.
Insurance. We are insured for general liability, auto liability and workers’ compensation exposures, subject to deductible amounts. The expected liability for unpaid claims, including incurred but not reported losses, is determined using the assistance of a third-party actuary and is reflected on our balance sheet as an accrued liability. The amount recoverable from our insurance provider is reflected as an other asset. Our accounting policy includes an internal evaluation and adjustment of our reserve for all insured losses on a quarterly basis. On a quarterly basis, we engage an external actuarial professional to independently assess and estimate the total liability outstanding, which is compared to the actual reserve balance at that time and adjusted accordingly.
Stock-Based Compensation. Calculating stock-based compensation expense requires the input of subjective assumptions. We determine the fair value of each restricted stock unit grant subject to market conditions using the Monte Carlo simulation model. Specific inputs to the model include the expected volatilities of our common stock and the expected volatilities of the common stocks of the constituents of the Company’s peer group, dividend yield and risk-free rate.
The expected volatilities are based on the historical volatilities of our common stock and the common stocks of the constituents of the Company’s peer group over the most recent period equal to the measurement period. The expected dividend yield is based on our history of not paying regular dividends in the past and our current intention to not pay regular dividends in the foreseeable future. The risk-free rate is based on the U.S. Treasury yield curve in effect at the time of grant and has a term equal to the measurement period.
RECENTLY ISSUED ACCOUNTING STANDARDS
Information regarding recent accounting pronouncements is discussed in Note 2 to the consolidated financial statements included in Item 8 of this annual report on Form 10-K.
Item 7A. Quantitative and Qualitative Disclosures about Market Risk
We may experience changes in interest expense if changes in our debt occur. Changes in market interest rates could also affect our interest expense. Our 2023 notes and our 2024 notes bear interest at a fixed rate, therefore, our interest expense related to these notes would not be affected by an increase in market interest rates. Borrowings under the 2015 facility and the 2015 term loan bear interest at either a base rate or eurodollar rate, plus, in each case, an applicable margin. At December 31, 2016, a 1.0% increase in interest rates on the 2015 term loan would, subject to the interest rate floor specified in the agreement, result in approximately $3.6 million in additional interest expense annually. At December 31, 2016, a 1.0% increase in interest rates on the 2015 facility would result in no additional interest expense annually as we had no outstanding borrowings. The 2015 facility also assesses variable commitment and outstanding letter of credit fees based on quarterly average loan utilization.
We purchase certain materials, including lumber products, which are then sold to customers as well as used as direct production inputs for our manufactured products that we deliver. Short-term changes in the cost of these materials and the related in-bound freight costs, some of which are subject to significant fluctuations, are sometimes, but not always, passed on to our customers. Our delayed ability to pass on material price increases to our customers can adversely impact our operating results.
39
Item 8. Financial Statements and Supplementary Data
INDEX TO CONSOLIDATED FINANCIAL STATEMENTS
|
|
41 |
|
|
|
42 |
|
|
|
43 |
|
|
Consolidated Statements of Cash Flows for the years ended December 31, 2016, 2015 and 2014 |
|
44 |
|
|
45 |
|
|
|
46 |
40
Report of Independent Registered Public Accounting Firm
To the Board of Directors and Stockholders of Builders FirstSource, Inc.
In our opinion, the accompanying consolidated balance sheets and the related consolidated statements of operations and comprehensive income (loss), stockholders’ equity and cash flows present fairly, in all material respects, the financial position of Builders FirstSource, Inc. and its subsidiaries at December 31, 2016 and December 31, 2015, and the results of their operations and their cash flows for each of the three years in the period ended December 31, 2016 in conformity with accounting principles generally accepted in the United States of America. Also in our opinion, the Company maintained, in all material respects, effective internal control over financial reporting as of December 31, 2016, based on criteria established in Internal Control - Integrated Framework (2013) issued by the Committee of Sponsoring Organizations of the Treadway Commission (COSO). The Company's management is responsible for these financial statements, for maintaining effective internal control over financial reporting and for its assessment of the effectiveness of internal control over financial reporting, included in Management's Report on Internal Control over Financial Reporting. Our responsibility is to express opinions on these financial statements and on the Company's internal control over financial reporting based on our integrated audits. We conducted our audits in accordance with the standards of the Public Company Accounting Oversight Board (United States). Those standards require that we plan and perform the audits to obtain reasonable assurance about whether the financial statements are free of material misstatement and whether effective internal control over financial reporting was maintained in all material respects. Our audits of the financial statements included examining, on a test basis, evidence supporting the amounts and disclosures in the financial statements, assessing the accounting principles used and significant estimates made by management, and evaluating the overall financial statement presentation. Our audit of internal control over financial reporting included obtaining an understanding of internal control over financial reporting, assessing the risk that a material weakness exists, and testing and evaluating the design and operating effectiveness of internal control based on the assessed risk. Our audits also included performing such other procedures as we considered necessary in the circumstances. We believe that our audits provide a reasonable basis for our opinions.
A company’s internal control over financial reporting is a process designed to provide reasonable assurance regarding the reliability of financial reporting and the preparation of financial statements for external purposes in accordance with generally accepted accounting principles. A company’s internal control over financial reporting includes those policies and procedures that (i) pertain to the maintenance of records that, in reasonable detail, accurately and fairly reflect the transactions and dispositions of the assets of the company; (ii) provide reasonable assurance that transactions are recorded as necessary to permit preparation of financial statements in accordance with generally accepted accounting principles, and that receipts and expenditures of the company are being made only in accordance with authorizations of management and directors of the company; and (iii) provide reasonable assurance regarding prevention or timely detection of unauthorized acquisition, use, or disposition of the company’s assets that could have a material effect on the financial statements.
Because of its inherent limitations, internal control over financial reporting may not prevent or detect misstatements. Also, projections of any evaluation of effectiveness to future periods are subject to the risk that controls may become inadequate because of changes in conditions, or that the degree of compliance with the policies or procedures may deteriorate.
/s/ PricewaterhouseCoopers LLP
Dallas, Texas
March 1, 2017
41
BUILDERS FIRSTSOURCE, INC. AND SUBSIDIARIES
CONSOLIDATED STATEMENTS OF OPERATIONS AND COMPREHENSIVE INCOME (LOSS)
|
|
|
Years Ended December 31, |
|
|||||||||
|
|
|
2016 |
|
|
2015 |
|
|
2014 |
|
|||
|
|
|
(In thousands, except per share amounts) |
|
|||||||||
|
Sales |
|
$ |
6,367,284 |
|
|
$ |
3,564,425 |
|
|
$ |
1,604,096 |
|
|
Cost of sales |
|
|
4,770,536 |
|
|
|
2,662,967 |
|
|
|
1,247,099 |
|
|
Gross margin |
|
|
1,596,748 |
|
|
|
901,458 |
|
|
|
356,997 |
|
|
Selling, general and administrative expenses |
|
|
1,360,412 |
|
|
|
810,703 |
|
|
|
307,387 |
|
|
Income from operations |
|
|
236,336 |
|
|
|
90,755 |
|
|
|
49,610 |
|
|
Interest expense, net |
|
|
214,667 |
|
|
|
109,199 |
|
|
|
30,349 |
|
|
Income (loss) before income taxes |
|
|
21,669 |
|
|
|
(18,444 |
) |
|
|
19,261 |
|
|
Income tax expense (benefit) |
|
|
(122,672 |
) |
|
|
4,387 |
|
|
|
1,111 |
|
|
Net income (loss) |
|
$ |
144,341 |
|
|
$ |
(22,831 |
) |
|
$ |
18,150 |
|
|
Comprehensive income (loss) |
|
$ |
144,341 |
|
|
$ |
(22,831 |
) |
|
$ |
18,150 |
|
|
Net income (loss) per share: |
|
|
|
|
|
|
|
|
|
|
|
|
|
Basic |
|
$ |
1.30 |
|
|
$ |
(0.22 |
) |
|
$ |
0.19 |
|
|
Diluted |
|
$ |
1.27 |
|
|
$ |
(0.22 |
) |
|
$ |
0.18 |
|
|
Weighted average common shares outstanding: |
|
|
|
|
|
|
|
|
|
|
|
|
|
Basic |
|
|
110,754 |
|
|
|
103,190 |
|
|
|
98,050 |
|
|
Diluted |
|
|
113,585 |
|
|
|
103,190 |
|
|
|
100,522 |
|
The accompanying notes are an integral part of these consolidated financial statements.
42
BUILDERS FIRSTSOURCE, INC. AND SUBSIDIARIES
|
|
|
December 31, |
|
|||||
|
|
|
2016 |
|
|
2015 |
|
||
|
|
|
(In thousands, except per share amounts) |
|
|||||
|
ASSETS |
|
|
|
|
|
|
|
|
|
Current assets: |
|
|
|
|
|
|
|
|
|
Cash and cash equivalents |
|
$ |
14,449 |
|
|
$ |
65,063 |
|
|
Accounts receivable, less allowances of $11,571 and $8,049 at December 31, 2016 and 2015, respectively |
|
|
569,208 |
|
|
|
528,544 |
|
|
Other receivables |
|
|
55,781 |
|
|
|
57,778 |
|
|
Inventories, net |
|
|
541,771 |
|
|
|
513,045 |
|
|
Other current assets |
|
|
34,772 |
|
|
|
29,899 |
|
|
Total current assets |
|
|
1,215,981 |
|
|
|
1,194,329 |
|
|
Property, plant and equipment, net |
|
|
656,101 |
|
|
|
734,329 |
|
|
Assets held for sale |
|
|
4,361 |
|
|
|
5,585 |
|
|
Goodwill |
|
|
740,411 |
|
|
|
739,625 |
|
|
Intangible assets, net |
|
|
159,373 |
|
|
|
189,604 |
|
|
Deferred income taxes |
|
|
115,320 |
|
|
|
2,035 |
|
|
Other assets, net |
|
|
18,340 |
|
|
|
16,531 |
|
|
Total assets |
|
$ |
2,909,887 |
|
|
$ |
2,882,038 |
|
|
LIABILITIES AND STOCKHOLDERS’ EQUITY |
|
|
|
|
|
|
|
|
|
Current liabilities: |
|
|
|
|
|
|
|
|
|
Checks outstanding |
|
$ |
35,606 |
|
|
$ |
46,833 |
|
|
Accounts payable |
|
|
409,759 |
|
|
|
365,347 |
|
|
Accrued liabilities |
|
|
293,115 |
|
|
|
293,905 |
|
|
Current maturities of long-term debt and lease obligations |
|
|
16,217 |
|
|
|
29,153 |
|
|
Total current liabilities |
|
|
754,697 |
|
|
|
735,238 |
|
|
Long-term debt and lease obligations, net of current maturities, debt discount, and debt issuance costs |
|
|
1,785,835 |
|
|
|
1,922,518 |
|
|
Deferred income taxes |
|
|
— |
|
|
|
11,502 |
|
|
Other long-term liabilities |
|
|
59,735 |
|
|
|
63,585 |
|
|
Total liabilities |
|
|
2,600,267 |
|
|
|
2,732,843 |
|
|
Commitments and contingencies (Note 14) |
|
|
|
|
|
|
|
|
|
Stockholders’ equity: |
|
|
|
|
|
|
|
|
|
Preferred stock, $0.01 par value, 10,000 shares authorized; zero shares issued and outstanding at December 31, 2016 and 2015 |
|
|
— |
|
|
|
— |
|
|
Common stock, $0.01 par value, 200,000 shares authorized; 111,564 and 109,726 shares issued and outstanding at December 31, 2016 and 2015, respectively |
|
|
1,115 |
|
|
|
1,097 |
|
|
Additional paid-in capital |
|
|
527,868 |
|
|
|
511,802 |
|
|
Accumulated deficit |
|
|
(219,363 |
) |
|
|
(363,704 |
) |
|
Total stockholders’ equity |
|
|
309,620 |
|
|
|
149,195 |
|
|
Total liabilities and stockholders’ equity |
|
$ |
2,909,887 |
|
|
$ |
2,882,038 |
|
The accompanying notes are an integral part of these consolidated financial statements.
43
BUILDERS FIRSTSOURCE, INC. AND SUBSIDIARIES
CONSOLIDATED STATEMENTS OF CASH FLOWS
|
|
|
Years Ended December 31, |
|
|||||||||
|
|
|
2016 |
|
|
2015 |
|
|
2014 |
|
|||
|
|
|
(In thousands) |
|
|||||||||
|
Cash flows from operating activities: |
|
|
|
|
|
|
|
|
|
|
|
|
|
Net income (loss) |
|
$ |
144,341 |
|
|
$ |
(22,831 |
) |
|
$ |
18,150 |
|
|
Adjustments to reconcile net income (loss) to net cash provided by operating activities: |
|
|
|
|
|
|
|
|
|
|
|
|
|
Depreciation and amortization |
|
|
109,793 |
|
|
|
58,280 |
|
|
|
9,519 |
|
|
Asset impairments |
|
|
4,616 |
|
|
|
2,114 |
|
|
|
— |
|
|
Amortization of deferred loan costs |
|
|
6,863 |
|
|
|
18,630 |
|
|
|
2,432 |
|
|
Amortization of debt discount |
|
|
639 |
|
|
|
299 |
|
|
|
— |
|
|
Loss on extinguishment of debt |
|
|
55,776 |
|
|
|
— |
|
|
|
— |
|
|
Payment of original issue discount |
|
|
(1,259 |
) |
|
|
— |
|
|
|
— |
|
|
Accretion of lease finance obligations |
|
|
813 |
|
|
|
— |
|
|
|
— |
|
|
Fair value adjustment of stock warrants |
|
|
— |
|
|
|
4,563 |
|
|
|
(456 |
) |
|
Deferred income taxes |
|
|
(124,787 |
) |
|
|
3,287 |
|
|
|
524 |
|
|
Bad debt expense |
|
|
1,390 |
|
|
|
2,285 |
|
|
|
(274 |
) |
|
Stock compensation expense |
|
|
10,549 |
|
|
|
6,848 |
|
|
|
6,157 |
|
|
Net gain on sales of assets |
|
|
(4,952 |
) |
|
|
(801 |
) |
|
|
(114 |
) |
|
Changes in assets and liabilities, net of assets acquired and liabilities assumed: |
|
|
|
|
|
|
|
|
|
|
|
|
|
Receivables |
|
|
(45,942 |
) |
|
|
74,089 |
|
|
|
1,113 |
|
|
Inventories |
|
|
(33,965 |
) |
|
|
46,854 |
|
|
|
(9,103 |
) |
|
Other current assets |
|
|
(4,873 |
) |
|
|
(6,320 |
) |
|
|
(4,791 |
) |
|
Other assets and liabilities |
|
|
(1,641 |
) |
|
|
5,314 |
|
|
|
(660 |
) |
|
Accounts payable and checks outstanding |
|
|
36,585 |
|
|
|
(45,286 |
) |
|
|
(5,410 |
) |
|
Accrued liabilities |
|
|
4,281 |
|
|
|
29,709 |
|
|
|
10,406 |
|
|
Net cash provided by operating activities |
|
|
158,227 |
|
|
|
177,034 |
|
|
|
27,493 |
|
|
Cash flows from investing activities: |
|
|
|
|
|
|
|
|
|
|
|
|
|
Purchases of property, plant and equipment |
|
|
(42,662 |
) |
|
|
(43,811 |
) |
|
|
(25,716 |
) |
|
Proceeds from sale of property, plant and equipment |
|
|
8,305 |
|
|
|
4,275 |
|
|
|
213 |
|
|
Cash used for acquisitions, net |
|
|
(3,970 |
) |
|
|
(1,468,511 |
) |
|
|
(69,337 |
) |
|
Net cash used in investing activities |
|
|
(38,327 |
) |
|
|
(1,508,047 |
) |
|
|
(94,840 |
) |
|
Cash flows from financing activities: |
|
|
|
|
|
|
|
|
|
|
|
|
|
Borrowings under revolving credit facility |
|
|
907,000 |
|
|
|
320,000 |
|
|
|
30,000 |
|
|
Payments under revolving credit facility |
|
|
(967,000 |
) |
|
|
(290,000 |
) |
|
|
— |
|
|
Proceeds from issuance of notes |
|
|
750,000 |
|
|
|
700,000 |
|
|
|
— |
|
|
Proceeds from term loan |
|
|
— |
|
|
|
594,000 |
|
|
|
— |
|
|
Repayments of long-term debt and other loans |
|
|
(807,517 |
) |
|
|
(4,213 |
) |
|
|
(67 |
) |
|
Payments of debt extinguishment costs |
|
|
(42,869 |
) |
|
|
— |
|
|
|
— |
|
|
Payments of loan costs |
|
|
(15,663 |
) |
|
|
(58,525 |
) |
|
|
(34 |
) |
|
Proceeds from public offering of common stock, net of issuance costs |
|
|
— |
|
|
|
111,309 |
|
|
|
— |
|
|
Exercise of stock options |
|
|
6,627 |
|
|
|
6,718 |
|
|
|
1,831 |
|
|
Repurchase of common stock |
|
|
(1,092 |
) |
|
|
(986 |
) |
|
|
(1,306 |
) |
|
Net cash provided by (used in) financing activities |
|
|
(170,514 |
) |
|
|
1,378,303 |
|
|
|
30,424 |
|
|
Net increase (decrease) in cash and cash equivalents |
|
|
(50,614 |
) |
|
|
47,290 |
|
|
|
(36,923 |
) |
|
Cash and cash equivalents at beginning of period |
|
|
65,063 |
|
|
|
17,773 |
|
|
|
54,696 |
|
|
Cash and cash equivalents at end of period |
|
$ |
14,449 |
|
|
$ |
65,063 |
|
|
$ |
17,773 |
|
Supplemental disclosure of non-cash activities
For the years ended December 31, 2016 and 2015 the Company retired assets subject to lease finance obligations of $38.1 million and $1.4 million and extinguished the related lease finance obligation of $41.2 million and $1.5 million, respectively. There were no retirements of assets subject to lease finance obligations or extinguishment of lease finance obligations for the year ended December 31, 2014.
The Company purchased equipment which was financed through capital lease obligations of $8.1 million and $1.6 million in the years ended December 31, 2016 and 2015, respectively. There were no purchases of equipment financed through capital lease obligations for the year ended December 31, 2014.
The accompanying notes are an integral part of these consolidated financial statements.
44
BUILDERS FIRSTSOURCE, INC. AND SUBSIDIARIES
CONSOLIDATED STATEMENT OF CHANGES IN STOCKHOLDERS’ EQUITY
|
|
|
|
|
|
|
|
|
|
|
Additional Paid |
|
|
|
|
|
|
|
|
|
|
|
|
|
Common Stock |
|
|
in |
|
|
Accumulated |
|
|
|
|
|
|||||||
|
|
|
Shares |
|
|
Amount |
|
|
Capital |
|
|
Deficit |
|
|
Total |
|
|||||
|
|
|
(In thousands) |
|
|||||||||||||||||
|
Balance at December 31, 2013 |
|
|
97,905 |
|
|
$ |
973 |
|
|
$ |
373,418 |
|
|
$ |
(359,023 |
) |
|
$ |
15,368 |
|
|
Vesting of restricted stock |
|
|
— |
|
|
|
6 |
|
|
|
(6 |
) |
|
|
— |
|
|
|
— |
|
|
Stock compensation expense |
|
|
— |
|
|
|
— |
|
|
|
6,157 |
|
|
|
— |
|
|
|
6,157 |
|
|
Exercise of stock options |
|
|
492 |
|
|
|
5 |
|
|
|
1,826 |
|
|
|
— |
|
|
|
1,831 |
|
|
Repurchase of common stock |
|
|
(171 |
) |
|
|
(2 |
) |
|
|
(1,304 |
) |
|
|
— |
|
|
|
(1,306 |
) |
|
Net income |
|
|
— |
|
|
|
— |
|
|
|
— |
|
|
|
18,150 |
|
|
|
18,150 |
|
|
Balance at December 31, 2014 |
|
|
98,226 |
|
|
|
982 |
|
|
|
380,091 |
|
|
|
(340,873 |
) |
|
|
40,200 |
|
|
Issuance of common stock from public offering, net of issuance costs |
|
|
9,200 |
|
|
|
92 |
|
|
|
111,217 |
|
|
|
— |
|
|
|
111,309 |
|
|
Vesting of restricted stock units |
|
|
495 |
|
|
|
5 |
|
|
|
(5 |
) |
|
|
— |
|
|
|
— |
|
|
Stock compensation expense |
|
|
— |
|
|
|
— |
|
|
|
6,848 |
|
|
|
— |
|
|
|
6,848 |
|
|
Exercise of stock options |
|
|
1,388 |
|
|
|
14 |
|
|
|
6,704 |
|
|
|
— |
|
|
|
6,718 |
|
|
Exercise of stock warrants |
|
|
569 |
|
|
|
6 |
|
|
|
7,931 |
|
|
|
— |
|
|
|
7,937 |
|
|
Repurchase of common stock |
|
|
(152 |
) |
|
|
(2 |
) |
|
|
(984 |
) |
|
|
— |
|
|
|
(986 |
) |
|
Net loss |
|
|
— |
|
|
|
— |
|
|
|
— |
|
|
|
(22,831 |
) |
|
|
(22,831 |
) |
|
Balance at December 31, 2015 |
|
|
109,726 |
|
|
|
1,097 |
|
|
|
511,802 |
|
|
|
(363,704 |
) |
|
|
149,195 |
|
|
Vesting of restricted stock units |
|
|
505 |
|
|
|
5 |
|
|
|
(5 |
) |
|
|
— |
|
|
|
— |
|
|
Stock compensation expense |
|
|
— |
|
|
|
— |
|
|
|
10,549 |
|
|
|
— |
|
|
|
10,549 |
|
|
Exercise of stock options |
|
|
1,496 |
|
|
|
15 |
|
|
|
6,612 |
|
|
|
— |
|
|
|
6,627 |
|
|
Repurchase of common stock |
|
|
(163 |
) |
|
|
(2 |
) |
|
|
(1,090 |
) |
|
|
— |
|
|
|
(1,092 |
) |
|
Net income |
|
|
— |
|
|
|
— |
|
|
|
— |
|
|
|
144,341 |
|
|
|
144,341 |
|
|
Balance at December 31, 2016 |
|
|
111,564 |
|
|
$ |
1,115 |
|
|
$ |
527,868 |
|
|
$ |
(219,363 |
) |
|
$ |
309,620 |
|
The accompanying notes are an integral part of these consolidated financial statements.
45
BUILDERS FIRSTSOURCE, INC. AND SUBSIDIARIES
NOTES TO CONSOLIDATED FINANCIAL STATEMENTS
1. Description of the Business
Builders FirstSource, Inc., a Delaware corporation formed in 1998, is a leading supplier of building materials, manufactured components and construction services to professional contractors, sub-contractors, and consumers. Following our acquisition of ProBuild Holdings LLC (“ProBuild”) in July 2015, the company operates locations in 40 states across the United States.
In this annual report, references to the “Company,” “we,” “our,” “ours” or “us” refer to Builders FirstSource, Inc. and its consolidated subsidiaries (including ProBuild as of July 31, 2015), unless otherwise stated or the context otherwise requires.
2. Summary of Significant Accounting Policies
Principles of Consolidation
The consolidated financial statements present the results of operations, financial position, and cash flows of Builders FirstSource, Inc. and its wholly-owned subsidiaries. All intercompany transactions have been eliminated in consolidation.
Accounting Estimates
The preparation of financial statements in conformity with generally accepted accounting principles (“GAAP”) in the United States of America requires management to make estimates and assumptions that affect the reported amounts of assets and liabilities and disclosures of contingent assets and liabilities at the date of the financial statements, and the reported amounts of revenues and expenses during the reporting period. Actual results could materially differ from those estimates.
Estimates are used when accounting for items such as revenue, vendor rebates, allowance for returns, discounts and doubtful accounts, employee compensation programs, depreciation and amortization periods, income taxes, inventory values, insurance programs, goodwill, other intangible assets and long-lived assets.
Sales Recognition
We recognize sales of building products upon delivery to the customer. For contracts with service elements, sales are generally recognized on the completed contract method as these contracts are usually completed within 30 days with the percentage of completion method applied on a limited basis to certain contracts. Percentage of completion revenue represents less than 2% of our consolidated sales for each year presented. Contract costs include all direct material and labor, equipment costs and those indirect costs related to contract performance. Provisions for estimated losses on uncompleted contracts are recognized in the period in which such losses are determined. Prepayments for materials or services are deferred until such materials have been delivered or services have been provided. All sales recognized are net of allowances for discounts and estimated returns, based on historical experience. We present all sales tax on a net basis in our consolidated financial statements. The Company records sales incentives provided to customers as a reduction of revenue.
Cash and Cash Equivalents & Checks Outstanding
Cash and cash equivalents consist of cash on hand and all highly liquid investments with an original maturity date of three months or less. Also included in cash and cash equivalents are proceeds due from credit card transactions that generally settle within two business days. We maintain cash at financial institutions in excess of federally insured limits. Further, we maintain various banking relationships with different financial institutions. Accordingly, when there is a negative book cash balance resulting from outstanding checks that had not yet been paid by any single financial institution; they are reflected in checks outstanding on the accompanying consolidated balance sheets.
Financial Instruments
We use financial instruments in the normal course of business as a tool to manage our assets and liabilities. We do not hold or issue financial instruments for trading purposes.
We issued detachable warrants in 2011, which were measured at fair value on a recurring basis until exercised in 2015 as discussed in Note 8.
46
We extend credit to qualified professional homebuilders and contractors, in many cases on a non-collateralized basis. Accounts receivable potentially expose us to concentrations of credit risk. Because our customers are dispersed among our various markets, our credit risk to any one customer or state economy is not significant.
Our customer mix is a balance of large national homebuilders, regional homebuilders, local homebuilders and repair and remodeling contractors. For the year ended December 31, 2016, our top 10 customers accounted for approximately 16.8% of our sales, and no single customer accounted for more than 5% of sales.
The allowance for doubtful accounts is based on management’s assessment of the amount which may become uncollectible in the future and is estimated using specific review of problem accounts, overall portfolio quality, current economic conditions that may affect the borrower’s ability to pay, and historical experience. Accounts receivable are written off when deemed uncollectible. Other receivables consist primarily of vendor rebates receivable.
We also establish reserves for credit memos and customer returns. The reserve balance was $5.6 million and $3.8 million at December 31, 2016 and 2015, respectively. The activity in this reserve was not significant for each year presented.
Accounts receivable consisted of the following at December 31:
|
|
|
2016 |
|
|
2015 |
|
||
|
|
|
(In thousands) |
|
|||||
|
Accounts Receivable |
|
$ |
580,779 |
|
|
$ |
536,593 |
|
|
Less: allowances for returns and doubtful accounts |
|
|
11,571 |
|
|
|
8,049 |
|
|
Accounts receivable, net |
|
$ |
569,208 |
|
|
$ |
528,544 |
|
The following table shows the changes in our allowance for doubtful accounts:
|
|
|
2016 |
|
|
2015 |
|
|
2014 |
|
|||
|
|
|
(In thousands) |
|
|||||||||
|
Balance at January 1, |
|
$ |
4,245 |
|
|
$ |
1,734 |
|
|
$ |
2,413 |
|
|
Additions |
|
|
1,390 |
|
|
|
2,285 |
|
|
|
(274 |
) |
|
Deductions (write-offs, net of recoveries) |
|
|
287 |
|
|
|
226 |
|
|
|
(405 |
) |
|
Balance at December 31, |
|
$ |
5,922 |
|
|
$ |
4,245 |
|
|
$ |
1,734 |
|
Inventories
Inventories consist principally of materials purchased for resale, including lumber, sheet goods, windows, doors and millwork, as well as certain manufactured products and are stated at the lower of cost or market. Cost is determined using the weighted average method, the use of which approximates the first-in, first-out method. We accrue for shrink based on the actual historical shrink results of our most recent physical inventories adjusted, if necessary, for current economic conditions. These estimates are compared with actual results as physical inventory counts are taken and reconciled to the general ledger.
During the year, we monitor our inventory levels by market and record provisions for excess inventories based on slower moving inventory. We define potential excess inventory as the amount of inventory on hand in excess of the historical usage, excluding special order items purchased in the last six months. We then apply our judgment as to forecasted demand and other factors, including liquidation value, to determine the required adjustments to net realizable value. Our inventories are generally not susceptible to technological obsolescence.
Our arrangements with vendors provide for rebates of a specified amount of consideration, payable when certain measures, generally related to a stipulated level of purchases, have been achieved. We account for estimated rebates as a reduction of the prices of the vendor’s inventory until the product is sold, at which time such rebates reduce cost of sales in the accompanying consolidated statements of operations and comprehensive loss. Throughout the year we estimate the amount of the rebates based upon the expected level of purchases. We continually revise these estimates based on actual purchase levels.
We source products from a large number of suppliers. No materials purchased from any single supplier represented more than 7% of our total materials purchased in 2016.
47
Handling costs incurred in manufacturing activities are included in cost of sales. All other shipping and handling costs are included in selling, general and administrative expenses in the accompanying consolidated statements of operations and comprehensive income (loss) and totaled $269.8 million, $171.9 million and $79.7 million in 2016, 2015 and 2014, respectively.
Income Taxes
We account for income taxes utilizing the liability method described in the Income Taxes topic of the FASB Accounting Standards Codification (“Codification”). Deferred income taxes are recorded to reflect consequences on future years of differences between the tax basis of assets and liabilities and their financial reporting amounts at each year-end based on enacted tax laws and statutory tax rates applicable to the periods in which differences are expected to affect taxable earnings. We record a valuation allowance to reduce deferred tax assets if it is more likely than not that some portion or all of the deferred tax assets will not be realized.
Warranty Expense
We have warranty obligations with respect to most manufactured products; however, the liability for the warranty obligations is not significant as a result of third-party inspection and acceptance processes.
Debt Issuance Costs and Debt Discount
Loan costs are capitalized upon the issuance of long-term debt and amortized over the life of the related debt. Debt issuance costs associated with term debt are presented as a reduction to long-term debt. Debt issuance costs associated with revolving debt arrangements are presented as a component of other assets. Debt issuance costs incurred in connection with revolving debt arrangements are amortized using the straight-line method. Debt issuance costs incurred in connection with term debt are amortized using the effective interest method. Debt discount is amortized over the life of the related debt using the effective interest method. Amortization of debt issuance costs and the debt discount are included in interest expense. Upon changes to our debt structure, we evaluate debt issuance costs in accordance with the Debt topic of the Codification. We adjust debt issuance costs as necessary based on the results of this evaluation, as discussed in Note 8.
Property, Plant and Equipment
Property, plant and equipment are recorded at cost and depreciated using the straight-line method over the estimated useful lives of the assets. The estimated lives of the various classes of assets are as follows:
|
|
|
Buildings and improvements |
|
20 to 40 years |
|
|
|
Machinery and equipment |
|
3 to 10 years |
|
|
|
Furniture and fixtures |
|
3 to 5 years |
|
|
|
Leasehold improvements |
|
The shorter of the estimated useful life or the remaining lease term |
Major additions and improvements are capitalized, while maintenance and repairs that do not extend the useful life of the property are charged to expense as incurred. Gains or losses from dispositions of property, plant and equipment are recorded in the period incurred. We also capitalize certain costs of computer software developed or obtained for internal use, including interest, provided that those costs are not research and development, and certain other criteria are met. Internal use computer software costs are included in machinery and equipment and generally depreciated using the straight-line method over the estimated useful lives of the assets, generally three years.
We periodically evaluate the commercial and strategic operation of the land, related buildings and improvements of our facilities. In connection with these evaluations, some facilities may be consolidated, and others may be sold or leased. Nonoperating assets primarily related to land and building real estate assets associated with location closures that are actively being marketed for sale within a year are classified as assets held for sale and recorded at fair value, usually the quoted market price obtained from an independent third-party less the cost to sell. Until the assets are sold, an estimate of the fair value is reassessed at each reporting period. Net gains or losses related to the sale of real estate and equipment or impairment adjustments related to assets held for sale are recorded as selling, general and administrative expenses.
48
We evaluate our long-lived assets, other than goodwill, for impairment when events or changes in circumstances indicate, in our judgment, that the carrying value of such assets may not be recoverable. The determination of whether or not impairment exists is based on our estimate of undiscounted future cash flows before interest attributable to the assets as compared to the net carrying value of the assets. If impairment is indicated, the amount of the impairment recognized is determined by estimating the fair value of the assets based on estimated discounted future cash flows and recording a provision for loss if the carrying value is greater than estimated fair value. The net carrying value of assets identified to be disposed of in the future is compared to their estimated fair value, usually the quoted market price obtained from an independent third-party less the cost to sell, to determine if impairment exists. Until the assets are disposed of, an estimate of the fair value is reassessed when related events or circumstances change. Asset impairment charges are presented in the consolidated statements of operations and comprehensive income (loss) for the respective years.
Insurance
We have established insurance programs to cover certain insurable risks consisting primarily of physical loss to property, business interruptions resulting from such loss, workers’ compensation, employee healthcare, and comprehensive general and auto liability. Third party insurance coverage is obtained for exposures above predetermined deductibles as well as for those risks required to be insured by law or contract. Provisions for losses are developed from valuations that rely upon our past claims experience, which considers both the frequency and settlement of claims. We discount our workers’ compensation liability based upon estimated future payment streams at our risk-free rate. Our total insurance reserve balances were $80.4 million and $84.3 million as of December 31, 2016 and 2015, respectively. Of these balances $43.6 million and $40.3 million were recorded as other long-term liabilities as of December 31, 2016 and 2015, respectively. Included in these reserve balances as of December 31, 2016 and 2015, were approximately $9.4 million and $9.9 million, respectively, of claims that exceeded stop-loss limits and are expected to be recovered under insurance policies which are also recorded as other receivables and other assets in the accompanying consolidated balance sheets.
Net Income (Loss) per Common Share
Net income (loss) per common share, or earnings per share (“EPS”), is calculated in accordance with the Earnings per Share topic of the Codification which requires the presentation of basic and diluted EPS. Basic EPS is computed using the weighted average number of common shares outstanding during the period. Diluted EPS is computed using the weighted average number of common shares outstanding during the period, plus the dilutive effect of potential common shares.
The table below presents a reconciliation of weighted average common shares used in the calculation of basic and diluted EPS for the years ended December 31:
|
|
|
2016 |
|
|
2015 |
|
|
2014 |
|
|||
|
|
|
(In thousands) |
|
|||||||||
|
Weighted average shares for basic EPS |
|
|
110,754 |
|
|
|
103,190 |
|
|
|
98,050 |
|
|
Dilutive effect of options, warrants, and RSUs |
|
|
2,831 |
|
|
|
— |
|
|
|
2,472 |
|
|
Weighted average shares for diluted EPS |
|
|
113,585 |
|
|
|
103,190 |
|
|
|
100,522 |
|
Our restricted stock shares include rights to receive dividends that are not subject to the risk of forfeiture even if the underlying restricted stock shares on which the dividends were paid do not vest. In accordance with the Earnings Per Share topic of the Codification, unvested share-based payment awards that contain non-forfeitable rights to dividends are deemed participating securities and should be considered in the calculation of basic EPS. Since the restricted stock shares do not include an obligation to share in losses, they will be included in our basic EPS calculation in periods of net income and excluded from our basic EPS calculation in periods of net loss. Accordingly, there were 13,000 restricted stock shares excluded from the computation of basic EPS in 2015 because we generated a net loss. There were 27,000 restricted stock shares included in our basic EPS calculation for 2014 as we generated net income. There were no outstanding restricted stock shares as of December 31, 2016.
For the purpose of computing diluted EPS, weighted average shares outstanding have been adjusted for common shares underlying 3,515,000 options to purchase common stock and 2,177,000 restricted stock units (“RSUs”) for 2016. Options to purchase 4,998,000 shares of common stock and 1,516,000 RSUs were not included in the computation of diluted EPS for 2015 because their effect was anti-dilutive. Incremental shares attributable to average warrants outstanding during 2015 were not included in the computation of diluted EPS for 2015 as their effect was anti-dilutive. There were no warrants outstanding at December 31, 2016 as all of the remaining warrants were exercised in April 2015. Weighted average shares outstanding have been adjusted for common shares underlying 6,246,000 options, 700,000 warrants, and 1,855,000 RSUs for 2014. In addition, $0.5 million of income due to fair value adjustments related to the warrants was excluded from net income in the computation of diluted EPS for 2014.
49
Goodwill and Other Intangible Assets
Intangibles subject to amortization
We recognize an acquired intangible asset apart from goodwill whenever the intangible asset arises from contractual or other legal rights, or whenever it can be separated or divided from the acquired entity and sold, transferred, licensed, rented, or exchanged, either individually or in combination with a related contract, asset or liability. Impairment losses are recognized if the carrying value of an intangible asset subject to amortization is not recoverable from expected future cash flows and its carrying amount exceeds its estimated fair value.
Goodwill
We recognize goodwill as the excess cost of an acquired entity over the net amount assigned to assets acquired and liabilities assumed. Goodwill is tested for impairment on an annual basis and between annual tests whenever impairment is indicated. This annual test takes place as of December 31 each year. Impairment losses are recognized whenever the implied fair value of goodwill is less than its carrying value.
Stock-based Compensation
We have four stock-based employee compensation plans, which are described more fully in Note 10. We issue new common stock shares upon exercises of stock options, grants of restricted stock, and vesting of RSUs.
The fair value of each option award is estimated on the date of grant using the Black-Scholes option-pricing model with the following weighted average assumptions for the year ended December 31:
|
|
|
2016 |
|
|
2015 |
|
|
2014 |
|
Expected life |
|
6.0 years |
|
|
6.0 years |
|
|
5.8 years |
|
Expected volatility |
|
60.88% |
|
|
75.2% |
|
|
92.1% |
|
Expected dividend yield |
|
0.00% |
|
|
0.00% |
|
|
0.00% |
|
Risk-free rate |
|
1.41% |
|
|
1.75% |
|
|
1.83% |
The expected life represents the period of time the options are expected to be outstanding. We used the simplified method for determining the expected life assumption due to limited historical exercise experience on our stock options. The expected volatility is based on the historical volatility of our common stock over the most recent period equal to the expected life of the option. The expected dividend yield is based on our history of not paying regular dividends in the past and our current intention to not pay regular dividends in the foreseeable future. The risk-free rate is based on the U.S. Treasury yield curve in effect at the time of grant and has a term equal to the expected life of the options.
The fair value of RSU awards subject to market conditions is estimated on the date of grant using the Monte Carlo simulation model with the following weighted average assumptions for the year ended December 31:
|
|
|
2016 |
|
Expected volatility (company) |
|
53.6% |
|
Expected volatility (peer group median) |
|
17.3% |
|
Correlation between the company and peer group median |
|
0.47 |
|
Expected dividend yield |
|
0.00% |
|
Risk-free rate |
|
1.29% |
The expected volatilities are based on the historical volatilities of our common stock and the common stocks of the constituents of the Company’s peer group over the most recent period equal to the measurement period. The expected dividend yield is based on our history of not paying regular dividends in the past and our current intention to not pay regular dividends in the foreseeable future. The risk-free rate is based on the U.S. Treasury yield curve in effect at the time of grant and has a term equal to the measurement period. We did not grant any RSUs subject to market conditions in 2015 or 2014.
50
The Fair Value Measurements and Disclosures topic of the Codification provides a framework for measuring the fair value of assets and liabilities and establishes a fair value hierarchy that requires an entity to maximize the use of observable inputs and minimize the use of unobservable inputs when measuring fair value. The fair value hierarchy can be summarized as follows:
Level 1 — unadjusted quoted prices for identical assets or liabilities in active markets accessible by us
Level 2 — inputs that are observable in the marketplace other than those inputs classified as Level 1
Level 3 — inputs that are unobservable in the marketplace and significant to the valuation
If a financial instrument uses inputs that fall in different levels of the hierarchy, the instrument will be categorized based upon the lowest level of input that is significant to the fair value calculation. The only financial instruments measured at fair value on a recurring basis were our warrants as discussed in Note 8.
As of December 31, 2016 and 2015 the Company does not have any financial instruments which are measured at fair value on a recurring basis. We have elected to report the value of our 10.75% senior unsecured notes due 2023 (“2023 notes”), 5.625% senior secured notes due 2024 (“2024 notes”), and $600.0 million term loan facility due 2022 (“2015 term loan”) at amortized cost. The fair values of the 2023 notes, the 2024 notes and the 2015 term loan at December 31, 2016 were approximately $421.8 million, $758.0 million and $471.2 million, respectively, and were determined using Level 2 inputs based on market prices.
Supplemental Cash Flow Information
Supplemental cash flow information was as follows for the years ended December 31:
|
|
|
2016 |
|
|
2015 |
|
|
2014 |
|
|||
|
|
|
(In thousands) |
|
|||||||||
|
Cash payments for interest |
|
$ |
197,384 |
|
|
$ |
55,028 |
|
|
$ |
28,338 |
|
|
Cash payments for income taxes |
|
|
2,875 |
|
|
|
1,409 |
|
|
|
456 |
|
Comprehensive Income (Loss)
Comprehensive income (loss) is defined as the change in equity (net assets) of a business enterprise during a period from transactions and other events and circumstances from non-owner sources. It consists of net income (loss) and other gains and losses affecting stockholders’ equity that, under GAAP, are excluded from net income. We had no items of other comprehensive income (loss) for the years ended December 31, 2016, 2015, and 2014.
Recently Issued Accounting Pronouncements
In January 2017, the Financial Accounting Standards Board (“FASB”) issued an update to the existing guidance under the Intangibles-Goodwill and Other topic of the Accounting Standards Codification (“Codification”) to simplify the accounting for goodwill impairment. The guidance removes Step 2 of the goodwill impairment test, which requires a hypothetical purchase price allocation. A goodwill impairment will now be the amount by which a reporting unit’s carrying value exceeds its fair value, not to exceed the carrying amount of goodwill. All of the other goodwill impairment guidance will remain largely unchanged, including the option to perform a qualitative assessment to determine if a quantitative impairment test is necessary. This update is effective for annual and any interim goodwill impairment tests in fiscal years beginning after December 15, 2019. Early adoption of this guidance is permitted for annual or interim goodwill tests performed after January 1, 2017. This guidance will be applied on a prospective basis following adoption.
In January 2017, the FASB issued an update to the existing guidance under the Business Combinations topic of the Codification. This update revises the definition of a business. Under this guidance when substantially all of the assets acquired is concentrated in a single asset (or group of similar assets) the assets acquired would not be considered a business. If this initial screen is met the need for further assessment is eliminated. If this screen is not met in order to be considered a business an acquisition would have to include an input and a substantive process that together significantly contribute to the ability to create outputs. This update is effective for public companies for annual and interim reporting periods beginning after December 15, 2017. Early adoption of this guidance is permitted. This guidance requires prospective application following adoption.
51
In August 2016, the FASB issued an update to the existing guidance under the Statement of Cash Flows topic of the Codification. This update clarifies the classification of certain transactions in the statement of cash flows. This update requires application using a retrospective transition method. This update is effective for public companies for annual and interim reporting periods beginning after December 15, 2017. Early adoption is permitted, provided that all of the amendments in this update are adopted in the same period. As a result of the Company’s election to early adopt this updated guidance in the fourth quarter of 2016, $42.9 million in payments of debt extinguishment costs made in 2016 which were previously reflected as operating cash outflows on our 2016 quarterly reports on Form 10-Q are now presented as financing cash outflows. Adoption of this guidance resulted in $1.1 million from the second quarter of 2016, $33.3 million from the third quarter of 2016 and $8.5 million from the fourth quarter of 2016 in payments of debt extinguishment costs being presented as cash outflows from financing activities for the year ended December 31, 2016. The adoption of this guidance had no impact to our statement of cash flows for the years ended December 31, 2015 or 2014
In March 2016, the FASB issued an update to the existing guidance under the Compensation-Stock Compensation topic of the Codification. This update simplifies several aspects of accounting for stock compensation including accounting for income taxes, classification of awards as liabilities or equity, forfeitures and classification on the statement of cash flows. This update is effective for public companies for annual and interim reporting periods beginning after December 15, 2016. Early adoption is permitted with adjustments reflected as of the beginning of the fiscal year of adoption. The various aspects of this guidance require prospective, retrospective, or modified retrospective application. This guidance will be effective for the Company in the first quarter of 2017. As of December 31, 2016 the Company had approximately $23.3 million of unrecognized gross windfall benefits. Upon adoption the Company will recognize any previously unrecorded windfall benefits on a modified retrospective basis through a cumulative-effect adjustment to the beginning balance of our accumulated deficit. Following adoption any windfalls or shortfalls will be recognized as a component of income tax expense in the period they occur. Additionally, the Company will elect to recognize the effect of pre-vesting forfeitures as they actually occur rather than estimating forfeitures each period. Any differential between the amount of compensation cost previously recorded and the amount that would have been recorded without assuming forfeitures will be recognized on a modified retrospective basis through a cumulative-effect adjustment to the beginning balance of our accumulated deficit.
In February 2016, the FASB issued an update to the existing guidance under Leases topic of the Codification. Under the new guidance, lessees will be required to recognize the following for all leases, with the exception of short-term leases, at the commencement date: (1) a lease liability, which is a lessee‘s obligation to make lease payments arising from a lease, measured on a discounted basis; and (2) a right-of-use asset, which is an asset that represents the lessee’s right to use, or control the use of, a specified asset for the lease term. This update requires a modified retrospective transition as of the beginning of the earliest comparative period presented in the financial statements. This update is effective for public companies for fiscal years beginning after December 15, 2018, including interim periods within those fiscal years, with early adoption permitted. We are currently evaluating the impact of this guidance on our financial statements.
In July 2015, the FASB issued an update to the existing guidance under the Inventory topic of the Codification. This update changes the subsequent measurement of inventory from lower of cost or market to lower of cost and net realizable value. This guidance is effective for interim and annual reporting periods beginning after December 15, 2016. Early adoption of this guidance is permitted as of the beginning of an interim or annual reporting period. This guidance requires prospective application. We do not expect the adoption of this guidance to have an impact on our financial statements.
In August 2014, the FASB issued an update to the existing guidance under the Presentation of Financial Statements topic of the Codification. This update requires management to perform interim and annual assessments on whether there are conditions or events that raise substantial doubt about the entity’s ability to continue as a going concern within one year of the date the financial statements are issued and to provide related disclosures, if required. This new guidance is effective for the annual period ending after December 15, 2016, and for annual and interim periods thereafter. As such, the Company adopted this guidance for the annual reporting period ending December 31, 2016. The adoption of this guidance did not have an impact on our financial statements.
In May 2014, the FASB issued an update to the existing guidance under the Revenue Recognition topic of the Codification which is a comprehensive new revenue recognition model requiring a company to recognize revenue to depict the transfer of promised goods or services to customers in an amount that reflects the consideration to which the entity expects to be entitled in exchange for those goods or services. This new guidance was originally effective for annual reporting periods beginning after December 15, 2016. However, in July 2015 the FASB approved an optional one year deferral of the effective date to annual reporting periods beginning after December 15, 2017. Early adoption is permitted; however, this guidance cannot be adopted earlier than the original effective date. The Company does not intend to adopt this guidance early, therefore it will be effective for us beginning on January 1, 2018. This guidance allows either full retrospective or modified retrospective methods of adoption. Subsequent to issuance of the original update the FASB issued several updates amending this new guidance. In April 2016, the FASB issued an update clarifying issues related to identifying performance obligations and licensing. In May 2016, the FASB issued an update regarding the assessment of collectability criteria, presentation of sales taxes, measurement of noncash consideration and transition guidance for completed contracts and contract modifications. While we are still evaluating the impact of these updates on our financial statements, we anticipate this guidance will primarily impact our contracts with service elements and certain classifications within the statement of operations.
52
3. Acquisitions
On June 30, 2014 the Company acquired certain assets and the operations of Slone Lumber Company, Inc. (“Slone”) for $8.7 million in cash (including certain adjustments). Based in Houston, Texas, Slone is a full-line building materials supplier. Slone’s product offerings include lumber, engineered beams, interior and exterior door units, moulding, trim, and cabinets. Slone also offers installation services on exterior doors, shutters, and cabinets.
On July 31, 2014 the Company acquired certain assets and the operations of West Orange Lumber Company, Inc. (“West Orange”) for $9.8 million in cash (including certain adjustments). Based in Groveland, Florida, West Orange supplies lumber, roof and floor trusses, custom windows and doors, as well as installation services, to both residential homebuilders and commercial contractors in central Florida.
On August 6, 2014 the Company acquired certain assets and the operations of Truss Rite, LLC (“Truss Rite”) for $14.6 million in cash (including certain adjustments). Based in Sherman, Texas Truss Rite primarily manufactures wood roof and floor trusses for large multi-family and commercial projects throughout Texas and parts of Oklahoma. Truss Rite predominately serves developers and general contractors in the multi-family residential housing sector.
On October 1, 2014 the Company acquired certain assets and the operations of Trim Tech of Austin, Inc. (“Trim Tech”) for $19.4 million in cash (including certain adjustments). Trim Tech is based in Hutto, Texas, which is approximately 30 miles north of downtown Austin. Trim Tech is a turn-key supplier of custom cabinets, interior and exterior doors, stair parts, and custom millwork and molding.
On December 22, 2014 the Company acquired certain assets and the operations of Empire Truss, Ltd. (“Empire”) for $16.8 million in cash (including certain adjustments). Empire is a Texas-based manufacturer of custom designed roof trusses and floor trusses, and a distributor of engineered wood products with its primary operations located in Huntsville, Texas, approximately 65 miles north of downtown Houston. Empire’s primary focus is on multi-family and light commercial customers.
On February 9, 2015, the Company acquired certain assets and the operations of Timber Tech Texas, Inc. and its affiliates (“Timber Tech”) for $5.8 million in cash (including certain adjustments). Timber Tech is based in Cibolo, Texas, which is approximately 25 miles northeast of downtown San Antonio. Timber Tech is a manufacturer of roof trusses, floor trusses, wall panels and sub-components, as well as a supplier of glue laminated timber and veneer lumber beams.
On July 31, 2015, the Company acquired all of the operating affiliates of ProBuild through the purchase of all issued and outstanding equity interests in ProBuild for $1.63 billion in cash, subject to certain adjustments. The purchase price was funded by the net proceeds received from the financing transactions described in Note 8. Previously headquartered in Denver, Colorado, ProBuild is one of the nation’s largest professional building materials suppliers. As a result of the ProBuild acquisition, the Company has a greater diversification of products and services and a significantly improved geographic footprint.
These acquisitions were accounted for by the acquisition method, and accordingly the results of operations were included in the Company’s consolidated financial statements from the acquisition date. The purchase price was allocated to the assets acquired based on estimated fair values at the acquisition date, with the excess of purchase price over the estimated fair value of the net assets acquired recorded as goodwill. The fair value of acquired intangible assets of $184.5 million, primarily related to tradenames, customer relationships and lease contract intangibles, was estimated by applying an income approach. That measure is based on significant Level 3 inputs not observable in the market. Key assumptions developed based on the Company’s historical experience, future projections and comparable market data include future cash flows, long-term growth rates, royalty rates, attrition rates and discount rates.
We incurred acquisition related costs of $20.9 million and $0.6 million related to these acquisitions during the years ended December 31, 2015 and 2014, respectively. These costs include due diligence costs and transaction costs to complete the acquisitions, and have been recognized in selling, general and administrative expense in the accompanying condensed consolidated statements of operations and comprehensive income (loss). We did not incur any acquisition costs related to these acquisitions during the year ended December 31, 2016.
53
The following table summarizes the aggregate fair values of the assets acquired and liabilities assumed for ProBuild and all other acquisitions, net of cash (in thousands) for the year ended:
|
|
|
2015 |
|
|
2014 |
|
||||
|
|
|
ProBuild |
|
|
All Other |
|
|
All Other |
|
|
|
Accounts receivable |
$ |
470,105 |
|
$ |
306 |
|
$ |
9,544 |
|
|
|
Other receivables |
|
34,718 |
|
|
— |
|
|
— |
|
|
|
Inventory |
|
411,160 |
|
|
1,095 |
|
|
5,417 |
|
|
|
Other current assets |
|
12,101 |
|
|
— |
|
|
— |
|
|
|
Property, plant and equipment |
|
658,540 |
|
|
3,961 |
|
|
8,580 |
|
|
|
Assets held for sale |
|
10,911 |
|
|
— |
|
|
— |
|
|
|
Goodwill (Note 5) |
|
602,690 |
|
|
(2,839 |
) |
|
28,581 |
|
|
|
Intangible assets (Note 6) |
|
184,509 |
|
|
3,311 |
|
|
17,467 |
|
|
|
Other assets |
|
2,016 |
|
|
— |
|
|
34 |
|
|
|
Total assets acquired |
|
2,386,750 |
|
|
5,834 |
|
|
69,623 |
|
|
|
Checks outstanding |
|
(32,378 |
) |
|
— |
|
|
— |
|
|
|
Current maturities of long term debt and lease obligations |
|
(25,456 |
) |
|
— |
|
|
— |
|
|
|
Accounts payable |
|
(339,673 |
) |
|
— |
|
|
— |
|
|
|
Accrued liabilities |
|
(210,436 |
) |
|
(37 |
) |
|
(286 |
) |
|
|
Other long-term liabilities |
|
(53,703 |
) |
|
— |
|
|
— |
|
|
|
Long-term debt and lease obligations, net of current maturities |
|
(262,390 |
) |
|
— |
|
|
— |
|
|
|
Total liabilities assumed |
|
(924,036 |
) |
|
(37 |
) |
|
(286 |
) |
|
|
Total net assets acquired |
$ |
1,462,714 |
|
$ |
5,797 |
|
$ |
69,337 |
|
|
All of the goodwill and intangible assets recognized from the ProBuild and all other acquisitions are expected to be deductible for tax purposes, with the goodwill recognized from these acquisitions being amortized ratably over a 15 year period. The ProBuild acquisition was treated as an asset purchase for tax purposes.
The operating results of the acquisitions have been included in the consolidated statements of operations and comprehensive income (loss) from their acquisition dates through December 31, 2016. Net sales and net income attributable to ProBuild were approximately $4,520 million and $190 million, respectively for the year ended December 31, 2016. Net sales and net income attributable to ProBuild were approximately $1,860 million and $50 million, respectively, for the period of August 1, 2015 through December 31, 2015. Net income attributable to ProBuild does not include an allocation of the additional interest expense incurred by the Company as a result of the ProBuild acquisition financing transactions. Net sales and net income attributable to the other acquisitions are not material, individually or in the aggregate.
The following table reflects the pro forma operating results for the Company which gives effect to the acquisition of ProBuild as if it had occurred on January 1, 2014. The pro forma results are based on assumptions that the Company believes are reasonable under the circumstances. The pro forma results are not necessarily indicative of future results. The pro forma financial information includes the historical results of the Company and ProBuild adjusted for certain items, which are described below, and does not include the effects of any synergies or cost reduction initiatives related to the acquisition of ProBuild. Pro forma information for the other acquisitions is not presented as it is not material, individually or in the aggregate.
|
|
Year Ended December 31, |
|
|
||||||
|
|
2015 |
|
|
2014 |
|
|
|
||
|
|
(pro forma) (in thousands, except per share amounts) |
||||||||
|
Net sales |
$ |
6,066,792 |
|
|
$ |
6,082,819 |
|
||
|
Net loss |
$ |
(10,433 |
) |
|
$ |
(127,880 |
) |
||
|
Basic net loss per share |
$ |
(0.10 |
) |
|
$ |
(1.19 |
) |
||
|
Diluted net loss per share |
$ |
(0.10 |
) |
|
$ |
(1.19 |
) |
||
Pro forma net loss for the years ended December 31, 2015 and 2014 reflects adjustments primarily related to depreciation and amortization, the conversion from last-in, first-out to first-in, first out inventory valuation, and interest expense. Pro forma net loss for 2015 was adjusted to exclude transaction-related expenses of $46.9 million ($34.6 million incurred by the Company and $12.3 million incurred by ProBuild). Pro forma net loss for 2014 was adjusted to include these transaction-related expenses.
54
On May 13, 2016, the Company acquired certain assets and the operations of Alaska Truss Manufacturing, LLC and ATM, LLC (collectively “Alaska Truss”) for cash of $4.0 million and $1.0 million of other consideration, subject to certain adjustments. Of the total consideration, $3.4 million was allocated to tangible assets acquired, primarily property, plant and equipment, $0.8 million was allocated to intangible assets and $0.8 million was allocated to goodwill.
Based in Chugiak, Alaska, Alaska Truss supplies roof trusses to both residential and commercial contractors throughout the greater Anchorage area. Acquisition costs related to Alaska Truss were not material in the year ended December 31, 2016. Pro forma results of operations are not presented as this acquisition is not material.
4. Property, Plant and Equipment
Property, plant and equipment consisted of the following at December 31:
|
|
|
2016 |
|
|
2015 |
|
||
|
|
|
(In thousands) |
|
|||||
|
Land |
|
$ |
195,064 |
|
|
$ |
214,302 |
|
|
Buildings and improvements |
|
|
331,498 |
|
|
|
338,566 |
|
|
Machinery and equipment |
|
|
329,529 |
|
|
|
314,446 |
|
|
Furniture and fixtures |
|
|
56,571 |
|
|
|
47,456 |
|
|
Construction in progress |
|
|
12,771 |
|
|
|
7,828 |
|
|
Property, plant and equipment |
|
|
925,433 |
|
|
|
922,598 |
|
|
Less: accumulated depreciation |
|
|
269,332 |
|
|
|
188,269 |
|
|
Property, plant and equipment, net |
|
$ |
656,101 |
|
|
$ |
734,329 |
|
Depreciation expense was $87.2 million, $46.3 million and $8.5 million, of which $9.5 million, $5.3 million and $2.5 million was included in cost of sales, in 2016, 2015, and 2014, respectively.
Included in property, plant and equipment are certain assets held under capital leases and lease finance obligations. These assets are recorded at the present value of minimum lease payments and include land, buildings and equipment. Amortization charges associated with assets held under capital leases and lease finance obligations are included in depreciation expense. The following balances held under capital lease and lease finance obligations, net of accumulated amortization of $9.2 million and $4.9 million at December 31, 2016 and 2015, respectively, are included on the accompanying combined balance sheet:
|
|
|
2016 |
|
|
2015 |
|
||
|
|
|
(In thousands) |
|
|||||
|
Land |
|
$ |
119,287 |
|
|
$ |
124,987 |
|
|
Buildings and improvements |
|
|
151,862 |
|
|
|
183,390 |
|
|
Machinery and equipment |
|
|
11,012 |
|
|
|
14,168 |
|
|
|
|
$ |
282,161 |
|
|
$ |
322,545 |
|
55
5. Goodwill
The following table sets forth the changes in the carrying amount of goodwill by reportable segment for the years ended December 31, 2016 and 2015 (in thousands):
|
|
|
|
Northeast |
|
|
Southeast |
|
|
South |
|
|
West |
|
|
Total |
|
|
Balance as of January 1, 2015 |
|
|
|
|
|
|
|
|
|
|
|
|
|
|
|
|
|
Goodwill |
|
$ |
13,609 |
|
$ |
49,591 |
|
$ |
121,210 |
|
$ |
— |
|
$ |
184,410 |
|
|
Accumulated impairment losses |
|
|
(494 |
) |
|
(615 |
) |
|
(43,527 |
) |
|
— |
|
|
(44,636 |
) |
|
|
|
|
13,115 |
|
|
48,976 |
|
|
77,683 |
|
|
— |
|
|
139,774 |
|
|
Acquisitions and other purchase price adjustments |
|
|
83,493 |
|
|
11,100 |
|
|
208,452 |
|
|
296,806 |
|
|
599,851 |
|
|
Balance as of December 31, 2015 |
|
|
|
|
|
|
|
|
|
|
|
|
|
|
|
|
|
Goodwill |
|
$ |
97,102 |
|
$ |
60,691 |
|
$ |
329,662 |
|
$ |
296,806 |
|
$ |
784,261 |
|
|
Accumulated impairment losses |
|
|
(494 |
) |
|
(615 |
) |
|
(43,527 |
) |
|
— |
|
|
(44,636 |
) |
|
|
|
|
96,608 |
|
|
60,076 |
|
|
286,135 |
|
|
296,806 |
|
|
739,625 |
|
|
Acquisitions and other purchase price adjustments |
|
|
— |
|
|
— |
|
|
— |
|
|
786 |
|
|
786 |
|
|
Balance as of December 31, 2016 |
|
|
|
|
|
|
|
|
|
|
|
|
|
|
|
|
|
Goodwill |
|
$ |
97,102 |
|
$ |
60,691 |
|
$ |
329,662 |
|
$ |
297,592 |
|
$ |
785,047 |
|
|
Accumulated impairment losses |
|
|
(494 |
) |
|
(615 |
) |
|
(43,527 |
) |
|
— |
|
|
(44,636 |
) |
|
|
|
$ |
96,608 |
|
$ |
60,076 |
|
$ |
286,135 |
|
$ |
297,592 |
|
$ |
740,411 |
|
In 2016, the change in the carrying amount of goodwill is attributable to our acquisition of Alaska Truss. In 2015, the change in the carrying amount of goodwill is attributable to our acquisitions of ProBuild and Timber Tech. The amount allocated to goodwill is attributable to the assembled workforce of the acquired companies as well as the diversification of products and services, the significantly improved geographic footprint, and the synergies expected to arise as a result of these acquisitions.
We closely monitor trends in economic factors and their effects on operating results to determine if an impairment trigger was present that would warrant a reassessment of the recoverability of the carrying amount of goodwill prior to the required annual impairment test in accordance with the Intangibles – Goodwill and Other topic of the Codification.
The process of evaluating goodwill for impairment involves the determination of fair value of our reporting units. Inherent in such fair value determinations are certain judgments and estimates relating to future cash flows, including our interpretation of current economic indicators and market valuations and assumptions about our strategic plans with regard to our operations. Due to the uncertainties associated with such estimates, actual results could differ from such estimates resulting in further impairment of goodwill.
In performing our impairment analysis, we developed a range of fair values for our reporting units using a discounted cash flow methodology. The discounted cash flow methodology establishes fair value by estimating the present value of the projected future cash flows to be generated from the reporting unit. The discount rate applied to the projected future cash flows to arrive at the present value is intended to reflect all risks of ownership and the associated risks of realizing the stream of projected future cash flows. The discounted cash flow methodology uses our projections of financial performance for a five-year period. The most significant assumptions used in the discounted cash flow methodology are the discount rate, the terminal value and the expected future revenues, gross margins and operating expenses, which vary among reporting units. Significant assumptions used in our financial projections include housing starts, lumber commodity prices, and market share gains.
We recorded no goodwill impairment charges in 2016, 2015, and 2014.
56
The following table presents intangible assets as of December 31:
|
|
|
2016 |
|
|
2015 |
|
||||||||||
|
|
|
Gross Carrying Amount |
|
|
Accumulated Amortization |
|
|
Gross Carrying Amount |
|
|
Accumulated Amortization |
|
||||
|
|
|
(In thousands) |
|
|||||||||||||
|
Customer relationships |
|
$ |
149,046 |
|
|
$ |
(33,023 |
) |
|
$ |
148,910 |
|
|
$ |
(12,968 |
) |
|
Non-compete agreements |
|
|
1,379 |
|
|
|
(375 |
) |
|
|
766 |
|
|
|
(170 |
) |
|
Trade names |
|
|
51,361 |
|
|
|
(13,286 |
) |
|
|
51,361 |
|
|
|
(4,155 |
) |
|
Favorable lease intangibles |
|
|
6,408 |
|
|
|
(2,137 |
) |
|
|
6,408 |
|
|
|
(548 |
) |
|
Total intangible assets |
|
$ |
208,194 |
|
|
$ |
(48,821 |
) |
|
$ |
207,445 |
|
|
$ |
(17,841 |
) |
|
Unfavorable lease obligations (included in Accrued liabilities and Other long-term liabilities) |
|
$ |
(19,597 |
) |
|
$ |
8,746 |
|
|
$ |
(19,547 |
) |
|
$ |
2,072 |
|
In connection with the acquisition of ProBuild, we recorded intangible assets of $184.5 million, which includes $50.1 million of trade names, $128.0 million of customer relationships and $6.4 million of favorable lease intangibles. We also recorded $19.5 million of unfavorable lease obligations. The weighted average useful lives of the acquired assets are 9.7 years for trade names, 13.5 years for customer relationships, and 10.0 years for both the favorable and unfavorable lease intangibles.
During the years ended December 31, 2016, 2015, and 2014, we recorded amortization expense in relation to the above-listed intangible assets of $22.6 million, $11.9 million, and $1.1 million, respectively. In addition, as a result of the facility closure activities following the ProBuild acquisition, we recorded impairment charges of $1.7 million and $1.4 million against our intangible assets during the years ended December 31, 2016 and 2015, respectively. We recognized these impairment charges in selling, general, and administrative expense in the accompanying consolidated statement of operations and comprehensive income (loss). The following table presents the estimated amortization expense for these intangible assets for the years ending December 31 (in thousands):
|
2017 |
|
$ |
21,869 |
|
|
2018 |
|
|
18,651 |
|
|
2019 |
|
|
17,748 |
|
|
2020 |
|
|
14,817 |
|
|
2021 |
|
|
11,935 |
|
|
Thereafter |
|
|
63,502 |
|
|
Total future net intangible amortization expense |
|
$ |
148,522 |
|
7. Accrued Liabilities
Accrued liabilities consisted of the following at December 31:
|
|
|
2016 |
|
|
2015 |
|
||
|
|
|
(In thousands) |
|
|||||
|
Accrued payroll and other employee related expenses |
|
$ |
127,485 |
|
|
$ |
120,138 |
|
|
Accrued business taxes |
|
|
30,177 |
|
|
|
29,054 |
|
|
Self-insurance reserves |
|
|
36,817 |
|
|
|
44,085 |
|
|
Accrued interest |
|
|
28,570 |
|
|
|
33,712 |
|
|
Facility closure reserves |
|
|
3,910 |
|
|
|
5,228 |
|
|
Customer obligations |
|
|
38,448 |
|
|
|
38,173 |
|
|
Unfavorable lease obligations (Note 6) |
|
|
4,921 |
|
|
|
5,096 |
|
|
Other |
|
|
22,787 |
|
|
|
18,419 |
|
|
Total accrued liabilities |
|
$ |
293,115 |
|
|
$ |
293,905 |
|
57
Long-term debt and lease obligations consisted of the following (in thousands):
|
|
December 31, 2016 |
|
|
December 31, 2015 |
|
||
|
2021 notes |
$ |
— |
|
|
$ |
350,000 |
|
|
2023 notes |
|
367,608 |
|
|
|
700,000 |
|
|
2024 notes |
|
750,000 |
|
|
|
— |
|
|
2015 facility |
|
— |
|
|
|
60,000 |
|
|
2015 term loan |
|
467,650 |
|
|
|
598,625 |
|
|
Lease finance obligations |
|
238,539 |
|
|
|
280,909 |
|
|
Capital lease obligations (Note 9) |
|
7,427 |
|
|
|
8,159 |
|
|
|
|
1,831,224 |
|
|
|
1,997,693 |
|
|
Unamortized debt discount and debt issuance costs |
|
(29,172 |
) |
|
|
(46,022 |
) |
|
|
|
1,802,052 |
|
|
|
1,951,671 |
|
|
Less: current maturities of long-term debt and lease obligations |
|
16,217 |
|
|
|
29,153 |
|
|
Long-term debt and lease obligations, net of current maturities |
$ |
1,785,835 |
|
|
$ |
1,922,518 |
|
ProBuild Acquisition Financing
As described in Note 3, we acquired all of the operating affiliates of ProBuild on July 31, 2015 through the purchase of all issued and outstanding equity interests of ProBuild for $1.63 billion in cash, subject to certain adjustments. The purchase price was funded with the net cash proceeds from (i) the sale of $700.0 million in aggregate principal amount of 10.75% senior unsecured notes due 2023 (the “2023 notes”), (ii) entry into a $600.0 million term loan credit agreement (the “2015 term loan”) provided by a syndicate of financial institutions led by Deutsche Bank AG, New York Branch, as administrative and collateral agent, (iii) a $295.0 million draw on an amended and restated $800.0 million senior secured revolving credit facility (the “2015 facility”) provided by a syndicate of financial institutions led by SunTrust Bank as administrative and collateral agent, and (iv) a public offering of 9.2 million new shares of our common stock at an offering price of $12.80 per share (the “equity offering”).
In connection with the financing transactions described above, we incurred approximately $65.0 million of various third-party fees and expenses. Of these costs, $18.1 million were allocated to the 2023 notes, $16.0 million were allocated to the 2015 term loan, $11.2 million were allocated to the 2015 facility and $6.5 million were allocated to the equity offering. The costs allocated to the 2023 notes and the 2015 term loan were recorded as reductions to long-term debt and are being amortized over their respective terms using the effective interest method. The costs allocated to the 2015 facility were recorded as other assets and are being amortized over its term on a straight-line basis. The costs allocated to the equity offering were recorded as a reduction to additional paid-in capital. In addition, $13.2 million in costs relate to commitment fees paid for bridge and backstop financing facilities entered into in connection with these financing transactions, neither of which was utilized. As such, these fees were recorded as interest expense in the third quarter of 2015. At the closing of these transactions, there were approximately $3.0 million in unamortized debt issuance costs associated with our previous revolving credit facility, of which approximately $0.9 million were recorded as interest expense in the third quarter of 2015. The remaining $2.1 million in unamortized costs associated with our previous revolving credit facility are being amortized over the term of the 2015 facility.
2016 Debt Transactions
During the year ended December 31, 2016, the Company executed several debt transactions which are described in more detail below. These transactions include two debt exchanges, complete extinguishment of our 7.625% senior secured notes due 2021 (the “2021 notes”), repricing and partially repaying our 2015 term loan and a cash tender offer in which we further reduced the aggregate principal amount of outstanding 2023 notes. These transactions have extended our debt maturity profile and reduced our annual cash interest on a go forward basis.
Note Exchange Transactions
On February 12, 2016, we completed separate privately negotiated note exchange transactions in which $218.6 million in aggregate principal amount of our 2023 notes was exchanged for $207.6 million in aggregate principal amount of our previously outstanding 2021 notes. On February 29, 2016, we completed additional separate privately negotiated note exchange transactions in which $63.8 million in aggregate principal amount of our 2023 notes was exchanged for $60.0 million in aggregate principal amount of our previously outstanding 2021 notes.
58
The note exchange transactions were considered to be debt extinguishments. As such, we recognized a net gain of $7.8 million which was recorded as an offset to interest expense in the accompanying consolidated statements of operations and comprehensive income (loss) for the year ended December 31, 2016. Of this $7.8 million gain, $14.8 million was attributable to the reduction in outstanding principal which was partially offset by the write-off of $7.0 million of unamortized debt issuance costs associated with the 2023 notes which were extinguished in the exchange transactions.
In connection with issuance of the 2021 notes in the exchange transactions, we incurred $4.9 million of various third-party fees and expenses. These costs were previously recorded as a reduction to long-term debt and were subsequently written off to interest expense in the third quarter of 2016 in connection with the extinguishment of the 2021 notes as described in the “2016 Refinancing Transactions” section below.
Note Redemption Transaction
In May 2016, the Company exercised its contractual right to redeem $35.0 million in aggregate principal amount of 2021 notes at a price of 103.0%, plus accrued and unpaid interest. The redemption transaction was considered to be a debt extinguishment. As such, we recognized a loss of $1.7 million which was recorded as a component of interest expense in the accompanying consolidated statements of operations and comprehensive income (loss) for the year ended December 31, 2016. Of this $1.7 million loss, $1.1 million was attributable to the payment of the redemption premium and $0.6 million was attributable to the write-off of unamortized debt issuance costs associated with the redeemed notes.
2016 Refinancing Transactions
In August 2016, we completed a private offering of $750.0 million in aggregate principal amount of 5.625% senior secured notes due 2024 (“2024 notes”) at an issue price equal to 100% of their face value. At the same time the Company also repriced its 2015 term loan. This repricing lowered the applicable margin to 3.75% in the case of Eurodollar loans and 2.75% in the case of base rate loans. This reduction represents a 1.25% decrease in the applicable margin for both Eurodollar and base rate loans. In connection with the repricing, the mandatory quarterly principal repayments were reduced from $1.375 million to $1.175 million. All other material terms of the 2015 term loan remain unchanged.
The proceeds from the issuance of the 2024 notes were used, together with cash on hand and borrowings on the 2015 facility, to fully redeem the $582.6 million in aggregate outstanding principal amount of 2021 notes, to pay down $125.9 million of the 2015 term loan and to pay related transaction fees and expenses.
The redemption of the 2021 notes was considered to be a debt extinguishment. As such, we recognized a loss of $43.9 million which was recorded as a component of interest expense in the accompanying consolidated statements of operations and comprehensive income (loss) for the year ended December 31, 2016. Of this $43.9 million loss, $33.3 million was attributable to the payment of the redemption premium and $10.6 million was attributable to the write-off of unamortized debt issuance costs associated with the redeemed notes. In addition, in connection with the repricing and pay down of the 2015 term loan we recognized $8.2 million in interest expense in the third quarter of 2016 related to the write-off of unamortized debt discount and debt issuance costs.
In connection with the issuance of the 2024 notes and the 2015 term loan repricing, we incurred approximately $12.0 million of various third-party fees and expenses. Of these costs $10.5 million were allocated to the 2024 notes and have been recorded as a reduction to long-term debt. These costs are being amortized over the contractual life of the 2024 notes using the effective interest method. The remaining $1.5 million in costs incurred were allocated to the 2015 term loan. Of this $1.5 million, $1.2 million was recorded to interest expense in the third quarter of 2016. The remaining $0.3 million of new third-party costs together with $10.9 million in remaining unamortized debt discount and debt issuance costs have been recorded as a reduction of long-term debt and are being be amortized over the remaining contractual life of the 2015 term loan using the effective interest method.
Tender Offer
In October 2016, we purchased $50.0 million in aggregate principal amount of our 2023 notes pursuant to the terms of a cash tender offer at a price of 117.0% of par value plus accrued and unpaid interest. The purchase of the 2023 notes was funded with cash on hand and borrowings under our 2015 facility.
59
The tender offer transaction was considered to be a debt extinguishment. As such, we recognized a loss on extinguishment of $9.7 million which was recorded as a component of interest expense in the accompanying consolidated statements of operations and comprehensive income (loss) for the year ended December 31, 2016. Of this loss, approximately $8.5 million was attributable to the purchase premium paid to the lenders and $1.2 million was attributable to the write-off of unamortized debt issuance costs associated with the redeemed notes. In addition to the loss described above, we incurred approximately $0.1 million in third party costs which were recorded to selling, general, and administrative expense in the fourth quarter of 2016.
Senior Unsecured Notes due 2023
As of December 31, 2016, we have $367.6 million outstanding in aggregate principal amount of the 2023 notes that mature on August 15, 2023. The 2023 notes were sold in a private offering at an issue price equal to 100% of their face value. Interest accrues on the 2023 notes at a rate of 10.75% per annum and is payable semi-annually on March 1 and September 1 of each year, commencing on March 1, 2016.
The terms of the notes are governed by an indenture and a supplemental indenture, each dated as of July 31, 2015, among the Company, the guarantors named therein and Wilmington Trust, National Association, as trustee (the “trustee”). Pursuant to the indenture and supplemental indenture, the company’s significant operating subsidiaries serve as guarantors of the 2023 notes. The 2023 notes are the Company’s senior unsecured obligations and will rank equally with all of its existing and future senior unsecured debt and will be senior to all of its existing and future subordinated debt.
The indenture contains certain restrictive covenants, which among other things, limit the ability of the Company to incur additional debt, issue preferred stock, create liens, pay dividends, make certain investments, sell certain assets, enter into certain types of transactions with affiliates, and effect mergers and consolidations. At any time prior to August 15, 2018, the Company may redeem the 2023 notes in whole or in part at a redemption price equal to 100% of the principal amount of the 2023 notes plus a premium as specified in the indenture. At any time on or after August 15, 2018, the Company may redeem the 2023 notes at the redemption prices set forth in the indenture plus accrued and unpaid interest. In addition, the Company may redeem up to 40% of the aggregate principal amount of the 2023 notes with the net cash proceeds of one or more equity offerings, as described in the indenture, at a price equal to 110.75% of the principal amount thereof, plus accrued and unpaid interest. In the event of a change in control, we may be required to repurchase all or part of the 2023 notes at a price equal to 101% of the principal amount thereof, plus accrued and unpaid interest.
2015 Term Loan Credit Agreement
As of December 31, 2016, we have $467.7 million outstanding under the 2015 term loan, which matures on July 31, 2022. The 2015 term loan, which was issued at 99%, bears interest, at our option, at either a eurodollar rate or a base rate, plus, in each case an applicable margin. The margin will be 3.75% per annum in the case of eurodollar rate loans and 2.75% per annum in the case of base rate loans. The 2015 term loan has mandatory principal repayments of $1.175 million which are payable in March, June, September, and December of each year provided that each such payment is subject to reduction as a result of certain prepayments of the loans in accordance with the loan documentation. The weighted average interest rate of the term loan was 5.6% during the year ended December 31, 2016.
2015 Senior Secured Revolving Credit Facility
The 2015 facility provides for an $800.0 million revolving credit line to be used for working capital and general corporate purposes. The available borrowing capacity, or borrowing base, is derived from a percentage of the Company’s eligible receivables and inventory, as defined by the agreement, subject to certain reserves. As of December 31, 2016, the net borrowing availability under the 2015 facility is $667.2 million after being reduced by outstanding letters of credit of $84.8 million. During the year ended December 31, 2016, we borrowed $907.0 million and repaid $967.0 million at a weighted average interest rate of 2.5%. There were no outstanding borrowings under the 2015 facility as of December 31, 2016. The 2015 facility matures on July 31, 2020.
Borrowings under the 2015 facility bear interest, at our option, at either a eurodollar rate or a base rate, plus, in each case an applicable margin. The applicable margin ranges from 1.25% to 1.75% per annum in the case of eurodollar rate loans and 0.25% to 0.75% per annum in the case of base rate loans. The margin in either case is based on a measure of availability under the 2015 facility. A variable commitment fee, currently 0.375% per annum, is charged on the unused amount of the revolver based on quarterly average loan utilization. Letters of credit under the 2015 facility are assessed at a rate equal to the applicable eurodollar margin, currently 1.5%, as well as a fronting fee at a rate of 0.125% per annum. These fees are payable quarterly in arrears at the end of March, June, September, and December.
60
All obligations under the 2015 term loan and 2015 facility will be guaranteed jointly and severally by the Company and all other subsidiaries that guarantee the 2024 notes. All obligations and the guarantees of those obligations will be secured by substantially all of the assets of the Company and the guarantors subject to certain exceptions and permitted liens, including (i) with respect to the 2015 term loan, a first-priority security interest in such assets that constitute Notes Collateral (as defined below) and a second priority security interest in such assets that constitute ABL Collateral (as defined below), and (ii) with respect to the 2015 facility, a first-priority security interest in such assets that constitute ABL Collateral and a second-priority security interest in such assets that constitute Notes Collateral.
“ABL Collateral” includes substantially all presently owned and after-acquired accounts receivable, inventory, rights of unpaid vendors with respect to inventory, deposit accounts, commodity accounts, securities accounts and lock boxes, investment property, cash and cash equivalents, and general intangibles, books and records, supporting obligations and documents and related letters of credit, commercial tort claims or other claims related to and proceeds of each of the foregoing. “Notes Collateral” includes all collateral which is not ABL collateral.
The 2015 term loan and the 2015 facility contain restrictive covenants which, among other things, limit the Company’s ability to incur additional indebtedness, incur liens, engage in mergers or other fundamental changes, sell certain assets, pay dividends, make acquisitions or investments, prepay certain indebtedness, change the nature of our business, and engage in certain transactions with affiliates. In addition, the 2015 facility also contains a financial covenant requiring the satisfaction of a minimum fixed charge ratio of 1.00 to 1.00 in the event that the Company does not meet a minimum measure of availability, currently the larger of $80.0 million or 10% of the maximum borrowing amount under the 2015 facility.
Senior Secured Notes due 2024
As of December 31, 2016 we have $750.0 million outstanding in aggregate principal amount of the 2024 notes which mature on September 1, 2024. Interest accrues on the 2024 notes at a rate of 5.625% per annum and is payable semi-annually on March 1 and September 1 of each year, commencing on March 1, 2017.
The terms of the 2024 notes are governed by the indenture, dated as of August 22, 2016 (the “Indenture”), among the Company, the guarantors named therein (the “Guarantors”) and Wilmington Trust, National Association, as trustee (the “Trustee”) and notes collateral agent (the “Notes Collateral Agent”). The 2024 notes, subject to certain exceptions, are guaranteed, jointly and severally, on a senior secured basis, by certain of our direct and indirect wholly owned subsidiaries. All obligations under the 2024 notes, and the guarantees of those obligations, are secured by substantially all of the assets of the Company and the Guarantors subject to certain exceptions and permitted liens, including a first-priority security interest in such assets that constitute Notes Collateral (as defined above) and a second-priority security interest in such assets that constitute ABL Collateral (as defined above).
The Notes Collateral Agent became a party to the ABL/Bond Intercreditor Agreement, dated as of May 29, 2013, among SunTrust Bank, as agent under the Company’s 2015 facility, the Wilmington Trust, National Association, the Company and the Guarantors, and the Pari Passu Intercreditor Agreement, dated as of July 31, 2015, among Deutsche Bank AG New York Branch, as term collateral agent under the Company’s 2015 term loan, Wilmington Trust, National Association, the Company and the Guarantors. These documents govern all arrangements in respect of the priority of the security interests in the ABL Collateral and the Notes Collateral among the parties to the Indenture, the 2015 facility and the 2015 term loan. The 2024 notes constitute senior secured obligations of the Company and Guarantors, rank senior in right of payment to all future debt of the Company and Guarantors that is expressly subordinated in right of payment to the 2024 notes, and rank equally in right of payment with all existing and future liabilities of the Company and Guarantors that are not so subordinated, including the 2015 facility.
The Indenture contains restrictive covenants that limit the ability of the Company and its restricted subsidiaries to, among other things, incur additional debt or issue preferred stock; create liens; create restrictions on the Company’s subsidiaries’ ability to make payments to the Company; pay dividends and make other distributions in respect of the Company’s and its subsidiaries’ capital stock; make certain investments or certain other restricted payments; guarantee indebtedness; designate unrestricted subsidiaries; sell certain kinds of assets; enter into certain types of transactions with affiliates; and effect mergers and consolidations.
61
At any time prior to September 1, 2019, the Company may redeem the 2024 notes in whole or in part at a redemption price equal to 100% of the principal amount of the 2024 notes plus the “applicable premium” set forth in the Indenture. At any time on or after September 1, 2019, the Company may redeem the 2024 notes at the redemption prices set forth in the Indenture, plus accrued and unpaid interest, if any, to the redemption date. At any time and from time to time during the 36-month period following August 22, 2016 (“the Closing Date”), the Company may redeem up to 10% of the aggregate principal amount of the 2024 notes during each twelve-month period commencing on the Closing Date at a redemption price of 103% of the aggregate principal amount thereof plus accrued and unpaid interest to the redemption date. In addition, at any time prior to September 1, 2019, the Company may redeem up to 40% of the aggregate principal amount of the 2024 notes with the net cash proceeds of one or more equity offerings, as described in the Indenture, at a price equal to 105.625% of the principal amount thereof, plus accrued and unpaid interest, if any, to the redemption date. If the Company experiences certain change of control events, holders of the 2024 notes may require it to repurchase all or part of their 2024 notes at 101% of the principal amount thereof, plus accrued and unpaid interest, if any, to the repurchase date.
As of December 31, 2016 we were not in violation of any covenants or restrictions imposed by any of our debt agreements.
Future maturities of long-term debt as of December 31, 2016 were as follows (in thousands):
|
Year ending December 31, |
|
|
|
|
|
2017 |
|
$ |
4,700 |
|
|
2018 |
|
|
4,700 |
|
|
2019 |
|
|
4,700 |
|
|
2020 |
|
|
4,700 |
|
|
2021 |
|
|
4,700 |
|
|
Thereafter |
|
|
1,561,758 |
|
|
Total long-term debt (including current maturities) |
|
$ |
1,585,258 |
|
Warrants
Our previous term loan included detachable warrants that allowed for the purchase of up to 1.6 million shares of our common stock at a price of $2.50 per share. In April 2015, the remaining 0.7 million of outstanding, detachable warrants were exercised. The warrants were considered to be derivative financial instruments and were classified as liabilities. As such, they were measured at fair value on a recurring basis. Our share price and, to a lesser extent, the historical volatility of our common stock were the primary factors in the changes to our fair value measurements related to the warrants. All other inputs being equal, an increase or decrease in our share price or volatility resulted in an increase or decrease in the fair value of our warrants and an increase or decrease in interest expense.
Non-cash fair value adjustments related to our derivative financial instrument recorded as interest expense in the consolidated statements of operations and comprehensive income (loss) for the years ended December 31 (in thousands) were as follows:
|
Derivative Not Designated as Hedging Instruments |
|
Location of Gain (Loss) Recognized in Income |
|
Amount of Gain (Loss) |
|
|||||||||
|
|
|
2016 |
|
|
2015 |
|
|
2014 |
|
|||||
|
Warrants |
|
Interest expense, net |
|
|
— |
|
|
|
(4,563) |
|
|
|
456 |
|
We used the income approach to value our warrants by using the Black-Scholes option-pricing model. Using this model, the risk-free interest rate was based on the U.S. Treasury yield curve in effect on the valuation date. The expected life was based on the period of time until the expiration of the warrants. Expected volatility was based on the historical volatility of our common stock over the most recent period equal to the expected life of the warrants. The expected dividend yield was based on our history of not paying regular dividends in the past.
These techniques incorporated Level 1 and Level 2 inputs. Significant inputs to the derivative valuation for the warrants were observable in the active markets and are classified as Level 2 in the hierarchy.
62
As a result of the ProBuild acquisition, the Company is party to 150 individual property lease agreements with a single lessor as of December 31, 2016. These lease agreements have initial terms ranging from nine to fifteen years (expiring from 2016 through 2021) and renewal options in five-year increments providing for up to approximately 30-year remaining total lease terms. A related agreement between the lessor and the Company gives the Company the right to acquire a limited number of the leased facilities at fair market value. As a result of these purchase rights, the Company treats all of the properties that it leases from this lessor as a financing arrangement. The Company is also party to certain additional agreements with the same lessor which commit the Company to perform certain repair and maintenance obligations under the leases in a specified manner and timeframe.
In 2006, we completed construction on a new multi-purpose facility. Based on the evaluation of the construction project in accordance with the Leases topic of the Codification, we were deemed the owner of the facility during the construction period. Effectively, a sale and leaseback of the facility occurred when construction was completed and the lease term began. This transaction did not qualify for sale-leaseback accounting. As a result the Company treats the lease of this facility as a financing arrangement.
As of December 31, 2016, lease finance obligations consist of $238.5 million, with cash payments of $23.8 million for the year ended December 31, 2016. These lease finance obligations are included on the consolidated balance sheet as a component of long-term debt and lease obligations. The related assets are recorded as components of property, plant, and equipment on the consolidated balance sheet.
Future minimum commitments for lease finance obligations as of December 31, 2016 were as follows (in thousands):
|
Year ending December 31, |
|
|
|
|
|
2017 |
|
$ |
19,009 |
|
|
2018 |
|
|
18,974 |
|
|
2019 |
|
|
18,975 |
|
|
2020 |
|
|
18,893 |
|
|
2021 |
|
|
18,230 |
|
|
Thereafter |
|
|
262,481 |
|
|
Total |
|
$ |
356,562 |
|
9. Capital Lease Obligations
The Company leases certain property and equipment under capital leases expiring through 2020. These leases require monthly payments of principal and interest, imputed at various interest rates. Future minimum lease payments as of December 31, 2016 are as follows (in thousands):
|
Years ending December 31, |
|
|
|
|
|
2017 |
|
$ |
3,426 |
|
|
2018 |
|
|
2,045 |
|
|
2019 |
|
|
2,391 |
|
|
2020 |
|
|
89 |
|
|
Thereafter |
|
|
— |
|
|
Total minimum lease payments |
|
|
7,951 |
|
|
Less: amount representing interest |
|
|
(524 |
) |
|
Present value of net minimum payments |
|
|
7,427 |
|
|
Less: current portion |
|
|
(3,130 |
) |
|
Long-term capital lease obligations, net of current portion |
|
$ |
4,297 |
|
63
10. Employee Stock-Based Compensation
2014 Incentive Plan
Under our 2014 Incentive Plan (“2014 Plan”), the Company is authorized to grant awards in the form of incentive stock options, non-qualified stock options, restricted stock shares, restricted stock units, other common stock-based awards and cash-based awards. In May 2016, our shareholders approved an amendment to our 2014 Plan that increased the number of shares of common stock reserved for the grant of awards under the 2014 Plan from 5.0 million shares to 8.5 million shares, subject to adjustment as provided by the 2014 Plan. All 8.5 million shares under the Plan may be made subject to options, stock appreciation rights (“SARs”), or stock-based awards. Stock options and SARs granted under the 2014 Plan may not have a term exceeding 10 years from the date of grant. The 2014 Plan also provides that all awards will become fully vested and/or exercisable upon a change in control (as defined in the 2014 Plan) if those awards (i) are not assumed or equitably substituted by the surviving entity or (ii) have been assumed or equitably substituted by the surviving entity, and the grantee’s employment is terminated under certain circumstances. Other specific terms for awards granted under the 2014 Plan shall be determined by our Compensation Committee (or the board of directors if so determined by the board of directors). Awards granted under the 2014 Plan generally vest ratably over a three to four year period. As of December 31, 2016, 6.0 million shares were available for issuance under the 2014 Plan.
2007 Incentive Plan
Under our 2007 Incentive Plan (“2007 Plan”), the Company is authorized to grant awards in the form of incentive stock options, non-qualified stock options, restricted stock, other common stock-based awards and cash-based awards. In January 2010, our shareholders approved an amendment to our 2007 Plan which increased the number of shares of common stock that may be granted pursuant to awards under the 2007 Plan from 2.5 million shares to 7.0 million shares. The maximum number of common shares reserved for the grant of awards under the 2007 Plan is 7.0 million, subject to adjustment as provided by the 2007 Plan. No more than 7.0 million shares may be made subject to options or SARs granted under the 2007 Plan, and no more than 3.5 million shares may be made subject to stock-based awards other than options or SARs. Stock options and SARs granted under the 2007 Plan may not have a term exceeding 10 years from the date of grant. The 2007 Plan also provides that all awards will become fully vested and/or exercisable upon a change in control (as defined in the 2007 Plan). Other specific terms for awards granted under the 2007 Plan shall be determined by our Compensation Committee (or the board of directors if so determined by the board of directors). Historically, awards granted under the 2007 Plan generally vest ratably over a three to four-year period. As of December 31, 2016, 94,000 shares were available for issuance under the 2007 Plan, 94,000 of which may be made subject to stock-based awards other than options or SARs.
2005 Equity Incentive Plan
Under our 2005 Equity Incentive Plan (“2005 Plan”), we were authorized to grant stock-based awards in the form of incentive stock options, non-qualified stock options, restricted stock and other common stock-based awards. Stock options and SARs granted under the 2005 Plan could not have a term exceeding 10 years from the date of grant. The 2005 Plan also provided that all awards become fully vested and/or exercisable upon a change in control (as defined in the 2005 Plan). Historically, awards granted under the 2005 Plan generally vest ratably over a three-year period. As of June 27, 2015, no further grants will be made under the 2005 Plan.
1998 Stock Incentive Plan
Under the Builders FirstSource, Inc. 1998 Stock Incentive Plan (“1998 Plan”), we were authorized to issue shares of common stock pursuant to awards granted in various forms, including incentive stock options, non-qualified stock options and other stock-based awards. The 1998 Plan also authorized the sale of common stock on terms determined by our board of directors. Stock options granted under the 1998 Plan generally cliff vest after a period of seven to nine years with certain option grants subject to acceleration if certain financial targets were met. The expiration date is generally 10 years subsequent to date of issuance. As of January 1, 2005, no further grants will be made under the 1998 Plan.
64
The following table summarizes our stock option activity:
|
|
|
Options |
|
|
Weighted |
|
|
Weighted |
|
|
Aggregate |
|
||||
|
|
|
(In thousands) |
|
|
|
|
|
|
|
|
(In thousands) |
|
||||
|
Outstanding at December 31, 2015 |
|
|
4,998 |
|
|
$ |
5.19 |
|
|
|
|
|
|
|
|
|
|
Granted |
|
|
63 |
|
|
$ |
6.59 |
|
|
|
|
|
|
|
|
|
|
Exercised |
|
|
(1,496 |
) |
|
$ |
4.43 |
|
|
|
|
|
|
|
|
|
|
Forfeited |
|
|
(50 |
) |
|
$ |
7.49 |
|
|
|
|
|
|
|
|
|
|
Outstanding at December 31, 2016 |
|
|
3,515 |
|
|
$ |
5.51 |
|
|
|
5.4 |
|
|
$ |
19,184 |
|
|
Exercisable at December 31, 2016 |
|
|
2,489 |
|
|
$ |
4.71 |
|
|
|
4.6 |
|
|
$ |
15,592 |
|
The outstanding options at December 31, 2016 include options to purchase 203,000 shares under the 2014 plan, 2,342,000 shares granted under the 2007 Plan, 554,000 shares granted under the 2005 Plan and 416,000 shares granted under the 1998 Plan. As of December 31, 2016, options to purchase 35,000 shares under the 2014 Plan, 1,759,000 shares under the 2007 Plan, 279,000 shares under the 2005 Plan and 416,000 shares under the 1998 Plan were exercisable. The weighted average grant date fair value of options granted during the years ended December 31, 2016, 2015 and 2014 were $3.71, $4.20 and $5.71, respectively. The total intrinsic value of options exercised during the years ended December 31, 2016, 2015, and 2014 were $11.6 million, $12.8 million and $2.0 million, respectively. We realized no excess tax benefits for stock options exercised during the years ended December 31, 2016, 2015 and 2014. Vesting of all of our stock options is contingent solely on continuous employment over the requisite service period.
Outstanding and exercisable stock options at December 31, 2016 were as follows (shares in thousands):
|
|
|
Outstanding |
|
|
Exercisable |
|
||||||||||||||
|
Range of Exercise Prices |
|
Shares |
|
|
Weighted |
|
|
Weighted |
|
|
Shares |
|
|
Weighted |
|
|||||
|
$3.15 |
|
|
416 |
|
|
$ |
3.15 |
|
|
|
6.1 |
|
|
|
416 |
|
|
$ |
3.15 |
|
|
$3.19 - $3.72 |
|
|
1,189 |
|
|
$ |
3.20 |
|
|
|
3.1 |
|
|
|
1,189 |
|
|
$ |
3.20 |
|
|
$6.35 - $6.70 |
|
|
286 |
|
|
$ |
6.50 |
|
|
|
6.3 |
|
|
|
117 |
|
|
$ |
6.60 |
|
|
$7.15- $7.67 |
|
|
1,624 |
|
|
$ |
7.63 |
|
|
|
6.7 |
|
|
|
767 |
|
|
$ |
7.59 |
|
|
$3.15 - $7.67 |
|
|
3,515 |
|
|
$ |
5.51 |
|
|
|
5.4 |
|
|
|
2,489 |
|
|
$ |
4.71 |
|
Restricted Stock Shares
The following table summarizes restricted stock activity for the year ended December 31, 2016 (shares in thousands):
|
|
|
Shares |
|
|
Weighted |
|
||
|
Nonvested at December 31, 2015 |
|
|
13 |
|
|
$ |
3.72 |
|
|
Granted |
|
|
— |
|
|
$ |
— |
|
|
Vested |
|
|
(13 |
) |
|
$ |
3.72 |
|
|
Forfeited |
|
|
— |
|
|
$ |
— |
|
|
Nonvested at December 31, 2016 |
|
|
— |
|
|
$ |
— |
|
Restricted Stock Units
The outstanding restricted stock units (“RSUs”) at December 31, 2016 include 1,864,000 units granted under the 2014 Plan and 313,000 units granted under the 2007 Plan.
65
The following table summarizes activity for RSUs subject solely to service conditions for the year ended December 31, 2016 (shares in thousands):
|
|
|
Shares |
|
|
Weighted |
|
||
|
Nonvested at December 31, 2015 |
|
|
1,516 |
|
|
$ |
7.49 |
|
|
Granted |
|
|
705 |
|
|
$ |
10.68 |
|
|
Vested |
|
|
(505 |
) |
|
$ |
7.69 |
|
|
Forfeited |
|
|
(59 |
) |
|
$ |
8.14 |
|
|
Nonvested at December 31, 2016 |
|
|
1,657 |
|
|
$ |
8.77 |
|
The weighted average grant date fair value of RSUs for which vesting is subject solely to service conditions granted during the years ended December 31, 2016, 2015 and 2014 were $10.68, $7.26, and $7.48, respectively.
The following table summarizes activity for RSUs subject to both performance and service conditions for the year ended December 31, 2016 (shares in thousands):
|
|
|
Shares |
|
|
Weighted |
|
||
|
Nonvested at December 31, 2015 |
|
|
— |
|
|
$ |
— |
|
|
Granted |
|
|
265 |
|
|
$ |
10.96 |
|
|
Vested |
|
|
— |
|
|
$ |
— |
|
|
Forfeited |
|
|
(5 |
) |
|
$ |
11.09 |
|
|
Nonvested at December 31, 2016 |
|
|
260 |
|
|
$ |
10.95 |
|
The weighted average grant date fair value of RSUs for which vesting is subject to both performance and service conditions granted during the year ended December 31, 2016 was $10.96. There were no RSUs granted in 2015 or 2014 which were subject to both performance and service conditions.
The following table summarizes activity for RSUs subject to both market and service conditions for the year ended December 31, 2016 (shares in thousands):
|
|
|
Shares |
|
|
Weighted |
|
||
|
Nonvested at December 31, 2015 |
|
|
— |
|
|
$ |
— |
|
|
Granted |
|
|
265 |
|
|
$ |
7.58 |
|
|
Vested |
|
|
— |
|
|
$ |
— |
|
|
Forfeited |
|
|
(5 |
) |
|
$ |
7.72 |
|
|
Nonvested at December 31, 2016 |
|
|
260 |
|
|
$ |
7.58 |
|
The weighted average grant date fair value of RSUs for which vesting is subject to both market and service conditions granted during the year ended December 31, 2016 was $7.58. There were no RSUs granted in 2015 or 2014 which were subject to both market and service conditions.
Our results of operations include stock compensation expense of $10.5 million ($6.3 million net of taxes), $6.9 million ($6.9 million net of taxes) and $6.2 million ($6.2 million net of taxes) for the years ended December 31, 2016, 2015 and 2014, respectively. The total fair value of options vested during the years ended December 31, 2016, 2015, and 2014 were $2.8 million, $2.7 million and $3.0 million, respectively. The total fair value of restricted stock vested during the years ended December 31, 2016, 2015 and 2014 were $49,600, $49,600 and $2.0 million, respectively. The total fair value of RSUs vested during the years ended December 31, 2016 and 2015 were $3.9 million and $3.7 million, respectively. There were no RSUs which vested in 2014.
As of December 31, 2016, there was $14.1 million of total unrecognized compensation cost related to non-vested share-based compensation arrangements granted under the Plans. That cost is expected to be recognized over a weighted-average period of 1.6 years.
66
When we close certain facilities, primarily related to location consolidation initiatives, we recognize expense related to the minimum future lease obligations over the remaining lease terms on closed facilities, net of estimated sub-rental income as well as employee severance costs. These expenses are recorded in selling, general, and administrative expense in the accompanying consolidated statement of operations and comprehensive income (loss).
An analysis of our facility closure reserves for the periods reflected is as follows:
|
|
|
2014 |
|
|
Additions |
|
|
Assumed in Acquisition |
|
|
|
Payments |
|
|
2015 |
|
|
Additions |
|
|
Payments |
|
|
2016 |
|
||||||||||||
|
|
|
|
|
|
|
(In thousands) |
|
||||||||||||||||||||||||||||||
|
Facility and other exit costs, net of estimated sub-lease rental income |
|
$ |
1,147 |
|
|
$ |
2,836 |
|
|
$ |
12,494 |
|
|
$ |
(3,942 |
) |
|
$ |
12,535 |
|
|
$ |
464 |
|
|
$ |
(4,776 |
) |
|
$ |
8,223 |
|
|||||
|
Employee severance and termination benefits |
|
|
— |
|
|
|
1,434 |
|
|
|
— |
|
|
|
(1,181 |
) |
|
|
253 |
|
|
|
117 |
|
|
|
(358 |
) |
|
|
12 |
|
|||||
|
Total facility closure reserve |
|
$ |
1,147 |
|
|
$ |
4,270 |
|
|
$ |
12,494 |
|
|
$ |
(5,123 |
) |
|
$ |
12,788 |
|
|
$ |
581 |
|
|
$ |
(5,134 |
) |
|
$ |
8,235 |
|
|||||
The Company assumed $12.5 million of exit cost reserves as part of the ProBuild acquisition during 2015. The facility and other exit cost reserves of $8.2 million at December 31, 2016, of which $4.3 million is recorded as other long-term liabilities, are primarily related to future minimum lease payments on vacated facilities.
As plans to close facilities are developed and executed, assets that can be used at other facilities are transferred and assets to be abandoned or sold are written down to their net realizable value, including any long-lived assets. In situations where multiple facilities serve the same market we may temporarily close, or idle, facilities with plans to reopen these facilities once demand returns to the market. In these situations, finite lived assets continue to be depreciated and assessed for impairment. Should conditions in our markets worsen, or recovery take significantly longer than forecasted, we may temporarily idle or permanently close additional facilities, at which time we may incur additional facility closure costs or asset impairment charges. Future non-cash impairment charges would have the effect of decreasing our earnings or increasing our losses in such period, but would not impact our current outstanding debt obligations or compliance with covenants contained in the related debt agreements. We continuously monitor economic conditions in all of our markets and changes in market conditions may warrant future closings or idling of facilities. In addition, as we continue the integration of ProBuild we may close or idle other facilities.
12. Income Taxes
The components of income tax expense (benefit) included in continuing operations were as follows for the years ended December 31:
|
|
|
2016 |
|
|
2015 |
|
|
2014 |
|
|||
|
|
|
(In thousands) |
|
|||||||||
|
Current: |
|
|
|
|
|
|
|
|
|
|
|
|
|
Federal |
|
$ |
— |
|
|
$ |
— |
|
|
$ |
— |
|
|
State |
|
|
2,115 |
|
|
|
1,100 |
|
|
|
587 |
|
|
|
|
|
2,115 |
|
|
|
1,100 |
|
|
|
587 |
|
|
Deferred: |
|
|
|
|
|
|
|
|
|
|
|
|
|
Federal |
|
|
(110,720 |
) |
|
|
2,530 |
|
|
|
457 |
|
|
State |
|
|
(14,067 |
) |
|
|
757 |
|
|
|
67 |
|
|
|
|
|
(124,787 |
) |
|
|
3,287 |
|
|
|
524 |
|
|
Income tax expense (benefit) |
|
$ |
(122,672 |
) |
|
$ |
4,387 |
|
|
$ |
1,111 |
|
67
Temporary differences, which give rise to deferred tax assets and liabilities, were as follows as of December 31:
|
|
|
2016 |
|
|
2015 |
|
||
|
|
|
(In thousands) |
|
|||||
|
Deferred tax assets related to: |
|
|
|
|
|
|
|
|
|
Accrued expenses |
|
$ |
13,100 |
|
|
$ |
6,786 |
|
|
Insurance reserves |
|
|
15,128 |
|
|
|
7,156 |
|
|
Facility closure reserves |
|
|
564 |
|
|
|
429 |
|
|
Stock-based compensation expense |
|
|
7,429 |
|
|
|
7,284 |
|
|
Accounts receivable |
|
|
5,023 |
|
|
|
1,358 |
|
|
Inventories |
|
|
24,628 |
|
|
|
8,200 |
|
|
Operating loss and credit carryforwards |
|
|
87,610 |
|
|
|
110,425 |
|
|
Goodwill and other intangible assets |
|
|
— |
|
|
|
9,176 |
|
|
Other |
|
|
— |
|
|
|
4,494 |
|
|
|
|
|
153,482 |
|
|
|
155,308 |
|
|
Valuation allowance |
|
|
(4,821 |
) |
|
|
(136,548 |
) |
|
Total deferred tax assets |
|
|
148,661 |
|
|
|
18,760 |
|
|
Deferred tax liabilities related to: |
|
|
|
|
|
|
|
|
|
Prepaid expenses |
|
|
(3,799 |
) |
|
|
(6,344 |
) |
|
Goodwill and other intangible assets |
|
|
(15,956 |
) |
|
|
(11,502 |
) |
|
Property, plant and equipment |
|
|
(13,058 |
) |
|
|
(10,381 |
) |
|
Other |
|
|
(528 |
) |
|
|
— |
|
|
Total deferred tax liabilities |
|
|
(33,341 |
) |
|
|
(28,227 |
) |
|
Net deferred tax asset (liability) |
|
$ |
115,320 |
|
|
$ |
(9,467 |
) |
A reconciliation of the statutory federal income tax rate to our effective rate for continuing operations is provided below for the years ended December 31:
|
|
|
2016 |
|
|
2015 |
|
|
2014 |
|
|||
|
Statutory federal income tax rate |
|
|
35.0 |
% |
|
|
35.0 |
% |
|
|
35.0 |
% |
|
State income taxes, net of federal income tax |
|
|
6.1 |
|
|
|
8.3 |
|
|
|
5.2 |
|
|
Valuation allowance |
|
|
(607.9 |
) |
|
|
(52.1 |
) |
|
|
(36.5 |
) |
|
Permanent difference – 162(m) limitation |
|
|
0.6 |
|
|
|
(5.4 |
) |
|
|
0.7 |
|
|
Permanent difference – Warrant mark to market |
|
|
— |
|
|
|
(8.6 |
) |
|
|
(0.8 |
) |
|
Permanent difference – Other |
|
|
(0.8 |
) |
|
|
(0.9 |
) |
|
|
2.0 |
|
|
Other |
|
|
0.9 |
|
|
|
0.1 |
|
|
|
— |
|
|
|
|
|
(566.1 |
)% |
|
|
(23.6 |
)% |
|
|
5.6 |
% |
Section 382 of the Internal Revenue Code imposes annual limitations on the utilization of net operating loss (“NOL”) carryforwards, other tax carryforwards, and certain built-in losses upon an ownership change as defined under that section. In general terms, an ownership change may result from transactions that increase the aggregate ownership of certain stockholders in the Company’s stock by more than 50 percentage points over a three year testing period (“Section 382 Ownership Change”). If the Company were to experience a Section 382 Ownership Change, an annual limitation would be imposed on certain of the Company’s tax attributes, including NOL and capital loss carryforwards, and certain other losses, credits, deductions or tax basis.
At December 31, 2016 and 2015, the Company had deferred tax assets, net of deferred tax liabilities, of $120.1 million and $127.1 million, respectively, offset by valuation allowances of $4.8 million and $136.5 million, respectively. We have $411.4 million of state net operating loss carry-forwards, which includes $2.5 million of state tax credit carry-forwards expiring at various dates through 2036. We also have $226.5 million of federal net operating loss carry-forwards that will expire at various dates through 2036. The federal and state net operating loss carry-forwards include approximately $23.3 million of gross windfall tax benefits from stock option exercises that have not been recorded as of December 31, 2016. At December 31, 2016, the Company needed to generate approximately $287.6 million of pre-tax income in future periods to realize its federal deferred tax assets.
68
We evaluate our deferred tax assets on a quarterly basis to determine whether a valuation allowance is required. In accordance with the Income Taxes topic of the Codification, we assess whether it is more likely than not that some or all of our deferred tax assets will not be realized. Significant judgment is required in estimating valuation allowances for deferred tax assets and in making this determination, we consider all available positive and negative evidence. In the Company’s evaluation of its ability to realize its deferred tax assets, we gave more significant weight to evidence that was objective in nature as compared to subjective evidence. Also, more significant weight was given to evidence that relates to the Company’s current financial performance. The realization of a deferred tax asset ultimately depends on the existence of sufficient taxable income in the applicable carryback or carryforward periods. We consider the nature, frequency, and severity of current and cumulative losses, as well as historical and forecasted financial results, the overall business environment, our industry's historic cyclicality, the reversal of existing deferred tax liabilities, and tax planning strategies in our assessment. Changes in our estimates of future taxable income and tax planning strategies will affect our estimate of the realization of the tax benefits of these tax carryforwards.
We recorded a full valuation allowance in 2008 due to our cumulative three-year loss position at that time, compounded by the negative industry-wide business trends and outlook. At December 31, 2015, the Company had given significant weight to the negative objective evidence of the historically weak housing market conditions during the housing downturn that contributed to our three-year cumulative pre-tax loss position when reporting a valuation allowance of $136.5 million against our deferred income tax assets, representing a valuation allowance against substantially all of our net deferred income tax assets.
In the second quarter of 2016, we moved from a cumulative loss position over the previous three years to a cumulative income position for the first time since we established the full valuation allowance in 2008. We continued to maintain a cumulative income position over the previous three years into the third quarter of 2016. In the Company’s evaluation at September 30, 2016, we gave the most significant weight to this objective positive evidence related to its recent financial results. Additionally, even conservative projections of the Company’s estimated future annual pre-tax income would indicate realization of all of its federal net operating losses well in advance of the expiration of the Company’s NOL carryforwards and it would also absorb all federal deductible temporary differences as they reverse in future years. The Company considered, at a lower weighting, the subjective positive evidence that it expects to increase its pre-tax income in future years as the homebuilding industry continues to recover and strengthen as currently projected by a composite of third-party sources, including the NAHB. Therefore, at September 30, 2016, with this positive historical evidence and the projection of future profitability, management determined that there was sufficient positive evidence to conclude that it is more likely than not that we would realize our net federal and certain state deferred tax assets, resulting in a $117.6 million and $3.2 million benefit being recognized in our provision for income taxes for the third and fourth quarter of 2016, respectively.
Prior to the quarter ended June 30, 2016, the Company had given significant weight to the negative objective evidence of its three-year cumulative pre-tax loss position as a result of losses incurred in prior years during the housing downturn. As of June 30, 2016 and September 30, 2016, the Company had generated positive cumulative pre-tax income for the past three years and therefore, the prior year losses were weighted less than the recent positive financial results in the Company’s evaluation at September 30, 2016. Other negative subjective evidence, such as the cyclical, slower-than-anticipated housing market recovery, was considered at a lower weighting because the Company’s recent financial performance has been achieved in this environment.
As of December 31, 2016, we have certain states where we are not currently projecting future taxable income levels that would be sufficient to utilize the carryover net operating losses and as such continue to maintain a valuation allowance against certain of these state deferred tax assets. We will continue to assess quarterly whether it is more likely than not that some or all of these state deferred tax assets will be realizable in the future. Changes in the positive and negative evidence, including differences in the Company’s future operating results as compared to the estimates utilized in the determination of the valuation allowance, could result in changes in the Company’s estimate of the valuation allowance related to its tax benefits for state net operating loss carryforwards.
In 2016 we recorded a reduction to the valuation allowance of $131.7 million against our net deferred tax assets as we released valuation allowances on our net deferred tax assets as noted above. In 2015, we recorded a valuation allowance of $9.7 million related to our continuing operations. In 2014, we reduced our valuation allowance by $7.2 million due to the utilization of net operating losses against federal and state taxable income.
We base our estimate of deferred tax assets and liabilities on current tax laws and rates. In certain cases, we also base our estimate on business plan forecasts and other expectations about future outcomes. Changes in existing tax laws or rates could affect our actual tax results, and future business results may affect the amount of our deferred tax liabilities or the valuation of our deferred tax assets over time. Due to uncertainties in the estimation process, particularly with respect to changes in facts and circumstances in future reporting periods, as well as the residential homebuilding industry’s cyclicality and sensitivity to changes in economic conditions, it is possible that actual results could differ from the estimates used in previous analyses.
Accounting for deferred taxes is based upon estimates of future results. Differences between the anticipated and actual outcomes of these future results could have a material impact on our consolidated results of operations or financial position.
69
The following table shows the changes in our valuation allowance:
|
|
|
2016 |
|
|
2015 |
|
|
2014 |
|
|||
|
|
|
(In thousands) |
|
|||||||||
|
Balance at January 1, |
|
$ |
136,548 |
|
|
$ |
133,183 |
|
|
$ |
143,682 |
|
|
Additions charged to expense: |
|
|
|
|
|
|
|
|
|
|
|
|
|
Continuing operations |
|
|
— |
|
|
|
9,679 |
|
|
|
— |
|
|
Discontinued operations |
|
|
— |
|
|
|
— |
|
|
|
131 |
|
|
Reductions credited to expense: |
|
|
|
|
|
|
|
|
|
|
|
|
|
Continuing operations |
|
|
(131,727 |
) |
|
|
— |
|
|
|
(7,178 |
) |
|
Discontinued operations |
|
|
— |
|
|
|
(55 |
) |
|
|
— |
|
|
Deductions |
|
|
— |
|
|
|
(6,259 |
) |
|
|
(3,452 |
) |
|
Balance at December 31, |
|
$ |
4,821 |
|
|
$ |
136,548 |
|
|
$ |
133,183 |
|
We accrue interest and penalties on our uncertain tax positions as a component of our provision for income taxes. We accrued no significant interest and penalties in 2016, 2015 or 2014. We had a total of $0.3 million and $0.3 million accrued for interest and penalties for our uncertain tax positions as of December 31, 2016 and 2015, respectively.
The following table shows the changes in the amount of our uncertain tax positions (exclusive of the effect of interest and penalties):
|
|
|
2016 |
|
|
2015 |
|
|
2014 |
|
|||
|
|
|
(In thousands) |
|
|||||||||
|
Balance at January 1, |
|
$ |
208 |
|
|
$ |
378 |
|
|
$ |
950 |
|
|
Tax positions taken in prior periods: |
|
|
|
|
|
|
|
|
|
|
|
|
|
Gross increases |
|
|
18 |
|
|
|
— |
|
|
|
2 |
|
|
Gross decreases |
|
|
— |
|
|
|
— |
|
|
|
— |
|
|
Tax positions taken in current period: |
|
|
|
|
|
|
|
|
|
|
|
|
|
Gross increases |
|
|
23 |
|
|
|
12 |
|
|
|
13 |
|
|
Settlements with taxing authorities |
|
|
— |
|
|
|
— |
|
|
|
— |
|
|
Lapse of applicable statute of limitations |
|
|
(0 |
) |
|
|
(182 |
) |
|
|
(587 |
) |
|
Balance at December 31, |
|
$ |
249 |
|
|
$ |
208 |
|
|
$ |
378 |
|
The balance for uncertain tax positions was $0.2 million as of December 31, 2016 excluding penalties and interest.
We are subject to U.S. federal income tax as well as income tax of multiple state jurisdictions. Based on completed examinations and the expiration of statutes of limitations, we have concluded all U.S. federal income tax matters for years through 2012. We report in 41 states with various years open to examination.
13. Employee Benefit Plans
As a result of the ProBuild acquisition we maintain two active defined contribution 401(k) plans. Our employees are eligible to participate in the plans subject to certain employment eligibility provisions. Participants can contribute up to 15% of their annual compensation, subject to federally mandated maximums. Participants are immediately vested in their own contributions. We match a certain percentage of the contributions made by participating employees, subject to IRS limitations. Our matching contributions are subject to a pro-rata five-year vesting schedule. We recognized expense of $4.6 million, $6.5 million and $0.4 million in 2016, 2015 and 2014, respectively, for contributions to the plan.
Through the ProBuild acquisition, the Company acquired a defined benefit plan, the ProBuild Retirement Plan, which was terminated as of January 30, 2015. The Company has made all remaining plan benefit distributions and the plan was fully terminated and settled as of December 31, 2015.
70
The Company contributes to multiple collectively bargained union retirement plans including multiemployer plans. The Company does not administer the multiemployer plans, and contributions are determined in accordance with the provisions of negotiated labor contracts. The risks of participating in multiemployer plans are different from single-employer plans. Assets contributed to the multiemployer plan by one employer may be used to provide benefits to employees of other participating employers. If a participating employer stops contributing to a multiemployer plan, the unfunded obligations of that multiemployer plan may be borne by the remaining participating employers. If the Company chooses to stop participating in a multiemployer plan, the Company may be required to pay that plan an amount (“withdrawal liability”) based on the plan’s formula and the underfunded status of the plan attributable to the Company. Contributions to the plans for the years ended December 31, 2016 and 2015 were not significant.
14. Commitments and Contingencies
We lease certain land, buildings and equipment used in operations. These leases are generally accounted for as operating leases with initial terms ranging from one to 20 years and they generally contain renewal options. Certain operating leases are subject to contingent rentals based on various measures, primarily consumer price index increases. We also lease certain properties from related parties, including current employees and non-affiliate stockholders. Total rent expense under operating leases was approximately $68.7 million, $43.6 million and $25.4 million for the years ended December 31, 2016, 2015, and 2014, respectively.
In addition, we have residual value guarantees on certain equipment leases. Under these leases we have the option of (a) purchasing the equipment at the end of the lease term, (b) arranging for the sale of the equipment to a third party, or (c) returning the equipment to the lessor to sell the equipment. If the sales proceeds in any case are less than the residual value, we are required to reimburse the lessor for the deficiency up to a specified level as stated in each lease agreement. If the sales proceeds exceed the residual value, we are entitled to all of such excess amounts. The guarantees under these leases for the residual values of equipment at the end of the respective operating lease periods approximated $3.9 million as of December 31, 2016. Based upon the expectation that none of these leased assets will have a residual value at the end of the lease term that is materially less than the value specified in the related operating lease agreement or that we will purchase the equipment at the end of the lease term, we do not believe it is probable that we will be required to fund any amounts under the terms of these guarantee arrangements. Accordingly, no accruals have been recognized for these guarantees.
Future minimum commitments for noncancelable operating leases with initial or remaining lease terms in excess of one year are as follows:
|
|
|
Related Party |
|
|
Total* |
|
||
|
|
|
(In thousands) |
|
|||||
|
Year ending December 31, |
|
|
|
|
|
|
|
|
|
2017 |
|
$ |
1,010 |
|
|
$ |
67,213 |
|
|
2018 |
|
|
336 |
|
|
|
57,619 |
|
|
2019 |
|
|
350 |
|
|
|
46,536 |
|
|
2020 |
|
|
360 |
|
|
|
33,056 |
|
|
2021 |
|
|
375 |
|
|
|
22,915 |
|
|
Thereafter |
|
|
1,019 |
|
|
|
56,192 |
|
|
|
|
$ |
3,450 |
|
|
$ |
283,531 |
|
|
* |
Includes related party future minimum commitments for noncancelable operating leases. |
As of December 31, 2016, we had outstanding letters of credit totaling $84.8 million under our 2015 facility that principally support our self-insurance programs.
Beginning in the fourth quarter, the Company has seen an increased occurrence of known and threatened construction defect legal claims primarily in two states. While these claims are generally covered under the Company’s existing insurance programs to the extent any loss exceeds the deductible, there is a reasonable possibility of loss that is not able to be estimated at this time because (i) many of the proceedings are in the discovery stage, (ii) the outcome of future litigation is uncertain, and/or (iii) the complex nature of the claims. Although the Company cannot estimate a reasonable range of loss based on currently available information, the resolution of these matters could have an adverse effect on the Company's financial position, results of operations or cash flows.
We are a party to various legal proceedings in the ordinary course of business. Although the ultimate disposition of these proceedings cannot be predicted with certainty, management believes the outcome of any claim that is pending or threatened, either individually or on a combined basis, will not have a material adverse effect on our consolidated financial position, cash flows or
71
results of operations. However, there can be no assurances that future adverse judgments and costs would not be material to our results of operations or liquidity for a particular period.
15. Segment and Product Information
We offer an integrated solution to our customers providing manufacturing, supply, and installation of a full range of structural and related building products. We provide a wide variety of building products and services directly to homebuilder customers. We manufacture floor trusses, roof trusses, wall panels, stairs, millwork, windows, and doors. We also provide a full range of construction services. These product and service offerings are distributed across 400 locations operating in 40 states across the United States, which have been reorganized into nine geographical regions following the ProBuild acquisition. Centralized financial and operational oversight, including resource allocation and assessment of performance on an income (loss) from continuing operations before income taxes basis, is performed by our CEO, whom we have determined to be our chief operating decision maker (“CODM”).
As a result of the reorganization following the ProBuild acquisition, the Company has nine operating segments aligned with its nine geographical regions (Regions 1 through 9). While all of our operating segments have similar nature of products, distribution methods and customers, certain of our operating segments have been aggregated due to also containing similar economic characteristics, resulting in the following composition of reportable segments:
|
|
• |
Regions 1 and 2 have been aggregated to form the “Northeast” reportable segment |
|
|
• |
Regions 3 and 5 have been aggregated to form the “Southeast” reportable segment |
|
|
• |
Regions 4 and 6 have been aggregated to form the “South” reportable segment |
|
|
• |
Region 7, 8 and 9 have been aggregated to form the “West” reportable segment |
In addition to our reportable segments, our consolidated results include corporate overhead, other various operating activities that are not internally allocated to a geographical region nor separately reported to the CODM, and certain reconciling items primarily related to allocations of corporate overhead and rent expense, which have collectively been presented as “All Other”. The accounting policies of the segments are consistent with those described in Note 2, except for noted reconciling items.
The following tables present Net sales, Income (loss) before income taxes and certain other measures for the reportable segments, reconciled to consolidated total operations, for the years ended December 31, (in thousands):
|
|
|
2016 |
|
|||||||||||||
|
Reportable segments |
|
Net Sales |
|
|
Depreciation & Amortization |
|
|
Interest |
|
|
Income (loss) before income taxes |
|
||||
|
Northeast |
|
$ |
1,204,099 |
|
|
$ |
18,220 |
|
|
$ |
18,660 |
|
|
$ |
35,356 |
|
|
Southeast |
|
|
1,367,933 |
|
|
|
11,384 |
|
|
|
19,956 |
|
|
|
37,158 |
|
|
South |
|
|
1,704,753 |
|
|
|
22,139 |
|
|
|
22,331 |
|
|
|
69,846 |
|
|
West |
|
|
1,939,206 |
|
|
|
33,775 |
|
|
|
27,143 |
|
|
|
72,649 |
|
|
Total reportable segments |
|
|
6,215,991 |
|
|
|
85,518 |
|
|
|
88,090 |
|
|
|
215,009 |
|
|
All other |
|
|
151,293 |
|
|
|
24,275 |
|
|
|
126,577 |
|
|
|
(193,340 |
) |
|
Total consolidated |
|
$ |
6,367,284 |
|
|
$ |
109,793 |
|
|
$ |
214,667 |
|
|
$ |
21,669 |
|
|
|
|
|
|
|||||||||||||
|
|
|
2015 |
|
|||||||||||||
|
Reportable segments |
|
Net Sales |
|
|
Depreciation & Amortization |
|
|
Interest |
|
|
Income (loss) before income taxes |
|
||||
|
Northeast |
|
$ |
626,985 |
|
|
$ |
4,201 |
|
|
$ |
7,508 |
|
|
$ |
28,862 |
|
|
Southeast |
|
|
917,022 |
|
|
|
5,296 |
|
|
|
14,598 |
|
|
|
14,607 |
|
|
South |
|
|
1,073,240 |
|
|
|
10,649 |
|
|
|
12,707 |
|
|
|
50,878 |
|
|
West |
|
|
786,476 |
|
|
|
5,824 |
|
|
|
6,118 |
|
|
|
35,170 |
|
|
Total reportable segments |
|
|
3,403,723 |
|
|
|
25,970 |
|
|
|
40,931 |
|
|
|
129,517 |
|
|
All other |
|
|
160,702 |
|
|
|
32,310 |
|
|
|
68,268 |
|
|
|
(147,961 |
) |
|
Total consolidated |
|
$ |
3,564,425 |
|
|
$ |
58,280 |
|
|
$ |
109,199 |
|
|
$ |
(18,444) |
|
72
|
|
|
2014 |
|
|||||||||||||
|
Reportable segments |
|
Net Sales |
|
|
Depreciation & Amortization |
|
|
Interest |
|
|
Income (loss) before income taxes |
|
||||
|
Northeast |
|
$ |
229,998 |
|
|
$ |
1,068 |
|
|
$ |
3,634 |
|
|
$ |
3,464 |
|
|
Southeast |
|
|
672,059 |
|
|
|
2,743 |
|
|
|
11,925 |
|
|
|
5,465 |
|
|
South |
|
|
558,446 |
|
|
|
2,621 |
|
|
|
7,666 |
|
|
|
17,804 |
|
|
West |
|
|
— |
|
|
|
— |
|
|
|
— |
|
|
|
— |
|
|
Total reportable segments |
|
|
1,460,503 |
|
|
|
6,432 |
|
|
|
23,225 |
|
|
|
26,733 |
|
|
All other |
|
|
143,593 |
|
|
|
3,087 |
|
|
|
7,124 |
|
|
|
(7,472 |
) |
|
Total consolidated |
|
$ |
1,604,096 |
|
|
$ |
9,519 |
|
|
$ |
30,349 |
|
|
$ |
19,261 |
|
Asset information by segment is not reported internally or otherwise reviewed by the CODM nor does the company earn revenues or have long-lived assets located in foreign countries. The Company’s net sales by product category for the periods indicated were as follows (in thousands):
Sales by product category were as follows for the years ended December 31:
|
|
|
2016 |
|
|
2015 |
|
|
2014 |
|
|||
|
|
|
(In thousands) |
|
|||||||||
|
Lumber & lumber sheet goods |
|
$ |
2,131,394 |
|
|
$ |
1,129,684 |
|
|
$ |
535,279 |
|
|
Windows, doors & millwork |
|
|
1,286,151 |
|
|
|
818,131 |
|
|
|
446,433 |
|
|
Manufactured products |
|
|
1,097,665 |
|
|
|
635,338 |
|
|
|
311,994 |
|
|
Gypsum, roofing & insulation |
|
|
520,007 |
|
|
|
264,894 |
|
|
|
61,114 |
|
|
Siding, metal & concrete products |
|
|
622,344 |
|
|
|
319,618 |
|
|
|
81,894 |
|
|
Other building & product services |
|
|
709,723 |
|
|
|
396,760 |
|
|
|
167,382 |
|
|
Total sales |
|
$ |
6,367,284 |
|
|
$ |
3,564,425 |
|
|
$ |
1,604,096 |
|
In the above presentation of the Company’s net sales by product category, prior periods have been revised to reflect a re-categorization of certain product sales within the respective product categories to be consistent with how management views the business after further refinement from the ongoing evaluations following the ProBuild acquisition. Install labor sales are reflected in the “Other building products & services” category.
16. Related Party Transactions
Floyd F. Sherman, our chief executive officer, and Brett Milgrim, a member of the Company’s board of directors, serve on the board of directors for PGT, Inc.. We purchased windows from PGT, Inc. totaling $11.4 million, $9.3 million and $6.3 million in 2016, 2015 and 2014, respectively. We had accounts payable to PGT, Inc. in the amounts of $1.4 million and $1.1 million as of December 31, 2016 and 2015, respectively.
In 2016, 2015 and 2014, we paid approximately $0.7 million, $1.0 million and $0.9 million, respectively, in rental expense to employees or our non-affiliate stockholders for leases of land and buildings.
Transactions between the Company and other related parties occur in the ordinary course of business. However, the Company carefully monitors and assesses related party relationships. Management does not believe that any of these transactions with related parties had a material impact on the Company’s results for the years ended December 31, 2016, 2015 or 2014.
73
17. Unaudited Quarterly Financial Data
The following tables summarize the consolidated quarterly results of operations for 2016 and 2015 (in thousands, except per share amounts):
|
|
|
|
2016 |
|
|
||||||||||||||
|
|
|
First Quarter |
|
|
|
Second Quarter |
|
|
Third Quarter |
|
|
Fourth Quarter |
|
|
|||||
|
Net sales |
|
$ |
1,397,114 |
|
|
|
$ |
1,677,300 |
|
|
$ |
1,745,958 |
|
|
$ |
1,546,912 |
|
|
|
|
Gross margin |
|
|
349,748 |
|
|
|
|
418,331 |
|
|
|
437,094 |
|
|
|
391,575 |
|
|
|
|
Net income (loss) |
|
|
(16,980 |
) |
(1) |
|
|
29,441 |
(2) |
|
|
125,469 |
(3) |
|
|
6,411 |
(4) |
|
|
|
Net income (loss) per share |
|
|
|
|
|
|
|
|
|
|
|
|
|
|
|
|
|
|
|
|
Basic |
|
$ |
(0.15 |
) |
(1) |
|
$ |
0.27 |
(2) |
|
$ |
1.13 |
(3) |
|
$ |
0.06 |
(4) |
|
|
|
Diluted |
|
$ |
(0.15 |
) |
(1) |
|
$ |
0.26 |
(2) |
|
$ |
1.10 |
(3) |
|
$ |
0.06 |
(4) |
|
|
|
|
|
|
2015 |
|
|
||||||||||||||
|
|
|
First Quarter |
|
|
|
Second Quarter |
|
|
Third Quarter |
|
|
Fourth Quarter |
|
|
|||||
|
Net sales |
|
$ |
370,986 |
|
|
|
$ |
461,521 |
|
|
$ |
1,276,063 |
|
|
$ |
1,455,855 |
|
|
|
|
Gross margin |
|
|
83,733 |
|
|
|
|
110,614 |
|
|
|
324,774 |
|
|
|
382,337 |
|
|
|
|
Net income (loss) |
|
|
(7,070 |
) |
(5) |
|
|
3,576 |
(6) |
|
|
(8,757 |
) |
(7) |
|
(10,580 |
) |
(8) |
|
|
Net income (loss) per share |
|
|
|
|
|
|
|
|
|
|
|
|
|
|
|
|
|
|
|
|
Basic |
|
$ |
(0.07 |
) |
(5) |
|
$ |
0.04 |
(6) |
|
$ |
(0.08 |
) |
(7) |
$ |
(0.10 |
) |
(8) |
|
|
Diluted |
|
$ |
(0.07 |
) |
(5) |
|
$ |
0.03 |
(6) |
|
$ |
(0.08 |
) |
(7) |
$ |
(0.10 |
) |
(8) |
|
|
(1) |
Includes a gain on debt extinguishment of $7.8 million as discussed in Note 8 and a valuation allowance of $5.1 million as discussed in Note 12. |
|
(2) |
Includes a loss on debt extinguishment of $1.7 million as discussed in Note 8 and a valuation allowance of $(16.0) million as discussed in Note 12. |
|
(3) |
Includes a loss on debt extinguishment and financing costs of $53.3 million as discussed in Note 8 and a valuation allowance of $(117.6) million as discussed in Note 12. |
|
(4) |
Includes a loss on debt extinguishment of $9.7 million as discussed in Note 8 and a valuation allowance of $(3.2) million as discussed in Note 12. |
|
(5) |
Includes acquisition costs of $5.5 million as discussed in Note 3, fair value adjustments for the warrants of $0.2 million as discussed in Note 8 and a valuation allowance of $3.1 million as discussed in Note 12. |
|
(6) |
Includes acquisition costs of $6.4 million as discussed in Note 3, fair value adjustments for the warrants of $4.7 million as discussed in Note 8 and a valuation allowance of $(1.3) million as discussed in Note 12. |
|
(7) |
Includes acquisition costs of $8.8 million as discussed in Note 3, financing costs of $13.2 million as discussed in Note 8 and a valuation allowance of $1.1 million as discussed in Note 12. |
|
(8) |
Includes acquisition costs of $0.2 million as discussed in Note 3 and a valuation allowance of $6.8 million as discussed in Note 12. |
Earnings per share is computed independently for each of the quarters presented; therefore, the sum of the quarterly earnings per share may not equal the annual earnings per share.
In the below presentation of the Company’s net sales by product category, prior quarterly periods for 2016 and 2015 have been revised to reflect a re-categorization of certain product sales within the respective product categories to be consistent with how management views the business after further refinement from the ongoing evaluations following the ProBuild acquisition. Install labor sales are reflected in the “Other building products & services” category.
74
Sales by product category were as follows (in thousands):
|
|
|
Three Months Ended |
|||||||||||||||
|
|
|
March 31, 2016 |
|
|
June 30, 2016 |
|
|
September 30, 2016 |
|
|
December 31, 2016 |
|
|||||
|
Lumber & lumber sheet goods |
|
$ |
461,415 |
|
|
$ |
560,877 |
|
|
$ |
592,770 |
|
|
$ |
516,332 |
|
|
|
Windows, doors & millwork |
|
|
296,668 |
|
|
|
329,424 |
|
|
|
337,155 |
|
|
|
322,904 |
|
|
|
Manufactured products |
|
|
236,233 |
|
|
|
286,446 |
|
|
|
301,563 |
|
|
|
273,423 |
|
|
|
Gypsum, roofing & insulation |
|
|
112,302 |
|
|
|
138,662 |
|
|
|
145,618 |
|
|
|
123,425 |
|
|
|
Siding, metal & concrete products |
|
|
131,966 |
|
|
|
168,070 |
|
|
|
176,557 |
|
|
|
145,751 |
|
|
|
Other building products & services |
|
|
158,530 |
|
|
|
193,821 |
|
|
|
192,295 |
|
|
|
165,077 |
|
|
|
Net Sales |
|
$ |
1,397,114 |
|
|
$ |
1,677,300 |
|
|
$ |
1,745,958 |
|
|
$ |
1,546,912 |
|
|
|
|
|
Three Months Ended |
|||||||||||||||
|
|
|
March 31, 2015 |
|
|
June 30, 2015 |
|
|
September 30, 2015 |
|
|
December 31, 2015 |
|
|||||
|
Lumber & lumber sheet goods |
|
$ |
117,927 |
|
|
$ |
144,974 |
|
|
$ |
409,492 |
|
|
$ |
457,291 |
|
|
|
Windows, doors & millwork |
|
|
108,796 |
|
|
|
129,215 |
|
|
|
268,029 |
|
|
|
312,091 |
|
|
|
Manufactured products |
|
|
74,307 |
|
|
|
98,634 |
|
|
|
223,258 |
|
|
|
239,139 |
|
|
|
Gypsum, roofing & insulation |
|
|
13,690 |
|
|
|
17,394 |
|
|
|
108,045 |
|
|
|
125,765 |
|
|
|
Siding, metal & concrete products |
|
|
18,595 |
|
|
|
25,152 |
|
|
|
127,930 |
|
|
|
147,941 |
|
|
|
Other building products & services |
|
|
37,671 |
|
|
|
46,152 |
|
|
|
139,309 |
|
|
|
173,628 |
|
|
|
Net Sales |
|
$ |
370,986 |
|
|
$ |
461,521 |
|
|
$ |
1,276,063 |
|
|
$ |
1,455,855 |
|
|
18. Subsequent Event
On February 23, 2017, we repriced our existing 2015 term loan through an amendment and extension of the term loan credit agreement providing for a $467.7 million senior secured term loan facility due 2024 (“2024 term loan”). This repricing reduces the interest rate by 0.75% and extends the maturity by 19 months to February 29, 2024.
The 2024 term loan bears interest based on either a eurodollar or base rate (a rate equal to the highest of an agreed commercially available benchmark rate, the federal funds effective rate plus 0.50% or the eurodollar rate plus 1.0%, as selected by the Company) plus, in each case, an applicable margin. The applicable margin in the 2024 term loan is (x) 3% in the case of Eurodollar rate loans and (y) 2% in the case of base rate loans. These rates represents a 0.75% reduction from the 2015 term loan. Deutsche Bank AG New York Branch continues to serve as administrative agent and collateral agent under the 2024 term loan.
75
Item 9. Changes in and Disagreements with Accountants on Accounting and Financial Disclosure
None.
Item 9A. Controls and Procedures
Disclosure Controls Evaluation and Related CEO and CFO Certifications. Our management, with the participation of our principal executive officer (“CEO”) and principal financial officer (“CFO”) conducted an evaluation of the effectiveness of the design and operation of our disclosure controls and procedures as of the end of the period covered by this annual report.
Certifications of our CEO and our CFO, which are required in accordance with Rule 13a-14 of the Securities Exchange Act of 1934, as amended (“Exchange Act”), are attached as exhibits to this annual report. This “Controls and Procedures” section includes the information concerning the controls evaluation referred to in the certifications, and it should be read in conjunction with the certifications for a more complete understanding of the topics presented.
Limitations on the Effectiveness of Controls. We do not expect that our disclosure controls and procedures will prevent all errors and all fraud. A system of controls and procedures, no matter how well conceived and operated, can provide only reasonable, not absolute, assurance that the objectives of the system are met. Because of the limitations in all such systems, no evaluation can provide absolute assurance that all control issues and instances of fraud, if any, within the Company have been detected. Furthermore, the design of any system of controls and procedures is based in part upon certain assumptions about the likelihood of future events, and there can be no assurance that any design will succeed in achieving its stated goals under all potential future conditions, regardless of how unlikely. Because of these inherent limitations in a cost-effective system of controls and procedures, misstatements or omissions due to error or fraud may occur and not be detected.
Scope of the Controls Evaluation. The evaluation of our disclosure controls and procedures included a review of their objectives and design, the Company’s implementation of the controls and procedures and the effect of the controls and procedures on the information generated for use in this annual report. In the course of the evaluation, we sought to identify whether we had any data errors, control problems or acts of fraud and to confirm that appropriate corrective action, including process improvements, were being undertaken if needed. This type of evaluation is performed on a quarterly basis so that conclusions concerning the effectiveness of our disclosure controls and procedures can be reported in our quarterly reports on Form 10-Q. Many of the components of our disclosure controls and procedures are also evaluated by our internal audit department, our legal department and by personnel in our finance organization. The overall goals of these various evaluation activities are to monitor our disclosure controls and procedures on an ongoing basis, and to maintain them as dynamic systems that change as conditions warrant.
Conclusions regarding Disclosure Controls. Based on the required evaluation of our disclosure controls and procedures, our CEO and CFO have concluded that, as of December 31, 2016, we maintained disclosure controls and procedures that were effective in providing reasonable assurance that information required to be disclosed by us in the reports that we file or submit under the Exchange Act is recorded, processed, summarized and reported within the time periods specified in the SEC’s rules and forms, and that such information is accumulated and communicated to our management, including our CEO and CFO, as appropriate, to allow timely decisions regarding required disclosure.
Management’s Report on Internal Control Over Financial Reporting. Our management is responsible for establishing and maintaining adequate internal control over financial reporting, as such term is defined in Rule 13a-15(f) of the Exchange Act. Internal control over financial reporting is a process designed to provide reasonable assurance regarding the reliability of financial reporting and the preparation of financial statements for external purposes in accordance with generally accepted accounting principles ("GAAP"). Internal control over financial reporting includes policies and procedures that: (i) pertain to the maintenance of records that, in reasonable detail, accurately and fairly reflect the transactions and dispositions of our assets; (ii) provide reasonable assurance that transactions are recorded as necessary to permit preparation of financial statements in accordance with GAAP, and that our receipts and expenditures are being made only in accordance with authorizations of our management and directors; and (iii) provide reasonable assurance regarding prevention or timely detection of unauthorized acquisition, use or disposition of our assets that could have a material effect on the financial statements.
Because of its inherent limitations, internal control over financial reporting may not prevent or detect misstatements. Also, projections of any evaluation of effectiveness to future periods are subject to the risk that controls may become inadequate because of changes in conditions, or that the degree of compliance with existing policies or procedures may deteriorate.
76
Under the supervision and with the participation of our management, including our CEO and CFO, we conducted an evaluation of the effectiveness of our internal control over financial reporting based on the framework set forth in Internal Control — Integrated Framework (2013) issued by the Committee of Sponsoring Organizations of the Treadway Commission. Based on our evaluation under the framework set forth in Internal Control — Integrated Framework (2013), our management concluded that our internal control over financial reporting was effective as of December 31, 2016.
The effectiveness of the Company’s internal control over financial reporting as of December 31, 2016, has been audited by PricewaterhouseCoopers LLP, an independent registered public accounting firm, as stated in their report which appears herein.
Changes in Internal Control over Financial Reporting. During the quarter ended December 31, 2016, there were no changes in our internal control over financial reporting that have materially affected, or are reasonably likely to materially affect, our internal control over financial reporting.
On February 23, 2017, we repriced our existing 2015 term loan with Deutsche Bank AG New York Branch, as administrative agent and collateral agent, and the lenders and financial institutions party thereto, pursuant to an amendment and extension of the term loan credit agreement providing for a $467.7 million senior secured term loan facility due 2024 (“2024 term loan”). This repricing reduces the interest rate by 0.75% and extends the maturity by 19 months to February 29, 2024.
The 2024 term loan bears interest based on either a eurodollar or base rate (a rate equal to the highest of an agreed commercially available benchmark rate, the federal funds effective rate plus 0.50% or the eurodollar rate plus 1.0%, as selected by the Company) plus, in each case, an applicable margin. The applicable margin in the 2024 term loan is (x) 3% in the case of Eurodollar rate loans and (y) 2% in the case of base rate loans. These rates represents a 0.75% reduction from the 2015 term loan.
77
Item 10. Directors, Executive Officers and Corporate Governance
The information required by this item appears in our definitive proxy statement for our annual meeting of stockholders to be held May 24, 2017 under the captions “Proposal 1 — Election of Directors,” “Continuing Directors,” “Information Regarding the Board and Its Committees,” “Corporate Governance,” “Section 16(a) Beneficial Ownership Reporting Compliance,” and “Executive Officers of the Registrant,” which information is incorporated herein by reference.
Code of Business Conduct and Ethics
Builders FirstSource, Inc. and its subsidiaries endeavor to do business according to the highest ethical and legal standards, complying with both the letter and spirit of the law. Our board of directors approved a Code of Business Conduct and Ethics that applies to our directors, officers (including our principal executive officer, principal financial officer and controller) and employees. Our Code of Business Conduct and Ethics is administered by a compliance committee made up of representatives from our legal, human resources, finance and internal audit departments.
Our employees are encouraged to report any suspected violations of laws, regulations and the Code of Business Conduct and Ethics, and all unethical business practices. We provide continuously monitored hotlines for anonymous reporting by employees.
Our board of directors has also approved a Supplemental Code of Ethics for the Chief Executive Officer, President, and Senior Financial Officers of Builders FirstSource, Inc., which is administered by our general counsel.
Both of these policies are listed as exhibits to this annual report on Form 10-K and can be found in the “investors” section of our corporate Web site at: www.bldr.com.
Stockholders may request a free copy of these policies by contacting the Corporate Secretary, Builders FirstSource, Inc., 2001 Bryan Street, Suite 1600, Dallas, Texas 75201, United States of America.
In addition, within four business days of:
|
|
• |
Any amendment to a provision of our Code of Business Conduct and Ethics or our Supplemental Code of Ethics for Chief Executive Officer, President and Senior Financial Officers of Builders FirstSource, Inc. that applies to our chief executive officer, our chief financial officer or controller; or |
|
|
• |
The grant of any waiver, including an implicit waiver, from a provision of one of these policies to one of these officers that relates to one or more of the items set forth in Item 406(b) of Regulation S-K. |
We will provide information regarding any such amendment or waiver (including the nature of any waiver, the name of the person to whom the waiver was granted and the date of the waiver) on our Web site at the Internet address above, and such information will be available on our Web site for at least a 12-month period. In addition, we will disclose any amendments and waivers to our Code of Business Conduct and Ethics or our Supplemental Code of Ethics for Chief Executive Officer, President and Senior Financial Officers of Builders FirstSource, Inc. as required by the listing standards of the NASDAQ Stock Market LLC.
Item 11. Executive Compensation
The information required by this item appears in our definitive proxy statement for our annual meeting of stockholders to be held May 24, 2017 under the captions “Executive Compensation and Other Information,” “Information Regarding the Board and its Committees — Compensation of Directors,” and “Compensation Committee Interlocks and Insider Participation,” which information is incorporated herein by reference.
Item 12. Security Ownership of Certain Beneficial Owners and Management and Related Stockholder Matters
The information required by this item appears in our definitive proxy statement for our annual meeting of stockholders to be held on May 24, 2017 under the caption “Ownership of Securities” and “Equity Compensation Plan Information,” which information is incorporated herein by reference.
78
Item 13. Certain Relationships and Related Transactions, and Director Independence
The information required by this item appears in our definitive proxy statement for our annual meeting of stockholders to be held May 24, 2017 under the caption “Election of Directors and Management Information,” “Information Regarding the Board and its Committees,” and “Certain Relationships and Related Party Transactions,” which information is incorporated herein by reference.
Item 14. Principal Accountant Fees and Services
The information required by this item appears in our definitive proxy statement for our annual meeting of stockholders to be held May 24, 2017 under the caption “Proposal 4 — Ratification of Selection of Independent Registered Public Accounting Firm — Fees Paid to PricewaterhouseCoopers LLP,” which information is incorporated herein by reference.
79
Item 15. Exhibits and Financial Statement Schedules
(a) (1) See the index to consolidated financial statements provided in Item 8 for a list of the financial statements filed as part of this report.
(2) Financial statement schedules are omitted because they are either not applicable or not material.
(3) The following documents are filed, furnished or incorporated by reference as exhibits to this report as required by Item 601 of Regulation S-K.
|
Exhibit Number |
|
Description |
|
|
|
|
|
3.1 |
|
Amended and Restated Certificate of Incorporation of Builders FirstSource, Inc. (incorporated by reference to Exhibit 3.1 to Amendment No. 4 to the Registration Statement of the Company on Form S-1, filed with the Securities and Exchange Commission on June 6, 2005, File Number 333-122788) |
|
3.2 |
|
Amended and Restated By-Laws of Builders FirstSource, Inc. (incorporated by reference to Exhibit 3.2 to the Company’s Current Report on Form 8-K, filed with the Securities and Exchange Commission on March 5, 2007, File Number 0-51357) |
|
4.1 |
|
Registration Rights Agreement, dated as of January 21, 2010, among Builders FirstSource, Inc., JLL Partners Fund V, L.P., and Warburg Pincus Private Equity IX, L.P. (incorporated by reference to Exhibit 10.2 to the Company’s Current Report on Form 8-K, filed with the Securities and Exchange Commission on January 22, 2010, File Number 0-51357) |
|
4.2 |
|
Indenture, dated as of July 31, 2015, among Builders FirstSource, Inc., the guarantors party thereto, and Wilmington Trust, National Association, as trustee (form of Note included therein) (incorporated by reference to Exhibit 4.1 to the Company’s Current Report on Form 8-K, filed with the Securities and Exchange Commission on August 6, 2015, File Number 0-51357) |
|
4.3 |
|
Supplemental Indenture to the Indenture dated as of July 31, 2015, dated as of July 31, 2015, among Builders FirstSource, Inc., the guarantors party thereto, and Wilmington Trust, National Association, as trustee (incorporated by reference to Exhibit 4.2 to the Company’s Current Report on Form 8-K, filed with the Securities and Exchange Commission on August 6, 2015, File Number 0-51357) |
|
4.4 |
|
Indenture, dated as of August 22, 2016, among Builders FirstSource, Inc., the guarantors party thereto, and Wilmington Trust, National Association, as trustee and notes collateral agent (form of Note included therein) (incorporated by reference to Exhibit 4.1 to the Company’s Current Report on Form 8-K, filed with the Securities and Exchange Commission on August 23, 2016, File Number 0-51357) |
|
10.1 |
|
Term Loan Credit Agreement, dated as of July 31, 2015, among Builders FirstSource, Inc., Deutsche Bank AG, New York Branch, as administrative agent and collateral agent, and the lenders and financial institutions party thereto (incorporated by reference to Exhibit 10.1 to the Company’s Current Report on Form 8-K, filed with the Securities Exchange Commission on August 6, 2015, File Number 0-51357) |
|
10.2 |
|
First Amendment to Credit Agreement, dated as of August 22, 2016, by and among Builders FirstSource, Inc., Deutsche Bank AG New York Branch, as administrative agent, and the lenders and financial institutions party thereto (incorporated by reference to Exhibit 10.2 to the Company’s Current Report on Form 8-K, filed with the Securities and Exchange Commission on August 23, 2016, File Number 0-51357) |
|
10.3* |
|
Second Amendment to Credit Facility, dated as of February 23, 2017, by and among Builders FirstSource, Inc., Deutsche Bank AG New York Branch, as administrative agent, and the lenders and financial institutions party thereto
|
|
10.4 |
|
Amended and Restated Senior Secured Revolving Credit Facility, dated as of July 31, 2015, among Builders FirstSource, Inc., SunTrust Bank, as administrative agent and collateral agent, and the lenders and financial institutions party thereto (incorporated by reference to Exhibit 10.2 to the Company’s Current Report on Form 8-K, filed with the Securities Exchange Commission on August 6, 2015, File Number 0-51357) |
80
|
Exhibit Number |
|
Description |
|
10.5 |
|
ABL/Bond Intercreditor Agreement, dated as of May 29, 2013, among Builders FirstSource, Inc. and certain of its subsidiaries, as grantors, SunTrust Bank, as ABL agent, and Wilmington Trust, National Association, as notes collateral agent (incorporated by reference to Exhibit 10.2 to the Company’s Current Report on Form 8-K, filed with the Securities Exchange Commission on June 3, 2013, File Number 0-51357) |
|
10.6 |
|
Collateral Agreement, dated as of July 31, 2015, among the Company, certain of its subsidiaries, and Deutsche Bank AG, New York Branch (incorporated by reference to Exhibit 10.4 to the Company’s Current Report on Form 8-K, filed with the Securities Exchange Commission on August 6, 2015, File Number 0-51357) |
|
10.7 |
|
Amended and Restated ABL Collateral Agreement, dated as of July 31, 2015, among the Company, certain of its subsidiaries, and SunTrust Bank (incorporated by reference to Exhibit 10.5 to the Company’s Current Report on Form 8-K, filed with the Securities Exchange Commission on August 6, 2015, File Number 0-51357) |
|
10.8 |
|
Notes Collateral Agreement, dated as of August 22, 2016, among Builders FirstSource, Inc., certain of its subsidiaries, and Wilmington Trust, National Association, as trustee (incorporated by reference to Exhibit 10.1 to the Company’s Current Report on Form 8-K, filed with the Securities and Exchange Commission on August 23, 2016, File Number 0-51357) |
|
10.9 |
|
Guarantee Agreement, dated as of July 31, 2015, among the guarantors party thereto and Deutsche Bank AG, New York Branch (incorporated by reference to Exhibit 10.6 to the Company’s Current Report on Form 8-K, filed with the Securities Exchange Commission on August 6, 2015, File Number 0-51357) |
|
10.10 |
|
Amended and Restated ABL Guarantee Agreement, dated as of July 31, 2015, among the Guarantors (as defined therein) and SunTrust Bank (incorporated by reference to Exhibit 10.7 to the Company’s Current Report on Form 8-K, filed with the Securities Exchange Commission on August 6, 2015, File Number 0-51357) |
|
10.11 |
|
Lease and Master Agreement Guaranty, dated as of July 31, 2015, by the Company in favor of LN Real Estate LLC (incorporated by reference to Exhibit 10.10 to the Company’s Quarterly Report on Form 10-Q for the quarter ended September 30, 2015, filed with the Securities and Exchange Commission on November 9, 2015, File Number 0-51357) |
|
10.12+ |
|
Builders FirstSource, Inc. 1998 Stock Incentive Plan, as amended, effective March 1, 2004 (incorporated by reference to Exhibit 10.4 to Amendment No. 1 to the Registration Statement of the Company on Form S-1, filed with the Securities and Exchange Commission on April 27, 2005, File Number 333-122788) |
|
10.13+ |
|
Amendment No. 7 to the Builders FirstSource, Inc. 1998 Stock Incentive Plan (incorporated by reference to Exhibit 10.6 to the Company’s Annual Report on Form 10-K for the year ended December 31, 2006, filed with the Securities and Exchange Commission on March 12, 2007, File Number 0-51357) |
|
10.14+ |
|
2004 Form of Builders FirstSource, Inc. 1998 Stock Incentive Plan Nonqualified Stock Option Agreement (incorporated by reference to Exhibit 10.5 to Amendment No. 1 to the Registration Statement of the Company on Form S-1, filed with the Securities and Exchange Commission on April 27, 2005, File Number 333-122788) |
|
10.15+ |
|
Builders FirstSource, Inc. 2005 Equity Incentive Plan (incorporated by reference to Exhibit 10.14 to Amendment No. 4 to the Registration Statement of the Company on Form S-1, filed with the Securities and Exchange Commission on June 6, 2005, File Number 333-122788) |
|
10.16+ |
|
2006 Form of Builders FirstSource, Inc. 2005 Equity Incentive Plan Nonqualified Stock Option Agreement (incorporated by reference to Exhibit 99.1 to the Company’s Current Report on Form 8-K, filed with the Securities and Exchange Commission on February 17, 2006, File Number 0-51357) |
|
10.17+ |
|
2007 Form of Builders FirstSource, Inc. 2005 Equity Incentive Plan Nonqualified Stock Option Agreement for Employee Directors (incorporated by reference to Exhibit 10.1 to the Company’s Current Report on Form 8-K, filed with the Securities and Exchange Commission on March 5, 2007, File Number 0-51357) |
|
10.18+ |
|
Builders FirstSource, Inc. 2007 Incentive Plan (incorporated by reference to Annex D of the Company’s Definitive Proxy Statement on Schedule 14A, filed with the Securities and Exchange Commission on December 15, 2009, File Number 0-51357) |
|
10.19+ |
|
2008 Form of Builders FirstSource, Inc. 2007 Incentive Plan Nonqualified Stock Option Agreement (incorporated by reference to Exhibit 10.1 to the Company’s Quarterly Report on Form 10-Q for the quarter ended March 31, 2008, filed with the Securities and Exchange Commission on May 1, 2008, File Number 0-51357) |
81
|
Exhibit Number |
|
Description |
|
10.20+ |
|
2008 Form of Builders FirstSource, Inc. 2007 Incentive Plan Restricted Stock Award Agreement (incorporated by reference to Exhibit 10.2 to the Company’s Quarterly Report on Form 10-Q for the quarter ended March 31, 2008, filed with the Securities and Exchange Commission on May 1, 2008, File Number 0-51357) |
|
10.21+ |
|
2010 Form of Builders FirstSource, Inc. 2007 Incentive Plan Nonqualified Stock Option Agreement for Employee Directors (incorporated by reference to Exhibit 10.21 to the Company’s Annual Report on Form 10-K for the year ended December 31, 2009, filed with the Securities and Exchange Commission on March 4, 2010, File Number 0-51357) |
|
10.22+ |
|
2014 Form of Builders FirstSource, Inc. 2007 Incentive Plan Restricted Stock Unit Award Certificate (incorporated by reference to Exhibit 10.2 to the Company’s Quarterly Report on Form 10-Q for the quarter ended June 30, 2014, filed with the Securities and Exchange Commission on August 1, 2014, File Number 0-51357) |
|
10.23+ |
|
2014 Form of Builders FirstSource, Inc. 2007 Incentive Plan Director Restricted Stock Unit Award Certificate (incorporated by reference to Exhibit 10.1 to the Company’s Quarterly Report on Form 10-Q for the quarter ended September 30, 2014, filed with the Securities and Exchange Commission on November 5, 2014, File Number 0-51357) |
|
10.24+ |
|
Builders FirstSource, Inc. 2014 Incentive Plan (incorporated herein by reference to Appendix A of the Company’s Definitive Proxy Statement on Schedule 14A, filed with the Securities and Exchange Commission on April 11, 2014, File Number 0-51357) |
|
10.25+ |
|
Amendment to the Builders FirstSource, Inc. 2014 Incentive Plan (incorporated by reference to Appendix A of the Company’s Definitive Proxy Statement on Schedule 14A, filed with the Securities and Exchange Commission on April 14, 2016, File Number 0-51357) |
|
10.26+ |
|
2014 Form of Builders FirstSource, Inc. 2014 Incentive Plan Restricted Stock Unit Award Certificate (incorporated by reference to Exhibit 10.3 to the Company’s Quarterly Report on Form 10-Q for the quarter ended June 30, 2014, filed with the Securities and Exchange Commission on August 1, 2014, File Number 0-51357) |
|
10.27+ |
|
2015 Form of Builders FirstSource, Inc. 2014 Incentive Plan Non-Statutory Stock Option Award Certificate (incorporated by reference to Exhibit 10.22 to the Company’s Annual Report on Form 10-K for the year ended December 31, 2014, filed with the Securities and Exchange Commission on March 3, 2015, File Number 0-51357) |
|
10.28+ |
|
2016 Form of Builders FirstSource, Inc. 2014 Incentive Plan Restricted Stock Unit Award Certificate (incorporated by reference to Exhibit 10.2 to the Company’s Quarterly Report on Form 10-Q for the quarter ended March 31, 2016, filed with the Securities and Exchange Commission on May 6, 2016, File Number 0-51357) |
|
10.29*+ |
|
Builders FirstSource, Inc. Amended and Restated Director Compensation Policy |
|
10.30+ |
|
Builders FirstSource, Inc. Form of Director Indemnification Agreement (incorporated by reference to Exhibit 10.13 to Amendment No. 3 to the Registration Statement of the Company on Form S-1, filed with the Securities and Exchange Commission on May 26, 2005, File Number 333-122788) |
|
10.31+ |
|
Employment Agreement, dated September 1, 2001, between Builders FirstSource, Inc. and Floyd F. Sherman (incorporated by reference to Exhibit 10.9 to Amendment No. 1 to the Registration Statement of the Company on Form S-1, filed with the Securities and Exchange Commission on April 27, 2005, File Number 333-122788) |
|
10.32+ |
|
Amendment to Employment Agreement, dated June 1, 2005, between Builders FirstSource, Inc. and Floyd F. Sherman (incorporated by reference to Exhibit 10.15 to Amendment No. 4 to the Registration Statement of the Company on Form S-1, filed with the Securities and Exchange Commission on June 6, 2005, File Number 333-122788) |
|
10.33+ |
|
Second Amendment to Employment Agreement, dated October 29, 2008, between Builders FirstSource, Inc. and Floyd F. Sherman (incorporated by reference to Exhibit 10.27 to the Company’s Annual Report on Form 10-K for the year ended December 31, 2008, filed with the Securities and Exchange Commission on March 2, 2009, File Number 0-51357) |
|
10.34+ |
|
Employment Agreement, dated February 23, 2010, between Builders FirstSource, Inc. and M. Chad Crow (incorporated by reference to Exhibit 10.1 to the Company’s Current Report on Form 8-K, filed with the Securities and Exchange Commission on February 26, 2010, File Number 0-51357) |
|
10.35+ |
|
Employment Agreement, dated January 15, 2004, between Builders FirstSource, Inc. and Morris E. Tolly (incorporated by reference to Exhibit 10.22 to the Company’s Annual Report on Form 10-K for the year ended December 31, 2007, filed with the Securities and Exchange Commission on March 5, 2008, File Number 0-51357) |
82
|
Exhibit Number |
|
Description |
|
10.36+ |
|
Amendment to Employment Agreement, dated October 29, 2008, between Builders FirstSource, Inc. and Morris E. Tolly (incorporated by reference to Exhibit 10.31 to the Company’s Annual Report on Form 10-K for the year ended December 31, 2008, filed with the Securities and Exchange Commission on March 2, 2009, File Number 0-51357) |
|
10.37+ |
|
Employment Agreement, dated January 15, 2004, between Builders FirstSource, Inc. and Donald F. McAleenan (incorporated by reference to Exhibit 10.3 to the Company’s Quarterly Report on Form 10-Q for the quarter ended September 30, 2005, filed with the Securities Exchange Commission on November 2, 2005, File Number 0-51357) |
|
10.38+ |
|
Amendment to Employment Agreement, dated October 29, 2008, between Builders FirstSource, Inc. and Donald F. McAleenan (incorporated by reference to Exhibit 10.33 to the Company’s Annual Report on Form 10-K for the year ended December 31, 2008, filed with the Securities and Exchange Commission on March 2, 2009, File Number 0-51357) |
|
10.39*+ |
|
Employment Agreement, dated November 14, 2014, between Builders FirstSource, Inc. and Peter M. Jackson |
|
14.1 |
|
Builders FirstSource, Inc. Code of Business Conduct and Ethics (incorporated by reference to Exhibit 14.1 to the Company’s Annual Report on Form 10-K for the year ended December 31, 2005, filed with the Securities and Exchange Commission on March 13, 2006, File Number 0-51357) |
|
14.2 |
|
Builders FirstSource, Inc. Supplemental Code of Ethics (incorporated by reference to Exhibit 14.2 to the Company’s Annual Report on Form 10-K for the year ended December 31, 2005, filed with the Securities and Exchange Commission on March 13, 2006, File Number 0-51357) |
|
21.1 |
|
Subsidiaries of the Registrant (incorporated by reference to Exhibit 21.1 to the Company’s Annual Report on Form 10-K for the year ended December 31, 2015, filed with the Securities and Exchange Commission on March 11, 2016, File Number 0-51357) |
|
23.1* |
|
Consent of PricewaterhouseCoopers LLP, Independent Registered Public Accounting Firm |
|
24.1* |
|
Power of Attorney (included as part of signature page) |
|
31.1* |
|
Certification of Chief Executive Officer pursuant to 17 CFR 240.13a-14(a), as adopted pursuant to Section 302 of the Sarbanes-Oxley Act of 2002, signed by Floyd F. Sherman as Chief Executive Officer |
|
31.2* |
|
Certification of Chief Financial Officer pursuant to 17 CFR 240.13a-14(a), as adopted pursuant to Section 302 of the Sarbanes-Oxley Act of 2002, signed by Peter M. Jackson as Chief Financial Officer |
|
32.1** |
|
Certification of Chief Executive Officer and Chief Financial Officer pursuant to 18 U.S.C. Section 1350, as adopted pursuant to Section 906 of the Sarbanes-Oxley Act of 2002, signed by Floyd F. Sherman as Chief Executive Officer and Peter M. Jackson as Chief Financial Officer |
|
101* |
|
The following financial information from Builders FirstSource, Inc.’s Form 10-K filed on March 1, 2017, formatted in eXtensible Business Reporting Language (“XBRL”): (i) Consolidated Statements of Operations and Comprehensive Income (Loss) for the years ended December 31, 2016, 2015, and 2014, (ii) Consolidated Balance Sheets at December 31, 2016 and 2015, (iii) Consolidated Statements of Cash Flows for the years ended December 31, 2016, 2015, and 2014, (iv) Consolidated Statements of Changes in Stockholders’ Equity for the years ended December 31, 2016, 2015, and 2014, and (v) the Notes to Consolidated Financial Statements. |
|
* |
Filed herewith |
|
** |
Builders FirstSource, Inc. is furnishing, but not filing, the written statement pursuant to Title 18 United States Code 1350, as added by Section 906 of the Sarbanes-Oxley Act of 2002, of Floyd F. Sherman, our Chief Executive Officer, and Peter M. Jackson, our Chief Financial Officer. |
|
+ |
Indicates a management contract or compensatory plan or arrangement |
(b) A list of exhibits filed, furnished or incorporated by reference with this Form 10-K is provided above under Item 15(a)(3) of this report. Builders FirstSource, Inc. will furnish a copy of any exhibit listed above to any stockholder without charge upon written request to Donald F. McAleenan, Senior Vice President and General Counsel, 2001 Bryan Street, Suite 1600, Dallas, Texas 75201.
(c) Not applicable
83
None.
84
Pursuant to the requirements of Section 13 or 15(d) of the Securities Exchange Act of 1934, the registrant has duly caused this report to be signed on its behalf by the undersigned, thereunto duly authorized.
March 1, 2017
|
BUILDERS FIRSTSOURCE, INC. |
|
|
|
/s/ FLOYD F. SHERMAN |
|
Floyd F. Sherman |
|
Chief Executive Officer |
|
(Principal Executive Officer) |
The undersigned hereby constitute and appoint Donald F. McAleenan and his substitutes our true and lawful attorneys-in-fact with full power to execute in our name and behalf in the capacities indicated below any and all amendments to this report and to file the same, with all exhibits thereto and other documents in connection therewith, with the Securities and Exchange Commission, and hereby ratify and confirm all that such attorney-in-fact or his substitutes shall lawfully do or cause to be done by virtue thereof.
Pursuant to the requirements of the Securities Exchange Act of 1934, this report has been signed below by the following persons on behalf of the registrant and in the capacities and on the dates indicated.
|
Signature |
|
Title |
|
Date |
|
|
|
|
||
|
/s/ FLOYD F. SHERMAN |
|
Chief Executive Officer and Director |
|
March 1, 2017 |
|
Floyd F. Sherman |
|
(Principal Executive Officer) |
|
|
|
|
|
|
||
|
/s/ PETER M. JACKSON |
|
Senior Vice President and Chief Financial Officer |
|
March 1, 2017 |
|
Peter M. Jackson |
|
(Principal Financial Officer) |
|
|
|
|
|
|
||
|
/s/ JAMI COULTER |
|
Vice President and Chief Accounting Officer |
|
March 1, 2017 |
|
Jami Coulter |
|
(Principal Accounting Officer) |
|
|
|
|
|
|
||
|
/s/ PAUL S. LEVY |
|
Chairman and Director |
|
March 1, 2017 |
|
Paul S. Levy |
|
|
|
|
|
|
|
|
||
|
/s/ CLEVELAND A. CHRISTOPHE |
|
Director |
|
March 1, 2017 |
|
Cleveland A. Christophe |
|
|
|
|
|
|
|
|
||
|
/s/ DANIEL AGROSKIN |
|
Director |
|
March 1, 2017 |
|
Daniel Agroskin |
|
|
|
|
|
|
|
|
||
|
/s/ ROBERT C. GRIFFIN |
|
Director |
|
March 1, 2017 |
|
Robert C. Griffin |
|
|
|
|
|
|
|
|
||
|
/s/ KEVIN J. KRUSE |
|
Director |
|
March 1, 2017 |
|
Kevin J. Kruse |
|
|
|
|
|
|
|
|
||
|
/s/ BRETT N. MILGRIM |
|
Director |
|
March 1, 2017 |
|
Brett N. Milgrim |
|
|
|
|
|
|
|
|
||
|
/s/ CRAIG A. STEINKE |
|
Director |
|
March 1, 2017 |
|
Craig A. Steinke |
|
|
|
|
85