Attached files
| file | filename |
|---|---|
| EX-10.39 - EXHIBIT 10.39 - WEST PHARMACEUTICAL SERVICES INC | ex1039distributoragreement.htm |
| EX-32.2 - EXHIBIT 32.2 - WEST PHARMACEUTICAL SERVICES INC | ex322cfo906certification_2.htm |
| EX-32.1 - EXHIBIT 32.1 - WEST PHARMACEUTICAL SERVICES INC | ex321ceo906certification_2.htm |
| EX-31.2 - EXHIBIT 31.2 - WEST PHARMACEUTICAL SERVICES INC | ex312cfo302certification_2.htm |
| EX-31.1 - EXHIBIT 31.1 - WEST PHARMACEUTICAL SERVICES INC | ex311ceo302certification_2.htm |
| EX-23 - EXHIBIT 23 - WEST PHARMACEUTICAL SERVICES INC | ex23consent_2016.htm |
| EX-21 - EXHIBIT 21 - WEST PHARMACEUTICAL SERVICES INC | ex21listofsubsidiaries_2016.htm |
| EX-10.40 - EXHIBIT 10.40 - WEST PHARMACEUTICAL SERVICES INC | ex1040licenseagreement_2016.htm |
UNITED STATES |
SECURITIES AND EXCHANGE COMMISSION |
Washington, D.C. 20549 |
FORM 10-K |
(Mark One)
þ | ANNUAL REPORT PURSUANT TO SECTION 13 OR 15 (d) OF THE SECURITIES EXCHANGE ACT OF 1934 |
For the fiscal year ended December 31, 2016
or
¨ | TRANSITION REPORT PURSUANT TO SECTION 13 OR 15 (d) OF THE SECURITIES EXCHANGE ACT OF 1934 |
For the transition period from to
Commission File Number 1-8036
WEST PHARMACEUTICAL SERVICES, INC. (Exact name of registrant as specified in its charter) |
Pennsylvania | 23-1210010 |
(State or other jurisdiction of incorporation or organization) | (I.R.S. Employer Identification Number) |
530 Herman O. West Drive, Exton, PA | 19341-0645 |
(Address of principal executive offices) | (Zip Code) |
Registrant’s telephone number, including area code: 610-594-2900
Securities registered pursuant to Section 12(b) of the Act:
Title of each class | Name of each exchange on which registered |
Common Stock, par value $.25 per share | New York Stock Exchange |
Securities registered pursuant to Section 12 (g) of the Act: None
Indicate by check mark if the registrant is a well-known seasoned issuer, as defined in Rule 405 of the Securities Act. Yes þ No o
Indicate by check mark if the registrant is not required to file reports pursuant to Section 13 or Section 15(d) of the Act. Yes o No þ
Indicate by check mark whether the registrant (1) has filed all reports required to be filed by Section 13 or 15 (d) of the Securities Exchange Act of 1934 during the preceding 12 months (or for such shorter period that the registrant was required to file such reports), and (2) has been subject to such filing requirements for the past 90 days. Yes þ No o
Indicate by check mark whether the registrant has submitted electronically and posted on its corporate Web site, if any, every Interactive Data File required to be submitted and posted pursuant to Rule 405 of Regulation S-T during the preceding 12 months (or for such shorter period that the registrant was required to submit and post such files). Yes þ No o
Indicate by check mark if disclosure of delinquent filers pursuant to Item 405 of Regulation S-K is not contained herein, and will not be contained, to the best of registrant's knowledge, in definitive proxy or information statements incorporated by reference in Part III of this Form 10-K or any amendment to this Form 10-K. o
Indicate by check mark whether the registrant is a large accelerated filer, an accelerated filer, a non-accelerated filer, or a smaller reporting company. See the definitions of “large accelerated filer,” “accelerated filer” and “smaller reporting company” in Rule 12b-2 of the Exchange Act.
Large accelerated filer | þ | Accelerated filer | o | |
Non-accelerated filer | o | (Do not check if a smaller reporting company) | Smaller reporting company | o |
Indicate by check mark whether the registrant is a shell company (as defined in Rule 12b-2 of the Exchange Act). Yes o No þ
The aggregate market value of the voting stock held by non-affiliates of the registrant as of June 30, 2016 was approximately $5,555,781,688 based on the closing price as reported on the New York Stock Exchange.
As of January 31, 2017, there were 73,260,436 shares of the registrant's common stock outstanding.
DOCUMENTS INCORPORATED BY REFERENCE
Document | Parts Into Which Incorporated |
Proxy Statement for the Annual Meeting of Shareholders to be held May 2, 2017 | Part III |
TABLE OF CONTENTS
Page | ||
BUSINESS | ||
RISK FACTORS | ||
UNRESOLVED STAFF COMMENTS | ||
PROPERTIES | ||
LEGAL PROCEEDINGS | ||
MINE SAFETY DISCLOSURES | ||
MARKET FOR REGISTRANT'S COMMON EQUITY, RELATED STOCKHOLDER MATTERS AND ISSUER PURCHASES OF EQUITY SECURITIES | ||
SELECTED FINANCIAL DATA | ||
MANAGEMENT'S DISCUSSION AND ANALYSIS OF FINANCIAL CONDITION AND RESULTS OF OPERATIONS | ||
QUANTITATIVE AND QUALITATIVE DISCLOSURES ABOUT MARKET RISK | ||
FINANCIAL STATEMENTS AND SUPPLEMENTARY DATA | ||
CHANGES IN AND DISAGREEMENTS WITH ACCOUNTANTS ON ACCOUNTING AND FINANCIAL DISCLOSURE | ||
CONTROLS AND PROCEDURES | ||
OTHER INFORMATION | ||
DIRECTORS, EXECUTIVE OFFICERS AND CORPORATE GOVERNANCE | ||
EXECUTIVE COMPENSATION | ||
SECURITY OWNERSHIP OF CERTAIN BENEFICIAL OWNERS AND MANAGEMENT AND RELATED STOCKHOLDER MATTERS | ||
CERTAIN RELATIONSHIPS AND RELATED TRANSACTIONS, AND DIRECTOR INDEPENDENCE | ||
PRINCIPAL ACCOUNTING FEES AND SERVICES | ||
EXHIBITS, FINANCIAL STATEMENT SCHEDULES | ||
2
PART I
ITEM 1. BUSINESS
General
West Pharmaceutical Services, Inc. and its majority-owned subsidiaries (which may be referred to as “West”, the “Company”, “we”, “us”, or “our”) is a manufacturer of packaging components and delivery systems for injectable drugs and healthcare products. Our products include vial containment solutions, prefillable systems, self-injection platforms, cartridge systems and components, reconstitution and transfer systems, intradermal delivery solutions, specialty components, and contract manufacturing and analytical services. Our customers include the leading biologic, generic, pharmaceutical, diagnostic, and medical device companies in the world. The Company was incorporated under the laws of the Commonwealth of Pennsylvania on July 27, 1923.
All trademarks and registered trademarks used in this report are the property of West, either directly or indirectly through its subsidiaries unless noted otherwise. Daikyo Crystal Zenith® (“CZ”) is a registered trademark of Daikyo Seiko, Ltd. (“Daikyo”).
Throughout this report, references to “Notes” refer to the Notes to Consolidated Financial Statements included in Part II, Item 8 of this Annual Report on Form 10-K (“Form 10-K”), unless otherwise indicated.
West Website
We maintain a website at www.westpharma.com. Our Form 10-K, Quarterly Reports on Form 10-Q, Current Reports on Form 8-K and amendments to those reports filed or furnished pursuant to Section 13(a) or 15(d) of the Securities Exchange Act of 1934 are available on our website under the Investors - SEC Filings caption as soon as reasonably practical after we electronically file the material with, or furnish it to, the U.S. Securities and Exchange Commission (“SEC”). These filings are also available to the public over the Internet at the SEC's website at www.sec.gov. You may also read and copy any document we file at the SEC's Public Reference Room at 100 F. Street, N.E., Washington, D.C. 20549. Please call the SEC at 1-800-SEC-0330 for further information on the Public Reference Room.
Throughout this Form 10-K, we incorporate by reference certain information from parts of other documents filed with the SEC and from our Proxy Statement for the 2017 Annual Meeting of Shareholders (“2017 Proxy Statement”), which will be filed with the SEC within 120 days following the end of our 2016 fiscal year. Our 2017 Proxy Statement will be available on our website on or about March 31, 2017, under the caption Investors - Annual Reports & Proxy.
Information about our corporate governance, including our Corporate Governance Principles and Code of Business Conduct, as well as information about our Directors, Board Committees, Committee Charters, and instructions on how to contact the Board, is available on our website under the Investors - Corporate Governance heading. We intend to make any required disclosures regarding any amendments of our Code of Business Conduct or waivers granted to any of our directors or executive officers under the caption Code of Business Conduct on our website. Information relating to the West Pharmaceutical Services Dividend Reinvestment Plan is also available on our website under the Investors - Transfer Agent/Dividend Reinvestment caption.
We will provide any of the foregoing information without charge upon written request to our Corporate Secretary, West Pharmaceutical Services, Inc., 530 Herman O. West Drive, Exton, PA 19341.
Business Segments
In 2015, our business operations consisted of two reportable segments, the Pharmaceutical Packaging Systems segment (“Packaging Systems”) and the Pharmaceutical Delivery Systems segment (“Delivery Systems”). Beginning in 2016, we changed our organization and reporting structure for our next phase of growth and
3
development, which resulted in a change to Proprietary Products and Contract-Manufactured Products as our reportable segments.
Segment results presented in the accompanying consolidated financial statements and related notes have been retroactively adjusted to reflect the impact of this change. Please refer to Note 17, Segment Information, for additional details.
Proprietary Products Segment
Our Proprietary Products reportable segment, which is a combination of the previous Packaging Systems segment and the proprietary products portion of the previous Delivery Systems segment, develops commercial, operational, and innovation strategies across our global network, with specific emphasis on product offerings to biologic, generic, and pharmaceutical drug customers.
Proprietary Products offers proprietary packaging, containment and drug delivery products. The packaging products include stoppers and seals for injectable packaging systems, which are designed to help ensure drug compatibility and stability, while also supporting operational efficiency. Proprietary Products also offers syringe and cartridge components, including custom solutions for the specific needs of injectable drug applications, as well as administration systems that can enhance the safe delivery of drugs through advanced reconstitution, mixing and transfer technologies.
In 2016, we announced the availability of the 1-3mL NovaPure® plunger, an innovative, high-quality component for pre-filled delivery systems, designed to reduce particulates, ensure consistency of delivery and fit the changing needs of higher-volume injectable drug delivery systems. This new offering adds to our current portfolio of NovaPure products, which includes the 1mL long NovaPure plunger and 13mm and 20mm NovaPure lyo and serum stoppers. Our NovaPure plungers are designed and manufactured using scientific, risk-mitigating Quality by Design principles to ensure dimensional control and consistency, sub-visible and visible particulate control, and low parts per million defect attributes.
We also offer drug containment solutions, including CZ vials, syringes and cartridges, which can provide a high-quality solution to glass incompatibility issues and can stand up to cold storage environments, while reducing the risk of breakage that exists with glass. It is an integrated life-cycle solution that is designed to maintain drug safety, purity and efficacy.
In addition, we offer a variety of self-injection systems, which are innovative, patient-centric technologies that are easy to use and can be combined with connected health technologies that have the potential to increase adherence.
The development of our SmartDose® technology platform continues to gain momentum in the marketplace, as the U.S. Food and Drug Administration (“FDA”) approved the first combination product that incorporates our SmartDose technology for use in the U.S. in July 2016, and several other active development programs are in place. This technology platform is designed for controlled, subcutaneous delivery of high volume and high viscosity drugs, and the device incorporates prefillable CZ cartridges. The technology platform is fully programmable, has a single push-button operation and a hidden needle for safety.
Analytical Lab Services completes the product offerings in Proprietary Products. This group provides specialized testing for drug packaging, devices and administration systems.
The growth strategy for Proprietary Products includes organic growth through market segmentation, new-product innovation, strategic acquisitions and geographic expansion. Proprietary Products has manufacturing facilities in North and South America, Europe and Asia Pacific, with affiliated companies in Mexico and Japan. See Item 2, Properties, for additional information on our manufacturing and other sites.
See Note 17, Segment Information, for net sales and asset information for Proprietary Products.
4
Contract-Manufactured Products Segment
Our Contract-Manufactured Products reportable segment, which consists of the contract manufacturing portion of the previous Delivery Systems segment, serves as a fully integrated business focused on the design, manufacture, and automated assembly of complex devices, primarily for pharmaceutical, diagnostic, and medical device customers.
Contract-Manufactured Products includes a variety of custom contract-manufacturing and assembly solutions, which use such technologies as multi-component molding, in-mold labeling, ultrasonic welding and clean room molding and device assembly. We manufacture customer-owned components and devices used in surgical, diagnostic, ophthalmic, injectable, and other drug delivery systems, as well as consumer products.
Contract-Manufactured Products has expertise in product design and development, including in-house mold design, an engineering center for developmental and prototype tooling, process design and validation and high-speed automated assemblies. Contract-Manufactured Products has manufacturing operations in North America and Europe. See Item 2, Properties, for additional information on our manufacturing and other sites.
See Note 17, Segment Information, for net sales and asset information for Contract-Manufactured Products.
International
We have significant operations outside of the United States (“U.S.”), which are managed through the same business segments as our U.S. operations – Proprietary Products and Contract-Manufactured Products. Sales outside of the U.S. accounted for 51.1% of consolidated net sales in 2016. For a geographic breakdown of sales, see Note 17, Segment Information.
Although the general business processes are similar to the domestic business, international operations are exposed to additional risks. These risks include currency fluctuations relative to the U.S. Dollar (“USD”), multiple tax jurisdictions and, particularly in South America and Israel, political and social issues that could destabilize local markets and affect the demand for our products.
See further discussion of our international operations, the risks associated with our international operations, and our attempt to minimize some of these risks in Part I, Item 1A, Risk Factors; Part II, Item 7, Management's Discussion and Analysis of Financial Condition and Results of Operations under the caption Financial Condition, Liquidity and Capital Resources; Part II, Item 7A, Quantitative and Qualitative Disclosures About Market Risk; Note 1 under the captions Financial Instruments and Foreign Currency Translation; and Note 9, Derivative Financial Instruments.
Raw Materials
We use three basic raw materials in the manufacture of our products: elastomers, aluminum and plastic. Elastomers include both natural and synthetic materials. We currently have access to adequate supplies of these raw materials to meet our production needs through agreements with suppliers.
We employ a supply chain management strategy in our business segments, which involves purchasing from integrated suppliers that control their own sources of supply. Due to regulatory control over our production processes, and the cost and time involved in qualifying suppliers, we rely on single-source suppliers for many critical raw materials. We purchase certain raw materials in the open market. This strategy increases the risk that our supply chain may be interrupted in the event of a supplier production problem. These risks are managed, where possible, by selecting suppliers with multiple manufacturing sites, rigorous quality control systems, surplus inventory levels and other methods of maintaining supply in case of an interruption in production.
5
Intellectual Property
Intellectual property, including patents, trade secrets and know-how, is important to our business. We own or license intellectual property rights, including issued patents and pending patent applications in the U.S. and in other countries that relate to various aspects of our products. Some key value-added and proprietary products and processes are licensed from Daikyo. Our intellectual property rights have been useful in establishing our market position and in the growth of our business, and are expected to continue to be of value in the future.
Seasonality
Although our Proprietary Products business is not inherently seasonal, sales and operating profit in the second half of the year are typically lower than the first half primarily due to scheduled plant shutdowns in conjunction with our customers' production schedules and the year-end impact of holidays on production. This can vary from year-to-year, depending upon customer inventory management programs and customer product launches.
Our Contract-Manufactured Products business is not inherently seasonal.
Working Capital
We are required to carry significant amounts of inventory to meet customer requirements. In addition, some of our supply agreements require us to purchase inventory in bulk orders, which increases inventory levels but decreases the risk of supply interruption. Levels of inventory are also influenced by the seasonal patterns addressed above. For a more detailed discussion of working capital, please refer to the discussion in Part II, Item 7, Management's Discussion and Analysis of Financial Condition and Results of Operations under the caption Financial Condition, Liquidity and Capital Resources.
Marketing
Our Proprietary Products customers include most of the major biologic, generic, and pharmaceutical drug companies in the world, which incorporate our components and other offerings into their products for distribution to the ultimate end-user.
Our Contract-Manufactured Products customers include many of the world's largest pharmaceutical, diagnostic, and medical device companies. Contract-Manufactured Products components generally are incorporated into our customers' manufacturing lines for further processing or assembly.
Our products and services are distributed primarily through our own sales force and distribution network, with limited use of contract sales agents and regional distributors.
Our ten largest customers accounted for 36.8% of our consolidated net sales in 2016, but none of these customers individually accounted for more than 10% of net sales. See Note 17, Segment Information, for information on sales by significant product group.
Order Backlog
Order backlog includes firm orders placed by customers for manufacture over a period of time according to their schedule or upon confirmation by the customer. We also have contractual arrangements with a number of our customers. Products covered by these contracts are included in our backlog only as orders are received. Order backlog may be positively or negatively impacted by several factors, including customer ordering patterns and the necessary lead-time to deliver customer orders. Order backlog is one of many measures we use to understand future demand, and should not be considered in isolation to predict future sales growth.
At December 31, 2016 and 2015, the order backlog for Proprietary Products was $373.3 million and $413.2 million, respectively. The decrease in backlog primarily reflects a return to normal levels and an unfavorable foreign currency impact. In 2015, we had orders being placed further in advance by certain customers, some as much as
6
several quarters, while others focused more on short-term stock-building. The majority of the order backlog for Proprietary Products at December 31, 2016 is expected to be filled during 2017.
The majority of Contract-Manufactured Products manufacturing activity is governed by contractual volume expectations, with terms between one and three years, subject to periodic revisions based on customer requirements.
Competition
We compete with several companies across our Proprietary Products product lines. Due to the special nature of our pharmaceutical packaging components and our long-standing participation in the market, competition for these components is based primarily on product design and performance, although total cost is becoming increasingly important as pharmaceutical companies continue with aggressive cost-control programs across their operations.
In addition, there is a small number of competitors supplying medical devices and medical device components. We compete in this market on the basis of our reputation for quality and reliability in engineering and project management, as well as our knowledge of, and experience in, compliance with regulatory requirements.
We also have specialized knowledge of container closure components, which is integral to developing delivery systems. With our range of proprietary technologies, we compete with new and established companies in the area of drug delivery devices, including suppliers of prefillable syringes, auto-injectors, safety needles and other proprietary systems.
We differentiate ourselves from our competition by being an integrated drug containment and delivery systems global supplier that can provide pre-approval primary packaging support and engineering development, analytical services, regulatory expertise and after-sale technical support. Customers also appreciate the global scope of our manufacturing capability and our ability to produce many products at multiple sites.
Our Contract-Manufactured Products business operates in very competitive markets for its products. The competition varies from smaller regional companies to large global molders. Given the cost pressures they face, many of our customers look off-shore to reduce cost. We differentiate ourselves by leveraging our global capability and by employing new technologies such as high-speed automated assembly, insert-molding, multi-shot molding and expertise with multiple-piece closure systems.
Research and Development Activities
We maintain our own research-scale production facilities and laboratories for developing new products, and offer contract engineering design and development services to assist customers with new product development. Our quality control, regulatory and laboratory testing capabilities are used to ensure compliance with applicable manufacturing and regulatory standards for primary and secondary pharmaceutical packaging components and delivery systems. The engineering departments are responsible for product and tooling design and testing, and for the design and construction of processing equipment. We continue to seek new innovative opportunities for acquisition, licensing, partnering or development of products, services and technologies that serve the injectable drug containment and delivery market. Research and development spending will continue to increase as we pursue innovative strategic platforms in prefillable syringes, injectable containers, advanced injection and safety and administration systems.
Commercial development of our new products and services for medical and pharmaceutical applications commonly requires several years. New products that we develop may require separate approval as medical devices, and products that are intended to be used in the packaging and delivery of pharmaceutical products are subject to both customer acceptance of our products and regulatory approval of the customer's products following our development period.
We spent $36.8 million in 2016, $34.1 million in 2015, and $37.3 million in 2014 on research and development, all of which related to Proprietary Products.
7
Environmental Regulations
We are subject to various federal, state and local provisions regulating the discharge of materials into the environment or otherwise relating to the protection of the environment. Our compliance with these laws and regulations has not had a material impact on our financial position, results of operations or cash flows. There were no material capital expenditures for environmental control facilities in 2016 and there are no material expenditures planned for such purposes in 2017.
Employees
As of December 31, 2016, we employed approximately 7,300 people in our operations throughout the world, including approximately 7,100 full-time employees.
ITEM 1A. RISK FACTORS
The statements in this section describe major risks to our business and should be considered carefully. In addition, these statements constitute our cautionary statements under the Private Securities Litigation Reform Act of 1995.
Our disclosure and analysis in this Form 10-K contains some forward-looking statements that are based on management's beliefs and assumptions, current expectations, estimates and forecasts. We also provide forward-looking statements in other materials we release to the public as well as oral forward-looking statements. Such statements give our current expectations or forecasts of future events. They do not relate strictly to historical or current facts. We have attempted, wherever possible, to identify forward-looking statements by using words such as “estimate,” “expect,” “intend,” “believe,” “plan,” “anticipate” and other words and terms of similar meaning. In particular, these include statements relating to future actions, business plans and prospects, new products, future performance or results of current or anticipated products, sales efforts, expenses, interest rates, foreign-exchange rates, economic effects, the outcome of contingencies, such as legal proceedings, and financial results.
Many of the factors that will determine our future results are beyond our ability to control or predict. Achievement of future results is subject to known or unknown risks or uncertainties, and therefore, actual results could differ materially from past results and those expressed or implied in any forward-looking statement. You should bear this in mind as you consider forward-looking statements.
Unless required by applicable securities law, we undertake no obligation to publicly update forward-looking statements, whether as a result of new information, future events or otherwise. We also refer you to further disclosures we make on related subjects in our Quarterly Reports on Form 10-Q and Current Reports on Form 8-K to the SEC.
Our operating results may be adversely affected by unfavorable economic and market conditions.
The current uncertainty in the global economy, including the effects of recession or slow economic growth in the U.S., Europe, and emerging markets in Asia and South America, may negatively affect our operating results. Examples of the effects of these global economic challenges include: our suppliers' and our customers' inability to access the credit markets at commercially reasonable rates; reduction in sales due to customers decreasing their inventories in the near-term or long-term or due to liquidity difficulties; reduction in sales due to shortages of materials we purchase from our suppliers; reduction in research and development efforts and expenditures by our customers; our inability to hedge our currency and raw material risks sufficiently or at commercially reasonable prices; insolvency of suppliers or customers; inflationary pressures on our supplies or our products; and increased expenses due to growing global taxation of corporate profits or revenues. Our operating results in one or more geographic regions may also be affected by uncertain or changing economic conditions within that region. If economic and market conditions in the U.S. or Europe, or in emerging markets, weaken further, we may experience material adverse impacts on our business, financial condition and results of operations.
8
Our sales and profitability are largely dependent on the sale of drug products delivered by injection and the packaging of drug products. If the products developed by our customers in the future use another delivery system, our sales and profitability could suffer.
Our business depends to a substantial extent on customers' continued sales and development of products that are delivered by injection. If our customers fail to continue to sell, develop and deploy injectable products or we are unable to develop new products that assist in the delivery of drugs by alternative methods, our sales and profitability may suffer.
Changes in foreign currency exchange rates could have a material adverse effect on our business and/or results of operations.
Our business is subject to foreign currency exchange rate fluctuations. Sales outside of the U.S. accounted for 51.1% of our consolidated net sales in 2016 and we anticipate that sales from international operations will continue to represent a significant portion of our total sales in the future. In addition, many of our manufacturing facilities and suppliers are located outside of the U.S. Further, we intend to continue our expansion into emerging and/or faster-growing markets outside of the U.S. in the future. Virtually all of our international sales, assets and related operating costs and expenses are earned, valued or incurred in the currency of the local country, primarily the Euro, the Singapore Dollar, and the Danish Krone. In addition, we are exposed to Japanese Yen (“Yen”), as we maintain a 25% ownership interest in, and we purchase finished goods and other materials from, Daikyo. We are also exposed to currencies in emerging market countries, such as the Chinese Yuan, the Indian Rupee, and various South American currencies, including the Venezuelan Bolivar and the Argentinian Peso. Our consolidated financial statements are presented in USD, and, therefore, we must translate the reported values of our foreign assets, liabilities, revenues and expenses into USD, which can result in significant fluctuations in the amount of those assets, liabilities, revenues or expenses. The exchange rates between these foreign currencies and USD in recent years have fluctuated significantly and may continue to do so in the future. Increases or decreases in the value of USD compared to these foreign currencies may negatively affect the value of these items in our consolidated financial statements, which could have a material adverse effect on our operating results.
In addition to translation risks, we incur currency transaction risk when we or one of our subsidiaries enters into a purchase or sales transaction in a currency other than that entity's local currency. In order to reduce our exposure to fluctuations in certain exchange rates, we have entered, and expect to continue to enter, into hedging arrangements, including the use of financial derivatives. There can be no certainty that we will be able to enter into or maintain hedges of these currency risks, or that our hedges will be effective, which could have a significant effect on our financial condition and operating results.
If we are unable to provide comparative value advantages, timely fulfill customer orders, or resist pricing pressure, we will have to reduce our prices, which may reduce our profit margins.
We compete with several companies across our major product lines. Because of the special nature of these products, competition is based primarily on product design and performance, although total cost is becoming increasingly important as pharmaceutical companies continue with aggressive cost-control programs across their operations. Companies often compete on the basis of price. We differentiate ourselves from our competition by being a “full-service, value-added” global supplier that is able to provide pre-sale compatibility studies, engineering support, and other services and sophisticated post-sale technical support on a global basis. However, we face continued pricing pressure from our customers and competitors. If we are unable to resist or to offset the effects of continued pricing pressure through our value-added services, improved operating efficiencies and reduced expenditures, or if we have to reduce our prices, our sales and profitability may suffer.
Consolidation in the pharmaceutical and healthcare industries could adversely affect our future revenues and operating income.
The pharmaceutical and healthcare industries have experienced a significant amount of consolidation. As a result of this consolidation, competition to provide goods and services to customers has increased. In addition, group
9
purchasing organizations and integrated health delivery networks have served to concentrate purchasing decisions for some customers, which has placed pricing pressure on suppliers. Further consolidation within the industries we serve could exert additional pressure on the prices of our products.
We are subject to regulation by governments around the world, and if these regulations are not complied with, existing and future operations may be curtailed, and we could be subject to liability.
The design, development, manufacturing, marketing and labeling of certain of our products and our customers' products that incorporate our products are subject to regulation by governmental authorities in the U.S., Europe and other countries, including the FDA and the European Medicines Agency. Complying with governmental regulation can be costly and can result in required modification or withdrawal of existing products and a substantial delay in the introduction of new products. Failure to comply with applicable regulatory requirements or failure to obtain regulatory approval for a new product could result in expenses and actions that could adversely affect our business and financial performance.
Products incorporating our technologies are subject to regulations and extensive approval or clearance processes, which make the timing and success of new-product commercialization difficult to predict.
The process of obtaining FDA and other required regulatory approvals is expensive and time-consuming. Historically, most medical devices incorporating our technologies have been subject to the FDA's 510(k) marketing approval process, which typically lasts from six to nine months. Supplemental or full pre-market approval reviews require a significantly longer period, delaying commercialization. Pharmaceutical products incorporating our technologies are subject to the FDA's New Drug Application process, which typically takes a number of years to complete. Additionally, biotechnology products incorporating our technologies are subject to the FDA's Biologics License Application process, which also typically takes a number of years to complete. Outside of the U.S., sales of medical devices and pharmaceutical or biotechnology products are subject to international regulatory requirements that vary from country to country. The time required to obtain approval for sale internationally may be longer or shorter than that required for FDA approval.
Changes in the regulation of drug products and devices may increase competitive pressure and adversely affect our business.
An effect of the governmental regulation of our customers' drug products, devices, and manufacturing processes is that compliance with regulations makes it difficult to change components and devices produced by one supplier with those from another supplier, due to the large amount of data and information that customers must generate to demonstrate that the components and devices are equivalent and pose no additional risk to the patient. The regulation of our customers' products that incorporate our components and devices has increased over time. If the applicable regulations were to be modified in a way that reduced the level of data and information needed to prove equivalency for a change from one supplier's components or devices to those made by another, it is likely that the competitive pressure would increase and adversely affect our sales and profitability.
If we are not successful in protecting our intellectual property rights, our ability to compete may be affected.
Our patents, trademarks and other intellectual property are important to our business. We rely on patent, trademark, copyright, trade secret, and other intellectual property laws, as well as nondisclosure and confidentiality agreements and other methods, to protect our proprietary information, technologies and processes. We also have obligations with respect to the non-use and non-disclosure of third party intellectual property. We may need to engage in litigation or similar activities to enforce our intellectual property rights, to protect our trade secrets or to determine the validity and scope of proprietary rights of others. Any such litigation could require us to expend significant resources and divert the efforts and attention of our management and other personnel from our business operations. There can be no assurance that the steps we will take to prevent misappropriation, infringement or other violation of our intellectual property or the intellectual property of others will be successful. In addition, effective patent, copyright, trademark and trade secret protection may be unavailable or limited for some of our intellectual property in some countries. Failure to protect our intellectual property could harm our business and results of operations. In addition,
10
if relevant and effective patent protection is not available or has expired, we may not be able to prevent competitors from independently developing products and services similar or duplicative to ours.
Disruption in our manufacturing facilities could have a material adverse effect on our ability to make and sell products and have a negative impact on our reputation, performance or financial condition.
We have manufacturing sites throughout the world. In some instances, however, the manufacturing of certain product lines is concentrated in one or only a few of our plants. The functioning of our manufacturing and distribution assets and systems could be disrupted for reasons either within or beyond our control, including, without limitation: extreme weather or longer-term climatic changes; natural disasters; pandemic; war; accidental damage; disruption to the supply of material or services; product quality and safety issues; systems failure; workforce actions; or environmental contamination. There is a risk that incident management systems in place may prove inadequate and that any disruption may materially adversely affect our ability to make and sell products and, therefore, materially adversely affect our reputation, performance or financial condition.
The medical technology industry is very competitive and customer demands and/or new products in the marketplace could cause a reduction in demand.
The medical technology industry is subject to rapid technological changes, and we face significant competition across our product lines and in each market in which our products are sold. We face this competition from a wide range of companies, including large medical device companies, some of which have greater financial and marketing resources than we do. We also face competition from firms that are more specialized than we are with respect to particular markets. In some instances, competitors, including pharmaceutical companies, also offer, or are attempting to develop, alternative therapies for diseases that may be delivered without a medical device. The development of new or improved products, processes or technologies by other companies (such as needle-free injection technology) may reduce customer demand for our products or render some of our products or proposed products obsolete or less competitive. In addition, any failure or inability to meet increased customer quality expectations could cause a reduction in demand.
Significant developments in U.S. policies could have a material adverse effect on our business and/or results of operations.
Changes in U.S. social, political, regulatory, and economic conditions, or in laws and policies governing foreign trade, manufacturing, development, immigration, and investment could have an adverse effect on our financial condition, results of operations and cash flows.
Our international sales and operations are subject to risks and uncertainties that vary by country and which could have a material adverse effect on our business and/or results of operations.
We conduct business in most of the major pharmaceutical markets in the world. Our international operations and our ability to implement our overall business strategy (including our plan to continue expanding into emerging and/or faster-growing markets outside of the U.S.) are subject to risks and uncertainties that can vary by country, and include: transportation delays and interruptions; political and economic instability and disruptions, including the United Kingdom's referendum on withdrawal from the European Union; imposition of duties and tariffs; import and export controls; the risks of divergent business expectations or cultural incompatibility inherent in establishing and maintaining operations in foreign countries; difficulties in staffing and managing multi-national operations; labor strikes and/or disputes; and potentially adverse tax consequences. Limitations on our ability to enforce legal rights and remedies with third parties or our joint venture partners outside of the U.S. could also create exposure. In addition, we may not be able to operate in compliance with foreign laws and regulations, or comply with applicable customs, currency exchange control regulations, transfer pricing regulations or any other laws or regulations to which we may be subject, in the event that these laws or regulations change. Any of these events could have an adverse effect on our international operations in the future by reducing the demand for our products or decreasing the prices at which we can sell our products, or otherwise have an adverse effect on our financial condition, results of operations and cash flows.
11
Disruptions in the supply of key raw materials could adversely impact our operations.
We generally purchase our raw materials and supplies required for the production of our products in the open market. For reasons of quality assurance, sole source availability or cost effectiveness, many components and raw materials are available and/or purchased only from a single supplier. Due to the stringent regulations and requirements of the FDA and other regulatory authorities regarding the manufacture of our products, we may not be able to quickly establish additional or replacement sources for these components or materials or do so without excessive cost. As a result, a reduction or interruption in manufacturing, or an inability to secure alternative sources of raw materials or components, could have a material adverse effect on our business and/or results of operations.
Raw material and energy prices have a significant impact on our profitability. If raw material and/or energy prices increase, and we cannot pass those price increases on to our customers, our profitability and financial condition may suffer.
We use three basic raw materials in the manufacture of our products: elastomers (which include synthetic and natural material), aluminum and plastic. In addition, our manufacturing facilities consume a wide variety of energy products to fuel, heat and cool our operations. Supply and demand factors, which are beyond our control, generally affect the price of our raw materials and utility costs. If we are unable to pass along increased raw material prices and energy costs to our customers, our profitability, and thus our financial condition, may be adversely affected. The prices of many of these raw materials and utilities are cyclical and volatile. For example, the prices of certain commodities, particularly petroleum-based raw materials, have in the recent past exhibited rapid changes, affecting the cost of synthetic elastomers and plastic. While we generally attempt to pass along increased costs to our customers in the form of sales price increases, historically there has been a time delay between raw material and/or energy price increases and our ability to increase the prices of our products. In some circumstances, we may not be able to increase the prices of our products due to competitive pressure and other factors.
If we are not timely or successful in new-product innovation or the development and commercialization of proprietary multi-component systems, our future revenues and operating income could be adversely affected.
Our growth partly depends on new-product innovation and the development and commercialization of proprietary multi-component systems for injectable drug administration and other healthcare applications. Product development and commercialization is inherently uncertain and is subject to a number of factors outside of our control, including any necessary regulatory approvals and commercial acceptance for the products. The ultimate timing and successful commercialization of new products and systems requires substantial evaluations of the functional, operational, clinical and economic viability of our products. In addition, the timely and adequate availability of filling capacity is essential to both conducting definitive stability trials and the timing of commercialization of customers' products in CZ prefilled cartridges and syringes. Delays, interruptions or failures in developing and commercializing new-product innovations or proprietary multi-component systems could adversely affect future revenues and operating income. In addition, adverse conditions may also result in future charges to recognize impairment in the carrying value of our goodwill and other intangible assets, which could have a material adverse effect on our financial results.
We may not succeed in finding and completing acquisition or other strategic transactions, if any, which could have an adverse effect on our business and results of operations.
We have historically engaged in acquisition activity and we may in the future engage in acquisitions or other strategic transactions, such as joint ventures or investments in other entities. We may be unable to identify suitable targets, opportunistic or otherwise, for acquisitions or other strategic transactions in the future. If we identify a suitable candidate, our ability to successfully implement the strategic transaction would depend on a variety of factors including our ability to obtain financing on acceptable terms, and to comply with the restrictions contained in our debt agreements. Strategic transactions involve risks, including those associated with integrating the operations or maintaining the operations as separate (as applicable), financial reporting, disparate technologies and personnel of acquired companies, joint ventures or related companies; managing geographically dispersed operations or other strategic investments; the diversion of management's attention from other business concerns; the inherent risks in
12
entering markets or lines of business in which we have either limited or no direct experience; unknown risks; and the potential loss of key employees, customers and strategic partners of acquired companies, joint ventures or companies in which we may make strategic investments. We may not successfully integrate any businesses or technologies we may acquire or strategically develop in the future and may not achieve anticipated revenue and cost benefits relating to any such strategic transactions. Strategic transactions may be expensive, time consuming and may strain our resources. Strategic transactions may not be accretive to our earnings and may negatively impact our results of operations as a result of, among other things, the incurrence of debt, one-time write-offs of goodwill and amortization expenses of other intangible assets. In addition, strategic transactions that we may pursue could result in dilutive issuances of equity securities.
Product defects could adversely affect the results of our operations.
The design, manufacture and marketing of pharmaceutical packaging and medical devices involve certain inherent risks. Manufacturing or design defects, unanticipated use of our products, or inadequate disclosure of risks relating to the use of our products can lead to injury or other adverse events. These events could lead to recalls or safety alerts relating to our products (either voluntary or required by the FDA or similar governmental authorities in other countries), and could result, in certain cases, in the removal of a product from the market. A recall could result in significant costs, as well as negative publicity and damage to our reputation that could reduce demand for our products. Personal injuries relating to the use of our products can also result in product liability claims being brought against us. In some circumstances, such adverse events could also cause delays in new product approvals.
Our operations must comply with environmental statutes and regulations, and any failure to comply could result in extensive costs which would harm our business.
The manufacture of some of our products involves the use, transportation, storage and disposal of hazardous or toxic materials and is subject to various environmental protection and occupational health and safety laws and regulations in the countries in which we operate. This has exposed us in the past, and could expose us in the future, to risks of accidental contamination and events of non-compliance with environmental laws. Any such occurrences could result in regulatory enforcement or personal injury and property damage claims or could lead to a shutdown of some of our operations, which could have an adverse effect on our business and results of operations. We currently incur costs to comply with environmental laws and regulations and these costs may become more significant.
A loss of key personnel or highly skilled employees could disrupt our operations.
Our executive officers are critical to the management and direction of our businesses. Our future success depends, in large part, on our ability to retain these officers and other key employees, including people in technical, marketing, sales and research positions. Competition for experienced employees, particularly for persons with specialized skills, can be intense. Our ability to recruit such talent will depend on a number of factors, including compensation and benefits, work location and work environment. If we cannot effectively recruit and retain qualified executives and employees, our business could be adversely affected. Although we believe that we will be able to attract and retain talented personnel and replace key personnel should the need arise, our inability to do so on a timely basis could disrupt the operations of the unit affected or our overall operations. In addition, because of the complex nature of many of our products and programs, we are generally dependent on an educated and highly skilled engineering staff and workforce. Our operations could be disrupted by a shortage of available skilled employees.
The uncertain effects of potential climate change legislation could lead to significantly increased costs.
If legislation or regulations are enacted or promulgated in the U.S., Europe or Asia or any other jurisdictions in which we do business that limit or reduce allowable greenhouse gas emissions and other emissions, such restrictions could have a significant effect on our operating and financial decisions, including those involving capital expenditures to reduce emissions, and our results of operations. Our manufacturing operations may not be able to operate as planned if we are not able to comply with new legal and regulatory legislation around climate change, or it may become too costly to operate in a profitable manner. Additionally, suppliers' added expenses could be passed
13
on to us in the form of higher prices and we may not be able to pass on such expenses to our customers through price increases.
Healthcare reform may adversely affect our results of operations.
The Patient Protection and Affordable Care Act (the “PPACA”) was enacted in March 2010 and could result in reduced demand for our products, as our sales depend, in part, on the extent to which pharmaceutical companies and healthcare providers and facilities are reimbursed by government authorities, private insurers and other third-party payers for the costs of our products. The coverage policies and reimbursement levels of third-party payers, which can vary among public and private sources, may affect which products customers purchase and the prices they are willing to pay for these products in a particular jurisdiction. Legislative or administrative reforms to reimbursement systems in the U.S. (including the possible termination of the PPACA and potential replacement thereafter with a different system) or abroad (for example, those under consideration in France, Germany, Italy and the United Kingdom) could significantly reduce reimbursement for our customers' products, which could in turn reduce the demand for our products.
Moreover, in the coming years, additional changes could be made to global governmental healthcare programs that could significantly impact the success of our products. We will continue to evaluate the PPACA, as amended, the implementation of regulations or guidance related to various provisions of the PPACA by federal agencies, the potential repeal and replacement of the PPACA, as well as trends and changes that may be encouraged by the legislation and other healthcare legislation globally and that may potentially impact our business over time.
No assurance can be given that we will continue to pay or declare dividends.
We have historically paid dividends. However, there can be no assurance that we will pay or declare dividends in the future. The actual declaration and payment of future dividends, the amount of any such dividends, and the establishment of record and payment dates, if any, are subject to determination by our Board of Directors each quarter after its review of our then-current strategy, applicable debt covenants and financial performance and position, among other things. Our declaration and payment of future dividends is subject to risks and uncertainties, including: deterioration of our financial performance or position; inability to declare a dividend in compliance with applicable laws or debt covenants; an increase in our cash needs or decrease in available cash; and the business judgment of the Board of Directors that a declaration of a dividend is not in our best interest.
Our results of operations and earnings may not meet guidance or expectations.
We provide public guidance on our expected results of operations for future periods. This guidance is comprised of forward-looking statements subject to risks and uncertainties, including the risks and uncertainties described in this Form 10-K and in our other public filings and public statements, and is based necessarily on assumptions we make at the time we provide such guidance. Our guidance may not always be accurate. If, in the future, our results of operations for a particular period do not meet our guidance or the expectations of investment analysts or if we reduce our guidance for future periods, the market price of our common stock could decline significantly.
We are exposed to credit risk on accounts receivable and certain prepayments made in the normal course of business. This risk is heightened during periods when economic conditions worsen.
A substantial majority of our outstanding trade receivables are not covered by collateral or credit insurance. In addition, we have made prepayments associated with insurance premiums and other advances in the normal course of business. While we have procedures to monitor and limit exposure to credit risk on trade receivables and other current assets, there can be no assurance such procedures will effectively limit our credit risk and avoid losses, which could have a material adverse effect on our financial condition and operating results.
14
Unauthorized access to our or our customers' information and systems could negatively impact our business.
We may face certain security threats, including threats to the confidentiality, availability and integrity of our data and systems. We maintain an extensive network of technical security controls, policy enforcement mechanisms and monitoring systems in order to address these threats. While these measures are designed to prevent, detect and respond to unauthorized activity in our systems, certain types of attacks could result in financial or information losses and/or reputational harm. If we cannot prevent the unauthorized access, release and/or corruption of our or our customers' confidential, classified or personally identifiable information, our reputation could be damaged, and/or we could face financial losses.
If we fail to comply with our obligations under our distributorship or license agreements with Daikyo or we are unable to renew these agreements on the same or substantially similar terms, we could lose license rights that are important to our business.
Key value-added and proprietary products and processes are licensed from our affiliate, Daikyo, including but not limited to, CZ, FluroTec and B2-coating technologies. Our rights to these products and processes are licensed pursuant to agreements that expire in 2027. However, if the agreements are terminated early, our business could be adversely impacted.
ITEM IB. UNRESOLVED STAFF COMMENTS
As of the filing of this Form 10-K, there were no unresolved comments from the Staff of the SEC.
15
ITEM 2. PROPERTIES
Our corporate headquarters are located at 530 Herman O. West Drive, Exton, Pennsylvania. This building also houses our North American sales and marketing, administrative support and customer service functions, as well as laboratories.
The following table summarizes production facilities by segment and geographic region. All facilities shown are owned except where otherwise noted.
Proprietary Products | ||||
Manufacturing: | ||||
North American Operations | European Operations | Asia Pacific Operations | ||
United States | Denmark | China | ||
Clearwater, FL | Horsens | Qingpu | ||
Jersey Shore, PA | England | India | ||
Kearney, NE | St. Austell | Sri City | ||
Kinston, NC | France | Singapore | ||
Lititz, PA | Le Nouvion | Jurong | ||
Scottsdale, AZ (2) | Le Vaudreuil | |||
St. Petersburg, FL (1) | Germany | |||
Eschweiler (1) | ||||
South American Operations | Stolberg | |||
Brazil | Serbia | |||
Sao Paulo | Kovin | |||
Mold-and-Die Tool Shop: | Contract Analytical Laboratory: | |||
North American Operations | European Operations | North American Operations | ||
United States | England | United States | ||
Upper Darby, PA | Bodmin (2) | Exton, PA | ||
Contract-Manufactured Products | ||||
Manufacturing: | ||||
North American Operations | European Operations | |||
United States | Ireland | |||
Frankfort, IN (2) | Dublin (2) | |||
Grand Rapids, MI | ||||
Phoenix, AZ (2) | ||||
Tempe, AZ (2) | ||||
Williamsport, PA | ||||
Puerto Rico | ||||
Cayey | ||||
(1) | This manufacturing facility is also used for research and development activities. |
(2) | This facility is leased in whole or in part. |
16
Our Proprietary Products reportable segment leases facilities located in Israel, New Jersey and Texas for research and development, as well as other activities. Sales offices in various locations are leased under short-term arrangements.
In October 2014, we announced plans to expand our global manufacturing operations to include a new facility in Waterford, Ireland, which will produce packaging components for insulin injector cartridges and other high-value packaging components. Commercial production is expected to begin in 2018.
ITEM 3. LEGAL PROCEEDINGS
None.
ITEM 4. MINE SAFETY DISCLOSURES
Not applicable.
EXECUTIVE OFFICERS OF THE COMPANY
The executive officers of the Company are set forth in this table. Generally, executive officers are elected by the Board of Directors annually at the regular meeting of the Board of Directors following the Annual Meeting of Shareholders. Additionally, executive officers may be elected upon hire or due to a promotion.
Name | Age | Position |
Michael A. Anderson | 61 | Vice President and Treasurer since June 2001. He was Finance Director, Drug Delivery Systems Division from October 1999 to June 2001, Vice President, Business Development from April 1997 to October 1999 and Director of Taxes from July 1992 to April 1997. He retired from West as of December 31, 2016. |
Annette F. Favorite | 52 | Senior Vice President and Chief Human Resources Officer since October 2015. Prior to joining West, she spent more than 25 years at IBM Corporation, an information technology services company, in a number of strategic and global human resources roles. Most recently, she served as Vice President, Global Talent Management. |
William J. Federici | 57 | Senior Vice President and Chief Financial Officer since joining West in August 2003. Acting Treasurer since January 2017. He was National Industry Director for Pharmaceuticals of KPMG LLP (accounting firm) from June 2002 until August 2003 and, prior thereto, an audit partner with Arthur Andersen, LLP. |
Karen A. Flynn | 54 | Senior Vice President and Chief Commercial Officer since January 2016. She was President, Pharmaceutical Packaging Systems from October 2014 to January 2016, President, Pharmaceutical Packaging Systems Americas Region from June 2012 to October 2014, and Vice President, Sales from May 2008 to June 2012. From 2000 to 2008, she worked in Sales Management, most recently as Vice President, Global Accounts, for Catalent (formerly a business segment of Cardinal Health). Prior thereto, she held various positions at West, including Quality, Research and Development, and Sales. |
17
Eric M. Green | 47 | Chief Executive Officer since April 2015 and President since December 2015. Prior to joining West, he was Executive Vice President and President of the Research Markets business unit at Sigma-Aldrich Corporation, a leading life science and technology company, from 2013 to 2015. From 2009 to 2013, he served as Vice President and Managing Director, International, where he was responsible for Asia Pacific and Latin America, and prior thereto, held various commercial and operational roles. |
Daniel Malone | 55 | Vice President and Corporate Controller since August 2011. He was Vice President of Finance, Pharmaceutical Packaging Systems Americas Region from September 2008 to August 2011 and Director of Financial and Management Reporting from October 1999 to September 2008. |
George L. Miller | 62 | Senior Vice President, General Counsel and Corporate Secretary since joining West in November 2015. Previously, he served as Senior Vice President, General Counsel and Corporate Secretary for Sigma-Aldrich Corporation from 2009 to 2015. Prior to working at Sigma-Aldrich, he held senior legal positions with Novartis AG, a global healthcare company. |
David A. Montecalvo | 51 | Senior Vice President, Global Operations and Supply Chain since September 2016. Prior to joining West, he served in a number of senior leadership roles at Medtronic plc, including Vice President, Contract Manufacturing Operations, for the company's Restorative Therapies Group, and Vice President, Business Operations Integration, where he was responsible for directing and leading the global operations integration of Covidien plc into Medtronic. Prior thereto, he held senior operations and product development roles at Urologix, Inc. and LecTec Corporation. |
Eric Resnick | 53 | Vice President and Chief Technology Officer since March 2016. Previously, he served as Vice President and General Manager of Integrated Packaging and Delivery within West's Innovation and Technology Team and President Proprietary Products - Pharmaceutical Delivery Systems from March 2015 until March 2016. He served as Vice President Research and Development and Self-Injection Systems from March 2014 until March 2015, and Vice President and General Manager of West's Contract Manufacturing Delivery Devices division from 2008 until March 2014. Prior thereto, he held various positions of increasing responsibility since joining The Tech Group in 2001. Prior to joining West, he held engineering and operating roles with Eastman Kodak Company and Ortho Clinical Diagnostics. |
18
PART II
ITEM 5. MARKET FOR REGISTRANT'S COMMON EQUITY, RELATED STOCKHOLDER MATTERS AND ISSUER PURCHASES OF EQUITY SECURITIES
Our common stock is listed on the New York Stock Exchange (“NYSE”) under the symbol “WST.” The following table shows the high and low prices for our common stock as reported by the NYSE, for the periods indicated.
First Quarter | Second Quarter | Third Quarter | Fourth Quarter | Year | ||||||
High | Low | High | Low | High | Low | High | Low | High | Low | |
2016 | 69.59 | 53.88 | 77.71 | 68.42 | 84.33 | 71.23 | 86.50 | 70.17 | 86.50 | 53.88 |
2015 | 60.30 | 48.66 | 60.00 | 52.73 | 61.73 | 53.10 | 64.59 | 52.79 | 64.59 | 48.66 |
As of January 31, 2017, we had 915 shareholders of record, which excludes shareholders whose shares were held by brokerage firms, depositaries and other institutional firms in “street names” for their customers.
Dividends
Our common stock paid a quarterly dividend of $0.11 per share in each of the first three quarters of 2015; $0.12 per share in the fourth quarter of 2015 and each of the first three quarters of 2016; and $0.13 per share in the fourth quarter of 2016.
Issuer Purchases of Equity Securities
The following table shows information with respect to purchases of our common stock made during the three months ended December 31, 2016 by us or any of our “affiliated purchasers” as defined in Rule 10b-18(a)(3) under the Exchange Act:
Period | Total number of shares purchased (1)(2) | Average price paid per share (1)(2) | Total number of shares purchased as part of publicly announced plans or programs (2)(3) | Maximum number (or approximate dollar value) of shares that may yet be purchased under the plans or programs (2)(3) | |||||||||
October 1 – 31, 2016 | 70 | $ | 72.23 | — | 329,190 | ||||||||
November 1 – 30, 2016 | 329,390 | 77.24 | 329,190 | — | |||||||||
December 1 – 31, 2016 | 70 | 82.86 | — | — | |||||||||
Total | 329,530 | $ | 77.24 | 329,190 | — | ||||||||
(1) | Includes 340 shares purchased on behalf of employees enrolled in the Non-Qualified Deferred Compensation Plan for Designated Employees (Amended and Restated Effective January 1, 2008). Under the plan, Company match contributions are delivered to the plan’s investment administrator, who then purchases shares in the open market and credits the shares to individual plan accounts. |
(2) | In December 2015, we announced a share repurchase program authorizing the repurchase of up to 700,000 shares of our common stock from time to time on the open market or in privately-negotiated transactions as permitted under the Securities Exchange Act of 1934 Rule 10b-18. During the fourth quarter of 2016, we purchased 329,190 shares of our common stock under this program at a cost of $25.4 million, or an average price of $77.25 per share. During the year ended December 31, 2016, we purchased 700,000 shares of our common stock under this program at a cost of $52.2 million, or an average price of $74.54 per share. This share repurchase program expired on December 31, 2016. |
19
(3) | In December 2016, we announced a share repurchase program authorizing the repurchase of up to 800,000 shares of our common stock from time to time on the open market or in privately-negotiated transactions as permitted under the Securities Exchange Act of 1934 Rule 10b-18. The number of shares to be repurchased and the timing of such transactions will depend on a variety of factors, including market conditions. This share repurchase program commenced on January 1, 2017 and is expected to be completed by December 31, 2017. |
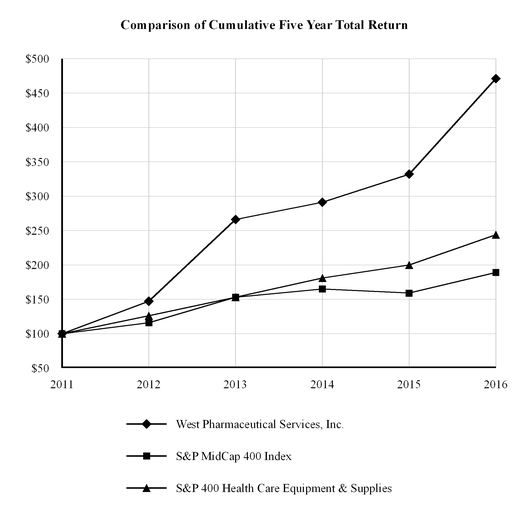
Performance Graph
The following performance graph compares the cumulative total return to holders of our common stock with the cumulative total return of the following Standard & Poor's (“S&P”) indices, for the five years ended December 31, 2016: MidCap 400 Index and 400 Health Care Equipment & Supplies Industry.
Cumulative total return to shareholders is measured by dividing total dividends (assuming dividend reinvestment) plus the per-share price change for the period by the share price at the beginning of the period. The Company's cumulative shareholder return is based on an investment of $100 on December 31, 2011 and is compared to the cumulative total return of the S&P indices mentioned above over the period with a like amount invested.
20
ITEM 6. SELECTED FINANCIAL DATA
FIVE-YEAR SUMMARY
West Pharmaceutical Services, Inc. and Subsidiaries
(in millions, except per share data) | 2016 | 2015 | 2014 | 2013 | 2012 | ||||||||||
SUMMARY OF OPERATIONS | |||||||||||||||
Net sales | $ | 1,509.1 | $ | 1,399.8 | $ | 1,421.4 | $ | 1,368.4 | $ | 1,266.4 | |||||
Operating profit | 196.8 | 128.6 | 182.0 | 162.4 | 135.1 | ||||||||||
Net income | 143.6 | 95.6 | 127.1 | 112.3 | 80.7 | ||||||||||
Net income per share: | |||||||||||||||
Basic (1) | $ | 1.96 | $ | 1.33 | $ | 1.79 | $ | 1.61 | $ | 1.19 | |||||
Diluted (2) | 1.91 | 1.30 | 1.75 | 1.57 | 1.15 | ||||||||||
Weighted average common shares outstanding | 73.3 | 72.0 | 70.9 | 69.6 | 68.1 | ||||||||||
Weighted average shares assuming dilution | 75.0 | 73.8 | 72.8 | 71.4 | 71.8 | ||||||||||
Dividends declared per common share | $ | 0.50 | $ | 0.46 | $ | 0.41 | $ | 0.39 | $ | 0.37 | |||||
YEAR-END FINANCIAL POSITION | |||||||||||||||
Cash and cash equivalents | $ | 203.0 | $ | 274.6 | $ | 255.3 | $ | 230.0 | $ | 161.9 | |||||
Working capital | 400.9 | 359.4 | 406.6 | 413.6 | 295.4 | ||||||||||
Total assets | 1,716.7 | 1,695.1 | 1,669.7 | 1,670.2 | 1,562.5 | ||||||||||
Total invested capital: | |||||||||||||||
Total debt | 228.6 | 298.2 | 335.5 | 372.1 | 410.0 | ||||||||||
Total equity | 1,117.5 | 1,023.9 | 956.9 | 906.4 | 728.9 | ||||||||||
Total invested capital | $ | 1,346.1 | $ | 1,322.1 | $ | 1,292.4 | $ | 1,278.5 | $ | 1,138.9 | |||||
PERFORMANCE MEASUREMENTS (3) | |||||||||||||||
Gross margin (a) | 33.2 | % | 32.6 | % | 31.5 | % | 31.8 | % | 30.6 | % | |||||
Operating profitability (b) | 13.0 | % | 9.2 | % | 12.8 | % | 11.9 | % | 10.7 | % | |||||
Effective tax rate | 28.7 | % | 22.6 | % | 28.0 | % | 27.4 | % | 30.2 | % | |||||
Return on invested capital (c) | 10.5 | % | 7.6 | % | 10.2 | % | 9.8 | % | 8.8 | % | |||||
Net debt-to-total invested capital (d) | 2.2 | % | 2.3 | % | 7.7 | % | 13.6 | % | 25.4 | % | |||||
Research and development expenses | $ | 36.8 | $ | 34.1 | $ | 37.3 | $ | 37.9 | $ | 33.2 | |||||
Operating cash flow | 219.4 | 212.4 | 182.9 | 220.5 | 187.4 | ||||||||||
Stock price range | $86.50-53.88 | $64.59-48.66 | $55.29-39.11 | $50.60-27.31 | $28.01-18.68 | ||||||||||
(1) Based on weighted average common shares outstanding.
(2) Based on weighted average shares, assuming dilution.
(3) Performance measurements represent indicators commonly used in the financial community. The following performance measures are not in conformity with U.S. generally accepted accounting principles (“U.S. GAAP”) and should not be used as a substitute for the comparable U.S. GAAP financial measures. The non-U.S. GAAP financial measures are included as management uses them in evaluating our results of operations, and believes that this information provides users with a valuable insight into our overall performance and financial position.
(a) Net sales minus cost of goods and services sold, including applicable depreciation and amortization, divided by net sales.
(b) Operating profit divided by net sales.
(c) Operating profit multiplied by one minus the effective tax rate divided by average total invested capital.
(d) Net debt (total debt less cash and cash equivalents) divided by total invested capital less cash and cash equivalents.
21
Factors affecting the comparability of the information reflected in the selected financial data:
▪ | Net income in 2016 included the impact of restructuring and related charges of $17.4 million (net of $9.0 million in tax), a charge related to the devaluation of the Venezuelan Bolivar of $2.7 million, a pension curtailment gain of $1.3 million (net of $0.8 million in tax), and a discrete tax charge of $1.0 million. |
▪ | Net income in 2015 included the impact of a pension settlement charge of $32.0 million (net of $18.4 million in tax), a charge for executive retirement and related costs of $6.9 million (net of $4.0 million in tax) and a discrete tax charge of $0.8 million. |
▪ | Net income in 2014 included the impact of a charge for license costs associated with acquired in-process research of $0.8 million (net of $0.4 million in tax) and discrete tax charges of $1.8 million. |
▪ | Net income in 2013 included the impact of a loss on extinguishment of debt of $0.2 million and net discrete tax charges of $3.6 million. |
▪ | Net income in 2012 included the impact of restructuring and related charges of $1.4 million (net of $0.7 million in tax), an impairment charge of $2.1 million (net of $1.3 million in tax), an increase in acquisition-related contingencies of $1.0 million (net of $0.2 million in tax), a loss on extinguishment of debt of $9.8 million (net of $1.8 million in tax) and discrete tax charges of $2.1 million. |
22
ITEM 7. MANAGEMENT’S DISCUSSION AND ANALYSIS OF FINANCIAL CONDITION AND RESULTS OF OPERATIONS
OVERVIEW
The following discussion is intended to further the reader's understanding of the consolidated financial condition and results of operations of our Company. It should be read in conjunction with our consolidated financial statements and the accompanying footnotes included in Part II, Item 8 of this Form 10-K. These historical financial statements may not be indicative of our future performance. This Management's Discussion and Analysis of Financial Condition and Results of Operations contains a number of forward-looking statements, all of which are based on our current expectations and could be affected by the uncertainties and risks discussed in Part I, Item 1A of this Form 10-K.
Non-U.S. GAAP Financial Measures
For the purpose of aiding the comparison of our year-over-year results, we may refer to net sales and other financial results excluding the effects of changes in foreign currency exchange rates. The constant-currency amounts are calculated by translating the current year’s functional currency results at the prior-year period’s exchange rate. We may also refer to consolidated operating profit and consolidated operating profit margin excluding the effects of unallocated items. The re-measured results excluding effects from currency translation and excluding the effects of unallocated items are not in conformity with U.S. GAAP and should not be used as a substitute for the comparable U.S. GAAP financial measures. The non-U.S. GAAP financial measures are incorporated into our discussion and analysis as management uses them in evaluating our results of operations, and believes that this information provides users a valuable insight into our results.
Our Operations
We are a manufacturer of packaging components and delivery systems for injectable drugs and healthcare products. Our products include vial containment solutions, prefillable systems, self-injection platforms, cartridge systems and components, reconstitution and transfer systems, intradermal delivery solutions, specialty components, and contract manufacturing and analytical services. Our customers include the leading biologic, generic, pharmaceutical, diagnostic, and medical device companies in the world. The Company was incorporated under the laws of the Commonwealth of Pennsylvania on July 27, 1923.
In 2015, our business operations consisted of two reportable segments, Packaging Systems and Delivery Systems. Beginning in 2016, we changed our organization and reporting structure for our next phase of growth and development, which resulted in a change to Proprietary Products and Contract-Manufactured Products as our reportable segments. Our Proprietary Products reportable segment, which is a combination of the previous Packaging Systems segment and the proprietary products portion of the previous Delivery Systems segment, develops commercial, operational, and innovation strategies across our global network, with specific emphasis on product offerings to biologic, generic, and pharmaceutical drug customers. Our Contract-Manufactured Products reportable segment, which consists of the contract manufacturing portion of the previous Delivery Systems segment, serves as a fully integrated business focused on the design, manufacture, and automated assembly of complex devices, primarily for pharmaceutical, diagnostic, and medical device customers. We also maintain global partnerships to share technologies and market products with affiliates in Japan and Mexico.
As a result of our global manufacturing and distribution presence, more than half of our revenues are generated outside of the U.S. in currencies other than USD, including approximately 40% in Europe and 10% collectively in Asia and South America. Fluctuations in foreign currency exchange rates, therefore, can have a significant effect on our consolidated financial results. Generally, our financial results are affected positively by a weaker USD and negatively by a stronger USD, as compared to the foreign currencies in which we conduct our business. In terms of net sales, the most significant foreign currencies are the Euro, the Singapore Dollar, and the Danish Krone, with Euro-denominated sales representing the majority of sales transacted in foreign currencies. In addition, we are
23
exposed to Yen, as we maintain a 25% ownership interest in, and we purchase finished goods and other materials from, Daikyo. We are also exposed to currencies in emerging market countries, such as the Chinese Yuan, the Indian Rupee, and various South American currencies, including the Venezuelan Bolivar and the Argentinian Peso, both of which were unfavorable to our results in 2016. During 2016, average exchange rates were unfavorable versus the exchange rates realized in 2015. Foreign currency translation resulted in lower reported net sales, operating profit, net income, and net income per diluted share of $17.5 million, $4.0 million, $2.9 million, and $0.04, respectively, as compared to 2015.
Segment results presented in the accompanying consolidated financial statements and related notes have been retroactively adjusted to reflect the impact of this change. Please refer to Note 17, Segment Information, for additional details.
2016 Financial Performance Summary
Consolidated net sales increased by $109.3 million, or 7.8%, in 2016, due to growth in our high-value product offerings. Excluding foreign currency translation effects, consolidated net sales in 2016 increased by $126.8 million, or 9.1%.
Consolidated gross profit increased by $45.3 million, or 9.9%, in 2016, as product mix improvements, production efficiencies, and sales price increases were partially offset by increased labor and overhead costs. Consolidated gross profit margin increased by 0.6 margin points in 2016.
Net income per diluted share was $1.91 in 2016, as compared to $1.30 in 2015. Results for 2016 included restructuring and related charges, a charge related to the devaluation of the Venezuelan Bolivar, the impact of foreign currency translation, and a discrete tax charge, which reduced net income per diluted share by $0.23, $0.04, $0.04, and $0.01, respectively, as compared to 2015. Results for 2016 also included a pension curtailment gain, which increased net income per diluted share by $0.01, as compared to 2015. Results for 2015 included a pension settlement charge, a charge for executive retirement and related costs, and a discrete tax charge, which reduced net income per diluted share by $0.43, $0.09, and $0.01, respectively, as compared to 2014.
At December 31, 2016, our cash and cash equivalents balance totaled $203.0 million and our borrowing capacity under our $300.0 million multi-currency revolving credit facility (the "Credit Facility") was $270.6 million.
We continue to focus on our customers' increasing demand for higher product quality, including the development of our proprietary packaging and delivery systems product offerings. We will manage our capabilities and asset base to respond to changing markets and to enable improvements in service and quality. We expect that contract manufacturing will remain focused on pharmaceutical, diagnostic, and medical device customers. We plan to continue funding capital projects related to new products, expansion activity, advanced quality systems, and investment in emerging markets. We believe that our strong operating results and financial position give us a platform for sustained growth, and will enable us to take advantage of opportunities to invest in our business as they arise. See Part I, Item 1A, Risk Factors, of this Form 10-K for further discussion regarding the risks associated with our operations.
RESULTS OF OPERATIONS
We evaluate the performance of our segments based upon, among other things, segment net sales and operating profit. Segment operating profit excludes general corporate costs, which include executive and director compensation, stock-based compensation, adjustments to annual incentive plan expense for over- or under-attainment of targets, certain pension and other retirement benefit costs, and other corporate facilities and administrative expenses not allocated to the segments. Also excluded are items that we consider not representative of ongoing operations. Such items are referred to as other unallocated items and generally include restructuring and related charges, certain asset impairments and other specifically-identified income or expense items.
24
Percentages in the following tables and throughout this Results of Operations section may reflect rounding adjustments.
Net Sales
The following table presents net sales, consolidated and by reportable segment:
Year Ended December 31, | % Change | ||||||||||||||||
($ in millions) | 2016 | 2015 | 2014 | 2016/2015 | 2015/2014 | ||||||||||||
Proprietary Products | $ | 1,189.9 | $ | 1,098.3 | $ | 1,126.3 | 8.3 | % | (2.5 | )% | |||||||
Contract-Manufactured Products | 320.2 | 302.4 | 295.7 | 5.9 | % | 2.3 | % | ||||||||||
Intersegment sales elimination | (1.0 | ) | (0.9 | ) | (0.6 | ) | — | — | |||||||||
Consolidated net sales | $ | 1,509.1 | $ | 1,399.8 | $ | 1,421.4 | 7.8 | % | (1.5 | )% | |||||||
2016 compared to 2015
Consolidated net sales increased by $109.3 million, or 7.8%, in 2016, including an unfavorable foreign currency translation impact of $17.5 million. Excluding foreign currency translation effects, consolidated net sales increased by $126.8 million, or 9.1%. Consolidated net sales originating in the U.S. in 2016 were $738.3 million, an increase of 10.6% from 2015. Consolidated net sales generated outside of the U.S. (mainly in Europe) in 2016 were $770.8 million, an increase of 5.2% from 2015. Excluding foreign currency translation effects, consolidated net sales generated outside of the U.S. in 2016 increased by 7.6%.
Proprietary Products – Proprietary Products net sales increased by $91.6 million, or 8.3%, in 2016, including an unfavorable foreign currency translation impact of $17.5 million. Excluding foreign currency translation effects, net sales increased by $109.1 million, or 9.9%, due to growth in our high-value product offerings, including products sold under our distributorship agreement with Daikyo and our Westar® and FluroTec-coated stoppers and plungers. An improvement in product mix and higher sales volumes contributed 9.1 percentage points of the increase, and sales price increases contributed the remainder of the increase.
Contract-Manufactured Products – Contract-Manufactured Products net sales increased by $17.8 million, or 5.9%, in 2016, primarily due to higher drug delivery and diagnostic product sales.
2015 compared to 2014
Consolidated net sales decreased by $21.6 million, or 1.5%, in 2015, including an unfavorable foreign currency translation impact of $123.9 million. Excluding foreign currency translation effects, consolidated net sales increased by $102.3 million, or 7.2%. Consolidated net sales originating in the U.S. in 2015 were $667.4 million, an increase of 5.8% from 2014. Consolidated net sales generated outside of the U.S. (mainly in Europe) in 2015 were $732.4 million, a decrease of 7.4% from 2014 due to an unfavorable foreign currency translation impact. Excluding foreign currency translation effects, consolidated net sales generated outside of the U.S. in 2015 increased by 8.3%.
Proprietary Products – Proprietary Products net sales decreased by $28.0 million, or 2.5%, in 2015, including an unfavorable foreign currency translation impact of $113.7 million. Excluding foreign currency translation effects, net sales increased by $85.7 million, or 7.6%, due to growth in our high-value product offerings, particularly FluroTec-coated components, Westar components, and the Envision line of vision-inspected components.
Contract-Manufactured Products – Contract-Manufactured Products net sales increased by $6.7 million, or 2.3%, in 2015, including an unfavorable foreign currency translation impact of $10.2 million. Excluding foreign currency translation effects, net sales increased by $16.9 million, or 5.7%, particularly due to an increase in the sale of glucose monitoring devices.
The intersegment sales elimination, which is required for the presentation of consolidated net sales, represents the elimination of components sold between our segments.
25
Gross Profit
The following table presents gross profit and related gross margins, consolidated and by reportable segment:
Year Ended December 31, | % Change | ||||||||||||||||
($ in millions) | 2016 | 2015 | 2014 | 2016/2015 | 2015/2014 | ||||||||||||
Proprietary Products: | |||||||||||||||||
Gross Profit | $ | 448.0 | $ | 404.5 | $ | 396.6 | 10.8 | % | 2.0 | % | |||||||
Gross Profit Margin | 37.7 | % | 36.8 | % | 35.2 | % | |||||||||||
Contract-Manufactured Products: | |||||||||||||||||
Gross Profit | $ | 53.1 | $ | 51.3 | $ | 51.2 | 3.5 | % | 0.2 | % | |||||||
Gross Profit Margin | 16.6 | % | 17.0 | % | 17.3 | % | |||||||||||
Consolidated Gross Profit | $ | 501.1 | $ | 455.8 | $ | 447.8 | 9.9 | % | 1.8 | % | |||||||
Consolidated Gross Profit Margin | 33.2 | % | 32.6 | % | 31.5 | % | |||||||||||
2016 compared to 2015
Consolidated gross profit increased by $45.3 million, or 9.9%, in 2016, including an unfavorable foreign currency translation impact of $5.6 million. Consolidated gross profit margin increased by 0.6 margin points in 2016.
Proprietary Products – Proprietary Products gross profit increased by $43.5 million, or 10.8%, in 2016, including an unfavorable foreign currency translation impact of $5.6 million. Proprietary Products gross profit margin increased by 0.9 margin points in 2016, as product mix improvements, production efficiencies, and sales price increases were partially offset by increased labor and overhead costs.
Contract-Manufactured Products – Contract-Manufactured Products gross profit increased by $1.8 million, or 3.5%, in 2016. Contract-Manufactured Products gross profit margin decreased by 0.4 margin points in 2016, as increased labor and overhead costs were partially offset by a favorable mix of product sales and lower raw material costs.
2015 compared to 2014
Consolidated gross profit increased by $8.0 million, or 1.8%, in 2015, including an unfavorable foreign currency translation impact of $42.4 million. Consolidated gross profit margin increased by 1.1 margin points in 2015.
Proprietary Products – Proprietary Products gross profit increased by $7.9 million, or 2.0%, in 2015, including an unfavorable foreign currency translation impact of $41.4 million. Proprietary Products gross profit margin increased by 1.6 margin points in 2015, as product mix improvements, sales price increases, and production efficiencies were partially offset by increased labor and overhead costs.
Contract-Manufactured Products – Contract-Manufactured Products gross profit increased by $0.1 million, or 0.2%, in 2015, including an unfavorable foreign currency translation impact of $1.0 million. Contract-Manufactured Products gross profit margin decreased by 0.3 margin points in 2015 as a result of increased overhead and depreciation related to new capabilities supporting contract manufacturing programs.
26
Research and Development (“R&D”) Costs
The following table presents R&D costs, consolidated and by reportable segment:
Year Ended December 31, | % Change | ||||||||||||||||
($ in millions) | 2016 | 2015 | 2014 | 2016/2015 | 2015/2014 | ||||||||||||
Proprietary Products | $ | 36.8 | $ | 34.1 | $ | 37.3 | 7.9 | % | (8.6 | )% | |||||||
Contract-Manufactured Products | — | — | — | — | — | ||||||||||||
Consolidated R&D costs | $ | 36.8 | $ | 34.1 | $ | 37.3 | 7.9 | % | (8.6 | )% | |||||||
2016 compared to 2015
Consolidated R&D costs increased by $2.7 million, or 7.9%, in 2016, due to continued investment in advanced delivery and container systems, process technology, and formulation development.
2015 compared to 2014
Consolidated R&D costs decreased by $3.2 million, or 8.6%, in 2015, due to the reallocation of resources to commercial projects in 2015, the reassignment of personnel to clinical trial production activities for the SmartDose technology platform in 2015, the completion of development work on the SelfDose self-injection system in 2014, and the impact of foreign currency translation, which decreased R&D costs by $1.0 million.
All of the R&D costs incurred during 2016 and 2015 related to Proprietary Products.
Selling, General and Administrative (“SG&A”) Costs
The following table presents SG&A costs, consolidated and by reportable segment and corporate:
Year Ended December 31, | % Change | ||||||||||||||||
($ in millions) | 2016 | 2015 | 2014 | 2016/2015 | 2015/2014 | ||||||||||||
Proprietary Products | $ | 168.3 | $ | 159.4 | $ | 160.7 | 5.6 | % | (0.8 | )% | |||||||
Contract-Manufactured Products | 15.2 | 15.8 | 14.8 | (3.8 | )% | 6.8 | % | ||||||||||
Corporate | 56.3 | 57.8 | 53.2 | (2.6 | )% | 8.6 | % | ||||||||||
Consolidated SG&A costs | $ | 239.8 | $ | 233.0 | $ | 228.7 | 2.9 | % | 1.9 | % | |||||||
SG&A as a % of net sales | 15.9 | % | 16.6 | % | 16.1 | % | |||||||||||
2016 compared to 2015
Consolidated SG&A costs increased by $6.8 million, or 2.9%, in 2016, including the impact of foreign currency translation, which decreased SG&A costs by $1.7 million.
Proprietary Products – Proprietary Products SG&A costs increased by $8.9 million, or 5.6%, in 2016, due to increases in compensation costs primarily related to merit increases and information system maintenance costs. Foreign currency translation decreased Proprietary Products SG&A costs by $1.7 million.
Contract-Manufactured Products – Contract-Manufactured Products SG&A costs decreased by $0.6 million, or 3.8%, in 2016, due to decreases in compensation and travel costs.
Corporate – Corporate’s SG&A costs decreased by $1.5 million, or 2.6%, in 2016, as a decrease in incentive compensation costs was partially offset by an increase in U.S. pension costs and stock-based compensation expense.
2015 compared to 2014
Consolidated SG&A costs increased by $4.3 million, or 1.9%, in 2015, including the impact of foreign currency translation, which decreased SG&A costs by $12.5 million.
27
Proprietary Products – Proprietary Products SG&A costs decreased by $1.3 million, or 0.8%, in 2015, as the impact of foreign currency translation, which decreased SG&A costs by $12.2 million, was offset by increases in compensation costs related to merit increases and incentive compensation costs.
Contract-Manufactured Products – Contract-Manufactured Products SG&A costs increased by $1.0 million, or 6.8%, in 2015, as increases in incentive compensation costs and compensation costs were offset by decreases in sales costs and the impact of foreign currency translation, which decreased SG&A costs by $0.3 million.
Corporate – Corporate’s SG&A costs increased by $4.6 million, or 8.6%, in 2015, due to increased incentive compensation costs and stock-based compensation expense, both of which were partially offset by decreases in U.S. pension costs and outside services.
Other Expense (Income)
The following table presents other income and expense items, consolidated and by reportable segment and unallocated items:
Expense (income) | Year Ended December 31, | ||||||||||
($ in millions) | 2016 | 2015 | 2014 | ||||||||
Proprietary Products | $ | 1.0 | $ | (1.2 | ) | $ | (1.0 | ) | |||
Contract-Manufactured Products | (0.3 | ) | — | (0.5 | ) | ||||||
Corporate | — | — | 0.1 | ||||||||
Unallocated items | 27.0 | 61.3 | 1.2 | ||||||||
Consolidated other expense (income) | $ | 27.7 | $ | 60.1 | $ | (0.2 | ) | ||||
Other income and expense items, consisting of foreign exchange transaction gains and losses, gains and losses on the sale of fixed assets, development income, contingent consideration costs, and miscellaneous income and charges, are generally recorded within segment results.
2016 compared to 2015
Consolidated other expense decreased by $32.4 million in 2016.
Proprietary Products – Proprietary Products other expense increased by $2.2 million in 2016, primarily due to increased contingent consideration costs and foreign exchange transaction losses.
Contract-Manufactured Products – Contract-Manufactured Products other income increased by $0.3 million in 2016, due to gains on the sale of fixed assets recorded in 2016.
Unallocated items – During 2016, we recorded $26.4 million in restructuring and related charges, consisting of $8.9 million for severance charges, $10.0 million for a non-cash asset write-down associated with the discontinued use of a trademark, $7.3 million for non-cash asset write-downs associated with the discontinued use of a patent and certain equipment, and $0.2 million for other charges. In addition, during 2016, we recorded a pension curtailment gain of $2.1 million in connection with our decision to freeze both our U.S. qualified and non-qualified defined benefit pension plans as of January 1, 2019, and recorded a charge of $2.7 million related to the devaluation of the Venezuelan Bolivar from the previously-prevailing official exchange rate of 6.3 Bolivars to USD to 10.0 Bolivars to USD. Please refer to Note 14, Other Expense (Income), for further discussion of these items.
2015 compared to 2014
Consolidated other expense increased by $60.3 million in 2015.
28
Proprietary Products – Proprietary Products other income increased by $0.2 million in 2015, primarily due to an asset write-off recorded in 2014.
Contract-Manufactured Products – Contract-Manufactured Products other income decreased by $0.5 million in 2015, due to including a gain recorded in 2014 as a result of the sale of a contract services business.
Corporate – Corporate other expense decreased by $0.1 million to zero in 2015.
Unallocated items – During 2015, we recorded a $50.4 million pension settlement charge, of which $47.0 million related to our purchase of a group annuity contract from Metropolitan Life Insurance Company (“MetLife”). The remaining portion of the pension settlement charge related to lump-sum payouts made to terminated vested participants of our U.S. qualified pension plan. In addition, during 2015, we recorded a $10.9 million charge for executive retirement and related costs, including $2.4 million for a long-term incentive plan award for our previous Chief Executive Officer (“CEO”), $8.0 million for the revaluation of modified outstanding awards to provide for continued vesting for our previous CEO and Senior Vice President of Human Resources in conjunction with their retirement, and $0.5 million for other costs, including relocation and legal fees. Please refer to Note 14, Other Expense (Income), for further discussion of these items.
Operating Profit
The following table presents adjusted operating profit, consolidated and by reportable segment, corporate and unallocated items:
Year Ended December 31, | % Change | ||||||||||||||||
($ in millions) | 2016 | 2015 | 2014 | 2016/2015 | 2015/2014 | ||||||||||||
Proprietary Products | $ | 241.9 | $ | 212.2 | $ | 199.6 | 14.0 | % | 6.3 | % | |||||||
Contract-Manufactured Products | 38.2 | 35.5 | 36.9 | 7.6 | % | (3.8 | )% | ||||||||||
Corporate | (56.3 | ) | (57.8 | ) | (53.3 | ) | (2.6 | )% | 8.4 | % | |||||||
Adjusted consolidated operating profit | $ | 223.8 | $ | 189.9 | $ | 183.2 | 17.9 | % | 3.7 | % | |||||||
Adjusted consolidated operating profit margin | 14.8 | % | 13.6 | % | 12.9 | % | |||||||||||
Unallocated items | (27.0 | ) | (61.3 | ) | (1.2 | ) | |||||||||||
Consolidated operating profit | $ | 196.8 | $ | 128.6 | $ | 182.0 | 53.0 | % | (29.3 | )% | |||||||
Consolidated operating profit margin | 13.0 | % | 9.2 | % | 12.8 | % | |||||||||||
2016 compared to 2015
Consolidated operating profit increased by $68.2 million, or 53.0%, in 2016, including an unfavorable foreign currency translation impact of $4.0 million.
Proprietary Products – Proprietary Products operating profit increased by $29.7 million, or 14.0%, in 2016, including an unfavorable foreign currency translation impact of $4.0 million, due to the factors described above.
Contract-Manufactured Products – Contract-Manufactured Products operating profit increased by $2.7 million, or 7.6%, in 2016, due to the factors described above.
Corporate – Corporate costs decreased by $1.5 million, or 2.6%, in 2016, due to the factors described above.
Unallocated items – Please refer to the Other Expense (Income) section for details.
Excluding the unallocated items, our adjusted consolidated operating profit margin increased by 1.2 margin points in 2016.
29
2015 compared to 2014
Consolidated operating profit decreased by $53.4 million, or 29.3%, in 2015, including an unfavorable foreign currency translation impact of $29.3 million.
Proprietary Products – Proprietary Products operating profit increased by $12.6 million, or 6.3%, in 2015, including an unfavorable foreign currency translation impact of $28.7 million, due to the factors described above.
Contract-Manufactured Products – Contract-Manufactured Products operating profit decreased by $1.4 million, or 3.8%, in 2015, including an unfavorable foreign currency translation impact of $0.6 million, due to the factors described above.
Corporate – Corporate costs increased by $4.5 million, or 8.4%, in 2015, due to the factors described above.
Unallocated items – Please refer to the Other Expense (Income) section for details.
Excluding the unallocated items, our adjusted consolidated operating profit margin increased by 0.7 margin points in 2015.
Interest Expense, Net
The following table presents interest expense, net, by significant component:
Year Ended December 31, | % Change | ||||||||||||||||
($ in millions) | 2016 | 2015 | 2014 | 2016/2015 | 2015/2014 | ||||||||||||
Interest expense | $ | 11.7 | $ | 15.6 | $ | 18.1 | (25.0 | )% | (13.8 | )% | |||||||
Capitalized interest | (3.6 | ) | (1.5 | ) | (1.6 | ) | 140.0 | % | (6.3 | )% | |||||||
Interest income | (1.1 | ) | (1.6 | ) | (3.5 | ) | (31.3 | )% | (54.3 | )% | |||||||
Interest expense, net | $ | 7.0 | $ | 12.5 | $ | 13.0 | (44.0 | )% | (3.8 | )% | |||||||
2016 compared to 2015
Interest expense, net, decreased by 5.5 million, or 44.0%, in 2016, due to lower interest expense resulting from less debt outstanding during 2016 and increases in capitalized interest resulting from ongoing capital projects, including the construction of our new facility in Waterford, Ireland.
2015 compared to 2014
Interest expense, net, decreased by 0.5 million, or 3.8%, in 2015, primarily due to lower interest expense resulting from less debt outstanding during 2015, partially offset by a decrease in interest income. During 2014, we recorded $1.6 million in interest income following the settlement of a tax matter in Brazil.
Income Taxes
The provision for income taxes was $54.5 million, $26.3 million, and $47.2 million for the years 2016, 2015, and 2014, respectively, and the effective tax rate was 28.7%, 22.6%, and 28.0%, respectively.
During 2016, we recorded a tax benefit of $9.0 million in connection with restructuring and related charges of $26.4 million, a discrete tax charge of $0.8 million related to the pension curtailment gain of $2.1 million, and a discrete tax charge of $1.0 million resulting from the impact of changes in enacted tax rates on our previously-recorded deferred tax asset and liability balances.
During 2015, we recorded a tax benefit of $18.4 million in connection with the pension settlement charge of $50.4 million, a tax benefit of $4.0 million in connection with the $10.9 million charge for executive retirement and related
30
costs of $10.9 million, and a discrete tax charge of $0.8 million resulting from the impact of a change in the enacted tax rate in the United Kingdom on our previously-recorded deferred tax asset balances.
During 2014, we recorded a tax benefit of $0.4 million in connection with the charge for license costs associated with acquired in-process research of $1.2 million, a discrete tax charge of $1.0 million resulting from the impact of a change in apportionment factors on state tax rates applied to items in other comprehensive income (“OCI”), and a discrete tax charge of $0.8 million as a result of the finalization of estimates of foreign tax credits available with respect to a repatriation of cash from our subsidiaries in Israel.
Please refer to Note 15, Income Taxes, for further discussion of our income taxes.
Equity in Net Income of Affiliated Companies
Equity in net income of affiliated companies represents the contribution to earnings from our 25% ownership interest in Daikyo and our 49% ownership interest in four companies in Mexico. Equity in net income of affiliated companies was $8.2 million, $5.8 million, and $5.3 million for the years 2016, 2015 and 2014, respectively. Equity in net income of affiliated companies increased by $2.4 million, or 41.4%, in 2016, due to favorable operating results at Daikyo. Equity in net income of affiliated companies increased by $0.5 million, or 9.4%, in 2015, as favorable operating results in Mexico were partially offset by unfavorable operating results at Daikyo. Please refer to Note 5, Affiliated Companies, for further discussion of our affiliated companies.
Net Income
Net income in 2016 was $143.6 million, or $1.91 per diluted share, compared to $95.6 million, or $1.30 per diluted share, in 2015. Our 2016 results included the impact of restructuring and related charges of $17.4 million (net of $9.0 million in tax), a charge related to the devaluation of the Venezuelan Bolivar of $2.7 million, a pension curtailment gain of $1.3 million (net of $0.8 million in tax), and a discrete tax charge of $1.0 million.
Net income in 2015 was $95.6 million, or $1.30 per diluted share, compared to $127.1 million, or $1.75 per diluted share, in 2014. Our 2015 results included the impact of a pension settlement charge of $32.0 million (net of $18.4 million in tax), a charge for executive retirement and related costs of $6.9 million (net of $4.0 million in tax) and a discrete tax charge of $0.8 million.
Net income in 2014 was $127.1 million, or $1.75 per diluted share, compared to $112.3 million, or $1.57 per diluted share, in 2013. Our 2014 results included the impact of a charge for license costs associated with acquired in-process research of $0.8 million (net of $0.4 million in tax) and discrete tax charges of $1.8 million.
FINANCIAL CONDITION, LIQUIDITY AND CAPITAL RESOURCES
Cash Flows
The following table presents cash flow data for the years ended December 31:
($ in millions) | 2016 | 2015 | 2014 | ||||||||
Net cash provided by operating activities | $ | 219.4 | $ | 212.4 | $ | 182.9 | |||||
Net cash used in investing activities | $ | (175.8 | ) | $ | (129.5 | ) | $ | (104.0 | ) | ||
Net cash used in financing activities | $ | (113.9 | ) | $ | (41.5 | ) | $ | (30.8 | ) | ||
Net Cash Provided by Operating Activities
2016 compared to 2015
Net cash provided by operating activities increased by $7.0 million in 2016, due to improved operating results and a decrease in pension plan contributions, partially offset by higher working capital requirements.
31
2015 compared to 2014
Net cash provided by operating activities increased by $29.5 million in 2015, due to increased earnings before non-cash charges and lower working capital requirements.
Net Cash Used in Investing Activities
2016 compared to 2015
Net cash used in investing activities increased by $46.3 million in 2016, due to an increase in capital spending, to $170.2 million, and our $8.4 million cost-method investment in an intradermal drug delivery company. The capital spending for 2016 consisted of spending for new products, expansion activity, and emerging markets, including the construction of our new facility in Waterford, Ireland.
2015 compared to 2014
Net cash used in investing activities increased by $25.5 million in 2015, due to an increase in capital spending, to $131.6 million, and sales and maturities of our remaining short-term investments in 2014. The capital spending for 2015 consisted of spending for new products, expansion activity, and emerging markets, including projects in the U.S., Europe, and Asia.
Net Cash Used in Financing Activities
2016 compared to 2015
Net cash used in financing activities increased by $72.4 million in 2016, due to net debt repayments of $69.8 million, which included the maturity of our Euro note B, and $52.2 million in treasury share purchases under the repurchase program announced in December 2015, partially offset by increases in proceeds and excess tax benefits from employee stock plans. Please refer to Note 3, Net Income Per Share, for further discussion of the share repurchase program.
2015 compared to 2014
Net cash used in financing activities increased by $10.7 million in 2015, due to an increase in net debt repayments and dividend payments.
We paid cash dividends totaling $35.8 million ($0.49 per share), $32.4 million ($0.45 per share) and $29.1 million ($0.41 per share) during 2016, 2015 and 2014, respectively.
Liquidity and Capital Resources
The table below presents selected liquidity and capital measures as of:
($ in millions) | December 31, 2016 | December 31, 2015 | |||||
Cash and cash equivalents | $ | 203.0 | $ | 274.6 | |||
Working capital | $ | 400.9 | $ | 359.4 | |||
Total debt | $ | 228.6 | $ | 298.2 | |||
Total equity | $ | 1,117.5 | $ | 1,023.9 | |||
Net debt-to-total invested capital | 2.2 | % | 2.3 | % | |||
Cash and cash equivalents include all instruments that have maturities of ninety days or less when purchased. Working capital is defined as current assets less current liabilities. Net debt is defined as total debt less cash and cash equivalents, and total invested capital is defined as the sum of net debt and total equity. Net debt and total invested capital are non-U.S. GAAP financial measures that should not be used as a substitute for the comparable U.S. GAAP financial measures. The non-U.S. GAAP financial measures are incorporated into our discussion and analysis as
32
management believes that this information provides users with a valuable insight into our overall performance and financial position.
Cash and cash equivalents – Our cash and cash equivalents balance at December 31, 2016 consisted of cash held in depository accounts with banks around the world and cash invested in high-quality, short-term investments. The cash and cash equivalents balance at December 31, 2016 included $83.1 million of cash held by subsidiaries within the U.S., and $119.9 million of cash held by subsidiaries outside of the U.S. Deferred income taxes have not been provided for any funds held by the subsidiaries outside of the U.S., as such earnings are intended to be reinvested indefinitely outside of the U.S.
Working capital - Working capital at December 31, 2016 increased by $41.5 million, or 11.5%, as compared to December 31, 2015, including a decrease of $5.8 million due to foreign currency translation. Excluding the impact of currency exchange rates, cash and cash equivalents decreased by $70.3 million, accounts receivable and inventories increased by $23.3 million and $21.2 million, respectively, and total current liabilities decreased by $70.0 million. Accounts receivable and inventories increased due to increased sales activity and production during the fourth quarter of 2016, as compared to the fourth quarter of 2015. The decrease in current liabilities was primarily due to the maturity of our Euro note B in February 2016.
Debt and credit facilities - The $69.6 million decrease in total debt at December 31, 2016, as compared to December 31, 2015, resulted from net debt repayments of $69.8 million, which included the maturity of our Euro note B, partially offset by a reduction of $0.2 million in unamortized debt issuance costs.
Our sources of liquidity include our Credit Facility. At December 31, 2016, we had $26.4 million in outstanding long-term borrowings under this facility, of which $4.3 million was denominated in Yen and $22.1 million was denominated in Euro. These borrowings, together with outstanding letters of credit of $3.0 million, resulted in a borrowing capacity available under our Credit Facility of $270.6 million at December 31, 2016. We do not expect any significant limitations on our ability to access this source of funds. Please refer to Note 8, Debt, for further discussion of our Credit Facility.
Pursuant to the financial covenants in our debt agreements, we are required to maintain established interest coverage ratios and to not exceed established leverage ratios. In addition, the agreements contain other customary covenants, none of which we consider restrictive to our operations. At December 31, 2016, we were in compliance with all of our debt covenants, and we expect to continue to be in compliance with the terms of these agreements throughout 2017.
We believe that cash on hand and cash generated from operations, together with availability under our Credit Facility, will be adequate to address our foreseeable liquidity needs based on our current expectations of our business operations, capital expenditures and scheduled payments of debt obligations.
33
Commitments and Contractual Obligations
The following table summarizes our commitments and contractual obligations at December 31, 2016. These obligations are not expected to have a material impact on liquidity.
Payments Due By Period | |||||||||||||||
($ in millions) | Total | Less than 1 year | 1 - 3 years | 3 - 5 years | More than 5 years | ||||||||||
Purchase obligations (1) | $ | 75.7 | $ | 4.2 | $ | 7.5 | $ | 18.3 | $ | 45.7 | |||||
Debt (including unamortized debt issuance costs) | 229.5 | 2.4 | 32.7 | 26.4 | 168.0 | ||||||||||
Interest on debt and interest rate swaps (2) | 58.7 | 9.0 | 14.2 | 13.5 | 22.0 | ||||||||||
Operating lease obligations | 68.4 | 12.3 | 19.4 | 10.2 | 26.5 | ||||||||||
Other long-term liabilities (3) | 19.4 | 0.5 | 3.1 | 5.3 | 10.5 | ||||||||||
Total contractual obligations (4) | $ | 451.7 | $ | 28.4 | $ | 76.9 | $ | 73.7 | $ | 272.7 | |||||
(1) | Our business creates a need to enter into various commitments with suppliers. In accordance with U.S. GAAP, these purchase obligations are not reflected in the accompanying consolidated balance sheets. These purchase commitments do not exceed our projected requirements and are in the normal course of business. |
(2) | For fixed-rate long-term debt, interest was based on principal amounts and fixed coupon rates at year-end. Future interest payments on variable-rate debt were calculated using principal amounts and the applicable ending interest rate at year-end. Interest on fixed-rate derivative instruments was based on notional amounts and fixed interest rates contractually obligated at year-end. |
(3) | Represents acquisition-related contingencies. In connection with certain business acquisitions, we agreed to make payments to the sellers if and when certain operating milestones are achieved, such as sales and operating income targets. |
(4) | This table does not include obligations pertaining to pension and postretirement benefits because the actual amount and timing of future contributions may vary significantly depending upon plan asset performance, benefit payments, and other factors. Contributions to our plans are expected to be $23.7 million in 2017. See Note 13, Benefit Plans, for estimated benefit payments over the next ten years. |
Reserves for uncertain tax positions - The table above does not include $6.2 million of total gross unrecognized tax benefits as of December 31, 2016. Due to the high degree of uncertainty regarding the timing of potential cash flows, we cannot reasonably estimate the settlement periods for amounts which may be paid.
Letters of credit - We have letters of credit totaling $3.0 million supporting the reimbursement of workers' compensation and other claims paid on our behalf by insurance carriers. Our accrual for insurance obligations was $4.4 million at December 31, 2016, of which $1.2 million is in excess of our deductible and, therefore, is reimbursable by the insurance company.
OFF-BALANCE SHEET ARRANGEMENTS
At December 31, 2016, we had no off-balance sheet financing arrangements other than operating leases, unconditional purchase obligations incurred in the ordinary course of business, and outstanding letters of credit related to various insurance programs.
34
CRITICAL ACCOUNTING POLICIES AND ESTIMATES
Management's discussion and analysis addresses consolidated financial statements that are prepared in accordance with U.S. GAAP. The application of these principles requires management to make estimates and assumptions, some of which are subjective and complex, that affect the amounts reported in the consolidated financial statements. We believe the following accounting policies and estimates are critical to understanding and evaluating our results of operations and financial position:
Revenue Recognition: Revenue is recognized when persuasive evidence of a sales arrangement exists, title and risk of loss have transferred, the selling price is fixed or determinable, and collectability is reasonably assured. Generally, sales are recognized upon shipment or upon delivery to our customers' site, based upon shipping terms or legal requirements. Some customers receive pricing rebates upon attaining established sales volumes. We record rebate costs when sales occur based on our assessment of the likelihood that the required volumes will be attained. We also maintain an allowance for product returns, as we believe that we are able to reasonably estimate the amount of returns based on our substantial historical experience.
Impairment of Long-Lived Assets: Long-lived assets, including property, plant and equipment, are tested for impairment whenever circumstances indicate that the carrying value of these assets may not be recoverable. An asset is considered impaired if the carrying value of the asset exceeds the sum of the future expected undiscounted cash flows to be derived from the asset. Once an asset is considered impaired, an impairment loss is recorded within other expense (income) for the difference between the asset's carrying value and its fair value. For assets held and used in the business, management determines fair value using estimated future cash flows to be derived from the asset, discounted to a net present value using an appropriate discount rate. For assets held for sale or for investment purposes, management determines fair value by estimating the proceeds to be received upon sale of the asset, less disposition costs. During 2016, as part of our restructuring plan, we recorded within other expense a $4.5 million non-cash asset write-down associated with the discontinued use of certain equipment.
Impairment of Goodwill and Other Intangible Assets: Goodwill and indefinite-lived intangible assets are tested for impairment at least annually, following the completion of our annual budget and long-range planning process, or whenever circumstances indicate that the carrying value of these assets may not be recoverable. Goodwill is tested for impairment at the reporting unit level, which is the same as, or one level below, our operating segments. Recent accounting guidance allows entities to first assess qualitative factors, including macroeconomic conditions, industry and market considerations, cost factors, and overall financial performance, to determine whether it is necessary to perform the first step of the two-step quantitative goodwill impairment test. We considered this guidance when performing our annual impairment testing, but elected to continue utilizing the two-step quantitative impairment test. The first step in the two-step test is to compare the fair value of each reporting unit to its carrying amount, including goodwill. If the carrying amount exceeds fair value, the second step must be performed. The second step requires the comparison of the carrying amount of the goodwill to its implied fair value, which is calculated as if the reporting unit had just been acquired as of the testing date. Any excess of the carrying amount of goodwill over the implied fair value would represent an impairment loss. Considerable management judgment is necessary to estimate fair value. Amounts and assumptions used in our goodwill impairment test, such as future sales, future cash flows and long-term growth rates, are consistent with internal projections and operating plans. Amounts and assumptions used in our goodwill impairment test are also largely dependent on the continued sale of drug products delivered by injection and the packaging of drug products, as well as our timeliness and success in new-product innovation or the development and commercialization of proprietary multi-component systems. Changes in the estimate of fair value, including the estimate of future cash flows, could have a material impact on our future results of operations and financial position. No impairment in the carrying value of our reporting units was evident as a result of our annual review of goodwill, and each of our reporting units had a fair value in excess of its carrying value of at least 180%.
At December 31, 2015, a trademark had been determined to have an indefinite life and, therefore, was not subject to amortization. During 2016, as part of our restructuring plan, we recorded within other expense a $10.0 million non-cash asset write-down associated with the discontinued use of this trademark.
35
Intangible assets with finite lives are amortized using the straight-line method over their estimated useful lives, and reviewed for impairment whenever circumstances indicate that the carrying value of these assets may not be recoverable. During 2016, as part of our restructuring plan, we recorded within other expense a $2.8 million non-cash asset write-down associated with the discontinued use of a patent.
Employee Benefits: We maintain funded and unfunded defined benefit pension plans in the U.S. and a number of other countries that cover employees who meet eligibility requirements. In addition, we sponsor postretirement benefit plans which provide healthcare benefits for eligible employees who retire or become disabled. The measurement of annual cost and obligations under these defined benefit postretirement plans is subject to a number of assumptions, which are specific for each of our U.S. and foreign plans. The assumptions, which are reviewed at least annually, are relevant to both the plan assets (where applicable) and the obligation for benefits that will ultimately be provided to our employees. Two of the most critical assumptions in determining pension and retiree medical plan expense are the discount rate and expected long-term rate of return on plan assets. Other assumptions reflect demographic factors such as retirement age, rates of compensation increases, mortality and turnover and are evaluated periodically and updated to reflect our actual experience. For our funded plans, we consider the current and expected asset allocations of our plan assets, as well as historical and expected rates of return in estimating the long-term rate of return on plan assets. Under U.S. GAAP, differences between actual and expected results are generally accumulated in other comprehensive income (loss) as actuarial gains or losses and subsequently amortized into earnings over future periods.
Changes in key assumptions could have a material impact on our future results of operations and financial position. We estimate that every 25 basis point reduction in our long-term rate of return assumption would increase pension expense by $0.4 million, and every 25 basis point reduction in our discount rate would increase pension expense by $0.6 million. A decrease in the discount rate increases the present value of benefit obligations. Our net pension underfunded balance at December 31, 2016 was $69.8 million, compared to $57.4 million at December 31, 2015. Our underfunded balance for other postretirement benefits was $8.0 million at December 31, 2016, compared to $10.2 million at December 31, 2015.
Income Taxes: We estimate income taxes payable based upon current domestic and international tax legislation. In addition, deferred income tax assets and liabilities are established to recognize differences between the tax basis and financial statement carrying values of assets and liabilities. We maintain valuation allowances where it is more likely than not that all or a portion of a deferred tax asset will not be realized. The recoverability of tax assets is subject to our estimates of future profitability, generally at the respective subsidiary company and country level. Changes in tax legislation, business plans and other factors may affect the ultimate recoverability of tax assets or final tax payments, which could result in adjustments to tax expense in the period such change is determined.
When accounting for uncertainty in income taxes recognized in our financial statements, we apply a more-likely-than-not threshold for financial statement recognition and measurement of a tax position taken or expected to be taken in a tax return.
Contingent Consideration
The fair value of the contingent consideration liability related to the SmartDose technology platform (the “SmartDose contingent consideration”) was initially determined using a probability-weighted income approach, and is revalued at each reporting date or more frequently if circumstances dictate. Changes in the fair value of this obligation are recorded as income or expense within other expense (income) in our consolidated statements of income. The significant unobservable inputs used in the fair value measurement of the contingent consideration are the sales projections, the probability of success factors, and the discount rate. Significant increases or decreases in any of those inputs in isolation would result in a significantly lower or higher fair value measurement. As development and commercialization of the SmartDose technology platform progresses, we may need to update the sales projections, the probability of success factors, and the discount rate used. This could result in a material increase or decrease to the contingent consideration liability.
36
See Note 1, Summary of Significant Accounting Policies and Note 2, New Accounting Standards, to our consolidated financial statements for additional information on accounting and reporting standards considered in the preparation and presentation of our financial statements.
ITEM 7A. QUANTITATIVE AND QUALITATIVE DISCLOSURES ABOUT MARKET RISK
We are exposed to various market risk factors such as fluctuating interest rates, foreign currency exchange rates and increasing commodity prices. These risk factors can impact our results of operations, cash flows and financial position. To manage these risks, we periodically enter into derivative financial instruments such as interest rate swaps, call options and forward exchange contracts for periods consistent with and for notional amounts equal to or less than the underlying exposures. In accordance with Company policy, derivative financial instruments are not used for investment or trading purposes.
Foreign Currency Exchange Risk
Sales outside of the U.S. accounted for 51.1% of consolidated net sales in 2016. Virtually all of these sales and related operating costs are denominated in the currency of the local country and translated into USD for consolidated reporting purposes. Although the majority of the assets and liabilities of these subsidiaries are denominated in the functional currency of the subsidiary, they may also hold assets or liabilities denominated in other currencies. These items may give rise to foreign currency transaction gains and losses. As a result, our results of operations and financial position are exposed to changing currency exchange rates. We periodically use forward contracts to hedge certain transactions or to neutralize month-end balance sheet exposures on cross-currency intercompany loans.
We have designated our €21.0 million Euro-denominated borrowings under our Credit Facility as a hedge of our net investment in certain European subsidiaries. We also have ¥500.0 million in Yen-denominated borrowings under our Credit Facility which has been designated as a hedge of our net investment in Daikyo. At December 31, 2016, a cumulative foreign currency translation gain on these hedges of $1.1 million (net of tax of $0.6 million) was recorded within accumulated other comprehensive loss.
Interest Rate Risk
As a result of our normal borrowing activities, we have long-term debt with both fixed and variable interest rates. Long-term debt consists of senior notes, revolving credit facilities and capital lease obligations. Our exposures to fluctuations in interest rates are managed to the extent considered necessary by entering into interest rate swap agreements.
The following table summarizes our interest rate risk-sensitive instruments:
($ in millions) | 2017 | 2018 | 2019 | 2020 | 2021 | Thereafter | Carrying Value | Fair Value | ||||||||||
Current Debt and Capital Leases: | ||||||||||||||||||
U.S. dollar denominated (1) | $ | 2.4 | $ | 2.4 | $ | 2.4 | ||||||||||||
Average interest rate - variable | 2.3 | % | ||||||||||||||||
Long-Term Debt: | ||||||||||||||||||
U.S. dollar denominated (1) | 32.6 | 0.1 | 32.7 | 32.7 | ||||||||||||||
Average interest rate - variable | 2.3 | % | ||||||||||||||||
U.S. dollar denominated | 168.0 | 168.0 | 169.2 | |||||||||||||||
Average interest rate - fixed | 3.9 | % | ||||||||||||||||
Euro denominated | 22.1 | 22.1 | 22.1 | |||||||||||||||
Average interest rate - variable | 1.0 | % | ||||||||||||||||
Yen denominated | 4.3 | 4.3 | 4.3 | |||||||||||||||
Average interest rate - variable | 1.0 | % | ||||||||||||||||
37
(1) As of December 31, 2016, we have a forward-start interest rate swap outstanding designed to hedge the variability in cash flows due to changes in the applicable interest rate of our $34.9 million five-year term loan. At December 31, 2016, this agreement had a fair value of $1.0 million, unfavorable to us, which was recorded as a noncurrent liability. Please refer to Note 9, Derivative Financial Instruments, for additional information on this interest rate hedge.
Commodity Price Risk
Many of our proprietary products are made from synthetic elastomers, which are derived from the petroleum refining process. We purchase the majority of our elastomers via long-term supply contracts, some of which contain clauses that provide for surcharges related to fluctuations in crude oil prices. In recent years, raw material costs have fluctuated due to crude oil price fluctuations. We expect this volatility to continue. We will continue to pursue pricing and hedging strategies, and ongoing cost control initiatives to offset the effects on gross profit.
In February 2016, we purchased a series of call options for a total of 71,900 barrels of crude oil to mitigate our exposure to such oil-based surcharges and protect operating cash flows with regards to a portion of our forecasted elastomer purchases through November 2016. With these contracts in 2016, we benefited $0.4 million due to increases in crude oil prices, offset by the $0.2 million premium that we paid to purchase the contracts.
In November 2016, we purchased a series of call options for a total of 96,525 barrels of crude oil through November 2017. During 2016, the gain recorded in cost of goods and services sold related to these options was less than $0.1 million.
38
ITEM 8. FINANCIAL STATEMENTS AND SUPPLEMENTARY DATA
CONSOLIDATED STATEMENTS OF INCOME
West Pharmaceutical Services, Inc. and Subsidiaries for the years ended December 31, 2016, 2015 and 2014
(In millions, except per share data)
2016 | 2015 | 2014 | ||||||||||
Net sales | $ | 1,509.1 | $ | 1,399.8 | $ | 1,421.4 | ||||||
Cost of goods and services sold | 1,008.0 | 944.0 | 973.6 | |||||||||
Gross profit | 501.1 | 455.8 | 447.8 | |||||||||
Research and development | 36.8 | 34.1 | 37.3 | |||||||||
Selling, general and administrative expenses | 239.8 | 233.0 | 228.7 | |||||||||
Other expense (income) (Note 14) | 27.7 | 60.1 | (0.2 | ) | ||||||||
Operating profit | 196.8 | 128.6 | 182.0 | |||||||||
Interest expense | 8.1 | 14.1 | 16.5 | |||||||||
Interest income | 1.1 | 1.6 | 3.5 | |||||||||
Income before income taxes | 189.8 | 116.1 | 169.0 | |||||||||
Income tax expense | 54.4 | 26.3 | 47.2 | |||||||||
Equity in net income of affiliated companies | 8.2 | 5.8 | 5.3 | |||||||||
Net income | $ | 143.6 | $ | 95.6 | $ | 127.1 | ||||||
Net income per share: | ||||||||||||
Basic | $ | 1.96 | $ | 1.33 | $ | 1.79 | ||||||
Diluted | $ | 1.91 | $ | 1.30 | $ | 1.75 | ||||||
Weighted average shares outstanding: | ||||||||||||
Basic | 73.3 | 72.0 | 70.9 | |||||||||
Diluted | 75.0 | 73.8 | 72.8 | |||||||||
Dividends declared per share | $ | 0.50 | $ | 0.46 | $ | 0.41 | ||||||
The accompanying notes are an integral part of the consolidated financial statements.
39
CONSOLIDATED STATEMENTS OF COMPREHENSIVE INCOME
West Pharmaceutical Services, Inc. and Subsidiaries for the years ended December 31, 2016, 2015 and 2014
(In millions)
2016 | 2015 | 2014 | |||||||||
Net income | $ | 143.6 | $ | 95.6 | $ | 127.1 | |||||
Other comprehensive (loss) income, net of tax: | |||||||||||
Foreign currency translation adjustments | (18.1 | ) | (70.3 | ) | (71.3 | ) | |||||
Defined benefit pension and other postretirement plans: | |||||||||||
Prior service credit arising during period, net of tax of $1.1 and $0.3 | 1.9 | 0.4 | — | ||||||||
Net actuarial loss arising during period, net of tax of $(4.8), $(6.0) and $(10.6) | (11.1 | ) | (9.3 | ) | (18.9 | ) | |||||
Settlement effects arising during period, net of tax of $1.1 and $18.7 | 2.0 | 31.7 | — | ||||||||
Less: amortization of actuarial loss, net of tax of $1.2, $1.6 and $1.1 | 2.2 | 2.9 | 2.0 | ||||||||
Less: amortization of prior service credit, net of tax of $(0.5), $(0.5) and $(0.5) | (0.9 | ) | (0.8 | ) | (0.8 | ) | |||||
Less: amortization of transition obligation | 0.1 | 0.1 | 0.1 | ||||||||
Net (losses) gains on investment securities, net of tax of $(0.1), $0.4 and $0.2 | (0.2 | ) | 0.7 | 0.4 | |||||||
Net (losses) gains on derivatives, net of tax of $0.1, $0.8 and $0.9 | (0.1 | ) | 1.2 | 1.7 | |||||||
Other comprehensive loss, net of tax | (24.2 | ) | (43.4 | ) | (86.8 | ) | |||||
Comprehensive income | $ | 119.4 | $ | 52.2 | $ | 40.3 | |||||
The accompanying notes are an integral part of the consolidated financial statements.
40
CONSOLIDATED BALANCE SHEETS
West Pharmaceutical Services, Inc. and Subsidiaries at December 31, 2016 and 2015
(In millions, except per share data)
2016 | 2015 | ||||||
ASSETS | |||||||
Current assets: | |||||||
Cash and cash equivalents | $ | 203.0 | $ | 274.6 | |||
Accounts receivable, net | 200.5 | 181.4 | |||||
Inventories | 199.3 | 181.1 | |||||
Other current assets | 39.1 | 36.6 | |||||
Total current assets | 641.9 | 673.7 | |||||
Property, plant and equipment | 1,554.7 | 1,440.3 | |||||
Less: accumulated depreciation and amortization | 776.4 | 719.3 | |||||
Property, plant and equipment, net | 778.3 | 721.0 | |||||
Investments in affiliated companies | 82.7 | 61.3 | |||||
Goodwill | 103.0 | 104.6 | |||||
Deferred income taxes | 66.2 | 70.5 | |||||
Intangible assets, net | 23.3 | 37.6 | |||||
Other noncurrent assets | 21.3 | 26.4 | |||||
Total Assets | $ | 1,716.7 | $ | 1,695.1 | |||
LIABILITIES AND EQUITY | |||||||
Current liabilities: | |||||||
Notes payable and other current debt | $ | 2.4 | $ | 69.3 | |||
Accounts payable | 122.0 | 119.8 | |||||
Pension and other postretirement benefits | 2.2 | 5.6 | |||||
Accrued salaries, wages and benefits | 51.6 | 53.0 | |||||
Income taxes payable | 4.5 | 12.8 | |||||
Other current liabilities | 58.3 | 53.8 | |||||
Total current liabilities | 241.0 | 314.3 | |||||
Long-term debt | 226.2 | 228.9 | |||||
Deferred income taxes | 9.2 | 12.4 | |||||
Pension and other postretirement benefits | 75.6 | 62.0 | |||||
Other long-term liabilities | 47.2 | 53.6 | |||||
Total Liabilities | 599.2 | 671.2 | |||||
Commitments and contingencies (Note 16) | |||||||
Equity: | |||||||
Preferred stock, 3.0 million shares authorized; 0 shares issued and 0 shares outstanding in 2016 and 2015 | — | — | |||||
Common stock, par value $.25 per share; 100.0 million shares authorized; shares issued: 73.7 million and 72.4 million; shares outstanding: 73.1 million and 72.3 million | 18.4 | 18.1 | |||||
Capital in excess of par value | 260.4 | 207.8 | |||||
Retained earnings | 1,071.6 | 964.6 | |||||
Accumulated other comprehensive loss | (186.8 | ) | (162.6 | ) | |||
Treasury stock, at cost (0.6 million and 0.1 million shares in 2016 and 2015) | (46.1 | ) | (4.0 | ) | |||
Total Equity | 1,117.5 | 1,023.9 | |||||
Total Liabilities and Equity | $ | 1,716.7 | $ | 1,695.1 | |||
The accompanying notes are an integral part of the consolidated financial statements.
41
CONSOLIDATED STATEMENT OF EQUITY
West Pharmaceutical Services, Inc. and Subsidiaries for the years ended December 31, 2016, 2015 and 2014
(In millions)
Common Shares Issued | Common Stock | Capital in Excess of Par Value | Number of Treasury Shares | Treasury Stock | Retained earnings | Accumulated other comprehensive loss | Total | ||||||||||||||||||||||
Balance, December 31, 2013 | 70.4 | $ | 17.6 | $ | 120.0 | 0.2 | $ | (3.8 | ) | $ | 805.0 | $ | (32.4 | ) | $ | 906.4 | |||||||||||||
Net income | — | — | — | — | — | 127.1 | — | 127.1 | |||||||||||||||||||||
Stock-based compensation | — | — | 15.5 | — | (0.3 | ) | — | — | 15.2 | ||||||||||||||||||||
Shares issued under stock plans | 1.1 | 0.2 | 20.9 | (0.1 | ) | — | — | — | 21.1 | ||||||||||||||||||||
Shares repurchased for employee tax withholdings | (0.1 | ) | — | (4.1 | ) | — | — | — | — | (4.1 | ) | ||||||||||||||||||
Excess tax benefits from employee stock plans | — | — | 7.9 | — | — | — | — | 7.9 | |||||||||||||||||||||
Dividends declared | — | — | — | — | — | (29.9 | ) | — | (29.9 | ) | |||||||||||||||||||
Other comprehensive loss, net of tax | — | — | — | — | — | — | (86.8 | ) | (86.8 | ) | |||||||||||||||||||
Balance, December 31, 2014 | 71.4 | 17.8 | 160.2 | 0.1 | (4.1 | ) | 902.2 | (119.2 | ) | 956.9 | |||||||||||||||||||
Net income | — | — | — | — | — | 95.6 | — | 95.6 | |||||||||||||||||||||
Stock-based compensation | — | 0.1 | 26.4 | — | 0.2 | — | — | 26.7 | |||||||||||||||||||||
Shares issued under stock plans | 1.1 | 0.2 | 17.6 | — | — | — | — | 17.8 | |||||||||||||||||||||
Shares repurchased for employee tax withholdings | (0.1 | ) | — | (5.5 | ) | — | (0.1 | ) | — | — | (5.6 | ) | |||||||||||||||||
Excess tax benefits from employee stock plans | — | — | 9.1 | — | — | — | — | 9.1 | |||||||||||||||||||||
Dividends declared | — | — | — | — | — | (33.2 | ) | — | (33.2 | ) | |||||||||||||||||||
Other comprehensive loss, net of tax | — | — | — | — | — | — | (43.4 | ) | (43.4 | ) | |||||||||||||||||||
Balance, December 31, 2015 | 72.4 | 18.1 | 207.8 | 0.1 | (4.0 | ) | 964.6 | (162.6 | ) | 1,023.9 | |||||||||||||||||||
Net income | — | — | — | — | — | 143.6 | — | 143.6 | |||||||||||||||||||||
Stock-based compensation | — | — | 17.1 | — | 0.2 | — | — | 17.3 | |||||||||||||||||||||
Shares issued under stock plans | 1.4 | 0.3 | 21.0 | — | 9.9 | — | — | 31.2 | |||||||||||||||||||||
Shares purchased under share repurchase program | — | — | — | 0.5 | (52.2 | ) | — | — | (52.2 | ) | |||||||||||||||||||
Shares repurchased for employee tax withholdings | (0.1 | ) | — | (3.7 | ) | — | — | — | — | (3.7 | ) | ||||||||||||||||||
Excess tax benefits from employee stock plans | — | — | 18.2 | — | — | — | — | 18.2 | |||||||||||||||||||||
Dividends declared | — | — | — | — | — | (36.6 | ) | — | (36.6 | ) | |||||||||||||||||||
Other comprehensive loss, net of tax | — | — | — | — | — | — | (24.2 | ) | (24.2 | ) | |||||||||||||||||||
Balance, December 31, 2016 | 73.7 | $ | 18.4 | $ | 260.4 | 0.6 | $ | (46.1 | ) | $ | 1,071.6 | $ | (186.8 | ) | $ | 1,117.5 | |||||||||||||
The accompanying notes are an integral part of the consolidated financial statements.
42
CONSOLIDATED STATEMENTS OF CASH FLOWS
West Pharmaceutical Services, Inc. and Subsidiaries for the years ended December 31, 2016, 2015 and 2014
(In millions)
2016 | 2015 | 2014 | |||||||||
Cash flows from operating activities: | |||||||||||
Net income | $ | 143.6 | $ | 95.6 | $ | 127.1 | |||||
Adjustments to reconcile net income to net cash provided by operating activities: | |||||||||||
Depreciation | 88.1 | 86.1 | 84.8 | ||||||||
Amortization | 2.6 | 3.8 | 5.2 | ||||||||
Stock-based compensation | 19.5 | 29.6 | 18.6 | ||||||||
Non-cash restructuring charges | 17.5 | — | — | ||||||||
Pension (curtailment gain) settlement charge | (2.1 | ) | 50.4 | — | |||||||
Loss on sales of equipment | 0.7 | 0.4 | 0.3 | ||||||||
Deferred income taxes | 21.5 | (8.9 | ) | 7.0 | |||||||
Pension and other retirement plans, net | (6.5 | ) | (28.8 | ) | (25.0 | ) | |||||
Equity in undistributed earnings of affiliates, net of dividends | (6.8 | ) | (5.0 | ) | (4.5 | ) | |||||
Changes in assets/liabilities: | |||||||||||
Increase in accounts receivable | (23.3 | ) | (14.1 | ) | (6.3 | ) | |||||
Increase in inventories | (21.2 | ) | (11.4 | ) | (16.2 | ) | |||||
Increase in other current assets | (2.4 | ) | (2.6 | ) | (11.7 | ) | |||||
Increase (decrease) in accounts payable | 6.1 | 17.2 | (3.5 | ) | |||||||
Changes in other assets and liabilities | (17.9 | ) | 0.1 | 7.1 | |||||||
Net cash provided by operating activities | 219.4 | 212.4 | 182.9 | ||||||||
Cash flows from investing activities: | |||||||||||
Capital expenditures | (170.2 | ) | (131.6 | ) | (111.9 | ) | |||||
Acquisition of patents and other long-term assets | — | — | (0.2 | ) | |||||||
Sales and maturities of short-term investments | — | — | 16.8 | ||||||||
Purchases of short-term investments | — | — | (9.3 | ) | |||||||
Purchase of cost-method investments | (8.4 | ) | (1.5 | ) | (0.5 | ) | |||||
Other, net | 2.8 | 3.6 | 1.1 | ||||||||
Net cash used in investing activities | (175.8 | ) | (129.5 | ) | (104.0 | ) | |||||
Cash flows from financing activities: | |||||||||||
Borrowings under revolving credit agreements | — | 71.4 | 263.4 | ||||||||
Repayments under revolving credit agreements | — | (71.4 | ) | (283.4 | ) | ||||||
Debt issuance costs | — | (1.0 | ) | — | |||||||
Repayments of long-term debt | (69.8 | ) | (27.4 | ) | (2.3 | ) | |||||
Dividend payments | (35.8 | ) | (32.4 | ) | (29.1 | ) | |||||
Contingent consideration payments | (0.3 | ) | (0.1 | ) | (0.3 | ) | |||||
Proceeds from exercise of stock options and stock appreciation rights | 25.9 | 12.7 | 14.3 | ||||||||
Employee stock purchase plan contributions | 3.8 | 3.2 | 2.8 | ||||||||
Excess tax benefits from employee stock plans | 18.2 | 9.1 | 7.9 | ||||||||
Shares purchased under share repurchase program | (52.2 | ) | — | — | |||||||
Shares repurchased for employee tax withholdings | (3.7 | ) | (5.6 | ) | (4.1 | ) | |||||
Net cash used in financing activities | (113.9 | ) | (41.5 | ) | (30.8 | ) | |||||
Effect of exchange rates on cash | (1.3 | ) | (22.1 | ) | (22.8 | ) | |||||
Net (decrease) increase in cash and cash equivalents | (71.6 | ) | 19.3 | 25.3 | |||||||
Cash, including cash equivalents at beginning of period | 274.6 | 255.3 | 230.0 | ||||||||
Cash, including cash equivalents at end of period | $ | 203.0 | $ | 274.6 | $ | 255.3 | |||||
Supplemental cash flow information: | |||||||||||
Interest paid, net of amounts capitalized | $ | 8.6 | $ | 14.7 | $ | 16.7 | |||||
Income taxes paid, net | $ | 48.1 | $ | 33.1 | $ | 37.4 | |||||
Accrued capital expenditures | $ | 22.7 | $ | 25.0 | $ | 21.0 | |||||
Dividends declared, not paid | $ | 9.5 | $ | 8.6 | $ | 7.8 | |||||
The accompanying notes are an integral part of the consolidated financial statements.
43
NOTES TO CONSOLIDATED FINANCIAL STATEMENTS
Note 1: Summary of Significant Accounting Policies
Principles of Consolidation: The consolidated financial statements include the accounts of West after the elimination of intercompany transactions. We have no participation or other rights in variable interest entities.
Use of Estimates: The financial statements are prepared in conformity with U.S. GAAP. These principles require management to make estimates and assumptions that affect the reported amounts of assets, liabilities, revenues and expenses and the disclosure of contingencies in the financial statements. Actual amounts realized may differ from these estimates.
Cash and Cash Equivalents: Cash equivalents include time deposits, certificates of deposit and all highly liquid debt instruments with maturities of three months or less at the time of purchase.
Accounts Receivable: Our accounts receivable balance was net of an allowance for doubtful accounts of $0.4 million and $0.6 million at December 31, 2016 and 2015, respectively. We record the allowance based on a specific identification methodology.
Inventories: Inventories are valued at the lower of cost (on a first-in, first-out basis) or market. The following is a summary of inventories at December 31:
($ in millions) | 2016 | 2015 | ||||
Raw materials | $ | 78.0 | $ | 74.4 | ||
Work in process | 28.9 | 30.1 | ||||
Finished goods | 92.4 | 76.6 | ||||
$ | 199.3 | $ | 181.1 | |||
Property, Plant and Equipment: Property, plant and equipment assets are carried at cost. Maintenance and minor repairs and renewals are charged to expense as incurred. Costs incurred for computer software developed or obtained for internal use are capitalized for application development activities and immediately expensed for preliminary project activities or post-implementation activities. Upon sale or retirement of depreciable assets, costs and related accumulated depreciation are eliminated, and gains or losses are recognized in other (income) expense. Depreciation and amortization are computed principally using the straight-line method over the estimated useful lives of the assets, or the remaining term of the lease, if shorter.
Impairment of Goodwill and Other Intangible Assets: Goodwill and indefinite-lived intangible assets are tested for impairment at least annually, following the completion of our annual budget and long-range planning process, or whenever circumstances indicate that the carrying value of these assets may not be recoverable. Goodwill is tested for impairment at the reporting unit level, which is the same as, or one level below, our operating segments. Recent accounting guidance allows entities to first assess qualitative factors, including macroeconomic conditions, industry and market considerations, cost factors, and overall financial performance, to determine whether it is necessary to perform the first step of the two-step quantitative goodwill impairment test. We considered this guidance when performing our annual impairment testing, but elected to continue utilizing the two-step quantitative impairment test. The first step in the two-step analysis is to compare the fair value of each reporting unit to its carrying amount, including goodwill. If the carrying amount exceeds fair value, the second step must be performed. The second step requires the comparison of the carrying amount of the goodwill to its implied fair value, which is calculated as if the reporting unit had just been acquired as of the testing date. Any excess of the carrying amount of goodwill over the implied fair value would represent an impairment loss.
At December 31, 2015, a trademark had been determined to have an indefinite life and, therefore, was not subject to amortization. During 2016, as part of our restructuring plan, we recorded within other expense a $10.0 million non-cash asset write-down associated with the discontinued use of this trademark.
44
Intangible assets with finite lives are amortized using the straight-line method over their estimated useful lives of 5 to 25 years, and reviewed for impairment whenever circumstances indicate that the carrying value of these assets may not be recoverable. During 2016, as part of our restructuring plan, we recorded within other expense a $2.8 million non-cash asset write-down associated with the discontinued use of a patent.
Impairment of Long-Lived Assets: Long-lived assets, including property, plant and equipment, are tested for impairment whenever circumstances indicate that the carrying value of these assets may not be recoverable. An asset is considered impaired if the carrying value of the asset exceeds the sum of the future expected undiscounted cash flows to be derived from the asset. Once an asset is considered impaired, an impairment loss is recorded within other (income) expense for the difference between the asset's carrying value and its fair value. For assets held and used in the business, management determines fair value using estimated future cash flows to be derived from the asset, discounted to a net present value using an appropriate discount rate. For assets held for sale or for investment purposes, management determines fair value by estimating the proceeds to be received upon sale of the asset, less disposition costs. During 2016, as part of our restructuring plan, we recorded within other expense a $4.5 million non-cash asset write-down associated with the discontinued use of certain equipment.
Employee Benefits: The measurement of the obligations under our defined benefit pension and postretirement medical plans are subject to a number of assumptions. These include the rate of return on plan assets (for funded plans) and the rate at which the future obligations are discounted to present value. U.S. GAAP requires the recognition of an asset or liability for the funded status of a defined benefit postretirement plan, as measured by the difference between the fair value of plan assets, if any, and the benefit obligation. For a pension plan, the benefit obligation is the projected benefit obligation; for any other postretirement plan, such as a retiree health plan, the benefit obligation is the accumulated postretirement benefit obligation. See Note 13, Benefit Plans, for a more detailed discussion of our pension and other retirement plans.
Financial Instruments: All derivatives are recognized as either assets or liabilities in the balance sheet and recorded at their fair value. For a derivative designated as hedging the exposure to variable cash flows of a forecasted transaction (referred to as a cash flow hedge), the effective portion of the derivative's gain or loss is initially reported as a component of OCI, net of tax, and subsequently reclassified into earnings when the forecasted transaction affects earnings. For a derivative designated as hedging the exposure to changes in the fair value of a recognized asset or liability or a firm commitment (referred to as a fair value hedge), the derivative's gain or loss is recognized in earnings in the period of change together with the offsetting loss or gain on the hedged item. For a derivative designated as hedging the foreign currency exposure of a net investment in a foreign operation, the gain or loss is reported in OCI, net of tax, as part of the cumulative translation adjustment. The ineffective portion of any derivative used in a hedging transaction is recognized immediately into earnings. Derivative financial instruments that are not designated as hedges are also recorded at fair value, with the change in fair value recognized immediately into earnings. We do not purchase or hold any derivative financial instrument for investment or trading purposes.
Foreign Currency Translation: Foreign currency transaction gains and losses are recognized in the determination of net income. Foreign currency translation adjustments of subsidiaries and affiliates operating outside of the U.S. are accumulated in other comprehensive loss, a separate component of equity.
Revenue Recognition: Revenue is recognized when persuasive evidence of a sales arrangement exists, title and risk of loss have transferred, the selling price is fixed or determinable, and collectability is reasonably assured. Generally, sales are recognized upon shipment or upon delivery to our customers' site, based upon shipping terms or legal requirements. Some customers receive pricing rebates upon attaining established sales volumes. We record rebate costs when sales occur based on our assessment of the likelihood that the required volumes will be attained. We also maintain an allowance for product returns, as we believe that we are able to reasonably estimate the amount of returns based on our substantial historical experience.
Shipping and Handling Costs: Shipping and handling costs are included in cost of goods and services sold. Shipping and handling costs billed to customers in connection with the sale are included in net sales.
45
Research and Development: Research and development expenditures are for the creation, engineering and application of new or improved products and processes. Expenditures include primarily salaries and outside services for those directly involved in research and development activities and are expensed as incurred.
Environmental Remediation and Compliance Costs: Environmental remediation costs are accrued when such costs are probable and reasonable estimates are determinable. Cost estimates include investigation, cleanup and monitoring activities; such estimates are adjusted, if necessary, based on additional findings. Environmental compliance costs are expensed as incurred as part of normal operations.
Litigation: From time to time, we are involved in legal proceedings, investigations and claims generally incidental to our normal business activities. In accordance with U.S. GAAP, we accrue for loss contingencies when it is probable that a liability has been incurred and the amount of the loss can be reasonably estimated. These estimates are based on an analysis made by internal and external legal counsel considering information known at the time. Legal costs in connection with loss contingencies are expensed as incurred.
Income Taxes: Deferred income taxes are recognized by applying enacted statutory tax rates, applicable to future years, to temporary differences between the tax basis and financial statement carrying values of our assets and liabilities. Valuation allowances are established when it is more likely than not that all or a portion of a deferred tax asset will not be realized. No provision is made for the U.S. income taxes on the undistributed earnings of wholly-owned foreign subsidiaries as such earnings are intended to be permanently reinvested. We recognize interest costs related to income taxes in interest expense and penalties within other (income) expense. The tax law ordering approach is used for purposes of determining whether an excess tax benefit has been realized during the year.
Stock-Based Compensation: Under the fair value provisions of U.S. GAAP, stock-based compensation cost is measured at the grant date based on the value of the award and is recognized as expense over the vesting period. In order to determine the fair value of stock options on the grant date, we use the Black-Scholes valuation model.
Net Income Per Share: Basic net income per share is computed by dividing net income attributable to common shareholders by the weighted average number of shares of common stock outstanding during each period. Net income per share assuming dilution considers the dilutive effect of outstanding stock options and other stock awards based on the treasury stock method. The treasury stock method assumes the use of exercise proceeds to repurchase common stock at the average fair market value in the period.
Note 2: New Accounting Standards
Recently Adopted Standards
In November 2015, the Financial Accounting Standards Board (“FASB”) issued guidance regarding the balance sheet classification of deferred taxes. This guidance requires that deferred tax assets and liabilities be classified as noncurrent. The requirement that deferred tax assets and liabilities of a tax-paying component of an entity be offset and presented as a single amount is not affected by these amendments. This guidance is effective for fiscal years, and interim periods within those years, beginning after December 15, 2016. Early adoption is permitted and the amendments may be applied either prospectively to all deferred tax assets and liabilities or retrospectively to all periods presented. We adopted this guidance in the fourth quarter of 2015, on a prospective basis. The adoption did not have a material impact on our financial statements.
In September 2015, the FASB issued guidance that simplifies the accounting for measurement-period adjustments in business combinations, by eliminating the requirement to account for those adjustments retrospectively. Instead, the acquirer will be required to recognize measurement-period adjustments in the reporting period in which the amounts are determined. We adopted this guidance as of January 1, 2016, on a prospective basis. The adoption did not have a material impact on our financial statements.
46
In May 2015, the FASB issued amended guidance on the disclosure requirements for certain investments whose fair value was measured using the net asset value (“NAV”) per share practical expedient. In addition, the guidance eliminates the requirement to categorize such investments within the fair value hierarchy table. This guidance is effective for fiscal years, and interim periods within those years, beginning after December 15, 2015. Early adoption is permitted, and retroactive application is required for all periods presented. We adopted this guidance in the fourth quarter of 2016. The adoption did not have a material impact on our financial statements. Please refer to Note 13, Benefit Plans, for additional details.
In April 2015, the FASB issued guidance regarding the classification of debt issuance costs. This guidance requires debt issuance costs related to a recognized debt liability to be presented in the balance sheet as a direct deduction from the carrying amount of that debt. Subsequently, in August 2015, the FASB issued additional guidance which addressed the presentation of debt issuance costs associated with lines of credit, whereby these costs may be presented as an asset and amortized ratably over the term of the line of credit arrangement, regardless of whether there are any outstanding borrowings. This guidance is effective for fiscal years, and interim periods within those years, beginning after December 15, 2015. Early adoption is permitted for financial statements that have not been previously issued, and retrospective application is required for each balance sheet presented. We adopted this guidance in the fourth quarter of 2015. The adoption did not have a material impact on our financial statements.
In April 2015, the FASB issued guidance on the accounting for fees paid by a customer in a cloud computing arrangement. We adopted this guidance as of January 1, 2016, on a prospective basis. The adoption did not have a material impact on our financial statements.
In February 2015, the FASB issued amended guidance that changes the analysis that a reporting entity must perform to determine whether it should consolidate certain types of legal entities. We adopted this guidance as of January 1, 2016, on a prospective basis. The adoption did not have a material impact on our financial statements.
In January 2015, the FASB issued guidance which removes the concept of extraordinary items from U.S. GAAP. This guidance eliminates the requirement for companies to spend time assessing whether items meet the criteria of being both unusual and infrequent. We adopted this guidance as of January 1, 2016. The adoption did not have a material impact on our financial statements.
In August 2014, the FASB issued guidance which defines management's responsibility to evaluate whether there is substantial doubt about an entity's ability to continue as a going concern and to provide related footnote disclosures. This guidance is effective for the annual period ending after December 15, 2016, and for annual periods and interim periods thereafter. We adopted this guidance in the fourth quarter of 2016. The adoption did not have an impact on our financial statements.
In June 2014, the FASB issued guidance that clarifies the accounting for share-based payments in which the terms of the award provide that a performance target that affects vesting could be achieved after the requisite service period. In this case, the performance target would be required to be treated as a performance condition, and should not be reflected in estimating the grant-date fair value of the award. The guidance also addresses when to recognize the related compensation cost. We adopted this guidance as of January 1, 2016. The adoption did not have a material impact on our financial statements.
Standards Issued Not Yet Adopted
In January 2017, the FASB issued guidance which removes the second step of the goodwill impairment test. A goodwill impairment charge will now be the amount by which a reporting unit's carrying amount exceeds its fair value, not to exceed the total amount of goodwill allocated to that reporting unit. This guidance is effective for fiscal years, and interim periods within those years, beginning after December 15, 2019. Early adoption is permitted. We are currently evaluating the impact that this guidance will have on our financial statements.
In January 2017, the FASB issued guidance which clarifies the definition of a business to assist entities with evaluating whether transactions should be accounted for as acquisitions (or disposals) of assets or businesses. This
47
guidance is effective for fiscal years, and interim periods within those years, beginning after December 15, 2017. We are currently evaluating the impact that this guidance will have on our financial statements.
In November 2016, the FASB issued guidance on the classification and presentation of restricted cash in the statement of cash flows. This guidance is effective for fiscal years, and interim periods within those years, beginning after December 15, 2017. Early adoption is permitted. We are currently evaluating the impact that this guidance will have on our financial statements.
In October 2016, the FASB issued guidance which requires companies to recognize the income tax consequences of an intra-entity transfer of an asset other than inventory when the transfer occurs. This guidance is effective for fiscal years, and interim periods within those years, beginning after December 15, 2017. Early adoption is permitted. We are currently evaluating the impact that this guidance will have on our financial statements.
In August 2016, the FASB issued guidance to reduce the diversity in how certain cash receipts and cash payments are presented and classified in the statement of cash flows. This guidance is effective for fiscal years, and interim periods within those years, beginning after December 15, 2017. Early adoption is permitted. We are currently evaluating the impact that this guidance will have on our financial statements.
In March 2016, the FASB issued guidance that simplifies several aspects of the accounting for share-based payment transactions, including income tax consequences, classification of awards as either equity or liabilities, and classification on the statement of cash flows. This guidance is effective for fiscal years, and interim periods within those years, beginning after December 15, 2016. Early adoption is permitted. We are currently evaluating the impact that this guidance will have on our financial statements.
In March 2016, the FASB issued guidance that simplifies the transition to the equity method of accounting. This guidance eliminates the requirement to retroactively adopt the equity method of accounting when there is an increase in the level of ownership interest or degree of influence. This guidance is effective for fiscal years, and interim periods within those years, beginning after December 15, 2016. We believe that the adoption of this guidance will not have a material impact on our financial statements.
In February 2016, the FASB issued guidance on the accounting for leases. This guidance requires lessees to recognize lease assets and lease liabilities on the balance sheet and to expand disclosures about leasing arrangements, both qualitative and quantitative. In terms of transition, the guidance requires adoption based upon a modified retrospective approach. This guidance is effective for fiscal years, and interim periods within those years, beginning after December 15, 2018. We are continuing to evaluate the impact that this guidance will have on our financial statements.
In January 2016, the FASB issued guidance that addresses certain aspects of recognition, measurement, presentation, and disclosure of financial instruments. This guidance is effective for fiscal years, and interim periods within those years, beginning after December 15, 2017. We believe that the adoption of this guidance will not have a material impact on our financial statements.
In July 2015, the FASB issued guidance regarding the subsequent measurement of inventory. This guidance requires inventory measured using any method other than last-in, first-out or the retail inventory method to be measured at the lower of cost and net realizable value. Net realizable value represents estimated selling prices in the ordinary course of business, less reasonably predictable costs of completion, disposal and transportation. This guidance is effective for fiscal years, and interim periods within those years, beginning after December 15, 2016. We believe that the adoption of this guidance will not have a material impact on our financial statements.
In May 2014, the FASB issued guidance on the accounting for revenue from contracts with customers that will supersede most existing revenue recognition guidance, including industry-specific guidance. The core principle requires an entity to recognize revenue to depict the transfer of goods or services to customers in an amount that reflects the consideration to which the entity expects to be entitled in exchange for those goods or services. In addition, the guidance requires enhanced disclosures regarding the nature, timing and uncertainty of revenue and
48
cash flows arising from an entity's contracts with customers. The FASB subsequently issued additional clarifying standards to address issues arising from implementation of the new revenue recognition standard. This guidance is effective for interim and annual reporting periods beginning on or after December 15, 2017. Early adoption is permitted as of one year prior to the current effective date. Entities can choose to apply the guidance using either a full retrospective approach or a modified retrospective approach. We have made progress towards completion of our evaluation of the potential impact that the adoption of this guidance will have on our financial statements.
Note 3: Net Income Per Share
The following table reconciles the shares used in the calculation of basic net income per share to those used for diluted net income per share:
(in millions) | 2016 | 2015 | 2014 | ||||||||
Net income | $ | 143.6 | $ | 95.6 | $ | 127.1 | |||||
Weighted average common shares outstanding | 73.3 | 72.0 | 70.9 | ||||||||
Dilutive effect of stock options, stock appreciation rights and performance share awards, based on the treasury stock method | 1.7 | 1.8 | 1.9 | ||||||||
Weighted average shares assuming dilution | 75.0 | 73.8 | 72.8 | ||||||||
During 2016, 2015 and 2014, there were 0.1 million, 0.7 million, and 0.5 million shares from stock-based compensation plans not included in the computation of diluted net income per share because their impact was antidilutive.
In December 2015, we announced a share repurchase program authorizing the repurchase of up to700,000 shares of our common stock from time to time on the open market or in privately-negotiated transactions as permitted under the Securities Exchange Act of 1934 Rule 10b-18. During 2016, we purchased 700,000 shares of our common stock under this program at a cost of $52.2 million, or an average price of $74.54 per share. This share repurchase program expired on December 31, 2016.
In December 2016, we announced a share repurchase program authorizing the repurchase of up to 800,000 shares of our common stock from time to time on the open market or in privately-negotiated transactions as permitted under the Securities Exchange Act of 1934 Rule 10b-18. The number of shares to be repurchased and the timing of such transactions will depend on a variety of factors, including market conditions. This share repurchase program commenced on January 1, 2017 and is expected to be completed by December 31, 2017.
Note 4: Property, Plant and Equipment
A summary of gross property, plant and equipment at December 31 is presented in the following table:
($ in millions) | Expected useful lives (years) | 2016 | 2015 | ||||
Land | $ | 18.6 | $ | 17.6 | |||
Buildings and improvements | 5-50 | 443.3 | 412.8 | ||||
Machinery and equipment | 10-15 | 698.5 | 674.8 | ||||
Molds and dies | 4-7 | 98.3 | 94.4 | ||||
Computer hardware and software | 3-10 | 121.9 | 118.3 | ||||
Construction in progress | 174.1 | 122.4 | |||||
$ | 1,554.7 | $ | 1,440.3 | ||||
Depreciation expense for the years ended December 31, 2016, 2015 and 2014 was $88.1 million, $86.1 million and $84.8 million, respectively.
49
There were no capitalized leases included in buildings and improvements at December 31, 2016. Capitalized leases included in machinery and equipment were $1.5 million at December 31, 2016. Capitalized leases included in buildings and improvements and machinery and equipment were $2.0 million and $1.5 million at December 31, 2015, respectively. Accumulated depreciation on all property, plant and equipment accounted for as capitalized leases was $1.5 million and $2.1 million at December 31, 2016 and 2015, respectively.
We capitalize interest on borrowings during the active construction period of major capital projects. Capitalized interest is added to the cost of the underlying assets and is amortized over the useful lives of the assets. Capitalized interest for the years ended December 31, 2016, 2015 and 2014 was $3.6 million, $1.5 million and $1.6 million, respectively.
During 2016, as part of our restructuring plan, we recorded within other expense a $4.5 million non-cash asset write-down associated with the discontinued use of certain equipment.
Note 5: Affiliated Companies
At December 31, 2016, the following affiliated companies were accounted for under the equity method:
Location | Ownership interest | |
The West Company Mexico, S.A. de C.V. | Mexico | 49% |
Aluplast S.A. de C.V. | Mexico | 49% |
Pharma Tap S.A. de C.V. | Mexico | 49% |
Pharma Rubber S.A. de C.V. | Mexico | 49% |
Daikyo | Japan | 25% |
Unremitted income of affiliated companies included in consolidated retained earnings amounted to $63.0 million, $56.2 million and $51.2 million at December 31, 2016, 2015 and 2014, respectively. Dividends received from affiliated companies were $1.4 million in 2016, $0.8 million in 2015 and $0.8 million in 2014.
Our equity in net unrealized gains of Daikyo's investment securities and derivative instruments, as well as pension adjustments, included in accumulated other comprehensive loss was $(5.3) million, $(5.4) million and $(4.7) million at December 31, 2016, 2015 and 2014, respectively.
Our purchases from, and royalty payments made to, affiliates totaled $94.5 million, $65.8 million and $68.9 million, respectively, in 2016, 2015 and 2014, of which $9.0 million and $10.1 million was due and payable as of December 31, 2016 and 2015, respectively. The majority of these transactions related to a distributorship agreement with Daikyo that allows us to purchase and re-sell Daikyo products. Sales to affiliates were $6.8 million, $5.3 million and $5.1 million, respectively, in 2016, 2015 and 2014, of which $0.9 million and $0.5 million was receivable as of December 31, 2016 and 2015, respectively.
At December 31, 2016 and 2015, the aggregate carrying amount of investments in equity-method affiliates was $69.3 million and $56.3 million, respectively. In addition, during 2016, we made an $8.4 million cost-method investment in an intradermal drug delivery company. At December 31, 2016 and 2015, we had cost-method investments, for which fair value was not readily determinable, with a carrying amount of $13.4 million and $5.0 million, respectively. We test our cost-method investments for impairment whenever circumstances indicate that the carrying value of the investments may not be recoverable.
50
Note 6: Goodwill and Intangible Assets
The changes in the carrying amount of goodwill by reportable segment were as follows:
($ in millions) | Proprietary Products | Contract-Manufactured Products | Total | ||||||
Balance, December 31, 2014 | $ | 78.9 | $ | 29.7 | $ | 108.6 | |||
Foreign currency translation | (3.8 | ) | (0.2 | ) | (4.0 | ) | |||
Balance, December 31, 2015 | 75.1 | 29.5 | 104.6 | ||||||
Foreign currency translation | (1.4 | ) | (0.2 | ) | (1.6 | ) | |||
Balance, December 31, 2016 | $ | 73.7 | $ | 29.3 | $ | 103.0 | |||
As of December 31, 2016, we had no accumulated goodwill impairment losses.
Intangible assets and accumulated amortization as of December 31 were as follows:
2016 | 2015 | |||||||||||||||||
($ in millions) | Cost | Accumulated Amortization | Net | Cost | Accumulated Amortization | Net | ||||||||||||
Patents and licensing | $ | 17.8 | $ | (13.4 | ) | $ | 4.4 | $ | 19.7 | $ | (12.8 | ) | $ | 6.9 | ||||
Technology | 3.3 | (0.7 | ) | 2.6 | 3.4 | (0.6 | ) | 2.8 | ||||||||||
Trademarks | 2.0 | (1.6 | ) | 0.4 | 12.0 | (1.4 | ) | 10.6 | ||||||||||
Customer relationships | 29.3 | (18.3 | ) | 11.0 | 29.5 | (17.7 | ) | 11.8 | ||||||||||
Customer contracts | 10.7 | (5.8 | ) | 4.9 | 10.8 | (5.3 | ) | 5.5 | ||||||||||
$ | 63.1 | $ | (39.8 | ) | $ | 23.3 | $ | 75.4 | $ | (37.8 | ) | $ | 37.6 | |||||
The cost basis of intangible assets includes a foreign currency translation loss of $0.3 million and $0.9 million for the years ended December 31, 2016 and 2015, respectively. Amortization expense for the years ended December 31, 2016, 2015 and 2014 was $2.6 million, $3.5 million and $4.9 million, respectively. Estimated annual amortization expense for the next five years is as follows: 2017 - $4.1 million, 2018 - $3.5 million, 2019 - $3.6 million, 2020 - $3.6 million and 2021 - $3.5 million. During 2016, as part of our restructuring plan, we recorded within other expense a $2.8 million non-cash asset write-down associated with the discontinued use of a patent and a $10.0 million non-cash asset write-down associated with the discontinued use of an indefinite-lived trademark.
Note 7: Other Current Liabilities
Other current liabilities as of December 31 included the following:
($ in millions) | 2016 | 2015 | ||||
Deferred income | $ | 13.2 | $ | 14.4 | ||
Other accrued expenses | 20.3 | 23.1 | ||||
Dividends payable | 9.5 | 8.6 | ||||
Restructuring obligations | 5.9 | — | ||||
Other | 9.4 | 7.7 | ||||
Total other current liabilities | $ | 58.3 | $ | 53.8 | ||
Other consisted primarily of value-added taxes payable and accrued taxes other than income.
51
Note 8: Debt
The following table summarizes our long-term debt obligations, net of unamortized debt issuance costs and current maturities, at December 31. The interest rates shown in parentheses are as of December 31, 2016.
($ in millions) | 2016 | 2015 | |||||
Euro note B, due February 27, 2016 | $ | — | $ | 66.8 | |||
Term loan, due January 1, 2018 (2.27%) | 34.9 | 37.1 | |||||
Note payable, due December 31, 2019 | 0.2 | 0.2 | |||||
Credit Facility, due October 15, 2020 (1.00%) | 26.4 | 27.1 | |||||
Series A notes, due July 5, 2022 (3.67%) | 42.0 | 42.0 | |||||
Series B notes, due July 5, 2024 (3.82%) | 53.0 | 53.0 | |||||
Series C notes, due July 5, 2027 (4.02%) | 73.0 | 73.0 | |||||
229.5 | 299.2 | ||||||
Less: unamortized debt issuance costs | 0.9 | 1.0 | |||||
Total debt | 228.6 | 298.2 | |||||
Less: current portion of long-term debt | 2.4 | 69.3 | |||||
Long-term debt | $ | 226.2 | $ | 228.9 | |||
Euro-denominated Note
Our Euro note B of €61.1 million ($66.8 million at December 31, 2015) matured in February 2016.
Term Loan
In 2013, we entered into a $42.8 million fivefive-year term loan due January 2018 related to our corporate office and research building. Borrowings under the loan bear interest at a variable rate equal to the London Interbank Offered Rate (“LIBOR”) plus a margin of 1.50 percentage points. Please refer to Note 9, Derivative Financial Instruments, for a discussion of the interest-rate swap agreement associated with this loan. At December 31, 2016, $34.9 million was outstanding under this loan, of which $2.4 million was classified as current. As of December 31, 2016 and 2015, there were unamortized debt issuance costs remaining of $0.1 million and $0.1 million, respectively, which are being amortized as additional interest expense over the term of the loan.
Credit Facility
In October 2015, we entered into the Credit Facility, that replaced our prior revolving credit facility, which was scheduled to expire in April 2017. The Credit Facility, which expires in October 2020, contains a $300.0 million credit facility, which may be increased from time to time by up to $100.0 million in the aggregate, subject to the satisfaction of certain conditions and upon approval by the banks. Up to $30.0 million of the Credit Facility is available for swing-line loans and up to $30.0 million is available for the issuance of standby letters of credit. Borrowings under the Credit Facility bear interest at either the base rate or at the applicable LIBOR rate, plus a tiered margin based on the ratio of our total debt to modified earnings before interest, taxes, depreciation and amortization (“EBITDA”), ranging from 0 to 75 basis points for base rate loans and 100 to 175 basis points for LIBOR rate loans. Consistent with our previous revolving credit facility, the Credit Facility contains representations and covenants that require compliance with, among other restrictions, a maximum leverage ratio and a minimum interest coverage ratio. The Credit Facility also contains usual and customary default provisions, and limitations on liens securing indebtedness, asset sales, distributions and acquisitions. As of December 31, 2016 and 2015, total unamortized debt issuance costs of $1.3 million and $1.6 million, respectively, were recorded in other noncurrent assets and are being amortized as additional interest expense over the term of the Credit Facility. A portion of these costs relate to our prior credit facility.
52
At December 31, 2016, we had $26.4 million in outstanding long-term borrowings under the Credit Facility, of which $4.3 million was denominated in Yen and $22.1 million in Euro. These borrowings, together with outstanding letters of credit of $3.0 million, resulted in a borrowing capacity available under the Credit Facility of $270.6 million at December 31, 2016.
Private Placement
In 2012, we concluded a private placement issuance of $168.0 million in senior unsecured notes. The total amount of the private placement issuance was divided into three tranches - $42.0 million 3.67% Series A Notes due July 5, 2022, $53.0 million 3.82% Series B Notes due July 5, 2024, and $73.0 million 4.02% Series C Notes due July 5, 2027 (the “Notes”). The Notes rank pari passu with our other senior unsecured debt. The weighted average of the coupon interest rates on the Notes is 3.87%. Related interest-rate hedging and transaction costs incurred increased the annual effective rate of interest on the Notes to an estimated 4.16%. Please refer to Note 9, Derivative Financial Instruments, for additional discussion of the related interest rate hedge. As of December 31, 2016 and 2015, there were unamortized debt issuance costs remaining of $0.8 million and $0.9 million, respectively, which are being amortized as additional interest expense over the term of the Notes.
Covenants
Pursuant to the financial covenants in our debt agreements, we are required to maintain established interest coverage ratios and to not exceed established leverage ratios. In addition, the agreements contain other customary covenants, none of which we consider restrictive to our operations. At December 31, 2016, we were in compliance with all of our debt covenants, and we expect to continue to be in compliance with the terms of these agreements throughout 2017.
Interest costs incurred during 2016, 2015 and 2014 were $11.7 million, $15.6 million and $18.1 million, respectively. The aggregate annual maturities of long-term debt were as follows: 2017 - $2.4 million, 2018 - $32.6 million, 2019 - $0.1 million, 2020 - $26.4 million, none in 2021, and thereafter - $168.0 million.
Note 9: Derivative Financial Instruments
Our ongoing business operations expose us to various risks such as fluctuating interest rates, foreign exchange rates and increasing commodity prices. To manage these market risks, we periodically enter into derivative financial instruments such as interest rate swaps, options and foreign exchange contracts for periods consistent with and for notional amounts equal to or less than the related underlying exposures. We do not purchase or hold any derivative financial instruments for investment or trading purposes. All derivatives are recorded on the balance sheet at fair value.
Interest Rate Risk
At December 31, 2016, we had a $34.9 million forward-start interest rate swap outstanding that hedges the variability in cash flows due to changes in the applicable interest rate of our variable-rate five-year term loan related to the purchase of our corporate office and research building. Under this swap, we receive variable interest rate payments based on one-month LIBOR plus a margin in return for making monthly fixed interest payments at 5.41%. We designated this swap as a cash flow hedge.
53
Foreign Exchange Rate Risk
In 2016 and 2015, we entered into forward exchange contracts, designated as fair value hedges, to neutralize our exposure to fluctuating foreign exchange rates on cross-currency intercompany loans. As of December 31, 2016 and December 31, 2015, the total amount of these forward exchange contracts was €57.5 million and €20.0 million, respectively.
In addition, in the fourth quarter of 2016, we entered into several foreign currency contracts, designated as cash flow hedges, for periods of up to eighteen months, intended to hedge the currency risk associated with a portion of our forecasted transactions denominated in foreign currencies. At December 31, 2016, we had outstanding foreign currency contracts to purchase and sell certain currencies, as follows:
(in millions) | Sell | ||||||
Currency | Purchase | USD | Euro | ||||
USD | 49.0 | — | 46.1 | ||||
Yen | 6,475.0 | 31.6 | 23.5 | ||||
Singapore Dollar | 37.0 | 18.2 | 7.3 | ||||
At December 31, 2016, a portion of our debt consisted of borrowings denominated in currencies other than USD. We have designated our €21.0 million ($22.1 million) Euro-denominated borrowings under our Credit Facility as a hedge of our net investment in certain European subsidiaries. A cumulative foreign currency translation gain of $1.7 million pre-tax ($1.1 million after tax) on this debt was recorded within accumulated other comprehensive loss as of December 31, 2016. We have also designated our ¥500.0 million ($4.3 million) Yen-denominated borrowings under our Credit Facility as a hedge of our net investment in Daikyo. At December 31, 2016, there was a cumulative foreign currency translation loss on this Yen-denominated debt of less than $0.1 million, which was also included within accumulated other comprehensive loss.
Commodity Price Risk
Many of our proprietary products are made from synthetic elastomers, which are derived from the petroleum refining process. We purchase the majority of our elastomers via long-term supply contracts, some of which contain clauses that provide for surcharges related to fluctuations in crude oil prices. The following economic hedges did not qualify for hedge accounting treatment since they did not meet the highly effective requirement at inception.
In February 2016, we purchased a series of call options for a total of 71,900 barrels of crude oil to mitigate our exposure to such oil-based surcharges and protect operating cash flows with regards to a portion of our forecasted elastomer purchases through November 2016. With these contracts in 2016, we benefited $0.4 million due to increases in crude oil prices, offset by the $0.2 million premium that we paid to purchase the contracts.
In November 2016, we purchased a series of call options for a total of 96,525 barrels of crude oil through November 2017. During 2016, the gain recorded in cost of goods and services sold related to these options was less than $0.1 million.
Effects of Derivative Instruments on Financial Position and Results of Operations
Please refer to Note 10, Fair Value Measurements, for the balance sheet location and fair values of our derivative instruments as of December 31, 2016 and 2015.
54
The following table summarizes the effects of derivative instruments designated as hedges on OCI and earnings, net of tax, for the year ended December 31:
Amount of (Loss)Gain Recognized in OCI | Amount of (Gain) Loss Reclassified from Accumulated OCI into Income | Location of (Gain) Loss Reclassified from Accumulated OCI into Income | |||||||||||||||
($ in millions) | 2016 | 2015 | 2016 | 2015 | |||||||||||||
Cash Flow Hedges: | |||||||||||||||||
Foreign currency hedge contracts | $ | (0.5 | ) | $ | 1.6 | $ | — | $ | (1.6 | ) | Net sales | ||||||
Foreign currency hedge contracts | (0.6 | ) | — | — | — | Cost of goods and services sold | |||||||||||
Interest rate swap contracts | (0.1 | ) | (0.3 | ) | 0.8 | 1.3 | Interest expense | ||||||||||
Forward treasury locks | — | — | 0.3 | 0.2 | Interest expense | ||||||||||||
Total | $ | (1.2 | ) | $ | 1.3 | $ | 1.1 | $ | (0.1 | ) | |||||||
Net Investment Hedges: | |||||||||||||||||
Foreign currency-denominated debt | $ | — | $ | 6.2 | $ | — | $ | — | Foreign exchange and other | ||||||||
Total | $ | — | $ | 6.2 | $ | — | $ | — | |||||||||
During 2016 and 2015, there was no material ineffectiveness related to our hedges.
Note 10: Fair Value Measurements
Fair value is defined as the price that would be received to sell an asset or paid to transfer a liability (an exit price) in the principal or most advantageous market for the asset or liability in an orderly transaction between market participants on the measurement date. The following fair value hierarchy classifies the inputs to valuation techniques used to measure fair value into one of three levels:
• | Level 1: Unadjusted quoted prices in active markets for identical assets or liabilities. |
• | Level 2: Inputs other than quoted prices that are observable for the asset or liability, either directly or indirectly. These include quoted prices for similar assets or liabilities in active markets and quoted prices for identical or similar assets or liabilities in markets that are not active. |
• | Level 3: Unobservable inputs that reflect the reporting entity’s own assumptions. |
The following tables present the assets and liabilities recorded at fair value on a recurring basis:
Balance at | Basis of Fair Value Measurements | ||||||||||||||
($ in millions) | December 31, 2016 | Level 1 | Level 2 | Level 3 | |||||||||||
Assets: | |||||||||||||||
Deferred compensation assets | $ | 7.4 | $ | 7.4 | $ | — | $ | — | |||||||
Foreign currency contracts | 0.2 | — | 0.2 | — | |||||||||||
$ | 7.6 | $ | 7.4 | $ | 0.2 | $ | — | ||||||||
Liabilities: | |||||||||||||||
Contingent consideration | $ | 8.0 | $ | — | $ | — | $ | 8.0 | |||||||
Deferred compensation liabilities | 8.4 | 8.4 | — | — | |||||||||||
Interest rate swap contract | 1.0 | — | 1.0 | — | |||||||||||
Foreign currency contracts | 1.6 | — | 1.6 | — | |||||||||||
$ | 19.0 | $ | 8.4 | $ | 2.6 | $ | 8.0 | ||||||||
55
Balance at | Basis of Fair Value Measurements | ||||||||||||||
($ in millions) | December 31, 2015 | Level 1 | Level 2 | Level 3 | |||||||||||
Assets: | |||||||||||||||
Deferred compensation assets | $ | 6.8 | $ | 6.8 | $ | — | $ | — | |||||||
Foreign currency contracts | 0.2 | — | 0.2 | — | |||||||||||
$ | 7.0 | $ | 6.8 | $ | 0.2 | $ | — | ||||||||
Liabilities: | |||||||||||||||
Contingent consideration | $ | 6.0 | $ | — | $ | — | $ | 6.0 | |||||||
Deferred compensation liabilities | 8.8 | 8.8 | — | — | |||||||||||
Interest rate swap contracts | 2.0 | — | 2.0 | — | |||||||||||
Foreign currency contracts | 0.2 | — | 0.2 | — | |||||||||||
$ | 17.0 | $ | 8.8 | $ | 2.2 | $ | 6.0 | ||||||||
Deferred compensation assets are included within other noncurrent assets and are valued using a market approach based on quoted market prices in an active market. The fair value of our foreign currency contracts, included within other current assets and other current liabilities, is valued using an income approach based on quoted forward foreign exchange rates and spot rates at the reporting date. The fair value of our contingent consideration, included within other current and long-term liabilities, is discussed further in the section related to Level 3 fair value measurements. The fair value of deferred compensation liabilities is based on quoted prices of the underlying employees’ investment selections and is included within other long-term liabilities. Our interest rate swap, included within other long-term liabilities, is valued based on the terms of the contract and observable market inputs (i.e., LIBOR, Eurodollar synthetic forwards and swap spreads). Please refer to Note 9, Derivative Financial Instruments, for further discussion of our derivatives.
Level 3 Fair Value Measurements
The fair value of the SmartDose contingent consideration was initially determined using a probability-weighted income approach, and is revalued at each reporting date or more frequently if circumstances dictate. Changes in the fair value of this obligation are recorded as income or expense within other expense (income) in our consolidated statements of income. The significant unobservable inputs used in the fair value measurement of the contingent consideration are the sales projections, the probability of success factors, and the discount rate. Significant increases or decreases in any of those inputs in isolation would result in a significantly lower or higher fair value measurement. As development and commercialization of the SmartDose technology platform progresses, we may need to update the sales projections, the probability of success factors, and the discount rate used. This could result in a material increase or decrease to the contingent consideration liability.
The following table provides a summary of changes in our Level 3 fair value measurements:
($ in millions) | |||
Balance, December 31, 2014 | $ | 5.0 | |
Increase in fair value recorded in earnings | 1.1 | ||
Payments | (0.1 | ) | |
Balance, December 31, 2015 | 6.0 | ||
Increase in fair value recorded in earnings | 2.3 | ||
Payments | (0.3 | ) | |
Balance, December 31, 2016 | $ | 8.0 | |
56
Please refer to Note 14, Other Expense (Income), for further discussion of acquisition-related contingencies.
Other Financial Instruments
We believe that the carrying amounts of our cash and cash equivalents and accounts receivable approximate their fair values due to their near-term maturities.
The estimated fair value of long-term debt is based on quoted market prices for debt issuances with similar terms and maturities and is classified as Level 2 within the fair value hierarchy. At December 31, 2016, the estimated fair value of long-term debt was $228.3 million compared to a carrying amount of $226.2 million. At December 31, 2015, the estimated fair value of long-term debt was $225.0 million and the carrying amount was $228.9 million.
Note 11: Accumulated Other Comprehensive Loss
The following table presents the changes in the components of accumulated other comprehensive loss, net of tax:
($ in millions) | Losses on cash flow hedges | Unrealized gains on investment securities | Defined benefit pension and other postretirement plans | Foreign currency translation | Total | ||||||||||
Balance, December 31, 2014 | $ | (4.3 | ) | $ | 4.7 | $ | (64.6 | ) | $ | (55.0 | ) | $ | (119.2 | ) | |
Other comprehensive income (loss) before reclassifications | 1.3 | 0.7 | (8.9 | ) | (70.3 | ) | (77.2 | ) | |||||||
Amounts reclassified out | (0.1 | ) | — | 33.9 | — | 33.8 | |||||||||
Other comprehensive income (loss), net of tax | 1.2 | 0.7 | 25.0 | (70.3 | ) | (43.4 | ) | ||||||||
Balance, December 31, 2015 | (3.1 | ) | 5.4 | (39.6 | ) | (125.3 | ) | (162.6 | ) | ||||||
Other comprehensive loss before reclassifications | (1.2 | ) | (0.2 | ) | (9.2 | ) | (18.1 | ) | (28.7 | ) | |||||
Amounts reclassified out | 1.1 | — | 3.4 | — | 4.5 | ||||||||||
Other comprehensive loss, net of tax | (0.1 | ) | (0.2 | ) | (5.8 | ) | (18.1 | ) | (24.2 | ) | |||||
Balance, December 31, 2016 | $ | (3.2 | ) | $ | 5.2 | $ | (45.4 | ) | $ | (143.4 | ) | $ | (186.8 | ) | |
57
A summary of the reclassifications out of accumulated other comprehensive loss is presented in the following table ($ in millions):
Detail of components | 2016 | 2015 | Location on Statement of Income | ||||
Losses on cash flow hedges: | |||||||
Foreign currency contracts | $ | — | $ | 1.8 | Net sales | ||
Interest rate swap contracts | (1.3 | ) | (2.1 | ) | Interest expense | ||
Forward treasury locks | (0.4 | ) | (0.3 | ) | Interest expense | ||
Total before tax | (1.7 | ) | (0.6 | ) | |||
Tax expense | 0.6 | 0.7 | |||||
Net of tax | $ | (1.1 | ) | $ | 0.1 | ||
Amortization of defined benefit pension and other postretirement plans: | |||||||
Transition obligation | $ | (0.1 | ) | $ | (0.1 | ) | (a) |
Prior service credit | 1.4 | 1.3 | (a) | ||||
Actuarial losses | (3.4 | ) | (4.5 | ) | (a) | ||
Curtailment | (3.1 | ) | — | (a) | |||
Settlements | — | (50.4 | ) | (a) | |||
Total before tax | (5.2 | ) | (53.7 | ) | |||
Tax expense | 1.8 | 19.8 | |||||
Net of tax | $ | (3.4 | ) | $ | (33.9 | ) | |
Total reclassifications for the period, net of tax | $ | (4.5 | ) | $ | (33.8 | ) | |
(a) These components are included in the computation of net periodic benefit cost. Please refer to Note 13, Benefit Plans, for additional details.
Note 12: Stock-Based Compensation
On May 3, 2016, our shareholders approved the adoption of the West Pharmaceutical Services, Inc. 2016 Omnibus Incentive Compensation Plan (the “2016 Plan”). All remaining shares available for issuance under the 2011 Omnibus Incentive Compensation Plan (the “2011 Plan”) were extinguished upon adoption of the 2016 Plan. Awards granted under previous plans remain outstanding until expiration or settlement. The 2016 Plan provides for the granting of stock options, stock appreciation rights, restricted stock awards and performance awards to employees and non-employee directors. A committee of the Board of Directors determines the terms and conditions of awards to be granted. Vesting requirements vary by award. At December 31, 2016, there were 5,334,471 shares remaining in the 2016 Plan for future grants.
Stock options and stock appreciation rights reduce the number of shares available by one share for each award granted. All other awards under the 2016 Plan will reduce the total number of shares available for grant by an amount equal to 2.5 times the number of shares awarded. If awards made under previous plans would entitle a plan participant to an amount of West stock in excess of the target amount, the additional shares (up to a maximum threshold amount) will be distributed under the 2016 Plan.
58
The following table summarizes our stock-based compensation expense recorded within selling, general and administrative expenses for the years ended December 31:
($ in millions) | 2016 | 2015 | 2014 | ||||||
Stock option and appreciation rights | $ | 8.6 | $ | 9.2 | $ | 7.6 | |||
Performance-vesting shares | 6.7 | 6.0 | 6.5 | ||||||
Performance-vesting units | 0.1 | 0.7 | 1.9 | ||||||
Performance-vesting shares/units dividend equivalents | 0.2 | 0.2 | 0.4 | ||||||
Employee stock purchase plan | 0.7 | 0.6 | 0.5 | ||||||
Deferred compensation plans | 3.2 | 2.5 | 1.7 | ||||||
Total stock-based compensation expense | $ | 19.5 | $ | 19.2 | $ | 18.6 | |||
In addition, we recorded a $0.2 million charge during 2016 as part of our restructuring plan, and we recorded a $10.4 million charge during 2015 related to executive retirements. Both charges were recorded within other expense. Please refer to Note 14, Other Expense (Income), for further discussion of these charges.
The amount of unrecognized compensation expense for all non-vested awards as of December 31, 2016, was approximately $16.2 million, which is expected to be recognized over a weighted average period of 1.7 years.
Stock Options
Stock options granted to employees vest in equal annual increments over 4 years of continuous service. All awards expire 10 years from the date of grant. Upon the exercise of stock options, shares are issued in exchange for the exercise price of the options.
The following table summarizes changes in outstanding options:
(in millions, except per share data) | 2016 | 2015 | 2014 | |||
Options outstanding, January 1 | 5.0 | 4.6 | 4.8 | |||
Granted | 0.7 | 0.9 | 0.7 | |||
Exercised | (1.1 | ) | (0.5 | ) | (0.7 | ) |
Forfeited | (0.1 | ) | — | (0.2 | ) | |
Options outstanding, December 31 | 4.5 | 5.0 | 4.6 | |||
Options exercisable, December 31 | 2.7 | 2.9 | 2.6 | |||
Weighted Average Exercise Price | 2016 | 2015 | 2014 | ||||||
Options outstanding, January 1 | $ | 31.77 | $ | 25.49 | $ | 21.99 | |||
Granted | 61.98 | 56.06 | 47.59 | ||||||
Exercised | 22.50 | 21.85 | 20.17 | ||||||
Forfeited | 45.91 | — | 31.42 | ||||||
Options outstanding, December 31 | $ | 38.11 | $ | 31.77 | $ | 25.49 | |||
Options exercisable, December 31 | $ | 27.17 | $ | 22.75 | $ | 20.67 | |||
As of December 31, 2016, the weighted average remaining contractual life of options outstanding and of options exercisable was 6.3 years and 4.9 years, respectively.
As of December 31, 2016, the aggregate intrinsic value of total options outstanding was $212.4 million, of which $153.5 million represented vested options.
59
The fair value of the options was estimated on the date of grant using a Black-Scholes option valuation model that used the following weighted average assumptions in 2016, 2015 and 2014: a risk-free interest rate of 1.4%, 1.7%, and 1.6%, respectively; stock volatility of 20.4%, 21.0%, and 21.9%, respectively; and dividend yields of 0.9%, 0.9%, and 0.8%, respectively. Stock volatility is estimated based on historical data and the impact from expected future trends. Expected lives, which are based on prior experience, averaged 6 years for 2016, 2015 and 2014. The weighted average grant date fair value of options granted in 2016, 2015 and 2014 was $12.12, $10.57 and $10.38, respectively. Stock option expense is recognized over the vesting period, net of forfeitures.
For the years ended December 31, 2016, 2015 and 2014, the intrinsic value of options exercised was $49.4 million, $17.7 million and $16.0 million, respectively. The grant date fair value of options vested during those same periods was $5.8 million, $4.8 million and $4.7 million, respectively.
Stock Appreciation Rights
Stock appreciation rights (“SARs”) granted to eligible international employees vest in equal annual increments over 4 years of continuous service. All awards expire 10 years from the date of grant. The fair value of each cash-settled SAR is adjusted at the end of each reporting period, with the resulting change reflected in expense. As of December 31, 2016, SARs outstanding were 116,087, of which 61,135 were cash-settled and 54,952 were stock-settled. Upon exercise of a cash-settled SAR, the employee receives cash for the difference between the grant date price and the fair market value of the Company's stock on the date of exercise. As a result of the cash settlement feature, cash-settled SARs are recorded within other long-term liabilities. Upon exercise of a stock-settled SAR, shares are issued in exchange for the exercise price of the stock-settled SAR. As a result of the stock settlement feature, stock-settled SARs are recorded within equity.
The following table summarizes changes in outstanding SARs:
2016 | 2015 | 2014 | ||||
SARs outstanding, January 1 | 232,930 | 297,714 | 375,104 | |||
Granted | 3,368 | 12,356 | 7,733 | |||
Exercised | (114,976 | ) | (77,140 | ) | (85,123 | ) |
Forfeited | (5,235 | ) | — | — | ||
SARs outstanding, December 31 | 116,087 | 232,930 | 297,714 | |||
SARs exercisable, December 31 | 71,701 | 112,295 | 88,751 | |||
Weighted Average Exercise Price | 2016 | 2015 | 2014 | ||||||
SARs outstanding, January 1 | $ | 27.79 | $ | 25.20 | $ | 24.03 | |||
Granted | 68.40 | 57.25 | 47.74 | ||||||
Exercised | 24.95 | 22.52 | 22.09 | ||||||
Forfeited | 42.28 | — | — | ||||||
SARs outstanding, December 31 | $ | 31.13 | $ | 27.79 | $ | 25.20 | |||
SARs exercisable, December 31 | $ | 26.65 | $ | 24.60 | $ | 23.15 | |||
Performance Awards
In addition to stock options and SAR awards, we grant performance vesting share (“PVS”) awards and performance vesting unit (“PVU”) awards to eligible employees. These awards are earned based on the Company's performance against pre-established targets, including annual growth rate of revenue and return on invested capital, over a specified performance period. Depending on the achievement of the targets, recipients of PVS awards are entitled to receive a certain number of shares of common stock, whereas recipients of PVU awards are entitled to receive a payment in cash per unit based on the fair market value of a share of our common stock at the end of the performance period.
60
The following table summarizes changes in our outstanding PVS awards:
2016 | 2015 | 2014 | |||||||
Non-vested PVS awards, January 1 | 422,726 | 470,719 | 578,358 | ||||||
Granted at target level | 115,035 | 147,908 | 133,823 | ||||||
Adjustments above/(below) target | 19,339 | 132,444 | 53,438 | ||||||
Vested and converted | (173,364 | ) | (318,337 | ) | (250,205 | ) | |||
Forfeited | (5,674 | ) | (10,008 | ) | (44,695 | ) | |||
Non-vested PVS awards, December 31 | 378,062 | 422,726 | 470,719 | ||||||
Weighted Average Grant Date Fair Value | 2016 | 2015 | 2014 | ||||||
Non-vested PVS awards, January 1 | $ | 45.60 | $ | 30.93 | $ | 23.79 | |||
Granted at target level | 60.47 | 55.49 | 47.21 | ||||||
Adjustments above/(below) target | 38.71 | 22.97 | 22.86 | ||||||
Vested and converted | 59.64 | 51.53 | 48.69 | ||||||
Forfeited | 49.86 | 41.84 | 30.76 | ||||||
Non-vested PVS awards, December 31 | $ | 54.47 | $ | 45.60 | $ | 30.93 | |||
Shares earned under PVS and PVU awards may vary from 0% to 200% of an employee's targeted award. The fair value of PVS awards is based on the market price of our stock at the grant date and is recognized as expense over the performance period, adjusted for estimated target outcomes and net of forfeitures. The weighted average grant date fair value of PVS awards granted during the years 2016, 2015 and 2014 was $60.47, $55.49 and $47.21, respectively. Including forfeiture and above-target achievement expectations, we expect that the PVS awards will convert to 362,939 shares to be issued over an average remaining term of 1 year.
The fair value of PVU awards is also based on the market price of our stock at the grant date. These awards are revalued at the end of each quarter based on changes in our stock price. As a result of the cash settlement feature, PVU awards are recorded within other long-term liabilities.
The following table summarizes changes in our outstanding PVU awards:
2016 | 2015 | 2014 | ||||
Non-vested PVU awards, January 1 | 29,196 | 55,509 | 79,456 | |||
Granted at target level | 419 | 1,386 | 1,584 | |||
Adjustments above/(below) target | 2,858 | 19,315 | 6,907 | |||
Vested and converted | (29,032 | ) | (47,014 | ) | (32,438 | ) |
Forfeited | (990 | ) | — | — | ||
Non-vested PVU awards, December 31 | 2,451 | 29,196 | 55,509 | |||
Weighted Average Grant Date Fair Value | 2016 | 2015 | 2014 | ||||||
Non-vested PVU awards, January 1 | $ | 32.07 | $ | 26.15 | $ | 23.86 | |||
Granted at target level | 59.64 | 54.14 | 47.34 | ||||||
Adjustments above/(below) target | 30.80 | 22.07 | 22.72 | ||||||
Vested and converted | 59.64 | 51.53 | 47.34 | ||||||
Forfeited | 50.55 | — | — | ||||||
Non-vested PVU awards, December 31 | $ | 25.28 | $ | 32.07 | $ | 26.15 | |||
61
Employee Stock Purchase Plan
We also offer an Employee Stock Purchase Plan (“ESPP”) which provides for the sale of our common stock to eligible employees at 85% of the current market price on the last trading day of each quarterly offering period. Payroll deductions are limited to 25% of the employee's base salary, not to exceed $25,000 in any one calendar year. In addition, employees may not buy more than 2,000 shares during any offering period (8,000 shares per year). Purchases under the ESPP were 60,839 shares, 61,757 shares and 76,751 shares for the years 2016, 2015 and 2014, respectively. At December 31, 2016, there were approximately 4.0 million shares available for issuance under the ESPP.
Deferred Compensation Plans
Our deferred compensation plans include a Non-Qualified Deferred Compensation Plan for Non-Employee Directors, under which non-employee directors may defer all or part of their annual cash retainers. The deferred fees may be credited to a stock-equivalent account. Amounts credited to this account are converted into deferred stock units based on the fair market value of one share of our common stock on the last day of the quarter. For deferred stock units ultimately paid in cash, a liability is calculated at an amount determined by multiplying the number of units by the fair market value of our common stock at the end of each reporting period. In addition, deferred stock awards are granted on the date of our annual meeting, and are distributed in shares of common stock. In 2016, we granted 20,077 deferred stock awards, with a grant date fair value of $71.47. Similarly, a non-qualified deferred compensation plan for eligible employees provides for the conversion of compensation into deferred stock units. As of December 31, 2016, the two deferred compensation plans held a total of 388,287 deferred stock units, including 24,296 units to be paid in cash.
In addition, during 2016, we granted 1,393 restricted share awards at a weighted grant-date fair value of $71.79 per share to new executive officers under the 2016 Plan. During 2015, we granted 41,458 restricted share awards at a weighted grant-date fair value of $57.89 per share to new executive officers under the 2011 Plan. The fair value of the awards is based on the market price of our stock at the grant date and is recognized as expense over the vesting period.
Annual Incentive Plan
Under our annual incentive plan, participants are paid bonuses on the attainment of certain financial goals, which they can elect to receive in either cash or shares of our common stock. If the employee elects payment in shares, they are also given a restricted incentive stock award equal to one share for each four bonus shares issued. The incentive stock awards vest at the end of four years provided that the participant has not made a disqualifying disposition of their bonus shares. Incentive stock award grants were 2,400 shares, 1,500 shares and 4,200 shares in 2016, 2015 and 2014, respectively. Incentive stock forfeitures of 800 shares, 200 shares and 4,100 shares occurred in 2016, 2015 and 2014, respectively. Compensation expense is recognized over the vesting period based on the fair market value of common stock on the award date: $59.64 per share granted in 2016, $51.53 per share granted in 2015 and $48.69 per share granted in 2014.
Note 13: Benefit Plans
Certain of our U.S. and international subsidiaries sponsor defined benefit pension plans. In addition, we provide minimal death benefits for certain U.S. retirees and pay a portion of healthcare costs for retired U.S. salaried employees and their dependents. Benefits for participants are coordinated with Medicare and the plan mandates Medicare risk (“HMO”) coverage wherever possible and caps the total contribution for non-HMO coverage. We also sponsor a defined contribution plan for certain salaried and hourly U.S. employees. Our 401(k) plan contributions were $4.9 million for 2016, $4.8 million for 2015 and $4.3 million for 2014.
62
Pension and Other Retirement Benefits
The components of net periodic benefit cost and other amounts recognized in OCI were as follows:
Pension benefits | Other retirement benefits | ||||||||||||||||||
($ in millions) | 2016 | 2015 | 2014 | 2016 | 2015 | 2014 | |||||||||||||
Net periodic benefit cost: | |||||||||||||||||||
Service cost | $ | 10.2 | $ | 10.6 | $ | 9.8 | $ | 0.5 | $ | 0.5 | $ | 0.4 | |||||||
Interest cost | 10.5 | 13.8 | 17.1 | 0.5 | 0.4 | 0.4 | |||||||||||||
Expected return on assets | (12.6 | ) | (19.5 | ) | (19.3 | ) | — | — | — | ||||||||||
Amortization of prior service credit | (1.4 | ) | (1.3 | ) | (1.3 | ) | — | — | — | ||||||||||
Amortization of transition obligation | 0.1 | 0.1 | 0.1 | — | — | — | |||||||||||||
Amortization of actuarial loss (gain) | 4.8 | 5.9 | 4.7 | (1.4 | ) | (1.4 | ) | (1.6 | ) | ||||||||||
Curtailment | (2.1 | ) | — | — | — | — | — | ||||||||||||
Settlement effects | — | 50.4 | — | — | — | — | |||||||||||||
Net periodic benefit cost | $ | 9.5 | $ | 60.0 | $ | 11.1 | $ | (0.4 | ) | $ | (0.5 | ) | $ | (0.8 | ) | ||||
Other changes in plan assets and benefit obligations recognized in OCI, pre-tax: | |||||||||||||||||||
Net loss (gain) arising during period | $ | 19.2 | $ | 17.7 | $ | 31.5 | $ | (0.1 | ) | $ | (0.8 | ) | $ | 0.1 | |||||
Prior service credit arising during period | — | (0.7 | ) | — | (3.0 | ) | — | — | |||||||||||
Amortization of prior service credit | 1.4 | 1.3 | 1.3 | — | — | — | |||||||||||||
Amortization of transition obligation | (0.1 | ) | (0.1 | ) | (0.1 | ) | — | — | — | ||||||||||
Amortization of actuarial (loss) gain | (4.8 | ) | (5.9 | ) | (4.7 | ) | 1.4 | 1.4 | 1.6 | ||||||||||
Curtailment | (3.1 | ) | — | — | — | — | — | ||||||||||||
Settlement effects | — | (50.4 | ) | — | — | — | — | ||||||||||||
Foreign currency translation | (3.2 | ) | (1.6 | ) | (2.1 | ) | — | — | — | ||||||||||
Total recognized in OCI | $ | 9.4 | $ | (39.7 | ) | $ | 25.9 | $ | (1.7 | ) | $ | 0.6 | $ | 1.7 | |||||
Total recognized in net periodic benefit cost and OCI | $ | 18.9 | $ | 20.3 | $ | 37.0 | $ | (2.1 | ) | $ | 0.1 | $ | 0.9 | ||||||
Net periodic benefit cost by geographic location is as follows:
Pension benefits | Other retirement benefits | ||||||||||||||||||
2016 | 2015 | 2014 | 2016 | 2015 | 2014 | ||||||||||||||
U.S. plans | $ | 7.1 | $ | 57.4 | $ | 8.1 | $ | (0.4 | ) | $ | (0.5 | ) | $ | (0.8 | ) | ||||
International plans | 2.4 | 2.6 | 3.0 | — | — | — | |||||||||||||
Net periodic benefit cost | $ | 9.5 | $ | 60.0 | $ | 11.1 | $ | (0.4 | ) | $ | (0.5 | ) | $ | (0.8 | ) | ||||
During 2016, we recorded a pension curtailment gain of $2.1 million in connection with our decision to freeze both our U.S. qualified and non-qualified defined benefit pension plans as of January 1, 2019.
63
During 2015, we recorded a $50.4 million pension settlement charge within other expense, of which $47.0 million related to our purchase of a group annuity contract from MetLife to settle $139.4 million of our $313.6 million outstanding pension benefit obligation under our U.S. qualified pension plan. MetLife assumed the obligation to pay future pension benefits and provide administrative services beginning November 1, 2015 for approximately 1,750 retirees and surviving beneficiaries who retired before January 1, 2015 and are currently receiving payments from this plan. The purchase was funded directly by plan assets. The remaining portion of the pension settlement charge related to lump-sum payouts made to terminated vested participants of our U.S. qualified pension plan.
The following table presents the changes in the benefit obligation and the fair value of plan assets, as well as the funded status of the plans:
Pension benefits | Other retirement benefits | ||||||||||||
($ in millions) | 2016 | 2015 | 2016 | 2015 | |||||||||
Change in benefit obligation: | |||||||||||||
Benefit obligation, January 1 | $ | (246.3 | ) | $ | (398.5 | ) | $ | (10.2 | ) | $ | (10.1 | ) | |
Service cost | (10.2 | ) | (10.6 | ) | (0.5 | ) | (0.5 | ) | |||||
Interest cost | (10.5 | ) | (13.8 | ) | (0.5 | ) | (0.4 | ) | |||||
Participants' contributions | (0.6 | ) | (0.6 | ) | (0.5 | ) | (0.6 | ) | |||||
Actuarial (loss) gain | (23.4 | ) | 7.8 | 0.1 | 0.8 | ||||||||
Amendments/transfers in | — | 0.8 | 3.0 | — | |||||||||
Benefits/expenses paid | 16.2 | 14.6 | 0.6 | 0.6 | |||||||||
Curtailment | 5.2 | — | — | — | |||||||||
Settlement | — | 149.7 | — | — | |||||||||
Foreign currency translation | 7.4 | 4.3 | — | — | |||||||||
Benefit obligation, December 31 | $ | (262.2 | ) | $ | (246.3 | ) | $ | (8.0 | ) | $ | (10.2 | ) | |
Change in plan assets: | |||||||||||||
Fair value of assets, January 1 | $ | 188.9 | $ | 322.3 | $ | — | $ | — | |||||
Actual return on assets | 16.8 | (6.0 | ) | — | — | ||||||||
Employer contribution | 6.8 | 38.0 | 0.1 | — | |||||||||
Participants' contributions | 0.6 | 0.6 | 0.5 | 0.6 | |||||||||
Benefits/expenses paid | (16.2 | ) | (14.6 | ) | (0.6 | ) | (0.6 | ) | |||||
Settlement | — | (149.7 | ) | — | — | ||||||||
Foreign currency translation | (4.5 | ) | (1.7 | ) | — | — | |||||||
Fair value of assets, December 31 | $ | 192.4 | $ | 188.9 | $ | — | $ | — | |||||
Funded status at end of year | $ | (69.8 | ) | $ | (57.4 | ) | $ | (8.0 | ) | $ | (10.2 | ) | |
International pension plan assets, at fair value, included in the preceding table were $28.8 million and $29.2 million at December 31, 2016 and 2015, respectively.
Amounts recognized in the balance sheet were as follows:
Pension benefits | Other retirement benefits | |||||||||||
($ in millions) | 2016 | 2015 | 2016 | 2015 | ||||||||
Current liabilities | $ | (1.5 | ) | $ | (5.0 | ) | $ | (0.7 | ) | $ | (0.6 | ) |
Noncurrent liabilities | (68.3 | ) | (52.4 | ) | (7.3 | ) | (9.6 | ) | ||||
$ | (69.8 | ) | $ | (57.4 | ) | $ | (8.0 | ) | $ | (10.2 | ) | |
64
The amounts in accumulated other comprehensive loss, pre-tax, consisted of:
Pension benefits | Other retirement benefits | |||||||||||
($ in millions) | 2016 | 2015 | 2016 | 2015 | ||||||||
Net actuarial loss (gain) | $ | 86.0 | $ | 79.9 | $ | (11.9 | ) | $ | (13.2 | ) | ||
Transition obligation | — | 0.1 | — | — | ||||||||
Prior service credit | (2.3 | ) | (5.7 | ) | (3.0 | ) | — | |||||
Total | $ | 83.7 | $ | 74.3 | $ | (14.9 | ) | $ | (13.2 | ) | ||
The net actuarial loss and prior service credit for the defined benefit pension plans that will be amortized from accumulated other comprehensive loss into net periodic benefit cost over the next fiscal year are $4.7 million and $1.4 million, respectively. The net actuarial gain and prior service credit for the other retirement benefits plan that will be amortized from accumulated other comprehensive loss into net periodic benefit cost over the next fiscal year is $2.3 million and $0.7 million.
The accumulated benefit obligation for all defined benefit pension plans was $258.4 million and $238.9 million at December 31, 2016 and 2015, respectively, including $60.6 million and $55.5 million, respectively, for international pension plans.
All of the defined benefit pension plans have projected benefit obligations and accumulated benefit obligations in excess of plan assets as of December 31, 2016 and 2015.
Benefit payments expected to be paid under our defined benefit pension and other retirement benefit plans in the next ten years are as follows:
($ in millions) | Domestic | International | Total | ||||||
2017 | $ | 12.5 | $ | 1.5 | $ | 14.0 | |||
2018 | 13.4 | 1.7 | 15.1 | ||||||
2019 | 14.3 | 2.1 | 16.4 | ||||||
2020 | 15.3 | 2.7 | 18.0 | ||||||
2021 | 15.0 | 2.4 | 17.4 | ||||||
2022 to 2026 | 73.6 | 14.9 | 88.5 | ||||||
$ | 144.1 | $ | 25.3 | $ | 169.4 | ||||
In 2017, we expect to contribute $23.0 million to pension plans, of which $1.9 million is for international plans. Included in this amount is a $1.1 million contribution to our non-qualified defined benefit pension plan. In addition, we expect to contribute $0.7 million for other retirement benefits in 2017. We periodically consider additional, voluntary contributions depending on the investment returns generated by pension plan assets, changes in benefit obligation projections and other factors.
Weighted average assumptions used to determine net periodic benefit cost were as follows:
Pension benefits | Other retirement benefits | ||||||||||||
2016 | 2015 | 2014 | 2016 | 2015 | 2014 | ||||||||
Discount rate | 3.99 | % | 4.08 | % | 4.50 | % | 4.30 | % | 3.90 | % | 4.55 | % | |
Rate of compensation increase | 4.04 | % | 4.07 | % | 4.29 | % | — | — | — | ||||
Long-term rate of return on assets | 6.95 | % | 6.84 | % | 7.01 | % | — | — | — | ||||
65
Weighted average assumptions used to determine the benefit obligations were as follows:
Pension benefits | Other retirement benefits | ||||||||
2016 | 2015 | 2016 | 2015 | ||||||
Discount rate | 3.68 | % | 4.22 | % | 3.90 | % | 4.30 | % | |
Rate of compensation increase | 4.04 | % | 4.07 | % | — | — | |||
The discount rate used to determine the benefit obligations for U.S. pension plans was 4.15% and 4.55% as of December 31, 2016 and 2015, respectively. The weighted average discount rate used to determine the benefit obligations for all international plans was 2.25% and 3.19% as of December 31, 2016 and 2015, respectively. The rate of compensation increase for U.S. plans was 4.25% for 2016 and 2015, while the weighted average rate for all international plans was 2.59% for 2016 and 2.73% for 2015. Other retirement benefits were only available to U.S. employees. The long-term rate of return for U.S. plans, which accounts for 85% of global plan assets, was 7.25% for 2016, 2015 and 2014.
The assumed healthcare cost trend rate used to determine benefit obligations was 6.60% for all participants in 2016, decreasing to 5.00% by 2021. A change in the assumed healthcare cost trend rate by one percentage point would result in a $0.2 million increase or decrease in the postretirement obligation. The assumed healthcare cost trend rate used to determine net periodic benefit cost was 7.00% for all participants in 2016, decreasing to 5.00% by 2021. The effect of a one percentage point increase in the rate would be a $0.1 million increase in the aggregate service and interest cost components, while a one percentage point decrease in the rate would have an immaterial impact.
The weighted average asset allocations by asset category for our pension plans, at December 31, were as follows:
2016 | 2015 | |||
Equity securities | 60 | % | 62 | % |
Debt securities | 30 | % | 35 | % |
Other | 10 | % | 3 | % |
100 | % | 100 | % | |
Our U.S. pension plan is managed as a balanced portfolio comprised of two components: equity and fixed income debt securities. Equity investments are used to maximize the long-term real growth of fund assets, while fixed income investments are used to generate current income, provide for a more stable periodic return, and to provide some protection against a prolonged decline in the market value of equity investments. Temporary funds may be held as cash. We maintain a long-term strategic asset allocation policy which provides guidelines for ensuring that the fund's investments are managed with the short-term and long-term financial goals of the fund, while allowing the flexibility to react to unexpected changes in capital markets.
The following are the U.S. target asset allocations and acceptable allocation ranges:
Target allocation | Allocation range | |
Equity securities | 65% | 60% - 70% |
Debt securities | 35% | 30% - 40% |
Other | —% | 0% - 5% |
Diversification across and within asset classes is the primary means by which we mitigate risk. We maintain guidelines for all asset and sub-asset categories in order to avoid excessive investment concentrations. Fund assets are monitored on a regular basis. If at any time the fund asset allocation is not within the acceptable allocation range, funds will be reallocated. We also review the fund on a regular basis to ensure that the investment returns received are consistent with the short-term and long-term goals of the fund and with comparable market returns. We are
66
prohibited from pledging fund securities and from investing pension fund assets in our own stock, securities on margin or derivative securities.
The following tables present the fair value of our pension plan assets, utilizing the fair value hierarchy discussed in Note 10, Fair Value Measurements:
Balance at | ||||||||||||
December 31, | Basis of Fair Value Measurements | |||||||||||
($ in millions) | 2016 | Level 1 | Level 2 | Level 3 | ||||||||
Cash | $ | 10.0 | $ | 10.0 | $ | — | $ | — | ||||
Equity securities: | ||||||||||||
Indexed mutual funds | 8.9 | 8.9 | — | — | ||||||||
International mutual funds | 3.0 | 3.0 | — | — | ||||||||
Fixed income securities: | ||||||||||||
Mutual funds | 9.2 | 9.2 | — | — | ||||||||
Insurance contract | 0.5 | — | 0.5 | — | ||||||||
Balanced mutual fund | 6.3 | 6.3 | — | — | ||||||||
Pension plan assets in the fair value hierarchy | $ | 37.9 | $ | 37.4 | $ | 0.5 | $ | — | ||||
Pension plan assets measured at NAV | 154.5 | |||||||||||
Pension plan assets at fair value | $ | 192.4 | ||||||||||
In accordance with U.S. GAAP, certain pension plan assets measured at NAV have not been classified in the fair value hierarchy.
Balance at | ||||||||||||
December 31, | Basis of Fair Value Measurements | |||||||||||
($ in millions) | 2015 | Level 1 | Level 2 | Level 3 | ||||||||
Cash | $ | 0.6 | $ | 0.6 | $ | — | $ | — | ||||
Equity securities: | ||||||||||||
Indexed mutual funds | 79.2 | 79.2 | — | — | ||||||||
International mutual funds | 37.7 | 37.7 | — | — | ||||||||
Fixed income securities: | ||||||||||||
Mutual funds | 63.0 | 63.0 | — | — | ||||||||
Insurance contract | 0.6 | — | 0.6 | — | ||||||||
Balanced mutual fund | 7.8 | 7.8 | — | — | ||||||||
Pension plan assets at fair value | $ | 188.9 | $ | 188.3 | $ | 0.6 | $ | — | ||||
67
Note 14: Other Expense (Income)
Other expense (income) consisted of:
($ in millions) | 2016 | 2015 | 2014 | ||||||||
Restructuring and related charges: | |||||||||||
Severance and post-employment benefits | $ | 8.9 | $ | — | $ | — | |||||
Asset-related charges | 17.3 | — | — | ||||||||
Other charges | 0.2 | — | — | ||||||||
Total restructuring and related charges | $ | 26.4 | $ | — | $ | — | |||||
Pension settlement charge | — | 50.4 | — | ||||||||
Pension curtailment gain | (2.1 | ) | — | — | |||||||
Executive retirement and related costs | — | 10.9 | — | ||||||||
Venezuela currency devaluation | 2.7 | — | — | ||||||||
License costs | — | — | 1.2 | ||||||||
Development income | (1.5 | ) | (1.5 | ) | (1.6 | ) | |||||
Contingent consideration costs | 2.3 | 1.1 | 1.0 | ||||||||
Other items | (0.1 | ) | (0.8 | ) | (0.8 | ) | |||||
Total other expense (income) | $ | 27.7 | $ | 60.1 | $ | (0.2 | ) | ||||
Restructuring and Related Charges
On February 15, 2016, our Board of Directors approved a restructuring plan designed to repurpose several of our
production facilities in support of growing high-value proprietary products and to realign operational and commercial activities to meet the needs of our new market-focused commercial organization.
During 2016, we incurred $26.4 million in restructuring and related charges in connection with this plan, consisting of $8.9 million for severance charges, $10.0 million for a non-cash asset write-down associated with the discontinued use of a trademark, $7.3 million for non-cash asset write-downs associated with the discontinued use of a patent and certain equipment, and $0.2 million for other charges.
The following table presents activity related to our restructuring obligations:
($ in millions) | Severance and benefits | Asset-related charges | Other charges | Total | |||||||||||
Balance, December 31, 2015 | $ | — | $ | — | $ | — | $ | — | |||||||
Charges | 8.9 | 17.3 | 0.2 | 26.4 | |||||||||||
Cash payments | (3.0 | ) | — | — | (3.0 | ) | |||||||||
Non-cash asset write-downs | — | (17.3 | ) | (0.2 | ) | (17.5 | ) | ||||||||
Balance, December 31, 2016 | $ | 5.9 | $ | — | $ | — | $ | 5.9 | |||||||
68
Other Items
During 2015, we recorded a $50.4 million pension settlement charge, of which $47.0 million related to our purchase of a group annuity contract from MetLife and $3.4 million related to lump-sum payouts made to terminated vested participants of our U.S. qualified pension plan. Please refer to Note 13, Benefit Plans, for additional details.
During 2016, we recorded a pension curtailment gain of $2.1 million in connection with our decision to freeze both our U.S. qualified and non-qualified defined benefit pension plans as of January 1, 2019.
In addition, during 2015, we recorded a $10.9 million charge for executive retirement and related costs, including $2.4 million for a long-term incentive plan award for our previous CEO, $8.0 million for the revaluation of modified outstanding awards to provide for continued vesting for our previous CEO and Senior Vice President of Human Resources in conjunction with their retirement, and $0.5 million for other costs, including relocation and legal fees.
On February 17, 2016, the Venezuelan government announced a devaluation of the Bolivar, from the previously-prevailing official exchange rate of 6.3 Bolivars to USD to 10.0 Bolivars to USD, and streamlined the previous
three-tiered currency exchange mechanism into a dual currency exchange mechanism. As a result, during 2016, we recorded a $2.7 million charge. After the remeasurement, as of December 31, 2016, we had $1.8 million in net monetary assets denominated in Venezuelan Bolivars, including $0.7 million in cash and cash equivalents, and $4.5 million in non-monetary assets. If there are further devaluations of the Bolivar or other changes in the currency exchange mechanisms in Venezuela in the future, a pre-tax charge of up to $6.3 million could be required. We will continue to actively monitor the political and economic developments in Venezuela.
During 2014, we recorded a $1.2 million charge for license costs associated with acquired in-process research.
Development income of $1.5 million was recognized within Proprietary Products during 2016, related to a nonrefundable customer payment of $20.0 million received in June 2013 in return for the exclusive use of the SmartDose technology platform within a specific therapeutic area. As of December 31, 2016, there was $14.4 million of unearned income related to this payment, of which $1.5 million was included in other current liabilities and $12.9 million was included in other long-term liabilities. The unearned income is being recognized as development income on a straight-line basis over the remaining term of the agreement. The agreement does not include a future minimum purchase commitment from the customer. During 2015 and 2014, we recorded development income of $1.5 million and $1.6 million, respectively, within Proprietary Products, of which $1.5 million for each year related to the nonrefundable customer payment described above.
Contingent consideration costs represent changes in the fair value of the SmartDose contingent consideration. Please refer to Note 10, Fair Value Measurements, for additional details.
Other items consist of foreign exchange transaction gains and losses, gains and losses on the sale of fixed assets, and miscellaneous income and charges.
Note 15: Income Taxes
As a global organization, we and our subsidiaries file income tax returns in the U.S. federal jurisdiction and various state and foreign jurisdictions. During 2016, the statute of limitations for the 2012 U.S. federal tax year lapsed, leaving tax years 2013 through 2016 open to examination. For U.S. state and local jurisdictions, tax years 2012 through 2016 are open to examination. We are also subject to examination in various foreign jurisdictions for tax years 2009 through 2016.
69
A reconciliation of the beginning and ending amount of the liability for unrecognized tax benefits is as follows:
($ in millions) | 2016 | 2015 | ||||
Balance at January 1 | $ | 5.9 | $ | 6.9 | ||
Increase due to current year position | 1.0 | 0.8 | ||||
Increase due to prior year position | 1.2 | 0.9 | ||||
Reduction for expiration of statute of limitations | (0.9 | ) | (1.2 | ) | ||
Settlements | (1.0 | ) | (1.5 | ) | ||
Balance at December 31 | $ | 6.2 | $ | 5.9 | ||
In addition, we had balances in accrued liabilities for interest and penalties of $0.1 million and $0.3 million at December 31, 2016 and 2015, respectively. As of December 31, 2016, we had $6.2 million of total gross unrecognized tax benefits, of which $1.4 million, if recognized, would favorably impact the effective income tax rate. It is reasonably possible that, due to the expiration of statutes and the closing of tax audits, the amount of gross unrecognized tax benefits may be reduced by approximately $0.7 million during the next twelve months, which would favorably impact our effective tax rate.
The components of income before income taxes are:
($ in millions) | 2016 | 2015 | 2014 | ||||||
U.S. operations | $ | 84.5 | $ | (4.0 | ) | $ | 57.5 | ||
International operations | 105.3 | 120.1 | 111.5 | ||||||
Total income before income taxes | $ | 189.8 | $ | 116.1 | $ | 169.0 | |||
The related provision for income taxes consists of:
($ in millions) | 2016 | 2015 | 2014 | ||||||
Current: | |||||||||
Federal | $ | 2.5 | $ | 1.0 | $ | 5.2 | |||
State | 1.0 | 0.9 | 0.5 | ||||||
International | 29.4 | 33.3 | 34.5 | ||||||
Current income tax provision | 32.9 | 35.2 | 40.2 | ||||||
Deferred: | |||||||||
Federal and state | 21.8 | (13.2 | ) | 7.7 | |||||
International | (0.3 | ) | 4.3 | (0.7 | ) | ||||
Deferred income tax provision | 21.5 | (8.9 | ) | 7.0 | |||||
Income tax expense | $ | 54.4 | $ | 26.3 | $ | 47.2 | |||
Deferred income taxes result from temporary differences between the amount of assets and liabilities recognized for financial reporting and tax purposes.
70
The significant components of our deferred tax assets and liabilities at December 31 are:
($ in millions) | 2016 | 2015 | ||||
Deferred tax assets | ||||||
Net operating loss carryforwards | $ | 15.4 | $ | 16.5 | ||
Tax credit carryforwards | 27.9 | 40.8 | ||||
Restructuring and impairment charges | 2.9 | — | ||||
Pension and deferred compensation | 46.4 | 42.0 | ||||
Other | 19.5 | 19.3 | ||||
Valuation allowance | (18.7 | ) | (20.1 | ) | ||
Total deferred tax assets | 93.4 | 98.5 | ||||
Deferred tax liabilities: | ||||||
Accelerated depreciation | 30.3 | 35.0 | ||||
Other | 6.1 | 5.4 | ||||
Total deferred tax liabilities | 36.4 | 40.4 | ||||
Net deferred tax asset | $ | 57.0 | $ | 58.1 | ||
A reconciliation of the U.S. federal corporate tax rate to our effective consolidated tax rate on income before income taxes follows:
2016 | 2015 | 2014 | ||||
U.S. federal corporate tax rate | 35.0 | % | 35.0 | % | 35.0 | % |
Tax on international operations less than U.S. tax rate | (2.9 | ) | (5.1 | ) | (6.8 | ) |
Reversal of prior valuation allowance | (0.3 | ) | — | (0.5 | ) | |
Reversal of reserves for unrecognized tax benefits | (0.6 | ) | (1.6 | ) | (0.5 | ) |
U.S. tax on international earnings, net of foreign tax credits | (1.3 | ) | (4.6 | ) | (0.1 | ) |
State income taxes, net of federal tax effect | 0.8 | 0.3 | 1.5 | |||
U.S. research and development credits | (0.8 | ) | (1.3 | ) | (0.9 | ) |
Other business credits and Section 199 Deduction | (1.1 | ) | (1.3 | ) | (0.7 | ) |
Other | (0.1 | ) | 1.2 | 1.0 | ||
Effective tax rate | 28.7 | % | 22.6 | % | 28.0 | % |
During 2016, we recorded a tax benefit of $9.0 million in connection with restructuring and related charges of $26.4 million, a discrete tax charge of $0.8 million related to the pension curtailment gain of $2.1 million, and a discrete tax charge of $1.0 million resulting from the impact of changes in enacted tax rates on our previously-recorded deferred tax asset and liability balances.
During 2015, we recorded a discrete tax benefit of $4.0 million related to executive retirement and related costs. In addition, we recorded a discrete tax benefit of $18.4 million for a pension settlement charge. In 2015, we also recorded a discrete tax charge of $0.8 million resulting from the impact of a change in the enacted tax rate in the United Kingdom on our previously-recorded deferred tax asset balances.
During 2014, we recorded a discrete tax charge of $1.0 million resulting from the impact of a change in apportionment factors on state tax rates applied to items in OCI and a discrete tax charge of $0.8 million as a result of the finalization of estimates of foreign tax credits available with respect to a repatriation of cash from our subsidiaries in Israel.
71
At December 31, 2016, we have fully utilized all of our U.S. federal net operating loss carryforwards. State operating loss carryforwards of $254.8 million created a deferred tax asset of $14.0 million, while foreign operating loss carryforwards of $9.4 million created a deferred tax asset of $1.4 million. Management estimates that certain state and foreign operating loss carryforwards are unlikely to be utilized and the associated deferred tax assets have been fully reserved. State loss carryforwards expire as follows: $5.3 million in 2017 and $249.5 million thereafter. Foreign loss carryforwards will begin to expire in 2024, while $6.2 million of the total $9.4 million will not expire.
As of December 31, 2016, we had available foreign tax credit carryforwards of $8.2 million expiring as follows: $3.2 million in 2024 and $5.0 million in 2025. We have U.S. federal and state research and development credit carryforwards of $12.0 million and $3.0 million, respectively. The $12.0 million of U.S. federal research and development credits expire as follows: $0.6 million expire in 2028, $1.1 million expire in 2029, $1.0 million expire in 2030, $1.0 million expire in 2031, $1.4 million expire in 2032, $1.4 million expire in 2033 and $5.5 million expire after 2033. The $3.0 million of state research and development credits expire as follows: $0.2 million expire in 2021, $0.8 million expire in 2022, $0.5 million expire in 2023 and $1.5 million expire after 2023. Additionally, we have available other state tax credits of $0.9 million which expire in 2020.
In November 2015, the FASB issued guidance regarding the balance sheet classification of deferred taxes. This guidance requires that deferred tax assets and liabilities be classified as noncurrent. The requirement that deferred tax assets and liabilities of a tax-paying component of an entity be offset and presented as a single amount is not affected by these amendments. We adopted this guidance in the fourth quarter of 2015, on a prospective basis. Please refer to Note 2, New Accounting Standards, for additional details.
Undistributed earnings of foreign subsidiaries amounted to $612.3 million at December 31, 2016, on which deferred income taxes have not been provided because such earnings are intended to be reinvested indefinitely outside of the U.S. It is not practicable to estimate the tax liability that might be incurred if such earnings were remitted to the U.S.
Note 16: Commitments and Contingencies
At December 31, 2016, we were obligated under various operating lease agreements. Rental expense in 2016, 2015 and 2014 was $11.7 million, $10.5 million and 10.7 million, respectively.
At December 31, 2016, future minimum rental payments under non-cancelable operating leases were:
Year | ($ in millions) | ||
2017 | $ | 12.3 | |
2018 | 10.9 | ||
2019 | 8.5 | ||
2020 | 5.4 | ||
2021 | 4.8 | ||
Thereafter | 26.5 | ||
Total | $ | 68.4 | |
At December 31, 2016, outstanding unconditional contractual commitments for the purchase of raw materials and finished goods amounted to $75.7 million, of which $4.2 million is due to be paid in 2017.
We have letters of credit totaling $3.0 million supporting the reimbursement of workers' compensation and other claims paid on our behalf by insurance carriers. Our accrual for insurance obligations was $4.4 million at December 31, 2016, of which $1.2 million is in excess of our deductible and, therefore, is reimbursable by the insurance company.
Our SmartDose contingent consideration is payable to the selling shareholders based upon a percentage of product sales over the life of the underlying product patent, with no cap on total payments. Given the length of the earnout period and the uncertainty in forecasted product sales, we do not believe it is meaningful to estimate the upper end
72
of the range over the entire period. However, our estimated probable range which could become payable over the next five years is between zero and $8.9 million.
Note 17: Segment Information
In 2015, our business operations consisted of two reportable segments, Packaging Systems and Delivery Systems. Beginning in 2016, we changed our organization and reporting structure for our next phase of growth and development, which resulted in a change to Proprietary Products and Contract-Manufactured Products as our
reportable segments. The Proprietary Products reportable segment, which is a combination of the previous
Packaging Systems segment and the proprietary products portion of the previous Delivery Systems segment,
develops commercial, operational, and innovation strategies across our global network, with specific emphasis on
product offerings to biologic, generic, and pharmaceutical drug customers. The Contract-Manufactured Products
reportable segment, which consists of the contract manufacturing portion of the previous Delivery Systems segment,
serves as a fully integrated business focused on the design, manufacture, and automated assembly of complex devices, primarily for pharmaceutical, diagnostic, and medical device customers.
We evaluate the performance of our segments based upon, among other things, segment net sales and operating profit. Segment operating profit excludes general corporate costs, which include executive and director compensation, stock-based compensation, adjustments to annual incentive plan expense for over- or under-attainment of targets, certain pension and other retirement benefit costs, and other corporate facilities and administrative expenses not allocated to the segments. Also excluded are items that we consider not representative of ongoing operations. Such items are referred to as other unallocated items and generally include restructuring and related charges, certain asset impairments and other specifically-identified income or expense items.
The following table presents information about our reportable segments, reconciled to consolidated totals:
($ in millions) | 2016 | 2015 | 2014 | ||||||
Net sales: | |||||||||
Proprietary Products | $ | 1,189.9 | $ | 1,098.3 | $ | 1,126.3 | |||
Contract-Manufactured Products | 320.2 | 302.4 | 295.7 | ||||||
Intersegment sales elimination | (1.0 | ) | (0.9 | ) | (0.6 | ) | |||
Consolidated net sales | $ | 1,509.1 | $ | 1,399.8 | $ | 1,421.4 | |||
The intersegment sales elimination, which is required for the presentation of consolidated net sales, represents the elimination of components sold between our segments.
We do not have any customers accounting for greater than 10% of consolidated net sales.
The following table presents net sales and property, plant and equipment, net, by the country in which the legal subsidiary is domiciled and assets are located:
Net Sales | Property, Plant and Equipment, Net | ||||||||||||||||||
($ in millions) | 2016 | 2015 | 2014 | 2016 | 2015 | 2014 | |||||||||||||
United States | $ | 738.3 | $ | 667.4 | $ | 630.7 | $ | 329.3 | $ | 332.3 | $ | 327.5 | |||||||
Germany | 200.6 | 194.0 | 219.4 | 96.8 | 102.9 | 110.9 | |||||||||||||
France | 116.3 | 107.6 | 118.2 | 37.1 | 38.6 | 40.4 | |||||||||||||
Other European countries | 268.3 | 252.0 | 285.0 | 192.3 | 117.6 | 91.5 | |||||||||||||
Other | 185.6 | 178.8 | 168.1 | 122.8 | 129.6 | 135.5 | |||||||||||||
$ | 1,509.1 | $ | 1,399.8 | $ | 1,421.4 | $ | 778.3 | $ | 721.0 | $ | 705.8 | ||||||||
73
The following tables provide summarized financial information for our segments:
($ in millions) | Proprietary Products | Contract-Manufactured Products | Corporate and Elimination | Consolidated | ||||||||
2016 | ||||||||||||
Net sales | $ | 1,189.9 | $ | 320.2 | $ | (1.0 | ) | $ | 1,509.1 | |||
Operating profit | $ | 241.9 | $ | 38.2 | $ | (83.3 | ) | $ | 196.8 | |||
Interest expense, net | — | — | (7.0 | ) | (7.0 | ) | ||||||
Income before income taxes | $ | 241.9 | $ | 38.2 | $ | (90.3 | ) | $ | 189.8 | |||
Segment assets | $ | 1,173.9 | $ | 261.1 | $ | 281.7 | $ | 1,716.7 | ||||
Capital expenditures | 133.2 | 34.0 | 3.0 | 170.2 | ||||||||
Depreciation and amortization expense | 71.7 | 14.9 | 4.1 | 90.7 | ||||||||
2015 | ||||||||||||
Net sales | $ | 1,098.3 | $ | 302.4 | $ | (0.9 | ) | $ | 1,399.8 | |||
Operating profit | $ | 212.2 | $ | 35.5 | $ | (119.1 | ) | $ | 128.6 | |||
Interest expense, net | — | — | (12.5 | ) | (12.5 | ) | ||||||
Income before income taxes | $ | 212.2 | $ | 35.5 | $ | (131.6 | ) | $ | 116.1 | |||
Segment assets | $ | 1,083.7 | $ | 248.5 | $ | 362.9 | $ | 1,695.1 | ||||
Capital expenditures | 113.2 | 22.1 | (3.7 | ) | 131.6 | |||||||
Depreciation and amortization expense | 69.9 | 14.2 | 5.8 | 89.9 | ||||||||
2014 | ||||||||||||
Net sales | $ | 1,126.3 | $ | 295.7 | $ | (0.6 | ) | $ | 1,421.4 | |||
Operating profit | $ | 199.6 | $ | 36.9 | $ | (54.5 | ) | $ | 182.0 | |||
Interest expense, net | — | — | (13.0 | ) | (13.0 | ) | ||||||
Income before income taxes | $ | 199.6 | $ | 36.9 | $ | (67.5 | ) | $ | 169.0 | |||
Segment assets | $ | 1,185.5 | $ | 234.0 | $ | 250.2 | $ | 1,669.7 | ||||
Capital expenditures | 88.4 | 26.9 | (3.4 | ) | 111.9 | |||||||
Depreciation and amortization expense | 71.6 | 12.7 | 5.7 | 90.0 | ||||||||
74
Report of Independent Registered Public Accounting Firm
To the Shareholders and the Board of Directors of West Pharmaceutical Services, Inc.
In our opinion, the consolidated financial statements listed in the index appearing under Item 15 (a) (1), present fairly, in all material respects, the financial position of West Pharmaceutical Services, Inc., and its subsidiaries at December 31, 2016 and December 31, 2015, and the results of their operations and their cash flows for each of the three years in the period ended December 31, 2016 in conformity with accounting principles generally accepted in the United States of America. In addition, in our opinion, the financial statement schedule listed in the accompanying index appearing under Item 15 (a) (2) presents fairly, in all material respects, the information set forth therein when read in conjunction with the related consolidated financial statements. Also in our opinion, the Company maintained, in all material respects, effective internal control over financial reporting as of December 31, 2016, based on criteria established in Internal Control - Integrated Framework (2013) issued by the Committee of Sponsoring Organizations of the Treadway Commission (COSO). The Company's management is responsible for these financial statements and financial statement schedule, for maintaining effective internal control over financial reporting and for its assessment of the effectiveness of internal control over financial reporting, included in Management's Report on Internal Control over Financial Reporting appearing under Item 9A. Our responsibility is to express opinions on these financial statements, on the financial statement schedule, and on the Company's internal control over financial reporting based on our integrated audits. We conducted our audits in accordance with the standards of the Public Company Accounting Oversight Board (United States). Those standards require that we plan and perform the audits to obtain reasonable assurance about whether the financial statements are free of material misstatement and whether effective internal control over financial reporting was maintained in all material respects. Our audits of the financial statements included examining, on a test basis, evidence supporting the amounts and disclosures in the financial statements, assessing the accounting principles used and significant estimates made by management, and evaluating the overall financial statement presentation. Our audit of internal control over financial reporting included obtaining an understanding of internal control over financial reporting, assessing the risk that a material weakness exists, and testing and evaluating the design and operating effectiveness of internal control based on the assessed risk. Our audits also included performing such other procedures as we considered necessary in the circumstances. We believe that our audits provide a reasonable basis for our opinions.
A company’s internal control over financial reporting is a process designed to provide reasonable assurance regarding the reliability of financial reporting and the preparation of financial statements for external purposes in accordance with generally accepted accounting principles. A company’s internal control over financial reporting includes those policies and procedures that (i) pertain to the maintenance of records that, in reasonable detail, accurately and fairly reflect the transactions and dispositions of the assets of the company; (ii) provide reasonable assurance that transactions are recorded as necessary to permit preparation of financial statements in accordance with generally accepted accounting principles, and that receipts and expenditures of the company are being made only in accordance with authorizations of management and directors of the company; and (iii) provide reasonable assurance regarding prevention or timely detection of unauthorized acquisition, use, or disposition of the company’s assets that could have a material effect on the financial statements.
75
Because of its inherent limitations, internal control over financial reporting may not prevent or detect misstatements. Also, projections of any evaluation of effectiveness to future periods are subject to the risk that controls may become inadequate because of changes in conditions, or that the degree of compliance with the policies or procedures may deteriorate.
/s/ PricewaterhouseCoopers LLP
PricewaterhouseCoopers LLP
Philadelphia, Pennsylvania
February 28, 2017
76
Quarterly Operating and Per Share Data (Unaudited)
($ in millions, except per share data) | First Quarter (1) | Second Quarter (2) | Third Quarter (3) | Fourth Quarter (4) | Full Year | ||||||||||
2016 | |||||||||||||||
Net sales | $ | 362.1 | $ | 388.0 | $ | 376.7 | $ | 382.3 | $ | 1,509.1 | |||||
Gross profit | 123.3 | 133.3 | 121.1 | 123.4 | 501.1 | ||||||||||
Net income | 22.1 | 44.7 | 37.6 | 39.1 | 143.6 | ||||||||||
Net income per share: | |||||||||||||||
Basic | $ | 0.31 | $ | 0.61 | $ | 0.51 | $ | 0.53 | $ | 1.96 | |||||
Diluted | $ | 0.30 | $ | 0.60 | $ | 0.50 | $ | 0.52 | $ | 1.91 | |||||
2015 | |||||||||||||||
Net sales | $ | 335.9 | $ | 359.7 | $ | 344.5 | $ | 359.7 | $ | 1,399.8 | |||||
Gross profit | 109.7 | 118.2 | 108.3 | 119.6 | 455.8 | ||||||||||
Net income | 32.9 | 27.8 | 1.5 | 33.4 | 95.6 | ||||||||||
Net income per share: | |||||||||||||||
Basic | $ | 0.46 | $ | 0.39 | $ | 0.02 | $ | 0.46 | $ | 1.33 | |||||
Diluted | $ | 0.45 | $ | 0.38 | $ | 0.02 | $ | 0.45 | $ | 1.30 | |||||
The sum of the quarterly amounts may not equal full year due to rounding.
Factors affecting the comparability of the information reflected in the quarterly data:
(1) | Net income for the first quarter of 2016 included restructuring and related charges of $15.0 million ($0.20 per diluted share) and a charge of $2.5 million related to the devaluation of the Venezuelan Bolivar ($0.03 per diluted share). |
(2) | Second quarter 2016 net income included $1.0 million in reversals of previously-recorded restructuring and related charges ($0.01 per diluted share). Second quarter 2015 net income included a $6.9 million ($0.09 per diluted share) charge for executive retirement and related costs. |
(3) | Net income for the third quarter of 2016 included restructuring and related charges of $1.6 million ($0.02 per diluted share) and a discrete tax charge of $0.3 million ($0.01 per diluted share). Net income for the third quarter of 2015 included a pension settlement charge of $31.1 million ($0.42 per diluted share) in connection with our purchase of a group annuity contract from MetLife and lump-sum payouts made to terminated vested participants of our U.S. qualified pension plan. |
(4) | Fourth quarter 2016 net income included restructuring and related charges of $1.8 million ($0.02 per diluted share), a pension curtailment gain of $1.3 million ($0.01 per diluted share) and a discrete tax charge of $0.7 million ($0.01 per diluted share). Fourth quarter 2015 net income included a $0.9 million ($0.01 per diluted share) pension settlement charge related to lump-sum payouts made to terminated vested participants of our U.S. qualified pension plan and a discrete tax charge of $0.8 million ($0.01 per diluted share). |
ITEM 9. CHANGES IN AND DISAGREEMENTS WITH ACCOUNTANTS ON ACCOUNTING AND FINANCIAL DISCLOSURE
None.
77
ITEM 9A. CONTROLS AND PROCEDURES
Disclosure Controls are controls and procedures designed to reasonably ensure that information required to be disclosed in our reports filed under the Exchange Act, such as this annual report, is recorded, processed, summarized and reported within the time periods specified in the SEC's rules and forms. Disclosure Controls include, without limitation, controls and procedures designed to ensure that information required to be disclosed in our reports filed under the Securities Exchange Act of 1934, as amended, is accumulated and communicated to our management, including our CEO and Chief Financial Officer (“CFO”), or persons performing similar functions, as appropriate, to allow timely decisions regarding required disclosure. Our Disclosure Controls include some, but not all, components of our internal control over financial reporting.
Evaluation of Disclosure Controls and Procedures
An evaluation was performed under the supervision and with the participation of our management, including our CEO and CFO, of the effectiveness of our disclosure controls and procedures (as defined in Rule 13a-15(e) under the Securities Exchange Act of 1934), as of the end of the period covered by this Form 10-K. Based on this evaluation, our CEO and CFO have concluded that, as of December 31, 2016, our disclosure controls and procedures are effective.
Management's Report on Internal Control over Financial Reporting
Our management is responsible for establishing and maintaining adequate internal control over financial reporting, as defined in Rule 13a-15(f) under the Securities Exchange Act of 1934. Our internal control over financial reporting is a process designed under the supervision of our CEO and CFO to provide reasonable assurance regarding the reliability of financial reporting and the preparation of our financial statements for external reporting purposes in accordance with U.S. generally accepted accounting principles.
Management assessed the effectiveness of our internal control over financial reporting as of December 31, 2016 based on the framework established in “Internal Control-Integrated Framework (2013)” issued by the Committee of Sponsoring Organizations of the Treadway Commission (COSO). Based on this assessment, management has determined that our internal control over financial reporting was effective as of December 31, 2016.
Because of its inherent limitations, internal control over financial reporting may not prevent or detect misstatements. No evaluation of controls can provide absolute assurance that all control issues and instances of fraud, if any, within West have been detected. These inherent limitations include the realities that judgments in decision-making can be faulty, and that breakdowns can occur because of simple error or mistake. Controls can also be circumvented by the individual acts of some persons, by collusion of two or more people, or by management override of the controls. The design of any system of controls is based in part upon certain assumptions about the likelihood of future events, and there can be no assurance that any design will succeed in achieving its stated goals under all potential future conditions. Also projections of any evaluation of effectiveness to future periods are subject to the risks that controls may become inadequate because of changes in conditions, or that the degree of compliance with the policies or procedures may deteriorate.
The effectiveness of our internal control over financial reporting as of December 31, 2016 has been audited by PricewaterhouseCoopers LLP, an independent registered public accounting firm, as stated in their report, which is included herein.
Changes in Internal Controls
During the fourth quarter ended December 31, 2016, there have been no changes to our internal control over financial reporting that have materially affected, or are reasonably likely to materially affect, our internal control over financial reporting.
ITEM 9B. OTHER INFORMATION
None.
78
PART III
ITEM 10. DIRECTORS, EXECUTIVE OFFICERS AND CORPORATE GOVERNANCE
Information about our directors is incorporated by reference from the discussion under the heading Items to Be Voted on - Proposal 1 - Election of Directors in our 2017 Proxy Statement. Information about our Code of Business Conduct is incorporated by reference from the discussion under the heading Corporate Governance and Board Matters - Code of Business Conduct in our 2017 Proxy Statement. Information regarding the procedures by which our shareholders may recommend nominees to our Board of Directors is incorporated by reference from the discussion under the heading Other Information - 2018 Shareholders Proposals or Nominations included in our 2017 Proxy Statement. Information about our Audit Committee, including the members of the committee, and our Audit Committee financial experts, is incorporated by reference from the discussion under the heading Corporate Governance and Board Matters - Committees - Audit Committee in our 2017 Proxy Statement. The balance of the information required by this item is contained in the discussion entitled Executive Officers of the Company in Part I of this Form 10-K.
ITEM 11. EXECUTIVE COMPENSATION
Information about director and executive compensation is incorporated by reference from the discussion under the headings Director Compensation and Executive Compensation in our 2017 Proxy Statement.
79
ITEM 12. SECURITY OWNERSHIP OF CERTAIN BENEFICIAL OWNERS AND MANAGEMENT AND RELATED STOCKHOLDER MATTERS
Information required by this Item is incorporated by reference from the discussion under the headings Other Information - Stock Ownership in our 2017 Proxy Statement.
Equity Compensation Plan Information Table
The following table sets forth information about the grants of stock options, restricted stock or other rights under all of the Company's equity compensation plans as of the close of business on December 31, 2016. The table does not include information about tax-qualified plans such as the West 401(k) Plan or the Tech Group Puerto Rico Savings and Retirement Plan.
Plan Category | Number of Securities to be Issued Upon Exercise of Outstanding Options, Warrants and Rights (a) | Weighted-Average Exercise Price of Outstanding Options, Warrants and Rights (b) | Number of Securities Remaining Available for Future Issuance Under Equity Compensation Plans (Excluding Securities Reflected in Column (a)) (c) | |||||||
Equity compensation plans approved by security holders | 5,272,515 | (1) | $ | 37.97 | (2) | 9,374,016 | (3) | |||
Equity compensation plans not approved by security holders | — | — | — | |||||||
Total | 5,272,515 | $ | 37.97 | 9,374,016 | ||||||
(1) | Includes 78,184 outstanding stock options, 103,680 restricted performance share units, 1,393 restricted retention share units, 24,244 deferred stock-equivalents units and 704 restricted stock-equivalents units granted to directors under the 2016 Plan. Includes 3,358,823 outstanding stock options, 54,952 outstanding stock-settled stock appreciation rights, 255,603 restricted performance share units, 41,458 restricted retention share units, 171,422 deferred stock-equivalents units under the 2011 Plan (which was terminated in 2016). Includes 1,100,092 outstanding stock options and 72,523 deferred stock-equivalents units granted to directors under the Non-Qualified Deferred Compensation Plan for Non-Employee Directors under the 2007 Omnibus Incentive Compensation Plan (which was terminated in 2011). Includes 9,437 outstanding stock options under the 2004 Stock-Based Compensation Plan (which was terminated in 2007). The average term of remaining options and stock-settled stock appreciation rights granted is 6.3 years. No future grants or awards may be made under the terminated plans. The total includes restricted performance share units at 100% of grant. The restricted performance share unit payouts were at 110.6%, 167.8% and 124.4% in 2016, 2015 and 2014, respectively. The total does not include stock-equivalent units granted or credited to directors under the Non-Qualified Deferred Compensation Plan for Non-Employee Directors to be settled only in cash. |
(2) | Restricted performance share and deferred stock-equivalent units are excluded when determining the weighted-average exercise price of outstanding options. |
(3) | Represents 4,039,545 shares reserved under the Company's Employee Stock Purchase Plan and 5,334,471 shares remaining available for issuance under the 2016 Plan. The estimated number of shares that could be issued for 2016 from the Employee Stock Purchase Plan is 454,936. This number of shares is calculated by multiplying the 328 share per offering period per participant limit by 1,387, the number of current participants in the plan. |
80
ITEM 13. CERTAIN RELATIONSHIPS AND RELATED TRANSACTIONS, AND DIRECTOR INDEPENDENCE
Information called for by this Item is incorporated by reference from the discussion under the heading Corporate Governance and Board Matters - Related Person Transactions and Procedures in our 2017 Proxy Statement. Information about director independence is incorporated by reference from the discussion under the heading Corporate Governance and Board Matters - Director Independence in our 2017 Proxy Statement.
ITEM 14. PRINCIPAL ACCOUNTING FEES AND SERVICES
Information about the fees for professional services rendered by our independent auditors in 2016 and 2015 is incorporated by reference from the discussion under the heading Independent Auditors and Fees - Fees Paid to PricewaterhouseCoopers LLP in our 2017 Proxy Statement. Our Audit Committee's policy on pre-approval of audit and permissible non-audit services of our independent auditors is incorporated by reference from the section captioned Independent Auditors and Fees - Audit Committee Policy on Pre-Approval of Audit and Permissible Non-Audit Services in our 2017 Proxy Statement.
PART IV
ITEM 15. EXHIBITS, FINANCIAL STATEMENT SCHEDULES
(a) 1. Financial Statements
The following documents are included in Part II, Item 8:
Consolidated Statements of Income for the years ended December 31, 2016, 2015 and 2014
Consolidated Statements of Comprehensive Income for the years ended December 31, 2016, 2015 and 2014
Consolidated Balance Sheets at December 31, 2016 and 2015
Consolidated Statement of Equity for the years ended December 31, 2016, 2015 and 2014
Consolidated Statements of Cash Flows for the years ended December 31, 2016, 2015 and 2014
Notes to Consolidated Financial Statements
Report of Independent Registered Public Accounting Firm
81
(a) 2. Financial Statement Schedules
Schedule II - Valuation and Qualifying Accounts
($ in millions) | Balance at beginning of period | Charged to costs and expenses | Deductions (1) | Balance at end of period | ||||||||
For the year ended December 31, 2016 | ||||||||||||
Allowances deducted from assets: | ||||||||||||
Deferred tax asset valuation allowance | $ | 20.1 | $ | (1.3 | ) | $ | (0.1 | ) | $ | 18.7 | ||
Allowance for doubtful accounts | 0.6 | — | (0.2 | ) | 0.4 | |||||||
Total allowances deducted from assets | $ | 20.7 | $ | (1.3 | ) | $ | (0.3 | ) | $ | 19.1 | ||
For the year ended December 31, 2015 | ||||||||||||
Allowances deducted from assets: | ||||||||||||
Deferred tax asset valuation allowance | $ | 22.1 | $ | (0.3 | ) | $ | (1.7 | ) | $ | 20.1 | ||
Allowance for doubtful accounts | 0.9 | 0.1 | (0.4 | ) | 0.6 | |||||||
Total allowances deducted from assets | $ | 23.0 | $ | (0.2 | ) | $ | (2.1 | ) | $ | 20.7 | ||
For the year ended December 31, 2014 | ||||||||||||
Allowances deducted from assets: | ||||||||||||
Deferred tax asset valuation allowance | $ | 23.5 | $ | (0.9 | ) | $ | (0.5 | ) | $ | 22.1 | ||
Allowance for doubtful accounts | 0.8 | 0.4 | (0.3 | ) | 0.9 | |||||||
Total allowances deducted from assets | $ | 24.3 | $ | (0.5 | ) | $ | (0.8 | ) | $ | 23.0 | ||
__________________________
(1) | Includes accounts receivable written off, the write-off or write-down of valuation allowances, and translation adjustments. |
All other schedules are omitted because they are either not applicable, not required or because the information required is contained in the consolidated financial statements or notes thereto.
(a) 3. | Exhibits - An index of the exhibits included in this Form 10-K is contained on pages F-1 through F-4 and is incorporated herein by reference. |
(b) | See subsection (a) 3. above. |
(c) | Financial Statements of affiliates are omitted because they do not meet the tests of a significant subsidiary at the 20% level. |
82
SIGNATURES
Pursuant to the requirements of Section 13 or 15(d) of the Securities Exchange Act of 1934, West Pharmaceutical Services, Inc. has duly caused this report to be signed on its behalf by the undersigned, thereunto duly authorized.
WEST PHARMACEUTICAL SERVICES, INC.
(Registrant)
By: /s/ William J. Federici
William J. Federici
Senior Vice President and Chief Financial Officer
February 28, 2017
83
Pursuant to the requirements of the Securities Exchange Act of 1934, this report has been signed below by the following persons on behalf of West Pharmaceutical Services, Inc. in the capacities and on the dates indicated.
Signature | Title | Date |
/s/ Eric M. Green | Director, President and Chief Executive Officer | February 28, 2017 |
Eric M. Green | (Principal Executive Officer) | |
/s/ Daniel Malone | Vice President and Controller | February 28, 2017 |
Daniel Malone | (Principal Accounting Officer) | |
/s/ William J. Federici | Senior Vice President and Chief Financial Officer | February 28, 2017 |
William J. Federici | (Principal Financial Officer) | |
/s/ Mark A. Buthman | Director | February 14, 2017 |
Mark A. Buthman | ||
/s/ William F. Feehery | Director | February 14, 2017 |
William F. Feehery | ||
/s/ Thomas W. Hofmann | Director | February 14, 2017 |
Thomas W. Hofmann | ||
/s/ Paula A. Johnson | Director | February 14, 2017 |
Paula A. Johnson | ||
/s/ Myla Lai-Goldman, M.D. | Director | February 14, 2017 |
Myla Lai-Goldman, M.D. | ||
/s/ Douglas A. Michels | Director | February 14, 2017 |
Douglas A. Michels | ||
/s/ Paolo Pucci | Director | February 14, 2017 |
Paolo Pucci | ||
/s/ John H. Weiland | Director | February 14, 2017 |
John H. Weiland | ||
/s/ Patrick J. Zenner | Director and Chairman of the Board | February 14, 2017 |
Patrick J. Zenner | ||
84
EXHIBIT INDEX
Exhibit Number | Description |
3.1 | Our Amended and Restated Articles of Incorporation are incorporated by reference from our Form 10-Q report for the quarter ended March 31, 2015. |
3.2 | Our Bylaws, as amended through May 5, 2015, are incorporated by reference from our Form 10-Q report for the quarter ended March 31, 2015. |
4.1 | Form of stock certificate for common stock is incorporated by reference from our annual report on Form 10-K dated May 6, 1999. |
4.2 | Article 5, 6, 8(c) and 9 of our Amended and Restated Articles of Incorporation are incorporated by reference from our Form 10-Q report for the quarter ended March 31, 2015. |
4.3 | Article I and V of our Bylaws, as amended through May 5, 2015, are incorporated by reference from our Form 10-Q report for the quarter ended March 31, 2015. |
4.4 (1) | Instruments defining the rights of holders of long-term debt securities of West and its subsidiaries have been omitted. |
10.1 | First Amendment to Credit Agreement, dated as of September 4, 2015, by and among West, certain of its subsidiaries, the several banks and other financial institutions party thereto, and PNC Bank, National Association, as administrative agent for the Lenders incorporated by reference from our Form 10-Q report for the quarter ended September 30, 2015. |
10.2 | Credit Agreement, dated as of October 15, 2015, between West, certain of its subsidiaries, the lenders party thereto from time to time, PNC Bank, National Association, as Administrative Agent and PNC Capital Markets, LLC, as Sole Lead Arranger and Sole Bookrunner, is incorporated by reference from our Form 8-K dated October 15, 2015. |
10.3 | Note Purchase Agreement, dated July 5, 2012, among the Company and the Purchasers named therein is incorporated by reference from our Form 8-K filed on July 10, 2012. |
10.4 (2) | Retirement Separation Agreement, dated as of June 30, 2015, between us and Donald E. Morel, Jr., Ph.D., is incorporated by reference from our Form 8-K dated July 1, 2015. |
10.5 (2) | 2015 Long-Term Incentive Plan Award, dated as of June 30, 2015, between us and Donald E. Morel, Jr., is incorporated by reference from our Form 10-Q report for the quarter ended June 30, 2015. |
10.6 (2) | 2015 Long-Term Incentive Plan Award, dated as of June 30, 2015, between us and Patrick Zenner, is incorporated by reference from our Form 10-Q report for the quarter ended June 30, 2015. |
10.7 (2) | Employment Agreement, dated as of April 13, 2015, between us and Eric M. Green, is incorporated by reference from our Form 8-K dated April 15, 2015. |
10.8 (2) | Indemnification Agreement, dated as of April 24, 2015, between us and Eric M. Green, is incorporated by reference from our Form 8-K dated April 30, 2015. |
10.9 (2) | Sign-On Retention Award Notice, dated as of April 24, 2015, from us to Eric M. Green, is incorporated by reference from our Form 8-K dated April 30, 2015. |
10.10 (2) | Form of Second Amended and Restated Change-in-Control Agreement between us and certain of our executive officers dated as of March 25, 2000 is incorporated by reference from our 10-Q report for the quarter ended March 31, 2000. |
10.11 (2) | Form of Amendment No. 1 to Second Amended and Restated Change-in-Control Agreement dated as of May 1, 2001 between us and certain of our executive officers is incorporated by reference from our 2001 10-K report. |
10.12 (2) | Form of Amendment No. 2 to Second Amended and Restated Change-in-Control Agreement between us and certain of our executive officers, dated as of various dates in December 2008, is incorporated by reference from our 2008 10-K report. |
10.13 (2) | Schedule of agreements with executive officers is incorporated by reference from our 2008 10-K report. |
10.14 (2) | Change-in-Control Agreement, dated as of August 16, 2012, between us and Daniel Malone, is incorporated by reference from our 2013 10-K report. |
10.15 (2) | Change-in-Control Agreement, dated as of August 15, 2012, between us and Karen Flynn, is incorporated by reference from our 2013 10-K report. |
F-1
Exhibit Number | Description |
10.16 (2) | Employment Agreement, dated as of April 30, 2002, between us and Donald E. Morel, Jr. is incorporated by reference from our 10-Q report for the quarter ended September 30, 2002. |
10.17 (2) | Amendment #1 to the Employment Agreement between us and Donald E. Morel, Jr., dated as of December 19, 2008, is incorporated by reference from our 2008 10-K report. |
10.18 (2) | Non-Qualified Stock Option Agreement, dated as of April 30, 2002 between us and Donald E. Morel, Jr. is incorporated by reference from our 10-Q report for the quarter ended September 30, 2002. |
10.19 (2) | Indemnification Agreement, dated as of January 5, 2009 between us and Donald E. Morel, Jr. is incorporated by reference from our Form 8-K dated January 6, 2009. |
10.20 (2) | Supplemental Employees' Retirement Plan, as amended and restated effective January 1, 2008, is incorporated by reference from our 2008 10-K report. |
10.21 (2) | Non-Qualified Deferred Compensation Plan for Designated Employees, as amended and restated effective January 1, 2008, is incorporated by reference from our 2008 10-K report. |
10.22 (2) | Deferred Compensation Plan for Outside Directors, as amended and restated effective June 30, 2013, is incorporated by reference from our 2013 10-K report. |
10.23 (2) | West Pharmaceutical Services, Inc. 2011 Omnibus Incentive Compensation Plan is incorporated by reference from our Form 8-K filed on May 6, 2011. |
10.24 (2) | 2007 Omnibus Incentive Compensation Plan effective as of May 1, 2007, is incorporated by reference to Exhibit 99.1 of the Company's Form 8-K dated May 4, 2007. |
10.25 (2) | 2004 Stock-Based Compensation Plan (now terminated) is incorporated by reference from our Proxy Statement for the 2004 Annual Meeting of Shareholders. |
10.26 (2) | Form of Executive 2006 Non-Qualified Stock Option Award is incorporated by reference from our 10-Q report for the quarter ended March 31, 2006. |
10.27 (2) | Form of Director 2006 Non-Qualified Stock Option Award Notice is incorporated by reference from our 10-Q report for the quarter ended June 30, 2006. |
10.28 (2) | Form of Director 2006 Stock Unit Award Notice is incorporated by reference from our 10-Q report for the quarter ended June 30, 2006. |
10.29 (2) | Form of 2007 Non-Qualified Stock Option and Performance-Vesting Share Unit Award, issued pursuant to the 2004 Stock-Based Compensation Plan, is incorporated by reference from our 10-Q report for the quarter ended March 31, 2007. |
10.30 (2) | Form of Director 2007 Deferred Stock Award, issued pursuant to the 2007 Omnibus Incentive Compensation Plan, is incorporated by reference from our 10-Q report for the quarter ended June 30, 2007. |
10.31 (2) | Form of 2008 Non-Qualified Stock Option and Performance-Vesting Share Unit Award, issued pursuant to the 2007 Omnibus Incentive Compensation Plan, is incorporated by reference from our 10-Q report for the quarter ended March 31, 2008. |
10.32 (2) | Form of Director 2008 Deferred Stock Award, issued pursuant to the 2007 Omnibus Incentive Compensation Plan, is incorporated by reference from our 2008 10-K report. |
10.33 (2) | Form of 2009 Supplemental Long-Term Incentive Award, is incorporated by reference from our 10-Q report for the quarter ended September 30, 2009. |
10.34 (2) | Letter Agreement dated as of March 30, 2006 between us and Donald E. Morel, Jr. is incorporated by reference from our 10-Q report for the quarter ended June 30, 2006. |
10.35 | Credit Agreement, dated June 3, 2011, by and among us, certain of our subsidiaries, several banks and other financial institutions from time to time parties thereto (the “Lenders”) and PNC Bank, National Association, as administrative agent for the Lenders. |
10.36 | Security Agreement, dated June 3, 2011, by and among us, the subsidiaries of the Company listed on the signature pages thereto and PNC Bank, National Association, as administrative agent, for the holders of the Obligations. |
10.37 (3) | Agreement, effective as of January 1, 2005, between us and The Goodyear Tire & Rubber Company is incorporated by reference from our 10-Q report for the quarter ended June 30, 2005. |
F-2
Exhibit Number | Description |
10.38 (3) | First Agreement to Amend to Agreement, effective as of July 1, 2008, between us and The Goodyear Tire & Rubber Company is incorporated by reference from our 10-Q report for the quarter ended March 31, 2009. |
10.39 (3) | Distributorship Agreement, dated and effective January 18, 2017, between Daikyo Seiko, Ltd. and us. |
10.40 (4) | Amended and Restated Technology Exchange and Cross License Agreement, dated and effective January 18, 2017, between Daikyo Seiko, Ltd. and us. |
10.41 | Note Purchase Agreement, dated as of July 28, 2005, among us and each of the purchasers listed on Schedule A thereto, is incorporated by reference from our 8-K report dated August 3, 2005. |
10.42 | Indemnification agreements between us and each of our directors in the form of Exhibit 10.1 to our Form 8-K report dated January 6, 2009, which is incorporated by reference. |
10.43 (3) | Global Supply Agreement by and between ExxonMobil Chemical Company and us, entered into on August 11, 2014, and effective January 1, 2014 through December 31, 2018 is incorporated by reference from our Form 8-K report filed on August 15, 2014. |
10.44 (2) | Form of 2014 Long-Term Incentive Plan Award is incorporated by reference from our Form 10-Q report for the quarter ended March 31, 2014. |
10.45 (2) | Form of 2014 Stock-Settled Restricted Stock Unit Award is incorporated by reference from our Form 10-Q report for the quarter ended June 30, 2014. |
10.46 (3) | Amendment by and between ExxonMobil Chemical Company and us, incorporated by reference from our Form 10-Q report for the quarter ended June 30, 2016. |
10.47 (2) | Employment Agreement, dated August 28, 2016, between David Montecalvo and us, incorporated by reference from our Form 10-Q report for the quarter ended September 30, 2016. |
10.48 (3) | Agreement, dated August 16, 2016, to amend Agreement by and between the Goodyear Tire & Rubber Company and us, incorporated by reference from our Form 10-Q report for the quarter ended September 30, 2016. |
21. | Subsidiaries of the Company. |
23. | Consent of Independent Registered Public Accounting Firm. |
31.1 | Certification by the Chief Executive Officer Pursuant to Section 302 of the Sarbanes-Oxley Act of 2002. |
31.2 | Certification by the Chief Financial Officer Pursuant to Section 302 of the Sarbanes-Oxley Act of 2002. |
32.1* | Certification by the Chief Executive Officer Pursuant to 18 U.S.C. Section 1350, as Adopted Pursuant to Section 906 of the Sarbanes-Oxley Act of 2002. |
32.2* | Certification by the Chief Financial Officer Pursuant to 18 U.S.C. Section 1350, as Adopted Pursuant to Section 906 of the Sarbanes-Oxley Act of 2002. |
101.INS | XBRL Instance Document |
101.SCH | XBRL Taxonomy Extension Schema Document |
101.CAL | XBRL Taxonomy Extension Calculation Linkbase Document |
101.LAB | XBRL Taxonomy Extension Label Linkbase Document |
101.PRE | XBRL Taxonomy Extension Presentation Linkbase Document |
101.DEF | XBRL Taxonomy Extension Definition Linkbase Document |
(1) | We agree to furnish to the SEC, upon request, a copy of each instrument with respect to issuances of long-term debt of the Company and its subsidiaries. |
(2) | Management compensatory plan. |
(3) | Certain portions of this exhibit have been omitted and filed separately with the SEC pursuant to a confidential treatment order of the SEC. |
F-3
(4) | Certain portions of this exhibit have been omitted pursuant to a confidential treatment request submitted to the SEC. |
* | Furnished, not filed. |
F-4