Attached files
| file | filename |
|---|---|
| EX-99.A - RESERVE AUDIT - ENERGEN CORP | egn123116ex99a.htm |
| EX-32 - ENERGEN CORPORATION 18 U.S.C. SECTION 1350 CERTIFICATION - ENERGEN CORP | egn12312016ex32.htm |
| EX-31.B - ENERGEN CORPORATION CERTIFICATION OF CFO - ENERGEN CORP | egn12312016ex31b.htm |
| EX-31.A - ENERGEN CORPORATION CERTIFICATION OF CEO - ENERGEN CORP | egn12312016ex31a.htm |
| EX-24 - POWER OF ATTORNEY - ENERGEN CORP | egn12312016ex24.htm |
| EX-23.B - CONSENT OF INDEPENDENT OIL AND GAS RESERVOIR ENGINEERS - ENERGEN CORP | egn12312016ex23b.htm |
| EX-23.A - CONSENT OF REGISTERED PUBLIC ACCOUNTING FIRM - ENERGEN CORP | egn12312016ex23a.htm |
| EX-21 - SUBSIDIARIES - ENERGEN CORP | egn12312016ex21.htm |
| EX-10.E - ENERGEN STOCK INCENTIVE PLAN - ENERGEN CORP | egn123116ex10e.htm |
| EX-10.D - SEVERANCE COMPENSATION AGREEMENT - ENERGEN CORP | egn123116ex10d.htm |
UNITED STATES
SECURITIES AND EXCHANGE COMMISSION
Washington, D.C. 20549
FORM 10-K
x | ANNUAL REPORT PURSUANT TO SECTION 13 OR 15(d) OF THE SECURITIES EXCHANGE ACT OF 1934 FOR THE YEAR ENDED DECEMBER 31, 2016 |
o | TRANSITION REPORT PURSUANT TO SECTION 13 OR 15(d) OF THE SECURITIES EXCHANGE ACT OF 1934 FOR THE TRANSITION PERIOD FROM ___ TO ___ |
Commission file number 1-7810
Energen Corporation
(Exact name of registrant as specified in its charter)
Alabama | 63-0757759 | |
(State or other jurisdiction of incorporation or organization) | (I.R.S. Employer Identification No.) | |
605 Richard Arrington Jr. Boulevard North, Birmingham, Alabama | 35203-2707 | |
(Address of principal executive offices) | (Zip Code) | |
Registrant’s telephone number, including area code
(205) 326-2700
Securities Registered Pursuant to Section 12(b) of the Act:
Title of Each Class | Name of Each Exchange on Which Registered | |
Common Stock, $0.01 par value | New York Stock Exchange | |
Securities Registered Pursuant to Section 12(g) of the Act: None
Indicate by check mark if the registrant is a well-known seasoned issuer, as defined in Rule 405 of the Securities Act. YES x NO o
Indicate by check mark if the registrant is not required to file reports pursuant to Section 13 or Section 15(d) of the Act. YES o NO x
Indicate by a check mark whether the registrant (1) has filed all reports required to be filed by Section 13 or 15(d) of the Securities Exchange Act of 1934 during the preceding 12 months (or for such shorter period that the registrant was required to file such reports) and (2) has been subject to such filing requirements for the past 90 days. YES x NO o
Indicate by check mark whether the registrant has submitted electronically and posted on its corporate Web site, if any, every Interactive Data File required to be submitted and posted pursuant to Rule 405 of Regulation S-T (§232.405 of this chapter) during the preceding 12 months (or for such shorter period that the registrant was required to submit and post such files). YES x NO o
Indicate by a check mark if disclosure of delinquent filers pursuant to Item 405 of Regulation S-K is not contained herein and will not be contained, to the best of registrant’s knowledge, in definitive proxy or information statements incorporated by reference in Part III of this Form 10-K or any amendment to this Form 10-K. x
Indicate by check mark whether the registrant is a large accelerated filer, an accelerated filer, a non-accelerated filer, or a smaller reporting company. See the definitions of “large accelerated filer,” “accelerated filer” and “smaller reporting company” in Rule 12b-2 of the Exchange Act.
Large accelerated filer x Accelerated filer o Non-accelerated filer o Smaller reporting company o
Indicate by check mark whether the registrant is a shell company (as defined in Rule 12b-2 of the Act). YES o NO x
Aggregate market value of the voting stock held by non-affiliates of the registrant as of June 30, 2016: $4,616,230,556
Number of shares outstanding of the registrant’s common stock as of February 14, 2017: 97,187,767 shares
DOCUMENTS INCORPORATED BY REFERENCE
Energen Corporation Proxy Statement to be filed on or about March 22, 2017 (Part III, Item 10-14)
ENERGEN CORPORATION 2016 FORM 10-K ANNUAL REPORT | ||
TABLE OF CONTENTS | ||
Page | ||
Industry Glossary | ||
Cautionary Statement Regarding Forward-Looking Statements | ||
PART I | ||
Item 1. | Business | |
Item 1A. | Risk Factors | |
Item 1B. | Unresolved Staff Comments | |
Item 2. | Properties | |
Item 3. | Legal Proceedings | |
Item 4. | Mine Safety Disclosures | |
PART II | ||
Item 5. | Market for Registrant’s Common Equity, Related Stockholder Matters and Issuer | |
Purchases of Equity Securities | ||
Item 6. | Selected Financial Data | |
Item 7. | Management’s Discussion and Analysis of Financial Condition and | |
Results of Operations | ||
Item 7A. | Quantitative and Qualitative Disclosures about Market Risk | |
Item 8. | Financial Statements and Supplementary Data | |
Item 9. | Changes in and Disagreements with Accountants on Accounting and | |
Financial Disclosure | ||
Item 9A. | Controls and Procedures | |
PART III | ||
Item 10. | Directors, Executive Officers and Corporate Governance | |
Item 11. | Executive Compensation | |
Item 12. | Security Ownership of Certain Beneficial Owners and Management and | |
Related Stockholder Matters | ||
Item 13. | Certain Relationships and Related Transactions, and Director Independence | |
Item 14. | Principal Accountant Fees and Services | |
PART IV | ||
Item 15. | Exhibits and Financial Statement Schedules | |
Signatures | ||
2
INDUSTRY GLOSSARY For a more complete definition of certain terms defined below, as well as other terms and concepts applicable to successful efforts accounting, please refer to Rule 4-10(a) of Regulation S-X, promulgated pursuant to the Securities Act of 1933 and the Securities Exchange Act of 1934, each as amended. | |
Basin | A large natural depression on the earth’s surface in which sediments accumulate. |
Basis | The difference between the futures price for a commodity and the corresponding cash spot price. This commonly is related to factors such as product quality, location and contract pricing. |
Basin Specific | A type of derivative contract whereby the contract’s settlement price is based on specific geographic basin indices. |
Bbl | A standard barrel containing 42 United States gallons. |
Bcf | One billion cubic feet of natural gas. |
BOE | One barrel of oil equivalent, a standard conversion used to express oil and natural gas volumes on a comparable oil equivalent basis. Natural gas equivalents are determined under the relative energy content method by using the ratio of six Mcf of natural gas to one barrel of oil. |
Collar | A contractual arrangement that effectively establishes a price range between a floor and a ceiling for the underlying commodity. The purchaser bears the risk of fluctuation between the minimum (or floor) price and the maximum (or ceiling) price. |
Completion | The process of treating a drilled well followed by the installation of permanent equipment for the production of oil or natural gas or, in the case of a dry hole, the reporting of abandonment to the appropriate agency. |
Development Costs | Costs necessary to gain access to, prepare and equip development wells in areas of proved reserves. |
Development Well | A well drilled within the proved area of an oil or natural gas reservoir to the depth of a stratigraphic horizon known to be productive. |
Downspacing | An increase in the number of available drilling locations as a result of a regulatory commission order. |
Dry Well | An exploratory or a development well found to be incapable of producing either oil or natural gas in sufficient quantities to justify completion as an oil or natural gas well. |
Exploration Expenses | Costs primarily associated with drilling unsuccessful exploratory wells in undeveloped properties or exploratory geological and geophysical activities. |
Exploratory Well | A well drilled to find and produce oil or natural gas in an unproved area, to find a new reservoir in a field previously found to be productive of oil or natural gas in another reservoir, or to extend a known reservoir. |
Field | An area consisting of a single reservoir or multiple reservoirs, all grouped on or related to the same individual geological structural feature and/or stratigraphic condition. |
Futures Contract | An exchange-traded contractual arrangement to buy or sell a standard quantity and quality of a commodity at a specified future date and price. Such contracts offer liquidity and minimal credit risk exposure but lack the flexibility of swap contracts. |
Hedging | The use of derivative commodity instruments such as futures, swaps, options and collars to help reduce financial exposure to commodity price volatility. |
Horizontal Drilling | A drilling technique used in certain formations where a well is drilled vertically to a certain depth and then drilled at a right angle with a specified interval. |
Hydraulic Fracturing | The process of creating and preserving a fracture or system of fractures in a reservoir rock typically by injecting a fluid under pressure through a wellbore and into the targeted formation. |
Gross Well or Acre | A well or acre in which a working interest is owned. |
LIBOR | London Interbank Offered Rate. |
MBbl | One thousand barrels of oil. |
MBOE | One thousand BOE. |
MBOE/d | One thousand BOE per day. |
Mcf | One thousand cubic feet of natural gas. |
MMBOE | One million BOE. |
3
MMcf | One million cubic feet of natural gas. |
MMcfe | One million cubic feet of natural gas equivalent. |
MMgal | One million gallons of natural gas liquids. |
Natural Gas Liquids (NGL) | Liquid hydrocarbons that are extracted and separated from the natural gas stream. NGL products include ethane, propane, butane, natural gasoline and other hydrocarbons. |
Net Well or Acre | A net well or acre is deemed to exist when the sum of fractional ownership working interests in gross wells or acres equals one. |
NYMEX | New York Mercantile Exchange. |
Operational Enhancement | Any action undertaken to improve production efficiency of oil and natural gas wells and/or reduce well costs. |
Operator | The company responsible for exploration, development and production activities for a specific project. |
Pay-Add | An operation within a currently producing wellbore that attempts to access and complete an additional pay zone(s) while maintaining production from the existing completed zone(s). |
Pay Zone | The stratigraphic horizon from which oil and natural gas is produced. |
Production (Lifting) Costs | Costs incurred to operate and maintain wells. |
Productive Well | An exploratory or a development well that is not a dry well. |
Proved Developed Reserves | The portion of proved reserves which can be expected to be recovered through existing wells with existing equipment and operating methods. |
Proved Reserves | Estimated quantities of crude oil, natural gas and natural gas liquids that geological and engineering data demonstrate with reasonable certainty to be recoverable in future years from known reservoirs under existing economic and operating conditions. |
Proved Reserves-to-Production Ratio | Ratio expressing years of supply determined by dividing the remaining recoverable proved reserves at year end by actual annual production volumes. The reserve-to-production ratio is a statistical indicator with certain limitations, including predictive value. The ratio varies over time as changes occur in production levels and remaining recoverable proved reserves. |
Proved Undeveloped Reserves (PUD) | The portion of proved reserves which can be expected to be recovered from new wells on undrilled proved acreage or from existing wells where a relatively major expenditure is required for completion. |
Recompletion | An operation within an existing wellbore whereby a completion in one pay zone is abandoned in order to attempt a completion in a different pay zone. |
Reservoir | A porous and permeable underground formation containing a natural accumulation of producible natural gas and/or oil that is confined by impermeable rock or water barriers and is separate from other reservoirs. |
SEC | The United States Securities and Exchange Commission. |
Service Well | A well employed for the introduction into an underground stratum of water, gas or other fluid under pressure or disposal of salt water produced with oil or other waste. |
Sidetrack Well | A new section of wellbore drilled from an existing well. |
Swap | A contractual arrangement in which two parties, called counterparties, effectively agree to exchange or “swap” variable and fixed rate payment streams based on a specified commodity volume. The contracts allow for flexible terms such as specific quantities, settlement dates and location but also expose the parties to counterparty credit risk. |
Undeveloped Acreage | Lease acreage on which wells have not been drilled or completed to a point that would permit the production of commercial quantities of oil and natural gas regardless of whether such acreage contains proved reserves. |
Working Interest | Ownership interest in the oil and natural gas properties that is burdened with the cost of development and operation of the property. |
Workover | A major remedial operation on a completed well to restore, maintain, or improve the well’s production such as deepening the well or plugging back to produce from a shallow formation. |
4
CAUTIONARY STATEMENT REGARDING FORWARD-LOOKING STATEMENTS
All statements, other than statements of historical fact, appearing in this report constitute forward-looking statements within the meaning of Section 27A of the Securities Act of 1933, as amended, and Section 21E of the Securities Exchange Act of 1934, as amended, and are noted in Energen’s disclosure and analysis as permitted by the Private Securities Litigation Reform Act of 1995. These forward-looking statements include, among other things, statements about our expectations, beliefs, intentions or business strategies for the future, statements concerning our outlook with regard to the timing and amount of future production of oil, natural gas liquids and natural gas, price realizations, the nature and timing of capital expenditures for exploration and development, plans for funding operations and drilling program capital expenditures, the timing and success of specific projects, operating costs and other expenses, proved oil and natural gas reserves, liquidity and capital resources, outcomes and effects of litigation, claims and disputes and derivative activities. In particular, forward-looking statements may include words such as “anticipate”, “believe”, “could”, “estimate”, “expect”, “forecast”, “foresee”, “intend”, “may”, “plan”, “potential”, “predict”, “project”, “seek”, “will” or other words or expressions concerning matters that are not historical facts. These statements involve certain risks and uncertainties that may cause actual results to differ materially from expectations as of the date of this filing.
Factors that could cause actual results to differ materially from those expressed or implied by forward-looking statements include, but are not limited to, the following:
• | volatility of oil, natural gas liquids and natural gas prices; |
• | uncertainties about the estimates of our proved oil, natural gas liquids and natural gas reserves; |
• | drilling risks; |
• | risks associated with our concentration of operations in the Permian Basin of west Texas and New Mexico; |
• | competition in the oil and natural gas industry; |
• | the adequacy of our capital resources, access to financing and liquidity; |
• | operational risks including risks of personal injury, property damage and environmental damage; |
• | changes in the regulatory environment at the federal, state, or local level and our ability to comply with regulations promulgated by the various regulatory bodies; |
• | changes in and the effects of environmental and other governmental regulation that applies to our operations, including new legislation or regulation of hydraulic fracturing, water use and disposal, permitting, climate change and other legal requirements; |
• | instability in the domestic and global capital and credit markets; |
• | financial strength of the parties with whom we do business, including other working interest owners, providers of midstream services, providers of oilfield services, purchasers of our oil, natural gas liquids and natural gas and the counterparties to our derivative contracts; |
• | changes in domestic and global economic and business conditions that impact the demand for oil, natural gas liquids and natural gas; |
• | changes in domestic and global supplies of oil, natural gas and natural gas liquids arising from economic and business conditions (including actions by the Organization of the Petroleum Exporting Countries); |
• | uncertainties about our ability to successfully execute our business and financial plans and strategies, including but not limited to our ability to economically develop our proved oil, natural gas liquids and natural gas reserves and to replace those reserves as scheduled as well our ability to project future rates of production and the timing of development expenditures; |
• | risks associated with our ability to execute on property acquisitions and divestitures including market liquidity, price levels, timing and financing associated with such transactions; |
• | the effectiveness of and our ability to use derivative instruments as part of our risk management activities; |
• | the costs and effects of litigation; and |
• | acts of nature, sabotage, terrorism or other malicious intentional acts (including cyber-attacks), war and other similar acts that disrupt operations or cause damage greater than covered by insurance. |
5
See Item 1A, Risk Factors, for a discussion of risk factors that may affect Energen and cause material variances from forward-looking statement expectations. The Item 1A, Risk Factors, discussion is incorporated by reference into this forward-looking statement disclosure.
Except as otherwise disclosed, the forward-looking statements do not reflect the impact of possible or pending acquisitions, investments, divestitures or restructurings. The absence of errors in input data, calculations and formulas used in estimates, assumptions and forecasts cannot be guaranteed. We base our forward-looking statements on information currently available to us, and we undertake no obligation to update or revise any of these statements, whether as a result of changes in underlying factors, new information, future events or other developments.
6
PART I
ITEM 1. BUSINESS
General
Energen Corporation (Energen or the Company) is an oil and natural gas exploration and production company engaged in the exploration, development and production of oil, natural gas liquids and natural gas. Our operations are conducted through our subsidiary, Energen Resources Corporation (Energen Resources) and primarily occur within the Midland Basin, the Delaware Basin and the Central Basin Platform areas of the Permian Basin in west Texas and New Mexico. Our corporate headquarters are located in Birmingham, Alabama.
Prior to September 2, 2014, Energen owned Alabama Gas Corporation (Alagasco), which was engaged in the purchase, distribution and sale of natural gas principally in central and north Alabama. On September 2, 2014, Energen completed the transaction to sell Alagasco to The Laclede Group, Inc. (Laclede) for $1.6 billion, less the assumption of $267 million in debt. The net pre-tax proceeds to Energen totaled approximately $1.32 billion resulting in a pre-tax gain of $726.5 million. This sale had an effective date of August 31, 2014. Energen used cash proceeds from the sale to reduce long-term and short-term indebtedness. During 2014, Energen classified Alagasco as held for sale and reflected the associated operating results in discontinued operations. See Note 16, Held for Sale Properties and Discontinued Operations, for further information regarding the sale of Alagasco.
Energen was incorporated in 1978 in connection with a corporate reorganization completed in 1979 which resulted in Energen becoming the parent company to Energen Resources, which was formed in 1971, and Alagasco. Alagasco was formed by merger in 1948. As noted above, Alagasco was sold in 2014 to Laclede.
Energen maintains a web site with the address www.energen.com. Information contained on this web site is not incorporated by reference into this report. Energen makes available free of charge through its web site the annual reports on Form 10-K, quarterly reports on Form 10-Q, current reports on Form 8-K, and any amendments to these reports. Also, these reports are available in print upon shareholder request. These reports are available as soon as reasonably practicable after being electronically filed with or furnished to the Securities and Exchange Commission. Energen’s web site also includes its Business Conduct Guidelines, Corporate Governance Guidelines, Audit Committee Charter, Compensation Committee Charter and Governance and Nominations Committee Charter, each of which is available in print upon shareholder request.
Narrative Description of Business
• | Oil and Natural Gas Operations |
General: Energen’s operations focus on increasing production and adding proved reserves through the development of oil, natural gas liquids and natural gas properties. In addition, Energen explores for and develops new reservoirs, primarily in areas in which it has an operating presence. All oil, natural gas liquids and natural gas production is sold to third parties. Energen operates its properties for its own interest and that of its joint interest owners. This role includes overall project management and day-to-day decision-making relative to project operations.
At the end of 2016, Energen’s proved reserves totaled 316.3 MMBOE. Substantially all of these proved reserves are located in the Permian Basin in west Texas and New Mexico. Approximately 51 percent of Energen’s year-end proved reserves are proved developed reserves. Energen’s proved reserves are long-lived, with a year-end proved reserves-to-production ratio of 15 years. Oil, natural gas liquids and natural gas represent approximately 63 percent, 18 percent and 19 percent, respectively, of Energen’s proved reserves.
Property Acquisitions and Dispositions: During June, July and August of 2016, Energen completed a series of asset sales of certain non-core Permian Basin assets in the Delaware Basin in Texas and in the San Juan Basin in New Mexico for an aggregate purchase price of $552 million. These transactions had closing dates of June 3, 7, 30, July 15 and August 9 of 2016 with various effective dates ranging from March 1, 2016 to June 30, 2016. Minor portions of the assets were transferred to other parties upon the exercise of preferential purchase rights under pre-existing joint operating agreements in the ordinary course of business. Pre-tax proceeds to Energen were approximately $532.9 million after purchase price adjustments of approximately $19 million related to the operations of the properties subsequent to the effective dates and other one-time adjustments including transfer payments and certain amounts due the buyer, but before consideration of transaction costs of approximately $5 million. In the year ended December 31, 2016, Energen recognized pre-tax gains of $246.3 million on the sales. Energen used proceeds from the sale to fund ongoing operations.
7
In March 2015, Energen completed the sale of the majority of its natural gas assets in the San Juan Basin in New Mexico and Colorado (effective as of January 1, 2015) for an aggregate purchase price of $395 million. The sales proceeds were reduced by purchase price adjustments of approximately $11 million related to the operations of the San Juan Basin properties subsequent to December 31, 2014 and one-time adjustments related primarily to liabilities assumed by the buyer, which resulted in pre-tax proceeds to Energen of approximately $384 million before consideration of transaction costs of approximately $2.8 million. Energen recognized a pre-tax gain of $27.0 million on the sale. Energen used proceeds from the sale to reduce long-term indebtedness. At December 31, 2014, proved reserves associated with these San Juan Basin held for sale properties totaled 69,038 MBOE.
In March 2014, Energen completed the sale of its North Louisiana/East Texas natural gas and oil properties for $30.3 million. The sale had an effective date of December 1, 2013, and the proceeds from the sale were used to repay short-term obligations. During the third quarter of 2013, Energen classified these primarily natural gas properties as held for sale and reflected the associated operating results in discontinued operations.
Growth Strategy: Energen is focused on increasing its oil, natural gas liquids and natural gas production and proved reserves largely through active development and/or exploratory programs in the Permian Basin. The Company seeks to expand its footprint primarily through acquisitions of proved properties and unproved leasehold within areas of existing operations. Energen operated approximately 96 percent of its proved reserves at December 31, 2016.
Energen’s capital spending plans for 2017 target an investment of approximately $790 million (excluding acquisitions and lease renewals), the bulk of which will focus on drilling and development activities on its existing properties, all targeting the liquids-rich Permian Basin. Energen may choose to allocate additional capital during the year for property acquisitions and/or increased drilling and development activities.
Energen’s development activities can result in the addition of new proved reserves and can serve to reclassify proved undeveloped reserves to proved developed reserves. Proved reserve disclosures are provided annually, although changes to reserve classifications occur throughout the year. Accordingly, additions of new proved reserves from development activities can occur throughout the year and may result from numerous factors including, but not limited to, regulatory approvals for drilling unit downspacing that increase the number of available drilling locations; changes in the economic or operating environments that allow previously uneconomic locations to be added; technological advances that make reserve locations available for development; successful development of existing proved undeveloped reserve locations that reclassify adjacent probable locations to proved undeveloped reserve locations; increased knowledge of field geology and engineering parameters relative to oil and natural gas reservoirs; and changes in management’s intent to develop certain opportunities.
During the three years ended December 31, 2016, Energen’s development and exploratory efforts have added 327 MMBOE of proved reserves. During the same period, we drilled 623 gross development, exploratory and service wells (including one sidetrack well) and 73 well recompletions and pay-adds. In 2016, Energen’s successful development and exploratory wells and other activities added approximately 64 MMBOE of proved reserves; Energen drilled 87 gross development, exploratory and service wells (including no sidetrack wells), performed some 6 well recompletions and pay-adds, and conducted other operational enhancements. Energen’s production from continuing operations totaled 21.6 MMBOE in 2016. In 2017, production is estimated to be 24 MMBOE, including approximately 16.9 MMBOE of estimated production from proved reserves owned at December 31, 2016. Production estimates do not include amounts for potential future acquisitions.
Drilling Activity: The following table sets forth the total number of net productive and dry exploratory and development wells drilled:
Years ended December 31, | 2016 | 2015 | 2014 | |||
Development: | ||||||
Productive | 18.5 | 50.8 | 80.2 | |||
Dry | — | — | — | |||
Total | 18.5 | 50.8 | 80.2 | |||
Exploratory: | ||||||
Productive | 53.2 | 98.5 | 109.4 | |||
Dry | — | 2.0 | 1.0 | |||
Total | 53.2 | 100.5 | 110.4 | |||
8
Included in the 2016 net wells drilled above are 42 gross (41 net) drilled but uncompleted wells in the Midland Basin and 17 gross (17 net) drilled but uncompleted wells in the Delaware Basin, all of which we plan to complete in 2017. Included in the 2015 net wells drilled above are 2 gross (2 net) drilled but uncompleted wells in the Midland Basin, which we also plan to complete in 2017. As of December 31, 2016, Energen was participating in the drilling of 2 gross (2 net) development and 16 gross (13 net) exploratory wells. In addition to the development wells drilled, Energen drilled 3.0, 12.9 and 22.5 net service wells during 2016, 2015 and 2014, respectively. Energen had 1 gross service well (1 net) in process as of December 31, 2016.
Productive Wells and Acreage: The following table sets forth the total gross and net productive gas and oil wells as of December 31, 2016, and developed and undeveloped acreage as of the latest practicable date prior to year end:
Gross | Net | |||
Oil wells | 5,128 | 3,384 | ||
Gas wells | 133 | 23 | ||
Developed acreage | 329,224 | 226,635 | ||
Undeveloped acreage | 51,572 | 26,505 | ||
There were no wells with multiple completions at December 31, 2016. All wells and acreage are located onshore in the United States, with the majority of the net undeveloped acreage located in Texas and New Mexico.
Concentration of Credit Risk: Revenues and related accounts receivable from oil and natural gas operations primarily are generated from the sale of produced oil, natural gas liquids and natural gas to energy marketing companies. Such sales are typically made on an unsecured credit basis with payment due the month following delivery. This concentration of sales to the energy marketing industry has the potential to affect Energen’s overall exposure to credit risk, either positively or negatively, in that our oil, natural gas liquids and natural gas purchasers may be affected similarly by changes in economic, industry or other conditions. Energen considers the credit quality of its purchasers and, in certain instances, may require credit assurances such as a deposit, letter of credit or parent guarantee. The two largest purchasers of Energen’s oil, natural gas liquids and natural gas, Plains Marketing, LP (Plains) and Shell Trading (US) Company (Shell), accounted for approximately 50 percent and 20 percent, respectively, of Energen’s accounts receivable for commodity sales as of December 31, 2016. Energen’s other purchasers each accounted for less than 7 percent of these accounts receivable as of December 31, 2016. During the year ended December 31, 2016, Plains and Shell accounted for approximately 52 percent and 12 percent, respectively, of total revenues from oil, natural gas liquids and natural gas sales. All other oil and natural gas purchasers each accounted for less than 10 percent of total revenues for the year ended December 31, 2016.
Risk Management: Energen attempts to lower the commodity price risk associated with its oil and natural gas business through the use of swaps and basis swaps. Energen has policies in place to limit hedging to not more than 80 percent of its estimated annual production; however, Energen’s credit facility contains a covenant that operates to limit hedging at a lower threshold in certain circumstances. Energen recognizes all derivatives on the balance sheet and measures all derivatives at fair value.
See the Cautionary Statement Regarding Forward-Looking Statements preceding Item 1, Business, and Item 1A, Risk Factors, for further discussion with respect to price and other risks.
• | Environmental Matters and Climate Change |
Various federal, state and local environmental laws and regulations apply to the operations of Energen. Historically, the cost of environmental compliance has not materially affected our financial position, results of operations or cash flows. New regulations, enforcement policies, claims for damages or other events could result in significant unanticipated costs.
Federal, state and local legislative bodies and agencies frequently exercise their respective authority to adopt new laws and regulations and to amend and interpret existing laws and regulations. Such law and regulation changes may occur with little prior notification, subject Energen to cost increases, and impose restrictions and limitations on our operations. Examples of law and regulatory changes with the potential to materially impact Energen include, but are not limited to, measures dealing with hydraulic fracturing, emission limits and reporting and the repeal of certain oil and natural gas tax incentives and deductions.
Energen regularly utilizes hydraulic fracturing in its drilling and completion activities. Energen’s first widespread use of hydraulic fracturing occurred during the 1980s in conjunction with the exploration and development of coalbed methane in Alabama’s Black Warrior Basin.
9
Hydraulic fracturing is a reservoir stimulation technique used throughout the oil and natural gas industry for more than 60 years. After a well has been drilled, hydraulic fracturing is used during the completion process to form small fractures in the target formation through which the oil and/or natural gas can flow. The fractures are created when a water-based fluid is pumped at a calculated rate and pressure into the crude oil- or natural gas-bearing rock. The fracture fluid is a mixture composed primarily of water and sand or inert ceramic, sand-like grains; it also contains a small percentage of special purpose chemical additives (which are highly diluted-typically less than one percent by volume) that can vary by project. The millimeter-thick cracks or fractures in the target formation are propped open by the sand, thereby allowing the crude oil or natural gas to flow from tight (low permeability) reservoirs into the well bore.
States in which we operate have adopted a variety of well construction, set back, and disclosure regulations limiting how drilling can be performed and requiring various degrees of chemical and water usage disclosure for operators that employ hydraulic fracturing. We are complying with these additional regulations as part of our routine operations and within the normal execution of our business plan. The adoption of additional federal or state regulations, however, could impose significant new costs and challenges. For example, adoption of new hydraulic fracturing permitting requirements could significantly delay or prevent new drilling. Adoption of new regulatory restrictions on the use of hydraulic fracturing could reduce the amount of oil and gas able to be recovered from our proved reserves. The degree to which additional oil and natural gas industry regulation may impact our future operations and results will depend on the extent to which we utilize the regulated activity and whether the geographic locations in which we operate are subject to the new regulation.
Existing federal, state and local environmental laws and regulations also have the potential to increase costs, reduce liquidity, delay operations and otherwise alter business operations. These existing laws and regulations include, but are not limited to, the Clean Air Act; the Clean Water Act; Oil Pollution Prevention: Spill Prevention, Control, and Countermeasure regulations; Toxic Substances Control Act; Resource Conservation and Recovery Act; and the Federal Endangered Species Act. Compliance with these and other environmental laws and regulations is undertaken as part of Energen’s routine operations. Energen does not separately track costs associated with these routine compliance activities.
Climate change, whether arising through natural occurrences or human activities, may have a significant impact upon the operations of Energen. Volatile weather patterns and the resulting environmental impact may adversely affect our results of operations, financial position and cash flows. We are unable to predict the timing or manifestation of climate change or reliably estimate the impact to Energen. However, climate change could affect our operations as follows:
• | sustained increases or decreases to the supply and demand of oil, natural gas liquids and natural gas; |
• | potential disruption to third-party facilities to which Energen delivers. Such facilities include third-party oil and gas gathering, transportation, processing and storage facilities and are typically limited in number and geographically concentrated. |
During January 2014, Energen Resources responded to a General Notice and Information Request from the Environmental Protection Agency regarding the Reef Environmental Site in Sylacauga, Talladega County, Alabama. The letter identifies Energen Resources as a potentially responsible party under The Comprehensive Environmental Response, Compensation, and Liability Act for the cleanup of the Site. In 2008, Energen hired a third party to transport approximately 3,000 gallons of non-hazardous wastewater to Reef Environmental for wastewater treatment. Reef Environmental ceased operating its wastewater treatment system in 2010. Due to its one time use of Reef Environmental for a small volume of non-hazardous wastewater, Energen Resources has not accrued a liability for cleanup of the Site.
• | Employees |
The Company has approximately 390 employees. On January 22, 2016 and March 18, 2016, we reduced our workforce as part of an overall plan to reduce costs and better align our workforce with the needs of our business. Energen believes that its relations with employees are good.
10
ITEM 1A. RISK FACTORS
The future success and continued viability of our business, like any venture, is subject to many recognized and unrecognized risks and uncertainties. Such risks and uncertainties could cause actual results to differ materially from those contained in forward-looking statements made in this report and presented elsewhere by management. The following list identifies and briefly summarizes certain risk factors. The list should not be viewed as complete or comprehensive, as the risks below are not the only risks facing Energen. Energen could also be affected by other risks and uncertainties in addition to those described herein. If any of the following risks were to occur, our business, financial condition or results of operations could be materially adversely affected; and such events could impair our ability to implement business plans or complete development activities as scheduled. Further, the trading price of our shares could decline, and shareholders could lose part or all of their investment. In addition, such risks may prevent us from complying with our financial and non-financial covenants and may result in a default under our credit facility or other long-term debt.
We undertake no obligation to correct or update such risk factors whether as a result of new information, future events or otherwise. These risk factors should be read in conjunction with our disclosure specific to forward-looking statements made elsewhere in this report under the heading Cautionary Statement Regarding Forward-Looking Statements.
Risks Related to Our Business
Commodity prices for crude oil and natural gas are volatile, and a substantial reduction in commodity prices could adversely affect our financial condition and results of operations.
Our revenues, cash flows and earnings are influenced predominantly by the amount of oil, natural gas liquids and natural gas we produce, net of the effects of settlements on our derivative commodity instruments, and the prices we receive for production. Oil, natural gas liquids and natural gas are commodities and historical markets for oil, natural gas liquids and natural gas have been volatile and prices are subject to wide fluctuations in response to relatively minor changes in supply and demand. For example, during the year ended December 31, 2016, commodity prices changed significantly, with the settlement price for West Texas Intermediate (WTI) crude oil ranging from a high of approximately $54.06 per barrel to a low of approximately $26.21 per barrel and settlement prices for Henry Hub natural gas ranging from a high of approximately $3.93 per Mcf to a low of approximately $1.64 per Mcf.
In addition to reducing our revenue, cash flows and earnings, low prices for oil, natural gas liquids and natural gas may adversely affect us in a variety of ways. For example, some of our exploration and development projects could become uneconomic and we may also have to make significant downward adjustments to our estimated proved reserves and our estimates of the present value of those reserves. If these price effects occur, or if our estimates of production or economic factors change, accounting rules may require us to writedown, as a noncash impairment loss in our statements of income, the carrying value of our proved oil and natural gas properties. Lower commodity prices may also result in a reduction in the amount we are permitted to borrow under our credit facility and adversely impact our ability to meet financial ratios contained in our debt agreements, especially those calculated by reference to the value of our reserves, earnings or cash flows, which could reduce the amount we are permitted to borrow under our credit facility or result in an event of default. We could also be required to reduce our capital spending on exploration and development, which will adversely affect our ability to replace our reserves and could result in the loss of leasehold. As more fully disclosed in Item 7, Management’s Discussion and Analysis of Financial Condition and Results of Operations under the heading “Credit Facility and Working Capital”, the Company discusses its plans regarding liquidity and covenant compliance for 2017.
Approximately 63 percent of our December 31, 2016 proved reserves are oil. As a result, changes in oil prices have a greater impact on our business than changes of comparable magnitude in natural gas prices. Commodity prices for oil, natural gas liquids and natural gas are reflections of supply and demand and are subject to many factors that are beyond our control, including:
• | the domestic and foreign supply of oil, natural gas liquids and natural gas, including the ability of the members of the Organization of the Petroleum Exporting Countries and other exporting countries to agree on and maintain oil price and production controls; |
• | the level of consumer demand for oil, natural gas liquids and natural gas; |
• | global or regional oil and natural gas inventory levels; |
• | the availability, proximity and capacity of transportation facilities and processing facilities; |
• | global economic conditions; |
• | commodity price disparities between delivery points and applicable index prices; |
• | the supply, demand and pricing of alternative sources of energy or fuels and the effects of energy conservation efforts or technological advances in energy consumption; |
11
• | weather conditions; |
• | changes in political conditions in major oil and natural gas producing regions and |
• | domestic, local and foreign governmental regulations and taxes. |
Our oil and natural gas proved reserves are estimates, and actual future production may vary significantly and may also be negatively impacted by our inability to invest in production on planned timelines.
There are numerous uncertainties inherent in estimating quantities of proved oil and natural gas reserves and in projecting future rates of production and timing of development expenditures. Reserve estimation is a subjective process involving the estimation of volumes to be recovered from underground accumulations of oil and natural gas that are unable to be measured in an exact manner. The reserve estimation process is dependent upon and subject to multiple variables and assumptions, including:
• | oil, natural gas liquids and natural gas prices; |
• | timing of development expenditures; |
• | the quality, quantity and interpretation of available geological, geophysical and engineering data; |
• | the geologic characteristics of the reservoirs; |
• | future operating costs, property, severance, excise and other taxes and costs and |
• | the effects of compliance with regulatory and contractual requirements. |
Additionally, in the event we are unable to fully invest or must alter the timing of our planned investment expenditures, our future revenues, production and proved reserves could be negatively affected.
Drilling for and producing oil and natural gas are high-risk activities with many uncertainties that could impact our expenses or our production volumes.
Drilling involves many risks, including the risk that no commercially productive oil or natural gas reservoirs will be located or economically developed. Our future drilling activities may not be successful and, if unsuccessful, such failure could have a material adverse effect on our future results of operations and financial condition. Anticipated drilling plans and capital expenditures may also be delayed, curtailed or canceled which could result in actual drilling and capital expenditures being substantially different than currently planned, due to:
• | delays resulting from compliance with regulatory or contractual requirements, which may include limitations on hydraulic |
fracturing or the emission of greenhouse gases;
• | unexpected or unusual pressure or irregularities in geological formations; |
• | unexpected drilling conditions; |
• | declines in oil, natural gas liquids or natural gas prices; |
• | adverse weather conditions, such as tornadoes, snow and ice storms; |
• | delays in, limited availability of, or cost to obtain personnel and equipment necessary to complete our drilling, completion and operating activities; |
• | equipment or facility failures and accidents or malfunctions resulting in blowouts, fires, explosions, uncontrollable flows of oil, natural gas or well fluids, surface cratering and other events; |
• | title related issues; |
• | fracture stimulation failures; |
• | restricted access to land for drilling; |
• | reductions in availability of financing at acceptable rates; |
• | strategic changes implemented by management and |
• | limitations in the market for oil, natural gas liquids and natural gas. |
While all drilling, whether developmental, extension or exploratory, involves these risks, exploratory and extension drilling involve greater risks of dry holes or failure to find and exploit commercially productive quantities of oil and natural gas. We expect to continue to experience exploration and abandonment expense in 2017 and future years.
12
Our concentration of producing properties in the Permian Basin of west Texas and New Mexico makes us vulnerable to risks associated with operating in limited geographic areas.
At December 31, 2016, primarily all of our total estimated proved reserves were attributable to properties located in the Permian Basin of west Texas and New Mexico. As a result of this geographic concentration, we may be disproportionately exposed to the impact of regional supply and demand factors, delays or interruptions of production from wells in these areas caused by:
• | local, state and federal governmental regulation; |
• | processing or transportation capacity constraints; |
• | market limitations; |
• | water shortages, including restrictions on water usage or other drought related conditions or |
• | interruption of the processing or transportation of oil, natural gas liquids or natural gas. |
Our industry is highly competitive which makes it challenging for us to acquire properties to replace our proved oil and natural gas reserves, market oil and natural gas and locate and secure qualified personnel.
We operate in a highly competitive environment for acquiring properties to replace our proved oil and natural gas reserves, marketing oil and natural gas and locating and securing qualified personnel. Many of our current and potential competitors may possess greater financial, technical and personnel resources than we do. Those competitors may be willing to pay more for exploratory prospects and productive oil and natural gas properties, as well as for trained personnel. Our ability to acquire properties and to find and develop proved reserves in the future will depend on our ability to evaluate and select suitable properties and to execute transactions in an intensely competitive environment. Our failure to acquire properties, market oil and natural gas and secure trained personnel could have a material adverse effect on our production, revenues and results of operations.
Our business is capital intensive, and we may not be able to obtain the needed capital, financing, or refinancing of our current indebtedness on satisfactory terms or at all.
Our exploration, development and acquisition activities are capital intensive and constitute the primary use of our capital resources. We make and expect to continue to make significant capital expenditures for the exploration, development and acquisition of oil, natural gas liquids and natural gas reserves. We have historically funded our capital expenditures through cash flows from operations, our credit facility or other borrowings, debt and equity markets and property sales. We expect that we will continue to fund a portion of our capital expenditures with borrowings under our credit facility, from the proceeds of debt and equity issuances and from proceeds from property sales. However, adverse changes in the commodity price environment or industry conditions may result in a lack of access to capital on attractive terms or at all. Thus, no assurance can be given that we will be able to access either the debt or equity capital markets, or be able to sell properties for attractive prices, to repay any such future borrowings.
If our borrowing capacity decreases, for any reason, we may have limited ability to obtain the capital necessary to support our future operations. If we are unable to obtain necessary financing with appropriate terms, we could experience a decline in our operations. Specifically, a failure to secure additional financing, or necessary refinancing, could result in a reduction of our operations relating to the development of future prospects, which in turn could lead to a decline in our proved oil and natural gas reserves and could adversely affect our future production, revenues and results of operations. Further, we could realize a loss of acreage through lease expirations, and we may not be able to complete acquisitions that may be favorable to us or finance the capital expenditures necessary to replace our reserves.
The terms of our credit facility limit the amount we can borrow to a borrowing base amount which is determined by our lenders in their sole discretion based on their valuation of our proved reserves and their internal criteria including commodity price outlook. The borrowing base amount is subject to redetermination semi-annually on April 1 and October 1 of each year and for event-driven unscheduled redeterminations. On April 13, 2016, the borrowing base and aggregate commitments were reduced to $1.05 billion in association with the semi-annual redetermination required under the agreement. On October 25, 2016, the borrowing base was reaffirmed with no changes. As of December 31, 2016, the Company had no outstanding amounts under its revolving credit facility. A lowering of our borrowing base could require us to immediately repay indebtedness in excess of the borrowing base, or we might need to further secure the lenders with additional collateral, if available. If our borrowing base decreases, we may have limited ability to obtain the capital necessary to sustain our operations at current levels. If additional capital is needed to fund our capital expenditures, our ability to access the capital markets may be limited by our financial condition at the time of any such financing or offering and the covenants in our existing debt agreements, as well as by adverse market conditions resulting from, among other things, general economic conditions and contingencies and uncertainties that are beyond our control.
13
We are also subject to financial and non-financial covenants under the terms of our credit facility. The financial covenants in our credit facility require Energen to maintain a ratio of total debt to consolidated income before interest expense, income taxes, depreciation, depletion, amortization, exploration expense and other noncash income and expenses (EBITDAX) less than or equal to 4.0 to 1.0. As of December 31, 2016, we were in compliance with our covenants and expect to maintain compliance during 2017. However, in future periods, factors including those outside of our control may prevent us from maintaining compliance with the financial and non-financial covenants, including our total debt to EBITDAX covenant. Such factors may include commodity price declines, lack of liquidity in property and capital markets and our continuing ability to execute on our business plan. In the event that we are unable to remain in compliance with our financial and non-financial covenants, we would seek covenant relief at a scheduled redetermination date or at an interim date, as appropriate. However, no assurances can be given with respect to such relief. If any such covenant violations are not waived by the lenders such violation would result in an event of default that could trigger acceleration of payment of the amounts outstanding under our credit facility and long term note agreements. Additionally, the lenders could refuse to make additional loans under the credit facility, take possession of any collateral, and exercise other remedies or rights that may be available to them, all of which could have a material adverse effect on the business and financial condition of the Company. As more fully disclosed in Item 7, Management’s Discussion and Analysis of Financial Condition and Results of Operations under the heading “Credit Facility and Working Capital”, the Company discusses its plans regarding liquidity and covenant compliance for 2017.
In 2016 we discontinued dividend payments and, therefore, only appreciation in the price of our common stock will provide a return to our stockholders.
Although we have paid cash dividends on our common stock in the past, in February 2016 our board of directors announced the discontinuance of dividend payments. We currently intend to retain future earnings and other cash resources, if any, for the operation and development of our business. Any payment of future dividends will be at the discretion of our board of directors and will depend on our results of operations, financial condition, contractual restrictions, cash requirements, future prospects and other considerations that our board of directors deems relevant.
The nature of our operations involves many operational risks including the risk of personal injury, property damage and environmental damage, and our insurance policies do not cover all such risks.
Inherent in our oil and natural gas production activities are a variety of hazards and operational risks, including but not limited to:
• | pipeline and storage leaks, ruptures and spills; |
• | equipment malfunctions and mechanical failures; |
• | fires and explosions; |
• | well blowouts, explosions and cratering; |
• | uncontrollable flows of oil, natural gas or well fluids; |
• | vandalism; |
• | pollution; |
• | releases of toxic gases; |
• | adverse weather conditions or natural disasters and |
• | soil, surface and water or groundwater contamination from petroleum constituents, hydraulic fracturing fluid, or produced water. |
Such events could result in loss of human life, significant damage to or destruction of property, environmental pollution or other damage, impairment or suspension of our operations, repair and remediation costs, regulatory investigations and penalties or lawsuits and other substantial financial losses. Furthermore, our oil and natural gas exploration and production activities are subject to all of the operating risks associated with drilling for and producing oil and natural gas, including those noted above. Additionally, the location of certain of our pipeline and storage facilities near populated areas, including residential areas, commercial business centers and industrial sites, could increase the level of damages resulting from these risks.
In accordance with customary industry practices, we maintain insurance against some, but not all, of these risks and losses; and the insurance coverages are subject to retention levels and coverage limits. We may elect not to obtain insurance if we believe the cost of available insurance is excessive relative to the risks presented. In addition, pollution and environmental risks generally are not fully insurable. Furthermore, we could be subject to the credit risk of our insurers if we make a claim under our insurance policies. There is no guarantee that we will be able to obtain or maintain our insurance in the future at rates we deem economical and that the insurance we may desire will be offered by insurers. Losses and liabilities arising from uninsured or under-insured events or insurer insolvency, in the event of a claim, could materially and adversely affect our business, financial condition or results of operations.
14
We are subject to extensive regulation, including numerous federal, state and local laws and regulations as well as legislation and regulations restricting the emissions of “greenhouse gases” that may require significant expenditures or impose significant restrictions on our operations.
We are subject to extensive federal, state and local regulation which significantly influences our operations. Federal, state and local legislative bodies and agencies frequently exercise their respective authority to adopt new laws and regulations and to amend, modify and interpret existing laws and regulations. Such changes can subject us to significant tax or increased expenditures and can impose significant restrictions and limitations on our operations. Noncompliance with these laws and regulations may subject us to administrative, civil or criminal penalties, remedial cleanups, and natural resource damages or other liabilities. Furthermore, we may incur significant costs to remain in compliance with or to return to compliance with applicable regulations if they are revised or reinterpreted or if governmental policies or laws change related to our operations.
If additional federal, state or local regulations or restrictions are adopted in the areas we operate or plan to operate, we may incur significant costs to comply with the requirements, experience delays or have to curtail our exploration, development, or production activities. Additionally, such restrictions could reduce the amount of oil and gas that we are able to recover from our proved reserves.
The subject of climate change continues to receive attention from many parties including legislators and governmental agencies.
If additional legislation or regulatory programs to reduce emissions of greenhouse gases are adopted, it could require us to incur increased operating costs, such as those for purchasing and operating emissions control systems, acquiring emissions allowances or complying with new regulatory or reporting requirements. Any such legislation or regulatory programs could also increase the cost of consuming and using oil and natural gas, and thereby negatively impact the demand for the oil, natural gas liquids and natural gas we produce. Consequently, legislation and regulatory programs related to greenhouse gases could adversely affect our production, revenues and results of operations.
Federal, state and local legislative and regulatory initiatives relating to hydraulic fracturing, as well as governmental reviews of such activities, could result in increased costs and additional operating restrictions or delays and adversely affect our production.
Energen regularly utilizes hydraulic fracturing in its drilling and completion activities, and hydraulic fracturing is a common practice that is used in the oil and gas industry to stimulate production of hydrocarbons from tight (low permeability) formations. After a well has been drilled, hydraulic fracturing is used during the completion process to form small fractures in the target formation through which the oil, natural gas liquids or natural gas can flow. The fractures are created when a water-based fluid is pumped at a calculated rate and pressure into the crude oil- or natural gas-bearing rock. The fracture fluid is a mixture composed primarily of water and sand or inert ceramic, sand-like grains; it also contains a small percentage of special purpose chemical additives (which are highly diluted-typically less than one percent by volume) that can vary by project. The millimeter-thick cracks or fractures in the target formation are propped open by the sand, thereby allowing the crude oil or natural gas to flow from tight reservoirs into the well bore.
The hydraulic fracturing process is typically regulated by state oil and gas commissions. However, under the Safe Drinking Water Act’s Underground Injection Control Program, the EPA has assumed regulatory authority of hydraulic fracturing involving diesel additives and issued revised permitting guidance in February 2014 requiring facilities to obtain permits to use diesel additives in hydraulic fracturing activities. Legislation intended to provide for federal regulation of hydraulic fracturing and require disclosure of the chemicals used has been introduced and considered by the U.S. Congress. In addition, Texas and New Mexico, two states in which we operate, have adopted, and other states have considered adopting, regulations that could impose new or stricter permitting, disclosure and well construction requirements on companies that perform hydraulic fracturing. Consideration and efforts to regulate hydraulic fracturing by local, state and federal authorities continue and local land use restrictions, such as county and city ordinances, may also restrict or prohibit any type of drilling or hydraulic fracturing. If additional federal, state or local restrictions are adopted in the areas we operate or plan to operate, we may incur significant costs to comply with the requirements, experience delays or have to curtail our exploration, development, or production activities. Additionally, such restrictions could reduce the amount of oil and gas that we are able to recover from our proved reserves.
Our operations are dependent on the availability, use and disposal of water; and restrictions on our ability to acquire or dispose of water could cause us to incur substantial costs in the acquisition, usage and disposal of water.
Water is a key component of both the drilling and hydraulic fracturing processes. Historically, we have been able to obtain water from various local sources for use in our operations. Texas has recently experienced periods of severe drought conditions that have persisted for several years. Local water districts may restrict the use of water subject to their jurisdiction for drilling and hydraulic fracturing in order to protect the local water supply during drought conditions. If we are unable to obtain water to use in our
15
operations from local sources, we may have to incur substantial costs to produce oil and natural gas and it may make it uneconomical to produce in that area. Our drilling procedures produce water of which we must dispose. We could be unable to dispose of our wastewater or face increased costs and procedures for disposal as a result of changes in federal or local legislation governing the disposal of drilling wastewater.
We periodically evaluate our proved and unproved oil and natural gas properties for impairment and could be required to recognize non-cash charges in our statements of income in future periods. If commodity prices for oil, natural gas liquids or natural gas decline or our drilling efforts are unsuccessful, we may be required to writedown the carrying values of certain oil and natural gas properties.
We periodically review the carrying value of our proved and unproved oil and natural gas properties for possible impairment on a field-by-field basis. We monitor our oil and natural gas properties as well as the market and business environments in which we operate and make assessments about events that could result in potential impairment issues, which include, but are not limited to, downward commodity price trends, unanticipated increased operating costs and lower than expected production performance. If a material event occurs, we perform an evaluation to determine whether the asset is impaired. If the undiscounted net future cash flows determined by such evaluations are insufficient to fully recover the cost invested in the respective project, we will record an impairment loss in our statements of income. We recorded $220.7 million and $1.3 billion of impairments during 2016 and 2015, respectively.
We are exposed to counterparty credit risk as a result of our concentrated customer base and to the risks associated with other companies with whom we do business experiencing financial distress.
Revenues and related accounts receivable from oil and natural gas operations primarily are generated from the sale of produced oil, natural gas liquids and natural gas to a small number of energy marketing companies. Such sales are typically made on an unsecured credit basis with payment due the month following delivery. This concentration of sales to a limited number of customers in the energy marketing industry has the potential to adversely affect our overall exposure to credit risk based on changes in economic, industry or other conditions specific to a single customer or to the energy marketing industry generally. We consider the credit quality of our customers and, in certain instances, may require credit assurances such as a deposit, letter of credit or parent company guarantee.
In addition, we rely on other working interest owners in our wells to pay their proportionate share of costs and on oilfield service companies and midstream companies for services associated with the drilling and completion of wells and for certain midstream services. A decline in the commodity price environment may result in a material adverse impact on the liquidity and financial position of the companies with whom we do business, resulting in delays in payment of, or non-payment of, amounts owing to us and similar impacts. These events could have an adverse impact on our financial condition, results of operations and cash flows.
We are subject to financing and interest rate exposure risks. Volatility in global financial markets, negative operating results, certain strategic business decisions, or other matters resulting in a downgrade in, or a negative outlook with respect to, our credit ratings could negatively impact our cost of and our ability to access capital for future development and working capital needs.
We rely on access to credit markets, and turmoil or volatility in the global financial markets could lead to a contraction in credit availability and negatively impact our ability to finance our operations. Global financial market turmoil, as has been experienced in the last decade, could materially affect our operations, liquidity and financial condition through the adverse impacts such turmoil can have on the debt and equity capital markets. Market volatility and credit market disruption may severely limit credit availability, and issuer credit ratings can change rapidly. A significant reduction in cash flows from operations or the availability of credit could limit our ability to pursue acquisition opportunities or reduce cash flow used for drilling which could materially and adversely affect our ability to achieve our planned growth and operating results.
The availability and cost of credit market access is significantly influenced by market events and rating agency evaluations for lenders and Energen. In addition to operating results, business decisions relating to recapitalization, refinancing, restructuring, acquisition and disposition transactions involving Energen may negatively impact market and rating agency considerations regarding the credit of Energen.
16
Our derivative risk management activities may limit our potential gains and involve other risks that could result in financial losses.
Although we make use of futures, swaps, options, collars and fixed-price contracts to mitigate price risk, fluctuations in future oil, natural gas liquids and natural gas prices could materially affect our financial position, results of operations and cash flows. Furthermore, such risk mitigation activities may cause our financial position and results of operations to be materially different from results that would have been obtained had such risk mitigation activities not been implemented. The changes in the fair market value of our derivative contracts as reported in our consolidated statements of income may result in significant non-cash gains or losses.
The effectiveness of such risk mitigation assumes that counterparties maintain satisfactory credit quality and that actual sales volumes will generally meet or exceed the volumes subject to the futures, swaps, options, collars and fixed-price contracts. A substantial failure to meet sales volume targets, whether caused by miscalculations, weather events, natural disaster, accident, mechanical failure, criminal act or otherwise, could leave us financially exposed to our counterparties and result in material adverse financial consequences to Energen. The adverse effect could be increased if the adverse event was widespread enough to move market prices against our position.
Derivatives reform legislation which has been adopted by the U.S. Congress, or additions to or changes in the legislation, could negatively impact our ability to use derivative instruments as part of our risk management activities.
In July 2010, the Dodd-Frank Wall Street Reform and Consumer Protection Act (Dodd-Frank Act) was signed into law. Title VII of the Dodd-Frank Act establishes federal oversight and regulation of the over-the-counter derivatives markets and participants in such markets. The Commodities Futures Trading Commission (CFTC) and the SEC have adopted, or are in the process of adopting, rules and regulations covering, among other derivative transactions, transactions linked to crude oil and natural gas prices. We believe Energen’s derivative transactions qualify for the end-user exception which exempts them from certain Dodd-Frank Act swap clearing and exchange-trading requirements pursuant to final regulations adopted by the CFTC and SEC.
The CFTC has designated certain interest rate swaps and credit default swaps for mandatory clearing and the associated rules also may require Energen, in connection with covered derivative activities, to comply with certain clearing and trade-execution requirements or take steps to qualify for an exemption to such requirements, although the application of these provisions to us is uncertain at this time. Although we believe we qualify for the end-user exception from the mandatory clearing requirements for swaps entered to mitigate our commercial risks, the application of the mandatory clearing and trade execution requirements to other market participants, such as dealers, may change the cost and availability of our future derivative arrangements (including through requirements to post collateral which could adversely affect Energen’s available liquidity). The changes in the regulation of swaps may result in certain market participants deciding to curtail or stop engaging in derivative activities. If we reduce our use of derivatives as a result of the Dodd Frank Act and regulations, our results of operations may become more volatile and our cash flows may be less predictable, which could adversely affect our ability to plan for and fund capital expenditures and our results of operations. Our revenues could be adversely affected if, as a consequence of the Dodd-Frank Act and related regulations, commodity prices are lowered due to reduced trading in derivatives. Any of these consequences could have a material adverse effect on our financial condition and results of operations.
Our operations depend on the use of third-party facilities, and an interruption of our ability to utilize these facilities may adversely affect our financial condition and results of operations.
Energen delivers to third-party facilities. These facilities include third-party oil and natural gas gathering, transportation, processing and storage facilities. Energen relies on such facilities for access to market for our oil, natural gas liquids and natural gas production. Such facilities are typically limited in number and geographically concentrated. A lack of available capacity on these facilities could result in the shut-in of producing wells or the delay or discontinuance of development plans for properties for Energen. An extended interruption of access to or service from these facilities, whether caused by weather events, natural disaster, accident, mechanical failure, criminal act, maintenance or otherwise could have an adverse effect on our revenues and results of operations.
17
The success of our future operations is dependent on our future drilling activities and our ability to economically develop our oil, natural gas liquids and natural gas reserves; and our expectations regarding future drilling and development activities are subject to uncertainties that could significantly alter the occurrence or timing of such activities, as they are expected to be realized over multiple years.
We have identified drilling locations and prospects for future drilling, including development and exploratory drilling activities. Our ability to successfully and economically drill and develop these locations depends on a number of factors, including:
• | prices of oil, natural gas liquids and natural gas; |
• | current laws or regulations or changes in the laws or regulations in the identified and prospective locations; |
• | the availability and cost of capital; |
• | seasonal and other weather conditions; |
• | regulatory approvals; |
• | negotiation of agreements with third parties; |
• | access to and availability of required equipment, supplies and personnel and |
• | drilling results. |
Because of the factors noted above, we cannot provide any guarantee regarding the timing or success of future drilling activities; and our actual drilling activities may materially differ from our current expectations, including potential delays, curtailment or cancellation of anticipated drilling plans and capital expenditures.
Energen has limited control over activities on properties which we do not operate, which could reduce our production and revenues.
Energen operates in certain instances through joint ventures under joint operating agreements. Typically, the operator under a joint operating agreement enters into contracts, such as drilling contracts, for the benefit of all joint venture partners. Through the joint operating agreement, the non-operators reimburse, and in some cases advance, the funds necessary to meet the contractual obligations entered into by the operator. For properties we do not operate, we have limited ability to control the operation or future development of the properties or the amount of capital expenditures that we are required to fund with respect to them. An operator’s failure to adequately perform operations, an operator’s breach of the applicable agreements or an operator’s failure to act in our best interest could reduce our production and revenues. The success and timing of our drilling and development activities on properties operated by others is dependent on a number of factors, including the operator's timing and amount of capital expenditures, expertise and financial resources, inclusion of other participants in drilling wells and use of technology. Our dependence on the operator and other working interest owners for these projects and our limited ability to control the operation and future development of these properties could negatively affect the realization of our expected returns on capital in drilling or acquisition activities and could lead to unexpected costs in the future.
Our business could be negatively impacted by security threats, including cybersecurity threats and related disruptions.
We face a variety of security threats, including cybersecurity threats to access sensitive information or render data or systems unusable, threats to the security of our facilities and infrastructure or those of third parties, including processing plants and pipelines, and threats from terrorist acts. Current procedures and controls may not be sufficient to prevent security breaches from occurring, and we could have to implement additional procedures and controls to mitigate the effects of potential breaches and monitor for potential security threats resulting in increased capital and operating costs. In the event of a security breach, losses of sensitive information, critical infrastructure or capabilities essential to our operations could occur and could have a material adverse effect on our reputation, operations, financial position and results of operations. Cybersecurity attacks are sophisticated and prevalent and include, but are not limited to, malicious software, attempts to gain unauthorized access to data and systems, other electronic security breaches that could cause disruptions in critical systems, unauthorized release of confidential information and data corruption. As we rely on our information technology infrastructure to process, transmit and store electronic information critical for the efficient operation of our business and day-to-day operations, such attacks could lead to a material disruption in our business, including the theft, destruction, loss, misappropriation or release of confidential data or other business information, financial losses, loss of business, potential liability and damage our reputation.
ITEM 1B. UNRESOLVED STAFF COMMENTS
None
18
ITEM 2. PROPERTIES
The corporate headquarters of Energen and Energen Resources are located in leased office space in Birmingham, Alabama. See the discussion under Item 1, Business, for further information related to Energen’s business operations. Information concerning Energen’s production and proved reserves is summarized in the table below and included in Note 21, Oil and Natural Gas Operations (Unaudited), in the Notes to Financial Statements. See Item 7, Management’s Discussion and Analysis of Financial Condition and Results of Operations for a discussion of the future outlook and expectations for Energen and additional information regarding production, revenue and production costs.
Energen focuses on increasing its production and proved reserves through the development and exploration of onshore North American oil and natural gas properties. Energen maintains a district office in Midland, Texas.
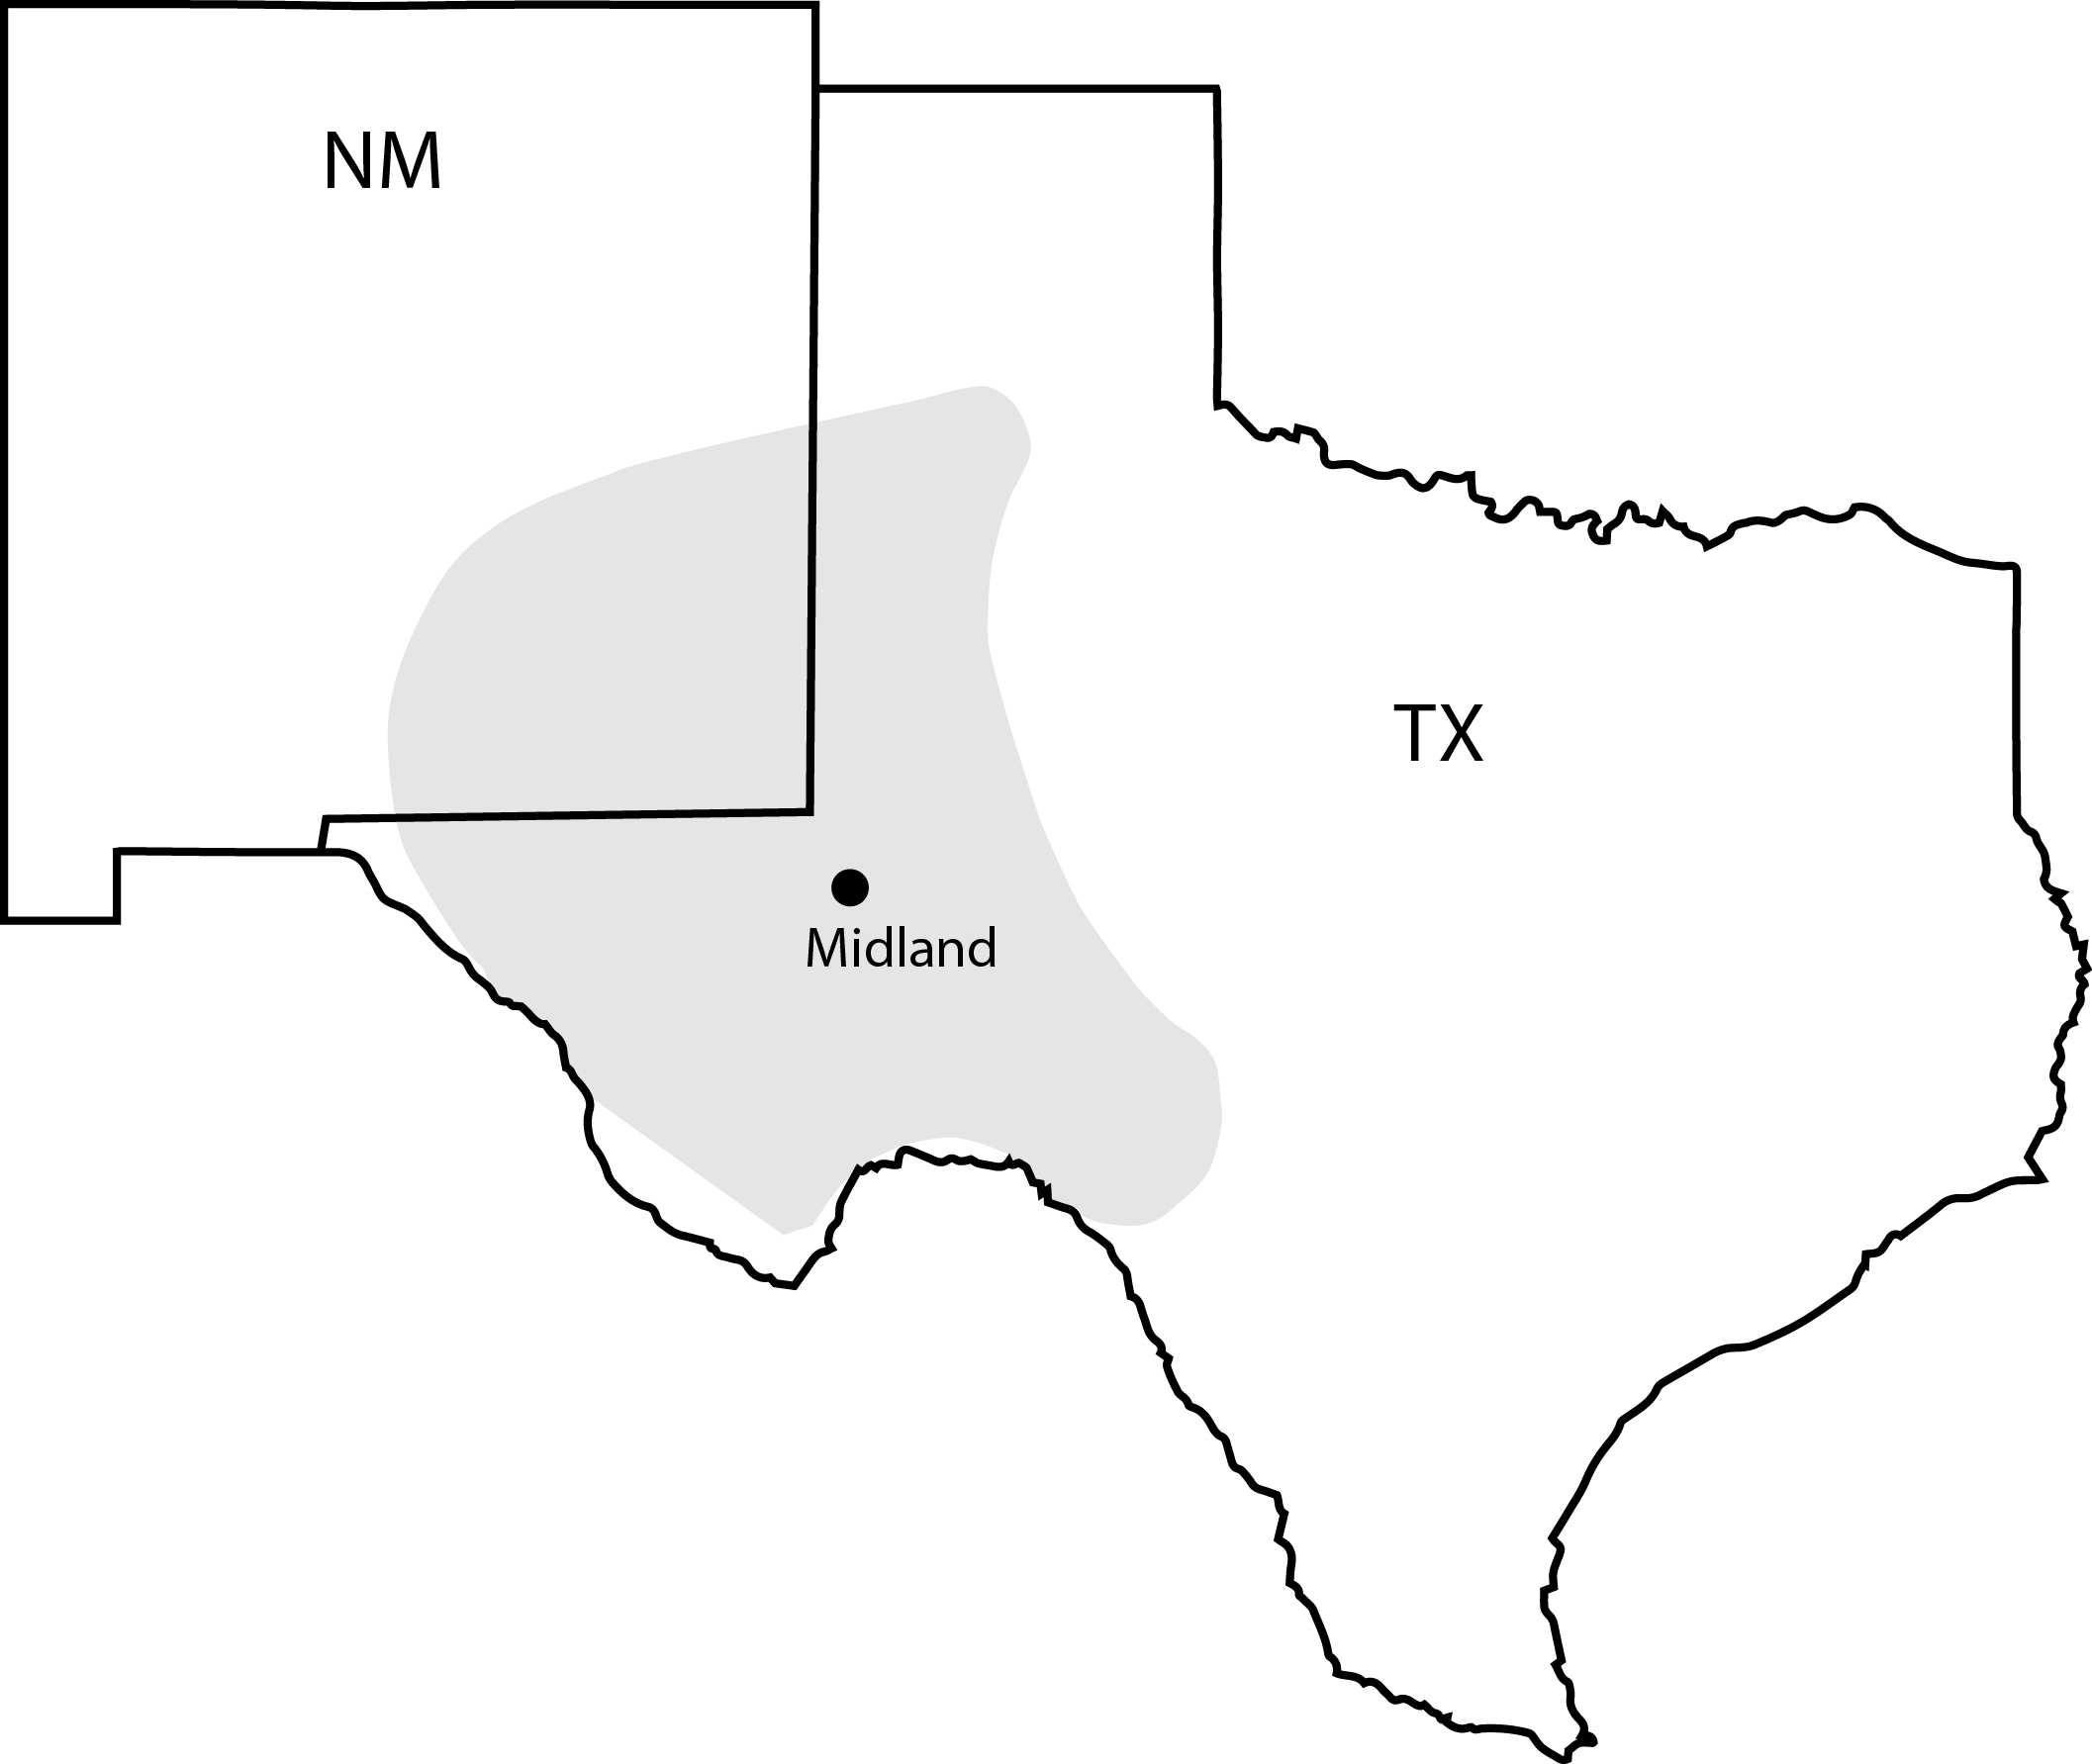
Energen’s major area of operation is in the Permian Basin as highlighted on the above map.
The following table sets forth the production volumes, proved reserves and proved reserves-to-production ratio by area:
Year ended | |||||
December 31, 2016 | December 31, 2016 | December 31, 2016 | |||
Production Volumes (MBOE) | Proved Reserves (MBOE) | Proved Reserves-to-Production Ratio | |||
Permian Basin | |||||
Midland Basin | 12,938 | 236,389 | 18.27 years | ||
Delaware Basin | 4,271 | 39,052 | 9.14 years | ||
Central Basin Platform | 3,176 | 40,495 | 12.75 years | ||
San Juan Basin* | 1,138 | — | — | ||
Other | 116 | 393 | 3.39 years | ||
Total | 21,639 | 316,329 | 14.62 years | ||
*All remaining San Juan Basin assets were sold during the year ended December 31, 2016.
19
The following table sets forth proved reserves by area as of December 31, 2016:
Oil MBbl | NGL MBbl | Natural Gas MMcf | Total MBOE | |||||
Permian Basin | ||||||||
Midland Basin | 141,528 | 47,771 | 282,543 | 236,389 | ||||
Delaware Basin | 22,078 | 7,613 | 56,164 | 39,052 | ||||
Central Basin Platform | 35,781 | 2,634 | 12,481 | 40,495 | ||||
Other | 188 | 28 | 1,060 | 393 | ||||
Total | 199,575 | 58,046 | 352,248 | 316,329 | ||||
See Note 21, Oil and Natural Gas Operations (Unaudited), in the Notes to Financial Statements for the changes to proved reserves during the years ended December 31, 2016, 2015 and 2014 of oil, natural gas liquids and natural gas.
The following table sets forth proved developed reserves by area as of December 31, 2016:
Oil MBbl | NGL MBbl | Natural Gas MMcf | Total MBOE | |||||
Permian Basin | ||||||||
Midland Basin | 50,578 | 21,872 | 134,352 | 94,843 | ||||
Delaware Basin | 14,655 | 5,233 | 39,224 | 26,425 | ||||
Central Basin Platform | 35,781 | 2,634 | 12,481 | 40,495 | ||||
Other | 188 | 28 | 1,060 | 393 | ||||
Total | 101,202 | 29,767 | 187,117 | 162,156 | ||||
The following table sets forth proved undeveloped reserves by area as of December 31, 2016:
Oil MBbl | NGL MBbl | Natural Gas MMcf | Total MBOE | |||||
Permian Basin | ||||||||
Midland Basin | 90,950 | 25,899 | 148,191 | 141,546 | ||||
Delaware Basin | 7,423 | 2,380 | 16,940 | 12,627 | ||||
Total | 98,373 | 28,279 | 165,131 | 154,173 | ||||
The following table sets forth the reconciliation of proved undeveloped reserves:
Year ended December 31, 2016 | Total MMBOE |
Balance at beginning of period | 170.7 |
Undeveloped reserves transferred to developed reserves | (8.7) |
Revisions | (49.8) |
Extensions and discoveries | 42.0 |
Balance at end of period | 154.2 |
Proved undeveloped reserves transferred to proved developed reserves reflect capital expenditures of approximately $47 million during the year ended December 31, 2016 in development of previously proved undeveloped reserves. Proved undeveloped reserves additions included proved undeveloped reserve locations one offset away from producing wells and proved undeveloped reserve locations that are more than one offset away from producing wells using reliable technology and where our geologic interpretation and experience indicate the reservoirs are continuous across those locations. The technologies associated with these additions to proved reserve estimates included analysis of well production data, geophysical data, wireline data, core data and interpretation of zonal analysis. Negative revisions include 22.9 MMBOE of proved undeveloped reserves that will no longer be developed in
20
the five-year time horizon due to development being delayed to focus on other assets with higher returns, 1.1 MMBOE related to changes in year-end pricing, and 33.3 MMBOE of proved undeveloped reserves that were included in the sale of our non-core acreage. Positive revisions total 7.6 MMBOE, including 7.4 MMBOE from extending lateral length of certain locations.
Estimated proved reserves as of December 31, 2016 are based upon studies for each of our properties prepared by Company engineers and audited by Ryder Scott Company, L.P. (Ryder Scott), independent oil and gas reservoir engineers. Calculations were prepared using geological and engineering methods widely used and referred to by professionals in the industry and in accordance with SEC guidelines.
A Senior Vice President at Ryder Scott is the technical person primarily responsible for overseeing the audit of the reserves. The Senior Vice President has a Bachelor of Science degree in Mechanical Engineering and is a member of the Society of Petroleum Engineers and the Society of Petroleum Evaluation Engineers. He has been employed by Ryder Scott since 1982 and also serves as chief technical advisor of unconventional reserves evaluation. Energen Resources’ Vice President of Acquisitions and Reservoir Engineering is the technical person primarily responsible for overseeing reserves on behalf of Energen. His background includes a Bachelor of Science degree in Mechanical Engineering and membership in the Society of Petroleum Engineers. He is a registered Professional Engineer in the state of Alabama with more than 30-years experience evaluating oil and natural gas properties and estimating reserves.
Energen relies upon certain internal controls when preparing its reserve estimations. These internal controls include review by the reservoir engineering managers to ensure the correct reserve methodology has been applied for each specific property and that the reserves are properly categorized in accordance with SEC guidelines. The reservoir engineering managers also affirm the accuracy of the data used in the reserve and associated rate forecast, provide a review of the procedures used to input pricing data and provide a review of the working and net revenue interest factors to ensure that factors are adequately reflected in the engineering analysis.
Net production forecasts are compared to historical sales volumes to check for reasonableness, and operating costs and severance taxes calculated in the reserve report are compared to historical accounting data to help ensure proper cost estimates are used. A reserve table is generated comparing the previous year’s reserves to current year reserve estimates to determine variances. This table is reviewed by the Vice President of Acquisitions and Reservoir Engineering and the Chief Operating Officer of Energen Resources. Revisions and additions are investigated and explained.
Reserve estimates of proved reserves are sent to independent reservoir engineers for audit and verification. For 2016, approximately 99 percent of all proved reserves were audited by the independent reservoir engineers which audit engineering procedures, check the reserve estimates for reasonableness and check that the reserves are properly classified.
The following table sets forth the standard pressure base in pounds-force per square inch absolute (psia) for the significant states in which Energen has wells:
Texas | 14.65 psia | |
New Mexico | 15.025 psia | |
The following table sets forth the total net productive oil and natural gas wells by area as of December 31, 2016, and developed and undeveloped acreage as of the latest practicable date prior to year-end:
Gross Wells | Net Wells | Net Developed Acreage | Net Undeveloped Acreage | |||||
Permian Basin | ||||||||
Midland Basin | 1,141 | 1,046 | 83,918 | 6,240 | ||||
Delaware Basin | 278 | 167 | 40,594 | 11,434 | ||||
Central Basin Platform and other | 3,764 | 2,191 | 82,240 | 2,307 | ||||
Other | 78 | 3 | 19,883 | 6,524 | ||||
Total | 5,261 | 3,407 | 226,635 | 26,505 | ||||
21
The following table sets forth expiration dates for gross and net undeveloped acreage at year end as of December 31, 2016:
Years ending December 31, | ||||||||||||||||
2017 | 2018 | 2019 | Thereafter | |||||||||||||
Gross | Net | Gross | Net | Gross | Net | Gross | Net | |||||||||
Permian | ||||||||||||||||
Midland Basin | 4,003 | 2,166 | 3,719 | 1,767 | 1,753 | 1,806 | 1,856 | 982 | ||||||||
Delaware Basin | 5,721 | 3,252 | 6,237 | 4,510 | 8,087 | 3,279 | 1,650 | 392 | ||||||||
Central Basin Platform and other | 1,057 | 704 | — | 57 | — | — | 2,898 | 1,066 | ||||||||
Other* | 160 | — | — | — | — | — | 14,431 | 6,524 | ||||||||
Total | 10,941 | 6,122 | 9,956 | 6,334 | 9,840 | 5,085 | 20,835 | 8,964 | ||||||||
*Other includes a total of 14,591 gross (6,524 net) acreage principally located in Alabama, Wyoming, Kentucky, Louisiana and Texas, where Energen does not currently have plans for development.
In the ordinary course of business based on our evaluation of certain geologic trends and prospective economics, we have allowed certain lease acreage to expire and may allow additional acreage to expire in the future.
At December 31, 2016, Energen had approximately 316.3 MMBOE total proved reserves which included 154.2 MMBOE of proved undeveloped reserves. We had approximately 28.5 MMBOE or 18.5 percent of our proved undeveloped reserves on leased acreage which is not held by production. The continuous development provisions of these leases extend the primary terms upon the satisfaction of certain conditions. These provisions generally require at least one well be drilled on such leases prior to the expiration of the primary term and that subsequent wells be drilled within a time period that is specific to each lease but ranges from 60 days to 180 days. Once a lease is fully developed, it remains in effect as long as production is maintained from the lease. Our drilling plans provide for the development of these proved undeveloped reserves prior to the expiration of the initial primary term or under the extended primary term as provided for under the continuous development provisions of our lease agreements.
ITEM 3. LEGAL PROCEEDINGS
Energen and its affiliates are, from time to time, parties to various pending or threatened legal proceedings. Certain of these lawsuits include claims for punitive damages in addition to other specified relief. Various pending or threatened legal proceedings are in progress currently. See Note 12, Commitments and Contingencies, in the Notes to Financial Statements for further discussion with respect to legal proceedings.
ITEM 4. MINE SAFETY DISCLOSURES
None
22
EXECUTIVE OFFICERS OF THE REGISTRANT
Name | Age | Position (1) |
James T. McManus, II | 58 | Chairman, Chief Executive Officer and President of Energen (2) |
Charles W. Porter, Jr. | 52 | Vice President, Chief Financial Officer and Treasurer of Energen (3) |
John S. Richardson | 59 | President and Chief Operating Officer of Energen Resources (4) |
J. David Woodruff, Jr. | 60 | Vice President, General Counsel and Secretary of Energen (5) |
David A. Godsey | 62 | Senior Vice President – Exploration and Geology of Energen Resources (6) |
Russell E. Lynch, Jr. | 43 | Vice President and Controller of Energen (7) |
Notes:
(1) All executive officers of Energen have been employed by Energen or a subsidiary for the past five years except for Mr. Godsey. Officers serve at the pleasure of the Board of Directors.
(2) Mr. McManus has been employed by the Company in various capacities since 1986. He was elected Executive Vice President and Chief Operating Officer of Energen Resources in October 1995 and President of Energen Resources in April 1997. He was elected President and Chief Operating Officer of Energen effective January 1, 2006 and Chief Executive Officer of Energen and each of its subsidiaries effective July 1, 2007. He was elected Chairman of the Board of Energen and each of its subsidiaries effective January 1, 2008. Mr. McManus serves as a Director of Energen and each of its subsidiaries.
(3) Mr. Porter has been employed by the Company in various financial capacities since 1989. He was elected Controller of Energen Resources in 1998. In 2001, he was elected Vice President – Finance of Energen Resources. He was elected Vice President, Chief Financial Officer and Treasurer of Energen and each of its subsidiaries effective January 1, 2007.
(4) Mr. Richardson has been employed by the Company in various capacities since 1985. He was elected Vice President – Acquisitions and Engineering of Energen Resources in 1997. He was elected Executive Vice President and Chief Operating Officer of Energen Resources effective January 1, 2006. He was elected President and Chief Operating Officer of Energen Resources effective January 23, 2008.
(5) Mr. Woodruff has been employed by the Company in various capacities since 1986. He was elected Vice President-Legal and Assistant Secretary of Energen and each of its subsidiaries in April 1991. He was elected General Counsel and Secretary of Energen and each of its subsidiaries effective January 1, 2003. He also served as Vice President –Corporate Development of Energen from 1995 to 2010.
(6) Mr. Godsey was employed by the Company in December 2012 as Senior Vice President – Exploration and Geology of Energen Resources. He served as Geoscience Manager Permian Basin for Cheasapeake Energy from April 2003 to December 2012. He also served from December 1999 to April 2003 as Project Geologist for EOG Resources, Inc.
(7) Mr. Lynch has been employed by the Company in various capacities since 2001. He was elected Vice President and Controller of Energen effective January 1, 2009. He was elected Vice President and Controller of Energen Resources effective January 22, 2016.
23
PART II
ITEM 5. | MARKET FOR REGISTRANT’S COMMON EQUITY, RELATED STOCKHOLDER MATTERS AND ISSUER PURCHASES OF EQUITY SECURITIES |
Quarterly Market Prices and Dividends Paid Per Share | ||||
Quarter ended | High | Low | Close | Dividends Paid |
March 31, 2015 | $71.75 | $57.71 | $66.00 | $0.02 |
June 30, 2015 | $77.12 | $65.53 | $68.30 | $0.02 |
September 30, 2015 | $69.11 | $43.75 | $49.86 | $0.02 |
December 31, 2015 | $61.98 | $39.99 | $40.99 | $0.02 |
March 31, 2016 | $42.76 | $20.76 | $36.59 | — |
June 30, 2016 | $51.27 | $34.03 | $48.21 | — |
September 30, 2016 | $60.00 | $43.70 | $57.72 | — |
December 31, 2016 | $64.44 | $47.88 | $57.67 | — |
Energen’s common stock is listed on the New York Stock Exchange under the symbol EGN. At February 13, 2017, there were 4,114 holders of record of Energen common stock. In February 2016, we announced the discontinuance of dividend payments. Accordingly, we do not expect to pay cash dividends on Energen common stock in 2017. The amount and timing of all dividend payments is subject to the discretion of the Board of Directors and is based upon business conditions, results of operations, financial conditions and other factors. Energen may not pay dividends during an event of default, if the payment would result in an event of default or if availability is less than 10 percent of the loan limit under the credit facility.
The following table summarizes information concerning purchases of equity securities by the issuer:
Period | Total Number of Shares Purchased | Average Price Paid per Share | Total Number of Shares Purchased as Part of Publicly Announced Plans | Maximum Number of Shares that May Yet Be Purchased Under the Plans** | ||||||
October 1, 2016 - October 31, 2016 | 545 | * | $ | 57.20 | — | 3,373,161 | ||||
November 1, 2016 - November 30, 2016 | — | — | — | 3,373,161 | ||||||
December 1, 2016 - December 31, 2016 | 490 | * | 58.36 | — | 3,373,161 | |||||
Total | 1,035 | $ | 57.75 | — | 3,373,161 | |||||
*Acquired in connection with tax withholdings and payment of exercise price on stock compensation plans.
**By resolution adopted October 22, 2014, the Board of Directors authorized Energen to repurchase up to 3,600,000 shares of Energen common stock. The resolution does not have an expiration date and does not limit Energen’s authorization to acquire shares in connection with tax withholdings and payment of exercise price on stock compensation plans.
24
PERFORMANCE GRAPH
Energen Corporation — Comparison of Five-Year Cumulative Shareholder Returns
This graph compares the total shareholder returns of Energen, the Standard & Poor’s Composite Stock Index (S&P 500) and the Standard & Poor’s Supercomposite Oil & Gas Exploration & Production Index (S15OILP). The graph assumes $100 invested at the per-share closing price of the common stock on the New York Exchange Composite Tape on December 31, 2011, in the Company and each of the indices. Total shareholder return includes reinvested dividends.
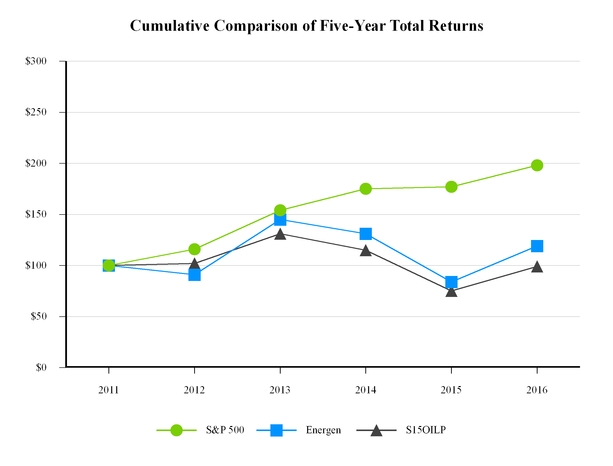
As of December 31, | 2011 | 2012 | 2013 | 2014 | 2015 | 2016 | ||||||||||||
S&P 500 | $ | 100 | $ | 116 | $ | 154 | $ | 175 | $ | 177 | $ | 198 | ||||||
Energen | $ | 100 | $ | 91 | $ | 145 | $ | 131 | $ | 84 | $ | 119 | ||||||
S15OILP | $ | 100 | $ | 102 | $ | 131 | $ | 115 | $ | 75 | $ | 99 | ||||||
25
ITEM 6. SELECTED FINANCIAL DATA
The selected financial data as set forth below should be read in conjunction with the consolidated financial statements and the Notes to Financial Statements included in this Form 10-K.
SELECTED FINANCIAL AND COMMON STOCK DATA
Years ended December 31, (dollars in thousands, except per share amounts) | 2016 | 2015 | 2014 | 2013 | 2012 | ||||||||||||||
INCOME STATEMENT | |||||||||||||||||||
Total revenues | $ | 532,889 | $ | 878,554 | $ | 1,679,213 | $ | 1,206,293 | $ | 1,090,948 | |||||||||
Income (loss) from continuing operations | $ | (167,513 | ) | $ | (945,731 | ) | $ | 99,643 | $ | 141,881 | $ | 204,621 | |||||||
Net income (loss) | $ | (167,513 | ) | $ | (945,731 | ) | $ | 568,032 | $ | 204,554 | $ | 253,562 | |||||||
Diluted earnings per average common share from continuing operations | $ | (1.77 | ) | $ | (12.43 | ) | $ | 1.36 | $ | 1.96 | $ | 2.83 | |||||||
Diluted earnings per average common share | $ | (1.77 | ) | $ | (12.43 | ) | $ | 7.75 | $ | 2.82 | $ | 3.51 | |||||||
BALANCE SHEET | |||||||||||||||||||
Total property, plant and equipment, net | $ | 4,061,552 | $ | 4,350,690 | $ | 5,199,137 | $ | 5,118,088 | $ | 4,698,951 | |||||||||
Total assets | $ | 4,579,823 | $ | 4,611,156 | $ | 6,138,258 | $ | 6,622,212 | $ | 6,175,890 | |||||||||
Long-term debt | $ | 527,443 | $ | 773,550 | $ | 1,038,563 | $ | 1,093,541 | $ | 903,500 | |||||||||
Total shareholders’ equity | $ | 3,120,602 | $ | 2,895,860 | $ | 3,414,604 | $ | 2,858,019 | $ | 2,676,690 | |||||||||
COMMON STOCK DATA | |||||||||||||||||||
Cash dividends paid per common share | $ | — | $ | 0.08 | $ | 0.47 | $ | 0.58 | $ | 0.56 | |||||||||
Diluted average common shares outstanding (000) | 94,476 | 76,078 | 73,275 | 72,471 | 72,316 | ||||||||||||||
Price range: | |||||||||||||||||||
High | $ | 64.44 | $ | 77.12 | $ | 90.66 | $ | 89.92 | $ | 58.24 | |||||||||
Low | $ | 20.76 | $ | 39.99 | $ | 53.78 | $ | 44.46 | $ | 40.13 | |||||||||
Close | $ | 57.67 | $ | 40.99 | $ | 63.76 | $ | 70.75 | $ | 45.09 | |||||||||
26
SELECTED BUSINESS DATA
Years ended December 31, (dollars in thousands, except per unit data) | 2016 | 2015 | 2014 | 2013 | 2012 | ||||||||||||||
Oil, natural gas liquids and natural gas sales from continuing operations | |||||||||||||||||||
Oil | $ | 521,017 | $ | 631,663 | $ | 988,868 | $ | 961,055 | $ | 766,105 | |||||||||
Natural gas liquids | 48,652 | 48,856 | 110,918 | 91,407 | 81,313 | ||||||||||||||
Natural gas | 51,697 | 82,742 | 244,408 | 203,855 | 159,377 | ||||||||||||||
Total | $ | 621,366 | $ | 763,261 | $ | 1,344,194 | $ | 1,256,317 | $ | 1,006,795 | |||||||||
Open non-cash mark-to-market gains (losses) on derivative instruments | |||||||||||||||||||
Oil | $ | (57,148 | ) | $ | (242,227 | ) | $ | 271,200 | $ | (43,261 | ) | $ | 58,786 | ||||||
Natural gas liquids | (6,868 | ) | — | 287 | (652 | ) | 479 | ||||||||||||
Natural gas | (7,174 | ) | (39,525 | ) | 43,958 | (3,919 | ) | (515 | ) | ||||||||||
Total | $ | (71,190 | ) | $ | (281,752 | ) | $ | 315,445 | $ | (47,832 | ) | $ | 58,750 | ||||||
Closed gains (losses) on derivative instruments | |||||||||||||||||||
Oil | $ | (17,701 | ) | $ | 346,404 | $ | 4,377 | $ | (52,694 | ) | $ | (35,954 | ) | ||||||
Natural gas liquids | — | — | 6,218 | 10,795 | 4,146 | ||||||||||||||
Natural gas | 414 | 50,641 | 8,979 | 39,707 | 57,211 | ||||||||||||||
Total | $ | (17,287 | ) | $ | 397,045 | $ | 19,574 | $ | (2,192 | ) | $ | 25,403 | |||||||
Total revenues | $ | 532,889 | $ | 878,554 | $ | 1,679,213 | $ | 1,206,293 | $ | 1,090,948 | |||||||||
Production volumes from continuing operations | |||||||||||||||||||
Oil (MBbl) | 13,213 | 14,023 | 11,814 | 10,364 | 8,749 | ||||||||||||||
Natural gas liquids (MMgal) | 163.5 | 170.7 | 172.3 | 135.8 | 108.1 | ||||||||||||||
Natural gas (MMcf) | 27,204 | 35,604 | 58,602 | 58,104 | 59,166 | ||||||||||||||
Production volumes from continuing operations (MBOE) | 21,639 | 24,022 | 25,684 | 23,281 | 21,183 | ||||||||||||||
Total production volumes (MBOE) | 21,639 | 24,022 | 25,849 | 25,362 | 24,066 | ||||||||||||||
Proved reserves | |||||||||||||||||||
Oil (MBbl) | 199,575 | 210,691 | 181,227 | 164,870 | 155,348 | ||||||||||||||
Natural gas liquids (MBbl) | 58,046 | 71,713 | 73,463 | 63,011 | 56,155 | ||||||||||||||
Natural gas (MMcf)) | 352,248 | 433,904 | 707,926 | 719,725 | 809,128 | ||||||||||||||
Total (MBOE) | 316,329 | 354,722 | 372,678 | 347,835 | 346,359 | ||||||||||||||
Costs per BOE from continuing operations | |||||||||||||||||||
Oil, natural gas liquids and natural gas production expenses | $ | 7.94 | $ | 9.51 | $ | 10.68 | $ | 11.06 | $ | 9.55 | |||||||||
Production and ad valorem taxes | $ | 1.98 | $ | 2.39 | $ | 3.97 | $ | 4.04 | $ | 3.58 | |||||||||
Depreciation, depletion and amortization | $ | 20.70 | $ | 24.72 | $ | 21.36 | $ | 19.45 | $ | 16.17 | |||||||||
Exploration expense | $ | 0.25 | $ | 0.62 | $ | 1.09 | $ | 0.60 | $ | 0.62 | |||||||||
General and administrative expense | $ | 4.42 | $ | 6.21 | $ | 4.75 | $ | 4.89 | $ | 3.71 | |||||||||
Capital expenditures | $ | 582,898 | $ | 1,114,808 | $ | 1,451,951 | $ | 1,120,753 | $ | 1,307,968 | |||||||||
27
ITEM 7. | MANAGEMENT'S DISCUSSION AND ANALYSIS OF FINANCIAL CONDITION AND RESULTS OF OPERATIONS |
OVERVIEW OF BUSINESS
Energen Corporation (Energen or the Company) is an oil and natural gas exploration and production company engaged in the exploration, development and production of oil, natural gas liquids and natural gas. Our operations are conducted through our subsidiary, Energen Resources Corporation (Energen Resources) and primarily occur within the Midland Basin, the Delaware Basin and the Central Basin Platform areas of the Permian Basin in west Texas and New Mexico.
Energen is focused on increasing its oil, natural gas liquids and natural gas production and proved reserves largely through active development and/or exploratory programs in the Permian Basin. The Company seeks to expand its footprint primarily through acquisitions of proved properties and unproved leasehold within areas of existing operations. All oil, natural gas liquids and natural gas production is sold to third parties. Energen operates properties for its own interest and that of its joint interest owners. This role includes overall project management and day-to-day decision-making relative to project operations.
FINANCIAL AND OPERATING PERFORMANCE
Overview of 2016 Results and Activities
During the year ended December 31, 2016, Energen experienced a challenging commodity price environment. Key results were as follows:
• | completed 59 net wells of which 46 were drilled but uncompleted from the prior year; |
• | added 58 net new drilled but uncompleted wells for a total of 60 net wells at December 31, 2016; |
• | realized a 35.8 percent decline in general and administrative (G&A) expense and a 24.8 percent decrease in oil, natural gas liquids and natural gas production expense; |
• | issued 18,170,000 additional shares of common stock through a public equity offering receiving net proceeds of approximately $381.1 million; |
• | completed a series of asset sales of certain non-core Permian Basin assets in the Delaware Basin in Texas and in the San Juan Basin in New Mexico for an aggregate purchase price of approximately $552 million; |
• | completed an estimated $143.7 million in various purchases and renewals of unproved leasehold largely in the Permian Basin, including approximately $77 million of acreage purchased in Lea County, New Mexico and |
• | ended the year with cash of $386.1 million and long-term debt of $554.0 million at December 31, 2016. |
Year ended December 31, 2016 vs year ended December 31, 2015
Energen’s net loss and loss from continuing operations for the year ended December 31, 2016 totaled $167.5 million ($1.77 per diluted share) compared to the year ended December 31, 2015 net loss and loss from continuing operations of $945.7 million ($12.43 per diluted share). Energen did not have discontinued operations in 2016 and 2015. This change in loss from continuing operations was primarily the result of:
• | non-cash impairments in 2015 on certain Permian Basin oil properties in the Delaware Basin (approximately $388.3 million after-tax) and in the Central Basin Platform (approximately $310.1 million after-tax); |
• | gain in the year-to-date 2016 on a series of asset sales of certain non-core Permian Basin assets in the Delaware Basin in Texas and in the San Juan Basin (approximately $158.4 million after-tax); |
• | lower year-over-year after-tax losses of $135.3 million on open derivatives (resulting from an after-tax $45.9 million non-cash loss on open derivatives for 2016 and an after-tax $181.3 million non-cash loss on open derivatives for 2015); |
• | lower depreciation, depletion and amortization (DD&A) expense (approximately $94 million after-tax); |
• | non-cash impairments in 2015 on certain held for sale properties in the San Juan Basin (approximately $85.1 million after-tax); |
• | lower oil, natural gas liquids and natural gas production expense (approximately $37 million after-tax); |
• | decreased general and administrative (G&A) expense (approximately $34 million after-tax); |
• | unproved leasehold writedowns in 2015 on San Juan Basin properties (approximately $24.3 million after-tax); |
• | additional unproved leasehold writedowns in 2015 primarily on Permian Basin properties in the Delaware Basin (approximately $18.7 million after-tax); |
• | lower production and ad valorem taxes (approximately $9 million after-tax); |
• | lower exploration expense (approximately $6 million after-tax) and |
• | decreased interest expense (approximately $4 million after-tax) |
28
partially offset by:
• | period over period loss on closed derivatives (approximately $267 million after-tax); |
• | non-cash impairments on certain Permian Basin oil properties primarily in the Central Basin Platform (approximately $120.4 million after-tax) and the Delaware Basin (approximately $13.7 million after-tax); |
• | decreased realized oil and natural gas commodity prices (approximately $55 million after-tax); |
• | lower oil, natural gas liquids and natural gas production volumes (approximately $37 million after-tax); |
• | gain in 2015 on sale of the majority of our natural gas assets in the San Juan Basin (approximately $17.3 million after tax); |
• | non-cash impairments on certain properties in the San Juan Basin (approximately $4.8 million after-tax) and |
• | unproved leasehold writedowns primarily on Permian Basin properties in the Delaware Basin and Central Basin Platform (approximately $3 million after-tax). |
Year ended December 31, 2015 vs year ended December 31, 2014
For the year ended December 31, 2015, Energen’s net loss totaled $945.7 million ($12.43 per diluted share) as compared to net income of $568.0 million ($7.75 per diluted share) in 2014. Energen’s loss from continuing operations totaled $945.7 million ($12.43 per diluted) in 2015 as compared with income from continuing operations of $99.6 million ($1.36 per diluted) in 2014. Energen did not have discontinued operations in 2015. Income from discontinued operations for 2014 was $468.4 million ($6.39 per diluted share) largely due to the sale of Alagasco. This change in income (loss) from continuing operations was primarily the result of:
• | lower realized oil, natural gas liquids and natural gas commodity prices (approximately $428 million after-tax); |
• | increased year-over-year after-tax losses of $382.9 million on open derivatives (resulting from an after-tax $181.3 million non-cash loss on open derivatives for 2015 and an after-tax $201.8 million non-cash gain on open derivatives for 2014); |
• | non-cash impairments on certain Permian Basin oil properties in the Delaware Basin (approximately $388.3 million after-tax) and in the Central Basin Platform (approximately $310.1 million after-tax); |
• | non-cash impairments on certain held for sale properties in the San Juan Basin (approximately $85.1 million after-tax); |
• | decreased natural gas and natural gas liquids production volumes (approximately $62 million after-tax); |
• | higher DD&A expense (approximately $29 million after-tax); |
• | unproved leasehold writedowns on San Juan Basin properties (approximately $24.3 million after-tax); |
• | additional unproved leasehold writedowns primarily on Permian Basin properties in the Delaware Basin (approximately $18.7 million after-tax); |
• | increased G&A expense (approximately $17 million after-tax) and |
• | increased interest expense (approximately $3 million after-tax) |
partially offset by:
• | period over period gain on closed derivatives (approximately $242 million after-tax); |
• | non-cash impairments in 2014 on certain gas properties in the San Juan Basin (approximately $143.7 million after-tax); |
• | higher oil production volumes (approximately $118 million after-tax); |
• | non-cash impairments in 2014 on certain oil properties in the Permian Basin (approximately $70.9 million after-tax); |
• | unproved leasehold writedowns in 2014 on Permian Basin oil properties (approximately $39 million after-tax) and unproved leasehold writedowns on San Juan Basin properties (approximately $3.7 million after-tax); |
• | decreased oil, natural gas liquids and natural gas production expense (approximately $29 million after-tax); |
• | lower production and ad valorem taxes (approximately $29 million after-tax); |
• | gain on sale of the majority of our natural gas assets in the San Juan Basin (approximately $17.3 million after tax) and |
• | lower exploration expense (approximately $8 million after-tax). |
29
Results of Operations
The following table summarizes information regarding our production and operating data from continuing operations.
Years ended December 31, (in thousands, except sales price and per unit data) | 2016 | 2015 | 2014 | ||||||
Operating and production data from continuing operations | |||||||||
Oil, natural gas liquids and natural gas sales | |||||||||
Oil | $ | 521,017 | $ | 631,663 | $ | 988,868 | |||
Natural gas liquids | 48,652 | 48,856 | 110,918 | ||||||
Natural gas | 51,697 | 82,742 | 244,408 | ||||||
Total | $ | 621,366 | $ | 763,261 | $ | 1,344,194 | |||
Open non-cash mark-to-market gains (losses) on derivative instruments | |||||||||
Oil | $ | (57,148 | ) | $ | (242,227 | ) | $ | 271,200 | |
Natural gas liquids | (6,868 | ) | — | 287 | |||||
Natural gas | (7,174 | ) | (39,525 | ) | 43,958 | ||||
Total | $ | (71,190 | ) | $ | (281,752 | ) | $ | 315,445 | |
Closed gains (losses) on derivative instruments | |||||||||
Oil | $ | (17,701 | ) | $ | 346,404 | $ | 4,377 | ||
Natural gas liquids | — | — | 6,218 | ||||||
Natural gas | 414 | 50,641 | 8,979 | ||||||
Total | $ | (17,287 | ) | $ | 397,045 | $ | 19,574 | ||
Total revenues | $ | 532,889 | $ | 878,554 | $ | 1,679,213 | |||
Production volumes | |||||||||
Oil (MBbl) | 13,213 | 14,023 | 11,814 | ||||||
Natural gas liquids (MMgal) | 163.5 | 170.7 | 172.3 | ||||||
Natural gas (MMcf) | 27,204 | 35,604 | 58,602 | ||||||
Total production volumes (MBOE) | 21,639 | 24,022 | 25,684 | ||||||
Average daily production volumes | |||||||||
Oil (MBbl) | 36.1 | 38.4 | 32.4 | ||||||
Natural gas liquids (MMgal) | 0.4 | 0.5 | 0.5 | ||||||
Natural gas (MMcf) | 74.3 | 97.5 | 160.6 | ||||||
Total average daily production volumes (MBOE/d) | 59.1 | 65.8 | 70.4 | ||||||
Permian Basin - Spraberry (Trend Area) Field production volumes (included in production volumes above)* | |||||||||
Oil (MBbl) | 7,205 | 6,714 | 4,004 | ||||||
Natural gas liquids (MMgal) | 105.3 | 86.7 | 56.2 | ||||||
Natural gas (MMcf) | 16,163 | 13,338 | 7,305 | ||||||
Total production volumes (MBOE) | 12,406 | 11,002 | 6,558 | ||||||
Average realized prices excluding effects of open non-cash mark-to-market derivative instruments | |||||||||
Oil (per barrel) | $ | 38.09 | $ | 69.75 | $ | 84.07 | |||
Natural gas liquids (per gallon) | $ | 0.30 | $ | 0.29 | $ | 0.68 | |||
Natural gas (per Mcf) | $ | 1.92 | $ | 3.75 | $ | 4.32 | |||
Average realized prices excluding effects of all derivative instruments | |||||||||
Oil (per barrel) | $ | 39.43 | $ | 45.04 | $ | 83.70 | |||
Natural gas liquids (per gallon) | $ | 0.30 | $ | 0.29 | $ | 0.64 | |||
30
Natural gas (per Mcf) | $ | 1.90 | $ | 2.32 | $ | 4.17 | |||
Costs per BOE | |||||||||
Oil, natural gas liquids and natural gas production expenses | $ | 7.94 | $ | 9.51 | $ | 10.68 | |||
Production and ad valorem taxes | $ | 1.98 | $ | 2.39 | $ | 3.97 | |||
Depreciation, depletion and amortization | $ | 20.70 | $ | 24.72 | $ | 21.36 | |||
Exploration expense | $ | 0.25 | $ | 0.62 | $ | 1.09 | |||
General and administrative | $ | 4.42 | $ | 6.21 | $ | 4.75 | |||
*The Spraberry (Trend Area) Field in the Permian Basin contained 15 percent or more of Energen’s total proved reserves as of December 31, 2016, 2015 and 2014. Production volumes in 2015 and 2014 have been revised to include certain horizontal wells in the Spraberry Trend Area.
Revenues: Our revenues fluctuate primarily as a result of realized commodity prices, production volumes and the value of our derivative contracts. Our revenues are predominantly derived from the sale of oil, natural gas liquids and natural gas.
For the year ended December 31, 2016, oil, natural gas liquids and natural gas sales decreased $141.9 million or 18.6 percent from the same period of 2015. Particular factors impacting commodity sales for 2016 include the following:
• | Oil volumes fell 5.8 percent to 13,213 MBbl during 2016 as production declines in the Midland Basin Wolfberry, 3rd Bone Spring in the Delaware Basin and the Central Basin Platform along with production declines associated with a series of asset sales of certain non-core Permian Basin assets in the Delaware Basin in Texas and in the San Juan Basin in New Mexico that were partially offset by new well performance, net of production declines, in the horizontal Wolfcamp in the Midland and Delaware basins and also Spraberry in the Midland Basin. |
• | Average realized oil prices in 2016 fell 12.5 percent to $39.43 per barrel. |
• | Production of natural gas liquids decreased 4.2 percent to 163.5 MMgal in 2016. Production declines in the Midland Basin Wolfberry and 3rd Bone Spring in the Delaware Basin and declines from the asset sales of certain non-core Permian Basin assets in the Delaware Basin in Texas and in the San Juan Basin in New Mexico were partially offset by new well performance, net of production declines, in the horizontal Wolfcamp in the Midland and Delaware basins along with Spraberry in the Midland Basin. |
• | Average realized natural gas liquids prices rose 3.4 percent to an average price of $0.30 per gallon during 2016. |
• | Natural gas production decreased 23.6 percent to 27.2 Bcf in 2016 primarily due to the sale of natural gas assets in the San Juan Basin and production declines in the 3rd Bone Spring in the Delaware Basin and in the Midland Basin Wolfberry partially offset by new horizontal Wolfcamp production in the Midland and Delaware basins and also Spraberry in the Midland Basin. |
• | Average realized natural gas prices in 2016 fell 18.1 percent to $1.90 per Mcf. |
• | Production from continuing operations decreased 9.9 percent to 21.6 MMBOE during 2016. |
For the year ended December 31, 2015, commodity sales decreased $580.9 million or 43.2 percent from the same period of 2014. Particular factors impacting commodity sales for 2015 include the following:
• | Oil volumes in 2015 increased 18.7 percent to 14,023 MBbl as new drilling in the horizontal Wolfcamp in the Midland and Delaware basins more than offset declines in the Wolfberry in the Midland Basin, 3rd Bone Spring in the Delaware Basin and the Central Basin Platform. |
• | Average realized oil prices fell 46.2 percent to $45.04 per barrel during 2015. |
• | Natural gas liquids production for 2015 declined 0.9 percent to 170.7 MMgal due to the sale of the majority of our natural gas assets in the San Juan Basin. |
• | Average realized natural gas liquids prices decreased 54.7 percent to an average price of $0.29 per gallon during 2015. |
• | Natural gas production decreased 39.2 percent to 35.6 Bcf in 2015 due to the sale of natural gas assets in the San Juan Basin, normal declines in the San Juan Basin and pipeline curtailments in the Permian Basin partially offset by accelerated completions and new well performance in the Permian Basin. |
• | Average realized natural gas prices decreased 44.4 percent to $2.32 per Mcf during 2015. |
• | Production from continuing operations fell 6.5 percent to 24 MMBOE during 2015. |
Realized prices exclude the effects of derivative instruments.
31
Oil, natural gas liquids and natural gas production expense: The following table provides the components of our oil, natural gas liquids and natural gas production expenses:
Years ended December 31, (in thousands, except per unit data) | 2016 | 2015 | 2014 | ||||||
Lease operating expenses | $ | 114,386 | $ | 140,010 | $ | 140,413 | |||
Workover and repair costs | 46,619 | 68,428 | 91,629 | ||||||
Marketing and transportation | 10,709 | 19,942 | 42,390 | ||||||
Total oil, natural gas liquids and natural gas production expense | $ | 171,714 | $ | 228,380 | $ | 274,432 | |||
Oil, natural gas liquids and natural gas production expense per BOE | $ | 7.94 | $ | 9.51 | $ | 10.68 | |||
Energen had oil, natural gas liquids and natural gas production expense of $171.7 million, $228.4 million and $274.4 million during the years ended December 31, 2016, 2015 and 2014, respectively. Lease operating expense may be positively or negatively impacted by property acquisitions and dispositions and also generally reflects year-over-year increases in the number of active wells resulting from Energen’s ongoing development and exploratory activities. Overall lease operating expense was positively impacted in the current year by the sale of certain non-core Permian Basin assets and the San Juan Basin.
• | In 2016, lease operating expense decreased $25.6 million largely due to decreased water disposal costs (approximately $8.9 million), lower non-operated costs (approximately $4.3 million), decreased gathering costs (approximately $3.7 million), lower labor costs (approximately $3.7 million), lower other operations and maintenance expense (approximately $3.5 million), decreased environmental compliance costs (approximately $1.2 million) and decreased electrical costs (approximately $0.5 million) partially offset by additional equipment rental costs (approximately $0.8 million) and increased chemical and treatment costs (approximately $0.7 million). |
• | In 2015, lease operating expense decreased $0.4 million primarily due to lower other operations and maintenance expense (approximately $8 million) and decreased electrical costs (approximately $3.6 million) largely offset by additional equipment rental costs (approximately $4.5 million), higher labor costs (approximately $2 million), increased non-operated costs (approximately $1.9 million), increased gathering costs (approximately $1.2 million), higher environmental compliance costs (approximately $1.1 million) and higher water disposal costs (approximately $1.1 million). |
On a per unit basis, the average lease operating expense for 2016, 2015 and 2014 was $5.29 per BOE, $5.83 per BOE and $5.46 per BOE, respectively.
Workover and repair costs decreased approximately $21.8 million in 2016 and decreased $23.2 million in 2015. In 2016, these expenses were lower largely due to lower incidence of well failures and reduced costs of services and materials. Workover and repair costs in 2015 were lower primarily due to lower incidence of offset well stimulation interference and lower electrical costs.
In the years ended December 31, 2016 and 2015, marketing and transportation costs decreased $9.2 million and $22.4 million, respectively. The decline in 2016 and 2015 was largely due to lower natural gas volumes as a result of the sale of certain San Juan Basin natural gas assets.
Production and ad valorem taxes: The following table provides details of our production and ad valorem taxes:
Years ended December 31, (in thousands, except per unit data) | 2016 | 2015 | 2014 | ||||||
Production taxes | $ | 31,849 | $ | 38,197 | $ | 75,249 | |||
Ad valorem taxes | 11,089 | 19,183 | 26,814 | ||||||
Total production and ad valorem tax expense | $ | 42,938 | $ | 57,380 | $ | 102,063 | |||
Total production and ad valorem tax expense per BOE | $ | 1.98 | $ | 2.39 | $ | 3.97 | |||
Production and ad valorem taxes were $42.9 million, $57.4 million and $102.1 million during the years ended December 31, 2016, 2015 and 2014, respectively. In 2016, production-related taxes were $6.3 million lower with approximately $2.6 million attributed to decreased commodity market prices and approximately $3.8 million attributed to lower production volumes. In 2015, production-related taxes were $37.1 million lower with approximately $32.2 million attributed to decreased commodity market prices and
32
$4.9 million attributed to lower net production volumes. Commodity market prices exclude the effects of derivative instruments for purposes of determining production taxes. Decreased ad valorem taxes of $8.1 million and $7.6 million in 2016 and 2015, respectively, were primarily driven by the factor adjusted price impact on our Texas oil and natural gas properties.
Depreciation, depletion and amortization: DD&A expense decreased $145.8 million in 2016 and increased $45.2 million in 2015. The average DD&A rates were $20.70 per BOE in 2016, $24.72 per BOE in 2015 and $21.36 per BOE in 2014. The decrease in the 2016 per unit DD&A rate, which contributed approximately $86.6 million to the decrease in DD&A expense, was largely due to lower rates resulting from asset impairments. Decreased production volumes reduced DD&A expense approximately $58.3 million in 2016. The increase in the 2015 per unit DD&A rate, which contributed approximately $79.3 million to the increase in DD&A expense, was primarily due to higher rates resulting from an increase in development costs and the impact of year end reserve revisions driven by lower commodity prices. Lower net production volumes reduced DD&A expense approximately $35.2 million in 2015.
Asset impairment: Non-cash impairment writedowns are reflected in asset impairment on the consolidated income statements.
Permian Basin: During the first quarter of 2016, Energen recognized non-cash impairment writedowns in the Permian Basin of $208.3 million to adjust the carrying amount of these properties to their fair value. We estimate future discounted cash flows in determining fair value using commodity assumptions, which are based on the commodity price curve for five years and then escalated at 3 percent through our assumed price cap. Our commodity price assumptions declined in the first quarter of 2016 by approximately 5 percent for oil and 4 percent for natural gas in comparable periods.
For 2015, Energen recognized non-cash impairment writedowns on certain properties in the Permian Basin of $1,092.2 million to adjust the carrying amount of these properties to their fair value. We estimate future discounted cash flows in determining fair value using commodity assumptions, which are based on the commodity price curve for five years and then escalated at 3 percent through our assumed price cap. During the fourth quarter of 2015, Energen recognized non-cash impairment writedowns of $646.1 million due to commodity price declines and the related impact to our drilling plans. Our commodity price assumptions declined over the third quarter by approximately 12 percent for oil and 6 percent for natural gas in comparable periods. During the third quarter of 2015, Energen recognized non-cash impairment writedowns of $390.2 million due to commodity price declines. Our commodity price assumptions declined over the second quarter by approximately 19 percent for oil and 12 percent for natural gas in comparable periods. During the second quarter of 2015, Energen recognized non-cash impairment writedowns on certain properties in the Central Basin Platform of $51.5 million. Estimated future cash flows were revised due to the receipt of an unsolicited offer for these properties. During the first quarter of 2015, Energen recognized a non-cash impairment writedown of $4.3 million.
During the third and fourth quarters of 2014, Energen recognized non-cash impairment writedowns on certain Permian Basin properties in the Midland Basin of $25.8 million and in the Delaware Basin of $90.6 million, respectively, to adjust the carrying amount of these properties to their fair value based on expected future discounted cash flows.
During 2016, Energen recognized unproved leasehold writedowns primarily on Permian Basin oil properties in the Delaware Basin and the Central Basin Platform of $4.8 million. Energen recognized unproved leasehold writedowns primarily on Permian Basin oil properties in the Delaware Basin of $29.2 million in 2015. During 2014, Energen recognized unproved leasehold writedowns of $64.4 million. These 2014 unproved leasehold writedowns included $55.1 million of expected leasehold expirations.
San Juan Basin: During the first quarter of 2016, Energen recognized non-cash impairment writedowns on held for sale properties in the San Juan Basin of $7.5 million to adjust the carrying amount of these properties to their fair value.
Energen recognized non-cash impairment writedowns on properties in the San Juan Basin of $133.1 million during the fourth quarter of 2015 to adjust the carrying amount of these properties to their fair value based on expected future discounted cash flows. These remaining properties were designated as held for sale as of December 31, 2015. At December 31, 2015, proved reserves associated with Energen’s San Juan Basin held for sale properties totaled 16,930 MBOE.
During 2014, non-cash impairment writedowns of $230.3 million were recognized by Energen on certain natural gas properties in the San Juan Basin to adjust the carrying amount of these properties to their fair value based on expected future discounted cash flows and direct market data as these properties were designated as held for sale as of December 31, 2014. At December 31, 2014, proved reserves associated with Energen’s San Juan Basin held for sale properties totaled 69,038 MBOE.
During 2015 and 2014, Energen recognized unproved leasehold writedowns San Juan Basin properties of $37.9 million and $5.8 million, respectively.
33
Exploration: The following table provides details of our exploration expense:
Years ended December 31, (in thousands, except per unit data) | 2016 | 2015 | 2014 | ||||||
Geological and geophysical | $ | 5,032 | $ | 7,316 | $ | 8,800 | |||
Dry hole costs | 16 | 7,097 | 9,325 | ||||||
Delay rentals and other | 367 | 465 | 9,965 | ||||||
Total exploration expense | $ | 5,415 | $ | 14,878 | $ | 28,090 | |||
Total exploration expense per BOE | $ | 0.25 | $ | 0.62 | $ | 1.09 | |||
Exploration expense decreased $9.5 million during 2016 primarily due to lower dry hole costs and seismic costs. Exploration expense decreased $13.2 million in 2015 primarily due to lower delay rentals and dry hole costs. Delay rentals are lower in 2015 largely due to the sale of certain San Juan Basin properties.
General and administrative: The following table provides details of our G&A expense:
Years ended December 31, (in thousands, except per unit data) | 2016 | 2015 | 2014 | ||||||
General and administrative | $ | 15,150 | $ | 30,578 | $ | 25,519 | |||
Benefit and performance-based compensation costs | 35,218 | 64,805 | 45,215 | ||||||
Labor costs | 45,321 | 53,749 | 51,318 | ||||||
Total general and administrative expense | $ | 95,689 | $ | 149,132 | $ | 122,052 | |||
Total general and administrative expense per BOE | $ | 4.42 | $ | 6.21 | $ | 4.75 | |||
Total G&A expense decreased $53.4 million in 2016 largely due to decreased costs from Energen’s benefit and performance-based compensation plans (approximately $29.6 million), lower labor costs (approximately $13.4 million), decreased legal expenses (approximately $5.4 million), decreased professional services (approximately $5.3 million), decreased recruiting expenses (approximately $1.2 million), lower insurance costs (approximately $1.1 million) and decreased vehicle expenses (approximately $1 million) partially offset by charges associated with the workforce reduction of $5.0 million. In 2015, total G&A expense rose $27.1 million primarily due to increased costs related to Energen’s benefit and performance-based compensation plans (approximately $19.6 million), increased legal expenses (approximately $5.4 million) and higher labor costs (approximately $2.4 million). Included in costs from the benefit and performance-based compensation plans were pension costs of $3.3 million (all of which was settlement expense), $31.3 million (including settlement expense of $29.8 million) and $18.9 million (including settlement expense of $4.1 million) for the years ended December 31, 2016, 2015 and 2014, respectively.
(Gain) loss on sale of assets and other, net: During June, July and August of 2016, Energen completed a series of asset sales of certain non-core Permian Basin assets in the Delaware Basin in Texas and in the San Juan Basin in New Mexico for an aggregate purchase price of $552 million. These transactions had closing dates of June 3, 7, 30, July 15 and August 9 of 2016 with various effective dates ranging from March 1, 2016 to June 30, 2016. Minor portions of the assets were transferred to other parties upon the exercise of preferential purchase rights under pre-existing joint operating agreements in the ordinary course of business. Pre-tax proceeds to Energen were approximately $532.9 million after purchase price adjustments of approximately $19 million related to the operations of the properties subsequent to the effective dates and other one-time adjustments including transfer payments and certain amounts due the buyer, but before consideration of transaction costs of approximately $5 million. In the year ended December 31, 2016, Energen recognized pre-tax gains of $246.3 million on the sales. Energen used proceeds from the sale to fund ongoing operations.
On March 31, 2015, Energen completed the sale of the majority of our natural gas assets in the San Juan Basin in New Mexico and Colorado (effective as of January 1, 2015) for an aggregate purchase price of $395 million. The sales proceeds were reduced by purchase price adjustments of approximately $11 million related to the operations of the San Juan Basin properties subsequent to December 31, 2014 and one-time adjustments related primarily to liabilities assumed by the buyer, which resulted in pre-tax proceeds to Energen of approximately $384 million before consideration of transaction costs of approximately $2.8 million. Energen recognized a pre-tax gain of $27.0 million on the sale. Energen used proceeds from the sale to reduce long-term indebtedness. At December 31, 2014, proved reserves associated with these San Juan Basin held for sale properties totaled 69,038 MBOE.
34
Interest expense: Interest expense decreased $6 million during 2016 primarily due to decreased borrowings under our syndicated credit facility resulting from proceeds on asset sales and our first quarter equity offering. Interest expense rose $5.3 million during 2015 largely due to the classification of interest expense associated with debt required to be extinguished as discontinued operations in 2014 partially offset by the 2014 write-off of $2.7 million in debt issuance costs associated with the $600 million Senior Term Loans which were repaid in September 2014 in association with the sale of Alagasco. The interest expense associated with the $600 million Senior Term Loans is reflected in discontinued operations for 2014. The average daily outstanding balance under credit facilities was $33.6 million in 2016. The average daily outstanding balance under credit facilities was $358.9 million in 2015 as compared to $482.2 million in 2014.
Income tax expense: Income tax expense increased $455.4 million in 2016 largely due to higher pre-tax income and decreased $575.7 million in 2015 primarily due to lower pre-tax income. In addition, the Company recorded $2.5 million and $1.3 million
tax expense for the change in the valuation allowance for our deferred tax assets as of December 31, 2016, and 2015, respectively, due to the uncertainty of their realization. On June 15, 2015, a Texas tax bill was signed into law which reduces the Texas Franchise Tax (Margin Tax) rate from 1 percent to 0.75 percent for taxpayers not engaged in retail or wholesale trade. The tax rate reduction is applicable for tax reports originally due on or after January 1, 2016. Energen recognized a $3.1 million income tax benefit during the second quarter of 2015, the period the law was enacted, to reflect the impact of this change.
The Company monitors legislative proposals that, if enacted, would make significant changes to U.S. tax laws. These changes have included items such as a decrease in the federal income tax rate, among other proposals. The adoption of the proposed changes in the U.S. tax law could affect our financial condition, results of operations and cash flows.
Discontinued operations, net of tax: On September 2, 2014, Energen completed the transaction to sell Alagasco to Laclede for $1.6 billion, less the assumption of $267 million in debt. The net pre-tax proceeds to Energen totaled approximately $1.32 billion. This sale had an effective date of August 31, 2014. Energen used cash proceeds from the sale to reduce long-term and short-term indebtedness. During the second quarter of 2014, Energen classified Alagasco as held for sale and reflected the associated operating results in discontinued operations. Energen’s results of operations and cash flows for the year ended December 31, 2014 presented in our consolidated financial statements and these notes reflect Alagasco as discontinued operations.
In March 2014, Energen completed the sale of its North Louisiana/East Texas primarily natural gas properties for $30.3 million. The sale had an effective date of December 1, 2013, and the proceeds from the sale were used to repay short-term obligations. Energen classified these primarily natural gas properties as held for sale and reflected the associated operating results in discontinued operations. Energen recognized non-cash impairment writedowns on these properties in 2014 of $1.9 million pre-tax to adjust the carrying amount of these properties to their fair value based on an estimate of the selling price of the properties.
See Note 16, Held for Sale Properties and Discontinued Operations, in the Notes to Financial Statements for additional information regarding discontinued operations.
FINANCIAL POSITION AND LIQUIDITY
Cash Flow
The key drivers impacting our cash flow from operations are our oil, natural gas liquids and natural gas production volumes and realized commodity market prices, net of the effects of settlements on our derivative commodity instruments. During 2016, we relied on our cash flows from operations, proceeds from the first quarter 2016 equity offering and the pre-tax proceeds from the series of asset sales in the Permian Basin and San Juan Basin to fund our capital spending plans and working capital requirements. Cash flows may be supplemented, as needed, by borrowings under our syndicated credit facility.
Net cash provided by operating activities: Energen’s net cash from operating activities totaled $292.4 million, $714.6 million and $705.5 million in 2016, 2015 and 2014, respectively, and included discontinued operations associated with cash flows from Alagasco of $91.5 million in 2014. Net income in 2016 was impacted overall by the decreased price environment and lower production volumes (including the impact of asset sales). Also affecting net income were certain non-cash charges including DD&A, asset impairment charges, deferred income taxes and the change in derivative fair value . The gain on sale of assets totaled $246.4 million. During 2015, net income was impacted by non-cash charges, including asset impairment charges, deferred income taxes and the change in derivative fair value. During 2015, operating cash flows were impacted by significantly lower commodity prices. During 2014, operating cash flows decreased due to lower oil and natural gas liquids commodity prices partially offset by increased production and higher natural gas commodity prices. Net income in 2014 was also significantly impacted by non-cash charges, including higher DD&A, asset impairment charges and the change in derivative fair value. The Company’s working capital needs were also influenced by accrued taxes and the timing of payments and recoveries for all years and included pension contributions associated with our non-qualified supplemental retirement plans of $14.6 during 2016.
35
Net cash used in investing activities: Energen made net investments of $66.1 million during 2016. Energen invested $147.9 million on a cash basis in property acquisitions including approximately $143.8 million of unproved leaseholds; $89.1 million for development costs including approximately $77 million to drill 21 net development and service wells; $344.1 million for exploration including approximately $257 million to drill 53 net exploratory wells. Included in the proceeds from asset sales in 2016 are cash proceeds of $528.1 million from the series of asset sales of certain non-core Permian Basin assets in the Delaware Basin and in the San Juan Basin. During 2015, the Company made net investments of $847.3 million. Energen invested $87.4 million in property acquisitions including approximately $85.5 million of unproved leaseholds; $386.4 million for development costs (includes the reversal of approximately $17.2 million of accrued development cost) including approximately $139 million to drill 63 net development and service wells; and $753.1 million for exploration (includes the reversal of approximately $111.1 million of accrued exploration cost) including approximately $492 million to drill 100 net exploratory wells. Included in the proceeds from asset sales in 2015 are cash proceeds of $384 million from the sale of certain San Juan Basin assets and $8.6 million from the sale of Alagasco. During 2014, the Company made net investments of $38.9 million. Energen invested $70.7 million in property acquisitions including approximately $68.5 million of unproved leaseholds; $399.1 million for development costs (excludes the accrual of approximately $4.6 million of accrued development cost) including approximately $270 million to drill 102 net development and service wells; and $844.1 million for exploration (excludes the accrual of approximately $109.3 million of accrued exploration cost) including approximately $703 million to drill 110 net exploratory wells. Included in the proceeds from asset sales and the sale of Alagasco in 2014 are cash proceeds of $1,317.1 million from the sale of Alagasco and $30 million from the sale of North Louisiana/East Texas properties.
During 2016, Energen added 64 MMBOE of proved reserves from discoveries and other additions, primarily the result of exploratory and development drilling that increased the number of proved undeveloped locations in the Permian Basin. Energen added approximately 133 MMBOE and 130 MMBOE of proved reserves in 2015 and 2014, respectively.
Net cash provided by (used in) financing activities: The Company provided $158.5 million for net financing activities in 2016 primarily due to the issuance of 18,170,000 shares of common stock largely offset by the repayment of credit facility borrowings. The Company provided $132.1 million for net financing activities in 2015 primarily due to the issuance of 5,700,000 shares of common stock largely offset by the repayment of credit facility borrowings. In 2014, the Company used $670.3 million for net financing activities largely due to the repayment of $600 million Senior Term Loans, discontinued operations primarily related to the sale of Alagasco and the purchase and retirement of shares. For each of the years, net cash provided by (used in) financing activities reflected cash received from the issuance of common stock through the Company’s stock-based compensation plan. During 2015 and 2014, net cash provided by (used in) financing activities also reflected dividends paid to common shareholders.
Capital Expenditures
Capital spending at Energen is detailed below.
Years ended December 31, (in thousands) | 2016 | 2015 | 2014 | ||||||
Property acquisitions | $ | 147,733 | $ | 87,556 | $ | 71,096 | |||
Development | 89,101 | 370,331 | 406,597 | ||||||
Exploration | 344,061 | 641,983 | 953,409 | ||||||
Other | 2,003 | 14,938 | 20,849 | ||||||
Total | 582,898 | 1,114,808 | 1,451,951 | ||||||
Less exploration expenditures charged to income | 4,818 | 74,198 | 79,441 | ||||||
Net capital expenditures | $ | 578,080 | $ | 1,040,610 | $ | 1,372,510 | |||
Energen completed an estimated $143.7 million in various purchases, leases and renewals of unproved leasehold largely in the Permian Basin, including approximately $77 million of acreage leased from the Bureau of Land Management in Lea County, New Mexico, during 2016. The Lea County, New Mexico lease is currently under administrative review pending final issuance of the acreage to Energen. Energen currently expects the review to be completed within 12 to 24 months.
36
FUTURE CAPITAL RESOURCES AND LIQUIDITY
Outlook
Realized commodity prices and production levels by commodity type are the two primary drivers of our liquidity. Historically, prices received for oil, natural gas liquids and natural gas production have been volatile because of supply and demand factors, general economic conditions and seasonal weather patterns. Crude oil prices also are affected by quality differentials, worldwide political developments and actions of the Organization of the Petroleum Exporting Countries. Basis differentials, like the underlying commodity prices, can be volatile because of regional supply and demand factors, including seasonal variations and the availability and price of transportation to consuming areas.
We engage in derivative risk management activities in order to reduce the risk associated with commodity price fluctuations. Commodity hedges in place for 2017 will help mitigate some of the commodity price volatility. See Item 7A, Quantitative and Qualitative Disclosures about Market Risk, for a full detail of our hedged volumes.
Production from the liquids rich Permian Basin in 2017 is estimated to be 24 MMBOE, including approximately 16.9 MMBOE of estimated production from proved reserves owned at December 31, 2016. Production estimates do not include amounts related to potential future acquisitions. In the event Energen is unable to fully invest in its capital investment opportunities, future operating revenues, production and proved reserves could be negatively affected.
Production volumes by commodity are expected to be as follows:
Year ended December 31, (MMBOE) | 2017 |
Oil | 15.6 |
Natural gas liquids | 4.1 |
Natural gas | 4.3 |
Total | 24.0 |
During 2017, Energen expects an annualized decline rate of approximately 25 percent for its proved developed producing properties owned at December 31, 2016. During the same period, total production from proved properties is expected to decrease approximately 15.5 percent and total production from all properties owned at December 31, 2016 is expected to increase approximately 20 percent. The above proved developed producing properties decline rate is not necessarily indicative of Energen’s expectations for its terminal decline rate on a long-term basis.
Various factors influence decline rates. For example, certain properties may have production curves that decline at faster rates in the early years of production and at slower rates in later years. Accordingly, the decline rate for a single year is influenced by numerous factors, including but not limited to, the mix of types of wells, the mix of newer versus older wells, and the effect of enhanced recovery activities, but it is not necessarily indicative of future decline rates. Energen expects a compound annual decline rate for proved developed producing properties owned at December 31, 2016 for the 5 year period 2016 to 2021, for the 10 year period 2016 to 2026 and for the 20 year period 2016 to 2036 of approximately 16.3 percent, 12.2 percent and 9.5 percent, respectively.
Revenues and related accounts receivable from oil and natural gas operations primarily are generated from the sale of produced oil, natural gas liquids and natural gas to energy marketing companies. Such sales are typically made on an unsecured credit basis with payment due the month following delivery. This concentration of sales to the energy marketing industry has the potential to affect Energen’s overall exposure to credit risk, either positively or negatively, in that our oil and natural gas purchasers may be affected similarly by changes in economic, industry or other conditions. Energen considers the credit quality of its customers and, in certain instances, may require credit assurances such as a deposit, letter of credit or parent guarantee.
Energen plans to continue investing capital in oil and natural gas production operations. For 2017, we expect our oil and natural gas capital spending to total approximately $840 million, including approximately $127 million for the development of previously identified proved undeveloped reserves. Included in the above estimate are acquisitions in the Delaware Basin of approximately $32 million for unproved leasehold acreage and $18 million for net mineral acres purchases. Capital spending is required to offset declines in production and proved oil and natural gas reserves. Future success in maintaining and growing reserves and production is highly dependent on the results of our drilling program and our ability to add reserves economically during a challenging market for crude oil and natural gas.
37
Capital expenditures in the Permian Basin by area during 2017 are planned as follows:
Year ended December 31, (in thousands) | 2017 | ||
Midland Basin | $ | 440,000 | |
Delaware Basin | 345,000 | ||
Central Basin and ARO | 5,000 | ||
Acquisitions/Unproved Leasehold | 50,000 | ||
Total | $ | 840,000 | |
Energen anticipates drilling and/or completing the following operated net wells by area during 2017.
Midland Basin | Delaware Basin | Total | |
Drilled but uncompleted wells as of December 31, 2016 (to be completed in 2017) | 43 | 17 | 60 |
Wells drilled and completed during 2017 | 31 | 22 | 53 |
Drilled but uncompleted wells as of December 31, 2017 | 23 | 7 | 30 |
The wells above include 3 vertical wells to be drilled and completed during 2017 and 3 drilled but uncompleted vertical wells as of December 31, 2017, all in the Midland Basin. Energen expects to use our 6 to 7 operated drilling rigs during 2017 to drill these wells.
Energen also may allocate additional capital for other oil and natural gas activities such as property acquisitions and additional development of existing properties. Energen may evaluate acquisition opportunities which arise in the marketplace. Energen’s ability to invest in property acquisitions is subject to market conditions and industry trends. Property acquisitions, except as discussed above, are not included in the aforementioned estimate of oil and natural gas investments and could result in capital expenditures different from those outlined above.
Credit Facility and Working Capital
At December 31, 2016, we had $386.1 million of cash on hand and $1.05 billion of committed financing available under our credit facility. On September 2, 2014, Energen entered into a five-year syndicated secured credit facility with domestic and foreign lenders. On April 13, 2016, our committed financing available under our credit facility was reduced to $1.05 billion in conjunction with our scheduled semi-annual redetermination. On October 25, 2016, the borrowing base was reaffirmed with no changes. To finance our operations, working capital and capital spending, we expect to use cash on hand and internally generated cash flow from operations supplemented, if necessary, by our existing five-year syndicated credit facility. As discussed in Note 15, Acquisition and Disposition of Properties, Energen completed a series of asset sales of certain non-core Permian Basin assets in the Delaware Basin in Texas and in the San Juan Basin in New Mexico for an aggregate purchase price of $552 million.
Access to capital is an integral part of Energen’s business plan. As discussed in Note 6, Equity Offering, during the first quarter of 2016, Energen issued 18,170,000 additional shares of common stock and received net proceeds of approximately $381.1 million, after deducting offering expenses. Energen may also issue long-term debt and equity periodically to replace short-term obligations, enhance liquidity and provide for permanent financing. As of December 31, 2016, the Company has no outstanding amounts under its revolving credit facility. While we expect to have ongoing access to our credit facility and capital markets, continued access could be adversely affected by current and future economic and business conditions and possible credit rating downgrades.
Our debt facilities are subject to certain financial and non-financial covenants as discussed in Note 3, Long Term Debt, in the Notes to Financial Statements. The financial covenants of the credit facility require Energen to maintain a ratio of total debt to consolidated income before interest expense, income taxes, depreciation, depletion, amortization, exploration expense and other noncash income and expenses (EBITDAX) less than or equal to 4.0 to 1.0. As of December 31, 2016, we were in compliance with our covenants and expect to maintain compliance during 2017. However, in future periods, factors including those outside of our control may prevent us from maintaining compliance with the financial and non-financial covenants, including our total debt to EBITDAX covenant. Such factors may include commodity price declines, lack of liquidity in property and capital markets and our continuing ability to execute on our business plan. The borrowing base on our credit facility is scheduled to be redetermined in April and October of 2017. In the event that we are unable to remain in compliance with our financial and non-financial covenants, we would seek covenant relief at a scheduled redetermination date or at an interim date, as appropriate. However, no assurances
38
can be given with respect to such relief. If any such covenant violations are not waived by the lenders such violation would result in an event of default that could trigger acceleration of payment of the amounts outstanding under our credit facility and long term note agreements. Additionally, the lenders could refuse to make additional loans under the credit facility, take possession of any collateral, and exercise other remedies or rights that may be available to them, all of which could have a material adverse effect on the business and financial condition of the Company.
Energen’s obligations under the syndicated credit facility are unconditionally guaranteed by Energen Resources. The financial covenants of the credit facility require Energen to maintain a ratio of total debt to EBITDAX less than or equal to 4.0 to 1.0; to maintain a ratio of consolidated current assets (adjusted to include amounts available for borrowings and exclude non-cash derivative instruments) to consolidated current liabilities (adjusted to exclude maturities under the credit facility and non-cash derivative instruments) greater than or equal to 1.0 to 1.0; and, during certain periods, to maintain a ratio of the net present value of proved reserves of our oil and natural gas properties to consolidated total debt greater than or equal to 1.50 to 1.0. We are also bound by covenants which limit our ability to incur additional indebtedness, make certain distributions or alter our corporate structure. Energen may not pay dividends during an event of default, if the payment would result in an event of default or if availability is less than 10 percent of the loan limit under the credit facility. Our credit facility also limits our ability to enter into commodity hedges based on projected production volumes. In addition, the terms of our credit facility limit the amount we can borrow to a borrowing base amount which is determined by our lenders in their sole discretion based on their valuation of our proved reserves and their internal criteria including commodity price outlook. The borrowing base amount is subject to redetermination semi-annually and for event-driven unscheduled redeterminations. Our next scheduled redetermination is April 1, 2017.
At December 31, 2016, Energen reported unadjusted working capital of $167.7 million arising from current assets of $505.9 million exceeding current liabilities of $338.2 million. Working capital at Energen is largely influenced by cash on hand arising from proceeds from asset sales and our first quarter equity offering partially offset by the fair value of derivative financial instruments associated with future production. Energen has $0.1 million in current assets and $65.5 million in current liabilities associated with its derivative financial instruments at December 31, 2016.
Workforce Reduction
On January 22, 2016 and March 18, 2016, we reduced our workforce as part of an overall plan to reduce costs and better align our workforce with the needs of our business in light of current oil and natural gas commodity prices. In connection with the reductions, we incurred charges of approximately $5.0 million during 2016 for one-time termination benefits which are included in general and administrative expense on the consolidated income statement.
Credit Ratings
On July 29, 2016, Moody’s Investors Service raised Energen’s Corporate Family rating from B1 to Ba3 with a stable outlook. Moody’s Senior Unsecured Medium-Term Notes and Senior Unsecured Bond ratings were raised from B3 to B2 with a stable outlook. On February 9, 2016, Standard and Poor’s affirmed its Corporate credit rating for Energen at BB with a stable outlook.
Equity Offering and Shares Issued
During the first quarter of 2016, Energen issued 18,170,000 additional shares of common stock through a public equity offering. We received net proceeds of approximately $381.1 million, after deducting offering expenses. During the second quarter of 2015, Energen issued 5,700,000 additional shares of common stock through a public equity offering. We received net proceeds of approximately $398.6 million, after deducting offering expenses. Net proceeds from these offerings were used to repay borrowings under our credit facility and for general corporate purposes.
(in thousands) | December 31, 2016 | December 31, 2015 | ||
Shares outstanding | 97,075 | 78,795 | ||
Treasury stock* | 3,064 | 2,976 | ||
Shares issued | 100,139 | 81,771 | ||
*Excludes 61,845 shares and 50,800 shares held in the 1997 Deferred Compensation Plan at December 31, 2016 and 2015, respectively.
Dividends
In February 2016, we announced the discontinuance of dividend payments. Accordingly, we do not expect to pay cash dividends on Energen common stock in 2017. The amount and timing of all dividend payments is subject to the discretion of the Board of Directors and is based upon business conditions, results of operations, financial conditions and other factors.
39
Employee Benefit Plans
In October 2014, Energen’s Board of Directors elected to freeze and terminate its qualified defined benefit pension plan. A plan amendment adopted in October 2014 closed the plan to new entrants, effective November 1, 2014, and froze benefit accruals effective December 31, 2014. Energen terminated the plan on January 31, 2015 and distributed benefits in December 2015. The Pension Benefit Guaranty Corporation (PBGC) is conducting an audit of the termination of the pension plan to ensure that Energen properly calculated and distributed benefits in accordance with plan provisions and in compliance with the appropriate laws and regulations administered by the PBGC.
Energen’s non-qualified supplemental retirement plans were terminated effective December 31, 2014. Distributions under the plans were made in the first quarters of 2016 and 2015.
Stock Repurchase Authorization
From time to time, the Company may repurchase shares of its common stock through open market or negotiated purchases. Such repurchases would be pursuant to a 3,600,000 share repurchase authorization approved by the Board of Directors on October 22, 2014. There were no shares repurchased pursuant to its repurchase authorization for the years ended December 31, 2016 and 2015. For the year ended December 31, 2014, Energen repurchased and retired 226,839 shares for $14.9 million pursuant to our repurchase authorization. As of December 31, 2016, a total of 3,373,161 shares remain authorized for future repurchase. The timing and amounts of any repurchases are subject to changes in market conditions and other business considerations. Energen also from time to time acquires shares in connection with participant elections under Energen’s stock compensation plans. For the years ended December 31, 2016, 2015 and 2014, Energen acquired 88,320 shares, 73,126 shares and 32,768 shares, respectively, in connection with its stock compensation plans.
Contractual Cash Obligations and Other Commitments
In the course of ordinary business activities, Energen enters into a variety of contractual cash obligations and other commitments. The following table summarizes Energen’s significant contractual cash obligations, other than hedging contracts, as of December 31, 2016:
Payments Due Before December 31, | |||||||||||||||
(in thousands) | Total | 2017 | 2018-2019 | 2020-2021 | 2022 and Thereafter | ||||||||||
Long-term debt (1) | $ | 554,000 | $ | 24,000 | $ | — | $ | 400,000 | $ | 130,000 | |||||
Interest payments on debt | 182,941 | 29,075 | 55,732 | 49,543 | 48,591 | ||||||||||
Operating leases | 8,884 | 3,822 | 5,062 | — | — | ||||||||||
Asset retirement obligations (2) | 490,531 | 2,535 | 6,869 | 6,147 | 474,980 | ||||||||||
Total contractual cash obligations | $ | 1,236,356 | $ | 59,432 | $ | 67,663 | $ | 455,690 | $ | 653,571 | |||||
(1) Long-term debt obligations include approximately $0.4 million of unamortized debt discounts as of December 31, 2016.
(2) Represents the estimated future asset retirement obligation on an undiscounted basis.
Energen operates in certain instances through joint ventures under joint operating agreements. Typically, the operator under a joint operating agreement enters into contracts, such as drilling contracts, for the benefit of all joint venture partners. Through the joint operating agreement, the non-operators reimburse, and in some cases advance, the funds necessary to meet the contractual obligations entered into by the operator. These obligations are typically shared on a working interest basis as defined in the joint operating contractual agreement.
Under various agreements for third-party gathering, treatment, transportation or other services, Energen is committed to deliver minimum production volumes or to pay certain costs in the event the minimum quantities are not delivered. These delivery commitments are approximately 4.2 MMBOE through October 2020.
The contractual obligations reported above exclude Energen’s liability of $14.2 million related to Energen’s provision for uncertain tax positions. Energen cannot make a reasonably reliable estimate of the amount and period of related future payments for such liability.
In 2011, Energen Resources received an Order to Perform Restructured Accounting and Pay Additional Royalties (the Order), following an audit performed by the Taxation and Revenue Department (the Department) of the State of New Mexico on behalf
40
of the Office of Natural Resources Revenue (ONRR), of federal oil and gas leases in New Mexico. The audit covered periods from January 2004 through December 2008 and included a review of the computation and payment of royalties due on minerals removed from specified U.S. federal leases. The Order addressed ONRR’s efforts to change accounting and reporting practices, and to unbundle fees charged by third parties that gather, compress and transport natural gas production. ONRR now maintains that all or some of such fees are not deductible.
Energen Resources appealed the Order in 2011 and in July 2012, on a motion from ONRR, the Order was remanded. In August 2014, ONRR issued its Revised Order and Energen Resources appealed the Revised Order. In the Revised Order, ONRR ordered that Energen pay additional royalties on production from certain federal leases in the amount of $129,700. At ONRR’s request the Revised Order was also remanded in August 2015. On April 15, 2016 ONRR issued its Second Revised Order. The Second Revised Order directs Energen Resources to pay additional royalties of $189,000, replacing the previous demand of $129,700. Energen had previously estimated that application of the ONRR position to all of the Company’s federal leases would result in ONRR claims up to approximately $24 million, plus interest and penalties from 2004 forward. ONRR began implementing its unbundling initiative in 2010, but seeks to implement its revisions retroactively, despite the fact that they conflict with previous audits, allowances and industry practice. Energen plans to appeal and vigorously contest the Second Revised Order, the predecessor orders and the findings. Management is unable, at this time, to determine a range of reasonably possible losses, and no amount has been accrued as of December 31, 2016.
Derivative Commodity Instruments
We periodically enter into derivative commodity instruments to hedge our exposure to price fluctuations on oil, natural gas liquids and natural gas production. Such instruments may include over-the-counter (OTC) swaps, options and basis swaps typically executed with investment and commercial banks and energy-trading firms.
Due to the volatility of commodity prices, the estimated fair value of our derivative instruments is subject to fluctuation from period to period, which could result in significant differences between the current estimated fair value and the ultimate settlement price. Additionally, Energen is at risk of economic loss based upon the creditworthiness of our counterparties. We were in a net loss position with fifteen of our active counterparties and in a gain position with the remaining one at December 31, 2016. Energen has policies in place to limit hedging to not more than 80 percent of our estimated annual production; however, Energen’s credit facility contains a covenant which operates to limit hedging at a lower threshold in certain circumstances.
Energen has prepared a sensitivity analysis to evaluate the hypothetical effect that changes in the market value of crude oil, natural gas liquids and natural gas may have on the fair value of its derivative instruments. This analysis measured the impact on the commodity derivative instruments and, thereby, did not consider the underlying exposure related to the commodity. At December 31, 2016, Energen was in a net loss position of $68.4 million for derivative contracts and estimates that a 10 percent increase in the commodities prices would have resulted in an approximate $66.9 million change in the fair value of open derivative contracts and that a 10 percent decrease in the would have resulted in an approximate $59.5 million change in the fair value of open derivative contracts; however, gains and losses on derivative contracts are expected to be similarly offset by sales at the spot market price. The hypothetical change in fair value was calculated by multiplying the difference between the hypothetical price and the contractual price by the contractual volumes and did not include the impact of related taxes on actual cash prices.
All derivatives are recognized at fair value under the fair value hierarchy as discussed in Note 2, Summary of Significant Accounting Policies, in the Notes to Financial Statements. Level 3 liabilities as of December 31, 2016 represent an immaterial amount of both total assets and liabilities. Changes in fair value primarily result from price changes in the underlying commodity. Energen has prepared a sensitivity analysis to evaluate the hypothetical effect that changes in the prices used to estimate fair value would have on the fair value of its Level 3 instruments. We estimate that a 10 percent increase or decrease in commodity prices would result in an approximate $4.4 million change in the fair value of open Level 3 derivative contracts and to the results of operations.
In July 2010, the Dodd-Frank Wall Street Reform and Consumer Protection Act (Dodd-Frank Act) was signed into law. Title VII of the Dodd-Frank Act establishes federal oversight and regulation of the over-the-counter derivatives markets and participants in such markets. The Commodities Futures Trading Commission (CFTC) and the SEC have adopted, or are in the process of adopting, rules and regulations covering, among other derivative transactions, transactions linked to crude oil and natural gas prices. We believe Energen’s derivative transactions qualify for the end-user exception which exempts them from certain Dodd-Frank Act swap clearing and exchange-trading requirements pursuant to final regulations adopted by the CFTC and SEC. However, the Dodd-Frank Act also authorized the CFTC to set position limits for certain futures and options contracts in the major energy markets and for swaps that are their economic equivalents. The CFTC’s initial regulations on position limits were vacated by the U.S. District Court for the District of Columbia in 2012, and the CFTC subsequently proposed new position limits in November 2013. The CFTC reproposed position limit regulations on December 5, 2016, and the final rules have not yet been adopted. The full impact of the Dodd-Frank Act and related regulatory requirements on Energen will not be known until the regulations have been fully implemented and the derivative markets have adjusted to such regulations. Energen could experience increased costs
41
and reduced liquidity in the markets as a result of these rules and regulations governing derivatives, which could reduce hedging opportunities and negatively affect our revenues and cash flows.
CRITICAL ACCOUNTING POLICIES AND ESTIMATES
Energen’s consolidated financial statements are prepared in accordance with accounting principles generally accepted in the United States of America. Management has identified the following critical accounting policies in the application of existing accounting standards or in the implementation of new standards that involve significant judgments and estimates by Energen. The application of these accounting policies necessarily requires management’s most subjective or complex judgments regarding estimates and projected outcomes of future events that could have a material impact on the financial statements.
Accounting for Oil and Natural Gas Producing Activities and Related Proved Reserves: Energen utilizes the successful efforts method of accounting for its oil and natural gas producing activities. Acquisition and development costs of proved properties are capitalized and amortized on a units-of-production basis over the remaining life of total proved and proved developed reserves. Proved oil and natural gas reserves are the estimated quantities of crude oil, natural gas liquids and natural gas that geological and engineering data demonstrate with reasonable certainty to be recoverable in future years from known reservoirs under existing economic and operating conditions. The technologies associated with these proved reserve estimates are analysis of well production data, geophysical data, wireline and core data. Accordingly, these estimates do not include probable or possible reserves. Estimated oil and gas proved reserves are based on currently available reservoir data and are subject to future revision. Estimates of physical quantities of oil and natural gas proved reserves have been determined by Company engineers. Independent oil and natural gas reservoir engineers have audited the estimates of proved reserves of crude oil, natural gas liquids and natural gas attributed to Energen’s net interests in oil and natural gas properties as of December 31, 2016. The independent reservoir engineers have issued reports covering approximately 99 percent of the Company’s ending proved reserves and in their judgment these estimates were reasonable in the aggregate. Energen’s production of proved undeveloped reserves requires the drilling of development wells and the installation or completion of related infrastructure facilities.
Changes in oil and natural gas prices, operating costs and expected performance from the properties can result in a revision to the amount of estimated proved reserves held by Energen. If proved reserves are revised upward, earnings could be affected due to lower depreciation and depletion expense per unit of production. Likewise, if proved reserves are revised downward, earnings could be affected due to higher depreciation and depletion expense or due to an immediate writedown of the property’s book value if an impairment is warranted.
The table below reflects an estimated increase in 2017 depreciation, depletion and amortization expense associated with an assumed downward revision in the reported oil and natural gas reserve amounts at December 31, 2016:
Percentage Change in Proved Oil & Natural Gas Reserves From Reported Reserves December 31, 2016 | ||||||
(dollars in thousands) | -5% | -10% | ||||
Estimated increase in DD&A expense for the year ended December 31, 2017, net of tax | $ | 11,415 | $ | 23,912 | ||
Exploratory drilling costs are capitalized pending determination of proved reserves. If proved reserves are not discovered, the exploratory drilling costs are expensed. Other exploration costs, including geological and geophysical costs, are expensed as incurred.
Asset Impairments: Oil and natural gas proved properties periodically are assessed for possible impairment on a field-by-field basis using the estimated undiscounted future cash flows. Impairment losses are recognized when the estimated undiscounted future cash flows are less than the current net book values of the properties in a field. We monitor the business environment and our oil and natural gas properties for events that could result in a potential impairment. Further, we make assumptions about future expectations in our evaluation of potential impairment. Such assumptions include, but are not necessarily limited to, commodity prices and related basis differentials, transportation costs, inflation assumptions, well and reservoir performance, severance and ad valorem taxes, other operating and future development costs, and general business plans. Cash flow and fair value estimates require Energen to make projections and assumptions for pricing, demand, competition, operating costs, legal and regulatory issues, discount rates and other factors for many years into the future. These variables can, and often do, differ from the estimates and can have a positive or negative impact on our need for impairment or on the amount of impairment. In addition, further changes in the economic and business environment can impact Energen’s original and ongoing assessments of potential impairment.
42
Our commodity price assumption is a significant and volatile uncertainty in our estimate, and we are unable to reliably forecast future commodity prices. Our assumption is therefore based on the commodity price curve for the next five years and then escalated at 3 percent through our assumed price caps. Our other assumptions generally have less volatility than the price assumption with variances tending to be field specific and more localized in effect. However, these assumptions can also be impacted by a higher or lower inflationary environment, limitations on takeaway capacity, well and reservoir performance over time, changes to governmental taxation, or changes to cost assumptions, operational and development plans, or the general economic or business environment.
If a material event occurs, we make an estimate of undiscounted future cash flows to determine whether the asset is impaired. If the asset is impaired, we will record an impairment loss for the difference between the net book value of the properties and the fair value of the properties. The fair value of the properties typically is estimated using discounted cash flows.
We may also recognize impairments of capitalized costs for unproved properties. The greatest portion of these costs generally relate to the acquisition of leasehold. The costs are capitalized and periodically evaluated as to recoverability, based on changes brought about by exploration activities, changes in economic factors and potential shifts in business strategy employed by management. We consider a combination of geologic and economic factors to evaluate the need for impairment of these costs.
Certain impairments were recognized during the first quarter of 2016 as discussed under Asset Impairment in our Results of Operations. We estimate a further decline in our price assumptions by 10 percent from December 31, 2016 prices (assuming all other assumptions are held constant) would result in immaterial expense. Other assumptions such as operating costs, transportation costs, well and reservoir performance, severance tax rates and ad valorem taxes, operating and development plans may also change given an assumed 10 percent commodity price decline. However, we are unable to estimate their correlation to the price change and these other assumptions may worsen or partially mitigate some of the estimated impairment.
Derivatives: Energen periodically enters into derivative commodity instruments to manage its exposure to oil, natural gas liquids and natural gas price volatility. We enter into derivative transactions that are accounted for as mark-to-market transactions with gains and losses reported in gain (loss) on derivative instruments, net. Energen does not enter into derivatives or other financial instruments for trading purposes. The use of derivative contracts to mitigate price risk may cause the Company’s financial position, results of operations and cash flow to be materially different from results that would have been obtained had such risk mitigation activities not occurred.
Asset Retirement Obligation: Energen records the fair value of a liability for an asset retirement obligation in the period in which it is incurred. Subsequent to initial measurement, liabilities are required to be accreted to their present value each period and capitalized costs are depreciated over the estimated useful life of the related assets. Upon settlement of the liability, Energen will settle the obligation for its recorded amount and recognize the resulting gain or loss. Energen has an obligation to remove tangible equipment and restore land at the end of oil and natural gas production operations. The estimate of future restoration and removal costs includes numerous assumptions and uncertainties, including but not limited to, inflation factors, discount rates, timing of settlement, and changes in contractual, regulatory, political, environmental, safety and public relations considerations.
RECENT PRONOUNCEMENTS OF THE FINANCIAL ACCOUNTING STANDARDS BOARD
See Note 19, Recently Issued Accounting Standards, in the Notes to Financial Statements for information regarding recently issued accounting standards.
43
ITEM 7A. QUANTITATIVE AND QUALITATIVE DISCLOSURES ABOUT MARKET RISK
The information below should be read in conjunction with the related disclosures in Item 7, Management’s Discussion and Analysis of Financial Condition and Results of Operations under the heading “Outlook” and in Note 7, Derivative Commodity Instruments, and in Note 8, Fair Value Measurements, in the Notes to Financial Statements.
We are exposed to various market risks including commodity price risk, counterparty credit risk and interest rate risk. We seek to manage these risks through our risk management program which often includes the use of derivative instruments. We do not enter into derivative or other financial instruments for speculative or trading purposes.
Commodity price risk: Energen’s major market risk exposure is in the pricing applicable to its oil and natural gas production. Historically, prices received for oil, natural gas liquids and natural gas production have been volatile due to world and national supply-and-demand factors, seasonal weather patterns and general economic conditions. Crude oil prices also are affected by quality differentials, by worldwide political developments and by actions of the Organization of the Petroleum Exporting Countries. Basis differentials, like the underlying commodity prices, can be volatile because of regional supply-and-demand factors, including seasonal factors and the availability and price of transportation to consuming areas. As impacted by such commodity price volatility during 2016, our average realized oil prices fell 12.5 percent to $39.43 per barrel, average realized natural gas liquids prices rose 3.4 percent to an average price of $0.30 per gallon and average realized natural gas prices decreased 18.1 percent to $1.90 per Mcf.
We periodically enter into derivative commodity instruments to hedge our exposure to price fluctuations on oil, natural gas liquids and natural gas production. Such instruments may include over-the-counter swaps and basis swaps typically executed with investment and commercial banks and energy-trading firms.
As of December 31, 2016 (except as noted), Energen entered into the following transactions for 2017 and subsequent years:
Production Period | Description | Total Hedged Volumes | Average Contract Price | Fair Value (in thousands) | |||
Oil | |||||||
2017 | NYMEX Swaps | 6,060 | MBbl | $49.77 Bbl | $ | (40,196 | ) |
NYMEX Three-Way Collars | 4,800 | MBbl | (5,207 | ) | |||
Ceiling sold price (call) | $62.18 Bbl | ||||||
Floor purchased price (put) | $45.00 Bbl | ||||||
Floor sold price (put) | $35.00 Bbl | ||||||
2018 | NYMEX Three-Way Collars | 3,240 | MBbl | (1,694 | ) | ||
Ceiling sold price (call) | $65.03 Bbl | ||||||
Floor purchased price (put) | $50.00 Bbl | ||||||
Floor sold price (put) | $40.00 Bbl | ||||||
NYMEX Three-Way Collars | 2,340 | MBbl | * | ||||
Ceiling sold price (call) | $65.38 Bbl | ||||||
Floor purchased price (put) | $50.00 Bbl | ||||||
Floor sold price (put) | $40.00 Bbl | ||||||
Oil Basis Differential | |||||||
2017 | WTI/WTI Basis Swaps | 7,890 MBbl | $(0.58) Bbl | (1,984 | ) | ||
WTI/WTI Basis Swaps | 1,230 MBbl | $(0.94) Bbl | * | ||||
Natural Gas Liquids | |||||||
2017 | Liquids Swaps | 45.4 | MMGal | $0.52 Gal | (5,556 | ) | |
34.7 | MMGal | $0.64 Gal | * | ||||
2018 | Liquids Swaps | 30.2 | MMGal | $0.60 Gal | (1,312 | ) | |
Natural Gas | |||||||
2017 | Basin Specific Swaps - Permian | 14.7 | Bcf | $2.85 Mcf | (6,900 | ) | |
44
2017 | NYMEX Swaps | 0.9 | Bcf | $3.29 Mcf | (265 | ) | |
Natural Gas Basis Differential | |||||||
2017 | Permian Swaps | 0.9 | Bcf | $(0.29) Mcf | (9 | ) | |
Derivative contracts (closed but not cash settled) | (5,300 | ) | |||||
Total | $ | (68,423 | ) | ||||
WTI - West Texas Intermediate/Midland, WTI - West Texas Intermediate/Cushing | |||||||
*Contracts entered into subsequent to December 31, 2016 | |||||||
Realized prices are anticipated to be lower than New York Mercantile Exchange prices primarily due to basis differences and other factors.
Counterparty credit risk: Our principal exposure to credit risk is through the sale of our oil, natural gas liquids and natural gas production, which we market to energy marketing companies. Such sales are typically made on an unsecured credit basis with payment due the month following delivery. This concentration of sales to the energy marketing industry has the potential to affect our overall exposure to credit risk. We consider the credit quality of our purchasers and, in certain instances, may require credit assurances such as a deposit, letter of credit or parent guarantee.
We are also at risk for economic loss based upon the credit worthiness of our derivative instrument counterparties. The counterparties to the commodity instruments are investment banks and energy-trading firms and are believed to be creditworthy by Energen. All hedge transactions are subject to Energen’s risk management policy, approved by the Board of Directors, which does not permit speculative positions. Energen formally documents all relationships between hedging instruments and hedged items at the inception of the hedge, as well as its risk management objective and strategy for undertaking the hedge.
Interest rate risk: Our interest rate exposure as of December 31, 2016 primarily relates to our syndicated credit facility with variable interest rates. There was no outstanding credit facility balance as of December 31, 2016. All long-term debt obligations, other than our credit facility, were at fixed rates at December 31, 2016.
45
ITEM 8. | FINANCIAL STATEMENTS AND SUPPLEMENTARY DATA |
ENERGEN CORPORATION
INDEX TO FINANCIAL STATEMENTS
Page | ||
1. | Financial Statements | |
Report of Independent Registered Public Accounting Firm | ||
Consolidated Balance Sheets as of December 31, 2016 and 2015 | ||
Consolidated Statements of Income for the years ended December 31, 2016, 2015 and 2014 | ||
Consolidated Statements of Comprehensive Income for the years ended December 31, 2016, 2015 and 2014 | ||
Consolidated Statements of Shareholders’ Equity for the years ended December 31, 2016, 2015 and 2014 | ||
Consolidated Statements of Cash Flows for the years ended December 31, 2016, 2015 and 2014 | ||
Notes to Financial Statements | ||
Schedules other than those listed above are omitted because they are not required, not applicable, or the required information is shown in the financial statements or notes thereto.
46
REPORT OF INDEPENDENT REGISTERED PUBLIC ACCOUNTING FIRM
To the Board of Directors and Shareholders of Energen Corporation:
In our opinion, the consolidated financial statements listed in the accompanying index present fairly, in all material respects, the financial position of Energen Corporation and its subsidiaries at December 31, 2016 and 2015, and the results of their operations and their cash flows for each of the three years in the period ended December 31, 2016 in conformity with accounting principles generally accepted in the United States of America. Also in our opinion, the Company maintained, in all material respects, effective internal control over financial reporting as of December 31, 2016, based on criteria established in Internal Control - Integrated Framework (2013) issued by the Committee of Sponsoring Organizations of the Treadway Commission (COSO). The Company’s management is responsible for these financial statements, for maintaining effective internal control over financial reporting and for its assessment of the effectiveness of internal control over financial reporting, included in Management’s Report on Internal Control over Financial Reporting appearing under Item 9A. Our responsibility is to express opinions on these financial statements and on the Company’s internal control over financial reporting based on our integrated audits. We conducted our audits in accordance with the standards of the Public Company Accounting Oversight Board (United States). Those standards require that we plan and perform the audits to obtain reasonable assurance about whether the financial statements are free of material misstatement and whether effective internal control over financial reporting was maintained in all material respects. Our audits of the financial statements included examining, on a test basis, evidence supporting the amounts and disclosures in the financial statements, assessing the accounting principles used and significant estimates made by management, and evaluating the overall financial statement presentation. Our audit of internal control over financial reporting included obtaining an understanding of internal control over financial reporting, assessing the risk that a material weakness exists, and testing and evaluating the design and operating effectiveness of internal control based on the assessed risk. Our audits also included performing such other procedures as we considered necessary in the circumstances. We believe that our audits provide a reasonable basis for our opinions.
A company’s internal control over financial reporting is a process designed to provide reasonable assurance regarding the reliability of financial reporting and the preparation of financial statements for external purposes in accordance with generally accepted accounting principles. A company’s internal control over financial reporting includes those policies and procedures that (i) pertain to the maintenance of records that, in reasonable detail, accurately and fairly reflect the transactions and dispositions of the assets of the company; (ii) provide reasonable assurance that transactions are recorded as necessary to permit preparation of financial statements in accordance with generally accepted accounting principles, and that receipts and expenditures of the company are being made only in accordance with authorizations of management and directors of the company; and (iii) provide reasonable assurance regarding prevention or timely detection of unauthorized acquisition, use, or disposition of the company’s assets that could have a material effect on the financial statements.
Because of its inherent limitations, internal control over financial reporting may not prevent or detect misstatements. Also, projections of any evaluation of effectiveness to future periods are subject to the risk that controls may become inadequate because of changes in conditions, or that the degree of compliance with the policies or procedures may deteriorate.
/s/ PricewaterhouseCoopers LLP
Birmingham, Alabama
February 28, 2017
47
ENERGEN CORPORATION
CONSOLIDATED BALANCE SHEETS
(in thousands) | December 31, 2016 | December 31, 2015 | |||||
ASSETS | |||||||
Current Assets | |||||||
Cash and cash equivalents | $ | 386,093 | $ | 1,272 | |||
Accounts receivable, net | 73,322 | 63,097 | |||||
Inventories, net | 14,222 | 11,255 | |||||
Assets held for sale | — | 93,739 | |||||
Derivative instruments | 50 | 56,963 | |||||
Income tax receivable | 27,153 | 8,376 | |||||
Prepayments and other | 5,071 | 11,638 | |||||
Total current assets | 505,911 | 246,340 | |||||
Property, Plant and Equipment | |||||||
Oil and natural gas properties, successful efforts method | |||||||
Proved properties | 7,543,464 | 7,611,118 | |||||
Unproved properties | 196,888 | 145,724 | |||||
Less accumulated depreciation, depletion and amortization | 3,723,669 | 3,454,510 | |||||
Oil and natural gas properties, net | 4,016,683 | 4,302,332 | |||||
Other property and equipment, net | 44,869 | 48,358 | |||||
Total property, plant and equipment, net | 4,061,552 | 4,350,690 | |||||
Other postretirement assets | 3,619 | 3,881 | |||||
Other assets | 8,741 | 10,245 | |||||
TOTAL ASSETS | $ | 4,579,823 | $ | 4,611,156 | |||
The accompanying Notes to Financial Statements are an integral part of these statements.
48
ENERGEN CORPORATION
CONSOLIDATED BALANCE SHEETS
(in thousands, except share data) | December 31, 2016 | December 31, 2015 | |||||
LIABILITIES AND SHAREHOLDERS’ EQUITY | |||||||
Current Liabilities | |||||||
Long-term debt due within one year | $ | 24,000 | $ | — | |||
Accounts payable | 65,031 | 64,742 | |||||
Accrued taxes | 7,252 | 5,801 | |||||
Accrued wages and benefits | 25,089 | 28,563 | |||||
Accrued capital costs | 79,988 | 79,206 | |||||
Revenue and royalty payable | 51,217 | 60,493 | |||||
Liabilities related to assets held for sale | — | 12,789 | |||||
Pension liabilities | — | 15,685 | |||||
Derivative instruments | 65,467 | 459 | |||||
Other | 20,160 | 19,783 | |||||
Total current liabilities | 338,204 | 287,521 | |||||
Long-term debt | 527,443 | 773,550 | |||||
Asset retirement obligations | 81,544 | 89,990 | |||||
Noncurrent derivative instruments | 3,006 | — | |||||
Deferred income taxes | 495,888 | 552,369 | |||||
Other | 13,136 | 11,866 | |||||
Total liabilities | 1,459,221 | 1,715,296 | |||||
Commitments and Contingencies | |||||||
Shareholders’ Equity Preferred stock, cumulative, $0.01 par value, 5,000,000 shares authorized | — | — | |||||
Common shareholders’ equity | |||||||
Common stock, $0.01 par value; 150,000,000 shares authorized; 100,138,797 shares issued at December 31, 2016 and 81,770,161 shares issued at December 31, 2015 | 1,001 | 818 | |||||
Premium on capital stock | 1,372,569 | 979,030 | |||||
Retained earnings | 1,878,503 | 2,046,016 | |||||
Accumulated other comprehensive income (loss), net of tax | |||||||
Pension and postretirement plans | 1,405 | 263 | |||||
Deferred compensation plan | 2,261 | 1,965 | |||||
Treasury stock, at cost; 3,125,715 shares and 3,026,350 shares at December 31, 2016 and 2015, respectively | (135,137 | ) | (132,232 | ) | |||
Total shareholders’ equity | 3,120,602 | 2,895,860 | |||||
TOTAL LIABILITIES AND SHAREHOLDERS’ EQUITY | $ | 4,579,823 | $ | 4,611,156 | |||
The accompanying Notes to Financial Statements are an integral part of these statements.
49
ENERGEN CORPORATION
CONSOLIDATED STATEMENTS OF INCOME
Years ended December 31, (in thousands, except share data) | 2016 | 2015 | 2014 | ||||||
Revenues | |||||||||
Oil, natural gas liquids and natural gas sales | $ | 621,366 | $ | 763,261 | $ | 1,344,194 | |||
Gain (loss) on derivative instruments, net | (88,477 | ) | 115,293 | 335,019 | |||||
Total revenues | 532,889 | 878,554 | 1,679,213 | ||||||
Operating Costs and Expenses | |||||||||
Oil, natural gas liquids and natural gas production | 171,714 | 228,380 | 274,432 | ||||||
Production and ad valorem taxes | 42,938 | 57,380 | 102,063 | ||||||
Depreciation, depletion and amortization | 447,961 | 593,789 | 548,564 | ||||||
Asset impairment | 220,652 | 1,292,308 | 416,801 | ||||||
Exploration | 5,415 | 14,878 | 28,090 | ||||||
General and administrative (including non-cash stock based compensation of $19,641, $12,910 and $16,262 for the years ended December 31, 2016, 2015 and 2014, respectively) | 95,689 | 149,132 | 122,052 | ||||||
Accretion of discount on asset retirement obligations | 6,672 | 7,108 | 7,608 | ||||||
(Gain) loss on sale of assets and other, net | (246,922 | ) | (26,570 | ) | 2,642 | ||||
Total operating costs and expenses | 744,119 | 2,316,405 | 1,502,252 | ||||||
Operating Income (Loss) | (211,230 | ) | (1,437,851 | ) | 176,961 | ||||
Other Income (Expense) | |||||||||
Interest expense | (36,899 | ) | (43,108 | ) | (37,771 | ) | |||
Other income | 978 | 223 | 1,181 | ||||||
Total other expense | (35,921 | ) | (42,885 | ) | (36,590 | ) | |||
Income (Loss) From Continuing Operations Before Income Taxes | (247,151 | ) | (1,480,736 | ) | 140,371 | ||||
Income tax expense (benefit) | (79,638 | ) | (535,005 | ) | 40,728 | ||||
Income (Loss) From Continuing Operations | (167,513 | ) | (945,731 | ) | 99,643 | ||||
Discontinued Operations, net of tax | |||||||||
Income from discontinued operations | — | — | 29,292 | ||||||
Gain on disposal of discontinued operations, net | — | — | 439,097 | ||||||
Income From Discontinued Operations | — | — | 468,389 | ||||||
Net Income (Loss) | $ | (167,513 | ) | $ | (945,731 | ) | $ | 568,032 | |
Diluted Earnings Per Average Common Share | |||||||||
Continuing operations | $ | (1.77 | ) | $ | (12.43 | ) | $ | 1.36 | |
Discontinued operations | — | — | 6.39 | ||||||
Net Income (Loss) | $ | (1.77 | ) | $ | (12.43 | ) | $ | 7.75 | |
Basic Earnings Per Average Common Share | |||||||||
Continuing operations | $ | (1.77 | ) | $ | (12.43 | ) | $ | 1.37 | |
Discontinued operations | — | — | 6.42 | ||||||
Net Income (Loss) | $ | (1.77 | ) | $ | (12.43 | ) | $ | 7.79 | |
Diluted Average Common Shares Outstanding | 94,475,797 | 76,078,371 | 73,274,631 | ||||||
Basic Average Common Shares Outstanding | 94,475,797 | 76,078,371 | 72,896,579 | ||||||
The accompanying Notes to Financial Statements are an integral part of these statements.
50
ENERGEN CORPORATION
CONSOLIDATED STATEMENTS OF COMPREHENSIVE INCOME
Years ended December 31, (in thousands) | 2016 | 2015 | 2014 | ||||||
Net Income (Loss) | $ | (167,513 | ) | $ | (945,731 | ) | $ | 568,032 | |
Other comprehensive income (loss): | |||||||||
Cash flow hedges: | |||||||||
Current period change in fair value of derivative commodity instruments, net of tax of $23 in 2014 | — | — | 37 | ||||||
Reclassification adjustment for derivative commodity instruments, net of tax of ($8,212) in 2014 | — | — | (13,399 | ) | |||||
Current period change in fair value of interest rate swap, net of tax of ($160) in 2014 | — | — | (298 | ) | |||||
Reclassification adjustment for interest rate swap, net of tax of $798 in 2014 | — | — | 1,482 | ||||||
Total cash flow hedges | — | — | (12,178 | ) | |||||
Pension and postretirement plans: | |||||||||
Amortization of net benefit obligation at transition, net of tax of $8 in 2014 | — | — | 14 | ||||||
Amortization of prior service cost, net of tax of ($176), $0 and $87, respectively | (289 | ) | — | 161 | |||||
Amortization of net loss, net of tax of $1,168, $10,676 and $7,676, respectively | 1,890 | 19,828 | 14,256 | ||||||
Current period change in fair value of pension and postretirement plans, net of tax of ($279), $1,779, and ($2,722), respectively | (459 | ) | 3,305 | (5,056 | ) | ||||
Total pension and postretirement plans | 1,142 | 23,133 | 9,375 | ||||||
Comprehensive Income (Loss) | $ | (166,371 | ) | $ | (922,598 | ) | $ | 565,229 | |
The accompanying Notes to Financial Statements are an integral part of these statements.
51
ENERGEN CORPORATION
CONSOLIDATED STATEMENTS OF SHAREHOLDERS’ EQUITY
Common Stock | Premium on Capital Stock | Retained Earnings | Accumulated Other Comprehensive Income (Loss) | Deferred Compensation Plan | Treasury Stock | Total Shareholders’ Equity | |||||||||||||||||
(in thousands, except share data) | Number of Shares | Par Value | |||||||||||||||||||||
BALANCE DECEMBER 31, 2013 | 75,574,156 | $ | 756 | $ | 523,711 | $ | 2,476,616 | $ | (20,067 | ) | $ | 3,259 | $ | (126,256 | ) | $ | 2,858,019 | ||||||
Net income | 568,032 | 568,032 | |||||||||||||||||||||
Other comprehensive loss | (2,803 | ) | (2,803 | ) | |||||||||||||||||||
Purchase of treasury shares, net (32,768 shares) | (2,547 | ) | (2,547 | ) | |||||||||||||||||||
Purchase and retirement of treasury shares | (226,839 | ) | (2 | ) | (2,388 | ) | (12,523 | ) | (14,913 | ) | |||||||||||||
Shares issued for employee benefit plans | 528,394 | 5 | 25,496 | 25,501 | |||||||||||||||||||
Deferred compensation obligation | (397 | ) | 397 | — | |||||||||||||||||||
Stock-based compensation | 11,713 | 11,713 | |||||||||||||||||||||
Tax benefit from employee stock plans | 5,906 | 5,906 | |||||||||||||||||||||
Cash dividends - $0.47 per share | (34,304 | ) | (34,304 | ) | |||||||||||||||||||
BALANCE DECEMBER 31, 2014 | 75,875,711 | 759 | 564,438 | 2,997,821 | (22,870 | ) | 2,862 | (128,406 | ) | 3,414,604 | |||||||||||||
Net income | (945,731 | ) | (945,731 | ) | |||||||||||||||||||
Other comprehensive income | 23,133 | 23,133 | |||||||||||||||||||||
Purchase of treasury shares, net (73,206 shares) | (4,723 | ) | (4,723 | ) | |||||||||||||||||||
Shares issued for: | |||||||||||||||||||||||
Stock offering | 5,700,000 | 57 | 398,563 | 398,620 | |||||||||||||||||||
Employee benefit plans | 194,450 | 2 | 6,737 | 6,739 | |||||||||||||||||||
Deferred compensation obligation | (897 | ) | 897 | — | |||||||||||||||||||
Stock-based compensation | 8,228 | 8,228 | |||||||||||||||||||||
Tax benefit from employee stock plans | 1,064 | 1,064 | |||||||||||||||||||||
Cash dividends - $0.08 per share | (6,074 | ) | (6,074 | ) | |||||||||||||||||||
BALANCE DECEMBER 31, 2015 | 81,770,161 | 818 | 979,030 | 2,046,016 | 263 | 1,965 | (132,232 | ) | 2,895,860 | ||||||||||||||
Net loss | (167,513 | ) | (167,513 | ) | |||||||||||||||||||
Other comprehensive income | 1,142 | 1,142 | |||||||||||||||||||||
Purchase of treasury shares, net (88,320 shares) | (2,609 | ) | (2,609 | ) | |||||||||||||||||||
Shares issued for: | |||||||||||||||||||||||
Stock offering | 18,170,000 | 182 | 380,895 | 381,077 | |||||||||||||||||||
Employee benefit plans | 198,636 | 1 | 6,857 | 6,858 | |||||||||||||||||||
Deferred compensation obligation | 296 | (296 | ) | — | |||||||||||||||||||
Stock-based compensation | 6,043 | 6,043 | |||||||||||||||||||||
Tax benefit from employee stock plans | (256 | ) | (256 | ) | |||||||||||||||||||
BALANCE DECEMBER 31, 2016 | 100,138,797 | $ | 1,001 | $ | 1,372,569 | $ | 1,878,503 | $ | 1,405 | $ | 2,261 | $ | (135,137 | ) | $ | 3,120,602 | |||||||
The accompanying Notes to Financial Statements are an integral part of these statements.
52
ENERGEN CORPORATION
CONSOLIDATED STATEMENTS OF CASH FLOWS
Years ended December 31, (in thousands) | 2016 | 2015 | 2014 | ||||||
Operating Activities | |||||||||
Net income (loss) | $ | (167,513 | ) | $ | (945,731 | ) | $ | 568,032 | |
Income from discontinued operations | — | — | (468,389 | ) | |||||
Adjustments to reconcile net income to net cash provided by operating activities: | |||||||||
Depreciation, depletion and amortization | 447,961 | 593,789 | 548,564 | ||||||
Asset impairment | 220,652 | 1,292,308 | 416,801 | ||||||
Accretion of discount on asset retirement obligations | 6,672 | 7,108 | 7,608 | ||||||
Deferred income taxes | (57,193 | ) | (539,735 | ) | 302,890 | ||||
Change in derivative fair value | 76,490 | 233,315 | (346,646 | ) | |||||
(Gain) loss on sale of assets | (246,393 | ) | (28,077 | ) | 55 | ||||
Stock-based compensation expense | 19,641 | 12,910 | 16,262 | ||||||
Exploration, including dry holes | 16 | 7,097 | 9,325 | ||||||
Discontinued operations | — | — | 91,510 | ||||||
Other, net | 5,752 | 35,641 | 4,166 | ||||||
Net change in: | |||||||||
Accounts receivable | 38,305 | 117,486 | 4,812 | ||||||
Inventories | (2,948 | ) | (655 | ) | (3,121 | ) | |||
Accounts payable | (2,205 | ) | (46,283 | ) | 18,695 | ||||
Accrued taxes/income tax receivable | (17,326 | ) | (4,791 | ) | (488,980 | ) | |||
Pension and other postretirement benefit contributions | (14,608 | ) | (24,848 | ) | (12,483 | ) | |||
Other current assets and liabilities | (14,855 | ) | 5,058 | 36,382 | |||||
Net cash provided by operating activities | 292,448 | 714,592 | 705,483 | ||||||
Investing Activities | |||||||||
Additions to oil and natural gas properties | (447,028 | ) | (1,154,373 | ) | (1,264,059 | ) | |||
Acquisitions, net of cash acquired | (147,879 | ) | (87,410 | ) | (70,730 | ) | |||
Proceeds from asset sales and sale of Alabama Gas Corporation | 528,775 | 394,521 | 1,347,725 | ||||||
Purchase of short-term investments | — | (919,000 | ) | (473,000 | ) | ||||
Sale of short-term investments | — | 919,000 | 473,000 | ||||||
Discontinued operations | — | — | (51,850 | ) | |||||
Net cash used in investing activities | (66,132 | ) | (847,262 | ) | (38,914 | ) | |||
Financing Activities | |||||||||
Payment of dividends on common stock | — | (6,074 | ) | (34,304 | ) | ||||
Issuance of common stock, net | 381,261 | 399,600 | 23,053 | ||||||
Purchase and retirement of shares | — | — | (14,913 | ) | |||||
Reduction of long-term debt | — | — | (600,000 | ) | |||||
Payment of debt issuance costs | — | — | (10,901 | ) | |||||
Net change in credit facility | (222,500 | ) | (262,500 | ) | (4,000 | ) | |||
Tax benefit on stock compensation | (256 | ) | 1,064 | 5,906 | |||||
Discontinued operations | — | — | (35,113 | ) | |||||
Net cash provided by (used in) financing activities | 158,505 | 132,090 | (670,272 | ) | |||||
Net change in cash and cash equivalents | 384,821 | (580 | ) | (3,703 | ) | ||||
Cash and cash equivalents at beginning of period | 1,272 | 1,852 | 5,555 | ||||||
Cash and cash equivalents at end of period | $ | 386,093 | $ | 1,272 | $ | 1,852 | |||
The accompanying Notes to Financial Statements are an integral part of these statements.
53
ENERGEN CORPORATION
NOTES TO FINANCIAL STATEMENTS
1. ORGANIZATION AND BASIS OF PRESENTATION
Energen Corporation (Energen or the Company) is an oil and natural gas exploration and production company engaged in the exploration, development and production of oil, natural gas liquids and natural gas. Our operations are conducted through our subsidiary, Energen Resources Corporation (Energen Resources) and primarily occur within the Midland Basin, the Delaware Basin and the Central Basin Platform areas of the Permian Basin in west Texas and New Mexico. Our corporate headquarters are located in Birmingham, Alabama.
Energen may, in the ordinary course of business, be involved in the sale of developed or undeveloped properties. All assets held for sale are reported at the lower of the carrying amount or estimated fair value. Certain of these held for sale properties also qualify as discontinued operations. The results of operations of these properties are reclassified and reported as discontinued operations for prior periods.
Prior to September 2, 2014, Energen owned Alabama Gas Corporation (Alagasco), which was engaged in the purchase, distribution and sale of natural gas principally in central and north Alabama. On September 2, 2014, Energen completed the transaction to sell Alagasco to The Laclede Group, Inc. (Laclede) for $1.6 billion, less the assumption of $267 million in debt. The net pre-tax proceeds to Energen totaled approximately $1.32 billion resulting in a pre-tax gain of $726.5 million. This sale had an effective date of August 31, 2014. Energen used cash proceeds from the sale to reduce long-term and short-term indebtedness. During 2014, Energen classified Alagasco as held for sale and reflected the associated operating results in discontinued operations. See Note 16, Held for Sale Properties and Discontinued Operations, for further information regarding the sale of Alagasco.
Workforce Reduction
On January 22, 2016 and March 18, 2016, we reduced our workforce as part of an overall plan to reduce costs and better align our workforce with the needs of our business. In connection with the reductions, we incurred charges of approximately $5.0 million during 2016 for one-time termination benefits which are included in general and administrative expense on the consolidated income statement.
2. SUMMARY OF SIGNIFICANT ACCOUNTING POLICIES
A. Principles of Consolidation
The accompanying consolidated financial statements include Energen and its subsidiaries, principally Energen Resources, after elimination of all significant intercompany transactions in consolidation. In the opinion of management, our consolidated financial statements reflect all adjustments necessary to present fairly our financial position, results of operations, and cash flows for the periods and as of the dates shown. Such adjustments consist of normal recurring items. Certain reclassifications were made to conform prior periods’ financial statements to the current-year presentation.
B. Estimates
The preparation of financial statements in conformity with accounting principles generally accepted in the United States of America requires management to make estimates and assumptions that affect the reported amounts of assets and liabilities at the date of the financial statements and the reported amount of revenues and expenses during the reporting period. The major estimates and assumptions identified by management include, but are not limited to, physical quantities of proved oil and gas reserves, periodic assessments of oil and gas properties for impairment, Energen’s obligations under its employee pension and compensation plans, the valuation of derivative financial instruments, the allowance for doubtful accounts, tax contingency reserves, legal contingency reserves, asset retirement obligations and self insurance reserves. Due to the inherent uncertainty involved in making estimates, actual results reported in future periods may differ from the estimates.
C. Cash and Cash Equivalents
Cash and cash equivalents consist of cash in banks and investments readily convertible into cash, which have original maturities within three months at the date of acquisition. Cash equivalents are stated at cost, which approximates fair value.
54
D. Short-term Investments
All highly liquid financial instruments with maturities greater than three months and less than one year at the date of purchase are considered to be short-term investments. As of December 31, 2016 and 2015, Energen had no short-term investments.
E. Accounts Receivable and Allowance for Doubtful Accounts
Trade accounts receivable are recorded at the invoiced amounts and do not bear interest. The allowance for doubtful accounts is our best estimate of the amount of probable credit losses in the existing accounts receivable. Energen determines the allowance based on historical experience and in consideration of current market conditions. Account balances are charged against the allowance when it is anticipated the receivable will not be recovered. Energen had allowance for doubtful accounts of $0.6 million and $0.7 million at December 31, 2016 and 2015, respectively.
F. Inventory
Inventories consist primarily of tubular goods and other oilfield equipment used in our operations and are stated at the lower of cost or market value, on a weighted average cost basis. Energen had an inventory valuation allowance of $0.7 million and $0.2 million at December 31, 2016 and 2015, respectively.
G. Oil and Natural Gas Operations
Operating Revenues: Energen utilizes the sales method of accounting to recognize oil, natural gas liquids and natural gas production revenue. Under the sales method, revenues are based on actual sales volumes of commodities sold to purchasers. Over-production liabilities are established only when it is estimated that a property’s over-produced volumes exceed the net share of remaining proved reserves for such property. Energen had no significant production imbalances at December 31, 2016 and 2015.
Property and Related Depletion: Energen follows the successful efforts method of accounting for costs incurred in the exploration and development of oil, natural gas liquids and natural gas reserves. Lease acquisition costs are capitalized initially, and unproved properties are reviewed periodically to determine if there has been impairment of the carrying value, with any such impairment charged to exploration expense currently. All development costs are capitalized. Energen capitalizes exploratory drilling costs until a determination is made that the well or project has either found proved reserves or is impaired. After an exploratory well has been drilled and found oil and natural gas reserves, a determination may be pending as to whether the oil and natural gas quantities can be classified as proved. In those circumstances, we continue to capitalize the drilling costs pending the determination of proved status if (i) the well has found a sufficient quantity of reserves to justify its completion as a producing well and (ii) we are making sufficient progress assessing the reserves and the economic and operating viability of the project. Capitalized exploratory drilling costs are presented in proved properties in the balance sheets. If the exploratory well is determined to be a dry well, the costs are charged to exploration expense. Other exploration costs, including geological and geophysical costs, are expensed as incurred. Depreciation, depletion and amortization expense is determined on a field-by-field basis using the units-of-production method based on proved reserves. Anticipated abandonment and restoration costs are capitalized and depreciated using the units-of-production method based on proved developed reserves.
Asset Impairments: Oil and natural gas proved properties periodically are assessed for possible impairment on a field-by-field basis using the estimated undiscounted future cash flows. Energen monitors its oil and natural gas properties as well as the market and business environments in which it operates and makes assessments about events that could result in potential impairment. Such potential events may include, but are not limited to, commodity price declines, unanticipated increased operating costs, and lower than expected production performance. If a material event occurs, we make an estimate of undiscounted future cash flows to determine whether the asset is impaired. Impairment losses are recognized when the estimated undiscounted future cash flows are less than the current net book values of the properties in a field. If the asset is impaired, Energen will record an impairment loss for the difference between the net book value of the properties and the fair value of the properties. The fair value of the properties typically is estimated using discounted cash flows and sale agreements and similar support as applicable.
Cash flow and fair value estimates require Energen to make projections and assumptions for pricing, demand, competition, operating costs, legal and regulatory issues, discount rates and other factors for many years into the future. These variables can, and often do, differ from the estimates and can have a positive or negative impact on our need for impairment or on the amount of impairment. In addition, further changes in the economic and business environment can impact Energen’s original and ongoing assessments of potential impairment.
55
Energen also may recognize impairments of capitalized costs for unproved properties. The greatest portion of these costs generally relate to the acquisition of leasehold. The costs are capitalized and periodically evaluated as to recoverability, based on changes brought about by exploration activities, changes in economic factors and potential shifts in business strategy employed by management. We consider a combination of geologic and economic factors to evaluate the need for impairment of these costs.
Acquisitions: Energen recognizes all acquisitions at fair value. Energen estimates the fair value of the assets acquired and liabilities assumed as of the acquisition date, the date on which Energen obtained control of the properties for all acquisitions that qualify as business combinations. The fair value is the price that would be received to sell an asset or paid to transfer a liability in an orderly transaction between market participants at the measurement date (exit price). Fair value measurements also utilize assumptions of market participants. Energen uses a discounted cash flow model and makes market assumptions as to future commodity prices, projections of estimated quantities of oil and natural gas reserves, expectations for timing and amount of future development and operating costs, projections of future rates of production, expected recovery rates and risk adjusted discount rates. These assumptions represent Level 3 inputs under the fair value hierarchy. Acquisition related costs are expensed as incurred in general and administrative expense on the consolidated income statements.
Held for Sale Properties and Discontinued Operations: Energen may, in the ordinary course of business, be involved in the sale of developed or undeveloped properties. All assets held for sale are reported at the lower of the carrying amount or estimated fair value. Certain of these held for sale properties also qualify as discontinued operations and the results of operations of these properties are reclassified and reported as discontinued operations for prior periods.
H. Derivative Commodity Instruments
We periodically enter into derivative commodity instruments to hedge our exposure to price fluctuations on oil, natural gas liquids and natural gas production. Such instruments may include over-the-counter (OTC) swaps, options and basis swaps typically executed with investment and commercial banks and energy-trading firms. All derivative commodity instruments in a gain position are valued on a discounted basis incorporating an estimate of performance risk specific to each related counterparty. Derivative commodity instruments in a loss position are valued on a discounted basis incorporating an estimate of performance risk specific to Energen. All derivative transactions are included in operating activities on the consolidated statements of cash flows.
The majority of our counterparty agreements include provisions for net settlement of transactions payable on the same date and in the same currency. Most of the agreements include various contractual set-off rights, which may be exercised by the non-defaulting party in the event of an early termination due to a default.
Derivative transactions are pursuant to standing authorizations by the Board of Directors, which do not authorize speculative positions. Energen formally documents all relationships between hedging instruments and hedged items at the inception of the hedge, as well as its risk management objective and strategy for undertaking the hedge. This process includes specific identification of the hedging instrument and the nature of the risk being hedged. Our credit facility also limits our ability to enter into commodity hedges based on projected production volumes.
I. Fair Value Measurements
The carrying values of cash and cash equivalents, accounts payable, accounts receivable (net of allowance), derivative commodity instruments, pension and postretirement plan assets and liabilities and other current assets and liabilities approximate fair value. Fair value is the price that would be received to sell an asset or paid to transfer a liability in an orderly transaction between market participants at the measurement date (exit price). In determining fair value, we use various valuation approaches and classify all assets and liabilities based on the lowest level of input that is significant to the fair value measurement. Observable inputs represent market data obtained from independent sources, whereas unobservable inputs reflect our own assumptions about the assumptions other market participants would use in pricing the asset or liability based on the best information available in the circumstances. Assessing the significance of a particular input may require judgment considering factors specific to the asset or liability, and may affect the valuation of the asset or liability and its placement within the fair value hierarchy. The hierarchy is broken down into three levels based on the observability of inputs as follows:
Level 1 - | Unadjusted quoted prices in active markets for identical assets or liabilities; |
Level 2 - | Pricing inputs other than quoted prices in active markets included within Level 1, which are either directly or indirectly observable through correlation with market data as of the reporting date; |
Level 3 - | Pricing that requires inputs that are both significant and unobservable to the calculation of the fair value measure. The fair value measure represents estimates of the assumptions that market participants would use in pricing the |
56
asset or liability. Unobservable inputs are developed based on the best available information and subject to cost-benefit constraints.
The fair value of Energen’s derivative commodity instruments is determined using market transactions and other market evidence whenever possible, including market-based inputs to models and broker or dealer quotations. Our OTC derivative contracts trade in less liquid markets with limited pricing information as compared to markets with actively traded, unadjusted quoted prices; accordingly, the determination of fair value is inherently more difficult. OTC derivatives for which we are able to substantiate fair value through direct or indirect observable market prices are classified within Level 2 of the fair value hierarchy. These Level 2 fair values consist of swaps and options priced in reference to NYMEX oil and natural gas prices, basin specific gas hedges and gas basis. OTC derivatives valued using unobservable market prices have been classified within Level 3 of the fair value hierarchy. These Level 3 fair values include oil basis and natural gas liquids swaps. We consider the frequency of pricing and variability in pricing between sources in determining whether a market is considered active. While Energen does not have access to the specific assumptions used in its counterparties’ valuation models, we maintain communications with our counterparties and discuss pricing practices. Further, we corroborate the fair value of our transactions by comparison of market-based price sources.
Energen utilizes a discounted cash flow model in valuing its interest rate derivatives, which are comprised of interest rate swap agreements. The fair value attributable to Energen's interest rate derivative contracts is based on (i) the contracted notional amounts, (ii) active market-quoted LIBOR yield curves and (iii) the applicable credit-adjusted risk-free rate yield curve.
Pension and postretirement plan assets include cash and mutual funds. Plan assets were classified in their entirety based on the lowest level of input that is significant to the fair value measurement. The determination and classification of fair value requires judgment and may affect the valuation of fair value assets and their placement within the fair value hierarchy. Level 1 and Level 2 fair values use market transactions and other market evidence whenever possible and consist primarily of equities, fixed income and mutual funds.
J. Stock-Based Compensation
Energen recognizes all share-based compensation awards in general and administrative expense on the consolidated income statement over the requisite vesting period. Equity awards are measured at fair value as of the date of grant. Awards that are settled in cash are classified as liabilities and re-measured at fair value at the end of each reporting period. Forfeitures are estimated at the time of grant and revised, if necessary, in subsequent periods if the actual forfeitures differ from those estimates. We recognize all stock-based compensation expense in the period of grant, subject to certain vesting requirements, for retirement eligible employees. Energen utilizes the long-form method of calculating the available pool of windfall tax benefit. For the year ended December 31, 2016, we recognized tax expense of $0.3 million related to our stock-based compensation. For the years ended December 31, 2015 and 2014, we recognized an excess tax benefit of $1.1 million and $5.9 million, respectively.
K. Environmental Costs
Environmental compliance costs, including ongoing maintenance, monitoring and similar costs, are expensed as incurred. Environmental remediation costs are accrued when remedial efforts are probable and the cost can be reasonably estimated.
L. Income Taxes
Energen uses the liability method of accounting for income taxes. Under this method, a deferred tax asset or liability is recognized for the estimated future tax effects attributable to temporary differences between the financial statement basis and the tax basis of assets and liabilities as well as tax credit carryforwards. Deferred tax assets and liabilities are measured using enacted tax rates expected to apply to taxable income in the years in which those temporary differences are expected to be recovered or settled. The effect on deferred tax assets and liabilities of a change in tax rates is recognized in the period of the change. Energen and its subsidiaries file a consolidated federal income tax return. Consolidated federal income taxes are charged to appropriate subsidiaries using the separate return method.
M. Earnings Per Share (EPS)
Energen’s basic earnings per share amounts have been computed based on the weighted average number of common shares outstanding. Diluted earnings per share amounts reflect the assumed issuance of common shares for all potentially dilutive securities.
57
N. Employee Benefit Plans
Plan Termination: In October 2014, Energen’s Board of Directors elected to freeze and terminate its qualified defined benefit pension plan. A plan amendment adopted in October 2014 closed the plan to new entrants, effective November 1, 2014, and froze benefit accruals effective December 31, 2014. Energen terminated the plan on January 31, 2015 and distributed benefits in December 2015. The Pension Benefit Guaranty Corporation (PBGC) is conducting an audit of the termination of the pension plan to ensure that Energen properly calculated and distributed benefits in accordance with plan provisions and in compliance with the appropriate laws and regulations administered by the PBGC.
Energen’s non-qualified supplemental retirement plans were terminated effective December 31, 2014. Distributions under the plans were partially made in the first quarter of 2015 with the remainder of approximately $14.5 million paid in the first quarter of 2016. The Company expects to make no additional benefit payments with respect to the termination of the non-qualified supplemental retirement plans.
Postretirement Benefit Plans: Energen provides certain postretirement health care and life insurance benefits for all employees hired prior to January 1, 2010. These postretirement healthcare and life insurance benefits are available upon reaching normal retirement age while working for Energen. The projected unit credit actuarial method was used to determine the normal cost and actuarial liability. For these plans, certain financial assumptions are used in determining Energen’s projected benefit obligation. These assumptions are examined periodically by Energen, and any required changes are reflected in the subsequent determination of projected benefit obligations.
Energen calculates periodic expense for the other postretirement benefit plans on an actuarial basis and the net funded status is recognized as an asset or liability in its statement of financial position with changes in the funded status recognized through comprehensive income. The benefit obligation is the accumulated postretirement benefit obligation. Energen measures the funded status of its employee benefit plans as of the date of its year-end statement of financial position.
For our other postretirement plan, we selected a yield curve comprised of a broad base of Aa bonds with maturities between zero and thirty years. The discount rate was developed as the level equivalent rate that would produce the same present value as that using spot rates aligned with the projected benefit payments.
The assumed rate of return on assets is the weighted average of expected long-term asset assumptions. Energen considered past performance and current expectations for assets held by the plans as well as the expected long-term allocation of plan assets.
58
3. LONG-TERM DEBT
Long-term debt consisted of the following:
(in thousands) | December 31, 2016 | December 31, 2015 | ||||
Credit facility | $ | — | $ | 222,500 | ||
7.40% Medium-term Notes, Series A, due July 24, 2017 | 2,000 | 2,000 | ||||
7.36% Medium-term Notes, Series A, due July 24, 2017 | 15,000 | 15,000 | ||||
7.23% Medium-term Notes, Series A, due July 28, 2017 | 2,000 | 2,000 | ||||
7.32% Medium-term Notes, Series A, due July 28, 2022 | 20,000 | 20,000 | ||||
7.60% Medium-term Notes, Series A, due July 26, 2027 | 5,000 | 5,000 | ||||
7.35% Medium-term Notes, Series A, due July 28, 2027 | 10,000 | 10,000 | ||||
7.125% Medium-term Notes, Series B, due February 15, 2028 | 100,000 | 100,000 | ||||
4.625% Notes, due September 1, 2021 | 400,000 | 400,000 | ||||
Total | 554,000 | 776,500 | ||||
Less amounts due within one year | 24,000 | — | ||||
Less unamortized debt discount | 387 | 413 | ||||
Less unamortized debt issuance costs | 2,170 | 2,537 | ||||
Total | $ | 527,443 | $ | 773,550 | ||
The aggregate maturities of Energen’s long-term debt as of December 31, 2016 are as follows:
Years ending December 31, (in thousands) | |||||
2017 | 2018 | 2019 | 2020 | 2021 | Thereafter |
$24,000 | $— | $— | $— | $400,000 | $130,000 |
On January 23, 2017, Energen redeemed the $2 million of 7.40% Medium-term Notes, Series A, due July 24, 2017 and $5 million of 7.60% Medium-term Notes, Series A, due July 26, 2027. The $5 million of 7.60% Medium-term Notes has been classified as long-term debt due within one year on the consolidated balance sheets.
The debt agreements of Energen contain financial and nonfinancial covenants including routine matters such as timely payment of principal and interest, maintenance of corporate existence and restrictions on liens. Although none of the agreements have events of default based on credit ratings, the interest rates applicable to the syndicated credit facility discussed below may adjust based on credit rating changes during certain periods.
Under Energen’s Indenture dated September 1, 1996 with The Bank of New York as Trustee, a cross default provision provides that any debt default of more than $10 million by Energen or Energen Resources will constitute an event of default by Energen. The Indenture does not include a restriction on the payment of dividends.
Credit Facility: On September 2, 2014, Energen entered into a five-year syndicated secured credit facility with domestic and foreign lenders. On April 13, 2016, the borrowing base and aggregate commitments were reduced to $1.05 billion in association with the semi-annual redetermination required under the agreement. On October 25, 2016, the borrowing base was reaffirmed with no changes. Energen’s obligations under the syndicated credit facility are unconditionally guaranteed by Energen Resources. Subject to release of collateral in certain periods upon the achievement of certain investment grade ratings from designated ratings agencies, the credit facility is collateralized by certain assets of Energen, including a pledge of equity interests in subsidiaries of Energen other than Energen Resources, and by mortgages on substantially all of Energen Resources’ oil and natural gas properties. The current credit facility qualifies for classification as long-term debt on the consolidated balance sheets. The financial covenants of the credit facility require Energen to maintain a ratio of total debt to consolidated income before interest expense, income taxes, depreciation, depletion, amortization, exploration expense and other non-cash income and expenses (EBITDAX) less than or equal to 4.0 to 1.0; to maintain a ratio of consolidated current assets (adjusted to include amounts available for
59
borrowings and exclude non-cash derivative instruments) to consolidated current liabilities (adjusted to exclude maturities under the credit facility and non-cash derivative instruments) greater than or equal to 1.0 to 1.0; and, during certain periods, to maintain a ratio of the net present value of proved reserves of our oil and natural gas properties to consolidated total debt greater than or equal to 1.50 to 1.0. We are also bound by covenants which limit our ability to incur additional indebtedness, make certain distributions or alter our corporate structure. Energen may not pay dividends during an event of default, if the payment would result in an event of default or if availability is less than 10 percent of the loan limit under the credit facility. Our credit facility also limits our ability to enter into commodity hedges based on projected production volumes. In addition, the terms of our credit facility limit the amount we can borrow to a borrowing base amount which is determined by our lenders in their sole discretion based on their valuation of our proved reserves and their internal criteria including commodity price outlook. The borrowing base amount is subject to redetermination semi-annually and for event-driven unscheduled redeterminations. Our next scheduled redetermination is April 1, 2017.
Under Energen’s credit facility, a cross default provision provides that any debt default of more than $75 million by Energen or Energen Resources will constitute an event of default by Energen.
Upon an uncured event of default under the credit facility, all amounts owing under the credit facility, if any, depending on the nature of the event of default will automatically, or may upon notice by the administrative agent or the requisite lenders thereunder, become immediately due and payable and the lenders may terminate their commitments under the defaulted facility. Energen was in compliance with the terms of its credit facility as of December 31, 2016.
The following is a summary of information relating to Energen’s credit facility:
(in thousands) | December 31, 2016 | December 31, 2015 | ||||
Credit facility outstanding | $ | — | $ | 222,500 | ||
Available for borrowings | 1,050,000 | 1,177,500 | ||||
Total borrowing commitments | $ | 1,050,000 | $ | 1,400,000 | ||
Maximum amount outstanding at any month-end | $ | 214,500 | $ | 685,000 | ||
Average daily amount outstanding | $ | 33,642 | $ | 358,929 | ||
Weighted average interest rates based on: | ||||||
Average daily amount outstanding | 1.72 | % | 1.60 | % | ||
Amount outstanding at year-end | — | % | 1.64 | % | ||
Energen’s total interest expense was $36.9 million, $43.1 million and $37.8 million for the years ended December 31, 2016, 2015 and 2014, respectively. Energen’s total interest expense for the years ended December 31, 2016, 2015 and 2014 included amortization of debt issuance costs related to long-term debt, including our credit facility, of $3.3 million, $3.3 million and $5.7 million, respectively. Capitalized interest expense was $0.1 million and $0.2 million for the years ended December 31, 2016 and 2014, respectively. Capitalized interest expense for the year ended December 31, 2015 was not significant. At December 31, 2016, Energen paid commitment fees on the unused portion of available credit facility at a current annual rate of 30 basis points per annum. Energen paid commitment fees of $3.4 million, $4.1 million and $3.6 million for the years ended December 31, 2016, 2015 and 2014, respectively.
60
4. INCOME TAXES
The components of Energen’s income taxes consisted of the following:
Years ended December 31, (in thousands) | 2016 | 2015 | 2014 | ||||||
Taxes estimated to be payable currently: | |||||||||
Federal | $ | (23,277 | ) | $ | 3,972 | $ | 161,576 | ||
State | 832 | 758 | 72,379 | ||||||
Total current | (22,445 | ) | 4,730 | 233,955 | |||||
Taxes deferred: | |||||||||
Federal | (62,205 | ) | (513,187 | ) | 144,645 | ||||
State | 5,012 | (26,548 | ) | (34,447 | ) | ||||
Total deferred | (57,193 | ) | (539,735 | ) | 110,198 | ||||
Total income tax expense (benefit) | $ | (79,638 | ) | $ | (535,005 | ) | $ | 344,153 | |
The components of Energen’s income taxes consisted of the following:
Years ended December 31, (in thousands) | 2016 | 2015 | 2014 | ||||||
Income tax expense (benefit) from continuing operations | $ | (79,638 | ) | $ | (535,005 | ) | $ | 40,728 | |
Income tax expense from discontinued operations | — | — | 17,928 | ||||||
Income tax expense from gain on disposal of discontinued operations | — | — | 285,497 | ||||||
Total income tax expense (benefit) | $ | (79,638 | ) | $ | (535,005 | ) | $ | 344,153 | |
Energen elected early adoption of Accounting Standards Update (ASU) No. 2015-17, Balance Sheet Classification of Deferred Taxes, prospectively as of December 31, 2015. This update requires that deferred tax liabilities and assets be classified as noncurrent on the balance sheet. The current requirement that deferred tax liabilities and assets of each jurisdiction of an entity be offset and presented as a single amount is not affected by the amendments in this update. We reclassified $14.5 million from a current deferred income tax asset to a noncurrent deferred income tax liability at December 31, 2015.
Temporary differences and carryforwards which gave rise to Energen’s deferred tax assets and liabilities were as follows:
(in thousands) | December 31, 2016 | December 31, 2015 | ||||
Noncurrent | Noncurrent | |||||
Deferred tax assets: | ||||||
Minimum tax credit | $ | 64,203 | $ | 44,862 | ||
Allowance for doubtful accounts | 222 | 253 | ||||
Insurance and other accruals | 3,151 | 2,807 | ||||
Compensation accruals | 13,895 | 11,650 | ||||
Deferred compensation and other costs | 5,401 | 8,693 | ||||
Derivative instruments | 22,402 | — | ||||
State net operating losses and other carryforwards | 12,947 | 12,577 | ||||
Other | 313 | — | ||||
Total deferred tax assets | 122,534 | 80,842 | ||||
Valuation allowance | (5,735 | ) | (3,235 | ) | ||
Total deferred tax assets | 116,799 | 77,607 | ||||
61
Deferred tax liabilities: | ||||||
Depreciation and basis differences | 603,324 | 620,629 | ||||
Derivative instruments | — | 2,838 | ||||
Other comprehensive income | 854 | 141 | ||||
Other | 8,509 | 6,368 | ||||
Total deferred tax liabilities | 612,687 | 629,976 | ||||
Net deferred tax liabilities | $ | (495,888 | ) | $ | (552,369 | ) |
Energen files a consolidated federal income tax return with all of its subsidiaries. As of December 31, 2016, the amount of minimum tax credit which can be carried forward indefinitely to reduce future regular tax liability is $64.2 million. Energen has a federal net operating loss generated in the current year of $128 million, which the Company intends to carry back and fully utilize in the 2014 tax year. Energen made a reclassification of approximately $25.5 million between income tax receivable and deferred tax assets to reflect the impact of this federal net operating loss carryback. In addition, the federal net operating loss carryback will generate an additional minimum tax credit carryforward of $19.1 million.
Energen has $8.8 million of state net operating loss and charitable contribution carryforwards which will expire beginning in 2024 through 2028. Energen Resources has $281 million of state net operating loss carryforwards which will expire beginning in 2026 through 2036. Energen Resources has a valuation allowance recorded against deferred tax assets of $5.7 million arising from certain of these state net operating losses and other state deferred tax assets that are not expected to be realized through reversals of its existing taxable temporary differences. Energen intends to fully reserve these assets until it is determined that deferred tax assets can be realized through future taxable income in the respective state taxing jurisdictions. No other valuation allowance with respect to deferred taxes is deemed necessary as Energen anticipates generating adequate future taxable income from the reversals of its existing taxable temporary differences to realize the benefits of all remaining deferred tax assets on the consolidated balance sheets.
Total income tax expense from continuing operations differs from the amount which would have been provided by applying the statutory federal income tax rate of 35 percent to earnings before taxes as illustrated below:
Years ended December 31, (in thousands) | 2016 | 2015 | 2014 | ||||||
Income tax expense (benefit) at statutory federal income tax rate | $ | (86,503 | ) | $ | (518,258 | ) | $ | 49,130 | |
Increase (decrease) resulting from: | |||||||||
State income taxes, net of federal income tax benefit | 925 | (15,417 | ) | (459 | ) | ||||
Impact of state law changes | (9 | ) | (3,075 | ) | (121 | ) | |||
Impact of state deferred tax revaluation on San Juan properties | (153 | ) | (1,241 | ) | (8,382 | ) | |||
Change in deferred tax valuation allowance | 2,500 | 1,305 | 552 | ||||||
Other, net | 3,602 | 1,681 | 8 | ||||||
Total income tax expense (benefit) | $ | (79,638 | ) | $ | (535,005 | ) | $ | 40,728 | |
Effective income tax rate (%) | 32.22 | 36.13 | 29.01 | ||||||
In addition to other changes in state apportionment reflected in the state income taxes, net of federal income tax benefit above, Energen recognized $0.2 million, $1.2 million and $8.4 million of income tax benefit during 2016, 2015 and 2014, respectively, as a result of re-measuring its state deferred tax liabilities. This re-measurement reflected the state apportionment changes related to certain San Juan Basin properties designated as held for sale as of December 31, 2015, and 2014.
62
A reconciliation of Energen’s beginning and ending amount of unrecognized tax benefits is as follows:
(in thousands) | |||
Balance as of December 31, 2013 | $ | 15,986 | |
Additions based on tax positions related to the current year | 3,873 | ||
Additions for tax positions of prior years | 19 | ||
Reductions for tax positions of prior years | (954 | ) | |
Lapse of statute of limitations | (1,394 | ) | |
Balance as of December 31, 2014 | 17,530 | ||
Additions based on tax positions related to the current year | 2,378 | ||
Reductions based on tax positions related to the current year | (6,589 | ) | |
Reductions for tax positions of prior years | (345 | ) | |
Lapse of statute of limitations | (1,785 | ) | |
Balance as of December 31, 2015 | 11,189 | ||
Additions based on tax positions related to the current year | 2,936 | ||
Additions for tax positions of prior years | 1,484 | ||
Reductions for tax positions of prior years | (99 | ) | |
Lapse of statute of limitations | (1,300 | ) | |
Balance as of December 31, 2016 | $ | 14,210 | |
The amount of unrecognized tax benefits at December 31, 2016 that would favorably impact Energen’s effective tax rate, if recognized, is $3.5 million. Energen recognizes potential accrued interest and penalties related to unrecognized tax benefits in income tax expense. During the years ended December 31, 2016, 2015, and 2014, Energen recognized approximately $101,000 of expense, $2,000 of income and $27,000 of expense for interest (net of tax benefit) and penalties, respectively. Energen had approximately $0.3 million and $0.2 million for the payment of interest (net of tax benefit) and penalties accrued at December 31, 2016 and 2015, respectively.
On February 8, 2017, the Company received notification from the Internal Revenue Service that the review of the Company's amended tax return for the 2012 tax year had concluded and the full amount of the refund claim of $0.9 million had been accepted. The Company expects to receive the refund in the first quarter of 2017. Energen’s tax returns for years 2013-2015 remain open and subject to examination by the IRS and major state taxing jurisdictions. Accordingly, it is reasonably possible that changes to the reserve for uncertain tax benefits may occur as a result of various audits and the expiration of the statute of limitations. As a result of the anticipated closing of certain statute of limitations, the Company expects approximately a range of $1 million to $4 million of uncertain tax position liabilities will be released in the next 12 months and will not significantly impact the Company’s effective rate.
5. EMPLOYEE BENEFIT PLANS
Plan Terminations: In October 2014, Energen’s Board of Directors elected to freeze and terminate its qualified defined benefit pension plan. A plan amendment adopted in October 2014 closed the plan to new entrants, effective November 1, 2014, and froze benefit accruals effective December 31, 2014. Energen terminated the plan on January 31, 2015 and distributed benefits in December 2015. The PBGC is conducting an audit of the termination of the pension plan to ensure that Energen properly calculated and distributed benefits in accordance with plan provisions and in compliance with the appropriate laws and regulations administered by the PBGC.
Energen’s non-qualified supplemental retirement plans were terminated effective December 31, 2014. Distributions under the plans were partially made in the first quarter of 2015 with the remainder of approximately $14.5 million paid in the first quarter of 2016. The Company expects to make no additional benefit payments with respect to the termination of the non-qualified supplemental retirement plans. Certain annuities associated with our non-qualified supplemental retirement plans remain of approximately $1.1 million and are included in other current liabilities and other long-term liabilities on the consolidated balance sheets.
63
Benefit Obligations: The following table sets forth the combined funded status of the defined qualified and nonqualified supplemental benefit plans along with the postretirement health care and life insurance benefit plans and their reconciliation with the related amounts in Energen’s consolidated financial statements.
As of December 31, (in thousands) | 2016 | 2015 | 2016 | 2015 | ||||||||
Pension | Postretirement Benefits | |||||||||||
Accumulated benefit obligation | $ | 1,094 | $ | 15,729 | ||||||||
Benefit obligation: | ||||||||||||
Balance at beginning of period | $ | 15,729 | $ | 107,669 | $ | 6,488 | $ | 11,127 | ||||
Service cost | — | — | 94 | 392 | ||||||||
Interest cost | — | 816 | 223 | 466 | ||||||||
Actuarial (gain) loss | (26 | ) | (683 | ) | 917 | (1,185 | ) | |||||
Plan amendments | — | — | (422 | ) | (4,071 | ) | ||||||
Curtailment gain | — | — | (477 | ) | — | |||||||
Benefits paid | (14,609 | ) | (92,073 | ) | (1,376 | ) | (241 | ) | ||||
Balance at end of period | $ | 1,094 | $ | 15,729 | $ | 5,447 | $ | 6,488 | ||||
Plan assets: | ||||||||||||
Fair value of plan assets at beginning of period | $ | 27 | $ | 67,542 | $ | 10,369 | $ | 10,693 | ||||
Actual return (loss) on plan assets | (27 | ) | (289 | ) | 73 | (83 | ) | |||||
Employer contributions | 14,609 | 24,847 | — | — | ||||||||
Benefits paid | (14,609 | ) | (92,073 | ) | (1,376 | ) | (241 | ) | ||||
Fair value of plan assets at end of period | $ | — | $ | 27 | $ | 9,066 | $ | 10,369 | ||||
Funded status of plans | $ | (1,094 | ) | $ | (15,702 | ) | $ | 3,619 | $ | 3,881 | ||
Noncurrent assets | $ | — | $ | — | $ | 3,619 | $ | 3,881 | ||||
Current liabilities | (121 | ) | (15,702 | ) | — | — | ||||||
Noncurrent liabilities | (973 | ) | — | — | — | |||||||
Net asset (liability) recognized | $ | (1,094 | ) | $ | (15,702 | ) | $ | 3,619 | $ | 3,881 | ||
Amounts recognized to accumulated other comprehensive income: | ||||||||||||
Prior service credit, net of taxes | $ | — | $ | — | $ | (2,111 | ) | $ | (2,646 | ) | ||
Net actuarial loss, net of taxes | — | 2,179 | 643 | 205 | ||||||||
Total accumulated other comprehensive income (loss) | $ | — | $ | 2,179 | $ | (1,468 | ) | $ | (2,441 | ) | ||
Other investment assets designated for payment of the nonqualified supplemental retirement plans were as follows:
December 31, 2015 | |||||||||
(in thousands) | Level 1 | Level 2 | Total | ||||||
Cash and cash equivalents | $ | 3,308 | $ | — | $ | 3,308 | |||
Total | $ | 3,308 | $ | — | $ | 3,308 | |||
While intended for payment of the nonqualified supplemental retirement plan benefits, these assets remain subject to the claims of Energen’s creditors and are not recognized in the funded status of the plan. These assets are recorded at fair value and included in prepayments and other and other assets in the consolidated balance sheets.
64
The components of net periodic benefit cost from continuing operations were as follows:
Years ended December 31, (in thousands) | 2016 | 2015 | 2014 | ||||||
Pension Plans | |||||||||
Components of net periodic benefit cost: | |||||||||
Service cost | $ | — | $ | — | $ | 6,808 | |||
Interest cost | — | 816 | 4,498 | ||||||
Expected long-term return on assets | — | — | (4,386 | ) | |||||
Prior service cost amortization | — | — | 202 | ||||||
Actuarial loss amortization | — | 737 | 4,995 | ||||||
Termination benefit charge | — | — | 2,477 | ||||||
Settlement charge | 3,325 | 29,767 | 4,082 | ||||||
Curtailment expense | — | — | 254 | ||||||
Net periodic expense | $ | 3,325 | $ | 31,320 | $ | 18,930 | |||
Postretirement Benefit Plans | |||||||||
Components of net periodic benefit cost: | |||||||||
Service cost | $ | 94 | $ | 392 | $ | 253 | |||
Interest cost | 223 | 466 | 661 | ||||||
Expected long-term return on assets | (316 | ) | (457 | ) | (1,122 | ) | |||
Prior service cost amortization | (465 | ) | — | — | |||||
Actuarial gain amortization | — | — | (653 | ) | |||||
Transition obligation amortization | — | — | 44 | ||||||
Settlement charge | 45 | — | — | ||||||
Curtailment gain | (816 | ) | — | — | |||||
Net periodic (income) expense | $ | (1,235 | ) | $ | 401 | $ | (817 | ) | |
Other changes in plan assets and projected benefit obligations recognized in other comprehensive income were as follows:
Years ended December 31, (in thousands) | 2016 | 2015 | 2014 | ||||||
Pension Plans | |||||||||
Net actuarial (gain) loss experienced during the year | $ | — | $ | (394 | ) | $ | 10,495 | ||
Net actuarial loss recognized as expense | (3,352 | ) | (30,478 | ) | (25,433 | ) | |||
Prior service cost recognized as expense | — | — | (246 | ) | |||||
Curtailment loss | — | — | (8,749 | ) | |||||
Total recognized in other comprehensive income (loss) | (3,352 | ) | (30,872 | ) | (23,933 | ) | |||
Postretirement Benefit Plans | |||||||||
Net actuarial (gain) loss experienced during the year | $ | 682 | $ | (645 | ) | $ | 7,649 | ||
Net actuarial gain (loss) recognized as expense | (9 | ) | — | 1,908 | |||||
Prior service cost recognized as income | 780 | — | — | ||||||
Prior service credit during the year | (421 | ) | (4,071 | ) | — | ||||
Prior service cost amortization | 465 | — | — | ||||||
Transition obligation recognized as expense | — | — | (48 | ) | |||||
Total recognized in other comprehensive income (loss) | $ | 1,497 | $ | (4,716 | ) | $ | 9,509 | ||
65
In the first quarter of 2016, Energen incurred a settlement charge of $3.3 million for the payment of lump sums from the non-qualified supplemental retirement plans. In the three months ended March 31, 2016, Energen incurred a curtailment gain of $0.8 million in connection with the reduction in workforce.
In the year ended December 31, 2015, Energen incurred settlement charges of $27.3 million for the payment of lump sums from the qualified defined benefit pension plans. Also in the first quarter of 2015, Energen incurred a settlement charge of $2.5 million for the payment of lump sums from the non-qualified supplemental retirement plans.
During the year ended December 31, 2014, Energen incurred settlement charges of $7.6 million for the payment of lump sums from the qualified defined benefit pension plans of which $3.7 million is included in discontinued operations. Also during 2014, Energen incurred settlement charges of $0.4 million for the payment of lump sums from the non-qualified supplemental retirement plans. In the fourth quarter of 2014, Energen incurred a settlement charge of $1.8 million for the payment of lump sums from the non-qualified supplemental retirement plans which is included in discontinued operations. In the fourth quarter of 2014, Energen recognized a termination benefit charge of $2.5 million to provide for early retirement of certain non-highly compensated employees. In conjunction with the sale of Alagasco, Energen recognized a curtailment loss of $0.3 million in the fourth quarter of 2014.
Estimated amounts to be amortized from accumulated other comprehensive income into postretirement benefit cost during 2017 are included in the table below.
(in thousands) | |||
Amortization of prior service credit | $ | (454 | ) |
Amortization of net actuarial loss | $ | 9 | |
Energen has a long-term disability plan covering most employees. Energen had expense of $0.2 million for each of the years ended December 31, 2016, 2015 and 2014.
Assumptions: The weighted average rate assumptions to determine net periodic benefit costs were as follows:
Years ended December 31, | 2016 | 2015 | 2014 | |||
Pension Plans | ||||||
Discount rate | — | 0.96 | % | 3.66 | % | |
Expected long-term return on plan assets | — | — | 7.00 | % | ||
Rate of compensation increase for pay-related plans | — | — | 3.63 | % | ||
Postretirement Benefit Plans | ||||||
Discount rate | 4.37 | % | 4.25 | % | 4.88 | % |
Expected long-term return on plan assets | 4.96 | % | 6.20 | % | 7.00 | % |
Rate of compensation increase | — | — | 3.60 | % | ||
For the year ended December 31, 2015, the discount rate shown above represents the weighted average for the nonqualified supplemental retirement plan. For the year ended December 31, 2015, the expected long-term return on plan assets no longer applies for our defined benefit pension plan as the assets of the nonqualified supplemental retirement plan are not considered qualifying assets. As the plans were frozen as of December 31, 2014, the rate of compensation increase no longer applies for any of the plans. The weighted average assumptions used to determine the benefit obligations at the measurement date were as follows:
Years ended December 31, | 2016 | 2015 | ||
Pension Plans | ||||
Discount rate | — | 3.90 | % | |
Postretirement Benefit Plans | ||||
Discount rate | 4.30 | % | 4.70 | % |
66
The assumed post-65 health care cost trend rates used to determine the postretirement benefit obligation at the measurement date were as follows:
As of December 31, | 2016 | 2015 | ||
Health care cost trend rate assumed for next year | — | 7.75 | % | |
Rate to which the cost trend rate is assumed to decline | — | 5.00 | % | |
Year that rate reaches ultimate rate | — | 2026 | ||
Health care costs trend rates will not have a material impact to the accumulated postretirement benefit obligation as employees will receive a fixed postretirement benefit.
Investment Strategy: For our postretirement benefit plan assets, we continue to employ a total return investment approach whereby a mix of fixed income investments and equities are used to meet future plan obligations on a long-term basis with a prudent level of risk. Risk tolerance is established through consideration of plan liabilities, plan funded status, corporate financial condition and market conditions.
Energen seeks to maintain an appropriate level of diversification to minimize the risk of large losses in a single asset class. Accordingly, plan assets for the postretirement health care and life insurance benefit plan do not have a concentration of assets in a single entity, industry, commodity or class of investment fund.
The Company’s weighted average plan asset allocations by asset category were as follows:
Pension | Postretirement Benefits | |||||||||||
As of December 31, | Target | 2016 | 2015 | Target | 2016 | 2015 | ||||||
Asset category: | ||||||||||||
Equity securities | — | — | — | 26 | % | 26 | % | 56 | % | |||
Debt securities | — | — | — | 74 | % | 74 | % | 44 | % | |||
Cash and cash equivalents | — | — | 100 | % | — | — | — | |||||
Total | — | — | 100 | % | 100 | % | 100 | % | 100 | % | ||
Equity securities for postretirement benefits do not include the Company’s common stock.
Plan assets included in the funded status of the pension plans were as follows:
December 31, 2015 | |||||||||
(in thousands) | Level 1 | Level 2 | Total | ||||||
Cash and cash equivalents | $ | 27 | $ | — | $ | 27 | |||
Total | $ | 27 | $ | — | $ | 27 | |||
Plan assets included in the funded status of the postretirement benefit plans were as follows:
December 31, 2016 | |||||||||
(in thousands) | Level 1 | Level 2 | Total | ||||||
Cash and cash equivalents | $ | 10 | $ | — | $ | 10 | |||
United States equities | 180 | — | 180 | ||||||
Global equities | 2,158 | — | 2,158 | ||||||
Fixed income | 6,718 | — | 6,718 | ||||||
Total | $ | 9,066 | $ | — | $ | 9,066 | |||
67
December 31, 2015 | |||||||||
(in thousands) | Level 1 | Level 2 | Total | ||||||
United States equities | $ | 4,185 | $ | — | $ | 4,185 | |||
Global equities | 1,650 | — | 1,650 | ||||||
Fixed income | — | 4,534 | 4,534 | ||||||
Total | $ | 5,835 | $ | 4,534 | $ | 10,369 | |||
Energen had no Level 3 postretirement benefit plan assets. United States equities consist of mutual funds with varying strategies. These funds invest largely in medium to large capitalized companies with exposure blending growth, market-oriented and value styles. Additional fund investments include small capitalization companies, and certain of these funds utilize tax-sensitive management approaches. Global equities are mutual funds that invest in non-United States securities broadly diversified across most developed markets with exposure blending growth, market-oriented and value styles. Fixed income securities are high-quality short-duration securities including investment-grade market sectors with tactical investments in non-investment grade sectors.
Cash Flows: Due to restructuring of our plans, Energen no longer qualifies for benefits related to the Medicare Prescription Drug, Improvement and Modernization Act of 2003. The following benefit payments, which reflect expected future service, as appropriate, are anticipated to be paid as follows:
(in thousands) | Postretirement Benefits | |
2017 | $339 | |
2018 | $335 | |
2019 | $336 | |
2020 | $339 | |
2021 | $365 | |
2022-2026 | $1,567 | |
Energen Employee Savings Plan (ESP): The Company sponsors the ESP for the benefit of substantially all employees. The ESP allows eligible employees to contribute a percentage of their annual compensation. The Company makes contributions matching a portion of the employee’s contribution and, additionally, makes employer supplemental contributions as a percentage of each employee’s compensation. Expense associated with Energen contributions to the ESP was $3.3 million, $5.7 million and $3.7 million for the years ended December 31, 2016, 2015 and 2014, respectively.
6. COMMON STOCK PLANS
Stock Incentive Plan: The Stock Incentive Plan provides for the grant of performance share awards and restricted stock units and restricted stock. The Stock Incentive Plan also provides for the grant of non-qualified stock options and incentive stock options to officers and key employees. Under the Stock Incentive Plan, established in 1997, 3,497,920 shares of Energen common stock are reserved for issuance, adjusted for stock splits, with 1,788,492 available for future grants as of December 31, 2016.
Performance Share Awards: The Stock Incentive Plan provides for the grant of performance share awards to eligible employees based on predetermined Energen performance criteria at the end of an award period. The Stock Incentive Plan provides that payment of earned performance share awards be made in the form of Energen common stock.
68
A summary of performance share award activity as of December 31, 2016, and transactions during the years ended December 31, 2016, 2015 and 2014 is presented below:
Stock Incentive Plan | |||||
Shares | Weighted Average Price | ||||
Nonvested at December 31, 2013 | 160,819 | $ | 62.13 | ||
Granted (two-year vesting period) | 937 | 131.56 | |||
Granted (three-year vesting period) | 65,309 | 93.49 | |||
Vested and paid | (14,097 | ) | 70.06 | ||
Nonvested at December 31, 2014 | 212,968 | 71.53 | |||
Granted (three-year vesting period) | 120,372 | 83.94 | |||
Vested and paid | (77,257 | ) | 61.36 | ||
Nonvested at December 31, 2015 | 256,083 | 80.43 | |||
Granted (three-year vesting period) | 167,016 | 25.34 | |||
Vested and paid | (74,176 | ) | 63.88 | ||
Forfeited | (12,481 | ) | 72.30 | ||
Nonvested at December 31, 2016 | 336,442 | $ | 57.03 | ||
Energen recorded expense of $6.2 million, $6.7 million and $6.2 million for the years ended December 31, 2016, 2015 and 2014, respectively, for performance share awards with a related deferred income tax benefit of $2.2 million, $2.4 million and $2.3 million. As of December 31, 2016, there was $6.0 million of total unrecognized compensation cost related to performance share awards. These awards have a remaining weighted average requisite service period of 1.68 years.
Restricted Stock: In addition, the Stock Incentive Plan provides for the grant of restricted stock and restricted stock units (restricted stock awards) which have been valued based on the quoted market price of Energen’s common stock at the date of grant. Restricted stock awards vest within three years from grant date. A summary of restricted stock award activity as of December 31, 2016, and transactions during the years ended December 31, 2016, 2015 and 2014 is presented below:
Stock Incentive Plan | |||||
Awards | Weighted Average Price | ||||
Nonvested at December 31, 2013 | 62,518 | $ | 51.16 | ||
Restricted stock units granted | 48,904 | 71.91 | |||
Vested | (11,848 | ) | 65.94 | ||
Nonvested at December 31, 2014 | 99,574 | 59.60 | |||
Restricted stock units granted | 99,814 | 65.15 | |||
Vested | (14,446 | ) | 53.20 | ||
Nonvested at December 31, 2015 | 184,942 | 63.09 | |||
Restricted stock units granted | 197,473 | 29.89 | |||
Vested | (56,337 | ) | 54.70 | ||
Forfeited | (435 | ) | 40.73 | ||
Nonvested at December 31, 2016 | 325,643 | $ | 44.44 | ||
Energen recorded expense of $5.3 million, $6.0 million and $3.2 million for the years ended December 31, 2016, 2015 and 2014, respectively, related to restricted stock awards, with a related deferred income tax benefit of $1.9 million, $2.1 million and $1.2 million, respectively. As of December 31, 2016, there was $2.4 million of total unrecognized compensation cost related to nonvested restricted stock awards recorded in premium on capital stock. These awards have a remaining requisite service period of 1.77 years.
69
Stock Options: The Stock Incentive Plan provides for the grant of non-qualified stock options, incentive stock options, or a combination thereof to officers and key employees. Options granted under the Stock Incentive Plan provides for the purchase of Energen common stock at not less than the fair market value on the date the option was granted. The sale or transfer of the shares is limited during certain periods. All outstanding options are non-qualified, vest within three years from date of grant and expire 10 years from the grant date.
A summary of stock option activity as of December 31, 2016, and transactions during the years ended December 31, 2016, 2015 and 2014 are presented below:
Stock Incentive Plan | |||||
Shares | Weighted Average Exercise Price | ||||
Outstanding at December 31, 2013 | 1,191,044 | $ | 51.06 | ||
Granted | 110,307 | 72.55 | |||
Exercised | (544,280 | ) | 50.09 | ||
Outstanding at December 31, 2014 | 757,071 | 54.88 | |||
Exercised | (23,680 | ) | 41.42 | ||
Outstanding at December 31, 2015 | 733,391 | 55.32 | |||
Exercised | (22,490 | ) | 44.60 | ||
Outstanding at December 31, 2016 | 710,901 | $ | 55.66 | ||
Exercisable at December 31, 2014 | 454,938 | $ | 51.88 | ||
Exercisable at December 31, 2015 | 622,156 | $ | 53.80 | ||
Exercisable at December 31, 2016 | 676,271 | $ | 54.79 | ||
Energen uses the Black-Scholes pricing model to calculate the fair values of the options awarded. For purposes of this valuation the following assumptions were used to derive the fair values:
Grant date | 4/15/2014 | 1/22/2014 |
Awards granted | 2,439 | 107,868 |
Fair market value of stock option at grant | $32.22 | $27.57 |
Expected life of award | 5.8 years | 5.8 years |
Risk-free interest rate | 1.93% | 2.06% |
Annualized volatility rate | 40.7% | 40.7% |
Dividend yield | 0.2% | 0.8% |
Energen recorded stock option expense of $0.1 million, $0.4 million and $2.9 million during the years ended December 31, 2016, 2015 and 2014, respectively, with a related deferred tax benefit of $44,000, $0.1 million and $1.1 million, respectively.
The total intrinsic value of stock options exercised during the year ended December 31, 2016, was $0.2 million. During the year ended December 31, 2016, Energen received cash of $0.2 million from the exercise of stock options. Total intrinsic value for outstanding options as of December 31, 2016, was $3.3 million and $3.3 million for exercisable options. The fair value of options vested for the year ended December 31, 2016 was $1.6 million. As of December 31, 2016, there was an immaterial amount of unrecognized compensation cost related to outstanding nonvested stock options.
70
The following table summarizes options outstanding as of December 31, 2016:
Stock Incentive Plan | ||
Range of Exercise Prices | Shares | Weighted Average Remaining Contractual Life |
$60.56 | 48,560 | 1.00 year |
$29.79 | 21,791 | 2.00 years |
$46.69 | 26,481 | 3.00 years |
$54.99 | 104,841 | 4.00 years |
$54.11 | 271,164 | 5.00 years |
$48.36 | 124,071 | 6.00 years |
$80.48 | 3,686 | 6.79 years |
$72.39 | 107,868 | 7.00 years |
$79.63 | 2,439 | 7.00 years |
$29.79-$80.48 | 710,901 | 4.91 years |
The weighted average remaining contractual life of currently exercisable stock options is 4.80 years as of December 31, 2016.
Stock Appreciation Rights Plan: The Energen Stock Appreciation Rights Plan provides for the payment of cash incentives measured by the long-term appreciation of Energen common stock. Officers of Energen are not eligible to participate in this Plan. These awards are liability awards which settle in cash and are remeasured each reporting period until settlement. These awards have a three year requisite service period.
A summary of stock appreciation rights activity as of December 31, 2016, and transactions during the years ended December 31, 2016, 2015 and 2014 are presented below:
Stock Appreciation Rights Plan | |||||
Shares | Weighted Average Exercise Price | ||||
Outstanding at December 31, 2013 | 377,377 | $ | 49.48 | ||
Granted | 62,749 | 72.39 | |||
Exercised/forfeited | (164,976 | ) | 52.37 | ||
Outstanding at December 31, 2014 | 275,150 | 52.96 | |||
Exercised/forfeited | (10,283 | ) | 55.18 | ||
Outstanding at December 31, 2015 | 264,867 | 52.88 | |||
Exercised/forfeited | (12,338 | ) | 61.51 | ||
Outstanding at December 31, 2016 | 252,529 | $ | 52.46 | ||
71
Energen issued the following awards with stock appreciation rights. Energen uses the Black-Scholes pricing model to calculate the fair values of the rights awarded. Certain stock appreciation rights have been modified subsequent to the original grant date. For purposes of this valuation the following assumptions were used to derive the fair values as of December 31, 2016:
Grant date | 1/22/2014 | 1/22/2014 | 1/22/2014 | 1/24/2013 | 1/24/2013 | 1/24/2013 | 1/24/2013 |
(modified) | (modified) | (modified) | (modified) | (modified) | |||
Awards granted | 46,710 | 15,517 | 522 | 63,436 | 20,218 | 768 | 3,578 |
Fair market value of award | $13.26 | $8.82 | $7.03 | $20.26 | $17.75 | $16.19 | $13.93 |
Expected life of award | 3.56 years | 2.13 years | 1.63 years | 3.03 years | 2.13 years | 1.63 years | 1.00 year |
Risk-free interest rate | 1.61% | 1.24% | 1.08% | 1.48% | 1.24% | 1.08% | 0.85% |
Annualized volatility rate | 39.1% | 39.1% | 39.1% | 39.1% | 39.1% | 39.1% | 39.1% |
Dividend yield | —% | —% | —% | —% | —% | —% | —% |
Grant date | 1/26/2011 | 1/26/2011 | 1/27/2010 | 1/28/2009 | 2/4/2008 | 2/1/2007 |
(modified) | ||||||
Awards granted | 182,199 | 7,785 | 171,749 | 305,257 | 67,093 | 85,906 |
Fair market value of award | $14.34 | $10.36 | $16.83 | $28.46 | $4.38 | $11.43 |
Expected life of award | 2.03 years | 1.00 year | 1.54 years | 1.04 years | 0.55 years | 0.04 years |
Risk-free interest rate | 1.21% | 0.85% | 1.05% | 0.86% | 0.64% | 0.42% |
Annualized volatility rate | 39.1% | 39.1% | 39.1% | 39.1% | 39.1% | 39.1% |
Dividend yield | —% | —% | —% | —% | —% | —% |
Expense associated with stock appreciation rights of $2.6 million was recorded for the year ended 2016. Income associated with stock appreciation rights of $3.2 million and $0.4 million was recorded for the years ended December 31, 2015 and 2014. During the year ended December 31, 2016, the total intrinsic value of stock appreciation rights exercised was $51,000. During the year ended December 31, 2016, Energen paid $35,000 in settlement of stock appreciation rights.
Petrotech Incentive Plan: The Energen Resources’ Petrotech Incentive Plan provides for the grant of stock equivalent units which may include market conditions. Officers of Energen are not eligible to participate in this Plan. These awards are liability awards which are remeasured each reporting period and settle in cash at completion of the vesting period. Stock equivalent units with service conditions are valued based on Energen’s stock price at the end of the period adjusted to remove the present value of future dividends.
72
A summary of Petrotech unit activity as of December 31, 2016, and transactions during the years ended December 31, 2016, 2015 and 2014 are presented below:
Petrotech Incentive Plan | |||
Shares | |||
Outstanding at December 31, 2013 | 173,292 | ||
Granted | 76,084 | ||
Paid | (4,431 | ) | |
Forfeited | (31,075 | ) | |
Outstanding at December 31, 2014 | 213,870 | ||
Granted (three-year vesting period) | 128,519 | ||
Granted (two-year vesting period) | 297 | ||
Granted (16 month vesting period) | 1,648 | ||
Paid | (78,430 | ) | |
Forfeited | (22,158 | ) | |
Outstanding at December 31, 2015 | 243,746 | ||
Paid | (67,392) | ||
Forfeited | (32,111) | ||
Outstanding at December 31, 2016 | 144,243 | ||
Energen recognized expense of $5.4 million, $3.0 million and $4.5 million during 2016, 2015 and 2014, respectively, related to these units.
1997 Deferred Compensation Plan: The 1997 Deferred Compensation Plan allows officers and non-employee directors to defer certain compensation. Amounts deferred by a participant under the 1997 Deferred Compensation Plan are credited to accounts maintained for a participant in either a stock account or an investment account. The stock account tracks the performance of Energen’s common stock, including reinvestment of dividends. The investment account tracks the performance of certain mutual funds. Energen has funded, and presently plans to continue funding, a trust in a manner that generally tracks participants’ accounts under the 1997 Deferred Compensation Plan. While intended for payment of benefits under the 1997 Deferred Compensation Plan, the trust’s assets remain subject to the claims of our creditors. Amounts earned under the 1997 Deferred Compensation Plan and invested in Energen common stock held by the trust have been recorded as treasury stock, along with the related deferred compensation obligation in the consolidated statements of shareholders’ equity. As of December 31, 2016 there were 573,024 shares reserved for issuance from the 1997 Deferred Compensation Plan.
1992 Energen Corporation Directors Stock Plan: In 1992 Energen adopted the Energen Corporation Directors Stock Plan to pay a portion of the compensation of its non-employee directors in shares of Energen common stock. Under the Plan, 25,470 shares, 11,550 shares and 10,360 shares were awarded during the years ended December 31, 2016, 2015 and 2014, respectively, leaving 90,904 shares reserved for issuance as of December 31, 2016.
Stock Repurchase Authorization: By resolution adopted October 22, 2014, the Board of Directors authorized Energen to repurchase up to 3,600,000 shares of Energen common stock. The resolution does not have an expiration date and does not limit Energen’s authorization to acquire shares in connection with tax withholdings and payment of exercise price on stock compensation plans. There were no shares repurchased pursuant to its repurchase authorization for the years ended December 31, 2016 and 2015. For the year ended December 31, 2014, Energen repurchased and retired 226,839 shares for $14.9 million pursuant to our repurchase authorization. As of December 31, 2016, a total of 3,373,161 shares remain authorized for future repurchase. Energen also from time to time acquires shares in connection with participant elections under Energen’s stock compensation plans. For the years ended December 31, 2016, 2015 and 2014, Energen acquired 88,320 shares, 73,126 shares and 32,768 shares, respectively, in connection with its stock compensation plans.
73
7. DERIVATIVE COMMODITY INSTRUMENTS
The following table details gain (loss) on derivative instruments, net, as follows:
Years ended December 31, (in thousands) | 2016 | 2015 | 2014 | ||||||
Open non-cash mark-to-market gains (losses) on derivative instruments | $ | (71,190 | ) | $ | (281,752 | ) | $ | 315,445 | |
Closed gains (losses) on derivative instruments | (17,287 | ) | 397,045 | 19,574 | |||||
Gain (loss) on derivative instruments, net | $ | (88,477 | ) | $ | 115,293 | $ | 335,019 | ||
The following tables detail the offsetting of derivative assets and liabilities as well as the fair values of derivatives on the balance sheets:
(in thousands) | December 31, 2016 | |||||||||||||||||
Gross Amounts Not Offset in the Balance Sheets | ||||||||||||||||||
Gross Amounts Recognized at Fair Value | Gross Amounts Offset in the Balance Sheets | Net Amount Presented in the Balance Sheets | Financial Instruments | Cash Collateral Received | Net Fair Value Presented in the Balance Sheets | |||||||||||||
Derivatives not designated as hedging instruments | ||||||||||||||||||
Assets | ||||||||||||||||||
Derivative instruments | $ | 1,756 | $ | (1,706 | ) | $ | 50 | $ | — | $ | — | $ | 50 | |||||
Liabilities | ||||||||||||||||||
Derivative instruments | 67,173 | (1,706 | ) | 65,467 | — | — | 65,467 | |||||||||||
Noncurrent derivative instruments | 3,006 | — | 3,006 | — | — | 3,006 | ||||||||||||
Total derivatives | $ | (68,423 | ) | $ | — | $ | (68,423 | ) | $ | — | $ | — | $ | (68,423 | ) | |||
(in thousands) | December 31, 2015 | |||||||||||||||||
Gross Amounts Not Offset in the Balance Sheets | ||||||||||||||||||
Gross Amounts Recognized at Fair Value | Gross Amounts Offset in the Balance Sheets | Net Amount Presented in the Balance Sheets | Financial Instruments | Cash Collateral Received | Net Fair Value Presented in the Balance Sheets | |||||||||||||
Derivatives not designated as hedging instruments | ||||||||||||||||||
Assets | ||||||||||||||||||
Derivative instruments | $ | 72,563 | $ | (15,600 | ) | $ | 56,963 | $ | — | $ | — | $ | 56,963 | |||||
Liabilities | ||||||||||||||||||
Derivative instruments | 16,059 | (15,600 | ) | 459 | — | — | 459 | |||||||||||
Total derivatives | $ | 56,504 | $ | — | $ | 56,504 | $ | — | $ | — | $ | 56,504 | ||||||
Due to the volatility of commodity prices, the estimated fair value of our derivative instruments is subject to fluctuation from period to period, which could result in significant differences between the current estimated fair value and the ultimate settlement price. Additionally, Energen is at risk of economic loss based upon the creditworthiness of our counterparties. We were in a net loss position with fifteen of our active counterparties and in a gain position with the remaining one at December 31, 2016. The counterparty net gain position at December 31, 2016, BP Corporation North America Inc., constituted approximately $0.1 million of Energen’s total net loss on fair value of derivatives.
74
The following table details the effect of derivative commodity instruments in cash flow hedging relationships on the financial statements:
Years ended December 31, (in thousands) | Location on Statements of Income | 2014 | ||||
Net gain recognized in other comprehensive income on derivatives (effective portion), net of tax of $23 | — | $ | 37 | |||
Gain reclassified from accumulated other comprehensive income into income (effective portion) | Gain (loss) on derivative instruments, net | $ | 21,612 | |||
The following table details the effect of open and closed derivative commodity instruments not designated as hedging instruments on the income statement:
Years ended December 31, (in thousands) | Location on Statements of Income | 2016 | 2015 | 2014 | ||||||
Gain (loss) recognized in income on derivatives | Gain (loss) on derivative instruments, net | $ | (88,477 | ) | $ | 115,293 | $ | 313,408 | ||
As of December 31, 2016, Energen entered into the following transactions for 2017 and subsequent years:
Production Period | Description | Total Hedged Volumes | Average Contract Price | |
Oil | ||||
2017 | NYMEX Swaps | 6,060 | MBbl | $49.77 Bbl |
NYMEX Three-Way Collars | 4,800 | MBbl | ||
Ceiling sold price (call) | $62.18 Bbl | |||
Floor purchased price (put) | $45.00 Bbl | |||
Floor sold price (put) | $35.00 Bbl | |||
2018 | NYMEX Three-Way Collars | 3,240 | MBbl | |
Ceiling sold price (call) | $65.03 Bbl | |||
Floor purchased price (put) | $50.00 Bbl | |||
Floor sold price (put) | $40.00 Bbl | |||
Oil Basis Differential | ||||
2017 | WTI/WTI Basis Swaps | 7,890 | MBbl | $(0.58) Bbl |
Natural Gas Liquids | ||||
2017 | Liquids Swaps | 45.4 | MMGal | $0.52 Gal |
2018 | Liquids Swaps | 30.2 | MMGal | $0.60 Gal |
Natural Gas | ||||
2017 | Basin Specific Swaps - Permian | 14.7 | Bcf | $2.85 Mcf |
2017 | NYMEX Swaps | 0.9 | Bcf | $3.29 Mcf |
Natural Gas Basis Differential | ||||
2017 | Permian Swaps | 0.9 | Bcf | $(0.29) Mcf |
WTI - West Texas Intermediate/Midland, WTI - West Texas Intermediate/Cushing | ||||
As of December 31, 2016, the maximum term over which Energen has hedged exposures to the variability of cash flows is through December 31, 2018.
75
Energen enters into three-way collars which are a combination of three options: a sold call, a purchased put and a sold put. The sold call establishes the maximum price that the Company will receive for the contracted commodity volumes. The purchased put establishes the minimum price, above the sold put, that the Company will receive for the contracted volumes. The Company will receive the market price for the contracted volumes if the market price is between the sold call and the purchased put. If, however, the market price for the commodity falls below the sold put strike price, the minimum price that the Company will receive for the contracted volumes equals the market price plus the excess of the purchased put strike price over the sold put strike price.
8. FAIR VALUE MEASUREMENTS
Assets and Liabilities Measured at Fair Value on a Recurring Basis
Energen classifies the fair value of multiple derivative instruments executed under master netting arrangements as net derivative assets and liabilities. The following fair value hierarchy tables present information about Energen’s assets and liabilities measured at fair value on a recurring basis:
December 31, 2016 | |||||||||
(in thousands) | Level 2 | Level 3 | Total | ||||||
Assets | |||||||||
Derivative instruments | $ | 50 | $ | — | $ | 50 | |||
Liabilities | |||||||||
Derivative instruments | (57,927 | ) | (7,540 | ) | (65,467 | ) | |||
Noncurrent derivative instruments | (1,694 | ) | (1,312 | ) | (3,006 | ) | |||
Net derivative liability | $ | (59,571 | ) | $ | (8,852 | ) | $ | (68,423 | ) |
December 31, 2015 | |||||||||
(in thousands) | Level 2 | Level 3 | Total | ||||||
Assets | |||||||||
Derivative instruments | $ | 69,864 | $ | (12,901 | ) | $ | 56,963 | ||
Liabilities | |||||||||
Derivative instruments | 2,699 | (3,158 | ) | (459 | ) | ||||
Net derivative asset (liability) | $ | 72,563 | $ | (16,059 | ) | $ | 56,504 | ||
The fair value of interest rate swaps was a $0.2 million liability at December 31, 2015 and was classified as Level 2 fair value liabilities. The fair value of our interest rate swaps are recognized on a gross basis in accounts payable on the consolidated balance sheet.
Energen prepared a sensitivity analysis to evaluate the hypothetical effect that changes in the prices used to estimate fair value would have on the fair value of its Level 3 instruments. We estimate that a 10 percent increase or decrease in commodity prices would result in an approximate $4.4 million change in the fair value of open Level 3 derivative contracts and to the results of operations.
76
The table below sets forth a summary of changes in the fair value of Energen’s Level 3 derivative commodity instruments as follows:
Years ended December 31, (in thousands) | 2016 | 2015 | 2014 | ||||||
Balance at beginning of period | $ | (16,059 | ) | $ | 24,436 | $ | 18,289 | ||
Realized gains | (14,120 | ) | 13,145 | 22,208 | |||||
Unrealized gains (losses) relating to instruments held at the reporting date* | 5,745 | (40,495 | ) | 2,981 | |||||
Settlements during period | 14,120 | (13,145 | ) | (19,042 | ) | ||||
Transfer out of Level 3 | 1,462 | — | — | ||||||
Balance at end of period | $ | (8,852 | ) | $ | (16,059 | ) | $ | 24,436 | |
*Includes $8.9 million in mark-to-market losses, $16.1 million in mark-to-market losses and $20.2 million in mark-to-market gains for the years ended December 31, 2016, 2015 and 2014, respectively.
Changes in Fair Value Levels: The availability of observable market data is monitored to assess the appropriate classification for financial instruments within the fair value hierarchy. Changes in economic conditions or model-based valuation techniques may require the transfer of financial instruments from one fair value level to another. In such instances, the transfer is reported at the beginning of the reporting period. For the years ended December 31, 2016, 2015 and 2014, except for the transfer out of Level 3 noted below, there were no significant transfers in or out of Levels 1, 2, or 3.
Transfer of Gas Basin Specific Contracts and Gas Basis Contracts: During 2016 the Company determined that its gas basin specific contracts and gas basis contracts met the requirements to be categorized as a Level 2 fair value. The transfer of these assets out of Level 3 was primarily the result of increased price observability of the inputs used in assessing the assets’ fair value throughout the full term of the derivatives.
The tables below set forth quantitative information about Energen’s Level 3 fair value measurements of derivative commodity instruments as follows:
(in thousands, except price data) | Fair Value as of December 31, 2016 | Valuation Technique* | Unobservable Input* | Range | ||
Oil Basis - WTI/WTI | ||||||
2017 | $ | (1,984 | ) | Discounted Cash Flow | Forward Basis | ($0.21 - $0.36) Bbl |
Natural Gas Liquids | ||||||
2017 | $ | (5,556 | ) | Discounted Cash Flow | Forward Basis | $0.65 Gal |
2018 | $ | (1,312 | ) | Discounted Cash Flow | Forward Basis | $0.64 Gal |
*Discounted cash flow represents an income approach in calculating fair value including the referenced unobservable input and a discount reflecting credit quality of the counterparty.
Assets and Liabilities Measured at Fair Value on a Nonrecurring Basis
Certain assets and liabilities are reported at fair value on a nonrecurring basis in Energen’s consolidated balance sheets. The following methods and assumptions were used to estimate the fair values.
Asset retirement obligations: Energen’s asset retirement obligations (ARO) primarily relate to the future plugging, abandonment and reclamation of wells and facilities. We recognize a liability for the fair value of the ARO in the periods incurred. See Note 13, Asset Retirement Obligations, for further discussion related to these ARO’s. These assumptions are classified as Level 3 fair value.
Asset Impairments: We monitor our oil and natural gas properties as well as the market and business environments in which we operate and make assessments about events that could result in potential impairment. Such potential events may include, but are not limited to, commodity price declines, unanticipated increased operating costs, and lower than expected field production performance. If a material event occurs, Energen makes an estimate of undiscounted future cash flows to determine whether the asset is impaired. If the asset is impaired, we will record an impairment loss for the difference between the net book value of the properties and the fair value of the properties. The fair value of the properties typically is estimated using discounted cash flows and values derived from purchase and sale agreements and similar support as applicable. Cash flow and fair value estimates require
77
Energen to make projections and assumptions for pricing, demand, competition, operating costs, legal and regulatory issues, discount rates and other factors for many years into the future.
These assumptions are classified as Level 3 fair value. See Note 14, Asset Impairment, for impairments recognized by Energen during the years ended December 31, 2016, 2015 and 2014.
Financial Instruments Not Carried at Fair Value
The stated value of cash and cash equivalents, short-term investments, accounts receivables (net of allowance), and short-term debt approximates fair value due to the short maturity of the instruments. Short-term investments purchased and sold during 2015 and 2014 of $919 million and $473 million, respectively, are not considered readily convertible into cash and accordingly are not classified in cash and cash equivalents. In addition, the Company also invested in certain short-term investments that qualify and were classified as cash and cash equivalents. The fair value of Energen’s long-term debt, including the current portion and notes payable to banks, approximates $559.9 million and $690.1 million and has a carrying value of $554.0 million and $776.5 million at December 31, 2016 and 2015, respectively. The fair values are based on market prices of similar issues having the same remaining maturities, redemption terms and credit rating. Short-term debt is classified as Level 1 fair value and long-term debt is classified as Level 2 fair value.
Concentration of Credit Risk
Revenues and related accounts receivable from oil and natural gas operations primarily are generated from the sale of produced oil, natural gas liquids and natural gas to energy marketing companies. Such sales are typically made on an unsecured credit basis with payment due the month following delivery. This concentration of sales to the energy marketing industry has the potential to affect Energen’s overall exposure to credit risk, either positively or negatively, in that our oil, natural gas liquids and natural gas purchasers may be affected similarly by changes in economic, industry or other conditions. Energen considers the credit quality of its purchasers and, in certain instances, may require credit assurances such as a deposit, letter of credit or parent guarantee. The two largest purchasers of Energen’s oil, natural gas liquids and natural gas, Plains Marketing, LP (Plains) and Shell Trading (US) Company (Shell), accounted for approximately 50 percent and 20 percent, respectively, of Energen’s accounts receivable for commodity sales as of December 31, 2016. Energen’s other purchasers each accounted for less than 7 percent of these accounts receivable as of December 31, 2016. During the year ended December 31, 2016, Plains and Shell accounted for approximately 52 percent and 12 percent, respectively, of total revenues from oil, natural gas liquids and natural gas sales. All other oil and natural gas purchasers each accounted for less than 10 percent of total revenues for the year ended December 31, 2016.
9. EXPLORATORY COSTS
The following table sets forth capitalized exploratory well costs and includes additions pending determination of proved reserves, reclassifications to proved reserves and costs charged to expense:
Years ended December 31, (in thousands) | 2016 | 2015 | 2014 | ||||||
Capitalized exploratory well costs at beginning of period | $ | 103,588 | $ | 119,439 | $ | 57,600 | |||
Additions pending determination of proved reserves | 344,045 | 634,908 | 946,751 | ||||||
Reclassifications due to determination of proved reserves | (282,637 | ) | (650,759 | ) | (882,254 | ) | |||
Exploratory well costs charged to expense | — | — | (2,658 | ) | |||||
Capitalized exploratory well costs at end of period | $ | 164,996 | $ | 103,588 | $ | 119,439 | |||
The following table sets forth capitalized exploratory wells costs:
(in thousands) | December 31, 2016 | December 31, 2015 | ||||
Exploratory wells in progress (drilling rig not released) | $ | 14,531 | $ | 1,760 | ||
Capitalized exploratory well costs for a period of one year or less | 143,602 | 101,828 | ||||
Capitalized exploratory well costs for a period greater than one year | 6,863 | — | ||||
Total capitalized exploratory well costs | $ | 164,996 | $ | 103,588 | ||
78
At December 31, 2016, Energen had 59 gross exploratory wells either drilling or waiting on results from completion and testing in the Permian Basin. At December 31, 2016, Energen had two gross wells capitalized for a period greater than one year. These wells are scheduled for completion during 2017. No wells were capitalized for a period greater than one year as of December 31, 2015.
10. RECONCILIATION OF EARNINGS PER SHARE
Years ended December 31, | ||||||||||||||||||||||||
(in thousands, except per share amounts) | 2016 | 2015 | 2014 | |||||||||||||||||||||
Net Loss | Shares | Per Share Amount | Net Loss | Shares | Per Share Amount | Net Income | Shares | Per Share Amount | ||||||||||||||||
Basic EPS | $ | (167,513 | ) | 94,476 | $ | (1.77 | ) | $ | (945,731 | ) | 76,078 | $ | (12.43 | ) | $ | 568,032 | 72,897 | $ | 7.79 | |||||
Effect of dilutive securities | ||||||||||||||||||||||||
Stock options | — | — | 216 | |||||||||||||||||||||
Non-vested restricted stock | — | — | 58 | |||||||||||||||||||||
Performance share awards | — | — | 104 | |||||||||||||||||||||
Diluted EPS | $ | (167,513 | ) | 94,476 | $ | (1.77 | ) | $ | (945,731 | ) | 76,078 | $ | (12.43 | ) | $ | 568,032 | 73,275 | $ | 7.75 | |||||
In periods of loss, shares that otherwise would have been included in diluted average commons shares outstanding are excluded. Energen had 330,690 and 355,915 of excluded shares for the years ended December 31, 2016 and 2015, respectively.
Energen had the following shares that were excluded from the computation of diluted EPS, as inclusion would be anti-dilutive.
Years ended December 31, (in thousands) | 2016 | 2015 | 2014 | |||
Stock options | 539 | 114 | 114 | |||
Non-vested restricted stock | — | — | 3 | |||
Performance share awards | — | — | 2 | |||
11. EQUITY OFFERING
During the first quarter of 2016, Energen issued 18,170,000 additional shares of common stock through a public equity offering. We received net proceeds of approximately $381.1 million, after deducting offering expenses. Net proceeds from this offering were used to repay borrowings under our credit facility and for general corporate purposes.
During the second quarter of 2015, Energen issued 5,700,000 additional shares of common stock through a public equity offering. We received net proceeds of approximately $398.6 million, after deducting offering expenses. Net proceeds from this offering were used to repay borrowings under our credit facility and for general corporate purposes.
12. COMMITMENTS AND CONTINGENCIES
Commitments and Agreements: Under various agreements for third-party gathering, treatment, transportation or other services, Energen is committed to deliver minimum production volumes or to pay certain costs in the event the minimum quantities are not delivered. These delivery commitments are approximately 4.2 MMBOE through October 2020.
Environmental Matters: Various environmental laws and regulations apply to the operations of Energen and Energen Resources. Historically, the cost of environmental compliance has not materially affected our financial position, results of operations or cash flows. New regulations, enforcement policies, claims for damages or other events could result in significant unanticipated costs.
79
During January 2014, Energen Resources responded to a General Notice and Information Request from the Environmental Protection Agency regarding the Reef Environmental Site in Sylacauga, Talladega County, Alabama. The letter identifies Energen Resources as a potentially responsible party under The Comprehensive Environmental Response, Compensation, and Liability Act for the cleanup of the Site. In 2008, Energen hired a third party to transport approximately 3,000 gallons of non-hazardous wastewater to Reef Environmental for wastewater treatment. Reef Environmental ceased operating its wastewater treatment system in 2010. Due to its one time use of Reef Environmental for a small volume of non-hazardous wastewater, Energen Resources has not accrued a liability for cleanup of the Site.
Legal Matters: Energen and its affiliates are, from time to time, parties to various pending or threatened legal proceedings and we have accrued a provision for our estimated liability. Certain of these lawsuits include claims for punitive damages in addition to other specified relief. We recognize a liability for contingencies, including an estimate of legal costs to be incurred, when information available indicates both a loss is probable and the amount of the loss can be reasonably estimated. Based upon information presently available, and in light of available legal and other defenses, contingent liabilities arising from threatened and pending litigation are not considered material in relation to the respective financial positions of Energen and its affiliates. It should be noted, however, that there is uncertainty in the valuation of pending claims and prediction of litigation results.
On November 4, 2015, Energen Resources filed a quiet title action against Endeavor Energy Resources, L.P. (Endeavor) in the District Court of Howard County, Texas, to remove a cloud on the title to approximately 10,000 acres leased by Energen Resources in that county. Energen Resources believes the cloud on title arises from a prior, unreleased but partially terminated oil and gas lease covering the leased lands. Endeavor filed a counterclaim alleging Energen Resources tortiously interfered with a prospective contract seeking $300 million in damages. On April 28, 2016, the trial judge ruled with respect to the acreage not held by production that Endeavor’s lease terminated prior to the date Energen Resources entered into its lease and additionally ruled that Endeavor’s claim for tortuous interference will be dismissed with prejudice. The order left several ancillary issues for a later ruling. In November 2016, the trial judge entered a final and appealable judgment with respect to the remaining issues and that judgement has been appealed by Endeavor.
New Mexico Audits: In 2011, Energen Resources received an Order to Perform Restructured Accounting and Pay Additional Royalties (the Order), following an audit performed by the Taxation and Revenue Department (the Department) of the State of New Mexico on behalf of the Office of Natural Resources Revenue (ONRR), of federal oil and gas leases in New Mexico. The audit covered periods from January 2004 through December 2008 and included a review of the computation and payment of royalties due on minerals removed from specified U.S. federal leases. The Order addressed ONRR’s efforts to change accounting and reporting practices, and to unbundle fees charged by third parties that gather, compress and transport natural gas production. ONRR now maintains that all or some of such fees are not deductible.
Energen Resources appealed the Order in 2011 and in July 2012, on a motion from ONRR, the Order was remanded. In August 2014, ONRR issued its Revised Order and Energen Resources appealed the Revised Order. In the Revised Order, ONRR ordered that Energen pay additional royalties on production from certain federal leases in the amount of $129,700. At ONRR’s request the Revised Order was also remanded in August 2015. On April 15, 2016 ONRR issued its Second Revised Order. The Second Revised Order directs Energen Resources to pay additional royalties of $189,000, replacing the previous demand of $129,700. Energen had previously estimated that application of the ONRR position to all of the Company’s federal leases would result in ONRR claims up to approximately $24 million, plus interest and penalties from 2004 forward. ONRR began implementing its unbundling initiative in 2010, but seeks to implement its revisions retroactively, despite the fact that they conflict with previous audits, allowances and industry practice. Energen plans to appeal and vigorously contest the Second Revised Order, the predecessor orders and the findings. Management is unable, at this time, to determine a range of reasonably possible losses, and no amount has been accrued as of December 31, 2016.
Lease Obligations: Energen’s total lease payments included as operating lease expense were $22.6 million, $23.7 million and $24.1 million for the years ended December 31, 2016, 2015 and 2014, respectively. Minimum future rental payments required after 2016 under leases with initial or remaining noncancelable lease terms in excess of one year are as follows:
Years Ending December 31, (in thousands) | |||||
2017 | 2018 | 2019 | 2020 | 2021 | 2022 and thereafter |
$3,822 | $2,614 | $2,448 | $— | $— | $— |
80
13. ASSET RETIREMENT OBLIGATIONS
Energen’s asset retirement obligations primarily relate to the future plugging, abandonment and reclamation of wells and facilities. We recognize a liability for the fair value of the ARO in the periods incurred. The ARO fair value liability is determined by calculating the present value of the estimated future cash outflows we expect to incur to plug, abandon and reclaim our producing properties at the end of their productive lives, and is recognized on a discounted basis incorporating an estimate of performance risk specific to Energen. Subsequent to initial measurement, liabilities are accreted to their present value and capitalized costs are depreciated over the estimated useful lives of the related assets. Upon settlement of the liability, Energen may recognize a gain or loss for differences between estimated and actual settlement costs.
The following table reflects the components of the change in Energen’s ARO balance:
(in thousands) | |||
Balance as of December 31, 2013 | $ | 108,533 | |
Liabilities incurred | 2,266 | ||
Liabilities settled | (1,543 | ) | |
Accretion expense (including discontinued operations of $251) | 7,859 | ||
Revision in estimated cash flows | 692 | ||
Reclassification associated with held for sale properties* | (23,747 | ) | |
Balance as of December 31, 2014 | 94,060 | ||
Liabilities incurred | 981 | ||
Liabilities settled | (686 | ) | |
Accretion expense | 7,108 | ||
Reclassification associated with held for sale properties** | (11,473 | ) | |
Balance as of December 31, 2015 | 89,990 | ||
Liabilities incurred | 230 | ||
Liabilities settled | (758 | ) | |
Accretion expense | 6,672 | ||
Revision in estimated cash flows | (12,875 | ) | |
Reclassification associated with held for sale properties*** | (1,715 | ) | |
Balance as of December 31, 2016 | $ | 81,544 | |
*Asset retirement obligation associated with certain San Juan Basin properties included as liabilities related to assets held for sale in current liabilities on the balance sheet at December 31, 2014.
**Asset retirement obligation associated with certain San Juan Basin properties included as liabilities related to assets held for sale in current liabilities on the balance sheet at December 31, 2015.
***Adjustment to the reclassification of the asset retirement obligation associated with a series of asset sales of certain non-core Permian Basin Assets in the Delaware Basin in Texas and in the San Juan Basin in New Mexico.
81
14. ASSET IMPAIRMENT
Impairments recognized by Energen are presented below:
Years ended December 31, (in thousands) | 2016 | 2015 | 2014 | ||||||
Continuing operations | |||||||||
Permian Basin properties | |||||||||
Central Basin Platform | $ | 187,043 | $ | 484,848 | $ | — | |||
Delaware Basin | 21,288 | 607,303 | 90,594 | ||||||
Midland Basin | — | — | 25,776 | ||||||
San Juan Basin properties | 7,519 | 133,055 | 230,315 | ||||||
Permian Basin unproved leasehold properties | 4,762 | 29,168 | 64,361 | ||||||
San Juan Basin unproved leasehold properties | 40 | 37,934 | 5,755 | ||||||
Total asset impairments from continuing operations | 220,652 | 1,292,308 | 416,801 | ||||||
Discontinued operations | |||||||||
North Louisiana/East Texas oil and natural gas properties | — | — | 1,936 | ||||||
Total asset impairments from discontinued operations | — | — | 1,936 | ||||||
Total asset impairments | $ | 220,652 | $ | 1,292,308 | $ | 418,737 | |||
Non-cash impairment writedowns are reflected in asset impairment on the consolidated income statement.
Permian Basin: During the first quarter of 2016, Energen recognized non-cash impairment writedowns in the Permian Basin of $208.3 million to adjust the carrying amount of these properties to their fair value. We estimate future discounted cash flows in determining fair value using commodity assumptions, which are based on the commodity price curve for five years and then escalated at 3 percent through our assumed price cap. Our commodity price assumptions declined in the first quarter of 2016 by approximately 5 percent for oil and 4 percent for natural gas in comparable periods.
For 2015, Energen recognized non-cash impairment writedowns on certain properties in the Permian Basin of $1,092.2 million to adjust the carrying amount of these properties to their fair value. We estimate future discounted cash flows in determining fair value using commodity assumptions, which are based on the commodity price curve for five years and then escalated at 3 percent through our assumed price cap. During the fourth quarter of 2015, Energen recognized non-cash impairment writedowns of $646.1 million due to commodity price declines and the related impact to our drilling plans. Our commodity price assumptions declined over the third quarter by approximately 12 percent for oil and 6 percent for natural gas in comparable periods. During the third quarter of 2015, Energen recognized non-cash impairment writedowns of $390.2 million due to commodity price declines. Our commodity price assumptions declined over the second quarter by approximately 19 percent for oil and 12 percent for natural gas in comparable periods. During the second quarter of 2015, Energen recognized non-cash impairment writedowns on certain properties in the Central Basin Platform of $51.5 million. Estimated future cash flows were revised due to the receipt of an unsolicited offer for these properties. During the first quarter of 2015, Energen recognized a non-cash impairment writedown of $4.3 million.
During the third and fourth quarters of 2014, Energen recognized non-cash impairment writedowns on certain Permian Basin properties in the Midland Basin of $25.8 million and in the Delaware Basin of $90.6 million, respectively, to adjust the carrying amount of these properties to their fair value based on expected future discounted cash flows.
During 2016, Energen recognized unproved leasehold writedowns primarily on Permian Basin oil properties in the Delaware Basin and the Central Basin Platform of $4.8 million. Energen recognized unproved leasehold writedowns primarily on Permian Basin oil properties in the Delaware Basin of $29.2 million in 2015. During 2014, Energen recognized unproved leasehold writedowns of $64.4 million. These 2014 unproved leasehold writedowns included $55.1 million of expected leasehold expirations.
San Juan Basin: During the first quarter of 2016, Energen recognized non-cash impairment writedowns on held for sale properties in the San Juan Basin of $7.5 million to adjust the carrying amount of these properties to their fair value.
82
Energen recognized non-cash impairment writedowns on properties in the San Juan Basin of $133.1 million during the fourth quarter of 2015 to adjust the carrying amount of these properties to their fair value based on expected future discounted cash flows. These remaining properties were designated as held for sale as of December 31, 2015. At December 31, 2015, proved reserves associated with Energen’s San Juan Basin held for sale properties totaled 16,930 MBOE.
During 2014, non-cash impairment writedowns of $230.3 million were recognized by Energen on certain natural gas properties in the San Juan Basin to adjust the carrying amount of these properties to their fair value based on expected future discounted cash flows and direct market data as these properties were designated as held for sale as of December 31, 2014. At December 31, 2014, proved reserves associated with Energen’s San Juan Basin held for sale properties totaled 69,038 MBOE.
During 2015 and 2014, Energen recognized unproved leasehold writedowns on San Juan Basin properties of $37.9 million and $5.8 million, respectively.
North Louisiana/East Texas: In March 2014, Energen completed the sale of its North Louisiana/East Texas natural gas and oil properties for $30.3 million. The sale had an effective date of December 1, 2013, and the proceeds from the sale were used to repay short-term obligations. Energen recognized non-cash impairment writedowns on these properties in 2014 of $1.9 million to adjust the carrying amount of these properties to their fair value based on an estimate of the selling price of the properties. These non-cash impairment writedowns are reflected in gain on disposal of discontinued operations, net in the year ended December 31, 2014.
15. ACQUISITION AND DISPOSITION OF PROPERTIES
During June, July and August of 2016, Energen completed a series of asset sales of certain non-core Permian Basin assets in the Delaware Basin in Texas and in the San Juan Basin in New Mexico for an aggregate purchase price of $552 million. These transactions had closing dates of June 3, 7, 30, July 15 and August 9 of 2016 with various effective dates ranging from March 1, 2016 to June 30, 2016. Minor portions of the assets were transferred to other parties upon the exercise of preferential purchase rights under pre-existing joint operating agreements in the ordinary course of business. Pre-tax proceeds to Energen were approximately $532.9 million after purchase price adjustments of approximately $19 million related to the operations of the properties subsequent to the effective dates and other one-time adjustments including transfer payments and certain amounts due the buyer, but before consideration of transaction costs of approximately $5 million. In the year ended December 31, 2016, Energen recognized pre-tax gains of $246.3 million on the sales. Energen used proceeds from the sale to fund ongoing operations.
On March 31, 2015, Energen completed the sale of the majority of its natural gas assets in the San Juan Basin in New Mexico and Colorado (effective as of January 1, 2015) for an aggregate purchase price of $395 million. The sales proceeds were reduced by purchase price adjustments of approximately $11 million related to the operations of the San Juan Basin properties subsequent to December 31, 2014 and one-time adjustments related primarily to liabilities assumed by the buyer, which resulted in pre-tax proceeds to Energen of approximately $384 million before consideration of transaction costs of approximately $2.8 million. Energen recognized a pre-tax gain of $27.0 million on the sale. Energen used proceeds from the sale to reduce long-term indebtedness. At December 31, 2014, proved reserves associated with these San Juan Basin properties totaled 69,038 MBOE.
Energen completed an estimated $143.7 million in various purchases and renewals of unproved leasehold largely in the Permian Basin, including approximately $77 million of acreage purchased in Lea County, New Mexico, during 2016. Energen completed an estimated total of $85.7 million in various purchases of unproved leasehold largely in the Permian Basin during 2015. During 2014, Energen completed a total of approximately $68.5 million in various purchases of unproved leasehold properties, including the October 2014, purchase of approximately 15,000 net acres of unproved leasehold in the Mancos formation oil play in the San Juan Basin for $22.8 million.
83
16. HELD FOR SALE PROPERTIES AND DISCONTINUED OPERATIONS
The following table details San Juan Basin held for sale properties by major classes of assets and liabilities. These property sales in the San Juan Basin do not qualify for discontinued operations:
(in thousands) | December 31, 2015 | ||||
Inventories | $ | 3,651 | |||
Oil and natural gas properties | 305,386 | ||||
Less accumulated depreciation, depletion and amortization | (219,059 | ) | |||
Other property and equipment, net | 3,761 | ||||
Total assets held for sale | 93,739 | ||||
Other long-term liabilities | (12,789 | ) | |||
Total liabilities held for sale | (12,789 | ) | |||
Total net assets held for sale | $ | 80,950 | |||
On September 2, 2014, Energen completed the transaction to sell Alagasco to Laclede for $1.6 billion, less the assumption of $267 million in debt. The net pre-tax proceeds to Energen totaled approximately $1.32 billion resulting in a pre-tax gain of $726.5 million. This sale had an effective date of August 31, 2014. Energen used cash proceeds from the sale to reduce long-term and short-term indebtedness. During 2014, Energen classified Alagasco as held for sale and reflected the associated operating results in discontinued operations. Energen’s results of operations and cash flows for the year ended December 31, 2014 presented in our consolidated financial statements and these notes reflect Alagasco as discontinued operations.
We classified as discontinued operations interest on debt required to be extinguished, certain depreciation costs that ended at close of transaction, the related income tax impact of these items and the earnings of Alagasco. In addition, we reclassified from discontinued operations certain general and administrative expenses, other income and the related tax impact from these items. The table below provides a detail of these items included in income (loss) from discontinued operations as follows:
Year ended December 31, (in thousands) | 2014 | ||||
Alagasco net income | $ | 40,646 | |||
Depreciation, depletion and amortization | (408 | ) | |||
General and administrative | 3,337 | ||||
Interest expense | (17,306 | ) | |||
Other income | (347 | ) | |||
Income tax expense | 5,567 | ||||
Alagasco income from discontinued operations | 31,489 | ||||
Energen income (loss) from discontinued operations | (2,197 | ) | |||
Income from discontinued operations | $ | 29,292 | |||
84
Year ended December 31, (in thousands, except per share data) | 2014 | ||||
Natural gas distribution revenues | $ | 397,648 | |||
Oil and natural gas revenues | 5,199 | ||||
Total revenues | $ | 402,847 | |||
Pretax income from discontinued operations | $ | 47,220 | |||
Income tax expense | 17,928 | ||||
Income From Discontinued Operations | $ | 29,292 | |||
Gain on disposal of discontinued operations, net | $ | 724,594 | |||
Income tax expense | 285,497 | ||||
Gain on Disposal of Discontinued Operations, net | $ | 439,097 | |||
Total Income From Discontinued Operations | $ | 468,389 | |||
Diluted Earnings Per Average Common Share | |||||
Income from discontinued operations | $ | 0.40 | |||
Gain on disposal of discontinued operations, net | 5.99 | ||||
Total Income From Discontinued Operations | $ | 6.39 | |||
Basic Earnings Per Average Common Share | |||||
Income from discontinued operations | $ | 0.40 | |||
Gain on disposal of discontinued operations, net | 6.02 | ||||
Total Income From Discontinued Operations | $ | 6.42 | |||
In March 2014, Energen completed the sale of its North Louisiana/East Texas natural gas and oil properties for $30.3 million. The sale had an effective date of December 1, 2013, and the proceeds from the sale were used to repay short-term obligations. Energen recognized non-cash impairment writedowns on these properties in 2014 of $1.9 million pre-tax to adjust the carrying amount of these properties to their fair value based on an estimate of the selling price of the properties. These non-cash impairment writedowns are reflected in gain on disposal of discontinued operations, net in the year ended December 31, 2014.
17. SUPPLEMENTAL CASH FLOW INFORMATION
Supplemental information concerning Energen’s cash flow activities from continuing operations was as follows:
Years ended December 31, (in thousands) | 2016 | 2015 | 2014 | ||||||
Interest paid, net of amount capitalized | $ | 35,919 | $ | 40,747 | $ | 32,172 | |||
Income taxes paid | $ | 562 | $ | 8,114 | $ | 219,505 | |||
Noncash investing activities: | |||||||||
Accrued development, exploration costs and other capital | $ | 79,988 | $ | 79,206 | $ | 207,461 | |||
Capitalized asset retirement obligations costs | $ | 230 | $ | 981 | $ | 2,958 | |||
Receivable from sale of Alabama Gas Corporation | $ | — | $ | — | $ | 8,247 | |||
Noncash financing activities: | |||||||||
Issuance of common stock for employee benefit plans | $ | 6,675 | $ | 5,758 | $ | 2,448 | |||
Treasury stock acquired in connection with tax withholdings | $ | 2,610 | $ | 4,722 | $ | 2,547 | |||
85
18. ACCUMULATED OTHER COMPREHENSIVE INCOME (LOSS)
The following table provides changes in the components of accumulated other comprehensive income (loss), net of the related income tax effects:
(in thousands) | ||||
Balance as of December 31, 2015 | $ | 263 | ||
Other comprehensive income before reclassifications | (459 | ) | ||
Amounts reclassified from accumulated other comprehensive income | 1,601 | |||
Change in accumulated other comprehensive income (loss) | 1,142 | |||
Balance as of December 31, 2016 | $ | 1,405 | ||
The following table provides details of the reclassifications out of accumulated other comprehensive income (loss):
Years ended December 31, (in thousands) | 2016 | 2015 | 2014 | |||||||
Amounts Reclassified | Line Item Where Presented | |||||||||
Gains (losses) on cash flow hedges: | ||||||||||
Commodity contracts | $ | — | $ | — | $ | 21,611 | Gain (loss) on derivative instruments, net | |||
Interest rate swap | — | — | (2,280 | ) | Interest expense | |||||
Total cash flow hedges | — | — | 19,331 | |||||||
Income tax expense | — | — | (7,414 | ) | ||||||
Net of tax | — | — | 11,917 | |||||||
Pension and postretirement plans: | ||||||||||
Transition obligation | — | — | (22 | ) | General and administrative | |||||
Prior service cost | 465 | — | (248 | ) | General and administrative | |||||
Actuarial losses | (3,058 | ) | (30,504 | ) | (21,932 | ) | General and administrative | |||
Total pension and postretirement plans | (2,593 | ) | (30,504 | ) | (22,202 | ) | ||||
Income tax benefit | 992 | 10,676 | 7,771 | |||||||
Net of tax | (1,601 | ) | (19,828 | ) | (14,431 | ) | ||||
Total reclassifications for the period | $ | (1,601 | ) | $ | (19,828 | ) | $ | (2,514 | ) | |
19. RECENTLY ISSUED ACCOUNTING STANDARDS
In August 2016, the Financial Accounting Standards Board (FASB) issued ASU 2016-15, Statement of Cash Flows - Classification of Certain Cash Receipts and Cash Payments. This update apples to all entities that are required to present a statement of cash flows. This update provides guidance on eight specific cash flow issues: debt prepayment or debt extinguishment costs, settlement of zero-coupon debt instruments or other debt instruments with coupon interest rates that are insignificant in relation to the effective interest rate of the borrowing, contingent consideration payments made after a business combination, proceeds from the settlement of insurance claims, proceeds from the settlement of corporate-owned life insurance policies, distributions received from equity method investees, beneficial interests in securitization transactions and separately identifiable cash flows and application of the predominance principle. This update will be effective for financial statements issued for fiscal years beginning after December 31, 2017, including interim periods within those fiscal years with early adoption permitted. This update should be applied using the retrospective transition method. Adoption of this standard will only affect the presentation of the Company’s cash flows and is not expected to have a material impact on the Company’s consolidated financial statements.
In March 2016, the FASB issued ASU No. 2016-09, Improvements to Employee Share-Based Payment Accounting, which makes a number of changes meant to simplify and improve accounting for share-based payments. The amendment is effective for annual periods beginning after December 15, 2016, and interim periods within those annual periods. The adoption of the ASU is not expected to have a material impact on our consolidated financial statements.
86
In February 2016, the FASB issued ASU No. 2016-02, Leases. This update increases transparency and comparability by recognizing lease assets and lease liabilities on the balance sheet and disclosing key information about leasing arrangements. The amendment is effective for fiscal years beginning after December 15, 2018, and interim periods within those fiscal years. The primary effect of adopting the new standard will be to record assets and obligations on the balance sheet for contracts currently recognized as operating leases. We have identified certain applicable leases under the standard and are currently developing an inventory of all applicable leases. The Company is still evaluating the impact of this standard on our consolidated financial statements.
In April 2015, the FASB issued ASU No. 2015-03, Simplifying the Presentation of Debt Issuance Costs. This update requires that debt issuance costs related to a recognized debt liability be presented in the balance sheet as a direct deduction from the carrying amount of that debt liability, consistent with debt discounts. The amendment is effective for fiscal years beginning on or after December 15, 2015, and interim periods within those fiscal years. We reclassified the related prior year amount on the balance sheet to conform to the current year presentation. In August 2015, the FASB issued ASU No. 2015-15, Presentation and Subsequent Measurement of Debt Issuance Costs Associated with Line-of-Credit Arrangements. This update clarifies the guidance regarding line-of-credit arrangements with regards to ASU 2015-03. ASU 2015-15 allows entities to defer and present debt issue costs as an asset and subsequently amortize the deferred debt issue costs ratably over the term of the line-of-credit arrangement. The adoption of ASU No. 2015-03 did not have a material impact on the consolidated financial statements of Energen. The additional disclosures are included in Note 3, Long-Term Debt.
In August 2014, the FASB issued ASU 2014-15, Disclosure of Uncertainties about an Entity’s Ability to Continue as a Going Concern. This update codifies management’s responsibility to evaluate whether there is substantial doubt about an entity’s ability to continue as a going concern and to provide related footnote disclosures. The guidance is effective for interim and annual periods ending after December 15, 2016 and early adoption is permitted. The adoption of the amendments in this ASU did not impact the Company's financial position or results of operations.
In May 2014, the FASB issued ASU No. 2014-09, Revenue from Contracts with Customers. This update is based on the principle that revenue is recognized to depict the transfer of goods or services to customers in an amount that reflects the consideration to which the entity expects to be entitled in exchange for those goods or services. It also requires additional disclosure about the nature, amount, timing and uncertainty of revenue and cash flows arising from customer contracts. Companies may apply this update retrospectively or using a modified retrospective approach to adjust retained earnings. In August 2015, the FASB issued ASU No. 2015-14, Revenue from Contracts with Customers, which deferred the effective date of ASU No. 2014-09 to annual periods beginning after December 15, 2017, including interim reporting periods within that reporting period. The Company expects to adopt using the modified retrospective method of adoption on January 1, 2018. We continue to evaluate the impact of this standard on our individual customer contracts, however, due to the short length of our revenue cycle, we do not expect and have not identified any significant impacts to the consolidated financial statements.
20. SUMMARIZED QUARTERLY FINANCIAL DATA (Unaudited)
The following data summarizes quarterly operating results:
Year ended December 31, 2016 | ||||||||||||
(in thousands, except per share amounts) | First | Second | Third | Fourth | ||||||||
Revenues | $ | 128,219 | $ | 105,765 | $ | 184,385 | $ | 114,520 | ||||
Operating income (loss) | $ | (301,811 | ) | $ | 68,875 | $ | 90,302 | $ | (68,596 | ) | ||
Income (loss) from continuing operations | $ | (203,116 | ) | $ | 36,759 | $ | 53,314 | $ | (54,470 | ) | ||
Net income (loss) | $ | (203,116 | ) | $ | 36,759 | $ | 53,314 | $ | (54,470 | ) | ||
Diluted earnings per average common share | ||||||||||||
Continuing operations | $ | (2.34 | ) | $ | 0.38 | $ | 0.55 | $ | (0.56 | ) | ||
Net income (loss) | $ | (2.34 | ) | $ | 0.38 | $ | 0.55 | $ | (0.56 | ) | ||
Basic earnings per average common share | ||||||||||||
Continuing operations | $ | (2.34 | ) | $ | 0.38 | $ | 0.55 | $ | (0.56 | ) | ||
Net income (loss) | $ | (2.34 | ) | $ | 0.38 | $ | 0.55 | $ | (0.56 | ) | ||
87
Year ended December 31, 2015 | ||||||||||||
(in thousands, except per share amounts) | First | Second | Third | Fourth | ||||||||
Revenues | $ | 221,858 | $ | 168,326 | $ | 295,571 | $ | 192,799 | ||||
Operating loss | $ | (12,409 | ) | $ | (161,678 | ) | $ | (348,214 | ) | $ | (915,550 | ) |
Loss from continuing operations | $ | (15,420 | ) | $ | (111,601 | ) | $ | (227,904 | ) | $ | (590,806 | ) |
Net loss | $ | (15,420 | ) | $ | (111,601 | ) | $ | (227,904 | ) | $ | (590,806 | ) |
Diluted earnings per average common share | ||||||||||||
Continuing operations | $ | (0.21 | ) | $ | (1.52 | ) | $ | (2.89 | ) | $ | (7.50 | ) |
Net loss | $ | (0.21 | ) | $ | (1.52 | ) | $ | (2.89 | ) | $ | (7.50 | ) |
Basic earnings per average common share | ||||||||||||
Continuing operations | $ | (0.21 | ) | $ | (1.52 | ) | $ | (2.89 | ) | $ | (7.50 | ) |
Net loss | $ | (0.21 | ) | $ | (1.52 | ) | $ | (2.89 | ) | $ | (7.50 | ) |
21. OIL AND NATURAL GAS OPERATIONS (Unaudited)
Capitalized Costs: The following table sets forth capitalized costs:
(in thousands) | December 31, 2016 | December 31, 2015 | ||||
Proved | $ | 7,543,464 | $ | 7,911,554 | ||
Unproved | 196,888 | 150,674 | ||||
Total capitalized costs | 7,740,352 | 8,062,228 | ||||
Accumulated depreciation, depletion and amortization | 3,723,669 | 3,673,569 | ||||
Capitalized costs, net | $ | 4,016,683 | $ | 4,388,659 | ||
Costs Incurred: The following table sets forth costs incurred in property acquisition, exploration and development activities and includes both capitalized costs and costs charged to expense during the year:
Years ended December 31, (in thousands) | 2016 | 2015 | 2014 | ||||||
Property acquisition: | |||||||||
Proved | $ | 4,066 | $ | 1,866 | $ | 2,582 | |||
Unproved | 143,667 | 85,690 | 68,514 | ||||||
Exploration | 349,463 | 649,764 | 972,164 | ||||||
Development | 89,624 | 372,177 | 408,949 | ||||||
Total costs incurred | $ | 586,820 | $ | 1,109,497 | $ | 1,452,209 | |||
88
Results of Operations From Producing Activities: The following table sets forth results of Energen’s oil, natural gas liquids and natural gas operations from producing activities:
Years ended December 31, (in thousands) | 2016 | 2015 | 2014 | ||||||
Gross revenues* | $ | 532,889 | $ | 878,554 | $ | 1,679,213 | |||
Production (lifting costs) | 214,652 | 285,760 | 376,495 | ||||||
Exploration expense | 5,415 | 14,877 | 28,090 | ||||||
Depreciation, depletion and amortization including asset impairments | 663,659 | 1,880,190 | 960,539 | ||||||
Accretion expense | 6,672 | 7,108 | 7,608 | ||||||
Income tax expense (benefit) | (123,153 | ) | (469,362 | ) | 99,469 | ||||
Results of operations from producing activities | $ | (234,356 | ) | $ | (840,019 | ) | $ | 207,012 | |
* The years ended December 31, 2016, 2015 and 2014 gross revenues include a pre-tax non-cash mark-to-market loss on derivatives of $71.2 million, a pre-tax non-cash mark-to-market loss on derivatives of $281.8 million and a pre-tax non-cash mark-to-market gain on derivatives of $315.4 million, respectively.
Oil and Natural Gas Reserves: The calculation of proved reserves is made pursuant to rules prescribed by the SEC. Such rules, in part, require that proved categories of reserves be disclosed. Proved reserves and associated values were calculated using twelve-month average prices and current costs for the years ended December 31, 2016, 2015 and 2014. Changes to prices and costs could have a significant effect on the disclosed amount of proved reserves and their associated values. In addition, the estimation of proved reserves inherently requires the use of geologic and engineering estimates which are subject to revision as reservoirs are produced and developed and as additional information is available. Accordingly, the amount of actual future production may vary significantly from the amount of proved reserves disclosed. The proved reserves are located onshore in the United States of America.
Estimates of physical quantities of oil and natural gas proved reserves were determined by Company engineers. Ryder Scott Company, L.P. (Ryder Scott), independent oil and natural gas reservoir engineers, have audited the estimates of proved reserves of oil, natural gas liquids and natural gas that Energen has attributed to its net interests in oil and natural gas properties as of December 31, 2016. Ryder Scott audited the proved reserve estimates for substantially all of the Permian Basin proved reserves. The independent reservoir engineers have issued reports covering approximately 99 percent of Energen’s ending proved reserves indicating that in their judgment the estimates are reasonable in the aggregate.
Year ended December 31, 2016 | Oil MBbl | NGL MBbl | Natural Gas MMcf | Total MMBOE | ||||
Proved reserves at beginning of period | 210,691 | 71,713 | 433,904 | 354.7 | ||||
Revisions of previous estimates | (17,840 | ) | (6,800 | ) | (7,779 | ) | (26.0 | ) |
Purchases | 103 | 21 | 89 | 0.1 | ||||
Extensions and discoveries | 45,129 | 10,480 | 50,780 | 64.1 | ||||
Production | (13,213 | ) | (3,892 | ) | (27,204 | ) | (21.6 | ) |
Sales | (25,295 | ) | (13,476 | ) | (97,542 | ) | (55.0 | ) |
Proved reserves at end of period | 199,575 | 58,046 | 352,248 | 316.3 | ||||
Proved developed reserves at end of period | 101,202 | 29,767 | 187,117 | 162.1 | ||||
Proved undeveloped reserves at end of period | 98,373 | 28,279 | 165,131 | 154.2 | ||||
89
Year ended December 31, 2015 | Oil MBbl | NGL MBbl | Natural Gas MMcf | Total MMBOE | ||||
Proved reserves at beginning of period | 181,227 | 73,463 | 707,926 | 372.7 | ||||
Revisions of previous estimates | (39,537 | ) | (11,979 | ) | (44,176 | ) | (58.9 | ) |
Purchases | 2 | 1 | 2 | 0.0 | ||||
Extensions and discoveries | 83,319 | 25,530 | 143,022 | 132.6 | ||||
Production | (14,023 | ) | (4,065 | ) | (35,604 | ) | (24.0 | ) |
Sales | (297 | ) | (11,237 | ) | (337,266 | ) | (67.7 | ) |
Proved reserves at end of period | 210,691 | 71,713 | 433,904 | 354.7 | ||||
Proved developed reserves at end of period | 108,319 | 36,374 | 236,112 | 184.0 | ||||
Proved undeveloped reserves at end of period | 102,372 | 35,339 | 197,792 | 170.7 | ||||
Year ended December 31, 2014 | Oil MBbl | NGL MBbl | Natural Gas MMcf | Total MMBOE | ||||
Proved reserves at beginning of period | 164,870 | 63,011 | 719,725 | 347.8 | ||||
Revisions of previous estimates | (48,548 | ) | (15,165 | ) | (71,806 | ) | (75.7 | ) |
Purchases | 88 | 26 | 116 | 0.1 | ||||
Extensions and discoveries | 76,722 | 29,695 | 141,209 | 130.0 | ||||
Production | (11,818 | ) | (4,104 | ) | (59,562 | ) | (25.8 | ) |
Sales | (87 | ) | — | (21,756 | ) | (3.7 | ) | |
Proved reserves at end of period | 181,227 | 73,463 | 707,926 | 372.7 | ||||
Proved developed reserves at end of period | 118,697 | 47,621 | 589,074 | 264.5 | ||||
Proved undeveloped reserves at end of period | 62,530 | 25,842 | 118,852 | 108.2 | ||||
2016 Activities: Energen had net downward reserve revisions during 2016 which totaled 26.0 MMBOE including approximately 10.6 MMBOE related to changes in year-end pricing and downward revisions of approximately 22.9 MMBOE of proved undeveloped reserves that will no longer be developed in the five-year time horizon due to development being delayed to focus on other assets with higher returns. Net upward reserve revisions of 7.5 MMBOE due to factors other than price included increased lateral length, lower lease operating expense and improved well performance partially offset by changes in plant yields.
Energen purchased 0.1 MMBOE of reserves during 2016 primarily related to the acquisition of oil properties in the Permian Basin.
During 2016, Energen had extensions and discoveries of 64.1 MMBOE of which 65 percent were proved undeveloped reserves and 35 percent were proved developed reserves. Extension drilling resulted in no discoveries with exploratory drilling providing 64.1 MMBOE of discoveries.
During 2016, Energen had sales of 55 MMBOE primarily due to the sale of certain non-core Permian Basin assets in the Delaware Basin in Texas and in the San Juan Basin in New Mexico.
2015 Activities: Energen had net downward reserve revisions during 2015 which totaled 58.9 MMBOE including negative revisions of approximately 38.0 MMBOE related to changes in year-end pricing and negative revisions of approximately 8.2 MMBOE of proved undeveloped reserves that are now expected to be drilled after the original five year period. Other negative revisions were 5.5 MMBOE due to increased declines in certain Wolfberry wells and 5.0 MMBOE of Wolfcamp reserves due to interference caused by our wellbore placement geometry.
During 2015, Energen had extensions and discoveries of 132.6 MMBOE, primarily in the Permian Basin, of which 78 percent were proved undeveloped reserves and 22 percent were proved developed reserves. Extension drilling resulted in 3.1 MMBOE of discoveries with exploratory drilling providing 129.5 MMBOE of discoveries.
During 2015, Energen had sales of 67.7 MMBOE primarily due to the sale of certain natural gas assets in the San Juan Basin.
90
2014 Activities: Energen had net downward reserve revisions during 2014 which totaled 75.7 MMBOE including downward revisions of approximately 53.4 MMBOE of proved undeveloped reserves that are now expected to be drilled after the original five year period and upward revisions of approximately 3.9 MMBOE related to changes in year-end pricing. The San Juan Basin had upward reserve revisions of 1.6 MMBOE including 4.4 MMBOE related to changes in year-end pricing and downward revisions of approximately 1.5 MMBOE due to higher operating costs. Net downward reserve revisions of 77.3 MMBOE in the Permian Basin were due to reclassifying 53.4 MMBOE as unproved because of changes in our development plans, downward revisions of approximately 13.3 MMBOE due to decreased well performance in certain Wolfberry wells, downward revisions of approximately 5.4 due to higher operating costs and approximately 0.5 MMBOE related to changes in the year-end pricing.
Energen purchased 0.1 MMBOE of reserves during 2014 primarily related to the acquisition of oil properties in the Permian Basin.
During 2014, Energen had extensions and discoveries of 130.0 MMBOE of which 70 percent were proved undeveloped reserves and 30 percent were proved developed reserves. Extension drilling resulted in 89.6 MMBOE of discoveries with exploratory drilling providing 40.4 MMBOE of discoveries. The San Juan Basin added 1.1 MMBOE of reserves through the drilling or identification of 16 well locations and 10 pay adds. The Permian Basin added 128.6 MMBOE of reserves primarily through the drilling or identification of 361 well locations.
During 2014, Energen had sales of 3.7 MMBOE primarily due to the sale of the North Louisiana/East Texas primarily natural gas properties.
Standardized Measure of Discounted Future Net Cash Flows Relating to Proved Oil and Natural Gas Reserves: The standardized measure of discounted future net cash flows is not intended, nor should it be interpreted, to present the fair market value of Energen’s crude oil and natural gas reserves. An estimate of fair market value would take into consideration factors such as, but not limited to, the recovery of reserves not presently classified as proved reserves, anticipated future changes in prices and costs, and a discount factor more representative of the time value of money and the risks inherent in reserve estimates. Open mark-to-market derivatives applicable to future periods are excluded from the calculation of standardized measure of future net cash flows.
Years ended December 31, (in thousands) | 2016 | 2015 | 2014 | ||||||
Future gross revenues | $ | 9,191,808 | $ | 11,714,729 | $ | 20,971,672 | |||
Future production costs | 3,126,153 | 4,353,974 | 7,532,273 | ||||||
Future development costs | 1,632,577 | 1,961,661 | 1,784,738 | ||||||
Future income tax expense | 762,921 | 1,065,887 | 3,440,582 | ||||||
Future net cash flows | 3,670,157 | 4,333,207 | 8,214,079 | ||||||
Discount at 10% per annum | 2,320,350 | 2,299,859 | 3,994,423 | ||||||
Standardized measure of discounted future net cash flows relating to proved oil and natural gas reserves | $ | 1,349,807 | $ | 2,033,348 | $ | 4,219,656 | |||
91
The following are the principal sources of changes in the standardized measure of discounted future net cash flows:
Years ended December 31, (in thousands) | 2016 | 2015 | 2014 | ||||||
Balance at beginning of year | $ | 2,033,348 | $ | 4,219,656 | $ | 4,017,841 | |||
Revisions to reserves proved in prior years: | |||||||||
Net changes in prices, production costs and future development costs | (221,639 | ) | (2,861,591 | ) | (1,147,028 | ) | |||
Net changes due to revisions in quantity estimates | (167,188 | ) | (404,708 | ) | (1,285,394 | ) | |||
Development costs incurred, previously estimated | 71,099 | 350,560 | 337,198 | ||||||
Accretion of discount | 203,335 | 421,966 | 401,784 | ||||||
Changes in timing and other* | (100,742 | ) | (903,975 | ) | 987,652 | ||||
Total revisions | (215,135 | ) | (3,397,748 | ) | (705,788 | ) | |||
New field discoveries and extensions, net of future production and development costs | 352,358 | 776,315 | 2,321,028 | ||||||
Sales of oil and gas produced, net of production costs | (440,446 | ) | (514,380 | ) | (1,054,553 | ) | |||
Purchases | 1,733 | 8 | 4,241 | ||||||
Sales | (235,222 | ) | (372,039 | ) | (21,092 | ) | |||
Net change in income taxes | (146,829 | ) | 1,321,536 | (342,021 | ) | ||||
Net change in standardized measure of discounted future net cash flows | (683,541 | ) | (2,186,308 | ) | 201,815 | ||||
Balance at end of year | $ | 1,349,807 | $ | 2,033,348 | $ | 4,219,656 | |||
*Amount represents changes in production timing and other. In 2015, the production timing is significantly affected by changes related to the delay of the drilling program. For 2014, the production timing is significantly affected by changes related to the acceleration of the horizontal drilling program and the delay of the vertical drilling program.
92
ITEM 9. | CHANGES IN AND DISAGREEMENTS WITH ACCOUNTANTS ON ACCOUNTING AND FINANCIAL DISCLOSURE |
None
ITEM 9A. CONTROLS AND PROCEDURES
a. Disclosure Controls and Procedures
Our disclosure controls and procedures (as defined in Rules 13a-15(e) and 15d-15(e) of the Securities Exchange Act of 1934) are designed to provide reasonable assurance of achieving their objectives and, as of the end of the period covered by this report, our chief executive officer and chief financial officer concluded that our disclosure controls and procedures are effective at that reasonable assurance level.
b. Management’s Report on Internal Control Over Financial Reporting
Management is responsible for establishing and maintaining adequate internal control over financial reporting as defined in Rules 13a-15(f) and 15d-15(f) under the Securities Exchange Act of 1934. Energen Corporation’s internal control over financial reporting is a process designed to provide reasonable assurance regarding the reliability of financial reporting and the preparation of financial statements for external purposes in accordance with accounting principles generally accepted in the United States of America. Internal control over financial reporting includes those written policies and procedures that:
i | pertain to the maintenance of records that, in reasonable detail, accurately and fairly reflect the transactions and dispositions of the assets of Energen Corporation; |
ii | provide reasonable assurance that transactions are recorded as necessary to permit preparation of financial statements in accordance with accounting principles generally accepted in the United States of America, and that receipts and expenditures of Energen Corporation are being made only in accordance with authorization of management and directors of Energen Corporation; and |
iii | provide reasonable assurance regarding prevention or timely detection of unauthorized acquisition, use or disposition of assets that could have a material effect on the consolidated financial statements. |
Because of its inherent limitations, internal control over financial reporting may not prevent or detect misstatements. Also, projections of any evaluation of effectiveness to future periods are subject to the risk that controls may become inadequate because of changes in conditions, or that the degree of compliance with the policies or procedures may deteriorate.
Management assessed the effectiveness of Energen Corporation’s internal control over financial reporting as of December 31, 2016. Management based this assessment on criteria for effective internal control over financial reporting described in “Internal Control - Integrated Framework” (2013) issued by the Committee of Sponsoring Organizations of the Treadway Commission. Management’s assessment included an evaluation of the design of Energen Corporation’s internal control over financial reporting and testing of the operational effectiveness of its internal control over financial reporting. Management reviewed the results of its assessment with the Audit Committee of our Board of Directors.
Based on this assessment, management determined that, as of December 31, 2016, Energen Corporation maintained effective internal control over financial reporting. The effectiveness of Energen Corporation’s internal control over financial reporting as of December 31, 2016 has been audited by PricewaterhouseCoopers, LLP, an independent registered public accounting firm, as stated in their report which appears herein.
c. Changes in Internal Control Over Financial Reporting
Our chief executive officer and chief financial officer have concluded that during the most recent fiscal quarter covered by this report there were no changes in our internal control over financial reporting that materially affected or are reasonably likely to materially affect our internal control over financial reporting.
93
PART III
ITEM 10. DIRECTORS, EXECUTIVE OFFICERS AND CORPORATE GOVERNANCE
Information regarding the executive officers of Energen is included in Part I. The other information required by Item 10 is incorporated herein by reference from Energen’s definitive proxy statement for the Annual Meeting of Shareholders to be held May 3, 2017. The definitive proxy statement will be filed on or about March 22, 2017.
ITEM 11. EXECUTIVE COMPENSATION
The information regarding executive compensation is incorporated herein by reference from Energen’s definitive proxy statement for the Annual Meeting of Shareholders to be held May 3, 2017.
ITEM 12. | SECURITY OWNERSHIP OF CERTAIN BENEFICIAL OWNERS AND MANAGEMENT AND RELATED STOCKHOLDER MATTERS |
a. Security Ownership of Certain Beneficial Owners
The information regarding the security ownership of the beneficial owners of more than five percent of Energen’s common stock is incorporated herein by reference from Energen’s definitive proxy statement for the Annual Meeting of Shareholders to be held May 3, 2017.
b. Security Ownership of Management
The information regarding the security ownership of management is incorporated herein by reference from Energen’s definitive proxy statement for the Annual Meeting of Shareholders to be held May 3, 2017.
c. Securities Authorized for Issuance Under Equity Compensation Plans
The following table summarizes information concerning securities authorized for issuance under equity compensation plans as of December 31, 2016:
Plan Category | Number of Securities to be Issued for Outstanding Options, Performance Share Awards and Restricted Stock Units | Weighted Average Exercise Price | Number of Securities Remaining Available for Future Issuance Under Equity Compensation Plans | |||
Equity compensation plans approved by security holders* | 1,709,900 | $ | 54.06 | 2,452,420 | ||
Equity compensation plans not approved by security holders | — | — | — | |||
Total | 1,709,900 | $ | 54.06 | 2,452,420 | ||
*These plans include 1,788,492 shares associated with Energen’s Stock Incentive Plan, 90,904 shares associated with the 1992 Energen Corporation Directors Stock Plan and 573,024 shares associated with the 1997 Deferred Compensation Plan.
ITEM 13. CERTAIN RELATIONSHIPS AND RELATED TRANSACTIONS, AND DIRECTOR INDEPENDENCE
The information regarding certain relationships and related transactions, and director independence is incorporated herein by reference from Energen’s definitive proxy statement for the Annual Meeting of Shareholders to be held May 3, 2017.
ITEM 14. PRINCIPAL ACCOUNTANT FEES AND SERVICES
The information regarding Principal Accountant Fees and Services is incorporated herein by reference from Energen’s definitive proxy statement for the Annual Meeting of Shareholders to be held May 3, 2017.
94
PART IV
ITEM 15. EXHIBITS AND FINANCIAL STATEMENT SCHEDULES
a. Documents Filed as Part of This Report
(1) | Financial Statements |
The consolidated financial statements of Energen are included in Item 8 of this Form 10-K.
(2) Financial Statement Schedules
No financial statement schedules are required to be files as part of this Form 10-K or they are inapplicable.
(3) Exhibits
The exhibits listed on the accompanying Index to Exhibits are filed as part of this Form 10-K.
95
Energen Corporation
INDEX TO EXHIBITS
Item 14(a)(3)
Exhibit | |
Number | Description |
*3(a) | Restated Certificate of Incorporation of Energen Corporation (composite, as amended April 29, 2005) which was filed as Exhibit 3(a) to Energen’s Quarterly Report on Form 10-Q for the quarterly period ended March 31, 2005 |
*3(b) | Articles of Amendment to Restated Certificate of Incorporation of Energen, designating Series 1998 Junior Participating Preferred Stock (July 27, 1998) which was filed as Exhibit 4(b) to Energen’s Post Effective Amendment No. 1 to Registration Statement on Form S-3 (Registration No. 333-00395) |
*3(c) | Bylaws of Energen Corporation (as amended through July 23, 2008) which was filed as Exhibit 99.1 to Energen’s Current Report on Form 8-K, dated July 25, 2008 |
*4(a) | Form of Indenture between Energen Corporation and The Bank of New York, as Trustee, which was dated as of September 1, 1996 (the “Energen 1996 Indenture”), and which was filed as Exhibit 4(i) to the Registrant’s Registration Statement on Form S-3 (Registration No. 333-11239) |
*4(a)(i) | Officers’ Certificate, dated September 13, 1996, pursuant to Section 301 of the Energen 1996 Indenture setting forth the terms of the Series A Notes which was filed as Exhibit 4(d)(i) to Energen’s Annual Report on Form 10-K for the year ended September 30, 2001 |
*4(a)(ii) | Officers’ Certificate, dated July 8, 1997, pursuant to Section 301 of the Energen 1996 Indenture amending the terms of the Series A Notes which was filed as Exhibit 4(d)(ii) to Energen’s Annual Report on Form 10-K for the year ended September 30, 2001 |
*4(a)(iii) | Amended and Restated Officers’ Certificate, dated February 27, 1998, setting forth the terms of the Series B Notes which was filed as Exhibit 4(d)(iii) to Energen’s Annual Report on Form 10-K for the year ended September 30, 2001 |
*4(a)(iv) | Officers’ Certificate, dated August 5, 2011, pursuant to Section 301 of the Energen 1996 Indenture setting forth the terms of the 4.65 percent Senior Notes due September 1, 2021, which was filed as Exhibit 4.1 to Energen’s Current Report on Form 8-K, dated August 5, 2011 |
*10(a) | Credit Agreement dated September 2, 2014, by and among Energen Corporation, as Borrower, Wells Fargo Bank, National Association, as Administrative Agent, which was filed as Exhibit 10.1 to Energen’s Current Report on Form 8-K filed September 2, 2014 |
*10(b) | First Amendment to the Credit Agreement dated as of October 20, 2014, by and among Energen Corporation, as Borrower, Wells Fargo Bank, National Association, as Administrative Agent, Energen Resources Corporation, as Guarantor, and the institutions named therein as lenders, which was filed as Exhibit 10.1 to Energen’s Current Report on Form 8-K filed October 20, 2014 |
*10(b)(i) | Second Amendment to the Credit Agreement dated as of April 16, 2015, by and among Energen Corporation, as Borrower, Wells Fargo Bank, National Association, as Administrative Agent, Energen Resources Corporation, as Guarantor, and the institutions named therein as lenders, which was filed as Exhibit 10.1 to Energen’s Current Report on Form 8-K filed April 20, 2015 |
*10(b)(ii) | Third Amendment to the Credit Agreement dated as of October 20, 2015, by and among Energen Corporation, as Borrower, Wells Fargo Bank, National Association, as Administrative Agent, Energen Resources Corporation, as Guarantor, and the institutions named therein as lenders, which was filed as Exhibit 10.1 to Energen’s Current Report on Form 8-K filed October 23, 2015 |
*10(b)(iii) | Fourth Amendment to the Credit Agreement dated as of April 13, 2016, by and among Energen Corporation, as Borrower, Wells Fargo Bank, National Association, as Administrative Agent, Energen Resources Corporation, as Guarantor, and the institutions named therein as lenders, which was filed as Exhibit 10.1 to Energen’s Current Report on Form 8-K filed April 14, 2016 |
96
*10(b)(iv) | Fifth Amendment to the Credit Agreement dated as of October 25, 2016, by and among Energen Corporation, as Borrower, Wells Fargo Bank, National Association, as Administrative Agent, Energen Resources Corporation, as Guarantor, and the institutions named therein as lenders, which was filed as Exhibit 10.1 to Energen’s Current Report on Form 8-K filed October 26, 2016 |
*10(c) | Commitment Increase Letter dated November 17, 2014, by and among Energen Corporations, as Borrower, Wells Fargo Bank, National Association, as Administrative Agent, and the institutions named therein as lenders, which was filed as Exhibit 10.1 to Energen’s Current Report on Form 8-K filed October 17, 2014 |
10(d) | Form of Severance Compensation Agreement between Energen Corporation and its executive officers |
10(e) | Energen Corporation Stock Incentive Plan (as amended effective January 1, 2017) |
*10(f) | Form of Stock Option Agreement under the Energen Corporation Stock Incentive Plan which was filed as Exhibit 10(r) to Energen’s Annual Report on Form 10-K for the year ended December 31, 2012 |
*10(g) | Form of Restricted Stock Agreement under the Energen Corporation Stock Incentive Plan which was filed as Exhibit 10(s) to Energen’s Annual Report on Form 10-K for the year ended December 31, 2012 |
*10(h) | Form of Restricted Stock Unit Agreement under the Energen Corporation Stock Incentive Plan which was filed as Exhibit 10.2 to Energen’s Current Report on Form 8-K filed December 12, 2013 |
*10(i) | Form of Performance Share Award under the Energen Corporation Stock Incentive Plan which was filed as Exhibit 10(t) to Energen’s Annual Report on Form 10-K for the year ended December 31, 2012 |
*10(j) | Energen Corporation 1997 Deferred Compensation Plan (as amended and restated) effective October 22, 2014 |
*10(k) | Energen Corporation Directors Stock Plan (as amended April 28, 2010) which was filed as an attachment to Energen’s definitive Proxy Statement on Schedule 14A , filed March 19, 2010 |
*10(l) | Energen Corporation Annual Incentive Compensation Plan, as amended effective January 1, 2016, which was filed as Exhibit 10 to Energen’s Quarterly Report on Form 10-Q for the quarterly period ended March 31, 2016 |
21 | Subsidiaries of Energen Corporation |
23(a) | Consent of Registered Public Accounting Firm (PricewaterhouseCoopers LLP) |
23(b) | Consent of Independent Oil and Gas Reservoir Engineers (Ryder Scott Company, L.P.) |
24 | Power of Attorney |
31(a) | Energen Corporation Certification of Chief Executive Officer pursuant to Rule 13a-14(a) or 15d-14(a) |
31(b) | Energen Corporation Certification of Chief Financial Officer pursuant to Rule 13a-14(a) or 15d-14(a) |
32 | Energen Corporation Certification pursuant to 18 U.S.C. Section 1350 |
99(a) | Reserve Audit – Ryder Scott & Company, L.P. |
101 | The financial statements and notes thereto from Energen Corporation’s Annual Report on Form 10-K for the year ended December 31, 2016 are formatted in XBRL |
*Incorporated by reference | |
97
SIGNATURE
Pursuant to the requirements of Section 13 or 15(d) of the Securities Exchange Act of 1934, the registrant has duly caused this report to be signed on its behalf by the undersigned, thereunto duly authorized.
ENERGEN CORPORATION
(Registrant)
February 28, 2017 | By | /s/ J.T. McManus, II | |
J.T. McManus, II Chairman, Chief Executive Officer and President of Energen Corporation; | |||
98
SIGNATURES
Pursuant to the requirements of the Securities Exchange Act of 1934, this report has been signed by the following persons on behalf of the registrant and in the capacities and on the dates indicated.
February 28, 2017 | By | /s/ J.T. McManus, II | |
J.T. McManus, II Chairman, Chief Executive Officer and President of Energen Corporation | |||
February 28, 2017 | By | /s/ Charles W. Porter, Jr. | |
Charles W. Porter, Jr. Vice President, Chief Financial Officer and Treasurer of Energen Corporation | |||
February 28, 2017 | By | /s/ Russell E. Lynch, Jr. | |
Russell E. Lynch, Jr. Vice President and Controller of Energen Corporation | |||
February 28, 2017 | * | ||
Kenneth W. Dewey Director | |||
February 28, 2017 | * | ||
M. James Gorrie Director | |||
February 28, 2017 | * | ||
Jay Grinney Director | |||
February 28, 2017 | * | ||
William G. Hargett Director | |||
February 28, 2017 | * | ||
Frances Powell Hawes Director | |||
February 28, 2017 | * | ||
Alan A. Kleier Director | |||
*By | /s/ Charles W. Porter, Jr. | ||
Charles W. Porter, Jr. Attorney-in-Fact | |||
99