Attached files
| file | filename |
|---|---|
| EX-99.1 - EXHIBIT 99.1 - UCP, Inc. | a12312016ucppressrelease.htm |
| 8-K - 8-K - UCP, Inc. | ucpq420168-kcoverresults.htm |

© 2017 UCP | CONFIDENTIAL1
February 27, 2017
4Q16 Earnings Presentation

Forward-Looking Statements
© 2017 UPC | CONFIDENTIAL2
We make forward-looking statements in this presentation that are subject to risks,
uncertainties and assumptions. All statements other than statements of historical fact
included in this presentation are forward-looking statements. You can identify forward-
looking statements by the fact that they do not relate strictly to historical facts. These
statements may include words such as “may,” “might,” “will,” “should,” “expects,” “plans,”
“anticipates,” “believes,” “estimates,” “predicts,” “potential” “project,” “goal,” “intend” or
“continue,” the negative of these terms and other comparable terminology. These forward-
looking statements may include projections of our future financial or operating performance,
our anticipated growth strategies, anticipated trends in our business and other future events
or circumstances. These statements are based on our current expectations and projections
about future events and may prove to be inaccurate.
Forward-looking statements involve numerous risks and uncertainties and you should not
rely on them as predictions of future events. Forward-looking statements depend on
assumptions, data or methods which may prove to be incorrect or imprecise and may prove
to be inaccurate. We do not guarantee that the transactions and events described in any
forward-looking statements will happen as described (or that they will happen at all). The
following factors, among others, could cause actual results and future events to differ
materially from those set forth or contemplated in the forward-looking statements: economic
changes, either nationally or in the markets in which we operate, including declines in
employment, volatility of mortgage interest rates, declines in consumer sentiment and an
increase in inflation; downturns in the homebuilding industry, either nationally or in the
markets in which we operate; continued volatility and uncertainty in the credit markets and
broader financial markets; the operating performance of our business; changes in our
business and investment strategy; availability of land to acquire and our ability to acquire
land on favorable terms or at all; availability, terms and deployment of capital; disruptions in
the availability of mortgage financing or increases in the number of foreclosures in our
markets; shortages of or increased prices for labor, land or raw materials used in housing
construction; delays or restrictions in land development or home construction, or reduced
consumer demand resulting from adverse weather and geological conditions or other events
outside our control; the cost and availability of insurance and surety bonds; changes in, or
the failure or inability to comply with, governmental laws and regulations; the timing of
receipt of regulatory approvals and the opening of communities; the degree and nature of
our competition; our leverage and debt service obligations; our future operating expenses,
which may increase disproportionately to our revenue; our ability to achieve operational
efficiencies with future revenue growth; our relationship, and actual and potential conflicts of
interest, with PICO, which owns a majority economic interest in UCP, LLC; and availability
of, and our ability to retain, qualified personnel. For a further discussion of these and other
factors, see the “Risk Factors” disclosed in our Annual Report on Form 10-K for the year
ended December 31, 2016, which is filed with the Securities and Exchange Commission. In
light of these risks and uncertainties, the forward-looking statements discussed in this
presentation might not occur.
You are cautioned not to place undue reliance on forward-looking statements, which speak
only as of the date of this presentation. While forward-looking statements reflect our good
faith beliefs, they are not guarantees of future performance, and our actual results could
differ materially from those expressed in any forward-looking statement. We disclaim any
obligation to publicly update or revise any forward-looking statement to reflect changes in
underlying assumptions or factors, new information, data or methods, future events or other
changes, except as required by law.
© 2017 UCP | CONFIDENTIAL3
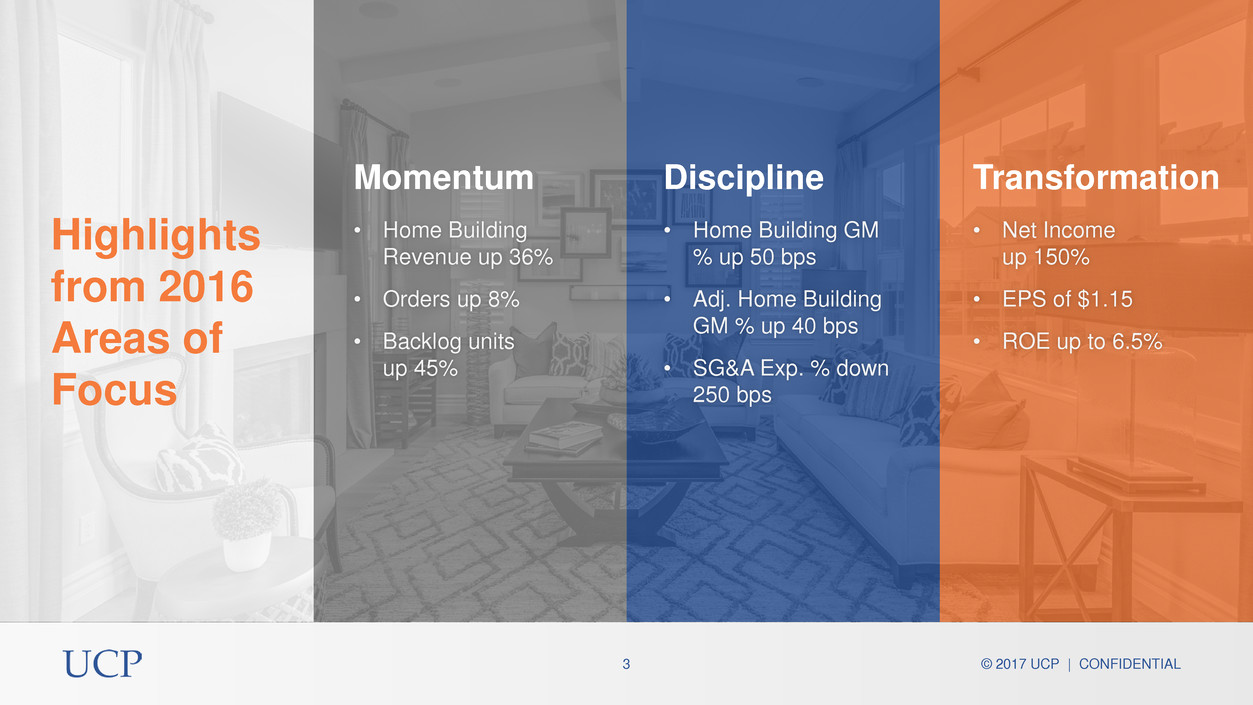
• Home Building
Revenue up 36%
• Orders up 8%
• Backlog units
up 45%
Highlights
from 2016
Areas of
Focus
Momentum
• Home Building GM
% up 50 bps
• Adj. Home Building
GM % up 40 bps
• SG&A Exp. % down
250 bps
Discipline
• Net Income
up 150%
• EPS of $1.15
• ROE up to 6.5%
Transformation

© 2017 UCP | CONFIDENTIAL4
Homebuilding
Revenue
($MM)
+36%
New Home
Orders
+8%
2016 Homebuilding Deliveries, Revenue & Orders
$252.6
$343.9
FY15 FY16
Deliveries by Region
27%
73%
Southeast FY16 West FY16
860 933
FY15 FY16
Homes
Delivered
+17%
701
820
FY15 FY16
Average Selling
Price
($000)
+16%
$360
$419
FY15 FY16
© 2017 UCP | CONFIDENTIAL5
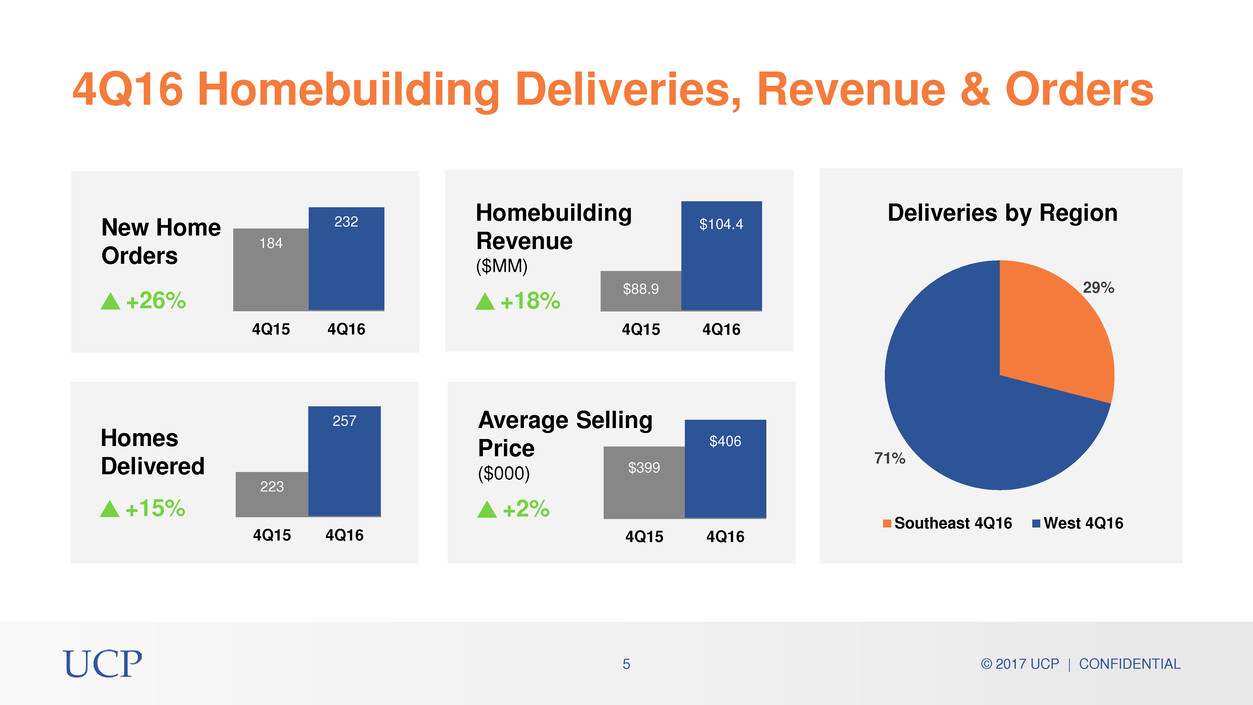
Homebuilding
Revenue
($MM)
+18%
$88.9
$104.4
4Q15 4Q16
29%
71%
Southeast 4Q16 West 4Q16
Deliveries by Region
New Home
Orders
+26%
184
232
4Q15 4Q16
Homes
Delivered
+15%
223
257
4Q15 4Q16
Average Selling
Price
($000)
+2%
$399
$406
4Q15 4Q16
4Q16 Homebuilding Deliveries, Revenue & Orders

© 2017 UCP | CONFIDENTIAL6
Backlog & Lots
249
362
4Q15 4Q16
Homes in Backlog
4,284 4,075
1,594
2,563
4Q15 4Q16
West Southeast
5,878
6,638
Lots by Region1
(1) ‘Lots by Region’ denotes owned & controlled lots as of December 31, 2016.
$108.8
$149.6
4Q15 4Q16
Backlog Value
($MM)
+38% +45%

© 2017 UCP | CONFIDENTIAL7
• 4Q16 and FY16 homebuilding gross margin
increased 60bps and 50bps, respectively,
from prior year
• Balancing pre-sales and spec sales
• Controlling price to help manage pace
• Focus on construction cost containment
• FY16 incentives decreased by 50bps to
2.1% of HB Revenue
(1) Adjusted homebuilding gross margin is a non-GAAP financial measure. The most directly comparable GAAP financial measure is
homebuilding gross margin. A discussion of adjusted homebuilding gross margin is included in the Appendix hereto, as well as a
reconciliation between homebuilding gross margin and adjusted homebuilding gross margin.
Strong Homebuilding
Gross Margin 18.0% 18.6%
4Q15 4Q16
17.8% 18.3%
FY15 FY16
21.1% 20.9%
4Q15 4Q16
20.3% 20.7%
FY15 FY16
Homebuilding
Gross Margin
Adj.
Homebuilding
Gross Margin1
© 2017 UCP | CONFIDENTIAL8
(1) Adjusted homebuilding gross margin is a non-GAAP financial measure. The most directly comparable GAAP financial measure is
homebuilding gross margin. A discussion of adjusted homebuilding gross margin is included in the Appendix hereto, as well as a
reconciliation between homebuilding gross margin and adjusted homebuilding gross margin.
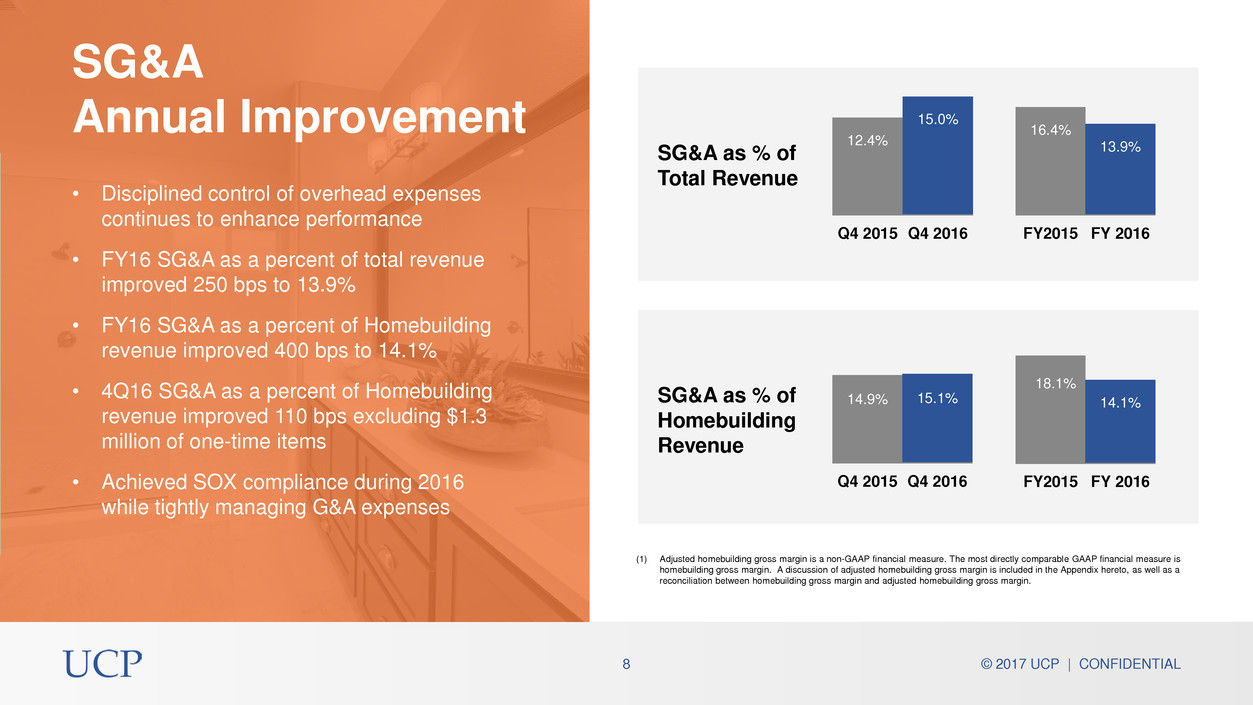
SG&A
Annual Improvement
SG&A as % of
Total Revenue
SG&A as % of
Homebuilding
Revenue
16.4%
13.9%
FY2015 FY 2016
18.1%
14.1%
FY2015 FY 2016
12.4%
15.0%
Q4 2015 Q4 2016
14.9% 15.1%
Q4 2015 Q4 2016
• Disciplined control of overhead expenses
continues to enhance performance
• FY16 SG&A as a percent of total revenue
improved 250 bps to 13.9%
• FY16 SG&A as a percent of Homebuilding
revenue improved 400 bps to 14.1%
• 4Q16 SG&A as a percent of Homebuilding
revenue improved 110 bps excluding $1.3
million of one-time items
• Achieved SOX compliance during 2016
while tightly managing G&A expenses

© 2017 UCP | CONFIDENTIAL9
Earnings & Returns Up
Earnings Per Share Return on Equity
$0.30
$1.15
FY15 FY16
2.7%
6.5%
FY15 FY16
$0.40
$0.89
4Q15 4Q16

© 2017 UCP | CONFIDENTIAL10
Core EPS (2)
(1) The valuation allowance applies only to net income (loss) attributable to UCP, Inc. Noncontrolling interest adjusted for non-recurring items excluding the impact from the valuation allowance removal.
(2) Core EPS is a non-GAAP financial measure. The most directly comparable GAAP financial measure is EPS. Core EPS is used by management in understanding the underlying earnings performance of the Company without the impact of
income and expenses that are not in the normal and ordinary course of the Company’s business.
Earnings Per Share Attributable to UCP, Inc.
4Q16 FY16 4Q16 FY16
Net income (loss) attributable to UCP,
Inc., as reported $7,151 $9,238 $0.89 $1.15
UCP, Inc. share of Non-Recurring
items, Net of Tax
$554 $3,006 $0.07 $0.37
Valuation Allowance Removal (1) $(5,482) $(5,482) $ (0.68) $ (0.68)
Core Net income (loss) attributable to
UCP, Inc.
$ 2,223 $6,762 $0.28 $0.84
Diluted Shares Outstanding 8,009,350 8,064,728 8,009,350 8,064,728
© 2017 UCP | CONFIDENTIAL11
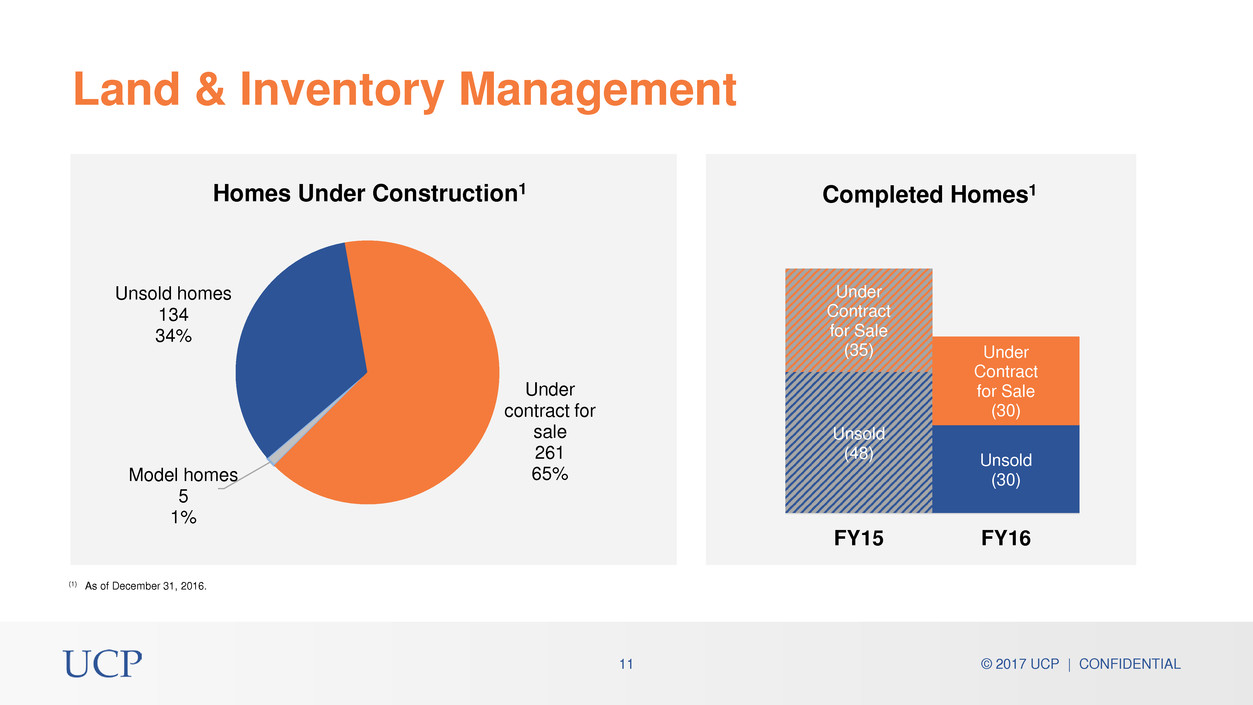
Land & Inventory Management
Model homes
5
1%
Unsold homes
134
34%
Under
contract for
sale
261
65%
Homes Under Construction1 Completed Homes1
(1) As of December 31, 2016.
Unsold
(48) Unsold
(30)
Under
Contract
for Sale
(35) Under
Contract
for Sale
(30)
FY15 FY16

© 2017 UCP | CONFIDENTIAL12
(1) The ratio of net debt-to-capital is a non-GAAP financial measure. The most directly comparable GAAP financial measure is the ratio of debt-to-capital. We believe that our leverage ratios provide useful information to the users of our financial statements regarding
our financial position and cash and debt management. A discussion of net debt-to-capital is included in the Appendix hereto, as well as a reconciliation between net-debt-to capital and debt-to-capital.
(2) Interest coverage is computed using EBIT, a non-GAAP financial measure. EBIT is computed by adding interest expense to pre-tax income calculated in accordance with GAAP. A reconciliation between EBIT and pre-tax income is included in the appendix hereto.
The interest coverage ratio is calculated by comparing EBIT to interest expensed.
(3) Interest coverage calculated on a last twelve months’ basis.
($ in millions, except where noted) Dec 31, 2016 Dec 31, 2015
Cash $40.9 $39.8
Real Estate Inventory $373.2 $361.0
Debt $161.0 $156.0
Equity $226.9 $217.4
Debt-to-Capital 41.5% 41.8%
Net Debt-to-Capital1 37.3% 37.6%
Cash to total Capital 10.6% 10.7%
Interest Coverage2,3 1.4 times 1.0 times
Balance Sheet Strength
Current Capitalization Dec 31, 2016
Cash
Cash & Cash Equivalents $40.9
Debt
Variable Interest Notes $81.3
Fixed Interest Notes $5.6
8.5% Senior Notes Due 2017 $74.9
Debt Issuance Cost ($0.7)
Total Debt $161.0
Total Equity $226.9

© 2017 UCP | CONFIDENTIAL13
$72.5
$155.4
$252.6
$343.9
FY13 FY14 FY15 FY16
Homebuilding
Revenue
• Continuous innovation in home design for
the way new home buyers want to live
• Strong commitment to best-in-class
construction standards
• Customer-driven experience that continues
long after purchase
• Consistent winner of Eliant Homebuyers’
Choice Awards for our exemplary
customer service
• Deliveries up more than 400% since 2013
Brand Promise Resonating
68%
CAGR

© 2017 UCP | CONFIDENTIAL14
3.6%
3.3%
2.5% 2.5%
1.9% 1.8%
1.6%
1.2%
Seattle San Jose Nashville Riverside Charlotte Fresno U.S.
Average
Myrtle
Beach
Employment Growth
(YoY % Change)
Source: John Burns Real Estate Consulting. Employment Data as of 11/2016. Months Supply Data as of 12/2016
Vibrant Markets Create Foundation for Growth
0.7
1.0
1.3
2.9
3.6
3.8 3.9
Seattle San Jose Fresno Charlotte U.S.
Average
Nashville Riverside
Resale Months of Supply
(2016)

© 2017 UCP | CONFIDENTIAL15
2017
Focus
Areas
Momentum
Discipline
Operational Excellence
Strengthening the Benchmark Brand

© 2017 UCP | CONFIDENTIAL16
2017 Outlook
Home
Deliveries
Homebuilding
Revenue ($MM)
During 2017 we will seek to:
• Continue growing home deliveries and revenue
• Maintain stable gross margin
• Expand backlog
• Strengthen position in existing markets
• Enhance customer experience
• Drive higher ROE
432
701
820
925-975
2014 2015 2016 2017E
(1) CAGR projection calculated to midpoint of 2017E range
30%
$155
$253
$344
$390-$410
2014 2015 2016 2017E
37%
CAGR1
CAGR1

© 2017 UCP | CONFIDENTIAL17
Appendix

© 2017 UCP | CONFIDENTIAL18
(1) Adjusted homebuilding gross margin is a non-GAAP financial measure. The most directly comparable GAAP financial measure is homebuilding gross margin. A discussion of adjusted homebuilding gross margin is included in the Appendix hereto, as well as a reconciliation
between homebuilding gross margin and adjusted homebuilding gross margin.
Three Months Ended December 31, Twelve Months Ended December 31,
($ in millions, except where noted) 2016 2015 2016 2015
Net Orders 232 184 933 860
Homebuilding Deliveries 257 223 820 701
ASP (000s) $406 $399 $419 $360
Revenue
Homebuilding $104.4 $88.9 $343.9 $252.6
Land development $0.1 $18.0 $5.4 $21.1
Other $— $— $— $5.1
Total revenue $104.6 $106.9 $349.4 $278.8
Homebuilding Gross Margin 18.6% 18.0% 18.3% 17.8%
Homebuilding Adjusted Gross Margin ¹ 20.9% 21.1% 20.7% 20.3%
Operating Expense
Sales and marketing $5.7 $5.7 $19.3 $18.9
General and administrative $10.1 $7.6 $29.2 $26.9
Goodwill impairment $— $— $4.2 $—
Total operating expense $15.7 $13.3 $52.6 $45.8
Other income, net $0.0 $0.0 $0.3 $0.2
Net income (loss) before income taxes $3.7 $7.7 $9.2 $5.9
Provision for income taxes $5.6 $(0.1) $5.3 $(0.1)
Net income (loss) $9.3 $7.6 $14.4 $5.8
Totals may not add due to roundingFinancial Summary

© 2017 UCP | CONFIDENTIAL19
(1) Adjusted homebuilding gross margin percentage is a non-GAAP financial measure. The most directly comparable GAAP financial measure is homebuilding gross margin. Adjusted gross margin is defined as gross margin plus capitalized interest, impairment and abandonment charges. We use adjusted gross margin
information as a supplemental measure when evaluating our operating performance. We believe this information is meaningful, because it isolates the impact that leverage and non-cash impairment and abandonment charges have on gross margin. However, because adjusted gross margin information excludes interest
expense and impairment and abandonment charges, all of which have real economic effects and could materially impact our results, the utility of adjusted gross margin information as a measure of our operating performance is limited. In addition, other companies may not calculate adjusted gross margin information in the
same manner that we do. Accordingly, adjusted gross margin information should be considered only as a supplement to gross margin information as a measure of our performance. The table above provides a reconciliation of adjusted gross margin numbers to the most comparable GAAP financial measure.
Three Months Ended December 31, Year Ended December 31,
($ in thousands) 2016 % 2015 % 2016 % 2015 %
Consolidated Gross Margin & Adjusted Gross
Margin
Revenue $104,565 100.0% $106,870 100.0% $349,368 100.0% $278,791 100.0%
Cost of Sales 85,171 81.5% 85,952 80.4% 287,840 82.4% 227,324 81.5%
Gross Margin 19,394 18.5% 20,918 19.6% 61,528 17.6% 51,467 18.5%
Add: interest in cost of sales 2,429 2.3% 2,176 2.0% 8,118 2.3% 5,592 2.0%
Add: impairment and abandonment charges 17 − 929 0.9% 3,112 0.9% 1,075 0.4%
Adjusted Gross Margin(1) $21,840 20.9% $24,023 22.5% $72,758 20.8% $58,134 20.9%
Consolidated Gross margin percentage 18.5% 19.6% 17.6% 18.5%
Consolidated Adjusted gross margin percentage(1) 20.9% 22.5% 20.8% 20.9%
Homebuilding Gross Margin & Adjusted Gross
Margin
Homebuilding revenue $104,438 100.0% $88,892 100.0% $343,919 100.0% $252,597 100.0%
Cost of home sales 85,053 81.4% 72,926 82.0% 281,072 81.7% 207,670 82.2%
Homebuilding gross margin 19,385 18.6% 15,966 18.0% 62,847 18.3% 44,927 17.8%
Add: interest in cost of home sales 2,418 2.3% 1,908 2.1% 7,737 2.2% 5,275 2.1%
Add: impairment and abandonment charges − − 923 1.0% 458 0.1% 1,042 0.4%
Adjusted homebuilding gross margin(1) $21,803 20.9% $18,797 21.1% $71,042 20.7% $51,244 20.3%
Homebuilding gross margin percentage 18.6% 18.0% 18.3% 17.8%
Adjusted homebuilding gross margin percentage(1) 20.9% 21.1% 20.7% 20.3%
Appendix – Gross Margin and Adj. Gross Margin Reconciliation
© 2017 UCP | CONFIDENTIAL20
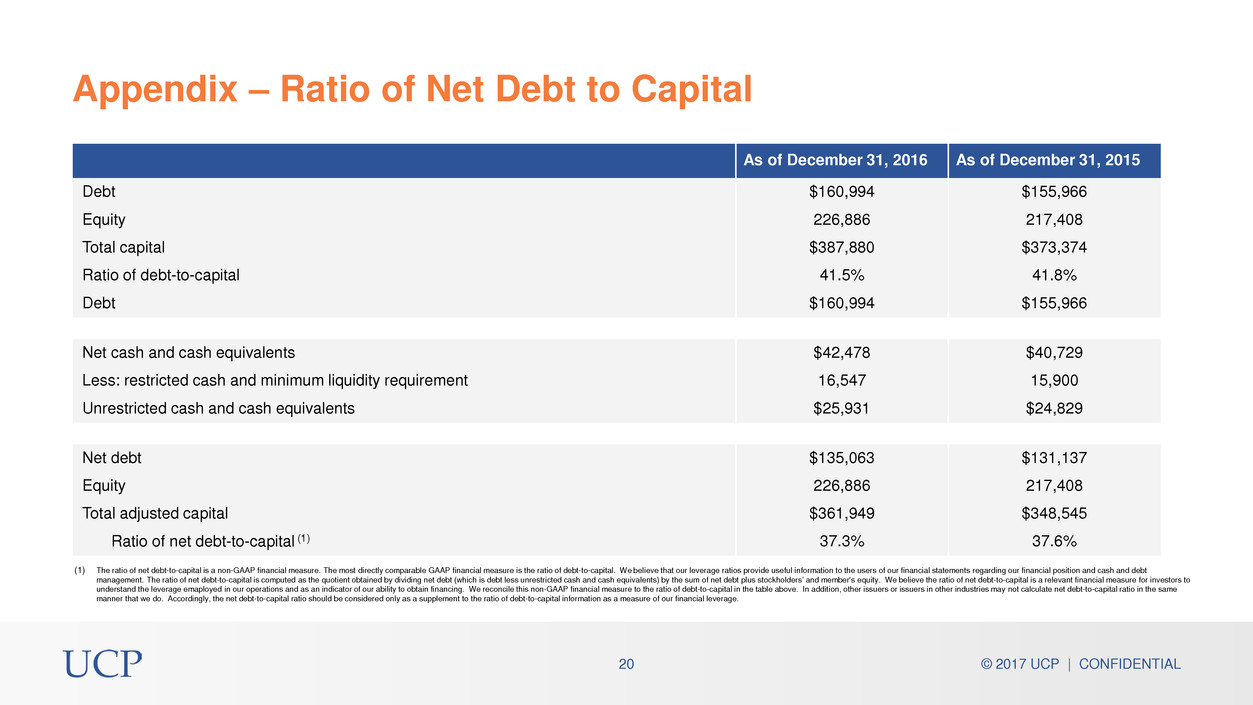
(1) The ratio of net debt-to-capital is a non-GAAP financial measure. The most directly comparable GAAP financial measure is the ratio of debt-to-capital. We believe that our leverage ratios provide useful information to the users of our financial statements regarding our financial position and cash and debt
management. The ratio of net debt-to-capital is computed as the quotient obtained by dividing net debt (which is debt less unrestricted cash and cash equivalents) by the sum of net debt plus stockholders’ and member's equity. We believe the ratio of net debt-to-capital is a relevant financial measure for investors to
understand the leverage emaployed in our operations and as an indicator of our ability to obtain financing. We reconcile this non-GAAP financial measure to the ratio of debt-to-capital in the table above. In addition, other issuers or issuers in other industries may not calculate net debt-to-capital ratio in the same
manner that we do. Accordingly, the net debt-to-capital ratio should be considered only as a supplement to the ratio of debt-to-capital information as a measure of our financial leverage.
As of December 31, 2016 As of December 31, 2015
Debt $160,994 $155,966
Equity 226,886 217,408
Total capital $387,880 $373,374
Ratio of debt-to-capital 41.5% 41.8%
Debt $160,994 $155,966
Net cash and cash equivalents $42,478 $40,729
Less: restricted cash and minimum liquidity requirement 16,547 15,900
Unrestricted cash and cash equivalents $25,931 $24,829
Net debt $135,063 $131,137
Equity 226,886 217,408
Total adjusted capital $361,949 $348,545
Ratio of net debt-to-capital (1) 37.3% 37.6%
Appendix – Ratio of Net Debt to Capital

© 2017 UCP | CONFIDENTIAL21
(1) EBIT (“earnings before interest & tax”) is a non-GAAP financial measure. The most directly comparable GAAP financial measure is net income before taxes. EBIT is computed from GAAP pre-taxable income by adding back interest expense. We believe that EBIT provides useful information to the users of our financial
statements regarding our operating profitability. We reconcile this non-GAAP financial measure to net income before taxes, based on the last twelve months, in the table above. In addition, other issuers or issuers in other industries may not calculate EBIT in the same manner that we do. Accordingly, EBIT should be
considered only as a supplement to the net income before taxes as a measure of our operating profitability.
(2) Interest coverage is computed using EBIT, a non-GAAP financial measure. The interest coverage ratio is calculated by comparing EBIT to interest expensed. We believe that interest coverage ratio is a relevant financial measure for investors to understand our debt and profitability of our operations and as an indicator of our
ability to pay interest on our debt.
UCP Interest Coverage
Twelve Months Ended Twelve Months Ended
12/31/2015 12/31/2016
Pre-Tax Income $5,852,371 $9,163,055
Interest Expense included in COS 5,592,089 8,117,453
EBIT 11,444,460 17,280,508
Depreciation 587,581 597,051
Amortization 34,000 34,000
EBITDA 12,066,041 17,911,559
Impairments (net of contingent consideration) 923,031 4,464,792
EBITDA (excluding Impairments) $12,989,072 $22,376,321
Interest Incurred $11,567,368 $12,502,682
Interest Coverage 1.0 1.4
Appendix – EBIT
