Attached files
| file | filename |
|---|---|
| EX-99.1 - EX-99.1 - Sanchez Energy Corp | sn-20161231ex99126b119.htm |
| EX-32.2 - EX-32.2 - Sanchez Energy Corp | sn-20161231ex3221205ba.htm |
| EX-32.1 - EX-32.1 - Sanchez Energy Corp | sn-20161231ex321cb159e.htm |
| EX-31.2 - EX-31.2 - Sanchez Energy Corp | sn-20161231ex31235c6df.htm |
| EX-31.1 - EX-31.1 - Sanchez Energy Corp | sn-20161231ex3115c4084.htm |
| EX-23.3 - EX-23.3 - Sanchez Energy Corp | sn-20161231ex233f82a70.htm |
| EX-23.2 - EX-23.2 - Sanchez Energy Corp | sn-20161231ex232bcddc8.htm |
| EX-23.1 - EX-23.1 - Sanchez Energy Corp | sn-20161231ex23160d791.htm |
| EX-21.1 - EX-21.1 - Sanchez Energy Corp | sn-20161231ex2114eb1c9.htm |
| EX-10.29 - EX-10.29 - Sanchez Energy Corp | sn-20161231ex1029fd270.htm |
UNITED STATES
SECURITIES AND EXCHANGE COMMISSION
Washington, D.C. 20549
Form 10‑K
(Mark One)
|
☒ |
ANNUAL REPORT PURSUANT TO SECTION 13 OR 15(d) OF THE SECURITIES EXCHANGE ACT OF 1934 |
|
For the fiscal year ended December 31, 2016 |
|
|
or |
|
|
☐ |
TRANSITION REPORT PURSUANT TO SECTION 13 OR 15(d) OF THE SECURITIES EXCHANGE ACT OF 1934 |
For the transition period from to
Commission file number: 1‑35372
Sanchez Energy Corporation
(Exact name of Registrant as specified in its charter)
|
Delaware |
45‑3090102 |
|
1000 Main Street, Suite 3000 |
77002 |
Registrant’s telephone number, including area code (713) 783‑8000
Securities Registered Pursuant to Section 12(b) of the Act:
|
Title of each class |
Name of each exchange on which registered |
|
Common Stock, par value $0.01 per share Rights to purchase Series C Junior Participating Preferred Stock, par value $0.01 per share |
New York Stock Exchange
New York Stock Exchange |
Securities Registered Pursuant to Section 12(g) of the Act: None
Indicate by check mark if the Registrant is a well‑known seasoned issuer, as defined in Rule 405 of the Securities Act. Yes ☐ No ☒
Indicate by check mark if the Registrant is not required to file reports pursuant to Section 13 or Section 15(d) of the Act. Yes ☐ No ☒
Indicate by check mark whether the Registrant (1) has filed all reports required to be filed by Section 13 or 15(d) of the Securities Exchange Act of 1934 during the preceding 12 months (or for such shorter period that the Registrant was required to file such reports), and (2) has been subject to such filing requirements for the past 90 days. Yes ☒ No ☐
Indicate by check mark whether the Registrant has submitted electronically and posted on its corporate Web site, if any, every Interactive Data File required to be submitted and posted pursuant to Rule 405 of Regulation S T (§ 232.405 of this chapter) during the preceding 12 months (or for such shorter period that the Registrant was required to submit and post such files). Yes ☒ No ☐
Indicate by check mark if disclosure of delinquent filers pursuant to Item 405 of Regulation S‑K (§ 229.405 of this chapter) is not contained herein, and will not be contained, to the best of Registrant’s knowledge, in definitive proxy or information statements incorporated by reference in Part III of this Form 10‑K or any amendment to this Form 10‑K. ☐
Indicate by check mark whether the Registrant is a large accelerated filer, an accelerated filer, a non‑accelerated filer, or a smaller reporting company. See the definitions of “large accelerated filer,” “accelerated filer” and “smaller reporting company” in Rule 12b‑2 of the Exchange Act.
|
Large accelerated filer ☐ |
Accelerated filer ☒ |
Non‑accelerated filer ☐ |
Smaller reporting company ☐ |
Indicate by check mark whether the Registrant is a shell company (as defined in Rule 12b‑2 of the Act). Yes ☐ No ☒
Aggregate market value of the voting and non‑voting common equity held by non‑affiliates of Registrant as of June 30, 2016: $392,858,811
Number of shares of Registrant’s common stock outstanding as of February 24, 2017: 78,648,272.
Documents Incorporated By Reference:
Portions of the Registrant’s definitive proxy statement for its 2017 Annual Meeting of Stockholders or an amendment to this Form 10-K, which will be filed with the Securities and Exchange Commission within 120 days of December 31, 2016, are incorporated by reference into Part III of this report for the year ended December 31, 2016.
SANCHEZ ENERGY CORPORATION
FORM 10‑K
FOR THE YEAR ENDED DECEMBER 31, 2016
i
CAUTIONARY NOTE REGARDING FORWARD‑LOOKING STATEMENTS
This Annual Report on Form 10‑K contains “forward‑looking statements” within the meaning of the safe harbor provisions of the Private Securities Litigation Reform Act of 1995. All statements, other than statements of historical facts, included in this Annual Report on Form 10‑K that address activities, events, conditions or developments that we expect, believe or anticipate will or may occur in the future are forward‑looking statements. These statements are based on certain assumptions we made based on management’s experience, perception of historical trends and technical analyses, current conditions, anticipated future developments and other factors believed to be appropriate and reasonable by management. When used in this Annual Report on Form 10‑K, words such as “will,” “potential,” “believe,” “estimate,” “intend,” “expect,” “may,” “should,” “anticipate,” “could,” “plan,” “predict,” “project,” “profile,” “model,” “strategy,” “future” or their negatives or the statements that include these words or other words that convey the uncertainty of future events or outcomes, are intended to identify forward‑looking statements, although not all forward‑looking statements contain such identifying words. In particular, statements, express or implied, concerning our future operating results and returns, our strategy and plans or view of the market, or our ability to replace or increase reserves, increase production, or generate income or cash flows are forward‑looking statements. Forward‑looking statements are not guarantees of performance. Such statements are subject to a number of assumptions, risks and uncertainties, many of which are beyond our control. Although we believe that the expectations reflected in our forward‑looking statements are reasonable and are based on reasonable assumptions, no assurance can be given that these assumptions are accurate or that any of these expectations will be achieved (in full or at all) or will prove to have been correct. Important factors that could cause our actual results to differ materially from the expectations reflected in the forward‑looking statements include, among others:
|
· |
the timing and extent of changes in prices for, and demand for, crude oil and condensate, natural gas liquids (“NGLs”), natural gas and related commodities; |
|
· |
our ability to successfully execute our business and financial strategies; |
|
· |
our ability to utilize the services, personnel and other assets of Sanchez Oil & Gas Corporation (“SOG”) pursuant to existing services agreements; |
|
· |
our ability to replace the reserves we produce through drilling and property acquisitions; |
|
· |
our ability to close our recently announced Comanche Acquisition, including the related financing transactions; |
|
· |
the realized benefits of the acreage acquired in our various acquisitions, including our pending Comanche Acquisition, and other assets and liabilities assumed in connection therewith; |
|
· |
our ability to successfully integrate the assets acquired in our pending Comanche Acquisition, if consummated, into our operations; |
|
· |
the realized benefits of our partnership with affiliates of The Blackstone Group, L.P.; |
|
· |
the realized benefits of our joint ventures; |
|
· |
the realized benefits of our transactions with Sanchez Production Partners LP (“SPP”); |
|
· |
the extent to which our drilling plans are successful in economically developing our acreage in, and to produce reserves and achieve anticipated production levels from, our existing and future projects; |
|
· |
the accuracy of reserve estimates, which by their nature involve the exercise of professional judgment and may therefore be imprecise; |
1
|
· |
the extent to which we can optimize reserve recovery and economically develop our plays utilizing horizontal and vertical drilling, advanced completion technologies and hydraulic fracturing; |
|
· |
our ability to successfully execute our hedging strategy and the resulting realized prices therefrom; |
|
· |
the credit worthiness and performance of our counterparts, including financial institutions, operating partners and other parties; |
|
· |
competition in the oil and natural gas exploration and production industry in the marketing of crude oil, natural gas and NGLs and for the acquisition of leases and properties, employees and other personnel, equipment, materials and services and, related thereto, the availability and cost of employees and other personnel, equipment, materials and services; |
|
· |
our ability to access the credit and capital markets to obtain financing on terms we deem acceptable, if at all, and to otherwise satisfy our capital expenditure requirements; |
|
· |
the availability, proximity and capacity of, and costs associated with, gathering, processing, compression and transportation facilities; |
|
· |
the impact of, and changes in, government policies, laws and regulations, including tax laws and regulations, environmental laws and regulations relating to air emissions, waste disposal, hydraulic fracturing and access to and use of water, laws and regulations imposing conditions and restrictions on drilling and completion operations and laws and regulations with respect to derivatives and hedging activities; |
|
· |
developments in oil‑producing and natural gas‑producing countries, the actions of the Organization of Petroleum Exporting Countries (“OPEC”) and other factors affecting the supply of oil and natural gas; |
|
· |
our ability to effectively integrate acquired crude oil and natural gas properties into our operations, fully identify existing and potential problems with respect to such properties and accurately estimate reserves, production and costs with respect to such properties; |
|
· |
the extent to which our crude oil and natural gas properties operated by others are operated successfully and economically; |
|
· |
the use of competing energy sources and the development of alternative energy sources; |
|
· |
unexpected results of litigation filed against us; |
|
· |
the extent to which we incur uninsured losses and liabilities or losses and liabilities in excess of our insurance coverage; and |
|
· |
the other factors described under “Item 1A. Risk Factors” in this Annual Report on Form 10‑K and any updates to those factors set forth in our subsequent Quarterly Reports on Form 10‑Q or Current Reports on Form 8‑K. |
In light of these risks, uncertainties and assumptions, the events anticipated by our forward‑looking statements may not occur, and, if any of such events do, we may not have correctly anticipated the timing of their occurrence or the extent of their impact on our actual results. Accordingly, you should not place any undue reliance on any of our forward‑looking statements. Any forward‑looking statement speaks only as of the date on which such statement is made, and we undertake no obligation to correct or update any forward‑looking statement, whether as a result of new information, future events or otherwise, except as required by applicable law. These cautionary statements qualify all forward-looking statements attributable to us or persons acting on our behalf.
2
Overview
Sanchez Energy Corporation (together with our consolidated subsidiaries, “Sanchez Energy,” the “Company,” “we,” “our,” “us” or similar terms), a Delaware corporation formed in August 2011, is an independent exploration and production company focused on the acquisition and development of U.S. onshore unconventional oil and natural gas resources, with a current focus on the horizontal development of significant resource potential from the Eagle Ford Shale in South Texas. We also hold an undeveloped acreage position in the Tuscaloosa Marine Shale (“TMS”) in Mississippi and Louisiana, which offers future upside opportunity. As of December 31, 2016, we have assembled approximately 278,000 net leasehold acres with an approximate 94% average working interest in the Eagle Ford Shale. For the year 2017, we plan to invest substantially all of our capital budget in the Eagle Ford Shale. We continue to evaluate opportunities to increase both our acreage and our producing assets through acquisitions. Our successful acquisition of such assets will depend on both the opportunities and the financing alternatives available to us at the time we consider such opportunities. We have included definitions of some of the oil and natural gas terms used in this Annual Report on Form 10‑K in the “Glossary of Selected Oil and Natural Gas Terms.”
Listed below is a table of our significant consummated transactions since January 1, 2014:
|
Transaction |
|
Transaction Date |
|
Transaction Effective Date |
|
Core Area |
|
Net Acreage Acquired |
|
Net Acreage Remaining at 12/31/16 |
|
(Purchase) / Disposition Price (millions) |
|
|
|
Cotulla Disposition |
|
12/14/2016 |
|
6/1/2016 |
|
Cotulla, Eagle Ford |
|
N/A |
|
N/A |
|
$ |
161 |
* |
|
Carnero Processing Disposition |
|
11/22/2016 |
|
11/22/2016 |
|
N/A |
|
N/A |
|
N/A |
|
$ |
56 |
|
|
Production Asset Transaction |
|
11/22/2016 |
|
7/1/2016 |
|
Palmetto and Cotulla, Eagle Ford |
|
N/A |
|
N/A |
|
$ |
26 |
|
|
Carnero Gathering Disposition |
|
7/5/2016 |
|
7/5/2016 |
|
N/A |
|
N/A |
|
N/A |
|
$ |
37 |
|
|
Western Catarina Midstream Divestiture |
|
10/14/2015 |
|
10/14/2015 |
|
Catarina, Eagle Ford |
|
N/A |
|
N/A |
|
$ |
346 |
|
|
Palmetto Disposition |
|
3/31/2015 |
|
1/1/2015 |
|
Palmetto, Eagle Ford |
|
N/A |
|
N/A |
|
$ |
83 |
|
|
Catarina Acquisition |
|
6/30/2014 |
|
1/1/2014 |
|
Catarina, Eagle Ford |
|
106,100 |
|
106,100 |
|
$ |
(557) |
|
* On December 14, 2016, we completed the initial closing of the Cotulla Disposition for cash consideration of approximately $153.5 million. Subsequently, a second closing on an additional portion of the assets was completed for cash consideration of approximately $7.1 million, and the Cotulla Disposition remains subject to post-closing adjustments and potential future closings.
On December 14, 2016, the Company completed the initial closing of the Cotulla Disposition (as defined in “Item 8. Financial Statements and Supplementary Data — Note 3, Acquisitions and Divestitures”) for cash consideration of approximately $153.5 million. Subsequent to December 31, 2016, a second closing on an additional portion of the Cotulla Assets was completed for cash consideration of approximately $7.1 million, and the Cotulla Disposition remains subject to post-closing adjustments and potential future closings. The assets sold included (based on the Company’s internal estimates) estimated net proved reserves, as of the effective date of June 1, 2016, of approximately 6.9 MMBoe. Proved developed reserves are estimated to account for approximately 90% of the total net proved reserves. As of the effective date of June 1, 2016, the Cotulla Assets consisted of approximately 15,000 net acres with 112 gross (93 net) wells producing approximately 3,000 Boe/d.
On November 22, 2016, the Company completed the disposition of its 50% equity interests in Carnero Processing, LLC (“Carnero Processing”) to SPP, a joint venture that is 50% owned by Targa Resources Corp. (NYSE: TRGP) (“Targa”). The Company received aggregate cash consideration of approximately $55.5 million and SPP agreed to assume approximately $24.5 million of the Company’s remaining capital contribution commitments in connection
3
with the acquisition (the “Carnero Processing Disposition”). The purchase price was determined through arm’s length negotiations between the Company and SPP, including independent committees of both entities.
On November 22, 2016, the Company also completed the Production Asset Transaction (as defined in “Item 8. Financial Statements and Supplementary Data — Note 3, Acquisitions and Divestitures”) cash consideration of $25.6 million after $1.4 million in normal and customary closing adjustments. The purchase price was determined through arm’s length negotiations between the Company and SPP, including independent committees of both entities. The Production Asset Transaction included the disposition of working interests in 23 producing Eagle Ford wellbores located in Dimmit and Zavala counties in South Texas together with escalating working interests in an additional 11 producing wellbores located in the Palmetto Field in Gonzales County, Texas to SPP. The effective date of the Production Asset Transaction was July 1, 2016.
On July 5, 2016, the Company completed the disposition of its 50% equity interest in Carnero Gathering, LLC (“Carnero Gathering”) a joint venture that is 50% owned by Targa, to SPP for an initial payment of approximately $37.0 million and the assumption by SPP of the Company’s remaining capital commitments to Carnero Gathering, estimated at approximately $7.4 million as of that date (the “Carnero Gathering Disposition”). In addition, SPP is required to pay the Company an earnout based on natural gas received above a threshold volume and tariff at Carnero Gathering’s delivery points from the Company and other producers. Carnero Gathering owns a total of approximately 45 miles (10 miles of which remain under construction as of December 31, 2016) of high pressure natural gas gathering pipelines that currently connect SPP’s Western Catarina Midstream system to nearby pipelines in South Texas. The Carnero Gathering System is designed to directly connect to a cryogenic natural gas processing plant in South Texas that is expected to be operational in the spring of 2017. The Company’s 50% equity interest in this processing plant was conveyed to SPP in the Carnero Processing Disposition.
On October 14, 2015, the Company completed the Western Catarina Midstream Divestiture (as defined in “Item 8. Financial Statements and Supplementary Data — Note 3, Acquisitions and Divestitures”) for an adjusted purchase price of $345.8 million in cash. In connection with the closing of the Western Catarina Midstream Divestiture, the Company entered into a Firm Gathering and Processing Agreement (the “Gathering Agreement”) on October 14, 2015 for an initial term of 15 years under which production from approximately 35,000 acres in Dimmit County and Webb County, Texas will be dedicated for gathering by Catarina Midstream, LLC (“Catarina Midstream”). In addition, for the first five years of the Gathering Agreement, SN Catarina, LLC will be required to meet a minimum quarterly volume delivery commitment of 10,200 barrels per day of crude oil and condensate and 142,000 Mcf per day of natural gas, subject to certain adjustments.
On March 31, 2015, we completed the Palmetto Disposition (as defined in “Item 8. Financial Statements and Supplementary Data —Note 3, Acquisitions and Divestitures”) for an adjusted purchase price of approximately $83.4 million. The effective date of the transaction was January 1, 2015. The aggregate average working interest percentage initially conveyed was 18.25% per wellbore and, upon January 1 of each subsequent year after the closing, the working interest of the purchaser, a wholly owned subsidiary of SPP, will automatically increase in incremental amounts according to the purchase agreement until January 1, 2019, at which point the purchaser will own a 47.5% working interest, and we will own a 2.5% working interest in each of the wellbores.
On June 30, 2014, we completed our acquisition of 106,000 net contiguous acres in Dimmit, LaSalle and Webb Counties, Texas (the “Catarina Acquisition”) in the Eagle Ford Shale with an effective date of January 1, 2014. All proved reserves in the Catarina area are covered under lease acreage that is held by production, which acreage amounted to approximately 29,000 acres. Under the lease we have a 100% working interest and 75% net revenue interest in the lease acreage over the Eagle Ford Shale formation from the top of the Austin Chalk formation to the base of the Buda Lime formation. The 77,000 acres of undeveloped acreage that were included in the Catarina Acquisition are subject to a continuous drilling obligation. Such drilling obligation requires us to drill (i) 50 wells in each annual period commencing on July 1, 2014 and (ii) at least one well in any consecutive 120‑day period in order to maintain rights to any future undeveloped acreage. Up to 30 wells drilled in excess of the minimum 50 wells in a given annual period can be carried over to satisfy part of the 50 well requirement in the subsequent annual period on a well for well basis. The lease also created a customary security interest in the production therefrom in order to secure royalty payments to the lessor and
4
other lease obligations. Our current capital budget and plans include drilling at least the minimum annual well requirement necessary to maintain access to such undeveloped acreage.
Our Business Strategies
Our primary business objective is to increase reserves, production and cash flows at an attractive return on invested capital. Our business strategy is currently focused on exploiting long‑life, unconventional oil, condensate, NGL and natural gas reserves from the Eagle Ford Shale as well as other projects that directly enhance the profitability of our oil and gas development activities. Key elements of our business strategy include:
|
· |
Efficiently develop our Eagle Ford Shale leasehold positions. We intend to efficiently drill and develop our acreage position to maximize the value of our resource potential. At December 31, 2016, approximately 67% of our proved reserves were proved undeveloped. As of December 31, 2016, we had 473 net wells, and had identified over 3,000 net locations, for potential future drilling in our Eagle Ford Shale area that will be our primary targets in the near term. In 2017, we plan to invest between $395 million and $440 million on development drilling and completion in the Eagle Ford Shale, which represents 100% of our 2017 drilling and completion budget and 93% of our total 2017 capital budget. |
|
· |
Enhance returns by focusing on operational and cost efficiencies. We are focused on the improvement of our operating measures and have significant experience in successfully converting early‑stage resource opportunities into cost‑efficient development projects. We believe the magnitude and concentration of our acreage within our core project areas provide us with the opportunity to capture economies of scale, including the ability to directly procure goods and services from manufacturers, drill multiple wells from a single pad, utilize centralized production and fluid handling facilities and implement a line-management approach to improve efficiencies in drilling and completions. In addition, we focus on midstream and other projects that serve our production and add optionality to end markets, ultimately enhancing our realized prices. |
|
· |
Adopt and employ leading drilling and completion techniques. We are focused on enhancing our drilling and completion techniques to maximize recovery of reserves. Industry methods with respect to drilling and completion have significantly evolved over the last several years, resulting in increased initial production rates and recoverable hydrocarbons per well through the implementation of longer laterals, more tightly spaced fracture stimulation stages and large proppant volumes. We evaluate industry drilling results and monitor the results of other operators to improve our operating practices, and we expect our drilling and completion techniques to continue to evolve. |
|
· |
Leverage our relationship with our affiliates to expand unconventional assets. SOG, headquartered in Houston, Texas, is a private full service oil and natural gas company engaged in the exploration and development of oil and natural gas primarily in the South Texas and onshore Gulf Coast areas on behalf of its affiliates. The Company refers to SOG and its affiliates (but excluding the Company), collectively, as the “Sanchez Group.” Various members of the Sanchez Group have drilled or participated in over 3,000 wells, directly and through joint ventures, and have invested substantial amounts of capital in the oil and natural gas industry since 1972. During this period, they have carefully cultivated relationships with mineral and surface rights owners in and around our core areas and compiled an extensive technological database that we believe gives us a competitive advantage in acquiring additional leasehold positions in these areas. We have unrestricted access to the proprietary portions of the technological database related to our properties and SOG is otherwise required to interpret and use the database for our benefit. We plan to leverage our affiliates’ expertise, industry relationships and size to opportunistically expand reserves and our leasehold positions in the Eagle Ford Shale and other onshore unconventional oil, condensate, NGL and natural gas resources. |
|
· |
Pursue strategic acquisitions to grow our leasehold position in the Eagle Ford Shale and seek opportunistic entry into new basins. We believe that we will be able to identify and acquire additional acreage and producing assets in the Eagle Ford Shale at attractive valuations by leveraging our longstanding relationships in and knowledge of South Texas. We also plan to selectively target additional |
5
domestic basins that would allow us to employ our strategies on attractive acreage positions that we believe are similar to our Eagle Ford Shale acreage. |
|
· |
Maintain substantial financial liquidity and flexibility. As of December 31, 2016, we had a liquidity position of approximately $800 million, consisting of approximately $500 million of cash and cash equivalents and $300 million of availability under our undrawn Second Amended and Restated Credit Agreement (defined in “Item 8. Financial Statements and Supplementary Data —Note 5, Long‑Term Debt”), which had a $350 million borrowing base (with a $300 million aggregate elected commitment amount). We evaluate our level of operating activity in light of both actual commodity prices and changes we are able to make to our costs of operations and, based upon this evaluation, adjust our capital spending program as appropriate. In addition, we expect to continue to regularly review acquisition opportunities from third parties or other members of the Sanchez Group. We have entered into and intend to continue executing hedging transactions for a significant portion of our expected production to achieve more predictable cash flow and to reduce our exposure to adverse fluctuations in oil and natural gas prices. |
Our Competitive Strengths
We believe the following competitive strengths will allow us to successfully execute our business strategies:
|
· |
Geographically concentrated leasehold position in leading North American unconventional oil resource trends. We have assembled a current leasehold position of approximately 278,000 net acres in the Eagle Ford Shale, which we believe to be one of the highest rates of return unconventional oil and natural gas formations in North America. In addition to further leveraging our base of technical expertise in our project areas, our geographically concentrated acreage position allows us to establish economies of scale with respect to drilling, production, operating and administrative costs, in addition to further leveraging our base of technical expertise in our project areas. We believe that our recent well results and offset operator activity in and around our project areas have significantly de‑risked our acreage position such that there are low geologic risks and ample repeatable drilling opportunities across our core operating areas. |
|
· |
Proven low cost operator. We are recognized as one of the lowest cost operators in the Eagle Ford Shale. We utilize a combination of initiatives that have improved the efficiency of our operations and reduced the cost of sourcing goods and services. The Company has implemented systems and processes that provide complete transparency for our well program across our organization thereby eliminating drag and waste on repetitive tasks. We have also segmented and optimized each step in drilling and completing a well. In addition, our supply chain management team takes a rigorous and methodical approach to reducing the total delivered costs of purchased good and services by examining costs on their most granular level. Goods and services are commonly sourced directly from suppliers, eliminating the middleman and their markups. Additionally, we constantly review the value chain for opportunities to internally provide services in order to further reduce, or provide sustainability in, current costs. |
|
· |
Demonstrated ability to drive liquids production and reserves growth. Our average production for the full year 2016 was approximately 53,350 Boe/d, substantially all of which was from the Eagle Ford Shale. This compares to approximately 52,600 Boe/d for the full year 2015. Our total proved reserves at December 31, 2016 were 192.8 MMBoe, an increase of approximately 51% over the prior year. |
|
· |
Large oil‑weighted multi‑year drilling inventory. We have an inventory of over 3,000 net locations for potential future drilling on our acreage position in the oil, natural gas and condensate, or black oil and volatile oil and gas, windows of the Eagle Ford Shale. |
|
· |
Experienced management and strong technical team. Our team is comprised of individuals with a long history in the oil and natural gas business, and a number of our key executives have prior experience as members of public company management teams. Furthermore, members of the Sanchez Group have a 40‑plus year operating history in the areas in which we operate, providing us with extensive knowledge of the basins and the ability to leverage longstanding relationships with mineral owners. Through SOG, we have access to an experienced staff of oil and natural gas professionals including geophysicists, geologists, drilling and completion engineers, production and reservoir engineers and technical support personnel. SOG’s technical team has significant experience and expertise in applying the most sophisticated |
6
technologies used in conventional and unconventional resource style plays including 3‑D seismic interpretation capabilities, horizontal drilling, comprehensive multi‑stage hydraulic fracture stimulation programs and other exploration, production and processing technologies. We believe this technical expertise is integral to successful exploitation of our assets, including defining new core producing areas in emerging plays. |
Core Properties
Eagle Ford Shale
We and our predecessor entities have a long history in the Eagle Ford Shale, where, as of December 31, 2016, we have assembled approximately 278,000 net leasehold acres with an approximate 94% average working interest and have over 3,300 gross (3,050 net) locations for potential future drilling. For the year 2017, we plan to invest substantially all of our capital budget in the Eagle Ford Shale.
In our Catarina area, we have approximately 106,000 net acres in Dimmit, LaSalle and Webb Counties, Texas with a 100% working interest. We anticipate drilling, completion and facilities costs on our acreage to be between $2.9 million and $3.3 million per well based on our current estimates and historical well costs. Current Estimated Ultimate Recovery (“EUR”) per well in Catarina is expected to range between 400 MBoe and 1,200 MBoe. We have identified between 1,300 and 1,650 gross and net locations for potential future drilling on our Catarina acreage. For the year 2017, we plan to spend $160 million to $170 million to spud 49 net wells and complete 53 net wells in our Catarina area.
In our Maverick area, we have approximately 100,000 net acres in Dimmit, Frio, LaSalle, Zavala, and McMullen Counties, Texas with an average working interest of approximately 96%. We believe that our Maverick acreage lies in the black oil window, where we anticipate drilling, completion and facilities costs on our acreage to be between $3.0 million and $4.0 million per well based on our current estimates and historical well costs. Current EUR per well in Maverick is expected to range between 300 MBoe and 400 MBoe. We have identified up to 1,100 gross (1,000 net) locations based on 75 acre well‑spacing for potential future drilling on our Maverick area. For the year 2017, we plan to spend $100 million to $110 million to spud 35 net wells and complete 35 net wells in our Maverick area.
In our Javelina area, we have approximately 39,500 net acres in LaSalle and Webb Counties, Texas with an average working interest of 100%. Our Javelina acreage encompasses proven Eagle Ford down-dip areas. We currently anticipate drilling, completion and facilities costs on our acreage to be between $6.0 million and $7.5 million per well based on our current estimates. We expect average EUR per well in Javelina to range between 1,500 MBoe and 2,500 MBoe. We have identified up to 265 gross (265 net) locations based on 120 acre well-spacing for potential future drilling on our Javelina area. For the year 2017, we do not plan to drill any wells in this area.
In our Palmetto area, we have approximately 8,000 net acres in Gonzales County, Texas with an average working interest of approximately 49%. We believe that our Palmetto acreage lies in the volatile oil window where we anticipate drilling, completion and facilities costs on our acreage to be between $5.5 and $6.0 million per well based on our current estimates and historical well costs. Current EUR per well in Palmetto is expected to range between 500 MBoe and 600 MBoe. We have identified up to 295 gross (143 net) locations based on 40 acre well‑spacing for potential future drilling in our Palmetto area. For the year 2017, we plan to spend $5 million to $10 million to spud 2 net wells and complete three net wells in our Palmetto area.
In our Marquis area, we have approximately 21,000 net acres, the majority of which are in southwest Fayette and northeast Lavaca Counties, Texas with a 100% working interest. We believe that our Marquis acreage lies in the volatile oil window, where we anticipate drilling, completion and facilities costs on our acreage to be between $4.0 million and $5.0 million per well based on our current estimates and historical well costs. Current EUR per well in Marquis is expected to range between 275 MBoe and 375 MBoe. We have identified up to 200 gross and net locations based on 60 acre well‑spacing for potential future drilling on our Marquis acreage. For the year 2017, we do not have any planned capital spending on drilling and completions in our Marquis area.
7
Tuscaloosa Marine Shale
In August 2013, we acquired approximately 40,000 net undeveloped acres in what we believe to be the core of the TMS for cash and shares of our common stock (the “TMS Transaction”). In connection with the TMS Transaction, we established an area of mutual interest (“AMI”) in the TMS with SR Acquisition I, LLC (“SR”), a subsidiary of our affiliate Sanchez Resources, LLC (“Sanchez Resources”), which included a carry on drilling costs for up to 6 gross (3 net) wells. As part of the TMS Transaction, we acquired all of the working interests in the AMI owned at closing from three sellers (two third parties and one related party of the Company, SR), resulting in our owning an undivided 50% working interest across the AMI through the TMS formation.
Total consideration for the transactions consisted of approximately $70 million in cash and the issuance of 342,760 common shares of the Company, valued at approximately $7.5 million. The total cash consideration provided to SR, an affiliate of the Company, was $14.4 million, before consideration of any well carries. The acquisitions were accounted for as the purchase of assets at cost at the acquisition date. We also committed, as a part of the total consideration, to carry SR for its 50% working interest in an initial 3 gross (1.5 net) TMS wells to be drilled within the AMI (the “Initial Well Carry”) with an option to drill an additional 6 gross (3 net) TMS wells (“Additional Wells”) within the AMI. In August 2015, after completing the Initial Well Carry, the Company signed an agreement with SR whereby the Company paid SR approximately $8 million in lieu of drilling the remaining two Additional Wells (the “Buyout Agreement”). The Buyout Agreement stipulates that SN has earned full rights to all acreage stated in the TMS Transaction and effectively terminates any future well carry commitments.
As of December 31, 2016, the AMI held rights to approximately 98,000 (64,000 net) acres, of which we owned approximately 45,600 net acres. The TMS development is currently challenged due to high well costs and depressed commodity prices. We believe that the TMS play has significant development potential and still has significant upside as changes in technology, commodity prices, and service prices occur. The average remaining lease term on the acreage is over 2 years, giving us ample time to allow other industry participants to further de‑risk the play.
Oil and Natural Gas Reserves and Production
Internal Controls
Our estimated reserves at December 31, 2016 were prepared by Ryder Scott Company, L.P. (“Ryder Scott”), our independent third-party reserve engineers pursuant to their report dated January 24, 2017, which is filed as an exhibit to this Annual Report on Form 10-K. We expect to continue to have our reserve estimates prepared semi‑annually by Ryder Scott. Our internal professional staff works closely with Ryder Scott to ensure the integrity, accuracy and timeliness of data that is furnished to them for their reserve estimation process. All of the reserve information maintained in our reserve engineering database is provided to the external engineers. In addition, we provide Ryder Scott other pertinent data, such as seismic information, geologic maps, well logs, production tests, material balance calculations, well performance data, operating procedures and relevant economic criteria. We make all requested information, as well as our pertinent personnel, available to the external engineers as part of their evaluation of our reserves. The estimated proved reserves attributable to the Comanche Assets (as defined in “Item 1A. Risk Factors—There can be no assurance that the Comanche Acquisition will be consummated in the anticipated timeframe, on the terms described herein, or at all.”) are as of June 30, 2016, are based on our internal evaluation and interpretation of reserve and other information provided to us in the course of our due diligence with respect to the Comanche Acquisition (as defined in “Item 1A. Risk Factors—There can be no assurance that the Comanche Acquisition will be consummated in the anticipated timeframe, on the terms described herein, or at all.”) and have not been independently verified or estimated.
Technology Used to Establish Reserves
Under the rules of the Securities and Exchange Commission (the “SEC”), proved reserves are those quantities of oil and natural gas that by analysis of geoscience and engineering data can be estimated with reasonable certainty to be economically producible from a given date forward from known reservoirs, and under existing economic conditions, operating methods and government regulations. The term “reasonable certainty” implies a high degree of confidence that the quantities of oil and natural gas actually recovered will equal or exceed the estimate. Reasonable certainty can be established using techniques that have been proven effective by actual production from projects in the same reservoir or
8
an analogous reservoir or by other evidence using reliable technology that establishes reasonable certainty. Reliable technology is a grouping of one or more technologies (including computational methods) that has been field tested and has been demonstrated to provide reasonably certain results with consistency and repeatability in the formation being evaluated or in an analogous formation.
To establish reasonable certainty with respect to our estimated proved reserves, Ryder Scott employed technologies that have been demonstrated to yield results with consistency and repeatability. The technologies and economic data used in the estimation of our reserves include, but are not limited to, electrical logs, radioactivity logs, core analyses, geologic maps and available downhole and production data, seismic data and well test data. Reserves attributable to producing wells with sufficient production history were estimated using appropriate decline curves or other performance relationships. Reserves attributable to producing wells with limited production history and for undeveloped locations were estimated using performance from analogous wells in the surrounding area and geologic data to assess the reservoir continuity. These wells were considered to be analogous based on production performance from the same formation and completion using similar techniques.
Qualifications of Responsible Technical Persons
Internal SOG Engineers. Daniel Furbee is the technical person primarily responsible for overseeing the preparation of our reserve estimates. Mr. Furbee has over a decade of industry experience with positions of increasing responsibility in engineering and evaluations with companies such as Baker Hughes and LINN Energy. He holds a Bachelor of Science Petroleum Engineering degree from Marietta College and a Masters of Business Administration from the University of Houston. Mr. Furbee is a Registered Professional Engineer in the State of Texas.
Independent Reserve Engineers. Ryder Scott is an independent oil and natural gas consulting firm. No director, officer or key employee of Ryder Scott has any financial ownership in any member of the Sanchez Group or us. Ryder Scott’s compensation for the required investigations and preparation of its report is not contingent upon the results obtained and reported, and Ryder Scott has not performed other work for SOG or us that would affect its objectivity. The engineering information presented in Ryder Scott’s report was overseen by Michael F. Stell, P.E. Mr. Stell is an experienced reservoir engineer having been a practicing petroleum engineer since 1981. He has more than 24 years of experience in reserves evaluation with Ryder Scott. He has a Bachelor of Science degree in Chemical Engineering from Purdue University and Master of Science degree in Chemical Engineering from University of California - Berkeley. Mr. Stell is a Registered Professional Engineer in the State of Texas.
Estimated Proved Reserves
The following table presents the estimated net proved oil and natural gas reserves attributable to our properties and the standardized measure amounts associated with the estimated proved reserves attributable to our properties as of December 31, 2016, based on a reserve report prepared by Ryder Scott, our independent reserve engineers. The standardized measure amounts shown in the table are not intended to represent the current market value of our estimated oil and natural gas reserves.
9
|
|
|
As of December 31, 2016 |
|
|||||||||
|
|
|
|
|
|
|
|
|
Total |
|
|
|
|
|
|
|
|
|
|
|
|
|
Estimated |
|
|
|
|
|
|
|
|
|
Natural Gas |
|
|
|
Proved |
|
|
|
|
|
|
|
Oil |
|
Liquids |
|
Natural Gas |
|
Reserves |
|
PV-10 |
|
|
|
|
|
(MMBbl) |
|
(MMBbl) |
|
(Bcf) |
|
(MMBoe)(2) |
|
(in millions) |
|
|
|
Reserve Data (1): |
|
|
|
|
|
|
|
|
|
|
|
|
|
Estimated proved reserves by project area: |
|
|
|
|
|
|
|
|
|
|
|
|
|
Eagle Ford |
|
|
|
|
|
|
|
|
|
|
|
|
|
Catarina |
|
48.3 |
|
57.5 |
|
410.9 |
|
174.3 |
|
$ |
392.2 |
|
|
Maverick |
|
11.3 |
|
0.2 |
|
1.1 |
|
11.7 |
|
|
90.1 |
|
|
Palmetto |
|
3.0 |
|
0.6 |
|
3.6 |
|
4.2 |
|
|
10.3 |
|
|
Marquis |
|
1.8 |
|
0.4 |
|
1.6 |
|
2.4 |
|
|
17.9 |
|
|
Total Eagle Ford |
|
64.4 |
|
58.7 |
|
417.2 |
|
192.6 |
|
|
510.5 |
|
|
TMS |
|
0.2 |
|
— |
|
— |
|
0.2 |
|
|
2.9 |
|
|
Total |
|
64.6 |
|
58.7 |
|
417.2 |
|
192.8 |
|
$ |
513.4 |
|
|
Standardized Measure (in millions) (1)(3) |
|
|
|
|
|
|
|
|
|
$ |
513.4 |
|
|
|
|
|
|
|
|
|
|
|
|
|
|
|
|
Estimated proved developed reserves by project area: |
|
|
|
|
|
|
|
|
|
|
|
|
|
Eagle Ford |
|
|
|
|
|
|
|
|
|
|
|
|
|
Catarina |
|
12.1 |
|
20.4 |
|
146.0 |
|
56.8 |
|
$ |
267.5 |
|
|
Maverick |
|
3.9 |
|
0.2 |
|
1.1 |
|
4.3 |
|
|
60.1 |
|
|
Palmetto |
|
0.3 |
|
0.1 |
|
0.4 |
|
0.5 |
|
|
5.4 |
|
|
Marquis |
|
1.8 |
|
0.4 |
|
1.6 |
|
2.4 |
|
|
17.9 |
|
|
Total Eagle Ford |
|
18.1 |
|
21.1 |
|
149.1 |
|
64.0 |
|
|
350.9 |
|
|
TMS |
|
0.2 |
|
— |
|
— |
|
0.2 |
|
|
2.9 |
|
|
Total |
|
18.3 |
|
21.1 |
|
149.1 |
|
64.2 |
|
$ |
353.8 |
|
|
|
|
|
|
|
|
|
|
|
|
|
|
|
|
Estimated proved undeveloped reserves by project area: |
|
|
|
|
|
|
|
|
|
|
|
|
|
Eagle Ford |
|
|
|
|
|
|
|
|
|
|
|
|
|
Catarina |
|
36.2 |
|
37.1 |
|
264.9 |
|
117.5 |
|
$ |
124.7 |
|
|
Maverick |
|
7.4 |
|
— |
|
— |
|
7.4 |
|
|
30.0 |
|
|
Palmetto |
|
2.7 |
|
0.5 |
|
3.2 |
|
3.7 |
|
|
4.9 |
|
|
Marquis |
|
— |
|
— |
|
— |
|
— |
|
|
— |
|
|
Total Eagle Ford |
|
46.3 |
|
37.6 |
|
268.1 |
|
128.6 |
|
|
159.6 |
|
|
TMS |
|
— |
|
— |
|
— |
|
— |
|
|
— |
|
|
Total |
|
46.3 |
|
37.6 |
|
268.1 |
|
128.6 |
|
$ |
159.6 |
|
(1)Our estimated net proved reserves and related standardized measure were determined using index prices for oil and natural gas, without giving effect to commodity derivative contracts, held constant throughout the life of our properties. The unweighted arithmetic average first‑day‑of‑the‑month prices for the prior twelve months were $42.75/Bbl for WTI Cushing oil, $19.97/Bbl for NGLs and $2.49/MMBtu for Henry Hub natural gas at December 31, 2016. These prices were adjusted by lease for quality, transportation fees, geographical differentials, marketing bonuses or deductions and other factors affecting the price realized at the wellhead. For the year ended December 31, 2016, the average realized prices for oil, NGLs and natural gas were $37.95 per Bbl, $13.72 per Bbl and $2.50 per Mcf, respectively. For a description of our commodity derivative contracts, please read “Item 7. Management’s Discussion and Analysis of Financial Condition and Results of Operations—Results of Operations—Operating Costs and Expenses—Commodity Derivative Transactions” and “Item 7. Management’s Discussion and
10
Analysis of Financial Condition and Results of Operations—Critical Accounting Policies and Estimates—Derivative Instruments.”
(2) One Boe is equal to six Mcf of natural gas or one Bbl of oil or NGLs based on a rough energy equivalency. This is a physical correlation and does not reflect a value or price relationship between the commodities.
(3) Standardized measure is calculated in accordance with Accounting Standards Codification (“ASC”), Topic 932, Extractive Activities—Oil and Gas. For further information regarding the calculation of the standardized measure, see “Supplementary Information on Oil and Natural Gas Exploration, Development and Production Activities (Unaudited)” included in “Item 8. Financial Statements and Supplementary Data.”
The data in the table above represents estimates only. Oil, NGLs and natural gas reserve engineering is inherently a subjective process of estimating underground accumulations of oil, NGLs and natural gas that cannot be measured exactly. The accuracy of any reserve estimate is a function of the quality of available data and engineering and geological interpretation and judgment. Accordingly, reserve estimates may vary from the quantities of oil, NGLs and natural gas that are ultimately recovered. For a discussion of risks associated with reserve estimates, please read “Item 1A. Risk Factors—Our estimated reserves and future production rates are based on many assumptions that may prove to be inaccurate. Any material inaccuracies in these reserve estimates or underlying assumptions will materially affect the quantities and present value of our estimated reserves.”
Future prices realized for production and costs may vary, perhaps significantly, from the prices and costs assumed for purposes of these estimates. The standardized measure amounts shown above should not be construed as the current market value of our estimated oil and natural gas reserves. The 10% discount factor used to calculate standardized measure, which is required by Financial Accounting Standard Board (“FASB”) pronouncements, is not necessarily the most appropriate discount rate. The present value, no matter what discount rate is used, is materially affected by assumptions as to timing of future production, which may prove to be inaccurate.
Development of Proved Undeveloped Reserves
None of our proved undeveloped reserves (“PUD”) at December 31, 2016 are scheduled to be developed on a date more than five years from the date the reserves were initially booked as proved undeveloped. Historically, our drilling and development programs were substantially funded from capital contributions, cash flow from operations and the issuance of debt and equity securities. Based on our current expectations of our cash flows and drilling and development programs, which includes drilling of proved undeveloped locations, we believe that we can fund the drilling of our current inventory of proved undeveloped locations and our expansions and extensions in the next five years from our cash on hand combined with cash flow from operations and utilization of available borrowing capacity under our credit facility.
At a pace of approximately 30 wells per rig per year, our current 293 PUD drilling locations will all be developed within the next five years by running an average gross rig count of two rigs. As of December 31, 2016, we were running two active rigs and have an approved annual budget that allows for approximately six rigs to be run through 2017. For a more detailed discussion of our liquidity position, please read “Item 7. Management’s Discussion and Analysis of Financial Condition and Results of Operations—Liquidity and Capital Resources.”
11
As of December 31, 2016, we identified 293 gross (282 net) PUD drilling locations which we anticipate drilling within the next five years. The table below details the activity in our PUD locations from December 31, 2015 to December 31, 2016:
|
|
|
|
|
|
|
Net |
|
|
|
|
|
|
|
|
Net Natural |
|
Natural |
|
Net |
|
|
|
|
Net Oil |
|
Gas Liquids |
|
Gas |
|
Volume |
|
|
|
|
(MBbl) |
|
(MBbl) |
|
(MMcf) |
|
(MBoe) |
|
|
PUDs as of December 31, 2015 |
|
30,048 |
|
15,995 |
|
101,564 |
|
62,971 |
|
|
Revisions of previous estimates |
|
|
|
|
|
|
|
|
|
|
Revisions due to price change |
|
(15,372) |
|
(10,603) |
|
(67,150) |
|
(37,167) |
|
|
Technical revisions |
|
(451) |
|
241 |
|
3,589 |
|
388 |
|
|
Extensions and discoveries |
|
37,381 |
|
34,482 |
|
246,300 |
|
112,913 |
|
|
Purchases |
|
— |
|
— |
|
— |
|
— |
|
|
Divestitures |
|
(1,137) |
|
(81) |
|
(479) |
|
(1,298) |
|
|
Conversion to proved developed reserves during the year |
|
(4,137) |
|
(2,428) |
|
(15,688) |
|
(9,180) |
|
|
PUDs as of December 31, 2016 |
|
46,332 |
|
37,606 |
|
268,136 |
|
128,627 |
|
Excluding acquisitions, we expect to make capital expenditures related to drilling and completion of wells of approximately $265 million to $290 million during the year ended December 31, 2017. We plan to spend approximately 80% to 88% of these capital expenditures on development of PUDs in 2017. Technical revisions of PUD estimates are the result of changes in forecasted performance. There are net positive changes on our PUD forecast driven by better performance on our Catarina asset. As a result of price change, 131 PUD locations were removed. The total PUD volume impacted by price changes are 37.2 MMBoe as a result of locations that were removed from our Catarina, Cotulla, Marquis and Palmetto assets.
For more information about our historical costs associated with the development of proved undeveloped reserves, please read “Supplementary Information on Oil and Natural Gas Exploration, Development and Production Activities (Unaudited)” included in “Item 8. Financial Statements and Supplementary Data.”
Reconciliation of PV‑10 to Standardized Measure
PV‑10 is derived from the Standardized Measure of discounted future net cash flows, which is the most directly comparable financial measure in accordance with accounting principles generally accepted in the United States of America (“U.S. GAAP”). PV‑10 is a computation of the Standardized Measure on a pre‑tax basis. PV‑10 is equal to the Standardized Measure at the applicable date, before deducting future income taxes, discounted at 10%. We believe that the presentation of PV‑10 is relevant and useful to investors because it presents the discounted future net cash flows attributable to our estimated net proved reserves prior to taking into account future corporate income taxes, and it is a useful measure for evaluating the relative monetary significance of our oil and natural gas properties. Further, investors may utilize the measure as a basis for comparison of the relative size and value of our reserves to other companies. We use this measure when assessing the potential return on investment related to our oil and natural gas properties. PV‑10, however, is not a substitute for the Standardized Measure. Our PV‑10 measure and the Standardized Measure do not purport to present the fair value of our oil and natural gas reserves.
12
The following table provides a reconciliation of PV‑10 to the Standardized Measure at December 31, 2016 for our proved reserves (in millions):
|
|
|
Proved |
|
|
|
|
|
Reserves |
|
|
|
|
|
|
|
|
|
PV-10 |
|
$ |
513.4 |
|
|
Present value of future income taxes discounted at 10% |
|
|
— |
|
|
Standardized Measure (1) |
|
$ |
513.4 |
|
(1)Standardized measure is calculated in accordance with ASC Topic 932, Extractive Activities—Oil and Gas. For further information regarding the calculation of the standardized measure, see “Supplementary Information on Oil and Natural Gas Exploration, Development and Production Activities (Unaudited)” included in “Item 8. Financial Statements and Supplementary Data.”
13
Production, Revenues and Price History
The following table sets forth information regarding combined net production of oil, NGLs, and natural gas and certain price and cost information attributable to our properties for each of the periods presented:
|
|
|
Year Ended December 31, |
|
|||||||
|
|
|
|
|
|
|
|
|
|
|
|
|
|
|
2016 |
|
2015 |
|
2014 |
|
|||
|
Production: |
|
|
|
|
|
|
|
|
|
|
|
Oil - MBbl |
|
|
|
|
|
|
|
|
|
|
|
Catarina |
|
|
3,615 |
|
|
3,210 |
|
|
847 |
|
|
Maverick |
|
|
858 |
|
|
396 |
|
|
168 |
|
|
Cotulla |
|
|
810 |
|
|
1,436 |
|
|
1,868 |
|
|
Palmetto |
|
|
351 |
|
|
606 |
|
|
1,255 |
|
|
Marquis |
|
|
693 |
|
|
1,448 |
|
|
1,910 |
|
|
TMS |
|
|
44 |
|
|
69 |
|
|
32 |
|
|
Total |
|
|
6,371 |
|
|
7,165 |
|
|
6,080 |
|
|
Natural gas liquids - MBbl |
|
|
|
|
|
|
|
|
|
|
|
Catarina |
|
|
5,475 |
|
|
5,066 |
|
|
1,580 |
|
|
Maverick |
|
|
14 |
|
|
5 |
|
|
6 |
|
|
Cotulla |
|
|
237 |
|
|
326 |
|
|
486 |
|
|
Palmetto |
|
|
78 |
|
|
139 |
|
|
267 |
|
|
Marquis |
|
|
156 |
|
|
218 |
|
|
251 |
|
|
TMS |
|
|
— |
|
|
— |
|
|
— |
|
|
Total |
|
|
5,960 |
|
|
5,754 |
|
|
2,590 |
|
|
Natural gas - MMcf |
|
|
|
|
|
|
|
|
|
|
|
Catarina |
|
|
40,544 |
|
|
33,775 |
|
|
9,244 |
|
|
Maverick |
|
|
93 |
|
|
42 |
|
|
52 |
|
|
Cotulla |
|
|
1,393 |
|
|
2,075 |
|
|
3,067 |
|
|
Palmetto |
|
|
494 |
|
|
774 |
|
|
1,491 |
|
|
Marquis |
|
|
656 |
|
|
901 |
|
|
974 |
|
|
TMS |
|
|
9 |
|
|
27 |
|
|
— |
|
|
Total |
|
|
43,189 |
|
|
37,594 |
|
|
14,828 |
|
|
Net production volumes: |
|
|
|
|
|
|
|
|
|
|
|
Total oil equivalent (MBoe) |
|
|
19,529 |
|
|
19,184 |
|
|
11,141 |
|
|
Average daily production (Boe/d) |
|
|
53,358 |
|
|
52,560 |
|
|
30,523 |
|
|
Average Sales Price (1): |
|
|
|
|
|
|
|
|
|
|
|
Oil ($ per Bbl) |
|
$ |
37.95 |
|
$ |
42.98 |
|
$ |
88.64 |
|
|
Natural gas liquids ($ per Bbl) |
|
$ |
13.72 |
|
$ |
11.99 |
|
$ |
25.86 |
|
|
Natural gas ($ per Mcf) |
|
$ |
2.50 |
|
$ |
2.63 |
|
$ |
4.06 |
|
|
Oil equivalent ($ per Boe) |
|
$ |
22.09 |
|
$ |
24.80 |
|
$ |
59.79 |
|
|
Average unit costs per Boe: |
|
|
|
|
|
|
|
|
|
|
|
Oil and natural gas production expenses |
|
$ |
8.43 |
|
$ |
8.16 |
|
$ |
8.40 |
|
|
Production and ad valorem taxes |
|
$ |
1.01 |
|
$ |
1.40 |
|
$ |
3.39 |
|
|
General and administrative expense |
|
$ |
5.64 |
|
$ |
3.87 |
|
$ |
5.72 |
|
|
Adjusted G&A per Boe (2)(3) |
|
$ |
3.32 |
|
$ |
2.89 |
|
$ |
4.40 |
|
|
Depreciation, depletion, amortization and accretion |
|
$ |
8.18 |
|
$ |
17.96 |
|
$ |
30.35 |
|
|
Impairment of oil and natural gas properties |
|
$ |
8.66 |
|
$ |
71.15 |
|
$ |
19.19 |
|
(1)Excludes the impact of derivative instruments.
14
(2)For the years ended December 31, 2016, 2015 and 2014, Adjusted general and administrative (“G&A”) expense excludes stock-based compensation expense of approximately $37.1 million ($1.90 per Boe), $14.8 million ($0.77 per Boe) and $12.8 million ($1.15 per Boe), respectively.
(3)For the years ended December 31, 2016, 2015 and 2014, Adjusted G&A expense excludes acquisition and divestiture costs included in G&A expense of $8.1 million ($0.42 per Boe), $3.8 million ($0.20 per Boe) and $1.8 million ($0.16 per Boe), respectively.
The table above in addition to other areas throughout this Annual Report on Form 10-K contains disclosures of G&A expenses excluding expenses related to stock-based compensation expense and certain costs related to acquisitions and divestitures, which is referred to as “Adjusted G&A.” Adjusted G&A is a “non-GAAP financial measure,” as defined in SEC rules. Please see “Item 6. Selected Financial Data -- Non-GAAP Financial Measures,” for a reconciliation of G&A and G&A per Boe to Adjusted G&A and Adjusted G&A per Boe, respectively.
Drilling Activities
The following table sets forth information with respect to wells drilled and completed during the periods indicated. The information should not be considered indicative of future performance, nor should a correlation be assumed between the number of productive wells drilled, quantities of reserves found or economic value. At December 31, 2016, 25 gross (22 net) wells were in various stages of completion.
|
|
|
Year Ended December 31, |
|
||||||||||
|
|
|
2016 |
|
2015 |
|
2014 |
|
||||||
|
|
|
Gross |
|
Net |
|
Gross |
|
Net |
|
Gross |
|
Net |
|
|
Development wells: |
|
|
|
|
|
|
|
|
|
|
|
|
|
|
Productive |
|
67.0 |
|
64.0 |
|
128.0 |
|
108.0 |
|
115.0 |
|
82.0 |
|
|
Dry (1) |
|
1.0 |
|
1.0 |
|
— |
|
— |
|
— |
|
— |
|
|
Exploratory wells: |
|
|
|
|
|
|
|
|
|
|
|
|
|
|
Productive |
|
— |
|
— |
|
8.0 |
|
8.0 |
|
6.0 |
|
5.5 |
|
|
Dry |
|
— |
|
— |
|
— |
|
— |
|
— |
|
— |
|
|
Total wells: |
|
|
|
|
|
|
|
|
|
|
|
|
|
|
Productive |
|
67.0 |
|
64.0 |
|
136.0 |
|
116.0 |
|
121.0 |
|
87.5 |
|
|
Dry (1) |
|
1.0 |
|
1.0 |
|
— |
|
— |
|
— |
|
— |
|
(1)The Company encountered mechanical malfunctions during drilling and was unable to complete the well.
The following table sets forth information at December 31, 2016 relating to the productive wells in which we owned a working interest as of that date. Productive wells consist of producing wells and wells capable of production, including natural gas wells awaiting pipeline connections to commence deliveries and oil wells awaiting connection to production facilities. Gross wells are the total number of producing wells in which we own an interest, and net wells are the sum of our fractional working interests owned in gross wells.
|
|
|
Oil |
|
Natural Gas |
|
Total |
||||||
|
|
|
Gross |
|
Net |
|
Gross |
|
Net |
|
Gross |
|
Net |
|
Operated by us |
|
158.0 |
|
116.4 |
|
333.0 |
|
333.0 |
|
491.0 |
|
449.4 |
|
Non-operated |
|
119.0 |
|
22.9 |
|
1.0 |
|
0.3 |
|
120.0 |
|
23.2 |
|
Total |
|
277.0 |
|
139.3 |
|
334.0 |
|
333.3 |
|
611.0 |
|
472.6 |
15
Developed and Undeveloped Acreage
The following table sets forth information as of December 31, 2016 relating to our leasehold acreage. Acreage related to royalty, overriding royalty and other similar interests is excluded from this summary.
|
|
|
Developed Acreage |
|
Undeveloped Acreage |
|
Total Acreage |
|
||||||
|
|
|
Gross |
|
Net |
|
Gross |
|
Net |
|
Gross |
|
Net |
|
|
Catarina |
|
26,400 |
|
26,400 |
|
79,651 |
|
79,651 |
|
106,051 |
|
106,051 |
|
|
Maverick |
|
6,375 |
|
5,911 |
|
104,307 |
|
96,715 |
|
110,682 |
|
102,626 |
|
|
Javelina |
|
— |
|
— |
|
39,506 |
|
39,506 |
|
39,506 |
|
39,506 |
|
|
Marquis |
|
4,140 |
|
4,140 |
|
17,337 |
|
17,337 |
|
21,477 |
|
21,477 |
|
|
Palmetto |
|
3,200 |
|
1,554 |
|
13,474 |
|
6,543 |
|
16,674 |
|
8,097 |
|
|
Total Eagle Ford |
|
40,115 |
|
38,005 |
|
254,275 |
|
239,752 |
|
294,390 |
|
277,757 |
|
|
TMS |
|
1,000 |
|
711 |
|
63,147 |
|
44,928 |
|
64,147 |
|
45,639 |
|
|
Other |
|
2,908 |
|
727 |
|
- |
|
- |
|
2,908 |
|
727 |
|
|
Total |
|
44,023 |
|
39,443 |
|
317,422 |
|
284,680 |
|
361,445 |
|
324,123 |
|
As of December 31, 2016, approximately 58% of our acreage was held by production. As of December 31, 2016, we have leases that were not held by production and not impaired representing 8,768 net acres (all which were in the Eagle Ford Shale) expiring in 2017, 15,539 net acres (all of which were in the Eagle Ford Shale) expiring in 2018, and 105,859 net acres (94,088 of which were in the Eagle Ford Shale) expiring in 2019 and beyond. We anticipate that our current and future drilling plans along with selected lease extensions will address the majority of our leases expiring in the Eagle Ford Shale in 2017 and beyond. In addition to these lease expirations, we also have a continuous development obligation in our Catarina area that requires us to drill, but not complete, (i) 50 wells in each annual period commencing on July 1, 2014 and (ii) at least one well in any consecutive 120 day period in order to maintain rights to any future undeveloped acreage.
Delivery Commitments
We have made commitments to certain purchasers to deliver a portion of our natural gas production from our Catarina area.
As of December 31, 2016, in our Catarina area, we have three contracts that require us to deliver portions of our natural gas, with delivery requirements through 2020, 2021 and 2022, respectively. Under our contract expiring in 2020, we are required to deliver 207 Bcf of natural gas through the Catarina Midstream gathering facilities. Under our contract expiring in 2021, we are required to deliver approximately 79 Bcf of natural gas. Under our contract expiring in 2021, which begins in 2017, we are required to deliver approximately 228 Bcf of natural gas. During 2016, we recorded expenses related to deficiencies on delivery commitments of approximately $1.6 million. These amounts were recorded to natural gas production expenses in our consolidated statement of operations and were not considered material to the financial statement line item or to the consolidated financial statements as a whole. We do not expect to have additional expenses in 2017 related to deficiencies on our natural gas delivery commitments.
Also in our Catarina area, we have one contract that requires us to deliver a portion of our oil production through the Catarina Midstream gathering facilities. This contract expires in 2020 and requires us to deliver approximately 15 MMBbls of oil. We do not expect to have additional expenses in 2017 related to deficiencies on our oil delivery commitments.
Operations
Oil and Natural Gas Leases
The typical oil and natural gas lease agreement covering our properties provides for the payment of royalties to the mineral owner for all oil and natural gas produced from any well drilled on the lease premises. The lessor royalties
16
and other leasehold burdens on our Eagle Ford properties range from 20.8% to 36.7%, resulting in a net revenue interest to us ranging from 63.3% to 79.2%.
Marketing and Major Customers
For the year ended December 31, 2016, purchases by three of our customers accounted for more than 10% (33%, 20%, and 14%, respectively) of our total revenues. The three customers, who are not affiliates of the Company, purchased oil, NGLs and natural gas production from us pursuant to existing marketing agreements with terms that are currently on “evergreen” status and renew on a month‑to‑month basis until either party gives 30‑day advance written notice of non‑renewal.
Since the oil, NGLs and natural gas that we sell are commodities for which there are a large number of potential buyers and because of the adequacy of the infrastructure to transport oil, NGLs and natural gas in the areas in which we operate, if we were to lose one or more customers, we believe that we could readily procure substitute or additional customers such that our production volumes would not be materially affected for any significant period of time.
Hedging Activities
We enter into commodity derivative contracts with unaffiliated third parties to achieve more predictable cash flows and to reduce our exposure to short‑term fluctuations in oil and natural gas prices. For a more detailed discussion of our hedging activities, please read “Item 7. Management’s Discussion and Analysis of Financial Condition and Results of Operations—Results of Operations—Operating Costs and Expenses—Commodity Derivative Transactions,” “Item 7. Management’s Discussion and Analysis of Financial Condition and Results of Operations—Critical Accounting Policies and Estimates—Derivative Instruments” and “Item 7A. Quantitative and Qualitative Disclosures about Market Risk.”
Competition
We operate in a highly competitive environment for leasing and acquiring properties and in securing trained personnel. Our competitors specifically include major and independent oil and natural gas companies that operate in our project areas. These competitors include, but are not limited to, Carrizo Oil & Gas, Inc., Chesapeake Energy Corporation, EOG Resources, Inc., Marathon Oil Corporation, SM Energy Company and Noble Energy, Inc. Many of our competitors possess and employ financial, technical and personnel resources substantially greater than ours, which can be particularly important in the areas in which we operate. As a result, our competitors may be able to pay more for productive oil and natural gas properties and exploratory prospects, as well as evaluate, bid for and purchase a greater number of properties and prospects than our financial or personnel resources permit. Our ability to acquire additional properties and to find and develop reserves will depend on our ability to evaluate and select suitable properties and to consummate transactions in a highly competitive environment. In addition, there is substantial competition for capital available for investment in the oil and natural gas industry.
We are also affected by the competition for and the availability of equipment, including drilling rigs, completion equipment and materials. We are unable to predict when, or if, shortages of such equipment may occur or how they would affect our development and exploitation programs.
Title to Properties
Prior to completing an acquisition of producing oil and natural gas properties, we perform title reviews on significant leases, and depending on the materiality of properties, we may obtain a title opinion or review previously obtained title opinions. As a result, title examinations have been obtained on a significant portion of our properties. After an acquisition, we review the assignments from the seller for scrivener’s and other errors and execute and record corrective assignments as necessary.
As is customary in the oil and natural gas industry, we initially conduct only a cursory review of the titles to our properties on which we do not have proved reserves. Prior to the commencement of drilling operations on those properties, we conduct a thorough title examination and perform curative work with respect to significant defects. To the
17
extent title opinions or other investigations reflect title defects on those properties, we are typically responsible for curing any title defects at our expense. We generally will not commence drilling operations on a property until we have cured any material title defects on such property.
We believe that we have satisfactory title to all of our material assets. Although title to these properties is subject to encumbrances in some cases, such as customary interests generally retained in connection with the acquisition of real property, customary royalty interests and contract terms and restrictions, liens under operating agreements, liens related to environmental liabilities associated with historical operations, liens for current taxes and other burdens, easements, restrictions and minor encumbrances customary in the oil and natural gas industry, we believe that none of these liens, restrictions, easements, burdens and encumbrances will materially detract from the value of these properties or from our interest in these properties or materially interfere with our use of these properties in the operation of our business. In addition, we believe that we have obtained sufficient rights‑of‑way grants and permits from public authorities and private parties for us to operate our business in all material respects as described in this Annual Report on Form 10‑K.
Seasonal Nature of Business
Generally, but not always, the demand for natural gas decreases during the summer months and increases during the winter months, resulting in seasonal fluctuations in the price we receive for our natural gas production. Seasonal anomalies such as mild winters or hot summers sometimes lessen this fluctuation. In addition, certain natural gas users utilize natural gas storage facilities and purchase some of their anticipated winter requirements during the summer, which can lessen seasonal demand fluctuations.
Environmental Matters and Regulation
General
Our operations are subject to stringent and complex federal, state and local laws and regulations governing environmental protection as well as the discharge of materials into the environment or otherwise relating to protection of the environment or occupational health and safety. Numerous governmental agencies, such as the Environmental Protection Agency (the “EPA”) and the Texas Railroad Commission (“Commission”), issue regulations, which often require difficult and costly compliance measures that carry substantial administrative, civil and criminal penalties and may result in injunctive obligations for failure to comply. These laws and regulations may, among other things (i) require the acquisition of permits to conduct exploration, drilling and production operations; (ii) restrict the types, quantities and concentration of various substances that can be released into the environment or injected into formations in connection with oil and natural gas drilling, production and transportation activities; (iii) govern the sourcing and disposal of water used in the drilling and completion process; (iv) limit or prohibit drilling or injection activities on certain lands lying within wilderness, wetlands, seismically active areas, and other protected areas; (v) require remedial measures to mitigate pollution from former and ongoing operations, such as requirements to close pits and plug abandoned wells; (vi) result in the suspension or revocation of necessary permits, licenses and authorizations; (vii) impose substantial liabilities for pollution resulting from drilling and production operations; and (viii) require that additional pollution controls be installed. Any failure to comply with these laws and regulations may result in the assessment of administrative, civil, and criminal penalties, the imposition of corrective or remedial obligations, and the issuance of orders enjoining performance of some or all of our operations. Furthermore, liability under such laws and regulations is often strict (i.e., no showing of “fault” is required) and can be joint and several.
These laws and regulations may also restrict the rate of oil and natural gas production below the rate that would otherwise be possible. The regulatory burden on the oil and natural gas industry increases the cost of doing business in the industry and consequently affects profitability. Additionally, The U.S. Congress and federal and state agencies frequently revise environmental laws and regulations, and any changes that result in more stringent and costly waste handling, disposal and cleanup requirements for the oil and natural gas industry could have a significant impact on our operating costs.
18
The trend in environmental regulation has been to place more restrictions and limitations on activities that may affect the environment. Any changes in environmental laws and regulations or re-interpretation of enforcement policies that result in more stringent and costly waste handling, storage transport, disposal, or remediation requirements could have a material adverse effect on our financial position and results of operations. Moreover, accidental releases or spills may occur in the course of our operations, and we could incur significant costs and liabilities as a result of such releases or spills, including any third-party claims for damage to property, natural resources or persons. While we believe that we are in substantial compliance with existing laws and regulations and that continued compliance with existing
requirements will not materially affect us, there is no assurance that this situation will continue in the future.
The following is a summary of the more significant existing environmental, health and safety laws and regulations to which our business operations are subject and for which compliance may have a material adverse impact on our capital expenditures, results of operations or financial position.
Hazardous Substances and Waste Handling
Our operations are subject to environmental laws and regulations relating to the management and release of hazardous substances, solid and hazardous wastes and petroleum hydrocarbons. These laws generally regulate the generation, storage, treatment, transportation and disposal of solid and hazardous waste and may impose strict and, in some cases, joint and several liability for the investigation and remediation of affected areas where hazardous substances may have been released or disposed. The Comprehensive Environmental Response, Compensation and Liability Act, as amended, or CERCLA, also known as the Superfund law, and comparable state laws impose liability, without regard to fault or legality of conduct, on classes of persons considered to be responsible for the release, deemed “responsible parties,” of a “hazardous substance” into the environment. These persons include the current owner or operator of the site where the release occurred, past owners or operators at the time a hazardous substance was released at the site, and anyone who disposed or arranged for the disposal of a hazardous substance released at the site. Under CERCLA, such persons are subject to strict liability that, in some circumstances, may be joint and several for the costs of cleaning up the hazardous substances that have been released into the environment, for damages to natural resources and for the costs of certain health studies. CERCLA also authorizes the EPA and, in some instances, third parties to act in response to threats to the public health or the environment and to seek to recover the costs they incur from the responsible classes of persons. It is not uncommon for neighboring landowners and other third parties to file common law-based claims for personal injury and property damage allegedly caused by hazardous substances or other pollutants released into the environment. We generate materials in the course of our operations that may be regulated as hazardous substances, and despite the “petroleum exclusion” of Section 101(14) of CERCLA, which currently encompasses natural gas, we may nonetheless handle hazardous substances within the meaning of CERCLA, or similar state statutes, in the course of our ordinary operations and, as a result, may be jointly and severally liable under CERCLA for all or part of the costs required to clean up sites at which these hazardous substances have been released into the environment. In addition, we may have liability for releases of hazardous substances at our properties by prior owners or operators or other third parties.
The Resource Conservation and Recovery Act, as amended, or RCRA, and comparable state statutes and their implementing regulations, regulate the generation, transportation, treatment, storage, disposal and cleanup of hazardous and non-hazardous wastes. Under the auspices of the EPA, most states administer some or all of the provisions of RCRA, sometimes in conjunction with their own, more stringent requirements. Federal and state regulatory agencies can seek to impose administrative, civil and criminal penalties for alleged non-compliance with RCRA and analogous state requirements. Drilling fluids, produced waters, and most of the other wastes associated with the exploration, development, and production of oil or natural gas, if properly handled, are exempt from regulation as hazardous waste under Subtitle C of RCRA. These wastes, instead, are regulated under RCRA's less stringent solid waste provisions, state laws or other federal laws. It is possible, however, that certain oil and natural gas exploration, development and production wastes now classified as non-hazardous could be classified as hazardous wastes in the future and therefore be subject to more rigorous and costly disposal requirements. Indeed, legislation has been proposed from time to time in The U.S. Congress to re-categorize certain oil and natural gas exploration and production wastes as “hazardous wastes.” Also, in December 2016, the EPA agreed in a consent decree to review its regulations of oil and gas waste. It has until March 2019 to determine whether any revisions are necessary. Any such change could result in an increase in our costs
19
to manage and dispose of wastes, which could have a material adverse effect on our results of operations and financial position.
We currently own, lease, or operate numerous properties that have been used for oil and natural gas exploration, production and processing for many years. Although we believe that we are in substantial compliance with the requirements of CERCLA, RCRA, and related state and local laws and regulations, that we hold all necessary and up-to-date permits, registrations and other authorizations required under such laws and regulations and that we have utilized operating and waste disposal practices that were standard in the industry at the time, hazardous substances, wastes, or hydrocarbons may have been released on, under or from the properties owned or leased by us, or on, under or from other locations, including off-site locations, where such substances have been taken for disposal. In addition, some of our properties have been operated by third parties or by previous owners or operators whose treatment and disposal of hazardous substances, wastes, or hydrocarbons was not under our control. These properties and the substances disposed or released on, under or from them may be subject to CERCLA, RCRA and analogous state laws. Under such laws, we could be required to undertake response or corrective measures, which could include removal of previously disposed substances and wastes, cleanup of contaminated property or performance of remedial plugging or pit closure operations to prevent future contamination.
Water and Other Water Discharges and Spills
The Federal Water Pollution Control Act, as amended, also known as the Clean Water Act, the Safe Drinking Water Act, or the SDWA, the Oil Pollution Act of 1990, or the OPA, and analogous state laws, impose restrictions and strict controls with respect to the discharge of pollutants, including oil, produced waters and other hazardous substances, into federal and state waters. The discharge of pollutants into regulated waters is prohibited, except in accordance with the terms of a permit issued by EPA or an analogous state agency. The discharge of dredge and fill material in regulated waters, including wetlands, is also prohibited, unless authorized by a permit issued by the U.S. Army Corps of Engineers. The EPA has also adopted regulations requiring certain oil and natural gas exploration and production facilities to obtain individual permits or coverage under general permits for storm water discharges. Some states also maintain groundwater protection programs that require permits for discharges or operations that may impact groundwater conditions. The underground injection of fluids is subject to permitting and other requirements under state laws and regulation.
Furthermore, the EPA is examining regulatory requirements for “indirect dischargers” of wastewater – i.e., those that send their discharges to private or publicly owned treatment facilities, which treat the wastewater before discharging it to regulated waters. On June 28, 2016, the EPA published a final rule prohibiting the discharge of wastewater from onshore unconventional oil and gas extraction facilities to publicly owned wastewater treatment plants. The EPA is also conducting a study of private wastewater treatment facilities (also known as centralized waste treatment, or CWT, facilities) accepting oil and gas extraction wastewater. The EPA is collecting data and information related to the extent to which CWT facilities accept such wastewater, available treatment technologies (and their associated costs), discharge characteristics, financial characteristics of CWT facilities, and the environmental impacts of discharges from CWT facilities.
Costs may be associated with the treatment of wastewater or developing and implementing storm water pollution prevention plans, as well as for monitoring and sampling the storm water runoff from certain of our facilities. Obtaining permits also has the potential to delay the development of oil and natural gas projects. These same regulatory programs also limit the total volume of water that can be discharged, hence limiting the rate of development, and require us to incur compliance costs.
The OPA amends the Clean Water Act and establishes strict liability and natural resource damages liability for unauthorized discharges of oil into waters of the United States. The OPA is the primary federal law imposing oil spill liability. The OPA contains numerous requirements relating to the prevention of and response to petroleum releases into waters of the United States, including the requirement that operators of offshore facilities and certain onshore facilities near or crossing waterways must maintain certain significant levels of financial assurance to cover potential environmental cleanup and restoration costs. The OPA subjects owners of facilities to strict liability that, in some circumstances, may be joint and several for all containment and cleanup costs and certain other damages arising from a
20
release, including, but not limited to, the costs of responding to a release of oil to surface waters.
Pursuant to these laws and regulations, we may be required to obtain and maintain approvals or permits for the discharge of wastewater or storm water and the underground injection of fluids and are required to develop and implement spill prevention, control and countermeasure, or SPCC plans, in connection with on-site storage of significant quantities of oil. Federal and state regulatory agencies can impose administrative, civil and criminal penalties for non-compliance with discharge permits or other requirements of the Clean Water Act and analogous state laws and regulations. We maintain all required discharge permits necessary to conduct our operations, and we believe we are in substantial compliance with their terms.
Regulation of Hydraulic Fracturing
Hydraulic fracturing is an important and common process used by oil and natural gas exploration and
production operators in the completion of certain oil and natural gas wells whereby water, sand and chemicals are injected under pressure into subsurface formations to stimulate production of oil and/or natural gas. The federal Safe Drinking Water Act, or SDWA, regulates the underground injection of substances through the Underground Injection Control, or UIC, Program. Hydraulic fracturing is generally exempt from regulation under the UIC Program, and thus the hydraulic fracturing process is typically regulated by state oil and natural gas commissions. The EPA, however, has asserted federal regulatory authority over hydraulic fracturing involving diesel additives under the UIC Program. On February 12, 2014, the EPA published a revised UIC Program guidance for oil and natural gas hydraulic fracturing activities using diesel fuel. The guidance document describes how regulations of Class II wells, which are those wells injecting fluids associated with oil and natural gas production activities, may be tailored to address the purported unique risks of diesel fuel injection during the hydraulic fracturing process. Although the EPA is not the permitting authority for UIC Class II programs in Texas, Mississippi, and Louisiana, where we maintain acreage, the EPA is encouraging state programs to review and consider use of the above-mentioned guidance. In addition, the EPA plans to develop a Notice of Proposed Rulemaking by June 2018, which would describe a proposed mechanism - regulatory, voluntary, or a combination of both - to collect data on hydraulic fracturing chemical substances and mixtures. Furthermore, legislation to amend the SDWA to repeal the exemption for hydraulic fracturing from the definition of “underground injection” and require federal permitting and regulatory control of hydraulic fracturing, as well as legislative proposals to require disclosure of the chemical constituents of the fluids used in the fracturing process, have been proposed in recent sessions of The U.S. Congress.
The protection of groundwater quality is extremely important to us. We believe that we follow all state and federal regulations and apply industry standard practices for groundwater protection in our operations. These measures are subject to close supervision by state and federal regulators. Our policy and practice is to follow all applicable guidelines and regulations in the areas where we conduct hydraulic fracturing. Accordingly, we set surface casing strings below the deepest usable quality fresh water zones and cement them back to the surface in accordance with applicable regulations, potential lease requirements and other legal requirements to ensure protection of existing fresh water zones. Also, prior to commencing drilling operations for the production portion of the hole, the surface casing strings are pressure tested to ensure mechanical integrity.
Although not presently relevant to our current 2017 development plans, on March 26, 2015, the Bureau of Land Management (“BLM”) published a final rule governing hydraulic fracturing on federal and Indian lands. The rule requires public disclosure of chemicals used in hydraulic fracturing, implementation of a casing and cementing program, management of recovered fluids, and submission to BLM of detailed information about the proposed operation, including wellbore geology, the location of faults and fractures, and the depths of all usable water. On June 21, 2016, the United States District Court for Wyoming set aside the rule, holding that the BLM lacked Congressional authority to promulgate the rule. The BLM has appealed to the Tenth Circuit Court of Appeals.
Furthermore, there are certain governmental reviews either underway or being proposed that focus on environmental aspects of hydraulic fracturing practices. For example, on December 13, 2016, the EPA released a study examining the potential for hydraulic fracturing to impact drinking water resources finding that, under some circumstances, the use of water in hydraulic fracturing activities can impact drinking water resources. Also, on February 6, 2015, the EPA released a report with findings and recommendations related to public concern about induced seismic
21
activity from disposal wells. The report recommends strategies for managing and minimizing the potential for significant injection-induced seismic events. Other governmental agencies, including the U.S. Department of Energy, the U.S. Geological Survey, and the U.S. Government Accountability Office, have evaluated or are evaluating various other aspects of hydraulic fracturing.
These ongoing or proposed studies, depending on their degree of pursuit and any meaningful results obtained, could spur initiatives to further regulate hydraulic fracturing or the disposal of produced water and flowback fluid in underground injection wells under the SDWA or other regulatory mechanism.
Also, some states have adopted, and other states are considering adopting, regulations that could restrict hydraulic fracturing in certain circumstances or otherwise require the public disclosure of chemicals used in the hydraulic fracturing process. For example, in December 2011, the Commission adopted rules and regulations requiring that oil and gas operators publicly disclose the chemicals used in the hydraulic fracturing process. Also, in May 2013, the Commission adopted new rules governing well casing, cementing and other standards for ensuring that hydraulic fracturing operations do not contaminate nearby water resources. The new rules took effect in January 2014. Additionally, on October 28, 2014, the Commission adopted disposal well rule amendments designed, amongst other things, to require applicants for new disposal wells that will receive non-hazardous produced water and hydraulic fracturing flowback fluid to conduct seismic activity searches utilizing the U.S. Geological Survey. The searches are intended to determine the potential for earthquakes within a circular area of 100 square miles around a proposed, new disposal well. The disposal well rule amendments, which became effective on November 17, 2014, also clarify the Commission's authority to modify, suspend or terminate a disposal well permit if scientific data indicates a disposal well is likely to contribute to seismic activity. The Commission has used this authority to deny permits for waste disposal sites.
A number of lawsuits and enforcement actions have been initiated across the country alleging that hydraulic fracturing practices have induced seismic activity and adversely impacted drinking water supplies, use of surface water, and the environment generally. Several states and municipalities have adopted, or are considering adopting, regulations that could restrict or prohibit hydraulic fracturing in certain circumstances. These or any other new laws or regulations that significantly restrict hydraulic fracturing or the disposal of produced water and flowback fluid in underground injection wells could make it more difficult or costly for us to drill and produce from conventional and tight formations as well as make it easier for third parties opposing the hydraulic fracturing process to initiate legal proceedings.
Further federal, state and/or local laws governing hydraulic fracturing could result in additional permitting and financial assurance requirements, more stringent construction specifications, increased monitoring, reporting and recordkeeping obligations, plugging and abandonment requirements and also to attendant permitting delays and potential increases in costs. Such changes could cause us to incur substantial compliance costs, and compliance or the consequences of failure to comply by us could have a material adverse effect on our financial condition and results of operations. At this time, it is not possible to estimate the potential impact on our business that may arise if additional federal or state and/or local laws are enacted.
Air Emissions
The federal Clean Air Act, as amended, or the CAA, and comparable state laws, regulate emissions of various air pollutants through air emissions standards, construction and operating permitting programs and the imposition of other compliance requirements. In addition, the EPA has developed, and continues to develop, stringent regulations governing emissions of toxic air pollutants at specified sources. On August 16, 2012, the EPA published final rules that subject oil and natural gas production, processing, transmission, and storage operations to regulation under the New Source Performance Standards (“NSPS”) and National Emission Standards for Hazardous Air Pollutants (“NESHAP”) programs. The rule includes NSPS for completions of hydraulically fractured gas wells and establishes specific new requirements for emissions from compressors, controllers, dehydrators, storage vessels, natural gas processing plants and certain other equipment. The final rule seeks to achieve a 95% reduction in Volatile Organic Compounds (“VOCs”) emitted by requiring the use of reduced emission completions or "green completions" on all hydraulically fractured wells constructed or refractured after January 1, 2015. The EPA received numerous requests for reconsideration of these rules from both industry and the environmental community, and court challenges to the rules were also filed. In response, the
22
EPA has issued, and will likely continue to issue, revised rules responsive to some of the requests for reconsideration. In particular, on May 12, 2016, the EPA amended its regulations to impose new standards for methane and VOC emissions for certain new, modified, and reconstructed equipment, processes, and activities across the oil and natural gas sector. On the same day, the EPA finalized a plan to implement its minor new source review program in Indian country for oil and natural gas production, and it issued for public comment an information request that will require companies to provide extensive information instrumental for the development of regulations to reduce methane emissions from existing oil and gas sources.
Also, on November 15, 2016, the BLM finalized a rule to reduce the flaring, venting and leaking of methane from oil and gas operations on federal and Indian lands. The rule requires operators to use currently available technologies and equipment to reduce flaring, periodically inspect their operations for leaks, and replace outdated equipment that vents large quantities of gas into the air. The rule also clarifies when operators owe the government royalties for flared gas. State and industry groups have challenged this rule in federal court, asserting that the BLM lacks authority to prescribe air quality regulations. In addition, Congress has taken certain initial steps to repeal the rule pursuant to the Congressional Review Act, though it remains uncertain whether the rule will ultimately be repealed.
These laws and regulations may require us to obtain pre-approval for the construction or modification of certain projects or facilities expected to produce or significantly increase air emissions, obtain and strictly comply with stringent air permit requirements or utilize specific equipment or technologies to control emissions. The need to obtain permits has the potential to delay the development of oil and natural gas projects, and our failure to comply with these requirements could subject us to monetary penalties, injunctions, conditions or restrictions on operations and, potentially, criminal enforcement actions. While we may be required to incur certain capital expenditures in the next few years for air pollution control equipment or other air emissions-related issues, we do not believe that such requirements will have a material adverse effect on our operations.
Climate Change
In recent years, federal, state and local governments have taken steps to reduce emissions of GHGs. The EPA has finalized a series of GHG monitoring, reporting and emission control rules for the oil and natural gas industry, and the U.S. Congress has, from time to time, considered adopting legislation to reduce emissions. Almost one-half of the states have already taken measures to reduce emissions of GHGs primarily through the development of GHG emission inventories and/or regional GHG cap-and-trade programs.
Furthermore, in December 2015, the United States participated in the 21st Conference of the Parties (COP-21) of the United Nations Framework Convention on Climate Change in Paris, France. The resulting Paris Agreement calls for the parties to undertake “ambitious efforts” to limit the average global temperature, and to conserve and enhance sinks and reservoirs of GHGs. The Agreement went into effect on November 4, 2016 and establishes a framework for the parties to cooperate and report actions to reduce GHG emissions. Also, on June 29, 2016, the leaders of the United States, Canada and Mexico announced an Action Plan to, among other things, boost clean energy, improve energy efficiency, and reduce greenhouse gas emissions. The Action Plan specifically calls for a reduction in methane emissions from the oil and gas sector by 40 to 45 percent by 2025. It remains unclear whether and how the results of the 2016 U.S. election could impact the regulation of greenhouse gas emissions at the federal and state level.
Restrictions on GHG emissions that may be imposed could adversely affect the oil and natural gas industry. The adoption of any legislation or regulations that otherwise limit emissions of GHGs from our equipment and operations, could require us to incur increased operating costs to monitor and report on GHG emissions or reduce emissions of GHGs associated with our operations, such as costs to purchase and operate emissions control systems, to acquire emissions allowances or comply with new regulatory requirements. Any GHG emissions legislation or regulatory programs applicable to power plants or refineries could also increase the cost of consuming, and thereby adversely affect demand for the oil and natural gas that we produce. Consequently, legislation and regulatory programs to reduce GHG emissions could have an adverse effect on our business, financial condition and results of operations.
In addition, claims have been made against certain energy companies alleging that GHG emissions from oil and natural gas operations constitute a public nuisance under federal and/or state common law. As a result, private individuals may seek to enforce environmental laws and regulations against us and could allege personal injury or
23
property damages. While our business is not a party to any such litigation, we could be named in actions making similar allegations. An unfavorable ruling in any such case could significantly impact our operations and could have an adverse impact on our financial condition.
Moreover, there has been public discussion that climate change may be associated with extreme weather conditions such as more intense hurricanes, thunderstorms, tornados and snow or ice storms, as well as rising sea levels. Another possible consequence of climate change is increased volatility in seasonal temperatures. Some studies indicate that climate change could cause some areas to experience temperatures substantially colder than their historical averages. Extreme weather conditions can interfere with our production and increase our costs and damage resulting from extreme weather may not be fully insured. However, at this time, we are unable to determine the extent to which climate change may lead to increased storm or weather hazards affecting our operations.
National Environmental Policy Act
Oil and natural gas exploration, development and production activities on federal lands are subject to the National Environmental Policy Act, as amended, or NEPA. NEPA requires federal agencies, including the DOI, to evaluate major agency actions having the potential to significantly impact the environment. In the course of such evaluations, an agency will prepare an Environmental Assessment to evaluate the potential direct, indirect and cumulative impacts of a proposed project and, if necessary, will prepare a more detailed Environmental Impact Statement that may be made available for public review and comment. Currently, we have minimal exploration and production activities on federal lands. However, to the extent our current or future activities on federal lands are subject to the requirements of NEPA, this process has the potential to delay the receipt of governmental permits and the development of oil and natural gas projects. Authorizations under NEPA also are subject to protest, appeal or litigation, which can delay or halt projects.
Endangered Species Act
The Federal Endangered Species Act, or the ESA, and analogous state statutes restrict activities that may adversely threatened or endangered species or their habitat. Similar protections are offered to migratory birds under the Migratory Bird Treaty Act. Federal agencies are required to insure that any action authorized, funded or carried out by them is not likely to jeopardize the continued existence of listed species or modify their critical habitat. While some of our facilities on federal lands may be located in areas that are designated as habitat for endangered or threatened species, we believe that we are in substantial compliance with the ESA. The U.S. Fish and Wildlife Service may identify, however, previously unidentified endangered or threatened species or may designate critical habitat and suitable habitat areas that it believes are necessary for survival of a threatened or endangered species, which could cause us to incur additional costs or become subject to operating restrictions or bans in the affected areas.
Occupational Safety and Health Act
We are also subject to the requirements of OSHA and comparable state laws that regulate the protection of the health and safety of employees. In addition, OSHA's hazard communication standard requires that information be maintained about hazardous materials used or produced in our operations and that this information be provided to employees, state and local government authorities and citizens. We believe that our operations are in substantial compliance with the OSHA requirements.
Other Regulation of the Oil and Natural Gas Industry
The oil and natural gas industry is extensively regulated by numerous federal, state and local authorities. Legislation affecting the oil and natural gas industry is under constant review for amendment or expansion, frequently increasing the regulatory burden. Additionally, numerous departments and agencies, both federal and state, are authorized by statute to issue rules and regulations that are binding on the oil and natural gas industry and its individual members, some of which carry substantial penalties for failure to comply. Although the regulatory burden on the oil and natural gas industry increases our cost of doing business and, consequently, affects our profitability, these burdens generally do not affect us any differently or to any greater or lesser extent than they affect other companies in the oil and natural gas industry with similar types, quantities and locations of production.
24
Drilling and Production
Our operations are subject to various types of regulation at federal, state and local levels. These types of regulation include requiring permits for the drilling of wells, drilling bonds and reports concerning operations. Most states, and some counties and municipalities, in which we operate also regulate one or more of the following:
|
· |
the location of wells; |
|
· |
the method of drilling and casing wells; |
|
· |
the disclosure of the chemicals used in the hydraulic fracturing process; |
|
· |
the surface use and restoration of properties upon which wells are drilled; |
|
· |
the plugging and abandoning of wells; and |
|
· |
notice to surface owners and other third parties. |
State laws regulate the size and shape of drilling and spacing units or proration units governing the pooling of oil and natural gas properties. Some states allow forced pooling or integration of tracts to facilitate exploration, while other states rely on voluntary pooling of lands and leases. In some instances, forced pooling or unitization may be implemented by third parties and may reduce our interest in the unitized properties. In addition, state conservation laws establish maximum rates of production from oil and natural gas wells, generally prohibit the venting or flaring of natural gas and impose requirements regarding the ratability of production. These laws and regulations may limit the amount of oil and natural gas we can produce from our wells or limit the number of wells or the locations at which we can drill. Moreover, each state generally imposes a production or severance tax with respect to the production and sale of oil, natural gas and NGLs within its jurisdiction.
Natural Gas Regulation
The availability, terms and cost of transportation significantly affect sales of natural gas. The interstate transportation and sale for resale of natural gas is subject to federal regulation, including regulation of the terms, conditions and rates for interstate transportation, storage and various other matters, primarily by the Federal Energy Regulatory Commission, or FERC. Federal and state regulations govern the price and terms for access to natural gas pipeline transportation. FERC's regulations for interstate natural gas transmission in some circumstances may also affect the intrastate transportation of natural gas.
The FERC also possesses regulatory oversight over natural gas markets, including the purchase, sale and transportation activities of non-interstate pipelines and other natural gas market participants. FERC possesses substantial enforcement authority for violations of the Natural Gas Act, or NGA, including the ability to assess civil penalties, order disgorgement of profits and recommend criminal penalties. The Energy Policy Act of 2005 amended the NGA to grant FERC new authority to facilitate price transparency in markets for the sale or transportation of physical natural gas in interstate commerce, and to prohibit market manipulation. FERC's anti-manipulation regulations apply to FERC jurisdictional activities, which have been broadly construed by the FERC. Should we fail to comply with all applicable FERC-administered statutes, rules, regulations and orders, we could be subject to substantial civil and criminal penalties, including civil penalties of up to $1.0 million per day, per violation.
In 2008, FERC took additional steps to enhance its market oversight and monitoring of the natural gas industry. Order No. 704, as clarified in orders on rehearing, requires buyers and sellers of natural gas above a de minimis level, including entities not otherwise subject to FERC jurisdiction, to submit an annual report to FERC describing their wholesale physical natural gas transactions that use an index or that contribute to or may contribute to the formation of a gas index. The FERC also contemplated expanding the industry's reporting requirements. On November 15, 2012, the FERC issued a Notice of Inquiry seeking comments whether requiring quarterly reporting of every gas transaction within the FERC's jurisdiction that entails physical delivery for the next day or the next month would provide useful information for improving natural gas market transparency. The FERC ultimately determined that imposing a quarterly
25
reporting requirement is not necessary at this time and exercised its discretion to terminate the Notice of Inquiry on November 17, 2015.
Although natural gas prices are currently unregulated, The U.S. Congress historically has been active in the area of natural gas regulation. We cannot predict whether new legislation to regulate natural gas might be proposed, what proposals, if any, might actually be enacted by The U.S. Congress or the various state legislatures, and what effect, if any, the proposals might have on the operations of our properties. Sales of condensate and NGLs are not currently regulated and are made at market prices.
State Regulation
The various states regulate the drilling for, and the production, gathering and sale of, oil and natural gas, including imposing severance taxes and requirements for obtaining drilling permits. For example, Texas currently imposes a 4.6% severance tax on oil production and a 7.5% severance tax on natural gas production. States also regulate the method of developing new fields, the spacing and operation of wells and the prevention of waste of natural gas resources. States may regulate rates of production and may establish maximum daily production allowables from natural gas wells based on market demand or resource conservation, or both. States do not regulate wellhead prices or engage in other similar direct economic regulation, but there can be no assurance that they will not do so in the future. The effect of these regulations may be to limit the amount of natural gas that may be produced from our wells and to limit the number of wells or locations we can drill.
The oil and natural gas industry is also subject to compliance with various other federal, state and local regulations and laws. Some of those laws relate to resource conservation and equal employment opportunity. We do not believe that compliance with these laws will have a material adverse effect on us.
Employees
We currently do not have any employees. Pursuant to our Services Agreement with SOG (the “Services Agreement”), SOG performs services for us, including the operation of our properties. Please also read “Item 8. Financial Statements and Supplementary Data —Note 9, Related Party Transactions.” As of December 31, 2016, SOG had approximately 235 employees, including 27 engineers, 13 geoscientists and 13 land professionals. None of these employees are represented by labor unions or covered by any collective bargaining agreement. We believe that SOG’s relations with its employees are satisfactory.
We also contract for the services of independent consultants involved in land, engineering, regulatory, accounting, financial and other disciplines as needed.
Offices
For our principal offices, we currently share offices with other members of the Sanchez Group under leases entered into by the Company covering approximately 90,000 square feet of office space in Houston, Texas at 1000 Main Street, Suite 3000, Houston, Texas 77002, expiring in 2025. In addition, SOG maintains offices in Laredo and San Antonio, Texas.
Available Information
We are required to file annual, quarterly and current reports, proxy statements and other information with the SEC. You may read and copy any documents filed by us with the SEC at the SEC’s Public Reference Room at 100 F Street, N.E., Washington, D.C. 20549. You may obtain information on the operation of the Public Reference Room by calling the SEC at 1‑800‑SEC‑0330. Our filings with the SEC are also available to the public from commercial document retrieval services and at the SEC’s website at http://www.sec.gov.
26
Our common stock is listed and traded on the New York Stock Exchange (“NYSE”) under the symbol “SN.” Our reports, proxy statements and other information filed with the SEC can also be inspected and copied at the New York Stock Exchange, 20 Broad Street, New York, New York 10005.
We also make available on our website at http://www.sanchezenergycorp.com all of the documents that we file with the SEC, free of charge, as soon as reasonably practicable after we electronically file such material with the SEC. Information contained on our website is not incorporated by reference into this Annual Report on Form 10‑K.
Our business involves a high degree of risk. You should consider and read carefully all of the risks and uncertainties described below, together with all of the other information contained in this Annual Report on Form 10‑K, including the financial statements and the related notes appearing at the end of this Annual Report on Form 10‑K. If any of the following risks, or any risk described elsewhere in this Annual Report on Form 10‑K, actually occurs, our business, business prospects, financial condition, results of operations or cash flows could be materially adversely affected. The risks below are not the only ones facing the Company. Additional risks not currently known to us or that we currently deem immaterial may also adversely affect us. This Annual Report on Form 10‑K also contains forward‑looking statements, estimates and projections that involve risks and uncertainties. Our actual results could differ materially from those anticipated in the forward‑looking statements as a result of specific factors, including the risks described below. Also, please read “Cautionary Note Regarding Forward-Looking Statements.”
Risks Related to Our Business
Market conditions for oil, natural gas and NGLs are highly volatile. A sustained decline in prices for these commodities could adversely affect our revenue, cash flows, profitability and growth.
Prices for oil, natural gas and NGLs fluctuate widely in response to a variety of factors that are beyond our control, such as:
|
· |
domestic and foreign supply of and demand for oil, natural gas and NGLs; |
|
· |
weather conditions and the occurrence of natural disasters; |
|
· |
overall domestic and global economic conditions; |
|
· |
political and economic conditions in oil, natural gas and NGL producing countries globally, including terrorist attacks and threats, escalation of military activity in response to such attacks or acts of war; |
|
· |
actions of OPEC and other state‑controlled oil companies relating to oil price and production controls; |
|
· |
the effect of increasing liquefied natural gas and exports from the United States; |
|
· |
the impact of the U.S. dollar exchange rates on oil, natural gas and NGL prices; |
|
· |
technological advances affecting energy supply and energy consumption; |
|
· |
domestic and foreign governmental regulations, including regulations prohibiting or restricting our ability to apply hydraulic fracturing to our wells, and taxation; |
|
· |
the impact of energy conservation efforts and alternative fuel requirements; |
|
· |
the proximity, capacity, cost and availability of oil, natural gas and NGL pipelines and other transportation facilities; |
27
|
· |
the availability of refining capacity; and |
|
· |
the price and availability of, and consumer demand for, alternative fuels. |
Governmental actions may also affect oil, natural gas and NGL prices. It is uncertain what impact the election of President Trump and the new Congress may have on the exploration for and production of oil, natural gas and NGLs. In the past, oil, natural gas and NGL prices have been extremely volatile, and we expect this volatility to continue. Beginning in the latter half of 2014, oil prices declined precipitously, and continued to decline throughout 2015 as well as the start of 2016. The West Texas Intermediate posted price used to calculate the full cost ceiling in accordance with SEC rules declined from an annual high of $105.34 per Boe on July 1, 2014 to $69.00 per Boe on December 1, 2014, $41.85 per Boe on December 1, 2015 and $31.62 per Boe on February 1, 2016. Such volatility has negatively affected the amount of our net estimated proved reserves and has negatively affected the standardized measure of discounted future net cash flows of our net estimated proved reserves. We recorded a full cost ceiling test impairment after income taxes of $169 million for the year ended December 31, 2016, and we recorded a full cost ceiling impairment test impairment after income taxes of $1,365 million for the year ended December 31, 2015. The impact of lower commodity prices adversely affecting proved reserve values primarily contributed to the ceiling impairment. Changes in production rates, prices, levels of reserves, future development costs, transfers of unevaluated properties, and other factors will determine our actual ceiling test calculation and impairment analyses in future periods. The 12‑month average commodity price could continue to decline, which could result in additional impairments being recorded during 2017.
In addition, our revenue, profitability and cash flow depend upon the prices of and demand for oil, natural gas and NGL reserves, and continued price volatility and low commodity prices, or a sustained drop in prices could negatively affect our financial results and impede our growth. In particular, sustained declines in commodity prices will:
|
· |
limit our ability to enter into commodity derivative contracts at attractive prices; |
|
· |
reduce the value and quantities of our reserves, because declines in oil, natural gas and NGL prices would reduce the amount of oil, natural gas and NGLs that we can economically produce; |
|
· |
reduce the amount of cash flow available for capital expenditures; |
|
· |
limit our ability to borrow money or raise additional capital; and |
|
· |
make it uneconomical for our operating partners to commence or continue production levels of oil, natural gas and NGLs. |
An increase in the differential between the NYMEX or other benchmark prices of oil, natural gas and NGLs and the wellhead price we receive for our production could adversely affect our business, financial condition and results of operations.
The prices that we receive for our oil, natural gas and NGL production sometimes reflect differences between the relevant benchmark prices, such as NYMEX, that are used for calculating hedge positions. The difference between the benchmark price and the price we receive is called a basis differential. Increases in the basis differential between the benchmark prices for oil, natural gas and NGLs and the wellhead price we receive could adversely affect our business, financial condition and results of operations. We do not have or currently plan to have any commodity derivative contracts covering the amount of the basis differentials we experience in respect of our production. As such, we will be exposed to any increase in such differentials, which could adversely affect our business, financial condition and results of operations.
As of February 27, 2017, we had commodity derivative contracts in place covering approximately 36% and 98% of the mid‑point of our estimated oil and natural gas production, respectively, for 2017. The contracts consist of swaps and put spreads covering crude oil and natural gas production. In the future, we expect to continue to enter into commodity derivative contracts for a portion of our estimated production, which could result in net gains or losses on commodity derivatives. Our hedging strategy and future hedging transactions will be determined by our management,
28
which is not under any obligation to enter into commodity derivative contracts covering any specific portion of our production.
The prices at which we enter into commodity derivative contracts covering our production in the future will be dependent upon oil, natural gas and NGL prices at the time we enter into these transactions, which may be substantially higher or lower than past or current oil, natural gas and NGL prices. Accordingly, our price hedging strategy may not protect us from significant declines in oil, natural gas and NGL prices realized for our future production. Conversely, our hedging strategy may limit our ability to realize incremental cash flows from commodity price increases. As such, our hedging strategy may not protect us from changes in oil, natural gas and NGL prices that could have a significant adverse effect on our liquidity, business, financial condition and results of operations.
Lower oil, natural gas and NGL prices have caused us to record ceiling limitation impairments, reducing our earnings and our stockholders’ equity and further declines in commodity prices may cause us to record further impairments, which would reduce our earnings and stockholders’ equity.
We use the full‑cost method of accounting and accordingly, we capitalize all costs associated with the acquisition, exploration and development of oil, natural gas and NGL properties, including unproved and unevaluated property costs. Under full cost accounting rules, the net capitalized cost of oil, natural gas and NGL properties may not exceed a “ceiling limit” that is based upon the present value of estimated future net revenues from net proved reserves, discounted at 10%, plus the lower of the cost or fair market value of unproved properties and other adjustments as required by SEC rules. If net capitalized costs of oil, natural gas and NGL properties exceed the ceiling limit, we must charge the amount of the excess to earnings, which could have a material adverse effect on our results of operations for the periods in which such charges are taken. This is called a “ceiling limitation impairment.” The risk that we will experience a ceiling limitation impairment increases when oil, natural gas or NGL prices are depressed as in the current environment, if we have substantial downward revisions in estimated net proved reserves or if estimates of future development costs increase significantly. Based upon current price trends we could experience ceiling limitation impairments in future periods.
Beginning in the latter half of 2014, oil prices declined precipitously, and continued to decline throughout 2015 as well as the start of 2016. Given this decline in commodity prices, the net book value of our oil and natural gas properties exceeded our ceiling amount using the WTI unweighted 12‑month average price adjusted by lease for quality, transportation fees, geographical differentials, marketing bonuses or deductions and other factors affecting the price realized at the wellhead, resulting in a total write‑downs of our oil and natural gas properties of $1,365 million after income taxes during 2015 and $169.0 million after income taxes during 2016. As ceiling test computations depend upon the calculated unweighted arithmetic average prices, it is difficult to predict the likelihood, timing and magnitude of any future impairments. However, a decline in 12‑month average commodity prices could result in additional impairments recorded during 2017. A ceiling test write down would negatively affect our results of operations.
Costs associated with unevaluated properties are not initially subject to the ceiling test limitation. Rather, we assess all items classified as unevaluated property on a quarterly basis for possible impairment or reduction in value based upon our intentions, as approved by our board of directors and management, with respect to drilling on such properties, the remaining lease term, geological and geophysical evaluations, drilling results, the assignment of proved reserves, and the economic viability of development if proved reserves are assigned. These factors are significantly influenced by our expectations regarding future commodity prices, development costs, and access to capital at acceptable cost. During any period in which these factors indicate impairment, the cumulative drilling costs incurred to date for such property and all or a portion of the associated leasehold costs are transferred to the full cost pool and are then subject to amortization and the ceiling test limitation. Accordingly, a significant change in these factors, many of which are beyond our control, may shift a significant amount of cost from unevaluated properties into the full cost pool that is subject to amortization and the ceiling test limitation.
Lower oil and natural gas prices also reduces the amount of oil and natural gas that we can produce economically. Substantial and sustained decreases in oil and natural gas prices would render uneconomic a significant portion of our development and exploitation projects. This may result in our having to make downward adjustments to our estimated proved reserves. As a result, substantial and sustained declines in oil and natural gas prices may materially
29
and adversely affect our future business, financial condition, results of operations, liquidity or ability to finance planned capital expenditures.
The Company’s derivative risk management activities could result in financial losses.
To mitigate the effect of commodity price volatility on the Company’s net cash provided by operating activities, support the Company’s annual capital budgeting and expenditure plans and reduce commodity price risk associated with certain capital projects, the Company’s strategy is to enter into derivative arrangements covering a portion of its oil, NGL and natural gas production. These derivative arrangements are subject to mark‑to‑market accounting treatment, and the changes in fair market value of the contracts are reported in the Company’s statements of operations each quarter, which may result in significant non‑cash gains or losses. After the current hedges expire, there is significant uncertainty that we will be able to put new hedges in place that will provide us with the same benefit. These derivative contracts may also expose the Company to risk of financial loss in certain circumstances, including when:
|
· |
production is less than the contracted derivative volumes, in which case we might be forced to satisfy all or a portion of our hedging obligations without the benefit of the cash flow from our sale of the underlying physical commodity; |
|
· |
the counterparty to the derivative contract defaults on its contractual obligations; |
|
· |
there is a widening of price basis differentials between delivery points for our production and the delivery point assumed in the hedge instrument; or |
|
· |
the derivative contracts limit the benefit the Company would otherwise receive from increases in commodity prices. |
Such financial losses could materially impact our liquidity, business, financial condition and results of operations.
There can be no assurance that the Comanche Acquisition will be consummated in the anticipated timeframe, on the terms described herein, or at all.
On January 12, 2017, the Company, through two of our subsidiaries, SN EF UnSub, LP (“SN UnSub”) and SN EF Maverick, LLC (“SN Maverick”), along with an entity controlled by The Blackstone Group, L.P., Gavilan Resources, LLC (“Blackstone”), signed a purchase and sale agreement (the “Comanche Purchase Agreement”) to acquire assets (the “Comanche Assets”) from Anadarko E&P Onshore LLC and Kerr-McGee Oil and Gas Onshore LP (together, “Anadarko”) for $2,275 million in cash, subject to customary closing adjustments (the “Comanche Acquisition”). The consummation of the Comanche Acquisition is subject to certain closing conditions, including conditions that must be met by Anadarko and that are beyond our control. In addition, under certain circumstances, we, Blackstone or Anadarko are able to terminate the Comanche Purchase Agreement. In addition, we may be required to seek or utilize additional or other financing sources to consummate the Comanche Acquisition, if we do not have sufficient liquidity at closing or if our anticipated financing sources, including the preferred unit investment by affiliates of GSO Capital Partners LP (individually or collectively, as the context requires, “GSO”) in SN UnSub or the credit facility to be entered into by SN UnSub at the closing of the Comanche Acquisition, are not available, and we cannot assure you that such additional or other financing sources will be available on terms acceptable to us, or at all. There can be no assurances that the Comanche Acquisition will be consummated in the anticipated timeframe, on the terms described herein, or at all.
If the Comanche Acquisition is not consummated, under certain circumstances, we may be required to forfeit our approximate $56.9 million deposit under the Comanche Purchase Agreement. Furthermore, our stock price could be negatively impacted if we fail to complete the Comanche Acquisition.
30
There are a number of risks and uncertainties relating to the Comanche Acquisition. There can be no assurance that events will not intervene to delay or result in the failure to close the Comanche Acquisition. In addition, we, Blackstone and Anadarko have the ability to terminate the Comanche Purchase Agreement under certain circumstances. Failure to complete the Comanche Acquisition would prevent us from realizing the anticipated benefits of the Comanche Acquisition. We would also remain liable for significant transaction costs, including legal, accounting and financial advisory fees. In addition, the market price of our common stock may reflect various market assumptions as to whether the Comanche Acquisition will be completed. Consequently, the failure to complete or any delay in the closing of the Comanche Acquisition could result in a significant change in the market price of our common stock.
The Comanche Acquisition or any other acquisition we may undertake involve risks associated with acquisitions and integration of acquired assets, and the intended benefits of the Comanche Acquisition or any other acquisition we may undertake may not be realized.
The Comanche Acquisition or any other acquisition we may undertake involve risks associated with acquisitions and integrating acquired assets into existing operations, including that:
|
· |
our senior management's attention may be diverted from the management of daily operations of Catarina and our other legacy assets to the integration of the assets acquired in the Comanche Acquisition; |
|
· |
we could incur significant unknown and contingent liabilities for which we have limited or no contractual remedies or insurance coverage; |
|
· |
we may be unable to achieve the economies of scale that we expect from integrating the Comanche Assets or any other assets we may acquire into our existing operations; |
|
· |
the assets acquired in the Comanche Acquisition or any other acquisition we may undertake may not perform as well as we anticipate; and |
|
· |
unexpected costs, delays and challenges may arise in integrating the assets acquired in the Comanche Acquisition or any other acquisition we may undertake into our existing operations. |
Even if we successfully integrate the assets acquired in the Comanche Acquisition or any other acquisition we may undertake into our operations, it may not be possible to realize the full benefits we anticipate or we may not realize these benefits within the expected timeframe. If we fail to realize the benefits we anticipate from the Comanche Acquisition or any other acquisition we may undertake, our business, results of operations and financial condition may be adversely affected.
Under the terms of the lease with respect to the Catarina assets and under the terms of the Comanche Development Agreement, we are subject to annual drilling and development requirements and failure to comply with these requirements may result in loss of our interests in the Catarina area that are not held by production or sizable default payments to Anadarko, respectively.
In order to protect our exploration and development rights in the Catarina area, we are required to drill 50 wells per year (measured from July 1 to June 30). If we fail to meet the minimum drilling commitment under the terms of the Catarina Lease, we could forfeit our acreage under the Catarina Lease and rights to develop land not held by production (excluding, in certain instances, associated rights such as midstream assets). If we drill more than 50 wells in a prescribed twelve month period, we may apply such additional wells (up to a maximum of 30 additional wells) toward the following prescribed twelve month period’s 50-well requirements. In addition, the Catarina Lease requires us to go no longer than 120 days without spudding a well, and, under the terms of the Catarina Lease, failure to do so could result in the forfeiture of our acreage under the Catarina Lease and rights to develop land not held by production (excluding, in certain instances, acreage upon which associated midstream assets are located). Our drilling plans for our undeveloped leasehold acreage are subject to change based upon various factors, including factors that are beyond our control, such as drilling results, oil, natural gas and NGL prices, the availability and cost of capital, drilling and production costs,
31
availability of drilling services and equipment, gathering system and pipeline transportation constraints and regulatory approvals. Because of these uncertainties, we cannot assure you that we will be able meet our obligations under the Catarina Lease. If the Catarina Lease expires, we will lose our right to develop the related properties on this acreage, which could adversely affect our business, financial condition and results of operations.
At the closing of the Comanche Acquisition, we will enter into a development agreement (the “Development Agreement”) with Anadarko pursuant to which we will commit to completing and equipping 60 wells per year for 5 years. If we complete and equip more than 60 wells in a year, we may apply such additional wells (up to a maximum of 30 additional wells) toward the following years’ 60-well requirements. If we fail to complete and equip the required number of wells in a given year (after applying any qualifying additional wells from previous years), we must pay Anadarko a default fee of $200,000 for each well we fail to timely complete and equip. The drilling plan is subject to change based upon various factors, including factors that are beyond our control, such as drilling results, oil, natural gas and NGL prices, the availability and cost of capital, drilling and production costs, availability of drilling services and equipment, gathering system and pipeline transportation constraints and regulatory approvals. Because of these uncertainties, we cannot assure you that we will be able meet our obligations under the Development Agreement following the closing of the Comanche Acquisition.
Our agreements with Blackstone and GSO will restrict us from transferring our right, title and interest to the Comanche Assets.
At the closing of the Comanche Acquisition, we will enter into a joint development agreement with Blackstone (the “JDA”) that provides for the administration, operation and transfer of the jointly-owned Comanche Assets. Under the terms of the JDA, except under limited circumstances, neither we nor Blackstone can transfer any of our rights, title or interest to any asset or related assets (including any working interests) prior to the third anniversary of the JDA. In addition, under our agreements with GSO, following the closing of the Comanche Acquisition, we will not be able to dispose of all or a substantial portion of the Comanche Assets without GSO’s consent. These restrictions may prohibit us from taking advantage of certain opportunities, including our ability to sell these assets, which may arise from time to time.
The JDA will contain right of first offer (“ROFO”) and tag-along provisions that may hinder our ability to sell our interest in the Comanche Assets within our desired time frame or on our desired terms, and could delay or prevent an acquisition of us, even if the acquisition would be beneficial to our stockholders.
Under the terms of the JDA, both parties have a ROFO in the event that the other party intends to sell or otherwise transfer its interests. In addition, the JDA provides both parties with a tag-along right in the event that the other party intends to sell at least 35% of its total interests to a third-party purchaser (including upon a change of control transaction involving us). These features could limit third-party offers, inhibit our ability to sell our interests or adversely affect the timing of any sale of our interests and our ability to obtain the highest price possible in the event that we decide to market or sell our interests. In addition, the tag-along provisions of the JDA may also frustrate or prevent any attempts by our stockholders or a third party to replace or remove our current management or to acquire an interest in or engage in other corporate transactions with us, by subjecting certain corporate change of control transactions to a tag-along provision pursuant to which a third party may be required to acquire Blackstone’s interest in the Comanche Assets if it desires to enter into a corporate transaction with us.
Upon closing the Comanche Acquisition, we will enter into the JDA with Blackstone and amend and restate the limited partnership agreement of one of our subsidiaries, SN UnSub and the limited liability company agreement of SN UnSub’s general partner, SN EF UnSub GP, LLC, to admit GSO as a limited partner and member, respectively, therein, which involves risk.
At the closing of the transactions contemplated by the Comanche Acquisition, we will enter into the JDA that provides for the administration, operation and transfer of the jointly-owned Comanche Assets. The JDA provides for the parties to establish an operating committee, which will control the timing, scope and budgeting of operations on the Comanche Assets (subject to certain exceptions). Although we will be designated as operator of the Comanche Assets
32
under the JDA, under certain circumstances we may be removed as operator and, furthermore, because we will not control the operating committee we will not have unilateral control over many key variables of the operation and development of the Comanche Assets, including the establishment of the budget and development plan for the Comanche Assets. There can be no assurance that Blackstone will continue its relationship with us in the future or that we will be able to pursue our stated strategies with respect to the Comanche Assets. Furthermore, Blackstone may (a) have economic or business interests or goals that are inconsistent with ours; (b) take actions contrary to our policies or objectives; (c) undergo a change of control; (d) experience financial and other difficulties; or (e) be unable or unwilling to fulfill their obligations under the JDA, which may affect our financial conditions or results of operations.
Under the amended and restated limited partnership agreement of SN UnSub and limited liability company agreement of SN UnSub’s general partner, we will not be able to cause SN UnSub or its general partner to take or not to take certain actions unless GSO consents. GSO has committed to make a substantial investment (including contributions and other commitments) in SN UnSub at the closing of the Comanche Acquisition and, accordingly, has required that the relevant organizational documents of SN UnSub and its general partner contain certain features designed to provide it with the opportunity to participate in the management of SN UnSub and its general partner and to protect its investment in SN UnSub, as well as any other assets which may be substantially dependent on or otherwise affected by the activities of SN UnSub. These participation and protective features include a governance structure that consists of a board of directors of SN UnSub’s general partner, only some of whom are appointed by us. See “Item 7. Management’s Discussion and Analysis of Financial Condition and Results of Operations – Liquidity and Capital Resources.”
In addition, at the closing of the Comanche Acquisition, we expect that SN UnSub, which is an “unrestricted subsidiary” (as further described in “Item 8. Financial Statements and Supplementary Data —Note 5. Long Term Debt”), will have entered into a $330 million senior secured reserve-based revolving credit facility with JPMorgan Chase Bank, N.A., Citibank, N.A. and certain of their affiliates (the “SN UnSub Credit Facility”) or other alternate “stand alone” financing arrangement, which will limit its freedom to take certain actions. Thus, without the concurrence of GSO and/or the lenders under the SN UnSub Credit Facility or other financing arrangements, we will not be able to cause SN UnSub and its general partner to take or not to take certain actions, even though those actions may be in the best interest of SN UnSub, its general partner, or us. Furthermore, we, SN UnSub’s lenders, GSO and Blackstone may have different or conflicting goals or interests which could make it more difficult or time-consuming to obtain any necessary approvals or consents to pursue activities that we believe to be in the best interests of our stockholders. See “Item 7. Management’s Discussion and Analysis of Financial Condition and Results of Operations – Liquidity and Capital Resources.”
Our estimated reserves and future production rates are based on many assumptions that may prove to be inaccurate. Any material inaccuracies in these reserve estimates or underlying assumptions will materially affect the quantities and present value of our estimated reserves.
Numerous uncertainties are inherent in estimating quantities of oil, natural gas and NGL reserves and future production. It is not possible to measure underground accumulations of oil, natural gas and NGLs in an exact way. Oil, natural gas and NGL reserve engineering is complex, requiring subjective estimates of underground accumulations of oil, natural gas and NGLs and assumptions concerning future oil, natural gas and NGL prices, future production levels and operating and development costs. In estimating our level of oil, natural gas and NGL reserves, we and our independent reserve engineers make certain assumptions that may prove to be incorrect, including assumptions relating to:
|
· |
the level of oil, natural gas and NGL prices; |
|
· |
future production levels; |
|
· |
capital expenditures; |
|
· |
operating and development costs; |
|
· |
the effects of regulation; |
33
|
· |
the accuracy and reliability of the underlying engineering and geologic data; and |
|
· |
the availability of funds. |
If these assumptions prove to be incorrect, our estimates of our reserves, the economically recoverable quantities of oil, natural gas and NGLs attributable to any particular group of properties, the classifications of reserves based on risk of recovery and our estimates of the future net cash flows from our estimated reserves could change significantly. For example, with other factors held constant, if the commodity prices used in our reserve report as of December 31, 2016 had decreased by 10%, then the standardized measure of our estimated proved reserves as of that date would have decreased by approximately $216.7 million, from approximately $513.4 million to approximately $296.7 million.
Our standardized measure is calculated using unhedged oil, natural gas and NGL prices and is determined in accordance with the rules and regulations of the SEC. Over time, we may make material changes to reserve estimates to take into account changes in our assumptions and the results of actual development and production.
The reserve estimates we make for wells or fields that do not have a lengthy production history are less reliable than estimates for wells or fields with lengthy production histories. A lack of production history may contribute to inaccuracy in our estimates of proved reserves, future production rates and the timing of development expenditures.
Our estimated oil, natural gas and NGL reserves will naturally decline over time, and we may be unable to develop, find or acquire additional reserves to replace our current and future production at acceptable costs, which would adversely affect our business, financial condition and results of operations.
Our future oil, natural gas and NGL reserves, production volumes, and cash flow depend on our success in developing and exploiting our current reserves efficiently and finding or acquiring additional recoverable reserves economically. Our estimated oil, natural gas and NGL reserves will naturally decline over time as they are produced. Our success depends on our ability to economically develop, find or acquire additional reserves to replace our own current and future production. If we are unable to do so, or if expected development is delayed, reduced or cancelled, the average decline rates will likely increase.
The pro forma financial statements for the Comanche Acquisition and Carrizo Disposition are presented for illustrative purposes only and may not be an indication of our financial condition or results of operations following the Comanche Acquisition or the Carrizo Disposition.
The pro forma financial statements for the Comanche Acquisition and Carrizo Disposition included in our Current Reports on Form 8-K filed January 31, 2017 and January 9, 2017, respectively, are presented for illustrative purposes only, are based on various adjustments and assumptions, many of which are preliminary, and may not be an indication of our financial condition or results of operations following the Comanche Acquisition or the Carrizo Disposition. Our actual financial condition and results of operations following the Comanche Acquisition may not be consistent with, or evident from, these pro forma financial statements and other statements relating to the Comanche Acquisition or the Carrizo Disposition. In addition, the assumptions used in preparing the pro forma financial data and estimates may not prove to be accurate, and other factors may affect our financial condition or results of operations following the Comanche Acquisition or the Carrizo Disposition. Therefore, investors should refer to our historical financial statements included in this Annual Report on Form 10-K when evaluating an investment in our common stock.
Developing and producing oil, natural gas and NGLs are costly and high‑risk activities with many uncertainties that could adversely affect our business, financial condition and results of operations.
The cost of developing, completing and operating a well is often uncertain, and cost factors can adversely affect the economics of a well. Additionally, drilling wells with no or sub-economic levels of oil, natural gas and NGL production (dry holes) will negatively impact our financial position. In addition, our use of 2D and 3D seismic data and visualization techniques to identify subsurface structures and hydrocarbon indicators do not enable the interpreter to
34
know whether hydrocarbons are, in fact, present in those structures and requires additional pre‑development expenditures. Furthermore, our development and production operations may be curtailed, delayed or canceled as a result of other factors, including:
|
· |
high costs, shortages or delivery delays of rigs, equipment, labor or other services; |
|
· |
composition of sour gas, including sulfur and mercaptan content; |
|
· |
unexpected operational events and conditions; |
|
· |
reductions in oil, natural gas and NGL prices; |
|
· |
increases in severance taxes; |
|
· |
adverse weather conditions and natural disasters; |
|
· |
facility or equipment malfunctions and equipment failures or accidents, including acceleration of deterioration of our facilities and equipment due to the highly corrosive nature of sour gas; |
|
· |
title problems; |
|
· |
pipe or cement failures, casing collapses or other downhole failures; |
|
· |
compliance with ever‑changing environmental and other governmental requirements; |
|
· |
environmental hazards, such as natural gas leaks, oil, natural gas and NGL spills, salt water spills, pipeline ruptures, discharges of toxic gases or other releases of hazardous substances; |
|
· |
lost or damaged oilfield development and service tools; |
|
· |
unusual or unexpected geological formations and pressure or irregularities in formations; |
|
· |
loss of drilling fluid circulation; |
|
· |
fires, blowouts, surface craterings and explosions; |
|
· |
uncontrollable flows of oil, natural gas, NGL or well fluids; |
|
· |
loss of leases due to incorrect payment of royalties; |
|
· |
limited availability of financing at acceptable rates; and |
|
· |
other hazards, including those associated with sour gas such as an accidental discharge of hydrogen sulfide gas, that could also result in personal injury and loss of life, pollution and suspension of operations. |
If any of these factors were to occur with respect to a particular field, we could lose all or a part of our investment in the field, or we could fail to realize the expected benefits from the field, either of which could materially and adversely affect our business, financial condition and results of operations.
We routinely apply hydraulic fracturing techniques in many of our drilling and completion operations. Hydraulic fracturing has recently become subject to increased public scrutiny and recent changes in federal and state law, as well as proposed legislative changes, could significantly restrict the use of hydraulic fracturing. Such laws could make it more difficult or costly for us to perform fracturing to stimulate production from dense subsurface rock formations
35
and, in the event of local prohibitions against commercial production of natural gas, may preclude our ability to drill wells. In addition, such laws could make it easier for third parties opposing the hydraulic fracturing process to initiate legal proceedings based on allegations that specific chemicals used in the fracturing process could adversely affect groundwater. If hydraulic fracturing becomes regulated at the federal level as a result of federal legislation or regulatory initiatives by the EPA or other federal agencies, our fracturing activities could become subject to additional permitting requirements and result in permitting delays, financial assurance requirements, more stringent construction specifications, increased monitoring, reporting and recordkeeping obligations, plugging and abandonment requirements, as well as potential increases in costs. Please read “—Federal and state legislative and regulatory initiatives relating to hydraulic fracturing could result in increased costs and additional operating restrictions or delays” and “Item 1. Business—Environmental Matters and Regulation—Water and Other Water Discharges and Spills.”
Additionally, hydraulic fracturing, drilling, transportation and processing of hydrocarbons bear an inherent risk of loss of containment. Potential consequences include loss of reserves, loss of production, loss of economic value associated with the affected wellbore, contamination of soil, ground water, and surface water, as well as potential fines, penalties or damages associated with any of the foregoing consequences.
Our acquisition, development and production operations require us to make substantial capital expenditures. Although we expect to fund our capital expenditure budget for 2017 using cash flow from operations and cash on hand, if our cash flow from operations turns out to be less than we currently expect and we are required, but are unable, to fund our remaining capital budget from other sources, such as borrowings under our credit facility and/or the issuance of debt or equity securities, our failure to obtain the funds that we need could have a material adverse effect on our business, financial condition and results of operations.
The oil and natural gas industry in which we operate is capital intensive and we must make substantial capital expenditures in our business for the acquisition, development and production of oil, natural gas and NGL reserves. Our cash on hand, cash flows from operations, ability to borrow and access to capital markets are subject to a number of variables, many of which are beyond our control, including:
|
· |
our estimated proved oil, natural gas and NGL reserves; |
|
· |
the amount of oil, natural gas and NGLs we produce; |
|
· |
the prices at which we sell our production; |
|
· |
the results of our hedging strategy; |
|
· |
the costs of developing, producing, and transporting our oil, natural gas and NGL assets, including costs attributable to governmental regulation and taxation; |
|
· |
our ability to acquire, locate and produce new reserves; |
|
· |
fluctuations in our working capital needs; |
|
· |
interest payments, debt service and dividend payment requirements; |
|
· |
prevailing economic and capital markets conditions, especially for oil and gas companies; |
|
· |
our financial condition; and |
|
· |
the ability and willingness of banks and other lenders to lend to us. |
Continued decreases in our revenues or the borrowing base under our revolving credit facility as a result of lower oil, NGL or natural gas prices, operating difficulties, declines in reserves or for any other reason, will adversely impact our ability to obtain the capital necessary to sustain our operations at current levels. In addition, we may be
36
unable to access the capital markets for debt or equity financing. If we are unsuccessful in obtaining the funds we need to fund our capital budget, we will be forced to reduce our capital expenditures, which in turn could lead to a decline in our production, revenues and our reserves, and could adversely affect our business, financial condition and results of operations.
Our stock price has been volatile, and investors in our common stock could incur substantial losses.
Our stock price has been volatile. For example, during the year ended December 31, 2016, our stock price had a low closing price of $2.29 per share and a high closing price per share of $9.78 per share. As a result of this volatility, investors may not be able to sell their common stock at or above the price at which they purchased their shares. The market price for our common stock may be influenced by many factors, including, but not limited to:
|
· |
the price of oil, NGLs and natural gas; |
|
· |
the success of our exploration and development operations, and the marketing of any oil we produce; |
|
· |
regulatory developments in the United States; |
|
· |
the recruitment or departure of key personnel; |
|
· |
quarterly or annual variations in our financial results or those of companies that are perceived to be similar to us; |
|
· |
market conditions in the industries in which we compete and issuance of new or changed securities; |
|
· |
analysts’ reports or recommendations; |
|
· |
the failure of securities analysts to cover our common stock or changes in financial estimates by analysts; |
|
· |
the inability to meet the financial estimates of analysts who follow our common stock; |
|
· |
our issuance of any additional securities; |
|
· |
investor perception of our company and of the industry in which we compete; and |
|
· |
general economic, political and market conditions. |
Certain of our undeveloped leasehold acreage is subject to leases that will expire over the next several years unless production is established on units containing the acreage or the leases are extended.
Certain of our undeveloped leasehold acreage is subject to leases that will expire unless production in paying quantities is established during their primary terms or we obtain extensions of the leases. Our drilling plans for our undeveloped leasehold acreage are subject to change based upon various factors, including factors that are beyond our control, such as drilling results, oil, natural gas and NGL prices, the availability and cost of capital, drilling and production costs, availability of drilling services and equipment, gathering system and pipeline transportation constraints and regulatory approvals. Because of these uncertainties, we do not know if our undeveloped leasehold acreage will ever be drilled or if we will be able to produce crude oil, natural gas or NGLs from these or any other potential drilling locations. If our leases expire and we do not have them held by production, we will lose our right to develop the related properties on this acreage.
As of December 31, 2016, approximately 58% of our acreage was held by production. As of December 31, 2016, we have leases that were not held by production and not impaired representing 8,768 net acres (all which were in the Eagle Ford Shale) expiring in 2017, 15,539 net acres (all of which were in the Eagle Ford Shale) expiring in 2018, and 105,859 net acres (94,088 of which were in the Eagle Ford Shale) expiring in 2019 and beyond. While we anticipate that our current and future drilling plans will address the majority of our leases expiring in the Eagle Ford Shale in 2017, our actual drilling activities may materially differ from those presently identified, which could adversely affect our business, financial condition and results of operation.
37
Our identified drilling location inventories are scheduled out over several years, making them susceptible to uncertainties that could materially alter the occurrence or timing of their drilling.
Our management has specifically identified and scheduled drilling locations as an estimation of our future drilling activities on our existing acreage. These identified drilling locations represent a significant part of our growth strategy. Our ability to drill and develop these locations depends on a number of uncertainties, including the availability of capital, seasonal conditions, regulatory approvals, oil, NGL and natural gas prices, costs and drilling results. Because of these uncertainties, we do not know if the numerous potential drilling locations we have identified will ever be drilled or if we will be able to produce oil, NGL or natural gas from these or any other potential drilling locations. As such, our actual drilling activities may materially differ from those presently identified, which could adversely affect our business, financial condition and results of operations.
We may be unable to compete effectively with larger companies, which may adversely affect our ability to generate revenue.
The oil and natural gas industry is intensely competitive with respect to acquiring prospects and properties, marketing oil, NGLs and natural gas, and securing equipment and trained personnel. Many of our competitors are large independent oil and natural gas companies that possess and employ financial, technical and personnel resources substantially greater than those of the Sanchez Group. Those entities may be able to develop and acquire more properties than our financial or personnel resources permit. Our ability to acquire additional properties and to discover reserves in the future will depend on our ability to evaluate and select suitable properties and to consummate transactions in a highly competitive environment. Many of our larger competitors not only drill for and produce oil and natural gas but also carry on refining operations and market petroleum and other products on a regional, national or worldwide basis. These companies may be able to pay more for oil and natural gas properties and evaluate, bid for and purchase a greater number of properties than our financial, technical or personnel resources permit. In addition, there is substantial competition for investment capital in the oil and natural gas industry. These larger companies may have a greater ability to continue development activities during periods of low oil, NGL and natural gas prices and to absorb the burden of present and future federal, state, local and other laws and regulations. Furthermore, we may not be able to aggregate sufficient quantities of production to compete with larger companies that are able to sell greater volumes of production to intermediaries, thereby reducing the realized prices attributable to our production. Any inability to compete effectively with larger companies could have a material adverse impact on our business, financial condition and results of operations.
Our operations are subject to operational hazards and unforeseen interruptions for which we may not be adequately insured.
There are a variety of operating risks inherent in our wells and other operating properties and facilities, such as leaks, explosions, mechanical problems and natural disasters, all of which could cause substantial financial losses. Any of these or other similar occurrences could result in the disruption of our operations, substantial repair costs, personal injury or loss of human life, significant damage to property, environmental pollution, impairment of our operations and substantial revenue losses. The location of our wells and other operating properties and facilities near populated areas, including residential areas, commercial business centers and industrial sites, could significantly increase the level of damages resulting from these risks.
Insurance against all operational risks is not available to us. We are not fully insured against all risks, including development and completion risks that are generally not recoverable from third parties or insurance. In addition, pollution and environmental risks generally are not fully insurable. Additionally, we may elect not to obtain insurance if we believe that the cost of available insurance is excessive relative to the perceived risks presented. Losses could, therefore, occur for uninsurable or uninsured risks or in amounts in excess of existing insurance coverage. Moreover, insurance may not be available in the future at commercially reasonable costs or on commercially reasonable terms. Changes in the insurance markets due to weather, adverse economic conditions, and the aftermath of the Macondo well incident in the Gulf of Mexico have made it more difficult for us to obtain certain types of coverage. As a result, we may not be able to obtain the levels or types of insurance we would otherwise have obtained prior to these market changes,
38
and we cannot be sure the insurance coverage we do obtain will not contain large deductibles or fail to cover certain hazards or cover all potential losses. Losses and liabilities from uninsured and underinsured events and delay in the payment of insurance proceeds could have a material adverse effect on our business, financial condition and results of operations.
Our lack of diversification increases the risk of an investment in us and we are vulnerable to risks associated with operating in one major contiguous area.
Our current business focus is on the oil and natural gas industry in a limited number of properties, in the Eagle Ford Shale in South Texas and, to a lesser extent, the TMS in Southwest Mississippi and Southeast Louisiana. Larger companies have the ability to manage their risk by diversification. However, we currently lack diversification, in terms of both the nature and geographic scope of our business. For example, our Catarina assets, comprised of approximately 106,000 contiguous net acres in Dimmit, LaSalle and Webb Counties, Texas under the Catarina Lease (the “Catarina Lease”), represent approximately 90% of our proved reserves as of December 31, 2016, approximately 33% of our Eagle Ford acreage as of December 31, 2016 and, approximately 81% of our total production volumes for the year ended December 31, 2016. As a result, we will likely be impacted more acutely by factors affecting our industry or the regions in which we operate than we would if our business were more diversified, increasing our risk profile. In particular, we may be disproportionately exposed to the impact of delays or interruptions of production from wells in which we have an interest that are caused by transportation capacity constraints, curtailment of production, availability of equipment, facilities, personnel or services, significant governmental regulation, natural disasters, adverse weather conditions, plant closures for scheduled maintenance or interruption of transportation of oil or natural gas produced from wells in the Eagle Ford Shale. Due to the concentrated nature of our portfolio of properties, a number of our properties could experience any of the same conditions at the same time, resulting in a relatively greater impact on our results of operations than they might have on other companies that have a more diversified portfolio of properties. Such delays or interruptions could have a material adverse effect on our financial condition and results of operations.
We cannot control activities on properties that we do not operate and are unable to control their proper operation and profitability.
We do not operate all of the properties in which we own an ownership interest. As a result, we have limited ability to exercise influence over, and control the risks associated with, the operations of these non‑operated properties. The failure of an operator of our wells to adequately perform operations, an operator’s breach of the applicable agreements or an operator’s failure to act in ways that are in our best interests could reduce our production, revenues and reserves. The success and timing of our drilling and development activities on properties operated by others therefore depend upon a number of factors outside of our control, including:
|
· |
the nature and timing of the operator’s drilling and other activities; |
|
· |
the timing and amount of required capital expenditures; |
|
· |
the operator’s geological and engineering expertise and financial resources; |
|
· |
the approval of other participants in drilling wells; and |
|
· |
the operator’s selection of suitable technology. |
Our ability to produce oil and natural gas could be impaired if we are unable to acquire adequate supplies of water for our drilling and completion operations or are unable to dispose of the water we use at a reasonable cost and within applicable environmental rules.
Water is an essential component of oil and natural gas production during both the drilling and hydraulic fracturing processes. Drought conditions have persisted in our areas of operation in past years. These drought conditions have led governmental authorities to restrict the use of water, subject to their jurisdiction, for hydraulic fracturing to protect local water supplies. If we are unable to obtain water to use in our operations, we may be unable to economically
39
produce oil and natural gas, which could have a material and adverse effect on our financial condition, results of operations and cash flows.
Furthermore, the Clean Water Act imposes restrictions and strict controls regarding the discharge of produced waters and other oil and natural gas waste into navigable waters. In addition, the underground injection of fluids is subject to permitting and other requirements under state laws and regulation. Public concerns regarding the potential impacts to groundwater and induced seismic activity have resulted in new requirements related to the underground injection and disposal of fluids. The EPA is also examining regulatory requirements for “indirect dischargers” of wastewater – i.e., those that send their discharges to private or publicly owned treatment facilities, which treat the wastewater before discharging it to regulated waters. Compliance with environmental regulations and permit requirements governing the discharge of underground injection of fluids and the withdrawal, storage and use of surface water or groundwater necessary for hydraulic fracturing of wells may increase our operating costs and cause delays, interruptions or termination of our operations, the extent of which cannot be predicted.
We may lose our rights to the Sanchez Group’s technological database, including its 3D and 2D seismic data, under certain circumstances.
Pursuant to the Services Agreement, we have access to the unrestricted, proprietary portions of the technological database owned and maintained by the Sanchez Group and related to our properties, and SOG is otherwise required to interpret and use the database, to the extent relating to our properties, for our benefit under the Services Agreement. For a description of the Services Agreement see “Item 8. Financial Statements and Supplementary Data —Note 9, Related Party Transactions” in the notes to the consolidated financial statements in “Item 8. Financial Statements and Supplementary Data” of this Annual Report on Form 10‑K. This database includes the 2D and 3D seismic data used for our exploration and development projects as well as the well logs, LAS files, scanned well documents and other well documents and software that are necessary for our daily operations. This information is critical for the operation and expansion of our business. Under certain circumstances, including if SOG provides at least 180 days’ advance written notice of its desire to terminate the Services Agreement, the license agreement will terminate and we will lose our rights to this technological database unless members of the Sanchez Group permit us to retain some or all of these rights, which they may decline to do in their sole discretion. In such event, we are unlikely to be able to obtain rights to similar information under substantially similar commercial terms or to continue our business operations as proposed and our liquidity, business, financial condition and results of operations will be materially and adversely affected and it could delay or prevent an acquisition of us.
If we do not purchase additional acreage or make acquisitions on economically acceptable terms, our future growth will be limited.
Our ability to grow depends in part on our ability to make acquisitions on economically acceptable terms. We may be unable to make such acquisitions because we are:
|
· |
unable to identify attractive acquisition candidates or negotiate acceptable purchase contracts with their owners; |
|
· |
unable to obtain financing for such acquisitions on economically acceptable terms; or |
|
· |
outbid by competitors. |
If we are unable to acquire properties containing estimated proved reserves, our total level of estimated proved reserves will decline as a result of our production.
Any acquisitions we complete or geographic expansions we undertake will be subject to substantial risks that could have a negative impact on our business, financial condition and results of operations.
Any acquisition involves potential risks, including, among other things:
40
|
· |
mistaken assumptions about estimated proved reserves, future production, revenues, capital expenditures, operating expenses and costs, including synergies, timing of expected development and the potential for expiration of underlying leaseholds; |
|
· |
an inability to successfully integrate the assets or businesses we acquire; |
|
· |
a decrease in our liquidity by using a significant portion of our cash and cash equivalents to finance acquisitions; |
|
· |
a significant increase in our interest expense or financial leverage if we incur debt to finance acquisitions; |
|
· |
the assumption of unknown liabilities, losses or costs for which we are not indemnified or for which any indemnity we receive is inadequate; |
|
· |
the diversion of management’s attention from other business concerns; |
|
· |
mistaken assumptions about the overall cost of equity or debt; |
|
· |
an inability to hire, train or retain qualified personnel to manage and operate our growing business and assets; |
|
· |
facts and circumstances that could give rise to significant cash and certain non‑cash charges; and |
|
· |
customer or key employee losses at the acquired businesses. |
Further, we may in the future expand our operations into new geographic areas with operating conditions and a regulatory environment that may not be as familiar to us as our existing project areas. As a result, we may encounter obstacles that may cause us not to achieve the expected results of any such acquisitions, and any adverse conditions, regulations or developments related to any assets acquired in new geographic areas may have a negative impact on our business, financial condition and results of operations.
Our decision to acquire a property will depend in part on the evaluation of data obtained from production reports and engineering studies, geophysical and geological analyses and seismic data and other information, the results of which are often inconclusive and subject to various interpretations. Our reviews of acquired properties are inherently incomplete because it generally is not feasible to perform an in‑depth review of the individual properties involved in each acquisition, given time constraints imposed by sellers. Even a detailed review of records and properties may not necessarily reveal existing or potential problems, nor will it permit a buyer to become sufficiently familiar with the properties to assess fully their deficiencies and potential. Inspections may not always be performed on every well, and environmental problems, such as groundwater contamination, are not necessarily observable even when an inspection is undertaken.
We adopted the Rights Plan, which though it was designed to preserve the value of our NOLs, may discourage the acquisition and sale of large blocks of our common stock and may result in significant dilution for certain stockholders.
On July 28, 2015, the Company entered into a net operating loss carryforwards (“NOLs”) rights plan (the “Rights Plan”) designed to preserve stockholder value and the value of our NOLs by acting as a deterrent to any person acquiring beneficial ownership of 4.9% or more of the Company’s outstanding common stock without the approval of our board of directors. The Rights Plan may discourage existing 5% common stockholders from selling their interest in a single block, which may impact the liquidity of the Company's common stock, may deter institutional investors from investing in our common stock, and may deter potential acquirers from making premium offers to acquire the Company, factors which may depress the market price of our common stock. We can make no assurances the Rights Plan will be effective in meeting its intended objectives, including to deter a change in control and protecting or realizing NOLs.
41
If we were to experience an ownership change, we could be limited in our ability to use net operating losses arising prior to the ownership change to offset future taxable income.
As of December 31, 2016, we had NOLs of $1,200.9 million. If we were to experience an “ownership change,” as determined under Section 382 of the Internal Revenue Code, our ability to offset taxable income arising after the ownership change with NOLs arising prior to the ownership change would be limited, possibly substantially. An ownership change would establish an annual limitation on the amount of our pre‑change NOLs we could utilize to offset our taxable income in any future taxable year to an amount generally equal to the value of our stock immediately prior to the ownership change multiplied by the long‑term tax‑exempt rate. In general, an ownership change will occur if there is a cumulative increase in our ownership of more than 50 percentage points by one or more “5% shareholders” (as defined in the Internal Revenue Code) at any time during a rolling three‑year period.
Our business could be negatively impacted by security threats, including cyber-security threats, and other disruptions.
As an oil and natural gas producer, we face various security threats, including cyber-security threats to gain unauthorized access to sensitive information or to render data or systems unusable, threats to the safety of our employees, threats to the security of our facilities and infrastructure or third-party facilities and infrastructure, such as processing plants and pipelines, and threats from terrorist acts. Cyber-security attacks in particular are evolving and include, but are not limited to, malicious software, attempts to gain unauthorized access to data, and other electronic security breaches that could lead to disruptions in critical systems, unauthorized release of confidential or otherwise protected information and corruption of data. Although we utilize various procedures and controls to monitor and protect against these threats and to mitigate our exposure to such threats, there can be no assurance that these procedures and controls will be sufficient in preventing security threats from materializing. If any of these events were to materialize, they could lead to losses of sensitive information, critical infrastructure, personnel or capabilities essential to our operations and could have a material adverse effect on our reputation, financial position, results of operations or cash flows.
We may be able to incur substantially more debt. This could exacerbate the risks associated with our indebtedness.
Despite our current level of indebtedness, we and our subsidiaries may be able to incur substantial additional indebtedness in the future, including under our credit facility and the UnSub Credit Facility. As of December 31, 2016, we had $1.71 billion of debt outstanding, net of premium, discount and debt issuance costs, all of which was attributable to our Senior Notes, and a borrowing base of $350 million (with an aggregate elected commitment amount of $300 million) under our credit facility for secured revolver borrowings. In connection with the Comanche Acquisition, we expect to incur additional indebtedness at the closing of the Comanche Acquisition under the UnSub Credit Facility, which is expected to be on substantially the same terms as our existing facility, conformed to current market conditions and non-recourse to our other assets. Our increased indebtedness could adversely affect our business. In particular, it could increase our vulnerability to sustained, adverse macroeconomic weakness, limit our ability to obtain further financing and limit our ability to pursue certain operational and strategic opportunities. If new debt is added to our current debt levels, the related risks that we and our subsidiaries now face could intensify.
Our variable rate indebtedness subjects us to interest rate risk, which could cause our debt service obligations to increase significantly.
We will be subject to interest rate risk in connection with borrowings under our credit facility and expect to be subject to interest rate risk with respect to the UnSub Credit Facility, which we intend to enter at the closing of the Comanche Acquisition, which bears or is expected to bear in the case of the UnSub Credit Facility interest at variable rates. Interest rate changes will not affect the market value of any debt incurred under such facilities, but could affect the amount of our interest payments, and accordingly, our future earnings and cash flows, assuming other factors are held constant. We currently do not have any interest rate hedging arrangements with respect to our existing credit facility, nor are any for any of our facilities contemplated in the future. A significant increase in prevailing interest rates that results in a substantial increase in the interest rates applicable to our indebtedness could substantially increase our interest expense and have a material adverse effect on our financial condition and results of operations.
42
Restrictive covenants may adversely affect our operations.
Our credit facility, the indenture governing the Senior Notes contains, and we believe that the UnSub Credit Facility that we expect to enter into at the closing of the Comanche Acquisition will contain, a number of restrictive covenants that impose significant operating and financial restrictions on us and may limit our ability to engage in acts that may be in our long‑term best interest, including our ability, among other things, to:
|
· |
incur or assume additional debt or provide guarantees in respect of obligations of other persons; |
|
· |
issue redeemable stock and preferred stock; |
|
· |
pay dividends or distributions or redeem or repurchase capital stock; |
|
· |
prepay, redeem or repurchase certain debt; |
|
· |
make loans and investments; |
|
· |
create or incur liens; |
|
· |
restrict distributions from our subsidiaries; |
|
· |
sell assets and capital stock of our subsidiaries; |
|
· |
consolidate or merge with or into another entity, or sell all or substantially all of our assets; and |
|
· |
enter into new lines of business. |
A breach of the covenants under the indentures governing the Senior Notes, the covenants under our credit facility or the covenants under the UnSub Credit Facility could result in an event of default under the applicable indebtedness. An event of default may allow the creditors to accelerate the related debt and may result in an acceleration of any other debt that contains a cross‑acceleration or cross‑default provision (however, we expect that a default under our credit facility or the Senior Notes would not result in the acceleration of or default under the UnSub Credit Facility and that a default under the UnSub Credit Facility would not result in the acceleration of or default under our credit facility or Senior Notes). In addition, an event of default under our credit facility or the UnSub Credit Facility would permit the lenders under the relevant facility to terminate all commitments to extend further credit under that facility. If we were unable to repay those amounts, the lenders under our credit facility or the UnSub Credit Facility, as applicable, could proceed against the collateral granted to them to secure that debt.
We have a substantial amount of indebtedness, and expect to incur additional indebtedness in connection with the Comanche Acquisition, which may adversely affect our cash flow and our ability to operate our business, remain in compliance with debt covenants and make payments on our debt.
The aggregate amount of our outstanding indebtedness could have important consequences for us, including the following:
|
· |
any failure to comply with the obligations of any of our debt agreements, including financial and other restrictive covenants, could result in an event of default under the agreements governing such indebtedness; |
|
· |
the covenants contained in our debt agreements limit our ability to borrow money in the future for acquisitions, capital expenditures or to meet our operating expenses or other general corporate obligations and may limit our flexibility in operating our business; |
43
|
· |
we may have a higher level of debt than some of our competitors, which may put us at a competitive disadvantage; |
|
· |
we may be more vulnerable to economic downturns and adverse developments in our industry or the economy in general, especially extended or further declines in oil and natural gas prices; and |
|
· |
our debt level could limit our flexibility in planning for, or reacting to, changes in our business and the industry in which we operate. |
After the closing of the Comanche Acquisition, we expect to have additional outstanding indebtedness under the UnSub Credit Facility, which is expected to be on substantially the same terms as our existing credit facility, conformed to current market conditions and non-recourse to our other assets. Our ability to meet our expenses and debt obligations will depend on our future performance, which will be affected by financial, business, economic, regulatory and other factors. We will not be able to control many of these factors, such as economic conditions and governmental regulation. We cannot be certain that our cash flow from operations will be sufficient to allow us to pay the principal and interest on our debt and meet our other obligations. If we do not have enough cash to service our debt, we may be required to refinance all or part of our existing debt, sell assets, borrow more money or raise equity. We may not be able to refinance our debt, sell assets, borrow more money or raise equity on terms acceptable to us, if at all.
Because we have no plans to pay dividends on our common stock, investors must look solely to stock appreciation for a return on their investment in us.
We do not anticipate paying any cash dividends on our common stock in the foreseeable future. We currently intend to retain all future earnings to fund the development and growth of our business. Any payment of future dividends will be at the discretion of our board of directors and will depend on, among other things, our earnings, financial condition, capital requirements, level of indebtedness, statutory and contractual restrictions applying to the payment of dividends and other considerations that our board of directors may deem relevant. Covenants contained in our credit facility, future credit facilities we may enter into, our indenture and the certificates of designations for our preferred stock restrict our ability to pay dividends on our common stock. In addition, the Delaware General Corporation Law (the “DGCL”) permits payment of dividends only out of a corporation’s surplus, which is defined as the excess of net assets (total assets less total liabilities) over a corporation’s capital as determined under the DGCL. If commodity prices continue to decline, the value of our net assets will also continue to decline and, accordingly, our ability to lawfully declare and pay dividends may also decline. Investors must rely on sales of their common stock after price appreciation, which may never occur, as the only way to realize a return on their investment. Investors seeking cash dividends should not purchase our common stock.
Federal and state legislative and regulatory initiatives relating to hydraulic fracturing could result in increased costs and additional operating restrictions or delays.
Hydraulic fracturing is an important and common process used by oil and natural gas exploration and production operators in the completion of certain oil and natural gas wells whereby water, sand and chemicals are injected under pressure into subsurface formations to stimulate production of oil and/or natural gas. Hydraulic fracturing is generally exempt from federal regulation, and thus the process is typically regulated by state agencies. Nevertheless, the EPA has asserted federal regulatory authority over hydraulic fracturing involving diesel additives under the Underground Injection Control or UIC Program. In Texas, Louisiana and Mississippi, where we maintain acreage, the EPA is encouraging state programs to review and consider EPA guidance in these areas. In addition, the EPA plans to develop a Notice of Proposed Rulemaking by June 2018, which would describe a proposed mechanism – regulatory, voluntary, or a combination of both – to collect data on hydraulic fracturing chemical substances and mixtures.
On May 12, 2016, the EPA amended its regulations to impose new standards for methane and VOC emissions for certain new, modified, and reconstructed equipment, processes, and activities across the oil and natural gas sector. These standards, as well as any future laws and their implementing regulations, may require us to obtain pre-approval for the expansion or modification of existing facilities or the construction of new facilities expected to produce air
44
emissions, impose stringent air permit requirements, or mandate the use of specific equipment or technologies to control emissions.
Furthermore, there are certain governmental reviews either underway or being proposed that focus on environmental aspects of hydraulic fracturing practices. These ongoing or proposed studies, depending on their degree of pursuit and any meaningful results obtained, could spur initiatives to further regulate hydraulic fracturing or the disposal of produced water and flowback fluid in underground injection wells. Also, some states have adopted, and other states are considering adopting, regulations that could restrict hydraulic fracturing in certain circumstances or otherwise require the public disclosure of chemicals used in the hydraulic fracturing process, and a number of lawsuits and enforcement actions have been initiated across the country alleging that hydraulic fracturing practices have induced seismic activity and adversely impacted drinking water supplies, use of surface water, and the environment generally. These proceedings or regulations or any other new laws or regulations that significantly restrict hydraulic fracturing or the disposal of produced water and flowback fluid in underground injection wells could make it more difficult or costly for us to drill and produce from conventional or tight formations, increase our costs of compliance and doing business and make it easier for third parties opposing the hydraulic fracturing process to initiate legal proceedings.
Further federal, state and/or local laws governing hydraulic fracturing could result in additional permitting and financial assurance requirements, more stringent construction specifications, increased monitoring, reporting and recordkeeping obligations, plugging and abandonment requirements and also to attendant permitting delays and potential increases in costs. Such changes could cause us to incur substantial compliance costs, and compliance or the consequences of failure to comply by us could have a material adverse effect on our business, financial condition and results of operations. At this time, it is not possible to estimate the potential impact on our business that may arise if additional federal, state and/or local laws are enacted.
We are subject to complex federal, state, local and other laws and regulations that could adversely affect the cost, manner or feasibility of conducting our operations. In addition, the third parties on whom we rely on for gathering and transportation services are also subject to complex federal, state and other laws that could adversely affect the cost, manner or feasibility of conducting our business.
Our oil and natural gas development and production operations are subject to complex and stringent laws and regulations. To conduct our operations in compliance with these laws and regulations, we must obtain and maintain numerous permits, approvals and certificates from various federal, state and local governmental authorities. We may incur substantial costs in order to maintain compliance with these existing laws and regulations. In addition, our costs of compliance may increase if existing laws and regulations are revised or reinterpreted, or if new laws and regulations become applicable to our operations. Failure to comply with such laws and regulations, as interpreted and enforced, could have a material adverse effect on our business, financial condition and results of operations. Please read “Item 1. Business—Environmental Matters and Regulation” for a description of the laws and regulations that affect us.
In addition, the operations of the third parties on whom we rely for gathering and transportation services are also subject to complex and stringent laws and regulations that require obtaining and maintaining numerous permits, approvals and certifications from various federal, state and local government authorities. These third parties may incur substantial costs in order to comply with existing laws and regulations. If existing laws and regulations governing such third‑party services are revised or reinterpreted, or if new laws and regulations become applicable to their operations, these changes may affect the costs that we pay for such services. Similarly, a failure to comply with such laws and regulations by the third parties on whom we rely could have a material adverse effect on our business, financial condition and results of operations. Please read “Item 1. Business—Environmental Matters and Regulation” for a description of the laws and regulations that affect the third parties on whom we rely.
Climate change legislation or regulations restricting emissions of greenhouse gases could result in increased operating costs and reduced demand for the oil and natural gas that we produce.
In recent years, federal, state and local governments have taken steps to reduce emissions of GHGs. The EPA has finalized a series of GHG monitoring, reporting and emission control rules for the oil and natural gas industry, and the U.S. Congress has, from time to time, considered adopting legislation to reduce emissions. Almost one-half of the
45
states have already taken measures to reduce emissions of GHGs primarily through the development of GHG emission inventories and/or regional GHG cap-and-trade programs.
Furthermore, in December 2015, the United States participated in the 21st Conference of the Parties (COP-21) of the United Nations Framework Convention on Climate Change in Paris, France. The resulting Paris Agreement calls for the parties to undertake “ambitious efforts” to limit the average global temperature, and to conserve and enhance sinks and reservoirs of GHGs. The Agreement went into effect on November 4, 2016 and establishes a framework for the parties to cooperate and report actions to reduce GHG emissions. Also, on June 29, 2016, the leaders of the United States, Canada and Mexico announced an Action Plan to, among other things, boost clean energy, improve energy efficiency, and reduce GHG emissions. The Action Plan specifically calls for a reduction in methane emissions from the oil and gas sector by 40 to 45 percent by 2025. It remains unclear whether and how the results of the 2016 U.S. election could impact the regulation of GHG emissions at the federal and state level.
Restrictions on GHG emissions that may be imposed could adversely affect the oil and gas industry. The adoption of any legislation or regulations that otherwise limit emissions of GHGs from our equipment and operations could require us to incur increased operating costs, such as costs to monitor and report GHG emissions, purchase and operate emissions control systems to reduce emissions of GHGs associated with our operations, acquire emissions allowances or comply with new regulatory requirements. Any GHG emissions legislation or regulatory programs applicable to power plants or refineries could also increase the cost of consuming, and thus could adversely affect demand for the oil and natural gas that we produce. Consequently, legislation and regulatory programs to reduce GHG emissions could have an adverse effect on our business, financial condition and results of operations. Please read “Item 1. Business—Environmental Matters and Regulation.”
In addition, claims have been made against certain energy companies alleging that GHG emissions from oil and natural gas operations constitute a public nuisance under federal and/or state common law. As a result, private individuals may seek to enforce environmental laws and regulations against us and could allege personal injury or property damages. While our business is not a party to any such litigation, we could be named in actions making similar allegations. An unfavorable ruling in any such case could significantly impact our operations and could have an adverse impact on our financial condition.
Moreover, there has been public discussion that climate change may be associated with extreme weather conditions such as more intense hurricanes, thunderstorms, tornadoes and snow or ice storms, as well as rising sea levels. Another possible consequence of climate change is increased volatility in seasonal temperatures. Some studies indicate that climate change could cause some areas to experience temperatures substantially colder than their historical averages. Extreme weather conditions can interfere with our production and increase our costs and damage resulting from extreme weather may not be fully insured. However, at this time, we are unable to determine the extent to which climate change may lead to increased storm or weather hazards affecting our operations.
Our operations are subject to environmental and operational safety laws and regulations that may expose us to significant costs and liabilities.
We may incur significant delays, costs and liabilities as a result of stringent and complex environmental, health and safety requirements applicable to our oil and natural gas development and production operations. These laws and regulations may impose numerous obligations applicable to our operations, including that they may (i) require the acquisition of permits to conduct exploration, drilling and production operations; (ii) restrict the types, quantities and concentration of various substances that can be released into the environment or injected into formations in connection with oil and natural gas drilling, production and transportation activities; (iii) govern the sourcing and disposal of water used in the drilling and completion process; (iv) limit or prohibit drilling or injection activities on certain lands lying within wilderness, wetlands, seismically active areas, and other protected areas; (v) require remedial measures to mitigate pollution from former and ongoing operations, such as requirements to close pits and plug abandoned wells; (vi) result in the suspension or revocation of necessary permits, licenses and authorizations; (vii) impose substantial liabilities for pollution resulting from drilling and production operations; and (viii) require that additional pollution controls be installed. Numerous governmental authorities, such as the EPA and analogous state agencies, have the power to enforce compliance with these laws and regulations and the permits issued under them, often requiring difficult and
46
costly compliance or corrective actions. Failure to comply with these laws and regulations may result in the assessment of sanctions, including administrative, civil or criminal penalties, the imposition of investigatory or remedial obligations, the suspension or revocation of necessary permits, licenses and authorizations, the requirement that additional pollution controls be installed and, in some instances, the issuance of orders limiting or prohibiting some or all of our operations. In addition, we may experience delays in obtaining or be unable to obtain required permits, which may delay or interrupt our operations and limit our growth and revenue. These laws and regulations are complex, change frequently and have tended to become increasingly stringent over time.
There is inherent risk of incurring significant environmental costs and liabilities in the performance of our operations due to our handling of petroleum hydrocarbons and wastes, because of air emissions and wastewater discharges related to our operations, and as a result of historical industry operations and waste disposal practices. Under certain environmental laws and regulations, we could be subject to strict and joint and several liability for the removal or remediation of previously released materials or property contamination regardless of whether we were responsible for the release or contamination or the operations were in compliance with all applicable laws at the time those actions were taken. Private parties, including the owners of properties upon which our wells are drilled and facilities where our petroleum hydrocarbons or wastes are taken for reclamation or disposal, also may have the right to pursue legal actions to enforce compliance as well as to seek damages for non‑compliance with environmental laws and regulations or for personal injury or property or natural resource damages. In addition, the risk of accidental spills or releases could expose us to significant liabilities that could have a material adverse effect on our business, financial condition and results of operations. Changes in environmental laws and regulations occur frequently, and any changes that result in more stringent or costly waste control, handling, storage, transport, disposal or cleanup requirements could require us to make significant expenditures to attain and maintain compliance and may otherwise have a material adverse effect on our competitive position, business, financial condition and results of operations. We may not be able to recover some or any of these costs from insurance. Please read “Item 1. Business—Environmental Matters and Regulation” for more information.
Derivatives reform legislation and related regulations could have an adverse effect on our ability to hedge risks associated with our business.
The July 2010 Dodd-Frank Wall Street Reform and Consumer Protection Act, or the Dodd-Frank Act, provides for federal oversight of the over-the-counter derivatives market and entities that participate in that market and mandates that the Commodity Futures Trading Commission, or the CFTC, the SEC and certain federal regulators of financial institutions, or Prudential Regulators, adopt rules or regulations implementing the Dodd-Frank Act and providing definitions of terms used in the Dodd-Frank Act. The Dodd-Frank Act establishes margin requirements and requires clearing and trade execution practices for certain market participants and may result in certain market participants needing to curtail or cease their derivatives activities.
Although some of the rules necessary to implement the Dodd-Frank Act remain to be adopted, the CFTC, the SEC and the Prudential Regulators have issued many rules to implement the Dodd-Frank Act, including a rule, which we refer to as the “Mandatory Clearing Rule,” requiring clearing of hedges, or swaps, that are subject to it (currently, only certain interest rate and credit default swaps, which we do not presently have), a rule, which we refer to as the “End User Exception,” establishing an “end user” exception to the Mandatory Clearing Rule, a rule, which we refer to as the “Margin Rule,” setting forth collateral requirements in connection with swaps that are not cleared and also an exception to the Margin Rule for end users that are not financial end users, which exception we refer to as the “Non-Financial End User Exception,” and a rule, subsequently vacated by the United States District Court for the District of Columbia and remanded to the CFTC for further proceedings, imposing position limits. The CFTC proposed a new version of this rule with respect to which the comment period closed but no final rule was issued and has re-proposed a new version of such rule, which we refer to as the “Re-Proposed Position Limit Rule,” with respect to which the comment period is scheduled to close on February 28, 2017. The Re-Proposed Position Limit Rule provides an exemption from the position limits for swaps that constitute “bona fide hedging positions” within the definition of such term under the Re-Proposed Position Limit Rule, subject to the party claiming the exemption complying with the applicable filing, recordkeeping and reporting requirements of the Re-Proposed Position Limit Rule.
47
We qualify for the End User Exception and will utilize it if the Mandatory Clearing Rule is expanded to cover swaps in which we participate, we qualify for the Non-Financial End User Exception and will not be required to post margin under the Margin Rule and limits our existing and anticipated hedging positions constitute “bona fide hedging positions” under the Re-Proposed Position Limit Rule and we intend to do the filing, recordkeeping and reporting necessary to utilize the bona fide hedging position exemption under the Re-Proposed Position Limit Rule if and when it becomes effective, so we do not expect to be directly affected by any of such rules. However, most if not all of our hedge counterparties will be subject to mandatory clearing in connection with their hedging activities with parties who do not qualify for the End User Exception and will be required to post margin in connection with their hedging activities with other swap dealers, major swap participants, financial end users and other persons that do not qualify for the Non-Financial End User Exception. In addition, the European Union and other non-U.S. jurisdictions have enacted laws and regulations (including laws and regulations giving European Union financial authorities the power to write down amounts we may be owed on hedging agreements with counterparties subject to such laws and regulations and/or require that we accept equity interests in such counterparties in lieu of cash in satisfaction of such amounts), which we refer to collectively as “Foreign Regulations” which may apply to our transactions with counterparties subject to such Foreign Regulations. The Dodd-Frank Act, the rules which have been adopted and not vacated, and, to the extent that the Re-Proposed Position Limit Rule is ultimately effected, such proposed rule could significantly increase the cost of our derivative contracts, materially alter the terms of our derivative contracts, reduce the availability of derivatives to us that we have historically used to protect against risks that we encounter in our business, reduce our ability to monetize or restructure our existing derivative contracts, and increase our exposure to less creditworthy counterparties. The Foreign Regulations could have similar effects. If we reduce our use of derivatives as a result of the Dodd-Frank Act and regulations and Foreign Regulations, our results of operations may become more volatile and our cash flows may be less predictable, which could adversely affect our ability to plan for and fund capital expenditures. Finally, the Dodd-Frank Act was intended, in part, to reduce the volatility of oil and natural gas prices, which some legislators attributed to speculative trading in derivatives and commodity contracts related to oil and natural gas. Our revenues could therefore be adversely affected if a consequence of the Dodd-Frank Act and regulations is to lower commodity prices. Any of these consequences could have a material adverse effect on us, our financial condition, and our results of operations.
We may incur more taxes and certain of our projects may become uneconomic if certain federal income tax deductions currently available with respect to oil and natural gas exploration and production are eliminated as a result of future legislation.
In past years, legislation has been proposed from time to time that contains proposals to eliminate certain key U.S. federal income tax preferences currently available to oil and natural gas exploration and production companies. These proposals include, but are not limited to (i) the repeal of the percentage depletion allowance for oil and natural gas properties, (ii) the elimination of current deductions for intangible drilling and development costs, (iii) the elimination of the deduction for certain U.S. production activities and (iv) an extension of the amortization period for certain geological and geophysical expenditures. The Trump Administration has called for a comprehensive tax reform that would significantly change U.S. tax laws. It is unclear whether any of the foregoing proposals will actually be considered and enacted as part of tax reform legislation or how soon any such changes in law could become effective. The passage of any legislation as a result of these proposals or any other similar change in U.S. federal income tax law could eliminate and/or defer certain tax deductions that are currently available with respect to oil and natural gas exploration and production. Any such change could materially adversely affect our business, financial condition and results of operations by increasing the after‑tax costs we incur which would in turn make it uneconomic to drill some locations if commodity prices are not sufficiently high, resulting in lower revenues and decreases in production and reserves.
We are subject to anti‑takeover provisions in our restated certificate of incorporation and amended and restated bylaws, our Rights Plan and Delaware law that could delay or prevent an acquisition of our company, even if the acquisition would be beneficial to our stockholders.
Provisions in our restated certificate of incorporation and amended and restated bylaws may delay or prevent an acquisition of us. These provisions may also frustrate or prevent any attempts by our stockholders to replace or remove our current management by making it more difficult for stockholders to replace members of our board of directors, who are responsible for appointing the members of our management team. Furthermore, because we are incorporated in Delaware, we are governed by the provisions of Section 203 of the DGCL, which prohibits, with some exceptions,
48
stockholders owning in excess of 15% of our outstanding voting stock from merging or combining with us. In addition, the Company entered into the Rights Plan on July 28, 2015. The Rights Plan is designed to preserve stockholder value and the value of our NOLs by acting as a deterrent to any person acquiring beneficial ownership of 4.9% or more of the Company’s outstanding common stock without the approval of our board of directors. Although not intended for this purpose, the Rights Plan has an anti-takeover effect. For more information on possible risks associated with our rights plan, please see “—We adopted the Rights Plan, which though it was designed to preserve the value of our NOLs, may discourage the acquisition and sale of large blocks of our common stock and may result in significant dilution for certain stockholders.” Finally, our amended and restated bylaws establish advance notice requirements for nominations for election to our board of directors and for proposing matters that can be acted upon at stockholder meetings. Although we believe these provisions together provide an opportunity to receive higher bids by requiring potential acquirers to negotiate with our board of directors, they would apply even if an offer to acquire us may be considered beneficial by some stockholders.
We are subject to legal proceedings and legal compliance risks.
We, including our officers and directors, are involved in various legal proceedings from time to time. Certain of these legal proceedings may be a significant distraction to management and could expose our Company to significant liability, including damages, fines, penalties and attorneys’ fees and costs, any of which could have a material adverse effect on our business and results of operations.
We discuss the risks and uncertainties related to our litigation in more detail below in “Item 3. Legal Proceedings” and in “Item 8. Financial Statements and Supplementary Data — Note 14, Commitments and Contingencies.”
We may have potential business conflicts of interest with members of the Sanchez Group regarding our past, ongoing and future relationships and the resolution of these conflicts may not be favorable to us.
Conflicts of interest may arise between members of the Sanchez Group and us in a number of areas relating to our past, ongoing and future relationships, including:
|
· |
labor, tax, employee benefit, indemnification and other matters arising under agreements with SOG; |
|
· |
employee recruiting and retention; |
|
· |
business opportunities that may be attractive to both members of the Sanchez Group and us; and |
|
· |
business transactions that we enter into with members of the Sanchez Group. |
We may not be able to resolve any potential conflicts, and, even if we do so, the resolution may be less favorable to us than if we were dealing with an unaffiliated party.
Finally, in connection with our initial public offering (“IPO”), we entered into several agreements with members of the Sanchez Group. In addition, at the closing of the Comanche Acquisition, we expect to enter into management services agreements with SOG for it to perform various management service functions for SN UnSub and Blackstone and/or their affiliates. These agreements were or will be made in the context of a related party transaction. The terms of these agreements may be more or less favorable to us than if they had been negotiated with unaffiliated third parties.
49
Pursuant to the terms of our restated certificate of incorporation, members of the Sanchez Group are not required to offer corporate opportunities to us, and our directors and officers may be permitted to offer certain corporate opportunities to members of the Sanchez Group before us.
Our board of directors includes persons who are also directors and/or officers of members of the Sanchez Group. Our restated certificate of incorporation provides that:
|
· |
members of the Sanchez Group are free to compete with us in any activity or line of business; |
|
· |
we do not have any interest or expectancy in any business opportunity, transaction, or other matter in which members of the Sanchez Group engage or seek to engage merely because we engage in the same or similar lines of business; |
|
· |
to the fullest extent permitted by law, members of the Sanchez Group will have no duty to communicate their knowledge of, or offer, any potential business opportunity, transaction, or other matter to us, and members of the Sanchez Group are free to pursue or acquire such business opportunity, transaction, or other matter for themselves or direct the business opportunity, transaction, or other matter to its affiliates; and |
|
· |
if any director or officer of any member of the Sanchez Group who is also one of our officers or directors becomes aware of a potential business opportunity, transaction, or other matter (other than one expressly offered to that director or officer in writing solely in his or her capacity as our director or officer), that director or officer will have no duty to communicate or offer that business opportunity to us, and will be permitted to communicate or offer that business opportunity to such member of the Sanchez Group and that director or officer will not, to the fullest extent permitted by law, be deemed to have (1) breached or acted in a manner inconsistent with or opposed to his or her fiduciary or other duties to us regarding the business opportunity or (2) acted in bad faith or in a manner inconsistent with our best interests or those of our stockholders. |
We depend on SOG to provide us with certain services for our business. The services that SOG provides to us may not be sufficient to meet our needs, and we may have difficulty finding replacement services or be required to pay increased costs to replace these services after our agreements with SOG expire.
Certain services required by us for the operation of our business, including general and administrative services, geological, geophysical and reserve engineering, lease and land administration, marketing, accounting, operational services, information technology services, compliance, insurance maintenance and management of outside professionals, are provided by SOG pursuant to the Services Agreement. The services provided under the Services Agreement commenced on the date that the IPO closed and will terminate five years thereafter. The term automatically extends for additional 12‑month periods and is terminable by either party at any time upon 180 days’ written notice. See “Corporate Governance—Compensation Committee” in the proxy statement for the 2016 annual meeting of stockholders, which is incorporated by reference to this report. While these services are being provided to us by SOG, our operational flexibility to modify or implement changes with respect to such services or the amounts we pay for them is limited. After the expiration or termination of this agreement, we may not be able to replace these services or enter into appropriate third‑party agreements on terms and conditions, including cost, comparable to those that we will receive from SOG under our agreements with SOG.
In addition, SOG may outsource some or all of these services to third parties, and a failure of all or part of SOG’s relationships with its outsourcing providers could lead to delays in or interruptions of these services. Our reliance on SOG and others as service providers and on SOG’s outsourcing relationships, and our limited ability to control certain costs, could have a material adverse effect on our business, financial condition and results of operations.
50
Sector cost inflation could adversely affect our ability to execute our exploration and development plans on a timely basis and within our budget.
Our industry is cyclical and third party oilfield materials, service and supply costs are also subject to supply and demand dynamics. During periods of decreasing levels of industry exploration and production, such as occurred in 2015 and 2016, the demand for, and cost of, drilling rigs and oilfield services decreases. Conversely, during periods of increasing levels of industry activity, the demand for, and cost of, drilling rigs and oilfield services increases.
In the second half of 2016, we witnessed a modest improvement in commodity prices. If this trend continues, and if the commodity price recovery is robust, we expect industry exploration and production activities to increase, resulting in higher demand for oilfield services and supplies, which could result in sector price inflation. In addition, the costs of such items could increase and their availability may become limited, particularly in basins of relatively higher activity.
A portion of our total outstanding shares is held by members of the Sanchez Group and may be sold into the market at any time. In addition, if the Comanche Acquisition is consummated, Blackstone and GSO (or their affiliates) will receive a substantial number of our securities. This could cause the market price of our common stock to drop significantly, even if our business is doing well.
As of February 7, 2017, members of the Sanchez Group owned, in the aggregate, approximately 15.0% of our outstanding common stock. There are also an additional 8,961,750 shares available for future issuance to our directors, officers and employees as restricted stock or stock option awards pursuant to our Amended and Restated 2011 Long Term Incentive Plan. These shares are eligible for resale in the public markets, subject to the volume, manner of sale and other limitations under Rule 144 of the Securities Act. In addition, at the closing of the transaction contemplated by the Comanche Acquisition, we will issue 1.5 million shares of common stock to GSO and warrants to purchase 2.0 million and 6.5 million shares of common stock, at an exercise price of $10.00 per share, to GSO and an affiliate of Blackstone, respectively, resulting in GSO and such Blackstone affiliate owning approximately 3.9% and 7.3% of our common stock, respectively, assuming that the warrants will be fully exercised at closing. Following the conclusion of a two-year lockup period, these shares will be eligible for resale in the public markets, subject to the volume, manner of sale and other limitations under Rule 144 of the Securities Act. In addition, under certain circumstances, members of the Sanchez Group, GSO and such Blackstone affiliate have the right to require us to register the resale of their shares. Moreover, we have registered all of the shares of our common stock that we may issue under our employee benefit plans. These shares can be freely sold in the public market upon issuance unless, pursuant to their terms, these stock awards have transfer restrictions attached to them. Sales of a substantial number of shares of our common stock, or the perception in the market that the holders of a large number of shares intend to sell shares, could reduce the market price of our common stock.
Item 1B. Unresolved Staff Comments
None.
The information required by Item 2 is contained in Item 1. Business.
The information required by this Item is set forth in “Item 8. Financial Statements and Supplementary Data —Note 14, Commitments and Contingencies.”
Item 4. Mine Safety Disclosures
Not applicable.
51
Item 5. Market for Registrant’s Common Equity, Related Stockholder Matters and Issuer Purchases of Equity Securities
Market for Registrant’s Common Equity. Shares of our common stock are traded on the NYSE under the symbol “SN.” The following table sets forth the reported high and low sales prices of our common stock as reported by the NYSE for the periods indicated:
|
|
|
Common Stock |
|
||||
|
|
|
High |
|
Low |
|
||
|
2016: |
|
|
|
|
|
|
|
|
First Quarter |
|
$ |
6.35 |
|
$ |
2.06 |
|
|
Second Quarter |
|
$ |
9.83 |
|
$ |
4.84 |
|
|
Third Quarter |
|
$ |
9.49 |
|
$ |
5.64 |
|
|
Fourth Quarter |
|
$ |
10.14 |
|
$ |
5.90 |
|
|
|
|
Common Stock |
|
||||
|
|
|
High |
|
Low |
|
||
|
2015: |
|
|
|
|
|
|
|
|
First Quarter |
|
$ |
16.14 |
|
$ |
7.66 |
|
|
Second Quarter |
|
$ |
15.85 |
|
$ |
9.45 |
|
|
Third Quarter |
|
$ |
9.95 |
|
$ |
4.48 |
|
|
Fourth Quarter |
|
$ |
8.39 |
|
$ |
3.46 |
|
On February 24, 2017, the last sale price of our common stock, as reported on the NYSE, was $11.31 per share.
Holders. The number of holders of record of our common stock was approximately 31 on February 27, 2017, which does not include beneficial owners whose shares are held by a clearing agency, such as a broker or a bank.
Preferred Dividends. We pay preferred dividends quarterly, in arrears, on each January 1, April 1, July 1 and October 1, when and if declared by the Company’s board of directors on our Series A and Series B Preferred Stock in the amounts of 4.875% and 6.50%, respectively. The Company may, at its option, pay dividends in cash and, subject to certain conditions, common stock or any combination thereof. As of December 31, 2016, we have paid approximately $56.8 million in dividends to holders of our Series A and Series B Preferred Stock since their respective issuances. The dividends accrued for the period from January 1 to March 31, 2016 were declared by the Board and paid in cash by the Company. The dividends accrued for the periods from April 1 to July 31, August 1 to September 30, and October 1 to December 31, 2016, were declared by the Board and paid with the Company’s common stock.
We have not paid any cash dividends on our common equity since our inception. Although our future dividend policy is within the discretion of our board of directors and will depend upon various factors, including our results of operations, financial condition, capital requirements and investment opportunities, we do not anticipate declaring or paying any cash dividends to holders of our common stock in the foreseeable future. In addition, covenants contained in our credit facility, future credit facilities we may enter into, our indenture and the certificates of designations for our preferred stock restrict our ability to pay dividends on our common stock and the DGCL permits payment of dividends only out of a corporation’s surplus, which is defined as the excess of net assets (total assets less total liabilities) over a corporation’s capital as determined under the DGCL. We currently intend to retain future earnings to finance current operations and the future expansion of our business.
52
Securities Authorized for Issuance Under Equity Compensation Plans. The following table sets forth certain information as of December 31, 2016 regarding the Sanchez Energy Corporation Third Amended and Restated 2011 Long Term Incentive Plan (the “LTIP”). The LTIP was approved by our stockholders on May 24, 2016, which increased the number of the shares of our common stock available for incentive awards pursuant to the LTIP’s predecessor, which was approved by our stockholders on May 21, 2015.
|
|
|
|
|
|
|
(c) |
|
|
|
|
|
|
|
|
Number of Securities |
|
|
|
|
(a) |
|
(b) |
|
Remaining Available |
|
|
|
|
Number of Securities to be |
|
Weighted-Average |
|
For Future Issuance Under |
|
|
|
|
Issued Upon Exercise of |
|
Exercise Price of |
|
Equity Compensation Plans |
|
|
|
|
Outstanding Options, |
|
Outstanding Options, |
|
(Excluding Securities |
|
|
|
|
Warrants and Rights |
|
Warrants and Rights |
|
Reflected in Column (a)) |
|
|
Plan Category: |
|
|
|
|
|
|
|
|
Equity Compensation Plans Approved by Stockholders |
|
— |
|
N/A |
|
6,669,005 |
(1) |
|
Equity Compensation Plans Not Approved by Stockholders |
|
N/A |
|
N/A |
|
N/A |
|
|
Total |
|
— |
|
— |
|
6,669,005 |
|
(1)The maximum number of shares that may be delivered pursuant to the LTIP is limited to 17,239,790 shares plus an automatic increase equal to the lesser of (A) 15% of such issuance of additional Common Shares and (B) such lesser number of Common Shares as determined by the Board of Directors and Compensation Committee; provided, however, withheld to satisfy tax withholding obligations are not considered to be delivered under the LTIP.
Recent Sales of Unregistered Securities. All sales of unregistered securities within the last fiscal year have been previously reported in our Quarterly Reports on Form 10-Q and/or Current Reports on Form 8-K.
Repurchases of Equity Securities. Neither we nor any “affiliated purchaser” repurchased any of our equity securities in the quarter ended December 31, 2016.
Comparative Stock Performance
The performance graph below compares the cumulative total stockholder return for our common stock to that of the Standard and Poor’s, or S&P, 500 Index and the S&P 500 Oil & Gas Exploration and Production Index for the period from December 31, 2011 to December 31, 2016. “Cumulative total return” means the change in share price during the measurement period divided by the share price at the beginning of the measurement period. The graph assumes an investment of $100 was made in the Company’s common stock and in each of the S&P 500 Index and the S&P 500 Oil & Gas Exploration and Production Index at the closing market price on December 31, 2011.
53
COMPARISON OF CUMULATIVE TOTAL RETURN
AMONG SANCHEZ ENERGY CORPORATION, THE S&P 500 INDEX,
AND THE S&P 500 OIL & GAS EXPLORATION AND PRODUCTION INDEX
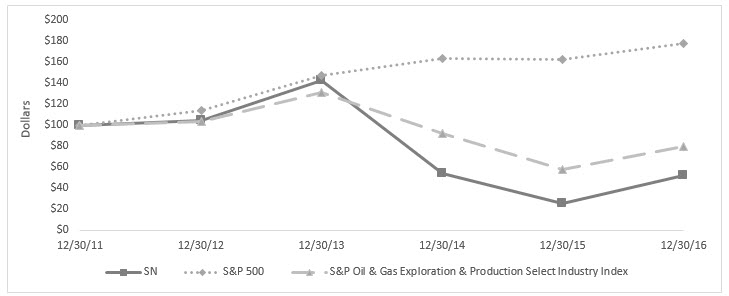
Note: The stock price performance of our common stock is not necessarily indicative of future performance.
The above information under the caption “Comparative Stock Performance” shall not be deemed to be “soliciting material” or to be “filed” with the SEC, nor shall such information be incorporated by reference into any future filing under the Securities Act or the Exchange Act except to the extent that we specifically request that such information be treated as “soliciting material” or specifically incorporate such information by reference into such a filing.
54
Item 6. Selected Financial Data
The selected financial data table below shows our historical consolidated financial data as of and for each of the five years in the period ended December 31, 2016. The selected financial data is derived from our audited historical financial statements.
The selected financial data should be read together with “Item 7. Management’s Discussion and Analysis of Financial Condition and Results of Operations” and “Item 8. Financial Statements and Supplementary Data” included in this Annual Report on Form 10‑K.
|
|
|
Year Ended December 31, |
|
|||||||||||||
|
|
|
2016 |
|
2015 |
|
2014 |
|
2013 |
|
2012 |
|
|||||
|
|
|
|
(in thousands, except per share amounts) |
|
||||||||||||
|
REVENUES: |
|
|
|
|
|
|
|
|
|
|
|
|
|
|
|
|
|
Oil sales |
|
$ |
241,766 |
|
$ |
307,971 |
|
$ |
538,887 |
|
$ |
290,322 |
|
$ |
42,377 |
|
|
Natural gas liquids sales |
|
|
81,744 |
|
|
69,011 |
|
|
66,989 |
|
|
13,013 |
|
|
15 |
|
|
Natural gas sales |
|
|
107,816 |
|
|
98,797 |
|
|
60,188 |
|
|
11,085 |
|
|
766 |
|
|
Total revenues |
|
|
431,326 |
|
|
475,779 |
|
|
666,064 |
|
|
314,420 |
|
|
43,158 |
|
|
OPERATING COSTS AND EXPENSES: |
|
|
|
|
|
|
|
|
|
|
|
|
|
|
|
|
|
Oil and natural gas production expenses |
|
|
164,567 |
|
|
156,528 |
|
|
93,581 |
|
|
35,669 |
|
|
3,401 |
|
|
Production and ad valorem taxes |
|
|
19,633 |
|
|
26,870 |
|
|
37,787 |
|
|
17,334 |
|
|
2,124 |
|
|
Depreciation, depletion, amortization and accretion |
|
|
159,760 |
|
|
344,572 |
|
|
338,097 |
|
|
134,845 |
|
|
15,922 |
|
|
Impairment of oil and natural gas properties |
|
|
169,046 |
|
|
1,365,000 |
|
|
213,821 |
|
|
— |
|
|
— |
|
|
General and administrative (1) |
|
|
110,081 |
|
|
74,160 |
|
|
63,692 |
|
|
47,951 |
|
|
37,239 |
|
|
Total operating costs and expenses |
|
|
623,087 |
|
|
1,967,130 |
|
|
746,978 |
|
|
235,799 |
|
|
58,686 |
|
|
Operating income (loss) |
|
|
(191,761) |
|
|
(1,491,351) |
|
|
(80,914) |
|
|
78,621 |
|
|
(15,528) |
|
|
Other income (expense): |
|
|
|
|
|
|
|
|
|
|
|
|
|
|
|
|
|
Interest income |
|
|
856 |
|
|
442 |
|
|
193 |
|
|
187 |
|
|
74 |
|
|
Other income (expense) |
|
|
134 |
|
|
(2,605) |
|
|
96 |
|
|
(52) |
|
|
— |
|
|
Gain on disposal of assets |
|
|
112,294 |
|
|
— |
|
|
— |
|
|
— |
|
|
— |
|
|
Interest expense |
|
|
(126,973) |
|
|
(126,399) |
|
|
(89,800) |
|
|
(30,934) |
|
|
(99) |
|
|
Earnings from equity investments |
|
|
3,466 |
|
|
— |
|
|
— |
|
|
— |
|
|
— |
|
|
Net gains (losses) on commodity derivatives |
|
|
(53,149) |
|
|
172,886 |
|
|
137,205 |
|
|
(16,938) |
|
|
(742) |
|
|
Total other income (expense) |
|
|
(63,372) |
|
|
44,324 |
|
|
47,694 |
|
|
(47,737) |
|
|
(767) |
|
|
Income (loss) before income taxes |
|
|
(255,133) |
|
|
(1,447,027) |
|
|
(33,220) |
|
|
30,884 |
|
|
(16,295) |
|
|
Income tax expense (benefit) |
|
|
1,825 |
|
|
7,600 |
|
|
(11,429) |
|
|
3,986 |
|
|
— |
|
|
Net income (loss) |
|
|
(256,958) |
|
|
(1,454,627) |
|
|
(21,791) |
|
|
26,898 |
|
|
(16,295) |
|
|
Less: |
|
|
|
|
|
|
|
|
|
|
|
|
|
|
|
|
|
Preferred stock dividends |
|
|
(15,948) |
|
|
(16,008) |
|
|
(33,590) |
|
|
(18,525) |
|
|
(2,112) |
|
|
Net income allocable to participating securities(2)(3) |
|
|
— |
|
|
— |
|
|
— |
|
|
(364) |
|
|
— |
|
|
Net income (loss) attributable to common stockholders |
|
$ |
(272,906) |
|
$ |
(1,470,635) |
|
$ |
(55,381) |
|
$ |
8,009 |
|
$ |
(18,407) |
|
|
Net income (loss) per common share - basic and diluted |
|
$ |
(4.63) |
|
$ |
(25.70) |
|
$ |
(1.06) |
|
$ |
0.22 |
|
$ |
(0.56) |
|
|
Weighted average number of shares used to calculate net income (loss) attributable to common stockholders - basic and diluted (4) |
|
|
58,900 |
|
|
57,229 |
|
|
52,338 |
|
|
36,379 |
|
|
33,000 |
|
(1)Includes stock based compensation expense of $37.1 million, $14.8 million, $12.8 million, $17.8 million and $25.5 million for the years ended December 31, 2016, 2015, 2014, 2013 and 2012, respectively. Also includes acquisition and divestiture costs of $8.1 million, $3.8 million, $1.8 million and $4.1 million for the years ended December 31, 2016, 2015, 2014 and 2013, respectively.
55
(2)The Company’s restricted shares of common stock are participating securities.
(3)For the years ended December 31, 2016, 2015, 2014 and 2012 no losses were allocated to participating restricted stock because such securities do not have a contractual obligation to share in the Company’s losses.
(4)The year ended December 31, 2016 excludes 2,113,462 shares of weighted average restricted stock and 12,554,481 shares of common stock resulting from an assumed conversion of the Company's Series A Convertible Stock and Series B Preferred Stock from the calculation of the denominator for diluted earnings per common share as these shares were anti-dilutive. The year ended December 31, 2015 excludes 2,663,010 shares of weighted average restricted stock and 12,529,314 shares of common stock resulting from an assumed conversion of the Company's Series A Convertible Stock and Series B Preferred Stock from the calculation of the denominator for diluted earnings per common share as these shares were anti-dilutive. The year ended December 31, 2014 excludes 1,732,888 shares of weighted average restricted stock and 13,527,738 shares of common stock resulting from an assumed conversion of the Company’s Series A Preferred Stock and Series B Preferred Stock from the calculation of the denominator for diluted earnings per common share as these shares were anti‑dilutive. The year ended December 31, 2013 excludes 757,963 shares of weighted average restricted stock and 14,979,225 shares of common stock resulting from an assumed conversion of the Company’s Series A Preferred Stock and Series B Preferred Stock from the calculation of the denominator for diluted earnings per common share as these shares were anti‑dilutive. The year ended December 31, 2012 excludes 184,230 shares of weighted average restricted stock and 1,992,857 shares of common stock resulting from an assumed conversion of the Company’s Series A Preferred Stock from the calculation of the denominator for diluted earnings per common share as these shares were anti‑dilutive.
|
|
|
As of December 31, |
|
|||||||||||||
|
|
|
2016 |
|
2015 |
|
2014 |
|
2013 |
|
2012 |
|
|||||
|
|
|
|
(in thousands) |
|
||||||||||||
|
Balance Sheet Data: |
|
|
|
|
|
|
|
|
|
|
|
|
|
|
|
|
|
Working capital |
|
$ |
385,808 |
|
$ |
499,112 |
|
$ |
412,798 |
|
$ |
54,061 |
|
$ |
15,671 |
|
|
Total assets (1) |
|
$ |
1,286,280 |
|
$ |
1,501,304 |
|
$ |
2,994,000 |
|
$ |
1,602,465 |
|
$ |
426,574 |
|
|
Long term debt, net of premium, discount and debt issuance costs(1) |
|
$ |
1,712,767 |
|
$ |
1,705,927 |
|
$ |
1,698,095 |
|
$ |
573,452 |
|
$ |
— |
|
|
Total stockholders' equity (deficit) |
|
$ |
(696,140) |
|
$ |
(456,169) |
|
$ |
999,587 |
|
$ |
857,309 |
|
$ |
366,743 |
|
|
(1) |
As a result of the adoption of ASU 2015-03 on a retrospective basis as of the quarter ended December 31, 2016, the total assets and long term debt, net of premium, discount and debt issuance costs as of December 31, 2015, 2014 and 2013 were reduced by approximately $41.0 million, $48.2 million and $19.8 million, respectively. These retrospective changes are reflected in the total assets and long term debt, net of premium, discount and debt issuance costs amounts in the table above. See further discussion on the adoption of ASU 2015-03 in “Item 8. Financial Statements and Supplementary Data — Note 5, Long-Term Debt.” |
56
|
|
|
Year Ended December 31, |
|
|||||||||||||
|
|
|
2016 |
|
2015 |
|
2014 |
|
2013 |
|
2012 |
|
|||||
|
|
|
|
(in thousands) |
|
||||||||||||
|
Cash Flow Data: |
|
|
|
|
|
|
|
|
|
|
|
|
|
|
|
|
|
Net cash provided by operating activities |
|
$ |
181,251 |
|
$ |
272,025 |
|
$ |
415,335 |
|
$ |
189,261 |
|
$ |
29,072 |
|
|
Net cash used in investing activities |
|
$ |
(108,637) |
|
$ |
(294,331) |
|
$ |
(1,361,264) |
|
$ |
(1,093,363) |
|
$ |
(181,427) |
|
|
Net cash provided by (used in) financing activities |
|
$ |
(5,745) |
|
$ |
(16,360) |
|
$ |
1,266,112 |
|
$ |
1,007,286 |
|
$ |
139,661 |
|
Non‑GAAP Financial Measures
Adjusted EBITDA
We present adjusted EBITDA attributable to common stockholders (“Adjusted EBITDA”) in addition to our reported net income (loss) in accordance with U.S. GAAP. Adjusted EBITDA is a non‑GAAP financial measure that is used as a supplemental financial measure by our management and by external users of our financial statements, such as investors, commercial banks and others, to assess our operating performance as compared to that of other companies in our industry, without regard to financing methods, capital structure or historical costs basis. It is also used to assess our ability to incur and service debt and fund capital expenditures.
We define Adjusted EBITDA as net income (loss):
|
· |
Plus: |
|
· |
Interest expense, including net losses (gains) on interest rate derivative contracts; |
|
· |
Net losses (gains) on commodity derivative contracts; |
|
· |
Net settlements received (paid) on commodity derivative contracts; |
|
· |
Depreciation, depletion, and amortization and accretion; |
|
· |
Impairment of oil and natural gas properties; |
|
· |
Stock‑based compensation expense; |
|
· |
Acquisition and divestiture costs included in general and administrative; |
|
· |
Income tax expense (benefit); and |
|
· |
Certain other items that we deem appropriate. |
|
· |
Less: |
|
· |
Gain on disposal of assets; |
|
· |
Amortization of deferred gain on Western Catarina Midstream Divestiture; |
|
· |
Interest income; and |
|
· |
Certain other items that we deem appropriate. |
57
Our Adjusted EBITDA should not be considered an alternative to net income (loss), operating income (loss), cash flows provided by (used in) operating activities or any other measure of financial performance or liquidity presented in accordance with U.S. GAAP. Our Adjusted EBITDA may not be comparable to similarly titled measures of another company because all companies may not calculate Adjusted EBITDA in the same manner.
The following table presents a reconciliation of our net income (loss) to Adjusted EBITDA (in thousands):
|
|
|
Year Ended December 31, |
|
|||||||||||||
|
|
|
2016 |
|
2015 |
|
2014 |
|
2013 |
|
2012 |
|
|||||
|
Net income (loss) |
|
$ |
(256,958) |
|
$ |
(1,454,627) |
|
$ |
(21,791) |
|
$ |
26,898 |
|
$ |
(16,295) |
|
|
Plus: |
|
|
|
|
|
|
|
|
|
|
|
|
|
|
|
|
|
Interest expense |
|
|
126,973 |
|
|
126,399 |
|
|
89,800 |
|
|
30,934 |
|
|
99 |
|
|
Net losses (gains) on commodity derivative contracts |
|
|
53,149 |
|
|
(172,886) |
|
|
(137,205) |
|
|
16,938 |
|
|
742 |
|
|
Net settlements received (paid) on commodity derivative contracts |
|
|
135,600 |
|
|
142,468 |
|
|
5,600 |
|
|
(5,787) |
|
|
2,749 |
|
|
Depreciation, depletion, amortization and accretion |
|
|
159,760 |
|
|
344,572 |
|
|
338,097 |
|
|
134,845 |
|
|
15,922 |
|
|
Impairment of oil and natural gas properties |
|
|
169,046 |
|
|
1,365,000 |
|
|
213,821 |
|
|
— |
|
|
— |
|
|
Stock-based compensation expense |
|
|
37,090 |
|
|
14,831 |
|
|
12,843 |
|
|
17,751 |
|
|
25,542 |
|
|
Acquisition and divestiture costs included in general and administrative |
|
|
8,130 |
|
|
3,814 |
|
|
1,808 |
|
|
4,129 |
|
|
— |
|
|
Write off of joint venture receivable, non-recurring |
|
|
— |
|
|
2,251 |
|
|
— |
|
|
— |
|
|
— |
|
|
Income tax expense (benefit) |
|
|
1,825 |
|
|
7,600 |
|
|
(11,429) |
|
|
3,986 |
|
|
— |
|
|
Less: |
|
|
|
|
|
|
|
|
|
|
|
|
|
|
|
|
|
Gain on disposal of assets |
|
|
(112,294) |
|
|
— |
|
|
— |
|
|
— |
|
|
— |
|
|
Amortization of deferred gain on Western Catarina Midstream Divestiture |
|
|
(14,812) |
|
|
(3,086) |
|
|
— |
|
|
— |
|
|
— |
|
|
Premiums on commodity derivative contracts(1) |
|
|
— |
|
|
— |
|
|
(718) |
|
|
(2,838) |
|
|
(3,059) |
|
|
Interest income |
|
|
(856) |
|
|
(443) |
|
|
(193) |
|
|
(190) |
|
|
(74) |
|
|
|
|
|
|
|
|
|
|
|
|
|
|
|
|
|
|
|
|
Adjusted EBITDA |
|
$ |
306,653 |
|
$ |
375,893 |
|
$ |
490,633 |
|
$ |
226,666 |
|
$ |
25,626 |
|
|
|
|
|
|
|
|
|
|
|
|
|
|
|
|
|
|
|
(1)This amount has been reduced by premiums associated with derivatives that settled during the respective periods, which may include premiums accrued but not yet paid as of the end of the quarter based on timing of cash settlement payments with counterparties.
The following table presents a reconciliation of net cash provided by operating activities to Adjusted EBITDA (in thousands):
|
|
|
Year Ended December 31, |
|
|||||||||||||
|
|
|
2016 |
|
2015 |
|
2014 |
|
2013 |
|
2012 |
|
|||||
|
Net cash provided by operating activities |
|
$ |
181,251 |
|
$ |
272,025 |
|
$ |
415,335 |
|
$ |
189,261 |
|
$ |
29,072 |
|
|
Net change in operating assets and liabilities |
|
|
5,190 |
|
|
(27,961) |
|
|
(6,238) |
|
|
12,334 |
|
|
(3,806) |
|
|
Cash reimbursements received for operating leasehold improvements |
|
|
— |
|
|
(2,648) |
|
|
— |
|
|
— |
|
|
— |
|
|
Interest expense, net (1) |
|
|
117,645 |
|
|
117,723 |
|
|
79,850 |
|
|
23,584 |
|
|
(74) |
|
|
Settlements on commodity derivative contracts, non-cash |
|
|
(11,093) |
|
|
11,466 |
|
|
(122) |
|
|
(2,642) |
|
|
434 |
|
|
Loss on inventory market adjustment |
|
|
(649) |
|
|
— |
|
|
— |
|
|
— |
|
|
— |
|
|
Distributions from equity investments |
|
|
(930) |
|
|
— |
|
|
— |
|
|
— |
|
|
— |
|
|
Earnings from equity investments |
|
|
3,466 |
|
|
— |
|
|
— |
|
|
— |
|
|
— |
|
|
Income tax expense |
|
|
1,825 |
|
|
158 |
|
|
— |
|
|
— |
|
|
— |
|
|
Write off of joint venture receivable, non-cash |
|
|
— |
|
|
2,251 |
|
|
— |
|
|
— |
|
|
— |
|
|
Acquisition and divestiture costs included in general and administrative |
|
|
8,130 |
|
|
3,814 |
|
|
1,808 |
|
|
4,129 |
|
|
— |
|
|
Gain (loss) on investment in SPP |
|
|
1,818 |
|
|
(935) |
|
|
— |
|
|
— |
|
|
— |
|
|
Adjusted EBITDA |
|
$ |
306,653 |
|
$ |
375,893 |
|
$ |
490,633 |
|
$ |
226,666 |
|
$ |
25,626 |
|
|
|
|
|
|
|
|
|
|
|
|
|
|
|
|
|
|
|
(1)This amount includes cash interest expense on our Senior Notes and credit agreements, net of interest income.
58
Adjusted Earnings (Loss)
We present adjusted earnings (loss) attributable to common stockholders (“Adjusted Earnings (Loss)”), in addition to our reported net income (loss) in accordance with U.S. GAAP. This information is provided because management views the exclusion of the items included in our definition of Adjusted Earnings (Loss) below as helpful for decision making by identifying operating trends that could otherwise be masked by these items and highlighting the impact that commodity price volatility has on our results. In addition, management believes the exclusion of the items included in our definition of Adjusted Earnings (Loss) below will help investors compare results between periods, identify operating trends and understand how the volatility of commodity prices impacts the Company’s results. We define Adjusted Earnings (Loss) as net income (loss):
Less:
|
· |
Preferred stock dividends; and |
|
· |
Certain other items that we deem appropriate. |
Plus:
|
· |
Net losses (gains) on commodity derivative contracts; |
|
· |
Net settlements received (paid) on commodity derivative contracts; |
|
· |
Impairment of oil and natural gas properties; |
|
· |
Stock‑based compensation expense; |
|
· |
Acquisition and divestiture costs included in general and administrative; |
|
· |
Gain on disposal of assets; |
|
· |
Amortization of deferred gain on Western Catarina Midstream Divestiture; |
|
· |
Certain other items that we deem appropriate; and |
|
· |
Tax impact of adjustments to net income (loss). |
59
The following table presents a reconciliation of our net income (loss) to Adjusted Earnings (Loss) (in thousands, except per share data):
|
|
|
Year Ended December 31, |
|
|||||||||||||
|
|
|
2016 |
|
2015 |
|
2014 |
|
2013 |
|
2012 |
|
|||||
|
|
|
|
|
|
|
|
|
|
|
|
||||||
|
Net income (loss) |
|
$ |
(256,958) |
|
$ |
(1,454,627) |
|
$ |
(21,791) |
|
$ |
26,898 |
|
$ |
(16,295) |
|
|
Less: Preferred stock dividends |
|
|
(15,948) |
|
|
(16,008) |
|
|
(33,590) |
|
|
(18,525) |
|
|
(2,112) |
|
|
Net income (loss) attributable to common shares and participating securities |
|
|
(272,906) |
|
|
(1,470,635) |
|
|
(55,381) |
|
|
8,373 |
|
|
(18,407) |
|
|
Plus: |
|
|
|
|
|
|
|
|
|
|
|
|
|
|
|
|
|
Non-cash preferred stock dividends associated with conversion |
|
|
— |
|
|
48 |
|
|
17,297 |
|
|
— |
|
|
— |
|
|
Non-cash write off of joint venture receivables |
|
|
— |
|
|
2,251 |
|
|
— |
|
|
— |
|
|
— |
|
|
Net losses (gains) on commodity derivatives contracts |
|
|
53,149 |
|
|
(172,886) |
|
|
(137,205) |
|
|
16,938 |
|
|
742 |
|
|
Net settlements received (paid) on commodity derivative contracts |
|
|
135,600 |
|
|
142,468 |
|
|
5,600 |
|
|
(5,787) |
|
|
2,749 |
|
|
Premiums on commodity derivative contracts (1) |
|
|
— |
|
|
— |
|
|
(718) |
|
|
(2,838) |
|
|
(3,059) |
|
|
Impairment of oil and natural gas properties |
|
|
169,046 |
|
|
1,365,000 |
|
|
213,821 |
|
|
— |
|
|
— |
|
|
Stock-based compensation expense |
|
|
37,090 |
|
|
14,831 |
|
|
12,843 |
|
|
17,751 |
|
|
25,542 |
|
|
Acquisition and divestiture costs included in general and administrative |
|
|
8,130 |
|
|
3,814 |
|
|
1,808 |
|
|
4,129 |
|
|
— |
|
|
Gain on disposal of assets |
|
|
(112,294) |
|
|
— |
|
|
— |
|
|
— |
|
|
— |
|
|
Amortization of deferred gain on Western Catarina Midstream Divestiture |
|
|
(14,812) |
|
|
(3,086) |
|
|
— |
|
|
— |
|
|
— |
|
|
Tax impact of adjustments to net income (loss) (2) |
|
|
260 |
|
|
12,385 |
|
|
(33,081) |
|
|
(3,898) |
|
|
— |
|
|
Adjusted Earnings (Loss) |
|
|
3,263 |
|
|
(105,810) |
|
|
24,984 |
|
|
34,668 |
|
|
7,567 |
|
|
Adjusted Earnings allocable to participating securities(3) |
|
|
(321) |
|
|
— |
|
|
(1,157) |
|
|
(1,513) |
|
|
(221) |
|
|
Adjusted Earnings (Loss) attributable to common stockholders |
|
$ |
2,942 |
|
$ |
(105,810) |
|
$ |
23,827 |
|
$ |
33,155 |
|
$ |
7,346 |
|
|
|
|
|
|
|
|
|
|
|
|
|
|
|
|
|
|
|
|
Weighted average number of shares used to calculate net income (loss) attributable to common stockholders - basic and diluted |
|
|
58,900 |
|
|
57,229 |
|
|
52,338 |
|
|
36,379 |
|
|
33,000 |
|
|
|
|
|
|
|
|
|
|
|
|
|
|
|
|
|
|
|
|
(1) |
This amount has been reduced by premiums associated with derivatives that settled during the respective periods, which may include premiums accrued but not yet paid as of the end of the quarter based on timing of cash settlement payments with counterparties. |
|
(2) |
The tax impact is computed by utilizing the Company’s effective tax rate on the adjustments to reconcile net income (loss) to Adjusted Earnings (loss). |
|
(3) |
The Company’s restricted shares of common stock are participating securities. |
Adjusted Earnings (Loss) is not intended to represent cash flows for the period, nor is it presented as a substitute for net income (loss), operating income (loss), cash flows provided by (used in) operating activities or any other measure of financial performance or liquidity presented in accordance with U.S. GAAP.
60
Adjusted G&A and Adjusted G&A per Boe
We present Adjusted G&A expense in addition to our reported G&A expense in accordance with U.S. GAAP. Adjusted G&A is reported herein because this measure is commonly used by management, analysts and investors as an indicator of cost management and operating efficiency on a comparable basis from period to period. In addition, management believes Adjusted G&A per Boe is used by analysts and others in valuation, comparison and investment recommendations of companies in the oil and gas industry to allow for analysis of G&A spend without regard to stock-based compensation programs which can vary substantially from company to company. Adjusted G&A per Boe should not be considered as an alternative to, or more meaningful than, total G&A per Boe as determined in accordance with U.S. GAAP and may not be comparable to other similar titled measures of other companies. We define Adjusted G&A as G&A:
Less:
|
· |
Stock-based compensation expense; and |
|
· |
Certain costs related to acquisitions and divestitures. |
The following table presents a reconciliation of our G&A to Adjusted G&A (in thousands, except per Boe data):
|
|
|
Year Ended December 31, |
|||||||||||||
|
|
|
2016 |
|
2015 |
|
2014 |
|
2013 |
|
2012 |
|||||
|
|
|
|
(in thousands, except per Boe data) |
||||||||||||
|
General and administrative expense |
|
$ |
110,081 |
|
$ |
74,160 |
|
$ |
63,692 |
|
$ |
47,951 |
|
$ |
37,239 |
|
Stock-based compensation expense included in G&A |
|
|
37,090 |
|
|
14,831 |
|
|
12,843 |
|
|
17,751 |
|
|
25,542 |
|
Acquisition and divestiture costs included in G&A |
|
|
8,130 |
|
|
3,814 |
|
|
1,808 |
|
|
4,129 |
|
|
- |
|
Adjusted G&A |
|
$ |
64,861 |
|
$ |
55,515 |
|
$ |
49,041 |
|
$ |
26,071 |
|
$ |
11,697 |
|
|
|
|
|
|
|
|
|
|
|
|
|
|
|
|
|
|
Average unit costs per Boe: |
|
|
|
|
|
|
|
|
|
|
|
|
|
|
|
|
General and administrative expense |
|
$ |
5.64 |
|
$ |
3.87 |
|
$ |
5.72 |
|
$ |
12.39 |
|
$ |
79.43 |
|
Stock-based compensation expense included in G&A |
|
$ |
1.90 |
|
$ |
0.77 |
|
$ |
1.15 |
|
$ |
4.58 |
|
$ |
54.48 |
|
Acquisition and divestiture costs included in G&A |
|
$ |
0.42 |
|
$ |
0.20 |
|
$ |
0.16 |
|
$ |
1.07 |
|
$ |
- |
|
Adjusted G&A per Boe |
|
$ |
3.32 |
|
$ |
2.89 |
|
$ |
4.40 |
|
$ |
6.73 |
|
$ |
24.95 |
Item 7. Management’s Discussion and Analysis of Financial Condition and Results of Operations
The following discussion and analysis of our financial condition and results of operations should be read in conjunction with our consolidated financial statements and related notes set forth in “Item 8. Financial Statements and Supplementary Data,” our consolidated financial data set forth in “Item 6. Selected Financial Data” and the risk factors identified in “Item 1A. Risk Factors” of this Annual Report on Form 10‑K.
Our estimated proved reserve information as of December 31, 2016 contained in this Annual Report on Form 10-K is based on a report prepared by Ryder Scott Company, L.P. (“Ryder Scott”), our independent reserve engineers. Estimated reserve information for the Comanche Assets contained in this Annual Report on Form 10-K is based on our internal evaluation and interpretation of reserve and other information provided to us in the course of our due diligence with respect to the Comanche Acquisition and has not been independently verified or estimated. Unless otherwise specified in this Annual Report on Form 10-K, the information in this Annual Report on Form 10-K does not give effect to the Comanche Acquisition.
61
Certain items in our discussion below are forward-looking statements. These forward looking statements involve risks and uncertainties. A number of factors could cause actual results to differ materially from those implied or expressed in such forward-looking statements. Please see “Cautionary Note Regarding Forward-Looking Statements.”
Business Overview
Sanchez Energy Corporation, a Delaware corporation formed in 2011, is an independent exploration and production company focused on the acquisition and development of U.S. onshore unconventional oil and natural gas resources, with a current focus on the horizontal development of significant resource potential from the Eagle Ford Shale in South Texas. We also hold an undeveloped acreage position in the TMS in Mississippi and Louisiana, which offers future upside opportunity. As of December 31, 2016, we have assembled approximately 278,000 net leasehold acres with an approximate 94% average working interest in the Eagle Ford Shale.
On January 12, 2017, the Company, through two of our subsidiaries, SN UnSub and SN Maverick, along with Blackstone signed the Comanche Purchase Agreement to acquire the Comanche Assets from Anadarko for $2,275 million in cash, subject to customary closing adjustments. The Comanche Assets are primarily located in the Western Eagle Ford Shale and are expected to significantly expand our asset base and production. The Comanche Assets consist of approximately 318,000 gross (155,000 net) acres comprised of 252,000 gross (122,000 net) Eagle Ford Shale acres and 66,000 gross (33,000 net) Pearsall Shale acres, with an approximate 49% average working interest therein, contain, as of June 30, 2016, approximately 300 MMBoe of proved reserves (70% liquids, 75% proved developed), and had production of approximately 67,000 Boe/d (70% liquids) as of December 31, 2016. The estimated proved reserves attributable to the Comanche Assets are based on our internal evaluation and interpretation of reserve and other information provided to us in the course of our due diligence with respect to the Comanche Acquisition and have not been independently verified or estimated. The Comanche Purchase Agreement provides that SN UnSub will pay approximately 37% of the purchase price (including through a $100 million cash contribution from the Company) and SN Maverick will pay approximately 13% of the purchase price and SN UnSub and SN Maverick would acquire half of the 49% working interest in and to the Comanche Assets in the aggregate (and approximately 50% and 0%, respectively, of the estimated total proved developed producing reserves, 20% and 30%, respectively, of the estimated total proved developed non-producing reserves, and 20% and 30%, respectively, of the total proved undeveloped reserves), and Blackstone will pay 50% of the purchase price and would acquire the remaining half of the 49% working interest in and to the Comanche Assets (approximately 50% of the estimated total proved developed producing reserves, proved developed non-producing reserves and proved undeveloped reserves). We expect to close the Comanche Acquisition during the first quarter of 2017. The effective date of the transaction is July 1, 2016. A working interest owner (the “Tag Owner”) held a tag right, exercisable until February 12, 2017, to sell its interest in the Comanche Assets (which is approximately one-half Anadarko’s interest) on substantially the same terms and conditions as Anadarko. However, the Tag Owner elected to waive its tag right. The estimated proved reserves attributable to the Comanche Assets are as of June 30, 2016, are based on our internal evaluation and interpretation of reserve and other information provided to us in the course of our due diligence with respect to the Comanche Acquisition and have not been independently verified or estimated.
For the year 2017, we plan to invest substantially all of our 2017 capital budget in the Eagle Ford Shale. We continue to evaluate opportunities to increase both our acreage and our producing assets through acquisitions. Our successful acquisition of such assets will depend on both the opportunities and the financing alternatives available to us at the time we consider such opportunities.
For further discussion of our business, including a description of various acquisitions completed during the periods presented in the consolidated financial statements, refer to “Item 1. Business—Overview.”
Basis of Presentation
The consolidated financial statements have been prepared in accordance with U.S. GAAP.
62
Our Properties
We and our predecessor entities have a long history in the Eagle Ford Shale, where we have assembled approximately 278,000 net leasehold acres with an average working interest of approximately 94%. Using approximately 75 acre well-spacing for our Maverick area, approximately 120 acre well-spacing for our Javelina area, approximately 40 acre well‑spacing for our Palmetto area, approximately 60 acre well‑spacing for our Marquis area and approximately 75 acre well‑spacing for our Catarina area, and assuming 80% of the acreage is drillable for our Maverick, Javelina, Marquis and Catarina areas, and 90% of the acreage is drillable for our Palmetto area, we believe that there could be over 3,300 potential gross (3,050 net) locations for potential future drilling in the Eagle Ford Shale. Pro forma for the pending Comanche Acquisition, we will have assembled approximately 339,000 net leasehold acres with an approximate 61% average working interest as of December 31, 2016, and will have over 7,300 potential gross (4,050 net) Eagle Ford locations for potential drilling. Our average well-spacing for the Comanche area is planned to be 600 foot apparent spacing (in zone), with plans for multi-bench development of two to four Eagle Ford targets across our acreage position.
The TMS development is currently challenged due to high well costs and depressed commodity prices. We believe that the TMS play has significant development potential and may offer upside opportunity as changes in technology, commodity prices, and service prices occur. The average remaining lease term on the acreage is over 2 years, giving us ample time to allow other industry participants to further de‑risk the play. Using approximately 250 acre well‑spacing for our TMS area and assuming 80% of the acreage is drillable, we believe that there are up to 200 gross (150 net) locations for potential future drilling.
In total, pro forma for the pending Comanche Acquisition, we believe that there are over 7,500 potential gross (4,200 net) Eagle Ford and TMS locations for future drilling. Consistent with other operators in this area, we perform multi‑stage hydraulic fracturing up to 30 stages on each well depending upon the length of the lateral section. For the year 2017, we plan to invest substantially all of our capital budget in the Eagle Ford Shale.
For further discussion of our properties, including a description of recent well results in our core operating areas, refer to “Item 1. Business—Core Properties.”
Recent Developments
Comanche Acquisition
As noted above in “Item 7. Management’s Discussion and Analysis—Business Overview”, the Company, through two of our subsidiaries, SN UnSub and SN Maverick, along with Blackstone, signed the Comanche Purchase Agreement to acquire the Comanche Assets from Anadarko for $2,275 million in cash, subject to customary closing adjustments. The Comanche Assets are primarily located in the Western Eagle Ford Shale and are projected to more than double our gross drilling inventory as of December 31, 2016, add 132 gross drilled but uncompleted wells and provide a path for strong growth within projected cash flow. With the Comanche Assets strategically located adjacent to our existing Catarina assets, we anticipate substantial operating synergies and other benefits arising from the scale and concentration of our expanded Eagle Ford position. Our continued focus on the Western Eagle Ford, expertise at multi-bench development and efficient cost structure provide us with opportunities to create significant value from the Comanche Assets. With the potential to duplicate the cost structure of our Catarina and Maverick operations throughout the Comanche Assets, we expect to further improve operating efficiencies while enhancing our capability to achieve sustainability of well cost reductions over time.
In connection with the pending Comanche Acquisition, on January 12, 2017, SN UnSub, JPMorgan Chase Bank, N.A., Citibank, N.A., and certain of their affiliates entered into a debt financing commitment letter for the SN UnSub Credit Facility.
Interim Investors Agreement
In connection with the execution of the Comanche Purchase Agreement, on January 12, 2017, we and Blackstone entered into an Interim Investors Agreement to govern the relationship between us and Blackstone pending
63
the closing of the transactions contemplated by the Comanche Purchase Agreement and provide for certain agreements to be entered into among us and Blackstone and their affiliates in connection with the closing of the Comanche Acquisition.
Securities Purchase Agreement
As part of the financing for the acquisition of the Comanche Assets, on January 12, 2017, we and GSO entered into a Securities Purchase Agreement (the “SPA”). The SPA provides that, at the closing of the transactions contemplated by the Comanche Purchase Agreement and subject to the other terms and conditions provided therein, (i) SN EF UnSub Holdings, LLC, the limited partner of SN UnSub, will purchase 100,000 common units of SN UnSub for $100 million and GSO will purchase at least 500,000 preferred units of SN UnSub for $500 million plus, at GSO’s sole election, additional preferred units if SN UnSub intends to incur senior debt other than pursuant to the SN UnSub Credit Facility, if there is an unsuccessful syndication of the SN UnSub Credit Facility, or the availability under the SN UnSub Credit Facility as of the closing will be less than $65 million (the “Debt Replacement Units”), and (ii) GSO will purchase one common unit in SN UnSub's general partner for nominal consideration. In addition, GSO has committed, pursuant to the terms and conditions of the SPA, to purchase additional preferred units (and, at its sole option, additional Debt Replacement Units).
2017 Capital Program
Our 2017 capital budget is focused on the development of our approximately 339,000 net acres in the Eagle Ford Shale, inclusive of net acreage attributable to the pending Comanche Acquisition. In 2017, we plan to invest $395 million to $440 million, or 100%, of our drilling and completion budget to complete 144 net Eagle Ford Shale wells. We also plan to invest $30 million to $35 million for facilities, leasing and seismic activities. This 2017 capital budget of $425 million to $475 million represents an increase of approximately 64% over our budgeted 2016 capital investment of $250 million to $300 million. The increase in our 2017 capital budget is attributable to the planned development of new locations expected to be added through the Comanche Acquisition. Capital allocation to the Catarina, Maverick and Palmetto assets remains unchanged as a result of the Comanche Acquisition, and is generally in line with 2016 activity levels.
The following table presents summary data for each of our project areas as of December 31, 2016, pro forma for the Comanche Acquisition as well as our drilling and completion budget for 2017 fiscal year:
|
|
|
|
|
|
|
|
|
|
|
2017 Capital Expenditure Budget |
|
||||||||||
|
|
|
|
|
Average |
|
|
|
Identified |
|
Net |
|
|
|
Drilling & |
|
% of |
|
% of |
|
||
|
|
|
Net |
|
Working |
|
Operator |
|
Gross |
|
Net |
|
Wells |
|
Net Wells |
|
Capital |
|
Operating |
|
D&C |
|
|
Catarina |
|
106,051 |
|
100% |
|
Sanchez Energy |
|
1,400 |
|
1,400 |
|
49 |
|
53 |
|
$160 - $170 |
|
35% |
|
37% |
|
|
Comanche |
|
61,262 |
|
23% |
|
Sanchez Energy |
|
4,000 |
|
1,000 |
|
30 |
|
53 |
|
$130 - $150 |
|
32% |
|
35% |
|
|
Maverick |
|
102,626 |
|
96% |
|
Sanchez Energy |
|
1,100 |
|
1,000 |
|
35 |
|
35 |
|
$100 - $110 |
|
24% |
|
26% |
|
|
Javelina |
|
39,506 |
|
100% |
|
Sanchez Energy |
|
300 |
|
300 |
|
- |
|
- |
|
$0 |
|
0% |
|
0% |
|
|
Palmetto |
|
8,097 |
|
49% |
|
Marathon |
|
300 |
|
150 |
|
2 |
|
3 |
|
$5 - $10 |
|
2% |
|
2% |
|
|
Marquis |
|
21,477 |
|
100% |
|
Sanchez Energy |
|
200 |
|
200 |
|
- |
|
- |
|
$0 |
|
0% |
|
0% |
|
|
Total Eagle Ford |
|
339,019 |
|
61% |
|
|
|
7,300 |
|
4,050 |
|
116 |
|
144 |
|
$395 - $440 |
|
93% |
|
100% |
|
|
TMS |
|
45,639 |
|
71% |
|
Sanchez Oil and Gas |
|
200 |
|
150 |
|
- |
|
- |
|
$0 |
|
0% |
|
0% |
|
|
Other |
|
727 |
|
25% |
|
Sanchez Energy |
|
- |
|
- |
|
- |
|
- |
|
$0 |
|
0% |
|
0% |
|
|
Total |
|
385,385 |
|
62% |
|
|
|
7,500 |
|
4,200 |
|
116 |
|
144 |
|
$395 - $440 |
|
93% |
|
100% |
|
|
Facilities, Leasing and Seismic |
|
|
|
|
|
|
|
|
|
|
|
|
|
|
|
$30 - $35 |
|
7% |
|
|
|
|
Total Capital Budget |
|
|
|
|
|
|
|
|
|
|
|
|
|
|
|
$425 - $475 |
|
100% |
|
|
|
(1)Average working interests reflect the Company’s average working interests in the leases it holds.
(2)Using approximately 75 acre well‑spacing for our Maverick area, approximately 120 acre well-spacing for our Javelina area, approximately 40 acre well-spacing for our Palmetto area, approximately 60 acre well‑spacing for our Marquis area and approximately 75 acre well‑spacing for our Catarina and assuming 80% of the acreage is drillable for our Maverick, Javelina, Marquis and Catarina areas, and 90% of the acreage is drillable for our Palmetto area, we believe that there could be over 3,300 potential gross (3,050 net) locations for potential future drilling in the Eagle Ford Shale. Following the completion of the pending Comanche Acquisition, we believe that we will have
64
over 7,300 gross (4,050 net) locations for potential future drilling in the Eagle Ford Shale. Our average well-spacing for the Comanche area is planned to be 600 foot apparent spacing (in zone), with plans for multi-bench development of two to four Eagle Ford targets across our acreage position, providing approximately 4,000 potential gross (1,000 net) locations. Using approximately 250 acre well‑spacing for our TMS area and assuming 80% of the acreage is drillable, we believe that there are up to 200 gross (150 net) locations for potential future drilling. In total, pro forma for the pending Comanche Acquisition, we believe that there are over 7,500 potential gross (4,200 net) Eagle Ford and TMS locations for future drilling.
In our Comanche area, pro forma for the pending Comanche Acquisition, we have approximately 61,000 net acres in Dimmit, Webb, La Salle and Maverick Counties, Texas with a 24% working interest. We anticipate drilling, completion and facilities costs on our acreage to average approximately $3.2 million per well based on our current estimates. Current EUR per well in Comanche is expected to range between 600 MBoe and 700 MBoe. We have identified between 4,000 and 1,000 gross and net Eagle Ford locations for potential future drilling on our Comanche acreage. For the year 2017, we plan to spend between $130 million to $150 million to complete 53 net wells, 32 of which were drilled by the previous operator.
Common Equity Offering
On February 6, 2017, the Company completed an underwritten public offering of 10,000,000 shares of the Company's common stock at a price of $12.50 per share ($11.7902 per share, net of underwriting discounts). The Company granted the Underwriters a 30-day option to purchase up to an additional 1,500,000 shares of the Company’s common stock on the same terms, which was exercised in full on February 1, 2017. The Company received net proceeds of approximately $135.9 million (after deducting underwriting discounts) from the sale of the shares of common stock. The Company intends to use the net proceeds of the offering for general corporate purposes, including working capital.
Outlook
Although capital markets have shown signs of improvement recently, our operating environment continues to be influenced by commodity price volatility. As a result, we face persistent uncertainty with respect to the future of our industry, which may continue into future years. In this environment, the Company plans to carefully manage its capital spending and operating activities in order to preserve liquidity. The Company maintains significant operational and financial flexibility to respond to changes in market and operating conditions, and our capital budget remains at all times subject to adjustment.
We expect to use a portion of our cash on hand, internally generated cash flows from operations, and funds raised through the strategic sale of certain non-core assets, to fund our 2017 capital expenditures, and currently project no borrowings under the Second Amended and Restated Credit Agreement for purposes of our development activity at our planned level of capital spending. We will continuously evaluate our capital spending and operating activities in light of realized commodity prices and the results of our operations, and may make further adjustments to our capital spending program as warranted, subject to our obligations under the JDA following the expected closing of the Comanche Acquisition. In addition, we will continuously review acquisition and divestiture opportunities involving third parties, SPP and/or other members of the Sanchez Group.
The average oil price (WTI Cushing) used in the SEC pricing methodology for calculating the PV-10 and Standardized Measures and for performing impairment tests under the full cost method, calculated as the unweighted arithmetic average of the first day of the month price for each month within the 12 month period ended December 31, 2016 was $42.75 per barrel and the average natural gas price, at Henry Hub, and calculated in the same manner, was $2.49 per MMBtu. At these price levels, SEC prices for oil and natural gas have decreased approximately 15% and 4%, respectively, since December 31, 2015, but have increased approximately 3% and 9%, respectively, since September 30, 2016.
As a result of less favorable commodity prices adversely impacting our proved reserve values, and the impact of commodity price volatility on our future drilling opportunities, we recorded a full cost ceiling test impairment after
65
income taxes of $169.0 million for the year ended December 31, 2016. While there is a possibility that the Company will incur additional impairments to our full cost pool in 2017, factors impacting the full cost ceiling test impairment calculation have not yet been determined. Based upon known improvements in the current NYMEX forward prices, we believe that there is a reasonable likelihood of an increase in the average 12 month trailing first-day-of-the-month pricing in the first quarter of 2017.
Results of Operations
Revenue and Production
The following table summarizes production, average sales prices and operating revenue for our oil, NGLs and natural gas operations for the periods indicated (in thousands, except average sales price and percentages):
|
|
|
|
|
|
|
|
|
|
|
|
|
|
|
|
|
|||||||
|
|
|
|
|
Increase (Decrease) |
|
|
||||||||||||||||
|
|
|
Year Ended December 31, |
|
2016 vs 2015 |
|
|
2015 vs 2014 |
|
|
|||||||||||||
|
|
|
2016 |
|
2015 |
|
2014 |
|
$ |
|
% |
|
|
$ |
|
% |
|
|
|||||
|
Net Production: |
|
|
|
|
|
|
|
|
|
|
|
|
|
|
|
|
|
|
|
|
|
|
|
Oil (MBbl) |
|
|
6,370 |
|
|
7,165 |
|
|
6,080 |
|
|
(795) |
|
(11) |
% |
|
|
1,085 |
|
18 |
% |
|
|
Natural gas liquids (MBbl) |
|
|
5,960 |
|
|
5,754 |
|
|
2,590 |
|
|
206 |
|
4 |
% |
|
|
3,164 |
|
122 |
% |
|
|
Natural gas (MMcf) |
|
|
43,189 |
|
|
37,594 |
|
|
14,828 |
|
|
5,595 |
|
15 |
% |
|
|
22,767 |
|
154 |
% |
|
|
Total oil equivalent (MBoe) |
|
|
19,529 |
|
|
19,184 |
|
|
11,141 |
|
|
345 |
|
2 |
% |
|
|
8,043 |
|
72 |
% |
|
|
|
|
|
|
|
|
|
|
|
|
|
|
|
|
|
|
|
|
|
|
|
|
|
|
Average Sales Price Excluding Derivatives(1): |
|
|
|
|
|
|
|
|
|
|
|
|
|
|
|
|
|
|
|
|
|
|
|
Oil ($ per Bbl) |
|
$ |
37.95 |
|
$ |
42.98 |
|
$ |
88.64 |
|
$ |
(5.03) |
|
(12) |
% |
|
$ |
(45.66) |
|
(52) |
% |
|
|
Natural gas liquids ($ per Bbl) |
|
|
13.72 |
|
|
11.99 |
|
|
25.86 |
|
|
1.73 |
|
14 |
% |
|
|
(13.87) |
|
(54) |
% |
|
|
Natural gas ($ per Mcf) |
|
|
2.50 |
|
|
2.63 |
|
|
4.06 |
|
|
(0.13) |
|
(5) |
% |
|
|
(1.43) |
|
(35) |
% |
|
|
Oil equivalent ($ per Boe) |
|
$ |
22.09 |
|
$ |
24.80 |
|
$ |
59.79 |
|
$ |
(2.71) |
|
(11) |
% |
|
$ |
(34.99) |
|
(59) |
% |
|
|
|
|
|
|
|
|
|
|
|
|
|
|
|
|
|
|
|
|
|
|
|
|
|
|
Average Sales Price Including Derivatives(2): |
|
|
|
|
|
|
|
|
|
|
|
|
|
|
|
|
|
|
|
|
|
|
|
Oil ($ per Bbl) |
|
$ |
55.37 |
|
$ |
60.28 |
|
$ |
89.26 |
|
$ |
(4.91) |
|
(8) |
% |
|
$ |
(28.98) |
|
(32) |
% |
|
|
Natural gas liquids ($ per Bbl) |
|
|
13.72 |
|
|
11.99 |
|
|
25.86 |
|
|
1.73 |
|
14 |
% |
|
|
(13.87) |
|
(54) |
% |
|
|
Natural gas ($ per Mcf) |
|
|
3.07 |
|
|
3.12 |
|
|
4.13 |
|
|
(0.05) |
|
(2) |
% |
|
|
(1.01) |
|
(24) |
% |
|
|
Oil equivalent ($ per Boe) |
|
$ |
29.03 |
|
$ |
32.23 |
|
$ |
60.22 |
|
$ |
(3.20) |
|
(10) |
% |
|
$ |
(27.99) |
|
(46) |
% |
|
|
|
|
|
|
|
|
|
|
|
|
|
|
|
|
|
|
|
|
|
|
|
|
|
|
REVENUES(1): |
|
|
|
|
|
|
|
|
|
|
|
|
|
|
|
|
|
|
|
|
|
|
|
Oil sales |
|
$ |
241,766 |
|
$ |
307,971 |
|
$ |
538,887 |
|
$ |
(66,205) |
|
(21) |
% |
|
$ |
(230,916) |
|
(43) |
% |
|
|
Natural gas liquids sales |
|
|
81,744 |
|
|
69,011 |
|
|
66,989 |
|
|
12,733 |
|
18 |
% |
|
|
2,022 |
|
3 |
% |
|
|
Natural gas sales |
|
|
107,816 |
|
|
98,797 |
|
|
60,188 |
|
|
9,019 |
|
9 |
% |
|
|
38,609 |
|
64 |
% |
|
|
Total revenues |
|
$ |
431,326 |
|
$ |
475,779 |
|
$ |
666,064 |
|
$ |
(44,453) |
|
(9) |
% |
|
$ |
(190,285) |
|
(29) |
% |
|
|
(1) |
Excludes the realized impact of derivative instruments. |
|
(2) |
Includes the realized impact of derivative instruments. |
66
Net Production. Production increased from 19,184.4 MBoe in 2015 to 19,528.7 MBoe in 2016 due to our drilling program in 2016. The number of gross wells producing at year end and the production for the periods were as follows:
|
|
|
Year Ended December 31, |
|
||||||||||
|
|
|
2016 |
|
2015 |
|
2014 |
|
||||||
|
|
|
# Wells |
|
MBoe |
|
# Wells |
|
MBoe |
|
# Wells |
|
MBoe |
|
|
Catarina |
|
333 |
|
15,847 |
|
287 |
|
13,905 |
|
193 |
|
3,967 |
|
|
Maverick |
|
36 |
|
888 |
|
24 |
|
409 |
|
18 |
|
182 |
|
|
Cotulla |
|
49 |
|
1,279 |
|
121 |
|
2,108 |
|
111 |
|
2,865 |
|
|
Palmetto |
|
76 |
|
511 |
|
72 |
|
874 |
|
64 |
|
1,771 |
|
|
Marquis |
|
103 |
|
958 |
|
103 |
|
1,816 |
|
90 |
|
2,324 |
|
|
TMS |
|
14 |
|
46 |
|
14 |
|
73 |
|
9 |
|
32 |
|
|
Total |
|
611 |
|
19,529 |
|
621 |
|
19,184 |
|
485 |
|
11,141 |
|
In 2016, 33% of our production was oil, 30% was NGLs and 37% was natural gas compared to 2015 production that was 37% oil, 30% NGLs and 33% natural gas. In 2014, 55% of our production was oil, 23% NGLs and 22% natural gas. The change in production mix during the year ended December 31, 2016 was due to the increase in production from the producing properties in Catarina that have a higher proportion of NGL and natural gas production as compared to oil production from this area. Throughout the year ended December 2016, production from Catarina continued to increase in proportion to the total production, and as such, a higher proportion of NGL and natural gas was produced as compared to oil.
Revenues. Oil, NGL and natural gas sales revenues totaled approximately $431.3 million, $475.8 million, and $666.1 million for the years ended December 31, 2016, 2015 and 2014, respectively. Oil revenue for the year ended December 31, 2016 decreased $66.2 million, while revenues from NGL and natural gas sales revenue for the year ended December 31, 2016 increased $12.8 million and $9.0 million, respectively, as compared to the year ended December 31, 2015.
The following tables provide an analysis of the impacts of changes in average realized prices and production volumes between the periods on our revenues from the year ended December 31, 2015 to the year ended December 31, 2016 (in thousands, except average sales price):
|
|
|
|
|
|
|
|
|
|
|
|
|
|
|
|||
|
|
|
2016 |
|
2015 |
|
Production |
|
2015 |
|
Revenue |
|
|||||
|
|
|
Production |
|
Production |
|
Volume |
|
Average Sales |
|
Increase/(Decrease) |
|
|||||
|
|
|
Volume |
|
Volume |
|
Difference |
|
Price |
|
due to Production |
|
|||||
|
Oil (MBbl) |
|
|
6,370 |
|
|
7,165 |
|
|
(795) |
|
$ |
42.98 |
|
$ |
(34,140) |
|
|
Natural gas liquids (MBbl) |
|
|
5,960 |
|
|
5,754 |
|
|
206 |
|
$ |
11.99 |
|
$ |
2,470 |
|
|
Natural gas (MMcf) |
|
|
43,189 |
|
|
37,594 |
|
|
5,595 |
|
$ |
2.63 |
|
$ |
14,704 |
|
|
Total oil equivalent (MBoe) |
|
|
19,529 |
|
|
19,184 |
|
|
345 |
|
$ |
24.80 |
|
$ |
(16,966) |
|
|
|
|
|
|
|
|
|
|
|
|
|
|
|
|
|
|
|
|
|
|
2016 |
|
2015 |
|
|
|
|
2016 |
|
Revenue |
|
||||
|
|
|
Average Sales |
|
Average Sales |
|
Average Sales |
|
Production |
|
Increase/(Decrease) |
|
|||||
|
|
|
Price |
|
Price |
|
Price Difference |
|
Volume |
|
due to Price |
|
|||||
|
Oil (MBbl) |
|
$ |
37.95 |
|
$ |
42.98 |
|
$ |
(5.03) |
|
|
6,370 |
|
$ |
(32,065) |
|
|
Natural gas liquids (MBbl) |
|
$ |
13.72 |
|
$ |
11.99 |
|
$ |
1.73 |
|
|
5,960 |
|
$ |
10,263 |
|
|
Natural gas (MMcf) |
|
$ |
2.50 |
|
$ |
2.63 |
|
$ |
(0.13) |
|
|
43,189 |
|
$ |
(5,685) |
|
|
Total oil equivalent (MBoe) |
|
$ |
22.09 |
|
$ |
24.80 |
|
$ |
(2.71) |
|
|
19,529 |
|
$ |
(27,487) |
|
Additionally, a 10% increase or decrease in our average realized sales prices, excluding the impact of derivatives, would have increased or decreased our revenues for the year ended December 31, 2016 by $43.1 million.
67
The following tables provide an analysis of the impacts of changes in average realized prices and production volumes between the periods on our revenues from the year ended December 31, 2014 to the year ended December 31, 2015 (in thousands, except average sales price):
|
|
|
2015 |
|
2014 |
|
Production |
|
2014 |
|
Revenue |
|||||
|
|
|
Production |
|
Production |
|
Volume |
|
Average Sales |
|
Increase/(Decrease) |
|||||
|
|
|
Volume |
|
Volume |
|
Difference |
|
Price |
|
due to Production |
|||||
|
Oil (MBbl) |
|
|
7,165 |
|
|
6,080 |
|
|
1,085 |
|
$ |
88.64 |
|
$ |
96,176 |
|
Natural gas liquids (MBbl) |
|
|
5,754 |
|
|
2,590 |
|
|
3,164 |
|
$ |
25.86 |
|
$ |
81,834 |
|
Natural gas (MMcf) |
|
|
37,594 |
|
|
14,828 |
|
|
22,766 |
|
$ |
4.06 |
|
$ |
92,412 |
|
Total oil equivalent (MBoe) |
|
|
19,184 |
|
|
11,141 |
|
|
8,043 |
|
$ |
59.79 |
|
$ |
270,422 |
|
|
|
|
|
|
|
|
|
|
|
|
|
|
|
|
|
|
|
|
2015 |
|
2014 |
|
|
|
|
2015 |
|
Revenue |
||||
|
|
|
Average Sales |
|
Average Sales |
|
Average Sales |
|
Production |
|
Increase/(Decrease) |
|||||
|
|
|
Price |
|
Price |
|
Price Difference |
|
Volume |
|
due to Price |
|||||
|
Oil (MBbl) |
|
$ |
42.98 |
|
$ |
88.64 |
|
$ |
(45.66) |
|
|
7,165 |
|
$ |
(327,092) |
|
Natural gas liquids (MBbl) |
|
$ |
11.99 |
|
$ |
25.86 |
|
$ |
(13.87) |
|
|
5,754 |
|
$ |
(79,812) |
|
Natural gas (MMcf) |
|
$ |
2.63 |
|
$ |
4.06 |
|
$ |
(1.43) |
|
|
37,594 |
|
$ |
(53,803) |
|
Total oil equivalent (MBoe) |
|
$ |
24.80 |
|
$ |
59.79 |
|
$ |
(34.99) |
|
|
19,184 |
|
$ |
(460,707) |
Additionally, a 10% increase or decrease in our average realized sales prices, excluding the impact of derivatives, would have increased or decreased our revenues for the year ended December 31, 2015 by $47.6 million.
Operating Costs and Expenses
The table below presents a detail of operating costs and expenses for the periods indicated (in thousands except percentages):
|
|
|
|
|
|
|
|
|
|
|
|
Increase (Decrease) |
|
|
|||||||||
|
|
|
|
|
|
|
|
|
|
|
|
|
|
|
|
|
|
|
|
|
|
|
|
|
|
|
Year Ended December 31, |
|
2016 vs 2015 |
|
|
2015 vs 2014 |
|
|
|||||||||||||
|
|
|
2016 |
|
2015 |
|
2014 |
|
$ |
|
% |
|
|
$ |
|
% |
|
|
|||||
|
OPERATING COSTS AND EXPENSES: |
|
|
|
|
|
|
|
|
|
|
|
|
|
|
|
|
|
|
|
|
|
|
|
Oil and natural gas production expenses |
|
$ |
164,567 |
|
$ |
156,528 |
|
$ |
93,581 |
|
$ |
8,039 |
|
5 |
% |
|
$ |
62,947 |
|
67 |
% |
|
|
Production and ad valorem taxes |
|
|
19,633 |
|
|
26,870 |
|
|
37,787 |
|
|
(7,237) |
|
(27) |
% |
|
|
(10,917) |
|
(29) |
% |
|
|
Depreciation, depletion, amortization and accretion |
|
|
159,760 |
|
|
344,572 |
|
|
338,097 |
|
|
(184,812) |
|
(54) |
% |
|
|
6,475 |
|
2 |
% |
|
|
Impairment of oil and natural gas properties |
|
|
169,046 |
|
|
1,365,000 |
|
|
213,821 |
|
|
(1,195,954) |
|
(88) |
% |
|
|
1,151,179 |
|
* |
|
|
|
General and administrative (1) |
|
|
110,081 |
|
|
74,160 |
|
|
63,692 |
|
|
35,921 |
|
48 |
% |
|
|
10,468 |
|
16 |
% |
|
|
Total operating costs and expenses |
|
|
623,087 |
|
|
1,967,130 |
|
|
746,978 |
|
|
(1,344,043) |
|
(68) |
% |
|
|
1,220,152 |
|
163 |
% |
|
|
|
|
|
|
|
|
|
|
|
|
|
|
|
|
|
|
|
|
|
|
|
|
|
|
Interest income and other income (expense) |
|
|
990 |
|
|
(2,163) |
|
|
289 |
|
|
3,153 |
|
* |
|
|
|
(2,452) |
|
* |
|
|
|
Interest expense |
|
|
(126,973) |
|
|
(126,399) |
|
|
(89,800) |
|
|
574 |
|
(0) |
% |
|
|
36,599 |
|
(41) |
% |
|
|
Net gains (losses) on commodity derivatives |
|
|
(53,149) |
|
|
172,886 |
|
|
137,205 |
|
|
(226,035) |
|
(131) |
% |
|
|
35,681 |
|
26 |
% |
|
|
Income tax benefit (expense) |
|
|
(1,825) |
|
|
(7,600) |
|
|
11,429 |
|
|
5,775 |
|
(76) |
% |
|
|
(19,029) |
|
* |
% |
|
*Not meaningful.
|
(1) |
Includes stock-based compensation expense of $37.1 million, $14.8 million and $12.8 million for the years ended December 31, 2016, 2015 and 2014, respectively, and includes acquisition and divestiture costs of $8.1 million, $3.8 million and $1.8 million for the years ended December 31, 2016, 2015 and 2014, respectively. |
68
Oil and Natural Gas Production Expenses. Oil and natural gas production expenses are the costs incurred to produce our oil and natural gas, as well as the daily costs incurred to maintain our producing properties. Such costs also include field personnel costs, utilities, chemical additives, salt water disposal, maintenance, repairs and occasional well workover expenses related to our oil and natural gas properties. Our oil and natural gas production expenses increased 5% to $164.6 million for the year ended December 31, 2016, as compared to $156.5 million for the same period in 2015 and $93.6 million for the same period in 2014. The increase in oil and natural gas production expenses from 2014 to 2016 is directly attributable to our increased production activities in the Eagle Ford Shale, as a result of increased drilling in our Catarina acreage, acquired in 2014. In addition, there was an increase in gathering and transportation costs primarily related to the Gathering Agreement with SPP that began in October 2015. Our average production expenses increased from $8.16 per Boe during the year ended December 31, 2015 to $8.43 per Boe for the year ended December 31, 2016. This increase was due primarily to the increase in gathering and transportation costs, which had an increased from $3.93 per Boe for the year ended December 31, 2015 to $6.29 per Boe for the year ended December 31, 2016. While we expect our oil and natural gas production expenses to increase as we add producing wells, we expect to continue our efficient operation of our properties, and do not expect significant increases in our average production expenses per Boe.
Production and Ad Valorem Taxes. Production taxes are paid on produced oil and natural gas based upon a percentage of gross revenues or at fixed rates established by state or local taxing authorities. Ad valorem taxes are paid based upon the appraised fair market value of producing properties using an estimated discounted cash flow approach by a fixed rate established by state or local taxing authorities. Our production and ad valorem taxes totaled $19.6 million, $26.9 million and $37.8 million for the years ended December 31, 2016, 2015 and 2014, respectively. The tax decrease from 2015 to 2016 is attributable to the decrease in revenues of 9% between the periods and the decrease in appraised property values from the sustained decline in commodity prices and decrease in drilling activity during the current period. This tax decrease from 2014 to 2015 was attributable to the decrease in revenues of 29% between the periods and the decrease in appraised property values due to the decline in commodity prices between the periods. Our average production and ad valorem taxes decreased from $1.40 per Boe during the year ended December 31, 2015 to $1.01 per Boe for the year ended December 31, 2016. This decrease in rate is attributable to the decrease in expense by 27% from 2015 to 2016 coupled with the increase in production volumes by 2% from 2015 to 2016. In addition, the majority of our horizontal wells are characterized as tight gas wells, which apply a reduced production tax rate after certification from the state regulatory body. Until the Company receives the proper certification, the normal production tax rates are applied to the wells, and once the certification is approved, the reduced rates are applied and tax credits are received from the state. The timing of receipt of the certifications and tax credits vary from well to well.
Depreciation, Depletion, Amortization, and Accretion. Depletion, depreciation, amortization, and accretion (“DD&A”) reflects the systematic expensing of the capitalized costs incurred in the acquisition, exploration and development of oil and natural gas properties. We use the full‑cost method of accounting and accordingly, we capitalize all costs associated with the acquisition, exploration and development of oil and natural gas properties, including unproved and unevaluated property costs. Internal costs are capitalized only to the extent they are directly related to acquisition, exploration and development activities and do not include any costs related to production, selling or general corporate administrative activities. Capitalized costs of oil and natural gas properties are amortized using the units of production method based upon production and estimates of proved oil and natural gas reserve quantities. Unproved and unevaluated property costs are excluded from the amortizable base used to determine DD&A expense.
Our DD&A expense for the year ended December 31, 2016 decreased to $159.8 million ($8.18 per Boe) from $344.6 million ($17.96 per Boe) in 2015 and $338.1 million in 2014 ($30.35 per Boe). The majority of the decrease in DD&A is related to a decrease in the depletion rate, resulting primarily from a decrease in the full-cost pool proved property amortization base as result of approximately $1,748 million of full-cost ceiling impairments recorded over the periods from the fourth quarter 2014 to the third quarter 2016. We did not record a full-cost ceiling impairment during the fourth quarter 2015 or fourth quarter 2016. This was slightly offset by an increase in production between the periods. Higher production in 2016 as compared to 2015 resulted in a $6.2 million increase in depletion expense and the change in depletion rate resulted in an offsetting $191.0 million decrease in depletion expense. Higher production in 2015 as compared to 2014 resulted in a $244.1 million increase in depletion expense and the change in depletion rate resulted in an offsetting $237.6 million decrease in depletion expense.
69
Impairment of Oil and Natural Gas Properties. We utilize the full cost method of accounting to account for our oil and natural gas exploration and development activities. Under this method of accounting, we are required on a quarterly basis to determine whether the book value of our oil and natural gas properties (excluding unevaluated properties) is less than or equal to the “ceiling,” based upon the expected after tax present value (discounted at 10%) of the future net cash flows from our proved reserves. Any excess of the net book value of our oil and natural gas properties over the ceiling must be recognized as a non‑cash impairment expense. We recorded a full cost ceiling test impairment after income taxes of $22.1 million, $87.4 million, and $59.6 million for the three months ended March 31, 2016, June 30, 2016, and September 30, 2016, respectively, and did not record a full cost ceiling impairment during the fourth quarter 2016. We recorded a full cost ceiling test impairment after income taxes of $441.5 million, $468.9 million, and $454.6 million for the three months ended March 31, 2015, June 30, 2015, and September 30, 2015, respectively, and did not record a full-cost ceiling impairment during the fourth quarter 2015. We recorded a full cost ceiling test impairment before income taxes of $213.8 million for the year ended December 31, 2014. The impact of less favorable commodity prices adversely affecting estimated proved reserve volumes and future estimated revenues was the main contributor to the ceiling impairments. Changes in production rates, levels of reserves, future development costs, transfers of unevaluated properties, and other factors will determine our actual ceiling test calculation and impairment analyses in future periods. Based upon known improvements in the current NYMEX forward prices, we believe that there is a reasonable likelihood of an increase in the average 12 month trailing first-day-of-the-month pricing in the first quarter of 2017.
If the simple average of oil and natural gas prices as of the first day of each month for the trailing 12‑month period ended December 31, 2016 had been $2.78 per MMbtu for natural gas, $47.62 per Bbl of oil, and $24.70 per Bbl of NGL, while all other factors remained constant, our ceiling test limitation related to the net book value of our proved oil and natural gas properties would have increased by approximately $389.2 million and our net PUD and total proved reserves would have increased by approximately 4.8 MMBoe and 11.8 MMBoe, respectively. The aforementioned prices were calculated based on a 12‑month simple average, which includes the oil and natural gas prices on the first day of the month for the 11 months ended February 2017 and the February 2017 prices were held constant for the remaining one month. This calculation of the impact of volatile commodity prices is prepared based on the presumption that all other inputs and assumptions are held constant with the exception of oil, natural gas, and NGL prices. Therefore, this calculation strictly isolates the impact of commodity prices on our ceiling test limitation and proved reserves. The impact of price is only a single variable in the estimation of our proved reserves and other factors noted above could have a significant impact on future reserves and the present value of future cash flows. There are numerous uncertainties inherent in the estimation of proved reserves and accounting for oil and natural gas properties in subsequent periods and this pro forma estimate should not be construed as indicative of our development plans or future results.
General and Administrative Expenses. Our G&A expenses, totaled $110.1 million for the year ended December 31, 2016 compared to $74.2 million and $63.7 million for the same periods in 2015 and 2014, respectively. This increase was due primarily to additional costs for added personnel at SOG performing services for the Company and for consulting services and increased fees for legal services during 2016. Our G&A expenses per Boe increased from $3.87 per Boe for the year ended December 31, 2015 to $5.64 per Boe for the year ended December 31, 2016. Our G&A expenses totaled $74.2 million ($3.87 per Boe) for the year ended December 31, 2015 compared to $63.7 million ($5.72 per Boe) for the same period in 2014. This increase was due primarily to additional costs for added personnel at SOG performing services for the Company and for consulting services and increased fees for legal services during 2015.
We recorded stock‑based compensation expense of $37.1 million for the year ended December 31, 2016 as compared to expense of $14.8 million for the year ended December 31, 2015. The increase was due primarily to the increase in awards made during the year and the associated amortization recognized in addition to the increase in the stock price from period to period. We recorded stock‑based compensation expense of $14.8 million and $12.8 million for the year ended December 31, 2015, and 2014, respectively. The increase from 2014 to 2015 was due primarily to the increase in awards made during the year and the associated amortization recognized offset by a decrease in the Company’s stock price from period to period. The Company records stock‑based compensation expense for awards granted to non‑employees at fair value and the unvested awards are revalued each period, impacting the amortization over the remaining life of the awards.
70
We recorded costs associated with the Carnero Gathering Sale, Carnero Processing Sale, Production Asset Transaction, Cotulla Sale, and the pending Comanche Acquisition that are included in G&A of $8.1 million for the year ended December 31, 2016. We recorded costs associated with the Palmetto Disposition and the Western Catarina Midstream Divestiture that are included in G&A of $3.8 million for the year ended December 31, 2015. We recorded costs associated with the Catarina Acquisition of $1.8 million for the year ended December 31, 2014.
Adjusted G&A, excluding stock‑based compensation expense and acquisition and divestiture costs included in G&A, totaled $64.9 million ($3.32 per Boe), $55.5 million ($2.89 per Boe), and $49.0 million ($4.40 per Boe) for the years ended December 31, 2016, 2015 and 2014, respectively.
Interest Expense. For the year ended December 31, 2016, interest expense totaled $127.0 million and included $7.8 million in amortization of debt issuance costs. This is compared to the year ended December 31, 2015, for which interest expense totaled $126.4 million and included $7.5 million in amortization of debt issuance costs. The interest expense incurred during the year ended December 31, 2016 is primarily related to the 7.75% Notes (as defined in “Item 8. Financial Statements and Supplementary Data — Note 5, Long‑Term Debt”) and 6.125% Notes (as defined in “Item 8. Financial Statements and Supplementary Data — Note 5, Long‑Term Debt”).
For the year ended December 31, 2015, interest expense totaled $126.4 million and included $7.5 million in amortization of debt issuance costs. This is compared to the year ended December 31, 2014, for which interest expense totaled $89.8 million and included $9.0 million in amortization of debt issuance costs and write‑offs of previously incurred debt issuance costs in connection with the unused senior unsecured bridge facility obtained as part of the Catarina Acquisition that expired. The interest expense incurred during the year ended December 31, 2015 is primarily related to the 7.75% Notes (as defined in Note 5, “Long‑Term Debt”) and 6.125% Notes (as defined in Note 5, “Long‑Term Debt”).
Commodity Derivative Transactions. We apply mark‑to‑market accounting to our derivative contracts; therefore, the full volatility of the non‑cash change in fair value of our outstanding contracts is reflected in other income and expenses. During the year ended December 31, 2016, we recognized a net loss of $53.1 million on our commodity derivative contracts, which included net gains of $135.6 million associated with the settlements of commodity derivative contracts, offset by mark to market losses of $188.7 million on unsettled commodity derivative contracts. The mark to market losses were a result of the increase in estimated future commodity prices as compared to the derivative settlement prices. The settlement gains realized during the period were primarily the result of decreases in commodity prices from the time the trades were entered until the time of cash settlement for trades that liquidated by their terms during the current period. During the year ended December 31, 2015, we recognized a net gain of $172.9 million on our commodity derivative contracts, which included net gains of $142.5 million associated with the settlements of commodity derivative contracts. During the year ended December 31, 2014, we recognized a net gain of $137.2 million on our commodity derivative contracts, which included net gains of $4.9 million associated with the settlements of commodity derivative contracts.
Income tax expense. For the year ended December 31, 2016, the Company recorded income tax expense of $1.8 million. Our effective tax rate for the year ended December 31, 2016 was (0.7)% as compared to a statutory rate of 35%. The difference between the statutory rate and the Company’s effective tax rate is primarily related to the valuation allowance of approximately $86.6 million recorded during the period. For the year ended December 31, 2015, the Company recorded income tax expense of $7.6 million. Our effective tax rate for the year ended December 31, 2015 was (0.5)% as compared to a statutory rate of 35%. The difference between the statutory rate and the Company’s effective tax rate is related to the valuation allowance of approximately $515 million recorded during the period. We expect our effective tax rate going forward to be approximately 0% as we have recorded a full valuation allowance against our net deferred tax assets.
Liquidity and Capital Resources
As of December 31, 2016, we had approximately $502 million in cash and cash equivalents and a $300 million in borrowing capacity at the aggregate elected commitment amount under the Second Amended and Restated Credit Agreement with a syndicate of 16 participating banks, resulting in availability liquidity of approximately $802 million.
71
The Company recently announced a new 2017 capital spending plan of approximately $425 million to $475 million. The new spending plan was approved in conjunction with the anticipated close of the Comanche Acquisition in March 2017 along with expected improvements in commodity prices during 2017. We may from time to time seek to retire or purchase our outstanding debt as well as our outstanding equity securities, both common stock and preferred stock, through cash purchases and/or exchanges for equity securities and/or debt securities, as applicable, in open market purchases, privately negotiated transactions or otherwise. Such repurchases or exchanges, if any, will depend on prevailing market conditions, our liquidity requirements, contractual restrictions and other factors. The amounts involved may be material.
For a description of current and previous credit agreements along with the indentures covering our Senior Notes refer to “Item 8. Financial Statements and Supplementary Data — Note 5, Long‑Term Debt.”
On February 6, 2017, we closed a firm commitment underwritten public offering of shares of our common stock and received net proceeds of approximately $135.9 million (after deducting underwriting discounts). We intend to use the net proceeds of the offering for general corporate purposes, including working capital.
Under the terms of SN UnSub’s preferred unit financing with GSO, if consummated the preferred units held by GSO in SN UnSub will receive a quarterly dividend of 10.0% per annum on the preferred units, payable in cash or in kind at SN UnSub’s election, provided that to the extent permitted under SN UnSub’s debt arrangements, SN UnSub will be required to pay the quarterly dividend in cash. After the first anniversary of the closing of the Anadarko transactions, to the extent permitted under SN UnSub’s debt arrangements, SN UnSub may apply all available cash to make additional payments towards the Base Return (as defined below) or redeem the preferred units. SN UnSub may not make cash distributions on the SN UnSub common units held by us until the preferred units are redeemed in full, and the preferred units would have priority over the common units, to the extent of the Base Return, upon a liquidation, a change of control or any redemption of the preferred units.
GSO will have the option to request SN UnSub to redeem the preferred units for the greater of (i) a 14.0% internal rate of return and (ii) a 1.50x return on investment (the “Base Return”) following the seventh anniversary of issuance. If the preferred units are not so redeemed, GSO may cause a sale of the assets or equity of SN UnSub, or obtain majority control of SN UnSub’s board of directors.
SN UnSub may at any time redeem the preferred units in whole or in part for cash for the Base Return.
GSO’s approval is required for a number of actions by UnSub (unless the preferred units are redeemed at or prior to such actions), including:
•incurring additional debt or providing guarantees in respect of obligations of other persons;
•amending material debt instruments or the JDA;
•effecting a change of control, liquidation or dissolution;
•selling or acquiring assets or modifying hedging arrangements;
•issuing any additional capital stock;
•filing for bankruptcy; and
•incurring general and administrative costs in excess of $5 million.
In connection with the Comanche Acquisition, on January 12, 2017, SN UnSub, JPMorgan Chase Bank, N.A., Citibank, N.A., and certain of their affiliates entered into a debt commitment letter with respect to the SN UnSub Credit
72
Facility. The new facility is expected to be on substantially the same terms as our existing facility, conformed to current market conditions and non-recourse to our other assets.
Cash Flows
Our cash flows for the years ended December 31, 2016, 2015 and 2014 are as follows (in thousands):
|
|
|
Year Ended December 31, |
|
|||||||
|
|
|
|
|
|
|
|
|
|
|
|
|
|
|
2016 |
|
2015 |
|
2014 |
|
|||
|
Cash Flow Data: |
|
|
|
|
|
|
|
|
|
|
|
Net cash provided by operating activities |
|
$ |
181,251 |
|
$ |
272,025 |
|
$ |
415,335 |
|
|
Net cash used in investing activities |
|
$ |
(108,637) |
|
$ |
(294,331) |
|
$ |
(1,361,264) |
|
|
Net cash provided by (used in) financing activities |
|
$ |
(5,745) |
|
$ |
(16,360) |
|
$ |
1,266,112 |
|
Net Cash Provided by Operating Activities. Net cash provided by operating activities was $181.3 million for the year ended December 31, 2016 compared to $272.0 million and $415.3 million for the same periods in 2015 and 2014, respectively. This decrease was related to the unfavorable impact of lower average commodity prices between the periods, partially offset by higher sales volumes.
One of the primary sources of variability in the Company’s cash flows from operating activities is fluctuations in commodity prices, the impact of which the Company partially mitigates by entering into commodity derivatives. Sales volume changes also impact cash flow. The Company’s cash flows from operating activities are also dependent on the costs related to continued operations and debt service.
Net Cash Used in Investing Activities. Net cash flows used in investing activities totaled $108.6 million for the year ended December 31, 2016 compared to $294.3 million and $1.4 billion for the same periods in 2015 and 2014, respectively. Capital expenditures for leasehold and drilling activities for the year ended December 31, 2016 totaled $313.3 million, primarily associated with bringing online 48 gross wells and expanding our acreage and asset development position in the Eagle Ford Shale through leasing. We spent approximately $36.5 million towards equity method investments prior to selling these investments in the Carnero Gathering Sale and Carnero Processing Sale (further discussed in Note 16, “Investments”) for a combined cash inflow of approximately $92.5 million. In addition, we received cash of approximately $153.5 million for the Cotulla Sale, purchased common units of SPP for $25 million, and invested approximately $5.4 million in other assets.
For the year ended December 31, 2015, we incurred capital expenditures for leasehold and drilling activities of $656.1 million, primarily associated with bringing online 136 gross wells. We received total cash of approximately $427.6 million for the Palmetto Disposition and the Western Catarina Midstream Divestiture, while spending approximately $50.0 million towards equity method investments (further discussed in Note 16, “Investments”) and $8.0 million for the Buyout Agreement (defined in Note 9, “Related Party Transactions” below). In addition, we invested $8.1 million in other assets.
For the year ended December 31, 2014, we incurred capital expenditures for leasehold and drilling activities of $791.3 million, primarily associated with bringing online 121 gross wells. We paid cash of $557.1 million for the oil and natural gas properties acquired in the Catarina Acquisition. We received cash of $0.7 million and $0.5 million as final settlement for the oil and natural gas properties acquired in the Cotulla and Wycross Acquisitions, respectively. In addition, we invested $14.1 million in other property and equipment.
Net Cash Provided by (Used in) Financing Activities. Net cash flows used in financing activities totaled $5.7 million for the year ended December 31, 2016 compared to $16.4 million net cash flows used in financing activities and $1.3 billion in cash provided by financing activities for the same period in 2015 and 2014, respectively.
During the year ended December 31, 2016, we made payments of $4.0 million for dividends on our Series A Preferred Stock and Series B Preferred Stock, and payments of approximately $1.7 million for deferred financing costs associated with the Sixth Amendment to the Second Amended and Restated Credit Agreement.
73
During the year ended December 31, 2015, we made payments of $16.0 million for dividends on our Series A Convertible Perpetual Preferred Stock and Series B Convertible Perpetual Preferred Stock.
During the year ended December 31, 2014, we received net proceeds from the issuance of common stock of $167.5 million, after deducting offering costs payable by us of $8.7 million. We also made payments of $16.3 million for dividends on our Series A Preferred Stock and Series B Preferred Stock. We received net proceeds of approximately $1.12 billion from the issuance of our 6.125% Notes, consisting of a face value of $1.15 billion, including the Additional 6.125% Notes which were issued at a premium to face value of $2.3 million, less debt issuance costs of $27.4 million. Other debt issuance costs for the year ended December 31, 2016 totaled $10.0 million. On May 12, 2014, the Company borrowed $100 million under the Amended and Restated Credit Agreement. The Company used proceeds from the issuance of the Original 6.125% Notes to repay the $100 million outstanding under the Amended and Restated Credit Agreement, in addition to funding a portion of the purchase price of the Catarina Acquisition.
Commitments and Contractual Obligations
Refer to “Item 8. Financial Statements and Supplementary Data — Note 14, Commitments and Contingencies” for a description of lawsuits pending against the Company.
During the year ended December 31, 2015, the Company entered into the Gathering Agreement with SPP as part of the Western Catarina Midstream Divestiture (defined below in “Item 8. Financial Statements and Supplementary Data — Note 3, Acquisitions and Divestitures”) that provides a firm commitment of oil and natural gas volumes at a fixed gathering fee. The Gathering Agreement represents an operating lease of the Catarina midstream assets. The firm commitment term under the Gathering Agreement commenced on October 14, 2015 and continues until October 13, 2020. As of December 31, 2016, our contractual obligations included our Senior Notes, interest expense on our Senior Notes, asset retirement obligations, rent expense for our corporate offices, lease of the Catarina midstream assets and other long term lease payments. The following table summarizes our contractual obligations as of December 31, 2016 (in thousands):
|
|
|
Less than 1 |
|
|
|
|
|
|
|
More than |
|
|
|
|
||
|
|
|
year |
|
1 - 3 years |
|
3 - 5 years |
|
5 years |
|
Total |
|
|||||
|
Senior Notes |
|
$ |
— |
|
$ |
— |
|
$ |
600,000 |
|
$ |
1,150,000 |
|
$ |
1,750,000 |
|
|
Interest expense (1) |
|
|
116,938 |
|
|
233,875 |
|
|
210,625 |
|
|
105,655 |
|
|
667,093 |
|
|
Asset retirement obligations (2) |
|
|
— |
|
|
— |
|
|
— |
|
|
25,087 |
|
|
25,087 |
|
|
Office rent (3) |
|
|
5,213 |
|
|
10,680 |
|
|
11,038 |
|
|
18,741 |
|
|
45,672 |
|
|
Midstream assets lease (4) |
|
|
41,928 |
|
|
83,857 |
|
|
32,854 |
|
|
— |
|
|
158,639 |
|
|
Other leases (5) |
|
|
1,791 |
|
|
3,583 |
|
|
3,584 |
|
|
3,131 |
|
|
12,089 |
|
|
Total |
|
$ |
165,870 |
|
$ |
331,995 |
|
$ |
858,101 |
|
$ |
1,302,614 |
|
$ |
2,658,580 |
|
|
(1) |
Represents estimated interest payments that will be due under the $600 million 7.75% Notes and $1,150 million 6.125% Notes that will mature on June 15, 2021 and January 15, 2023, respectively. |
|
(2) |
Amounts represent the present value of our estimate of future asset retirement obligations. Because these costs typically extend many years into the future, estimating these future costs requires management to make estimates and judgments that are subject to future revisions based upon numerous factors, including the rate of inflation, changing technology and the political and regulatory environment. See “Item 8. Financial Statements and Supplementary Data — Note 12, Asset Retirement Obligations.” |
|
(3) |
Represents payments due for leasing corporate office space in Houston, Texas. The lease began on November 1, 2014 and continues until March 31, 2025. |
|
(4) |
Represents payments due with respect to firm commitment oil and natural gas volumes under the Gathering Agreement contract signed with SPP as part of the Western Catarina Midstream Divestiture. As part of this sale, the |
74
Gathering Agreement represents an operating lease of the Catarina midstream assets. The firm commitment term under the Gathering Agreement commenced on October 14, 2015 and continues until October 13, 2020. |
|
(5) |
Represents payments due for a ground lease agreement for land owned by the Calhoun Port Authority which commenced on August 25, 2014 and continues until August 25, 2024. Also represents payments due for an acreage lease agreement for a promotional ranch managed by the Company in Kenedy County, Texas which commenced on March 1, 2014 and continues until February 28, 2024. |
In connection with the Catarina Acquisition, the 77,000 acres of undeveloped acreage that were included in the acquisition are subject to a continuous drilling obligation. Such drilling obligation requires us to drill (i) 50 wells in each annual period commencing on July 1, 2014 and (ii) at least one well in any consecutive 120‑day period in order to maintain rights to any future undeveloped acreage. Up to 30 wells drilled in excess of the minimum 50 wells in a given annual period can be carried over to satisfy part of the 50 well requirement in the subsequent annual period on a well for well basis. The lease also created a customary security interest in the production therefrom in order to secure royalty payments to the lessor and other lease obligations. Our current capital budget and plans include the drilling of at least the minimum number of wells required to maintain access to such undeveloped acreage.
The lease agreement for the acreage in Kenedy County, Texas includes a contractual requirement for the Company to spend a minimum of $4 million to make permanent improvements over the ten year life of the lease. The lease agreement does not specify the timing for such improvements to be made within the lease term. The Company has the right to terminate the lease obligation without penalty at any time with nine months advanced written notice and payment of any accrued leasehold expenses.
The Company’s ground lease with the Calhoun Port Authority is terminable upon 180 days written notice by the Company to the lessor in addition to a $1 million termination payment.
Off‑Balance Sheet Arrangements
As of December 31, 2016, we did not have any off‑balance sheet arrangements.
Critical Accounting Policies and Estimates
Our discussion and analysis of our financial condition and results of operations are based upon consolidated financial statements that have been prepared in accordance with U.S. GAAP. The preparation of these consolidated financial statements requires us to make estimates and judgments that affect the reported amounts of assets, liabilities, revenues and expenses. Our significant accounting policies are described in “Item 8. Financial Statements and Supplementary Data — Note 2, Basis of Presentation and Summary of Significant Accounting Policies.” When we prepare our financial statements, we review our estimates, including those related to oil, NGL and natural gas revenues, oil and natural gas properties, oil, NGL and natural gas reserves, fair value of derivative instruments, abandonment liabilities, income taxes, commitments and contingencies, depreciation, depletion and amortization, and full cost ceiling calculation. Our estimates are based on historical experience and various assumptions that we believe to be reasonable under the circumstances. Actual results may differ from these estimates under different assumptions or conditions. We believe the following critical accounting policies affect our more significant judgments and estimates used in the preparation of our consolidated financial statements.
Oil and Natural Gas Properties
The Company’s oil and natural gas properties are accounted for using the full cost method of accounting. All direct costs and certain indirect costs associated with the acquisition, exploration and development of oil and natural gas properties are capitalized. Once evaluated, these costs, as well as the estimated costs to retire the assets, are included in the amortization base and amortized to depletion expense using the units‑of‑production method. Depletion is calculated based on estimated proved oil and natural gas reserves. Proceeds from the sale or disposition of oil and natural gas properties are applied to reduce net capitalized costs unless the sale or disposition causes a significant change in the relationship between costs and the estimated quantities of proved reserves.
75
Full Cost Ceiling Test—Capitalized costs (net of accumulated depreciation, depletion and amortization and deferred income taxes) of proved oil and natural gas properties are subject to a full cost ceiling limitation. The ceiling limits these costs to an amount equal to the present value, discounted at 10%, of estimated future net cash flows from estimated proved reserves less estimated future operating and development costs, abandonment costs (net of salvage value) and estimated related future income taxes. In accordance with SEC rules, the oil and natural gas prices used to calculate the full cost ceiling are the 12‑month average prices, calculated as the unweighted arithmetic average of the first‑day‑of‑the‑month price for each month within the 12‑month period prior to the end of the reporting period, unless prices are defined by contractual arrangements. Prices are adjusted for “basis” or location differentials. Prices are held constant over the life of the reserves. If unamortized costs capitalized within the cost pool exceed the ceiling, the excess is charged to expense and separately disclosed during the period in which the excess occurs. Amounts thus required to be written off are not reinstated for any subsequent increase in the cost center ceiling. During the year ended December 31, 2016, the Company recorded a full cost ceiling test impairment after income taxes of $169.0 million. During the year ended December 31, 2015, the Company recorded a full cost ceiling test impairment after income taxes of $1,365 million. During the year ended December 31, 2014, the Company recorded a full cost ceiling test impairment before income taxes of $213.8 million.
Depreciation, depletion, amortization and accretion—DD&A is provided using the units‑of‑production method based upon estimates of proved oil, NGL and natural gas reserves with oil, NGL and natural gas production being converted to a common unit of measure based upon their relative energy content. All capitalized costs of oil and natural gas properties, including the estimated future costs to develop proved reserves, are amortized using the units‑of‑production method based on total proved reserves. Investments in unproved properties and major development projects are not amortized until proved reserves associated with the projects can be determined or until impairment occurs. If the results of an assessment indicate that the properties are impaired, the amount of the impairment is added to the capitalized costs to be amortized. Once the assessment of unproved properties is complete and when major development projects are evaluated, the costs previously excluded from amortization are transferred to the full cost pool and amortization begins. The amortizable base includes estimated future development costs and where significant, dismantlement, restoration and abandonment costs, net of estimated salvage value.
In arriving at depletion rates under the units‑of‑production method, the quantities of recoverable oil and natural gas reserves are established based on estimates made by internal and third party geologists and engineers, which require significant judgment as does the projection of future production volumes and levels of future costs, including future development costs. In addition, considerable judgment is necessary in determining when unproved properties become impaired and in determining the existence of proved reserves once a well has been drilled. All of these judgments may have significant impact on the calculation of depletion and impairment expense. At December 31, 2016, a 10% positive revision to proved reserves would decrease the depletion rate by approximately $0.67 per Boe and a 10% negative revision to proved reserves would increase the depletion rate by approximately $0.81 per Boe. Further, a 10% increase or decrease in estimated future development costs would increase or decrease the depletion rate by approximately $0.32 per Boe at December 31, 2016.
Unproved Properties—Costs associated with unproved properties and properties under development are excluded from the full cost amortization base until the properties have been evaluated. Additionally, the costs associated with seismic data, leasehold acreage, and wells currently drilling are also initially excluded from the amortization base. Unproved properties are identified on a project basis, with a project being an area in which significant leasehold interests are acquired within a contiguous area. Unproved properties are reviewed periodically by management and transferred into the full cost pool subject to amortization when management determines that a project area has been evaluated through drilling operations or thorough geologic evaluation, or through determination that the unproved leases will no longer be drilled upon prior to the lease expiration.
Oil and Natural Gas Reserves
The Company’s most significant estimates relate to its proved oil, NGL and natural gas reserves. The estimates of oil, NGL and natural gas reserves as of December 31, 2016, 2015 and 2014 are based on reports prepared by a third party engineering firm, Ryder Scott.
76
Estimates of proved reserves are based on the quantities of oil and natural gas that engineering and geological analyses demonstrate, with reasonable certainty, to be recoverable from established reservoirs in the future under current operating and economic parameters. Ryder Scott has historically prepared a reserve and economic evaluation of the Company’s properties, utilizing information provided to it by management and other information available, including information from the operators of the property.
The standards of the FASB and rules of the SEC permit the use of new technologies to determine proved reserve estimates if those technologies have been demonstrated empirically to lead to reliable conclusions about reserve volume estimates. These rules allow, but do not require, companies to disclose their probable and possible reserves to investors in documents filed with the SEC.
In addition, the disclosure guidelines require companies to report oil and natural gas reserves using an average price based upon the prior 12‑month first‑day‑of‑the‑month price rather than a period‑end price.
Reserves and their relation to estimated future net cash flows impact the depletion and impairment calculations. As a result, adjustments to depletion and impairment are made concurrently with changes to reserve estimates. The reserve estimates and the projected cash flows derived from these reserve estimates are prepared in accordance with SEC guidelines. The independent engineering firm noted above adheres to these guidelines when preparing their reserve reports. The accuracy of the reserve estimates is a function of many factors including the quality and quantity of available data, the interpretation of that data, the accuracy of various mandated economic assumptions, and the judgments of the individuals preparing the estimates, all of which could deviate significantly from actual results. As such, reserve estimates may materially vary from the ultimate quantities of oil and natural gas eventually recovered. Additionally, with other factors held constant, if the commodity prices used in our reserve report as of December 31, 2016 had decreased by 10%, then the standardized measure of our estimated proved reserves as of that date would have decreased by approximately $216.7 million, from approximately $513.4 million to approximately $296.7 million.
Asset Retirement Obligations
Asset retirement obligations represent the present value of the estimated cash flows expected to be incurred to plug, abandon and remediate producing properties, excluding salvage values, at the end of their productive lives in accordance with applicable laws. The significant unobservable inputs to this fair value measurement include estimates of plugging, abandonment and remediation costs, well life, inflation and credit‑adjusted risk free rate. The inputs are calculated based on historical data as well as current estimates. When the liability is initially recorded, the carrying amount of the related long‑lived asset is increased. Over time, accretion of the liability is recognized each period, and the capitalized cost is amortized over the useful life of the related asset. Upon settlement of the liability, any gain or loss is treated as an adjustment to the full cost pool.
Income Taxes
The Company accounts for income taxes using the asset and liability method. Deferred tax assets and liabilities arise from the expected future tax consequences of temporary differences between the book carrying amounts and the tax basis of assets and liabilities. Deferred tax assets and liabilities are measured using enacted tax rates expected to apply to taxable income in the years in which those temporary difference and carryforwards are expected to be recovered or settled. The effect on deferred tax assets and liabilities of a change in tax rates is recognized in income in the period that includes the enactment date. Valuation allowances are established when necessary to reduce the deferred tax asset to the amount more likely than not to be recovered.
Additionally, the Company is required to determine whether it is more likely than not (a likelihood of more than 50%) that a tax position will be sustained upon examination, including resolution of any related appeals or litigation processes, based on the technical merits of the position in order to record any financial statement benefit. If that step is satisfied, then the Company must measure the tax position to determine the amount of benefit to recognize in the financial statements. The tax position is measured at the largest amount of benefit that has greater than a 50% likelihood
77
of being realized upon ultimate settlement. Any interest or penalties would be recognized as a component of income tax expense.
The Company applies significant judgment in evaluating its tax positions and estimating its provision for income taxes. During the ordinary course of business, there are many transactions and calculations for which the ultimate tax determination is uncertain. The actual outcome of these future tax consequences could differ significantly from these estimates, which could impact the Company’s financial position, results of operations and cash flows. The Company does not have any material uncertain tax positions during the years ended December 31, 2016, 2015 or 2014.
Stock‑Based Compensation
The Company records stock‑based compensation expense for awards granted to its directors (for their services as directors) in accordance with the provisions of ASC 718, “Compensation—Stock Compensation.” Stock‑based compensation expense for these awards is based on the grant‑date fair value and recognized over the vesting period using the straight‑line method.
Awards granted to employees of the Sanchez Group (including those employees of the Sanchez Group who also serve as the Company’s officers) and consultants in exchange for services are considered awards to non‑employees and the Company records stock‑based compensation expense for these awards at fair value in accordance with the provisions of ASC 505‑50, “Equity‑Based Payments to Non‑Employees.” For awards granted to non‑employees, the Company records compensation expense equal to the fair value of the stock‑based award at the measurement date, which is determined to be the earlier of the performance commitment date or the service completion date. Compensation expense for unvested awards to non‑employees is revalued at each period end and is amortized over the vesting period of the stock‑based award. Stock‑based payments are measured based on the fair value of the equity instruments granted, as it is more determinable than the value of the services rendered.
For the restricted stock awards and phantom stock awards granted to non‑employees, stock‑based compensation expense is based on fair value re‑measured at each reporting period and recognized over the vesting period using the straight‑line method. Compensation expense for these awards will be revalued at each period end until vested.
Revenue Recognition
Oil, NGL and natural gas sales are recognized when production is sold to a purchaser at a fixed or determinable price, delivery has occurred, title has transferred, and collectability of the revenue is probable. Delivery occurs and title is transferred when production has been delivered to a pipeline, railcar or truck, or a tanker lifting has occurred. The sales method of accounting is used for oil, NGL and natural gas sales such that revenues are recognized based on our share of actual proceeds from the oil, NGLs and natural gas sold to purchasers. Oil and natural gas imbalances are generated on properties for which two or more owners have the right to take production “in‑kind” and, in doing so, take more or less than their respective entitled percentage.
Derivative Instruments
At times we may utilize derivative instruments to manage our exposure to fluctuations in the underlying commodity prices for the products sold by us. The carrying amount of derivative assets and liabilities is reported on the balance sheet at the estimated fair value of the derivative instruments. Our management sets and implements all of our hedging policies, including volumes, types of instruments and counterparties, on a monthly basis. These derivative transactions are not designated as cash flow hedges. Accordingly, these derivative contracts are marked‑to‑market and any changes in the estimated value of derivative contracts held at the balance sheet date are recognized in the statement of operations as net gains (losses) on commodity derivatives.
Item 7A. Quantitative and Qualitative Disclosures about Market Risk
We are exposed to market risk, including the effects of adverse changes in commodity prices and, potentially, interest rates as described below.
78
The primary objective of the following information is to provide quantitative and qualitative information about our potential exposure to market risks. The term “market risk” refers to the risk of loss arising from adverse changes in oil, NGLs and natural gas prices and interest rates. The disclosures are not meant to be precise indicators of expected future losses, but rather indicators of reasonably possible losses. All of our market risk sensitive instruments were entered into for purposes other than speculative trading.
Commodity Price Risk
Our major market risk exposure is in the pricing that we receive for our oil, NGL and natural gas production. Realized pricing is primarily driven by the prevailing market prices applicable to our oil, NGL and natural gas production. Pricing for oil, NGL and natural gas has been volatile and unpredictable for several years, and this volatility is expected to continue in the future. The prices we receive for our oil, NGL and natural gas production depend on many factors outside of our control, such as the strength of the global economy.
To reduce the impact of fluctuations in oil and natural gas prices on the Company’s revenues, or to protect the economics of property acquisitions, the Company periodically enters into derivative contracts with respect to a portion of its projected oil and natural gas production through various transactions that fix or, through options, modify the future prices to be realized. These transactions may include price swaps whereby the Company will receive a fixed price for its production and pay a variable market price to the contract counterparty. Additionally, the Company may enter into collars, whereby it receives the excess, if any, of the fixed floor over the floating rate or pays the excess, if any, of the floating rate over the fixed ceiling price. In addition, the Company enters into option transactions, such as puts or put spreads, as a way to manage its exposure to fluctuating prices. These hedging activities are intended to support oil and natural gas prices at targeted levels and to manage exposure to oil and natural gas price fluctuations. It is never the Company’s intention to enter into derivative contracts for speculative trading purposes. Please refer to “Item 8. Financial Statements and Supplementary Data — Note 10, Derivative Instruments” for a description of all of our derivatives covering anticipated future production as of December 31, 2016. In connection with the pending Comanche Acquisition, we expect to hedge a portion of projected future production attributable to the pending Comanche Acquisition, using hedge transactions that are consistent with the Company’s current hedging strategy.
At December 31, 2016, the fair value of our commodity derivative contracts was a net liability of approximately $37.1 million (inclusive of approximately $2.1 million liability for premiums incurred but not paid). We have commodity derivative contracts in place covering approximately 35% of the mid‑point of our total estimated oil production and approximately 99% of the mid-point of our total estimated natural gas production for 2017. A 10% increase in the oil and natural gas index prices above the December 31, 2016 prices would result in a decrease in the fair value of our commodity derivative contracts of $110.8 million; conversely, a 10% decrease in the oil and natural gas index prices would result in an increase of $108.5 million.
Interest Rate Risk
As of December 31, 2016, no amounts were outstanding under our Second Amended and Restated Credit Agreement. Our 7.75% Notes bear a fixed interest rate of 7.75% with an expected maturity date of June 15, 2021, and we had $600 million outstanding as of December 31, 2016. Our 6.125% Notes bear a fixed interest rate of 6.125% with an expected maturity date of January 15, 2023, and we had $1.15 billion outstanding as of December 31, 2016. We currently do not have any interest rate derivative contracts in place. If we incur significant debt with a risk of fluctuating interest rates in the future, we may enter into interest rate derivative contracts on a portion of our then outstanding debt to mitigate the risk of fluctuating interest rates.
Item 8. Financial Statements and Supplementary Data
The information required by this Item is included in this report as set forth in the “Index to Consolidated Financial Statements” beginning on page F‑1 of this Annual Report on Form 10-K and is incorporated by reference herein.
79
Item 9. Changes in and Disagreements with Accountants on Accounting and Financial Disclosure
On June 19, 2015, the Company (i) dismissed BDO USA, LLP (“BDO”) as the Company’s independent registered public accounting firm and (ii) appointed KPMG LLP (“KPMG”), effective immediately, to serve as the Company’s new independent registered public accounting firm to audit the Company’s financial statements as of and for the fiscal year ending December 31, 2015. The Audit Committee of the Company pursuant to its charter exercised its sole authority to approve BDO’s dismissal and KPMG’s appointment as the Company’s independent registered public accounting firm.
The report of BDO on the financial statements of the Company as of and for the fiscal year ended December 31, 2014 did not contain any adverse opinion or disclaimer of opinion, and was not qualified or modified as to uncertainty, audit scope or accounting principles. During the Company’s fiscal year ended December 31, 2014, and the interim period through June 19, 2015, (i) the Company had no disagreements with BDO on any matter of accounting principles or practices, financial statement disclosure or auditing scope or procedure, which disagreements, if not resolved to BDO’s satisfaction, would have caused BDO to make reference to the subject matter of such disagreements in its reports on the financial statements of the Company for such years and (ii) there were no reportable events of the type described in Item 304(a)(1)(v) of Regulation S-K under the Securities Exchange Act of 1934, as amended, except the following material weakness:
|
1. |
In connection with the performance of its audit of the Company’s financial statements for the year ended December 31, 2014, BDO reported that our internal control over financial reporting was not effective as of December 31, 2014 as a result of the identification of one material weakness related to an over-estimation of future development costs in the year-end reserve report. This material weakness was disclosed in the Company’s Annual Report on Form 10-K for the fiscal year ended December 31, 2014. |
The Company provided BDO with a copy of the foregoing disclosure and requested that BDO furnish the Company with a letter addressed to the SEC stating whether or not BDO agreed with the statements above concerning BDO. In a letter attached to the Current Report on Form 8-K filed on June 23, 2015, BDO stated that it agreed with the aforementioned disclosure.
Item 9A. Controls and Procedures
Conclusion Regarding the Effectiveness of Disclosure Controls and Procedures
Evaluation of Disclosure Controls and Procedures
As required by Rule 13a-15(b) of the Exchange Act, we have evaluated, under the supervision and with the participation of our management, including our principal executive officer and principal financial officer, the effectiveness of the design and operation of our disclosure controls and procedures (as defined in Rules 13a-15(e) and 15d-15(e) under the Exchange Act) as of the end of the period covered by this report. Our disclosure controls and procedures are designed to provide reasonable assurance that the information required to be disclosed by us in reports that we file or submit under the Exchange Act is accumulated and communicated to our management, including our principal executive officer and principal financial officer, as appropriate, to allow timely decisions regarding required disclosure and is recorded, processed, summarized and reported within the time periods specified in the rules and forms of the SEC. Based upon the evaluation, our principal executive officer and principal financial officer have concluded that our disclosure controls and procedures were effective at December 31, 2016 at the reasonable assurance level.
Management’s Annual Report on Internal Control Over Financial Reporting and Attestation Report of the Registered Public Accounting Firm
Our management is responsible for establishing and maintaining adequate internal control over financial reporting (as defined in Rules 13a‑15(f) and 15d‑15(f) promulgated under the Exchange Act). Even an effective system of internal control over financial reporting, no matter how well designed, has inherent limitations, including the
80
possibility of human error, circumvention of controls or overriding of controls and, therefore, can provide only reasonable assurance with respect to reliable financial reporting. Furthermore, the effectiveness of a system of internal control over financial reporting in future periods can change as conditions change. A material weakness is a deficiency, or a combination of deficiencies, in internal control over financial reporting such that there is a reasonable possibility that a material misstatement of the annual or interim financial statements will not be prevented or detected on a timely basis.
Our management assessed the effectiveness of our internal control over financial reporting as of December 31, 2016. In making this assessment, it used the criteria set forth by the Committee of Sponsoring Organizations of the Treadway Commission (COSO) in Internal Control—Integrated Framework (2013). Based on this assessment and such criteria, our management concluded that our internal control over financial reporting was effective as of December 31, 2016.
KPMG, an independent registered public accounting firm, has issued its report on the effectiveness of the Company’s internal control over financial reporting at December 31, 2016. The report from KPMG is included in this Item 8 under the heading “Report of Independent Registered Public Accounting Firm.”
Report of Independent Registered Public Accounting Firm
Please see Report of Independent Public Accounting Firm under “Item 8. Financial Statements and Supplementary Data” of this Annual Report on Form 10-K.
Changes in Internal Control Over Financial Reporting
There has been no change in our internal control over financial reporting during the three months ended December 31, 2016 that has materially affected, or is reasonably likely to materially affect, our internal control over financial reporting.
None.
81
Item 10. Directors, Executive Officers and Corporate Governance
Information regarding our directors, executive officers and certain corporate governance items will be included in an amendment to this Form 10‑K or in the proxy statement for the 2017 annual meeting of stockholders, in either case, to be filed within 120 days after December 31, 2016, and is incorporated by reference to this report.
Item 11. Executive Compensation
Information regarding executive compensation will be included in an amendment to this Form 10‑K or in the proxy statement for the 2017 annual meeting of stockholders and is incorporated by reference to this report.
Item 12. Security Ownership of Certain Beneficial Owners and Management and Related Stockholder Matters
Information regarding beneficial ownership and management and related stockholder matters will be included in an amendment to this Form 10‑K or in the proxy statement for the 2017 annual meeting of stockholders and is incorporated by reference to this report.
Item 13. Certain Relationships and Related Transactions, and Director Independence
Information regarding certain relationships and related transactions and director independence will be included in an amendment to this Form 10‑K or in the proxy statement for the 2017 annual meeting of stockholders and is incorporated by reference to this report.
Item 14. Principal Accountant Fees and Services
Information regarding principal accounting fees and services will be included in an amendment to this Form 10‑K or in the proxy statement for the 2017 annual meeting of stockholders and is incorporated by reference to this report.
82
GLOSSARY OF SELECTED OIL AND NATURAL GAS TERMS
The following includes a description of the meanings of some of the oil and natural gas industry terms used in this Annual Report on Form 10‑K. The definitions “analogous reservoir,” “development costs,” “development project,” “development well,” “economically producible,” “exploratory well,” “field,” “possible reserves,” “probable reserves,” “production costs,” “proved area,” “reservoir,” “resources,” and “unproved properties” have been excerpted from the applicable definitions contained in Rule 4‑10(a) of Regulation S‑X.
American Petroleum Institute (“API”) gravity: A system of classifying oil based on its specific gravity, whereby the greater the gravity, the lighter the oil.
analogous reservoir: Analogous reservoirs, as used in resource assessments, have similar rock and fluid properties, reservoir conditions (depth, temperature, and pressure) and drive mechanisms, but are typically at a more advanced stage of development than the reservoir of interest and thus may provide concepts to assist in the interpretation of more limited data and estimation of recovery. When used to support proved reserves, analogous reservoir refers to a reservoir that shares all of the following characteristics with the reservoir of interest: (i) the same geological formation (but not necessarily in pressure communication with the reservoir of interest); (ii) the same environment of deposition; (iii) similar geologic structure; and (iv) the same drive mechanism.
basin: A large depression on the earth’s surface in which sediments accumulate.
Bbl: One stock tank barrel, or 42 U.S. gallons liquid volume, used in reference to oil or other liquid hydrocarbons.
Bcf: One billion cubic feet of natural gas.
black oil: A quality of oil with an API gravity of 40° or less and with a gas‑to‑oil ratio of 500 cubic feet per barrel or less.
Boe: One barrel of oil equivalent, calculated by converting natural gas to oil equivalent barrels at a ratio of six Mcf of natural gas to one Boe of oil.
Boe/d: One Boe per day.
btu: One British thermal unit, the quantity of heat required to raise the temperature of a one‑pound mass of water by one degree Fahrenheit.
completion: The process of treating a drilled well followed by the installation of permanent equipment for the production of oil or natural gas, or in the case of a dry hole, the reporting of abandonment to the appropriate agency.
developed acreage: The number of acres that are allocated or assignable to producing wells or wells capable of production.
development costs: Costs incurred to obtain access to proved reserves and to provide facilities for extracting, treating, gathering and storing the oil and natural gas. More specifically, development costs, including depreciation and applicable operating costs of support equipment and facilities and other costs of development activities, are costs incurred to: (i) gain access to and prepare well locations for drilling, including surveying well locations for the purpose of determining specific development drilling sites, clearing ground, draining, road building, and relating public roads, gas lines, and power lines, to the extent necessary in developing the proved reserves; (ii) drill and equip development wells, development‑type stratigraphic test wells, and service wells, including the costs of platforms and of well equipment such as casing, tubing, pumping equipment, and the wellhead assembly; (iii) acquire, construct, and install production facilities such as lease flow lines, separators, treaters, heaters, manifolds, measuring devices, and production storage tanks, natural gas cycling and processing plants, and central utility and waste disposal systems; and (iv) provide improved recovery systems.
83
development project: A development project is the means by which petroleum resources are brought to the status of economically producible. As examples, the development of a single reservoir or field, an incremental development in a producing field or the integrated development of a group of several fields and associated facilities with a common ownership may constitute a development project.
development well: A well drilled within the proved area of an oil or natural gas reservoir to the depth of a stratigraphic horizon known to be productive.
differential: An adjustment to the price of oil or natural gas from an established spot market price to reflect differences in the quality and/or location of oil or natural gas.
dry hole: A well found to be incapable of producing hydrocarbons in sufficient quantities such that proceeds from the sale of such production would exceed production expenses and taxes.
economically producible: The term economically producible, as it relates to a resource, means a resource that generates revenue that exceeds, or is reasonably expected to exceed, the costs of the operation.
exploitation: A development or other project that may target proven or unproven reserves (such as probable or possible reserves), but that generally has a lower risk than that associated with exploration projects.
exploratory well: A well drilled to find a new field or to find a new reservoir in a field previously found to be productive of oil or natural gas in another reservoir.
field: An area consisting of a single reservoir or multiple reservoirs, all grouped on or related to the same individual geological structural feature and/or stratigraphic condition. The field name refers to the surface area, although it may refer to both the surface and the underground productive formations.
gross acres or gross wells: The total acres or wells, as the case may be, in which we have working interest.
horizontal drilling: A drilling technique used in certain formations where a well is drilled vertically to a certain depth and then drilled at a right angle within a specified interval.
independent exploration and production company: A company whose primary line of business is the exploration and production of crude oil and natural gas.
LLS: Louisiana light sweet crude.
MBbl: One thousand Bbl.
MBoe: One thousand Boe.
Mcf: One thousand cubic feet of natural gas.
MMBbl: One million Bbl.
MMBoe: One million Boe.
MMbtu: One million British thermal units.
MMcf: One million cubic feet of natural gas.
net acres or net wells: Gross acres or wells, as the case may be, multiplied by our working interest ownership percentage.
84
net production: Production that is owned by us less royalties and production due others.
net revenue interest: A working interest owner’s gross working interest in production less the royalty, overriding royalty, production payment and net profits interests.
NGLs: The combination of ethane, propane, butane and natural gasolines that when removed from natural gas become liquid under various levels of higher pressure and lower temperature.
NYMEX: New York Mercantile Exchange.
operator: The individual or company responsible for the exploration and/or production of an oil or natural gas well or lease.
possible reserves: Additional reserves that are less certain to be recovered than probable reserves.
probable reserves: Additional reserves that are less certain to be recovered than proved reserves but that, in sum with proved reserves, are as likely as not to be recovered.
production costs: Costs incurred to operate and maintain wells and related equipment and facilities, including depreciation and applicable operating costs of support equipment and facilities and other costs of operating and maintaining those wells and related equipment and facilities.
productive well: A well that produces commercial quantities of hydrocarbons, exclusive of its capacity to produce at a reasonable rate of return.
proved area: The part of a property to which proved reserves have been specifically attributed.
proved developed reserves: Reserves that can be expected to be recovered through existing wells with existing equipment and operating methods.
proved oil and natural gas reserves: The estimated quantities of oil, natural gas and NGLs that geological and engineering data demonstrate with reasonable certainty to be commercially recoverable in future years from known reservoirs under existing economic and operating conditions.
proved undeveloped reserves: Proved reserves that are expected to be recovered from new wells on undrilled acreage or from existing wells where a relatively major expenditure is required for recompletion.
realized price: The cash market price less all expected quality, transportation and demand adjustments.
recompletion: The completion for production of an existing wellbore in another formation from that which the well has been previously completed.
reserve: That part of a mineral deposit which could be economically and legally extracted or produced at the time of the reserve determination.
reservoir: A porous and permeable underground formation containing a natural accumulation of producible oil and/or natural gas that is confined by impermeable rock or water barriers and is individual and separate from other reservoirs.
resources: Resources are quantities of oil and natural gas estimated to exist in naturally occurring accumulations. A portion of the resources may be estimated to be recoverable and another portion may be considered unrecoverable. Resources include both discovered and undiscovered accumulations.
85
spacing: The distance between wells producing from the same reservoir. Spacing is often expressed in terms of acres (e.g., 75 acre well-spacing) and is often established by regulatory agencies.
standardized measure: The present value of estimated future after tax net revenue to be generated from the production of proved reserves, determined in accordance with the rules and regulations of the SEC (using prices and costs in effect as of the date of estimation), less future development, production and income tax expenses, and discounted at 10% per annum to reflect the timing of future net revenue. Standardized measure does not give effect to derivative transactions.
trend: A geographic area with hydrocarbon potential.
undeveloped acreage: Lease acreage on which wells have not been drilled or completed to a point that would permit the production of commercial quantities of oil and natural gas regardless of whether such acreage contains proved reserves.
unproved properties: Properties with no proved reserves.
volatile oil: A quality of oil with an API gravity greater than 40° and with a gas‑to‑oil ratio of greater than 500 cubic feet per barrel.
wellbore: The hole drilled by the bit that is equipped for oil or natural gas production on a completed well. Also called well or borehole.
working interest: An interest in an oil and natural gas lease that gives the owner of the interest the right to drill for and produce oil and natural gas on the leased acreage and requires the owner to pay a share of the costs of drilling and production operations.
workover: Operations on a producing well to restore or increase production.
WTI: West Texas Intermediate crude.
86
Item 15. Exhibits and Financial Statement Schedules
a.The following documents are filed as a part of this Annual Report on Form 10‑K or incorporated herein by reference:
(1)Financial Statements:
See Item 8. Financial Statements and Supplementary Data.
(2)Financial Statement Schedules:
None.
(3)Exhibits:
The exhibits required by Item 601 of Regulation S-K are listed in subparagraph (b) below.
b.The following exhibits are filed or furnished with this Annual Report on Form 10‑K or incorporated by reference:
|
Exhibit No. |
|
Description of Exhibit |
||
|
|
|
|
|
|
|
|
2.1 |
** |
Purchase and Sale Agreement, dated as of May 21, 2014, by and among SWEPI LP, Shell Gulf of Mexico Inc., as sellers, and Sanchez Energy Corporation, as buyer (filed as Exhibit 2.1 to the Company's Current Report on Form 8-K on May 22, 2014, and incorporated herein by reference). |
|
|
|
|
|
|
|
|
|
2.2 |
** |
Purchase and Sale Agreement, dated as of March 31, 2015, by and among SEP Holdings III, LLC, SEP Holdings IV, LLC and Sanchez Production Partners LP (filed as Exhibit 2.1 to the Company's Current Report on Form 8-K on April 1, 2015, and incorporated herein by reference). |
|
|
|
|
|
|
|
|
|
2.3 |
** |
Purchase and Sale Agreement, dated as of September 25, 2015, by and among Sanchez Energy Corporation, SN Catarina, LLC and Sanchez Production Partners LP (filed as Exhibit 2.1 to the Company’s Current Report on Form 8-K on September 29, 2015, and incorporated herein by reference). |
|
|
|
|
|
|
|
|
|
2.4 |
** |
Purchase and Sale Agreement, dated as of July 5, 2016, by and among Sanchez Energy Corporation, SN Midstream, LLC and Sanchez Production Partners LP (filed as Exhibit 2.1 to the Company’s Current Report on Form 8-K on July 6, 2016, and incorporated herein by reference). |
|
|
|
|
|
|
|
|
|
2.5 |
** |
Purchase and Sale Agreement, dated as of October 6, 2016, by and among Sanchez Energy Corporation, SN Midstream, LLC and Sanchez Production Partners LP (filed as Exhibit 2.1 to the Company’s Current Report on Form 8-K on October 7, 2016, and incorporated herein by reference). |
|
|
|
|
|
|
|
|
|
2.6 |
** |
Purchase and Sale Agreement, dated as of October 6, 2016, by and among SN Cotulla Assets, LLC, SN Palmetto, LLC, SEP Holdings IV, LLC and Sanchez Production Partners LP (filed as Exhibit 2.2 to the Company’s Current Report on Form 8-K on October 7, 2016, and incorporated herein by reference). |
|
|
|
|
|
|
|
|
|
2.7 |
** |
Purchase and Sale Agreement, dated as of October 6, 2016, by and among Sanchez Energy Corporation, SN Terminal, LLC and Sanchez Production Partners LP (filed as Exhibit 2.3 to the Company’s Current Report on Form 8-K on October 7, 2016, and incorporated herein by reference). |
|
|
|
|
|
|
|
|
|
2.8 |
** |
Purchase and Sale Agreement, dated as of October 24, 2016, by and among SN Cotulla Assets, LLC, Carrizo (Eagle Ford) LLC, Carrizo Oil & Gas, Inc., and for the limited purposes set forth therein, Sanchez Energy Corporation (filed as Exhibit 2.1 on the Company's Current Report on Form 8-K on January 13, 2017, and incorporated herein by reference). |
|
|
|
|
|
|
|
87
|
Exhibit No. |
|
Description of Exhibit |
||
|
|
2.9 |
** |
Purchase and Sale Agreement, dated as of January 12, 2017, by and among Anadarko E&P Onshore LLC, Kerr-McGee Oil & Gas Onshore LP, SN EF Maverick, LLC, SN EF UnSub, LP, Aguila Production, LLC, and solely for the purposes of Section 15.22 and Schedule 13.4(a), Sanchez Energy Corporation (filed as Exhibit 2.1 to the Company’s Current Report on Form 8-K on January 17, 2017, and incorporated herein by reference). |
|
|
|
|
|
|
|
|
|
3.1 |
|
Certificate of Amendment of Amended and Restated Certificate of Incorporation of Sanchez Energy Corporation (filed as Exhibit 3.1 to the Company's Current Report on Form 8-K on May 28, 2013, and incorporated herein by reference). |
|
|
|
|
|
|
|
|
|
3.2 |
|
Restated Certificate of Incorporation of Sanchez Energy Corporation, effective as of May 28, 2013 (filed as Exhibit 3.2 to the Company's Quarterly Report on Form 10-Q on November 8, 2013, and incorporated herein by reference). |
|
|
|
|
|
|
|
|
|
3.3 |
|
Certificate of Designations of Series C Junior Participating Preferred Stock of Sanchez Energy Corporation (filed as Exhibit 3.1 to the Company's Current Report on Form 8-K on July 29, 2015, and incorporated herein by reference). |
|
|
|
|
|
|
|
|
|
|
|
|
|
|
|
3.4 |
|
Amended and Restated Bylaws dated as of December 13, 2011 (filed as Exhibit 3.2 to the Company's Current Report on Form 8-K on December 19, 2011, and incorporated herein by reference). |
|
|
|
|
|
|
|
|
|
4.1 |
|
Form of Common Stock Certificate (filed as Exhibit 4.1 to Amendment No. 3 to the Company's Registration Statement on Form S-1 (File. No. 333-176613) on November 25, 2011, and incorporated herein by reference). |
|
|
|
|
|
|
|
|
|
4.2 |
|
Indenture, dated as of June 13, 2013, by and among Sanchez Energy Corporation, the subsidiary guarantors named therein and U.S. Bank National Association as trustee (filed as Exhibit 4.1 to the Company's Current Report on Form 8- K on June 14, 2013 and incorporated herein by reference). |
|
|
|
|
|
|
|
|
|
4.3 |
|
First Supplemental Indenture, dated as of September 11, 2013, by and among Sanchez Energy Corporation, SN TMS, LLC, the existing guarantors and U.S. Bank National Association as trustee (filed as Exhibit 4.2 to the Company's Current Report on Form 8-K on September 19, 2013 and incorporated herein by reference). |
|
|
|
|
|
|
|
|
|
4.4 |
|
Registration Rights Agreement, dated as of June 13, 2013, by and among Sanchez Energy Corporation, the subsidiary guarantors named therein and RBC Capital Markets, LLC, as representative of the several initial purchasers named therein (filed as Exhibit 4.2 to the Company's Current Report on Form 8-K on June 14, 2013, and incorporated herein by reference). |
|
|
|
|
|
|
|
|
|
4.5 |
|
Registration Rights Agreement, dated as of September 18, 2013, by and among Sanchez Energy Corporation, the subsidiary guarantors named therein, RBC Capital Markets, LLC and Credit Suisse Securities (USA), LLC, as representatives of the several initial purchasers named therein (filed as Exhibit 4.3 to the Company's Current Report on Form 8-K on September 13, 2013, and incorporated herein by reference). |
|
|
|
|
|
|
|
|
|
4.6 |
|
Registration Rights Agreement, dated as of December 19, 2011, by and between Sanchez Energy Corporation and Sanchez Energy Partners I, LP (filed as Exhibit 10.3 to the Company's Current Report on Form 8-K on December 23, 2011, and incorporated herein by reference). |
|
|
|
|
|
|
|
|
|
4.7 |
|
Second Supplemental Indenture, dated as of June 2, 2014, by and among Sanchez Energy Corporation, SN Catarina, LLC, the existing guarantors and U.S. Bank National Association, as trustee (filed as Exhibit 4.6 to the Company's Registration Statement on Form S-4 (File No. 333-196660)on June 11, 2014, and incorporated herein by reference). |
|
|
|
|
|
|
|
|
|
4.8 |
|
Indenture, dated as of June 27, 2014, by and among Sanchez Energy Corporation, the subsidiary guarantors named therein and U.S. Bank National Association, as trustee (filed as Exhibit 4.1 to the Company's Current Report on Form 8-K on July 2, 2014, and incorporated herein by reference). |
|
88
|
Exhibit No. |
|
Description of Exhibit |
||
|
|
|
|
|
|
|
|
4.9 |
|
Registration Rights Agreement, dated as of June 27, 2014, by and among Sanchez Energy Corporation, the subsidiary guarantors named therein and RBC Capital Markets, LLC, as representative of the several initial purchasers named therein (filed as Exhibit 4.2 to the Company's Current Report on Form 8-K on July 2, 2014, and incorporated herein by reference). |
|
|
|
|
|
|
|
|
|
4.10 |
|
Registration Rights Agreement, dated as of September 12, 2014, by and among Sanchez Energy Corporation, the subsidiary guarantors named therein, RBC Capital Markets, LLC and Credit Suisse Securities (USA), LLC, as representatives of the several initial purchasers named therein (filed as Exhibit 4.2 to the Company's Current Report on Form 8-K on September 15, 2014, and incorporated herein by reference). |
|
|
|
|
|
|
|
|
|
4.11 |
|
Rights Plan dated as of July 28, 2015, by and between Sanchez Energy Corporation and Continental Stock Transfer & Trust Company, as Rights Agent (including the form of Certificate of Designations of Series C Junior Participating Preferred Stock attached thereto as Exhibit A, the form of Right Certificate attached thereto as Exhibit B and the Summary of Rights attached thereto as Exhibit C) (filed as Exhibit 4.1 to the Company's Current Report on Form 8-K on July 29, 2015, and incorporated herein by reference). |
|
|
|
|
|
|
|
|
|
4.12 |
|
Instrument of Resignation, Appointment and Acceptance (7.75% Senior Notes), dated as of May 20, 2016, by and among Sanchez Energy Corporation, Delaware Trust Company and U.S. Bank National Association (filed as Exhibit 4.1 to the Company’s Quarterly Report on Form 10-Q on August 8, 2016, and incorporated herein by reference). |
|
|
|
|
|
|
|
|
|
4.13 |
|
Instrument of Resignation, Appointment and Acceptance (6.125% Senior Notes), dated as of May 20, 2016, by and among Sanchez Energy Corporation, Delaware Trust Company and U.S. Bank National Association (filed as Exhibit 4.2 to the Company’s Quarterly Report on Form 10-Q on August 8, 2016, and incorporated herein by reference). |
|
|
|
|
|
|
|
|
|
10.1 |
|
Services Agreement, dated as of December 19, 2011, by and between Sanchez Oil & Gas Corporation and Sanchez Energy Corporation (filed as Exhibit 10.1 to the Company's Current Report on Form 8-K on December 23, 2011, and incorporated herein by reference). |
|
|
|
|
|
|
|
|
|
10.2 |
|
Geophysical Seismic Data Use License Agreement, dated as of December 19, 2011, by and among Sanchez Oil & Gas Corporation, Sanchez Energy Corporation, SEP Holdings III, LLC and SN Marquis LLC (filed as Exhibit 10.2 to the Company's Current Report on Form 8-K on December 23, 2011, and incorporated herein by reference). |
|
|
|
|
|
|
|
|
|
10.3 |
* |
Indemnification Agreement, dated as of December 19, 2011, by and between Sanchez Energy Corporation and Antonio R. Sanchez, III (filed as Exhibit 10.4 to the Company's Current Report on Form 8-K on December 23, 2011, and incorporated herein by reference). |
|
|
|
|
|
|
|
|
|
10.4 |
* |
Indemnification Agreement, dated as of December 19, 2011, by and between Sanchez Energy Corporation and Michael G. Long (filed as Exhibit 10.5 to the Company's Current Report on Form 8-K on December 23, 2011, and incorporated herein by reference). |
|
|
|
|
|
|
|
|
|
10.5 |
* |
Indemnification Agreement, dated as of December 19, 2011, by and between Sanchez Energy Corporation and Gilbert A. Garcia (filed as Exhibit 10.6 to the Company's Current Report on Form 8-K on December 23, 2011, and incorporated herein by reference). |
|
|
|
|
|
|
|
|
|
10.6 |
* |
Form of Restricted Stock Agreement for Employees (filed as Exhibit 10.1 to the Company's Registration Statement on Form S-8 (File No. 333-178920) on January 6, 2012, and incorporated herein by reference). |
|
|
|
|
|
|
|
|
|
10.7 |
* |
Form of Restricted Stock Agreement for Non-employee Directors (filed as Exhibit 10.2 to the Company's Registration Statement on Form S-8 (File No. 333-178920) on January 6, 2012, and incorporated herein by reference). |
|
|
|
|
|
|
|
|
|
10.8 |
* |
Form of Restricted Stock Agreement for Antonio R. Sanchez, III (filed as Exhibit 10.3 to the Company's Registration Statement on Form S-8 (File No. 333-178920) on January 6, 2012, and incorporated herein by reference). |
|
89
|
Exhibit No. |
|
Description of Exhibit |
||
|
|
|
|
|
|
|
|
10.9 |
* |
Indemnification Agreement, dated as of March 9, 2012, by and between Sanchez Energy Corporation and Greg Colvin (filed as Exhibit 10.1 to the Company's Current Report on Form 8-K on March 14, 2012, and incorporated herein by reference). |
|
|
|
|
|
|
|
|
|
10.10 |
* |
Indemnification Agreement, dated as of March 9, 2012, by and between Sanchez Energy Corporation and Kirsten A. Hink (filed as Exhibit 10.2 to the Company's Current Report on Form 8-K on March 14, 2012, and incorporated herein by reference). |
|
|
|
|
|
|
|
|
|
10.11 |
* |
Indemnification Agreement, dated as of November 27, 2012, by and between Sanchez Energy Corporation and A.R. Sanchez, Jr. (filed as Exhibit 10.1 to the Company's Current Report on Form 8-K on December 3, 2012, and incorporated herein by reference). |
|
|
|
|
|
|
|
|
|
10.12 |
* |
Indemnification Agreement, dated as of November 27, 2012, by and between Sanchez Energy Corporation and Alan G. Jackson (filed as Exhibit 10.2 to the Company's Current Report on Form 8-K on December 3, 2012, and incorporated herein by reference). |
|
|
|
|
|
|
|
|
|
10.13 |
* |
Indemnification Agreement, dated as of March 4, 2014, by and between Sanchez Energy Corporation and Christopher Heinson (filed as Exhibit 10.1 to the Company's Current Report on Form 8-K on March 6, 2014, and incorporated herein by reference). |
|
|
|
|
|
|
|
|
|
10.14 |
|
Purchase Agreement, dated as of June 13, 2014, by and among Sanchez Energy Corporation, the subsidiary guarantors named therein, RBC Capital Markets, LLC and Credit Suisse Securities (USA), LLC, as representatives of the several initial purchasers named therein (filed as Exhibit 10.1 to the Company's Current Report on Form 8-K on June 16, 2014, and incorporated herein by reference). |
|
|
|
|
|
|
|
|
|
10.15 |
|
Second Amended and Restated Credit Agreement, dated as of June 30, 2014, by and among Sanchez Energy Corporation, as borrower, SEP Holdings III, LLC, SN Marquis LLC, SN Cotulla Assets, LLC, SN Operating, LLC, SN TMS, LLC and SN Catarina, LLC, as loan parties, Royal Bank of Canada, as administrative agent, Capital One, National Association, as syndication agent, Compass Bank, SunTrust Bank as co-documentation agents, RBC Capital Markets as sole lead arranger and sole book runner, and the lenders party thereto (filed as Exhibit 10.1 to the Company's Current Report on Form 8-K on July 2, 2014, and incorporated herein by reference). |
|
|
|
|
|
|
|
|
|
10.16 |
|
Purchase Agreement, dated as of September 9, 2014, by and among Sanchez Energy Corporation, the subsidiary guarantors named therein, RBC Capital Markets, LLC and Credit Suisse Securities (USA), LLC, as representatives of the several initial purchasers named therein (filed as Exhibit 10.1 to the Company's Current Report on Form 8-K on September 15, 2014, and incorporated herein by reference). |
|
|
|
|
|
|
|
|
|
10.17 |
|
First Amendment to Second Amended and Restated Credit Agreement, dated as of September 9, 2014, by and among Sanchez Energy Corporation, as borrower, SEP Holdings III, LLC, SN Marquis LLC, SN Cotulla Assets, LLC, SN Operating, LLC, SN TMS, LLC and SN Catarina, LLC, as loan parties, Royal Bank of Canada, as administrative agent, Capital One, National Association, as syndication agent, Compass Bank, SunTrust Bank as co-documentation agents, RBC Capital Markets as sole lead arranger and sole book runner, and the lenders party thereto (filed as Exhibit 10.2 to the Company's Current Report on Form 8-K on September 15, 2014, and incorporated herein by reference). |
|
|
|
|
|
|
|
|
|
10.18 |
* |
Indemnification Agreement, dated as of November 4, 2014, by and between Sanchez Energy Corporation and Sean Maher (filed as Exhibit 10.1 to the Company's Current Report on Form 8-K on November 6, 2014, and incorporated herein by reference). |
|
|
|
|
|
|
|
|
|
10.19 |
|
Second Amendment to Second Amended and Restated Credit Agreement, dated as of March 31, 2015, by and among Sanchez Energy Corporation, as borrower, SN Marquis LLC, SN Cotulla Assets LLC, SN Operating LLC, SN TMS, LLC, and SN Catarina LLC, as guarantors, Royal Bank of Canada, as administrative agent, and the other agents and lenders party thereto (filed as Exhibit 10.1 to the Company's Current Report on Form 8-K on April 1, 2015, and incorporated herein by reference). |
|
|
|
|
|
|
|
90
|
Exhibit No. |
|
Description of Exhibit |
||
|
|
10.20 |
* |
Indemnification Agreement, dated as of May 5, 2015, by and between Sanchez Energy Corporation and Thomas Brian Carney (filed as Exhibit 10.1 to the Company's Current Report on Form 8-K on May 8, 2015, and incorporated herein by reference). |
|
|
|
|
|
|
|
|
|
10.21 |
* |
Indemnification Agreement, dated as of May 5, 2015, by and between Sanchez Energy Corporation and G. Gleeson Van Riet (filed as Exhibit 10.2 to the Company's Current Report on Form 8-K on May 8, 2015, and incorporated herein by reference). |
|
|
|
|
|
|
|
|
|
10.22 |
* |
Sanchez Energy Corporation Second Amended and Restated 2011 Long Term Incentive Plan (filed as Exhibit 99.1 to the Company's Current Report on Form 8-K on May 27, 2015, and incorporated herein by reference). |
|
|
|
|
|
|
|
|
|
10.23 |
* |
Indemnification Agreement, dated as of October 1, 2015, by and between Sanchez Energy Corporation and Eduardo Sanchez (filed as Exhibit 10.1 to the Company’s Current Report on Form 8-K on October 6, 2015, and incorporated herein by reference). |
|
|
|
|
|
|
|
|
|
10.24 |
|
Third Amendment to Second Amended and Restated Credit Agreement, dated as of July 20, 2015, by and among Sanchez Energy Corporation, as borrower, SN Marquis LLC, SN Cotulla Assets LLC, SN Operating LLC, SN TMS, LLC, and SN Catarina LLC, as guarantors, Royal Bank of Canada, as administrative agent, and the other agents and lenders party thereto (filed as Exhibit 10.1 to the Company's Quarterly Report on Form 10-Q on November 8, 2013, and incorporated herein by reference). |
|
|
|
|
|
|
|
|
|
10.25 |
|
Fourth Amendment to Second Amended and Restated Credit Agreement, dated as of September 29, 2015, by and among Sanchez Energy Corporation, as borrower, SN Marquis LLC, SN Cotulla Assets LLC, SN Operating LLC, SN TMS, LLC, and SN Catarina LLC, as guarantors, Royal Bank of Canada, as administrative agent, and the other agents and lenders party thereto (filed as Exhibit 10.2 to the Company's Quarterly Report on Form 10-Q on November 8, 2013, and incorporated herein by reference). |
|
|
|
|
|
|
|
|
|
10.26 |
|
Fifth Amendment to Second Amended and Restated Credit Agreement, dated as of October 30, 2015, by and among Sanchez Energy Corporation, as borrower, SEP Holdings III, LLC, SN Marquis LLC, SN Cotulla Assets, LLC, SN Operating, LLC, SN TMS, LLC, and SN Catarina, LLC, as guarantors, Royal Bank of Canada, as administrative agent, and the lenders party thereto (filed as Exhibit 10.1 to the Company's Current Report on Form 8-K on November 4, 2015, and incorporated herein by reference). |
|
|
|
|
|
|
|
|
|
10.27 |
|
Sixth Amendment to Second Amended and Restated Credit Agreement, dated as of January 22, 2016, by and among Sanchez Energy Corporation, as borrower, SEP Holdings III, LLC, SN Marquis LLC, SN Cotulla Assets, LLC, SN Operating, LLC, SN TMS, LLC, and SN Catarina, LLC, as guarantors, Royal Bank of Canada, as administrative agent, and the lenders party thereto (filed as Exhibit 10.1 to the Company’s Current Report on Form 8-K on January 25, 2016, and incorporated herein by reference). |
|
|
|
|
|
|
|
|
|
10.28 |
|
Seventh Amendment to Second Amended and Restated Credit Agreement, dated as of March 18, 2016, by and among Sanchez Energy Corporation, as borrower, SEP Holdings III, LLC, SN Marquis LLC, SN Cotulla Assets, LLC, SN Operating, LLC, SN TMS, LLC, and SN Catarina, LLC, as guarantors, Royal Bank of Canada, as administrative agent, and the lenders party thereto (filed as Exhibit 10.1 to the Company’s Current Report on Form 8-K on March 21, 2016, and incorporated herein by reference). |
|
|
|
|
|
|
|
|
|
10.29 |
(a) |
Letter Agreement, dated as of December 9, 2016, by and among Royal Bank of Canada, as administrative agent under the Second Amended and Restated Credit Agreement, as amended, Sanchez Energy Corporation, as borrower and the other parties thereto. |
|
|
|
|
|
|
|
|
|
10.30 |
* |
Indemnification Agreement, dated as of December 14, 2015, by and between Sanchez Energy Corporation and Gregory B. Kopel (filed as Exhibit 10.1 to the Company's Current Report on Form 8-K on December 16, 2015, and incorporated herein by reference). |
|
|
|
|
|
|
|
91
|
Exhibit No. |
|
Description of Exhibit |
||
|
|
10.31 |
* |
Indemnification Agreement, dated as of March 8, 2016, by and between Sanchez Energy Corporation and Garrick Hill (filed as Exhibit 10.1 to the Company’s Current Report on Form 8-K on March 8, 2016, and incorporated herein by reference). |
|
|
|
|
|
|
|
|
|
10.32 |
* |
Form of Restricted Stock Award Agreement for Employees (filed as Exhibit 10.1 to the Company’s Current Report on Form 8-K on April 21, 2016, and incorporated herein by reference). |
|
|
|
|
|
|
|
|
|
10.33 |
* |
Form of Performance Accelerated Restricted Stock Agreement for Employees (filed as Exhibit 10.1 to the Company’s Current Report on Form 8-K on April 21, 2016, and incorporated herein by reference). |
|
|
|
|
|
|
|
|
|
10.34 |
* |
Form of Phantom Stock Agreement for Employees (filed as Exhibit 10.1 to the Company’s Current Report on Form 8-K on April 21, 2016, and incorporated herein by reference). |
|
|
|
|
|
|
|
|
|
10.35 |
* |
Form of Performance Accelerated Phantom Stock Agreement for Employees (filed as Exhibit 10.1 to the Company’s Current Report on Form 8-K on April 21, 2016, and incorporated herein by reference). |
|
|
|
|
|
|
|
|
|
10.36 |
* |
Indemnification Agreement, dated as of August 2, 2016, by and between Sanchez Energy Corporation and Robert Nelson (filed as Exhibit 10.1 on the Company’s Current Report on Form 8-K on August 3, 2016, and incorporated herein by reference). |
|
|
|
|
|
|
|
|
|
10.37 |
* |
Indemnification Agreement, dated as of October 10, 2016, by and between Sanchez Energy Corporation and Howard Thill (filed as Exhibit 10.1 on the Company’s Current Report on Form 8-K on October 12, 2016, and incorporated herein by reference). |
|
|
|
|
|
|
|
|
|
10.38 |
* |
Restricted Stock Agreement, dated as of October 10, 2016, by and between Sanchez Energy Corporation and Howard Thill (filed as Exhibit 10.2 on the Company’s Current Report on Form 8-K on October 12, 2016, and incorporated herein by reference). |
|
|
|
|
|
|
|
|
|
10.39 |
* |
Phantom Stock Agreement, dated as of October 10, 2016, by and between Sanchez Energy Corporation and Howard Thill (filed as Exhibit 10.3 on the Company’s Current Report on Form 8-K on October 12, 2016, and incorporated herein by reference). |
|
|
|
|
|
|
|
|
|
10.40 |
* |
Indemnification Agreement, dated as of November 3, 2016, by and between Sanchez Energy Corporation and Patricio D. Sanchez (filed as Exhibit 10.1 on the Company’s Current Report on Form 8-K on November 9, 2016, and incorporated herein by reference). |
|
|
|
|
|
|
|
|
|
10.41 |
** |
Securities Purchase Agreement, dated as of January 12, 2017, by and among Sanchez Energy Corporation, SN UR Holdings, LLC, SN EF UnSub Holdings, LLC, SN EF UnSub, LP, SN EF UnSub GP, LLC, GSO ST Holdings Associates LLC, and GSO ST Holdings LP (filed as Exhibit 10.1 to the Company’s Current Report on Form 8-K on January 17, 2017, and incorporated herein by reference). |
|
|
|
|
|
|
|
|
|
10.42 |
** |
Interim Investors Agreement, dated as of January 12, 2017, by and among Sanchez Energy Corporation, SN EF Maverick, LLC, SN EF UnSub, LP, Aguila Production, LLC, Aguila Production HoldCo, LLC, Blackstone Capital Partners VII L.P., and Blackstone Energy Partners II L.P. (filed as Exhibit 10.2 to the Company’s Current Report on Form 8-K on January 12, 2017, and incorporated herein by reference). |
|
|
|
|
|
|
|
|
|
16.1 |
|
Letter from BDO USA, LLP, dated as of June 23, 2015, regarding the change in certifying accountant (filed as Exhibit 16.1 to the Company’s Current Report on Form 8-K on June 23, 2015, and incorporated herein by reference). |
|
|
|
|
|
|
|
|
|
21.1 |
(a) |
List of Subsidiaries of Sanchez Energy Corporation. |
|
|
|
|
|
|
|
|
|
23.1 |
(a) |
Consent of KPMG LLP. |
|
|
|
|
|
|
|
|
|
23.2 |
(a) |
Consent of BDO USA, LLP. |
|
|
|
|
|
|
|
92
|
Exhibit No. |
|
Description of Exhibit |
||
|
|
23.3 |
(a) |
Consent of Ryder Scott Company, L.P. |
|
|
|
|
|
|
|
|
|
31.1 |
(a) |
Sarbanes-Oxley Section 302 certification of Principal Executive Officer. |
|
|
|
|
|
|
|
|
|
31.2 |
(a) |
Sarbanes-Oxley Section 302 certification of Principal Financial Officer. |
|
|
|
|
|
|
|
|
|
32.1 |
(b) |
Sarbanes-Oxley Section 906 certification of Principal Executive Officer. |
|
|
|
|
|
|
|
|
|
32.2 |
(b) |
Sarbanes-Oxley Section 906 certification of Principal Financial Officer. |
|
|
|
|
|
|
|
|
|
99.1 |
(a) |
Ryder Scott Company, L.P. Summary of December 31, 2016 Reserves. |
|
|
|
|
|
|
|
|
|
101.INS |
(a) |
XBRL Instance Document. |
|
|
|
|
|
|
|
|
|
101.SCH |
(a) |
XBRL Taxonomy Extension Schema Document. |
|
|
|
|
|
|
|
|
|
101.CAL |
(a) |
XBRL Taxonomy Extension Calculation Linkbase Document. |
|
|
|
|
|
|
|
|
|
101.DEF |
(a) |
XBRL Taxonomy Extension Definition Linkbase Document. |
|
|
|
|
|
|
|
|
|
101.LAB |
(a) |
XBRL Taxonomy Extension Labels Linkbase Document. |
|
|
|
|
|
|
|
|
|
101.PRE |
(a) |
XBRL Taxonomy Extension Presentation Linkbase Document. |
|
(a)Filed herewith.
(b)Furnished herewith.
*Management contract or compensatory plan or arrangement.
**The exhibits and schedules to this agreement have been omitted form this filing pursuant to Item 601(b)(2) of Regulation S‑K. The Company will furnish copies of such omitted exhibits and schedules to the SEC upon request.
None.
93
Pursuant to the requirements of Section 13 or 15(d) of the Securities Exchange Act of 1934, the registrant has duly caused this report to be signed on its behalf by the undersigned thereunto duly authorized, on February 27, 2017.
|
|
SANCHEZ ENERGY CORPORATION |
|
|
|
|
|
|
|
|
|
|
|
By: |
/s/ Antonio R. Sanchez, III |
|
|
|
Antonio R. Sanchez, III |
|
|
|
Chief Executive Officer |
KNOW ALL PERSONS BY THESE PRESENTS, that each person whose signature appears below constitutes and appoints Antonio R. Sanchez, III and Howard J. Thill, and each of them, as his true and lawful attorneys-in-fact and agents, with full power of substitution and resubstitution, for him and in his name, place and stead, in any and all capacities, to sign any and all amendments to this Annual Report on Form 10-K, and to file the same, with all exhibits thereto, and other documents in connection therewith, with the Securities and Exchange Commission, granting unto said attorneys-in-fact and agents full power and authority to do and perform each and every act and thing requisite or necessary to be done in connection therewith, as fully to all intents and purposes as he might or could do in person, hereby ratifying and confirming all that said attorneys-in-fact and agents, or their or his substitute or substitutes, may lawfully do or cause to be done by virtue hereof.
Pursuant to the requirements of the Securities Exchange Act of 1934, this report has been signed below by the following persons on behalf of the registrant and in the capacities and on the dates indicated:
|
Signature |
|
Title |
|
Date |
|
|
|
|
|
|
|
/s/ Antonio R. Sanchez, III |
|
Chief Executive Officer |
|
February 27, 2017 |
|
Antonio R. Sanchez, III |
|
|
|
|
|
|
|
|
|
|
|
/s/ Howard J. Thill |
|
Executive Vice President and Chief Financial Officer |
|
February 27, 2017 |
|
Howard J. Thill |
|
|
|
|
|
|
|
|
|
|
|
/s/ Kirsten A. Hink |
|
Senior Vice President and Chief Accounting Officer |
|
February 27, 2017 |
|
Kirsten A. Hink |
|
|
|
|
|
|
|
|
|
|
|
/s/ A. R. Sanchez, Jr. |
|
Executive Chairman of the Board of Directors |
|
February 27, 2017 |
|
A. R. Sanchez, Jr. |
|
|
|
|
|
|
|
|
|
|
|
/s/ Gilbert A. Garcia |
|
Director |
|
February 27, 2017 |
|
Gilbert A. Garcia |
|
|
|
|
|
|
|
|
|
|
|
/s/ Greg Colvin |
|
Director |
|
February 27, 2017 |
|
Greg Colvin |
|
|
|
|
|
|
|
|
|
|
|
/s/ Alan G. Jackson |
|
Director |
|
February 27, 2017 |
|
Alan G. Jackson |
|
|
|
|
|
|
|
|
|
|
|
/s/ Sean m. Maher |
|
Director |
|
February 27, 2017 |
|
Sean M. Maher |
|
|
|
|
94
|
|
|
|
|
|
|
/s/ Brian Carney |
|
Director |
|
February 27, 2017 |
|
Brian Carney |
|
|
|
|
|
|
|
|
|
|
|
/s/ Robert V. Nelson, III |
|
Director |
|
February 27, 2017 |
|
Robert V. Nelson, III |
|
|
|
|
95
ITEM 8. FINANCIAL STATEMENTS AND SUPPLEMENTARY DATA
INDEX TO CONSOLIDATED FINANCIAL STATEMENTS
Sanchez Energy Corporation
F-1
Report of Independent Registered Public Accounting Firm
Board of Directors and Stockholders
Sanchez Energy Corporation:
We have audited the accompanying consolidated balance sheets of Sanchez Energy Corporation and subsidiaries as of December 31, 2016 and 2015, and the related consolidated statements of operations, stockholders’ equity (deficit), and cash flows for each of the years in the two‑year period ended December 31, 2016. These consolidated financial statements are the responsibility of the Company’s management. Our responsibility is to express an opinion on these consolidated financial statements based on our audits.
We conducted our audits in accordance with the standards of the Public Company Accounting Oversight Board (United States). Those standards require that we plan and perform the audit to obtain reasonable assurance about whether the financial statements are free of material misstatement. An audit includes examining, on a test basis, evidence supporting the amounts and disclosures in the financial statements. An audit also includes assessing the accounting principles used and significant estimates made by management, as well as evaluating the overall financial statement presentation. We believe that our audits provide a reasonable basis for our opinion.
In our opinion, the consolidated financial statements referred to above present fairly, in all material respects, the financial position of Sanchez Energy Corporation and subsidiaries as of December 31, 2016 and 2015, and the results of their operations and their cash flows for each of the years in the two‑year period ended December 31, 2016, in conformity with U.S. generally accepted accounting principles.
We also have audited, in accordance with the standards of the Public Company Accounting Oversight Board (United States), Sanchez Energy Corporation’s internal control over financial reporting as of December 31, 2016, based on criteria established in Internal Control – Integrated Framework (2013) issued by the Committee of Sponsoring Organizations of the Treadway Commission (COSO), and our report dated February 27, 2017 expressed an unqualified opinion on the effectiveness of the Company’s internal control over financial reporting.
|
/s/ KPMG LLP |
|
|
|
|
|
|
|
Houston, Texas |
|
|
|
February 27, 2017 |
|
|
F-2
Report of Independent Registered Public Accounting Firm
Board of Directors and Stockholders
Sanchez Energy Corporation:
We have audited Sanchez Energy Corporation’s internal control over financial reporting as of December 31, 2016, based on criteria established in Internal Control – Integrated Framework (2013) issued by the Committee of Sponsoring Organizations of the Treadway Commission (COSO). Sanchez Energy Corporation’s management is responsible for maintaining effective internal control over financial reporting and for its assessment of the effectiveness of internal control over financial reporting, included in the accompanying Management’s Annual Report on Internal Control over Financial Reporting. Our responsibility is to express an opinion on the Company’s internal control over financial reporting based on our audit.
We conducted our audit in accordance with the standards of the Public Company Accounting Oversight Board (United States). Those standards require that we plan and perform the audit to obtain reasonable assurance about whether effective internal control over financial reporting was maintained in all material respects. Our audit included obtaining an understanding of internal control over financial reporting, assessing the risk that a material weakness exists, and testing and evaluating the design and operating effectiveness of internal control based on the assessed risk. Our audit also included performing such other procedures as we considered necessary in the circumstances. We believe that our audit provides a reasonable basis for our opinion.
A company’s internal control over financial reporting is a process designed to provide reasonable assurance regarding the reliability of financial reporting and the preparation of financial statements for external purposes in accordance with generally accepted accounting principles. A company’s internal control over financial reporting includes those policies and procedures that (1) pertain to the maintenance of records that, in reasonable detail, accurately and fairly reflect the transactions and dispositions of the assets of the company; (2) provide reasonable assurance that transactions are recorded as necessary to permit preparation of financial statements in accordance with generally accepted accounting principles, and that receipts and expenditures of the company are being made only in accordance with authorizations of management and directors of the company; and (3) provide reasonable assurance regarding prevention or timely detection of unauthorized acquisition, use, or disposition of the company’s assets that could have a material effect on the financial statements.
Because of its inherent limitations, internal control over financial reporting may not prevent or detect misstatements. Also, projections of any evaluation of effectiveness to future periods are subject to the risk that controls may become inadequate because of changes in conditions, or that the degree of compliance with the policies or procedures may deteriorate.
In our opinion, Sanchez Energy Corporation maintained, in all material respects, effective internal control over financial reporting as of December 31, 2016, based on criteria established in Internal Control – Integrated Framework (2013) issued by the Committee of Sponsoring Organizations of the Treadway Commission (COSO).
We also have audited, in accordance with the standards of the Public Company Accounting Oversight Board (United States), the consolidated balance sheets of Sanchez Energy Corporation and subsidiaries as of December 31, 2016 and 2015, and the related consolidated statements of operations, stockholders’ equity (deficit), and cash flows for each of the years in the two-year period ended December 31, 2016, and our report dated February 27, 2017 expressed an unqualified opinion on those consolidated financial statements.
|
/s/ KPMG LLP |
|
|
|
|
|
|
|
Houston, Texas |
|
|
|
February 27, 2017 |
|
|
F-3
Report of Independent Registered Public Accounting Firm
Board of Directors and Stockholders
Sanchez Energy Corporation
Houston, Texas
We have audited the accompanying consolidated statements of operations, stockholders’ equity, and cash flows of Sanchez Energy Corporation (the “Company”) for the year ended December 31, 2014. These financial statements are the responsibility of the Company’s management. Our responsibility is to express an opinion on these financial statements based on our audit.
We conducted our audit in accordance with the standards of the Public Company Accounting Oversight Board (United States). Those standards require that we plan and perform the audit to obtain reasonable assurance about whether the financial statements are free of material misstatement. An audit includes examining, on a test basis, evidence supporting the amounts and disclosures in the financial statements, assessing the accounting principles used and significant estimates made by management, as well as evaluating the overall financial statement presentation. We believe that our audit provides a reasonable basis for our opinion.
In our opinion, the consolidated financial statements referred to above present fairly, in all material respects, the results of operations and cash flows of Sanchez Energy Corporation for the year ended December 31, 2014, in conformity with accounting principles generally accepted in the United States of America.
|
/s/ BDO USA, LLP |
|
|
|
|
|
|
|
Houston, Texas |
|
|
|
March 2, 2015, except for Note 18, as to which the date is February 27, 2017 |
||
F-4
Sanchez Energy Corporation
(in thousands, except share and per share amounts)
|
|
|
December 31, |
|
||||
|
|
|
2016 |
|
2015 |
|
||
|
ASSETS |
|
|
|
|
|
|
|
|
Current assets: |
|
|
|
|
|
|
|
|
Cash and cash equivalents |
|
$ |
501,917 |
|
$ |
435,048 |
|
|
Oil and natural gas receivables |
|
|
41,057 |
|
|
30,668 |
|
|
Joint interest billings receivables |
|
|
496 |
|
|
1,259 |
|
|
Accounts receivable - related entities |
|
|
6,401 |
|
|
3,697 |
|
|
Fair value of derivative instruments |
|
|
— |
|
|
172,494 |
|
|
Other current assets |
|
|
12,934 |
|
|
23,452 |
|
|
Total current assets |
|
|
562,805 |
|
|
666,618 |
|
|
Oil and natural gas properties, at cost, using the full cost method: |
|
|
|
|
|
|
|
|
Unproved oil and natural gas properties |
|
|
231,424 |
|
|
253,529 |
|
|
Proved oil and natural gas properties |
|
|
3,164,115 |
|
|
2,914,867 |
|
|
Total oil and natural gas properties |
|
|
3,395,539 |
|
|
3,168,396 |
|
|
Less: Accumulated depreciation, depletion, amortization and impairment |
|
|
(2,736,951) |
|
|
(2,412,293) |
|
|
Total oil and natural gas properties, net |
|
|
658,588 |
|
|
756,103 |
|
|
|
|
|
|
|
|
|
|
|
Other assets: |
|
|
|
|
|
|
|
|
Fair value of derivative instruments |
|
|
— |
|
|
5,789 |
|
|
Investments (Investment in SPP measured at fair value of $26.8 million and $0 as of December 31, 2016 and 2015, respectively) |
|
|
39,656 |
|
|
49,985 |
|
|
Other assets |
|
|
25,231 |
|
|
22,809 |
|
|
Total assets |
|
$ |
1,286,280 |
|
$ |
1,501,304 |
|
|
LIABILITIES AND STOCKHOLDERS' EQUITY |
|
|
|
|
|
|
|
|
Current liabilities: |
|
|
|
|
|
|
|
|
Accounts payable |
|
$ |
1,076 |
|
$ |
4,184 |
|
|
Other payables |
|
|
2,251 |
|
|
2,004 |
|
|
Accrued liabilities: |
|
|
|
|
|
|
|
|
Capital expenditures |
|
|
35,154 |
|
|
51,983 |
|
|
Other |
|
|
82,458 |
|
|
69,974 |
|
|
Deferred premium liability |
|
|
2,079 |
|
|
24,548 |
|
|
Fair value of derivative instruments |
|
|
31,778 |
|
|
— |
|
|
Other current liabilities |
|
|
22,201 |
|
|
14,813 |
|
|
Total current liabilities |
|
|
176,997 |
|
|
167,506 |
|
|
Long term debt, net of premium, discount and debt issuance costs |
|
|
1,712,767 |
|
|
1,705,927 |
|
|
Asset retirement obligations |
|
|
25,087 |
|
|
25,907 |
|
|
Fair value of derivative instruments |
|
|
3,236 |
|
|
— |
|
|
Other liabilities |
|
|
64,333 |
|
|
58,133 |
|
|
Total liabilities |
|
|
1,982,420 |
|
|
1,957,473 |
|
|
Commitments and contingencies (Note 14) |
|
|
|
|
|
|
|
|
Stockholders' equity: |
|
|
|
|
|
|
|
|
Preferred stock ($0.01 par value, 15,000,000 shares authorized; 1,838,985 shares issued and outstanding as of December 31, 2016 and 2015 of 4.875% Convertible Perpetual Preferred Stock, Series A; 3,527,830 and 3,532,330 shares issued and outstanding as of December 31, 2016 and 2015 of 6.500% Convertible Perpetual Preferred Stock, Series B, respectively) |
|
|
53 |
|
|
53 |
|
|
Common stock ($0.01 par value, 150,000,000 shares authorized; 66,156,378 and 61,928,089 shares issued and outstanding as of December 31, 2016 and 2015, respectively) |
|
|
670 |
|
|
619 |
|
|
Additional paid-in capital |
|
|
1,112,397 |
|
|
1,079,513 |
|
|
Accumulated deficit |
|
|
(1,809,260) |
|
|
(1,536,354) |
|
|
Total stockholders' equity (deficit) |
|
|
(696,140) |
|
|
(456,169) |
|
|
Total liabilities and stockholders' equity (deficit) |
|
$ |
1,286,280 |
|
$ |
1,501,304 |
|
The accompanying notes are an integral part of these consolidated financial statements.
F-5
Sanchez Energy Corporation
Consolidated Statements of Operations
(in thousands, except per share amounts)
|
|
Year Ended December 31, |
|||||||
|
|
2016 |
|
2015 |
|
2014 |
|||
|
REVENUES: |
|
|
||||||
|
Oil sales |
$ |
241,766 |
|
$ |
307,971 |
|
$ |
538,887 |
|
Natural gas liquid sales |
|
81,744 |
|
|
69,011 |
|
|
66,989 |
|
Natural gas sales |
|
107,816 |
|
|
98,797 |
|
|
60,188 |
|
Total revenues |
|
431,326 |
|
|
475,779 |
|
|
666,064 |
|
OPERATING COSTS AND EXPENSES: |
|
|
|
|
|
|
|
|
|
Oil and natural gas production expenses |
|
164,567 |
|
|
156,528 |
|
|
93,581 |
|
Production and ad valorem taxes |
|
19,633 |
|
|
26,870 |
|
|
37,787 |
|
Depreciation, depletion, amortization and accretion |
|
159,760 |
|
|
344,572 |
|
|
338,097 |
|
Impairment of oil and natural gas properties |
|
169,046 |
|
|
1,365,000 |
|
|
213,821 |
|
General and administrative (inclusive of stock-based compensation expense of $37,090, $14,831, and $12,843 and for 2016, 2015, and 2014, respectively) |
|
110,081 |
|
|
74,160 |
|
|
63,692 |
|
Total operating costs and expenses |
|
623,087 |
|
|
1,967,130 |
|
|
746,978 |
|
Operating loss |
|
(191,761) |
|
|
(1,491,351) |
|
|
(80,914) |
|
Other income (expense): |
|
|
|
|
|
|
|
|
|
Interest income |
|
856 |
|
|
442 |
|
|
193 |
|
Other income (expense) |
|
134 |
|
|
(2,605) |
|
|
96 |
|
Gain on disposal of assets |
|
112,294 |
|
|
— |
|
|
— |
|
Interest expense |
|
(126,973) |
|
|
(126,399) |
|
|
(89,800) |
|
Earnings from equity investments |
|
3,466 |
|
|
— |
|
|
— |
|
Net gains (losses) on commodity derivatives |
|
(53,149) |
|
|
172,886 |
|
|
137,205 |
|
Total other income (expense) |
|
(63,372) |
|
|
44,324 |
|
|
47,694 |
|
Loss before income taxes |
|
(255,133) |
|
|
(1,447,027) |
|
|
(33,220) |
|
Income tax expense (benefit) |
|
1,825 |
|
|
7,600 |
|
|
(11,429) |
|
Net loss |
|
(256,958) |
|
|
(1,454,627) |
|
|
(21,791) |
|
Less: |
|
|
|
|
|
|
|
|
|
Preferred stock dividends |
|
(15,948) |
|
|
(16,008) |
|
|
(33,590) |
|
Net income allocable to participating securities |
|
— |
|
|
— |
|
|
— |
|
Net loss attributable to common stockholders |
$ |
(272,906) |
|
$ |
(1,470,635) |
|
$ |
(55,381) |
|
|
|
|
|
|
|
|
|
|
|
Net loss per common share - basic and diluted |
$ |
(4.63) |
|
$ |
(25.70) |
|
$ |
(1.06) |
|
Weighted average number of shares used to calculate net loss attributable to common stockholders - basic and diluted |
|
58,900 |
|
|
57,229 |
|
|
52,338 |
The accompanying notes are an integral part of these consolidated financial statements.
F-6
Sanchez Energy Corporation
Consolidated Statements of Stockholders’ Equity (Deficit)
(in thousands)
|
|
|
Series A |
|
Series B |
|
|
|
|
|
|
Additional |
|
|
|
|
Total |
|
||||||||
|
|
|
Preferred Stock |
|
Preferred Stock |
|
Common Stock |
|
Paid-in |
|
Accumulated |
|
Stockholders' |
|
||||||||||||
|
|
|
Shares |
|
Amount |
|
Shares |
|
Amount |
|
Shares |
|
Amount |
|
Capital |
|
Deficit |
|
Equity (Deficit) |
|
||||||
|
BALANCE, December 31, 2013 |
|
3,000 |
|
$ |
30 |
|
4,500 |
|
$ |
45 |
|
46,369 |
|
$ |
464 |
|
$ |
867,108 |
|
$ |
(10,338) |
|
$ |
857,309 |
|
|
Common shares issued, net of offering costs of $8,731 |
|
— |
|
|
— |
|
— |
|
|
— |
|
5,000 |
|
|
50 |
|
|
167,469 |
|
|
— |
|
|
167,519 |
|
|
Preferred stock dividends |
|
— |
|
|
— |
|
— |
|
|
— |
|
— |
|
|
— |
|
|
— |
|
|
(16,293) |
|
|
(16,293) |
|
|
Restricted stock awards, net of forfeitures |
|
— |
|
|
— |
|
— |
|
|
— |
|
1,673 |
|
|
17 |
|
|
(17) |
|
|
— |
|
|
— |
|
|
Exchange of preferred stock for common stock |
|
(1,161) |
|
|
(12) |
|
(968) |
|
|
(10) |
|
5,539 |
|
|
55 |
|
|
17,264 |
|
|
(17,297) |
|
|
— |
|
|
Stock-based compensation |
|
— |
|
|
— |
|
— |
|
|
— |
|
— |
|
|
— |
|
|
12,843 |
|
|
— |
|
|
12,843 |
|
|
Net loss |
|
— |
|
|
— |
|
— |
|
|
— |
|
— |
|
|
— |
|
|
— |
|
|
(21,791) |
|
|
(21,791) |
|
|
BALANCE, December 31, 2014 |
|
1,839 |
|
|
18 |
|
3,532 |
|
|
35 |
|
58,581 |
|
|
586 |
|
|
1,064,667 |
|
|
(65,719) |
|
|
999,587 |
|
|
Preferred stock dividends |
|
— |
|
|
— |
|
— |
|
|
— |
|
— |
|
|
— |
|
|
— |
|
|
(15,960) |
|
|
(15,960) |
|
|
Restricted stock awards, net of forfeitures |
|
— |
|
|
— |
|
— |
|
|
— |
|
3,337 |
|
|
33 |
|
|
(33) |
|
|
— |
|
|
— |
|
|
Exchange of preferred stock for common stock |
|
— |
|
|
— |
|
(4) |
|
|
— |
|
10 |
|
|
— |
|
|
48 |
|
|
(48) |
|
|
— |
|
|
Stock-based compensation |
|
— |
|
|
— |
|
— |
|
|
— |
|
— |
|
|
— |
|
|
14,831 |
|
|
— |
|
|
14,831 |
|
|
Net loss |
|
— |
|
|
— |
|
— |
|
|
— |
|
— |
|
|
— |
|
|
— |
|
|
(1,454,627) |
|
|
(1,454,627) |
|
|
BALANCE, December 31, 2015 |
|
1,839 |
|
|
18 |
|
3,528 |
|
|
35 |
|
61,928 |
|
|
619 |
|
|
1,079,513 |
|
|
(1,536,354) |
|
|
(456,169) |
|
|
Preferred stock dividends |
|
— |
|
|
— |
|
— |
|
|
— |
|
967 |
|
|
10 |
|
|
7,964 |
|
|
(15,948) |
|
|
(7,974) |
|
|
Restricted stock awards, net of forfeitures |
|
— |
|
|
— |
|
— |
|
|
— |
|
4,092 |
|
|
41 |
|
|
(41) |
|
|
— |
|
|
— |
|
|
Stock-based compensation |
|
— |
|
|
— |
|
— |
|
|
— |
|
— |
|
|
— |
|
|
24,961 |
|
|
— |
|
|
24,961 |
|
|
Net loss |
|
— |
|
|
— |
|
— |
|
|
— |
|
— |
|
|
— |
|
|
— |
|
|
(256,958) |
|
|
(256,958) |
|
|
BALANCE, December 31, 2016 |
|
1,839 |
|
$ |
18 |
|
3,528 |
|
$ |
35 |
|
66,987 |
|
$ |
670 |
|
$ |
1,112,397 |
|
$ |
(1,809,260) |
|
$ |
(696,140) |
|
The accompanying notes are an integral part of these consolidated financial statements.
F-7
F-8
Sanchez Energy Corporation
Notes to the Consolidated Financial Statements (Continued)
|
|
|
|
Year Ended December 31, |
|||||||
|
2016 |
2015 |
2014 |
||||||||
|
CASH FLOWS FROM OPERATING ACTIVITIES: |
|
|
|
|
|
|
|
|
|
|
|
Net loss |
|
|
$ |
(256,958) |
|
$ |
(1,454,627) |
|
$ |
(21,791) |
|
Adjustments to reconcile net income (loss) to net cash provided by operating activities: |
|
|
|
|
|
|
|
|
|
|
|
Depreciation, depletion, amortization and accretion |
|
|
|
159,760 |
|
|
344,572 |
|
|
338,097 |
|
Impairment of oil and natural gas properties |
|
|
|
169,046 |
|
|
1,365,000 |
|
|
213,821 |
|
Gain on disposal of assets |
|
|
|
(112,294) |
|
|
— |
|
|
— |
|
Stock-based compensation expense |
|
|
|
37,090 |
|
|
14,831 |
|
|
12,843 |
|
Net (gains) losses on commodity derivative contracts |
|
|
|
53,149 |
|
|
(172,886) |
|
|
(137,205) |
|
Net cash settlement received on commodity derivative contracts |
|
|
|
122,145 |
|
|
131,123 |
|
|
5,600 |
|
Losses incurred on premiums for derivative contracts |
|
|
|
24,548 |
|
|
(121) |
|
|
(596) |
|
Cash reimbursements received for operating leasehold improvements |
|
|
|
— |
|
|
2,648 |
|
|
— |
|
(Gain) loss on investment in SPP |
|
|
|
(1,818) |
|
|
935 |
|
|
— |
|
Amortization of deferred gain on Western Catarina Midstream Divestiture |
|
|
|
(14,813) |
|
|
(3,086) |
|
|
— |
|
Amortization of debt issuance costs |
|
|
|
7,840 |
|
|
7,529 |
|
|
9,002 |
|
Accretion of debt discount, net |
|
|
|
633 |
|
|
703 |
|
|
755 |
|
Deferred taxes |
|
|
|
— |
|
|
7,443 |
|
|
(11,429) |
|
Loss on inventory market adjustment |
|
|
|
649 |
|
|
— |
|
|
— |
|
Distributions from equity investments |
|
|
|
930 |
|
|
— |
|
|
— |
|
Earnings from equity investments |
|
|
|
(3,466) |
|
|
— |
|
|
— |
|
Changes in operating assets and liabilities: |
|
|
|
|
|
|
|
|
|
|
|
Accounts receivable |
|
|
|
(9,626) |
|
|
60,480 |
|
|
(26,971) |
|
Other current assets |
|
|
|
1,504 |
|
|
(450) |
|
|
(21,633) |
|
Accounts payable |
|
|
|
(3,108) |
|
|
(25,303) |
|
|
(2,868) |
|
Accounts receivable - related entities |
|
|
|
(2,704) |
|
|
(3,311) |
|
|
(1,347) |
|
Other payables |
|
|
|
247 |
|
|
(2,290) |
|
|
1,522 |
|
Accrued liabilities |
|
|
|
8,498 |
|
|
2,813 |
|
|
51,590 |
|
Other current liabilities |
|
|
|
— |
|
|
(5,166) |
|
|
5,166 |
|
Other liabilities |
|
|
|
(1) |
|
|
1,188 |
|
|
779 |
|
Net cash provided by operating activities |
|
|
|
181,251 |
|
|
272,025 |
|
|
415,335 |
|
|
|
|
|
|
|
|
|
|
|
|
|
CASH FLOWS FROM INVESTING ACTIVITIES: |
|
|
|
|
|
|
|
|
|
|
|
Payments for oil and natural gas properties |
|
|
|
(313,342) |
|
|
(656,136) |
|
|
(791,260) |
|
Payments for other property and equipment |
|
|
|
(5,394) |
|
|
(8,123) |
|
|
(14,062) |
|
Proceeds from sale of oil and natural gas properties |
|
|
|
179,143 |
|
|
427,571 |
|
|
— |
|
Acquisition of oil and natural gas properties |
|
|
|
— |
|
|
(7,658) |
|
|
(555,942) |
|
Investment in SPP |
|
|
|
(25,000) |
|
|
— |
|
|
— |
|
Purchases of investments |
|
|
|
(36,502) |
|
|
(49,985) |
|
|
— |
|
Sale of investments |
|
|
|
92,458 |
|
|
— |
|
|
— |
|
Net cash used in investing activities |
|
|
|
(108,637) |
|
|
(294,331) |
|
|
(1,361,264) |
|
|
|
|
|
|
|
|
|
|
|
|
|
CASH FLOWS FROM FINANCING ACTIVITIES: |
|
|
|
|
|
|
|
|
|
|
|
Proceeds from borrowings |
|
|
|
60,000 |
|
|
— |
|
|
100,000 |
|
Repayment of borrowings |
|
|
|
(60,000) |
|
|
— |
|
|
(100,000) |
|
Issuance of senior notes, net of premium and discount |
|
|
|
— |
|
|
— |
|
|
1,152,250 |
|
Issuance of common stock |
|
|
|
— |
|
|
— |
|
|
176,250 |
|
Payments for offering costs |
|
|
|
— |
|
|
— |
|
|
(8,731) |
|
Financing costs |
|
|
|
(1,758) |
|
|
(400) |
|
|
(37,364) |
|
Preferred dividends paid |
|
|
|
(3,987) |
|
|
(15,960) |
|
|
(16,293) |
|
Net cash provided by (used in) financing activities |
|
|
|
(5,745) |
|
|
(16,360) |
|
|
1,266,112 |
|
|
|
|
|
|
|
|
|
|
|
|
|
Increase (decrease) in cash and cash equivalents |
|
|
|
66,869 |
|
|
(38,666) |
|
|
320,183 |
|
Cash and cash equivalents, beginning of period |
|
|
|
435,048 |
|
|
473,714 |
|
|
153,531 |
|
Cash and cash equivalents, end of period |
|
|
$ |
501,917 |
|
$ |
435,048 |
|
$ |
473,714 |
|
|
|
|
|
|
|
|
|
|
|
|
|
NON-CASH INVESTING AND FINANCING ACTIVITIES: |
|
|
|
|
|
|
|
|
|
|
|
Change in asset retirement obligations |
|
|
$ |
(2,895) |
|
$ |
(1,877) |
|
$ |
20,303 |
|
Change in accrued capital expenditures |
|
|
|
(16,829) |
|
|
(110,744) |
|
|
75,843 |
|
Capital expenditures in accounts payable |
|
|
|
— |
|
|
— |
|
|
14,545 |
|
Common stock issued in exchange for preferred stock |
|
|
|
— |
|
|
273 |
|
|
123,731 |
|
SUPPLEMENTAL DISCLOSURE: |
|
|
|
|
|
|
|
|
|
|
|
Cash paid for taxes |
|
|
$ |
1,996 |
|
$ |
158 |
|
$ |
— |
|
Cash paid for interest |
|
|
$ |
118,498 |
|
$ |
121,644 |
|
$ |
48,064 |
F-9
Sanchez Energy Corporation
Notes to the Consolidated Financial Statements (Continued)
The accompanying notes are an integral part of these consolidated financial statements.
Note 1. Organization and Business
Sanchez Energy Corporation (together with our consolidated subsidiaries, “Sanchez Energy,” the “Company,” “we,” “our,” “us” or similar terms), a Delaware corporation formed in August 2011, is an independent exploration and production company focused on the acquisition and development of U.S. onshore unconventional oil and natural gas resources, with a current focus on the horizontal development of significant resource potential from the Eagle Ford Shale in South Texas. We also hold an undeveloped acreage position in the Tuscaloosa Marine Shale (“TMS”) in Mississippi and Louisiana, which offers future upside opportunity. As of December 31, 2016, we have assembled approximately 278,000 net leasehold acres with an approximate 94% average working interest in the Eagle Ford Shale. Pro forma for the Comanche Acquisition (defined below), we will have assembled 339,000 net leasehold acres with an approximate 61% average working interest as of December 31, 2016. Following completion of the Comanche Acquisition, we will have over 7,000 gross (4,000 net) locations for potential future drilling. For the year 2017, we plan to invest substantially all of our capital budget in the Eagle Ford Shale. We continue to evaluate opportunities to increase both our acreage and our producing assets through acquisitions. Our successful acquisition of such assets will depend on both the opportunities and the financing alternatives available to us at the time we consider such opportunities. We have included definitions of some of the oil and natural gas terms used in this Annual Report on Form 10‑K in the “Glossary of Selected Oil and Natural Gas Terms.”
Note 2. Basis of Presentation and Summary of Significant Accounting Policies
Basis of Presentation
The consolidated financial statements have been prepared in accordance with accounting principles generally accepted in the United States of America (“U.S. GAAP”).
Recent Accounting Pronouncements
In January 2017, the FASB issued Accounting Standards Update (“ASU”) 2017-01 “Business Combinations (Topic 805) - Clarifying the Definition of a Business,” which provides a new framework for determining whether transactions should be accounted for as acquisitions (or disposals) of assets or businesses. This ASU is effective for public business entities for annual and interim periods in fiscal years beginning after December 15, 2017. Early adoption is permitted, and the Company is currently in the process of evaluating the impact of adoption of this guidance on its consolidated financial statements.
In December 2016, the FASB issued Accounting Standards Update ASU 2016-19 “Technical Corrections and Improvements,” which amends a number of Topics in the FASB ASC. The ASU is part of an ongoing FASB project to facilitate Codification updates for non-substantive technical corrections, clarifications, and improvements that are not expected to have a significant effect on accounting practice or create a significant administrative cost to most entities. The ASU will apply to all reporting entities within the scope of the affected accounting guidance. Most amendments are effective upon issuance (December 2016).
In November 2016, the FASB issued ASU 2016-18 “Statement of Cash Flows (Topic 230): Restricted Cash,” which requires companies to include cash and cash equivalents that have restrictions on withdrawal or use in total cash and cash equivalents on the statement of cash flows. This ASU is effective for public business entities for annual and interim periods in fiscal years beginning after December 15, 2017. Early adoption is permitted, and the Company is currently in the process of evaluating the impact of adoption of this guidance on its consolidated financial statements.
F-10
Sanchez Energy Corporation
Notes to the Consolidated Financial Statements (Continued)
In October 2016, the FASB issued ASU 2016-16 “Income Taxes (Topic 740): Intra-Entity Transfers of Assets Other Than Inventory,” which eliminates a current exception in U.S. GAAP to the recognition of the income tax effects of temporary differences that result from intra-entity transfers of non-inventory assets. The intra-entity exception is being eliminated under the ASU. The standard is required to be applied on a modified retrospective basis and will be effective beginning with the first quarter of 2018. Early adoption is permitted, and the Company is currently in the process of evaluating the impact of adoption of this guidance on its consolidated financial statements.
In August 2016, the FASB issued ASU No. 2016-15 “Statement of Cash Flows: Classification of Certain Cash Receipts and Cash Payments”. This ASU is intended to clarify the presentation of cash receipts and payments in specific situations. The amendments in this ASU are effective for financial statements issued for annual periods beginning after December 15, 2017, including interim periods within those annual periods, and early application is permitted. The Company does not anticipate that ASU 2016-15 will have a material effect on its consolidated and condensed financial statements and related disclosures.
In March 2016, the FASB issued ASU No. 2016-09 “Improvements to Employee Share-Based Payment Accounting,” effective for annual and interim periods for public companies beginning after December 15, 2016, with a cumulative-effect and prospective approach to be used for implementation. ASU 2016-09 changes several aspects of the accounting for share-based payment award transactions including accounting for income taxes, classification of excess tax benefits on the statement of cash flows, forfeitures, minimum statutory tax withholding requirements and classification of employee taxes paid on the statement of cash flows when an employer withholds shares for tax-withholding purposes. The Company is currently in the process of evaluating the impact of adoption of this guidance on its consolidated financial statements.
In February 2016, the FASB issued ASU No. 2016-02 “Leases (Topic 842),” effective for annual and interim periods for public companies beginning after December 15, 2018, with a modified retrospective approach to be used for implementation. The standard updates the previous lease guidance by requiring the recognition of a right-to-use asset and lease liability on the statement of financial position for all leases with lease terms of more than 12 months. The lease liability represents the discounted obligation to make future minimum lease payments and corresponding right-of-use asset on the balance sheet for most leases. Recognition, measurement and presentation of expenses and cash flows arising from a lease will depend on classification as a finance or operating lease. The Company has several operating leases as further discussed in Note 16, “Commitments and Contingencies,” which will be impacted by the new rules under this standard. The Company will not early adopt this standard, and will apply the revised lease rules for our interim and annual reporting periods starting January 1, 2019. The Company is currently evaluating the impact of these rules on its financial statements and has started the assessment process by evaluating the population of leases under the revised definition. The adoption of this standard will result in an increase in the assets and liabilities on the Company’s consolidated balance sheets. The quantitative impacts of the new standard are dependent on the leases in force at the time of adoption. As a result, the evaluation of the effect of the new standards will extend over future periods.
During November 2015, the FASB issued ASU 2015-17, “Balance Sheet Classification of Deferred Taxes”, which simplifies the presentation of deferred income taxes. This ASU requires that deferred tax assets and liabilities be classified as non-current in a statement of financial position by jurisdiction rather than separately presented as current and non-current portions. ASU 2015-17 is effective for fiscal years beginning after December 15, 2016, and interim periods within those annual periods. Early adoption is permitted for financial statements as of the beginning of an interim or annual reporting period. The Company chose to adopt ASU 2015-17 as of the quarter ended December 31, 2015 on a retrospective basis. Adoption of this guidance affected the balance sheets as of December 31, 2014 as follows (in thousands):
F-11
Sanchez Energy Corporation
Notes to the Consolidated Financial Statements (Continued)
Decrease in Non-current assets of approximately $33,242
Decrease in Current liabilities of approximately $33,242
In July 2015, the FASB issued ASU No. 2015-11, “Simplifying the Measurement of Inventory,” effective for annual and interim periods beginning after December 15, 2016. ASU 2015-11 changes the inventory measurement principle for entities using the first-in, first out (FIFO) or average cost methods. For entities utilizing one of these methods, the inventory measurement principle will change from lower of cost or market to the lower of cost and net realizable value. The Company is currently in the process of evaluating the impact of adoption of this guidance on its consolidated financial statements, but do not expect the impact to be material.
May 2014, the FASB issued ASU No. 2014-09, “Revenue from Contracts with Customers (Topic 606).” In March, April, and May of 2016, the FASB issued rules clarifying several aspects of the new revenue recognition standard. The new guidance is effective for fiscal years and interim periods beginning after December 15, 2017. This guidance outlines a new, single comprehensive model for entities to use in accounting for revenue arising from contracts with customers and supersedes most current revenue recognition guidance, including industry-specific guidance. This new revenue recognition model provides a five-step analysis in determining when and how revenue is recognized. The new model will require revenue recognition to depict the transfer of promised goods or services to customers in an amount that reflects the consideration a company expects to receive in exchange for those goods and services. The new standard also requires more detailed disclosures related to the nature, amount, timing, and uncertainty of revenue and cash flows arising from contracts with customers. The Company will not early adopt the standard although early adoption is permitted. The Company is currently evaluating whether to apply the retrospective approach or modified retrospective approach with the cumulative effect recognized as of the date of initial application. The Company is currently evaluating the impact the standard is expected to have on its consolidated financial statements by evaluating current revenue streams and evaluating contracts under the revised standards.
Principles of Consolidation
The Company’s consolidated financial statements include the accounts of the Company and its subsidiaries. All intercompany balances and transactions have been eliminated.
Use of Estimates
The accompanying consolidated financial statements are prepared in conformity with U.S. GAAP, which requires management to make estimates and assumptions that affect the reported amounts of assets and liabilities and disclosure of contingent assets and liabilities at the date of the financial statements and the reported amounts of revenues and expenses during the reporting period. The most significant estimates pertain to proved oil and natural gas reserves and related cash flow estimates used in the depletion and impairment of oil and natural gas properties, the evaluation of unproved properties for impairment, the fair value of commodity derivative contracts and asset retirement obligations, accrued oil and natural gas revenues and expenses and the allocation of general and administrative expenses. Actual results could differ materially from those estimates.
Cash Equivalents
Cash and cash equivalents consist primarily of cash on deposit, money market accounts and investment grade commercial paper that are readily convertible into cash and purchased with original maturities of three months or less.
F-12
Sanchez Energy Corporation
Notes to the Consolidated Financial Statements (Continued)
Oil and Natural Gas Receivables
The majority of the Company’s receivables arise from sales of oil, natural gas liquids (“NGLs”) or natural gas. The Company does not have any off‑balance‑sheet credit exposure related to its customers. Receivables from the sale of oil and natural gas are generally unsecured. Allowances for doubtful accounts are determined based on management’s assessment of the creditworthiness of the customer. Receivables are considered past due if full payment is not received by the contractual due date. Past due accounts are written off against the allowance for doubtful accounts only after all the collection attempts have been exhausted. At December 31, 2016 and 2015, management believed that all balances were fully collectible and no allowance for doubtful accounts was deemed necessary.
Oil and Natural Gas Properties
The Company’s oil and natural gas properties are accounted for using the full cost method of accounting. All direct costs and certain indirect costs associated with the acquisition, exploration and development of oil and natural gas properties are capitalized. Once evaluated, these costs, as well as the estimated costs to retire the assets, are included in the amortization base and amortized to depletion expense using the units‑of‑production method. Depletion is calculated based on estimated proved oil and natural gas reserves. Proceeds from the sale or disposition of oil and natural gas properties are applied to reduce net capitalized costs unless the sale or disposition causes a significant change in the relationship between costs and the estimated quantities of proved reserves.
Full Cost Ceiling Test—Capitalized costs (net of accumulated depreciation, depletion and amortization and deferred income taxes) of proved oil and natural gas properties are subject to a full cost ceiling limitation. The ceiling limits these costs to an amount equal to the present value, discounted at 10%, of estimated future net cash flows from estimated proved reserves less estimated future operating and development costs, abandonment costs (net of salvage value) and estimated related future income taxes. In accordance with Securities and Exchange Commission (“SEC”) rules, the oil and natural gas prices used to calculate the full cost ceiling are the 12‑month average prices, calculated as the unweighted arithmetic average of the first‑day‑of‑the‑month price for each month within the 12‑month period prior to the end of the reporting period, unless prices are defined by contractual arrangements. Prices are adjusted for “basis” or location differentials. Prices are held constant over the life of the reserves. If unamortized costs capitalized within the cost pool exceed the ceiling, the excess is charged to expense and separately disclosed during the period in which the excess occurs. Amounts thus required to be written off are not reinstated for any subsequent increase in the cost center ceiling. During the year ended December 31, 2016, the Company recorded a full cost ceiling test impairment after income taxes of $169.0 million. During the year ended December 31, 2015, the Company recorded a full cost ceiling test impairment after income taxes of $1,365 million. During the year ended December 31, 2014, the Company recorded a full cost ceiling test impairment before income taxes of $213.8 million.
Depreciation, depletion, amortization and accretion—Depreciation, depletion, amortization and accretion (“DD&A”) is provided using the units-of-production method based upon estimates of proved oil, NGL and natural gas reserves with oil, NGL and natural gas production being converted to a common unit of measure based upon their relative energy content. All capitalized costs of oil and natural gas properties, including the estimated future costs to develop proved reserves, are amortized using the units-of-production method based on total proved reserves. Investments in unproved properties and major development projects are not amortized until proved reserves associated with the projects can be determined or until impairment occurs. If the results of an assessment indicate that the properties are impaired, the amount of the impairment is added to the capitalized costs to be amortized. Once the assessment of unproved properties is complete and when major development projects are evaluated, the costs previously excluded from amortization are transferred to the full cost pool and amortization begins. The amortizable base includes estimated future
F-13
Sanchez Energy Corporation
Notes to the Consolidated Financial Statements (Continued)
development costs and where significant, dismantlement, restoration and abandonment costs, net of estimated salvage value.
In arriving at depletion rates under the units‑of‑production method, the quantities of recoverable oil and natural gas reserves are established based on estimates made by internal and third party geologists and engineers, which require significant judgment as does the projection of future production volumes and levels of future costs, including future development costs. In addition, considerable judgment is necessary in determining when unproved properties become impaired and in determining the existence of proved reserves once a well has been drilled. All of these judgments may have significant impact on the calculation of depletion and impairment expense.
Unproved Properties—Costs associated with unproved properties and properties under development are excluded from the full cost amortization base until the properties have been evaluated. Additionally, the costs associated with seismic data, leasehold acreage, and wells currently drilling are also initially excluded from the amortization base. Unproved properties are identified on a project basis, with a project being an area in which significant leasehold interests are acquired within a contiguous area. Unproved properties are reviewed periodically by management and transferred into the full cost pool subject to amortization when management determines that a project area has been evaluated through drilling operations or a thorough geologic evaluation.
Based on management’s review and current operating plans, 5%, 8% and 25% of the unproved property balance at December 31, 2016 is expected to be added to the amortization base during the years 2017, 2018 and 2019, respectively. The remaining balances in unproved properties relate to project areas that will not be thoroughly evaluated until after 2019, and represent leasehold interests that have expiration dates beginning in 2020 or leasehold interests that are currently held by production.
The table below sets forth the cost of unproved properties excluded from the amortization base as of December 31, 2016, and notes the year in which the associated costs were incurred (in thousands):
|
|
|
Year of Acquisition |
|
|||||||||||||
|
|
|
Prior to 2014 |
|
2014 |
|
2015 |
|
|
2016 |
|
Total |
|
||||
|
Leasehold acquisition costs |
|
$ |
33,052 |
|
$ |
93,505 |
|
$ |
16,587 |
|
$ |
44,053 |
|
$ |
187,197 |
|
|
Exploration costs |
|
|
2,680 |
|
|
479 |
|
|
343 |
|
|
342 |
|
|
3,844 |
|
|
Development costs |
|
|
1,040 |
|
|
3,428 |
|
|
1,442 |
|
|
34,473 |
|
|
40,383 |
|
|
Total |
|
$ |
36,772 |
|
$ |
97,412 |
|
$ |
18,372 |
|
$ |
78,868 |
|
$ |
231,424 |
|
Oil and Natural Gas Reserve Quantities
The Company’s most significant estimates relate to its proved oil and natural gas reserves. The estimates of oil and natural gas reserves as of December 31, 2016, 2015 and 2014 are based on reports prepared by a third party engineering firm, Ryder Scott Company, L.P. (“Ryder Scott”).
Estimates of proved reserves are based on the quantities of oil and natural gas that engineering and geological analyses demonstrate, with reasonable certainty, to be recoverable from established reservoirs in the future under current operating and economic parameters. Ryder Scott has historically prepared a reserve and economic evaluation of the Company’s properties, utilizing information provided to it by management and other information available, including information from the operators of the property.
F-14
Sanchez Energy Corporation
Notes to the Consolidated Financial Statements (Continued)
The standards of the Financial Accounting Standards Board (“FASB”) and rules of the SEC permit the use of new technologies to determine proved reserve estimates if those technologies have been demonstrated empirically to lead to reliable conclusions about reserve volume estimates. These rules allow, but do not require, companies to disclose their probable and possible reserves to investors in documents filed with the SEC.
In addition, the disclosure guidelines require companies to report oil and natural gas reserves using an average price based upon the prior 12-month first-day-of-the-month price rather than a period-end price.
Reserves and their relation to estimated future net cash flows impact the depletion and impairment calculations. As a result, adjustments to depletion and impairment are made concurrently with changes to reserve estimates. The reserve estimates and the projected cash flows derived from these reserve estimates are prepared in accordance with SEC guidelines. The independent engineering firm noted above adheres to these guidelines when preparing their reserve reports. The accuracy of the reserve estimates is a function of many factors including the quality and quantity of available data, the interpretation of that data, the accuracy of various mandated economic assumptions, and the judgments of the individuals preparing the estimates, all of which could deviate significantly from actual results. As such, reserve estimates may materially vary from the ultimate quantities of oil and natural gas eventually recovered.
Debt Issuance Costs
Debt issuance costs relating to long‑term debt have been deferred and are being amortized and recorded as interest expense over the term of the related debt instrument. During 2016, the Company capitalized approximately $0.1 million in costs associated with the filing of a Form S-3 Registration Statement, and capitalized approximately $1.6 million associated with amending our Second Amended and Restated Agreement (as defined in Note 5, “Long-Term Debt”). During 2015, the Company capitalized approximately $0.4 million in costs associated with amending our Second Amended and Restated Agreement. During 2014, the Company capitalized approximately $37.4 million in costs associated with the issuance of the 6.125% Notes (as defined in Note 5, “Long-Term Debt”) and costs incurred to enter into the Second Amended and Restated Credit Agreement. The Company expensed $3.9 million of debt issuance costs during 2014 in conjunction with the termination of our senior unsecured Bridge Facility (as defined in Note 5, “Long-Term Debt”) obtained in connection with the Catarina Acquisition (as defined in Note 3, “Acquisitions and Divestitures”). At December 31, 2016 and December 31, 2015, the Company had approximately $35.0 million and $41.0 million, respectively, of debt issuance costs (net of accumulated amortization of $22.5 million and $14.7 million, respectively) remaining that are being amortized over the terms of the respective debt. In accordance with ASU 2015-03, “Interest—Imputation of Interest (Subtopic 835-30): Simplifying the Presentation of Debt Issuance Costs,” the debt issuance costs related to the issuance of the 6.125% Notes and Second Amended and Restated Agreement are presented on the balance sheet as a direct deduction from the long-term debt.
Environmental Expenditures
The Company is subject to extensive federal, state and local environmental laws and regulations. These laws regulate the discharge of materials into the environment and may require the Company to remove or mitigate the environmental effects of the disposal or release of petroleum or chemical substances at various sites. Environmental expenditures are expensed or capitalized depending on their future economic benefit. Expenditures that relate to an existing condition caused by past operations and that have no future economic benefits are expensed. Liabilities for expenditures of a non‑capital nature are recorded when environmental assessment and/or remediation is probable, and the costs can be reasonably estimated. Such liabilities are generally not discounted unless the timing of cash payments for the liability or component is fixed or reliably determinable.
F-15
Sanchez Energy Corporation
Notes to the Consolidated Financial Statements (Continued)
Liabilities for loss contingencies, including environmental remediation costs arising from claims, assessments, litigation, fines, and penalties and other sources, are recorded when it is probable that a liability has been incurred and the amount of the assessment and/or remediation can be reasonably estimated. Recoveries of environmental remediation costs from third parties, which are probable of realization, are separately recorded and are not offset against the related environmental liability.
Management believes the Company is currently in compliance with all applicable federal, state and local regulations associated with its properties. Accordingly, no environmental remediation liability or loss associated with the Company’s properties was recorded as of December 31, 2016 and 2015.
Asset Retirement Obligations
Asset retirement obligations represent the present value of the estimated cash flows expected to be incurred to plug, abandon and remediate producing properties, excluding salvage values, at the end of their productive lives in accordance with applicable laws. The significant unobservable inputs to this fair value measurement include estimates of plugging, abandonment and remediation costs, well life, inflation and credit-adjusted risk-free rate. The inputs are calculated based on historical data as well as current estimates. When the liability is initially recorded, the carrying amount of the related long-lived asset is increased. Over time, accretion of the liability is recognized each period, and the capitalized cost is amortized over the useful life of the related asset. Upon settlement of the liability, any gain or loss is treated as an adjustment to the full cost pool.
To estimate the fair value of an asset retirement obligation, the Company employs a present value technique, which reflects certain assumptions, including its credit‑adjusted risk‑free interest rate, inflation rate, the estimated settlement date of the liability and the estimated current cost to settle the liability. Changes in timing or to the original estimate of cash flows will result in change to the carrying amount of the liability.
Stock‑Based Compensation
The Company records stock-based compensation expense for awards granted to its directors (for their services as directors) in accordance with the provisions of Accounting Standards Codification (“ASC”) Topic 718, “Compensation—Stock Compensation.” Stock-based compensation expense for these awards is based on the grant-date fair value and recognized over the vesting period using the straight-line method.
Stock-based compensation awards and phantom stock awards, including those awards with market performance acceleration conditions, granted to employees of the Sanchez Group (as defined in Note 7, “Stock-Based Compensation”) (including those employees of the Sanchez Group who also serve as the Company’s officers) and consultants in exchange for services are considered awards to non-employees and the Company records stock-based compensation expense for these awards at fair value in accordance with the provisions of ASC 505-50, “Equity-Based Payments to Non-Employees.” For awards granted to non-employees, the Company records compensation expenses equal to the fair value of the stock-based award at the measurement date, which is determined to be the earlier of the performance commitment date or the service completion date. Compensation expense for unvested awards to non-employees is revalued at each period end and is amortized over the vesting period of the stock-based award. Stock-based payments are measured based on the fair value of the equity instruments granted, as it is more determinable than the value of the services rendered. In accordance with the guidance, the inclusion of market performance acceleration conditions does not change the accounting classification as compared to those awards without market performance acceleration conditions. The phantom stock awards are required to be settled in cash by the Company and are classified
F-16
Sanchez Energy Corporation
Notes to the Consolidated Financial Statements (Continued)
as a liability. Compensation expense for the unvested awards is revalued at each period end and is amortized over the vesting period of the stock-based award.
Revenue Recognition
Oil, NGL and natural gas sales are recognized when production is sold to a purchaser at a fixed or determinable price, delivery has occurred, title has transferred, and collectability of the revenue is probable. Delivery occurs and title is transferred when production has been delivered to a pipeline, railcar or truck, or a tanker lifting has occurred. The sales method of accounting is used for oil, NGL and natural gas sales. Oil and natural gas imbalances are generated on properties for which two or more owners have the right to take production “in‑kind” and, in doing so, take more or less than their respective entitled percentage. As of December 31, 2016, 2015 and 2014 there were no material oil and natural gas imbalances.
Sales to Major Customers
The Company’s oil, NGL and natural gas production was sold to certain customers representing 10% or more of its total revenues for the years ended December 31, 2016, 2015 and 2014 as listed below:
|
|
|
2016 |
|
2015 |
|
2014 |
|
|
Customer A |
|
4% |
|
7% |
|
23% |
|
|
Customer B |
|
14% |
|
14% |
|
4% |
|
|
Customer C |
|
0% |
|
4% |
|
15% |
|
|
Customer D |
|
33% |
|
38% |
|
37% |
|
|
Customer E |
|
20% |
|
0% |
|
0% |
|
Production is normally sold to relatively few customers. Substantially all of the Company’s customers are concentrated in the oil and natural gas industry and revenue can be materially affected by current economic conditions, the price of certain commodities such as crude oil and natural gas and the availability of alternate purchasers. Management believes the loss of any of the Company’s major customers would not have a long‑term material adverse effect on the Company’s operations.
General and Administrative Expenses
On December 19, 2011, the Company entered into a services agreement and other related agreements with Sanchez Oil & Gas Corporation (“SOG”), pursuant to which SOG (directly or through its subsidiaries) agreed to provide the Company with the services and data that the Company believes are necessary to manage, operate and grow its business, and the Company agreed to reimburse SOG for all direct and indirect costs incurred on its behalf. See detailed discussion of the Company’s relationship with SOG in Note 9, “Related Party Transactions.”
Derivative Instruments
The Company utilizes derivative instruments in order to manage price risk associated with future crude oil and natural gas production. Management sets and implements all of the hedging policies, including volumes, types of instruments and counterparties, on a monthly basis. The Company recognizes all derivatives as either assets or liabilities, measured at fair value, and recognizes changes in the fair value of derivatives in current earnings because it does not designate its derivatives as cash flow hedges.
F-17
Sanchez Energy Corporation
Notes to the Consolidated Financial Statements (Continued)
Income Taxes
The Company accounts for income taxes using the asset and liability method. Deferred tax assets and liabilities arise from the expected future tax consequences of temporary differences between the book carrying amounts and the tax basis of assets and liabilities. Deferred tax assets and liabilities are measured using enacted tax rates expected to apply to taxable income in the years in which those temporary difference and carryforwards are expected to be recovered or settled. The effect on deferred tax assets and liabilities of a change in tax rates is recognized in income in the period that includes the enactment date. Valuation allowances are established when necessary to reduce the deferred tax asset to the amount more likely than not to be recovered.
Additionally, the Company is required to determine whether it is more likely than not (a likelihood of more than 50%) that a tax position will be sustained upon examination, including resolution of any related appeals or litigation processes, based on the technical merits of the position in order to record any financial statement benefit. If that step is satisfied, then the Company must measure the tax position to determine the amount of benefit to recognize in the financial statements. The tax position is measured at the largest amount of benefit that has greater than a 50% likelihood of being realized upon ultimate settlement. Any interest or penalties would be recognized as a component of income tax expense.
The Company applies significant judgment in evaluating its tax positions and estimating its provision for income taxes. During the ordinary course of business, there are many transactions and calculations for which the ultimate tax determination is uncertain. The actual outcome of these future tax consequences could differ significantly from these estimates, which could impact the Company’s financial position, results of operations and cash flows. The Company does not have any material uncertain tax positions during the years ended December 31, 2016 or 2015.
Earnings per Share
Basic net income (loss) per common share are computed using the two-class method. The two-class method is required for those entities that have participating securities. The two-class method is an earnings allocation formula that determines net income (loss) per share for participating securities according to dividends declared (or accumulated) and participation rights in undistributed earnings. The Company’s restricted shares of common stock (see Note 7, “Stock‑Based Compensation”) are participating securities under ASC 260, “Earnings per Share,” because they may participate in undistributed earnings with common stock. Participating securities do not have a contractual obligation to share in the Company’s losses. Therefore, in periods of net loss, no portion of the loss is allocated to participating securities.
Diluted net income (loss) per common share reflect the dilutive effects of the participating securities using the two-class method or the treasury stock method, whichever is more dilutive. They also reflect the effects of the potential conversion of the Company’s Series A and Series B Preferred Stock using the if‑converted method, if the effect is dilutive.
Note 3. Acquisitions and Divestitures
Our acquisitions are accounted for under the acquisition method of accounting in accordance with ASC Topic 805, “Business Combinations” (“ASC Topic 805”). A business combination may result in the recognition of a gain or goodwill based on the measurement of the fair value of the assets acquired at the acquisition date as compared to the fair value of consideration transferred, adjusted for purchase price adjustments. The initial accounting for acquisitions may
F-18
Sanchez Energy Corporation
Notes to the Consolidated Financial Statements (Continued)
not be complete and adjustments to provisional amounts, or recognition of additional assets acquired or liabilities assumed, may occur as more detailed analyses are completed and additional information is obtained about the facts and circumstances that existed as of the acquisition dates. The results of operations of the properties acquired in our acquisitions have been included in the consolidated financial statements since the closing dates of the acquisitions.
Catarina Acquisition
On June 30, 2014, we completed the Catarina Acquisition for an aggregate adjusted purchase price of $557.1 million. The effective date of the transaction was January 1, 2014. The purchase price was funded with a portion of the proceeds from the issuance of the $850 million senior unsecured 6.125% notes due 2023 (the ‘‘Original 6.125% Notes’’) and cash on hand. The purchase price allocation for the Catarina Acquisition is preliminary and is subject to further adjustments and the settlement of certain post-closing adjustments with the seller. The total purchase price was allocated to the assets purchased and liabilities assumed based upon their fair values on the date of acquisition as follows (in thousands):
|
Proved oil and natural gas properties |
|
$ |
446,906 |
|
|
Unproved properties |
|
|
122,224 |
|
|
Other assets acquired |
|
|
2,682 |
|
|
Fair value of assets acquired |
|
|
571,812 |
|
|
Asset retirement obligations |
|
|
(14,723) |
|
|
Fair value of net assets acquired |
|
$ |
557,089 |
|
Cotulla Disposition
On December 14, 2016, SN Cotulla Assets, LLC (“SN Cotulla”), a wholly-owned subsidiary of the Company, completed the initial closing of the sale of certain oil and gas interests and associated assets located in Dimmit County, Frio County, LaSalle County, Zavala County and McMullen County, Texas (the “Cotulla Assets”) to Carrizo (Eagle Ford) LLC (“Carrizo Eagle Ford”), pursuant to a Purchase and Sale Agreement dated October 24, 2016 for an adjusted purchase price of approximately $153.5 million (the “Cotulla Disposition”). The effective date of the Cotulla Disposition is June 1, 2016. Subsequent to December 31, 2016, a second closing on an additional portion of the Cotulla Assets was completed for cash consideration of approximately $7.1 million, and the Cotulla Disposition remains subject to post-closing adjustments and potential future closings.
Normally, sales of oil and gas properties are accounted for as adjustments to capitalized costs with no gain or loss recognized. However, in circumstances where treating a sale like a normal retirement would result in a significant change in the company’s amortization rate, judgment should be applied. The Company determined that adjustments to capitalized costs for the Cotulla Disposition would cause a significant change in the company’s amortization rate. As such, the Company recorded a gain of approximately $112.3 million related to the Cotulla Disposition. The Company expects to record additional gains related to the potential future closings on the Cotulla Disposition in 2017, as noted above.
Production Asset Transaction
On November 22, 2016, the Company completed the sale of certain non-core producing oil and gas assets, located in South Texas, to SPP for an adjusted purchase price of approximately $25.6 million in cash (the “Production Asset Transaction”). The Production Asset Transaction includes working interests in 23 producing Eagle Ford wellbores located in Dimmit and Zavala counties in South Texas together with escalating working interests in an additional 11
F-19
Sanchez Energy Corporation
Notes to the Consolidated Financial Statements (Continued)
producing wellbores located in the Palmetto Field in Gonzales County, Texas. The effective date of the Production Asset Transaction was July 1, 2016. The aggregate average working interest percentage initially conveyed was 17.92% per wellbore and, upon January 1 of each subsequent year after the closing, the purchaser’s working interest will automatically increase in incremental amounts according to the purchase agreement until January 1, 2018, at which point the purchaser will own a 47.5% working interest and we will own a 2.5% working interest in each of the wellbores. The Company did not record any gains or losses related to the Production Asset Transaction.
Western Catarina Midstream Divestiture
On October 14, 2015, the Company and SN Catarina, LLC (“SN Catarina”) completed the sale of SN Catarina’s interests in Catarina Midstream, LLC, a wholly-owned subsidiary of SN Catarina (“Catarina Midstream”), which as of the closing included certain midstream gathering lines and associated assets and interests located in Dimmit County and Webb County, Texas and 105,263 SPP Common Units to SPP for an adjusted purchase price of $345.8 million in cash (the “Western Catarina Midstream Divestiture”). In connection with the closing of the Western Catarina Midstream Divestiture, SN Catarina and Catarina Midstream entered into a Firm Gathering and Processing Agreement (the “Gathering Agreement”) on October 14, 2015 for an initial term of 15 years under which production from approximately 35,000 acres in Dimmit County and Webb County, Texas will be dedicated for gathering by Catarina Midstream. In addition, for the first five years of the Gathering Agreement, SN Catarina will be required to meet a minimum quarterly volume delivery commitment of 10,200 barrels per day of crude oil and condensate and 142,000 Mcf per day of natural gas, subject to certain adjustments. SN Catarina will be required to pay gathering and processing fees of $0.96 per barrel for crude oil and condensate and $0.74 per Mcf for natural gas that are tendered through the gathering system, in each case, subject to an annual escalation for a positive increase in the consumer price index. In addition, SN Catarina has, under certain circumstances, a right of first refusal during the term of the agreement and afterwards with respect to dispositions by Catarina Midstream of its ownership interest in the gathering system. The Company recorded a deferred gain of approximately $74.1 million as a result of Gathering Agreement being accounted for as an operating lease. This deferred gain will be amortized straight-line over the firm commitment term of five years as an offset to the transportation fees paid to SPP under the Gathering Agreement.
Palmetto Disposition
On March 31, 2015, we completed our disposition to a subsidiary of Sanchez Production Partners LP (“SPP”) of escalating amounts of partial working interests in 59 wellbores located in Gonzales County, Texas (the “Palmetto Disposition”) for an adjusted sales price of approximately $83.4 million. The effective date of the transaction was January 1, 2015. The aggregate average working interest percentage initially conveyed was 18.25% per wellbore and, upon January 1 of each subsequent year after the closing, the purchaser’s working interest will automatically increase in incremental amounts according to the purchase agreement until January 1, 2019, at which point the purchaser will own a 47.5% working interest and we will own a 2.5% working interest in each of the wellbores. We received consideration consisting of approximately $83.0 million (approximately $81.4 million as adjusted) cash and 1,052,632 common units of SPP (the “SPP Common Units”) valued at approximately $2.0 million as of the date of the closing. These SPP Common Units were later sold back to SPP in October 2015 as part of the Western Catarina Midstream Divestiture described below. The Company did not record any gains or losses related to the Palmetto Disposition.
F-20
Sanchez Energy Corporation
Notes to the Consolidated Financial Statements (Continued)
Note 4. Cash and Cash Equivalents
As of December 31, 2016 and 2015, cash and cash equivalents consisted of the following (in thousands):
|
|
|
December 31, |
|
||||
|
|
|
2016 |
|
2015 |
|
||
|
Cash at banks |
|
$ |
58,269 |
|
$ |
35,600 |
|
|
Money market funds |
|
|
443,648 |
|
|
399,448 |
|
|
Total cash and cash equivalents |
|
$ |
501,917 |
|
$ |
435,048 |
|
Note 5. Long‑Term Debt
Long-term debt as of December 31, 2016 consisted of $1.15 billion face value of 6.125% senior notes (the “6.125% Notes,” consisting of $850 million in Original 6.125% Notes and $300 million in Additional 6.125% Notes (defined below), which were issued at a premium to face value of $2.3 million) maturing on January 15, 2023, and $600 million principal amount of 7.75% senior notes (the “7.75% Notes,” consisting of $400 million in Original 7.75% Notes (defined below) and $200 million in Additional 7.75% Notes, which were issued at a discount to face value of $7.0 million), maturing on June 15, 2021. During the first quarter 2016, the Company adopted ASU 2015-03 retrospectively to the comparable periods in this Form 10-Q. Adoption of this guidance affected the balance sheets as of December 31, 2015 as follows (in thousands):
Decrease in Long term debt, net of premium, discount and debt issuance costs of approximately $41,039
Decrease in Debt issuance costs, net (Other Assets) of approximately $41,039
As of December 31, 2016 and 2015 the Company’s long-term debt consisted of the following:
|
|
|
|
|
|
|
Amount Outstanding |
|
||||
|
|
|
|
|
|
|
(in thousands) as of |
|
||||
|
|
|
|
|
|
|
December 31, |
|
December 31, |
|
||
|
|
|
Interest Rate |
|
Maturity date |
|
2016 |
|
2015 |
|
||
|
Second Amended and Restated Credit Agreement |
|
Variable |
|
June 30, 2019 |
|
$ |
— |
|
$ |
— |
|
|
7.75% Notes |
|
7.75% |
|
June 15, 2021 |
|
|
600,000 |
|
|
600,000 |
|
|
6.125% Notes |
|
6.125% |
|
January 15, 2023 |
|
|
1,150,000 |
|
|
1,150,000 |
|
|
|
|
|
|
|
|
|
1,750,000 |
|
|
1,750,000 |
|
|
Unamortized discount on Additional 7.75% Notes |
|
|
|
|
|
|
(4,030) |
|
|
(4,933) |
|
|
Unamortized premium on Additional 6.125% Notes |
|
|
|
|
|
|
1,629 |
|
|
1,899 |
|
|
Unamortized debt issuance costs |
|
|
|
|
|
|
(34,832) |
|
|
(41,039) |
|
|
Total long-term debt |
|
|
|
|
|
$ |
1,712,767 |
|
$ |
1,705,927 |
|
F-21
Sanchez Energy Corporation
Notes to the Consolidated Financial Statements (Continued)
The components of interest expense are (in thousands):
|
|
|
|
|
|
|
|
|
|
|
|
|
|
|
Year Ended December 31, |
|
|||||||
|
|
|
|
2016 |
|
|
2015 |
|
|
2014 |
|
|
Interest on Senior Notes |
|
$ |
(116,938) |
|
$ |
(116,938) |
|
$ |
(78,479) |
|
|
Interest expense and commitment fees on credit agreement |
|
|
(1,561) |
|
|
(1,229) |
|
|
(1,564) |
|
|
Amortization of debt issuance costs |
|
|
(7,840) |
|
|
(7,529) |
|
|
(9,002) |
|
|
Amortization of discount on Additional 7.75% Notes |
|
|
(904) |
|
|
(904) |
|
|
(905) |
|
|
Amortization of premium on Additional 6.125% Notes |
|
|
270 |
|
|
201 |
|
|
150 |
|
|
Total interest expense |
|
$ |
(126,973) |
|
$ |
(126,399) |
|
$ |
(89,800) |
|
Credit Facility
Previous Credit Agreement: On May 31, 2013, we and our subsidiaries, SEP Holdings III, LLC (“SEP III”), SN Marquis LLC (“SN Marquis”) and SN Cotulla, collectively, as the borrowers, entered into a revolving credit facility represented by a $500 million Amended and Restated Credit Agreement with Royal Bank of Canada as the administrative agent and collateral agent, and the lenders party thereto (the “Amended and Restated Credit Agreement”). The Amended and Restated Credit Agreement was to mature on May 31, 2018.
On May 12, 2014, the Company borrowed $100 million under the Amended and Restated Credit Agreement. The Company used proceeds from the issuance of the Original 6.125% Notes to repay the $100 million outstanding.
Second Amended and Restated Credit Agreement: On June 30, 2014, the Company, as borrower, and SEP III, SN Marquis, SN Cotulla, SN Operating, LLC, SN TMS, LLC and SN Catarina, LLC as loan parties, entered into a revolving credit facility represented by a $1.5 billion Second Amended and Restated Credit Agreement with Royal Bank of Canada, as the administrative agent and collateral agent, and the lenders party thereto (together with all subsequent amendments, the ‘‘Second Amended and Restated Credit Agreement’’). The Second Amended and Restated Credit Agreement provides for the issuance of letters of credit, limited in the aggregate to the lesser of $80 million and the total availability thereunder. As of December 31, 2016, there were no borrowings and no letters of credit outstanding under the Second Amended and Restated Credit Agreement, which had a borrowing base of $350 million and aggregate elected commitments of $300 million. Availability under the Second Amended and Restated Credit Agreement is at all times subject to customary conditions and the then applicable borrowing base and aggregate elected commitment amount. All of the $300 million aggregate elected commitment amount was available for future revolver borrowings as of December 31, 2016.
The Second Amended and Restated Credit Agreement matures on June 30, 2019. The borrowing base under the Second Amended and Restated Credit Agreement is redetermined semi-annually by the lenders based on, among other things, an evaluation of the Company’s and its restricted subsidiaries’ oil and natural gas reserves. Semi-annual redeterminations of the borrowing base are generally scheduled to occur on or before April 1 and October 1 of each year. The borrowing base is also subject to (i) automatic reduction by 25% of the amount of any increase in the aggregate amount of the Company’s high yield debt and second lien debt, other than high yield or second lien debt issued in exchange for or to refinance existing high yield debt, permitted second lien debt incurred to refinance or replace permitted second lien debt, and permitted second lien debt representing the payment of interest in kind, (ii) interim redetermination at the election of the Company once between each scheduled redetermination, (iii) interim redetermination at the election of a majority of the lenders once between each scheduled redetermination, and (iv) if the
F-22
Sanchez Energy Corporation
Notes to the Consolidated Financial Statements (Continued)
required lenders so direct, in connection with asset sales and swap terminations during the period since the most recent borrowing base determination with a combined borrowing base value of more than 10% of the value of the proved developed oil and gas properties included in the most recent reserve report, a reduction in an amount equal to the borrowing base value, as determined by the administrative agent in its reasonable judgment, of such assets and swaps
The Company’s obligations under the Second Amended and Restated Credit Agreement are guaranteed by all of the Company’s existing and future subsidiaries not designated as “unrestricted subsidiaries” and secured by a first priority lien on substantially all of the Company’s assets and the assets of its existing and future subsidiaries including the SPV, defined below, an “unrestricted subsidiary,” but excluding other subsidiaries designated as “unrestricted subsidiaries,” including a first priority lien on all ownership interests in existing and future subsidiaries not designated as “unrestricted subsidiaries.”
At the Company’s election, interest on borrowings under the Second Amended and Restated Credit Agreement may be calculated based on an alternate base rate or an adjusted eurodollar (LIBOR) rate, plus an applicable margin. The applicable margin varies from 1.00% to 2.00% for alternate base rate borrowings and from 2.00% to 3.00% for eurodollar (LIBOR) borrowings and letters of credit, if any, depending on the Company’s utilization of the borrowing base. The Company is also required to pay a commitment fee of 0.50% per annum on any unused aggregate elected commitment amount.
The Second Amended and Restated Credit Agreement contains various affirmative and negative covenants and events of default that limit the Company’s ability to, among other things, incur indebtedness, make restricted payments, grant liens, consolidate or merge, dispose of certain assets, make investments, engage in transactions with affiliates, enter into hedge transactions and make acquisitions. The Second Amended and Restated Credit Agreement also provides for cross default between the Second Amended and Restated Credit Agreement and the other debt (including debt under the 6.125% Notes and the 7.75% Notes) and obligations in respect of hedging agreements (on a mark-to-market basis), of the Company and its restricted subsidiaries, in an aggregate principal amount in excess of $10 million. Furthermore, the Second Amended and Restated Credit Agreement contains financial covenants that require the Company to satisfy the following tests: (i) current assets plus undrawn borrowing capacity on the Second Amended and Restated Credit Agreement to current liabilities of at least 1.0 to 1.0 at all times, and (ii) net first lien debt (defined as the excess of first lien debt over cash) to consolidated last twelve months EBITDA of not greater than 2.00 to 1.0 as of the last day of any fiscal quarter. As of December 31, 2016, the Company was in compliance with the covenants of the Second Amended and Restated Credit Agreement.
The Second Amended and Restated Credit Amendment, among other things, also (a) permits the repurchase by the Company and its restricted subsidiaries, or by a special purpose unrestricted subsidiary of the Company (the “SPV”), of the Company’s senior unsecured notes and common and preferred equity securities, from cash in excess of lender credit exposure in an aggregate amount up to approximately $298.5 million subject to certain caps on purchases of the Company’s common and preferred equity securities and other limitations; (b) permits (i) the formation and capitalization of the SPV with up to $150 million, (ii) the SPV to purchase, hold and dispose of, including by way of distribution to its immediate parent, up to $150 million of the Company’s senior unsecured notes and common and preferred equity securities, (iii) the SPV to hold cash received from its immediate parent in a deposit account maintained with a lender under the Second Amended and Restated Credit Agreement, and (iv) the SPV to distribute cash to its immediate parent; (c) requires (i) the Company to cause the SPV to distribute all cash held by it or in its name as of the close of business on December 31, 2016 to its immediate parent, (ii) the equity interests in the SPV to be pledged in favor of the secured parties and (iii) the Company to maintain all deposits, securities and commodity accounts with lenders or affiliates of lenders under the Second Amended and Restated Credit Agreement and to enter into account control agreements in favor of the administrative agent for the benefit of the secured parties in respect of each of such accounts; (d) provides that, in
F-23
Sanchez Energy Corporation
Notes to the Consolidated Financial Statements (Continued)
the event of a borrowing base deficiency, the Company shall use unrestricted cash of the Company and its subsidiaries in excess of $35 million to prepay borrowings and cash collateralize letter of credit exposure, as applicable; and (e) restricts the Company from increasing its aggregate elected commitment amount until the lenders’ next regularly scheduled borrowing base redetermination, which is expected to occur in the fourth quarter 2016.
From time to time, the agents, arrangers, book runners and lenders under the Second Amended and Restated Credit Agreement and their affiliates have provided, and may provide in the future, investment banking, commercial lending, hedging and financial advisory services to the Company and its affiliates in the ordinary course of business, for which they have received, or may in the future receive, customary fees and commissions for these transactions.
7.75% Senior Notes Due 2021
On June 13, 2013, we completed a private offering of $400 million in aggregate principal amount of the Company’s 7.75% senior notes that will mature on June 15, 2021 (the “Original 7.75% Notes”). Interest on the notes is payable on each June 15 and December 15. We received net proceeds from this offering of approximately $388 million, after deducting initial purchasers’ discounts and offering expenses, which we used to repay outstanding indebtedness under our credit facilities. The Original 7.75% Notes are senior unsecured obligations and are guaranteed on a joint and several senior unsecured basis by, with certain exceptions, substantially all of our existing and future subsidiaries.
On September 18, 2013, we issued an additional $200 million in aggregate principal amount of our 7.75% senior notes due 2021 (the “Additional 7.75% Notes” and, together with the Original 7.75% Notes, the “7.75% Notes”) in a private offering at an issue price of 96.5% of the principal amount of the Additional 7.75% Notes. We received net proceeds of $188.8 million (after deducting the initial purchasers’ discounts and offering expenses of $4.2 million) from the sale of the Additional 7.75% Notes. The Company also received cash for accrued interest from June 13, 2013 through the date of issuance of $4.1 million, for total net proceeds of $192.9 million from the sale of the Additional 7.75% Notes. The Additional 7.75% Notes were issued under the same indenture as the Original 7.75% Notes, and are, therefore, treated as a single class of securities under the indenture. We used the net proceeds from the offering to partially fund our acquisition of contiguous acreage in McMullen County, Texas (the “Wycross Acquisition”) completed in October 2013, a portion of the 2013 and 2014 capital budgets, and for general corporate purposes.
The 7.75% Notes are senior unsecured obligations and rank equally in right of payment with all of our existing and future senior unsecured indebtedness. The 7.75% Notes rank senior in right of payment to our future subordinated indebtedness. The 7.75% Notes are effectively junior in right of payment to all of our existing and future secured debt (including under our Second Amended and Restated Credit Agreement) to the extent of the value of the assets securing such debt. The 7.75% Notes are fully and unconditionally guaranteed (except for customary release provisions) on a joint and several senior unsecured basis by the subsidiary guarantors party to the indenture governing the 7.75% Notes. To the extent set forth in the indenture governing the 7.75% Notes, certain of our subsidiaries will be required to fully and unconditionally guarantee the 7.75% Notes on a joint and several senior unsecured basis in the future.
The indenture governing the 7.75% Notes, among other things, restricts our ability and our restricted subsidiaries’ ability to: (i) incur, assume, or guarantee additional indebtedness or issue certain types of equity securities; (ii) pay distributions on, purchase or redeem shares or purchase or redeem subordinated debt; (iii) make certain investments; (iv) enter into certain transactions with affiliates; (v) create or incur liens on their assets; (vi) sell assets; (vii) consolidate, merge or transfer all or substantially all of their assets; (viii) restrict distributions or other payments from the Company’s restricted subsidiaries; and (ix) designate subsidiaries as unrestricted subsidiaries.
F-24
Sanchez Energy Corporation
Notes to the Consolidated Financial Statements (Continued)
We have the option to redeem all or a portion of the 7.75% Notes, at any time on or after June 15, 2017 at the applicable redemption prices specified in the indenture plus accrued and unpaid interest. We may also redeem the 7.75% Notes, in whole or in part, at a redemption price equal to 100% of their principal amount plus a make whole premium, together with accrued and unpaid interest and additional interest, if any, to the redemption date, at any time prior to June 15, 2017. In addition, we may be required to repurchase the 7.75% Notes upon a change of control or if we sell certain of our assets.
On July 18, 2014, we completed an exchange offer of $600 million aggregate principal amount of the 7.75% Notes that had been registered under the Securities Act of 1933, as amended (the “Securities Act”), for an equal amount of the 7.75% Notes that had not been registered under the Securities Act.
6.125% Senior Notes Due 2023
On June 27, 2014, the Company completed a private offering of $850 million in aggregate principal amount senior unsecured 6.125% notes due 2023 (the Original 6.125% Notes). Interest on the notes is payable on each July 15 and January 15. The Company received net proceeds from this offering of approximately $829 million, after deducting initial purchasers’ discounts and estimated offering expenses, which the Company used to repay all of the $100 million in borrowings outstanding under its Amended and Restated Credit Agreement and to finance a portion of the purchase price of the Catarina Acquisition. We used the remaining proceeds from the offering to fund a portion of the remaining 2014 capital budget and for general corporate purposes. The Original 6.125% Notes are the senior unsecured obligations of the Company and are guaranteed on a joint and several senior unsecured basis by, with certain exceptions, substantially all of the Company’s existing and future subsidiaries.
On September 12, 2014, we issued an additional $300 million in aggregate principal amount of our 6.125% senior notes due 2023 (the “Additional 6.125% Notes” and, together with the Original 6.125% Notes, the “6.125% Notes” and, together with the 7.75% Notes, the “Senior Notes”) in a private offering at an issue price of 100.75% of the principal amount of the Additional 6.125% Notes. We received net proceeds of $295.9 million, after deducting the initial purchasers’ discounts, adding premiums to face value of $2.3 million and deducting estimated offering expenses of $6.4 million. The Company also received cash for accrued interest from June 27, 2014 through the date of the issuance of $3.8 million, for total net proceeds of $299.7 million from the sale of the Additional 6.125% Notes. The Additional 6.125% Notes were issued under the same indenture as the Original 6.125% Notes, and are therefore treated as a single class of securities under the indenture. We used a portion of the net proceeds from the offering to fund a portion of the 2014 capital budget and used the remainder of the net proceeds to fund a portion of the 2015 capital budget, and for general corporate purposes.
The 6.125% Notes are senior unsecured obligations and rank equally in right of payment with all of our existing and future senior unsecured indebtedness. The 6.125% Notes rank senior in right of payment to the Company’s future subordinated indebtedness. The 6.125% Notes are effectively junior in right of payment to all of the Company’s existing and future secured debt (including under the Second Amended and Restated Credit Agreement) to the extent of the value of the assets securing such debt. The 6.125% Notes are fully and unconditionally guaranteed (except for customary release provisions) on a joint and several senior unsecured basis by the subsidiary guarantors party to the indenture governing the 6.125% Notes. To the extent set forth in the indenture governing the 6.125% Notes, certain of our subsidiaries will be required to fully and unconditionally guarantee the 6.125% Notes on a joint and several senior unsecured basis in the future.
The indenture governing the 6.125% Notes, among other things, restricts our ability and our restricted subsidiaries’ ability to: (i) incur, assume or guarantee additional indebtedness or issue certain types of equity securities;
F-25
Sanchez Energy Corporation
Notes to the Consolidated Financial Statements (Continued)
(ii) pay distributions on, purchase or redeem shares or purchase or redeem subordinated debt; (iii) make certain investments; (iv) enter into certain transactions with affiliates; (v) create or incur liens on their assets; (vi) sell assets; (vii) consolidate, merge or transfer all or substantially all of their assets; (viii) restrict distributions or other payments from the Company’s restricted subsidiaries; and (ix) designate subsidiaries as unrestricted subsidiaries.
The Company has the option to redeem all or a portion of the 6.125% Notes, at any time on or after July 15, 2018 at the applicable redemption prices specified in the indenture plus accrued and unpaid interest. The Company may also redeem the 6.125% Notes, in whole or in part, at a redemption price equal to 100% of their principal amount plus a make whole premium, together with accrued and unpaid interest and additional interest, if any, to the redemption date, at any time prior to July 15, 2018. In addition, the Company may redeem up to 35% of the 6.125% Notes prior to July 15, 2017 under certain circumstances with an amount not greater than the net cash proceeds of one or more equity offerings at the redemption price specified in the indenture. The Company may also be required to repurchase the 6.125% Notes upon a change of control or if we sell certain Company assets.
On February 27, 2015, we completed an exchange offer of $1.15 billion aggregate principal amount of the 6.125% Notes that had been registered under the Securities Act, for an equal amount of the 6.125% Notes that had not been registered under the Securities Act.
Pursuant to tripartite agreements by and among the Company, U.S. Bank National Association (“U.S. Bank”) and Delaware Trust Company (“Delaware Trust”), effective May 20, 2016, U.S. Bank resigned as the Trustee, Notes Custodian, Registar and Paying Agent (“Trustee”) under the indentures of the Senior Notes and Delaware Trust was appointed as successor Trustee. No other changes to the indentures for the 6.125% Notes or the 7.75% Notes were made at the time of the change in Trustee.
Note 6. Stockholders’ Equity
Common Stock Offerings— On September 18, 2013, the Company completed a public offering of 11,040,000 shares of common stock (including 1,440,000 shares purchased pursuant to the full exercise of the underwriters’ overallotment option), at an issue price of $23.00 per share. The Company received net proceeds from this offering of $241.4 million, after deducting underwriters’ fees and offering expenses of $12.5 million. The Company used the net proceeds from the offering to partially fund the Wycross Acquisition completed in October 2013 and a portion of the 2013 and 2014 capital budgets, and for general corporate purposes.
On June 12, 2014, the Company completed a public offering of 5,000,000 shares of common stock, at an issue price of $35.25 per share. The Company received net proceeds from this offering of $167.5 million, after deducting underwriters’ fees and offering expenses of $8.7 million. The Company used the net proceeds from the offering to partially fund the 2014 capital budget and for general corporate purposes.
As discussed further below in Note 19, “Subsequent Events,” on February 6, 2017, the Company completed a public offering of 11,500,000 shares of common stock (including 1,500,000 shares purchased pursuant to the full exercise of the underwriters’ overallotment option), at an issue price of $12.50 per share. The Company received net proceeds from this offering of $135.9 million, after deducting underwriters’ discounts fees of approximately $7.8 million.
Series A Preferred Stock Offering—On September 17, 2012, the Company completed a private placement of 3,000,000 shares of Series A Preferred Stock, which were sold to a group of qualified institutional buyers pursuant to the Rule 144A exemption from registration under the Securities Act. The issue price of each share of the Series A Preferred
F-26
Sanchez Energy Corporation
Notes to the Consolidated Financial Statements (Continued)
Stock was $50.00. The Company received net proceeds from the private placement of $144.5 million, after deducting initial purchasers’ discounts and commissions and offering costs of $5.5 million.
Each share of Series A Preferred Stock is convertible at any time at the option of the holder thereof at an initial conversion rate of 2.325 shares of common stock per share of Series A Preferred Stock (which is equal to an initial conversion price of $21.51 per share of common stock) and is subject to specified adjustments. As of December 31, 2016, based on the initial conversion price, approximately 4,275,640 shares of common stock would be issuable upon conversion of all of the outstanding shares of the Series A Preferred Stock.
The annual dividend on each share of Series A Preferred Stock is 4.875% on the liquidation preference of $50.00 per share and is payable quarterly, in arrears, on each January 1, April 1, July 1 and October 1, when, as and if declared by the Company’s Board of Directors (the “Board”). The Company may, at its option, pay dividends in cash and, subject to certain conditions, common stock or any combination thereof. Dividends are cumulative, and as of December 31, 2016, all dividends accumulated through that date had been paid. The dividends accrued for the period from October 1 to December 31, 2016, were declared by the Board and paid with the Company’s common stock on January 3, 2017.
Except as required by law or the Company’s Amended and Restated Certificate of Incorporation, (the “Charter”), holders of the Series A Preferred Stock will have no voting rights unless dividends fall into arrears for six or more quarterly periods (whether or not consecutive). In that event and until such arrearage is paid in full, the holders of the Series A Preferred Stock and the holders of the Series B Preferred Stock, voting as a single class, will be entitled to elect two directors and the number of directors on the Board will increase by that same number.
At any time on or after October 5, 2017, the Company may at its option cause all outstanding shares of the Series A Preferred Stock to be automatically converted into common stock at the conversion price, if, among other conditions, the closing sale price (as defined) of the Company’s common stock equals or exceeds 130% of the conversion price for a specified period prior to the conversion.
If a holder elects to convert shares of Series A Preferred Stock upon the occurrence of certain specified fundamental changes, the Company will be obligated to deliver an additional number of shares above the applicable conversion rate to compensate the holder for lost option time value of the shares of Series A Preferred Stock as a result of the fundamental change.
Series B Preferred Stock Offering—On March 26, 2013, the Company completed a private placement of 4,500,000 shares of Series B Preferred Stock. The issue price of each share of the Series B Preferred Stock was $50.00. The Company received net proceeds from the private placement of $216.6 million, after deducting placement agent’s fees and offering costs of $8.4 million.
Each share of Series B Preferred Stock is convertible at any time at the option of the holder thereof at an initial conversion rate of 2.337 shares of common stock per share of Series B Preferred Stock (which is equal to an initial conversion price of approximately $21.40 per share of common stock) and is subject to specified adjustments. As of December 31, 2016, based on the initial conversion price, approximately 8,244,539 shares of common stock would be issuable upon conversion of all of the outstanding shares of the Series B Preferred Stock.
The annual dividend on each share of Series B Preferred Stock is 6.500% on the liquidation preference of $50.00 per share and is payable quarterly, in arrears, on each January 1, April 1, July 1 and October 1, when, as and if declared by the Board. The Company may, at its option, pay dividends in cash and, subject to certain conditions,
F-27
Sanchez Energy Corporation
Notes to the Consolidated Financial Statements (Continued)
common stock or any combination thereof. Dividends are cumulative, and as of December 31, 2016, all dividends accumulated through that date had been paid. The dividends accrued for the period from October 1 to December 31, 2016, were declared by the Board and paid with the Company’s common stock on January 3, 2017.
Except as required by law or the Charter, holders of the Series B Preferred Stock will have no voting rights unless dividends fall into arrears for six or more quarterly periods (whether or not consecutive). In that event and until such arrearage is paid in full, the holders of the Series B Preferred Stock and the holders of the Series A Preferred Stock, voting as a single class, will be entitled to elect two directors and the number of directors on the Board will increase by that same number.
At any time on or after April 6, 2018, the Company may at its option cause all outstanding shares of the Series B Preferred Stock to be automatically converted into common stock at the conversion price, if, among other conditions, the closing sale price (as defined) of the Company’s common stock equals or exceeds 130% of the conversion price for a specified period prior to the conversion.
If a holder elects to convert shares of Series B Preferred Stock upon the occurrence of certain specified fundamental changes, the Company will be obligated to deliver an additional number of shares above the applicable conversion rate to compensate the holder for lost option time value of the shares of Series B Preferred Stock as a result of the fundamental change.
Preferred Stock Exchange—On February 12, 2014 and February 13, 2014, the Company entered into exchange agreements with certain holders (the “February 2014 Holders”) of the Series A Preferred Stock and the Series B Preferred Stock pursuant to which such holders agreed to exchange an aggregate of (i) 947,490 shares of the Series A Preferred Stock (and waive their rights to any accrued and unpaid dividends thereon) for 2,425,574 shares of the Company’s common stock, and (ii) 756,850 shares of the Series B Preferred Stock (and waive their rights to any accrued and unpaid dividends thereon) for 2,021,066 shares of the Company’s common stock.
Additionally, on May 29, 2014, the Company entered into exchange agreements with certain holders (the “May 2014 Holders”) of the Series A Preferred Stock and the Series B Preferred Stock pursuant to which such holders agreed to exchange an aggregate of (i) 166,025 shares of the Series A Preferred Stock (and waive their rights to any accrued and unpaid dividends thereon) for 418,715 shares of the Company’s common stock, and (ii) 210,820 shares of the Series B Preferred Stock (and waive their rights to any accrued and unpaid dividends thereon) for 553,980 shares of the Company’s common stock.
Further, on August 28, 2014, the Company entered into exchange agreements with certain holders (the “August 2014 Holders,’” and together with the May 2014 Holders and the February 2014 Holders, the “Holders”) of the Series A Preferred Stock, pursuant to which such holders agreed to exchange an aggregate of 47,500 shares of Series A Preferred Stock (and waive their rights to any accrued and unpaid dividends thereon) for 119,320 shares of the Company’s common stock.
Since the Holders were not entitled to any consideration over and above the initial conversion rates of 2.325 and 2.337 shares of common stock for each preferred share exchanged for Series A Preferred Stock and Series B Preferred Stock, respectively, any consideration is considered an inducement for the Holders to convert earlier than the Company could have forced conversion.
The Company has determined the fair value of consideration transferred to the Holders and the fair value of consideration transferrable pursuant to the original conversion terms. The $13.9 million, $3.1 million and $0.3 million
F-28
Sanchez Energy Corporation
Notes to the Consolidated Financial Statements (Continued)
excess of the fair value of the shares of common stock issued over the carrying value of the Series A Preferred Stock and Series B Preferred Stock redeemed in connection with the exchange agreements entered into in February, May and August 2014, respectively, has been reflected as an additional preferred stock dividend (i.e., as an increase in accumulated deficit) to arrive at net loss attributable to common stockholders in our condensed consolidated financial statements.
Preferred Stock Conversion—On November 20, 2015, a holder of our Series B Preferred Stock exercised its right to convert 4,500 shares our Series B Preferred Stock, at the prescribed initial conversion rate of 2.337 shares of common stock per share of Series B Preferred Stock, in exchange for 10,517 shares of our common stock.
NOL Rights Plan—On July 28, 2015, the Company entered into a net operating loss carryforwards (“NOLs”) rights plan (the “Rights Plan”) with Continental Stock Transfer & Trust Company, as rights agent. In connection therewith, the Board declared a dividend of one preferred share purchase right (“Right”) for each outstanding share of the Company’s common stock. The dividend was paid on August 10, 2015 to stockholders of record as of the close of business on August 7, 2015 (the “NOL Record Date”). In addition, one Right automatically attaches to each share of common stock issued between the NOL Record Date and such date as when the Rights become exercisable.
Earnings (Loss) Per Share—The following table shows the computation of basic and diluted net earnings (loss) per share for the years ended December 31, 2016, 2015, and 2014 (in thousands, except per share amounts):
|
|
|
Year Ended December 31, |
|
|||||||
|
|
|
2016 |
|
2015 |
|
2014 |
|
|||
|
Net loss |
|
$ |
(256,958) |
|
$ |
(1,454,627) |
|
$ |
(21,791) |
|
|
Less: |
|
|
|
|
|
|
|
|
|
|
|
Preferred stock dividends |
|
|
(15,948) |
|
|
(16,008) |
|
|
(33,590) |
|
|
Net loss allocable to participating securities(1)(2) |
|
|
— |
|
|
— |
|
|
— |
|
|
Net loss attributable to common stockholders |
|
$ |
(272,906) |
|
$ |
(1,470,635) |
|
$ |
(55,381) |
|
|
Weighted average number of unrestricted outstanding common shares used to calculate basic net loss per share |
|
|
58,900 |
|
|
57,229 |
|
|
52,338 |
|
|
Dilutive shares(3)(4)(5) |
|
|
— |
|
|
— |
|
|
— |
|
|
Denominator for diluted loss per common share |
|
|
58,900 |
|
|
57,229 |
|
|
52,338 |
|
|
Net loss per common share - basic and diluted |
|
$ |
(4.63) |
|
$ |
(25.70) |
|
$ |
(1.06) |
|
|
(1) |
The Company's restricted shares of common stock are participating securities. |
|
(2) |
For the years ended December 31, 2016, 2015 and 2014, no losses were allocated to participating restricted stock because such securities do not have a contractual obligation to share in the Company's losses. |
|
(3) |
The year ended December 31, 2016 excludes 2,113,462 shares of weighted average restricted stock and 12,554,481 shares of common stock resulting from an assumed conversion of the Company's Series A Preferred Stock and Series B Preferred Stock from the calculation of the denominator for diluted earnings (loss) per common share as these shares were anti-dilutive. |
|
(4) |
The year ended December 31, 2015 excludes 2,663,010 shares of weighted average restricted stock and 12,529,314 shares of common stock resulting from an assumed conversion of the Company's Series A Preferred Stock and |
F-29
Sanchez Energy Corporation
Notes to the Consolidated Financial Statements (Continued)
Series B Preferred Stock from the calculation of the denominator for diluted earnings (loss) per common share as these shares were anti-dilutive. |
|
(5) |
The year ended December 31, 2014 excludes 1,732,888 shares of weighted average restricted stock and 13,527,738 shares of common stock resulting from an assumed conversion of the Company's Series A Preferred Stock and Series B Preferred Stock from the calculation of the denominator for diluted earnings (loss) per common share as these shares were anti-dilutive. |
Note 7. Stock‑Based Compensation
At the Annual Meeting of Stockholders of the Company held on May 24, 2016 (“2016 Annual Meeting”), the Company’s stockholders approved the Sanchez Energy Corporation Third Amended and Restated 2011 Long Term Incentive Plan (the “LTIP”). The Board had previously approved the LTIP on May 21, 2015, subject to stockholder approval.
The Company’s directors and consultants as well as employees of SOG and its affiliates (excluding the Company) (collectively, the “Sanchez Group”) who provide services to the Company are eligible to participate in the LTIP. Awards to participants may be made in the form of stock options, stock appreciation rights, restricted shares, phantom stock, other stock-based awards or stock awards, or any combination thereof. The maximum shares of common stock that may be delivered with respect to awards under the LTIP shall be (i) 17,239,790 shares plus (ii) upon the issuance of additional shares of common stock from time to time after April 1, 2016, an automatic increase equal to the lesser of (A) 15% of such issuance of additional shares of common stock, and (B) such lesser number of shares of common stock as determined by the Board or Compensation Committee; provided, however, withheld to satisfy tax withholding obligations are not considered to be delivered under the LTIP. If any award is forfeited, cancelled, exercised, paid, or otherwise terminates or expires without the actual delivery of shares of common stock pursuant to such award (the grant of restricted stock is not a delivery of shares of common stock for this purpose), the shares subject to such award shall again be available for awards under the LTIP. There shall not be any limitation on the number of awards that may be paid in cash. Any shares delivered pursuant an award shall consist, in whole or in part, of shares of common stock newly issued by the Company, shares of common stock acquired in the open market, from any affiliate of the Company, or any combination of the foregoing, as determined by the Board or Compensation Committee in its discretion.
The LTIP is administered by the Compensation Committee of the Board as appointed by the Board. The Board may terminate or amend the LTIP at any time with respect to any shares for which a grant has not yet been made. The Board has the right to alter or amend the LTIP or any part of the LTIP from time to time, including increasing the number of shares that may be granted, subject to stockholder approval as may be required by the exchange upon which shares of the common stock are listed at that time, if any. No change may be made in any outstanding grant that would materially reduce the benefits of the participant without the consent of the participant. The LTIP will expire upon its termination by the Board or, if earlier, when no shares remain available under the LTIP for awards. Upon termination of the LTIP, awards then outstanding will continue pursuant to the terms of their grants.
The Company records stock-based compensation expense for awards granted to its directors (for their services as directors) in accordance with the provisions of ASC 718, “Compensation—Stock Compensation.” Stock-based compensation expense for these awards is based on the grant-date fair value and recognized over the vesting period using the straight-line method.
F-30
Sanchez Energy Corporation
Notes to the Consolidated Financial Statements (Continued)
Awards granted to employees of the Sanchez Group (including those employees of the Sanchez Group who also serve as the Company’s officers) and consultants in exchange for services are considered awards to non-employees and the Company records stock-based compensation expense for these awards at fair value in accordance with the provisions of ASC 505-50, “Equity-Based Payments to Non-Employees.” For awards granted to non-employees, the Company records compensation expenses equal to the fair value of the stock-based award at the measurement date, which is determined to be the earlier of the performance commitment date or the service completion date. Compensation expense for unvested awards to non-employees is revalued at each period end and is amortized over the vesting period of the stock-based award. Stock-based payments are measured based on the fair value of the equity instruments granted, as it is more determinable than the value of the services rendered.
For the restricted stock awards granted to non-employees, stock-based compensation expense is based on fair value re-measured at each reporting period and recognized over the vesting period using the straight-line method. Compensation expense for these awards will be revalued at each period end until vested.
During the year ended December 31, 2016, the Company issued 156,126 shares of restricted common stock pursuant to the LTIP to five directors of the Company that vest within one year from the date of grant. Pursuant to ASC 718, stock-based compensation expense for these awards was based on their grant date fair values of $8.00 and $5.81 per share (the closing sales price of the Company’s common stock on the grant date) and is being amortized over the vesting period.
The Company also issued approximately 4.4 million shares of restricted common stock pursuant to the LTIP to certain employees and consultants of SOG (including the Company’s officers), with whom the Company has a services agreement. Approximately 3.3 million shares of restricted common stock vest in equal annual amounts over a three-year period and the remaining 1.1 million shares of restricted common stock with cliff vesting at the end of a five-year period or earlier if the common stock closing price equals or exceeds certain benchmarks as set forth in the forms of agreement.
During the year ended December 31, 2015, the Company issued 95,237 shares of restricted common stock pursuant to the LTIP to five directors of the Company that vest within one year from the date of grant. Pursuant to ASC 718, stock-based compensation expense for these awards was based on their grant date fair values of $12.65 and $9.80 per share (the closing sales price of the Company’s common stock on the grant date) and is being amortized over the vesting period
The Company also issued approximately 3.4 million shares of restricted common stock pursuant to the LTIP to certain employees and consultants of SOG (including the Company’s officers), with whom the Company has a services agreement. Approximately 3.3 million shares of restricted common stock vest in equal annual amounts over a three-year period and approximately 0.1 million shares of restricted common stock vest in equal annual amounts over a five-year period.
During the year ended December 31, 2014, the Company issued 35,769 shares of restricted common stock pursuant to the LTIP to four directors of the Company that vest within one year from the date of grant. Pursuant to ASC 718, stock-based compensation expense for these awards was based on their grant date fair value of $33.05 and $14.90 per share (the closing sales price of the Company’s common stock on the grant date) and is being amortized over the one year vesting period.
The Company also issued approximately 2.0 million shares of restricted common stock pursuant to the LTIP to certain employees and consultants of SOG (including the Company’s officers), with whom the Company has a services agreement. Approximately 0.7 million shares of restricted common stock vest in equal annual amounts over a two-year
F-31
Sanchez Energy Corporation
Notes to the Consolidated Financial Statements (Continued)
period and approximately 1.3 million shares of restricted common stock vest in equal annual amounts over a three-year period.
In February 2016 and April 2016, the Compensation Committee approved several new forms of agreement for use in equity awards pursuant to the LTIP. The new forms of agreements consist of two new forms of restricted stock award agreements, one of which provides for vesting in equal annual increments over a three year period from the grant date (the “Grant Date”) and the other of which provides for cliff vesting five years after the Grant Date or earlier if the common stock closing price equals or exceeds certain benchmarks as set forth in the form of agreement (the “Performance Accelerated Restricted Stock” or “PARS”), and two new forms of phantom stock agreements payable only in cash, one of which provides for vesting in equal annual increments over a three year period from the Grant Date (the “Phantom Stock”) and the other of which provides for cliff vesting five years after the Grant Date or earlier if the Company’s common stock closing price equals or exceeds certain benchmarks as set forth in the form of agreement (the “Performance Accelerated Phantom Stock” or “PAPS”).
The PARS, PAPS and Phantom Stock awards granted to certain employees of the Sanchez Group (including those employees of the Sanchez Group who also serve as the Company’s officers) and consultants in exchange for services are considered awards to non-employees and the Company records stock-based compensation expense for these awards at fair value in accordance with the provisions of ASC 718, “Compensation – Stock Compensation.” In accordance with the guidance, the inclusion of market performance acceleration conditions does not change the accounting classification as compared to the restricted stock without market performance acceleration conditions, as both are still classified as equity within the Company’s balance sheet. The Phantom Stock awards are required to be settled in cash by the Company and, per the guidance, should be classified as a liability. Compensation expense for the unvested awards is revalued at each period end and is amortized over the vesting period of the stock-based award.
During the year ended December 31, 2016, the Company issued approximately 1.1 million shares of PARS pursuant to the LTIP to certain employees of SOG (including the Company’s officers), with whom the Company has a services agreement. These PARS shares vest have cliff vesting at the end of a five-year period or earlier if the common stock closing price equals or exceeds certain benchmarks as set forth in the forms of agreement.
During the year ended December 31, 2016, the Company issued approximately 4.0 million shares of Phantom Stock and PAPS pursuant to the LTIP to certain employees of SOG (including the Company’s officers), with whom the Company has a services agreement. Approximately 2.8 million shares of Phantom Stock vest in equal annual amounts over a three-year period and the remaining 1.2 million shares of PAPS have cliff vesting at the end of a five-year period or earlier if the common stock closing price equals or exceeds certain benchmarks as set forth in the forms of agreement.
The Company recognized the following stock-based compensation expense (in thousands) which is included in general and administrative expense in the condensed consolidated statements of operations.
|
|
|
|
|
|
|
|
|
|
|
|
|
|
Year Ended December 31, |
|||||||
|
|
|
2016 |
|
2015 |
|
2014 |
|||
|
Restricted stock awards, directors |
|
$ |
1,000 |
|
$ |
917 |
|
$ |
802 |
|
Restricted stock awards, non-employees |
|
|
18,145 |
|
|
13,914 |
|
|
12,041 |
|
Phantom Stock awards |
|
|
17,945 |
|
|
— |
|
|
— |
|
Total stock-based compensation expense |
|
$ |
37,090 |
|
$ |
14,831 |
|
$ |
12,843 |
F-32
Sanchez Energy Corporation
Notes to the Consolidated Financial Statements (Continued)
Based on the $9.03 per share closing price of the Company’s common stock on December 31, 2016, there was approximately $22.2 million of unrecognized compensation cost related to these non‑vested restricted shares (excluding the PARS shares) outstanding. The cost is expected to be recognized over a weighted average period of approximately 1.85 years.
Based on the $9.03 per share closing price of the Company’s common stock on December 31, 2016, there was approximately $3.9 million of unrecognized compensation cost related to these non‑vested PARS restricted shares outstanding. The cost is expected to be recognized over a weighted average period of approximately 3.42 years.
Based on the $9.03 per share closing price of the Company’s common stock on December 31, 2016, there was approximately $23.2 million of unrecognized compensation cost related to the non‑vested PAPS and Phantom Stock award shares outstanding. The cost is expected to be recognized over an average period of approximately 2.50 years.
A summary of the status of the non‑vested restricted common shares and PARS as of December 31, 2016 is presented below (in thousands, except per share amounts):
|
|
|
|
|
|
|
|
|
Aggregate |
|
|
|
|
|
|
|
Weighted |
|
Intrinsic |
||
|
|
|
|
Number of |
|
Average |
|
Value |
||
|
|
|
|
Shares |
|
Fair Value |
|
(in thousands) |
||
|
Non-vested common stock at December 31, 2015 |
|
|
4,425,767 |
|
$ |
12.21 |
|
$ |
54,053 |
|
Granted |
|
|
4,558,640 |
|
|
4.59 |
|
|
20,930 |
|
Vested |
|
|
(1,991,025) |
|
|
5.04 |
|
|
(10,036) |
|
Forfeited |
|
|
(466,407) |
|
|
10.85 |
|
|
(5,061) |
|
Non-vested common stock at December 31, 2016 |
|
|
6,526,975 |
|
$ |
9.18 |
|
$ |
59,886 |
As of December 31, 2016, approximately 6.7 million shares remain available for future issuance to participants under the LTIP.
A summary of the status of the non‑vested Phantom Stock shares and PAPS as of December 31, 2016 is presented below (in thousands, except per share amounts):
|
|
|
|
|
|
|
|
|
Aggregate |
|
|
|
|
|
|
|
Weighted |
|
Intrinsic |
||
|
|
|
|
Number of |
|
Average |
|
Value |
||
|
|
|
|
Shares |
|
Fair Value |
|
(in thousands) |
||
|
Non-vested common stock at December 31, 2015 |
|
|
— |
|
$ |
— |
|
$ |
— |
|
Granted |
|
|
3,990,413 |
|
|
4.87 |
|
|
19,451 |
|
Vested |
|
|
— |
|
|
— |
|
|
— |
|
Forfeited |
|
|
(78,000) |
|
|
6.62 |
|
|
(516) |
|
Non-vested common stock at December 31, 2016 |
|
|
3,912,413 |
|
$ |
4.84 |
|
$ |
18,935 |
F-33
Sanchez Energy Corporation
Notes to the Consolidated Financial Statements (Continued)
Note 8. Income Taxes
The components of the federal income tax provision for the years ended December 31, 2016, 2015 and 2014 are (in thousands):
|
|
|
Year Ended December 31, |
|
|||||||
|
|
|
2016 |
|
2015 |
|
2014 |
|
|||
|
Current expense as a result of current operations |
|
$ |
1,825 |
|
$ |
158 |
|
$ |
— |
|
|
Deferred benefit as a result of current operations |
|
|
(86,606) |
|
|
(506,943) |
|
|
(11,429) |
|
|
Increase in valuation allowance |
|
|
86,606 |
|
|
514,385 |
|
|
— |
|
|
Net income tax expense (benefit) |
|
$ |
1,825 |
|
$ |
7,600 |
|
$ |
(11,429) |
|
The difference between the statutory federal income taxes calculated using a U.S. Federal statutory corporate income tax rate of 35% and the Company’s effective tax rate of (0.7)% is summarized as follows (in thousands):
|
|
|
Year Ended December 31, |
|
|||||||
|
|
|
2016 |
|
2015 |
|
2014 |
|
|||
|
Income tax benefit at the federal statutory rate |
|
$ |
(89,297) |
|
$ |
(506,460) |
|
$ |
(11,627) |
|
|
Officers' compensation limitation |
|
|
3,115 |
|
|
1,328 |
|
|
— |
|
|
State Taxes (net of federal benefit) |
|
|
(232) |
|
|
(5,463) |
|
|
— |
|
|
Non-deductible general and administrative expenses |
|
|
743 |
|
|
309 |
|
|
231 |
|
|
Percentage depletion carryforward |
|
|
(144) |
|
|
— |
|
|
(107) |
|
|
Other |
|
|
39 |
|
|
— |
|
|
— |
|
|
Differences between actual income taxes and |
|
|
|
|
|
|
|
|
|
|
|
amounts estimated in prior years |
|
|
995 |
|
|
3,501 |
|
|
74 |
|
|
Income tax expense (benefit) |
|
|
(84,781) |
|
|
(506,785) |
|
|
(11,429) |
|
|
Valuation allowance |
|
|
86,606 |
|
|
514,385 |
|
|
— |
|
|
Net income tax expense (benefit) |
|
$ |
1,825 |
|
$ |
7,600 |
|
$ |
(11,429) |
|
F-34
Sanchez Energy Corporation
Notes to the Consolidated Financial Statements (Continued)
The Company’s deferred tax position reflects the net tax effects of the temporary differences between the carrying amounts of assets and liabilities for financial reporting purposes and the amounts used for income tax reporting. Significant components of the deferred tax assets and liabilities are as follows (in thousands):
|
|
|
As of December 31, |
|
||||
|
|
|
2016 |
|
2015 |
|
||
|
Deferred tax assets (liabilities): |
|
|
|
|
|
|
|
|
Derivative assets (obligations) |
|
$ |
12,516 |
|
$ |
(54,638) |
|
|
Depreciable, depletable property, plant and equipment |
|
|
144,348 |
|
|
288,736 |
|
|
Share-based compensation |
|
|
12,408 |
|
|
2,897 |
|
|
Revenue Recognition |
|
|
7,077 |
|
|
8,417 |
|
|
Other |
|
|
1,085 |
|
|
(535) |
|
|
Federal net operating loss carryforward |
|
|
420,302 |
|
|
268,068 |
|
|
State net operating loss carryforward |
|
|
3,256 |
|
|
1,440 |
|
|
Deferred tax assets: |
|
|
600,992 |
|
|
514,385 |
|
|
Valuation allowance |
|
|
(600,992) |
|
|
(514,385) |
|
|
Total Deferred tax assets |
|
$ |
— |
|
$ |
— |
|
As of December 31, 2016, the Company had NOLs of approximately $1,200.9 million which begin to expire in 2031. Additionally, the Company had net operating losses in the states of Montana, Mississippi, and Louisiana which will begin to expire in 2018, 2033 and 2026, respectively.
Management assesses the available positive and negative evidence to estimate if sufficient future taxable income will be generated to use the existing deferred tax assets. A significant piece of objective negative evidence evaluated was the cumulative loss incurred over the three-year period ended December 31, 2016.
On the basis of this evaluation, as of December 31, 2016, a valuation allowance of approximately $601.0 million has been recorded to record only the portion of the deferred tax asset that is more likely than not to be realized. The Company will continue to assess the need for a valuation allowance against deferred tax assets considering all available information obtained in future reporting periods.
The Company files income tax returns in the U.S. and various state jurisdictions. Sanchez is no longer subject to examination by federal income tax authorities prior to 2013. State statues vary by jurisdiction.
As of December 31, 2016, 2015 and 2014, the Company had no material uncertain tax positions.
Note 9. Related Party Transactions
SOG, headquartered in Houston, Texas, is a private full service oil and natural gas company engaged in the exploration and development of oil and natural gas primarily in the South Texas and onshore Gulf Coast areas on behalf of its affiliates.
The Company does not have any employees. On December 19, 2011 it entered into a services agreement with SOG pursuant to which specified employees of SOG provide certain services with respect to the Company’s business under the direction, supervision and control of SOG. Pursuant to this arrangement, SOG performs centralized corporate functions for the Company, such as general and administrative services, geological, geophysical and reserve engineering,
F-35
Sanchez Energy Corporation
Notes to the Consolidated Financial Statements (Continued)
lease and land administration, marketing, accounting, operational services, information technology services, compliance, insurance maintenance and management of outside professionals. The Company compensates SOG for the services at a price equal to SOG’s cost of providing such services, including all direct costs and indirect administrative and overhead costs (including the allocable portion of salary, bonus, incentive compensation and other amounts paid to persons that provide the services on SOG’s behalf) allocated in accordance with SOG’s regular and consistent accounting practices, including for any such costs arising from amounts paid directly by other members of the Sanchez Group on SOG’s behalf or borrowed by SOG from other members of the Sanchez Group, in each case, in connection with the performance by SOG of services on the Company’s behalf. The Company also reimburses SOG for sales, use or other taxes, or other fees or assessments imposed by law in connection with the provision of services to the Company (other than income, franchise or margin taxes measured by SOG’s net income or margin and other than any gross receipts or other privilege taxes imposed on SOG) and for any costs and expenses arising from or related to the engagement or retention of third party service providers.
Salaries and associated benefits of SOG employees and are allocated to the Company based on a fixed percentage that is reviewed quarterly and adjusted, if needed, based on a detailed analysis of actual time spent by the professional staff on Company projects and activities. General and administrative expenses such as office rent, utilities, supplies and other overhead costs, are allocated on the same percentages as the SOG employee salaries. Expenses allocated to the Company for general and administrative expenses for the years ended December 31, 2016, 2015 and 2014 are as follows (in thousands):
|
|
|
Year Ended December 31, |
|
|||||||
|
|
|
2016 |
|
2015 |
|
2014 |
|
|||
|
Administrative fees |
|
$ |
40,901 |
|
$ |
30,430 |
|
$ |
33,610 |
|
|
Third-party expenses |
|
|
5,001 |
|
|
5,427 |
|
|
4,515 |
|
|
Total included in general and administrative expenses |
|
$ |
45,902 |
|
$ |
35,857 |
|
$ |
38,125 |
|
As of December 31, 2016 and December 31, 2015, the Company had a net receivable from SOG and other members of the Sanchez Group of $6.4 million and $3.7 million, respectively, which are reflected as “Accounts receivable—related entities” and “Accounts payable—related entities,” respectively, in the consolidated balance sheets. The net receivable as of December 31, 2016 and December 31, 2015 consists primarily of advances paid related to leasehold and other costs paid to SOG. In addition, the net receivable as of December 31, 2016 and December 31, 2015 includes approximately $0.7 million and $0.7 million, respectively, of net receivable from Sanchez Resources, LLC (“Sanchez Resources”).
As of December 31, 2016, the Company had a net payable to SPP of approximately $9.0 million that consists primarily of the November and December accrual for fees associated with the Gathering Agreement (see Note 3, “Acquisitions and Divestitures” for further discussion), which is reflected in the “Other Accrued liabilities” account on the consolidated balance sheets.
Production Asset Transaction
On November 22, 2016, we completed the Production Asset Transaction discussed above to SPP, which is a related party (see Note 3, “Acquisitions and Divestitures”).
F-36
Sanchez Energy Corporation
Notes to the Consolidated Financial Statements (Continued)
Carnero Processing Disposition
On November 22, 2016, we sold our membership interests in Carnero Processing, LLC (“Carnero Processing”), to SPP, which is a related party (see Note 16, “Investments”).
Carnero Gathering Disposition
On July 5, 2016, we sold our membership interests in Carnero Gathering, LLC (“Carnero Gathering”) to SPP, which is a related party (see Note 16, “Investments”).
Palmetto Disposition
On March 31, 2015, we completed the Palmetto Disposition discussed above to a subsidiary of SPP, which is a related party (see Note 3, “Acquisitions and Divestitures”).
Western Catarina Midstream Divestiture
On October 14, 2015, we completed the Western Catarina Midstream Divestiture discussed above to SPP, which is a related party (see Note 3, “Acquisitions and Divestitures”).
TMS Asset Purchase
In August 2013, we acquired rights to approximately 40,000 net undeveloped acres in what we believe to be the core of the TMS (the “TMS Transaction”) for cash and shares of our common stock. In connection with the TMS Transaction, we established an Area of Mutual Interest (‘‘AMI’’) in the TMS with SR Acquisition I, LLC (‘‘SR’’), a subsidiary of our affiliate Sanchez Resources, which transaction included a carry on drilling costs for up to 6 gross (3 net) wells. Sanchez Resources is indirectly owned, in part, by our Chief Executive Officer and the Executive Chairman of the Board, who each also serve on our Board. Eduardo Sanchez, Patricio Sanchez and Ana Lee Sanchez Jacobs, each an immediate family member of our Chief Executive Officer and the Executive Chairman of our Board, collectively, either directly or indirectly, own a majority of the equity interests of Sanchez Resources. Sanchez Resources is managed by Eduardo Sanchez, who is the brother of our Chief Executive Officer and the son of our Executive Chairman of the Board. In addition, Eduardo Sanchez was named President of Sanchez Energy, effective as of October 1, 2015.
As part of the transaction, we acquired our working interests in the AMI owned at closing from three sellers (two third parties and one related party of the Company, SR) resulting in our owning an undivided 50% working interest across the AMI through the TMS.
Total consideration for the transactions consisted of approximately $70 million in cash and the issuance of 342,760 common shares of the Company, valued at approximately $7.5 million. The total cash consideration provided to SR, an affiliate of the Company, was $14.4 million, before consideration of any well carries. The acquisitions were accounted for as the purchase of assets at cost at the acquisition date. We also committed, as a part of the total consideration, to carry SR for its 50% working interest in an initial 3 gross (1.5 net) TMS wells to be drilled within the AMI (the “Initial Well Carry”) with an option to drill an additional 6 gross (3 net) TMS wells (“Additional Wells”) within the AMI. In August 2015, after completing the Initial Well Carry, the Company signed an agreement with SR whereby the Company paid SR approximately $8 million in lieu of drilling the remaining two Additional Wells (the “Buyout Agreement”). The Buyout Agreement stipulates that SN has earned full rights to all acreage stated in the TMS Transaction and effectively terminates any future well carry commitments.
F-37
Sanchez Energy Corporation
Notes to the Consolidated Financial Statements (Continued)
Note 10. Derivative Instruments
To reduce the impact of fluctuations in oil and natural gas prices on the Company’s revenues, or to protect the economics of property acquisitions, the Company periodically enters into derivative contracts with respect to a portion of its projected oil and natural gas production through various transactions that fix or modify the future prices to be realized. The derivative contracts may include fixed-for-floating price swaps (whereby, on the settlement date, the Company will receive or pay an amount based on the difference between a pre-determined fixed price and a variable market price for a notional quantity of production), put options (whereby the Company pays a cash premium in order to establish a fixed floor price for a notional quantity of production and, on the settlement date, receives the excess, if any, of the fixed price floor over a variable market price), and costless collars (whereby, on the settlement date, the Company receives the excess, if any, of a variable market price over a fixed floor price up to a fixed ceiling price for a notional quantity of production). In addition, the Company periodically enters into call swaptions as a way to achieve greater downside price protection than offered under prevailing fixed-for-floating price swaps by agreeing to expand the notional quantity hedged under a fixed-for-floating price swap at the counterparty’s election on a designated date.
These hedging activities, which are governed by the terms of our Second Amended and Restated Credit Agreement, are intended to support oil and natural gas prices at targeted levels and manage exposure to oil and natural gas price fluctuations. It is our policy to enter into derivative contracts only with counterparties that are creditworthy and competitive market makers. All of our derivatives with lenders, or affiliates of lenders, in our Second Amended and Restated Credit Agreement are collateralized by the assets securing our Second Amended and Restated Credit Agreement and, therefore, do not currently require the posting of cash collateral. Our existing derivatives with non-lender counterparties, as designated under the Second Amended and Restated Credit Agreement, are unsecured and do not require the posting of cash collateral. It is never the Company’s intention to enter into derivative contracts for speculative trading purposes.
All of our derivatives are accounted for as mark-to-market activities. Under ASC Topic 815, “Derivatives and Hedging,” these instruments are recorded on the condensed consolidated balance sheets at fair value as either short term or long term assets or liabilities based on their anticipated settlement date. The Company nets derivative assets and liabilities by commodity for counterparties where a legal right to such offset exists. Changes in the derivatives’ fair values are recognized in current earnings since the Company has elected not to designate its current derivative contracts as cash flow hedges for accounting purposes.
F-38
Sanchez Energy Corporation
Notes to the Consolidated Financial Statements (Continued)
The following table presents derivative positions for the periods indicated as of December 31, 2016:
|
|
|
January 1 - December 31, 2017 |
|
2018 |
|
2019 |
|
|||
|
Oil positions: |
|
|
|
|
|
|
|
|
|
|
|
Fixed-for-floating price swaps (NYMEX WTI): |
|
|
|
|
|
|
|
|
|
|
|
Hedged volume (Bbls) |
|
|
1,825,000 |
|
|
- |
|
|
- |
|
|
Average price ($/Bbl) |
|
$ |
51.70 |
|
$ |
- |
|
$ |
- |
|
|
|
|
|
|
|
|
|
|
|
|
|
|
Collars (NYMEX WTI): |
|
|
|
|
|
|
|
|
|
|
|
Hedged volume (Bbls) |
|
|
730,000 |
|
|
- |
|
|
- |
|
|
Average long put price ($/Bbl) |
|
$ |
45.00 |
|
$ |
- |
|
$ |
- |
|
|
Average short call price ($/Bbl) |
|
$ |
62.00 |
|
$ |
- |
|
$ |
- |
|
|
|
|
|
|
|
|
|
|
|
|
|
|
Natural gas positions: |
|
|
|
|
|
|
|
|
|
|
|
Fixed-for-floating price swaps (NYMEX Henry Hub): |
|
|
|
|
|
|
|
|
|
|
|
Hedged volume (MMBtu) |
|
|
40,805,000 |
|
|
29,532,500 |
|
|
7,300,000 |
|
|
Average price ($/MMBtu) |
|
$ |
3.07 |
|
$ |
3.02 |
|
$ |
3.02 |
|
|
|
|
|
|
|
|
|
|
|
|
|
The following table sets forth a reconciliation of the changes in fair value of the Company’s commodity derivatives for the years ended December 31, 2016, 2015, and 2014 (in thousands):
|
|
|
|
|
|
|
|
|
|
|
|
|
|
|
Year Ended December 31, |
|
|||||||
|
|
|
2016 |
|
|
2015 |
|
2014 |
|
||
|
Beginning fair value of commodity derivatives |
|
$ |
178,283 |
|
$ |
123,316 |
|
$ |
(3,397) |
|
|
Net gains (losses) on crude oil derivatives |
|
|
(47,389) |
|
|
170,592 |
|
|
115,602 |
|
|
Net gains (losses) on natural gas derivatives |
|
|
(30,307) |
|
|
26,843 |
|
|
21,603 |
|
|
Net settlements on derivative contracts: |
|
|
|
|
|
|
|
|
|
|
|
Crude oil |
|
|
(135,491) |
|
|
(123,946) |
|
|
(4,503) |
|
|
Natural gas |
|
|
(24,657) |
|
|
(18,522) |
|
|
(1,097) |
|
|
Net premiums on derivative contracts: |
|
|
|
|
|
|
|
|
|
|
|
Crude oil |
|
|
24,547 |
|
|
— |
|
|
(4,892) |
|
|
Ending fair value of commodity derivatives |
|
$ |
(35,014) |
|
$ |
178,283 |
|
$ |
123,316 |
|
F-39
Sanchez Energy Corporation
Notes to the Consolidated Financial Statements (Continued)
Balance Sheet Presentation
The Company’s derivatives are presented on a net basis as “Fair value of derivative instruments” on the consolidated balance sheets. The following information summarizes the gross fair values of derivative instruments, presenting the impact of offsetting the derivative assets and liabilities on the Company’s consolidated balance sheets (in thousands):
|
|
|
December 31, 2016 |
|
|||||||
|
|
|
|
|
|
Gross Amounts |
|
Net Amounts |
|
||
|
|
|
Gross Amount |
|
Offset in the |
|
Presented in the |
|
|||
|
|
|
of Recognized |
|
Consolidated |
|
Consolidated |
|
|||
|
|
|
Assets and Liabilities |
|
Balance Sheets |
|
Balance Sheets |
|
|||
|
Offsetting Derivative Assets: |
|
|
|
|
|
|
|
|
|
|
|
Current asset |
|
$ |
844 |
|
$ |
(844) |
|
$ |
— |
|
|
Long-term asset |
|
|
1,426 |
|
|
(1,426) |
|
|
— |
|
|
Total asset |
|
$ |
2,270 |
|
$ |
(2,270) |
|
$ |
— |
|
|
Offsetting Derivative Liabilities: |
|
|
|
|
|
|
|
|
|
|
|
Current liability |
|
$ |
32,622 |
|
$ |
(844) |
|
$ |
31,778 |
|
|
Long-term liability |
|
|
4,662 |
|
|
(1,426) |
|
|
3,236 |
|
|
Total liability |
|
$ |
37,284 |
|
$ |
(2,270) |
|
$ |
35,014 |
|
|
|
|
December 31, 2015 |
|
|||||||
|
|
|
|
|
|
Gross Amounts |
|
Net Amounts |
|
||
|
|
|
Gross Amount |
|
Offset in the |
|
Presented in the |
|
|||
|
|
|
of Recognized |
|
Consolidated |
|
Consolidated |
|
|||
|
|
|
Assets and Liabilities |
|
Balance Sheets |
|
Balance Sheets |
|
|||
|
Offsetting Derivative Assets: |
|
|
|
|
|
|
|
|
|
|
|
Current asset |
|
$ |
172,518 |
|
$ |
(24) |
|
$ |
172,494 |
|
|
Long-term asset |
|
|
5,821 |
|
|
(32) |
|
|
5,789 |
|
|
Total asset |
|
$ |
178,339 |
|
$ |
(56) |
|
$ |
178,283 |
|
|
Offsetting Derivative Liabilities: |
|
|
|
|
|
|
|
|
|
|
|
Current liability |
|
$ |
24 |
|
$ |
(24) |
|
$ |
— |
|
|
Long-term liability |
|
|
32 |
|
|
(32) |
|
|
— |
|
|
Total liability |
|
$ |
56 |
|
$ |
(56) |
|
$ |
— |
|
Note 11. Fair Value of Financial Instruments
Measurements of fair value of derivative instruments are classified according to the fair value hierarchy, which prioritizes the inputs to the valuation techniques used to measure fair value. Fair value is the price that would be received upon the sale of an asset or paid to transfer a liability in an orderly transaction between market participants at the measurement date. Fair value measurements are classified and disclosed in one of the following categories:
F-40
Sanchez Energy Corporation
Notes to the Consolidated Financial Statements (Continued)
Level 1: Measured based on unadjusted quoted prices in active markets that are accessible at the measurement date for identical, unrestricted assets or liabilities. Active markets are considered those in which transactions for the assets or liabilities occur in sufficient frequency and volume to provide pricing information on an ongoing basis.
Level 2: Measured based on quoted prices in markets that are not active, or inputs which are observable, either directly or indirectly, for substantially the full term of the asset or liability. This category includes those derivative instruments that can be valued using observable market data. Substantially all of these inputs are observable in the marketplace throughout the term of the derivative instrument, can be derived from observable data, or supported by observable levels at which transactions are executed in the marketplace.
Level 3: Measured based on prices or valuation models that require inputs that are both significant to the fair value measurement and less observable from objective sources (i.e. supported by little or no market activity). The valuation models used to value derivatives associated with the Company’s oil and natural gas production are primarily industry standard models that consider various inputs including: (a) quoted forward prices for commodities, (b) time value, and (c) current market and contractual prices for the underlying instruments, as well as other relevant economic measures. Although third party quotes are utilized to assess the reasonableness of the prices and valuation techniques, there is not sufficient corroborating evidence to support classifying these assets and liabilities as Level 2.
Financial assets and liabilities are classified based on the lowest level of input that is significant to the fair value measurement. Management’s assessment of the significance of a particular input to the fair value measurement requires judgment, and may affect the valuation of the fair value of assets and liabilities and their placement within the fair value hierarchy levels.
Fair Value on a Recurring Basis
The following tables set forth, by level within the fair value hierarchy, the Company’s financial assets and liabilities that were accounted for at fair value on a recurring basis as of December 31, 2016 and 2015 (in thousands):
|
|
|
As of December 31, 2016 |
|
||||||||||
|
|
|
Active Market |
|
|
|
|
|
|
|
|
|
|
|
|
|
|
for Identical |
|
Observable |
|
Unobservable |
|
Total |
|
||||
|
|
|
Assets |
|
Inputs |
|
Inputs |
|
Carrying |
|
||||
|
|
|
(Level 1) |
|
(Level 2) |
|
(Level 3) |
|
Value |
|
||||
|
Cash and cash equivalents: |
|
|
|
|
|
|
|
|
|
|
|
|
|
|
Money market funds |
|
$ |
443,648 |
|
$ |
— |
|
$ |
— |
|
$ |
443,648 |
|
|
Equity investment: |
|
|
|
|
|
|
|
|
|
|
|
|
|
|
Investment in SPP |
|
|
26,818 |
|
|
— |
|
|
— |
|
|
26,818 |
|
|
Oil derivative instruments: |
|
|
|
|
|
|
|
|
|
|
|
|
|
|
Swaps |
|
|
— |
|
|
(8,291) |
|
|
— |
|
|
(8,291) |
|
|
Collars |
|
|
— |
|
|
(572) |
|
|
— |
|
|
(572) |
|
|
Gas derivative instruments: |
|
|
|
|
|
|
|
|
|
|
|
|
|
|
Swaps |
|
|
— |
|
|
(26,151) |
|
|
— |
|
|
(26,151) |
|
|
Total |
|
$ |
470,466 |
|
$ |
(35,014) |
|
$ |
— |
|
$ |
435,452 |
|
F-41
Sanchez Energy Corporation
Notes to the Consolidated Financial Statements (Continued)
|
|
|
As of December 31, 2015 |
|
||||||||||
|
|
|
Active Market |
|
|
|
|
|
|
|
|
|
|
|
|
|
|
for Identical |
|
Observable |
|
Unobservable |
|
Total |
|
||||
|
|
|
Assets |
|
Inputs |
|
Inputs |
|
Carrying |
|
||||
|
|
|
(Level 1) |
|
(Level 2) |
|
(Level 3) |
|
Value |
|
||||
|
Cash and cash equivalents: |
|
|
|
|
|
|
|
|
|
|
|
|
|
|
Money market funds |
|
$ |
399,448 |
|
$ |
— |
|
$ |
— |
|
$ |
399,448 |
|
|
Oil derivative instruments: |
|
|
|
|
|
|
|
|
|
|
|
|
|
|
Swaps |
|
|
— |
|
|
72,887 |
|
|
— |
|
|
72,887 |
|
|
Puts |
|
|
— |
|
|
76,583 |
|
|
— |
|
|
76,583 |
|
|
Gas derivative instruments: |
|
|
— |
|
|
— |
|
|
— |
|
|
— |
|
|
Swaps |
|
|
— |
|
|
28,813 |
|
|
— |
|
|
28,813 |
|
|
Total |
|
$ |
399,448 |
|
$ |
178,283 |
|
$ |
— |
|
$ |
577,731 |
|
Financial Instruments: The Level 1 instruments presented in the tables above consist of money market funds included in cash and cash equivalents on the Company’s consolidated balance sheets as of December 31, 2016 and 2015. The Company’s money market funds represent cash equivalents backed by the assets of high‑quality banks and financial institutions. The Company identified the money market funds as Level 1 instruments due to the fact that the money market funds have daily liquidity, quoted prices for the underlying investments can be obtained and there are active markets for the underlying investments. In addition, the Level 1 instruments include the Company’s equity investment in common units of SPP as further discussed in Note 16, “Investments.” The investment in SPP is being accounting for under the fair value option, included in investments on the Company’s balance sheet as of December 31, 2016. The Company identified the common units in SPP as a Level 1 instruments due to the fact that SPP is a publicly traded company on the NYSE MKT with daily quoted prices that can be easily obtained.
The Company’s derivative instruments, which consist of swaps, collars and puts, are classified as Level 2 as of December 31, 2016 and 2015, in the table above. The fair values of the Company’s derivatives are based on third-party pricing models which utilize inputs that are either readily available in the public market, such as forward curves, or can be corroborated from active markets of broker quotes. Swaps and collars generally have no unobservable inputs and they are classified as Level 2. Puts and call swaption derivatives have inputs which are observable, either directly or indirectly, using market data. As of December 31, 2016 and 2015, the Company believes that substantially all of the inputs required to calculate the fair value of puts and call swaptions are observable in the marketplace throughout the term of these derivative instruments or supported by observable levels at which transactions are executed in the marketplace, and are, therefore, classified as Level 2. Derivative instruments are also subject to the risk that counterparties will be unable to meet their obligations. Such non-performance risk is considered in the valuation of the Company’s derivative instruments, but to date has not had a material impact on estimates of fair values. Significant changes in the quoted forward prices for commodities and changes in market volatility generally lead to corresponding changes in the fair value measurement of the Company’s derivative instruments.
There were no derivative instruments classified as Level 3 as of December 31, 2016 or December 31, 2015. The fair values of the Company’s derivative instruments classified as Level 3 as of December 31, 2014 were $75.5 million. The significant unobservable inputs for Level 3 contracts as of December 31, 2014 include unpublished forward prices of commodities, market volatility and credit risk of counterparties.
F-42
Sanchez Energy Corporation
Notes to the Consolidated Financial Statements (Continued)
The following table sets forth a reconciliation of changes in the fair value of the Company’s derivative instruments classified as Level 3 in the fair value hierarchy (in thousands):
|
|
(Level 3) |
|||||||
|
|
Year Ended December 31, |
|||||||
|
|
2016 |
|
2015 |
|
2014 |
|||
|
Beginning balance |
$ |
— |
|
$ |
75,523 |
|
$ |
(519) |
|
Total gains (losses) included in earnings |
|
— |
|
|
418 |
|
|
81,404 |
|
Net settlements on derivative contracts(1) |
|
— |
|
|
(14,277) |
|
|
(5,362) |
|
Derivative contracts transferred to Level 2 |
|
— |
|
|
(61,664) |
|
|
— |
|
Ending balance |
$ |
— |
|
$ |
— |
|
$ |
75,523 |
|
Gains (losses) included in earnings related to derivatives still held as of December 31, 2016, 2015, and 2014 |
$ |
— |
|
$ |
(940) |
|
$ |
76,760 |
(1) Includes ($12,919) of net settlements in Level 2 that were transferred from Level 3 during 2015.
Fair Value on a Non‑Recurring Basis
The Company follows the provisions of ASC 820‑10 for nonfinancial assets and liabilities measured at fair value on a non‑recurring basis. Fair value measurements of assets acquired and liabilities assumed in business combinations are based on inputs that are not observable in the market and thus represent Level 3 inputs. The fair value of acquired properties is based on market and cost approaches. Our purchase price allocations for the Catarina Acquisition is presented in Note 3, “Acquisitions and Divestitures.” Liabilities assumed include asset retirement obligations existing at the date of acquisition. Asset retirement obligation estimates are derived from historical costs as well as management’s expectation of future cost environments. As there is no corroborating market activity to support the assumptions, the Company has designated these liabilities as Level 3. A reconciliation of the beginning and ending balances of the Company’s asset retirement obligations is presented in Note 12, “Asset Retirement Obligations.”
In connection with the exchange agreements entered into in February, May and August 2014 by the Company with certain holders of the Company’s Series A Preferred Stock and Series B Preferred Stock, the Company issued common stock according to the conversion rate pursuant to each agreement and additional shares to induce the holders of the preferred stock to convert prior to the date the Company could mandate conversion. In addition, on November 20, 2015, a holder of our Series B Preferred Stock exercised its right to convert 4,500 shares our Series B Preferred Stock, at the prescribed initial conversion rate of 2.337 shares of common stock per share of Series B Preferred Stock, in exchange for 10,517 shares of our common stock. The fair value of the common stock issued is based on the price of the Company’s common stock on the date of issuance. There were no conversions of Series A Preferred Stock or Series B Preferred Stock into shares of the Company’s common stock during the year ended December 31, 2016. As there is an active market for the Company’s common stock, the Company has designated this fair value measurement as Level 1. A detailed description of the Company’s common stock and preferred stock issuances and redemptions is presented in Note 6, ‘‘Stockholders’ Equity.’’
Fair Value of Other Financial Instruments
Financial instruments not carried at fair value consist of oil and natural gas receivables, accounts payable and accrued liabilities and long-term debt. The carrying amounts of our oil and natural gas receivables, accounts payable and accrued liabilities approximate fair value due to the highly liquid nature of these short term instruments. The registered 7.75% Notes are traded in an active market, and as such, are classified as Level 1 financial instruments. The estimated
F-43
Sanchez Energy Corporation
Notes to the Consolidated Financial Statements (Continued)
fair value of the 7.75% Notes was $612.0 million as of December 31, 2016, and was calculated using quoted market prices based on trades of such debt as of that date. The Company uses a market approach to determine fair value of its unregistered 6.125% Notes using observable market data. However, as the market for the 6.125% Notes is far less active than that of the 7.75% Notes, the Company also uses comparable market values for similar instruments, which results in a Level 2 fair value measurement. The estimated fair value of the 6.125% Notes was $1,098.3 million as of December 31, 2016.
Note 12. Asset Retirement Obligations
The Company’s asset retirement obligations represent the present value of the estimated cash flows expected to be incurred to plug, abandon and remediate producing properties, excluding salvage values, at the end of their productive lives in accordance with applicable laws. Revisions in estimated liabilities during the period relate primarily to changes in estimates of asset retirement costs. Revisions in estimated liabilities can also include, but are not limited to, revisions of estimated inflation rates, changes in property lives, and the expected timing of settlement. The changes in the asset retirement obligation for the years ended December 31, 2016 and 2015 were as follows (in thousands):
|
|
|
December 31, |
|
||||
|
|
|
2016 |
|
2015 |
|
||
|
Abandonment liability as of January 1, |
|
$ |
25,907 |
|
$ |
25,694 |
|
|
Liabilities incurred during period |
|
|
1,492 |
|
|
6,021 |
|
|
Acquisitions |
|
|
219 |
|
|
— |
|
|
Divestitures |
|
|
(4,433) |
|
|
(379) |
|
|
Revisions |
|
|
(172) |
|
|
(7,623) |
|
|
Accretion expense |
|
|
2,074 |
|
|
2,194 |
|
|
Abandonment liability as of December 31, |
|
$ |
25,087 |
|
$ |
25,907 |
|
Note 13. Accrued Liabilities
The following information summarizes accrued liabilities as of December 31, 2016 and 2015 (in thousands):
|
|
|
As of December 31, |
|
||||
|
|
|
2016 |
|
2015 |
|
||
|
Capital expenditures |
|
$ |
35,154 |
|
$ |
51,983 |
|
|
Other: |
|
|
|
|
|
|
|
|
General and administrative costs |
|
|
14,738 |
|
|
5,214 |
|
|
Production taxes |
|
|
2,396 |
|
|
2,532 |
|
|
Ad valorem taxes |
|
|
2,756 |
|
|
886 |
|
|
Lease operating expenses |
|
|
23,942 |
|
|
27,077 |
|
|
Interest payable |
|
|
34,266 |
|
|
34,265 |
|
|
Preferred stock dividends and other |
|
|
4,360 |
|
|
— |
|
|
Total accrued liabilities |
|
$ |
117,612 |
|
$ |
121,957 |
|
F-44
Sanchez Energy Corporation
Notes to the Consolidated Financial Statements (Continued)
Note 14. Commitments and Contingencies
Litigation
From time to time, the Company may be involved in lawsuits that arise in the normal course of its business. We are not aware of any material governmental proceedings against us or contemplated to be brought against us.
On December 4, 2013, and December 16, 2013, three derivative actions were filed in the Court of Chancery of the State of Delaware against the Company, certain of its officers and directors, Sanchez Resources, Altpoint Capital Partners LLC and Altpoint Sanchez Holdings, LLC (Friedman v. A.R. Sanchez, Jr. et al., No. 9158; City of Roseville Employees’ Retirement System v. A.R. Sanchez, Jr. et al., No. 9132; and Delaware County Employees Retirement Fund v. A.R. Sanchez, Jr. et al., No. 9165 (collectively, the “Consolidated Derivative Actions”)).
On December 20, 2013, the Consolidated Derivative Actions were consolidated, co-lead counsel for the plaintiffs was appointed and the plaintiffs were ordered to file an amended consolidated complaint (In re Sanchez Energy Derivative Litigation, Consolidated C.A. No. 9132-VCG, hereinafter, the “Delaware Derivative Action”). On January 28, 2014, a verified consolidated stockholder derivative complaint was filed. The Consolidated Derivative Actions concern the Company’s purchase of working interests in the TMS from SR. Plaintiffs alleged breaches of fiduciary duty against the individual defendants as directors of the Company; breaches of fiduciary duty against Antonio R. Sanchez, III as an executive director of the Company; aiding and abetting breaches of fiduciary duty against SR, Eduardo Sanchez, Altpoint Capital Partners LLC and Altpoint Sanchez Holdings, LLC; and unjust enrichment against A.R. Sanchez, Jr. and Antonio R. Sanchez, III. All of the defendants filed a motion to dismiss on April 1, 2014. Briefing concerning the motions to dismiss concluded on June 27, 2014. A hearing was held on August 11, 2014, on the motions to dismiss, and the court subsequently granted the motions to dismiss. The plaintiffs appealed the case to the Delaware Supreme Court for which the parties fully briefed the appeal and provided oral argument. On October 2, 2015, the Delaware Supreme Court reversed the motions to dismiss and remanded the case to the Court of Chancery of the State of Delaware. The Consolidated Derivative Actions are currently in the early stages of discovery. A mediation in connection with the matter was held on July 7, 2016. The Company is unable to reasonably predict an outcome or to reasonably estimate a range of possible loss.
On January 9, 2014, a derivative action was filed in 333rd district court in Harris County, Texas against the Company and certain of its officers and directors, styled Martin v. Sanchez, No. 2014-01028 (333rd Dist. Harris County, Texas). The complaint alleged a breach of fiduciary duty, corporate waste and unjust enrichment against various officers and directors. No action has been taken to date and damages are unspecified. On March 14, 2014, this action was stayed following a ruling on the motion to dismiss in the Delaware Derivative Action. After the motions to dismiss were granted in the Delaware Derivative Action, the parties entered into another agreed stay pending the appeal of the Delaware Derivative Action to the Delaware Supreme Court. This stay was entered by the court on February 5, 2015. This action is in its preliminary stages, and the Company is unable to reasonably predict an outcome or to estimate a range of reasonably possible loss.
Defendants believe that the allegations contained in the matters described above are without merit and intend to vigorously defend themselves against the claims raised.
Catarina Drilling Obligation
In connection with the Catarina Acquisition, the 77,000 acres of undeveloped acreage that were included in the acquisition are subject to a continuous drilling obligation. Such drilling obligation requires us to drill (i) 50 wells in each
F-45
Sanchez Energy Corporation
Notes to the Consolidated Financial Statements (Continued)
annual period commencing on July 1, 2014 and (ii) at least one well in any consecutive 120 - day period in order to maintain rights to any future undeveloped acreage. Up to 30 wells drilled in excess of the minimum 50 wells in a given annual period can be carried over to satisfy part of the 50 well requirement in the subsequent annual period on a well for well basis. The lease also created a customary security interest in the production therefrom in order to secure royalty payments to the lessor and other lease obligations. Our current capital budget and plans include the drilling of at least the minimum number of wells required to maintain access to such undeveloped acreage.
Lease Payment Obligations
As of December 31, 2016, the Company had $216.4 million in lease payment obligations that satisfy operating lease criteria. These obligations include: (i) $158.6 million in payments due with respect to firm commitment of oil and natural gas volumes under the Gathering Agreement contract signed with SPP as part of the Western Catarina Midstream Divestiture that commenced on October 14, 2015 and continues until October 13, 2020, (ii) $45.7 million for a corporate office lease that commenced in the fourth quarter of 2014 and has an expiration date in March 2025, (iii) $6.2 million for a ground lease agreement for land owned by the Calhoun Port Authority that commenced during the third quarter of 2014 and has an expiration date in August 2024 and (iv) $5.9 million for a 10 year acreage lease agreement for a promotional ranch managed by the Company in Kenedy County, Texas.
The lease agreement for the acreage in Kenedy County, Texas includes a contractual requirement for the Company to spend a minimum of $4 million to make permanent improvements over the ten year life of the lease. The lease agreement does not specify the timing for such improvements to be made within the lease term. The Company has the right to terminate the lease obligation without penalty at any time with nine months advanced written notice and payment of any accrued leasehold expenses.
The Company’s ground lease with the Calhoun Port Authority is terminable upon 180 days written notice by the Company to the lessor in addition to a $1 million termination payment.
Note 15. Subsidiary Guarantors
The Company filed registration statements on Form S‑3 with the SEC, which became effective January 14, 2013 and June 11, 2014 and April 25, 2016 and registered, among other securities, debt securities. The subsidiaries of the Company named therein are co‑registrants with the Company, and the registration statement registered guarantees of debt securities by such subsidiaries. As of December 31, 2016, such subsidiaries are 100 percent owned by the Company and any guarantees by these subsidiaries will be full and unconditional (except for customary release provisions). In the event that more than one of these subsidiaries provide guarantees of any debt securities issued by the Company, such guarantees will constitute joint and several obligations.
The Company also filed a registration statement on Form S-4 with the SEC, which became effective on June 20, 2014, pursuant to which the Company completed an offering of the 7.75% Notes, which are guaranteed by its subsidiaries named therein. As of December 31, 2016, such guarantor subsidiaries are 100 percent owned by the Company and the guarantees by these subsidiaries are full and unconditional (except for customary release provisions) and are joint and several. The Company also filed a registration statement on Form S-4 with the SEC, which became effective on January 23, 2015, pursuant to which the Company completed an offering of the 6.125% Notes, which are guaranteed by its subsidiaries named therein. As of December 31, 2016, such guarantor subsidiaries are 100 percent owned by the Company and the guarantees by these subsidiaries are full and unconditional (except for customary release provisions) and are joint and several.
F-46
Sanchez Energy Corporation
Notes to the Consolidated Financial Statements (Continued)
The rules of Regulation S-X Rule 3-10 require that condensed consolidating financial information be provided for a subsidiary that has guaranteed the debt of a registrant issued in a public offering, where the guarantee is full, unconditional and joint and several and where the voting interest of the subsidiary is 100% owned by the registrant. See Note 18, “Condensed Consolidating Financial Information” for further discussion regarding the condensed consolidating financial information for guarantor and non-guarantor subsidiaries.
The Company has no assets or operations independent of its subsidiaries and there are no significant restrictions upon the ability of its subsidiaries to distribute funds to the Company.
Note 16. Investments
On November 22, 2016, a subsidiary of the Company purchased 2,272,727 common units of SPP for $25.0 million as part of a private equity issuance. As of December 31, 2016, this ownership represents approximately 16.9% of SPP’s common units outstanding. Rather than accounting for the investment under the equity method, the Company elected the fair value option to account for its interest in SPP. The Company records the equity investment in SPP at fair value at the end of each reporting period. Any gains or losses are recorded as a component of other income (expense) in the consolidated statement of operations. The Company recorded gains related to the investment in SPP for the twelve months ended December 31, 2016 of approximately $1.8 million.
On October 2, 2015, the Company, via SN Catarina, purchased from a subsidiary of Targa a 10% undivided interest in the Silver Oak II Gas Processing Facility (the “SOII Facility”) in Bee County, Texas for a purchase price of $12.5 million. Targa owns the remaining undivided 90% interest in the SOII Facility, which is operated by Targa. Concurrently with the execution of the purchase and sale agreement for the SOII Facility, the Company entered into a firm gas processing agreement, whereby Targa is processing a firm quantity, 125,000 Mcf/d, until the in-service date of the Carnero Processing Plant discussed below. The Company is accounting for the investment in the SOII Facility as an equity method investment as Targa is the operator and majority interest owner of the SOII Facility. As of December 31, 2016, the Company had invested capital of $12.5 million in the SOII Facility. The Company recorded earnings from the SOII Facility investment of approximately $1.2 million from equity investments during 2016.
On November 22, 2016, SN Midstream sold its membership interests in Carnero Processing to SPP for an initial payment of $55.5 million and the assumption by SPP of remaining capital commitments to Carnero Processing, which are estimated at approximately $24.5 million (the “Carnero Processing Disposition”). The Company was accounting for this joint venture as an equity method investment as Targa is the operator of the joint ventures and has the most influence with respect to the normal day-to-day construction and operating decisions. Prior to the sale, the Company had invested approximately $48.0 million in Carnero Processing joint venture. The membership interests disposed of constitute 50% of the outstanding membership interests in Carnero Processing. The remaining 50% membership interests of Carnero Processing are owned by an affiliate of Targa. Prior to the sale of Carnero Processing, the Company recorded losses of approximately $0.1 million from equity investments during 2016. The Company recorded a deferred gain of approximately $7.5 million included in “Other Liabilities” as a result of the firm gas processing agreement that remains between the Company and Targa. This deferred gain will be amortized periodically over the term of this firm gas processing agreement according to volumes processed through the Carnero Processing facility.
On July 5, 2016, SN Midstream sold its membership interests in Carnero Gathering to SPP for an initial payment of approximately $37.0 million and the assumption by SPP of remaining capital commitments to Carnero Gathering, estimated at approximately $7.4 million (the “Carnero Gathering Disposition”). The Company was accounting for this joint venture as an equity method investment as Targa is the operator of the joint ventures and has the most influence with respect to the normal day-to-day construction and operating decisions. Prior to the sale, the
F-47
Sanchez Energy Corporation
Notes to the Consolidated Financial Statements (Continued)
Company had invested approximately $26.0 million in Carnero Gathering joint venture. As part of the Carnero Gathering Disposition, SPP is required to pay SN Midstream a monthly earnout based on gas received at Carnero Gathering’s receipt points from SN Catarina and gas delivered and processed at the Processing Plant by other producers. The membership interests disposed of constitute 50% of the outstanding membership interests in Carnero Gathering. The remaining 50% membership interests of Carnero Gathering are owned by an affiliate of Targa. Prior to the sale of Carnero Gathering, the Company recorded earnings of approximately $2.3 million from equity investments during 2016. The Company recorded a deferred gain of approximately $8.7 million included in “Other Liabilities” as a result of the firm gas gathering agreement that remains between the Company and Targa and a transportation services agreement between Targa and Carnero Gathering. This deferred gain will be amortized periodically over the term of this firm gas gathering agreement according to volumes delivered through the Carnero Gathering pipelines.
Note 17. Variable Interest Entities
During the first quarter of 2016, the Company adopted ASU 2015-02, “Consolidation—Amendments to the Consolidation Analysis,” which introduces a separate analysis for determining if limited partnerships and similar entities are variable interest entities (“VIEs”) and clarifies the steps a reporting entity would have to take to determine whether the voting rights of stockholders in a corporation or similar entity are substantive.
As noted above in Note 16, “Investments,” the Company, through SN Midstream, entered into joint venture agreements with an affiliate of Targa in October 2015 to, among other things, construct the Processing Plant and associated high pressure gathering pipelines near the Company’s Catarina asset in South Texas. In addition, the Company, via SN Catarina, purchased from a subsidiary of Targa a 10% undivided interest in the SOII Facility. As noted above in Note 16, “Investments,” on July 5, 2016 and November 22, 2016, the Company sold its interests, and any remaining commitment to invest in Carnero Gathering and Carnero Processing, respectively, to SPP. The Company determined that ownership in the SOII Facility are more similar to limited partnerships than corporations. Under the revised guidance of ASU 2015-02, a limited partnership or similar entity with equity at risk will not be a VIE if they are able to exercise kick-out rights over the general partner(s) or they are able to exercise substantive participating rights. We concluded that the investment in SOII Facility is a VIE under the revised guidance because we cannot remove Targa as operator and we do not have substantive participating rights. In addition, Targa has the discretion to direct activities of the VIEs regarding the risks associated with price, operations, and capital investment which have the most significant impact on the VIEs economic performance.
The Company’s investment in the SOII Facility represents a VIE that could expose the Company to losses. The amount of losses the Company could be exposed to from the investment in the SOII Facility is limited to the equity in the investment at any point in time.
As of December 31, 2016, the Company had invested capital of $12.5 million in the SOII Facility, and recorded earnings from the equity investment of $0.3 million. As of December 31, 2016, no debt has been incurred by the SOII Facility. The Company is accounting for the VIE as an equity method investment and determined that Targa is the primary beneficiary of the VIE as Targa is the operator of the SOII Facility and has the most influence with respect to the normal day-to-day operating decisions of the facility. We have included the VIE in the “Other Assets - Investments” long-term asset line on the balance sheet.
As noted above in Note 16, “Investments,” in November 2016, the Company purchased common units of SPP for $25.0 million as part of a private equity issuance. Rather than accounting for the investment under the equity method, the Company elected the fair value option to account for its interest in SPP. The Company’s investment in SPP represents a VIE that could expose the Company to losses limited to the equity in the investment at any point in time.
F-48
Sanchez Energy Corporation
Notes to the Consolidated Financial Statements (Continued)
The carrying amounts of the investment in SPP and the Company’s maximum exposure to loss as of December 31, 2016, was approximately $26.8 million.
Below is a tabular comparison of the carrying amounts of the assets and liabilities of the VIE and the Company’s maximum exposure to loss as of December 31, 2016 and December 31, 2015 (in thousands):
|
|
|
December 31, |
|
December 31, |
||
|
|
|
2016 |
|
2015 |
||
|
Capital investments |
|
$ |
37,527 |
|
$ |
49,985 |
|
Earnings in equity investments |
|
|
311 |
|
|
— |
|
Gain (loss) from change in fair value of investment in SPP |
|
|
1,818 |
|
|
— |
|
Equity in equity investments |
|
$ |
39,656 |
|
$ |
49,985 |
|
|
|
|
|
|
|
|
|
|
|
December 31, |
|
December 31, |
||
|
|
|
2016 |
|
2015 |
||
|
Equity in equity investments |
|
$ |
39,656 |
|
$ |
49,985 |
|
Guarantees of capital investments |
|
|
— |
|
|
65,526 |
|
Maximum exposure to loss |
|
$ |
39,656 |
|
$ |
115,511 |
Note 18. Condensed Consolidating Financial Information
As noted above, the rules of the SEC require that condensed consolidating financial information be provided for a subsidiary that has guaranteed the debt of a registrant issued in a public offering, where the guarantee is full, unconditional and joint and several and where the voting interest of the subsidiary is 100% owned by the registrant. The Company is, therefore, presenting condensed consolidating financial information on a parent company, combined guarantor subsidiaries, combined non-guarantor subsidiaries and consolidated basis (in thousands) and should be read in conjunction with the consolidated financial statements. The financial information may not necessarily be indicative of results of operations, cash flows, or financial position had such guarantor subsidiaries operated as independent entities.
Investments in subsidiaries are accounted for by the respective parent company using the equity method for purposes of this presentation. Results of operations of subsidiaries are, therefore, reflected in the parent company’s investment accounts and earnings. The principal elimination entries set forth below eliminate investments in subsidiaries and intercompany balances and transactions. Typically, in a condensed consolidating financial statement, the net income and equity of the parent company equals the net income and equity of the consolidated entity.
F-49
Sanchez Energy Corporation
Notes to the Consolidated Financial Statements (Continued)
|
|
|
December 31, 2016 |
|||||||||||||
|
Assets |
|
Parent Company |
|
Combined Guarantor Subsidiaries |
|
Combined Non-Guarantor Subsidiaries |
|
Eliminations |
|
Consolidated |
|||||
|
Total current assets |
|
$ |
428,384 |
|
$ |
157,154 |
|
$ |
158,589 |
|
$ |
(181,322) |
|
$ |
562,805 |
|
Total oil and natural gas properties, net |
|
|
- |
|
|
658,588 |
|
|
- |
|
|
- |
|
|
658,588 |
|
Investment in subsidiaries |
|
|
734,704 |
|
|
- |
|
|
- |
|
|
(734,704) |
|
|
- |
|
Other assets |
|
|
14,376 |
|
|
15,221 |
|
|
35,290 |
|
|
- |
|
|
64,887 |
|
Total Assets |
|
$ |
1,177,464 |
|
$ |
830,963 |
|
$ |
193,879 |
|
$ |
(916,026) |
|
$ |
1,286,280 |
|
|
|
|
|
|
|
|
|
|
|
|
|
|
|
|
|
|
Liabilities and Shareholders' Equity |
|
|
|
|
|
|
|
|
|
|
|
|
|
|
|
|
Current liabilities |
|
$ |
109,539 |
|
$ |
78,344 |
|
$ |
170,435 |
|
$ |
(181,321) |
|
$ |
176,997 |
|
Long-term liabilities |
|
|
1,764,064 |
|
|
25,087 |
|
|
16,273 |
|
|
(1) |
|
|
1,805,423 |
|
Total shareholders' equity (deficit) |
|
|
(696,139) |
|
|
727,532 |
|
|
7,171 |
|
|
(734,704) |
|
|
(696,140) |
|
Total Liabilities and Shareholders' Equity (deficit) |
|
$ |
1,177,464 |
|
$ |
830,963 |
|
$ |
193,879 |
|
$ |
(916,026) |
|
$ |
1,286,280 |
|
|
|
December 31, 2015 |
|||||||||||||
|
Assets |
|
Parent Company |
|
Combined Guarantor Subsidiaries |
|
Combined Non-Guarantor Subsidiaries |
|
Eliminations |
|
Consolidated |
|||||
|
Total current assets |
|
$ |
671,278 |
|
$ |
37,005 |
|
$ |
704 |
|
$ |
(42,369) |
|
$ |
666,618 |
|
Total oil and natural gas properties, net |
|
|
- |
|
|
756,103 |
|
|
- |
|
|
- |
|
|
756,103 |
|
Investment in subsidiaries |
|
|
700,053 |
|
|
- |
|
|
- |
|
|
(700,053) |
|
|
- |
|
Other assets |
|
|
14,481 |
|
|
17,737 |
|
|
46,365 |
|
|
- |
|
|
78,583 |
|
Total Assets |
|
$ |
1,385,812 |
|
$ |
810,845 |
|
$ |
47,069 |
|
$ |
(742,422) |
|
$ |
1,501,304 |
|
|
|
|
|
|
|
|
|
|
|
|
|
|
|
|
|
|
Liabilities and Shareholders' Equity |
|
|
|
|
|
|
|
|
|
|
|
|
|
|
|
|
Current liabilities |
|
$ |
78,840 |
|
$ |
88,666 |
|
$ |
42,369 |
|
$ |
(42,369) |
|
$ |
167,506 |
|
Long-term liabilities |
|
|
1,764,060 |
|
|
25,907 |
|
|
- |
|
|
- |
|
|
1,789,967 |
|
Total shareholders' equity (deficit) |
|
|
(457,088) |
|
|
696,272 |
|
|
4,700 |
|
|
(700,053) |
|
|
(456,169) |
|
Total Liabilities and Shareholders' Equity (deficit) |
|
$ |
1,385,812 |
|
$ |
810,845 |
|
$ |
47,069 |
|
$ |
(742,422) |
|
$ |
1,501,304 |
F-50
Sanchez Energy Corporation
Notes to the Consolidated Financial Statements (Continued)
|
|
|
Year Ended December 31, 2016 |
|||||||||||||
|
|
|
Parent Company |
|
Combined Guarantor Subsidiaries |
|
Combined Non-Guarantor Subsidiaries |
|
Eliminations |
|
Consolidated |
|||||
|
Total revenues |
|
$ |
- |
|
$ |
431,326 |
|
$ |
- |
|
$ |
- |
|
$ |
431,326 |
|
Total operating costs and expenses |
|
|
111,155 |
|
|
509,985 |
|
|
1,947 |
|
|
- |
|
|
623,087 |
|
Other income (expense) |
|
|
(177,710) |
|
|
109,920 |
|
|
4,418 |
|
|
- |
|
|
(63,372) |
|
Income (loss) before income taxes |
|
|
(288,865) |
|
|
31,261 |
|
|
2,471 |
|
|
- |
|
|
(255,133) |
|
|
|
|
|
|
|
|
|
|
|
|
|
|
|
|
|
|
Income tax expense |
|
|
1,825 |
|
|
- |
|
|
- |
|
|
- |
|
|
1,825 |
|
Equity in income (loss) of subsidiaries |
|
|
33,730 |
|
|
- |
|
|
- |
|
|
(33,730) |
|
|
- |
|
Net income (loss) |
|
$ |
(256,960) |
|
$ |
31,261 |
|
$ |
2,471 |
|
$ |
(33,730) |
|
$ |
(256,958) |
|
|
|
Year Ended December 31, 2015 |
|||||||||||||
|
|
|
Parent Company |
|
Combined Guarantor Subsidiaries |
|
Combined Non-Guarantor Subsidiaries |
|
Eliminations |
|
Consolidated |
|||||
|
Total revenues |
|
$ |
- |
|
$ |
475,779 |
|
$ |
- |
|
$ |
- |
|
$ |
475,779 |
|
Total operating costs and expenses |
|
|
75,096 |
|
|
1,890,342 |
|
|
1,692 |
|
|
- |
|
|
1,967,130 |
|
Other income (expense) |
|
|
44,726 |
|
|
(402) |
|
|
- |
|
|
- |
|
|
44,324 |
|
Loss before income taxes |
|
|
(30,370) |
|
|
(1,414,965) |
|
|
(1,692) |
|
|
- |
|
|
(1,447,027) |
|
|
|
|
|
|
|
|
|
|
|
|
|
|
|
|
|
|
Income tax expense |
|
|
7,600 |
|
|
- |
|
|
- |
|
|
- |
|
|
7,600 |
|
Equity in income (loss) of subsidiaries |
|
|
(1,416,657) |
|
|
- |
|
|
- |
|
|
1,416,657 |
|
|
- |
|
Net income (loss) |
|
$ |
(1,454,627) |
|
$ |
(1,414,965) |
|
$ |
(1,692) |
|
$ |
1,416,657 |
|
$ |
(1,454,627) |
|
|
|
Year Ended December 31, 2014 |
|||||||||||||
|
|
|
Parent Company |
|
Combined Guarantor Subsidiaries |
|
Combined Non-Guarantor Subsidiaries |
|
Eliminations |
|
Consolidated |
|||||
|
Total revenues |
|
$ |
- |
|
$ |
666,064 |
|
$ |
- |
|
$ |
- |
|
$ |
666,064 |
|
Total operating costs and expenses |
|
|
64,454 |
|
|
681,876 |
|
|
648 |
|
|
- |
|
|
746,978 |
|
Other income (expense) |
|
|
47,678 |
|
|
16 |
|
|
- |
|
|
- |
|
|
47,694 |
|
Loss before income taxes |
|
|
(16,776) |
|
|
(15,796) |
|
|
(648) |
|
|
- |
|
|
(33,220) |
|
|
|
|
|
|
|
|
|
|
|
|
|
|
|
|
|
|
Income tax benefit |
|
|
(11,429) |
|
|
- |
|
|
- |
|
|
- |
|
|
(11,429) |
|
Equity in income (loss) of subsidiaries |
|
|
(16,443) |
|
|
- |
|
|
- |
|
|
16,443 |
|
|
- |
|
Net income (loss) |
|
$ |
(21,790) |
|
$ |
(15,796) |
|
$ |
(648) |
|
$ |
16,443 |
|
$ |
(21,791) |
F-51
Sanchez Energy Corporation
Notes to the Consolidated Financial Statements (Continued)
|
|
|
Year Ended December 31, 2016 |
|||||||||||||
|
|
|
Parent Company |
|
Combined Guarantor Subsidiaries |
|
Combined Non-Guarantor Subsidiaries |
|
Eliminations |
|
Consolidated |
|||||
|
Net cash provided by (used in) operating activities |
|
$ |
(38,646) |
|
$ |
219,266 |
|
$ |
631 |
|
$ |
- |
|
$ |
181,251 |
|
Net cash provided by (used in) investing activities |
|
|
(46,602) |
|
|
(133,814) |
|
|
55,571 |
|
|
16,208 |
|
|
(108,637) |
|
Net cash provided by (used in) financing activities |
|
|
(5,745) |
|
|
(85,452) |
|
|
101,660 |
|
|
(16,208) |
|
|
(5,745) |
|
Net increase (decrease) in cash and cash equivalents |
|
|
(90,993) |
|
|
- |
|
|
157,862 |
|
|
- |
|
|
66,869 |
|
Cash and cash equivalents, beginning of period |
|
|
434,934 |
|
|
- |
|
|
114 |
|
|
- |
|
|
435,048 |
|
Cash and cash equivalents, end of period |
|
$ |
343,941 |
|
$ |
- |
|
$ |
157,976 |
|
$ |
- |
|
$ |
501,917 |
|
|
|
Year Ended December 31, 2015 |
|||||||||||||
|
|
|
Parent Company |
|
Combined Guarantor Subsidiaries |
|
Combined Non-Guarantor Subsidiaries |
|
Eliminations |
|
Consolidated |
|||||
|
Net cash provided by (used in) operating activities |
|
$ |
(44,090) |
|
$ |
317,499 |
|
$ |
(1,384) |
|
$ |
- |
|
$ |
272,025 |
|
Net cash provided by (used in) investing activities |
|
|
21,670 |
|
|
(249,185) |
|
|
(40,327) |
|
|
(26,489) |
|
|
(294,331) |
|
Net cash provided by (used in) financing activities |
|
|
(16,360) |
|
|
(68,314) |
|
|
41,825 |
|
|
26,489 |
|
|
(16,360) |
|
Net increase (decrease) in cash and cash equivalents |
|
|
(38,780) |
|
|
- |
|
|
114 |
|
|
- |
|
|
(38,666) |
|
Cash and cash equivalents, beginning of period |
|
|
473,714 |
|
|
- |
|
|
- |
|
|
- |
|
|
473,714 |
|
Cash and cash equivalents, end of period |
|
$ |
434,934 |
|
$ |
- |
|
$ |
114 |
|
$ |
- |
|
$ |
435,048 |
F-52
Sanchez Energy Corporation
Notes to the Consolidated Financial Statements (Continued)
|
|
|
Year Ended December 31, 2014 |
|||||||||||||
|
|
|
Parent Company |
|
Combined Guarantor Subsidiaries |
|
Combined Non-Guarantor Subsidiaries |
|
Eliminations |
|
Consolidated |
|||||
|
Net cash provided by (used in) operating activities |
|
$ |
(100,047) |
|
$ |
516,474 |
|
$ |
(1,092) |
|
$ |
- |
|
$ |
415,335 |
|
Net cash provided by (used in) investing activities |
|
|
(845,882) |
|
|
(1,347,416) |
|
|
(6,492) |
|
|
838,526 |
|
|
(1,361,264) |
|
Net cash provided by (used in) financing activities |
|
|
1,266,112 |
|
|
830,942 |
|
|
7,584 |
|
|
(838,526) |
|
|
1,266,112 |
|
Net increase (decrease) in cash and cash equivalents |
|
|
320,183 |
|
|
- |
|
|
- |
|
|
- |
|
|
320,183 |
|
Cash and cash equivalents, beginning of period |
|
|
153,531 |
|
|
- |
|
|
- |
|
|
- |
|
|
153,531 |
|
Cash and cash equivalents, end of period |
|
$ |
473,714 |
|
$ |
- |
|
$ |
- |
|
$ |
- |
|
$ |
473,714 |
Note 19. Subsequent Events
On January 12, 2017, the Company, through two of our subsidiaries, SN EF UnSub, LP (“SN UnSub”) and SN EF Maverick, LLC (“SN Maverick”), along with an entity controlled by The Blackstone Group, L.P., Gavilan Resources, LLC (“Blackstone”), signed a purchase and sale agreement (the “Comanche Purchase Agreement”) to acquire assets (the “Comanche Assets”) from Anadarko E&P Onshore LLC and Kerr-McGee Oil and Gas Onshore LP for $2,275 million in cash, subject to customary closing adjustments (the “Comanche Acquisition”). The Comanche Assets are primarily located in the Western Eagle Ford Shale and are expected to significantly expand our asset base and production. The Comanche Assets consist of approximately 318,000 gross (155,000 net) acres comprised of 252,000 gross (122,000 net) Eagle Ford Shale acres and 66,000 gross (33,000 net) Pearsall Shale acres, with an approximate 49% average working interest therein, contain approximately 300 MMBoe of proved reserves (70% liquids, 75% proved developed), and had production of approximately 67,000 Boe/d (70% liquids) as of December 31, 2016. The Comanche Purchase Agreement provides that SN UnSub will pay approximately 37% of the purchase price (including through a $100 million cash contribution from the Company) and SN Maverick will pay approximately 13% of the purchase price and SN UnSub and SN Maverick would acquire half of the 49% working interest in and to the Comanche Assets in the aggregate (and approximately 50% and 0%, respectively, of the estimated total proved developed producing reserves, 20% and 30%, respectively, of the estimated total proved developed non-producing reserves, and 20% and 30%, respectively, of the total proved undeveloped reserves), and Blackstone will pay 50% of the purchase price and would acquire the remaining half of the 49% working interest in and to the Comanche Assets (approximately 50% of the estimated total proved developed producing reserves, proved developed non-producing reserves and proved undeveloped reserves). We expect to close the Comanche Acquisition during the first quarter of 2017. The effective date of the transaction is July 1, 2016.
On February 6, 2017, the Company completed an underwritten public offering of 10,000,000 shares of the Company's common stock at a price of $12.50 per share ($11.7902 per share, net of underwriting discounts). The Company granted the Underwriters a 30-day option to purchase up to an additional 1,500,000 shares of the Company’s common stock on the same terms, which was exercised in full and closed on February 6, 2017. The Company received net proceeds of approximately $135.9 million (after deducting underwriting discounts of approximately $7.8 million) from the sale of the shares of common stock. The Company intends to use the net proceeds of the offering for general corporate purposes, including working capital.
F-53
Supplementary Quarterly Financial Results (Unaudited)
The following table presents the Company’s unaudited quarterly financial information for 2016 and 2015 (in thousands, except per share amounts):
|
|
|
First |
|
Second |
|
Third |
|
Fourth |
|
||||
|
2016: |
|
Quarter |
|
Quarter |
|
Quarter |
|
Quarter |
|
||||
|
Oil and natural gas revenue |
|
$ |
79,816 |
|
$ |
110,968 |
|
$ |
114,807 |
|
$ |
125,735 |
|
|
Impairment of oil and natural gas properties |
|
|
(22,084) |
|
|
(87,380) |
|
|
(59,582) |
|
|
— |
|
|
Operating costs and expenses |
|
|
(115,081) |
|
|
(118,432) |
|
|
(107,505) |
|
|
(113,023) |
|
|
Operating income (loss) |
|
|
(57,349) |
|
|
(94,844) |
|
|
(52,280) |
|
|
12,712 |
|
|
Interest income |
|
|
325 |
|
|
158 |
|
|
146 |
|
|
227 |
|
|
Other income (expense) |
|
|
(414) |
|
|
211 |
|
|
7 |
|
|
330 |
|
|
Gain on disposal of assets |
|
|
— |
|
|
— |
|
|
— |
|
|
112,294 |
|
|
Interest expense |
|
|
(31,606) |
|
|
(31,822) |
|
|
(31,797) |
|
|
(31,748) |
|
|
Earnings from Equity Investments |
|
|
512 |
|
|
2,179 |
|
|
463 |
|
|
312 |
|
|
Net gains (losses) on commodity derivatives |
|
|
22,757 |
|
|
(58,750) |
|
|
18,640 |
|
|
(35,796) |
|
|
Other income (expense), net |
|
|
(8,426) |
|
|
(88,024) |
|
|
(12,541) |
|
|
45,619 |
|
|
Income (loss) before income taxes |
|
|
(65,775) |
|
|
(182,868) |
|
|
(64,821) |
|
|
58,331 |
|
|
Income tax expense (benefit) |
|
|
— |
|
|
— |
|
|
1,441 |
|
|
384 |
|
|
Net income (loss) |
|
|
(65,775) |
|
|
(182,868) |
|
|
(66,262) |
|
|
57,947 |
|
|
Less: |
|
|
|
|
|
|
|
|
|
|
|
|
|
|
Preferred stock dividends |
|
|
(3,987) |
|
|
(3,987) |
|
|
(3,987) |
|
|
(3,987) |
|
|
Net income allocable to participating securities (1) (2) |
|
|
— |
|
|
— |
|
|
— |
|
|
(5,601) |
|
|
Net income (loss) attributable to common |
|
|
|
|
|
|
|
|
|
|
|
|
|
|
stockholders |
|
$ |
(69,762) |
|
$ |
(186,855) |
|
$ |
(70,249) |
|
$ |
48,359 |
|
|
Basic income (loss) per share (3) |
|
$ |
(1.20) |
|
$ |
(3.20) |
|
$ |
(1.19) |
|
|
0.82 |
|
|
Weighted average common shares outstanding - basic |
|
|
58,099 |
|
|
58,413 |
|
|
59,190 |
|
|
59,252 |
|
|
Diluted income (loss) per share (3) |
|
$ |
(1.20) |
|
$ |
(3.20) |
|
$ |
(1.19) |
|
$ |
0.73 |
|
|
Weighted average common shares outstanding - diluted |
|
|
58,099 |
|
|
58,413 |
|
|
59,190 |
|
|
71,772 |
|
(1) No losses are allocated to participating restricted stock. Such securities do not have a contractual obligation to share in the Company’s losses.
(2)The sum of quarterly net income allocable to participating securities will not agree with total year net income allocable to participating securities as each quarterly computation is based on the allocation of net income for the quarter to the participating securities.
(3)The sum of quarterly net income per share may not agree with total year net income per share as each quarterly computation is based on the allocation of net income for the quarter to the participating securities and the weighted average shares outstanding
F-54
|
|
|
First |
|
Second |
|
Third |
|
Fourth |
|
||||
|
2015: |
|
Quarter |
|
Quarter |
|
Quarter |
|
Quarter |
|
||||
|
Oil and natural gas revenue |
|
$ |
110,593 |
|
$ |
141,128 |
|
$ |
114,526 |
|
$ |
109,532 |
|
|
Impairment of oil and natural gas properties |
|
|
(441,450) |
|
|
(468,922) |
|
|
(454,628) |
|
|
— |
|
|
Operating costs and expenses |
|
|
(166,967) |
|
|
(170,640) |
|
|
(148,401) |
|
|
(116,122) |
|
|
Operating income |
|
|
(497,824) |
|
|
(498,434) |
|
|
(488,503) |
|
|
(6,590) |
|
|
Interest and other income |
|
|
(1,824) |
|
|
773 |
|
|
(753) |
|
|
(359) |
|
|
Interest expense |
|
|
(31,558) |
|
|
(31,500) |
|
|
(31,442) |
|
|
(31,899) |
|
|
Net gains (losses) on commodity derivatives |
|
|
41,303 |
|
|
(33,749) |
|
|
103,996 |
|
|
61,336 |
|
|
Other income (expense), net |
|
|
7,921 |
|
|
(64,476) |
|
|
71,801 |
|
|
29,078 |
|
|
Income (loss) before income taxes |
|
|
(489,903) |
|
|
(562,910) |
|
|
(416,702) |
|
|
22,488 |
|
|
Income tax expense (benefit) |
|
|
7,442 |
|
|
— |
|
|
158 |
|
|
— |
|
|
Net income (loss) |
|
|
(497,345) |
|
|
(562,910) |
|
|
(416,860) |
|
|
22,488 |
|
|
Less: |
|
|
|
|
|
|
|
|
|
|
|
|
|
|
Preferred stock dividends |
|
|
(3,991) |
|
|
(3,991) |
|
|
(3,991) |
|
|
(4,035) |
|
|
Net income allocable to participating securities (1) (2) |
|
|
— |
|
|
— |
|
|
— |
|
|
— |
|
|
Net income (loss) attributable to common |
|
|
|
|
|
|
|
|
|
|
|
|
|
|
stockholders |
|
$ |
(501,336) |
|
$ |
(566,901) |
|
$ |
(420,851) |
|
$ |
18,453 |
|
|
Basic income (loss) per share (3) |
|
$ |
(8.83) |
|
$ |
(9.91) |
|
$ |
(7.33) |
|
|
0.32 |
|
|
Weighted average common shares outstanding - basic |
|
|
56,805 |
|
|
57,184 |
|
|
57,426 |
|
|
57,490 |
|
|
Diluted income (loss) per share (3) |
|
$ |
(8.83) |
|
$ |
(9.91) |
|
$ |
(7.33) |
|
$ |
0.32 |
|
|
Weighted average common shares outstanding - diluted |
|
|
56,805 |
|
|
57,184 |
|
|
57,426 |
|
|
57,490 |
|
(1)No losses are allocated to participating restricted stock. Such securities do not have a contractual obligation to share in the Company’s losses.
(2)The sum of quarterly net income allocable to participating securities will not agree with total year net income allocable to participating securities as each quarterly computation is based on the allocation of net income for the quarter to the participating securities.
(3)The sum of quarterly net income per share may not agree with total year net income per share as each quarterly computation is based on the allocation of net income for the quarter to the participating securities and the weighted average shares outstanding.
F-55
Sanchez Energy Corporation
Supplemental Information on Oil and Natural Gas Exploration,
Development and Production Activities
(Unaudited)
The Company’s oil and natural gas properties are located within the United States of America, which constitutes one cost center.
Capitalized Costs—Capitalized costs and accumulated depreciation, depletion and impairment relating to the Company’s oil and natural gas producing activities are summarized below as of the dates indicated (in thousands):
|
|
|
As of December 31, |
|
|||||||
|
|
|
2016 |
|
2015 |
|
2014 |
|
|||
|
Oil and Natural Gas Properties: |
|
|
|
|
|
|
|
|
|
|
|
Unproved |
|
$ |
231,424 |
|
$ |
253,529 |
|
$ |
385,827 |
|
|
Proved |
|
|
3,164,115 |
|
|
2,914,867 |
|
|
2,582,441 |
|
|
Total Oil and Natural Gas Properties |
|
|
3,395,539 |
|
|
3,168,396 |
|
|
2,968,268 |
|
|
Less Accumulated depreciation, depletion, amortization and impairment |
|
|
(2,736,951) |
|
|
(2,412,293) |
|
|
(706,590) |
|
|
Net oil and natural gas properties capitalized |
|
$ |
658,588 |
|
$ |
756,103 |
|
$ |
2,261,678 |
|
Costs Incurred—Costs incurred in oil and natural gas property acquisition, exploration and development activities are summarized below (in thousands):
|
|
|
Year Ended December 31, |
|
|||||||
|
|
|
2016 |
|
2015 |
|
2014 |
|
|||
|
Exploration costs |
|
$ |
379 |
|
$ |
30,523 |
|
$ |
64,534 |
|
|
Development costs |
|
|
284,569 |
|
|
512,208 |
|
|
806,644 |
|
|
Acquisition and Divestiture costs: |
|
|
|
|
|
|
|
|
|
|
|
Proved properties |
|
|
50 |
|
|
— |
|
|
432,271 |
|
|
Unproved properties |
|
|
13,430 |
|
|
8,508 |
|
|
122,224 |
|
|
Total Costs Incurred |
|
$ |
298,428 |
|
$ |
551,239 |
|
$ |
1,425,673 |
|
|
|
|
|
|
|
|
|
|
|
|
|
|
Seismic costs included in exploration costs |
|
$ |
379 |
|
$ |
1,446 |
|
$ |
833 |
|
Results of Operations—Results of operations for the Company’s oil, NGL and natural gas producing activities are summarized below (in thousands):
|
|
|
|
|
|
|
|
|
|
|
|
|
|
|
Year Ended December 31, |
|
|||||||
|
|
|
2016 |
|
2015 |
|
2014 |
|
|||
|
Oil, NGL, and natural gas revenue |
|
$ |
431,326 |
|
$ |
475,779 |
|
$ |
666,064 |
|
|
Less operating expenses: |
|
|
|
|
|
|
|
|
|
|
|
Oil, NGL, and natural gas production expenses |
|
|
(164,567) |
|
|
(156,528) |
|
|
(93,581) |
|
|
Production and ad valorem taxes |
|
|
(19,633) |
|
|
(26,870) |
|
|
(37,787) |
|
|
Depreciation, depletion, amortization and accretion |
|
|
(159,760) |
|
|
(344,572) |
|
|
(338,097) |
|
|
Impairment of oil and natural gas properties |
|
|
(169,046) |
|
|
(1,365,000) |
|
|
(213,821) |
|
|
Results of operations from oil and gas producing activities |
|
$ |
(81,680) |
|
$ |
(1,417,191) |
|
$ |
(17,222) |
|
Reserves—Proved reserves are those quantities of oil, NGL and natural gas, which, by analysis of geoscience and engineering data, can be estimated with reasonable certainty to be economically producible—from a given date
F-56
forward, from known reservoirs, and under existing economic conditions, operating methods, and government regulations—prior to the time at which contracts providing the right to operate expire, unless evidence indicates that renewal is reasonably certain, regardless of whether deterministic or probalistic methods are used for the estimation. The project to extract the hydrocarbons must have commenced or the operator must be reasonably certain that it will commence the project within a reasonable time.
Proved developed reserves are proved reserves that can be expected to be recovered through existing wells with existing equipment and operating methods or in which the cost of the required equipment is relatively minor compared with the cost of a new well.
Proved undeveloped reserves (“PUDs”) are reserves that are expected to be recovered from new wells on undrilled acreage or from existing wells where a relatively major expenditure is required. Reserves on undrilled acreage are limited to those directly offsetting development spacing areas that are reasonably certain of production when drilled, unless evidence using reliable technology exists that establishes reasonable certainty of producing economic quantities at a greater distance. Only those undrilled locations that are scheduled to be drilled within five years pursuant to a development plan can be allocated to undeveloped reserves, unless the specific circumstances justify a longer time. As of December 31, 2016, the Company did not have any PUDs previously disclosed that have remained undeveloped for five years or more and no PUD locations included in the Company’s proved oil reserves are scheduled to be drilled after five years.
Estimates of proved developed and undeveloped reserves for the periods presented are based on estimates made by the independent engineers, Ryder Scott.
Proved reserves for all periods presented were estimated in accordance with the guidelines established by the SEC and FASB. The rules require SEC reporting companies to prepare their reserve estimates based on the average prices during the 12 month period prior to the ending date of the period covered in the report, determined as the unweighted arithmetic average of the prices in effect on the first day of the month for each month within such period, unless prices were defined by contractual arrangements. The product prices used to determine the future gross revenues for each property reflect adjustments to the benchmark prices for gravity, quality, local conditions, and/or distance from the market. The pricing used for the estimates of the Company’s reserves of oil and condensate as of December 31, 2016, 2015 and 2014 was based on unweighted twelve month average WTI posted prices of $42.75, $50.28, and $94.99, respectively. The pricing used for the estimates of the Company’s reserves of natural gas as of December 31, 2016, 2015 and 2014 were based on an unweighted twelve month average Henry Hub spot natural gas prices average of $2.49, $2.58, and $4.35, respectively. The pricing used for the estimates of the Company’s reserves of natural gas liquids as of December 31, 2016, 2015 and 2014 were based on an unweighted twelve month average Mt. Belvieu prices average of $19.97, $19.90, and $44.84, respectively.
F-57
Net proved quantities summary
The following table sets forth the net proved, proved developed and proved undeveloped reserves activity for the years ended December 31, 2016, 2015 and 2014:
|
|
|
Oil (MBbl) |
|
Natural Gas Liquids (MBbl) |
|
Natural Gas (MMcf) |
|
MBoe (1) |
|
|
Balance as of December 31, 2013 |
|
45,420 |
|
6,615 |
|
40,156 |
|
58,727 |
|
|
Revisions of previous estimates |
|
1,261 |
|
3,901 |
|
6,412 |
|
6,231 |
|
|
Extensions and discoveries |
|
12,107 |
|
6,612 |
|
32,691 |
|
24,168 |
|
|
Purchases of reserves in place |
|
11,826 |
|
20,746 |
|
145,222 |
|
56,775 |
|
|
Production |
|
(6,080) |
|
(2,590) |
|
(14,828) |
|
(11,141) |
|
|
Balance as of December 31, 2014 |
|
64,534 |
|
35,284 |
|
209,653 |
|
134,760 |
|
|
Revisions of previous estimates |
|
(16,395) |
|
(1,999) |
|
3,427 |
|
(17,823) |
|
|
Extensions and discoveries |
|
14,369 |
|
10,091 |
|
63,860 |
|
35,103 |
|
|
Purchases of reserves in place |
|
(3,578) |
|
(824) |
|
(4,871) |
|
(5,213) |
|
|
Production |
|
(7,165) |
|
(5,754) |
|
(37,594) |
|
(19,184) |
|
|
Balance as of December 31, 2015 |
|
51,765 |
|
36,798 |
|
234,475 |
|
127,643 |
|
|
Revisions of previous estimates |
|
(20,506) |
|
(10,733) |
|
(49,076) |
|
(39,418) |
|
|
Extensions and discoveries |
|
42,778 |
|
39,237 |
|
278,715 |
|
128,467 |
|
|
Purchases (sales) of reserves in place |
|
(3,090) |
|
(675) |
|
(3,760) |
|
(4,392) |
|
|
Production |
|
(6,370) |
|
(5,960) |
|
(43,189) |
|
(19,529) |
|
|
Balance as of December 31, 2016 |
|
64,577 |
|
58,667 |
|
417,165 |
|
192,771 |
|
|
Proved developed reserves: |
|
|
|
|
|
|
|
|
|
|
As of December 31, 2014 |
|
27,460 |
|
18,554 |
|
110,543 |
|
64,438 |
|
|
As of December 31, 2015 |
|
21,718 |
|
20,803 |
|
132,911 |
|
64,672 |
|
|
As of December 31, 2016 |
|
18,245 |
|
21,060 |
|
149,029 |
|
64,143 |
|
|
Proved undeveloped reserves: |
|
|
|
|
|
|
|
|
|
|
As of December 31, 2014 |
|
37,074 |
|
16,730 |
|
99,110 |
|
70,322 |
|
|
As of December 31, 2015 |
|
30,048 |
|
15,995 |
|
101,564 |
|
62,970 |
|
|
As of December 31, 2016 |
|
46,332 |
|
37,606 |
|
268,136 |
|
128,627 |
|
|
|
|
|
|
|
|
|
|
|
|
(1)Oil equivalents are determined under the relative energy content method by using the ratio of 6.0 Mcf of gas to 1.0 Bbl of oil.
F-58
Standardized Measure—The standardized measure of discounted future net cash flows relating to the Company’s ownership interest in proved oil, NGL and natural gas reserves as of December 31, 2016, 2015 and 2014 is shown below (in thousands):
|
|
|
As of December 31, |
|
|||||||
|
Standardized Measure |
|
2016 |
|
2015 |
|
2014 |
|
|||
|
Future cash inflows |
|
$ |
4,300,728 |
|
$ |
3,424,682 |
|
$ |
7,835,812 |
|
|
Future production costs |
|
|
(2,362,243) |
|
|
(1,744,947) |
|
|
(2,635,281) |
|
|
Future development costs |
|
|
(919,418) |
|
|
(667,117) |
|
|
(1,639,991) |
|
|
Future income taxes |
|
|
— |
|
|
— |
|
|
(407,193) |
|
|
Discount to present value at 10% annual rate |
|
|
(505,696) |
|
|
(419,144) |
|
|
(1,372,769) |
|
|
Standardized measure of discounted future net cash flows |
|
$ |
513,371 |
|
$ |
593,474 |
|
$ |
1,780,578 |
|
The future cash flows are based on average first‑day‑of‑month prices during the prior 12‑month period and cost rates in existence at the time of the projections.
Changes in standardized measure of discounted future net cash flows—Changes in standardized measure of discounted future net cash flows relating to proved oil, NGL and natural gas reserves for each of the three years in the period ended December 31, 2016 are summarized below (in thousands):
|
|
|
Year Ended December 31, |
|
|||||||
|
Summary of Changes |
|
2016 |
|
2015 |
|
2014 |
|
|||
|
Balance, beginning of period |
|
$ |
593,474 |
|
$ |
1,780,578 |
|
$ |
1,209,555 |
|
|
|
|
|
|
|
|
|
|
|
|
|
|
Net changes in prices and costs |
|
|
(209,286) |
|
|
(1,790,803) |
|
|
(725,716) |
|
|
Revisions of previous quantity estimates |
|
|
(235,324) |
|
|
(120,836) |
|
|
130,752 |
|
|
Extensions, discoveries and improved recovery, less related costs |
|
|
239,765 |
|
|
279,679 |
|
|
448,464 |
|
|
Sales of oil and gas - net of production costs |
|
|
(247,126) |
|
|
(292,382) |
|
|
(535,580) |
|
|
Net change in income taxes |
|
|
— |
|
|
142,761 |
|
|
113,008 |
|
|
Changes in development costs |
|
|
456,565 |
|
|
426,246 |
|
|
629,403 |
|
|
Accretion of discount |
|
|
59,347 |
|
|
178,058 |
|
|
120,955 |
|
|
Purchases of reserves in place |
|
|
2,319 |
|
|
— |
|
|
590,559 |
|
|
Sales of reserves in place |
|
|
(49,738) |
|
|
(136,828) |
|
|
— |
|
|
Change in production rates, timing, and other |
|
|
(96,625) |
|
|
127,001 |
|
|
(200,822) |
|
|
Net change |
|
|
(80,103) |
|
|
(1,187,104) |
|
|
571,023 |
|
|
|
|
|
|
|
|
|
|
|
|
|
|
Balance, end of period |
|
$ |
513,371 |
|
$ |
593,474 |
|
$ |
1,780,578 |
|
F-59