Attached files
| file | filename |
|---|---|
| EX-10.40 - EXHIBIT 10.40 - Pioneer PE Holding LLC | ex1040doindemnificationagr.htm |
| EX-99.1 - EXHIBIT 99.1 - Pioneer PE Holding LLC | ex991nsai.htm |
| EX-32.2 - EXHIBIT 32.2 - Pioneer PE Holding LLC | ex322-2016123110xk.htm |
| EX-32.1 - EXHIBIT 32.1 - Pioneer PE Holding LLC | ex321-2016123110xk.htm |
| EX-31.2 - EXHIBIT 31.2 - Pioneer PE Holding LLC | ex312-2016123110xk.htm |
| EX-31.1 - EXHIBIT 31.1 - Pioneer PE Holding LLC | ex311-2016123110xk.htm |
| EX-23.2 - EXHIBIT 23.2 - Pioneer PE Holding LLC | ex232nsaiconsentfy1610-k.htm |
| EX-23.1 - EXHIBIT 23.1 - Pioneer PE Holding LLC | ex231kpmgconsent.htm |
| EX-21.1 - EXHIBIT 21.1 - Pioneer PE Holding LLC | ex211subsidiarylisting2016.htm |
| EX-10.41 - EXHIBIT 10.41 - Pioneer PE Holding LLC | ex1041doindemnificationagr.htm |
| EX-10.39 - EXHIBIT 10.39 - Pioneer PE Holding LLC | ex1039doindemnificationagr.htm |
UNITED STATES
SECURITIES AND EXCHANGE COMMISSION
Washington, D.C. 20549
FORM 10-K
(Mark One)
ý | ANNUAL REPORT PURSUANT TO SECTION 13 OR 15(d) OF THE SECURITIES EXCHANGE ACT OF 1934 |
For the fiscal year ended December 31, 2016
or
¨ | TRANSITION REPORT PURSUANT TO SECTION 13 OR 15(d) OF THE SECURITIES EXCHANGE ACT OF 1934 |
For the transition period from to
Commission File Number: 001-36463
PARSLEY ENERGY, INC.
(Exact name of registrant as specified in its charter)
Delaware | 46-4314192 | |
(State or other jurisdiction of incorporation or organization) | (I.R.S. Employer Identification No.) | |
303 Colorado Street, Suite 3000 Austin, Texas | 78701 | |
(Address of principal executive offices) | (Zip Code) | |
(737) 704-2300
(Registrant’s telephone number, including area code)
Securities registered pursuant to Section 12(b) of the Act:
Title of each class | Name of each exchange on which registered | |
Class A Common Stock, $0.01 par value | New York Stock Exchange | |
Securities registered pursuant to Section 12(g) of the Act: None
Indicate by check mark if the registrant is a well-known seasoned issuer, as defined in Rule 405 of the Securities Act. Yes ý No ¨
Indicate by check mark if the registrant is not required to file reports pursuant to Section 13 or Section 15(d) of the Act. Yes ¨ No ý
Indicate by check mark whether the registrant (1) has filed all reports required to be filed by Section 13 or 15(d) of the Securities Exchange Act of 1934 during the preceding 12 months (or for such shorter period that the registrant was required to file such reports), and (2) has been subject to such filing requirements for the past 90 days. Yes ý No ¨
Indicate by check mark whether the registrant has submitted electronically and posted on its corporate Web site, if any, every Interactive Data File required to be submitted and posted pursuant to Rule 405 of Regulation S-T during the preceding 12 months (or for such shorter period that the registrant was required to submit and post such files). Yes ý No ¨
Indicate by check mark if disclosure of delinquent filers pursuant to Item 405 of Regulation S-K is not contained herein, and will not be contained, to the best of registrant’s knowledge, in definitive proxy or information statements incorporated by reference in Part III of this Form 10-K or any amendment to this Form 10-K. ¨
Indicate by check mark whether the registrant is a large accelerated filer, an accelerated filer, a non-accelerated filer, or a smaller reporting company. See the definitions of "large accelerated filer," "accelerated filer" and "smaller reporting company" in Rule 12b-2 of the Exchange Act.
Large accelerated filer | ý | Accelerated filer | ¨ |
Non-accelerated filer | o (Do not check if a smaller reporting company) | Smaller reporting company | ¨ |
Indicate by check mark whether the registrant is a shell company (as defined in Rule 12b-2 of the Exchange Act). Yes ¨ No ý
Aggregate market value of the voting and non-voting common equity held by non-affiliates of registrant as of June 30, 2016 was approximately $3,250,385,356 based on the closing price as reported on the New York Stock Exchange.
As of February 27, 2017, the registrant had 246,479,483 shares of Class A Common Stock and 28,008,573 shares of Class B Common Stock outstanding.
DOCUMENTS INCORPORATED BY REFERENCE
Portions of the registrant’s definitive proxy statement for the 2017 Annual Meeting of Stockholders, to be filed no later than 120 days after the end of the fiscal year to which this Annual Report on Form 10-K relates, are incorporated by reference into Part III of this Annual Report on Form 10-K.
PARSLEY ENERGY, INC.
FORM 10-K
ANNUAL PERIOD ENDED DECEMBER 31, 2016
TABLE OF CONTENTS
Page | ||||
i
CAUTIONARY NOTE REGARDING FORWARD-LOOKING STATEMENTS
Various statements contained in or incorporated by reference into this Annual Report on Form 10-K (this "Annual Report") that express a belief, expectation, or intention, or that are not statements of historical fact, are "forward-looking statements" within the meaning of Section 27A of the Securities Act of 1933, as amended (the "Securities Act"), and Section 21E of the Securities Exchange Act of 1934, as amended (the "Exchange Act"). These forward-looking statements include statements, projections and estimates concerning the Company's operations, performance, business strategy, oil and natural gas reserves, drilling program, capital expenditures, liquidity and capital resources, the timing and success of specific projects, outcomes and effects of litigation, claims and disputes, derivative activities and potential financing. Forward-looking statements are generally accompanied by words such as "estimate," "project," "predict," "believe," "expect," "anticipate," "potential," "could," "may," "foresee," "plan," "goal" or other words that convey the uncertainty of future events or outcomes. Forward-looking statements are not guarantees of performance. We have based these forward-looking statements on our current expectations and assumptions about future events. These statements are based on certain assumptions and analyses made by us in light of our experience and our perception of historical trends, current conditions and expected future developments as well as other factors we believe are appropriate under the circumstances. Actual results may differ materially from those implied or expressed by the forward-looking statements. These forward-looking statements speak only as of the date of this Annual Report, or if earlier, as of the date they were made. We disclaim any obligation to update or revise these statements unless required by law, and we caution you not to rely on them unduly. While our management considers these expectations and assumptions to be reasonable, they are inherently subject to significant business, economic, competitive, regulatory and other risks, contingencies and uncertainties relating to, among other matters, the risks discussed under "Item 1A. Risk Factors," as well as those factors summarized below.
Forward-looking statements may include statements about our:
• | business strategy; |
• | reserves; |
• | exploration and development drilling prospects, inventories, projects and programs; |
• | ability to replace the reserves we produce through drilling and property acquisitions; |
• | financial strategy, liquidity and capital required for our development program; |
• | realized oil, natural gas and natural gas liquids ("NGLs") prices; |
• | timing and amount of future production of oil, natural gas and NGLs; |
• | hedging strategy and results; |
• | future drilling plans; |
• | competition and government regulations; |
• | ability to obtain permits and governmental approvals; |
• | pending legal or environmental matters; |
• | marketing of oil, natural gas and NGLs; |
• | leasehold or business acquisitions; |
• | costs of developing our properties; |
• | general economic conditions; |
• | credit markets; |
• | uncertainty regarding our future operating results; and |
• | plans, objectives, expectations and intentions contained in this Annual Report that are not historical. |
1
We caution you that these forward-looking statements are subject to all of the risks and uncertainties, most of which are difficult to predict and many of which are beyond our control, incident to the exploration for and development, production, gathering and sale of oil, natural gas and NGLs. These risks include, but are not limited to, commodity price volatility, inflation, lack of availability of drilling and production equipment and services, environmental risks, drilling and other operating risks, regulatory changes, the uncertainty inherent in estimating reserves and in projecting future rates of production, cash flow and access to capital, the timing of development expenditures, and the other risks described under "Item 1A. Risk Factors."
Additionally, we caution you that reserve engineering is a process of estimating underground accumulations of oil, natural gas and NGLs that cannot be measured in an exact way. The accuracy of any reserve estimate depends on the quality of available data, the interpretation of such data and price and cost assumptions made by reserve engineers. In addition, the results of drilling, testing and production activities may justify revisions of estimates that were made previously. If significant, such revisions would change the schedule of any further production and development drilling. Accordingly, reserve estimates may differ significantly from the quantities of oil, natural gas and NGLs that are ultimately recovered.
Should one or more of the risks or uncertainties described in this Annual Report occur, or should underlying assumptions prove incorrect, our actual results and plans could differ materially from those expressed in any forward-looking statements.
All forward-looking statements, expressed or implied, included in this Annual Report are expressly qualified in their entirety by this cautionary note. This cautionary note should also be considered in connection with any subsequent written or oral forward-looking statements that we or persons acting on our behalf may issue.
Except as otherwise required by applicable law, we disclaim any duty to update any forward-looking statements, all of which are expressly qualified by the statements in this cautionary note, to reflect events or circumstances after the date of this Annual Report.
2
GLOSSARY OF CERTAIN TERMS AND CONVENTIONS USED HEREIN
The terms defined in this section are used throughout this Annual Report:
(1 | ) | Bbl. One stock tank barrel, of 42 U.S. gallons liquid volume, used in reference to crude oil, condensate or natural gas liquids. | ||
(2 | ) | Boe. One barrel of oil equivalent, with 6,000 cubic feet of natural gas being equivalent to one barrel of oil. | ||
(3 | ) | Boe/d. One barrel of oil equivalent per day. | ||
(4 | ) | British thermal unit or Btu. The heat required to raise the temperature of a one-pound mass of water from 58.5 to 59.5 degrees Fahrenheit. | ||
(5 | ) | Completion. The process of treating a drilled well followed by the installation of permanent equipment for the production of oil or natural gas, or in the case of a dry hole, the reporting of abandonment to the appropriate agency. | ||
(6 | ) | Condensate. A mixture of hydrocarbons that exists in the gaseous phase at original reservoir temperature and pressure, but that, when produced, is in the liquid phase at surface pressure and temperature. | ||
(7 | ) | Development well. A well drilled within the proved area of an oil or natural gas reservoir to the depth of a stratigraphic horizon known to be productive. | ||
(8 | ) | Dry Hole. A well found to be incapable of producing hydrocarbons in sufficient quantities such that proceeds from the sale of such production exceed production expenses and taxes. | ||
(9 | ) | Economically producible. A resource that generates revenue that exceeds, or is reasonably expected to exceed, the costs of the operation. For a complete definition of economically producible, refer to the SEC’s Regulation S-X, Rule 4-10(a)(10). | ||
(10 | ) | Exploitation. A development or other project which may target proven or unproven reserves (such as probable or possible reserves), but which generally has a lower risk than that associated with exploration projects. | ||
(11 | ) | Exploration costs. Costs incurred in identifying areas that may warrant examination and in examining specific areas that are considered to have prospects of containing oil and natural gas reserves, including costs of drilling exploratory wells and exploratory-type stratigraphic test wells. Exploration costs may be incurred both before and after acquiring the related property. Principal types of exploration costs, which include depreciation and applicable operating costs of support equipment and facilities and other costs of exploration activities, are: | ||
(i) | Costs of topographical, geographical and geophysical studies, rights of access to properties to conduct those studies, and salaries and other expenses of geologists, geophysical crews, and others conducting those studies. Collectively, these are referred to as geological and geophysical costs or G&G costs. | |||
(ii) | Costs of carrying and retaining undeveloped properties, such as delay rentals, ad valorem taxes on properties, legal costs for title defense, and the maintenance of land and lease records. | |||
(iii) | Dry hole contributions and bottom hole contributions. | |||
(iv) | Costs of drilling and equipping exploratory wells. | |||
(v) | Costs of drilling exploratory-type stratigraphic test wells. | |||
(vi) | Idle drilling rig fees which are not chargeable to joint operations. | |||
(12 | ) | Exploratory well. A well drilled to find a new field or to find a new reservoir in a field previously found to be productive of oil or natural gas in another reservoir. | ||
(13 | ) | Field. An area consisting of a single reservoir or multiple reservoirs all grouped on or related to the same individual geological structural feature and/or stratigraphic condition. The field name refers to the surface area, although it may refer to both the surface and the underground productive formations. For a complete definition of field, refer to the SEC’s Regulation S-X, Rule 4-10(a)(15). | ||
(14 | ) | Formation. A layer of rock which has distinct characteristics that differ from nearby rock. | ||
(15 | ) | GAAP. Accounting principles generally accepted in the United States. | ||
(16 | ) | Gross acres or gross wells. The total acres or wells, as the case may be, in which an entity owns a working interest. | ||
(17 | ) | Horizontal drilling. A drilling technique used in certain formations where a well is drilled vertically to a certain depth and then drilled at a right angle within a specified interval. | ||
3
(18 | ) | Identified drilling locations. Potential drilling locations specifically identified by our management based on evaluation of applicable geologic and engineering data accrued over our multi-year historical drilling activities. | ||
(19 | ) | Lease operating expense. All direct and allocated indirect costs of lifting hydrocarbons from a producing formation to the surface constituting part of the current operating expenses of a working interest. Such costs include labor, superintendence, supplies, repairs, maintenance, allocated overhead charges, workover, insurance and other expenses incidental to production, but exclude lease acquisition or drilling or completion expenses. | ||
(20 | ) | LIBOR. London Interbank Offered Rate. | ||
(21 | ) | MBbl. One thousand barrels of crude oil, condensate or NGLs. | ||
(22 | ) | MBoe. One thousand barrels of oil equivalent. | ||
(23 | ) | Mcf. One thousand cubic feet of natural gas. | ||
(24 | ) | MMBtu. One million British thermal units. | ||
(25 | ) | MMcf. One million cubic feet of natural gas. | ||
(26 | ) | Natural gas liquids or NGLs. The combination of ethane, propane, butane, isobutane and natural gasolines that when removed from natural gas become liquid under various levels of higher pressure and lower temperature. | ||
(27 | ) | Net acres or net wells. The percentage of total acres or wells, as the case may be, an owner has out of a particular number of gross acres or wells. For example, an owner who has 50% interest in 100 gross acres owns 50 net acres. | ||
(28 | ) | NYMEX. The New York Mercantile Exchange. | ||
(29 | ) | Operator. The entity responsible for the exploration, development and production of a well or lease. | ||
(30 | ) | PE Units. The single class of units, in which all of the membership interests (including incentive units) in Parsley Energy, LLC were converted to in connection with our initial public offering. | ||
(31 | ) | Proved developed reserves. Proved reserves that can be expected to be recovered: | ||
(i) | Through existing wells with existing equipment and operating methods or in which the cost of the required equipment is relatively minor compared with the cost of a new well; or | |||
(ii) | Through installed extraction equipment and infrastructure operational at the time of the reserves estimate if the extraction is by means not involving a well. | |||
(32 | ) | Proved reserves. Those quantities of oil and natural gas, which, by analysis of geoscience and engineering data, can be estimated with reasonable certainty to be economically producible—from a given date forward, from known reservoirs, and under existing economic conditions, operating methods, and government regulations—prior to the time at which contracts providing the right to operate expire, unless evidence indicates that renewal is reasonably certain, regardless of whether deterministic or probabilistic methods are used for the estimation. The project to extract the hydrocarbons must have commenced, or the operator must be reasonably certain that it will commence, within a reasonable time. For a complete definition of proved oil and natural gas reserves, refer to the SEC’s Regulation S-X, Rule 4-10(a)(22). | ||
(33 | ) | Proved undeveloped reserves or PUDs. Proved reserves that are expected to be recovered from new wells on undrilled acreage, or from existing wells where a relatively major expenditure is required for recompletion. | ||
(i) | Reserves on undrilled acreage shall be limited to those directly offsetting development spacing areas that are reasonably certain of production when drilled, unless evidence using reliable technology exists that establishes reasonable certainty of economic producibility at greater distances; | |||
(ii) | Undrilled locations can be classified as having undeveloped reserves only if a development plan has been adopted indicating that they are scheduled to be drilled within five years, unless the specific circumstances justify a longer time; and | |||
(iii) | Under no circumstances shall estimates for proved undeveloped reserves be attributable to any acreage for which an application of fluid injection or other improved recovery technique is contemplated, unless such techniques have been proved effective by actual projects in the same reservoir or an analogous reservoir, or by other evidence using reliable technology establishing reasonable certainty. | |||
(34 | ) | Reasonable certainty. A high degree of confidence. For a complete definition of reasonable certainty, refer to the SEC’s Regulation S-X, Rule 4-10(a)(24). | ||
(35 | ) | Recompletion. The process of re-entering an existing wellbore that is either producing or not producing and completing new or existing reservoirs in an attempt to establish new production or increase existing production. | ||
4
(36 | ) | Reliable technology. A grouping of one or more technologies (including computational methods) that have been field tested and have been demonstrated to provide reasonably certain results with consistency and repeatability in the formation being evaluated or in an analogous formation. | ||
(37 | ) | Reserves. Estimated remaining quantities of oil and natural gas and related substances anticipated to be economically producible, as of a given date, by application of development prospects to known accumulations. In addition, there must exist, or there must be a reasonable expectation that there will exist, the legal right to produce or a revenue interest in the production, installed means of delivering oil and natural gas or related substances to market and all permits and financing required to implement the project. | ||
(38 | ) | Reservoir. A porous and permeable underground formation containing a natural accumulation of producible hydrocarbons that is confined by impermeable rock or water barriers and is separate from other reservoirs. | ||
(39 | ) | SEC. The United States Securities and Exchange Commission. | ||
(40 | ) | Spacing. The distance between wells producing from the same reservoir. Spacing is often expressed in terms of acres, e.g., 40-acre spacing, and is often established by regulatory agencies. | ||
(41 | ) | Undeveloped acreage. Leased acreage on which wells have not been drilled or completed to a point that would permit the production of economic quantities of oil or natural gas regardless of whether such acreage contains proved reserves. | ||
(42 | ) | Wellbore. The hole drilled by the bit that is equipped for oil or gas production on a completed well. Also called well or borehole. | ||
(43 | ) | Working interest. The right granted to the lessee of a property to explore for and to produce and own oil, natural gas or other minerals. The working interest owners bear the exploration, development and operating costs on either a cash, penalty or carried basis. | ||
(44 | ) | Workover. Operations on a producing well to restore or increase production. | ||
(45 | ) | WTI. West Texas Intermediate crude oil, which is a light, sweet crude oil, characterized by an American Petroleum Institute gravity, or API gravity, between 39 and 41 and a sulfur content of approximately 0.4 weight percent that is used as a benchmark for other crude oils. | ||
5
PART I
ITEM 1. BUSINESS
Overview
Parsley Energy, Inc. (either individually or together with its subsidiaries, as the context requires, the "Company," "we," "us" or "our") is an independent oil and natural gas company focused on the acquisition and development of unconventional oil and natural gas reserves in the Permian Basin. The Permian Basin is located in West Texas and Southeastern New Mexico and is comprised of three primary sub-areas: the Midland Basin, the Central Basin Platform and the Delaware Basin. These areas are characterized by high oil and liquids-rich natural gas content, multiple vertical and horizontal target horizons, extensive production histories, long-lived reserves and historically high drilling success rates. Our properties are primarily located in the Midland and Delaware Basins, where we focus predominantly on horizontal development drilling and expect to target various stacked pay intervals in the Spraberry, Wolfcamp, Upper Pennsylvanian (Cline) and Atoka shales.
We began operations in August 2008 when we acquired operator rights to wells producing from the Spraberry Trend in the Midland Basin from Joe Parsley, a co-founder of Parker and Parsley Petroleum Company. Shortly thereafter, we began a vertical drilling program focused in the Midland Basin. In late 2013, we drilled our first horizontal well and in 2014, we implemented our horizontal drilling program, which we believe provides more attractive returns on a majority of our acreage. Initially, our horizontal drilling program was focused in the Midland Basin. During 2015, we successfully drilled our first horizontal appraisal well in the Delaware Basin. Our future development will be focused predominately on horizontal development drilling in both our Midland Basin and Delaware Basin acreage. During 2016, we acquired certain mineral interests and surface rights in the Delaware Basin, which caused our net revenue interest in certain properties we operate to increase. As of December 31, 2016, we had an average working interest of 87% in 166 gross (146.7 net) horizontal wells, of which 151 gross (132.4 net) are in the Midland Basin. As of December 31, 2016, we operated 96% of the horizontal wells in which we have an interest and had the rights to develop 171,730 gross (138,567 net) acres in the Permian Basin, with approximately 95,072 net acres located in the Midland Basin and 43,495 net acres located in the Delaware Basin. Since we commenced our drilling program in November 2009, we have operated up to 12 rigs simultaneously and averaged six operated rigs for the year ended December 31, 2016. We are currently operating seven horizontal rigs and three vertical drilling rigs. The vertical rigs are used primarily to drill the vertical portion of horizontal wells. Our 2017 capital budget contemplates operating ten to 14 horizontal rigs for the year ended December 31, 2017.
We intend to grow our reserves and production through the drilling, development and exploitation of our multi-year inventory of identified drilling locations. As of December 31, 2016, we have identified 5,155 gross (4,246 net) potential horizontal drilling locations on our existing acreage.
The following table summarizes our technically identified horizontal drilling locations in the Permian Basin as of December 31, 2016:
Area (1) | Net Acreage | Identified Drilling Locations (2) | ||||
Midland Basin (3) | 95,072 | 3,466 | ||||
Delaware Basin (4) | 43,495 | 780 | ||||
Total Permian Basin | 138,567 | 4,246 | ||||
(1) | Please see "Item 2. Properties." | |
(2) | We have estimated our drilling locations based on well spacing assumptions for the areas in which we operate and other criteria. The drilling locations on which we actually drill will depend on the availability of capital, regulatory approvals, commodity prices, costs, actual drilling results and other factors. Any drilling activities we are able to conduct on these identified locations may not be successful and may not result in our adding additional proved reserves to our existing proved reserves. See also ‘‘Item 1A. Risk Factors." | |
(3) | Our horizontal location count in the Midland Basin assumes 660' to 990' between-well spacing, equivalent to five to eight wells per 640-acre section per target interval. The location count associated with the Wolfcamp B formation assumes two target intervals within the broader formation. The ultimate spacing may be less than these amounts, which would result in a higher location count, or greater than these amounts, which would result in a lower location count. | |
(4) | Our target horizontal location count in the Delaware Basin implies 660’ to 1,320’ between well spacing which is equivalent to four to eight wells per 640-acre section per prospective interval. The ultimate spacing may be less than these amounts, which would result in a higher location count, or greater than these amounts, which would result in a lower location count. | |
6
At December 31, 2016, our estimated proved oil and natural gas reserves were 222.3 MMBoe based on an internal reserve report audited by Netherland, Sewell & Associates, Inc. ("NSAI"), our independent reserve engineers. Based on this report, at December 31, 2016, our proved reserves were approximately 58% oil, 19% natural gas, 23% NGLs and 48% proved developed. The calculated percentages include proved developed non-producing reserves.
Our 2017 budget for capital development expenditures is approximately $1,000.0 million to $1,150.0 million, including $840.0 million to $960.0 million for drilling and completions and $160.0 million to $190.0 million for infrastructure and other expenditures. Our capital budget excludes any amounts that may be paid for acquisitions. For the year ended December 31, 2016, our capital expenditures for drilling, completions and infrastructure were $496.0 million, as compared to $400.9 million for the year ended December 31, 2015, excluding, in each period, amounts paid for acquisitions. We expect the working interest in wells we drill during 2017 to be approximately 85%-95%. The amount and timing of these capital expenditures is largely discretionary and within our control. We could choose to defer a portion of these planned capital expenditures depending on a variety of factors, including but not limited to the success of our drilling activities, prevailing and anticipated prices for oil and natural gas, the availability of necessary equipment, infrastructure and capital, the receipt and timing of required regulatory permits and approvals, seasonal conditions, drilling and acquisition costs and the level of participation by other interest owners.
Our Business Strategy
Our business strategy is to increase stockholder value through the following:
• | Grow reserves, production and cash flow by exploiting our liquids rich resource base. We intend to selectively develop our acreage base in an effort to maximize its value and resource potential. We intend to pursue drilling opportunities offering competitive returns that we consider to be low risk based on production history and industry activity in the area and repeatable as a result of well-defined geological properties over a large area. Through the conversion of our resource base to developed reserves, we will seek to increase our reserves, production and cash flow while generating favorable returns on invested capital. |
• | Improve operational and cost efficiency by maintaining control of our production. We currently operate approximately 96% of the wells in which we have an interest and intend to maintain operational control of substantially all of our producing properties. We believe that retaining control of our production will enable us to increase recovery rates, lower well costs, improve drilling performance and increase ultimate hydrocarbon recovery through optimization of our drilling and completion techniques. Our management team regularly evaluates our operating results against those of other operators in the area in an effort to improve our performance and implement best practices. The average time from spud to rig release for our horizontal Spraberry and Wolfberry wells has remained consistent (approximately 22 days during the fourth quarter of 2015 and approximately 23 days in the fourth quarter of 2016) despite an increase in average total measured depth of horizontal wells. Our average total measured depth of horizontal wells drilled in 2016 was 16,879 feet as compared to an average total measured depth of 16,440 feet during 2015. We have also reduced our total horizontal drilling, completion and facilities costs from an average of $6.7 million per well in the fourth quarter of 2015 to an average of $5.8 million per well in the fourth quarter of 2016. This decrease was driven primarily by a reduction in hydraulic fracturing costs and efficiencies gained through economies of scale over this time period. |
• | Pursue additional leasing and strategic acquisitions. We regularly evaluate and complete acquisitions of undeveloped leasehold and producing properties that meet our strategic and financial objectives in the ordinary course of our business, while selectively pursuing other acquisition opportunities that meet our strategic and financial objectives. Our acreage position extends through what we believe are multiple oil and natural gas producing stratigraphic horizons in the Midland Basin and Delaware Basin and we believe we can economically and efficiently add and integrate additional acreage into our current operations. We have a proven history of acquiring leasehold positions in the Permian Basin that have substantial oil-weighted resource potential and believe our management team’s extensive experience operating in the Midland Basin and Delaware Basin provides us with a competitive advantage in identifying leasing opportunities and acquisition targets and evaluating resource potential for the year ended December 31, 2018. |
• | Maintain financial flexibility. We intend to maintain a conservative financial position to allow us to develop our drilling, exploitation and exploration activities and maximize the present value of our oil-weighted resource potential. We intend to fund our growth with cash flow from operations, liquidity under our Revolving Credit Agreement (defined herein) and access to capital markets over time. As of December 31, 2016, we had approximately $733.1 million of liquidity, with $133.4 million of cash and cash equivalents and $599.8 million of available borrowing capacity under our Revolving Credit Agreement. Our borrowing base under the Revolving Credit Agreement currently |
7
stands at $875.0 million, with a commitment level of $600.0 million. Consistent with our disciplined approach to financial management, we have an active commodity hedging program that seeks to hedge a meaningful portion of our expected oil production, reducing our exposure to downside commodity price fluctuations and enabling us to protect cash flows and maintain liquidity to fund our capital program and investment opportunities. Due to our expectations of near-term commodity prices, we have elected to hedge a larger percentage of our anticipated oil volumes in the second half of 2017 than in the first half of 2017. We have also established a meaningful hedge position for 2018.
Our Strengths
We believe that the following strengths will help us achieve our business goals:
• | Extensive horizontal development potential. We believe that the majority of our acreage offers stacked pay potential to develop oil and natural gas from several prospective formations, including the Spraberry, Wolfcamp and Bone Springs, and further, that some of these formations may be characterized by sufficient thickness and resource potential to accommodate more than one target zone per formation. Through December 31, 2016, we had drilled and completed 136 gross (127.1 net) horizontal wells in the Midland Basin and six gross (5.8 net) horizontal wells in the Delaware Basin. Our portfolio of horizontal wells includes wells completed in seven distinct target zones. As of December 31, 2016, we had an inventory of 5,155 gross (4,246 net) identified horizontal drilling locations. |
• | Incentivized management team with substantial technical and operational expertise. Our management team has a proven track record of executing on multi-rig development drilling programs and has extensive experience in the Spraberry, Wolfberry and Wolftoka Trends of the Permian Basin. Our chief executive officer, Bryan Sheffield, is a third generation oil and natural gas executive and our management team has an average of 20 years of experience. We have also assembled a technical team that includes 30 petroleum engineers and 11 geologists with an average of 14 years of experience, which we believe will be of strategic importance as we continue to expand our future exploration and development plans. As of December 31, 2016, our executive officers hold approximately 20.9% of our outstanding equity interests. We believe our executive officers’ significant ownership interest provides meaningful incentive to increase the value of our business for the benefit of all stockholders. |
• | Operating control over substantially all our production. As of December 31, 2016, we operated approximately 96% of the wells in which we have an interest, which translates to a vast majority of our 2016 production. We believe that maintaining control of our production enables us to dictate the pace of development and better manage the cost, type and timing of exploration, exploitation and development activities. Our leasehold position is comprised primarily of properties that we operate and includes an estimated 5,155 gross (4,246 net) potential horizontal drilling locations. |
• | Conservative balance sheet. We expect to maintain financial flexibility that will allow us to develop our drilling activities and selectively pursue acquisitions. As of December 31, 2016, we did not have any debt outstanding under our Revolving Credit Agreement and had $599.8 million of available borrowing capacity. We believe this borrowing capacity, along with our existing cash flow from operations, will provide us with sufficient liquidity to execute our current capital program. |
Recent Events
Glasscock County Acquisition
On October 4, 2016, we acquired, from unaffiliated third-party sellers, undeveloped acreage and producing oil and natural gas properties in Glasscock County, Texas, as well as associated mineral and overriding royalty interests, for an aggregate purchase price of $390.9 million in cash, inclusive of a $20.0 million deposit paid to an escrow account upon signing the purchase and sale agreement in the third quarter of 2016 (the "Glasscock County Acquisition"). The Glasscock County Acquisition included 11,672 gross (9,140 net) acres and 67 gross (60 net) vertical wells.
8
New Revolving Credit Facility
On October 28, 2016, we and our subsidiary Parsley Energy, LLC ("Parsley LLC") entered into a new revolving credit agreement with, among others, Wells Fargo Bank, National Association, as administrative agent (the "New Revolving Credit Agreement"), providing for an initial borrowing base of $900.0 million and an initial commitment level of $600.0 million. The Revolving Credit Agreement replaced our previously existing amended and restated revolving credit agreement with, among others, Wells Fargo Bank, National Association, as administrative agent, which was terminated concurrently with entry into the New Revolving Credit Agreement. As used in this Annual Report, the term "Revolving Credit Agreement" refers, prior to October 28, 2016, to the previously existing amended and restated credit agreement and, subsequent to October 28, 2016, to the New Revolving Credit Agreement.
The Revolving Credit Agreement provides for a five-year senior secured revolving credit facility, maturing on October 28, 2021, with a borrowing capacity of the lowest of (i) the borrowing base, (ii) the aggregate elected borrowing base commitments and (iii) $2.5 billion. The revolving credit facility is secured by substantially all of the assets of Parsley LLC and its restricted subsidiaries.
December 2016 Refinancing
On December 13, 2016, Parsley LLC and Parsley Finance Corp. ("Finance Corp") issued $650.0 million aggregate principal amount of 5.375% senior unsecured notes due 2025 (the "2025 Notes") in an offering that was exempt from registration under the Securities Act (the "2025 Notes Offering"). The 2025 Notes Offering resulted in gross proceeds to us of $650.0 million and net proceeds to us, after deducting initial purchaser discounts and commissions and offering expenses, of approximately $644.1 million.
Concurrently with the 2025 Notes Offering, Parsley LLC used a portion of the net proceeds therefrom to fund a tender offer (the "Tender Offer") to purchase for cash any and all of its $550.0 million aggregate principal amount of 7.500% senior unsecured notes due 2022 (the "2022 Notes"). On December 13, 2016, the Tender Offer expired and, at such time, $487.7 million aggregate principal amount of the 2022 Notes was validly tendered (which did not include $1.2 million aggregate principal amount of the 2022 Notes that remained subject to guaranteed delivery procedures). Parsley LLC accepted all of the 2022 Notes validly tendered and not validly withdrawn in the Tender Offer and, on December 13, 2016, made a cash payment of $537.1 million, which included principal of $487.7 million, a prepayment premium on the extinguishment of debt of $32.5 million, accrued interest of $12.0 million and other debt issuance costs of $4.9 million. On December 15, 2016, Parsley LLC made an additional cash payment of $0.5 million for the tender of an additional $0.4 million aggregate principal amount of the 2022 Notes and $0.1 million of prepayment premium on the extinguishment of debt and accrued interest.
On January 5, 2017, Parsley LLC and Finance Corp. redeemed the $61.8 million aggregate principal amount of the 2022 Notes that remained outstanding and made a cash payment of $67.5 million to the remaining holders of the 2022 Notes, which included principal of $61.8 million, prepayment premium on the extinguishment of debt of $3.9 million and accrued interest of $1.8 million. As of December 31, 2016, we had committed to repayment of the remaining $61.8 million aggregate principal amount of the 2022 Notes, which are included in Current portion of long-term debt on our consolidated balance sheets, included in this Annual Report.
Recent Acquisitions
During the fourth quarter of 2016, we entered into purchase agreements to acquire, in unrelated transactions, certain undeveloped acreage and producing oil and natural gas properties located adjacent to our existing operating areas in the Midland and Southern Delaware Basins for an aggregate purchase price of approximately $606.6 million in cash. We also acquired certain mineral interests in the Southern Delaware Basin for an aggregate purchase price of $42.8 million. The purchase prices of these transactions are inclusive of deposits of $48.2 million paid to escrow accounts upon signing of certain of the purchase and sale agreements. The deposits are included in Other current assets on the consolidated balance sheets and as an operating activity on the consolidated statements of cash flows, included in this Annual Report.
9
January Equity Offering
On January 10, 2017, we entered into an underwriting agreement to sell 25,300,000 shares (including 3,300,000 shares issued pursuant to the underwriters’ option to purchase additional shares) of our Class A Common Stock, par value $0.01 per share ("Class A Common Stock"), at a price of $35.00 per share in an underwritten public offering (the "January Offering"). The January Offering closed on January 17, 2017 and resulted in gross proceeds to us of approximately $885.5 million and net proceeds to us, after deducting underwriting discounts and commissions and offering expenses, of approximately $863.0 million. A portion of the net proceeds from the January Offering is being used to fund the aggregate purchase price for certain acquisitions of oil and natural gas interests in the Midland and Southern Delaware Basins, and the remaining net proceeds will be used to fund a portion of our capital program and for general corporate purposes, including potential future acquisitions.
Upon completion of the January Offering, we contributed all of the net proceeds to Parsley LLC in exchange for an aggregate of 25,300,000 PE Units. As a result, our ownership of Parsley LLC increased to 88.0% and the PE Unit holders’ (each a "PE Unit Holder") ownership of Parsley LLC decreased to 12.0%.
February Equity Offering
On February 7, 2017, we entered into an underwriting agreement to sell 41,400,000 shares of Class A Common Stock (including 5,400,000 shares issued pursuant to the underwriters' option to purchase additional shares) at a price of $31.00 per share in an underwritten public offering (the "February Offering"). The February Offering closed on February 13, 2017 and resulted in gross proceeds to us of approximately $1,283.4 million and net proceeds to us, after deducting underwriting discounts and commissions and offering expenses of approximately $1,260.6 million. We will use a portion of the net proceeds from the February Offering to fund the cash portion of the purchase price for the Double Eagle Acquisition (defined herein) and the remaining net proceeds will be used to fund a portion of our capital program and for general corporate purposes, including potential future acquisitions.
Upon completion of the February Offering, we contributed all of the net proceeds to Parsley LLC in exchange for an aggregate of 41,400,000 PE Units. As a result, our ownership of Parsley LLC increased to 89.8% and the PE Unit Holders’ ownership of Parsley LLC decreased to 10.2%.
New 2025 Notes Offering
Concurrently with the closing of the February Offering, on February 13, 2017, Parsley LLC and Parsley Finance Corp. ("Finance Corp.") issued $450.0 million aggregate principal amount of 5.250% senior unsecured notes due 2025 (the "New 2025 Notes") in an offering that was exempt from registration under the Securities Act (the "New 2025 Notes Offering"). The New 2025 Notes Offering resulted in gross proceeds to us of $450.0 million and net proceeds to us, after deducting initial purchaser discounts and commissions and offering expenses, of approximately $444.2 million, which we intend to use to partially fund the cash portion of the Double Eagle Acquisition as discussed below.
Double Eagle Acquisition
On February 7, 2017, we entered into a contribution agreement (the "Double Eagle Contribution Agreement") with Double Eagle Energy Permian Operating LLC, Double Eagle Energy Permian LLC and Double Eagle Energy Permian Member LLC (collectively, "Double Eagle"), which provides for the contribution by Double Eagle of all of its interests in Double Eagle Lone Star LLC, DE Operating LLC, and Veritas Energy Partners, LLC, as well as certain related transactions with an affiliate of Double Eagle. As a result, we expect to acquire (the "Double Eagle Acquisition") approximately 167,000 gross (71,000 net) acres located in the Midland Basin and approximately 7,300 gross (3,300 net) associated horizontal drilling locations for an aggregate purchase price of approximately $2.8 billion, subject to certain purchase price adjustments set forth in the Double Eagle Contribution Agreement.
The aggregate purchase price for the Double Eagle Acquisition consists of (i) approximately $1.4 billion in cash (which we intend to fund from the net proceeds of the February Offering and the New 2025 Notes Offering) and (ii) approximately 39.4 million PE Units together with a corresponding approximately 39.4 million shares of our Class B Common Stock, par value $0.01 per share ("Class B Common Stock"). Upon the expiration of a 90-day lock-up period following the consummation of the Double Eagle Acquisition, each PE Unit, together with a corresponding share of our Class B Common Stock, will be exchangeable, at the option of the holder, for one share of our Class A Common Stock, or, if we or Parsley LLC so elects, cash. In connection with the closing of the Double Eagle Acquisition, we intend to enter into a registration rights agreement with Double Eagle containing provisions by which we will agree to, among other things and subject to certain restrictions, file an automatically effective registration statement with the SEC on Form S-3 providing for the registration of the shares of our Class
10
A Common Stock issuable upon exchange of the PE Units (and corresponding shares of our Class B Common Stock) to be issued as consideration to Double Eagle and to conduct certain underwritten offerings thereof.
The Double Eagle Contribution Agreement contains customary representations and warranties, covenants and indemnification provisions and has an effective date of January 1, 2017. We expect to close the Double Eagle Acquisition on or before April 20, 2017, subject to the satisfaction of customary closing conditions.
Upon completion of the issuances of Class B Common Stock and associated PE Units contemplated by the Double Eagle Acquisition, our ownership of Parsley LLC will decrease to 78.5% and the PE Unit Holders’ ownership of Parsley LLC will increase to 21.5%.
Organizational Structure
We are a holding company that was incorporated as a Delaware corporation on December 11, 2013 for the purpose of facilitating our initial public offering (the "IPO") and to become the sole managing member of Parsley LLC. Our principal asset is a controlling equity interest in Parsley LLC. On May 22, 2014, a registration statement filed on Form S-1 with the SEC related to shares of Class A Common Stock was declared effective. The IPO closed on May 29, 2014.
After the effective date of the registration statement but prior to the completion of the IPO, the limited liability company agreement of Parsley LLC was amended and restated to modify its capital structure by replacing the different classes of interests previously held by Parsley LLC owners with a single new class of units called "PE Units." In addition, each PE Unit Holder received one share of our Class B Common Stock. Pursuant to such amended and restated limited liability company agreement (the "Parsley LLC Agreement"), the PE Unit Holders generally have the right to exchange (the "Exchange Right") their PE Units (and a corresponding number of shares of Class B Common Stock), for shares of our Class A Common Stock at an exchange ratio of one share of Class A Common Stock for each PE Unit (and a corresponding number of shares of Class B Common Stock) exchanged (subject to conversion rate adjustments for stock splits, stock dividends and reclassifications), or, if either we or Parsley LLC so elects, cash (the "Cash Option"). In addition, in connection with the IPO, on May 29, 2014, we entered into a Tax Receivable Agreement (the "TRA") with Parsley LLC and the initial PE Unit Holders and certain other holders of equity in us (each such person, a "TRA Holder"). This agreement generally provides for the payment by us to a TRA Holder of 85% of the net cash savings, if any, in U.S. federal, state or local income tax that we actually realize (or are deemed to realize in certain circumstances) in periods after our IPO as a result of (i) any tax basis increases resulting from the contribution in connection with our IPO by such TRA Holder of all or a portion of its PE Units to us in exchange for shares of Class A Common Stock, (ii) the tax basis increases resulting from the exchange by such TRA Holder of PE Units for shares of Class A Common Stock pursuant to the Exchange Right (or resulting from an exchange of PE Units for cash pursuant to the Cash Option) and (iii) imputed interest deemed to be paid by us as a result of, and additional tax basis arising from, any payments we make under the TRA. We will retain the benefit of the remaining 15% of these cash savings. See "Certain Relationships and Related Transactions, and Director Independence" and "Management’s Discussion and Analysis of Financial Conditions and Results of Operations-Factors Affecting the Comparability of Our Financial Condition and Results of Operations-Corporate Reorganization." These transactions are collectively referred to as the "Reorganization Transactions."
As a result of the IPO and the related Reorganization Transactions, we became the sole managing member of and have a controlling equity interest in Parsley LLC. As the sole managing member of Parsley LLC, we operate and control all of the business and affairs of Parsley LLC and, through Parsley LLC and its subsidiaries, conduct our business. We consolidate the financial results of Parsley LLC and its subsidiaries and record noncontrolling interests for the economic interest in Parsley LLC held by the PE Unit Holders.
11
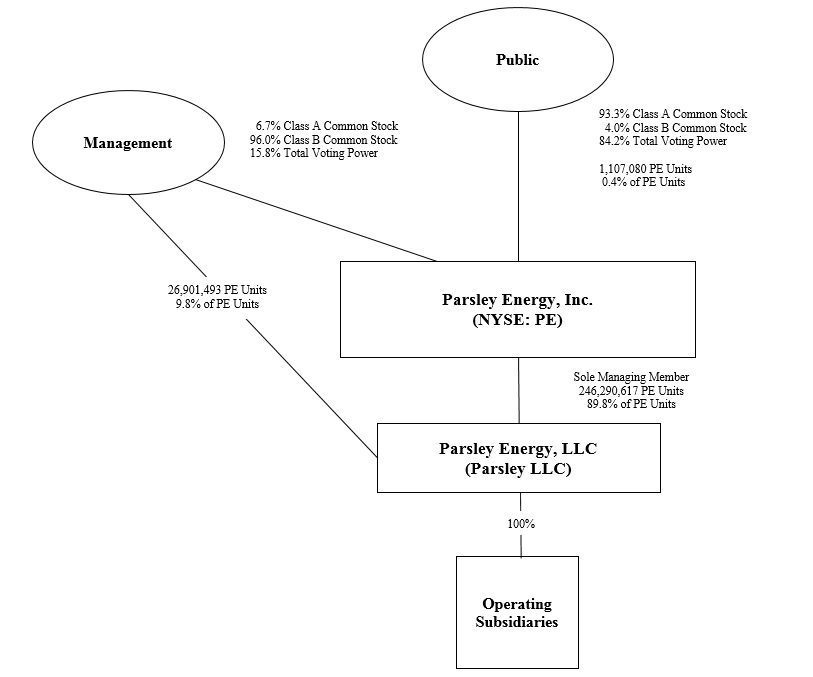
The following diagram indicates our organizational structure as of February 27, 2017. This chart is provided for illustrative purposes only and does not represent all legal entities affiliated with us.
12
Oil and Natural Gas Production Prices and Production Costs
Production and Price History
The following table sets forth information regarding net production of oil, natural gas and NGLs and certain price and cost information for the periods indicated:
Year Ended December 31, | ||||||||||||
2016 | 2015 | 2014 | ||||||||||
Revenues (in thousands, except percentages): | ||||||||||||
Oil sales | $ | 387,303 | $ | 215,795 | $ | 232,554 | ||||||
Natural gas sales | 30,928 | 26,582 | 30,642 | |||||||||
Natural gas liquids sales | 38,273 | 23,680 | 38,561 | |||||||||
Total revenues | $ | 456,504 | $ | 266,057 | $ | 301,757 | ||||||
Average realized prices (1): | ||||||||||||
Oil, without realized derivatives (per Bbls) | $ | 41.34 | $ | 44.89 | $ | 81.91 | ||||||
Oil, with realized derivatives (per Bbls) | 47.56 | 56.60 | 81.33 | |||||||||
Natural gas, without realized derivatives (per Mcf) | 2.30 | 2.57 | 4.23 | |||||||||
Natural gas, with realized derivatives (per Mcf) | 2.30 | 2.72 | 4.32 | |||||||||
Natural gas liquids (per Bbls) | 16.01 | 15.79 | 33.83 | |||||||||
Average price per Boe, without realized derivatives | 32.60 | 33.13 | 58.19 | |||||||||
Average price per Boe, with realized derivatives | 36.76 | 40.33 | 58.00 | |||||||||
Production: | ||||||||||||
Oil (MBbls) | 9,368 | 4,807 | 2,839 | |||||||||
Natural gas (MMcf) | 13,463 | 10,339 | 7,245 | |||||||||
Natural gas liquids (MBbls) | 2,390 | 1,500 | 1,140 | |||||||||
Total (MBoe) | 14,002 | 8,031 | 5,186 | |||||||||
Average daily production volume: | ||||||||||||
Oil (Bbls/d) | 25,596 | 13,170 | 7,778 | |||||||||
Natural gas (Mcf/d) | 36,784 | 28,326 | 19,849 | |||||||||
Natural gas liquids (Bbls/d) | 6,530 | 4,110 | 3,123 | |||||||||
Total (Boe/d) | 38,257 | 22,003 | 14,207 | |||||||||
(1) | Average prices shown in the table reflect prices both before and after the effects of our realized commodity hedging transactions. Our calculation of such effects includes both realized gains and losses on cash settlements for commodity derivative transactions and premiums paid or received on options that settled during the period. | |
Productive Wells
As of December 31, 2016, we owned an average 87% working interest in 166 gross (146.7 net) productive horizontal wells. As of December 31, 2016, we owned an average 62% working interest in 704 gross (481.5 net) productive vertical wells. Productive wells consist of producing wells and wells capable of production, including oil wells awaiting connection to production facilities. Gross wells are the total number of producing wells in which we have an interest and net wells are the sum of our fractional working interests owned in gross wells.
General
As of December 31, 2016, we operated approximately 96% of the wells in which we have an interest. As operator, we design and manage the development of a well and supervise operation and maintenance activities on a day-to-day basis. Independent contractors engaged by us provide all the equipment and personnel associated with these activities. We employ
13
petroleum engineers, geologists and land professionals who work to improve production rates, increase reserves and lower the cost of operating our oil and natural gas properties.
Marketing and Customers
We market the majority of the production from properties we operate for both our account and the account of the other working interest owners in these properties. We sell our production to purchasers at market prices.
We normally sell production to a relatively small number of customers, as is customary in the exploration, development and production business. For the year ended December 31, 2016, three purchasers each accounted for more than 10% of our revenue during the period: Shell Trading (US) Company ("Shell"), BML, Inc. ("BML") and Targa Pipeline Mid-Continent, LLC ("Targa"). For the year ended December 31, 2015, four purchasers each accounted for more than 10% of our revenue during the period: Shell, BML, Targa and Transoil Marketing, LLC. For the year ended December 31, 2014, five purchasers each accounted for more than 10% of our revenue during the period: Targa, Plains Marketing, LP, BML, Permian Transport & Trading and Enterprise Crude Oil, LLC. No other customer accounted for more than 10% of our revenue during these periods. If a major customer decided to stop purchasing oil and natural gas from us, revenue could decline and our operating results and financial condition could be harmed. However, we believe that the loss of any one or all of our major purchasers would not have a materially adverse effect on our financial condition or results of operations, as crude oil and natural gas are fungible products with well-established markets and numerous purchasers.
Transportation
During the initial development of our fields, we consider all gathering and delivery infrastructure in the areas of our production. Our oil is transported from the wellhead to our tank batteries by our gathering systems. The purchaser then transports the oil by truck or pipeline to a tank farm, another pipeline or a refinery. Our natural gas is transported from the wellhead to the purchaser’s meter and pipeline interconnection point through our gathering systems.
In addition, we move the majority of our produced water by pipeline connected to our operated salt water disposal wells rather than by truck. However, due to the inaccessibility of certain of our wells, some produced water will likely always be required to be taken away by truck. We have seen a reduction in lease operating expenses associated with produced water disposal and plan to continue to expand the gathering systems in the Midland and Delaware Basins.
In the second quarter of 2016, we entered into an agreement with a private midstream services company for firm pipeline transportation from our Reagan and Upton County, Texas acreage to Crane, Colorado City and Midland, Texas, which enables us to choose from multiple destinations for a substantial portion of our crude oil production. As of December 31, 2016, approximately 73% of our gross oil production was being transported by this pipeline. The Company does not believe that the termination of this agreement would materially impact its operating results, as crude oil and natural gas are fungible products with well-established markets and numerous purchasers.
Competition
The oil and natural gas industry is intensely competitive, and we compete with other companies that have greater resources. Many of these companies not only explore for and produce oil and natural gas, but also carry on midstream and refining operations and market petroleum and other products on a regional, national or worldwide basis. These companies may be able to pay more for productive oil and natural gas properties and exploratory prospects or to define, evaluate, bid for and purchase a greater number of properties and prospects than our financial or human resources permit. In addition, these companies may have a greater ability to continue exploration activities during periods of low oil and natural gas market prices. Our larger or more integrated competitors may be able to absorb the burden of existing, and any changes to, federal, state and local laws and regulations more easily than we can, which would adversely affect our competitive position. Our ability to acquire additional properties and to discover reserves in the future will be dependent upon our ability to evaluate and select suitable properties and to consummate transactions in a highly competitive environment. In addition, because we have fewer financial and human resources than many companies in our industry, we may be at a disadvantage in bidding for exploratory prospects and producing oil and natural gas properties.
There is also competition between oil and natural gas producers and other industries producing energy and fuel. Furthermore, competitive conditions may be substantially affected by various forms of energy legislation and/or regulation considered from time to time by the governments of the United States and the jurisdictions in which we operate. It is not possible to predict the nature of any such legislation or regulation which may ultimately be adopted or its effects upon our future operations. Such laws and regulations may substantially increase the costs of exploring for, developing or producing oil
14
and natural gas and may prevent or delay the commencement or continuation of a given operation. Our larger competitors may be able to absorb the burden of existing and any changes to, federal, state and local laws and regulations more easily than we can, which would adversely affect our competitive position.
Segment Information and Geographic Area
Operating segments are defined under GAAP as components of an enterprise that (i) engage in activities from which it may earn revenues and incur expenses (ii) for which separate operational financial information is available and is regularly evaluated by the chief operating decision maker for the purpose of allocating resources and assessing performance.
Based on our organization and management, we have only one reportable operating segment, which is oil and natural gas exploration and production. We consider drilling rig services ancillary to our oil and natural gas exploration and producing activities and manage these services to support such activities. All of our operations are conducted in one geographic area of the United States. For additional information, see our consolidated financial statements in this Annual Report beginning on page F-1.
Seasonality of Business
Weather conditions affect the demand for and prices of, oil and natural gas. Demand for oil and natural gas is typically higher in the first and fourth quarters resulting in higher prices. Due to these seasonal fluctuations, results of operations for individual quarterly periods may not be indicative of the results that may be realized on an annual basis.
Oil and Natural Gas Leases
The typical oil and natural gas lease agreement covering our properties provides for the payment of royalties to the mineral owner for all oil and natural gas produced from any wells drilled on the leased premises. The lessor royalties and other leasehold burdens on our properties generally range from 20% to 25%, resulting in a net revenue interest to us generally ranging from 75% to 80%. In cases where we own the minerals underlying properties that we operate, our net revenue interest will be higher.
Markets for Sale of Production
Our ability to market oil and natural gas found and produced, if any, will depend on numerous factors beyond our control, the effect of which cannot be accurately predicted or anticipated. Some of these factors include, without limitation, the availability of other domestic and foreign production, the marketing of competitive fuels, the proximity and capacity of pipelines, fluctuations in supply and demand, the availability of a ready market, the effect of United States federal and state regulation of production, refining, transportation and sales and general national and worldwide economic conditions. Additionally, we may experience delays in marketing natural gas production and fluctuations in natural gas prices and our marketing professionals may experience short-term delays in marketing oil due to trucking and refining constraints. There is no assurance that we will be able to market any oil or natural gas produced, or, if such oil or natural gas is marketed, that favorable prices can be obtained.
The United States natural gas market has undergone several significant changes over the past few decades. The majority of federal price ceilings were removed in 1985 and the remainder were lifted by the Natural Gas Wellhead Decontrol Act of 1989. Thus, currently, the United States natural gas market is operating in a free market environment in which the price of gas is determined by market forces rather than by regulations. At the same time, the domestic natural gas industry has also seen a dramatic change in the manner in which gas is bought, sold and transported. In most cases, natural gas is no longer sold to a pipeline company. Instead, the pipeline company now primarily serves the role of transporter and gas producers are free to sell their product to marketers, local distribution companies, end users or a combination thereof.
In recent years, oil, natural gas and NGLs prices have been under considerable pressure due to oversupply and other market conditions. Specifically, increased foreign production and increased efficiencies in horizontal drilling, combined with exploration of newly developed shale fields in North America, have dramatically increased global oil and natural gas production, which has led to significantly lower market prices for these commodities. In view of the many uncertainties affecting the supply and demand for oil, natural gas and NGLs, we are unable to accurately predict future oil, natural gas and NGLs prices or the overall effect, if any, that the decline in demand for and the oversupply of such products will have on our financial condition or results of operations.
15
Regulation of the Oil and Natural Gas Industry
Our operations are substantially affected by federal, state and local laws and regulations. Failure to comply with applicable laws and regulations can result in substantial penalties. The regulatory burden on the industry increases the cost of doing business and affects profitability. Although we believe we are in substantial compliance with all applicable laws and regulations, such laws and regulations are frequently amended or reinterpreted. Therefore, we are unable to predict the future costs or impact of compliance. Additional proposals and proceedings that affect the oil and natural gas industry are regularly considered by the United States Congress ("Congress"), the states, the Federal Energy Regulatory Commission (the "FERC") and the courts. We cannot predict when or whether any such proposals may become effective. We do not believe that we would be affected by any such action materially differently than similarly situated competitors.
Regulation Affecting Production
Natural gas production and related operations are, or have been, subject to price controls, taxes and numerous other laws and regulations. All of the jurisdictions in which we own or operate producing oil and natural gas properties have statutory provisions regulating the exploration for and production of oil and natural gas, including provisions related to permits for the drilling of wells, bonding requirements to drill or operate wells, the location of wells, the method of drilling and casing wells, the surface use and restoration of properties upon which wells are drilled, sourcing and disposal of water used in the drilling and completion process and the abandonment of wells. Our operations are also subject to various conservation laws and regulations. These include the regulation of the size of drilling and spacing units or proration units, the number of wells which may be drilled in an area and the unitization or pooling of crude oil or natural gas wells, as well as regulations that generally prohibit the venting or flaring of natural gas and impose certain requirements regarding the ratability or fair apportionment of production from fields and individual wells. These laws and regulations may limit the amount of oil and natural gas wells we can drill. Moreover, each state generally imposes a production or severance tax with respect to the production and sale of oil, natural gas and NGLs within its jurisdiction. States do not regulate wellhead prices or engage in other similar direct regulation, but there can be no assurance that they will not do so in the future. The effect of such future regulations may be to limit the amounts of oil and natural gas that may be produced from our wells, negatively affect the economics of production from these wells or limit the number of locations we can drill.
The failure to comply with the rules and regulations of natural gas production and related operations can result in substantial penalties. Our competitors in the oil and natural gas industry are subject to the same regulatory requirements and restrictions that affect our operations.
Regulation Affecting Sales and Transportation of Commodities
Sales prices of oil, natural gas and NGLs are not currently regulated and are made at market prices. Although prices of these energy commodities are currently unregulated, Congress historically has been active in their regulation. We cannot predict whether new legislation to regulate oil and natural gas, or the prices charged for these commodities might be proposed, what proposals, if any, might actually be enacted by Congress or the various state legislatures and what effect, if any, the proposals might have on our operations. Sales of oil and natural gas may be subject to certain state and potentially federal reporting requirements.
The price and terms of service of transportation of the commodities, including access to pipeline transportation capacity, are subject to extensive federal and state regulation. Such regulation may affect the marketing of oil and natural gas produced, as well as the revenues received for sales of such production. Gathering systems may be subject to state ratable take and common purchaser statutes. Ratable take statutes generally require gatherers to take, without undue discrimination, oil and natural gas production that may be tendered to the gatherer for handling. Similarly, common purchaser statutes generally require gatherers to purchase, or accept for gathering, without undue discrimination as to source of supply or producer. These statutes are designed to prohibit discrimination in favor of one producer over another producer or one source of supply over another source of supply. These statutes may affect whether and to what extent gathering capacity is available for oil and natural gas production, if any, of the drilling program and the cost of such capacity. Further state laws and regulations govern rates and terms of access to intrastate pipeline systems, which may similarly affect market access and cost.
The FERC regulates interstate natural gas pipeline transportation rates and service conditions. The FERC is continually proposing and implementing new rules and regulations affecting interstate transportation. The stated purpose of many of these regulatory changes is to promote competition among the various sectors of the natural gas industry and to promote market transparency. We do not believe that our drilling program will be affected by any such FERC action in a manner materially differently than other similarly situated natural gas producers.
16
In addition to the regulation of natural gas pipeline transportation, FERC has jurisdiction over the purchase or sale of gas or the purchase or sale of transportation services subject to FERC’s jurisdiction pursuant to the Energy Policy Act of 2005 ("EPAct 2005"). Under the EPAct 2005, it is unlawful for "any entity," including producers such as us, that are otherwise not subject to FERC’s jurisdiction under the Natural Gas Act of 1938 ("NGA") to use any deceptive or manipulative device or contrivance in connection with the purchase or sale of gas or the purchase or sale of transportation services subject to regulation by FERC, in contravention of rules prescribed by FERC. FERC’s rules implementing this provision make it unlawful, in connection with the purchase or sale of gas subject to the jurisdiction of FERC, or the purchase or sale of transportation services subject to the jurisdiction of FERC, for any entity, directly or indirectly, to use or employ any device, scheme or artifice to defraud; to make any untrue statement of material fact or omit to make any such statement necessary to make the statements made not misleading; or to engage in any act or practice that operates as a fraud or deceit upon any person. EPAct 2005 also gives FERC authority to impose civil penalties for violations of the NGA and the Natural Gas Policy Act of 1978 up to $1.0 million per day per violation. The anti-manipulation rule applies to activities of otherwise non-jurisdictional entities to the extent the activities are conducted "in connection with" gas sales, purchases or transportation subject to FERC jurisdiction, which includes the annual reporting requirements under Order 704 (defined below).
In December 2007, FERC issued a final rule on the annual natural gas transaction reporting requirements, as amended by subsequent orders on rehearing ("Order 704"). Under Order 704, any market participant, including a producer such as us that engages in wholesale sales or purchases of gas that equal or exceed 2.2 million MMBtus of physical natural gas in the previous calendar year, must annually report such sales and purchases to FERC on Form No. 552 on May 1 of each year. Form No. 552 contains aggregate volumes of natural gas purchased or sold at wholesale in the prior calendar year to the extent such transactions utilize or contribute to the formation of price indices. It is the responsibility of the reporting entity to determine which individual transactions should be reported based on the guidance of Order 704. Order 704 is intended to increase the transparency of the wholesale gas markets and to assist FERC in monitoring those markets and in detecting market manipulation.
The FERC also regulates rates and service conditions for interstate transportation of oil, including NGLs, under the Interstate Commerce Act (the "ICA"). Prices received from the sale of liquids may be affected by the cost of transporting those products to market. The ICA requires that pipelines maintain a tariff on file with FERC. The tariff sets forth the established rates as well as the rules and regulations governing the service. The ICA requires, among other things, that rates and terms and conditions of service on interstate common carrier pipelines be "just and reasonable." Such pipelines must also provide jurisdictional service in a manner that is not unduly discriminatory or unduly preferential. Shippers have the power to challenge new and existing rates and terms and conditions of service before FERC.
Rates of interstate liquids pipelines are currently regulated by FERC primarily through an annual indexing methodology, under which pipelines increase or decrease their rates in accordance with an index adjustment specified by FERC. For the five-year period beginning in 2010, FERC established an annual index adjustment equal to the change in the producer price index for finished goods plus 2.65%. For the five-year period beginning on July 1, 2016, FERC established an annual index adjustment equal to the change in the producer price index for finished goods plus 1.23%. This adjustment is subject to review every five years. Under FERC’s regulations, a liquids pipeline can request a rate increase that exceeds the rate obtained through application of the indexing methodology by using a cost-of-service approach, but only after the pipeline establishes that a substantial divergence exists between the actual costs experienced by the pipeline and the rates resulting from application of the indexing methodology. Increases in liquids transportation rates may result in lower revenue and cash flows.
In addition, due to common carrier regulatory obligations of liquids pipelines, capacity must be prorated among shippers in an equitable manner in the event there are nominations in excess of capacity or for new shippers. Therefore, new shippers or increased volume by existing shippers may reduce the capacity available to us. Any prolonged interruption in the operation or curtailment of available capacity of the pipelines that we rely upon for liquids transportation could have a material adverse effect on our business, financial condition, results of operations and cash flows. However, we believe that access to liquids pipeline transportation services generally will be available to us to the same extent as to our similarly-situated competitors.
Intrastate liquids pipeline transportation rates are subject to regulation by state regulatory commissions. The basis for intrastate liquids pipeline regulation and the degree of regulatory oversight and scrutiny given to intrastate liquids pipeline rates, varies from state to state. We believe that the regulation of liquids pipeline transportation rates will not affect our operations in any way that is materially different from the effects on our similarly-situated competitors.
In addition to FERC’s regulations, we are required to observe anti-market manipulation laws with regard to our physical sales of energy commodities. In November 2009, the Federal Trade Commission ("FTC") issued regulations pursuant to the Energy Independence and Security Act of 2007 intended to prohibit market manipulation in the petroleum industry. Violators of the regulations face civil penalties of up to $1 million per violation per day. In July 2010, Congress passed the Dodd-Frank Act,
17
which incorporated an expansion of the authority of the Commodity Futures Trading Commission ("CFTC") to prohibit market manipulation in the markets regulated by the CFTC. This authority, with respect to crude oil swaps and futures contracts, is similar to the anti-manipulation authority granted to the FTC with respect to crude oil purchases and sales. In July 2011, the CFTC issued final rules to implement their new anti-manipulation authority. The rules subject violators to a civil penalty of up to the greater of $1 million or triple the monetary gain to the person for each violation.
Regulation of Environmental and Occupational Safety and Health Matters
Our operations are subject to stringent and complex federal, state and local laws and regulations governing environmental protection as well as the discharge of materials into the environment and occupational health and safety. These laws and regulations may, among other things (i) require the acquisition of permits to conduct exploration, drilling and production operations; (ii) restrict the types, quantities and concentration of various substances that can be released into the environment or injected into formations in connection with oil and natural gas drilling and production activities; (iii) limit or prohibit drilling activities on certain lands lying within wilderness, wetlands and other protected areas; (iv) require remedial measures to mitigate pollution from former and ongoing operations, such as requirements to close pits and plug abandoned wells; and (v) impose substantial liabilities for pollution resulting from drilling and production operations. Any failure to comply with these laws and regulations may result in the assessment of administrative, civil and criminal penalties, the imposition of corrective or remedial obligations and the issuance of orders enjoining performance of some or all of our operations.
These laws and regulations may also restrict the rate of oil and natural gas production below the rate that would otherwise be possible. The regulatory burden on the oil and natural gas industry increases the cost of doing business in the industry and consequently affects profitability. Additionally, Congress and federal and state agencies frequently revise environmental laws and regulations and any changes that result in more stringent and costly waste handling, disposal and cleanup requirements for the oil and natural gas industry could have a significant impact on our operating costs.
The clear trend in environmental regulation is to place more restrictions and limitations on activities that may affect the environment and thus any changes in environmental laws and regulations or re-interpretation of enforcement policies that result in more stringent and costly waste handling, storage transport, disposal, or remediation requirements could have a material adverse effect on our financial position and results of operations. We may be unable to pass on such increased compliance costs to our purchasers. Moreover, accidental releases or spills may occur in the course of our operations and we cannot assure you that we will not incur significant costs and liabilities as a result of such releases or spills, including any third-party claims for damage to property, natural resources or persons. While compliance with existing environmental laws and regulations has not had a material adverse effect on our operations, we can provide no assurance that this will continue in the future.
The following is a summary of the more significant existing and proposed environmental, occupational health and safety laws and regulations to which our business operations are or may be subject and for which compliance may have a material adverse impact on our capital expenditures, results of operations or financial position.
The Resource Conservation and Recovery Act
The Resource Conservation and Recovery Act ("RCRA") and comparable state statutes, regulate the generation, transportation, treatment, storage, disposal and cleanup of hazardous and non-hazardous wastes. Pursuant to rules issued by the U.S. Environmental Protection Agency (the "EPA"), the individual states administer some or all of the provisions of RCRA, sometimes in conjunction with their own, more stringent requirements. Drilling fluids, produced waters and most of the other wastes associated with the exploration, development and production of crude oil or natural gas are currently regulated under RCRA’s non-hazardous waste provisions. However, it is possible that certain oil and natural gas drilling and production wastes now classified as non-hazardous could be classified as hazardous wastes in the future. For example, in December 2016, the EPA and environmental groups entered into a consent decree to address the EPA’s alleged failure to timely assess its RCRA Subtitle D criteria regulations exempting certain exploration and production related oil and natural gas wastes from regulation as hazardous wastes under RCRA. The consent decree requires the EPA to propose a rulemaking no later than March 15, 2019 for revision of certain Subtitle D criteria regulations pertaining to oil and natural gas wastes or to sign a determination that revision of the regulations is not necessary. Removal of RCRA’s exemption for exploration and production wastes has the potential to significantly increase our waste disposal costs to manage, which in turn will result in increased operating costs and could adversely impact our results of operations and financial position. Also, in the course of our operations, we generate some amounts of ordinary industrial wastes, such as paint wastes, waste solvents and waste oils that may be regulated as hazardous wastes if such wastes have hazardous characteristics.
18
Comprehensive Environmental Response, Compensation and Liability Act
The Comprehensive Environmental Response, Compensation and Liability Act ("CERCLA"), also known as the Superfund law, imposes joint and several liability, without regard to fault or legality of conduct, on classes of persons who are considered to be responsible for the release of a hazardous substance into the environment. These persons include the current and former owners and operators of the site where the release occurred and anyone who disposed or arranged for the disposal of a hazardous substance released at the site. Under CERCLA, such persons may be subject to joint and several liability for the costs of cleaning up the hazardous substances that have been released into the environment, for damages to natural resources and for the costs of certain health studies. In addition, it is not uncommon for neighboring landowners and other third-parties to file claims for personal injury and property damage allegedly caused by the hazardous substances released into the environment.
We generate materials in the course of our operations that may be regulated as hazardous substances. Despite the "petroleum exclusion" of CERCLA, which currently encompasses natural gas, we may nonetheless handle hazardous substances within the meaning of CERCLA, or similar state statutes, in the course of our ordinary operations and, as a result, may be jointly and severally liable under CERCLA for all or part of the costs required to clean up sites at which these hazardous substances have been released into the environment. In addition, we currently own, lease, or operate numerous properties that have been used for oil and natural gas exploration, production and processing for many years. Although we believe that we have utilized operating and waste disposal practices that were standard in the industry at the time, hazardous substances, wastes, or hydrocarbons may have been released on, under or from the properties owned or leased by us, or on, under or from other locations, including off-site locations, where such substances have been taken for disposal. In addition, some of our properties have been operated by third parties or by previous owners or operators whose treatment and disposal of hazardous substances, wastes, or hydrocarbons was not under our control. These properties and the substances disposed or released on, under or from them may be subject to CERCLA, RCRA and analogous state and local laws. Under such laws, we could be required to undertake investigatory, response, or corrective measures, which could include soil and groundwater sampling, the removal of previously disposed substances and wastes, the cleanup of contaminated property, or performance of remedial plugging or pit closure operations to prevent future contamination, the costs of which could be substantial.
Water Discharges
The Federal Water Pollution Control Act, or the Clean Water Act ("CWA"), and analogous state laws impose restrictions and strict controls with respect to the discharge of pollutants, including spills and leaks of oil and other substances, into waters of the United States. The discharge of pollutants into regulated waters, including wetland areas, is prohibited, except in accordance with the terms of a permit issued by the EPA, the U.S. Army Corps of Engineers (the "USACE") or an analogous state agency. In September 2015, new EPA and USACE rules defining the scope of the EPA’s and the USACE’s jurisdiction became effective. To the extent the rules expand the scope of the CWA’s jurisdiction, we could face increased costs and delays with respect to obtaining permits for dredge and fill activities in wetland areas. The rule has been challenged in court on the grounds that it unlawfully expands the reach of CWA programs and implementation of the rule has been stayed pending resolution of the court challenge. This litigation remains ongoing. In addition, federal and state regulatory agencies can impose administrative, civil and criminal penalties for non-compliance with discharge permits or other requirements of the CWA and analogous state laws and regulations. We do not expect the costs to comply with the requirements of the CWA to have a material adverse effect on our operations.
The Oil Pollution Act of 1990 ("OPA") amends the CWA and establishes strict liability for owners and operators of facilities that cause a release of oil into waters of the United States. In addition, OPA requires owners and operators of facilities that store oil above specified threshold amounts to develop and implement spill prevention, control and countermeasures ("SPCC") plans. We continue to review our properties to determine the need for new or updated SPCC plans and, where necessary, we will be developing or upgrading such plans implementing the physical and operation controls imposed by these plans, the costs of which are not expected to be substantial.
Safe Drinking Water Act
In the course of our operations, we produce water in addition to oil and natural gas. Water that is not recycled or otherwise disposed of on the lease may be sent to saltwater disposal wells for injection into subsurface formations. Underground injection operations are regulated under the federal Safe Drinking Water Act ("SDWA") and permitting and enforcement authority may be delegated to the states. In Texas, the Texas Railroad Commission ("RRC") regulates the disposal of produced water by injection well. The RRC requires operators to obtain a permit from the agency for the operation of saltwater disposal wells and establishes minimum standards for injection well operations. In response to recent seismic events near underground injection wells used for the disposal of oil and natural gas-related waste waters, federal and some state
19
agencies have begun investigating whether such wells have caused increased seismic activity and some states have shut down or imposed moratoria on the use of such injection wells. In response to these concerns, regulators in some states are considering additional requirements related to seismic safety. For example, the RRC has adopted new permit rules for injection wells to address these seismic activity concerns within the state. Among other things, the rules require companies seeking permits for disposal wells to provide seismic activity data in permit applications, provide for more frequent monitoring and reporting for certain wells and allow the RRC to modify, suspend, or terminate permits on grounds that a disposal well is likely to be, or determined to be, causing seismic activity. These new rules could impact the availability of injections wells for disposal of wastewater from our operations. Increased costs associated with the transportation and disposal of produced water, including the cost of complying with regulations concerning produced water disposal, may our reduce profitability; however, these costs are commonly incurred by all oil and natural gas producers, and we do not believe that the costs associated with the disposal of produced water will have a material adverse effect on our operations.
Air Emissions
The federal Clean Air Act and comparable state laws restrict the emission of air pollutants from many sources, such as, for example, tank batteries and compressor stations, through air emissions standards, construction and operating permitting programs and the imposition of other compliance requirements. These laws and regulations may require us to obtain pre-approval for the construction or modification of certain projects or facilities expected to produce or significantly increase air emissions, obtain and strictly comply with stringent air permit requirements or utilize specific equipment or technologies to control emissions of certain pollutants. The need to obtain permits has the potential to delay the development of oil and natural gas projects. Over the next several years, we may be required to incur certain capital expenditures for air pollution control equipment or other air emissions related issues. For example, in October 2015, the EPA lowered the National Ambient Air Quality Standard ("NAAQS") for ozone from 75 to 70 parts per billion. State implementation of the revised NAAQS could result in stricter permitting requirements, delay or prohibit our ability to obtain such permits and result in increased expenditures for pollution control equipment, the costs of which could be significant. More recently, in June 2016, the EPA finalized a rule regarding criteria for aggregating multiple small surface sites into a single source for air-quality permitting purposes applicable to the oil and natural gas industry. This rule could cause small facilities, on an aggregate basis, to be deemed a major source, thereby triggering more stringent air permitting requirements, which in turn could result in operational delays or require us to install costly pollution control equipment. The EPA has also adopted new rules under the Clean Air Act that require the reduction of volatile organic compound emissions from certain fractured and refractured natural gas wells for which well completion operations are conducted and further require that most wells use reduced emission completions, also known as "green completions." These regulations also establish specific new requirements regarding emissions from production‑related wet seal and reciprocating compressors and from pneumatic controllers and storage vessels. In addition, in June 2016, the EPA issued final rules that establish new air emission controls for emissions of methane from certain equipment and processes in the oil and natural gas source category, including production, processing, transmission and storage activities. The final rules include first-time standards to address emissions of methane from equipment and processes across the source category, including hydraulically fractured oil and natural gas well completions. In addition, the rule package extends existing VOC standards under the EPA’s Subpart OOOO of the New Source Performance Standards ("NSPS") to include previously unregulated equipment within the oil and natural gas source category. Compliance with this rule will require enhanced record-keeping practices, the purchase of new equipment such as optical gas imaging instruments to detect leaks and the increased frequency of maintenance and repair activities to address emissions leakage. The rules will also likely require hiring additional personnel to support these activities or the engagement of third party contractors to assist with and verify compliance. These and other air pollution control and permitting requirements have the potential to delay the development of oil and natural gas projects and increase our costs of development and production, which costs could be significant. However, we do not believe that compliance with such requirements will have a material adverse effect on our operations.
Regulation of Greenhouse Gas Emissions
In response to findings that emissions of carbon dioxide, methane and other greenhouse gases ("GHGs") present an endangerment to public health and the environment, the EPA has adopted regulations under existing provisions of the Clean Air Act that, among other things, establish Prevention of Significant Deterioration ("PSD"), construction and Title V operating permit reviews for certain large stationary sources. Facilities required to obtain PSD permits for their GHG emissions also will be required to meet "best available control technology" standards that will be established on a case-by-case basis. EPA rulemakings related to GHG emissions could adversely affect our operations and restrict or delay our ability to obtain air permits for new or modified sources. In addition, the EPA has adopted rules requiring the monitoring and reporting of GHG emissions from specified onshore and offshore oil and natural gas production sources in the United States on an annual basis, which include gathering and boosting facilities as well as GHG emissions from completions and workovers from hydraulically fractured oil wells. Also, as noted above, the EPA has proposed an NSPS related to methane emissions from the oil and natural gas source category.
20
While Congress has from time to time considered legislation to reduce emissions of GHGs, there has not been significant activity in the form of adopted legislation to reduce GHG emissions at the federal level in recent years. In the absence of such federal climate legislation, a number of state and regional cap and trade programs have emerged that typically require major sources of GHG emissions, such as electric power plants, to acquire and surrender emission allowances in return for emitting those GHGs. Although it is not possible at this time to predict how legislation or new regulations that may be adopted to address GHG emissions would impact our business, any such future laws and regulations imposing reporting obligations on, or limiting emissions of GHGs from, our equipment and operations could require us to incur costs to reduce emissions of GHGs associated with our operations. In addition, substantial limitations on GHG emissions could adversely affect demand for the oil and natural gas we produce and lower the value of our reserves. Finally, it should be noted that some scientists have concluded that increasing concentrations of GHGs in the Earth’s atmosphere may produce climate changes that have significant physical effects, such as increased frequency and severity of storms, floods, droughts and other extreme climatic events; if any such effects were to occur, they could have an adverse effect on our exploration and production operations.
Hydraulic Fracturing Activities
Hydraulic fracturing is an important and common practice that is used to stimulate production of natural gas and/or oil from dense subsurface rock formations. Hydraulic fracturing involves the injection of water, sand or alternative proppant and chemicals under pressure into target geological formations to fracture the surrounding rock and stimulate production. We regularly use hydraulic fracturing as part of our operations. Recently, there has been increased public concern regarding an alleged potential for hydraulic fracturing to adversely affect drinking water supplies and proposals have been made to enact separate federal, state and local legislation that would increase the regulatory burden imposed on hydraulic fracturing.
At the federal level, the EPA has asserted federal regulatory authority pursuant to the SDWA over certain hydraulic fracturing activities involving the use of diesel fuels and published permitting guidance in February 2014 addressing the performance of such activities. Also, in May 2014, the EPA issued an Advance Notice of Proposed Rulemaking to collect data on chemicals used in hydraulic fracturing operations under Section 8 of the Toxic Substances Control Act. To date, no other action has been taken. Further, the EPA finalized regulations under the CWA in June 2016 that prohibit wastewater discharges from hydraulic fracturing and certain other natural gas operations to publicly owned wastewater treatment plants. Also, in December 2016, the EPA released its final report on the potential impacts of hydraulic fracturing on drinking water resources. The final report concluded that "water cycle" activities associated with hydraulic fracturing may impact drinking water resources "under some circumstances," noting that the following hydraulic fracturing water cycle activities and local- or regional-scale factors are more likely than others to result in more frequent or more severe impacts: water withdrawals for fracturing in times or areas of low water availability; surface spills during the management of fracturing fluids, chemicals or produced water; injection of fracturing fluids into wells with inadequate mechanical integrity; injection of fracturing fluids directly into groundwater resources; discharge of inadequately treated fracturing wastewater to surface waters; and disposal or storage of fracturing wastewater in unlined pits. In addition, the U.S. Department of the Interior finalized rules in March 2015 that impose new or more stringent standards for performing hydraulic fracturing on federal and American Indian lands. The U.S. District Court of Wyoming has temporarily stayed implementation of this rule. A final decision has not yet been issued.
At the state level, several states have adopted or are considering legal requirements that could impose more stringent permitting, disclosure and well construction requirements on hydraulic fracturing activities. For example in May 2013, the RRC adopted new rules governing well casing, cementing and other standards for ensuring that hydraulic fracturing operations do not contaminate nearby water resources. Local government also may seek to adopt ordinances within their jurisdictions regulating the time, place and manner of drilling activities in general or hydraulic fracturing activities in particular or prohibit the performance of well drilling in general or hydraulic fracturing in particular. We believe that we follow applicable standard industry practices and legal requirements for groundwater protection in our hydraulic fracturing activities. Nonetheless, if new or more stringent federal, state, or local legal restrictions relating to the hydraulic fracturing process are adopted in areas where we operate, we could incur potentially significant added costs to comply with such requirements, experience delays or curtailment in the pursuit of exploration, development, or production activities and perhaps even be precluded from drilling wells.
If new federal, state or local laws or regulations that significantly restrict hydraulic fracturing are adopted, such legal requirements could result in delays, eliminate certain drilling and injection activities and make it more difficult or costly to perform fracturing. Any such regulations limiting or prohibiting hydraulic fracturing could reduce oil and natural gas exploration and production activities and, therefore, adversely affect our business. Such laws or regulations could also materially increase our costs of compliance and doing business by more strictly regulating how hydraulic fracturing wastes are handled or disposed.
21
Endangered Species Act and Migratory Birds
The federal Endangered Species Act ("ESA") and (in some cases) comparable state laws were established to protect endangered and threatened species. Pursuant to the ESA, if a species is listed as threatened or endangered, restrictions may be imposed on activities adversely affecting that species’ habitat. We may conduct operations on oil and natural gas leases in areas where certain species that are listed as threatened or endangered are known to exist and where other species, such as the sage grouse, that potentially could be listed as threatened or endangered under the ESA may exist. The U.S. Fish and Wildlife Service (the "FWS") may designate critical habitat and suitable habitat areas that it believes are necessary for the survival of a threatened or endangered species. A critical habitat or suitable habitat designation could result in further material restrictions to federal land use and may materially delay or prohibit land access for oil and natural gas development. Moreover, as a result of a 2011 settlement agreement, the FWS is required to make a determination on listing of more than 250 species as endangered or threatened under the FSA by no later than completion of the agency’s 2017 fiscal year. Similar protections are offered to migratory birds under the Migratory Bird Treaty Act. The federal government recently issued indictments under the Migratory Bird Treaty Act to several oil and natural gas companies after dead migratory birds were found near reserve pits associated with drilling activities and this represents an area of increased enforcement. The identification or designation of previously unprotected species as threatened or endangered in areas where underlying property operations are conducted could cause us to incur increased costs arising from species protection measures or could result in limitations on our exploration and production activities that could have an adverse impact on our ability to develop and produce reserves. If we were to have a portion of our leases designated as critical or suitable habitat, it could adversely impact the value of our leases.
OSHA
We are subject to the requirements of the Occupational Safety and Health Administration ("OSHA") and comparable state statutes whose purpose is to protect the health and safety of workers. In addition, the OSHA hazard communication standard, the Emergency Planning and Community Right-to-Know Act and comparable state statutes and any implementing regulations require that we organize and/or disclose information about hazardous materials used or produced in our operations and that this information be provided to employees, state and local governmental authorities and citizens.
Related Permits and Authorizations
Many environmental laws require us to obtain permits or other authorizations from state and/or federal agencies before initiating certain drilling, construction, production, operation, or other oil and natural gas activities and to maintain these permits and compliance with their requirements for on-going operations. These permits are generally subject to protest, appeal, or litigation, which, in certain cases, can delay or halt projects and cease production or operation of wells, pipelines and other operations.
Related Insurance
We maintain insurance against some risks associated with above or underground contamination that may occur as a result of our exploration and production activities. However, this insurance is limited to activities at the well site, and there can be no assurance that this insurance will continue to be commercially available or that this insurance will be available at premium levels that justify its purchase by us. The occurrence of a significant event that is not fully insured or indemnified against could have a materially adverse effect on our financial condition and operations.
Although we have not experienced any material adverse effect from compliance with environmental requirements, there is no assurance that this will continue. We did not have any material capital or other non-recurring expenditures in connection with complying with environmental laws or environmental remediation matters in 2016, nor do we anticipate that such expenditures will be material in 2017.
Employees
As of December 31, 2016, we employed 298 people. Our future success will depend in part on our ability to attract, retain and motivate qualified personnel. We are not a party to any collective bargaining agreements and have not experienced any strikes or work stoppages. We consider our relations with our employees to be satisfactory. From time to time we utilize the services of independent contractors to perform various field and other services.
22
Available Information
We file or furnish annual, quarterly and current reports, proxy statements and other documents with the SEC under the Exchange Act. The public may read and copy any materials we file with the SEC at the SEC’s Public Reference Room at 100 F Street, NE, Washington, D.C. 20549, on official business days during the hours of 10 a.m. to 3 p.m. The public may obtain information on the operation of the Public Reference Room by calling the SEC at 1-800-SEC-0330. The SEC also maintains an internet website at www.sec.gov that contains reports, proxy and information statements and other information regarding issuers, including us, that file electronically with the SEC.
Our Class A Common Stock is listed and traded on the New York Stock Exchange ("NYSE") under the symbol "PE." Our reports, proxy statements and other information filed with the SEC can also be inspected and copied at the offices of the NYSE, at 20 Broad Street, New York, New York 10005.
We also make available free of charge through our website, www.parsleyenergy.com, electronic copies of certain documents that we file with the SEC, including our Annual Reports on Form 10-K, Quarterly Reports on Form 10-Q, Current Reports on Form 8-K and amendments to those reports filed or furnished pursuant to Section 13(a) or 15(d) of the Exchange Act as soon as reasonably practicable after we electronically file such material with, or furnish it to, the SEC.
ITEM 1A. RISK FACTORS
You should carefully consider the following risks and all of the information contained in this Annual Report. Our business, financial condition and results of operations could be materially and adversely affected by any of these risks. The risks described below are not the only ones facing us. Additional risks not presently known to us or which we consider immaterial also may adversely affect us.
Risks Related to the Oil and Natural Gas Industry and Our Business
Oil and natural gas prices are volatile and have declined significantly in recent years. An extended continuation of low, or a further decline in, commodity prices may adversely affect our business, financial condition or results of operations and our ability to meet our capital expenditure obligations and financial commitments.
Prices for oil and natural gas can fluctuate widely and have declined significantly since 2014. For example, from 2014 through February 24, 2017, NYMEX WTI oil futures contract prices ranged from a high of $107.26 per barrel on June 20, 2014 to a low of $26.21 per barrel on February 11, 2016, and NYMEX Henry Hub gas futures prices ranged from a high of $6.15 per MMBtu on February 19, 2014 to a low of $1.64 per MMBtu on March 3, 2016. The duration and magnitude of the decline in crude oil prices cannot be predicted. The prices we receive for our oil and natural gas production heavily influence our revenue, profitability, access to capital and future rate of growth. Oil, natural gas and NGLs are commodities and, therefore, their prices are subject to wide fluctuations in response to relatively minor changes in supply and demand. Historically, the commodities market has been volatile. This market will likely continue to be volatile in the future. The prices we receive for our production, and the levels of our production, depend on numerous factors beyond our control. These factors include the following:
• | worldwide and regional economic conditions impacting the global supply and demand for oil, natural gas and NGLs; |
• | the price and quantity of foreign imports; |
• | political conditions in or affecting other producing countries, including conflicts in the Middle East, Africa, South America and Russia; |
• | the level of global exploration and production; |
• | the level of global inventories; |
• | prevailing prices on local price indices in the areas in which we operate; |
• | the proximity, capacity, cost and availability of gathering and transportation facilities; |
• | localized and global supply and demand fundamentals and transportation availability; |
• | weather conditions; |
• | technological advances affecting energy consumption; |
• | the effect of energy conservation efforts or activities by non-governmental organizations to restrict the exploration and production of oil and natural gas so as to minimize emissions of carbon dioxide and methane GHGs; |
23
• | the price and availability of alternative fuels; and |
• | domestic, local and foreign governmental regulation and taxes. |
If a buildup in inventories, lower global demand, or other factors cause prices for U.S. crude oil to weaken, our cash flows and results of operations may be negatively affected. We may be unable to obtain needed capital or financing on satisfactory terms, which could lead to a decline in the present value of our reserves and our ability to develop future reserves. Lower commodity prices may also reduce the amount of oil, natural gas and NGLs that we can produce economically.
If commodity prices decrease, a significant portion of our acquisition, development, and exploitation projects could become uneconomic. This may result in our having to make significant downward adjustments to our estimated proved reserves. As a result, a continuation of low, or a substantial or extended decline in, commodity prices may materially and adversely affect our future business, financial condition, results of operations, liquidity or ability to finance planned capital expenditures.
Our development and exploratory drilling efforts and our well operations may not be profitable or achieve our targeted returns.
We have acquired significant amounts of unproved property in order to further our development efforts and expect to continue to undertake acquisitions in the future. Development and exploratory drilling and production activities are subject to many risks, including the risk that no commercially productive reservoirs will be discovered. We acquire unproved properties and lease undeveloped acreage that we believe will enhance our growth potential and increase our results of operations over time. However, we cannot assure you that all prospects will be economically viable or that we will not abandon our investments. Additionally, we cannot assure you that unproved property acquired by us or undeveloped acreage leased by us will be profitably developed, that wells drilled by us in prospects that we pursue will be productive or that we will recover all or any portion of our investment in such unproved property or wells.
Properties we acquire may not produce as projected and we may be unable to determine reserve potential, identify liabilities associated with the properties that we acquire or obtain protection from sellers against such liabilities.
Acquiring oil and natural gas properties requires us to assess reservoir and infrastructure characteristics, including recoverable reserves, development and operating costs and potential environmental and other liabilities. Such assessments are inexact and inherently uncertain. In connection with the assessments, we perform a review of the subject properties, but such a review will not reveal all existing or potential problems. In the course of our due diligence, we may not inspect every well or pipeline. We cannot necessarily observe structural and environmental problems, such as pipe corrosion, when an inspection is made. We may not be able to obtain contractual indemnities from the seller for liabilities created prior to our purchase of the property. We may be required to assume the risk of the physical condition of the properties in addition to the risk that the properties may not perform in accordance with our expectations.
Our acquisition, development and exploitation projects require substantial capital expenditures. We may be unable to obtain required capital or financing on satisfactory terms, which could lead to a decline in our reserves.
The oil and natural gas industry is capital intensive. We make and expect to continue to make substantial capital expenditures for the acquisition and development of oil and natural gas reserves. We expect to fund our 2017 capital expenditures with cash on hand, cash generated by operations, borrowings under our Revolving Credit Agreement and possibly through additional capital market transactions. The actual amount and timing of our future capital expenditures may differ materially from our estimates as a result of, among other things, oil and natural gas prices, actual drilling results, the availability of drilling rigs and other services and equipment and regulatory, technological and competitive developments. A reduction in commodity prices from current levels may result in a decrease in our actual capital expenditures, which would negatively impact our ability to grow production. See "Management’s Discussion and Analysis of Financial Condition and Results of Operations—Capital Requirements and Sources of Liquidity."
Our cash flow from operations and access to capital are subject to a number of variables, including:
• | our proved reserves; |
• | the level of hydrocarbons we are able to produce from existing wells; |
• | the prices at which our production is sold; |
• | our ability to acquire, locate and produce new reserves; and |
24
• | our ability to borrow under our Revolving Credit Agreement. |
If our revenues or the borrowing base under our Revolving Credit Agreement decrease as a result of a continuation of lower oil and natural gas prices, operating difficulties, declines in reserves or for any other reason, we may have limited ability to obtain the capital necessary to sustain our operations and growth at current levels. If additional capital is needed, we may not be able to obtain debt or equity financing on terms acceptable to us, if at all. If cash flow generated by our operations or available borrowings under our Revolving Credit Agreement are not sufficient to meet our capital requirements, the failure to obtain additional financing could result in a curtailment of our operations relating to development of our properties, which in turn could lead to a decline in our reserves and production and would adversely affect our business, financial condition and results of operations.
Future price declines could result in a reduction in the carrying value of our proved oil and natural gas properties, which could adversely affect our results of operations.
Commodity prices have declined significantly from 2014. Through February 24, 2017, NYMEX WTI crude oil futures prices have declined from a high of $107.26 per Bbl on June 20, 2014 to a low of $26.21 per Bbl on February 11, 2016, and NYMEX Henry Hub gas futures prices have declined from a high of $6.15 per MMBtu on February 19, 2014 to a low of $1.64 per MMBtu on March 3, 2016. Likewise, NGLs have suffered significant declines over the same period. NGLs are made up of ethane, propane, isobutane, normal butane and natural gasoline, all of which have different uses and different pricing characteristics. As stated above, price declines, as have occurred since 2014, could result in downward adjustments to our estimated proved reserves. It is possible that prices could decline further, or our estimates of production or other economic factors could change to such an extent that we may be required to impair, as a non-cash charge to earnings, the carrying value of our oil and natural gas properties. We are required to perform impairment tests on proved oil and natural gas properties whenever events or changes in circumstances indicate that the carrying value of proved properties may not be recoverable. To the extent such tests indicate a reduction of the estimated useful life or estimated future cash flows of our oil and natural gas properties, the carrying value may not be recoverable and therefore an impairment charge would be required to reduce the carrying value of the proved properties to their fair value. See Impairment of Oil and Gas Properties included in "Part 2. Item 7. Management’s Discussion and Analysis" for specific information regarding our impairments. We may incur impairment charges in the future, which could materially affect our results of operations in the period incurred.
Drilling for and producing oil and natural gas are high risk activities with many uncertainties that could adversely affect our business, financial condition or results of operations.
Our future financial condition and results of operations will depend on the success of our acquisition, development, and exploitation activities, which are subject to numerous risks beyond our control, including the risk that drilling will not result in commercially viable oil and natural gas production.
Our decisions to purchase, explore, develop or otherwise exploit prospects or properties will depend in part on the evaluation of data obtained through geophysical and geological analysis, production data and engineering studies, the results of which are often inconclusive or subject to varying interpretations. For a discussion of the uncertainty involved in these processes, see "—Reserve estimates depend on many assumptions that may turn out to be inaccurate. Any material inaccuracies in reserve estimates or underlying assumptions will materially affect the quantities and present value of our reserves." In addition, our cost of drilling, completing and operating wells is often uncertain before drilling commences.
Further, many factors may curtail, delay or cancel our scheduled drilling projects, including the following:
• | delays imposed by or resulting from compliance with regulatory requirements including limitations resulting from wastewater disposal, discharge of GHGs and limitations on hydraulic fracturing; |
• | pressure or irregularities in geological formations; |
• | shortages of or delays in obtaining equipment and qualified personnel or in obtaining water for hydraulic fracturing activities; |
• | equipment failures or accidents, such as fires or blowouts; |
• | lack of available gathering facilities or delays in construction of gathering facilities; |
• | lack of available capacity on interconnecting transmission pipelines; |
• | adverse weather conditions, such as blizzards, tornados and ice storms; |
• | issues related to compliance with environmental regulations; |
25
• | environmental hazards, such as oil and natural gas leaks, oil spills, pipeline and tank ruptures, encountering naturally occurring radioactive materials and unauthorized discharges of brine, well stimulation and completion fluids, toxic gases or other pollutants into the surface and subsurface environment; |
• | declines in oil and natural gas prices; |
• | limited availability of financing at acceptable terms; |
• | title problems or legal disputes regarding leasehold rights; and |
• | limitations in the market for oil and natural gas. |
Our identified drilling locations are scheduled over many years, making them susceptible to uncertainties that could materially alter the occurrence or timing of their drilling. In addition, we may not be able to raise the substantial amount of capital that would be necessary to drill such locations.
Our management team has specifically identified and scheduled certain drilling locations as an estimation of our future multi-year drilling activities on our existing acreage. These locations represent a significant part of our growth strategy. Our ability to drill and develop these locations depends on a number of uncertainties, including oil and natural gas prices, the availability and cost of capital, drilling and production costs, availability of drilling services and equipment, drilling results, lease expirations, gathering system and pipeline transportation constraints, access to and availability of water sourcing and distribution systems, regulatory approvals and other factors. Because of these uncertain factors, we do not know if the numerous potential well locations we have identified will ever be drilled or if we will be able to produce natural gas or oil from these or any other potential locations. In addition, unless production is established within the spacing units covering the undeveloped acres on which some of the potential locations are obtained, the leases for such acreage will expire. As such, our actual drilling activities may materially differ from those presently identified.
We may not be able to generate sufficient cash to service all of our indebtedness and may be forced to take other actions to satisfy our obligations under the applicable debt instruments, which may not be successful.
We expect our earnings and cash flow to vary significantly from year to year due to the nature of our industry. As a result, the amount of debt that we can manage in some periods may not be appropriate for us in other periods. Additionally, our future cash flow may be insufficient to meet our debt obligations and other commitments. Any insufficiency could negatively impact our business. A range of economic, competitive, business and industry factors will affect our future financial performance, and, as a result, our ability to generate cash flow from operations and to pay our debt obligations. Many of these factors, such as oil, natural gas and NGLs prices, economic and financial conditions in our industry and the global economy and initiatives of our competitors, are beyond our control. We may not be able to maintain a level of cash flows from operating activities sufficient to permit us to pay the principal, premium, if any, and interest on our indebtedness. If our cash flows and capital resources are insufficient to fund our debt service obligations, we may be forced to reduce or delay planned investments and capital expenditures, or to sell assets, seek additional financing in the debt or equity markets or restructure or refinance our indebtedness. Our ability to restructure or refinance our indebtedness will depend on the condition of the capital markets and our financial condition at such time. Any refinancing of our indebtedness could be at higher interest rates and may require us to comply with more onerous covenants, which could further restrict our business operations. The terms of existing or future debt instruments may restrict us from adopting some of these alternatives. In addition, any failure to make payments of interest and principal on our outstanding indebtedness on a timely basis would likely result in a reduction of our credit ratings, which could harm our ability to incur additional indebtedness. In the absence of such operating results and resources, we could face substantial liquidity problems and might be required to dispose of material assets or operations to meet our debt service and other obligations. Our Revolving Credit Agreement and the indentures governing our senior unsecured notes restrict our ability to dispose of assets and our use of the proceeds from such disposition. We may not be able to consummate those dispositions or to obtain the proceeds that we could have realized from them and any proceeds may not be adequate to meet any debt service obligations then due. These alternative measures may not be successful and may not permit us to meet our debt service obligations.
Restrictions in our existing and future debt agreements could limit our growth and our ability to engage in certain activities.
Our Revolving Credit Agreement and the indentures governing our senior unsecured notes contain a number of significant covenants, including restrictive covenants that may limit our ability to, among other things:
• | incur or guarantee additional indebtedness or issue certain types of preferred stock; |
• | pay dividends on capital stock or redeem, repurchase, or retire our capital stock or subordinated indebtedness; |
26
• | transfer or sell assets; |
• | make investments; |
• | create certain liens; |
• | enter into agreements that restrict dividends or payments from our restricted subsidiaries to us; |
• | consolidate, merge, or transfer all or substantially all of our assets; |
• | engage in transactions with affiliates; and |
• | create unrestricted subsidiaries. |
In addition, our Revolving Credit Agreement requires us to maintain certain financial ratios or to reduce our indebtedness if we are unable to comply with such ratios. These restrictions may also limit our ability to obtain future financings to withstand a future downturn in our business or the economy in general, or to otherwise conduct necessary corporate activities. We may also be prevented from taking advantage of business opportunities that arise because of the limitations that the restrictive covenants under our Revolving Credit Agreement and the indentures governing our senior unsecured notes impose on us.
Our Revolving Credit Agreement limits the amount we can borrow up to the lowest of (i) the borrowing base, (ii) the aggregate elected borrowing base commitments and (iii) $2.5 billion. The lenders may, in their sole discretion, redetermine the borrowing base on a semi-annual basis based upon projected revenues from the oil and natural gas properties securing our loan. The lenders can unilaterally adjust the borrowing base and the borrowings permitted to be outstanding under our Revolving Credit Agreement. Any increase in the borrowing base requires the consent of the lenders holding 100% of the commitments. If the requisite number of lenders do not agree to a proposed borrowing base, then the borrowing base will be the highest borrowing base acceptable to such lenders. Outstanding borrowings in excess of the borrowing base must be repaid.
A breach of any covenant in our Revolving Credit Agreement would result in a default under the applicable agreement after any applicable grace periods. A default, if not waived, could result in acceleration of the indebtedness outstanding under the Revolving Credit Agreement and in a default with respect to, and an acceleration of, the indebtedness outstanding under other debt agreements. The accelerated indebtedness would become immediately due and payable. If that occurs, we may not be able to make all of the required payments or borrow sufficient funds to refinance such indebtedness. Even if new financing were available at that time, it may not be on terms that are acceptable to us.
If we are unable to comply with the restrictions and covenants in our Revolving Credit Agreement, there could be an event of default under the terms of our Revolving Credit Agreement, which could results in an acceleration of repayment.
If we are unable to comply with the restrictions and covenants in our Revolving Credit Agreement, there could be an event of default under the terms of this facility. Our ability to comply with these restrictions and covenants, including meeting the financial ratios and tests under our Revolving Credit Agreement, may be affected by events beyond our control. If market or other economic conditions deteriorate or if oil and natural gas prices decline, our ability to comply with these covenants may be impaired. We cannot assure that we will be able to comply with these restrictions and covenants or meet such financial ratios and tests. In the event of a default under our Revolving Credit Agreement, the lenders could terminate their commitments to lend or accelerate the loans and declare all amounts borrowed due and payable. If any of these events occur, our assets might not be sufficient to repay in full all of our outstanding indebtedness and we may be unable to find alternative financing. Even if we could obtain alternative financing, it might not be on terms that are favorable or acceptable to us. Additionally, we may not be able to amend our Revolving Credit Agreement or obtain needed waivers on satisfactory terms.
Our derivative activities could result in financial losses or could reduce our earnings.
To achieve more predictable cash flows and reduce our exposure to adverse fluctuations in the prices of the commodities we sell, we enter into commodity derivative contracts for a significant portion of our production, with an emphasis on oil production, primarily consisting of put spreads, basis swaps and three-way collars. See "Management’s Discussion and Analysis of Financial Condition and Results of Operations—Overview—Sources of Our Revenues" and "Management’s Discussion and Analysis of Financial Condition and Results of Operations—Overview—Realized Prices on the Sale of Oil, Natural Gas and NGLs." Accordingly, our earnings may fluctuate significantly as a result of changes in fair value of our derivative instruments.
27
Derivative instruments also expose us to the risk of financial loss in some circumstances, including when:
• | production is less than the volume covered by the derivative instruments; |
• | the counterparty to the derivative instrument defaults on its contractual obligations; |
• | there is an increase in the differential between the underlying price in the derivative instrument and actual prices received; or |
• | there are issues with regard to legal enforceability of such instruments. |
The use of derivatives may, in some cases, require the posting of cash collateral with counterparties. If we enter into derivative instruments that require cash collateral and commodity prices or interest rates change in a manner adverse to us, our cash otherwise available for use in our operations would be reduced which could limit our ability to make future capital expenditures and make payments on our indebtedness and which could also limit the size of our borrowing base. Future collateral requirements will depend on arrangements with our counterparties, highly volatile oil and natural gas prices and interest rates. In addition, derivative arrangements could limit the benefit we would receive from increases in the prices for oil and natural gas, which could also have an adverse effect on our financial condition.
Our commodity derivative contracts expose us to risk of financial loss if a counterparty fails to perform under a contract. Disruptions in the financial markets could lead to sudden decreases in a counterparty’s liquidity, which could make them unable to perform under the terms of the contract, and we may not be able to realize the benefit of the contract. We are unable to predict sudden changes in a counterparty’s creditworthiness or ability to perform. Even if we do accurately predict sudden changes, our ability to negate the risk may be limited depending upon market conditions.
During periods of declining commodity prices, our derivative contract receivable positions generally increase, which increases our counterparty credit exposure. If the creditworthiness of our counterparties deteriorates and results in their nonperformance, we could incur a significant loss with respect to our commodity derivative contracts.
Reserve estimates depend on many assumptions that may turn out to be inaccurate. Any material inaccuracies in reserve estimates or underlying assumptions will materially affect the quantities and present value of our reserves.
The process of estimating oil and natural gas reserves is complex. It requires interpretations of available technical data and many assumptions, including assumptions relating to current and future economic conditions and commodity prices. Any significant inaccuracies in these interpretations or assumptions could materially affect the estimated quantities and present value of our reserves.
In order to prepare reserve estimates, we must project production rates and timing of development expenditures. We must also analyze available geological, geophysical, production and engineering data. The extent, quality and reliability of this data can vary. The process also requires economic assumptions about matters such as oil and natural gas prices, drilling and operating expenses, capital expenditures, taxes and availability of funds.
Actual future production, oil and natural gas prices, revenues, taxes, development expenditures, operating expenses and quantities of recoverable oil and natural gas reserves will vary from our estimates. Any significant variance could materially affect the estimated quantities and present value of our reserves. In addition, we may adjust reserve estimates to reflect production history, results of exploration and development, existing commodity prices and other factors, many of which are beyond our control.
You should not assume that the present value of future net revenues from our reserves is the current market value of our estimated reserves. We generally base the estimated discounted future net cash flows from reserves on prices and costs on the date of the estimate. Actual future prices and costs may differ materially from those used in the present value estimate.
Approximately 38% of our net leasehold acreage is undeveloped and that acreage may not ultimately be developed or become commercially productive, which could cause us to lose rights under our leases as well as have a material adverse effect on our oil and natural gas reserves and future production and, therefore, our future cash flow and income.
As of December 31, 2016, approximately 38% of our net leasehold acreage was undeveloped or acreage on which wells have not been drilled or completed to a point that would permit the production of commercial quantities of oil and natural gas regardless of whether such acreage contains proved reserves. Unless production is established on the undeveloped acreage covered by our leases, such leases will expire. Our future oil and natural gas reserves and production and, therefore, our future cash flow and income are highly dependent on successfully developing our undeveloped leasehold acreage.
28
Our producing properties are located in the Permian Basin of West Texas, making us vulnerable to risks associated with operating in one major geographic area.
All of our producing properties are geographically concentrated in the Permian Basin of West Texas. At December 31, 2016, all of our total estimated proved reserves were attributable to properties located in this area. As a result of this concentration, we may be disproportionately exposed to the impact of regional supply and demand factors, delays or interruptions of production from wells in this area caused by governmental regulation, processing or transportation capacity constraints, market limitations, water shortages or other drought or extreme weather related conditions or interruption of the processing or transportation of oil, natural gas or NGLs.
The marketability of our production is dependent upon transportation and other facilities, certain of which we do not control. If these facilities are unavailable, our operations could be interrupted and our revenues reduced.
The marketing of oil, natural gas and NGLs production depends in large part on the availability, proximity and capacity of pipelines and storage facilities, gas gathering systems and other transportation, processing and refining facilities, as well as the existence of adequate markets. If there is insufficient capacity available on these systems, or if these systems are unavailable to us, the price offered for our production could be significantly depressed, or we could be forced to shut in some production or delay or discontinue drilling plans and commercial production following a discovery of hydrocarbons while we construct our own facility. We also rely (and expect to rely in the future) on facilities developed and owned by third parties in order to store, process, transport and sell our oil, natural gas and NGLs production. Our plans to develop and sell our oil and natural gas reserves could be materially and adversely affected by the inability or unwillingness of third parties to provide sufficient transportation, storage or processing facilities to us, especially in areas of planned expansion where such facilities do not currently exist.
Our drilling and production programs may not be able to obtain access on commercially reasonable terms or otherwise to truck transportation, pipelines, gas gathering, transmission, storage and processing facilities to market our oil and natural gas production.
The marketing of oil and natural gas production depends in large part on the capacity and availability of trucks, pipelines and storage facilities, gas gathering systems and other transportation, processing and refining facilities. Access to such facilities is, in many respects, beyond our control. If these facilities were unavailable to us on commercially reasonable terms or otherwise, we could be forced to shut in some production or delay or discontinue drilling plans and commercial production following a discovery of hydrocarbons. We rely (and expect to rely in the future) on facilities developed and owned by third parties in order to store, process, transmit and sell our oil and natural gas production. Our plans to develop and sell our oil and natural gas reserves could be materially and adversely affected by the inability or unwillingness of third parties to provide sufficient facilities and services to us on commercially reasonable terms or otherwise. The amount of oil and natural gas that can be produced is subject to limitation in certain circumstances, such as pipeline interruptions due to scheduled and unscheduled maintenance; excessive pressure; physical damage to the gathering, transportation, refining or processing facilities; or lack of capacity on such facilities. The curtailments arising from these and similar circumstances may last from a few days to several months and in many cases, we may be provided only limited, if any, notice as to when these circumstances will arise and their duration.
Extreme weather conditions could adversely affect our ability to conduct drilling activities in the areas where we operate.
Our exploration, exploitation and development activities and equipment could be adversely affected by extreme weather conditions, such as winter storms, which may cause a loss of production from temporary cessation of activity or lost or damaged facilities and equipment. Such extreme weather conditions could also impact other areas of our operations, including access to our drilling and production facilities for routine operations, maintenance and repairs and the availability of and our access to, necessary third-party services, such as gathering, processing, compression and transportation services. These constraints and the resulting shortages or high costs could delay or temporarily halt our operations and materially increase our operation and capital costs, which could have a material adverse effect on our business, financial condition and results of operations.
We may incur losses as a result of title defects in the properties in which we invest.
It is our practice in acquiring oil and natural gas leases or interests not to incur the expense of retaining lawyers to examine the title to the mineral interest at the time of acquisition. Rather, we rely upon the judgment of lease brokers or landmen who perform the fieldwork in examining records in the appropriate governmental office before attempting to acquire a lease in a specific mineral interest. The existence of a material title deficiency can render a lease worthless and can adversely
29
affect our results of operations and financial condition. While we do typically obtain title opinions prior to commencing drilling operations on a lease or in a unit, the failure of title may not be discovered until after a well is drilled, in which case we may lose the lease and the right to produce all or a portion of the minerals under the property.
The development of our estimated proved undeveloped reserves may take longer and may require higher levels of capital expenditures than we currently anticipate. Therefore, our estimated proved undeveloped reserves may not be ultimately developed or produced.
At December 31, 2016, 52% of our total estimated proved reserves were classified as proved undeveloped. Our approximately 116.2 MMBoe of estimated proved undeveloped reserves will require an estimated $992.1 million of development capital over the next five years. Development of these undeveloped reserves may take longer and require higher levels of capital expenditures than we currently anticipate. The future development of our proved undeveloped reserves is dependent on future commodity prices, costs and economic assumptions that align with our internal forecast as well as access to liquidity sources, such as capital markets, our Revolving Credit Agreement and derivative contracts. Delays in the development of our reserves, increases in costs to drill and develop such reserves, or decreases in commodity prices will reduce the value of our estimated proved undeveloped reserves and future net revenues estimated for such reserves and may result in some projects becoming uneconomic. In addition, delays in the development of reserves could cause us to have to reclassify our proved undeveloped reserves as unproved reserves.
SEC rules could limit our ability to book additional proved undeveloped reserves in the future.
SEC rules require that, subject to limited exceptions, proved undeveloped reserves may only be booked if they are related to wells scheduled to be drilled within five years after the date of booking. This requirement has limited and may continue to limit our ability to book additional proved undeveloped reserves as we pursue our drilling program. Moreover, we may be required to write down our proved undeveloped reserves if we do not drill those wells within the required five-year timeframe.
Unless we replace our reserves with new reserves and develop those reserves, our reserves and production will decline, which would adversely affect our future cash flows and results of operations.
Producing oil and natural gas reservoirs generally are characterized by declining production rates that vary depending upon reservoir characteristics and other factors. Unless we conduct successful ongoing acquisition, development, and exploitation activities or continually acquire properties containing proved reserves, our proved reserves will decline as those reserves are produced. Our future reserves and production and therefore our future cash flow and results of operations, are highly dependent on our success in efficiently developing and exploiting our current reserves and economically finding or acquiring additional recoverable reserves. We may not be able to develop, exploit, find or acquire sufficient additional reserves to replace our current and future production. If we are unable to replace our current and future production, the value of our reserves will decrease and our business, financial condition and results of operations would be adversely affected. Further, the horizontal decline curve we use to project our future production is subject to numerous limitations.
Conservation measures and technological advances could reduce demand for oil and natural gas.
Fuel conservation measures, alternative fuel requirements, increasing consumer demand for alternatives to oil and natural gas, technological advances in fuel economy and energy generation devices could reduce demand for oil and natural gas. The impact of the changing demand for oil and natural gas services and products may have a material adverse effect on our business, financial condition, results of operations and cash flows.
30
We depend upon several significant purchasers for the sale of most of our oil and natural gas production. The loss of one or more of these purchasers could, among other factors, limit our access to suitable markets for the oil and natural gas we produce.
The availability of a ready market for any oil and/or natural gas we produce depends on numerous factors beyond the control of our management, including but not limited to the extent of domestic production and imports of oil, the proximity and capacity of pipelines, the availability of skilled labor, materials and equipment, the effect of state and federal regulation of oil and natural gas production and federal regulation of oil and natural gas sold in interstate commerce. In addition, we depend upon several significant purchasers for the sale of most of our oil and natural gas production. See "Business—Oil and Natural Gas Production Prices and Production Costs— Marketing and Customers." We cannot assure you that we will continue to have ready access to suitable markets for our future oil and natural gas production.
We may incur substantial losses and be subject to substantial liability claims as a result of our operations. Additionally, we may not be insured for, or our insurance may be inadequate to protect us against, these risks.
We are not insured against all risks. Losses and liabilities arising from uninsured and underinsured events could materially and adversely affect our business, financial condition or results of operations.
Our exploration and production activities are subject to all of the operating risks associated with drilling for and producing oil and natural gas. Any of these risks could adversely affect our ability to conduct operations or result in substantial loss to us as a result of claims for:
• | injury or loss of life; |
• | damage to and destruction of property, natural resources and equipment; |
• | pollution and other environmental damage; |
• | regulatory investigations and penalties; |
• | suspension of our operations; and |
• | repair and remediation costs. |
We may elect not to obtain insurance for any or all of these risks if we believe that the cost of available insurance is excessive relative to the risks presented. In addition, pollution and environmental risks generally are not fully insurable. The occurrence of an event that is not fully covered by insurance could have a material adverse effect on our business, financial condition and results of operations.
Properties that we decide to drill may not yield oil or natural gas in commercially viable quantities.
Properties that we decide to drill that do not yield oil or natural gas in commercially viable quantities will adversely affect our results of operations and financial condition. There is no way to predict in advance of drilling and testing whether any particular prospect will yield oil or natural gas in sufficient quantities to recover drilling or completion costs or to be economically viable. The use of micro-seismic data and other technologies and the study of producing fields in the same area will not enable us to know conclusively prior to drilling whether oil or natural gas will be present or, if present, whether oil or natural gas will be present in commercial quantities. We cannot assure you that the analogues we draw from available data from other wells, more fully explored prospects or producing fields will be applicable to our drilling prospects. Further, our drilling operations may be curtailed, delayed or canceled as a result of numerous factors, including:
• | unexpected drilling conditions; |
• | title problems; |
• | pressure or lost circulation in formations; |
• | equipment failure or accidents; |
• | adverse weather conditions; |
• | compliance with environmental and other governmental or contractual requirements; and |
• | increases in the cost of, shortages or delays in the availability of, electricity, supplies, materials, drilling or workover rigs, equipment and services. |
31
We may be unable to make attractive acquisitions or successfully integrate acquired businesses and any inability to do so may disrupt our business and hinder our ability to grow.
In the future we may make acquisitions of producing properties or businesses that complement or expand our current business. The successful acquisition of producing properties requires an assessment of several factors, including:
• | recoverable reserves; |
• | future oil and natural gas prices and their applicable differentials; |
• | operating costs; and |
• | potential environmental and other liabilities. |
The accuracy of these assessments is inherently uncertain, and we may not be able to identify attractive acquisition opportunities. In connection with these assessments, we perform a review of the subject properties that we believe to be generally consistent with industry practices. Our review will not reveal all existing or potential problems nor will it permit us to become sufficiently familiar with the properties to assess fully their deficiencies and capabilities. Inspections may not always be performed on every well and environmental problems, such as groundwater contamination, are not necessarily observable even when an inspection is undertaken. Even when problems are identified, the seller may be unwilling or unable to provide effective contractual protection against all or part of the problems. We often are not entitled to contractual indemnification for environmental liabilities and acquire properties on an "as is" basis. Even if we do identify attractive acquisition opportunities, we may not be able to complete the acquisition or do so on commercially acceptable terms.
The success of any completed acquisition will depend on our ability to integrate effectively the acquired business into our existing operations. The process of integrating acquired businesses may involve unforeseen difficulties and may require a disproportionate amount of our managerial and financial resources. In addition, possible future acquisitions may be larger and for purchase prices significantly higher than those paid for earlier acquisitions. No assurance can be given that we will be able to identify additional suitable acquisition opportunities, negotiate acceptable terms, obtain financing for acquisitions on acceptable terms or successfully acquire identified targets. Our failure to achieve consolidation savings, to integrate the acquired businesses and assets into our existing operations successfully or to minimize any unforeseen operational difficulties could have a material adverse effect on our financial condition and results of operations.
In addition, our Revolving Credit Agreement and the indentures governing our senior unsecured notes impose certain limitations on our ability to enter into mergers or combination transactions. Our Revolving Credit Agreement and the indentures governing our senior unsecured notes also limit our ability to incur certain indebtedness, which could indirectly limit our ability to engage in acquisitions.
We are subject to complex U.S. federal, state, local and other laws and regulations related to environmental, occupational, health and safety issues that could adversely affect the cost, manner or feasibility of conducting our operations or expose us to significant liabilities.
Our operations are subject to stringent and complex federal, state and local laws and regulations governing the discharge of materials into the environment, the occupational health and safety aspects of our operations, or otherwise relating to environmental protection. These laws and regulations may impose numerous obligations applicable to our operations including the acquisition of a permit before conducting regulated drilling activities; the restriction of types, quantities and concentration of materials that can be released into the environment; the limitation or prohibition of drilling activities on certain lands lying within wilderness, wetlands and other protected areas; the application of specific health and safety criteria addressing worker protection; and the imposition of substantial liabilities for pollution resulting from our operations. Numerous governmental authorities, such as the EPA and analogous state agencies have the power to enforce compliance with these laws and regulations and the permits issued under them. Such enforcement actions often involve taking difficult and costly compliance measures or corrective actions. Failure to comply with these laws and regulations may result in the assessment of sanctions, including administrative, civil or criminal penalties, the imposition of investigatory or remedial obligations and the issuance of orders limiting or prohibiting some or all of our operations. In addition, we may experience delays in obtaining or be unable to obtain required permits, which may delay or interrupt our operations and limit our growth and revenue. In addition, the trend in environmental regulation is to place more restrictions and limitations on activities that may affect the environment and thus, our costs of compliance may increase if existing laws and regulations are revised or reinterpreted, or if new laws and regulations become applicable to our operations. For example, in June 2016, the EPA finalized rules regarding criteria for aggregating multiple small surface sites into a single source for air-quality permitting purposes applicable to the oil and natural gas industry. This rule could cause small facilities, on an aggregate basis, to be deemed a major source, thereby triggering more stringent air permitting processes and requirements. Failure to comply with laws and regulations applicable to our operations, including any
32
evolving interpretation and enforcement by governmental authorities, could have a material adverse effect on our business, financial condition and results of operations.
Certain environmental laws impose strict as well as joint and several liability for costs required to remediate and restore sites where hazardous substances, hydrocarbons, or solid wastes have been stored or released. We may be required to remediate contaminated properties currently or formerly operated by us or facilities of third parties that received waste generated by our operations regardless of whether such contamination resulted from the conduct of others or from consequences of our own actions that were in compliance with all applicable laws at the time those actions were taken. In addition, claims for damages to persons or property, including natural resources, may result from the environmental, health and safety impacts of our operations. Moreover, public interest in the protection of the environment has increased dramatically in recent years. The trend of more expansive and stringent environmental legislation and regulations applied to the crude oil and natural gas industry could continue, resulting in increased costs of doing business and consequently affecting profitability. To the extent laws are enacted or other governmental action is taken that restricts drilling or imposes more stringent and costly operating, waste handling, disposal and cleanup requirements, our business, prospects, financial condition or results of operations could be materially adversely affected. See "Business—Regulation of the Oil and Natural Gas Industry" for a further description of the laws and regulations that affect us.
Concerns over general economic, business or industry conditions may have a material adverse effect on our results of operations, liquidity and financial condition.
Concerns over global economic conditions, energy costs, geopolitical issues, inflation, the availability and cost of credit, the European, Asian and the United States financial markets have contributed to increased economic uncertainty and diminished expectations for the global economy. In addition, continued hostilities in the Middle East and the occurrence or threat of terrorist attacks in the United States or other countries could adversely affect the global economy. These factors, combined with volatility in commodity prices, business and consumer confidence and unemployment rates, have precipitated an economic slowdown. Concerns about global economic growth have had a significant adverse impact on global financial markets and commodity prices. If the economic climate in the United States or abroad deteriorates, worldwide demand for petroleum products could diminish, which could impact the price at which we can sell our production, affect the ability of our vendors, suppliers and customers to continue operations and ultimately adversely impact our results of operations, liquidity and financial condition.
A downgrade in our credit ratings could negatively impact our cost of and ability to access capital.
As of December 31, 2016, our long-term debt was rated B3 with a stable outlook by Moody’s Investors Service, Inc. ("Moody's") and B+ with a stable outlook by Standard & Poor’s Ratings Services. On February 8, 2017, our long term debt was upgraded by Moody's from B3 to B2. Since this date, no changes in our credit ratings have occurred; however, we cannot be assured that our credit ratings will not be downgraded in the future.
A downgrade in our credit ratings could negatively impact our costs of capital or our ability to effectively execute aspects of our strategy. Further, a downgrade in our credit ratings could affect our ability to raise debt in the public debt markets and the cost of any new debt could be much higher than our outstanding debt. These and other impacts of a downgrade in our credit ratings could have a material adverse effect on our business, financial condition and results of operations.
The unavailability or high cost of additional drilling rigs, equipment, supplies, personnel and oilfield services could adversely affect our ability to execute our exploration and development plans within our budget and on a timely basis.
The demand for qualified and experienced field personnel to drill wells and conduct field operations, geologists, geophysicists, engineers and other professionals in the oil and natural gas industry can fluctuate significantly, often in correlation with oil and natural gas prices, causing periodic shortages. Historically, there have been shortages of drilling and workover rigs, pipe and other equipment as demand for rigs and equipment has increased along with the number of wells being drilled. We cannot predict whether these conditions will exist in the future and, if so, what their timing and duration will be. Such shortages could delay or cause us to incur significant expenditures that are not provided for in our capital budget, which could have a material adverse effect on our business, financial condition or results of operations.
Should we fail to comply with all applicable regulatory agency administered statutes, rules, regulations and orders, we could be subject to substantial penalties and fines.
Under the Domenici-Barton Energy Policy Act of 2005, the FERC has civil penalty authority under the NGA to impose penalties for current violations of up to $1 million per day for each violation and disgorgement of profits associated with any
33
violation. While our operations have not been regulated by FERC as a natural gas company under the NGA, FERC has adopted regulations that may subject certain of our otherwise non-FERC jurisdictional facilities to FERC annual reporting requirements. We also must comply with the anti-market manipulation rules enforced by FERC. Additional rules and legislation pertaining to those and other matters may be considered or adopted by FERC from time to time. Additionally, the FTC has regulations intended to prohibit market manipulation in the petroleum industry with authority to fine violators of the regulations civil penalties of up to $1 million per day and the CFTC prohibits market manipulation in the markets regulated by the CFTC, including similar anti-manipulation authority with respect to crude oil swaps and futures contracts as that granted to the CFTC with respect to crude oil purchases and sales. The CFTC rules subject violators to a civil penalty of up to the greater of $1 million or triple the monetary gain to the person for each violation. Failure to comply with those regulations in the future could subject us to civil penalty liability, as described in "Business—Regulation of the Oil and Natural Gas Industry."
Climate change laws and regulations restricting emissions of greenhouse gases could result in increased operating costs and reduced demand for the oil and natural gas that we produce while potential physical effects of climate change could disrupt our production and cause us to incur significant costs in preparing for or responding to those effects.
In response to findings that emissions of carbon dioxide, methane and other GHGs present an endangerment to public health and the environment, the EPA has adopted regulations under existing provisions of the Clean Air Act that, among other things, establish PSD, construction and Title V operating permit reviews for certain large stationary sources. Facilities required to obtain PSD permits for their GHG emissions also will be required to meet "best available control technology" standards that will be established on a case-by-case basis. EPA rulemakings related to GHG emissions could adversely affect our operations and restrict or delay our ability to obtain air permits for new or modified sources. In addition, the EPA has adopted rules requiring the monitoring and reporting of GHG emissions from specified onshore and offshore oil and natural gas production sources in the United States on an annual basis, which include gathering and boosting facilities as well as completions and workovers from hydraulically fractured oil wells.
Furthermore, in June 2016, the EPA finalized rules that establish new controls for emissions of methane from new, modified or reconstructed sources in the oil and natural gas source category, including production, processing, transmission and storage activities. The rules include first-time standards to address emissions of methane from equipment and processes across the source category, including hydraulically fractured oil and natural gas well completions. Compliance with these rules will require enhanced record-keeping practices, the purchase of new equipment, such as optical gas imaging instruments to detect leaks, and increased frequency of maintenance and repair activities to address emissions leakage. The rules will also likely require additional personnel time to support these activities or the engagement of third party contractors to assist with and verify compliance. These new and proposed rules could result in increased compliance costs on our operations.
While Congress has from time to time considered legislation to reduce emissions of GHGs, there has not been significant activity in the form of adopted legislation to reduce GHG emissions at the federal level in recent years. In the absence of such federal climate legislation, a number of state and regional cap and trade programs have emerged that typically require major sources of GHG emissions, such as electric power plants, to acquire and surrender emission allowances in return for emitting those GHGs. Although it is not possible at this time to predict how legislation or new regulations that may be adopted to address GHG emissions would impact our business, any such future laws and regulations imposing reporting obligations on, or limiting emissions of GHGs from, our equipment and operations could require us to incur costs to reduce emissions of GHGs associated with our operations. In addition, substantial limitations on GHG emissions could adversely affect demand for the oil and natural gas we produce and lower the value of our reserves. Demand for our products may also be adversely affected by conservation plans and efforts undertaken in response to global climate change, including plans developed in connection with the recent Paris climate conference agreement reached in December 2015, which entered into force in November 2016. The United States is one of over 70 nations that has ratified or otherwise indicated its intent to comply with the agreement. However, the agreement is not binding on the United States. Finally, it should be noted that some scientists have concluded that increasing concentrations of GHGs in the Earth’s atmosphere may produce climate changes that have significant physical effects, such as increased frequency and severity of storms, floods, droughts and other extreme climatic events; if any such effects were to occur, they could have an adverse effect on our exploration and production operations.
Federal, state and local legislative and regulatory initiatives relating to hydraulic fracturing as well as governmental reviews of such activities could result in increased costs and additional operating restrictions or delays in the completion of oil and natural gas wells and adversely affect our production.
Hydraulic fracturing is a common industry practice that is used to stimulate production of natural gas and/or oil from dense subsurface rock formations. Hydraulic fracturing involves the injection of water, sand or alternative proppant and chemicals under pressure into target geological formations to fracture the surrounding rock and stimulate production. We regularly use hydraulic fracturing as part of our operations. Recently, there has been increased public concern regarding an
34
alleged potential for hydraulic fracturing to adversely affect drinking water supplies and proposals have been made to enact separate federal, state and local legislation that would increase the regulatory burden imposed on hydraulic fracturing.
At the federal level, the EPA has asserted federal regulatory authority pursuant to the SDWA over certain hydraulic fracturing activities involving the use of diesel fuels and published permitting guidance in February 2014 addressing the performance of such activities. Also, in May 2014, the EPA issued an Advance Notice of Proposed Rulemaking to collect data on chemicals used in hydraulic fracturing operations under Section 8 of the Toxic Substances Control Act. To date, no further action has been taken. Further, the EPA finalized regulations under the CWA in June 2016 prohibiting wastewater discharges from hydraulic fracturing and certain other natural gas operations to publicly owned wastewater treatment plants. Also, in December 2016, the EPA released its final report on the potential impacts of hydraulic fracturing on drinking water resources. The final report concluded that "water cycle" activities associated with hydraulic fracturing may impact drinking water resources "under some circumstances," noting that the following hydraulic fracturing water cycle activities and local- or regional-scale factors are more likely than others to result in more frequent or more severe impacts: water withdrawals for fracturing in times or areas of low water availability; surface spills during the management of fracturing fluids, chemicals or produced water; injection of fracturing fluids into wells with inadequate mechanical integrity; injection of fracturing fluids directly into groundwater resources; discharge of inadequately treated fracturing wastewater to surface waters; and disposal or storage of fracturing wastewater in unlined pits. In addition, the U.S. Department of the Interior finalized rules in March 2015 that impose new or more stringent standards for performing hydraulic fracturing on federal and American Indian lands. The U.S. District Court of Wyoming struck down these rules, but the decision has been appealed to the 10th Circuit Court of Appeals. A final decision has not yet been issued.
At the state level, several states have adopted or are considering legal requirements that could impose more stringent permitting, disclosure and well construction requirements on hydraulic fracturing activities. For example in May 2013, the RRC adopted new rules governing well casing, cementing and other standards for ensuring that hydraulic fracturing operations do not contaminate nearby water resources. Local government also may seek to adopt ordinances within their jurisdictions regulating the time, place and manner of drilling activities in general or hydraulic fracturing activities in particular or prohibit the performance of well drilling in general or hydraulic fracturing in particular. We believe that we follow applicable standard industry practices and legal requirements for groundwater protection in our hydraulic fracturing activities. Nonetheless, if new or more stringent federal, state, or local legal restrictions relating to the hydraulic fracturing process are adopted in areas where we operate, we could incur potentially significant added costs to comply with such requirements, experience delays or curtailment in the pursuit of exploration, development, or production activities and perhaps even be precluded from drilling wells.
Further regulation of hydraulic fracturing at the federal, state and local level could subject our operations to additional permitting requirements and result in permitting delays as well as potential increases in costs. Restrictions on hydraulic fracturing could also reduce the amount of oil and natural gas that we are ultimately able to produce from our reserves. Please read "Item 1. Business—Regulation of the Oil and Natural Gas Industry" for a further description of the laws and regulations that affect us.
Competition in the oil and natural gas industry is intense, making it more difficult for us to acquire properties and market oil or natural gas.
Our ability to acquire additional prospects and to find and develop reserves in the future will depend on our ability to evaluate and select suitable properties and to consummate transactions in a highly competitive environment for acquiring properties, marketing oil and natural gas and securing trained personnel. Also, there is substantial competition for capital available for investment in the oil and natural gas industry. We may not be able to compete successfully in the future in acquiring prospective reserves, developing reserves, marketing hydrocarbons and raising additional capital, which could have a material adverse effect on our business.
We operate in areas of high industry activity, which may affect our ability to hire, train or retain qualified personnel needed to manage and operate our assets.
Our operations and drilling activity are concentrated in the Permian Basin in West Texas, an area in which industry activity has remained relatively steady despite the downturn in commodity prices since 2014. As a result, demand for qualified personnel in this area and the cost to attract and retain such personnel, has continued to be competitive and would be expected to increase substantially in the future if commodity prices rebound. Moreover, our competitors may be able to offer better compensation packages to attract and retain qualified personnel than we are able to offer.
35
Any delay or inability to secure the personnel necessary for us to continue or complete our current and planned development activities could result in oil and natural gas production volumes being below our forecasted volumes. In addition, any such negative effect on production volumes, or significant increases in costs, could have a material adverse effect on our results of operations, liquidity and financial condition.
Declining general economic, business or industry conditions may have a material adverse effect on our results of operations, liquidity and financial condition.
Concerns over global economic conditions, energy costs, geopolitical issues, inflation, the availability and cost of credit and the United States financial market have contributed to increased economic uncertainty and diminished expectations for the global economy. In addition, continued hostilities in the Middle East and the occurrence or threat of terrorist attacks in the United States or other countries could adversely affect the global economy. Concerns about global economic growth have had, and could in the future have, a significant adverse impact on global financial markets and commodity prices. If the economic climate in the United States or abroad deteriorates, worldwide demand for petroleum products could diminish, which could impact the price at which we can sell our production, affect the ability of our vendors, suppliers and customers to continue operations and ultimately adversely impact our results of operations, liquidity and financial condition.
The loss of senior management or technical personnel could adversely affect operations.
We depend on the services of our senior management and technical personnel. We do not maintain, nor do we plan to obtain, any insurance against the loss of any of these individuals. The loss of the services of our senior management or technical personnel could have a material adverse effect on our business, financial condition and results of operations.
We are susceptible to the potential difficulties associated with rapid growth and expansion and have a limited operating history.
We have grown rapidly over the last several years. Our management believes that our future success depends on our ability to manage the rapid growth that we have experienced and the demands from increased responsibility on management personnel. The following factors could present difficulties:
• | increased responsibilities for our executive level personnel; |
• | increased administrative burden; |
• | increased capital requirements; and |
• | increased organizational challenges common to large, expansive operations. |
Our operating results could be adversely affected if we do not successfully manage these potential difficulties. The historical financial information incorporated herein is not necessarily indicative of the results that may be realized in the future. In addition, our operating history is limited and the results from our current producing wells are not necessarily indicative of success from our future drilling operations.
Part of our strategy involves drilling in existing or emerging shale plays using the latest available horizontal drilling and completion techniques, which involve risks and uncertainties in their application.
Our operations involve utilizing the latest drilling and completion techniques as developed by us and our service providers. As of December 31, 2016, we had drilled and completed 142 gross (132.9 net) horizontal wells and therefore are subject to increased risks associated with horizontal drilling as compared to companies that have greater experience in horizontal drilling activities. Risks that we face while drilling include, but are not limited to, failing to land our wellbore in the desired drilling zone, not staying in the desired drilling zone while drilling horizontally through the formation, not running our casing the entire length of the wellbore and not being able to run tools and other equipment consistently through the horizontal wellbore. Risks that we face while completing our wells include, but are not limited to, not being able to fracture stimulate the planned number of stages, not being able to run tools the entire length of the wellbore during completion operations and not successfully cleaning out the wellbore after completion of the final fracture stimulation stage. Ultimately, the success of these drilling and completion techniques can only be evaluated over time as more wells are drilled and production profiles are established over a sufficiently long time period. If our drilling results are less than anticipated or we are unable to execute our drilling program because of capital constraints, lease expirations, access to gathering systems and/or commodity prices decline, the return on our investment in these areas may not be as attractive as we anticipate. Further, as a result of any of these
36
developments we could incur material write-downs of our oil and natural gas properties and the value of our undeveloped acreage could decline in the future.
Increases in interest rates could adversely affect our business.
Our business and operating results can be harmed by factors such as the availability, terms and cost of capital, increases in interest rates or a reduction in our credit rating. These changes could cause our cost of doing business to increase, limit our ability to pursue acquisition opportunities, reduce cash flow used for drilling and place us at a competitive disadvantage. Potential disruptions and volatility in the global financial markets may lead to a contraction in credit availability impacting our ability to finance our operations. We require continued access to capital. A significant reduction in cash flows from operations or the availability of credit could materially and adversely affect our ability to achieve our planned growth and operating results.
Certain U.S. federal income tax deductions currently available with respect to oil and natural gas exploration and development may be eliminated as a result of future legislation.
In recent years, legislation has been proposed that would, if enacted into law, significantly change U.S. tax laws, including certain key U.S. federal income tax provisions currently available to oil and natural gas companies. Such legislative proposals include, but are not limited to: (i) the repeal of the percentage depletion allowance for oil and natural gas properties; (ii) the elimination of current deductions for intangible drilling and development costs; (iii) the elimination of the deduction for certain domestic production activities; and (iv) an extension of the amortization period for certain geological and geophysical expenditures. Congress could consider, and could include, some or all of these proposals as part of tax reform legislation accompanying lower federal income tax rates. Moreover, other more general features of tax reform legislation, including changes to cost recovery rules and to the deductibility of interest expense, may be developed that also would change the taxation of oil and natural gas companies. It is unclear whether these or similar changes will be enacted and, if enacted, how soon any such changes could take effect. The passage of any legislation as a result of these proposals or any similar changes in U.S. federal income tax laws could eliminate or postpone certain tax deductions that currently are available with respect to oil and natural gas exploration and development, or increase costs, and any such changes could have an adverse effect on our financial position, results of operations and cash flows.
Our ability to use our net operating loss carryforwards may be limited.
As of December 31, 2016, we had approximately $126.3 million of U.S. federal net operating loss carryforwards ("NOLs"), which begin to expire in 2034. Utilization of these NOLs depends on many factors, including our future income, which cannot be assured. In addition, Section 382 of the Internal Revenue Code of 1986, as amended ("Section 382"), generally imposes an annual limitation on the amount of NOLs that may be used to offset taxable income when a corporation has undergone an "ownership change" (as determined under Section 382). An ownership change generally occurs if one or more shareholders (or groups of shareholders) who are each deemed to own at least 5% of our stock change their ownership by more than 50 percentage points over their lowest ownership percentage within a rolling three-year period. In the event that an ownership change has occurred, or were to occur, utilization of our NOLs would be subject to an annual limitation under Section 382, determined by multiplying the value of our stock at the time of the ownership change by the applicable long-term tax-exempt rate as defined in Section 382, subject to certain adjustments. Any unused annual limitation may be carried over to later years. We cannot assure you that we will not undergo an ownership change in 2017. However, even if we did have an ownership change, in 2017, we do not believe that the resulting Section 382 annual limitation would prevent our utilization of our NOLs prior to their expiration. Future ownership changes or future regulatory changes could limit our ability to utilize our NOLs. To the extent we are not able to offset our future income with our NOLs, this would adversely affect our operating results and cash flows if we attain profitability.
Our use of 2-D and 3-D seismic data is subject to interpretation and may not accurately identify the presence of oil and natural gas, which could adversely affect the results of our drilling operations.
Even when properly used and interpreted, 2-D and 3-D seismic data and visualization techniques are only tools used to assist geoscientists in identifying subsurface structures and hydrocarbon indicators and do not enable the interpreter to know whether hydrocarbons are, in fact, present in those structures. In addition, the use of 3-D seismic and other advanced technologies requires greater predrilling expenditures than traditional drilling strategies and we could incur losses as a result of such expenditures. As a result, our drilling activities may not be successful or economical.
37
Our operations are substantially dependent on the availability of water. Restrictions on our ability to obtain water may have an adverse effect on our financial condition, results of operations and cash flows.
Water is an essential component of deep shale oil and natural gas production during both the drilling and hydraulic fracturing processes. Historically, we have been able to purchase water from local land owners for use in our operations. However, Texas has endured severe drought conditions during the past several years. These drought conditions have led governmental authorities to restrict the use of water subject to their jurisdiction for hydraulic fracturing to protect local water supplies. If we are unable to obtain water to use in our operations from local sources, we may be unable to produce oil and natural gas economically, which could have an adverse effect on our financial condition, results of operations and cash flows.
Restrictions on drilling activities intended to protect certain species of wildlife may adversely affect our ability to conduct drilling activities areas where we operate.
Oil and natural gas operations in our operating areas may be adversely affected by seasonal or permanent restrictions on drilling activities designed to protect various wildlife. Seasonal restrictions may limit our ability to operate in protected areas and can intensify competition for drilling rigs, oilfield equipment, services, supplies and qualified personnel, which may lead to periodic shortages when drilling is allowed. These constraints and the resulting shortages or high costs could delay our operations or materially increase our operating and capital costs. Permanent restrictions imposed to protect endangered species could prohibit drilling in certain areas or require the implementation of expensive mitigation measures. The designation of previously unprotected species in areas where we operate as threatened or endangered could cause us to incur increased costs arising from species protection measures or could result in limitations on our exploration and production activities that could have a material adverse impact on our ability to develop and produce our reserves.
The enactment of derivatives legislation could have an adverse effect on our ability to use derivative instruments to reduce the effects of commodity price, interest rate and other risks associated with our business.
The Dodd-Frank Act, enacted on July 21, 2010, established federal oversight and regulation of the over-the-counter derivatives market and of entities, such as us, that participate in that market. The Dodd-Frank Act requires the CFTC and the SEC to promulgate rules and regulations implementing the Dodd-Frank Act.
In October 2011, the CFTC issued regulations to set position limits for certain futures and option contracts in the major energy markets and for swaps that are their economic equivalents. The initial position limits rule was vacated by the United States District Court for the District of Columbia in September 2012. However, in November 2013, the CFTC proposed new rules that would place limits on positions in certain core futures and equivalent swaps contracts for or linked to certain physical commodities, subject to exceptions for certain bona fide hedging transactions. As these new position limit rules are not yet final, the impact of those provisions on us is uncertain at this time.
The Dodd-Frank Act and CFTC rules also will require us, in connection with certain derivatives activities, to comply with clearing and trade-execution requirements (or to take steps to qualify for an exemption to such requirements). To date, the CFTC has only designated certain interest rate swaps and credit default swaps for application of such mandatory clearing and trade-execution requirements. Although we expect to qualify for the end-user exception from such requirements for swaps entered to hedge our commercial risks, the application of the mandatory clearing and trade execution requirements to other market participants, such as swap dealers, may change the cost and availability of the swaps that we use for hedging. If our swaps do not qualify for the commercial end-user exception, or if the cost of entering into swaps outside of mandatory clearing becomes prohibitive, we may be required to clear such transactions. The ultimate effect of the rules and any additional regulations on our business is uncertain at this time.
In addition, certain banking regulators and the CFTC have adopted final rules establishing minimum margin requirements for swaps outside of mandatory clearing. Although we expect to qualify for the end-user exception from such margin requirements for swaps entered into to hedge our commercial risks, the application of such requirements to other market participants, such as swap dealers, may change the cost and availability of the swaps that we use for hedging. If any of our swaps do not qualify for the commercial end-user exception, the posting of collateral could reduce our liquidity and cash available for capital expenditures and our ability to manage commodity price volatility and the volatility in cash flows.
It is not possible at this time to predict with certainty the full effects of the Dodd-Frank Act and CFTC rules on us or the timing of such effects. The Dodd-Frank Act and any new regulations could significantly increase the cost of derivatives, materially alter the terms of derivative contracts, reduce the availability of derivatives to protect against risks we encounter and reduce our ability to monetize or restructure our existing derivative contracts. If we reduce our use of derivatives as a result of the Dodd-Frank Act and CFTC rules, our results of operations may become more volatile and our cash flows may be less
38
predictable, which could adversely affect our ability to plan for and fund capital expenditures. Any of these consequences could have a material and adverse effect on us, our financial condition or our results of operations.
In addition, the European Union and other non-U.S. jurisdictions are implementing regulations with respect to the derivatives market. To the extent we transact with counterparties in foreign jurisdictions, we may become subject to such regulations. At this time, the impact of such regulations is not clear.
We may not be able to keep pace with technological developments in our industry.
The oil and natural gas industry is characterized by rapid and significant technological advancements and introductions of new products and services using new technologies. As others use or develop new technologies, we may be placed at a competitive disadvantage or may be forced by competitive pressures to implement those new technologies at substantial costs. In addition, other oil and natural gas companies may have greater financial, technical and personnel resources that allow them to enjoy technological advantages and that may in the future allow them to implement new technologies before we can. We may not be able to respond to these competitive pressures or implement new technologies on a timely basis or at an acceptable cost. If one or more of the technologies we use now or in the future were to become obsolete, our business, financial condition or results of operations could be materially and adversely affected.
Our business could be negatively affected by security threats, including cybersecurity threats and other disruptions.
As an oil and natural gas producer, we face various security threats, including cybersecurity threats to gain unauthorized access to sensitive information or to render data or systems unusable; threats to the security of our facilities and infrastructure or third party facilities and infrastructure, such as processing plants and pipelines; and threats from terrorist acts. The potential for such security threats has subjected our operations to increased risks that could have a material adverse effect on our business. In particular, our implementation of various procedures and controls to monitor and mitigate security threats and to increase security for our information, facilities and infrastructure may result in increased capital and operating costs. Moreover, there can be no assurance that such procedures and controls will be sufficient to prevent security breaches from occurring. If any of these security breaches were to occur, they could lead to losses of sensitive information, critical infrastructure or capabilities essential to our operations and could have a material adverse effect on our reputation, financial position, results of operations or cash flows. Cybersecurity attacks in particular are becoming more sophisticated and include, but are not limited to, malicious software, attempts to gain unauthorized access to data and systems and other electronic security breaches that could lead to disruptions in critical systems, unauthorized release of confidential or otherwise protected information and corruption of data. These events could lead to financial losses from remedial actions, loss of business or potential liability.
We may not consummate the Double Eagle Acquisition.
We may not consummate the Double Eagle Acquisition, which is subject to the satisfaction of customary closing conditions. There can be no assurance that such conditions will be satisfied or that the Double Eagle Acquisition will be consummated.
If the Double Eagle Acquisition is delayed or terminated, the price of our Class A Common Stock may decline to the extent that the current market price of our Class A Common Stock reflects a market assumption that the Double Eagle Acquisition will be consummated on the terms described herein.
If the Double Eagle Acquisition is not consummated, our management will have broad discretion in the application of the net proceeds from the February Offering and the New 2025 Notes Offering in ways that you or other stockholders may not approve, and the market price of our Class A Common Stock could be adversely affected.
If the Double Eagle Acquisition is consummated, we may be unable to successfully integrate Double Eagle’s operations or to realize anticipated cost savings, revenues or other benefits of the Double Eagle Acquisition.
Our ability to achieve the anticipated benefits of the Double Eagle Acquisition, if consummated, will depend in part upon whether we can integrate Double Eagle’s assets and operations into our existing business in an efficient and effective manner. We may not be able to accomplish this integration process successfully. The successful acquisition of producing properties, including those acquired from Double Eagle, requires an assessment of several factors, including:
• | recoverable reserves; |
• | future natural gas and oil prices and their appropriate differentials; |
39
• | availability and cost of transportation of production to markets; |
• | availability and cost of drilling equipment and of skilled personnel; |
• | development and operating costs and potential environmental and other liabilities; and |
• | regulatory, permitting and similar matters. |
The accuracy of these assessments is inherently uncertain. In connection with these assessments, we have performed, and will continue to perform, a review of the subject properties, including properties that are subject to certain customary acreage swaps in process, that we believe to be generally consistent with industry practices. Our review may not reveal all existing or potential problems or permit us to become sufficiently familiar with the properties to fully assess their deficiencies and potential recoverable reserves. Inspections will not always be performed on every well, and environmental problems are not necessarily observable even when an inspection is undertaken. Even if problems are identified, the contractual protection provided with respect to all or a portion of the underlying deficiencies may prove ineffective or insufficient. The integration process may be subject to delays or changed circumstances, and we can give no assurance that the acquired properties will perform in accordance with our expectations or that our expectations with respect to integration or cost savings as a result of the Double Eagle Acquisition will materialize. Significant acquisitions, including the Double Eagle Acquisition, and other strategic transactions may involve other risks that may cause our business to suffer, including:
• | diversion of our management’s attention to evaluating, negotiating and integrating significant acquisitions and strategic transactions; |
• | the challenge and cost of integrating acquired assets and operations with those of ours while carrying on our ongoing business; and |
• | the failure to realize the full benefit that we expect in estimated proved reserves, production volume, cost savings from operating synergies or other benefits anticipated from an acquisition, or to realize these benefits within the expected time frame. |
Risks Related to our Class A Common Stock
We are a holding company. Our sole material asset is our equity interest in Parsley LLC and we are accordingly dependent upon distributions from Parsley LLC to pay taxes, make payments under the TRA and cover our corporate and other overhead expenses.
We are a holding company and have no material assets other than our equity interest in Parsley LLC. We have no independent means of generating revenue. To the extent Parsley LLC has available cash, we intend to cause Parsley LLC to make distributions to its unit holders, including us, in an amount sufficient to cover all applicable taxes at assumed tax rates and payments under the TRA and to reimburse us for our corporate and other overhead expenses. We are limited, however, in our ability to cause Parsley LLC and its subsidiaries to make these and other distributions to us due to the restrictions under our Revolving Credit Agreement and the indentures governing our senior unsecured notes. To the extent that we need funds and Parsley LLC or its subsidiaries are restricted from making such distributions under applicable law or regulation or under the terms of their financing arrangements, or are otherwise unable to provide such funds, it could materially adversely affect our liquidity and financial condition.
Our management collectively holds a significant percentage of the voting power of our common stock.
Holders of our Class A Common Stock and Class B Common Stock will vote together as a single class on all matters presented to our stockholders for their vote or approval, except as otherwise required by applicable law or our certificate of incorporation. As of December 31, 2016, our executive officers hold approximately 20.9% of our outstanding equity interests. The existence of this significant management ownership position may have the effect of deterring hostile takeovers, delaying or preventing changes in control or changes in management, or limiting the ability of our other stockholders to approve transactions that they may deem to be in the best interests of our company.
So long as our management team continues to control a significant percentage of the voting power of our common stock, they will continue to be able to strongly influence all matters requiring stockholder approval, regardless of whether or not other stockholders believe that a potential transaction is in their own best interests. In any of these matters, the interests of our management team may differ or conflict with the interests of our other stockholders.
40
We have engaged in transactions with our affiliates and expect to do so in the future. The terms of such transactions and the resolution of any conflicts that may arise may not always be in our or our stockholders’ best interests.
We have engaged in transactions and expect to continue to engage in transactions with affiliated companies, as described under the caption "Item 13. Certain Relationships and Related Transactions and Director Independence."
Our amended and restated certificate of incorporation and amended and restated bylaws, as well as Delaware law, contain provisions that could discourage acquisition bids or merger proposals, which may adversely affect the market price of our Class A Common Stock.
Our amended and restated certificate of incorporation authorizes our board of directors to issue preferred stock without stockholder approval. If our board of directors elects to issue preferred stock, it could be more difficult for a third party to acquire us. In addition, some provisions of our amended and restated certificate of incorporation and our amended and restated bylaws could make it more difficult for a third party to acquire control of us, even if the change of control would be beneficial to our stockholders, including:
• | limitations on the removal of directors; |
• | limitations on the ability of our stockholders to call special meetings; |
• | providing that the board of directors is expressly authorized to adopt, or to alter or repeal our bylaws; and |
• | establishing advance notice and certain information requirements for nominations for election to our board of directors and for proposing matters that can be acted upon by stockholders at stockholder meetings. |
In addition, certain change of control events have the effect of accelerating any payments due under our Revolving Credit Agreement and the TRA, and could, in certain defined circumstances, accelerate payments required by the indentures governing our senior unsecured notes, which could be substantial and accordingly serve as a disincentive to a potential acquirer of our company. Please see "—In certain cases, payments under the TRA may be accelerated and/or significantly exceed the actual benefits, if any, we realize in respect of the tax attributes subject to the TRA."
Our amended and restated certificate of incorporation designates the Court of Chancery of the State of Delaware as the sole and exclusive forum for certain types of actions and proceedings that may be initiated by our stockholders, which could limit our stockholders’ ability to obtain a favorable judicial forum for disputes with us or our directors, officers, employees or agents.
Our amended and restated certificate of incorporation provides that, unless we consent in writing to the selection of an alternative forum, the Court of Chancery of the State of Delaware will, to the fullest extent permitted by applicable law, be the sole and exclusive forum for (i) any derivative action or proceeding brought on our behalf, (ii) any action asserting a claim of breach of a fiduciary duty owed by any of our directors, officers, employees or agents to us or our stockholders, (iii) any action asserting a claim against us or any director or officer or other employee of ours arising pursuant to any provision of the Delaware General Corporation Law, our amended and restated certificate of incorporation or our bylaws, or (iv) any action asserting a claim against us or any director or officer or other employee of ours that is governed by the internal affairs doctrine, in each such case subject to such Court of Chancery having personal jurisdiction over the indispensable parties named as defendants therein. Any person or entity purchasing or otherwise acquiring any interest in shares of our capital stock will be deemed to have notice of and consented to, the provisions of our amended and restated certificate of incorporation described in the preceding sentence. This choice of forum provision may limit a stockholder’s ability to bring a claim in a judicial forum that it finds favorable for disputes with us or our directors, officers, employees or agents, which may discourage such lawsuits against us and such persons. Alternatively, if a court were to find these provisions of our amended and restated certificate of incorporation inapplicable to, or unenforceable in respect of, one or more of the specified types of actions or proceedings, we may incur additional costs associated with resolving such matters in other jurisdictions, which could adversely affect our business, financial condition or results of operations.
We do not intend to pay dividends on our Class A Common Stock, and our Revolving Credit Agreement and the indentures governing our senior unsecured notes place certain restrictions on our ability to do so. Consequently, your only opportunity to achieve a return on your investment is if the price of our Class A Common Stock appreciates.
We do not plan to declare dividends on shares of our Class A Common Stock in the foreseeable future. Additionally, our Revolving Credit Agreement and the indentures governing our senior unsecured notes place certain restrictions on our ability to pay cash dividends. Consequently, your only opportunity to achieve a return on your investment in us will be if you sell your
41
Class A Common Stock at a price greater than you paid for it. There is no guarantee that the price of our Class A Common Stock that will prevail in the market will ever exceed the price at which you purchased your shares of Class A Common Stock.
Future sales of our Class A Common Stock in the public market, or the perception that such sales may occur, could reduce our stock price, and any additional capital raised by us through the sale of equity or convertible securities may dilute your ownership in us.
We may sell additional shares of Class A Common Stock or securities convertible into shares of our Class A Common Stock in subsequent offerings. We cannot predict the size of future issuances of our Class A Common Stock or securities convertible into Class A Common Stock or the effect, if any, that future issuances and sales of shares of our Class A Common Stock will have on the market price of our Class A Common Stock. Sales of substantial amounts of our Class A Common Stock (including shares issued in connection with an acquisition), or the perception that such sales could occur, may adversely affect prevailing market prices of our Class A Common Stock.
On May 27, 2014, we filed a registration statement with the SEC on Form S-8 providing for the registration of 12,727,273 shares of our Class A Common Stock issued or reserved for issuance under our equity incentive plan. Subject to the satisfaction of vesting conditions, the expiration or waiver of lock-up agreements and the requirements of Rule 144 under the Securities Act, shares registered under the registration statement on Form S-8 are available for resale immediately in the public market without restriction.
On March 11, 2015, we filed a registration statement with the SEC on Form S-1 providing for the registration of 14,885,797 shares of our Class A Common Stock in connection with a private placement of such Class A Common Stock at a price of $15.50 per share to selected institutional investors. On June 5, 2015, we filed an automatically effective registration statement with the SEC on Form S-3 providing for the continued registration of such shares of our Class A Common Stock, which are available for resale immediately in the public market without restriction, as well as the registration of additional shares of our Class A Common Stock and certain other of our securities.
We are required to make payments under the Tax Receivable Agreement for certain tax benefits we may claim, and the amounts of such payments could be significant.
The PE Unit Holders generally have the right to exchange their PE Units (and a corresponding number of shares of Class B Common Stock), for shares of our Class A Common Stock at an exchange ratio of one share of Class A Common Stock for each PE Unit (and a corresponding number of shares of Class B Common Stock) exchanged (subject to conversion rate adjustments for stock splits, stock dividends and reclassifications), or, if either we or Parsley LLC so elects, cash.
We have entered into a Tax Receivable Agreement with Parsley LLC and the PE Unit Holders and certain other holders of equity interests in us. This agreement generally provides for the payment by us to a TRA Holder of 85% of the net cash savings, if any, in U.S. federal, state or local income or franchise tax that we actually realize (or are deemed to realize in certain circumstances) in periods after our IPO as a result of (i) any tax basis increases resulting from the contribution in connection with our IPO by such TRA Holder of all or a portion of its PE Units to us in exchange for shares of Class A Common Stock, (ii) the tax basis increases resulting from the exchange by such TRA Holder of PE Units for shares of Class A Common Stock pursuant to the Exchange Right (or resulting from an exchange of PE Units for cash pursuant to the Cash Option) and (iii) imputed interest deemed to be paid by us as a result of, and additional tax basis arising from, any payments we make under the Tax Receivable Agreement. In addition, payments we make under the Tax Receivable Agreement will be increased by any interest accrued from the due date (without extensions) of the corresponding tax return.
For purposes of the Tax Receivable Agreement, cash savings in tax generally are calculated by comparing our actual tax liability to the amount we would have been required to pay had we not been able to utilize any of the tax benefits subject to the Tax Receivable Agreement. The term of the Tax Receivable Agreement commenced upon the completion of our IPO and will continue until all such tax benefits have been utilized or expired, unless we exercise our right to terminate the Tax Receivable Agreement by making the termination payment specified in the agreement.
The actual increase in tax basis, as well as the amount and timing of any payments under the Tax Receivable Agreement, will vary depending upon a number of factors, including the timing of the exchanges of PE Units, the price of Class A Common Stock at the time of each exchange, the extent to which such exchanges are taxable, the amount and timing of the taxable income we generate in the future and the tax rate then applicable, and the portion of our payments under the Tax Receivable Agreement constituting imputed interest or depletable, depreciable or amortizable basis. We expect that the payments that we will be required to make under the Tax Receivable Agreement, for which we will be dependent on Parsley LLC, could be substantial.
42
The payment obligations under the Tax Receivable Agreement are our obligations and not obligations of Parsley LLC. However, we are a holding company with no independent means of generating revenue. Therefore, to the extent Parsley LLC has available cash, we intend to cause Parsley LLC to make distributions to its unit holders, including us, in an amount sufficient to cover all such obligations. The payments under the Tax Receivable Agreement are not conditioned upon a holder of rights under the Tax Receivable Agreement having a continued ownership interest in us.
In certain cases, payments under the TRA may be accelerated and/or significantly exceed the actual benefits, if any, we realize in respect of the tax attributes subject to the TRA.
If we elect to terminate the TRA early or it is terminated early due to certain mergers or other changes of control or due to a material breach of the TRA, we would be required to make an immediate payment equal to the present value of the anticipated future tax benefits subject to the TRA, for which we would be dependent on Parsley LLC. The calculation of anticipated future tax benefits will be based upon certain assumptions and deemed events as set forth in the TRA, including the assumption that we have sufficient taxable income to fully utilize such benefits and that any PE Units that the PE Unit Holders or their permitted transferees own on the termination date are deemed to be exchanged on the termination date. Any early termination payment may be made significantly in advance of the actual realization, if any, of such future benefits.
In these situations, our obligations under the TRA could have a substantial negative impact on our liquidity and could have the effect of delaying, deferring or preventing certain mergers, asset sales, other forms of business combinations or other changes of control due to the additional transaction costs a potential acquirer may attribute to satisfying such obligations. For example, if the TRA were terminated at December 31, 2016, the estimated termination payment would be approximately $322.3 million (calculated using a discount rate equal to LIBOR, plus 300 basis points, applied against an undiscounted liability of $660.6 million). The foregoing number is merely an estimate and the actual payment could differ materially. There can be no assurance that we will be able to finance our obligations under the TRA.
Payments under the TRA will be based on the tax reporting positions that we will determine. The holders of rights under the TRA will not reimburse us for any payments previously made under the TRA if such basis increases or other benefits are subsequently disallowed, except that excess payments made to any such holder will be netted against payments otherwise to be made, if any, to such holder after our determination of such excess. As a result, in such circumstances, we could make payments that are greater than our actual cash tax savings, if any and may not be able to recoup those payments, which could adversely affect our liquidity.
We may issue preferred stock whose terms could adversely affect the voting power or value of our Class A Common Stock.
Our amended and restated certificate of incorporation authorizes us to issue, without the approval of our stockholders, one or more classes or series of preferred stock having such designations, preferences, limitations and relative rights, including preferences over our Class A Common Stock respecting dividends and distributions, as our board of directors may determine. The terms of one or more classes or series of preferred stock could adversely impact the voting power or value of our Class A Common Stock. For example, we might grant holders of preferred stock the right to elect some number of our directors in all events or on the happening of specified events or the right to veto specified transactions. Similarly, the repurchase or redemption rights or liquidation preferences we might assign to holders of preferred stock could affect the residual value of the Class A Common Stock.
We are subject to certain requirements of Section 404 of the Sarbanes-Oxley Act. If we fail to comply with the requirements of Section 404 or if we or our auditors identify and report material weaknesses in internal control over financial reporting, our investors may lose confidence in our reported information and our stock price may be negatively affected.
As of December 31, 2016, we are required to comply with certain provisions of Section 404 of the Sarbanes-Oxley Act of 2002, or Sarbanes-Oxley Act. Section 404 requires that we document and test our internal control over financial reporting and issue our management’s assessment of our internal control over financial reporting. This section also requires that our independent registered public accounting firm issue an attestation report on such internal control. If we fail to comply with the requirements of Section 404 of the Sarbanes-Oxley Act, or if we or our auditors identify and report material weaknesses in our internal control over financial reporting, the accuracy and timeliness of the filing of our annual and quarterly reports may be materially adversely affected and could cause investors to lose confidence in our reported financial information, which could have a negative effect on the trading price of our Class A Common Stock. In addition, a material weakness in the effectiveness of our internal control over financial reporting could result in an increased chance of fraud and the loss of customers, reduce our ability to obtain financing and require additional expenditures to comply with these requirements, each of which could have a material adverse effect on our business, results of operations and financial condition.
43
ITEM 1B. UNRESOLVED STAFF COMMENTS
None.
44
ITEM 2. PROPERTIES
Our properties are located in the West Texas portion of the Permian Basin. As of December 31, 2016, our acreage position consisted of 138,567 net acres, 95,072 of which are in the Midland Basin and 43,495 of which are in the Delaware Basin, approximately 63% of which is held by production. As of December 31, 2016, we have interests in 166 gross (146.7 net) producing horizontal wells, of which we operate 96% of the net horizontal wells and interests in 704 gross (481.5 net) producing vertical wells, of which we also operate 96% of the vertical wells.
The Permian Basin is an area that extends through multiple counties in Southeast New Mexico and West Texas and covers an area some 250 miles wide and 300 miles long. It is comprised of three main sub-areas, the Delaware Basin, the Central Basin Platform and the Midland Basin. Historically, conventional reservoirs have been targeted and successfully produced in all three sub-areas. Over the past 30 years, there has been an increase in multi-stage fracturing treatments targeting and commingling production from multiple tight, stacked pay, unconventional formations. With the advent of horizontal drilling and the application of multi-stage fracture treatments within one horizontal well bore, activity has increased drastically targeting one unconventional formation at a time for production.
Core Area Descriptions
We group our assets by area based on similar geologic, economic and technical requirements. We split our assets into two areas, the Midland Basin and Southern Delaware Basin.
Midland Basin
Throughout the middle and late Pennsylvanian period, the Midland Basin was a very shallow and generally poorly defined area dominated by marine shale and limestone deposition. Organic content of the marine shale increased as the basin slowly subsided. Tectonic uplift of the Central Basin Platform and the coincident emergence of the Eastern Shelf during the early Permian period brought greater definition to the Midland Basin as a distinct physiographic feature. Slow subsidence and basin filling with organic shale and limestone continued to dominate deposition. During the middle Permian period, more emergent surrounding shelf areas to the northwest and south-southwest contributed thick volumes of clastic sand that molded with the shale and limestone and formed the widespread Spraberry formation throughout the Permian Basin. In the later Permian period, there was basin-wide infilling and subsequent burial with massive evaporate deposition.
The Midland Basin has historically been characterized by production from its most prolific field, the Spraberry Trend Area. The Spraberry Trend Area has been heavily drilled since the discovery of the Seaboard No. 2-D Lee well in Dawson County, Texas in 1949. The field stretches over 150 miles north to south and over 75 miles east to west. Additionally, activity targeting the deeper Wolfcamp formation increased dramatically after Henry Petroleum started drilling fully through the Wolfcamp formation in the early 2000s. In the late 2000s and early 2010s, many operators, including us, had success commingling still deeper production from the Upper Pennsylvanian (Cline), Strawn and Atoka formations. Concurrently, operators started testing zones singularly with horizontal wells and multi-stage treatments. To date, operators have drilled horizontal wells in multiple formations within the Midland Basin.
45
As of December 31, 2016, we have 123,330 gross (95,072 net) acres in our Midland Basin area. Approximately 80% of our acreage in this area is held by production. We have interests in 151 gross (132.4 net) producing horizontal wells in the Midland Basin as of December 31, 2016, and we operate 97% of the wells in the Midland Basin in which we have an interest. We also have interest in 688 gross (465.5 net) producing vertical wells. The table below sets forth our identified drilling locations in the Midland Basin as of December 31, 2016.
Target Horizontal Locations (1) | ||||||
Gross | Net | |||||
Target Horizontal Zone | ||||||
Spraberry (2) | 520 | 393 | ||||
Wolfcamp A | 585 | 476 | ||||
Wolfcamp B (3) | 1,207 | 986 | ||||
Wolfcamp C | 715 | 587 | ||||
Upper Pennsylvanian (Cline) | 715 | 572 | ||||
Lower Pennsylvanian (Atoka ) | 573 | 452 | ||||
Total Target Horizontal Location | 4,315 | 3,466 | ||||
(1) | Our target horizontal location count implies 660’ to 990’ between well spacing, which is equivalent to five to eight wells per 640-acre section per prospective interval. The ultimate spacing may be less than these amounts, which would result in a higher location count, or greater than these amounts, which would result in a lower location count. | |
(2) | Spraberry locations are based on Middle and Upper Spraberry. For the Middle Spraberry, only those locations located in Upton County, Texas are included at 990’ spacing. | |
(3) | Wolfcamp B locations are based on Upper and Lower Wolfcamp B, which implies 660' between well spacing, which is equivalent to eight to 16 wells per 640-acre section per prospective internal. | |
Delaware Basin
From the mid-Pennsylvanian period to the early Permian period, the Delaware Basin was a slowly subsiding area that was characterized by shallow marine shales and limestone. Influxes of clastic sands generally occurred as turbidite deposits formed during periodic sea-level changes. Records indicate a rapid deepening of the Delaware Basin relative to the emergent Central Basin Platform, during the early Permian period. Marine shale deposition continued to dominate the basin during this period. Episodic pulses of carbonate and clastic debris and density flows punctuated the shale deposition and eventually became significant reservoirs. Through the late Permian period, the basin became increasingly more clastic dominated as emergent shelf areas to the north shed sands into the basin.
46
As of December 31, 2016, we have 48,400 gross (43,495 net) acres in our Delaware Basin area. Approximately 19% of our acreage in this area is held by production; however, we hold mineral interests in a significant portion of our Delaware Basin leasehold acreage, which ensures out ability to continue producing from this area. As of December 31, 2016, we have interests in 15 gross (14.3 net) producing horizontal wells in the Delaware Basin, of which we operate 93%. We also have interest in 16 gross (16.0 net) producing vertical wells. The table below sets forth our identified drilling locations in the Delaware Basin as of December 31, 2016.
Target Horizontal Locations | ||||||
Gross | Net | |||||
Target Horizontal Zone | ||||||
2nd Bone Spring (1) | 140 | 131 | ||||
3rd Bone Spring (1) | 140 | 131 | ||||
Wolfcamp Flow Units (2) | 560 | 518 | ||||
Total Target Horizontal Location | 840 | 780 | ||||
(1) | Bone Spring locations are based on 1320’ between well spacing, which is equivalent to four wells per 640-acre section. The ultimate spacing may be less than these amounts, which would result in a higher location count, or greater than these amounts, which would result in a lower location count. | |
(2) | Our target horizontal location count implies 660’ between well spacing, which is equivalent to eight wells per 640-acre section per prospective interval. The ultimate spacing may be less than these amounts, which would result in a higher location count, or greater than these amounts, which would result in a lower location count. | |
Production Status
For the year ended December 31, 2016, our average daily net sales from production from our wells on our Midland Basin acreage, was 36,618 Boe/d, of which 66% was from oil, 16% was from natural gas and 18% was from NGLs. Average daily net sales from production from our wells on our Delaware Basin acreage, was 1,639 Boe/d, of which 88% was from oil, 6% was from natural gas and 6% was from NGLs.
Operational Facilities
Our land-based oil and natural gas processing facilities are typical of those found in the Permian Basin. Our facilities located at well locations or centralized lease locations include storage tank batteries, oil/natural gas/water separation equipment and pumping units. In addition, throughout our acreage, we own and operate facilities with significant water sourcing, transfer and disposal capacity.
Recent Activity
During the year ended December 31, 2016, we spud 92 gross (89.7 net) horizontal wells and four gross (3.9 net) vertical wells on our Midland Basin acreage. We also spud eight gross (7.8 net) horizontal wells on our Delaware Basin acreage.
During the year ended December 31, 2016, we incurred costs of approximately $356.0 million and $3.8 million for horizontal drilling and completions and vertical drilling and completions, respectively, on our Midland Basin acreage. We incurred costs of approximately $39.1 million and $0.6 million for horizontal drilling and completions and vertical drilling and completions, respectively, on our Delaware Basin acreage. We also incurred costs of approximately $96.5 million associated with facilities and infrastructure.
As of December 31, 2016, we have identified 5,155 gross (4,246 net) potential horizontal drilling locations on our existing acreage. The availability of local infrastructure, drilling support assets and other factors as management may deem relevant, such as easement restrictions and state and local regulations, are considered in determining such locations. The drilling locations on which we actually drill wells will ultimately depend upon the availability of capital, regulatory approvals, seasonal restrictions, oil and natural gas prices, costs, actual drilling results and other factors.
47
Production, Price and Cost Data
The following table sets forth information regarding our production of oil, natural gas and NGLs and certain price and cost information, for the periods indicated:
Year ended December 31, | ||||||||||||
2016 | 2015 | 2014 | ||||||||||
Average daily production volume: | ||||||||||||
Oil (Bbls/d) | 25,596 | 13,170 | 7,778 | |||||||||
Natural gas (Mcf/d) | 36,784 | 28,326 | 19,849 | |||||||||
Natural gas liquids (Bbls/d) | 6,530 | 4,110 | 3,123 | |||||||||
Total (Boe/d) | 38,257 | 22,003 | 14,207 | |||||||||
Average realized prices: | ||||||||||||
Oil, without realized derivatives (per Bbls) | $ | 41.34 | $ | 44.89 | $ | 81.91 | ||||||
Oil, with realized derivatives (per Bbls) | 47.56 | 56.60 | 81.33 | |||||||||
Natural gas, without realized derivatives (per Mcf) | 2.30 | 2.57 | 4.23 | |||||||||
Natural gas, with realized derivatives (per Mcf) | 2.30 | 2.72 | 4.32 | |||||||||
Natural gas liquids (per Bbls) | 16.01 | 15.79 | 33.83 | |||||||||
Average price per Boe, without realized derivatives | 32.60 | 33.13 | 58.19 | |||||||||
Average price per Boe, with realized derivatives | 36.76 | 40.33 | 58.00 | |||||||||
Average production costs (per Boe): | ||||||||||||
Lease operating expenses | $ | 4.23 | $ | 7.83 | $ | 7.34 | ||||||
Production and ad valorem taxes: | ||||||||||||
Production | $ | 1.64 | $ | 1.71 | $ | 3.06 | ||||||
Ad valorem | 0.35 | 0.51 | 0.59 | |||||||||
Total | $ | 1.99 | $ | 2.22 | $ | 3.65 | ||||||
Depreciation, depletion and amortization | $ | 16.70 | $ | 22.20 | $ | 18.18 | ||||||
Evaluation and Review of Proved Reserves
Estimates of our proved reserves as of December 31, 2016 were based on evaluations prepared by our internal staff of petroleum engineers and audited by NSAI, with respect to our major properties. We have no oil and natural gas reserves from non-traditional sources. Additionally, we do not provide optional disclosure of probable or possible reserves. Our historical proved reserve estimates as of December 31, 2015 and 2014 were prepared based on reports by NSAI. NSAI does not own an interest in any of our properties, nor is it employed by us on a contingent basis.
Reserve estimation procedures. We maintain an internal staff of petroleum engineers and geoscience professionals (the "Reserves Group") to ensure the integrity, accuracy and timeliness of the data used in our reserves estimation process. We have established internal controls over reserve estimation processes and procedures to support the accurate and timely preparation and disclosure of reserve estimates in accordance with SEC requirements. These controls include oversight of the reserves estimation reporting process by our Vice President—Engineering who reports directly to our President and Chief Operating Officer as well as annual external audits of our proved reserves by NSAI.
The reserve estimates are summarized in reserve reconciliations that quantify reserve changes since the previous year end as revisions of previous estimates, purchases of minerals-in-place, improved recovery, extensions and discoveries, production and sales of minerals-in-place. All reserve estimates, material assumptions and inputs used in reserve estimates and significant changes in reserve estimates are reviewed for engineering and financial appropriateness and compliance with SEC and GAAP standards by the Reserve Group, in consultation with our accounting and financial management personnel. Annually, our President and Chief Operating Officer reviews the reserve estimates and any differences with the reserve auditors on a consolidated basis before these estimates are approved.
Reserve information as well as models used to estimate such reserves are stored on secured databases. Non-technical information used in reserve estimation models, including oil, natural gas and NGLs prices, production costs, transportation
48
costs, future capital expenditures and our net ownership percentages are obtained from other departments. Internally, we conduct testing with respect to such non-technical inputs.
Proved reserves audits. The proved reserve audits performed by NSAI for the year ended December 31, 2016, in the aggregate, represented 100% of our year-end 2016 proved reserves; and 100% of our year-end 2016 associated pre-tax present value of proved reserves discounted at ten percent.
NSAI follows the general principles set forth in the "Standards Pertaining to the Estimating and Auditing of Oil and Gas Reserve Information" promulgated by the Society of Petroleum Engineers (the "SPE"). A reserve audit as defined by the SPE is not the same as a financial audit. The SPE's definition of a reserve audit includes the following concepts:
• | A reserve audit is an examination of reserve information that is conducted for the purpose of expressing an opinion as to whether such reserve information, in the aggregate, is reasonable and has been presented in conformity with the 2007 SPE publication entitled "Standards Pertaining to the Estimating and Auditing of Oil and Gas Reserves Information." |
• | The estimation of reserves is an imprecise science due to the many unknown geologic and reservoir factors that cannot be estimated through sampling techniques. Since reserves are only estimates, they cannot be audited for the purpose of verifying exactness. Instead, reserve information is audited for the purpose of reviewing in sufficient detail the policies, procedures and methods used by a company in estimating its reserves so that the reserve auditors may express an opinion as to whether, in the aggregate, the reserve information furnished by a company is reasonable. |
• | The methods and procedures used by a company and the reserve information furnished by a company, must be reviewed in sufficient detail to permit the reserve auditor, in its professional judgment, to express an opinion as to the reasonableness of the reserve information. The auditing procedures require the reserve auditor to prepare their own estimates of reserve information for the audited properties. |
In conjunction with the audit of our proved reserves and associated pre-tax present value discounted at ten percent, we provided to NSAI its external and internal engineering and geoscience technical data and analyses. NSAI accepted without independent verification the accuracy and completeness of the historical information and data furnished by us with respect to ownership interest, oil and natural gas production, well test data, commodity prices, operating and development costs, and any agreements relating to current and future operations of the properties and sales of production. However, if in the course of its evaluations something came to its attention that brought into question the validity or sufficiency of any such information or data, NSAI did not rely on such information or data until it had satisfactorily resolved its questions relating thereto or had independently verified such information or data.
In the course of its evaluations, NSAI prepared, for all of the audited properties, its own estimates of our proved reserves and the pre-tax present values of such reserves discounted at 10%. NSAI reviewed its audit differences with us, and, as necessary, held meetings with us to review additional reserves work performed by our technical teams and any updated performance data related to the proved reserve differences. Such data was incorporated, as appropriate, by both parties into the proved reserve estimates. NSAI's estimates, including any adjustments resulting from additional data, of those proved reserves and the pre-tax present value of such reserves discounted at 10% did not differ from our estimates by more than 10% in the aggregate. However, when compared on a lease-by-lease basis, some of our estimates were greater than those of the reserve auditors and some were less than the estimates of the reserve auditors. When such differences do not exceed 10% in the aggregate and NSAI is satisfied that the proved reserves and pre-tax present values of such reserves discounted at 10% are reasonable and that its audit objectives have been met, NSAI will issue an unqualified audit opinion. Remaining differences are not resolved due to the limited cost benefit of continuing such analyses. At the conclusion of the audit process, it was NSAI's opinion, as set forth in its audit letter, which is included as an exhibit to this Annual Report, that our estimates of the our proved oil and natural gas reserves and associated pre-tax present values discounted at 10% are, in the aggregate, reasonable and have been prepared in accordance with the "Standards Pertaining to the Estimating and Auditing of Oil and Gas Reserves Information" promulgated by the SPE.
Qualifications of proved reserves preparers and auditors. The Reserves Group is staffed by petroleum and geoscience professionals with extensive industry experience and the process is managed by our Vice President—Engineering, the technical person primarily responsible for overseeing the preparation of all of our reserve estimates. The qualifications of our Vice President—Engineering include over 30 years of reservoir and operations experience. He holds a Bachelor of Science in Petroleum Engineering degree and a graduate certificate in finance. He is also a member of multiple professional industry organizations. Our Vice President—Engineering reports directly to our President and Chief Operating Officer whose qualifications include over 11 years of reservoir and operations experience. He graduated with a Bachelor of Science in
49
Petroleum Engineering and is a member of various professional industry organizations. Our Reserves Group has an average of approximately 14 years of industry experience per person.
Following the preparation of our reserves estimates, these estimates are audited for their reasonableness by NSAI. NSAI provides worldwide petroleum property analysis services for energy clients, financial organizations and government agencies. NSAI was founded in 1961 and performs consulting petroleum engineering services under Texas Board of Professional Engineers Registration No. F-2699. The technical person primarily responsible for auditing our reserves estimates has been a practicing consulting petroleum engineer at NSAI since 1998 and has over 36 years of practical experience in petroleum engineering and meets or exceeds the education, training and experience requirements set forth in the "Standards Pertaining to the Estimating and Auditing of Oil and Gas Reserves Information" promulgated by the board of directors of the SPE.
Estimation of Proved Reserves. Under SEC rules, proved reserves are those quantities of oil and natural gas, which, by analysis of geoscience and engineering data, can be estimated with reasonable certainty to be economically producible—from a given date forward, from known reservoirs and under existing economic conditions, operating methods and government regulations—prior to the time at which contracts providing the right to operate expire, unless evidence indicates that renewal is reasonably certain, regardless of whether deterministic or probabilistic methods are used for the estimation. If deterministic methods are used, the SEC has defined reasonable certainty for proved reserves as a "high degree of confidence that the quantities will be recovered." All of our proved reserves as of December 31, 2016 and 2015 were estimated using a deterministic method. The estimation of reserves involves two distinct determinations. The first determination results in the estimation of the quantities of recoverable oil and natural gas and the second determination results in the estimation of the uncertainty associated with those estimated quantities in accordance with the definitions established under SEC rules. The process of estimating the quantities of recoverable oil and natural gas reserves relies on the use of certain generally accepted analytical procedures. These analytical procedures fall into four broad categories or methods: (1) production performance-based methods; (2) material balance-based methods; (3) volumetric-based methods; and (4) analogy. These methods may be used singularly or in combination by the reserve evaluator in the process of estimating the quantities of reserves. Reserves for proved developed producing wells were estimated using production performance methods for the vast majority of properties. Certain new producing properties with very little production history were forecast using a combination of production performance and analogy to similar production, both of which are considered to provide a relatively high degree of accuracy. Non-producing reserve estimates, for developed and undeveloped properties, were forecast using either volumetric or analogy methods, or a combination of both. These methods provide a relatively high degree of accuracy for predicting proved developed non-producing and proved undeveloped reserves for our properties, due to the mature nature of the properties targeted for development and an abundance of subsurface control data.
To estimate economically recoverable proved reserves and related future net cash flows, NSAI considered many factors and assumptions, including the use of reservoir parameters derived from geological and engineering data which cannot be measured directly, economic criteria based on current costs and the SEC pricing requirements and forecasts of future production rates. The current pricing environment could impact future economics.
Under SEC rules, reasonable certainty can be established using techniques that have been proven effective by actual production from projects in the same reservoir or an analogous reservoir or by other evidence using reliable technology that establishes reasonable certainty. Reliable technology is a grouping of one or more technologies (including computational methods) that has been field tested and has been demonstrated to provide reasonably certain results with consistency and repeatability in the formation being evaluated or in an analogous formation. To establish reasonable certainty with respect to our estimated proved reserves, the technologies and economic data used in the estimation of our proved reserves have been demonstrated to yield results with consistency and repeatability and include production and well test data, downhole completion information, geologic data, electrical logs, radioactivity logs, core analyses, historical well cost and operating expense data.
50
Summary of Oil, Natural Gas and NGLs Reserves. The following table presents our estimated net proved oil, natural gas and NGLs reserves as of the periods indicated:
December 31, | |||||
2016 | 2015 | ||||
Proved developed reserves: | |||||
Oil (MBbls) | 61,133 | 27,628 | |||
Natural gas (MMcf) | 123,946 | 77,612 | |||
Natural gas liquids (MBbls) | 24,306 | 10,890 | |||
Combined (MBoe) | 106,097 | 51,453 | |||
Proved undeveloped reserves: | |||||
Oil (MBbls) | 75,403 | 46,249 | |||
Natural gas (MMcf) | 99,659 | 79,563 | |||
Natural gas liquids (MBbls) | 24,237 | 12,848 | |||
Combined (MBoe) | 116,250 | 72,358 | |||
Proved reserves: | |||||
Oil (MBbls) | 136,536 | 73,877 | |||
Natural gas (MMcf) | 223,605 | 157,175 | |||
Natural gas liquids(MBbls) | 48,543 | 23,738 | |||
Combined (MBoe) | 222,347 | 123,811 | |||
Reserve engineering is and must be recognized as a subjective process of estimating volumes of economically recoverable oil and natural gas that cannot be measured in an exact manner. The accuracy of any reserve estimate is a function of the quality of available data and of engineering and geological interpretation. As a result, the estimates of different engineers often vary. In addition, the results of drilling, testing and production may justify revisions of such estimates. Accordingly, reserve estimates often differ from the quantities of oil and natural gas that are ultimately recovered. Estimates of economically recoverable oil and natural gas and of future net revenues are based on a number of variables and assumptions, all of which may vary from actual results, including geologic interpretation, prices and future production rates and costs. Please read "Item 1A. Risk Factors."
Additional information regarding our proved reserves can be found in the notes to our consolidated financial statements included elsewhere in this Annual Report and the proved reserve report as of December 31, 2016, which is included as an exhibit to this Annual Report.
Proved Undeveloped Reserves (PUDs)
As of December 31, 2016, our proved undeveloped reserves were composed of 75,403 MBbls of oil, 99,659 MMcf of natural gas and 24,237 MBbls of NGLs, for a total of 116,250 MBoe. PUDs will be converted from undeveloped to developed as the applicable wells begin production.
The following table summarizes our changes in PUDs during the year ended December 31, 2016 (in MBoe):
Balance, December 31, 2015 | 72,358 | ||
Purchases of reserves | 15,139 | ||
Divestiture of reserves | (4,455 | ) | |
Extensions and discoveries | 56,652 | ||
Revisions of previous estimates | (16,832 | ) | |
Transfers to proved developed | (6,612 | ) | |
Balance, December 31, 2016 | 116,250 | ||
Extensions and discoveries of 56,652 MBoe during the year ended December 31, 2016 resulted primarily from the drilling of new wells during the year and from new proved undeveloped locations added during the year. Revisions of previous estimates include the removal of 18,352 Mboe for all vertical PUD locations.
51
Costs incurred relating to the development of locations that were classified as PUDs at December 31, 2015 were approximately $53.2 million during the year ended December 31, 2016. Additionally, during 2016, we spent approximately $325.6 million drilling and completing other in-field wells which were not classified as proved as of December 31, 2015. Estimated future development costs relating to the development of PUDs at December 31, 2016 were projected to be approximately $262.9 million in 2017, $223.2 million in 2018, $313.0 million in 2019, $188.5 million in 2020 and $4.6 million in future periods. As we continue to develop our properties and have more well production and completion data, we believe we will continue to realize cost savings and experience lower relative drilling and completion costs as we convert PUDs into proved developed reserves in upcoming years. As of December 31, 2016, all of our PUD drilling locations are scheduled to be drilled within five years of their initial booking.
As of December 31, 2016, 2,839 MBoe of our total proved reserves were classified as proved developed non-producing.
Developed and Undeveloped Acreage
The following tables set forth information as of December 31, 2016 relating to our leasehold acreage.
Developed Acreage (1) | Undeveloped Acreage (2) | Total Acreage | ||||||||||||||||
Area | Gross (3) | Net (4) | Gross (3) | Net (4) | Gross (3) | Net (4) | ||||||||||||
Midland Basin | 98,996 | 76,959 | 24,334 | 18,113 | 123,330 | 95,072 | ||||||||||||
Delaware Basin | 9,294 | 9,214 | 39,106 | 34,281 | 48,400 | 43,495 | ||||||||||||
Total | 108,290 | 86,173 | 63,440 | 52,394 | 171,730 | 138,567 | ||||||||||||
(1) | Developed acreage is acreage spaced or assigned to productive wells and does not include undrilled acreage held by production under the terms of the lease. | |
(2) | Undeveloped acreage is acreage on which wells have not been drilled or completed to a point that would permit the production of commercial quantities of oil or natural gas, regardless of whether such acreage contains proved reserves. | |
(3) | A gross acre is an acre in which a working interest is owned. The number of gross acres is the total number of acres in which a working interest is owned. | |
(4) | A net acre is deemed to exist when the sum of the fractional ownership working interests in gross acres equals one. The number of net acres is the sum of the fractional working interests owned in gross acres expressed as whole numbers and fractions thereof. | |
In addition to the leasehold acreage described above, as of December 31, 2016, we held mineral rights in 33,161 acres, with an average royalty interest of 21%. These mineral rights and associated royalty interests boost net revenue interest in our applicable properties.
Many of the leases comprising the undeveloped acreage set forth in the table above will expire at the end of their respective primary terms unless production from the leasehold acreage has been established prior to such date, in which event the lease will remain in effect until the cessation of production. Most of the leases governing our acreage have continuous development clauses that permit us to continue to hold the acreage under such leases after the expiration of the primary term if we initiate additional development within 60 to 180 days of the expiration date, without the requirement of a lease extension payment. Thereafter, generally the leases are held with additional development every 60 to 180 days until the entire lease is held by production. The following table sets forth the gross and net undeveloped acreage, as of December 31, 2016, that will expire over the next four years unless production is established within the spacing units covering the acreage or the lease is renewed or extended under continuous drilling provisions prior to the primary term expiration dates. There are currently no expirations for the year ended December 31, 2021.
2017 | 2018 | 2019 | 2020 | |||||||||||||||||||||
Gross | Net | Gross | Net | Gross | Net | Gross | Net | |||||||||||||||||
Midland Basin | 8,159 | 6,260 | 11,727 | 9,406 | 3,488 | 2,391 | 960 | 56 | ||||||||||||||||
Delaware Basin | 4,916 | 3,215 | 16,189 | 15,322 | 18,001 | 15,744 | — | — | ||||||||||||||||
Total | 13,075 | 9,475 | 27,916 | 24,728 | 21,489 | 18,135 | 960 | 56 | ||||||||||||||||
52
Drilling Results
The following table sets forth information with respect to the number of wells completed during the periods indicated. The information should not be considered indicative of future performance, nor should it be assumed that there is any correlation between the number of productive wells drilled, quantities of reserves found or economic value. Productive wells are those that produce commercial quantities of hydrocarbons, whether or not they produce a reasonable rate of return.
Year ended December 31, | ||||||||||||||||||
2016 | 2015 | 2014 | ||||||||||||||||
Gross | Net | Gross | Net | Gross | Net | |||||||||||||
Horizontal: | ||||||||||||||||||
Development Wells: | ||||||||||||||||||
Productive (1) | 79 | 76 | 46 | 43 | 22 | 18 | ||||||||||||
Dry holes | — | — | — | — | — | — | ||||||||||||
Exploratory Wells: | ||||||||||||||||||
Productive (1) | — | — | 1 | 1 | — | — | ||||||||||||
Dry holes | — | — | — | — | — | — | ||||||||||||
Vertical: | ||||||||||||||||||
Development Wells: | ||||||||||||||||||
Productive (1) | 4 | 4 | 13 | 13 | 168 | 137 | ||||||||||||
Dry holes | — | — | — | — | — | — | ||||||||||||
Exploratory Wells: | ||||||||||||||||||
Productive (1) | — | — | 1 | 1 | 2 | 2 | ||||||||||||
Dry holes | — | — | — | — | — | — | ||||||||||||
Total: | ||||||||||||||||||
Productive (1) | 83 | 80 | 61 | 58 | 192 | 157 | ||||||||||||
Dry holes | — | — | — | — | — | — | ||||||||||||
83 | 80 | 61 | 58 | 192 | 157 | |||||||||||||
(1) | Although a well may be classified as productive upon completion, future changes in oil and natural gas prices, operating costs and production may result in the well becoming uneconomical, particularly exploratory wells for which there is no production history. | |
As of December 31, 2016, we had nine gross (nine net) horizontal wells in the process of being drilled, six gross (six net) horizontal wells awaiting hydraulic fracturing procedures and two gross (two net) horizontal wells in the process of being completed that are not reflected in the above table.
Title to Properties
As is customary in the oil and natural gas industry, when we acquire leasehold acreage, we conduct title due diligence on the subject properties but may not have title opinions covering the properties prior to entering into a purchase and sale agreement. At such time as we determine to conduct drilling operations on those properties, we conduct a thorough title examination and perform curative work with respect to significant defects prior to commencement of drilling operations. To the extent title opinions or other investigations completed after the closing of an acquisition reflect title defects on those properties, we are typically responsible for curing any title defects at our expense. We generally will not commence drilling operations on a property until we have cured any material title defects on such property. We have obtained title opinions on substantially all of our producing properties and believe that we have satisfactory title to our producing properties in accordance with standards generally accepted in the oil and natural gas industry.
53
Prior to completing an acquisition of producing oil and natural gas leases, we perform title reviews on the most significant leases and, depending on the materiality of properties, we may obtain a title opinion, obtain an updated title review or opinion or review previously obtained title opinions. Our oil and natural gas properties are subject to customary royalty and other interests, liens for current taxes and other burdens which we believe do not materially interfere with our use of or affect the carrying value of the properties.
We believe that we have satisfactory title to all of our material assets. Although title to these properties is subject to encumbrances in some cases, such as customary interests generally retained in connection with the acquisition of real property, customary royalty interests and contract terms and restrictions, liens under operating agreements, liens related to environmental liabilities associated with historical operations, liens for current taxes and other burdens, easements, restrictions and minor encumbrances customary in the oil and natural gas industry, we believe that none of these liens, restrictions, easements, burdens and encumbrances will materially detract from the value of these properties or from our interest in these properties or materially interfere with our use of these properties in the operation of our business. In addition, we believe that we have obtained sufficient rights-of-way grants and permits from public authorities and private parties for us to operate our business in all material respects as described in this Annual Report.
Facilities
As of December 31, 2016, we leased corporate office space in Austin, Texas at 303 Colorado St., where our corporate headquarters is located. We also lease corporate office space in Midland, Texas and own field operation facilities in Midland and Fort Stockton, Texas. We believe that our facilities are adequate for our current operations.
ITEM 3. LEGAL PROCEEDINGS
From time to time, we are a party to ongoing legal proceedings in the ordinary course of business, including workers’ compensation claims and employment-related disputes. We do not believe the results of these proceedings, individually or in the aggregate, will have a material adverse effect on our business, financial condition, results of operations, or liquidity.
ITEM 4. MINE SAFETY DISCLOSURES
Not applicable.
54
PART II
ITEM 5. MARKET FOR REGISTRANT’S COMMON EQUITY, RELATED STOCKHOLDER MATTERS AND ISSUER PURCHASES OF EQUITY SECURITIES
Our Class A Common Stock began trading on the NYSE under the symbol "PE" on May 29, 2014. Prior to that, there was no public market for our Class A Common Stock. The following table sets forth high and low sales prices of our Class A Common Stock for the periods indicated:
2016 | 2015 | ||||||||||||||
Price Range | Price Range | ||||||||||||||
High | Low | High | Low | ||||||||||||
Fourth Quarter | $ | 38.27 | $ | 32.52 | $ | 19.82 | $ | 15.29 | |||||||
Third Quarter | $ | 34.86 | $ | 26.72 | $ | 17.42 | $ | 13.72 | |||||||
Second Quarter | $ | 27.62 | $ | 21.76 | $ | 18.87 | $ | 15.92 | |||||||
First Quarter | $ | 22.82 | $ | 15.66 | $ | 18.29 | $ | 13.50 | |||||||
On February 24, 2017, the closing sales price of our Class A Common Stock as reported by the NYSE was $29.49 per share and we had approximately 30 holders of record of our Class A Common Stock. This number does not include owners for whom shares of our Class A Common Stock may be held in "street" name.
There is no public market for our Class B Common Stock. On February 24, 2017, we had approximately 10 holders of record of our Class B Common Stock.
Dividends
We have never declared or paid any cash dividends to holders of our Class A Common Stock or Class B Common Stock. We currently intend to retain all available funds, if any, to finance the expansion of our business. Our future dividend policy is within the discretion of our Board of Directors and will depend upon various factors, including our results of operations, financial condition, capital requirements and investment opportunities. In addition, our debt agreements restrict our ability to pay cash dividends to holders of our Class A Common Stock or Class B Common Stock.
Purchases of Equity Securities by the Issuer and Affiliated Purchasers
We did not repurchase any shares of our Class A Common Stock during the quarter ended December 31, 2016.
Sales of Unregistered Equity Securities
We did not have any sales of unregistered equity securities during the fiscal year ended December 31, 2016.
55
ITEM 6. SELECTED FINANCIAL DATA
The following tables show selected historical financial data for the periods and as of the periods indicated. For the year ended December 31, 2014, the financial statements are consolidated and for all prior years the financial statements are consolidated and combined. The following selected financial and operating data should be read in conjunction with "Item 7. Management’s Discussion and Analysis of Financial Condition and Results of Operations" and "Item 8. Financial Statements and Supplementary Data":
Year ended December 31, | ||||||||||||||||||||
2016 | 2015 | 2014 | 2013 | 2012 | ||||||||||||||||
(in thousands, except per share unit data) | ||||||||||||||||||||
REVENUES | ||||||||||||||||||||
Oil sales | $ | 387,303 | $ | 215,795 | $ | 232,554 | $ | 97,839 | $ | 30,443 | ||||||||||
Natural gas sales | 30,928 | 26,582 | 30,642 | 23,179 | 7,236 | |||||||||||||||
Natural gas liquids sales | 38,273 | 23,680 | 38,561 | — | — | |||||||||||||||
Other | 1,269 | 417 | 672 | 91 | 39 | |||||||||||||||
Total revenues | 457,773 | 266,474 | 302,429 | 121,109 | 37,718 | |||||||||||||||
OPERATING EXPENSES | ||||||||||||||||||||
Lease operating expenses | 59,293 | 62,913 | 38,071 | 16,572 | 4,646 | |||||||||||||||
Production and ad valorem taxes | 27,916 | 17,800 | 18,941 | 7,081 | 2,412 | |||||||||||||||
Depreciation, depletion and amortization | 233,766 | 178,281 | 94,297 | 28,152 | 6,406 | |||||||||||||||
General and administrative expenses | 84,591 | 55,294 | 87,949 | 16,553 | 3,658 | |||||||||||||||
Exploration costs | 13,931 | 13,865 | 3,136 | — | — | |||||||||||||||
Impairment | — | 950 | — | — | — | |||||||||||||||
Acquisition costs | 1,081 | — | 2,527 | — | — | |||||||||||||||
Accretion of asset retirement obligations | 732 | 826 | 512 | 181 | 66 | |||||||||||||||
Rig termination costs | — | 8,970 | 765 | — | — | |||||||||||||||
Other operating expenses | 5,316 | 1,696 | — | — | — | |||||||||||||||
Total operating expenses | 426,626 | 340,595 | 246,198 | 68,539 | 17,188 | |||||||||||||||
OPERATING INCOME (LOSS) | 31,147 | (74,121 | ) | 56,231 | 52,570 | 20,530 | ||||||||||||||
OTHER (EXPENSE) INCOME | ||||||||||||||||||||
Interest expense, net | (55,233 | ) | (45,553 | ) | (39,624 | ) | (13,771 | ) | (6,295 | ) | ||||||||||
(Loss) gain on sale of property | (119 | ) | (34,374 | ) | (2,097 | ) | 36 | 7,819 | ||||||||||||
Prepayment premium on extinguishment of debt | (36,335 | ) | — | (5,107 | ) | — | (6,597 | ) | ||||||||||||
Derivative (loss) gain | (50,835 | ) | 60,818 | 83,858 | (9,800 | ) | (2,190 | ) | ||||||||||||
Other income (expense) | 5,034 | (3,556 | ) | (71 | ) | 381 | 186 | |||||||||||||
Total other (expense) income, net | (137,488 | ) | (22,665 | ) | 36,959 | (23,154 | ) | (7,077 | ) | |||||||||||
(LOSS) INCOME BEFORE INCOME TAXES | (106,341 | ) | (96,786 | ) | 93,190 | 29,416 | 13,453 | |||||||||||||
INCOME TAX BENEFIT (EXPENSE) (1) | 17,424 | 23,755 | (36,468 | ) | (1,906 | ) | (554 | ) | ||||||||||||
NET (LOSS) INCOME | (88,917 | ) | (73,031 | ) | 56,722 | 27,510 | 12,899 | |||||||||||||
LESS: NET LOSS (INCOME) ATTRIBUTABLE TO NONCONTROLLING INTERESTS | 14,735 | 22,547 | (33,293 | ) | — | — | ||||||||||||||
NET (LOSS) INCOME ATTRIBUTABLE TO PARSLEY ENERGY, INC. STOCKHOLDERS | $ | (74,182 | ) | $ | (50,484 | ) | $ | 23,429 | $ | 27,510 | $ | 12,899 | ||||||||
Net (loss) income per common share: | ||||||||||||||||||||
Basic | $ | (0.46 | ) | $ | (0.45 | ) | $ | 0.65 | ||||||||||||
Diluted | $ | (0.46 | ) | $ | (0.45 | ) | $ | 0.65 | ||||||||||||
Weighted average common shares outstanding: | ||||||||||||||||||||
Basic | 161,793 | 111,271 | 93,168 | |||||||||||||||||
Diluted | 161,793 | 111,271 | 93,271 | |||||||||||||||||
(1) | Parsley Energy, Inc. is a subchapter C corporation ("C-Corp") under the Internal Revenue Code of 1986, as amended and is subject to federal and State of Texas income taxes. Our predecessor, Parsley LLC was not subject to U.S. federal income taxes. As a result, the consolidated net income in our historical financial statements for periods prior to our May 29, 2014 IPO does not reflect the tax expense we would have incurred as a C-Corp during such periods. | |
56
Year ended December 31, | ||||||||||||||||||||
2016 | 2015 | 2014 | 2013 | 2012 | ||||||||||||||||
(in thousands, except per share unit data) | ||||||||||||||||||||
Production | ||||||||||||||||||||
Oil (MBbls) | 9,368 | 4,807 | 2,839 | 1,049 | 356 | |||||||||||||||
Natural gas (MMcf) | 13,463 | 10,339 | 7,245 | 4,680 | 1,493 | |||||||||||||||
Natural gas liquids (MBbls) (1) | 2,390 | 1,500 | 1,140 | — | — | |||||||||||||||
Combined (MBoe) | 14,002 | 8,031 | 5,186 | 1,829 | 604 | |||||||||||||||
Average daily production volume: | ||||||||||||||||||||
Oil (Bbls/d) | 25,596 | 13,170 | 7,778 | 2,874 | 972 | |||||||||||||||
Natural gas (Mcf/d) | 36,784 | 28,326 | 19,849 | 12,822 | 4,079 | |||||||||||||||
Natural gas liquids (MBbls) (1) | 6,530 | 4,110 | 3,123 | — | — | |||||||||||||||
Total (Boe/d) | 38,257 | 22,003 | 14,207 | 5,011 | 1,652 | |||||||||||||||
Average realized prices: | ||||||||||||||||||||
Oil sales, without realized derivatives (per Bbls) | $ | 41.34 | $ | 44.89 | $ | 81.91 | $ | 93.28 | $ | 85.60 | ||||||||||
Oil sales, with realized derivatives (per Bbls) | 47.56 | 56.60 | 81.33 | 87.91 | 83.08 | |||||||||||||||
Natural gas, without realized derivatives (per Mcf) | 2.30 | 2.57 | 4.23 | 4.95 | 4.85 | |||||||||||||||
Natural gas, with realized derivatives (per Mcf) | 2.30 | 2.72 | 4.32 | 4.95 | 4.85 | |||||||||||||||
NGLs sales (MBbls) (1) | 16.01 | 15.79 | 33.83 | — | — | |||||||||||||||
Average price per Boe, without realized derivatives | 32.60 | 33.13 | 58.19 | 66.17 | 62.33 | |||||||||||||||
Average price per Boe, with realized derivatives | 36.76 | 40.33 | 58.00 | 63.09 | 60.85 | |||||||||||||||
Expense per Boe: | ||||||||||||||||||||
Lease operating expenses | $ | 4.23 | $ | 7.83 | $ | 7.34 | $ | 9.06 | $ | 7.69 | ||||||||||
Production and ad valorem taxes | 1.99 | 2.22 | 3.65 | 3.87 | 3.99 | |||||||||||||||
Depreciation, depletion and amortization | 16.70 | 22.20 | 18.18 | 15.39 | 10.60 | |||||||||||||||
General and administrative expenses | 6.04 | 6.89 | 16.96 | 9.05 | 6.00 | |||||||||||||||
Exploration costs | 0.99 | 1.73 | 0.60 | — | — | |||||||||||||||
Impairment | — | 0.12 | — | — | — | |||||||||||||||
Acquisition costs | 0.08 | — | 0.49 | — | — | |||||||||||||||
Accretion of asset retirement obligations | 0.05 | 0.10 | 0.10 | 0.10 | 0.11 | |||||||||||||||
Rig termination costs | — | 1.12 | 0.15 | — | — | |||||||||||||||
Other operating expenses | 0.38 | 0.21 | — | — | — | |||||||||||||||
Total operating expenses per Boe | $ | 30.46 | $ | 42.42 | $ | 47.47 | $ | 37.47 | $ | 28.39 | ||||||||||
Consolidated statements of cash flows data: | ||||||||||||||||||||
Net cash provided by (used in): | ||||||||||||||||||||
Operating activities | $ | 228,191 | $ | 172,290 | $ | 190,090 | $ | 53,235 | $ | 5,025 | ||||||||||
Investing activities | (1,885,366 | ) | (427,165 | ) | (1,247,677 | ) | (425,611 | ) | (89,539 | ) | ||||||||||
Financing activities | 1,447,470 | 547,409 | 1,088,744 | 378,096 | 74,245 | |||||||||||||||
Proved reserves: | ||||||||||||||||||||
Oil (MBbls) | 136,536 | 73,877 | 47,617 | 29,507 | 12,987 | |||||||||||||||
Natural gas (MMcf) | 48,543 | 23,738 | 22,667 | 77,818 | 30,214 | |||||||||||||||
NGLs (MBbls) | 223,605 | 157,175 | 123,645 | 12,357 | 4,732 | |||||||||||||||
Combined (MBoe) | 222,347 | 123,811 | 90,891 | 54,834 | 22,755 | |||||||||||||||
Consolidated balance sheet data: | ||||||||||||||||||||
Cash and cash equivalents | $ | 133,379 | $ | 343,084 | $ | 50,550 | $ | 19,393 | $ | 13,673 | ||||||||||
Total assets | 3,938,782 | 2,505,100 | 2,040,490 | 742,407 | 180,404 | |||||||||||||||
Long-term debt | 1,041,324 | 546,832 | 666,257 | 429,822 | 118,828 | |||||||||||||||
Total equity | 2,430,306 | 1,586,641 | 992,489 | 108,032 | 6,017 | |||||||||||||||
Other financial data: | ||||||||||||||||||||
Adjusted EBITDAX (2) | 349,409 | 195,357 | 207,077 | 76,885 | 26,291 | |||||||||||||||
(1) | For the years ended December 31, 2013 and 2012, NGLs production volumes and realized sales prices are included in the natural gas line item. | |
(2) | Adjusted EBITDAX is a non-GAAP financial measure. For a definition of Adjusted EBITDAX and a reconciliation to our most directly comparable financial measures calculated and presented in accordance with GAAP, please read "— Non-GAAP Financial Measures." | |
57
Non-GAAP Financial Measures
Adjusted EBITDAX
Adjusted EBITDAX is not a measure of net income as determined by GAAP. Adjusted EBITDAX is a supplemental non-GAAP financial measure that is used by management and external users of our consolidated financial statements, such as industry analysts, investors, lenders and rating agencies. We define Adjusted EBITDAX as net (loss) income before depreciation, depletion and amortization ("DD&A"), exploration costs, net interest expense, income tax (benefit) expense, stock-based compensation, impairment, acquisition costs, asset retirement obligation accretion expense, rig termination costs, loss (gain) on sales of oil and natural gas properties, prepayment premium on extinguishment of debt, (gain) loss on derivative instruments, net settlements on derivative instruments, premium realization on options that settled during the period, inventory write down and deferred tax asset valuation.
Management believes Adjusted EBITDAX is useful because it allows them to more effectively evaluate our operating performance and compare the results of our operations from period to period without regard to our financing methods or capital structure. We exclude the items listed above from net income in arriving at Adjusted EBITDAX because these amounts can vary substantially from company to company within our industry depending upon accounting methods and book values of assets, capital structures and the method by which the assets were acquired. Adjusted EBITDAX should not be considered as an alternative to, or more meaningful than, net income as determined in accordance with GAAP or as an indicator of our operating performance or liquidity. Certain items excluded from Adjusted EBITDAX are significant components in understanding and assessing a company’s financial performance, such as a company’s cost of capital and tax structure, as well as the historic costs of depreciable assets, none of which are components of Adjusted EBITDAX. Our computations of Adjusted EBITDAX may not be comparable to other similarly titled measure of other companies. We believe that Adjusted EBITDAX is a widely followed measure of operating performance and may also be used by investors to measure our ability to meet debt service requirements.
The following table presents a reconciliation of Adjusted EBITDAX to the GAAP financial measure of net income for each of the periods indicated.
Year Ended December 31, | ||||||||||||||||||||
2016 | 2015 | 2014 | 2013 | 2012 | ||||||||||||||||
(in thousands) | ||||||||||||||||||||
Adjusted EBITDAX reconciliation to net (loss) income: | ||||||||||||||||||||
Net (loss) income attributable to Parsley Energy, Inc. stockholders' | $ | (74,182 | ) | $ | (50,484 | ) | $ | 23,429 | $ | 27,510 | $ | 12,899 | ||||||||
Net (loss) income attributable to noncontrolling interests | (14,735 | ) | (22,547 | ) | 33,293 | — | — | |||||||||||||
Depreciation, depletion and amortization | 233,766 | 178,281 | 94,297 | 28,152 | 6,406 | |||||||||||||||
Exploration costs | 13,931 | 13,865 | 3,136 | — | — | |||||||||||||||
Interest expense, net | 55,233 | 45,553 | 39,624 | 13,771 | 6,295 | |||||||||||||||
Income tax (benefit) expense | (17,424 | ) | (23,755 | ) | 36,468 | 1,906 | 554 | |||||||||||||
EBITDAX | 196,589 | 140,913 | 230,247 | 71,339 | 26,154 | |||||||||||||||
Stock-based compensation | 12,871 | 8,133 | 53,297 | 1,233 | — | |||||||||||||||
Impairment | — | 950 | — | — | — | |||||||||||||||
Acquisition costs | 1,081 | — | 2,527 | — | — | |||||||||||||||
Accretion of asset retirement obligations | 732 | 826 | 512 | 181 | 66 | |||||||||||||||
Rig termination costs | — | 8,970 | 765 | — | — | |||||||||||||||
Loss (gain) on sales of oil and natural gas properties | 119 | 34,374 | 2,097 | (36 | ) | (7,819 | ) | |||||||||||||
Prepayment premium on extinguishment of debt | 36,335 | — | 5,107 | — | 6,597 | |||||||||||||||
Derivative loss (gain) | 50,835 | (60,818 | ) | (83,858 | ) | 9,800 | 2,190 | |||||||||||||
Net settlements on derivative instruments | 26,441 | 46,456 | 3,311 | (198 | ) | 179 | ||||||||||||||
Premium realization on options that settled during the period | 31,757 | 11,406 | (6,928 | ) | (5,434 | ) | (1,076 | ) | ||||||||||||
Inventory write down | — | 4,147 | — | — | — | |||||||||||||||
Deferred tax asset valuation | (7,351 | ) | — | — | — | — | ||||||||||||||
Adjusted EBITDAX | $ | 349,409 | $ | 195,357 | $ | 207,077 | $ | 76,885 | $ | 26,291 | ||||||||||
58
PV-10
The following table provides a reconciliation of PV-10 to the GAAP financial measure of Standardized Measure as of December 31, 2016:
As of December 31, 2016 | |||
(in millions) | |||
PV-10 of proved reserves | $ | 1,483.1 | |
Present value of future income tax discounted at 10% | (298.8 | ) | |
Standardized Measure | $ | 1,184.3 | |
59
ITEM 7. MANAGEMENT’S DISCUSSION AND ANALYSIS OF FINANCIAL CONDITION AND RESULTS OF OPERATIONS
The following discussion and analysis should be read in conjunction with our consolidated financial statements and related notes appearing in "Item 8. Financial Statements and Supplementary Data." The following discussion contains forward-looking statements that reflect our future plans, estimates, beliefs and expected performance. The forward-looking statements are dependent upon events, risks and uncertainties that may be outside our control. Our actual results could differ materially from those discussed in these forward-looking statements. Factors that could cause or contribute to such differences include, but are not limited to, market prices for oil and natural gas, production volumes, estimates of proved reserves, capital expenditures, economic and competitive conditions, regulatory changes and other uncertainties, as well as those factors discussed below and elsewhere in this Annual Report, particularly in "Item 1A. Risk Factors" and "Cautionary Note Regarding Forward-Looking Statements," all of which are difficult to predict. In light of these risks, uncertainties and assumptions, the forward-looking events discussed may not occur. We do not undertake any obligation to publicly update any forward-looking statements except as otherwise required by applicable law.
Overview
Parsley Energy, Inc. was formed in December 2013. We are a holding company whose sole material asset consists of 179,590,617 PE Units as of December 31, 2016. We are the managing member of Parsley LLC and are responsible for all operational, management and administrative decisions of Parsley LLC, and we consolidate the financial results of Parsley LLC and its subsidiaries.
We are an independent oil and natural gas company focused on the acquisition and development of unconventional oil and natural gas reserves in the Permian Basin. Our properties are located in the Midland and Delaware Basins, where we focus predominately on horizontal development drilling and expect to target various stacked pay intervals in the Spraberry, Wolfcamp, Upper Pennsylvanian (Cline) and Atoka shales.
Our Properties
At December 31, 2016, our acreage position was 171,730 gross (138,567 net) acres which includes 123,330 gross (95,072 net) acres in the Midland Basin and 48,400 gross (43,495 net) acres in the Delaware Basin. The majority of our identified horizontal drilling locations are located in Upton, Reagan, Midland and Glasscock Counties, Texas, in the Midland Basin, and Pecos and Reeves Counties, Texas, in the Delaware Basin. As of December 31, 2016, we operated 675 (477.7 net vertical wells across our acreage. Since commencing our horizontal drilling program in 2013 through December 31, 2016, we have drilled and completed 136 gross (127.1 net) horizontal wells in the Midland Basin, of which 70 gross (67.8 net) were completed during 2016. We have also drilled and completed six gross (5.8 net) horizontal wells in the Delaware Basin, of which 5 gross (4.8 net) were completed during 2016. As of December 31, 2016, we operated 160 gross (145.9 net) horizontal wells, of which 146 gross (132.1 net) are located in the Midland Basin and 14 gross (13.8 net) are located in the Delaware Basin. As of December 31, 2016, we had working interests in 870 gross (628.3 net) producing wells across our properties and operated 96.0% of the wells in which we had an interest.
How We Evaluate Our Operations
We use a variety of financial and operational metrics to assess the performance of our oil and natural gas operations, including:
• | production volumes; |
• | realized prices on the sale of oil, natural gas and NGLs, including the effect of our commodity derivative contracts; |
• | lease operating expenses; |
• | capital expenditures; |
• | completion activities; and |
• | certain unit costs. |
Sources of Our Revenues
Our production revenues are derived from the sale of our oil and natural gas production, as well as the sale of NGLs that are extracted from our natural gas during processing. Our oil, natural gas and NGLs revenues do not include the effects of
60
derivatives. For the years ended December 31, 2016, 2015 and 2014, our production revenues were derived 85%, 81% and 77%, respectively, from oil sales; 7%, 10% and 10%, respectively, from natural gas sales; and 8%, 9% and 13%, respectively, from NGLs sales. Our production revenues may vary significantly from period to period as a result of changes in volumes of production sold or changes in commodity prices.
Other revenues include fees charged by our subsidiaries, Pacesetter Drilling, LLC ("Pacesetter") and Parsley Minerals, LLC ("Minerals LLC"), to third parties for drilling services and surface use in the normal course of business.
Production Volumes
The following table presents historical production volumes for our properties for the years ended December 31, 2016, 2015 and 2014.
Year Ended December 31, | |||||||||
2016 | 2015 | 2014 | |||||||
Oil (MBbls) | 9,368 | 4,807 | 2,839 | ||||||
Natural gas (MMcf) | 13,463 | 10,339 | 7,245 | ||||||
Natural gas liquids (MBbls) | 2,390 | 1,500 | 1,140 | ||||||
Total (MBoe) | 14,002 | 8,031 | 5,186 | ||||||
Average net production (Boe/d) | 38,257 | 22,003 | 14,207 | ||||||
Production Volumes Directly Impact Our Results of Operations
As reservoir pressures decline, production from a given well or formation decreases. Growth in our future production and reserves will depend on our ability to continue to add proved reserves in excess of our production. Accordingly, we plan to maintain our focus on adding reserves through the development of our properties as well as acquisitions. Our ability to add reserves through development projects and acquisitions is dependent on many factors, including our ability to raise capital, obtain regulatory approvals, procure contract drilling rigs and personnel and successfully identify and consummate acquisitions. Please read "Item 1A. Risk Factors—Risks Related to the Oil and Natural Gas Industry and Our Business" for a discussion of these and other risks affecting our proved reserves and production.
Realized Prices on the Sale of Oil, Natural Gas and NGLs
Historically, oil, natural gas and NGLs prices have been extremely volatile, and we expect this volatility to continue. Because our production consists primarily of oil, our production revenues are more sensitive to price fluctuations in the price of oil than they are to fluctuations in natural gas or NGLs prices.
The following table provides the high and low prices for NYMEX WTI and NYMEX Henry Hub prompt month contract prices and our differentials to the average of those benchmark prices for the periods indicated.
Year Ended December 31, | |||||||||||
2016 | 2015 | 2014 | |||||||||
Oil | |||||||||||
NYMEX WTI High | $ | 54.06 | $ | 61.43 | $ | 107.26 | |||||
NYMEX WTI Low | $ | 26.21 | $ | 34.73 | $ | 53.27 | |||||
Differential to Average NYMEX WTI | $ | 1.20 | $ | (3.19 | ) | $ | 1.65 | ||||
Natural Gas | |||||||||||
NYMEX Henry Hub High | $ | 3.93 | $ | 3.23 | $ | 6.15 | |||||
NYMEX Henry Hub Low | $ | 1.64 | $ | 1.76 | $ | 2.89 | |||||
Differential to Average NYMEX Henry Hub | $ | (0.49 | ) | $ | 0.07 | $ | (0.29 | ) | |||
NGLs | |||||||||||
NYMEX WTI High | $ | 54.06 | $ | 61.43 | $ | 107.26 | |||||
NYMEX WTI Low | $ | 26.21 | $ | 34.73 | $ | 53.27 | |||||
Differential to Average NYMEX WTI | $ | (24.13 | ) | $ | (32.29 | ) | $ | (46.44 | ) | ||
61
To achieve more predictable cash flow and to reduce our exposure to adverse fluctuations in commodity prices, from time to time we enter into derivative arrangements for a portion of our production, with an emphasis on our oil production. By removing a significant portion of price volatility associated with our oil production, we believe we will mitigate, but not eliminate, the potential negative effects of reductions in oil prices on our cash flow from operations for those periods. See "Item 7A. Quantitative and Qualitative Disclosures about Market Risk—Commodity Price Risk" for information regarding our exposure to market risk, including the effects of changes in commodity prices and our commodity derivative contracts.
We will continue to use commodity derivative instruments to hedge our price risk in the future. Our hedging strategy and future hedging transactions will be determined at our discretion and may be different than what we have done on a historical basis. We are not under an obligation to hedge a specific portion of our oil, natural gas or NGLs production.
Our positions hedging production as of December 31, 2016 were as follows:
Description and Production Period | VOLUME (Bbls) | SHORT PUT PRICE ($/Bbl) | LONG PUT PRICE ($/Bbl) | DIFFERENTIAL PRICE | |||||||||||
Crude Oil Put Spreads(1): | |||||||||||||||
Jan 2017 - Jun 2017 | 1,434,000 | $ | 37.50 | $ | 52.50 | ||||||||||
Jan 2017 - Jun 2017 | 600,000 | $ | 30.00 | $ | 40.00 | ||||||||||
Jan 2017 - Dec 2017 | 900,000 | $ | 40.00 | $ | 55.00 | ||||||||||
Jul 2017 - Dec 2017 | 900,000 | $ | 40.00 | $ | 50.00 | ||||||||||
Jul 2017 - Dec 2017 | 1,350,000 | $ | 40.00 | $ | 52.50 | ||||||||||
Jul 2017 - Dec 2017 | 3,000,000 | $ | 42.50 | $ | 52.50 | ||||||||||
Jul 2017 - Dec 2017 | 864,000 | $ | 45.00 | $ | 55.00 | ||||||||||
Oct 2017 - Dec 2017 | 300,000 | $ | 42.50 | $ | 55.00 | ||||||||||
Oct 2017 - Dec 2017 | 600,000 | $ | 42.50 | $ | 52.50 | ||||||||||
Jan 2018 - Mar 2018 | 600,000 | $ | 42.50 | $ | 55.00 | ||||||||||
Jan 2018 - Mar 2018 | 900,000 | $ | 40.00 | $ | 52.50 | ||||||||||
Jan 2018 - Jun 2018 | 1,200,000 | $ | 42.50 | $ | 52.50 | ||||||||||
Apr 2018 - Jun 2018 | 600,000 | $ | 45.00 | $ | 55.00 | ||||||||||
Total | 13,248,000 | ||||||||||||||
Crude Oil Basis Swaps(2): | |||||||||||||||
Jan 2017 - Dec 2017 | 1,095,000 | $ | (0.40 | ) | |||||||||||
Jan 2017 - Dec 2017 | 1,095,000 | $ | (0.45 | ) | |||||||||||
Jan 2017 - Dec 2017 | 360,000 | $ | (1.60 | ) | |||||||||||
Jan 2017 - Dec 2017 | 960,000 | $ | (1.65 | ) | |||||||||||
Jan 2017 - Dec 2017 | 600,000 | $ | (1.70 | ) | |||||||||||
Jul 2017 - Dec 2017 | 180,000 | $ | (1.65 | ) | |||||||||||
Jan 2018 - Dec 2018 | 360,000 | $ | (0.95 | ) | |||||||||||
Total | 4,650,000 | ||||||||||||||
(1) | When NYMEX price is above put price, we receive NYMEX price. When NYMEX price is between the put price and the short put price, we receive the put price. When NYMEX price is below the short put price, we receive the NYMEX price plus the difference between the short put price and the put price. | |
(2) | We receive the differential price on our crude oil basis swaps. | |
62
Description and Production Period | VOLUME (Btu) | SHORT PUT PRICE ($/Btu) | LONG PUT PRICE ($/Btu) | SHORT CALL PRICE ($/Btu) | |||||||||||
Natural Gas Three-Way Collars(3): | |||||||||||||||
Jan 2017 - Dec 2017 | 3,600,000 | $ | 2.40 | $ | 2.75 | $ | 4.00 | ||||||||
Jan 2017 - Dec 2017 | 900,000 | $ | 2.35 | $ | 2.75 | $ | 4.05 | ||||||||
Jan 2017 - Dec 2017 | 1,200,000 | $ | 2.25 | $ | 2.75 | $ | 4.05 | ||||||||
Total | 5,700,000 | ||||||||||||||
(1) | Functions similarly to put spreads except that when index price is at or above the call price, we receive the call price. | |
We will recognize the following losses in the line item (Loss) gain on derivatives on our consolidated statements of operations from net cash premiums paid on options that will settle during the following periods (in thousands):
Q1 2017 | $ | (4,855 | ) |
Q2 2017 | $ | (4,855 | ) |
Q3 2017 | $ | (14,216 | ) |
Q4 2017 | $ | (17,828 | ) |
Q1 2018 | $ | (9,513 | ) |
Q2 2018 | $ | (4,350 | ) |
Principal Components of Our Cost Structure
Lease Operating Expenses. Lease operating expenses are the costs incurred in the operation of producing properties and workover costs. Expenses for direct labor, water injection and disposal, utilities, materials and supplies comprise the most significant portion of our lease operating expenses. Lease operating expenses do not include general and administrative expenses or production or ad valorem taxes. Certain items, such as direct labor and materials and supplies, generally remain relatively fixed across broad production volume ranges, but can fluctuate depending on activities performed during a specific period. For instance, repairs to our pumping equipment or surface facilities result in increased lease operating expenses in periods during which they are performed. Certain of our operating cost components are variable and increase or decrease as the level of produced hydrocarbons and water increases or decreases. For example, we incur power costs in connection with various production related activities such as pumping to recover oil and natural gas and separation and treatment of water produced in connection with our oil and natural gas production.
Production and Ad Valorem Taxes. Production taxes are paid on produced oil and natural gas based on a percentage of revenues from production sold at fixed rates established by federal, state or local taxing authorities. In general, the production taxes we pay correlate to the changes in oil and natural gas revenues. We are also subject to ad valorem taxes in the counties where our production is located. Ad valorem taxes are generally based on the valuation of our oil and natural gas properties.
Depletion, Depreciation and Amortization. DD&A is the systematic expensing of the capitalized costs incurred to acquire, explore and develop oil and natural gas. We use the successful efforts method of accounting for oil and natural gas activities and, as such, we capitalize all costs associated with our acquisition and development efforts and all successful exploration efforts, which are then allocated to each unit of production using the unit of production method. Please read "—Critical Accounting Policies and Estimates—Successful Efforts Method of Accounting for Oil and Natural Gas Activities" for further discussion.
Exploration Costs. Exploration costs, other than exploration drilling costs, are charged to expense as incurred. These costs include seismic expenditures and other geological and geophysical costs, exploratory dry holes, amortization and impairment of unproved leasehold costs and lease rentals. The costs of exploratory wells and exploratory-type stratigraphic wells are initially capitalized pending a determination of whether proved reserves have been found. At the completion of drilling activities, the costs of exploratory wells remain capitalized if a determination is made that proved reserves have been found. If no proved reserves have been found, the costs of each of the related exploratory wells are charged to expense. In some cases, a determination of proved reserves cannot be made at the completion of drilling, requiring additional testing and evaluation of the wells. The costs of such exploratory wells are expensed if a determination of proved reserves has not been made within a 12-month period after drilling is complete.
63
General and Administrative Expenses. These are costs incurred for overhead, including payroll and benefits for our corporate staff, costs of maintaining our office facilities, costs of managing our production and development operations (including numerous software applications), audit and other fees for professional services and legal compliance. Also included in general and administrative expenses is compensation expense incurred as a result of our Corporate Reorganization and IPO and stock-based compensation. See "—Factors Affecting the Comparability of Our Financial Condition and Results of Operations."
(Loss) Gain on Derivatives. We utilize commodity derivative contracts to reduce our exposure to fluctuations in the price of oil. None of our derivative contracts are designated as hedges for accounting purposes. Consequently, our derivative contracts are marked-to-market each quarter with fair value gains and losses recognized currently as a gain or loss in our results of operations. The amount of future gain or loss recognized on derivative instruments is dependent upon future oil prices, which will affect the value of the contracts. Cash flow is only impacted to the extent the actual settlements under the contracts result in making a payment to or receiving a payment from the counterparty.
Interest Expense. We finance a portion of our working capital requirements and capital expenditures with borrowings under our Revolving Credit Agreement and previously, our second lien credit facility, as well as through offerings of senior unsecured notes. As a result, we incur interest expense that is affected by both fluctuations in interest rates and our financing decisions. We reflect interest paid to the lenders under our Revolving Credit Agreement, second lien credit facility and senior unsecured notes in interest expense.
Impairment of Oil and Gas Properties
Proved oil and gas properties are reviewed for impairment quarterly or when events and circumstances indicate a possible decline in the recoverability of the carrying amount of such property. We estimate the expected future cash flows of our oil and gas properties and compare the undiscounted cash flows to the carrying amount of the oil and gas properties, on a field-by-field basis, to determine if the carrying amount is recoverable. If the carrying amount exceeds the estimated undiscounted future cash flows, we will write down the carrying amount of the oil and gas properties to estimated fair value.
As a result of suppressed commodity prices and their impact on our estimated future cash flows, we have continued to review our proved oil and natural gas properties for impairment. During the year ended December 31, 2016, we did not recognize an impairment of our proved oil and natural gas properties, and during the year ended December 31, 2015, we recognized an impairment of $1.0 million of our proved oil and natural gas properties. At December 31, 2016, in our significant fields that comprise 100% of our carrying value, our expected undiscounted future cash flows exceeded the carrying value of our proved oil and gas properties by an average of 143% and individually by a minimum of 70%. At December 31, 2015, in our significant fields that comprise 99% of our carrying value, our expected undiscounted future cash flows exceeded the carrying value of our proved oil and gas properties by an average of 119% and individually by a minimum of 6%.
The key assumptions used to determine the undiscounted future cash flows include, but are not limited to, future commodity prices, based on five-year WTI futures price index for oil and NGLs and five-year Henry Hub futures price index for natural gas, price differentials, future production estimates, estimated future capital expenditures and estimated future operating expenses. All inputs remained relatively consistent in the undiscounted future cash flow estimate from December 31, 2015 to December 31, 2016, except commodity price estimates. Future commodity pricing for oil and NGLs is based on five-year WTI futures prices, which increased 16% from December 31, 2015 to December 31, 2016 and on five-year Henry Hub futures prices, which increased 7% from December 31, 2015 to December 31, 2016. In terms of the reduction in value of undiscounted cash flows from December 31, 2015 to December 31, 2016, the effect of the decrease in pricing has been mitigated to a certain extent by the addition of both proved developed and proved undeveloped reserves through our continued drilling and completion of previously unproved oil and natural gas properties.
As part of our year-end reserves estimation process for future periods, we expect changes in the key assumptions used, which could be significant, including updates to future pricing estimates or differentials, future production estimates to align with our anticipated five-year drilling plan and changes in our capital costs and operating expense assumptions, which we expect to decrease further as a result of sustained lower commodity prices. There is a significant degree of uncertainty with the assumptions used to estimate future undiscounted cash flows due to, but not limited to, the risk factors referred to in "Item 1A. Risk Factors" included elsewhere in this Annual Report.
Any decrease in pricing, negative change in price differentials or increase in capital or operating costs could negatively impact the estimated undiscounted cash flows related to our proved oil and natural gas properties. For example, a decrease of 10% in estimated future pricing of oil and natural gas commodities as of December 31, 2016 would have not have resulted in an impairment of proved oil and gas properties.
64
Factors Affecting the Comparability of Our Financial Condition and Results of Operations
Our historical financial condition and results of operations for the periods presented may not be comparable, either from period to period or going forward, for the following reasons:
Recent Transactions
Glasscock County Acquisition. On October 4, 2016, we acquired, from unaffiliated third-party sellers, undeveloped acreage and producing oil and natural gas properties in Glasscock County, Texas, as well as associated mineral and overriding royalty interests, for an aggregate purchase price of $390.9 million in cash, inclusive of a $20.0 million deposit paid to an escrow account upon signing the purchase and sale agreement in the third quarter of 2016. The Glasscock County Acquisition included 11,672 gross (9,140 net) acres and 67 gross (60 net) vertical wells.
New Revolving Credit Facility. On October 28, 2016, we and Parsley LLC entered into the Revolving Credit Agreement, providing for an initial borrowing base of $900.0 million and an initial commitment level of $600.0 million. The Revolving Credit Agreement replaced our previously existing amended and restated revolving credit agreement with, among others, Wells Fargo Bank, National Association, as administrative agent, which was terminated concurrently with entry into the Revolving Credit Agreement.
The Revolving Credit Agreement provides for a five-year senior secured revolving credit facility, maturing on October 28, 2021, with a borrowing capacity of the lowest of (i) the borrowing base, (ii) the aggregate elected borrowing base commitments and (iii) $2.5 billion. The revolving credit facility is secured by substantially all of the assets of Parsley LLC and its restricted subsidiaries.
December 2016 Refinancing. On December 13, 2016, Parsley LLC and Finance Corp. issued $650.0 million aggregate principal amount of 2025 Notes in the 2025 Notes Offering. The 2025 Notes Offering resulted in gross proceeds to us of $650.0 million and net proceeds to us, after deducting initial purchaser discounts and commissions and offering expenses, of approximately $644.1 million.
Concurrently with the 2025 Notes Offering, Parsley LLC used a portion of the net proceeds therefrom to fund the Tender Offer to purchase for cash any and all of its $550.0 million aggregate principal amount of 2022 Notes. On December 13, 2016, the Tender Offer expired and, at such time, $487.7 million aggregate principal amount of the 2022 Notes was validly tendered (which did not include $1.2 million aggregate principal amount of the 2022 Notes that remained subject to guaranteed delivery procedures). Parsley LLC accepted all of the 2022 Notes validly tendered and not validly withdrawn in the Tender Offer and, on December 13, 2016, made a cash payment of $537.1 million, which included principal of $487.7 million, a prepayment premium on the extinguishment of debt of $32.5 million, accrued interest of $12.0 million and other debt issuance costs of $4.9 million. On December 15, 2016, Parsley LLC made an additional cash payment of $0.5 million for the tender of an additional $0.4 million aggregate principal amount of the 2022 Notes and $0.1 million of prepayment premium on the extinguishment of debt and accrued interest.
On January 5, 2017, Parsley LLC and Finance Corp. redeemed the $61.8 million aggregate principal amount of the 2022 Notes that remained outstanding and made a cash payment of $67.5 million to the remaining holders of the 2022 Notes, which included principal of $61.8 million, prepayment premium on the extinguishment of debt of $3.9 million and accrued interest of $1.8 million. As of December 31, 2016, we had committed to repayment of the remaining $61.8 million aggregate principal amount of the 2022 Notes, which are included in Current portion of long-term debt on our consolidated balance sheets, included in this Annual Report.
Recent Acquisitions. During the fourth quarter of 2016, we entered into purchase agreements to acquire, in unrelated transactions, certain undeveloped acreage and producing oil and natural gas properties located adjacent to our existing operating areas in the Midland and Southern Delaware Basins for an aggregate purchase price of approximately $606.6 million in cash. We also acquired certain mineral interests in the Southern Delaware Basin for an aggregate purchase price of $42.8 million. The purchase prices of these transactions are inclusive of deposits of $48.2 million paid to escrow accounts upon signing of certain of the purchase and sale agreements. The deposits are included in Other current assets on the consolidated balance sheets and as an operating activity on the consolidated statements of cash flows, included in this Annual Report.
January Equity Offering. On January 10, 2017, we entered into an underwriting agreement to sell 25,300,000 shares (including 3,300,000 shares issued pursuant to the underwriters’ option to purchase additional shares) of Class A Common Stock, at a price of $35.00 per share in an underwritten public offering. The January Offering closed on January 17, 2017 and resulted in gross proceeds to us of approximately $885.5 million and net proceeds to us, after deducting underwriting discounts
65
and commissions and offering expenses, of approximately $863.0 million. A portion of the net proceeds from the January Offering are being used to fund the aggregate purchase price for certain acquisitions of oil and natural gas interests in the Midland and Southern Delaware Basins, and the remaining net proceeds will be used to fund a portion of our capital program and for general corporate purposes, including potential future acquisitions.
February Equity Offering. On February 7, 2017, we entered into an underwriting agreement to sell 41,400,000 shares of Class A Common Stock (including 5,400,000 shares issued pursuant to the underwriters' option to purchase additional shares) at a price of $31.00 per share in an underwritten public offering. The February Offering closed on February 13, 2017 and resulted in gross proceeds to us of approximately $1,283.4 million and net proceeds to us, after deducting underwriting discounts and commissions and offering expenses, of approximately $1,260.6 million. We will use a portion of the net proceeds from the February Offering to fund the cash portion of the purchase price for the Double Eagle Acquisition and the remaining net proceeds will be used to fund a portion of our capital program and for general corporate purposes, including potential future acquisitions.
New 2025 Notes Offering. Concurrently with the closing of the February Offering, on February 13, 2017, Parsley LLC and Finance Corp issued $450.0 million aggregate principal amount of the New 2025 Notes in the New 2025 Notes Offering. The New 2025 Notes Offering resulted in gross proceeds to us of $450.0 million and net proceeds to us, after deducting initial purchaser discounts and commissions and offering expenses, of approximately $444.2 million, which we intend to use to partially fund the cash portion of the Double Eagle Acquisition as discussed below.
Double Eagle Acquisition. On February 7, 2017, we entered into the Double Eagle Contribution Agreement with Double Eagle, which provides for the contribution by Double Eagle of all of its interests in Double Eagle Lone Star LLC, DE Operating LLC, and Veritas Energy Partners, LLC, as well as certain related transactions with an affiliate of Double Eagle. As a result, we expect to acquire approximately 167,000 gross (71,000 net) acres located in the Midland Basin and approximately 7,300 gross (3,300 net) associated horizontal drilling locations for an aggregate purchase price of approximately $2.8 billion, subject to certain purchase price adjustments set forth in the Double Eagle Contribution Agreement.
The aggregate purchase price for the Double Eagle Acquisition consists of (i) approximately $1.4 billion in cash (which, we intend to fund from the net proceeds of the February Offering and the New 2025 Notes Offering) and (ii) approximately 39.4 million PE Units together with a corresponding approximately 39.4 million shares of our Class B Common Stock. Upon the expiration of a 90-day lock-up period following the consummation of the Double Eagle Acquisition, each PE Unit, together with a corresponding share of our Class B Common Stock, will be exchangeable, at the option of the holder, for one share of our Class A Common Stock, or, if we or Parsley LLC so elects, cash. In connection with the closing of the Double Eagle Acquisition, we intend to enter into a registration rights agreement with Double Eagle containing provisions by which we will agree to, among other things and subject to certain restrictions, file an automatically effective registration statement with the SEC on Form S-3 providing for the registration of the shares of our Class A Common Stock issuable upon exchange of the PE Units (and corresponding shares of our Class B Common Stock) to be issued as consideration to Double Eagle and to conduct certain underwritten offerings thereof.
The Double Eagle Contribution Agreement contains customary representations and warranties, covenants and indemnification provisions and has an effective date of January 1, 2017. We expect to close the Double Eagle Acquisition on or before April 20, 2017, subject to the satisfaction of customary closing conditions.
Incentive Unit Compensation
For the year ended December 31, 2014, general and administrative expenses include amounts attributable to incentive units that, pursuant to the terms of the Parsley LLC Agreement at that date, were only entitled to a payout after a specified level of cumulative cash distributions had been received by NGP X US Holdings, L.P. ("NGP"), through NGP and other preferred investors, including all of our executive officers. At December 31, 2014 and 2013, the incentive units were being accounted for as liability-classified awards pursuant to Accounting Standards Codification ("ASC") Topic 718, Compensation—Stock Compensation, as achievement of the payout conditions required settlement of such awards by transferring cash to the incentive unit holder. There were no such costs incurred during the years ended December 31, 2016 and 2015.
As part of the transactions described below under "—Corporate Reorganization," the Parsley LLC limited liability company agreement was amended. Such amendments, among other things, converted all outstanding incentive units in Parsley LLC into PE Units. A portion of such PE Units were exchanged on a one for one basis for shares of our Class A Common Stock, instead of in cash. As a result, on May 29, 2014, we accounted for the incentive unit awards as equity-classified awards pursuant to ASC Topic 718. This resulted in the recognition of $50.6 million of stock-based compensation equal to the excess
66
of the modified awards’ fair value (based on the initial offering price of $18.50) over the amount of cumulative compensation cost recognized prior to that date. We do not expect to incur such costs in the future.
Stock-Based Compensation
Stock-based compensation includes amortization expense related to grants from our 2014 Long Term Incentive Plan. Refer to Note 9—Stock-Based Compensation to our consolidated financial statements included elsewhere in this Annual Report for additional discussion.
Public Company Expenses
We incur direct, incremental general and administrative expenses as a result of being a publicly traded company, including, but not limited to, increased scope of our operations as a result of recent activities and costs associated with hiring new personnel, implementation of compensation programs that are competitive with our public company peer group, annual and quarterly reports to stockholders, tax return preparation, independent auditor fees, legal fees, investor relations activities, registrar and transfer agent fees, incremental director and officer liability insurance costs and independent director compensation. These direct, incremental general and administrative expenses are not included in our historical results of operations prior to the Corporate Reorganization.
Corporate Reorganization
The historical consolidated financial statements included in this Annual Report are based on the financial statements of our accounting predecessors, Parsley LLC and its predecessors, prior to the reorganization that occurred in connection with our IPO as described in Note 1—Organization and Nature of Operations – Corporate Reorganization of our consolidated financial statements included elsewhere in this Annual Report. As a result, the historical consolidated financial data may not give you an accurate indication of what our actual results would have been if the transactions described in Note 1—Organization and Nature of Operations – Corporate Reorganization of our consolidated financial statements included elsewhere in this Annual Report had been completed at the beginning of the periods presented or of what our future results of operations are likely to be.
In addition, we entered into the TRA with the TRA Holders in connection with our IPO. The TRA generally provides for the payment by us to a TRA Holder of 85% of the net cash savings, if any, in U.S. federal, state and local income tax or franchise tax that we actually realize (or are deemed to realize in certain circumstances) in periods after our IPO as a result of (i) any tax basis increases resulting from the contribution in connection with our IPO by such TRA Holder of all or a portion of its PE Units to us in exchange for shares of Class A Common Stock, (ii) the tax basis increases resulting from the exchange by such TRA Holder of PE Units for shares of Class A Common Stock pursuant to the Exchange Right (or resulting from an exchange of PE Units for cash at our or Parsley LLC’s election) and (iii) imputed interest deemed to be paid by us as a result of and additional tax basis arising from, any payments we make under the TRA. We will retain the benefit of the remaining 15% of these cash savings.
Income Taxes
Our accounting predecessors are limited liability companies or limited partnerships and therefore not subject to U.S. federal income taxes. Accordingly, no provision for U.S. federal income tax has been provided for in our historical results of operations. We are taxed as a corporation under the Internal Revenue Code of 1986, as amended and subject to U.S. federal income tax at a statutory rate of 35% of pretax earnings and, as such, the amount of our future U.S. federal income tax will be dependent upon our future taxable income.
Our operations located in Texas are subject to an entity-level tax, the Texas margin tax, at a statutory rate of up to 1.0% of revenues less operating expenses attributable to operations in Texas.
Drilling Activity
We began drilling operations in November 2009. As of December 31, 2016, we operated seven horizontal drilling rigs and three vertical drilling rig on our properties. For the year ended December 31, 2016, our capital expenditures for drilling, completions and infrastructure were $496.0 million, as compared to $400.9 million for all of fiscal year 2015.
The amount and timing of our future capital expenditures is largely discretionary and within our control. We could choose to defer a portion of planned capital expenditures depending on a variety of factors, including but not limited to the success of our drilling activities, prevailing and anticipated prices for oil and natural gas, the availability of necessary
67
equipment, infrastructure and capital, the receipt and timing of required regulatory permits and approvals, seasonal conditions, drilling and acquisition costs and the level of participation by other interest owners.
Results of Operations
Year ended December 31, 2016 Compared to Year ended December 31, 2015
Oil, natural gas and NGLs revenues. The following table provides the components of our production revenues for the periods indicated, as well as each period’s respective average prices and production volumes:
Year Ended December 31, | ||||||||||||||
2016 | 2015 | $ Change | % Change | |||||||||||
Production revenues (in thousands, except percentages): | ||||||||||||||
Oil sales | $ | 387,303 | $ | 215,795 | $ | 171,508 | 79 | % | ||||||
Natural gas sales | 30,928 | 26,582 | 4,346 | 16 | % | |||||||||
Natural gas liquids sales | 38,273 | 23,680 | 14,593 | 62 | % | |||||||||
Total revenues | $ | 456,504 | $ | 266,057 | $ | 190,447 | 72 | % | ||||||
Average realized prices (1): | ||||||||||||||
Oil, without realized derivatives (per Bbls) | $ | 41.34 | $ | 44.89 | $ | (3.55 | ) | (8 | )% | |||||
Oil, with realized derivatives (per Bbls) | 47.56 | 56.60 | (9.04 | ) | (16 | )% | ||||||||
Natural gas, without realized derivatives (per Mcf) | 2.30 | 2.57 | (0.27 | ) | (11 | )% | ||||||||
Natural gas, with realized derivatives (per Mcf) | 2.30 | 2.72 | (0.42 | ) | (15 | )% | ||||||||
Natural gas liquids (per Bbls) | 16.01 | 15.79 | 0.22 | 1 | % | |||||||||
Average price per Boe, without realized derivatives | 32.60 | 33.13 | (0.53 | ) | (2 | )% | ||||||||
Average price per Boe, with realized derivatives | 36.76 | 40.33 | (3.57 | ) | (9 | )% | ||||||||
Production: | ||||||||||||||
Oil (MBbls) | 9,368 | 4,807 | 4,561 | 95 | % | |||||||||
Natural gas (MMcf) | 13,463 | 10,339 | 3,124 | 30 | % | |||||||||
Natural gas liquids (MBbls) | 2,390 | 1,500 | 890 | 59 | % | |||||||||
Total (MBoe) | 14,002 | 8,031 | 5,971 | 74 | % | |||||||||
Average daily production volume: | ||||||||||||||
Oil (Bbls) | 25,596 | 13,170 | 12,426 | 94 | % | |||||||||
Natural gas (Mcf) | 36,784 | 28,326 | 8,458 | 30 | % | |||||||||
Natural gas liquids (Bbls) | 6,530 | 4,110 | 2,420 | 59 | % | |||||||||
Total (Boe/d) | 38,257 | 22,003 | 16,254 | 74 | % | |||||||||
(1) | Average prices shown in the table reflect prices both before and after the effects of our realized commodity hedging transactions. Our calculation of such effects includes both realized gains and losses on cash settlements for commodity derivative transactions and premiums paid or received on options that settled during the period. | |
68
The following table shows the relationship between our average realized oil price as a percentage of the average NYMEX price and the relationship between our average realized natural gas price as a percentage of the average NYMEX price for the years indicated. Management uses the realized price to NYMEX margin analysis to analyze trends in our oil and natural gas revenues.
Year Ended December 31, | |||||||
2016 | 2015 | ||||||
Average realized oil price ($/Bbl) | $ | 41.34 | $ | 44.89 | |||
Average NYMEX ($/Bbl) | $ | 40.14 | $ | 48.08 | |||
Differential to NYMEX | $ | 1.20 | $ | (3.19 | ) | ||
Average realized oil price to NYMEX percentage | 103 | % | 93 | % | |||
Average realized natural gas price ($/Mcf) | $ | 2.30 | $ | 2.57 | |||
Average NYMEX ($/Mcf) | $ | 2.79 | $ | 2.50 | |||
Differential to NYMEX | $ | (0.49 | ) | $ | 0.07 | ||
Average realized natural gas to NYMEX percentage | 82 | % | 103 | % | |||
Average realized NGLs price ($/Bbl) | $ | 16.01 | $ | 15.79 | |||
Average NYMEX ($/Bbl) | $ | 40.14 | $ | 48.08 | |||
Differential to NYMEX | $ | (24.13 | ) | $ | (32.29 | ) | |
Average realized NGLs price to NYMEX oil percentage | 40 | % | 33 | % | |||
Oil revenues increased 79% to $387.3 million during the year ended December 31, 2016 from $215.8 million during the year ended December 31, 2015. The increase is attributable to an increase in oil production volumes of 4,561 MBbls, offset by a $3.55 per barrel decrease in average oil prices. Of the overall changes in oil revenues, the increase in oil production volumes accounted for a positive change of $204.8 million and the decrease in oil prices accounted for a negative change of $33.3 million.
Natural gas revenues increased 16% to $30.9 million during the year ended December 31, 2016 from $26.6 million during the year ended December 31, 2015. The increase is attributable to an increase in volumes sold of 3,124 Mcf, offset by a $0.27 per Mcf decrease in average natural gas prices. Of the overall changes in natural gas revenues, the increase in natural gas production volumes accounted for a positive change of $8.0 million and the decrease in price accounted for a negative change of $3.7 million.
NGLs revenues increased 62% to $38.3 million during the year ended December 31, 2016 from $23.7 million during the year ended December 31, 2015. The increase is attributable to an 890 MBbls increase in NGLs production in addition to a $0.22 per barrel increase in average NGLs price. Of the overall changes in NGLs revenues, the increase in production volumes accounted for a positive change of $14.1 million and the increase in NGLs average price accounted for a positive change of $0.5 million.
69
Operating Expenses. The following table summarizes our expenses for the periods indicated:
Year ended December 31, | ||||||||||||||
2016 | 2015 | $ Change | % Change | |||||||||||
Operating expenses (in thousands, except percentages): | ||||||||||||||
Lease operating expenses | $ | 59,293 | $ | 62,913 | $ | (3,620 | ) | (6 | )% | |||||
Production and ad valorem taxes | 27,916 | 17,800 | 10,116 | 57 | % | |||||||||
Depreciation, depletion and amortization | 233,766 | 178,281 | 55,485 | 31 | % | |||||||||
General and administrative expenses (1) | 84,591 | 55,294 | 29,297 | 53 | % | |||||||||
Exploration costs | 13,931 | 13,865 | 66 | — | % | |||||||||
Impairment | — | 950 | (950 | ) | (100 | )% | ||||||||
Acquisition costs | 1,081 | — | 1,081 | 100 | % | |||||||||
Accretion of asset retirement obligations | 732 | 826 | (94 | ) | (11 | )% | ||||||||
Rig termination costs | — | 8,970 | (8,970 | ) | (100 | )% | ||||||||
Other operating expenses | 5,316 | 1,696 | 3,620 | * | ||||||||||
Total operating expenses | $ | 426,626 | $ | 340,595 | $ | 86,031 | 25 | % | ||||||
Expense per Boe: | ||||||||||||||
Lease operating expenses | $ | 4.23 | $ | 7.83 | $ | (3.60 | ) | (46 | )% | |||||
Production and ad valorem taxes | 1.99 | 2.22 | (0.23 | ) | (10 | )% | ||||||||
Depreciation, depletion and amortization | 16.70 | 22.20 | (5.50 | ) | (25 | )% | ||||||||
General and administrative expenses | 6.04 | 6.89 | (0.85 | ) | (12 | )% | ||||||||
Exploration costs | 0.99 | 1.73 | (0.74 | ) | (43 | )% | ||||||||
Impairment | — | 0.12 | (0.12 | ) | (100 | )% | ||||||||
Acquisition costs | 0.08 | — | 0.08 | 100 | % | |||||||||
Accretion of asset retirement obligations | 0.05 | 0.10 | (0.05 | ) | (50 | )% | ||||||||
Rig termination costs | — | 1.12 | (1.12 | ) | (100 | )% | ||||||||
Other operating expenses | 0.38 | 0.21 | 0.17 | 81 | % | |||||||||
Total operating expenses per Boe | $ | 30.46 | $ | 42.42 | $ | (11.96 | ) | (28 | )% | |||||
(1) | General and administrative expenses include stock-based compensation expense of $12.9 million and $8.1 million for the years ended December 31, 2016 and 2015, respectively. | |
* | The percentage change is not considered meaningful. | |
Lease Operating Expenses. Lease operating expenses decreased 6% to $59.3 million during the year ended December 31, 2016 from $62.9 million during the year ended December 31, 2015. The decrease is primarily due to the cost reduction initiatives implemented by management. On a per Boe basis, lease operating expenses decreased $3.60 per Boe, or 46%, to $4.23 per Boe for the year ended December 31, 2016 from $7.83 per Boe for the year ended December 31, 2015. The decrease in lease operating expenses per Boe is partially attributable to a greater portion of our production coming from horizontal wells. The decrease in lease operating expense per Boe is also partially attributable to a 74% increase in production during the same period.
Production and Ad Valorem Taxes. Production and ad valorem taxes increased 57% to $27.9 million during the year ended December 31, 2016 from $17.8 million during the year ended December 31, 2015. On a per Boe basis, production and ad valorem taxes decreased 10%, to $1.99 per Boe for the year ended December 31, 2016 from $2.22 per Boe for the year ended December 31, 2015. Overall, production taxes increased by approximately $9.4 million, reflecting increased production volumes and ad valorem taxes increased $0.7 million, reflecting increased property assessments.
Depreciation, Depletion and Amortization. DD&A expense increased 31% to $233.8 million for the year ended December 31, 2016 from $178.3 million for the year ended December 31, 2015. On a per Boe basis, DD&A decreased 25% to $16.70 for the year ended December 31, 2016 from $22.20 per Boe for the year ended December 31, 2015. The increases are due to an increase in proved capitalized costs primarily related to development costs incurred during the year ended December 31, 2016 as well as increased production.
70
General and Administrative Expenses. General and administrative expenses increased 53% to $84.6 million during the year ended December 31, 2016 from $55.3 million during the year ended December 31, 2015, primarily due to higher payroll and stock-based compensation expenses. In addition, we incurred increased rent expense for our corporate headquarters. On a per Boe basis, general and administrative expenses decreased 12%, to $6.04 per Boe for the year ended December 31, 2016 from $6.89 per Boe for the year ended December 31, 2015 which primarily relates to the 74% increase in total production volume.
Exploration Costs. The following table provides a breakdown of exploration costs incurred during the years ended December 31, 2016 and 2015.
Year Ended December 31, | |||||||
2016 | 2015 | ||||||
(in thousands) | |||||||
Leasehold abandonments | $ | 6,063 | $ | 8,227 | |||
Idle drilling rig fees | 4,304 | — | |||||
Geological and geophysical costs | 3,015 | 5,459 | |||||
Unproved leasehold amortization | 549 | 179 | |||||
Total exploration costs | $ | 13,931 | $ | 13,865 | |||
During the year ended December 31, 2016, we recognized leasehold abandonment expenses of approximately $6.1 million, which primarily relates to expired acreage and expiring acreage determined to be outside of our economically productive reserves. During the year ended December 31, 2015, we recognized leasehold abandonment expenses of approximately $8.2 million, of which $6.4 million primarily relates to expired acreage and expiring acreage determined to be outside of our economically productive reserves. We also recognized a $1.8 million expense in the year ended December 31, 2015 for costs incurred to prepare certain locations for drilling that, based on our historical results, our estimates of reduced future commodity prices and low rates of return, we had no future intent to drill.
Exploration costs include idle drilling rig fees of $4.3 million that are not chargeable to our joint operations during the year ended December 31, 2016. The drilling rig contract that results in these fees will expire in March 2017. There were no such expenses incurred during the year ended December 31, 2015.
Our geological and geophysical expenses primarily consist of the costs of acquiring and processing seismic data, geophysical data and core analysis, primarily relating to increased geoscientific analysis of our Delaware Basin assets. During the years ended December 31, 2016 and 2015, we obtained geological and geophysical data primarily related to a portion our Delaware Basin acreage.
We recognized leasehold amortization expense during the years ended December 31, 2016 and 2015 of $0.5 million and $0.2 million, respectively, which relates to amortization of unproved leasehold costs.
Impairment. We regularly review our long-lived assets to be held and used, including proved oil and natural gas properties accounted for under the successful efforts method of accounting. Due primarily to a decrease in our estimated future cash flows related to management’s outlook of future commodity prices and costs, we recognized a charge against earnings of $1.0 million during the year ended December 31, 2015, which was primarily attributable to properties in Upton County, Texas in our Midland Basin core area.
Acquisition Costs. During the year ended December 31, 2016, we incurred $1.1 million of acquisition costs, which include legal and other due diligence fees paid associated with the acquisitions described in Note 5—Acquisitions of Oil and Natural Gas Properties of our consolidated financial statements included elsewhere in this Annual Report. There were no such costs incurred during the year ended December 31, 2015.
Rig Termination. During the year ended December 31, 2015, we paid a total of $9.0 million in rig termination expenses, which is comprised of approximately $4.4 million related to the termination of drilling rig contracts entered into in 2014 and approximately $4.6 million for stacking fees associated with certain drilling rig contracts. There were no such expenses incurred during the year ended December 31, 2016.
Other Operating Expenses. During the years ended December 31, 2016 and 2015 other operating expenses were $5.3 million and $1.7 million, respectively, which are related to operating expenses incurred during the normal course of business of our majority-owned subsidiary, Pacesetter.
71
Other Income and Expenses. The following table summarizes our other income and expenses for the periods indicated:
Year ended December 31, | ||||||||||||||
2016 | 2015 | $ Change | % Change | |||||||||||
Other income (expense) (in thousands, except percentages): | ||||||||||||||
Interest expense, net | $ | (55,233 | ) | $ | (45,553 | ) | $ | (9,680 | ) | 21 | % | |||
Loss on sale of property | (119 | ) | (34,374 | ) | 34,255 | 100 | % | |||||||
Prepayment premium on extinguishment of debt | (36,335 | ) | — | (36,335 | ) | (100 | )% | |||||||
(Loss) gain on derivatives | (50,835 | ) | 60,818 | (111,653 | ) | * | ||||||||
Other income (expense) | 5,034 | (3,556 | ) | 8,590 | * | |||||||||
Total other (expense) income, net | $ | (137,488 | ) | $ | (22,665 | ) | $ | (114,823 | ) | * | ||||
* | The percentage change is not considered meaningful. |
Interest Expense. Interest expense increased 21% to $55.2 million in the year ended December 31, 2016 from $45.6 million during the year ended December 31, 2015, primarily due to higher weighted-average outstanding borrowings under our credit facilities and interest under the 2022 Notes and 2024 Notes.
Loss on Sale of Property. Loss on sale of property decreased $34.3 million in the year ended December 31, 2016 to $0.1 million from $34.4 million during the year ended December 31, 2015. This decrease is attributable to the following divestiture activity:
During December 2015, we sold our interest in 91 net operated wells and 11,664 gross (7,155 net) acres for net proceeds of $39.4 million and realized a $36.7 million loss, net of estimated purchase price adjustments. During July 2015, we sold 9,164 net acres for total proceeds of $9.3 million and recognized a gain on the sale of $3.2 million. In addition, during July 2015, Pacesetter sold certain noncurrent assets for net proceeds of $1.2 million and realized a $2.0 million loss on the sale.
Prepayment Premium on Extinguishment of Debt. In December 2016, we incurred a $36.3 million charge related to a prepayment penalty on our then 2022 Notes as discussed in "Factors Affecting the Comparability of Our Financial Condition and Results of Operations—December 2016 Refinancing." No similar expenses were incurred during the year ended December 31, 2015.
(Loss) Gain on Derivatives. Loss on derivatives increased $111.7 million to a loss of $50.8 million during the year ended December 31, 2016 as compared to a $60.8 million gain during the year ended December 31, 2015, as higher commodity prices reduced the value of our derivative portfolio.
Other Income (Expense). Other income (expense) increased $8.6 million to income of $5.0 million during the year ended December 31, 2016 as compared to expense of $3.6 million during the year ended December 31, 2015. The increase is attributable to a $7.4 million deferred tax asset valuation benefit associated with a write off of deferred tax assets associated with our TRA, as well as a $2.8 million decrease in expense associated with the sale or fair market value adjustment of inventory. This is offset by a $1.2 million decrease in geological and geophysical license fee income and a $0.4 million increase in income from our equity investment in Spraberry Production Services LLC ("SPS").
Income Tax Expense
For the year ended December 31, 2016, our operations were taxed at a combined U.S. federal and state effective tax rate of 16.4%. During the year ended December 31, 2016, we recognized an income tax benefit of $17.4 million, a decrease of $6.3 million, or 27%, as compared to the income tax benefit of $23.8 million we recognized during the year ended December 31, 2015. This decrease was attributable to the deferred tax asset valuation allowance described in Note 10—Income Taxes to our consolidated financial statements included elsewhere in this Annual Report.
72
Year Ended December 31, 2015 Compared to Year Ended December 31, 2014
Oil, Natural Gas and NGLs Revenues. The following table provides the components of our production revenues for the periods indicated, as well as each period’s respective average prices and production volumes:
Year Ended December 31, | ||||||||||||||
2015 | 2014 | $ Change | % Change | |||||||||||
Production revenues (in thousands, except percentages): | ||||||||||||||
Oil sales | $ | 215,795 | $ | 232,554 | $ | (16,759 | ) | (7 | )% | |||||
Natural gas sales | 26,582 | 30,642 | (4,060 | ) | (13 | )% | ||||||||
Natural gas liquids sales | 23,680 | 38,561 | (14,881 | ) | (39 | )% | ||||||||
Total revenues | $ | 266,057 | $ | 301,757 | $ | (35,700 | ) | (12 | )% | |||||
Average realized prices (1): | ||||||||||||||
Oil, without realized derivatives (per Bbls) | $ | 44.89 | $ | 81.91 | $ | (37.02 | ) | (45 | )% | |||||
Oil, with realized derivatives (per Bbls) | 56.60 | 81.33 | (24.73 | ) | (30 | )% | ||||||||
Natural gas, without realized derivatives (per Mcf) | 2.57 | 4.23 | (1.66 | ) | (39 | )% | ||||||||
Natural gas, with realized derivatives (per Mcf) | 2.72 | 4.32 | (1.60 | ) | (37 | )% | ||||||||
Natural gas liquids (per Bbls) | 15.79 | 33.83 | (18.04 | ) | (53 | )% | ||||||||
Average price per Boe, without realized derivatives | 33.13 | 58.19 | (25.06 | ) | (43 | )% | ||||||||
Average price per Boe, with realized derivatives | 40.33 | 58.00 | (17.67 | ) | (30 | )% | ||||||||
Production: | ||||||||||||||
Oil (MBbls) | 4,807 | 2,839 | 1,968 | 69 | % | |||||||||
Natural gas (MMcf) | 10,339 | 7,245 | 3,094 | 43 | % | |||||||||
Natural gas liquids (MBbls) | 1,500 | 1,140 | 360 | 32 | % | |||||||||
Total (MBoe) | 8,031 | 5,186 | 2,845 | 55 | % | |||||||||
Average daily production volume: | ||||||||||||||
Oil (Bbls) | 13,170 | 7,778 | 5,392 | 69 | % | |||||||||
Natural gas (Mcf) | 28,326 | 19,849 | 8,477 | 43 | % | |||||||||
Natural gas liquids (Bbls) | 4,110 | 3,123 | 987 | 32 | % | |||||||||
Total (Boe/d) | 22,003 | 14,207 | 7,796 | 55 | % | |||||||||
(1) | Average prices shown in the table reflect prices both before and after the effects of our realized commodity hedging transactions. Our calculation of such effects includes both realized gains and losses on cash settlements for commodity derivative transactions and premiums paid or received on options that settled during the period. | |
73
The following table shows the relationship between our average realized oil price as a percentage of the average NYMEX price and the relationship between our average realized natural gas price as a percentage of the average NYMEX price for the years indicated. Management uses the realized price to NYMEX margin analysis to analyze trends in our oil and natural gas revenues.
Year Ended December 31, | |||||||
2015 | 2014 | ||||||
Average realized oil price ($/Bbl) | $ | 44.89 | $ | 81.91 | |||
Average NYMEX ($/Bbl) | $ | 48.08 | $ | 80.27 | |||
Differential to NYMEX | $ | (3.19 | ) | $ | 1.65 | ||
Average realized oil price to NYMEX percentage | 93 | % | 102 | % | |||
Average realized natural gas price ($/Mcf) | $ | 2.57 | $ | 4.23 | |||
Average NYMEX ($/Mcf) | $ | 2.50 | $ | 4.52 | |||
Differential to NYMEX | $ | 0.07 | $ | (0.29 | ) | ||
Average realized natural gas to NYMEX percentage | 103 | % | 94 | % | |||
Average realized NGLs price ($/Bbl) | $ | 15.79 | $ | 33.83 | |||
Average NYMEX ($/Bbl) | $ | 48.08 | $ | 80.27 | |||
Differential to NYMEX | $ | (32.29 | ) | $ | (46.44 | ) | |
Average realized NGLs price to NYMEX oil percentage | 33 | % | 42 | % | |||
Oil revenues decreased 7% to $215.8 million during the year ended December 31, 2015 from $232.6 million during the year ended December 31, 2014. The decrease is attributable to a $37.02 per barrel a decrease in average oil prices of offset by an increase in oil production volumes of 1,968 MBbls. Of the overall changes in oil revenues, the decrease in oil prices accounted for a negative change of $178.0 million, offset by the increase in oil production volumes, which accounted for a positive change of $161.2 million.
Natural gas revenues decreased 13% to $26.6 million during the year ended December 31, 2015 from $30.6 million during the year ended December 31, 2014. The decrease is attributable to a $1.66 per Mcf decrease in average natural gas prices, offset by an increase in volumes sold of 3,094 Mcf. Of the overall changes in natural gas revenues, the decrease in natural gas price accounted for a negative change of $17.2 million, offset by increases in natural gas volumes, which accounted for a positive change of $13.1 million.
NGLs revenues decreased 39% to $23.7 million during the year ended December 31, 2015 from $38.6 million during the year ended December 31, 2014. The decrease is attributable to an $18.04 per barrel decrease in average NGLs price in addition to a 360 MBbls increase in NGLs production. Of the overall changes in NGLs revenues, the decrease in NGLs average price accounted for a negative change of $27.1 million and the increase in production volumes accounted for a positive change of $12.2 million.
74
Operating Expenses. The following table summarizes our expenses for the periods indicated:
Year ended December 31, | ||||||||||||||
2015 | 2014 | $ Change | % Change | |||||||||||
Operating expenses (in thousands, except percentages): | ||||||||||||||
Lease operating expenses | $ | 62,913 | $ | 38,071 | $ | 24,842 | 65 | % | ||||||
Production and ad valorem taxes | 17,800 | 18,941 | (1,141 | ) | (6 | )% | ||||||||
Depreciation, depletion and amortization | 178,281 | 94,297 | 83,984 | 89 | % | |||||||||
General and administrative expenses (1) | 55,294 | 87,949 | (32,655 | ) | (37 | )% | ||||||||
Exploration costs | 13,865 | 3,136 | 10,729 | * | ||||||||||
Impairment | 950 | — | 950 | 100 | % | |||||||||
Acquisition costs | — | 2,527 | (2,527 | ) | (100 | )% | ||||||||
Accretion of asset retirement obligations | 826 | 512 | 314 | 61 | % | |||||||||
Rig termination costs | 8,970 | 765 | 8,205 | * | ||||||||||
Other | 1,696 | — | 1,696 | 100 | % | |||||||||
Total operating expenses | $ | 340,595 | $ | 246,198 | $ | 94,397 | 38 | % | ||||||
Expense per Boe: | ||||||||||||||
Lease operating expenses | $ | 7.83 | $ | 7.34 | $ | 0.49 | 7 | % | ||||||
Production and ad valorem taxes | 2.22 | 3.65 | (1.43 | ) | (39 | )% | ||||||||
Depreciation, depletion and amortization | 22.20 | 18.18 | 4.02 | 22 | % | |||||||||
General and administrative expenses | 6.89 | 16.96 | (10.07 | ) | (59 | )% | ||||||||
Exploration costs | 1.73 | 0.60 | 1.13 | * | ||||||||||
Impairment | 0.12 | — | 0.12 | 100 | % | |||||||||
Acquisition costs | — | 0.49 | (0.49 | ) | * | |||||||||
Accretion of asset retirement obligations | 0.10 | 0.10 | — | — | % | |||||||||
Rig termination costs | 1.12 | 0.15 | 0.97 | * | ||||||||||
Other | 0.21 | — | 0.21 | (100 | )% | |||||||||
Total operating expenses per Boe | $ | 42.42 | $ | 47.47 | $ | (5.05 | ) | (11 | )% | |||||
(1) | General and administrative expenses include stock-based compensation expense of $8.1 million and $53.3 million for the years ended December 31, 2015 and 2014, respectively. | |
* | The percentage change is not considered meaningful. | |
Lease Operating Expenses. Lease operating expenses increased 65% to $62.9 million during the year ended December 31, 2015 from $38.1 million during the year ended December 31, 2014. The increase is primarily due to the higher operated well count during the year ended December 31, 2015 as compared to the prior year period. On a per Boe basis, lease operating expenses increased 7% to $7.83 per Boe from $7.34 per Boe for the year ended December 31, 2014. This increase was attributable to an increase in costs for workovers offset by a decrease in disposal costs.
Production and Ad Valorem Taxes. Production and ad valorem taxes decreased 6% to $17.8 million during the year ended December 31, 2015 from $18.9 million during the year ended December 31, 2014. On a per Boe basis, production and ad valorem taxes decreased or 39%, to $2.22 per Boe for the year ended December 31, 2015 from $3.65 per Boe for the year ended December 31, 2014. The decreases are directly related to the decrease in oil, natural gas and NGLs revenues for the same period.
Depreciation, Depletion and Amortization. DD&A expense increased 89% to $178.3 million for the year ended December 31, 2015 from $94.3 million for the year ended December 31, 2014. On a per Boe basis, DD&A increased 22%, to $22.20 per Boe for the year ended December 31, 2015 from $18.18 per Boe for the year ended December 31, 2014. The increases are due to an increase in proved capitalized costs primarily related to development costs incurred during the year ended December 31, 2015 and multiple oil and natural gas acquisitions.
75
General and Administrative Expenses. General and administrative expenses decreased 37% to $55.3 million during the year ended December 31, 2015 from $87.9 million during the year ended December 31, 2014, primarily due to the $51.1 million expense recognized in conjunction with our Corporate Reorganization and IPO during the year ended December 31, 2014, which was offset by increased professional fees and consultant costs incurred related to our status as a public company as well as increased rent expense for our corporate headquarters. On a per Boe basis, general and administrative expenses decreased 59%, to $6.89 per Boe for the year ended December 31, 2015 from $16.96 per Boe for the year ended December 31, 2014.
Exploration Costs. The following table provides a breakdown of exploration costs incurred during the years ended December 31, 2015 and 2014.
Year Ended December 31, | |||||||
2015 | 2014 | ||||||
(in thousands) | |||||||
Leasehold abandonments | $ | 8,227 | $ | 430 | |||
Geological and geophysical costs | 5,459 | 2,394 | |||||
Unproved leasehold amortization | 179 | 312 | |||||
Total exploration costs | $ | 13,865 | $ | 3,136 | |||
During the year ended December 31, 2015, we recognized leasehold abandonment expenses of approximately $8.2 million, of which $6.4 million primarily relates to expired acreage and expiring acreage determined to be outside of our economically productive reserves. We also recognized a $1.8 million expense in the year ended December 31, 2015 for costs incurred to prepare certain locations for drilling that, based on our historical results, our estimates of reduced future commodity prices and low rates of return, we had no future intent to drill.
Our geological and geophysical expenses primarily consist of the costs of acquiring and processing seismic data, geophysical data and core analysis, primarily relating to increased geoscientific analysis of our Delaware Basin assets. During the year ended December 31, 2015, we acquired additional geological and geophysical data related to our Delaware Basin acreage.
Impairment. We regularly review our long-lived assets to be held and used, including proved oil and natural gas properties accounted for under the successful efforts method of accounting. Due primarily to a decrease in our estimated future cash flows related to management’s outlook of future commodity prices and costs, we recognized a charge against earnings of $1.0 million during the year ended December 31, 2015, which was primarily attributable to properties in Upton County, Texas in our Midland Basin core area.
Acquisition Costs. Acquisition costs during the year ended December 31, 2014 are attributable to a one time advisory and valuation fee related to an acquisition that closed in September 2014.
Rig Termination. Rig termination costs increased $8.2 million to $9.0 million during the year ended December 31, 2015 from $0.8 million during the year ended December 31, 2014. The increase is related to additional termination costs incurred during the year ended December 31, 2015 including approximately $4.4 million related to the termination of drilling rig contracts entered into in 2014 and approximately $4.6 million for stacking fees associated with certain drilling rig contracts.
Other Operating Expenses. During the year ended December 31, 2015, other operating expenses were approximately $1.7 million, which are related to operating expenses incurred during the normal course of Pacesetter. There were no such expenses during the year ended December 31, 2014.
76
Other Income and Expenses. The following table summarizes our other income and expenses for the periods indicated:
Year ended December 31, | |||||||||||||||
2015 | 2014 | $ Change | % Change | ||||||||||||
Other income (expense) (in thousands, except percentages): | |||||||||||||||
Interest expense, net | $ | (45,553 | ) | $ | (39,624 | ) | $ | (5,929 | ) | 15 | % | ||||
Loss on sale of property | (34,374 | ) | (2,097 | ) | (32,277 | ) | * | ||||||||
Prepayment premium on extinguishment of debt | — | (5,107 | ) | 5,107 | (100 | )% | |||||||||
Gain on derivatives | 60,818 | 83,858 | (23,040 | ) | (27 | )% | |||||||||
Other expense | (3,556 | ) | (71 | ) | (3,485 | ) | * | ||||||||
Total other (expense) income, net | $ | (22,665 | ) | $ | 36,959 | $ | (59,624 | ) | (161 | )% | |||||
* | The percentage change is not considered meaningful. | |
Interest Expense, net. Interest expense increased 15% to $45.6 million in the year ended December 31, 2015 from $39.6 million during the year ended December 31, 2014, primarily due to higher weighted-average outstanding borrowings under our credit facilities and interest under the 2022 Notes.
Loss on Sale of Property. Loss on sale of property increased $32.3 million in the year ended December 31, 2015 to $34.4 million from $2.1 million during the year ended December 31, 2014. This increase is attributable to the following divestiture activity:
During December 2015, the Company sold its interest in 91 operated wells and 11,664 gross (7,155 net) acres for net proceeds of $39.4 million and realized a $36.7 million loss, net of estimated purchase price adjustments. During July 2015, the Company sold 9,164 net acres for total proceeds of $9.3 million and recognized a gain on the sale of $3.2 million. In addition, during July 2015, Pacesetter sold certain noncurrent assets for net proceeds of $1.2 million and realized a $2.0 million loss on the sale. In August 2014, the Company sold its interest in one operated well and 38 net acres for total proceeds of $0.2 million and realized a $2.1 million loss on the sale.
Prepayment Premium on Extinguishment of Debt. During the first quarter of 2014, we incurred a $5.1 million charge related to a prepayment penalty on our then outstanding second lien term loan. No similar expenses were incurred during the year ended December 31, 2015.
Gain on Derivatives. Gain on derivative instruments decreased $23.0 million during the year ended December 31, 2015 to $60.8 million during the year ended December 31, 2015 from $83.9 million during the year ended December 31, 2014, primarily as a result of the impact of additional derivative activities occurring during the year. We elected to lower certain strike prices for both long and short put positions during the year ended December 31, 2015. By lowering the strike prices for the put spreads, we collected approximately $87.7 million of cash for 15,539 notional MBbls.
Other Expense. Other expense increased $3.5 million to an expense of $3.6 million during the year ended December 31, 2015 from an expense of $0.1 million during the year December 31, 2014 due to a $4.1 million reduction in inventory related to multiple inventory trades and a fair market value adjustment. In addition, our income from our equity investment in SPS decreased by approximately $0.6 million. This is offset by $1.2 million of geological and geophysical license fee income received during the year ended December 31, 2015.
Income Tax Expense
For the year ended December 31, 2015, our operations were taxed at a combined U.S. federal and state effective tax rate of 24.5%. As a pass-through entity, our predecessor was subject only to the Texas margin tax at a statutory rate of 1.0% and was not subject to U.S. federal income tax. During the year ended December 31, 2015, we recognized an income tax benefit of $23.8 million, an increase of $60.3 million, or 165%, as compared to the income tax expense of $36.5 million we recognized during the year ended December 31, 2014. This increase was attributable to the corresponding decrease in net income during the applicable periods, as discussed above. During the year ended December 31, 2015, we were subject to the federal income tax rate for the entire period as compared to only the seven-month period subsequent to our IPO for the year ended December 31, 2014.
77
Capital Requirements and Sources of Liquidity
For the year ended December 31, 2016, our aggregate drilling, completions and infrastructure capital expenditures, including facilities, were $496.0 million. During the year ended December 31, 2015, our aggregate drilling, completion and infrastructure capital expenditures were $400.9 million. These capital expenditure totals exclude acquisitions.
Our 2017 budget for capital development expenditures is approximately $1,000.0 million to $1,150.0 million, including $840.0 million to $960.0 million for drilling and completions and $160.0 million to $190.0 million for infrastructure and other expenditures. The amount and timing of 2017 capital expenditures is largely discretionary and within our control. We could choose to defer a portion of these planned 2017 capital expenditures depending on a variety of factors, including, but not limited to, the success of our drilling activities, prevailing and anticipated prices for oil and natural gas, the availability of necessary equipment, infrastructure and capital, the receipt and timing of required regulatory permits and approvals, seasonal conditions, drilling and acquisition costs and the level of participation by other working interest owners.
To fund a portion of our capital requirements for the year ended December 31, 2016, we issued shares of our Class A Common Stock and conducted offerings of senior unsecured notes. During the year ended December 31, 2016, we received aggregate net proceeds of $930.3 million from the issuances and made aggregate net debt issuances in excess of debt payments of $517.5 million.
Based upon current oil and natural gas price expectations for the fiscal year 2017, we believe that our cash on hand, cash flow from operations and borrowings under our Revolving Credit Agreement will be sufficient to fund our operations through 2017. However, as more fully described below, future cash flows are subject to a number of variables, including the level of oil and natural gas production and prices, and the significant capital expenditures required to more fully develop our properties. As of December 31, 2016, our liquidity is as follows (in millions):
Cash | $ | 133.4 | |
Revolving Credit Agreement Availability | 599.8 | ||
Liquidity | $ | 733.2 | |
Pro forma for the January Offering, February Offering, New 2025 Notes Offering, Double Eagle Acquisition and other recent acquisitions our liquidity as of December 31, 2016, was approximately $1,362.6 million.
Future cash flows are subject to a number of variables, including the level of oil and natural gas production and prices, and the significant capital expenditures required to more fully develop our properties. For example, we expect a portion of our future capital expenditures to be financed with cash flows from operations derived from wells drilled in drilling locations not associated with proved reserves on our December 31, 2016 reserve report. The failure to achieve anticipated production and cash flows from operations from such wells could result in a reduction in future capital spending. Further, our capital expenditure budget for the year ended December 31, 2017 does not allocate any amounts for acquisitions of oil and natural gas properties. In the event we make additional acquisitions and the amount of capital required is greater than the amount we have available for acquisitions at that time, we could be required to reduce the expected level of capital expenditures and/or seek additional capital. If we require additional capital for that or other reasons, we may seek such capital through traditional reserve base borrowings, joint venture partnerships, production payment financings, asset sales, offerings of debt or equity securities or other means. We cannot assure you that needed capital will be available on acceptable terms or at all. If we are unable to obtain funds when needed or on acceptable terms, we may be required to curtail our current drilling programs, which could result in a loss of acreage through lease expirations. In addition, we may not be able to complete acquisitions that may be favorable to us or finance the capital expenditures necessary to replace our reserves. We may from time to time seek to retire or purchase our outstanding debt through cash purchases and/or exchanges for other debt or equity securities, in open market purchases, privately negotiated transactions or otherwise. Such repurchases or exchanges, if any, will depend on prevailing market conditions, our liquidity requirements, contractual restrictions and other factors. The amounts involved may be material.
78
Cash Flows
The following table summarizes our cash flows for the periods indicated (in thousands):
Year Ended December 31, | ||||||||||||
2016 | 2015 | 2014 | ||||||||||
Net cash provided by operating activities | $ | 228,191 | $ | 172,290 | $ | 190,090 | ||||||
Net cash used in investing activities | (1,885,366 | ) | (427,165 | ) | (1,247,677 | ) | ||||||
Net cash provided by financing activities | 1,447,470 | 547,409 | 1,088,744 | |||||||||
Net Cash Provided by Operating Activities. Net cash provided by operating activities was approximately $228.2 million, $172.3 million and $190.1 million for the years ended December 31, 2016, 2015 and 2014, respectively.
Net cash provided by operating activities increased $55.9 million to $228.2 million during the year ended December 31, 2016 from $172.3 million during the year ended December 31, 2015, largely due to a $36.3 million increase in total cash based operating expense, which includes lease operating expenses, production and ad valorem taxes, general and administrative expenses (excluding stock-based compensation) and other operating expenses, offset by an increase in production revenues directly related to the 74% increase in total production volumes. Additionally, cash received for derivative settlements and cash received for option premiums decreased $62.4 million for the year ended December 31, 2016 from the year ended December 31, 2015.
The $17.8 million decrease in operating cash flows to $172.3 million during the year ended December 31, 2015 from $190.1 million during the year ended December 31, 2014 is primarily due to a $35.7 million decrease in production revenues directly related to the 30% decrease in crude oil prices, including the effect of derivatives and a 65% increase in lease operating expenses to $62.9 million during the year ended December 31, 2015 from $38.1 million during the year ended December 31, 2014. This decrease is offset by a 6% reduction in production and ad valorem taxes to $17.8 million during the year ended December 31, 2015 from $18.9 million during the year ended December 31, 2014, which is directly related to the decrease in oil, natural gas and NGLs revenues for the same period.
Net Cash Used in Investing Activities. Net cash used in investing activities was approximately $1.9 billion, $427.2 million and $1.2 billion for the years ended December 31, 2016, 2015 and 2014, respectively.
The increased amount of cash used in investing activities in the year ended December 31, 2016 as compared to the year ended December 31, 2015 was due to the $1.3 billion increase in costs to acquire certain oil and natural gas properties.
The decrease in the amount of cash used in investing activities in the year ended December 31, 2015 as compared to the year ended December 31, 2014 is directly attributable to the $688.4 million decrease in acquisition activity and the $50.0 million increase related to proceeds received from the sale of oil and natural gas properties. The decrease during 2015 from 2014 is also due to fewer rigs operating during the year.
Net Cash Provided by Financing Activities. Net cash provided by financing activities was approximately $1.4 billion, $547.4 million and $1.1 billion for the years ended December 31, 2016, 2015 and 2014, respectively.
Net cash provided by financing activities increased during the year ended December 31, 2016, primarily due to increased debt and equity related activity. During the year ended 2016, we received net proceeds from equity offerings of $930.3 million and net proceeds from debt offerings of $549.7 million, excluding accrued and unpaid interest.
Net cash provided by financing activities decreased during the year ended December 31, 2015, primarily because of the $366.2 million increase in net debt payments in excess of borrowings during 2015 as compared to 2014. In addition our issuances of Class A Common Stock decreased by $198.3 million in 2015 as compared to issuances made in 2014.
Capital Sources
Revolving Credit Agreement. See Note 7—Debt to our consolidated financial statements included elsewhere in this Annual Report for a description of the Revolving Credit Agreement.
7.500% Senior Unsecured Notes due 2022. See Note 7—Debt to our consolidated financial statements included elsewhere in this Annual Report for a description of the 2022 Notes.
79
6.250% Senior Unsecured Notes due 2024. See Note 7—Debt to our consolidated financial statements included elsewhere in this Annual Report for information regarding our 6.250% senior unsecured notes due 2024.
5.3750% Senior Unsecured Notes due 2025. See Note 7—Debt to our consolidated financial statements included elsewhere in this Annual Report for information regarding the 2025 Notes.
Derivative Activity. We plan to continue our practice of entering into hedging arrangements to reduce the impact of commodity price volatility on our cash flow from operations. Under this strategy, we intend to continue our historical practice of entering into commodity derivative contracts at times and on terms desired to maintain a portfolio of commodity derivative contracts covering a portion of our projected oil production.
Working Capital. Our working capital totaled ($45.5) million, $259.8 million and ($16.7) million at December 31, 2016, 2015 and 2014, respectively. Our collection of receivables has historically been timely and losses associated with uncollectible receivables have historically not been significant. Our cash balances totaled $133.4 million, $343.1 million and $50.6 million at December 31, 2016, 2015 and 2014, respectively. The $209.7 million decrease in cash is primarily attributable to the $1.3 billion in acquisition costs described in Note 5—Acquisition of Oil and Natural Gas Properties offset by the receipt of proceeds for the sale of Class A Common Stock in conjunction with issuances of Class A Common Stock during the year as well as the receipt of proceeds in conjunction with the issuances of the Notes, as described in Note 7—Debt to our consolidated financial statements included elsewhere in this Annual Report. Due to the amounts that we accrue related to our drilling program, we may incur working capital deficits in the future. We believe that our cash on hand, cash flow from operations and availability under our Revolving Credit Agreement, will be sufficient to fund our working capital needs. We expect that our pace of development, production volumes, commodity prices and differentials to NYMEX prices for our oil and natural gas production will be the largest variables affecting our working capital.
Contractual Obligations
Our contractual obligations include long-term debt, cash interest expense on debt, operating lease obligations, drilling commitments, derivative liabilities and other obligations.
80
We had the following contractual obligations at December 31, 2016:
Payments Due by Period For the Year Ended December 31, | ||||||||||||||||||||||||||||
2017 | 2018 | 2019 | 2020 | 2021 | Thereafter | Total | ||||||||||||||||||||||
Revolving Credit Agreement (1) | $ | — | $ | — | $ | — | $ | — | $ | — | $ | — | $ | — | ||||||||||||||
Notes (2) | 3,500 | — | — | — | — | 1,050,000 | 1,053,500 | |||||||||||||||||||||
Interest (3) | 59,324 | 59,421 | 59,421 | 59,421 | 59,421 | 165,439 | 462,447 | |||||||||||||||||||||
Capital lease obligations (4) | 1,868 | 1,183 | 673 | 28 | — | — | 3,752 | |||||||||||||||||||||
Operating lease obligations (5) | 4,605 | 4,611 | 4,699 | 4,809 | 4,836 | 16,058 | 39,618 | |||||||||||||||||||||
Drilling commitments (6) | 21,118 | 5,940 | — | — | — | — | 27,058 | |||||||||||||||||||||
Asset retirement obligations (7) | 1,818 | 232 | 112 | 262 | 282 | 8,686 | 11,392 | |||||||||||||||||||||
Derivative obligations (8) | 23,268 | 6,600 | — | — | — | — | 29,868 | |||||||||||||||||||||
Total(9) | $ | 115,501 | $ | 77,987 | $ | 64,905 | $ | 64,520 | $ | 64,539 | $ | 1,240,183 | $ | 1,627,635 | ||||||||||||||
(1) | Does not include future commitment fees, amortization of deferred financing costs, interest expense or other fees related to the Revolving Credit Agreement because obligations thereunder are floating rate instruments and we cannot determine with accuracy the timing of future loan advances, repayments or future interest rates to be charged. | |
(2) | Includes principal only. Does not include the $61.8 million aggregate principal amount of the 2022 Notes redeemed on January 5, 2017 as discussed in Note 7—Debt. | |
(3) | Includes fixed rate interest on the 2024 Notes and 2025 Notes. | |
(4) | During 2015 and 2016, we entered into capital lease agreements payable in connection with the lease of vehicles for operations and field personnel. | |
(5) | We lease equipment and office facilities under non-cancellable operating leases. | |
(6) | We periodically enter into contractual arrangements under which we are committed to expend funds to drill wells in the future, including agreements to secure drilling rig services, which require us to make future minimum payments to the rig operators. We record drilling commitments in the periods in which well capital is incurred or rig services are provided. | |
(7) | Amounts represent estimates of future asset retirement obligations. Because these costs typically extend many years into the future, estimating these future costs requires management to make estimates and judgments that are subject to future revisions based upon numerous factors, including the rate of inflation, changing technology and the political and regulatory environment. | |
(8) | We enter into derivative agreements to hedge future production. We have deferred payment of the premium for certain agreements until the period of settlement. | |
(9) | These amounts do not include any contractual obligations incurred after December 31, 2016, including the issuance of our New 2025 Notes as discussed in Note 14-Subsequent Events to our consolidated financial statements included elsewhere in this Annual Report. | |
Critical Accounting Policies and Estimates
The discussion and analysis of our financial condition and results of operations are based upon our consolidated financial statements, which have been prepared in accordance with GAAP. The preparation of our financial statements requires us to make estimates and assumptions that affect the reported amounts of assets, liabilities, revenues and expenses and related disclosure of contingent assets and liabilities. Certain accounting policies involve judgments and uncertainties to such an extent that there is reasonable likelihood that materially different amounts could have been reported under different conditions, or if different assumptions had been used. We evaluate our estimates and assumptions on a regular basis. We base our estimates on historical experience and various other assumptions that are believed to be reasonable under the circumstances, the results of which form the basis for making judgments about the carrying values of assets and liabilities that are not readily apparent from other sources. Actual results may differ from these estimates and assumptions used in preparation of our consolidated financial statements. See below for an expanded discussion of our significant accounting policies and estimates made by management.
Successful Efforts Method of Accounting for Oil and Natural Gas Activities
Oil and natural gas exploration, development and production activities are accounted for in accordance with the successful efforts method of accounting. Under this method, costs of acquiring properties, costs of drilling successful exploration wells and development costs are capitalized.
81
The provision for DD&A of oil and natural gas properties is calculated on a reservoir basis using the unit-of-production method. All capitalized well costs and leasehold costs of proved properties are amortized on a unit-of-production basis over the remaining life of proved developed reserves and total proved reserves, respectively. Natural gas is converted to barrel equivalents at the rate of six thousand cubic feet of natural gas to one barrel of oil. The calculation for the unit-of-production DD&A method takes into consideration estimated future dismantlement, restoration and abandonment costs, which are net of estimated salvage values.
We capitalize interest on expenditures made in connection with long-term projects that are not subject to current depletion. Interest is capitalized only for the period that activities are in progress to bring these projects to their intended use and only to the extent we have incurred interest expense.
On the sale of a complete or partial unit of a proved property or pipeline and related facilities, the cost and related accumulated DD&A are removed from the property accounts and any gain or loss is recognized.
Expenditures for maintenance, repairs and minor renewals necessary to maintain properties in operating condition are expensed as incurred. Major betterments, replacements and renewals are capitalized to the appropriate property and equipment accounts. Estimated dismantlement and abandonment costs for oil and natural gas properties are capitalized, net of salvage, at their estimated net present value and amortized on a unit-of-production basis over the remaining life of the related proved developed reserves.
Exploration costs, other than exploration drilling costs, are charged to expense as incurred. These costs include seismic expenditures and other geological and geophysical costs, exploratory dry holes, amortization and impairment of unproved leasehold costs and lease rentals. The costs of exploratory wells and exploratory-type stratigraphic wells are initially capitalized pending a determination of whether proved reserves have been found. At the completion of drilling activities, the costs of exploratory wells remain capitalized if a determination is made that proved reserves have been found. If no proved reserves have been found, the costs of each of the related exploratory wells are charged to expense. In some cases, a determination of proved reserves cannot be made at the completion of drilling, requiring additional testing and evaluation of the wells. The costs of such exploratory wells are expensed if a determination of proved reserves has not been made within a 12-month period after drilling is complete. Under the successful efforts method, if an exploratory well does not find proved reserves, the costs of drilling the well are charged to expense. The costs of development wells are capitalized whether productive or nonproductive.
Unproved properties consist of costs incurred to acquire unproved leases, or lease acquisition costs. Unproved lease acquisition costs are capitalized until the leases expire or when we specifically identify leases that will revert to the lessor, at which time we expense the associated unproved lease acquisition costs. The expensing of the unproved lease acquisition costs is recorded in Exploration costs in our consolidated statement of operations. Lease acquisition costs related to successful exploratory drilling are reclassified to proved properties and depleted on a unit-of-production basis.
For sales of entire working interests in unproved properties, gain or loss is recognized to the extent of the difference between the proceeds received and the net carrying value of the property. Proceeds from sales of partial interests in unproved properties are accounted for as a recovery of costs unless the proceeds exceed the entire cost of the property.
Oil and Natural Gas Reserves and Standardized Measure of Discounted Net Future Cash Flows
This Annual Report presents estimates of our proved reserves as of December 31, 2016, which have been prepared and presented in accordance with SEC guidelines. The pricing that was used for estimates of our reserves as of December 31, 2016 was based on an unweighted first day of the month average 12- month WTI Phillips 66 posted price, net of differential, of $39.36 per Bbl for oil and $15.04 per Bbl for NGLs and a WAHA spot natural gas price, net of differential, of $2.23 per MMBtu for natural gas.
Our independent engineers and technical staff prepare the estimates of our oil and natural gas reserves and associated future net cash flows. Even though our independent engineers and technical staff are knowledgeable and follow authoritative guidelines for estimating reserves, they must make a number of subjective assumptions based on professional judgments in developing the reserve estimates. Reserve estimates are updated at least annually and consider recent production levels and other technical information about each field. Periodic revisions to the estimated reserves and future net cash flows may be necessary as a result of a number of factors, including reservoir performance, new drilling, oil and natural gas prices, cost changes, technological advances, new geological or geophysical data, or other economic factors. We cannot predict the amounts or timing of future reserve revisions. If such revisions are significant, they could significantly alter future depletion and result in impairment of long-lived assets that may be material.
82
It should not be assumed that the Standardized Measure included in this Annual Report as of December 31, 2016 is the current market value of our estimated proved reserves. In accordance with SEC requirements, we based the 2016 Standardized Measure on a 12-month average of commodity prices on the first day of the month and prevailing costs on the date of the estimate. Actual future prices and costs may be materially higher or lower than the prices and costs utilized in the estimate. See "Item 1A. Risk Factors" and "Item 2. Properties" for additional information regarding estimates of proved reserves.
Our estimates of proved reserves materially impact depletion expense. If the estimates of proved reserves decline, the rate at which we record depletion expense will increase, reducing future earnings. Such a decline may result from lower commodity prices, which may make it uneconomical to drill and produce higher cost fields. In addition, a decline in proved reserve estimates may impact the outcome of our assessment of our proved properties for impairment.
Asset Retirement Obligations
We have significant obligations to remove tangible equipment and facilities associated with our oil and natural gas wells and our service wells and to restore land at the end of oil and natural gas production operations. Our removal and restoration obligations are associated with plugging and abandoning wells and our gathering systems. Estimating the future restoration and removal costs is difficult and requires us to make estimates and judgments because most of the removal obligations are many years in the future and contracts and regulations often have vague descriptions of what constitutes removal. Asset removal technologies and costs are constantly changing, as are regulatory, political, environmental, safety and public relations considerations. Inherent in the present value calculations are numerous assumptions and judgments including the ultimate settlement amounts, inflation factors, credit adjusted discount rates, timing of settlements and changes in the legal, regulatory, environmental and political environments.
Allocation of Purchase Price in Business Combinations
As part of our business strategy, we regularly pursue the acquisition of oil and natural gas properties. The purchase price in an acquisition is allocated to the assets acquired and liabilities assumed based on their relative fair values as of the acquisition date, which may occur many months after the announcement date. Therefore, while the consideration to be paid may be fixed, the fair value of the assets acquired and liabilities assumed is subject to change during the period between the announcement date and the acquisition date. Our most significant estimates in our allocation typically relate to the value assigned to future recoverable oil and natural gas reserves and unproved properties. As the allocation of the purchase price is subject to significant estimates and subjective judgments, the accuracy of this assessment is inherently uncertain.
Impairment of Long-Lived Assets
All of our long-lived assets are monitored for potential impairment when circumstances indicate that the carrying value of an asset may be greater than its future net cash flows, including cash flows from risk adjusted proved reserves. The evaluations involve a significant amount of judgment since the results are based on estimated future events, such as future sales prices for oil and natural gas, future costs to produce these products, estimates of future oil and natural gas reserves to be recovered and the timing thereof, the economic and regulatory climates and other factors. The need to test an asset for impairment may result from significant declines in sales prices or downward revisions in estimated quantities of oil and natural gas reserves. Any assets held for sale are reviewed for impairment when we approve the plan to sell. Estimates of anticipated sales prices are highly judgmental and subject to material revision in future periods. Because of the uncertainty inherent in these factors, we cannot predict when or if future impairment charges will be recorded.
Equity Investments
Equity investments in which we exercise significant influence but do not control are accounted for using the equity method. Under the equity method, generally our share of investees’ earnings or loss, after elimination of intra-company profit or loss, is recognized in the consolidated statement of operations. We review its investments to determine if a loss in value which is other than a temporary decline has occurred. If such loss has occurred, we would recognize an impairment provision. There was no impairment for our equity investments for the years ended December 31, 2016, 2015 or 2014.
Derivatives
We use various financial instruments for non-trading purposes to manage and reduce price volatility and other market risks associated with our oil production. These arrangements are structured to reduce our exposure to commodity price decreases, but they can also limit the benefit we might otherwise receive from commodity price increases.
83
We apply the provisions of the "Derivatives and Hedging" topic of ASC 815, which requires each derivative instrument to be recorded at fair value. If a derivative has not been designated as a hedge or does not otherwise qualify for hedge accounting, it must be adjusted to fair value through earnings. We elected not to designate our current portfolio of commodity derivative contracts as hedges. Therefore, changes in fair value of these derivative instruments are recognized in earnings.
We enter into commodity derivative contracts for the purpose of economically hedging the price of our anticipated oil production even though we do not designate the derivatives as hedges for accounting purposes. We classify cash flows related to derivative contracts based on the nature and purpose of the derivative. As the derivative cash flows are considered an integral part of our oil and natural gas operations, they are classified as cash flows from operating activities in the consolidated statements of cash flows. All commodity derivative contracts we have entered into are for the purpose of economically hedging our anticipated oil production.
As required by GAAP, we utilize the most observable inputs available for the valuation technique used. The financial assets and liabilities are classified in their entirety based on the lowest level of input that is of significance to the fair value measurement. Our assessment of the significance of a particular input to the fair value measurement requires judgment and may affect the valuation of the financial assets and liabilities. Fair values of swaps are estimated using a combined income-based and market-based valuation methodology based upon forward commodity price curves obtained from independent pricing services. Settlement is determined by the average underlying price over a predetermined period of time. We use observable inputs in an option pricing valuation model to determine fair value such as: (i) current market and contractual prices for the underlying instruments; (ii) quoted forward prices for oil; (iii) interest rates, such as a LIBOR curve for a term similar to the commodity derivative contract; and (iv) appropriate volatilities.
Please read "Item 7A. Quantitative and Qualitative Disclosures about Market Risk" for additional information regarding our commodity derivative contracts.
Income Taxes
We account for income taxes using the asset and liability method. Deferred tax assets and liabilities are recognized for the future tax consequences attributable to differences between the financial statement carrying amounts of existing assets and liabilities and their respective tax bases and operating loss and tax credit carryforwards. Deferred tax assets and liabilities are measured using enacted tax laws and rates expected to apply to taxable income in the years in which those temporary differences are expected to be recovered or settled. The effect of a change in tax rates on deferred tax assets and liabilities is recognized in income in the period that includes the enactment date.
We periodically assess whether it is more likely than not that we will generate sufficient taxable income to realize our deferred income tax assets, including net operating losses. In making this determination, we consider all available positive and negative evidence and make certain assumptions. We consider, among other things, our deferred tax liabilities, the overall business environment, our historical earnings and losses, current industry trends and our outlook for future years.
Our federal and state income tax returns are generally not prepared or filed before the consolidated financial statements are prepared; therefore, we estimate the tax basis of our assets and liabilities, which are based on numerous judgments and assumptions inherent in the determination of future taxable income, at the end of each period as well as the effects of tax rate changes and tax credits. Adjustments related to these estimates are recorded in our tax provision in the period in which we finalize our income tax returns. Material changes to our tax accruals may occur in the future based on audits, changes in legislation or resolution of pending matters.
Deferred Tax Asset Valuation Allowances
We continually assesses both positive and negative evidence to determine whether it is more likely than not that deferred tax assets, if any, will be realized prior to their expiration. This includes monitoring Company-specific, oil and natural gas industry and worldwide economic factors and reassessing the likelihood that our net operating loss carryforwards and other deferred tax attributes in each jurisdiction will be utilized prior to their expiration. There can be no assurance that facts and circumstances will not materially change and require us to establish additional deferred tax asset valuation allowances in a future period.
Inflation
Inflation in the United States has been relatively low in recent years and did not have a material impact on results of operations for the years ended December 31, 2016, 2015 and 2014. Although the impact of inflation has been insignificant in
84
recent years, it is still a factor in the United States economy and we tend to experience inflationary pressure on the cost of oilfield services and equipment as increasing oil and natural gas prices increase drilling activity in our areas of operations.
Off-Balance Sheet Arrangements
As of December 31, 2016, we had no material off-balance sheet arrangements.
85
ITEM 7A. QUANTITATIVE AND QUALITATIVE DISCLOSURES ABOUT MARKET RISK
We are exposed to market risk, including the effects of adverse changes in commodity prices and interest rates as described below. The primary objective of the following information is to provide quantitative and qualitative information about our potential exposure to market risks. The term "market risk" refers to the risk of loss arising from adverse changes in the prices of the commodities we sell. The disclosures are not meant to be precise indicators of expected future losses, but rather indicators of reasonably possible losses. All of our market risk sensitive instruments were entered into for purposes other than speculative trading.
Commodity Price Risk
Our major market risk exposure is in the pricing that we receive for our oil production. Pricing for oil has been volatile and unpredictable for several years and this volatility is expected to continue in the future. The prices we receive for our oil production depend on many factors outside of our control, such as the strength of the global economy and global supply and demand for the commodities we produce.
To reduce the impact of fluctuations in oil prices on our production revenues, we periodically enter into commodity derivative contracts with respect to certain of our oil production through various transactions that limit the downside of future prices received. We plan to continue our practice of entering into such transactions to reduce the impact of commodity price volatility on our cash flow from operations. Future transactions may include price swaps whereby we will receive a fixed price for our production and pay a variable market price to the contract counterparty. Additionally, we may enter into collars, whereby we receive the excess, if any, of the fixed floor over the floating rate or pay the excess, if any, of the floating rate over the fixed ceiling price. These hedging activities are intended to support oil prices at targeted levels and to manage our exposure to oil price fluctuations. For a description of our open positions at December 31, 2016, see Note 3—Derivative Financial Instruments to our consolidated financial statements included elsewhere in this Annual Report.
We do not require collateral from our counterparties for entering into derivative instruments, so in order to mitigate the credit risk associated with such derivative instruments, we typically enter into an International Swap Dealers Association Master Agreement ("ISDA Agreement") with our counterparties. The ISDA Agreement is a standardized, bilateral contract between a given counterparty and us. Instead of treating each derivative transaction between the counterparty and us separately, the ISDA Agreement enables the counterparty and us to aggregate all trades under such agreement and treat them as a single agreement. This arrangement is intended to benefit us in two ways: (i) default by a counterparty under a single trade can trigger rights to terminate all trades with such counterparty that are subject to the ISDA Agreement; and (ii) netting of settlement amounts reduces our credit exposure to a given counterparty in the event of close-out.
As of December 31, 2016, the fair market value of our oil and natural gas derivative contracts was a net liability of $0.8 million, including deferred premium payables of $29.9 million. The deferred premium payable is a fixed amount and is not marked to fair market value. As of December 31, 2016, the fair market value of our oil derivative contracts was a net liability of $0.1 million. Based on our open oil derivative positions at December 31, 2016, a 10% increase in the NYMEX WTI price would increase our net oil derivative liability by approximately $9.3 million, while a 10% decrease in the NYMEX WTI price would decrease our net oil derivative liability by approximately $18.2 million. As of December 31, 2016, the fair market value of our natural gas derivative contracts was a net liability of $0.7 million. Based on our open natural gas derivative positions at December 31, 2016, a 10% increase in the NYMEX Henry Hub price would increase our net natural gas derivative liability by approximately $0.9 million, while a 10% decrease in the NYMEX Henry Hub price would decrease our natural gas derivative liability by approximately $0.6 million. Please read "Item 7. Management’s Discussion and Analysis of Financial Condition and Results of Operations—Overview—Realized Prices on the Sale of Oil, Natural Gas and NGLs."
Counterparty Risk
Our derivative contracts expose us to credit risk in the event of nonperformance by counterparties. While we do not require our counterparties to our derivative contracts to post collateral, we do evaluate the credit standing of such counterparties as we deem appropriate. This evaluation includes reviewing a counterparty’s credit rating and latest financial information. We plan to continue to evaluate the credit standings of our counterparties in a similar manner. The majority of our derivative contracts currently in place are with lenders under our Revolving Credit Agreement, who have investment grade ratings.
86
Interest Rate Risk
Our market risk exposure related to changes in interest rates relates primarily to debt obligations. We are exposed to changes in interest rates as a result of our Revolving Credit Agreement, which requires us to pay higher interest rate margins as we utilize a larger percentage of our available commitments. As of December 31, 2016, however, we had no outstanding borrowings related to our Revolving Credit Agreement and therefore an increase in interest rates will not result in increased interest expense until such time that we determine to make borrowings under our Revolving Credit Agreement.
87
ITEM 8. FINANCIAL STATEMENTS AND SUPPLEMENTARY DATA
Our consolidated financial statements and supplementary data are included in this Annual Report beginning on page F-1.
ITEM 9. CHANGES IN AND DISAGREEMENTS WITH ACCOUNTANTS ON ACCOUNTING AND FINANCIAL DISCLOSURE
None.
ITEM 9A. CONTROLS AND PROCEDURES
Evaluation of Disclosure Controls and Procedures
In accordance with Exchange Act Rules 13a-15 and 15d-15, we have evaluated, under the supervision and with the participation of our management, including our principal executive officer and principal financial officer, the effectiveness of the design and operation of our disclosure controls and procedures (as defined in Rules 13a-15(e) and 15d-15(e) under the Exchange Act) as of December 31, 2016. Our disclosure controls and procedures are designed to provide reasonable assurance that the information required to be disclosed by us in reports that we file or submit under the Exchange Act is accumulated and communicated to our management, including our principal executive officer and principal financial officer, as appropriate to allow timely decisions regarding required disclosure and is recorded, processed, summarized and reported within the time periods specified in the rules and forms of the SEC. Based upon that evaluation, our principal executive officer and principal financial officer concluded that our disclosure controls and procedures were effective as of December 31, 2016, at the reasonable assurance level.
Management’s Annual Report on Internal Control over Financial Reporting and Attestation Report of the Registered Public Accounting Firm
Our management, including our principal executive officer and principal financial officer, is responsible for establishing and maintaining adequate internal control over financial reporting as defined in Rule 13a-15(f) under the Exchange Act. Our internal control over financial reporting is designed to provide reasonable assurance regarding the reliability of financial reporting and the preparation of our consolidated financial statements for external purposes in accordance with GAAP.
Because of its inherent limitations, internal control over financial reporting may not prevent or detect misstatements. Also, projections of any evaluation of effectiveness to future periods are subject to the risk that controls may become inadequate because of changes in conditions, or that the degree of compliance with the policies or procedures may deteriorate.
Our management assessed the effectiveness of the Company's internal control over financial reporting as of December 31, 2016, using the criteria in Internal Control-Integrated Framework (2013) issued by the Committee of Sponsoring Organizations of the Treadway Commission (COSO). Based on this evaluation, our management believes that our internal control over financial reporting was effective as of December 31, 2016.
This Annual Report includes an attestation report of KPMG LLP, our independent registered public accounting firm, on our internal control over financial reporting as of December 31, 2016, which is included in this Annual Report on page F-3.
Changes in Internal Control over Financial Reporting
There were no changes in our system of internal control over financial reporting (as defined in Rule 13a-15(f) and Rule 15d-15(f) under the Exchange Act) during the quarter ended December 31, 2016, that have materially affected, or are reasonably likely to materially affect, our internal control over financial reporting.
ITEM 9B. OTHER INFORMATION
None.
88
PART III
ITEM 10. DIRECTORS, EXECUTIVE OFFICERS AND CORPORATE GOVERNANCE
The information required in response to this item will be set forth in our definitive proxy statement for the 2017 annual meeting of stockholders and is incorporated herein by reference.
Section 16(a) Beneficial Ownership Reporting Compliance
The information required in response to this item will be set forth in our definitive proxy statement for the 2017 annual meeting of stockholders and is incorporated herein by reference.
ITEM 11. EXECUTIVE COMPENSATION
The information required in response to this item will be set forth in our definitive proxy statement for the 2017 annual meeting of stockholders and is incorporated herein by reference.
ITEM 12. SECURITY OWNERSHIP OF CERTAIN BENEFICIAL OWNERS AND MANAGEMENT AND RELATED STOCKHOLDER MATTERS
The information required in response to this item will be set forth in our definitive proxy statement for the 2017 annual meeting of stockholders and is incorporated herein by reference.
ITEM 13. CERTAIN RELATIONSHIPS AND RELATED TRANSACTIONS, AND DIRECTOR INDEPENDENCE
The information required in response to this item will be set forth in our definitive proxy statement for the 2017 annual meeting of stockholders and is incorporated herein by reference.
ITEM 14. PRINCIPAL ACCOUNTING FEES AND SERVICES
The information required in response to this item will be set forth in our definitive proxy statement for the 2017 annual meeting of stockholders and is incorporated herein by reference.
89
PART IV
ITEM 15. EXHIBITS, FINANCIAL STATEMENT SCHEDULES
1. | The following documents are filed as part of this Annual Report or incorporated by reference: |
a. | Financial Statements: |
Our consolidated financial statements are included under Part II, Item 8 of this Annual Report. For a listing of these statements and accompanying footnotes, see "Index to consolidated Financial Statements" on page F-1 of this Annual Report.
b. | Financial Statement Schedules: |
All financial statement schedules have been omitted because they are not applicable or the required information is presented in the consolidated financial statements and related notes.
2. | Exhibits |
The exhibits required to be filed by this Item 15 are set forth in the Exhibit Index included within this Annual Report.
90
EXHIBIT INDEX
Exhibit No. | Description | |
2.1 | Agreement and Plan of Merger, dated as of May 29, 2014, by and between Parsley Energy Employee Holdings, LLC and Parsley Energy, Inc. (incorporated by reference to Exhibit 2.1 to the Company’s Current Report on Form 8-K, File No. 001-36463, filed with the SEC on June 4, 2014). | |
2.2# | Purchase and Sale Agreement, dated as of June 4, 2014, by and among OGX Production, LP, OGX Operating, LLC and Parsley Energy, L.P. (incorporated by reference to Exhibit 2.2 to the Company’s Current Report on Form 8-K, File No. 001-36463, filed with the SEC on June 4, 2014). | |
2.3# | Purchase and Sale Agreement, dated as of March 27, 2014, by and between Pacer Energy, Ltd and Parsley Energy, L.P. (incorporated by reference to Exhibit 2.3 to the Company’s Quarterly Report on Form 10-Q, File No. 001-36463, filed with the SEC on August 14, 2014). | |
2.4# | First Amendment to Purchase and Sale Agreement and Waiver of Conditions Precedent, dated as of May 1, 2014, by and between Pacer Energy, Ltd. and Parsley Energy, L.P. (incorporated by reference to Exhibit 2.4 to the Company’s Quarterly Report on Form 10-Q, File No. 001-36463, filed with the SEC on August 14, 2014). | |
2.5# | Purchase and Sale Agreement, dated as of August 19, 2014, by and between Cimarex Energy Co. and Parsley Energy, L.P. (incorporated by reference to Exhibit 2.1 to the Company’s Current Report on Form 8-K, File No. 001-36463, filed with the SEC on August 25, 2014). | |
2.6# | Asset Purchase Agreement, dated October 20, 2015, by and between Parsley Energy, L.P. and ExL Petroleum Management, LLC (incorporated by reference to Exhibit 2.1 to the Company’s Current Report on Form 8-K, File No. 001-36463, filed with the SEC on December 16, 2015). | |
2.7# | Purchase and Sale Agreement, dated August 15, 2016, by and between Parsley Energy, L.P. and BTA Oil Producers, LLC, et al. (incorporated by reference to Exhibit 2.1 to the Company’s Current Report on Form 8-K, File No. 001-36463, filed with the SEC on October 5, 2016). | |
2.8# | First Amendment to Purchase and Sale Agreement, dated October 4, 2016, by and between Parsley Energy, L.P. and BTA Oil Producers, LLC, et al. (incorporated by reference to Exhibit 2.2 to the Company’s Current Report on Form 8-K, File No. 001-36463, filed with the SEC on October 5, 2016). | |
3.1 | Amended and Restated Certificate of Incorporation of Parsley Energy, Inc. (incorporated by reference to Exhibit 3.1 to the Company’s Current Report on Form 8-K, File No. 001-36463, filed with the SEC on June 4, 2014). | |
3.2 | Amended and Restated Bylaws of Parsley Energy, Inc., dated October 28, 2016 (incorporated by reference to Exhibit 3.1 to the Company’s Current Report on Form 8-K, File No. 001-36463, filed with the SEC on November 2, 2016). | |
4.1 | Specimen Class A Common Stock Certificate (incorporated by reference to Exhibit 4.1 to Amendment No. 2 to the Company’s Registration Statement on Form S-1, File No. 333-195230, filed with the SEC on May 12, 2014). | |
4.2 | Indenture, dated May 27, 2016, by and among Parsley Energy, LLC, Parsley Finance Corp., the subsidiary guarantors named therein and U.S. Bank National Association, as trustee (incorporated by reference to Exhibit 4.1 to the Company’s Current Report on Form 8-K, File No. 001-36463, filed with the SEC on May 27, 2016). | |
4.3 | First Supplemental Indenture, dated August 18, 2016, by and among Parsley Energy, LLC, Parsley Finance Corp., the subsidiary guarantors named therein and U.S. Bank National Association, as trustee. (incorporated by reference to Exhibit 4.2 to the Company’s Current Report on Form 8-K, File No. 001-36463, filed with the SEC on August 19, 2016). | |
4.4 | Second Supplemental Indenture, dated October 27, 2016, by and among Parsley Energy, LLC, Parsley Finance Corp., the subsidiary guarantors named therein and U.S. Bank National Association, as trustee (incorporated by reference to Exhibit 4.5 to the Company’s Quarterly Report on Form 10-Q, File No. 001-36463, filed with the SEC on November 4, 2016). | |
4.5 | Indenture, dated December 13, 2016, by and among Parsley Energy, LLC, Parsley Finance Corp., the subsidiary guarantors named therein and U.S. Bank National Association, as trustee (incorporated by reference to Exhibit 4.1 to the Company’s Current Report on Form 8-K, File No. 001-36463, filed with the SEC on December 13, 2016). | |
4.6 | Amended and Restated Registration Rights Agreement, dated as of May 29, 2014, by and among Parsley Energy, LLC, Parsley Energy, Inc. and each of the parties listed as Owners on the signature pages thereto (incorporated by reference to Exhibit 4.1 to the Company’s Current Report on Form 8-K, File No. 001-36463, filed with the SEC on June 4, 2014). | |
91
Exhibit No. | Description | |
10.1 | Credit Agreement, dated October 28, 2016, by and between Parsley Energy, LLC, as borrower, Parsley Energy, Inc., Wells Fargo Bank, National Association, as administrative agent, JPMorgan Chase Bank, N.A., as syndication agent, BMO Harris Bank, N.A., as documentation agent and the lenders party thereto (incorporated by reference to Exhibit 10.1 to the Company’s Current Report on Form 8-K, File No. 001-36463, filed with the SEC on November 2, 2016). | |
10.2 | Purchase Agreement, dated May 24, 2016, by and among Parsley Energy, LLC, Parsley Finance Corp., the subsidiary guarantors named therein and Credit Suisse Securities (USA) LLC, as representative of the several initial purchasers named therein (incorporated by reference to Exhibit 10.1 to the Company’s Current Report on Form 8-K, File No. 001-36463, filed with the SEC on May 27, 2016). | |
10.3 | Purchase Agreement, dated August 16, 2016, by and among Parsley Energy, LLC, Parsley Finance Corp., the subsidiary guarantors named therein and J.P. Morgan Securities LLC, as representative of the several initial purchasers named therein (incorporated by reference to Exhibit 10.1 to the Company’s Current Report on Form 8-K, File No. 001-36463, filed with the SEC on August 19, 2016). | |
10.4 | Purchase Agreement, dated December 6, 2016, by and among Parsley Energy, LLC, Parsley Finance Corp., the subsidiary guarantors named therein and Credit Suisse Securities (USA) LLC, as representative of the several initial purchasers named therein (incorporated by reference to Exhibit 10.1 to the Company’s Current Report on Form 8-K, File No. 001-36463, filed with the SEC on December 7, 2016). | |
10.5† | Employment Agreement, dated as of January 23, 2014, by and between Parsley Energy Operations, LLC and Bryan Sheffield (incorporated by reference to Exhibit 10.8 to the Company’s Registration Statement on Form S-1, File No. 333-195230, filed with the SEC on April 11, 2014). | |
10.6† | First Amendment to Employment, Confidentiality and Non-Competition Agreement, dated as of September 30, 2016, by and between Parsley Energy Operations, LLC and Bryan Sheffield (incorporated by reference to Exhibit 10.3 to the Company’s Quarterly Report on Form 10-Q, File No. 001-36463, filed with the SEC on November 4, 2016). | |
10.7† | Employment, Confidentiality and Non-Competition Agreement, dated as of February 4, 2014, by and between Parsley Energy Operations, LLC and Ryan Dalton (incorporated by reference to Exhibit 10.12 to the Company’s Annual Form 10-K, File No. 001-36463, filed with the SEC on February 29, 2016). | |
10.8† | First Amendment to Employment, Confidentiality and Non-Competition Agreement, dated as of September 30, 2016, by and between Parsley Energy Operations, LLC and Ryan Dalton (incorporated by reference to Exhibit 10.4 to the Company’s Quarterly Report on Form 10-Q, File No. 001-36463, filed with the SEC on November 4, 2016). | |
10.9† | Amended and Restated Employment Agreement, dated as of December 8, 2014, by and between Parsley Energy Operations, LLC and Colin Roberts (incorporated by reference to Exhibit 10.1 to the Company’s Current Report on Form 8-K, File No. 001-36463, filed with the SEC on December 9, 2014). | |
10.10† | First Amendment to Employment, Confidentiality and Non-Competition Agreement, dated as of September 30, 2016, by and between Parsley Energy Operations, LLC and Colin Roberts (incorporated by reference to Exhibit 10.6 to the Company’s Quarterly Report on Form 10-Q, File No. 001-36463, filed with the SEC on November 4, 2016). | |
10.11† | Employment Agreement, dated as of February 13, 2014, by and between Parsley Energy Operations, LLC and Matthew Gallagher (incorporated by reference to Exhibit 10.10 to the Company’s Registration Statement on Form S-1, File No. 333-195230, filed with the SEC on April 11, 2014). | |
10.12† | First Amendment to Employment, Confidentiality and Non-Competition Agreement, dated as of September 30, 2016, by and between Parsley Energy Operations, LLC and Matthew Gallagher (incorporated by reference to Exhibit 10.5 to the Company’s Quarterly Report on Form 10-Q, File No. 001-36463, filed with the SEC on November 4, 2016). | |
10.13† | Employment Agreement, dated as of December 8, 2014, by and between Parsley Energy Operations, LLC and Thomas Layman (incorporated by reference to Exhibit 10.12 to the Company’s Annual Report on Form 10-K, File No. 001-36463, filed with the SEC on March 11, 2015). | |
10.14† | First Amendment to Employment, Confidentiality and Non-Competition Agreement, dated as of September 30, 2016, by and between Parsley Energy Operations, LLC and Thomas Layman (incorporated by reference to Exhibit 10.7 to the Company’s Quarterly Report on Form 10-Q, File No. 001-36463, filed with the SEC on November 4, 2016). | |
92
Exhibit No. | Description | |
10.15† | Form of Vice President Employment, Confidentiality and Non-Competition Agreement (incorporated by reference to Exhibit 10.11 to the Company’s Quarterly Report on Form 10-Q, File No. 001-36463, filed with the SEC on November 4, 2016). | |
10.16† | Form of First Amendment to Vice President Employment, Confidentiality and Non-Competition Agreement (incorporated by reference to Exhibit 10.12 to the Company’s Quarterly Report on Form 10-Q, File No. 001-36463, filed with the SEC on November 4, 2016). | |
10.17 | Master Reorganization Agreement, dated as of May 2, 2014, by and among Parsley Energy, Inc., NGP X US Holdings, L.P., Parsley Energy, LLC, the persons identified on the signature page thereto as Existing Members and Parsley Energy Employee Holdings, LLC (incorporated by reference to Exhibit 10.1 to the Company’s Current Report on Form 8-K, File No. 001-36463, filed with the SEC on May 28, 2014). | |
10.18 | First Amended and Restated Limited Liability Company Agreement of Parsley Energy, LLC (incorporated by reference to Exhibit 10.1 to the Company’s Current Report on Form 8-K, File No. 001-36463, filed with the SEC on June 4, 2014). | |
10.19 | Tax Receivable Agreement, dated as of May 29, 2014, by and among Parsley Energy, Inc., certain members of Parsley Energy, LLC and Bryan Sheffield (incorporated by reference to Exhibit 10.2 to the Company’s Current Report on Form 8-K, File No. 001-36463, filed with the SEC on June 4, 2014). | |
10.20† | Indemnification Agreement, dated as of May 14, 2014, by and between Parsley Energy, Inc. and Bryan Sheffield (incorporated by reference to Exhibit 10.3 to the Company’s Current Report on Form 8-K, File No. 001-36463, filed with the SEC on June 4, 2014). | |
10.21† | Indemnification Agreement, dated as of May 14, 2014, by and between Parsley Energy, Inc. and Ryan Dalton (incorporated by reference to Exhibit 10.4 to the Company’s Current Report on Form 8-K, File No. 001-36463, filed with the SEC on June 4, 2014). | |
10.22† | Indemnification Agreement, dated as of May 14, 2014, by and between Parsley Energy, Inc. and Michael Hinson (incorporated by reference to Exhibit 10.5 to the Company’s Current Report on Form 8-K, File No. 001-36463, filed with the SEC on June 4, 2014). | |
10.23† | Indemnification Agreement, dated as of May 14, 2014, by and between Parsley Energy, Inc. and Matt Gallagher (incorporated by reference to Exhibit 10.6 to the Company’s Current Report on Form 8-K, File No. 001-36463, filed with the SEC on June 4, 2014). | |
10.24† | Indemnification Agreement, dated as of May 14, 2014, by and between Parsley Energy, Inc. and Paul Treadwell (incorporated by reference to Exhibit 10.7 to the Company’s Current Report on Form 8-K, File No. 001-36463, filed with the SEC on June 4, 2014). | |
10.25† | Indemnification Agreement, dated as of May 14, 2014, by and between Parsley Energy, Inc. and Thomas Layman (incorporated by reference to Exhibit 10.8 to the Company’s Current Report on Form 8-K, File No. 001-36463, filed with the SEC on June 4, 2014). | |
10.26† | Indemnification Agreement, dated as of May 14, 2014, by and between Parsley Energy, Inc. and Colin Roberts (incorporated by reference to Exhibit 10.9 to the Company’s Current Report on Form 8-K, File No. 001-36463, filed with the SEC on June 4, 2014). | |
10.27† | Indemnification Agreement, dated as of May 14, 2014, by and between Parsley Energy, Inc. and Chris Carter (incorporated by reference to Exhibit 10.10 to the Company’s Current Report on Form 8-K, File No. 001-36463, filed with the SEC on June 4, 2014). | |
10.28† | Indemnification Agreement, dated as of May 14, 2014, by and between Parsley Energy, Inc. and David Smith (incorporated by reference to Exhibit 10.11 to the Company’s Current Report on Form 8-K, File No. 001-36463, filed with the SEC on June 4, 2014). | |
10.29† | Indemnification Agreement, dated as of May 14, 2014, by and between Parsley Energy, Inc. and A.R. Alameddine (incorporated by reference to Exhibit 10.12 to the Company’s Current Report on Form 8-K, File No. 001-36463, filed with the SEC on June 4, 2014). | |
10.30† | Indemnification Agreement, dated as of May 14, 2014, by and between Parsley Energy, Inc. and Randy Newcomer (incorporated by reference to Exhibit 10.13 to the Company’s Current Report on Form 8-K, File No. 001-36463, filed with the SEC on June 4, 2014). | |
10.31† | Indemnification Agreement, dated as of July 23, 2014, by and between Parsley Energy, Inc. and Hemang Desai (incorporated by reference to Exhibit 10.1 to the Company’s Current Report on Form 8-K, File No. 001-36463, filed with the SEC on July 24, 2014). | |
93
Exhibit No. | Description | |
10.32† | Indemnification Agreement, dated as of August 19, 2014, by and between Parsley Energy, Inc. and William Browning (incorporated by reference to Exhibit 10.1 to the Company’s Current Report on Form 8-K, File No. 001-36463, filed with the SEC on August 25, 2014). | |
10.33† | Indemnification Agreement, dated as of August 19, 2014, by and between Parsley Energy, Inc. and Brad Smith (incorporated by reference to Exhibit 10.32 to the Company’s Annual Report on Form 10-K, File No. 001-36463, filed with the SEC on February 29, 2016). | |
10.34† | Indemnification Agreement, dated as of January 1, 2016, by and between Parsley Energy, Inc. and Cecilia Camarillo (incorporated by reference to Exhibit 10.33 to the Company’s Annual Report on Form 10-K, File No. 001-36463, filed with the SEC on February 29, 2016). | |
10.35† | Indemnification Agreement, dated as of March 23, 2016, by and between Parsley Energy, Inc. and Ronald Brokmeyer (incorporated by reference to Exhibit 10.1 to the Company’s Current Report on Form 8-K, File No. 001-36463, filed with the SEC on March 23, 2016). | |
10.36† | Indemnification Agreement, dated as of April 1, 2016, by and between Parsley Energy, Inc. and Stephanie Reed (incorporated by reference to Exhibit 10.13 to the Company’s Quarterly Report on Form 10-Q, File No. 001-36463, filed with the SEC on November 4, 2016). | |
10.37† | Indemnification Agreement, dated as of July 26, 2016, by and between Parsley Energy, Inc. and Larry Parnell (incorporated by reference to Exhibit 10.14 to the Company’s Quarterly Report on Form 10-Q, File No. 001-36463, filed with the SEC on November 4, 2016). | |
10.38† | Indemnification Agreement, dated as of December 21, 2016, by and between Parsley Energy, Inc. and Jerry Windlinger (incorporated by reference to Exhibit 10.1 to the Company’s Current Report on Form 8-K, File No. 001-36463, filed with the SEC on December 21, 2016). | |
10.39* | Indemnification Agreement, dated as of January 5, 2017, by and between Parsley Energy, Inc. and Kristin McClure. | |
10.40* | Indemnification Agreement, dated as of January 5, 2017, by and between Parsley Energy, Inc. and Mark Timmons. | |
10.41* | Indemnification Agreement, dated as of January 5, 2017, by and between Parsley Energy, Inc. and Mark Brown. | |
10.42† | Amended and Restated Parsley Energy, Inc. 2014 Long Term Incentive Plan (incorporated by reference to Exhibit 10.30 to the Company’s Annual Report on Form 10-K, File No. 001-36463, filed with the SEC on March 11, 2015). | |
10.43† | Form of Restricted Stock Agreement (incorporated by reference to Exhibit 10.16 to Amendment No. 2 to the Company’s Registration Statement on Form S-1, File No. 333-195230, filed with the SEC on May 12, 2014). | |
10.44† | First Amendment to Form of Restricted Stock Agreement (incorporated by reference to Exhibit 10.9 to the Company’s Quarterly Report on Form 10-Q, File No. 001-36463, filed with the SEC on November 4, 2016). | |
10.45† | New Form of Restricted Stock Agreement (incorporated by reference to Exhibit 10.8 to the Company’s Quarterly Report on Form 10-Q, File No. 001-36463, filed with the SEC on November 4, 2016). | |
10.46† | Form of Notice of Grant of Restricted Stock (Time-Based) (incorporated by reference to Exhibit 10.10 to the Company’s Quarterly Report on Form 10-Q, File No. 001-36463, filed with the SEC on November 4, 2016). | |
10.47† | Form of Notice of Grant of Restricted Stock (Performance-Based) (incorporated by reference to Exhibit 10.18 to Amendment No. 2 to the Company’s Registration Statement on Form S-1, File No. 333-195230, filed with the SEC on May 12, 2014). | |
10.48† | Form of Restricted Stock Unit Agreement (incorporated by reference to Exhibit 10.34 to the Company’s Annual Report on Form 10-K, File No. 001-36463, filed with the SEC on March 11, 2015). | |
10.49† | Form of Notice of Grant of Restricted Stock Units (Time-Based) (incorporated by reference to Exhibit 10.35 to the Company’s Annual Report on Form 10-K, File No. 001-36463, filed with the SEC on March 11, 2015). | |
10.50† | Form of Notice of Grant of Restricted Stock Units (Performance-Based) (incorporated by reference to Exhibit 10.36 to the Company’s Annual Report on Form 10-K, File No. 001-36463, filed with the SEC on March 11, 2015). | |
21.1* | List of Subsidiaries of Parsley Energy, Inc. | |
94
Exhibit No. | Description | |
23.1* | Consent of KPMG LLP. | |
23.2* | Consent of Netherland, Sewell & Associates, Inc. | |
31.1* | Certification of Chief Executive Officer pursuant to Section 302 of the Sarbanes-Oxley Act of 2002. | |
31.2* | Certification of Chief Financial Officer pursuant to Section 302 of the Sarbanes-Oxley Act of 2002. | |
32.1** | Certification of Chief Executive Officer pursuant to 18 U.S.C. § 1350, as adopted pursuant to Section 906 of the Sarbanes-Oxley Act of 2002. | |
32.2** | Certification of Chief Financial Officer pursuant to 18 U.S.C. § 1350, as adopted pursuant to Section 906 of the Sarbanes-Oxley Act of 2002. | |
99.1* | Netherland, Sewell & Associates, Inc. Audit Letter. | |
101.INS* | XBRL Instance Document. | |
101.SCH* | XBRL Taxonomy Extension Schema Document. | |
101.CAL* | XBRL Taxonomy Extension Calculation Linkbase Document. | |
101.DEF* | XBRL Taxonomy Extension Definition Linkbase Document. | |
101.LAB* | XBRL Taxonomy Extension Labels Linkbase Document. | |
101.PRE* | XBRL Taxonomy Extension Labels Linkbase Document. | |
† | Management contract or compensatory plan or agreement |
* | Filed herewith. |
** | Furnished herewith. Pursuant to SEC Release No. 33-8212, this certification will be treated as "accompanying" this Annual Report on Form 10-K and not "filed" as part of such report for purposes of Section 18 of the Exchange Act or otherwise subject to the liability of Section 18 of the Exchange Act and this certification will not be deemed to be incorporated by reference into any filing under the Securities Act of 1933, except to the extent that the registrant specifically incorporates it by reference. |
# | Schedules and similar attachments have been omitted pursuant to Item 601(b)(2) of Regulation S-K. The registrant will furnish a supplemental copy of any omitted schedule or similar attachment to the Commission upon request. |
95
SIGNATURES
Pursuant to the requirements of Section 13 or 15(d) of the Securities Exchange Act of 1934, the registrant has duly caused this report to be signed on its behalf by the undersigned thereunto duly authorized.
February 27, 2017 | By: | /s/ Bryan Sheffield | ||
Bryan Sheffield | ||||
Chairman, Chief Executive Officer | ||||
Pursuant to the requirements of the Securities Exchange Act of 1934, this report has been signed below by the following persons on behalf of the registrant and in the capacities and on the dates indicated.
February 27, 2017 | By: | /s/ Bryan Sheffield | ||
Bryan Sheffield | ||||
Chairman, Chief Executive Officer (Principal Executive Officer) | ||||
February 27, 2017 | By: | /s/ Ryan Dalton | ||
Ryan Dalton | ||||
Executive Vice President—Chief Financial Officer (Principal Accounting and Financial Officer) | ||||
February 27, 2017 | By: | /s/ A.R. Almeddine | ||
A.R. Alameddine | ||||
Director | ||||
February 27, 2017 | By: | /s/ Ronald Brokmeyer | ||
Ronald Brokmeyer | ||||
Director | ||||
February 27, 2017 | By: | /s/ William Browning | ||
William Browning | ||||
Director | ||||
February 27, 2017 | By: | /s/ Hemang Desai | ||
Hemang Desai | ||||
Director | ||||
February 27, 2017 | By: | /s/ David H. Smith | ||
David H. Smith | ||||
Director | ||||
February 27, 2017 | By: | /s/ Jerry Windlinger | ||
Jerry Windlinger | ||||
Director | ||||
96
Index to Consolidated Financial Statements
Page | |
F-1
Report of Independent Registered Public Accounting Firm
The Board of Directors and Stockholders
Parsley Energy, Inc.:
We have audited the accompanying consolidated balance sheets of Parsley Energy, Inc. and subsidiaries (the Company) as of December 31, 2016 and 2015, and the related consolidated statements of operations, changes in equity, and cash flows for each of the years in the three-year period ended December 31, 2016. These consolidated financial statements are the responsibility of the Company’s management. Our responsibility is to express an opinion on these consolidated financial statements based on our audits.
We conducted our audits in accordance with the standards of the Public Company Accounting Oversight Board (United States). Those standards require that we plan and perform the audit to obtain reasonable assurance about whether the financial statements are free of material misstatement. An audit includes examining, on a test basis, evidence supporting the amounts and disclosures in the financial statements. An audit also includes assessing the accounting principles used and significant estimates made by management, as well as evaluating the overall financial statement presentation. We believe that our audits provide a reasonable basis for our opinion.
In our opinion, the consolidated financial statements referred to above present fairly, in all material respects, the financial position of Parsley Energy, Inc. and subsidiaries as of December 31, 2016 and 2015, and the results of their operations and their cash flows for each of the years in the three‑year period ended December 31, 2016, in conformity with U.S. generally accepted accounting principles.
We also have audited, in accordance with the standards of the Public Company Accounting Oversight Board (United States), Parsley Energy, Inc.’s internal control over financial reporting as of December 31, 2016, based on criteria established in Internal Control - Integrated Framework (2013) issued by the Committee of Sponsoring Organizations of the Treadway Commission (COSO), and our report dated February 27, 2017 expressed an unqualified opinion on the effectiveness of the Company’s internal control over financial reporting.
(signed) KPMG LLP
Dallas, Texas
February 27, 2017
F-2
Report of Independent Registered Public Accounting Firm
The Board of Directors and Stockholders
Parsley Energy, Inc.:
We have audited Parsley Energy, Inc.’s internal control over financial reporting as of December 31, 2016, based on criteria established in Internal Control - Integrated Framework (2013) issued by the Committee of Sponsoring Organizations of the Treadway Commission (COSO). Parsley Energy, Inc.’s management is responsible for maintaining effective internal control over financial reporting and for its assessment of the effectiveness of internal control over financial reporting, included in the accompanying Management’s Annual Report on Internal Control over Financial Reporting. Our responsibility is to express an opinion on the Company’s internal control over financial reporting based on our audit.
We conducted our audit in accordance with the standards of the Public Company Accounting Oversight Board (United States). Those standards require that we plan and perform the audit to obtain reasonable assurance about whether effective internal control over financial reporting was maintained in all material respects. Our audit included obtaining an understanding of internal control over financial reporting, assessing the risk that a material weakness exists, and testing and evaluating the design and operating effectiveness of internal control based on the assessed risk. Our audit also included performing such other procedures as we considered necessary in the circumstances. We believe that our audit provides a reasonable basis for our opinion.
A company’s internal control over financial reporting is a process designed to provide reasonable assurance regarding the reliability of financial reporting and the preparation of financial statements for external purposes in accordance with generally accepted accounting principles. A company’s internal control over financial reporting includes those policies and procedures that (1) pertain to the maintenance of records that, in reasonable detail, accurately and fairly reflect the transactions and dispositions of the assets of the company; (2) provide reasonable assurance that transactions are recorded as necessary to permit preparation of financial statements in accordance with generally accepted accounting principles, and that receipts and expenditures of the company are being made only in accordance with authorizations of management and directors of the company; and (3) provide reasonable assurance regarding prevention or timely detection of unauthorized acquisition, use, or disposition of the company’s assets that could have a material effect on the financial statements.
Because of its inherent limitations, internal control over financial reporting may not prevent or detect misstatements. Also, projections of any evaluation of effectiveness to future periods are subject to the risk that controls may become inadequate because of changes in conditions, or that the degree of compliance with the policies or procedures may deteriorate.
In our opinion, Parsley Energy, Inc. maintained, in all material respects, effective internal control over financial reporting as of December 31, 2016, based on criteria established in Internal Control - Integrated Framework (2013) issued by the Committee of Sponsoring Organizations of the Treadway Commission (COSO).
We also have audited, in accordance with the standards of the Public Company Accounting Oversight Board (United States), the consolidated balance sheets of Parsley Energy, Inc. and subsidiaries as of December 31, 2016 and 2015, and the related consolidated statements of operations, changes in equity, and cash flows for each of the years in the three‑year period ended December 31, 2016, and our report dated February 27, 2017 expressed an unqualified opinion on those consolidated financial statements.
(signed) KPMG LLP
Dallas, Texas
February 27, 2017
F-3
PARSLEY ENERGY, INC. AND SUBSIDIARIES
CONSOLIDATED BALANCE SHEETS
December 31, 2016 | December 31, 2015 | ||||||
(In thousands) | |||||||
ASSETS | |||||||
CURRENT ASSETS | |||||||
Cash and cash equivalents | $ | 133,379 | $ | 343,084 | |||
Restricted cash | 3,290 | 1,139 | |||||
Accounts receivable: | |||||||
Joint interest owners and other | 12,698 | 14,998 | |||||
Oil, natural gas and NGLs | 59,174 | 21,219 | |||||
Related parties | 290 | 390 | |||||
Short-term derivative instruments | 39,708 | 83,262 | |||||
Other current assets | 50,949 | 24,234 | |||||
Total current assets | 299,488 | 488,326 | |||||
PROPERTY, PLANT AND EQUIPMENT | |||||||
Oil and natural gas properties, successful efforts method | 4,063,417 | 2,246,161 | |||||
Accumulated depreciation, depletion, amortization and impairment | (506,175 | ) | (290,186 | ) | |||
Total oil and natural gas properties, net | 3,557,242 | 1,955,975 | |||||
Other property, plant and equipment net | 59,318 | 29,778 | |||||
Total property, plant and equipment, net | 3,616,560 | 1,985,753 | |||||
NONCURRENT ASSETS | |||||||
Long-term derivative instruments | 16,416 | 25,839 | |||||
Other noncurrent assets | 6,318 | 5,182 | |||||
Total noncurrent assets | 22,734 | 31,021 | |||||
TOTAL ASSETS | $ | 3,938,782 | 2,505,100 | ||||
LIABILITIES AND EQUITY | |||||||
CURRENT LIABILITIES | |||||||
Accounts payable and accrued expenses | $ | 162,317 | $ | 151,221 | |||
Revenue and severance taxes payable | 69,452 | 37,109 | |||||
Current portion of long-term debt | 67,214 | 951 | |||||
Short-term derivative instruments | 44,153 | 34,518 | |||||
Current portion of asset retirement obligations | 1,818 | 4,698 | |||||
Total current liabilities | 344,954 | 228,497 | |||||
NONCURRENT LIABILITIES | |||||||
Long-term debt | 1,041,324 | 546,832 | |||||
Asset retirement obligations | 9,574 | 13,522 | |||||
Deferred tax liability, net | 5,483 | 62,962 | |||||
Payable pursuant to tax receivable agreement | 94,326 | 51,504 | |||||
Long-term derivative instruments | 12,815 | 15,142 | |||||
Total noncurrent liabilities | 1,163,522 | 689,962 | |||||
COMMITMENTS AND CONTINGENCIES | |||||||
STOCKHOLDERS' EQUITY | |||||||
Preferred stock, $0.01 par value, 50,000,000 shares authorized, none issued and outstanding | — | — | |||||
Common stock | |||||||
Class A, $0.01 par value, 600,000,000 shares authorized, 179,730,033 shares issued and 179,590,617 shares outstanding at December 31, 2016 and 136,728,906 shares issued and 136,623,407 shares outstanding at December 31, 2015 | 1,797 | 1,360 | |||||
Class B, $0.01 par value, 125,000,000 shares authorized, 28,008,573 and 32,145,296 issued and outstanding at December 31, 2016 and December 31, 2015 | 280 | 321 | |||||
Additional paid in capital | 2,151,197 | 1,252,020 | |||||
(Accumulated deficit) retained earnings | (63,255 | ) | 10,868 | ||||
Treasury stock, at cost, 139,416 shares and 105,421 at December 31, 2016 and December 31, 2015 | (381 | ) | (77 | ) | |||
Total stockholders' equity | 2,089,638 | 1,264,492 | |||||
Noncontrolling interest | 340,668 | 322,149 | |||||
Total equity | 2,430,306 | 1,586,641 | |||||
TOTAL LIABILITIES AND EQUITY | $ | 3,938,782 | $ | 2,505,100 | |||
The accompanying notes are an integral part of these consolidated financial statements.
F-4
PARSLEY ENERGY, INC. AND SUBSIDIARIES
CONSOLIDATED STATEMENTS OF OPERATIONS
Year ended December 31, | |||||||||||
2016 | 2015 | 2014 | |||||||||
(in thousands, except per share data) | |||||||||||
REVENUES | |||||||||||
Oil sales | $ | 387,303 | $ | 215,795 | $ | 232,554 | |||||
Natural gas sales | 30,928 | 26,582 | 30,642 | ||||||||
Natural gas liquids sales | 38,273 | 23,680 | 38,561 | ||||||||
Other | 1,269 | 417 | 672 | ||||||||
Total revenues | 457,773 | 266,474 | 302,429 | ||||||||
OPERATING EXPENSES | |||||||||||
Lease operating expenses | 59,293 | 62,913 | 38,071 | ||||||||
Production and ad valorem taxes | 27,916 | 17,800 | 18,941 | ||||||||
Depreciation, depletion and amortization | 233,766 | 178,281 | 94,297 | ||||||||
General and administrative expenses (including stock-based compensation of $12,871, $8,133 and $53,297 for the years ended December 31, 2016, 2015 and 2014) | 84,591 | 55,294 | 87,949 | ||||||||
Exploration costs | 13,931 | 13,865 | 3,136 | ||||||||
Impairment | — | 950 | — | ||||||||
Acquisition costs | 1,081 | — | 2,527 | ||||||||
Accretion of asset retirement obligations | 732 | 826 | 512 | ||||||||
Rig termination costs | — | 8,970 | 765 | ||||||||
Other operating expenses | 5,316 | 1,696 | — | ||||||||
Total operating expenses | 426,626 | 340,595 | 246,198 | ||||||||
OPERATING INCOME (LOSS) | 31,147 | (74,121 | ) | 56,231 | |||||||
OTHER (EXPENSE) INCOME | |||||||||||
Interest expense, net | (55,233 | ) | (45,553 | ) | (39,624 | ) | |||||
Loss on sale of property | (119 | ) | (34,374 | ) | (2,097 | ) | |||||
Prepayment premium on extinguishment of debt | (36,335 | ) | — | (5,107 | ) | ||||||
(Loss) gain on derivatives | (50,835 | ) | 60,818 | 83,858 | |||||||
Other income (expense) | 5,034 | (3,556 | ) | (71 | ) | ||||||
Total other (expense) income, net | (137,488 | ) | (22,665 | ) | 36,959 | ||||||
(LOSS) INCOME BEFORE INCOME TAXES | (106,341 | ) | (96,786 | ) | 93,190 | ||||||
INCOME TAX BENEFIT (EXPENSE) | 17,424 | 23,755 | (36,468 | ) | |||||||
NET (LOSS) INCOME | (88,917 | ) | (73,031 | ) | 56,722 | ||||||
LESS: NET LOSS (INCOME) ATTRIBUTABLE TO NONCONTROLLING INTERESTS | 14,735 | 22,547 | (33,293 | ) | |||||||
NET (LOSS) INCOME ATTRIBUTABLE TO PARSLEY ENERGY, INC. STOCKHOLDERS | $ | (74,182 | ) | $ | (50,484 | ) | $ | 23,429 | |||
Net (loss) income per common share: | |||||||||||
Basic | $ | (0.46 | ) | $ | (0.45 | ) | $ | 0.65 | |||
Diluted | $ | (0.46 | ) | $ | (0.45 | ) | $ | 0.65 | |||
Weighted average common shares outstanding: | |||||||||||
Basic | 161,793 | 111,271 | 93,168 | ||||||||
Diluted | 161,793 | 111,271 | 93,271 | ||||||||
The accompanying notes are an integral part of these consolidated financial statements.
F-5
PARSLEY ENERGY, INC. AND SUBSIDIARIES
CONSOLIDATED STATEMENT OF CHANGES IN EQUITY
(in thousands)
Issued Shares | Shares | |||||||||||||||||||||||||||||||||||
Members' equity | Mezzanine equity | Class A Common Stock | Class B Common Stock | Class A Common Stock | Class B Common Stock | Additional paid in capital | (Accumulated deficit) retained earnings | Treasury stock | Treasury stock | Total stockholders' equity | Noncontrolling interest | Total equity | ||||||||||||||||||||||||
Balance at 12/31/2013 | $ | 30,874 | $ | 77,158 | — | — | $ | — | $ | — | $ | — | $ | — | — | $ | — | $ | — | $ | — | $ | 108,032 | |||||||||||||
Preferred return on redeemable LLC interests | (1,723 | ) | 1,723 | — | — | — | — | — | — | — | — | — | — | — | ||||||||||||||||||||||
Net loss prior to corporate reorganization | (37,923 | ) | — | — | — | — | — | — | — | — | — | — | — | (37,923 | ) | |||||||||||||||||||||
Balance prior to Corporate Reorganization and IPO | (8,772 | ) | 78,881 | — | — | — | — | — | — | — | — | — | — | 70,109 | ||||||||||||||||||||||
Reorganization Transactions: | ||||||||||||||||||||||||||||||||||||
Payment of Preferred Return | — | (6,726 | ) | — | — | — | — | — | — | — | — | — | — | (6,726 | ) | |||||||||||||||||||||
Conversion of PE Units for Class A Common Stock and Class B Common Stock | (42,316 | ) | (72,155 | ) | 43,204 | 32,145 | 432 | 321 | 113,718 | — | — | — | 114,471 | — | — | |||||||||||||||||||||
Net deferred tax liability due to corporate reorganization | — | — | — | — | — | — | (95,530 | ) | — | — | — | (95,530 | ) | — | (95,530 | ) | ||||||||||||||||||||
Deemed contribution -incentive unit compensation | 51,088 | — | — | — | — | — | — | — | — | — | — | — | 51,088 | |||||||||||||||||||||||
IPO Transactions: | ||||||||||||||||||||||||||||||||||||
Issuance of Class A Common Stock, net of underwriters discount and expenses | — | — | 49,963 | — | 500 | — | 867,250 | — | — | — | 867,750 | — | 867,750 | |||||||||||||||||||||||
Initial allocation of noncontrolling interest of Parsley LLC effective on the date of the IPO | — | — | — | — | — | — | (251,955 | ) | — | — | — | (251,955 | ) | 251,955 | — | |||||||||||||||||||||
Tax benefit from tax receivable agreement | — | — | — | — | — | — | 59,633 | — | — | — | 59,633 | — | 59,633 | |||||||||||||||||||||||
Liability due to tax receivable agreement | — | — | — | — | — | — | (50,689 | ) | — | — | — | (50,689 | ) | — | (50,689 | ) | ||||||||||||||||||||
Issuance of restricted stock and restricted stock units | — | — | 770 | — | — | — | — | — | — | — | — | — | — | |||||||||||||||||||||||
Restricted stock forfeited | — | — | — | — | — | — | (41 | ) | — | 37 | — | (41 | ) | — | (41 | ) | ||||||||||||||||||||
Stock-based compensation | — | — | — | — | — | — | 2,250 | — | — | — | 2,250 | — | 2,250 | |||||||||||||||||||||||
Consolidated net income subsequent to the Corporate Reorganization and the IPO | — | — | — | — | — | — | — | 61,352 | — | — | 61,352 | 33,293 | 94,645 | |||||||||||||||||||||||
Balance at 12/31/2014 | — | — | 93,937 | 32,145 | 932 | 321 | 644,636 | 61,352 | 37 | — | 707,241 | 285,248 | 992,489 | |||||||||||||||||||||||
Issuance of Class A Common Stock, net of underwriters discount and expenses | — | — | 42,748 | — | 428 | — | 668,990 | — | — | — | 669,418 | — | 669,418 | |||||||||||||||||||||||
Change in equity due to issuance of PE Units by Parsley LLC | — | — | — | — | — | — | (56,856 | ) | — | — | — | (56,856 | ) | 56,856 | — | |||||||||||||||||||||
F-6
PARSLEY ENERGY, INC. AND SUBSIDIARIES
CONSOLIDATED STATEMENT OF CHANGES IN EQUITY
(in thousands) (continued)
Issued Shares | Shares | |||||||||||||||||||||||||||||||||||
Members' equity | Mezzanine equity | Class A Common Stock | Class B Common Stock | Class A Common Stock | Class B Common Stock | Additional paid in capital | (Accumulated deficit) retained earnings | Treasury stock | Treasury stock | Total stockholders' equity | Noncontrolling interest | Total equity | ||||||||||||||||||||||||
Increase in net deferred tax liability due to issuance of PE Units by Parsley LLC | — | — | — | — | — | — | (18,383 | ) | — | — | — | (18,383 | ) | — | (18,383 | ) | ||||||||||||||||||||
Tax benefit from tax receivable agreement | — | — | — | — | — | — | 5,500 | — | — | — | 5,500 | — | 5,500 | |||||||||||||||||||||||
Initial noncontrolling interest allocation attributable to Pacesetter | — | — | — | — | — | — | — | — | — | — | — | 2,592 | 2,592 | |||||||||||||||||||||||
Issuance of restricted stock | — | — | 42 | — | — | — | — | — | — | — | — | — | — | |||||||||||||||||||||||
Restricted stock forfeited | — | — | — | — | — | — | (293 | ) | — | 68 | (71 | ) | (364 | ) | — | (364 | ) | |||||||||||||||||||
Vesting of restricted stock units | — | — | 2 | — | — | — | — | — | — | (6 | ) | (6 | ) | — | (6 | ) | ||||||||||||||||||||
Stock-based compensation | — | — | — | — | — | — | 8,426 | — | — | — | 8,426 | — | 8,426 | |||||||||||||||||||||||
Net loss | — | — | — | — | — | — | — | (50,484 | ) | — | — | (50,484 | ) | (22,547 | ) | (73,031 | ) | |||||||||||||||||||
Balance at 12/31/2015 | — | — | 136,729 | 32,145 | 1,360 | 321 | 1,252,020 | 10,868 | 105 | (77 | ) | 1,264,492 | 322,149 | 1,586,641 | ||||||||||||||||||||||
Adoption of ASU 2016-09 | — | — | — | — | — | — | — | 59 | — | — | 59 | — | 59 | |||||||||||||||||||||||
Restated balance | — | — | 136,729 | 32,145 | 1,360 | 321 | 1,252,020 | 10,927 | 105 | (77 | ) | 1,264,551 | 322,149 | 1,586,700 | ||||||||||||||||||||||
Issuance proceeds, net of underwriters discount and expenses | — | — | 38,812 | — | 388 | — | 929,927 | — | — | — | 930,315 | — | 930,315 | |||||||||||||||||||||||
Change in equity due to issuance of PE Units by Parsley LLC | — | — | — | — | — | — | (80,255 | ) | — | — | — | (80,255 | ) | 80,255 | — | |||||||||||||||||||||
Increase in net deferred tax liability due to issuance of PE Units by Parsley LLC | — | — | — | — | — | — | (13,215 | ) | — | — | — | (13,215 | ) | — | (13,215 | ) | ||||||||||||||||||||
Exchange of PE Units and Class B Common Stock for Class A Common Stock | — | — | 4,137 | (4,137 | ) | 41 | (41 | ) | 47,001 | — | — | — | 47,001 | (47,001 | ) | — | ||||||||||||||||||||
Change in net deferred tax liability due to exchange of PE Units and Class B Common Stock for Class A Common Stock | — | — | — | — | — | — | (5,999 | ) | — | — | — | (5,999 | ) | — | (5,999 | ) | ||||||||||||||||||||
Tax benefit from tax receivable agreement | — | — | — | — | — | — | 8,855 | — | — | — | 8,855 | — | 8,855 | |||||||||||||||||||||||
Issuance of restricted stock | — | — | 37 | — | — | — | — | — | — | — | — | — | — | |||||||||||||||||||||||
Vesting of restricted stock units | — | — | 15 | — | 8 | — | (8 | ) | — | — | (91 | ) | (91 | ) | — | (91 | ) | |||||||||||||||||||
Repurchase of common stock | — | — | — | — | — | — | — | — | 12 | (213 | ) | (213 | ) | — | (213 | ) | ||||||||||||||||||||
Restricted stock forfeited | — | — | — | — | — | — | (105 | ) | — | 22 | — | (105 | ) | — | (105 | ) | ||||||||||||||||||||
Stock-based compensation | — | — | — | — | — | — | 12,976 | — | — | — | 12,976 | — | 12,976 | |||||||||||||||||||||||
Net loss | — | — | — | — | — | — | — | (74,182 | ) | — | — | (74,182 | ) | (14,735 | ) | (88,917 | ) | |||||||||||||||||||
Balance at 12/31/2016 | $ | — | $ | — | 179,730 | 28,008 | $ | 1,797 | $ | 280 | $ | 2,151,197 | $ | (63,255 | ) | 139 | $ | (381 | ) | $ | 2,089,638 | $ | 340,668 | $ | 2,430,306 | |||||||||||
The accompanying notes are an integral part of these consolidated financial statements.
F-7
PARSLEY ENERGY, INC. AND SUBSIDIARIES
CONSOLIDATED STATEMENTS OF CASH FLOWS
Year Ended December 31, | |||||||||||
2016 | 2015 | 2014 | |||||||||
(In thousands) | |||||||||||
CASH FLOWS FROM OPERATING ACTIVITIES: | |||||||||||
Net (loss) income | $ | (88,917 | ) | $ | (73,031 | ) | $ | 56,722 | |||
Adjustments to reconcile net (loss) income to net cash provided by operating activities: | |||||||||||
Depreciation, depletion and amortization | 233,766 | 178,281 | 94,297 | ||||||||
Impairment expense | — | 950 | — | ||||||||
Inventory write down | — | 4,147 | — | ||||||||
Accretion of asset retirement obligations | 732 | 826 | 512 | ||||||||
Loss on sale of property | 119 | 34,374 | 2,097 | ||||||||
Prepayment premium on extinguishment of debt | 36,335 | — | 5,107 | ||||||||
Amortization and write off of deferred loan origination costs | 3,190 | 2,702 | 2,327 | ||||||||
Amortization of bond premium | (874 | ) | (764 | ) | (574 | ) | |||||
Deferred income tax (benefit) expense | (17,582 | ) | (24,041 | ) | 36,468 | ||||||
Deferred tax asset valuation | (7,351 | ) | — | — | |||||||
Stock-based compensation expense | 12,871 | 8,133 | 53,297 | ||||||||
Loss (gain) on derivatives | 50,835 | (60,818 | ) | (83,858 | ) | ||||||
Net cash received for derivative settlements | 32,364 | 43,767 | 3,311 | ||||||||
Net cash (paid) received for option premiums | (10,334 | ) | 40,656 | 193 | |||||||
Net premiums received (paid) on options that settled during the period | 31,757 | 11,406 | (2,308 | ) | |||||||
Other | 6,169 | 7,310 | 976 | ||||||||
Changes in operating assets and liabilities, net of acquisitions: | |||||||||||
Restricted cash | (2,151 | ) | (1,139 | ) | — | ||||||
Accounts receivable | (35,774 | ) | 24,103 | 45,372 | |||||||
Accounts receivable—related parties | 100 | 3,675 | (3,055 | ) | |||||||
Materials and supplies | — | 3,767 | (689 | ) | |||||||
Other current assets | (71,052 | ) | (22,793 | ) | 2,229 | ||||||
Other noncurrent assets | 748 | (588 | ) | (535 | ) | ||||||
Accounts payable and accrued expenses | 20,897 | (7,001 | ) | (32,121 | ) | ||||||
Revenue and severance taxes payable | 32,343 | (1,257 | ) | 9,947 | |||||||
Other noncurrent liabilities | — | (375 | ) | 375 | |||||||
Net cash provided by operating activities | 228,191 | 172,290 | 190,090 | ||||||||
CASH FLOWS FROM INVESTING ACTIVITIES: | |||||||||||
Development of oil and natural gas properties | (505,802 | ) | (382,550 | ) | (477,681 | ) | |||||
Acquisitions of oil and natural gas properties | (1,346,190 | ) | (73,807 | ) | (762,244 | ) | |||||
Acquisition of Pacesetter Drilling, LLC | — | (2,408 | ) | — | |||||||
Additions to other property and equipment | (33,374 | ) | (19,755 | ) | (7,924 | ) | |||||
Proceeds from sale of property | — | 51,355 | 172 | ||||||||
Net cash used in investing activities | (1,885,366 | ) | (427,165 | ) | (1,247,677 | ) | |||||
CASH FLOWS FROM FINANCING ACTIVITIES: | |||||||||||
Borrowings under long-term debt | 1,057,500 | 105,000 | 946,140 | ||||||||
Payments on long-term debt | (521,944 | ) | (225,794 | ) | (705,873 | ) | |||||
Debt issue costs | (18,097 | ) | (1,138 | ) | (12,547 | ) | |||||
Proceeds from issuance of common stock, net | 930,315 | 669,418 | 867,750 | ||||||||
Purchases of common stock | (213 | ) | (71 | ) | — | ||||||
Vesting of restricted stock units | (91 | ) | (6 | ) | — | ||||||
Payment of Preferred Return | — | — | (6,726 | ) | |||||||
Net cash provided by financing activities | 1,447,470 | 547,409 | 1,088,744 | ||||||||
Net (decrease) increase in cash and cash equivalents | (209,705 | ) | 292,534 | 31,157 | |||||||
Cash and cash equivalents at beginning of year | 343,084 | 50,550 | 19,393 | ||||||||
Cash and cash equivalents at end of year | $ | 133,379 | $ | 343,084 | $ | 50,550 | |||||
SUPPLEMENTAL DISCLOSURE OF CASH FLOW INFORMATION: | |||||||||||
Cash paid for interest | $ | 65,513 | $ | 43,993 | $ | 27,252 | |||||
Cash paid for income taxes | $ | 315 | $ | — | $ | — | |||||
SUPPLEMENTAL DISCLOSURE OF NON-CASH ACTIVITIES: | |||||||||||
Asset retirement obligations incurred, including changes in estimate | $ | (6,646 | ) | $ | 3,441 | $ | 7,498 | ||||
(Reductions) additions to oil and natural gas properties - change in capital accruals | $ | (9,831 | ) | $ | 18,300 | $ | 13,658 | ||||
Additions to other property and equipment funded by capital lease borrowings | $ | 2,758 | $ | 939 | $ | 2,263 | |||||
The accompanying notes are an integral part of these consolidated financial statements.
F-8
PARSLEY ENERGY, INC. AND SUBSIDIARIES
NOTES TO CONSOLIDATED AND COMBINED FINANCIAL STATEMENTS
December 31, 2016
NOTE 1. ORGANIZATION AND NATURE OF OPERATIONS
Parsley Energy, Inc. (individually or together with its subsidiaries, as the context requires, the "Company") was formed on December 11, 2013, pursuant to the laws of the State of Delaware, as a wholly owned subsidiary of Parsley Energy, LLC ("Parsley LLC"), a Delaware limited liability company formed on June 11, 2013. Concurrent with the formation of Parsley LLC, all of the interest holders of Parsley Energy, L.P. ("Parsley LP"), Parsley Energy Management, LLC ("PEM") and Parsley Energy Operations, LLC ("Operations") exchanged their interests in each entity in return for interests in Parsley LLC (the "Exchange"), causing each of Parsley LP, PEM and Operations to become wholly owned subsidiaries of Parsley LLC. As of December 31, 2016, the Company held 86.5% of Parsley LLC.
Parsley LP was formed on February 29, 2008 as a Texas limited partnership. On September 9, 2011, Parsley LP formed and held all of the interest in, Spraberry Energy, LLC ("Spraberry"), a Texas limited liability company. On November 20, 2012, Spraberry merged with and into Parsley LP, thereby terminating Spraberry’s corporate existence.
PEM was formed on February 19, 2008 as a Texas limited liability company and to act as the general partner of Parsley LP. On October 7, 2016, PEM merged with and into Operations, thereby terminating PEM’s corporate existence.
Operations was formed on February 19, 2008 as a Texas limited liability company.
Parsley LP also owns a noncontrolling 42.5% investment in Spraberry Production Services LLC ("SPS"). SPS was formed on August 27, 2010 as a Texas limited liability company and is primarily engaged in the oilfield services business, servicing properties located in the Permian Basin in West Texas.
Parsley Energy Aviation, LLC ("Parsley Aviation") was formed on March 22, 2013 as a Texas limited liability company and a wholly owned subsidiary of Operations.
Parsley Finance Corp. ("Finance Corp.") was formed on January 15, 2014 as a Delaware corporation and a wholly owned subsidiary of Parsley LLC.
Parsley Minerals, LLC ("Minerals LLC") was formed on May 13, 2016 as a Texas limited liability company and a wholly owned subsidiary of Parsley LP.
Parsley GP, LLC ("Parsley GP") was formed on October 21, 2016 as a Delaware limited liability company and a wholly owned subsidiary of PEM. On October 27, 2016, (i) PEM conveyed its general partnership units and limited partnership units in Parsley LP to Parsley GP and (ii) immediately thereafter, merged with and into Operations, with Operations continuing as the surviving entity. As a result of these transactions, Parsley GP became a wholly owned subsidiary of Operations and the new general partner of Parsley LP.
The Company, Parsley LLC and Parsley LLC’s wholly owned subsidiaries are primarily engaged in the acquisition, development, production, exploration and sale of crude oil and natural gas properties located in the Permian Basin in West Texas, and other tangential activities.
Initial Public Offering
On May 29, 2014, the Company completed its initial public offering (the "IPO") of 57.5 million shares of the Company’s Class A common stock, par value $0.01 per share ("Class A Common Stock"), at a price of $18.50 per share. Approximately 7.5 million of the shares of the Class A Common Stock were sold by selling stockholders and the Company did not receive any proceeds from the sale of those shares. The remaining approximately 50.0 million shares of the Company’s Class A Common Stock that were sold resulted in gross proceeds of approximately $924.3 million to the Company and net proceeds, after deducting underwriting discounts and commissions and offering expenses, of approximately $867.8 million. The material terms of the IPO are described in the Company’s final prospectus, dated May 22, 2014 and filed with the Securities and Exchange Commission ("SEC") pursuant to Rule 424(b)(4) of the Securities Act of 1933, as amended (the "Securities Act"), on May 27, 2014.
F-9
PARSLEY ENERGY, INC. AND SUBSIDIARIES
NOTES TO CONSOLIDATED AND COMBINED FINANCIAL STATEMENTS
December 31, 2016
Corporate Reorganization
On May 29, 2014, in connection with the IPO, Parsley LLC underwent a corporate reorganization ("Corporate Reorganization") whereby (a) all of the membership interests (including incentive units) in Parsley LLC held by its then existing owners (the "Existing Owners") were converted into a single class of units in Parsley LLC ("PE Units"), (b) certain of the Existing Owners contributed all of their PE Units to the Company in exchange for an equal number of shares of the Company’s Class A Common Stock, (c) certain of the Existing Owners contributed only a portion of their PE Units to the Company in exchange for an equal number of shares of the Company’s Class A Common Stock and continue to own a portion of the PE Units and (d) Parsley Energy Employee Holdings, LLC ("PEEH"), an entity owned by certain of Parsley LLC’s officers and employees that was formed to hold a portion of the incentive units in Parsley LLC, was merged with and into the Company, with the Company surviving the merger and the members of PEEH receiving shares of the Company’s Class A Common Stock. As a result of the above transactions, the Company issued a total of 43.2 million shares of its Class A Common Stock.
Upon completion of the IPO, the Company issued and contributed 32.1 million shares of its Class B common stock, par value $0.01 per share ("Class B Common Stock") and all of the net proceeds of the IPO to Parsley LLC in exchange for 93.2 million PE Units. Parsley LLC distributed to each of the Existing Owners that continued to own PE Units following the Corporate Reorganization and the IPO (collectively, the "PE Unit Holders"), one share of Class B Common Stock for each PE Unit such PE Unit Holder held. After giving effect to these transactions the Company owned an approximate 74.3% interest in Parsley LLC, with the remaining PE Unitholders owning an approximate 25.7% interest in Parsley LLC.
Pacesetter Drilling, LLC
On April 21, 2015, Operations, established a limited liability company, Pacesetter Drilling, LLC ("Pacesetter"), as a wholly owned subsidiary. On June 15, 2015, Pacesetter entered into an asset purchase agreement with an oilfield drilling company to acquire certain property, equipment and other assets (the "Pacesetter Acquisition"). The Pacesetter Acquisition was accounted for using the acquisition method under Accounting Standards Codification ("ASC") Topic 805, Business Combinations. Operations and Pacesetter’s President contributed cash in exchange for ownership in Pacesetter. Pacesetter then paid total consideration of $7.0 million for its interest in the purchased assets, of which $4.4 million was allocated to Operations and $2.6 million was allocated to the noncontrolling interest. As a result of the Pacesetter Acquisition, Operations has an approximately 63.0% interest in Pacesetter.
Public Offerings of Common Stock
On February 5, 2015, the Company entered into an underwriting agreement to sell 14,885,797 shares of Class A Common Stock in a private placement (the "Private Placement") at a price of $15.50 per share to selected institutional investors. The Private Placement closed on February 11, 2015 and resulted in gross proceeds of approximately $230.7 million to the Company and net proceeds to the Company, after deducting underwriting discounts and commissions and offering expenses, of approximately $224.0 million. The net proceeds were used to repay a portion of outstanding borrowings under the Company's Revolving Credit Agreement (as defined in Note 7—Debt) and for general corporate purposes.
On September 18, 2015, the Company entered into an underwriting agreement to sell 14,950,000 shares of Class A Common Stock (including 1,950,000 shares issued pursuant to the underwriters’ option to purchase additional shares) at a price of $15.00 per share in an underwritten public offering (the "September Offering"). The September Offering resulted in gross proceeds of approximately $224.3 million to the Company and net proceeds to the Company, after deducting underwriting discounts and commissions and offering expenses, of approximately $217.0 million. A portion of the net proceeds was used to repay borrowings outstanding under the Company's Revolving Credit Agreement and the remainder of the net proceeds were used to fund a portion of the Company’s capital program, including acquisitions.
On December 9, 2015, the Company and NGP X US Holdings, L.P., one of the Company’s stockholders ("NGP"), entered into an underwriting agreement to sell 14,202,500 shares of Class A Common Stock, including 12,911,364 shares of Class A Common Stock issued and sold by the Company and 1,291,136 shares of Class A Common Stock sold by NGP, at a price of $18.00 per share in an underwritten public offering (the "December Offering"). The December Offering resulted in gross proceeds of approximately $228.7 million to the Company and net proceeds to the Company, after deducting underwriting discounts and commissions and offering expenses, of approximately $228.4 million. A portion of the net proceeds from the offering was used to fund the acquisition of 6,040 gross (5,274 net) acres located in Upton, Reagan and Glasscock Counties,
F-10
PARSLEY ENERGY, INC. AND SUBSIDIARIES
NOTES TO CONSOLIDATED AND COMBINED FINANCIAL STATEMENTS
December 31, 2016
Texas and the remaining net proceeds were used to fund a portion of the Company’s capital program and for general corporate purposes. The Company did not receive any of the proceeds from the sale of shares by NGP.
On April 4, 2016, the Company entered into an underwriting agreement to sell 20,987,500 shares of Class A Common Stock (including 2,737,500 shares issued pursuant to the underwriters’ option to purchase additional shares) at a price of $21.40 per share in an underwritten public offering (the "April Offering"). The April Offering closed on April 8, 2016 and resulted in gross proceeds to the Company of approximately $449.1 million and net proceeds to the Company, after deducting underwriting discounts and commissions and offering expenses, of approximately $433.2 million.
On May 23, 2016, the Company entered into an underwriting agreement to sell 9,487,500 shares of Class A Common Stock (including 1,237,500 shares issued pursuant to the underwriters’ option to purchase additional shares) at a price of $24.60 per share in an underwritten public offering (the "May Offering"). The May Offering closed on May 27, 2016 and resulted in gross proceeds to the Company of approximately $233.4 million and net proceeds to the Company, after deducting underwriting discounts and commissions and offering expenses, of approximately $226.2 million.
On August 15, 2016, the Company entered into an underwriting agreement to sell 8,337,500 shares of Class A Common Stock (including 1,087,500 shares issued pursuant to the underwriters’ option to purchase additional shares) at a price of $33.55 per share in an underwritten public offering (the "August Offering"). The August Offering closed on August 19, 2016 and resulted in gross proceeds to the Company of approximately $279.7 million and net proceeds to the Company, after deducting underwriting discounts and commissions and offering expenses, of approximately $271.1 million.
On January 10, 2017, the Company entered into an underwriting agreement to sell 25,300,000 shares of Class A Common Stock (including 3,300,000 shares issued pursuant to the underwriters’ option to purchase additional shares) at a price of $35.00 per share in an underwritten public offering (the "January Offering"). The January Offering closed on January 17, 2017 and resulted in gross proceeds to the Company of approximately $885.5 million and net proceeds to the Company, after deducting underwriting discounts and commissions and offering expenses, of approximately $863.0 million. As discussed in Note 14—Subsequent Events, the Company used a portion of the net proceeds from the January Offering to fund the aggregate purchase price for certain acquisitions of oil and natural gas interests in the Midland and Southern Delaware Basins and the remaining net proceeds to fund a portion of its capital program and for general corporate purposes, including potential future acquisitions.
On February 7, 2017, the Company entered into an underwriting agreement to sell 41,400,000 shares of Class A Common Stock (including 5,400,000 shares issued pursuant to the underwriters' option to purchase additional shares), at a price of $31.00 per share in an underwritten public offering (the "February Offering"). The February Offering closed on February 13, 2017 and resulted in gross proceeds to the Company of approximately $1,283.4 million and net proceeds to the Company, after deducting underwriting discounts and commissions and offering expenses of approximately $1,260.6 million. As discussed in Note 14—Subsequent Events, the Company will use a portion of the net proceeds from the February Offering to fund the cash portion of the purchase price for the Double Eagle Acquisition (as defined in Note—14 Subsequent Events) and the remaining net proceeds will be used to fund a portion of its capital program and for general corporate purposes, including potential future acquisitions.
NOTE 2. SUMMARY OF SIGNIFICANT ACCOUNTING POLICIES
Principles of Consolidation
These consolidated financial statements include the accounts of Parsley Energy, Inc., its majority-owned subsidiary, Parsley LLC and the wholly owned subsidiaries of Parsley LLC: (i) Parsley LP, (ii) PEM (a wholly owned subsidiary of the Company until its merger with Operations on October 7, 2016), (iii) Operations, (iv) Finance Corp., (v) Parsley Aviation and (vi) Minerals LLC. Operations also owns an approximately 63.0% interest in Pacesetter. The Company includes the accounts of Pacesetter in its consolidated financial statements. Parsley LP owns a 42.5% interest in SPS. The Company accounts for its investment in SPS using the equity method of accounting. All significant intercompany and intra-company balances and transactions have been eliminated.
F-11
PARSLEY ENERGY, INC. AND SUBSIDIARIES
NOTES TO CONSOLIDATED AND COMBINED FINANCIAL STATEMENTS
December 31, 2016
Use of Estimates
These consolidated financial statements and related notes are presented in accordance with GAAP. Preparation in accordance with GAAP requires the Company to (1) adopt accounting policies within accounting rules set by the Financial Accounting Standards Board ("FASB") and by the SEC and (2) make estimates and assumptions that affect the reported amounts of assets and liabilities, the disclosure of contingent assets and liabilities at the date of the financial statements and the reported amounts of revenues and expenses during the reporting periods. The Company's management believes the major estimates and assumptions impacting the Company's consolidated financial statements are the following:
• | estimates of proved reserves of oil and natural gas, which affect the calculations of depletion, depreciation and amortization and impairment of capitalized costs of oil and natural gas properties; |
• | operating costs accrued and volumes and prices for revenues accrued; |
• | estimates of asset retirement obligations; |
• | estimates of the fair value assets acquired and liabilities assumed in business combinations; |
• | evaluations of impairment of proved and unproved properties are subject to number uncertainties including, among others, estimates of future recoverable reserves and commodity price outlooks; |
• | impairment of other assets; |
• | depreciation of property and equipment; |
• | valuation of commodity derivative instruments; and |
• | estimates of the fair value of stock-based compensation. |
Although management believes these estimates are reasonable, actual results may differ from estimates and assumptions of future events and these revisions could be material. Future production may vary materially from estimated oil and natural gas proved reserves. Actual future prices may vary significantly from price assumptions used for determining proved reserves and for financial reporting.
Cash and Cash Equivalents
The Company considers all cash on hand, depository accounts held by banks, money market accounts and investments with an original maturity of three months or less to be cash equivalents. The Company’s cash and cash equivalents are held in financial institutions in amounts that exceed the insurance limits of the Federal Deposit Insurance Corporation. However, management believes that the Company’s counterparty risks are minimal based on the reputation and history of the institutions selected.
Restricted Cash
Restricted cash at December 31, 2016 and 2015 of $3.3 million and $1.1 million includes cash that is contractually restricted involving a non-related party. The restricted cash includes revenues associated with an operated well.
Accounts Receivable
Accounts receivable consist of receivables from joint interest owners on properties the Company operates and crude oil, natural gas and NGLs production delivered to purchasers. The purchasers remit payment for production directly to the Company. Most payments are received within three months after the production date.
Amounts due from joint interest owners or purchasers are stated net of an allowance for doubtful accounts when the Company believes collection is doubtful. For receivables from joint interest owners, the Company typically has the ability to withhold future revenue disbursements to recover any non-payment of joint interest billings. Accounts receivable outstanding longer than the contractual payment terms are considered past due. The Company determines its allowance by considering a number of factors, including the length of time accounts receivable are past due, the Company’s previous loss history, the
F-12
PARSLEY ENERGY, INC. AND SUBSIDIARIES
NOTES TO CONSOLIDATED AND COMBINED FINANCIAL STATEMENTS
December 31, 2016
debtor’s current ability to pay its obligation to the Company, the condition of the general economy and the industry as a whole. The Company writes off specific accounts receivable when they become uncollectible and payments subsequently received on such receivables are credited to the allowance for doubtful accounts. No allowance was deemed necessary at December 31, 2016 or December 31, 2015.
Significant Customers
For the years ended December 31, 2016, 2015 and 2014, each of the following purchasers accounted for more than 10% of the Company's revenue:
Year Ended December 31, | ||||||
2016 | 2015 | 2014 | ||||
Shell Trading (US) Company | 44% | 23% | 4% | |||
BML, Inc. | 13% | 19% | 14% | |||
Targa Pipeline Mid-Continent, LLC | 13% | 12% | 20% | |||
TransOil Marketing, LLC | 8% | 13% | —% | |||
Plains Marketing, L.P. | 7% | 6% | 15% | |||
Enterprise Crude Oil, LLC | 3% | —% | 10% | |||
Permian Transport & Trading | —% | 6% | 11% | |||
The Company does not require collateral and does not believe the loss of any single purchaser would materially impact its operating results, as crude oil and natural gas are fungible products with well-established markets and numerous purchasers.
Material and Supplies
Materials and supplies are stated at the lower of cost or market and consists of oil and gas drilling or repair items such a tubing, casing and pumping units. These items are primarily acquired for use in future drilling or repair operations and are carried at lower of cost or market. "Market," in the context of valuation, represents net realizable value, which is the amount that the Company is allowed to bill to the joint account under joint operating agreements to which the Company is a party. During 2015, the Company made significant materials and supplies purchases and evaluated assets based on current operations. The Company determined that these materials and supplies would not be utilized in the current year and therefore reclassified them to noncurrent assets as non-depreciable other property, plant and equipment. See Note 13—Disclosures about Fair Value of Financial Instruments for additional information regarding the Company’s impairment of materials and supplies.
Oil and Natural Gas Properties
Oil and natural gas exploration, development and production activities are accounted for in accordance with the successful efforts method of accounting. Under this method, costs of acquiring properties, costs of drilling successful exploration wells and development costs are capitalized.
As exploration and development work progresses and the reserves on these properties are proven, capitalized costs attributed to the properties and mineral interests are subject to depreciation, depletion and amortization ("DD&A"). Depletion of capitalized costs is provided using the units-of-production method based on proved oil and gas reserves related to the associated reservoir.
The Company capitalizes interest on expenditures made in connection with long term projects that are not subject to current depletion. Interest is capitalized only for the period that activities are in progress to bring these projects to their intended use and only to the extent the company has incurred interest expense.
On the sale of a complete or partial unit of a proved property or pipeline and related facilities, the cost and related accumulated DD&A are removed from the property accounts and any gain or loss is recognized.
For sales of entire working interests in unproved properties, gain or loss is recognized to the extent of the difference between the proceeds received and the net carrying value of the property. Proceeds from sales of partial interests in unproved properties are accounted for as a recovery of costs unless the proceeds exceed the entire cost of the property.
F-13
PARSLEY ENERGY, INC. AND SUBSIDIARIES
NOTES TO CONSOLIDATED AND COMBINED FINANCIAL STATEMENTS
December 31, 2016
Oil and Gas Reserves
The estimates of proved oil and natural gas reserves utilized in the preparation of the consolidated financial statements are estimated in accordance with the rules established by the SEC and the FASB. These rules require that reserve estimates be prepared under existing economic and operating conditions using a trailing first day of the month 12-month average price, net of historical differentials, with no provision for price and cost escalations in future years except by contractual arrangements.
Reserve estimates are inherently imprecise. Accordingly, the estimates are expected to change as more current information becomes available. Oil and gas properties are depleted by field using the units-of-production method. Capitalized drilling and development costs of producing oil and natural gas properties are depleted over proved developed reserves and leasehold costs are depleted over total proved reserves. It is possible that, because of changes in market conditions or the inherent imprecision of reserve estimates, the estimates of future cash inflows, the amount of oil and natural gas reserves, the remaining estimated lives of oil and natural gas properties, or any combination of the above may be increased or decreased. Increases in recoverable economic volumes generally reduce per unit depletion rates while decreases in recoverable economic volumes generally increase per unit depletion rates.
Asset Retirement Obligations
For the Company, asset retirement obligations represent the future abandonment costs of tangible assets, namely the plugging and abandonment of wells and land remediation. The fair value of a liability for an asset’s retirement obligation is recorded in the period in which it is incurred if a reasonable estimate of fair value can be made and the corresponding cost is capitalized as part of the carrying amount of the related long-lived asset. The liability is accreted to its then present value each period. If the liability is settled for an amount other than the recorded amount, the difference is recorded in other income (expense) in the consolidated statements of operations.
Inherent to the present value calculation are numerous estimates, assumptions and judgments, including, but not limited to: the ultimate settlement amounts, inflation factors, credit-adjusted risk-free rates, timing of settlement and changes in the legal, regulatory, environmental and political environments. To the extent future revisions to these assumptions affect the present value of the abandonment liability, the Company makes corresponding adjustments to both the asset retirement obligation and the related oil and natural gas property asset balance. These revisions result in prospective changes to DD&A expense and accretion of the discounted abandonment liability.
The following table summarizes the changes in the Company’s asset retirement obligation for the periods indicated:
Year ended December 31, | ||||||||
2016 | 2015 | |||||||
(in thousands) | ||||||||
Asset retirement obligations, beginning of period | $ | 18,220 | $ | 16,207 | ||||
Additional liabilities incurred | 3,290 | 1,512 | ||||||
Disposition of wells | (858 | ) | (2,254 | ) | ||||
Accretion expense | 732 | 826 | ||||||
Liabilities settled upon plugging and abandoning wells | (56 | ) | — | |||||
Revision of estimates | (9,936 | ) | 1,929 | |||||
Asset retirement obligations, end of period | $ | 11,392 | $ | 18,220 | ||||
Allocation of Purchase Price in Business Combinations
As part of its business strategy, the Company regularly pursues the acquisition of oil and natural gas properties. The purchase price in an acquisition is allocated to the assets acquired and liabilities assumed based on their relative fair values as of the acquisition date, which may occur many months after the announcement date. Therefore, while the consideration to be paid may be fixed, the fair value of the assets acquired and liabilities assumed is subject to change during the period between the announcement date and the acquisition date. The Company's most significant estimates in its allocation typically relate to the value assigned to future recoverable oil and natural gas reserves and unproved properties. As the allocation of the purchase price is subject to significant estimates and subjective judgments, the accuracy of this assessment is inherently uncertain.
F-14
PARSLEY ENERGY, INC. AND SUBSIDIARIES
NOTES TO CONSOLIDATED AND COMBINED FINANCIAL STATEMENTS
December 31, 2016
Impairment of Oil and Natural Gas Properties
The Company reviews its long-lived assets to be held and used, including proved oil and natural gas properties by field. Whenever events or circumstances indicate that the carrying value of those assets may not be recoverable, an impairment loss is indicated if the sum of the expected future cash flows related to proved properties in the applicable field is less than the carrying amount of the assets. In this circumstance, the Company recognizes an impairment loss for the amount by which the carrying amount of the asset exceeds the estimated fair value of the asset. The Company reviews its oil and natural gas properties by amortization base or by individual well for those wells not constituting part of an amortization base. For each property determined to be impaired, an impairment loss equal to the difference between the carrying value of the properties and the estimated fair value (discounted future cash flows) of the properties would be recognized at that time. Estimating future cash flows involves the use of judgments, including estimation of the proved oil and natural gas reserve quantities, timing of development and production, expected future commodity prices, capital expenditures and production costs. See Note 13— Disclosures about Fair Value of Financial Instruments for additional information regarding the Company’s impairment of proved oil and natural gas properties.
Exploration Costs
Exploration costs, other than exploration drilling costs, are charged to expense as incurred. These costs include seismic expenditures and other geological and geophysical costs, exploratory dry holes, impairment and amortization of unproved leasehold costs and lease rentals. The costs of exploratory wells and exploratory-type stratigraphic wells are initially capitalized pending a determination of whether proved reserves have been found. At the completion of drilling activities, the costs of exploratory wells remain capitalized if determination is made that proved reserves have been found. If no proved reserves have been found, the costs of each of the related exploratory wells are charged to expense. In some cases, a determination of proved reserves cannot be made at the completion of drilling, requiring additional testing and evaluation of the wells. The costs of such exploratory wells are expensed if a determination of proved reserves has not been made within a 12-month period after drilling is complete.
Unproved oil and natural gas properties are assessed quarterly for impairment by considering future drilling plans, the results of exploration activities, commodity price outlooks, planned future sales or expiration of all or a portion of such projects.
The following table summarized exploration costs incurred by the Company for the periods indicated:
Year Ended December 31, | ||||||||||||
2016 | 2015 | 2014 | ||||||||||
(in thousands) | ||||||||||||
Leasehold abandonments | $ | 6,063 | $ | 8,227 | $ | 430 | ||||||
Geological and geophysical costs | 3,015 | 5,459 | 2,394 | |||||||||
Idle drilling rig fees | 4,304 | — | — | |||||||||
Unproved leasehold amortization | 549 | 179 | 312 | |||||||||
Total exploration costs | $ | 13,931 | $ | 13,865 | $ | 3,136 | ||||||
Other Property and Equipment, net
Other property and equipment is recorded at cost. The Company expenses maintenance and repairs in the period incurred. Upon retirements or disposition of assets, the cost and related accumulated depreciation are removed from the consolidated balance sheet with the resulting gains or losses, if any, reflected in operations. Depreciation of other property and equipment is computed using the straight line method over their estimated useful lives, which range from three years to 15 years. Depreciation expense on other property and equipment was $6.6 million, $4.7 million and $1.5 million for the years ended December 31, 2016, 2015 and 2014, respectively.
F-15
PARSLEY ENERGY, INC. AND SUBSIDIARIES
NOTES TO CONSOLIDATED AND COMBINED FINANCIAL STATEMENTS
December 31, 2016
Equity Investments
Equity investments in which the Company exercises significant influence but does not control are accounted for using the equity method. Under the equity method, generally the Company’s share of investees’ earnings or loss, after elimination of intra-company profit or loss, is recognized in the consolidated statement of operations. The Company reviews its investments to determine if a loss in value which is other than a temporary decline has occurred. If such loss has occurred, the Company would recognize an impairment provision. There was no impairment for the Company’s equity investments for the years ended December 31, 2016, 2015 and 2014.
Derivative Instruments
The Company uses derivative financial instruments to reduce exposure to fluctuations in commodity prices. These transactions are in the form of crude options and collars.
The Company reports the fair value of derivatives on the consolidated balance sheets in derivative instrument assets and derivative instrument liabilities as either current or noncurrent. The Company determines the current and noncurrent classification based on the timing of expected future cash flows of individual trades. The Company reports these on a gross basis by contract.
The Company’s derivative instruments were not designated as hedges for accounting purposes for any of the periods presented. Accordingly, the changes in fair value are recognized in the consolidated statements of operations in the period of change. Gains and losses resulting from the changes in fair value of derivatives are included in cash flows from operating activities.
Fair Value of Financial Instruments
Fair value represents the price that would be received to sell the asset or paid to transfer the liability in an orderly transaction between market participants at the reporting date. The Company’s assets and liabilities that are measured at fair value at each reporting date are classified according to a hierarchy that prioritizes inputs and assumptions underlying the valuation techniques. This fair value hierarchy gives the highest priority to quoted prices in active markets for identical assets or liabilities and the lowest priority to unobservable inputs and consists of three broad levels:
Level 1: | Observable inputs that reflect unadjusted quoted prices for identical assets or liabilities in active markets as of the reporting date. | |
Level 2: | Observable market-based inputs or unobservable inputs that are corroborated by market data. These are inputs other than quoted prices in active markets included in Level 1 that are either directly or indirectly observable as of the reporting date. | |
Level 3: | Unobservable inputs that are not corroborated by market data and may be used with internally developed methodologies that result in management’s best estimate of fair value. | |
Valuation techniques that maximize the use of observable inputs are favored. Assets and liabilities are classified in their entirety based on the lowest priority level of input that is significant to the fair value measurement. The assessment of the significance of a particular input to the fair value measurement requires judgment and may affect the placement of assets and liabilities within the levels of the fair value hierarchy. Reclassifications of fair value between Level 1, Level 2 and Level 3 of the fair value hierarchy, if applicable, are made at the end of each quarter.
Deferred Loan Costs
Deferred loan costs are stated at cost, net of amortization and are amortized to interest expense using the effective interest method over the life of the loan.
F-16
PARSLEY ENERGY, INC. AND SUBSIDIARIES
NOTES TO CONSOLIDATED AND COMBINED FINANCIAL STATEMENTS
December 31, 2016
Revenue Recognition
Revenues from the sale of crude oil, natural gas and NGLs are recognized when the production is sold, net of any royalty interest. Because final settlement of the Company’s hydrocarbon sales can take up to two months, the expected sales volumes and prices for those properties are estimated and accrued using information available at the time the revenue is recorded. Natural gas revenues are recorded using the entitlement method of accounting whereby revenue is recognized based on the Company’s proportionate share of natural gas production. At December 31, 2016, 2015 and 2014, the Company did not have any natural gas imbalances. Transportation expenses are included as a reduction of natural gas revenue and are not material.
Defined Contribution Plan
The Company sponsors a 401(k) defined contribution plan for the benefit of all employees at their date of hire. The plan allows eligible employees to contribute a portion of their annual compensation, not to exceed annual limits established by the federal government. The Company makes matching contribution of up to a certain percentage of an employee’s contributions. For the year ended December 31, 2016, 2015 and 2014, the Company made contributions to the plan of $1.9 million, $1.4 million and $0.8 million, respectively.
Income Taxes
The Company accounts for income taxes using the asset and liability method. Deferred tax assets and liabilities are recognized for the future tax consequences attributable to differences between the financial statement carrying amounts of existing assets and liabilities and their respective tax bases and operating loss and tax credit carry forwards. Deferred tax assets and liabilities are calculated by applying existing tax laws and the rates expected to apply to taxable income in the years in which those temporary differences are expected to be recovered or settled. The effect of a change in tax rates on deferred tax assets and liabilities is recognized in income in the period that includes the enactment date. The tax returns and the amount of taxable income or loss are subject to examination by federal and state taxing authorities.
The Company periodically assesses whether it is more likely than not that it will generate sufficient taxable income to realize its deferred income tax assets, including net operating losses. In making this determination, the Company considers all available positive and negative evidence and makes certain assumptions. The Company considers, among other things, its deferred tax liabilities, the overall business environment, its historical earnings and losses, current industry trends and its outlook for future years.
Parsley LLC, the Company’s accounting predecessor, is a limited liability company that is not subject to U.S. federal income tax.
Earnings per Share
The Company uses the "if-converted" method to determine the potential dilutive effect of its Class B Common Stock and the treasury stock method to determine the potential dilutive effect of outstanding restricted stock and restricted stock units.
Comprehensive Income
The Company has no elements of comprehensive income other than net income.
Segment Reporting
Operating segments are defined as components of an enterprise that (i) engage in activities from which it may earn revenues and incur expenses (ii) for which separate operational financial information is available and is regularly evaluated by the chief operating decision maker for the purpose of allocating resources and assessing performance.
Based on the organization and management of the Company, the Company has only one reportable operating segment, which is oil and natural gas exploration and production. The Company considers drilling rig services ancillary to its oil and gas exploration and production activities and manages these services to support such activities.
F-17
PARSLEY ENERGY, INC. AND SUBSIDIARIES
NOTES TO CONSOLIDATED AND COMBINED FINANCIAL STATEMENTS
December 31, 2016
Change in Accounting Principle
The Company adopted Accounting Standards Update ("ASU") 2015-03, Interest—Imputation of Interest (Subtopic 835-30): Simplifying the Presentation of Debt Issuance Costs, effective January 1, 2016. This standard requires companies that have historically presented debt issuance costs as an asset to present those costs as a direct deduction from the carrying amount of the underlying debt liability. To the extent that there are no borrowings under the Revolving Credit Agreement, the related deferred loan costs will continue to be classified as an asset. The guidance required retrospective application in the consolidated financial statements. The Company had no borrowings outstanding under the Revolving Credit Agreement (as defined in Note 7—Debt) at December 31, 2016 and 2015 and as such, approximately $4.2 million and $2.3 million, respectively, of deferred loan costs related to the Revolving Credit Agreement are included in Other noncurrent assets on the consolidated balance sheets and as an operating activity on the consolidated statements of cash flows, included in this Annual Report. The Company’s 2025 Notes (as defined in Note 7—Debt) and the 2024 Notes (as defined in Note 7—Debt) are presented net of approximately $14.3 million of deferred loan costs at December 31, 2016. The Company’s 2022 Notes (as defined in Note 7—Debt) are presented net of approximately $9.1 million of deferred loan costs at December 31, 2015.
The Company adopted ASU 2016-09, Compensation—Stock Compensation (Topic 718)—Improvements to Employee Share-Based Payment Accounting, effective January 1, 2016. This ASU is intended to simplify the accounting for share-based payment transactions, including the income tax consequences, classification of awards as either equity or liabilities, and classification on the statement of cash flows. The amendments in this update are effective for financial statements issued for annual periods beginning after December 15, 2016, including interim periods within those annual periods, and early application is permitted as of the beginning of an interim or annual reporting period. The ASU did not have a material effect on the Company’s consolidated and combined financial statements and related disclosures.
The Company adopted ASU 2015-17, Income Taxes (Topic 740), effective December 31, 2015. This standard requires companies that have historically presented current and noncurrent deferred tax assets and liabilities in a classified statement of financial position to present deferred tax assets and liabilities as noncurrent in a classified statement of financial position. The guidance may be applied either prospectively to all deferred tax liabilities and assets or retrospectively to all periods presented. The Company has elected not to retrospectively adjust prior periods.
Reclassifications
Certain reclassifications have been made to prior period amounts to conform to the current presentation.
Recent Accounting Pronouncements
In May 2014, the FASB issued ASU No. 2014-09, Revenue from Contracts with Customers, which supersedes the revenue recognition requirements in ASC Topic 605, Revenue Recognition, and most industry-specific guidance. ASU 2014-09 provides companies with a single model for use in accounting for revenue arising from contracts with customers and supersedes current revenue recognition guidance, including industry-specific revenue guidance. The core principle of the model is to recognize revenue when control of the goods or services transfers to the customer, as opposed to recognizing revenue when the risks and rewards transfer to the customer under the existing revenue guidance. In addition, new qualitative and quantitative disclosure requirements aim to enable financial statement users to understand the nature, amount, timing and uncertainty of revenue and cash flows arising from contracts with customers. In August 2015, the FASB issued ASU 2015-14, which defers the effective date of ASU 2014-09 for one year to fiscal years beginning after December 15, 2017. Early adoption is permitted for fiscal years beginning after December 15, 2016. In May 2016, the FASB issued ASU 2016-11, which rescinds guidance from the SEC on accounting for gas balancing arrangements and will eliminate the use of the entitlements method. Entities have the option of using either a full retrospective or modified approach to adopt the new standards. The Company has selected the modified retrospective approach for transition and plans to implement the new guidance on January 1, 2018. The amended guidance is not expected to materially affect the Company's consolidated financial statements or notes to the consolidated financial statements.
F-18
PARSLEY ENERGY, INC. AND SUBSIDIARIES
NOTES TO CONSOLIDATED AND COMBINED FINANCIAL STATEMENTS
December 31, 2016
In January 2016, the FASB issued ASU No. 2016-01, Financial Instruments—Overall, which addresses the fair value measurements, impairment assessment and disclosure requirements of equity securities, equity investments and other financial instruments and also clarifies current guidance to aid in the reduction of diversity in practice. For public business entities, the amended guidance is effective for fiscal years beginning after December 15, 2017 and for interim periods within those years. The amended guidance should be applied by means of a cumulative-effect adjustment to the balance sheet as of the beginning of the fiscal year of adoption. The amendments related to equity securities without readily determinable fair values should be applied prospectively. The Company has not yet determined the effect of the standard on its ongoing financial reporting.
In February 2016, the FASB issued ASU No. 2016-02, Leases (Topic 842), which modifies lessees’ recognition of lease assets and lease liabilities for those leases classified as operating leases under previous GAAP. The amended guidance will be effective for the Company for annual periods beginning after December 15, 2018. Early adoption is permitted. The Company is evaluating the effect that ASU 2016-02 will have on its consolidated financial statements and related disclosures. The Company has not yet selected a transition method nor has it determined the effect of the standard on its ongoing financial reporting.
In March 2016, the FASB issued ASU No. 2016-07, Investments—Equity Method and Joint Ventures (Topic 323), which eliminates the requirement that when an investment qualifies for use of the equity method as a result of an increase in the level of ownership interest or degree of influence, an investor must adjust the investment, results of operations and retained earnings retroactively on a step-by-step basis as if the equity method had been in effect during all previous periods that the investment had been held. The amended guidance will be effective for the Company for annual periods beginning after December 15, 2016. The amendments should be applied prospectively upon their effective date to increases in the level of ownership interest or degree of influence that result in the adoption of the equity method. Early adoption is permitted for any entity in any interim or annual period. The amended guidance is not expected to materially affect the Company’s consolidated financial statements or notes to the consolidated financial statements.
In August 2016, The FASB issued ASU No. 2016-15, Statement of Cash Flows (Topic 230), which provides guidance on eight specific cash flow issues, including cash payments associated with debt and debt modification, contingent consideration payments made after a business combination, proceeds from the settlement of insurance claims and corporate-owned life insurance policies, distributions made from equity method investees, beneficial interests in securitization transactions and separately identifiable cash flows and application of the predominance principle. The amended guidance will be effective for the Company for annual periods beginning after December 15, 2017. The amendments should be applied using a retrospective transition method to each period presented. Early adoption is permitted for any entity in any interim or annual period. The Company is evaluating the ASU and has not determined the effect of the standard on its ongoing financial reporting.
In October 2016, The FASB issued ASU No. 2016-16, Income Taxes (Topic 740), which requires an entity to recognize the income tax consequences of an intra-entity transfer of an asset other than inventory when the transfer occurs. This ASU also eliminates the exception for an intra-entity transfer of an asset other than inventory. The amended guidance does not include new disclosure requirements; however, existing disclosure requirements might be applicable when accounting for the current and deferred income taxes. The amended guidance will be effective for the Company for annual periods beginning after December 15, 2017. The amendments should be applied using a modified retrospective basis through a cumulative-effect adjustment directly to retained earnings as of the beginning of the period of adoption. Early adoption is permitted for any entity as of the beginning of an annual reporting period for which financial statements have not been issued or been made available for issuance. The Company is evaluating the ASU and has not determined the effect of the standard on its ongoing financial reporting.
In November 2016, The FASB issued ASU No. 2016-18, Statement of Cash Flows (Topic 230), which requires that a statement of cash flows explain the change during the period in the total of cash, cash equivalents and amounts generally described as restricted cash or restricted cash equivalents. The amounts generally described as restricted cash and restricted cash equivalents should be included with cash and cash equivalents when reconciling the beginning-of-period and end-of-period total amounts shown on the statements of cash flows. The amended guidance will be effective for the Company for annual periods beginning after December 15, 2017. The amendments should be applied using a retrospective transition method to each period presented. Early adoption is permitted for any entity in any interim or annual period. The Company is evaluating the ASU and has not determined the effect of the standard on its ongoing financial reporting.
In January 2017, The FASB issued ASU No. 2017-01, Business Combinations (Topic 805), which clarifies the definition of a business with the objective of adding guidance to assist entities with evaluating whether transactions should be accounted for as acquisitions (or disposals) of assets or businesses. The amendments in this ASU provide a screen to determine when a set
F-19
PARSLEY ENERGY, INC. AND SUBSIDIARIES
NOTES TO CONSOLIDATED AND COMBINED FINANCIAL STATEMENTS
December 31, 2016
is not a business, which requires that when substantially all of the fair value of the gross assets acquired (or disposed of) is concentrated in a single identifiable asset or a group of similar identifiable assets, the set is not considered a business. This reduces the number of transactions that require further evaluation. Further, this ASU provides a framework to assist entities in evaluating whether both an input and a substantive process are present as well as narrows the definition of the term output so that the term is consistent with how outputs are described in Topic 606. The amended guidance will be effective for the Company for annual periods beginning after December 15, 2017, including interim periods within those periods. The amendments should be applied prospectively on or after their effective date and no disclosures are required at transition. Early adoption is for transactions for which the acquisition date or disposal date occurs before the issuance date or effective date of the amendment, only when the transaction has not been reported in financial statements that have been issued or made available for issuance. The Company is evaluating the ASU and has not determined the effect of the standard on its ongoing financial reporting.
NOTE 3. DERIVATIVE FINANCIAL INSTRUMENTS
Commodity Derivative Instruments and Concentration of Risk
Objective and Strategy
The Company utilizes basis swap contracts, three-way collars and put spread options to (i) reduce the effect of price volatility on the commodities the Company produces and sells or consumes, (ii) support the Company's annual capital budgeting and expenditure plans and (iii) reduce commodity price risk associated with certain capital projects.
The Company uses put spread options to manage commodity price risk for NYMEX WTI. A put spread option is a combination of two options: a purchased put and a sold put. The purchased put establishes the minimum price that the Company will receive for the contracted volumes unless the market price for the commodity falls below the sold put strike price, at which point the minimum price equals the reference price plus the excess of the purchased put strike price over the sold put strike price.
Additionally, the Company uses basis swap contracts to mitigate basis risk caused by the volatility of the Company’s basis differentials. The basis swap contracts establish the differential between Cushing WTI prices and the relevant price index at which oil production is sold.
Oil Production Derivative Activities
All material physical sales contracts governing the Company's oil production are tied directly to, or are highly correlated with, NYMEX WTI oil prices.
F-20
PARSLEY ENERGY, INC. AND SUBSIDIARIES
NOTES TO CONSOLIDATED AND COMBINED FINANCIAL STATEMENTS
December 31, 2016
The following table sets forth the volumes associated with the Company's outstanding oil derivative contracts expiring during the periods indicated and the weighted average oil prices for those contracts:
Year Ending December 31, | ||||||||
Crude Options | 2017 | 2018 | ||||||
Purchased: | ||||||||
Puts (1) | ||||||||
Notional (MBbl) | 9,948 | 3,300 | ||||||
Weighted average strike price | $ | 52.04 | $ | 53.41 | ||||
Sold: | ||||||||
Puts (1) | ||||||||
Notional (MBbl) | (9,948 | ) | (3,300 | ) | ||||
Weighted average strike price | $ | 40.45 | $ | 42.27 | ||||
Basis swap contracts: (2) | ||||||||
Midland-Cushing index swap volume (MBbl) (3) | 4,290 | 360 | ||||||
Price differential ($/Bbl) | $ | (1.03 | ) | $ | (0.95 | ) | ||
(1) | Excludes 7,254 notional MBbls with a fair value of $10.3 million related to amounts recognized under master netting agreements with derivative counterparties. | |
(2) | Represents swaps that fix the basis differentials between the index prices at which the Company sells its oil produced in the Permian Basin and the Cushing WTI price. | |
(3) | As of December 31, 2016, the Company has remaining basis swap contracts for 4,650 MBbls of the Company’s 2017 and 2018 production with a negative price differential ranging from $0.40 per MBbl to $1.70 per MBbl between the Midland WTI price index and the Cushing WTI price index. | |
Natural Gas Production Derivative Activities
All material physical sales contracts governing the Company's natural gas production are tied directly or indirectly to NYMEX Henry Hub natural gas prices or regional index prices where the natural gas is sold. The Company uses three-way collars to manage natural gas price volatility.
The following table sets forth the volumes associated with the Company's outstanding natural gas derivative contracts expiring during the periods indicated and the weighted average natural gas prices for those contracts:
Year Ending December 31, | ||||
Natural Gas Three-Way Collars | 2017 | |||
Purchased: | ||||
Puts | ||||
Notional (MMbtu) | 5,700 | |||
Weighted average strike price | $ | 2.75 | ||
Sold: | ||||
Puts | ||||
Notional (MMbtu) | (5,700 | ) | ||
Weighted average strike price | $ | 2.36 | ||
Calls | ||||
Notional (MMbtu) | (5,700 | ) | ||
Weighted average strike price | $ | 4.02 | ||
Effect of Derivative Instruments on the Consolidated Financial Statements
All of the Company’s derivatives are accounted for as non-hedge derivatives and therefore all changes in the fair values of its derivative contracts are recognized as gains or losses in the earnings of the periods in which they occur. The Company
F-21
PARSLEY ENERGY, INC. AND SUBSIDIARIES
NOTES TO CONSOLIDATED AND COMBINED FINANCIAL STATEMENTS
December 31, 2016
recognized loss on derivatives of $50.8 million and gains of $60.8 million and $83.9 million for the years ended December 31, 2016, 2015 and 2014, respectively. These gains and losses are included in the consolidated statements of operations line item, (Loss) gain on derivatives. The fair value of the derivative instruments is discussed in Note 13—Disclosures about Fair Value of Financial Instruments.
The Company classifies the fair value amounts of derivative assets and liabilities as gross current or noncurrent derivative assets or gross current or noncurrent derivative liabilities, whichever the case may be, excluding those amounts netted under master netting agreements. The Company has agreements in place with all of its counterparties that allow for the financial right of offset for derivative assets and liabilities at settlement or in the event of default under the agreements. Additionally, the Company maintains accounts with its brokers to facilitate financial derivative transactions in support of its risk management activities. Based on the value of the Company’s positions in these accounts and the associated margin requirements, the Company may be required to deposit cash into these broker accounts. During the year ended December 31, 2016 and 2015, the Company did not receive or post any margins in connection with collateralizing its derivative positions. During the year ended 2014, the Company received and posted margins with some of its counterparties to collateralize certain derivative positions.
The following table presents the Company’s net exposure from its offsetting derivative asset and liability positions as indicated (in thousands):
Gross Amount Presented on Balance Sheet | Netting Adjustments | Net Exposure | ||||||||||
December 31, 2016 | ||||||||||||
Derivative assets with right of offset or master netting agreements | $ | 66,417 | $ | (10,293 | ) | $ | 56,124 | |||||
Derivative liabilities with right of offset or master netting agreements | (67,261 | ) | 10,293 | (56,968 | ) | |||||||
December 31, 2015 | ||||||||||||
Derivative assets with right of offset or master netting agreements | $ | 407,052 | $ | (297,951 | ) | $ | 109,101 | |||||
Derivative liabilities with right of offset or master netting agreements | (347,611 | ) | 297,951 | (49,660 | ) | |||||||
Concentration of Credit Risk
The financial integrity of the Company’s exchange-traded contracts is assured by NYMEX through systems of financial safeguards and transaction guarantees and is therefore subject to nominal credit risk. Over-the-counter traded options expose the Company to counterparty credit risk. These over-the-counter options are entered into with a large multinational financial institution with investment grade credit rating or through brokers that require all the transaction parties to collateralize their open option positions. The gross and net credit exposure from the Company's commodity derivative contracts as of December 31, 2016 and 2015 is summarized in the table above.
The Company monitors the creditworthiness of its counterparties, established credit limits according to the Company’s credit policies and guidelines and assesses the impact on fair values of its counterparties’ creditworthiness. The Company typically enters into International Swap Dealers Association Master Agreements ("ISDA Agreements") with its derivative counterparties. The terms of the ISDA Agreements provide the Company and its counterparties and brokers with rights of net settlement of gross commodity derivative assets against gross commodity derivative liabilities. The Company routinely exercises its contractual right to offset realized gains against realized losses when settling with derivative counterparties. The Company did not incur any losses due to counterparty bankruptcy filings during any of the years ended December 31, 2016, 2015 and 2014.
F-22
PARSLEY ENERGY, INC. AND SUBSIDIARIES
NOTES TO CONSOLIDATED AND COMBINED FINANCIAL STATEMENTS
December 31, 2016
Credit Risk Related Contingent Features in Derivatives
Certain commodity derivative instruments contain provisions that require the Company to either post additional collateral or immediately settle any outstanding liability balances upon the occurrence of a specified credit risk related event. These events, which are defined by the existing commodity derivative contracts, are primarily downgrades in the credit ratings of the Company and its affiliates. None of the Company’s commodity derivative instruments were in a net liability position with respect to any individual counterparty at December 31, 2016 or 2015.
NOTE 4. PROPERTY, PLANT AND EQUIPMENT
Property, plant and equipment includes the following (in thousands):
December 31, 2016 | December 31, 2015 | |||||||
Oil and natural gas properties: | ||||||||
Subject to depletion | $ | 2,376,712 | $ | 1,627,367 | ||||
Not subject to depletion | ||||||||
Incurred in 2016 | 1,215,920 | — | ||||||
Incurred in 2015 | 71,712 | 118,101 | ||||||
Incurred in 2014 and prior | 399,073 | 500,693 | ||||||
Total not subject to depletion | 1,686,705 | 618,794 | ||||||
Oil and natural gas properties, successful efforts method | 4,063,417 | 2,246,161 | ||||||
Less accumulated depreciation, depletion and impairment | (506,175 | ) | (290,186 | ) | ||||
Total oil and natural gas properties, net | 3,557,242 | 1,955,975 | ||||||
Other property, plant and equipment | 73,382 | 37,253 | ||||||
Less accumulated depreciation | (14,064 | ) | (7,475 | ) | ||||
Other property, plant and equipment, net | 59,318 | 29,778 | ||||||
Total property, plant and equipment, net | $ | 3,616,560 | $ | 1,985,753 | ||||
Costs subject to depletion are proved costs and costs not subject to depletion are unproved costs and current drilling projects. At December 31, 2016 and 2015, the Company had excluded $1,686.7 million and $618.8 million of capitalized costs from depletion.
As the Company’s exploration and development work progresses, and the reserves on the Company’s properties are proven, capitalized costs attributed to the properties and mineral interests are subject to DD&A. Depletion of capitalized costs is provided using the units-of-production method based on proved oil and gas reserves related to the associated reservoir. Depletion expense on capitalized oil and gas properties was $227.2 million, $173.6 million and $92.8 million for the years ended December 31, 2016, 2015 and 2014, respectively. The Company had no exploratory wells in progress at December 31, 2016, 2015 or 2014.
Costs not subject to depletion primarily include leasehold costs, broker and legal expenses and capitalized internal costs associated with developing oil and natural gas prospects on these properties. Leasehold costs are transferred into costs subject to depletion on an ongoing basis as these properties are evaluated and proved reserves are established.
Costs not subject to depletion also include costs associated with development wells in progress or awaiting completion at year-end. These costs are transferred into costs subject to depletion on an ongoing basis as these wells are completed and proved reserves are established or confirmed. These costs totaled $49.4 million at December 31, 2016. The Company anticipates that the $49.4 million associated with these wells in progress at December 31, 2016 will be transferred to costs subject to depletion during 2017.
The Company capitalizes interest on expenditures made in connection with long term projects that are not subject to current depletion. Interest is capitalized only for the period that activities are in progress to bring these projects to their intended use and only to the extent the company has incurred interest expense. There was no capitalized interest recorded during the year ended December 31, 2016 and 2015. There was $2.7 million of capitalized interest recorded during 2014.
F-23
PARSLEY ENERGY, INC. AND SUBSIDIARIES
NOTES TO CONSOLIDATED AND COMBINED FINANCIAL STATEMENTS
December 31, 2016
NOTE 5. ACQUISITIONS OF OIL AND NATURAL GAS PROPERTIES
The Company incurred $79.1 million, $38.8 million and $174.0 million of leasehold acquisition costs during the years ended December 31, 2016, 2015 and 2014, respectively, which are included as part of costs not subject to depletion.
In addition, during the years ended December 31, 2016, 2015 and 2014, the Company acquired certain oil and natural gas properties as described below. These acquisitions were accounted for using the acquisition method under ASC Topic 805, Business Combinations, which requires the acquired assets and liabilities to be recorded at fair values as of the respective acquisition dates.
During 2016, the Company acquired, from unaffiliated individuals and entities, interests in certain oil and natural gas properties through a number of separate, individually negotiated transactions for total cash consideration of $1,267.1 million. The Company reflected $261.4 million of the total consideration paid as part of its cost subject to depletion within its oil and natural gas properties and $1,005.7 million as unproved leasehold costs within its oil and natural gas properties for the year ended December 31, 2016. The revenues and operating expenses attributable to these acquisitions during the years ended December 31, 2016, 2015 and 2014 were not material.
During 2016, the Company also exchanged certain unproved acreage and oil and natural gas properties with a third party, with no gain or loss recognized.
During 2015, the Company acquired from unaffiliated individuals and entities, interests in certain oil and natural gas properties through a number of separate, individually negotiated transactions for an aggregate total cash consideration of $35.0 million. The Company reflected $16.4 million of the total consideration paid as part of its costs subject to depletion and $18.6 million as unproved leasehold costs within its oil and gas properties. The revenues and operating expenses attributable to the working interest acquisitions during the years ended December 31, 2016, 2015 and 2014 were not material.
During 2014, the Company acquired from unaffiliated individuals and entities, interests in certain oil and natural gas properties through a number of separate, individually negotiated transactions for an aggregate total cash consideration of $588.2 million. The Company reflected $233.9 million of the total consideration paid as part of its costs subject to depletion and $354.3 million as unproved leasehold costs within its oil and gas properties. The revenues and operating expenses attributable to the working interest acquisitions during the years ended December 31, 2016, 2015 and 2014 were not material.
NOTE 6. SALES OF OIL AND NATURAL GAS PROPERTIES
In December 2015, the Company sold its interest in 91 net operated wells and 11,664 gross (7,155 net) acres for net proceeds of $39.4 million and realized a $36.7 million loss, net of estimated purchase price adjustments.
In July 2015, the Company sold 9,164 net acres for total proceeds of $9.3 million and recognized a gain on the sale of $3.2 million.
In August 2014, the Company sold its interest in one operated well and 38 net acres for total proceeds of $0.2 million and realized a $2.1 million loss on the sale.
F-24
PARSLEY ENERGY, INC. AND SUBSIDIARIES
NOTES TO CONSOLIDATED AND COMBINED FINANCIAL STATEMENTS
December 31, 2016
NOTE 7. DEBT
The Company’s debt consists of the following (in thousands):
December 31, 2016 | December 31, 2015 | |||||||
5.375% senior unsecured notes due 2025 | $ | 650,000 | $ | — | ||||
6.250% senior unsecured notes due 2024 | 400,000 | — | ||||||
7.500% senior unsecured notes due 2022 | 61,846 | 550,000 | ||||||
Capital leases | 3,752 | 2,215 | ||||||
Other | 3,500 | — | ||||||
Revolving Credit Agreement | — | — | ||||||
Total debt | 1,119,098 | 552,215 | ||||||
Debt issuance costs on senior unsecured notes | (14,388 | ) | (9,092 | ) | ||||
Premium on senior unsecured notes | 3,828 | 4,660 | ||||||
Less: current portion | (67,214 | ) | (951 | ) | ||||
Total long-term debt | $ | 1,041,324 | $ | 546,832 | ||||
Revolving Credit Agreement
On October 28, 2016, the Company and its subsidiary Parsley LLC entered into a new revolving credit agreement with, among others, Wells Fargo Bank, National Association, as administrative agent (the "New Revolving Credit Agreement"), providing for an initial borrowing base of $900.0 million and an initial commitment level of $600.0 million. The Revolving Credit Agreement replaced the Company's previously existing amended and restated revolving credit agreement with, among others, Wells Fargo Bank, National Association, as administrative agent, which was terminated concurrently with entry into the New Revolving Credit Agreement. As used in this Annual Report, the term "Revolving Credit Agreement" refers, prior to October 28, 2016, to the previously existing amended and restated credit agreement and, subsequent to October 28, 2016, to the New Revolving Credit Agreement.
The Revolving Credit Agreement provides for a five-year senior secured revolving credit facility, maturing on October 28, 2021, with a borrowing capacity of the lesser of (i) the borrowing base, (ii) aggregate elected borrowing base commitments and (iii) $2.5 billion. The Revolving Credit Agreement is secured by substantially all of Parsley LLC’s and its restricted subsidiaries’ assets.
The Revolving Credit Agreement provides for an initial borrowing base of $900.0 million and commitment level of $600.0 million, which will be redetermined by the lenders on a semi-annual basis each April 1 and October 1, with the first such scheduled redetermination occurring on April 1, 2017. The amount Parsley LLC is able to borrow under the Revolving Credit Agreement is subject to compliance with the financial covenants, satisfaction of various conditions precedent to borrowing and other provisions of the Revolving Credit Agreement.
As of December 31, 2016, the borrowing base was $875.0 million with a commitment level of $600.0 million. There were no borrowings outstanding and $0.3 million in letters of credit outstanding, resulting in availability of approximately $599.8 million.
Borrowings under the Revolving Credit Agreement can be made in Eurodollars or at the alternate base rate. Eurodollar loans bear interest at a rate per annum equal to an adjusted LIBO rate plus an applicable margin ranging from 2.0% to 3.0%, depending on the percentage of the borrowing base utilized. Alternate base rate loans bear interest at a rate per annum equal to the greater of (i) the prime rate of Wells Fargo, (ii) the federal funds effective rate plus 0.5% and (iii) the adjusted LIBO rate plus 1.0%, plus an applicable margin ranging from 1.0% to 2.0%, depending on the percentage of the borrowing base utilized. Notwithstanding the foregoing, if the Consolidated Leverage Ratio (as defined in the Revolving Credit Agreement) as of the last day of any fiscal quarter or fiscal year of Parsley LLC, as applicable, exceeds 3.50 to 1.00, then the applicable margin with respect to alternate base rate loans and Eurodollar loans will, in each case, increase by 0.5% until such time as the Consolidated Leverage Ratio does not exceed 3.50 to 1.00. The Revolving Credit Agreement also provides for a commitment fee ranging from 0.375% to 0.500%, depending on the percentage of the borrowing base utilized. As of December 31, 2016, letters of credit
F-25
PARSLEY ENERGY, INC. AND SUBSIDIARIES
NOTES TO CONSOLIDATED AND COMBINED FINANCIAL STATEMENTS
December 31, 2016
outstanding under the Revolving Credit Agreement had a weighted average interest rate of 2.00%. The Company may repay any amounts borrowed prior to the maturity date without any premium or penalty other than customary LIBOR breakage costs.
The Revolving Credit Agreement is subject to various financial covenants, which include, for example, the maintenance of the following financial ratios:
• | a minimum current ratio (based on the ratio of consolidated current assets to consolidated current liabilities) of not less than 1.0 to 1.0 as of the last day of any fiscal quarter; and |
• | a maximum Consolidated Leverage Ratio of not more than 4.0 to 1.0 as of the last day of any fiscal quarter for the four fiscal quarters ending on such date (annualized through the period ending March 31, 2017). |
The Revolving Credit Agreement places restrictions on Parsley LLC and certain of its subsidiaries with respect to, for example, additional indebtedness, liens, dividends and other payments, investments, acquisitions, mergers, asset dispositions, transactions with affiliates, hedging transactions and other matters. The Revolving Credit Agreement also places customary "holding company" restrictions on the activities of the Company.
At December 31, 2016, the Company was in compliance with all required covenants. The Revolving Credit Agreement is subject to customary events of default, including a change in control (as defined in the Revolving Credit Agreement). If an event of default occurs and is continuing, the administrative agent or the Majority Lenders (as defined in the Revolving Credit Agreement) may accelerate any amounts outstanding and terminate lender commitments.
7.500% Senior Notes due 2022
On February 5, 2014, Parsley LLC and Finance Corp. ("the Issuers") issued $400.0 million aggregate principal amount of 7.500% senior unsecured notes due 2022 (the "2022 Notes") in an offering that was exempt from registration under the Securities Act. Interest was payable on the 2022 Notes semi-annually in arrears on each February 15 and August 15 and commenced August 15, 2014. The 2022 Notes were fully and unconditionally guaranteed on a senior unsecured basis by all of the subsidiaries of Parsley LLC that guarantee the indebtedness under the Revolving Credit Agreement, other than Finance Corp. (the "Guarantor Subsidiaries"). This issuance of 2022 Notes resulted in gross proceeds of $400.0 million and net proceeds to the Company, after deducting initial purchaser discounts and commissions and offering expenses, of approximately $391.4 million, $198.5 million of which was used repay all outstanding term debt, accrued interest and a prepayment penalty under a second lien credit facility (which was terminated concurrently with such repayment) and $175.1 million of which was used to partially repay borrowings under the Revolving Credit Agreement.
On April 14, 2014, the Issuers issued an additional $150.0 million aggregate principal amount of the 2022 Notes at 104% of par in an offering that was exempt from registration under the Securities Act. This issuance of 2022 Notes resulted in gross proceeds of $156.0 million and net proceeds to the Company, after deducting initial purchaser discounts and commissions and offering expenses, of $152.8 million, $145.0 million of which was used to repay borrowings under the Revolving Credit Agreement.
On December 6, 2016, Parsley LLC commenced a cash tender offer to purchase any and all of the 2022 Notes (the "Tender Offer"). On December 13, 2016, the Tender Offer expired and, at such time, $487.7 million aggregate principal amount of the 2022 Notes was validly tendered (which did not include $1.2 million aggregate principal amount of the 2022 Notes that remained subject to guaranteed delivery procedures). Parsley LLC accepted all of the 2022 Notes validly tendered and not validly withdrawn in the Tender Offer and, on December 13, 2016, made a cash payment of $537.1 million, which included principal of $487.7 million, a prepayment premium on the extinguishment of debt of $32.5 million, accrued interest of $12.0 million and other debt issuance costs of $4.9 million. On December 15, 2016, Parsley LLC made a cash payment of $0.5 million for the tender of an additional $0.4 million aggregate principal amount of the 2022 Notes and $0.1 million of prepayment premium on the extinguishment of debt and accrued interest. The Company recognized a loss on extinguishment of debt of $36.3 million, which is included in Prepayment premium on extinguishment of debt on the Company's consolidated statements of operations and in operating activities on the Company's statements of cash flows, included in this Annual Report.
On January 5, 2017, Parsley LLC redeemed $61.8 million aggregate principal of the 2022 Notes that remained outstanding and made a cash payment of $67.5 million to the remaining holders of the 2022 Notes, which included principal of $61.8 million, prepayment premium on the extinguishment of debt of $3.9 million and accrued interest of $1.8 million. During 2017, the Company will recognize a loss on extinguishment of debt of $3.9 million. As of December 31, 2016, the Company
F-26
PARSLEY ENERGY, INC. AND SUBSIDIARIES
NOTES TO CONSOLIDATED AND COMBINED FINANCIAL STATEMENTS
December 31, 2016
had committed to repayment of the remaining $61.8 million aggregate principal amount of the 2022 Notes, which are included in Current portion of long-term debt on the Company's consolidated balance sheets, included in this Annual Report.
6.250% Senior Unsecured Notes due 2024
On May 27, 2016, the Issuers issued $200.0 million aggregate principal amount of 6.250% senior unsecured notes due 2024 (the "Initial 2024 Notes") in an offering that was exempt from registration under the Securities Act (the "Initial 2024 Notes Offering"). The Initial 2024 Notes Offering resulted in gross proceeds to the Company of $200.0 million and net proceeds to the Company, after deducting initial purchaser discounts and commissions and offering expenses, of approximately $195.4 million.
On August 19, 2016, the Issuers issued an additional $200.0 million aggregate principal amount of 6.250% senior notes due 2024 (the "New 2024 Notes" and together with the Initial 2024 Notes, the "2024 Notes") at 102.000% of par, plus accrued and unpaid interest from May 27, 2016, in an offering that was exempt from registration under the Securities Act (the "New 2024 Notes Offering"). The New 2024 Notes were issued as additional notes under the indenture governing the Initial 2024 Notes. The New 2024 Notes have identical terms, other than the issue date, as the Initial 2024 Notes and the New 2024 Notes and Initial 2024 Notes will be treated as a single class of securities under the indenture governing the 2024 Notes. Interest is payable on the 2024 Notes semi-annually in arrears on each June 1 and December 1 and commenced December 1, 2016. The 2024 Notes are fully and unconditionally guaranteed on a senior unsecured basis by the Guarantor Subsidiaries. The 2024 Notes are not guaranteed by the Company and the Company is not subject to the terms of the indenture. The New 2024 Notes Offering resulted in gross proceeds to the Company of $206.8 million, including a $4.0 million premium and $2.8 million of accrued and unpaid interest and net proceeds to the Company, after deducting accrued and unpaid interest, initial purchaser discounts and commissions and offering expenses, of approximately $199.6 million. The interest received is included in Accounts payable and accrued expenses on the consolidated balance sheets and as an operating activity on the consolidated statements of cash flows, included in this Annual Report.
At any time prior to June 1, 2019, the Issuers may, from time to time, redeem up to 35% of the aggregate principal of the 2024 Notes with an amount of cash not greater than the net cash proceeds of certain equity offerings at a redemption price equal to 106.250% of the principal amount of the 2024 Notes redeemed, plus accrued and unpaid interest, if any, to the redemption date, with the proceeds of certain equity offerings so long as the redemption occurs within 120 days of completing such equity offering and at least 65% of the aggregate principal amount of the 2024 Notes remains outstanding after such redemption. Prior to June 1, 2019, the Issuers may, on any one or more occasions, redeem all or a part of the 2024 Notes for cash at a redemption price equal to 100% of the principal amount of the 2024 Notes redeemed, plus a "make-whole" premium as of and accrued and unpaid interest, if any, to, the date of redemption. On and after June 1, 2019, the Issuers may redeem the 2024 Notes, in whole or in part, at redemption prices (expressed as percentages of principal amount) equal to 104.688% for the 12-month period beginning on June 1, 2019, 103.125% for the 12-month period beginning June 1, 2020, 101.563% for the 12-month period beginning on June 1, 2021 and 100% beginning on June 1, 2022, plus accrued and unpaid interest to the redemption date.
The indenture governing the 2024 Notes contains covenants that, among other things and subject to certain exceptions and qualifications, limit the Issuers' ability and the ability of their restricted subsidiaries to: (i) incur or guarantee additional indebtedness or issue certain types of preferred stock; (ii) pay dividends on capital stock or redeem, repurchase or retire capital stock or subordinated indebtedness; (iii) transfer or sell assets; (iv) make investments; (v) create certain liens; (vi) enter into agreements that restrict dividends or other payments from their restricted subsidiaries to them; (vii) consolidate, merge or transfer all or substantially all of their assets; (viii) engage in transactions with affiliates; and (ix) create unrestricted subsidiaries.
At December 31, 2016, the Company was in compliance with all of these covenants. If at any time when the 2024 Notes are rated investment grade by either Moody’s Investors Service, Inc. or Standard & Poor’s Ratings Services and no default or event of default (as defined in the indenture governing the 2024 Notes) has occurred and is continuing, many of such covenants will be suspended. If the ratings on the 2024 Notes were to decline subsequently to below investment grade, the suspended covenants would be reinstated.
5.375% Senior Unsecured Notes due 2025
On December 13, 2016, the Issuers issued $650.0 million aggregate principal amount of 5.375% senior unsecured notes due 2025 (the "2025 Notes") in an offering that was exempt from registration under the Securities Act (the "2025 Notes
F-27
PARSLEY ENERGY, INC. AND SUBSIDIARIES
NOTES TO CONSOLIDATED AND COMBINED FINANCIAL STATEMENTS
December 31, 2016
Offering"). Interest is payable on the 2025 Notes semi-annually in arrears on each January 15 and July 15, commencing July 15, 2017. The 2025 Notes are fully and unconditionally guaranteed on a senior unsecured basis by the Guarantor Subsidiaries. The 2025 Notes are not guaranteed by the Company and the Company is not subject to the terms of the indenture governing the 2025 Notes. The 2025 Notes Offering resulted in gross proceeds to the Company of $650.0 million and net proceeds to the Company, after deducting initial purchaser discounts and commissions and offering expenses, of approximately $644.1 million.
At any time prior to January 15, 2020, the Issuers may, from time to time, redeem up to 35% of the aggregate principal amount of the 2025 Notes with an amount of cash not greater than the net cash proceeds of certain equity offerings at a redemption price equal to 105.375% of the principal amount of the 2025 Notes redeemed, plus accrued and unpaid interest, if any, to the date of redemption, provided that at least 65% of the aggregate principal amount issued under the indenture governing the 2025 Notes remains outstanding immediately after such redemption and the redemption occurs within 120 days of the closing date of such equity offering. Prior to January 15, 2020, the Issuers may, on any one or more occasions, redeem all or a part of the 2025 Notes at a redemption price equal to 100% of the principal amount of the 2025 Notes redeemed, plus a "make-whole" premium as of and accrued and unpaid interest, if any, to, the date of redemption. On and after January 15, 2020, the Issuers may redeem the 2025 Notes, in whole or in part, at redemption prices (expressed as percentages of principal amount) equal to 104.031% for the 12-month period beginning on January 15, 2020, 103.750% for the 12-month period beginning January 15, 2021, 101.344% for the 12-month period beginning on January 15, 2022 and 100% beginning on January 15, 2023, plus accrued and unpaid interest to the redemption date.
The indenture governing the 2025 Notes contains covenants that, among other things and subject to certain exceptions and qualifications, limit the Issuers’ ability and the ability of their restricted subsidiaries to: (i) incur or guarantee additional indebtedness or issue certain types of preferred stock; (ii) pay dividends on capital stock or redeem, repurchase or retire capital stock or subordinated indebtedness; (iii) transfer or sell assets; (iv) make investments; (v) create certain liens; (vi) enter into agreements that restrict dividends or other payments from their subsidiaries to them; (vii) consolidate, merge or transfer all or substantially all of their assets; (viii) engage in transactions with affiliates; and (ix) create unrestricted subsidiaries.
At December 31, 2016, the Company was in compliance with all of these covenants. If at any time when the 2025 Notes
are rated investment grade by either Moody’s Investors Service, Inc. or Standard & Poor’s Ratings Services and no default or
event of default (as defined in the indenture governing the 2025 Notes) has occurred and is continuing, many of such covenants will be suspended. If the ratings on the 2025 Notes were to decline subsequently to below investment grade, the suspended covenants would be reinstated.
Principal Maturities of Debt
Principal maturities debt outstanding at December 31, 2016 are as follows (in thousands):
2017 | $ | 67,214 | |
2018 | 1,183 | ||
2019 | 673 | ||
2020 | 28 | ||
2021 | — | ||
Thereafter | 1,050,000 | ||
Total | $ | 1,119,098 | |
F-28
PARSLEY ENERGY, INC. AND SUBSIDIARIES
NOTES TO CONSOLIDATED AND COMBINED FINANCIAL STATEMENTS
December 31, 2016
Interest Expense
The following amounts have been incurred and charged to interest expense for the year ended December 31, 2016, 2015 and 2014 (in thousands):
Year ended December 31, | ||||||||||||
2016 | 2015 | 2014 | ||||||||||
Cash payments for interest | $ | 65,513 | $ | 43,993 | $ | 27,252 | ||||||
Change in interest accrual | (11,604 | ) | (348 | ) | 13,390 | |||||||
Payment-in-kind interest | — | — | 234 | |||||||||
Amortization of deferred loan origination costs | 2,739 | 2,170 | 1,941 | |||||||||
Write-off of deferred loan origination costs | 451 | 532 | 386 | |||||||||
Amortization of bond premium | (874 | ) | (764 | ) | (574 | ) | ||||||
Other interest income | (992 | ) | (30 | ) | (316 | ) | ||||||
Interest costs incurred | 55,233 | 45,553 | 42,313 | |||||||||
Less: capitalized interest | — | — | (2,689 | ) | ||||||||
Total interest expense, net | $ | 55,233 | $ | 45,553 | $ | 39,624 | ||||||
NOTE 8. EQUITY
Preferred Stock
Pursuant to the Company’s amended and restated bylaws, the Company’s board of directors, subject to any limitations prescribed by law, may, without further stockholder approval, establish and issue from time to time one or more classes or series of preferred stock, par value $0.01 per share, covering up to an aggregate of 50.0 million shares of preferred stock. The Company had no shares of preferred stock outstanding at December 31, 2016 and 2015.
Class A Common Stock
The Company has 179.6 million shares of its Class A Common Stock outstanding as of December 31, 2016, which includes 0.6 million shares of restricted stock. Holders of Class A Common Stock are entitled to one vote per share on all matters to be voted upon by the stockholders and are entitled to ratably receive dividends when and if declared by the Company’s board of directors. Upon liquidation, dissolution, distribution of assets or other winding up, the holders of Class A Common Stock are entitled to receive ratably the assets available for distribution to the stockholders after payment of liabilities and the liquidation preference of any of the Company's outstanding shares of preferred stock.
Class B Common Stock
The Company has 28.0 million shares of its Class B Common Stock outstanding as of December 31, 2016. Holders of the Class B Common Stock are entitled to one vote per share on all matters to be voted upon by the stockholders. Holders of Class A Common Stock and Class B Common Stock vote together as a single class on all matters presented to the Company’s stockholders for their vote or approval, except with respect to the amendment of certain provisions of the Company’s certificate of incorporation that would alter or change the powers, preferences or special rights of the Class B Common Stock so as to affect them adversely, which amendments must be by a majority of the votes entitled to be cast by the holders of the shares affected by the amendment, voting as a separate class, or as otherwise required by applicable law.
Holders of Class B Common Stock do not have any right to receive dividends, unless the dividend consists of shares of Class B Common Stock or of rights, options, warrants or other securities convertible or exercisable into or exchangeable for shares of Class B Common Stock paid proportionally with respect to each outstanding share of Class B Common Stock and a dividend consisting of shares of Class A Common Stock or of rights, options, warrants or other securities convertible or exercisable into or exchangeable for shares of Class A Common Stock on the same terms is simultaneously paid to the holders of Class A Common Stock. Holders of Class B Common Stock do not have any right to receive a distribution upon a liquidation or winding up of the Company.
F-29
PARSLEY ENERGY, INC. AND SUBSIDIARIES
NOTES TO CONSOLIDATED AND COMBINED FINANCIAL STATEMENTS
December 31, 2016
Exchange Right
In accordance with the terms of the amended and restated limited liability company agreement of Parsley LLC ("Parsley LLC Agreement"), the PE Unit Holders generally have the right to exchange (the "Exchange Right") their PE Units (and a corresponding number of shares of Class B Common Stock), for shares of the Company’s Class A Common Stock at an exchange ratio of one share of Class A Common Stock for each PE Unit (and a corresponding number of shares of Class B Common Stock) exchanged, (subject to conversion rate adjustments for stock splits, stock dividends and reclassifications) or cash at the Company’s or Parsley LLC’s election. As a PE Unit Holder exchanges its PE Units, the Company’s interest in Parsley LLC will be correspondingly increased.
During the year ended December 31, 2016, certain PE Unit Holders exercised their Exchange Right under the Parsley LLC Agreement and elected to exchange an aggregate of 4.1 million PE Units (and a corresponding number of shares of Class B Common Stock) for an aggregate of 4.1 million shares of Class A Common Stock (collectively, the "Exchange"). The Company exercised its call right under the Parsley LLC Agreement and elected to issue Class A Common Stock to each of the exchanging PE Unit Holders in satisfaction of their election notices. As a result of the Exchange, the Company’s interest in Parsley LLC was increased from 83.9% to 85.9%. During the year ended December 31, 2015, no PE Unit Holders elected to exchange pursuant to their Exchange Right.
Earnings per Share
Basic earnings per share ("EPS") measures the performance of an entity over the reporting period. Diluted EPS measures the performance of an entity over the reporting period while giving effect to all potentially dilutive common shares that were outstanding during the period. The Company uses the "if-converted" method to determine the potential dilutive effect of its Class B Common Stock and the treasury stock method to determine the potential dilutive effect of outstanding restricted stock and restricted stock units.
EPS for the year ended December 31, 2016 and 2015 is calculated using the 12 months ended December 31, 2016 and 2015. EPS for the year ended December 31, 2014 is calculated for the period from May 29, 2014, the closing date of the IPO, to December 31, 2014. For the year ended December 31, 2016 and 2015, Class B Common Stock and time-based restricted stock were not recognized in dilutive EPS calculations as they would have been antidilutive. For the year ended December 31, 2014, only Class B Common Stock was not recognized in dilutive EPS calculations as it would have been antidilutive.
F-30
PARSLEY ENERGY, INC. AND SUBSIDIARIES
NOTES TO CONSOLIDATED AND COMBINED FINANCIAL STATEMENTS
December 31, 2016
The following table reflects the allocation of net income to common stockholders and EPS computations for the periods indicated based on a weighted average number of common stock outstanding for the period:
December 31, 2016 | December 31, 2015 | December 31, 2014 | ||||||||||
Basic EPS (in thousands, except per share data) | ||||||||||||
Numerator: | ||||||||||||
Basic net (loss) income attributable to Parsley Energy, Inc. Stockholders | $ | (74,182 | ) | $ | (50,484 | ) | $ | 61,352 | ||||
Denominator: | ||||||||||||
Basic weighted average shares outstanding | 161,793 | 111,271 | 93,168 | |||||||||
Basic EPS attributable to Parsley Energy, Inc. Stockholders | $ | (0.46 | ) | $ | (0.45 | ) | $ | 0.65 | ||||
Diluted EPS | ||||||||||||
Numerator: | ||||||||||||
Net (loss) income attributable to Parsley Energy, Inc. Stockholders | (74,182 | ) | (50,484 | ) | 61,352 | |||||||
Diluted net (loss) income attributable to Parsley Energy, Inc. Stockholders | $ | (74,182 | ) | $ | (50,484 | ) | $ | 61,352 | ||||
Denominator: | ||||||||||||
Basic weighted average shares outstanding | 161,793 | 111,271 | 93,168 | |||||||||
Effect of dilutive securities: | ||||||||||||
Restricted Stock and Restricted Stock Units | — | — | 103 | |||||||||
Diluted weighted average shares outstanding (1) | 161,793 | 111,271 | 93,271 | |||||||||
Diluted EPS attributable to Parsley Energy, Inc. Stockholders | $ | (0.46 | ) | $ | (0.45 | ) | $ | 0.65 | ||||
(1)Approximately 453,863 and 211,935 shares related to performance-based restricted stock units that could be converted to common shares in the future based on predetermined performance and market goals were not included in the computation of EPS for the year ended December 31, 2016 and 2015, because the performance and market conditions had not been met, assuming the end of the reporting period was the end of the contingency period.
LLC Interest Issuance
On May 29, 2014, in connection with the Corporate Reorganization, NGP and other preferred investors, including all of the Company's executive officers (the "Preferred Holders") interests were converted to PE Units. A portion of such PE Units were redeemed by Parsley LLC in exchange for the preferred return payment of the preferred return of approximately $6.7 million and the remainder of such PE Units were contributed to the Company in exchange for an equal number of shares of Class A Common Stock.
Noncontrolling Interest
Concurrent with the closing of the Pacesetter Acquisition, Pacesetter’s President acquired a 37.0% interest in Pacesetter, with Operations retaining 63.0% of Pacesetter. As a result, the Company has consolidated the financial position and results of operations of Pacesetter due to Operations’ ownership interest. The 37.0% interest retained by Pacesetter’s President is reflected as a noncontrolling interest.
As a result of the Corporate Reorganization and the IPO in 2014, the Company acquired 74.3% of Parsley LLC, with the Existing Owners retaining ownership of 25.7% of Parsley LLC. Upon completion of the additional public offerings of Class A Common Stock in 2016 (as discussed in Note 1—Organization and Nature of Operations) and the exchange of PE Units (and corresponding shares of Class B Common Stock) for Class A Common Stock, at December 31, 2016, the Company’s ownership of Parsley LLC was 86.5% and the PE Unit Holders’ ownership of Parsley LLC was 13.5%. Because the increase in the Company’s ownership interest in Parsley LLC does not result in a change of control, the transaction is accounted for as an equity transaction under ASC Topic 810, Consolidation, which requires that any differences between the amount by which the
F-31
PARSLEY ENERGY, INC. AND SUBSIDIARIES
NOTES TO CONSOLIDATED AND COMBINED FINANCIAL STATEMENTS
December 31, 2016
carrying value of the Company’s basis in Parsley LLC is adjusted and the fair value of the consideration received are recognized directly in equity and attributed to the controlling interest.
The Company has consolidated the financial position and results of operations of Parsley LLC and reflected that portion retained by the PE Unit Holders as a noncontrolling interest.
The following table summarizes the noncontrolling interest (loss) income:
Year ended December 31, | ||||||||||||
2016 | 2015 | 2014 | ||||||||||
(in thousands) | ||||||||||||
Net (loss) income attributable to the noncontrolling interests of: | ||||||||||||
Parsley LLC | $ | (14,953 | ) | $ | (21,870 | ) | $ | 33,293 | ||||
Pacesetter Drilling, LLC | 218 | (677 | ) | — | ||||||||
Total net (loss) income attributable to noncontrolling interest | $ | (14,735 | ) | $ | (22,547 | ) | $ | 33,293 | ||||
NOTE 9. STOCK-BASED COMPENSATION
In connection with the IPO, the Company adopted the Parsley Energy, Inc. 2014 Long Term Incentive Plan ("LTIP") for employees and directors of the Company who perform services for the Company. The shares to be delivered under the LTIP shall be made available from (i) authorized but unissued shares, (ii) shares held as treasury stock or (iii) previously issued shares reacquired by the Company including shares purchased on the open market. A total of 12.7 million shares of Class A Common Stock have been authorized for issuance under the LTIP. At December 31, 2016, the Company had 10.5 million shares of Class A Common Stock available for future grant.
The following table reflects stock-based compensation expense recorded for each type of stock-based compensation award for the years ended December 31, 2016, 2015 and 2014:
Year ended December 31, | ||||||||||||
2016 | 2015 | 2014 | ||||||||||
(in thousands) | ||||||||||||
Time-based restricted stock | $ | 3,523 | $ | 3,856 | $ | 2,145 | ||||||
Time-based restricted stock units | 5,677 | 2,710 | 64 | |||||||||
Performance-based restricted stock units | 3,671 | 1,567 | — | |||||||||
Incentive units | — | — | 51,088 | |||||||||
Total | $ | 12,871 | $ | 8,133 | $ | 53,297 | ||||||
(1) | Stock-based compensation expense on time-based restricted stock units with graded vesting is recognized on a straight-line basis over the requisite service period for each separately vesting portion of the award as if the award was, in-substance, multiple awards. | |
Stock-based compensation is included in General and administrative expenses on the Company’s consolidated statement of operations, included in this Annual Report.
Time-Based Restricted Stock
Time-based restricted stock are awards of Class A Common Stock that are legally issued and outstanding ("RSA"). RSAs are subject to restrictions on transfer and to a risk of forfeiture if the award recipient is no longer an employee or director of the Company for any reason prior to the lapse of the restrictions. The stock-based compensation expense for these awards was determined using the closing price on the date of grant applied to the total number of shares that were anticipated to fully vest.
F-32
PARSLEY ENERGY, INC. AND SUBSIDIARIES
NOTES TO CONSOLIDATED AND COMBINED FINANCIAL STATEMENTS
December 31, 2016
The following table summarizes the RSA activity for the year ended December 31, 2016:
Time-Based Restricted Stock | Grant Date Fair Value | ||||||
Outstanding at January 1, 2016 | 661,234 | $ | 18.50 | ||||
Awards granted | 36,504 | $ | 27.94 | ||||
Forfeited | (22,039 | ) | $ | 21.11 | |||
Vested | (74,938 | ) | $ | 18.14 | |||
Outstanding at December 31, 2016 | 600,761 | $ | 19.02 | ||||
Time-Based Restricted Stock Units
Time-based restricted stock units ("RSU") represent the right to receive Class A Common Stock at the end of the vesting period equal to the number of restricted stock units granted. RSUs are subject to restrictions on transfer and are generally subject to a risk of forfeiture if the award recipient is no longer an employee or director of the Company for any reason prior to the lapse of the restriction. The stock-based compensation expense of such RSUs was determined using the closing price on the date of grant applied to the total number of shares that were anticipated to fully vest. The following table summarizes the RSU activity for the year ended December 31, 2016:
Time-Based Restricted Stock Units | Grant Date Fair Value | ||||||
Outstanding at January 1, 2016 | 512,852 | $ | 16.84 | ||||
Awards granted | 567,347 | $ | 17.05 | ||||
Forfeited | (19,013 | ) | $ | 16.72 | |||
Vested | (15,400 | ) | $ | 16.85 | |||
Outstanding at December 31, 2016 | 1,045,786 | $ | 16.96 | ||||
Performance-Based Restricted Stock Units
During 2016 and 2015, performance-based, stock-settled restricted stock unit awards ("PSU"), were granted with a performance period of three years. The number of shares of Class A Common Stock actually delivered pursuant to these PSUs depends on the performance of the Company's Class A Common Stock over the performance period in relation to the performance of the common stock of a predetermined peer group. The conditions of the grants allow for an actual payout ranging between no payout and 200% of target. The payout level is calculated based on actual performance achieved during the performance period compared to a defined peer group. The fair value of such PSUs was determined using a Monte Carlo simulation and will be recognized over the next three years. The Monte Carlo simulation model utilizes multiple input variables that determine the probability of satisfying the market condition stipulated in the award grant and calculates the fair value of the award. Expected volatilities in the model were estimated using a historical period consistent with the performance period of approximately three years. The risk-free interest rate was based on the United States Treasury rate for a term commensurate with the expected life of the grant. The Company used the following assumptions to estimate the fair value of PSUs granted during 2016 and 2015:
2016 | 2015 | |||||
Risk-free interest rate | 0.88 | % | 1.05 | % | ||
Range of volatilities | 35.0% - 65.1% | 42.2% - 84.8% | ||||
F-33
PARSLEY ENERGY, INC. AND SUBSIDIARIES
NOTES TO CONSOLIDATED AND COMBINED FINANCIAL STATEMENTS
December 31, 2016
The following table summarizes the PSU activity for the year ended December 31, 2016:
Performance-Based Restricted Units | Grant Date Fair Value | ||||||
Outstanding at January 1, 2016 | 211,935 | $ | 24.20 | ||||
Awards granted | 241,928 | $ | 25.82 | ||||
Outstanding at December 31, 2016 | 453,863 | $ | 25.06 | ||||
The following table reflects the future stock-based compensation expense to be recorded for the stock-based compensation awards that were outstanding at December 31, 2016:
Time-Based Restricted Stock | Time-Based Restricted Stock Units | Performance-Based Restricted Units | ||||||||||
(in thousands) | ||||||||||||
2017 | $ | 3,136 | $ | 5,936 | $ | 3,955 | ||||||
2018 | 1,093 | 3,245 | 2,176 | |||||||||
2019 | — | 390 | 6 | |||||||||
Total | $ | 4,229 | $ | 9,571 | $ | 6,137 | ||||||
Incentive Units
Pursuant to the Parsley LLC Agreement, certain incentive units were issued to legacy investors, management and employees of Parsley LLC. The incentive units were intended to be compensation for services rendered to Parsley LLC. The original terms of the incentive units were as follows: Tier I incentive units vested ratably over three years, but were subject to forfeiture if payout was not achieved. In addition, all unvested Tier I incentive units vested immediately upon Tier I payout. Tier I payout was realized upon the return of the Preferred Holders’ invested capital and a specified rate of return. Tier II, III and IV incentive units vested only upon the achievement of certain payout thresholds for each such tier and each tier of the incentive units was subject to forfeiture if the applicable required payouts were not achieved. In addition, vested and unvested incentive units would be forfeited if an incentive unit holder’s employment was terminated for any reason or if the incentive unit holder voluntarily terminated their employment.
The incentive units were accounted for as liability-classified awards pursuant to ASC Topic 718, Compensation—Stock Compensation, as achievement of the payout conditions required the settlement of such awards by transferring cash to the incentive unit holder. As such, the fair value of the incentive unit was remeasured each reporting period through the date of settlement, with the percentage of such fair value recorded to compensation expense each period being equal to the percentage of the requisite explicit or implied service period that has been rendered at that date.
In connection with the Corporate Reorganization, all of the incentive units were immediately vested and converted into PE Units and, subsequently, a portion of such PE Units were exchanged on a one for one basis for shares of Class A Common Stock. As a result, Parsley LLC was required to recognize the unrecognized cumulative incentive unit compensation expense of $51.1 million recognized during the year ended December 31, 2014 which is included in General and administrative expenses on the Company’s consolidated statement of operations, included in this Annual Report.
NOTE 10. INCOME TAXES
Parsley LLC, the Company’s accounting predecessor, is a limited liability company that is not subject to United States federal income tax. The Company is a corporation and is subject to U.S. federal income tax. The tax implications of the IPO and the Company’s concurrent Corporate Reorganization and the tax impact of the Company’s status as a taxable corporation subject to U.S. federal income tax have been reflected in the accompanying consolidated financial statements. The effective combined U.S. federal and state income tax rate as of December 31, 2016 was 16.4%. The Company's 2016 effective tax rate includes a 15.7% detriment from a valuation allowance on its deferred tax asset. Excluding the impact of the valuation allowance, the Company's effective tax rate was a 32.1% benefit in 2016. During the years ended December 31, 2016, 2015 and 2014, the Company recognized an income tax benefit of $17.4 million and $23.8 million and an income tax expense of $36.5 million, respectively. Total income tax differed from amounts computed by applying the U.S. federal statutory tax rates to pre-tax income due primarily to the change in corporate status, state taxes and the impact of earnings (loss) attributable to
F-34
PARSLEY ENERGY, INC. AND SUBSIDIARIES
NOTES TO CONSOLIDATED AND COMBINED FINANCIAL STATEMENTS
December 31, 2016
noncontrolling ownership interests. At December 31, 2016, the Company did not have any accrued liability for uncertain tax positions and does not anticipate recognition of any significant liabilities for uncertain tax positions during the next 12 months. The Company’s policy is to record interest and penalties relating to uncertain tax positions in income tax expense.
As a result of the public offerings of Class A Common Stock in 2016, as discussed in Note 1—Organization and Nature of Operations, the Company recorded additional deferred tax liability of $20.1 million during the year ended December 31, 2016.
The Company early adopted ASU 2016-09 effective January 1, 2016, which resulted in a favorable adjustment for the net excess income tax benefits from stock-based compensation. The adoption was on a prospective basis and therefore had no impact on prior years. The Company also recorded an adjustment to opening retained earnings of $0.1 million to recognize U.S. net operating loss carryforwards attributable to excess tax benefits on stock-based compensation that had not been previously recognized to additional paid in capital because they did not reduce income taxes payable.
The components of the income tax (benefit) expense were as follows for the periods indicated (in thousands):
Year Ended December 31, | ||||||||||||
2016 | 2015 | 2014 | ||||||||||
Federal: | ||||||||||||
Current | $ | 158 | $ | 286 | $ | — | ||||||
Deferred | (18,461 | ) | (27,535 | ) | 31,968 | |||||||
Total federal | (18,303 | ) | (27,249 | ) | 31,968 | |||||||
State, net of federal benefit: | ||||||||||||
Deferred | 879 | 3,494 | 4,500 | |||||||||
Total state | 879 | 3,494 | 4,500 | |||||||||
Income tax (benefit) expense | $ | (17,424 | ) | $ | (23,755 | ) | $ | 36,468 | ||||
The following table reconciles the income tax (benefit) expense with income tax expense at the federal statutory rate for the periods indicated (in thousands):
Year Ended December 31, | ||||||||||||
2016 | 2015 | 2014 | ||||||||||
(Loss) income before income taxes | $ | (106,341 | ) | $ | (96,785 | ) | $ | 93,190 | ||||
Plus: net loss prior to corporate reorganization | — | — | 37,378 | |||||||||
Less: net loss (income) before income taxes attributable to noncontrolling interest | 14,579 | 22,438 | (33,293 | ) | ||||||||
(Loss) income attributable to Parsley Energy, Inc. Stockholders before income taxes | (91,762 | ) | (74,347 | ) | 97,275 | |||||||
Income taxes at the federal statutory rate | (32,120 | ) | (26,022 | ) | 34,046 | |||||||
State income taxes, net of federal benefit | 879 | 3,494 | 967 | |||||||||
State income taxes, prior to corporate reorganization | — | — | 1,246 | |||||||||
Provision to return adjustment | (237 | ) | (1,217 | ) | 170 | |||||||
Permanent and other | (2,634 | ) | (10 | ) | 39 | |||||||
Valuation allowance | 32,215 | — | — | |||||||||
Valuation allowance charged to equity | (15,527 | ) | — | — | ||||||||
Income tax (benefit) expense | $ | (17,424 | ) | $ | (23,755 | ) | $ | 36,468 | ||||
Net (loss) income attributable to Parsley Energy, Inc. Stockholders | $ | (74,182 | ) | $ | (50,484 | ) | $ | 23,429 | ||||
Net (loss) income attributable to noncontrolling interest | $ | (14,735 | ) | $ | (22,547 | ) | $ | 33,293 | ||||
F-35
PARSLEY ENERGY, INC. AND SUBSIDIARIES
NOTES TO CONSOLIDATED AND COMBINED FINANCIAL STATEMENTS
December 31, 2016
As of December 31, 2016, the Company had approximately $0.2 million of alternative minimum tax credits available that do not expire. In addition, the Company had approximately $126.3 million of federal net operating loss carryovers that expire during the years 2034 through 2036. The tax benefits of carryforwards are recorded as an asset to the extent that management assesses the utilization of such carryforwards to be more likely than not. When the future utilization of some portion of the carryforwards is determined not be more likely than not, a valuation allowance is provided to reduce the recorded tax benefits from such assets. As of December 31, 2016, the Company had a valuation allowance of $32.2 million as a result of management's assessment of the realizability of deferred tax assets, of which $24.2 million was recorded as a result of the Exchange.
Internal Revenue Code ("IRC") Section 382 addresses company ownership changes and specifically limits the utilization of certain deductions and other tax attributes on an annual basis following an ownership change. The Company may be found to have experienced an ownership change within the meaning of IRC Section 382 during 2016 that could subject a portion of the federal net operation loss carryforwards to an IRC Section 382 limitation. Such limitation would not result in a current federal tax liability at December 31, 2016.
The tax effects of temporary differences that give rise to significant portions of the deferred tax assets and deferred tax liabilities were as follows (in thousands):
December 31, | ||||||||
2016 | 2015 | |||||||
Assets: | ||||||||
Asset retirement obligations | 3,535 | 5,297 | ||||||
Deferred stock-based compensation | 6,868 | 3,066 | ||||||
Derivative fair value loss | 8,252 | — | ||||||
Accrued compensation | 3,398 | — | ||||||
Net operating loss carryforward | 44,407 | 18,141 | ||||||
Other | 166 | — | ||||||
Total deferred tax assets | 66,626 | 26,504 | ||||||
Less: Valuation allowance | (32,215 | ) | — | |||||
Net deferred tax assets | 34,411 | 26,504 | ||||||
Liabilities: | ||||||||
Book basis of oil and natural gas properties in excess of tax basis | (38,489 | ) | (64,792 | ) | ||||
Derivative fair value gain | — | (23,969 | ) | |||||
Earnings in investment in subsidiary | (1,116 | ) | (705 | ) | ||||
Other | (289 | ) | — | |||||
Total deferred tax liabilities | (39,894 | ) | (89,466 | ) | ||||
Net deferred tax liability | $ | (5,483 | ) | $ | (62,962 | ) | ||
With respect to income taxes, the Company's policy is to account for interest charges as interest expense, net and any penalties as Other income (expense) in the accompanying consolidated statements of operations, included in this Annual Report. The Company files income tax returns in the U.S. federal jurisdiction and the Texas state jurisdiction, a number of which remain open for examination. The Company's earliest open years in its key jurisdictions are as follows:
U.S. federal | 2013 |
State of Texas | 2012 |
The Company has evaluated all tax positions for which the statute of limitations remains open and believes that the material positions taken would more likely than not be sustained by examination. Therefore, at December 31, 2016, the Company had not established any reserves for, nor recorded any unrecognized benefits related to, uncertain tax positions.
F-36
PARSLEY ENERGY, INC. AND SUBSIDIARIES
NOTES TO CONSOLIDATED AND COMBINED FINANCIAL STATEMENTS
December 31, 2016
Tax Receivable Agreement
In connection with the IPO, on May 29, 2014, the Company entered into a Tax Receivable Agreement (the "TRA") with Parsley LLC and certain holders of PE Units prior to the IPO (each such person a "TRA Holder"), including certain executive officers. This agreement generally provides for the payment by the Company of 85% of the net cash savings, if any, in U.S. federal, state, and local income tax or franchise tax that the Company actually realizes (or is deemed to realize in certain circumstances) in periods after the IPO as a result of (i) any tax basis increases resulting from the contribution in connection with the IPO by such TRA Holder of all or a portion of its PE Units to the Company in exchange for shares of Class A Common Stock, (ii) the tax basis increases resulting from the exchange by such TRA Holder of PE Units for shares of Class A Common Stock or, if either the Company or Parsley LLC so elects, cash, and (iii) imputed interest deemed to be paid by the Company as a result of, and additional tax basis arising from, any payments the Company makes under the TRA. The term of the TRA commenced on May 29, 2014, and continues until all such tax benefits have been utilized or expired, unless the Company exercises its right to terminate the TRA. If the Company elects to terminate the TRA early, it would be required to make an immediate payment equal to the present value of the anticipated future tax benefits subject to the TRA (based upon certain assumptions and deemed events set forth in the TRA). In addition, payments due under the TRA will be similarly accelerated following certain mergers or other changes of control. The actual amount and timing of payments to be made under the TRA will depend upon a number of factors, including the amount and timing of taxable income generated in the future, changes in future tax rates, the use of loss carryovers and the portion of the Company's payments under the TRA constituting imputed interest. As of December 31, 2016, there have been no payments associated with the TRA.
As a result of the Exchange, the Company recorded additional TRA liability of $63.4 million before any reduction related to valuation allowance adjustments. Also related to the Exchange, the Company recorded additional deferred tax assets of $74.6 million, which resulted in the Company being in a federal net deferred tax asset position.
The Company is in a cumulative net loss position and does not have sufficient positive evidence to support the utilization of deferred tax assets in excess of reversing deferred tax liabilities. As a result, the Company has recorded a $24.2 million valuation allowance against its deferred tax assets. The payable pursuant to the TRA was also reduced by $20.5 million, which is 85% of the deferred tax asset that is not expected to be realized, as the payment of the payable pursuant to the TRA is dependent on the realizability of the deferred tax assets. Due to the change in valuation allowance occurring during the fourth quarter of 2016, $7.4 million of the total reduction to the TRA liability was written off to Other income (expense) in the Company's consolidated statement of operations and is included as an operating activity in the Company's consolidated statement of cash flows, included in this Annual Report. Additional paid in capital was also reduced by $3.9 million.
As of December 31, 2016 and December 31, 2015, the Company had recorded a TRA liability of $94.3 million and $51.5 million, respectively, for the estimated payments that will be made to the PE Unit Holders who have exchanged shares along with corresponding deferred tax assets, net of valuation allowance, of $111.0 million and $60.6 million, respectively, as a result of the increase in tax basis arising from such exchanges.
NOTE 11. RELATED PARTY TRANSACTIONS
Well Operations
During the years ended December 31, 2016, 2015 and 2014, several of the Company’s directors, officers, their immediate family and entities affiliated or controlled by such parties ("Related Party Working Interest Owners") owned non-operated working interests in certain of the oil and natural gas properties that the Company operates. The revenues disbursed to such Related Party Working Interest Owners for the years ended December 31, 2016, 2015 and 2014, totaled $2.5 million, $5.2 million and $11.3 million, respectively. The revenues disbursed to the Related Party Working Interest Owners for the year ended December 31, 2014 include $2.1 million of revenues for the five months ended May 29, 2014 for entities no longer considered a related party due to their direct relationship with Diamond K (defined herein).
As a result of this ownership, from time to time, the Company will be in a net receivable or net payable position with these individuals and entities. The Company does not consider any net receivables from these parties to be uncollectible.
F-37
PARSLEY ENERGY, INC. AND SUBSIDIARIES
NOTES TO CONSOLIDATED AND COMBINED FINANCIAL STATEMENTS
December 31, 2016
Tex-Isle Supply, Inc. Purchases
The Company makes purchases of equipment used in its drilling operations from Tex-Isle Supply, Inc. ("Tex-Isle"). Tex-Isle is controlled by a party who is also the general partner of Diamond K Interests, LP ("Diamond K"), a former member of Parsley LLC. In connection with the IPO, Diamond K exchanged its membership interest for shares of Class A Common Stock. As of May 29, 2014, Diamond K is no longer considered a related party as their ownership interest fell below 10% due to this transaction, which results in Tex-Isle no longer being considered a related party. During the five months ended May 29, 2014, the Company made purchases of equipment used in its drilling operations totaling $29.3 million, from Tex-Isle. During the year ended December 31, 2014, the Company made purchases of equipment used in its drilling operations totaling $68.1 million.
Spraberry Production Services, LLC
At December 31, 2016, the Company owned a 42.5% interest in SPS and accounts for this investment using the equity method. Using the equity method of accounting results in transactions between the Company and SPS and its subsidiaries being accounted for as related party transactions. During the years ended December 31, 2016, 2015 and 2014, the Company incurred charges totaling $4.4 million, $4.8 million and $5.1 million, respectively, for services performed by SPS for the Company’s well operations and drilling activities.
Lone Star Well Service, LLC
The Company makes purchases of equipment used in its drilling operations from Lone Star Well Service, LLC ("Lone Star"). Lone Star is controlled by SPS. During the years ended December 31, 2016, 2015 and 2014, the Company incurred charges totaling $6.3 million, $5.0 million and $0.7 million for services performed by Lone Star for the Company’s well operations and drilling activities.
Davis, Gerald & Cremer, P.C.
During the years ended December 31, 2016, 2015 and 2014, the Company incurred charges totaling $0.5 million, $0.2 million and $0.2 million, respectively, for legal services from Davis, Gerald & Cremer, P.C., of which the Company's director David H. Smith is a shareholder.
Riverbend Acquisition
During the year ended December 31, 2016, the Company acquired 8,800 gross (6,269 net) acres located in Glasscock, Midland and Reagan Counties, Texas, along with net production of approximately 900 Boe/d from existing wells, from Riverbend Permian L.L.C. ("Riverbend"), for total consideration of $177.1 million, after customary purchase price adjustments (the "Riverbend Acquisition"). Randolph J. Newcomer, Jr., a former member of the Company’s board of directors, is the President and Chief Executive Officer of Riverbend. As the transaction involved a related party at the time it was entered into, the Riverbend Acquisition was approved by the disinterested members of the Company’s board of directors. The Company reflected $37.9 million of the total consideration paid as part of its cost subject to depletion within its oil and natural gas properties and $139.2 million as unproved leasehold costs within its oil and natural gas properties for the year ended December 31, 2016.
TRA and Exchange Right
As discussed in Note 10—Income Taxes, in connection with the IPO, on May 29, 2014, the Company entered into the TRA with the TRA Holders, including certain executive officers.
As discussed in Note 8—Equity, in accordance with the terms of the Parsley LLC Agreement, the PE Unit Holders generally have the right to exchange their PE Units (and a corresponding number of shares of Class B Common Stock). As a PE Unit Holder exchanges its PE Units, the Company’s interest in Parsley LLC will be correspondingly increased.
During the year ended December 31, 2016, certain PE Unit Holders exercised their Exchange Right under the Parsley LLC Agreement and elected to exchange an aggregate of 4.1 million PE Units (and a corresponding number of shares of Class B Common Stock) for an aggregate of 4.1 million shares of Class A Common Stock. The Company exercised its call right
F-38
PARSLEY ENERGY, INC. AND SUBSIDIARIES
NOTES TO CONSOLIDATED AND COMBINED FINANCIAL STATEMENTS
December 31, 2016
under the Parsley LLC Agreement and elected to issue Class A Common Stock to each of the exchanging PE Unit Holders in satisfaction of their election notices.
F-39
PARSLEY ENERGY, INC. AND SUBSIDIARIES
NOTES TO CONSOLIDATED AND COMBINED FINANCIAL STATEMENTS
December 31, 2016
NOTE 12. COMMITMENTS AND CONTINGENCIES
Legal Matters
From time to time, the Company is a party to ongoing legal proceedings in the ordinary course of business, including workers’ compensation claims and employment-related disputes. The Company does not believe the results of these proceedings, individually or in the aggregate, will have a material adverse effect on its business, financial condition, results of operations, or liquidity.
Environmental Matters
The Company is subject to various federal, state and local laws and regulations relating to the protection of the environment. These laws, which are often changing, regulate the discharge of materials into the environment and may require the Company to remove or mitigate the environmental effects of the disposal or release of petroleum or chemical substances at various sites. The Company has established procedures for the ongoing evaluation of its operations, to identify potential environmental exposures and to comply with regulatory policies and procedures.
The Company accounts for environmental contingencies in accordance with the accounting guidance related to accounting for contingencies. Environmental expenditures that relate to current operations are expensed or capitalized as appropriate. Expenditures that relate to an existing condition caused by past operations, which do not contribute to current or future revenue generation, are expensed. Liabilities are recorded when environmental assessments and/or clean-ups are probable and the costs can be reasonably estimated. Such liabilities are generally undiscounted unless the timing of cash payments is fixed or readily determinable. At December 31, 2016 and 2015, the Company had no environmental matters requiring specific disclosure or requiring the recognition of a liability.
Asset Retirement Obligations
The following table summarizes the Company’s asset retirement obligations as of December 31, 2016:
Payments Due by Period | ||||||||||||||||||||||||||||
(in thousands) | 2017 | 2018 | 2019 | 2020 | 2021 | Thereafter | Total | |||||||||||||||||||||
Asset retirement obligations | $ | 1,818 | $ | 232 | $ | 112 | $ | 262 | $ | 282 | $ | 8,686 | $ | 11,392 | ||||||||||||||
Drilling Commitments
The Company periodically enters into contractual arrangements under which the Company is committed to expend funds to drill wells in the future, including agreements to secure drilling rig services, which require the Company to make future minimum payments to the rig operators. The Company records drilling commitments in the periods in which well capital is incurred or rig services are provided. The following table summarizes the Company’s drilling commitments as of December 31, 2016:
Payments Due by Period | ||||||||||||||||||||||||||||
(in thousands) | 2017 | 2018 | 2019 | 2020 | 2021 | Thereafter | Total | |||||||||||||||||||||
Drilling commitments | $ | 21,118 | $ | 5,940 | $ | — | $ | — | $ | — | $ | — | $ | 27,058 | ||||||||||||||
Derivative Obligations
The future deferred premium payments related to derivative agreements as of December 31, 2016 was as follows:
Payments Due by Period | ||||||||||||||||||||||||||||
(in thousands) | 2017 | 2018 | 2019 | 2020 | 2021 | Thereafter | Total | |||||||||||||||||||||
Derivative obligations | $ | 23,268 | $ | 6,600 | $ | — | $ | — | $ | — | $ | — | $ | 29,868 | ||||||||||||||
F-40
PARSLEY ENERGY, INC. AND SUBSIDIARIES
NOTES TO CONSOLIDATED AND COMBINED FINANCIAL STATEMENTS
December 31, 2016
Operating Leases
The estimated future minimum lease payments under long-term operating lease agreements as of December 31, 2016 was as follows (in thousands):
For the years ended December 31, | ||||||||||||||||||||||||||||
2017 | 2018 | 2019 | 2020 | 2021 | Thereafter | Total | ||||||||||||||||||||||
Office Leases | $ | 4,427 | $ | 4,531 | $ | 4,656 | $ | 4,805 | $ | 4,834 | $ | 16,058 | $ | 39,311 | ||||||||||||||
Office Equipment | 178 | 80 | 43 | 4 | 2 | — | 307 | |||||||||||||||||||||
Total | $ | 4,605 | $ | 4,611 | $ | 4,699 | $ | 4,809 | $ | 4,836 | $ | 16,058 | $ | 39,618 | ||||||||||||||
Rent expense for the years ended December 31, 2016, 2015 and 2014 was $7.1 million, $4.7 million and $1.5 million, respectively.
NOTE 13. DISCLOSURES ABOUT FAIR VALUE OF FINANCIAL INSTRUMENTS
The Company uses a valuation framework based upon inputs that market participants use in pricing an asset or liability, which are classified into two categories: observable inputs and unobservable inputs. Observable inputs represent market data obtained from independent sources, whereas unobservable inputs reflect a company’s own market assumptions, which are used if observable inputs are not reasonably available without undue cost and effort. These two types of inputs are further prioritized into the following fair value input hierarchy:
Level 1: | Observable inputs that reflect unadjusted quoted prices for identical assets or liabilities in active markets as of the reporting date. | |
Level 2: | Observable market-based inputs or unobservable inputs that are corroborated by market data. These are inputs other than quoted prices in active markets included in Level 1 that are either directly or indirectly observable as of the reporting date. | |
Level 3: | Unobservable inputs that are not corroborated by market data and may be used with internally developed methodologies that result in management’s best estimate of fair value. | |
Assets and Liabilities Measured at Fair Value on a Nonrecurring Basis
Certain assets and liabilities are measured at fair value on a nonrecurring basis. These assets and liabilities are not measured at fair value on an ongoing basis, but are subject to fair value adjustments whenever events or circumstances indicate that the carrying value of those assets may not be recoverable. These assets and liabilities can include inventory, proved and unproved oil and natural gas properties and other long-lived assets that are written down to fair value when they are impaired.
The Company periodically reviews its long-lived assets to be held and used, including proved oil and natural gas properties, whenever events or circumstances indicate that the carrying value of those assets may not be recoverable (e.g., if there was a sustained decline in commodity prices or the productivity of the Company's wells). The Company reviews its oil and natural gas properties by field. An impairment loss is recognized if the sum of the expected undiscounted future net cash flows is less than the carrying amount of the assets. If the estimated undiscounted future net cash flows are less than the carrying amount of a particular asset, the Company recognizes an impairment loss for the amount by which the carrying amount of the asset exceeds the estimated fair value of such asset.
Materials and Supplies. No impairment charge was recorded during the year ended December 31, 2016. During the year ended December 31, 2015, the Company recognized impairment of $4.1 million primarily to reduce the carrying value of oil and gas drilling and repair items. The Company estimates fair value of the inventory using significant Level 2 assumptions based on third-party price quotes for the asset in an active market. The impairment charges are included in Other income (expense) in the Company’s accompanying consolidated statements of operations, included in this Annual Report.
Proved Oil and Natural Gas Properties. During the year ended December 31, 2016, the Company did not recognize impairment charges, as the carrying amount of the assets exceeds the undiscounted future cash flows of the assets. During the year ended December 31, 2015, the Company recognized impairment charges of $1.0 million to reduce the carrying values of certain properties in Upton County, Texas to their estimated fair values.
F-41
PARSLEY ENERGY, INC. AND SUBSIDIARIES
NOTES TO CONSOLIDATED AND COMBINED FINANCIAL STATEMENTS
December 31, 2016
The Company estimates fair values using a discounted future cash flow model. Management’s assumptions associated with the calculation of discounted future cash flows include commodity prices based on NYMEX futures price strips (Level 1), as well as Level 3 assumptions including (i) pricing adjustments for differentials, (ii) production costs, (iii) capital expenditures, (iv) production volumes and (v) estimated reserves.
It is reasonably possible that the estimate of undiscounted future net cash flows may change in the future resulting in the need to impair carrying values. The primary factors that may affect estimates of future cash flows are (i) commodity futures prices, (ii) increases or decreases in production and capital costs, (iii) future reserve adjustments, both positive and negative, to proved reserves and (iv) results of future drilling activities.
Financial Assets and Liabilities Measured at Fair Value
Commodity derivative contracts are marked-to-market each quarter and are thus stated at fair value in the accompanying consolidated balance sheets and in Note 3—Derivative Financial Instruments. The company adjusts the valuations from the valuation model for nonperformance risk and for counterparty risk. The fair values of the Company’s commodity derivative instruments are classified as Level 2 measurements as they are calculated using industry standard models using assumptions and inputs which are substantially observable in active markets throughout the full term of the instruments. These include market price curves, contract terms and prices, credit risk adjustments, implied market volatility and discount factors. The following summarizes the fair value of the Company’s derivative assets and liabilities according to their fair value hierarchy as of the reporting dates indicated (in thousands):
December 31, 2016 | ||||||||||||||||
Level 1 | Level 2 | Level 3 | Total | |||||||||||||
Commodity derivative contracts | ||||||||||||||||
Assets: | ||||||||||||||||
Short-term derivative instruments | $ | — | $ | 39,708 | $ | — | $ | 39,708 | ||||||||
Long-term derivative instruments | — | 16,416 | — | 16,416 | ||||||||||||
Total derivative instrument - asset | $ | — | $ | 56,124 | $ | — | $ | 56,124 | ||||||||
Liabilities: | ||||||||||||||||
Short-term derivative instruments | $ | — | $ | (44,153 | ) | $ | — | $ | (44,153 | ) | ||||||
Long-term derivative instruments | — | (12,815 | ) | — | (12,815 | ) | ||||||||||
Total derivative instruments - liability | — | (56,968 | ) | — | (56,968 | ) | ||||||||||
Net commodity derivative liability | $ | — | $ | (844 | ) | $ | — | $ | (844 | ) | ||||||
December 31, 2015 | ||||||||||||||||
Level 1 | Level 2 | Level 3 | Total | |||||||||||||
Commodity derivative contracts | ||||||||||||||||
Assets: | ||||||||||||||||
Short-term derivative instruments | $ | — | $ | 83,262 | $ | — | $ | 83,262 | ||||||||
Long-term derivative instruments | — | 25,839 | — | 25,839 | ||||||||||||
Total derivative instrument - asset | $ | — | $ | 109,101 | $ | — | $ | 109,101 | ||||||||
Liabilities: | ||||||||||||||||
Short-term derivative instruments | $ | — | $ | (34,518 | ) | $ | — | $ | (34,518 | ) | ||||||
Long-term derivative instruments | — | (15,142 | ) | — | (15,142 | ) | ||||||||||
Total derivative instruments - liability | — | (49,660 | ) | — | (49,660 | ) | ||||||||||
Net commodity derivative asset | $ | — | $ | 59,441 | $ | — | $ | 59,441 | ||||||||
There were no transfers in to or out of Level 2 during the years ended December 31, 2016 or 2015.
F-42
PARSLEY ENERGY, INC. AND SUBSIDIARIES
NOTES TO CONSOLIDATED AND COMBINED FINANCIAL STATEMENTS
December 31, 2016
Financial Instruments Not Carried at Fair Value
The following table provides the fair value of financial instruments that are not recorded at fair value in the consolidated balance sheets (in thousands):
December 31, 2016 | December 31, 2015 | ||||||||||||||
Carrying Amount | Fair Value | Carrying Amount | Fair Value | ||||||||||||
Current portion of long-term debt: | |||||||||||||||
7.500% senior unsecured notes due 2022 | $ | 61,846 | $ | 65,737 | $ | 550,000 | $ | 522,610 | |||||||
Long-term debt: | |||||||||||||||
5.375% senior unsecured notes due 2025 | 650,000 | 654,531 | — | — | |||||||||||
6.250% senior unsecured notes due 2024 | 400,000 | 422,548 | — | — | |||||||||||
Revolving Credit Agreement | — | — | — | — | |||||||||||
The fair value of the 2022 Notes included in Current portion of long-term debt is equal to the principal amount of the cash payment made on January 5, 2017. The fair values of the 2024 Notes and 2025 Notes included in long-term debt were determined using the December 31, 2016 quoted market price, a Level 1 classification in the fair value hierarchy. The book value of the Revolving Credit Agreement approximates its fair value as the interest rate is variable. As of December 31, 2016, there are no indicators for change in the Company’s market spread.
The Company has other financial instruments consisting primarily of cash and cash equivalents, accounts receivable, prepaid expenses, other current assets, accounts payable and accrued liabilities that approximate their fair value due to the short-term nature of these instruments.
NOTE 14. SUBSEQUENT EVENTS
The Company has evaluated subsequent events through the date these financial statements were issued. The Company determined there were no events, other than as described below, that required disclosure or recognition in these financial statements.
January Equity Offering and Recent Acquisitions
On January 10, 2017, the Company entered into an underwriting agreement to sell 25,300,000 shares of Class A Common Stock (including 3,300,000 shares issued pursuant to the underwriters’ option to purchase additional shares) at a price of $35.00 per share in an underwritten public offering. The January Offering closed on January 17, 2017 and resulted in gross proceeds to the Company of approximately $885.5 million and net proceeds to the Company, after deducting underwriting discounts and commissions and offering expenses, of approximately $863.0 million. The Company used a portion of the net proceeds from the January Offering to fund the aggregate purchase price for certain acquisitions of oil and gas interests in the Midland and Southern Delaware Basins and the remaining net proceeds will be used to fund a portion of its capital program and for general corporate purposes, including potential future acquisitions.
A portion of the net proceeds from the January Offering was, or is expected to be, used to acquire, in unrelated transactions (i) approximately 31,800 gross (23,000 net) acres for an aggregate purchase price of $606.6 million. The Company also acquired certain mineral interests in approximately 3,926 net mineral acres, or approximately 660 net royalty acres, in the Southern Delaware Basin for an aggregate purchase price of $42.8 million. The purchase prices of these transactions are inclusive of deposits of $48.2 million paid to escrow accounts upon signing of certain of the purchase and sale agreements. The deposits are included in Other current assets on the consolidated balance sheets and as an operating activity on the consolidated statements of cash flows, included in this Annual Report.
February Equity Offering
On February 7, 2017, the Company entered into an underwriting agreement to sell 41,400,000 shares of Class A Common Stock (including 5,400,000 shares issued pursuant to the underwriters' option to purchase additional shares) at a price of $31.00 per share in an underwritten public offering. The February Offering closed on February 13, 2017 and resulted in gross
F-43
PARSLEY ENERGY, INC. AND SUBSIDIARIES
NOTES TO CONSOLIDATED AND COMBINED FINANCIAL STATEMENTS
December 31, 2016
proceeds to the Company of approximately $1,283.4 million and net proceeds to the Company, after deducting underwriting discounts and commissions and offering expenses, of approximately $1,260.6 million. The Company will use a portion of the net proceeds from the February Offering to fund the cash portion of the purchase price for the Double Eagle Acquisition and the remaining net proceeds will be used to fund a portion of the Company's capital program and for general corporate purposes, including potential future acquisitions.
New 2025 Notes Offering
Concurrently with the February Offering, the Company issued $450.0 million aggregate principal amount of 5.250% senior notes due 2025 (the "New 2025 Notes") (the "New 2025 Notes Offering") in an offering that was exempt from registration under the Securities Act. The New 2025 Notes Offering resulted in gross proceeds to the Company of $450.0 million and net proceeds to the Company, after deducting initial purchaser discounts and commissions and offering expenses, of approximately $444.2 million, which the Company intends to use to partially fund the cash portion of the Double Eagle Acquisition as discussed below.
Double Eagle Acquisition
On February 7, 2017, the Company entered into a contribution agreement (the "Double Eagle Contribution Agreement") with Double Eagle Energy Permian Operating LLC, Double Eagle Energy Permian LLC and Double Eagle Energy Permian Member LLC (collectively, "Double Eagle"), which provides for the contribution by Double Eagle of all of its interests in Double Eagle Lone Star LLC, DE Operating LLC, and Veritas Energy Partners, LLC, as well as certain related transactions with an affiliate of Double Eagle. As a result, the Company expects to acquire (the "Double Eagle Acquisition") approximately 167,000 gross (71,000 net) acres located in the Midland Basin and approximately 7,300 gross (3,300 net) associated horizontal drilling locations for an aggregate purchase price of approximately $2.8 billion, subject to certain purchase price adjustments set forth in the Double Eagle Contribution Agreement.
The aggregate purchase price for the Double Eagle Acquisition consists of (i) approximately $1.4 billion in cash (which, the Company intends to fund from the net proceeds of the February Offering and the New 2025 Notes Offering) and (ii) approximately 39.4 million PE Units and a corresponding approximately 39.4 million shares of Class B Common Stock. Upon the expiration of a 90-day lock-up period following the consummation of the Double Eagle Acquisition, each PE Unit, together with a corresponding share of the Company's Class B Common Stock, will be exchangeable, at the option of the holder, for one share of its Class A Common Stock, or, if the Company so elects, cash. In connection with the closing of the Double Eagle Acquisition, the Company intends to enter into a registration rights agreement with Double Eagle containing provisions by which the Company will agree to, among other things and subject to certain restrictions, file an automatically effective registration statement with the SEC on Form S-3 providing for the registration of the shares of the Company's Class A Common Stock issuable upon exchange of the PE Units (and corresponding shares of the Company's Class B Common Stock) to be issued as consideration to Double Eagle and to conduct certain underwritten offerings thereof.
The Double Eagle Contribution Agreement contains customary representations and warranties, covenants and indemnification provisions and has an effective date of January 1, 2017. The Company expects to close the Double Eagle Acquisition on or before April 20, 2017, subject to the satisfaction of customary closing conditions.
F-44
PARSLEY ENERGY, INC. AND SUBSIDIARIES
UNAUDITED SUPPLEMENTARY INFORMATION
December 31, 2016
SUPPLEMENTAL DISCLOSURE OF OIL AND NATURAL GAS OPERATIONS (Unaudited)
The Company’s oil and natural gas reserves are attributable solely to properties within the U.S.
Capitalized Costs
December 31, | ||||||||
2016 | 2015 | |||||||
Oil and natural gas properties: | (in thousands) | |||||||
Proved properties | $ | 2,376,712 | $ | 1,627,367 | ||||
Unproved properties | 1,686,705 | 618,794 | ||||||
Total oil and natural gas properties | 4,063,417 | 2,246,161 | ||||||
Less accumulated depreciation, depletion and amortization | (506,175 | ) | (290,186 | ) | ||||
Net oil and natural gas properties capitalized | $ | 3,557,242 | $ | 1,955,975 | ||||
Costs Incurred for Oil and Natural Gas Producing Activities
Year Ended December 31, | ||||||||||||
2016 | 2015 | 2014 | ||||||||||
Acquisition costs: | (in thousands) | |||||||||||
Proved properties | $ | 273,940 | $ | 16,422 | $ | 233,899 | ||||||
Unproved properties | 1,072,250 | 57,385 | 528,301 | |||||||||
Development costs | 495,971 | 404,291 | 488,673 | |||||||||
Total | $ | 1,842,161 | $ | 478,098 | $ | 1,250,873 | ||||||
Reserve Quantity Information
The following information represents estimates of the Company’s proved reserves as of December 31, 2016, which have been prepared and presented under SEC rules. These rules require SEC reporting companies to prepare their reserve estimates using specified reserve definitions and pricing based on a 12-month unweighted average of the first-day-of-the-month pricing. The pricing that was used for estimates of the Company’s reserves as of December 31, 2016 was based on an unweighted average 12-month average WTI posted price per Bbl for oil and NGLs and a Henry Hub spot natural gas price per Mcf for natural gas, as set forth in the following table:
Year Ended December 31, | ||||||||||||
2016 | 2015 | 2014 | ||||||||||
Oil (per Bbl) | $ | 39.36 | $ | 46.54 | $ | 85.99 | ||||||
Natural gas liquids (per Bbl) | $ | 15.04 | $ | 16.42 | $ | 35.27 | ||||||
Natural gas (per Mcf) | $ | 2.23 | $ | 2.53 | $ | 4.28 | ||||||
Subject to limited exceptions, proved undeveloped reserves may only be booked if they relate to wells scheduled to be drilled within five years of the date of booking. This requirement has limited and may continue to limit, the Company’s potential to record additional proved undeveloped reserves as it pursues its drilling program. Moreover, the Company may be required to write down its proved undeveloped reserves if it does not drill on those reserves with the required five-year timeframe. The Company does not have any proved undeveloped reserves which have remained undeveloped for five years or more.
The Company’s proved oil and natural gas reserves are located in the U.S. in the Permian Basin of West Texas. Proved reserves were estimated in accordance with the guidelines established by the SEC and the FASB.
Oil and natural gas reserve quantity estimates are subject to numerous uncertainties inherent in the estimation of quantities of proved reserves and in the projection of future rates of production and the timing of development expenditures. The accuracy of such estimates is a function of the quality of available data and of engineering and geological interpretation
F-45
PARSLEY ENERGY, INC. AND SUBSIDIARIES
UNAUDITED SUPPLEMENTARY INFORMATION
December 31, 2016
and judgment. Results of subsequent drilling, testing and production may cause either upward or downward revision of previous estimates.
Further, the volumes considered to be commercially recoverable fluctuate with changes in prices and operating costs. The Company emphasizes that reserve estimates are inherently imprecise and that estimates of new discoveries are more imprecise than those of currently producing oil and natural gas properties. Accordingly, these estimates are expected to change as additional information becomes available in the future.
The following table provides a roll forward of the total proved reserves for the years ended December 31, 2016, 2015 and 2014, as well as proved developed and proved undeveloped reserves at the beginning and end of each respective year:
Year Ended December 31, 2016 | ||||||||||||
Crude Oil (Bbls) | Liquids (Bbls) | Natural Gas (Mcf) | Boe | |||||||||
(in thousands) | ||||||||||||
Proved Developed and Undeveloped Reserves: | ||||||||||||
Beginning of the year | 73,877 | 23,738 | 157,175 | 123,811 | ||||||||
Extensions and discoveries | 64,005 | 20,698 | 83,815 | 98,672 | ||||||||
Revisions of previous estimates | (4,476 | ) | 3,898 | (19,032 | ) | (3,750 | ) | |||||
Purchases of reserves in place | 16,041 | 4,023 | 25,024 | 24,235 | ||||||||
Divestures of reserves in place | (3,543 | ) | (1,424 | ) | (9,914 | ) | (6,619 | ) | ||||
Production | (9,368 | ) | (2,390 | ) | (13,463 | ) | (14,002 | ) | ||||
End of the year | 136,536 | 48,543 | 223,605 | 222,347 | ||||||||
Proved Developed Reserves: | ||||||||||||
Beginning of the year | 27,628 | 10,890 | 77,612 | 51,453 | ||||||||
End of the year | 61,133 | 24,306 | 123,946 | 106,097 | ||||||||
Proved Undeveloped Reserves: | ||||||||||||
Beginning of the year | 46,249 | 12,848 | 79,563 | 72,358 | ||||||||
End of the year | 75,403 | 24,237 | 99,659 | 116,250 | ||||||||
F-46
PARSLEY ENERGY, INC. AND SUBSIDIARIES
UNAUDITED SUPPLEMENTARY INFORMATION
December 31, 2016
Year Ended December 31, 2015 | ||||||||||||
Crude Oil (Bbls) | Liquids (Bbls) | Natural Gas (Mcf) | Boe | |||||||||
(in thousands) | ||||||||||||
Proved Developed and Undeveloped Reserves: | ||||||||||||
Beginning of the year | 47,617 | 22,667 | 123,645 | 90,891 | ||||||||
Extensions and discoveries | 38,518 | 9,232 | 53,044 | 56,590 | ||||||||
Revisions of previous estimates | (6,688 | ) | (6,934 | ) | (11,825 | ) | (15,592 | ) | ||||
Purchases of reserves in place | 1,133 | 551 | 4,138 | 2,374 | ||||||||
Divestures of reserves in place | (1,896 | ) | (278 | ) | (1,488 | ) | (2,422 | ) | ||||
Production | (4,807 | ) | (1,500 | ) | (10,339 | ) | (8,030 | ) | ||||
End of the year | 73,877 | 23,738 | 157,175 | 123,811 | ||||||||
Proved Developed Reserves: | ||||||||||||
Beginning of the year | 23,547 | 11,491 | 65,484 | 45,952 | ||||||||
End of the year | 27,628 | 10,890 | 77,612 | 51,453 | ||||||||
Proved Undeveloped Reserves: | ||||||||||||
Beginning of the year | 24,070 | 11,176 | 58,161 | 44,939 | ||||||||
End of the year | 46,249 | 12,848 | 79,563 | 72,358 | ||||||||
Year Ended December 31, 2014 | ||||||||||||
Crude Oil (Bbls) | Liquids (Bbls) | Natural Gas (Mcf) | Boe | |||||||||
(in thousands) | ||||||||||||
Proved Developed and Undeveloped Reserves: | ||||||||||||
Beginning of the year | 29,507 | 12,357 | 77,818 | 54,834 | ||||||||
Extensions and discoveries | 18,776 | 8,157 | 41,348 | 33,824 | ||||||||
Revisions of previous estimates | (7,832 | ) | (528 | ) | (6,714 | ) | (9,480 | ) | ||||
Purchases of reserves in place | 10,006 | 3,906 | 18,244 | 16,953 | ||||||||
Divestures of reserves in place | — | — | — | — | ||||||||
Production | (2,840 | ) | (1,225 | ) | (7,051 | ) | (5,240 | ) | ||||
End of the year | 47,617 | 22,667 | 123,645 | 90,891 | ||||||||
Proved Developed Reserves: | ||||||||||||
Beginning of the year | 13,560 | 4,762 | 31,301 | 23,539 | ||||||||
End of the year | 23,547 | 11,491 | 65,484 | 45,952 | ||||||||
Proved Undeveloped Reserves: | ||||||||||||
Beginning of the year | 15,947 | 7,595 | 46,517 | 31,295 | ||||||||
End of the year | 24,070 | 11,176 | 58,161 | 44,939 | ||||||||
Extensions and discoveries of 98,672 MBoe, 56,590 MBoe and 33,824 MBoe during the years ended December 31, 2016, 2015 and 2014, result primarily from the drilling of new wells during each year and from new proved undeveloped locations added during each year.
F-47
PARSLEY ENERGY, INC. AND SUBSIDIARIES
UNAUDITED SUPPLEMENTARY INFORMATION
December 31, 2016
Standardized Measure of Discounted Future Net Cash Flows
The standardized measure of discounted future net cash flows does not purport to be, nor should it be interpreted to present, the fair value of the oil and natural gas reserves of the property. An estimate of fair value would take into account, among other things, the recovery of reserves not presently classified as proved, the value of unproved properties and consideration of expected future economic and operating conditions.
The estimates of future cash flows and future production and development costs as of December 31, 2016, 2015 and 2014 are based on the unweighted arithmetic average first-day-of-the-month price for the preceding 12-month period. Estimated future production of proved reserves and estimated future production and development costs of proved reserves are based on current costs and economic conditions. All wellhead prices are held flat over the forecast period for all reserve categories. The estimated future net cash flows are then discounted at a rate of 10%.
The standardized measure of discounted future net cash flows relating to proved oil, natural gas and NGLs reserves is as follows:
December 31, | ||||||||||||
2016 | 2015 | 2014 | ||||||||||
(in thousands) | ||||||||||||
Future cash inflows | $ | 6,603,206 | $ | 4,225,912 | $ | 5,423,551 | ||||||
Future development costs | (1,019,823 | ) | (829,560 | ) | (642,746 | ) | ||||||
Future production costs | (2,176,081 | ) | (1,534,011 | ) | (1,640,422 | ) | ||||||
Future income tax expenses | (370,337 | ) | (240,203 | ) | (903,354 | ) | ||||||
Future net cash flows | 3,036,965 | 1,622,138 | 2,237,029 | |||||||||
10% discount to reflect timing of cash flows | (1,852,653 | ) | (1,024,290 | ) | (1,281,400 | ) | ||||||
Standardized measure of discounted future net cash flows | $ | 1,184,312 | $ | 597,848 | $ | 955,629 | ||||||
In the foregoing determination of future cash inflows, sales prices used for oil, natural gas and NGLs for December 31, 2016, 2015 and 2014, were estimated using the average price during the 12-month period, determined as the unweighted arithmetic average of the first-day-of-the-month price for each month. Prices were adjusted by lease for quality, transportation fees and regional price differentials. Future costs of developing and producing the proved gas and oil reserves reported at the end of each year shown were based on costs determined at each such year-end, assuming the continuation of existing economic conditions.
It is not intended that the FASB’s standardized measure of discounted future net cash flows represent the fair market value of its’ predecessor’s proved reserves. The Company cautions that the disclosures shown are based on estimates of proved reserve quantities and future production schedules which are inherently imprecise and subject to revision and the 10% discount rate is arbitrary. In addition, costs and prices as of the measurement date are used in the determinations and no value may be assigned to probable or possible reserves.
F-48
PARSLEY ENERGY, INC. AND SUBSIDIARIES
UNAUDITED SUPPLEMENTARY INFORMATION
December 31, 2016
Changes in the standardized measure of discounted future net cash flows relating to proved oil, natural gas and NGLs reserves are as follows:
Year Ended December 31, | ||||||||||||
2016 | 2015 | 2014 | ||||||||||
(in thousands) | ||||||||||||
Standardized measure of discounted future net cash flows at the beginning of the year | $ | 597,848 | $ | 955,629 | $ | 720,780 | ||||||
Sales of oil and natural gas, net of production costs | (369,295 | ) | (185,344 | ) | (244,745 | ) | ||||||
Purchase of minerals in place | 118,795 | 4,872 | 279,725 | |||||||||
Divestiture of minerals in place | (14,591 | ) | (53,018 | ) | — | |||||||
Extensions and discoveries, net of future development costs | 770,947 | 485,380 | 537,241 | |||||||||
Previously estimated development costs incurred during the period | 61,756 | 12,560 | 96,881 | |||||||||
Net changes in prices and production costs | (80,492 | ) | (821,783 | ) | (74,080 | ) | ||||||
Changes in estimated future development costs | 118,930 | 77,621 | (9,517 | ) | ||||||||
Revisions of previous quantity estimates | 84,309 | (225,485 | ) | (126,395 | ) | |||||||
Accretion of discount | 69,731 | 131,442 | 73,107 | |||||||||
Net change in income taxes | (199,368 | ) | 249,065 | (348,501 | ) | |||||||
Net changes in timing of production and other | 25,742 | (33,091 | ) | 51,133 | ||||||||
Standardized measure of discounted future net cash flows at the end of the year | $ | 1,184,312 | $ | 597,848 | $ | 955,629 | ||||||
F-49