Attached files
| file | filename |
|---|---|
| 8-K - FORM 8-K - PUBLIC SERVICE ENTERPRISE GROUP INC | d332606d8k.htm |
| EX-99 - EX-99 - PUBLIC SERVICE ENTERPRISE GROUP INC | d332606dex99.htm |
 Public
Service Enterprise Group PSEG Earnings Conference Call
4 Quarter & Year-End 2016 February 24, 2017 EXHIBIT 99.1 th |
| 1 Forward-Looking Statements Certain of the matters discussed in this presentation about our and our subsidiaries’ future performance, including,
without limitation, future revenues, earnings, strategies, prospects, consequences and all other statements that are not purely historical constitute “forward-looking statements”
within the meaning of the Private Securities Litigation Reform Act of 1995. Such forward-looking statements are subject to risks and uncertainties, which could cause actual results to differ
materially from those anticipated. Such statements are based on management’s beliefs as well as assumptions made by and information currently available to management. When used herein, the words
“anticipate,” “intend,” “estimate,” “believe,” “expect,” “plan,” “should,” “hypothetical,” “potential,” “forecast,” “project,” variations of such words and
similar expressions are intended to identify forward-looking statements. Factors that may cause actual results to differ are often presented with the forward-looking statements themselves. Other factors that could cause actual results to
differ materially from those contemplated in any forward-looking statements made by us herein are discussed in filings we make with the United States Securities and Exchange Commission (SEC) including our Annual Report on Form 10-K and subsequent reports on Form 10-Q and Form 8-K and available on our website: http://www.pseg.com. These factors include, but are not limited
to: •
fluctuations in wholesale power and natural gas markets,
including the potential impacts on the economic viability of our generation units; • our ability to obtain adequate fuel supply;
• any inability to manage our
energy obligations with available supply;
• increases in competition in
wholesale energy and capacity markets;
• changes in technology related to
energy generation, distribution and consumption and customer usage patterns; • economic downturns; • third party credit risk relating to our sale of generation output and purchase of
fuel; • adverse
performance of our decommissioning and defined benefit plan trust fund investments and changes in funding requirements; • changes in state and federal legislation and regulations;
• the impact of pending rate case
proceedings; •
regulatory, financial, environmental, health and safety risks associated with our ownership and operation of nuclear facilities; • adverse changes in energy industry laws, policies and regulations, including market
structures and transmission planning;
• changes in federal and state
environmental regulations and enforcement;
• delays in receipt of, or an
inability to receive, necessary licenses and permits;
• adverse outcomes of any legal,
regulatory or other proceeding, settlement, investigation or claim applicable to us and/or the energy industry; • changes in tax laws and regulations;
• the impact of our holding company
structure on our ability to meet our corporate funding needs, service debt and pay dividends; • lack of growth or slower growth in the number of customers or changes in customer
demand; • any
inability of Power to meet its commitments under forward sale obligations; • reliance on transmission facilities that we do not own or control and the impact on our
ability to maintain adequate transmission capacity;
• any inability to successfully
develop or construct generation, transmission and distribution projects; • any equipment failures, accidents, severe weather events or other incidents that impact our
ability to provide safe and reliable service to our customers;
• our inability to exercise control over the operations of generation facilities in which we do not maintain a controlling interest; • any inability to maintain sufficient liquidity;
• any inability to realize
anticipated tax benefits or retain tax credits;
• challenges associated with
recruitment and/or retention of key executives and a qualified workforce; • the impact of our covenants in our debt instruments on our operations; and
• the impact of acts of terrorism,
cybersecurity attacks or intrusions. All of the
forward-looking statements made in this presentation are qualified by these cautionary statements and we cannot assure you that the results or developments anticipated by management
will be realized or even if realized, will have the expected
consequences to, or effects on, us or our business, prospects, financial condition, results of operations or cash flows. Readers are cautioned not to place undue reliance on these forward-looking statements in making any investment decision.
Forward-looking statements made in this presentation apply only as of the date of this presentation. While we may elect to update forward-looking statements from time to time, we specifically disclaim
any obligation to do so, even in light of new information or future events, unless otherwise required by applicable securities laws.
The forward-looking statements contained in this
presentation are intended to qualify for the safe harbor provisions of Section 27A of the Securities Act of 1933, as amended, and Section 21E of the Securities Exchange Act of 1934, as amended. |
 2 GAAP Disclaimer PSEG presents Operating Earnings and Adjusted Earnings Before Interest, Taxes, Depreciation and Amortization (EBITDA) in addition to its Net
Income reported in accordance with accounting principles generally
accepted in the United States (GAAP). Operating Earnings and Adjusted EBITDA are non-GAAP financial measures that differ from Net Income. Operating Earnings exclude the impact of returns (losses) associated with the Nuclear Decommissioning Trust (NDT),
Mark-to-Market (MTM) accounting and material one-time
items. Adjusted EBITDA excludes the same items as our Operating Earnings measure as well as income tax expense, interest expense and depreciation and amortization. The last two slides in this presentation (Slides A and B) include a list of items excluded
from Net Income to reconcile to Operating Earnings and Adjusted EBITDA
with a reference to those slides included on each of the slides where the non-GAAP information appears. Management uses Operating Earnings in its internal analysis, and in communications with investors and analysts, as a consistent measure for
comparing PSEG’s financial performance to previous financial
results. Management believes Adjusted EBITDA is useful to investors and other users of our financial statements in evaluating operating performance because it provides them with an additional tool to compare business performance across companies and across
periods. Management also believes that Adjusted EBITDA is widely used by
investors to measure operating performance without regard to items such as income tax expense, interest expense and depreciation and amortization, which can vary substantially from company to company depending upon, among other things, the
book value of assets, capital structure and whether assets were
constructed or acquired. Adjusted EBITDA also allows investors and other users to assess the underlying financial performance of our fleet before management’s decision to deploy capital. The presentation of Operating Earnings and Adjusted EBITDA is
intended to complement, and should not be considered an alternative to,
the presentation of Net Income, which is an indicator of financial performance determined in accordance with GAAP. In addition, Operating Earnings and Adjusted EBITDA as presented in this release may not be comparable to similarly titled measures
used by other companies.
Due to the forward looking nature of Operating Earnings and Adjusted EBITDA guidance,
PSEG is unable to reconcile these non-GAAP financial measures to the most directly comparable GAAP financial measure. Management is unable to project certain reconciling items, in particular MTM and NDT gains
(losses), for future periods due to market volatility.
These materials and other financial releases can be found on the PSEG website at www.pseg.com,
under the Investors tab. From time to time, PSEG, PSE&G and PSEG Power release important information via postings on their corporate website at http://investor.pseg.com.
Investors and other interested parties are encouraged to visit the corporate website to review new postings. The “email alerts” link at http://investor.pseg.com may be used to enroll to receive automatic email alerts and/or really simple syndication (RSS) feeds regarding new postings at http://investor.pseg.com/rss.
|
 PSEG 2016 Q4 and Full Year Review Ralph Izzo Chairman, President and Chief Executive Officer |
 $ millions (except EPS) 2016 2015 Net Income/(Loss) $ (98) $ 309 Reconciling Items 377 (54) Operating Earnings (non-GAAP)* $ 279 $ 255 EPS from Net Income/(Loss) $ (0.19) $ 0.60 EPS from Operating Earnings (non-GAAP)* $ 0.54 $ 0.50 4 Q4 Results Summary – Solid quarterly results Quarter ended December 31 * See Slide A for Items excluded from Net Income/(Loss) to reconcile to Operating Earnings (non-GAAP). |
 $
millions (except EPS) 2016
2015 Net Income $ 887 $ 1,679 Reconciling Items 588 (203) Operating Earnings (non-GAAP)* $ 1,475 $ 1,476 EPS from Net Income $ 1.75 $ 3.30 EPS from Operating Earnings (non-GAAP)* $ 2.90 $ 2.91 5 Full-Year Results Summary – At upper end of revised guidance Twelve Months ended December 31 * See Slide A for Items excluded from Net Income to reconcile to Operating Earnings (non-GAAP). |
 6 PSEG 2016 – Another Year of Successful Capital Deployment Solid 2016 financial performance Net Loss of $(0.19) vs. Net Income of $0.60 per share in Q4 2015; Full-year Net Income of $1.75 vs. $3.30 per share in 2015; Decision to retire Hudson-Mercer units resulted in $555 million of incremental D&A in Q4 Non-GAAP Operating Earnings* results of $0.54 vs. $0.50 per share in Q4 2015; Full-year non-GAAP Operating Earnings* of $2.90 vs. $2.91 per share in 2015 PSE&G achieved 13% growth in Net Income over 2015 on increased investment in transmission and distribution PSEG Power results exceeded revised guidance with stringent control of O&M Operational excellence PSE&G recognized for the 15th consecutive year as the Mid-Atlantic region’s most reliable electric utility Nuclear performance stabilized following extended outages at Salem Disciplined capital investment – producing results PSEG invested $4.2 billion in 2016: $2.8 billion at PSE&G and $1.3 billion at Power PSE&G’s $905 million GSMP and $1.2 billion Energy Strong infrastructure investments continue Solar 4 All programs total 158 MW DC with latest extension to provide $80 million for development of 33 MW DC of grid-connected, landfill/brownfield solar over next 3 years * See Slide A for Items excluded from Net Income/(Loss) to reconcile to Operating Earnings (non-GAAP). |
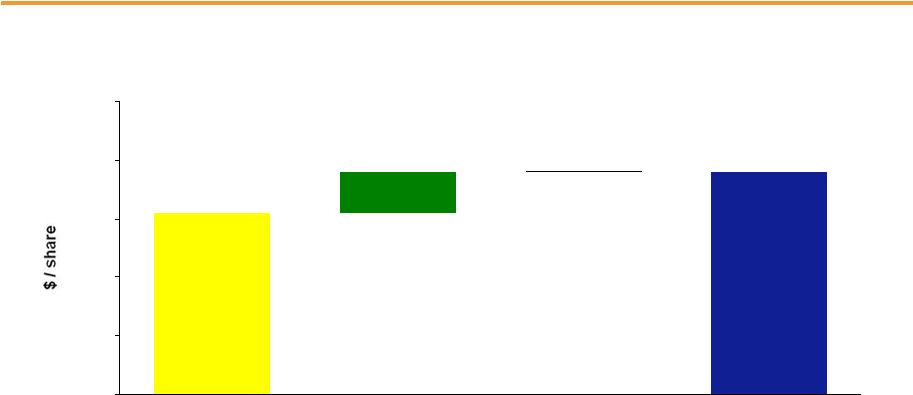
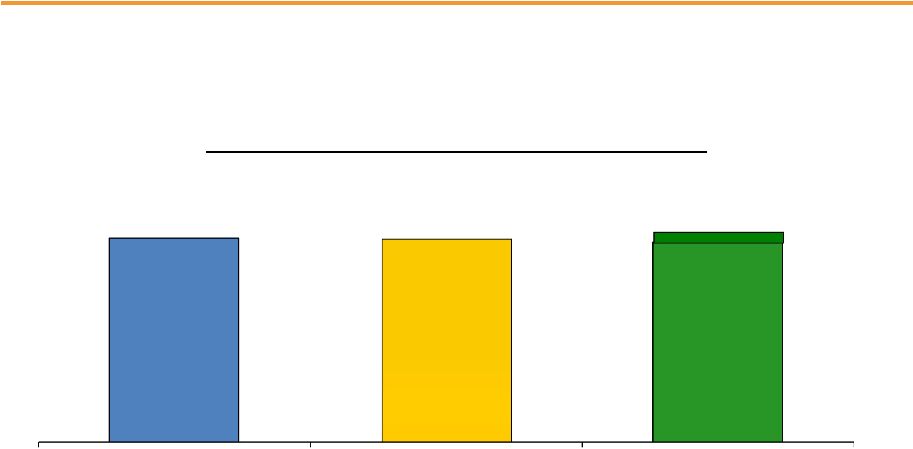 7 $2.80 - $3.00E PSEG Initiating 2017 Full-Year Guidance $2.91 $2.90 Growth in utility infrastructure investments continue to drive a higher regulated earnings contribution in 2017 Non-GAAP Operating Earnings* and 2017 Guidance * See Slide A for Items excluded from Net Income to reconcile to Operating Earnings (non-GAAP). E =
Estimate.
2015 2016 2017E |
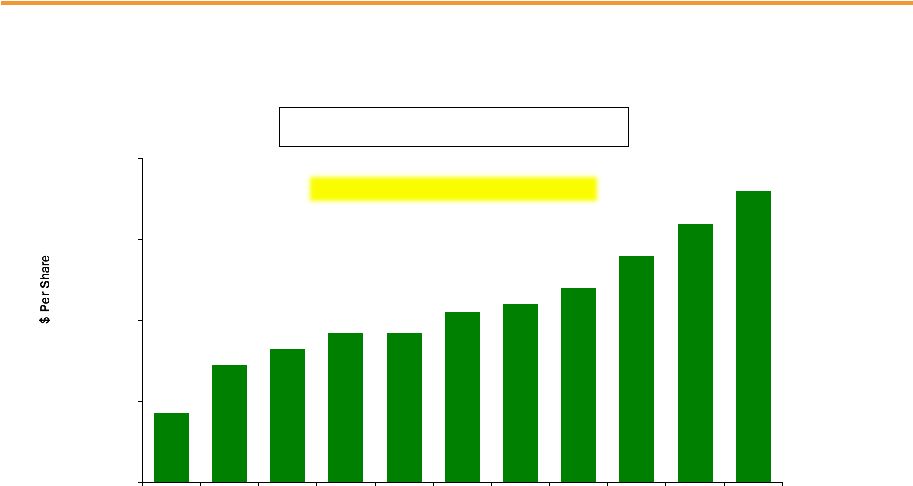 PSEG Annual
Dividend – Increased 4.9% to $1.72 per share
*INDICATIVE ANNUAL 2017 PSEG COMMON DIVIDEND RATE PER SHARE.
**2017 PAYOUT RATIO REFLECTS THE INDICATIVE ANNUAL DIVIDEND RATE DIVIDED BY THE MIDPOINT OF 2017 NON-GAAP OPERATING EARNINGS GUIDANCE OF $2.80 - $3.00 PER SHARE. 8 Continuing an improved rate of growth in the dividend, building on a 110-year history of returning cash to the shareholder $1.17 $1.29 $1.33 $1.37 $1.37 $1.42 $1.44 $1.48 $1.56 $1.64 $1.00 $1.20 $1.40 $1.60 $1.80 2007 2008 2009 2010 2011 2012 2013 2014 2015 2016 2017E PSEG Annual Dividend Rate Payout Ratio 43% 44% 43% 44% 50% 58% 56% 54% 54% 57% 59%** $1.72* 10 year rate of growth: 3.9% |
 PSEG
2016 Q4 Operating Company Review
Dan Cregg EVP and Chief Financial Officer |
 GAAP
Operating Earnings*) Results
Per Share $ millions (except Per Share amounts) 2016 2015 2016 2015 PSE&G (Net Income) $ 193 $ 156 $ 0.38 $ 0.31 PSEG Power (Net
Income/(Loss)) $ (302)
$ 149 $ (0.59) $ 0.29 PSEG Power (non- $ 69
$ 95 $ 0.13 $ 0.19 PSEG Enterprise/Other (Net
Income) $ 11
$ 4 $ 0.02 $ - PSEG Enterprise/Other (non-
GAAP Op. Earnings*) $ 17 $ 4 $ 0.03 $ - 10 Q4 Results by Subsidiary Quarter ended December 31 *See Slide B for Items excluded from Net Income/(Loss) to reconcile to Operating Earnings (non-GAAP) for PSEG Power and PSEG
Enterprise/Other. |
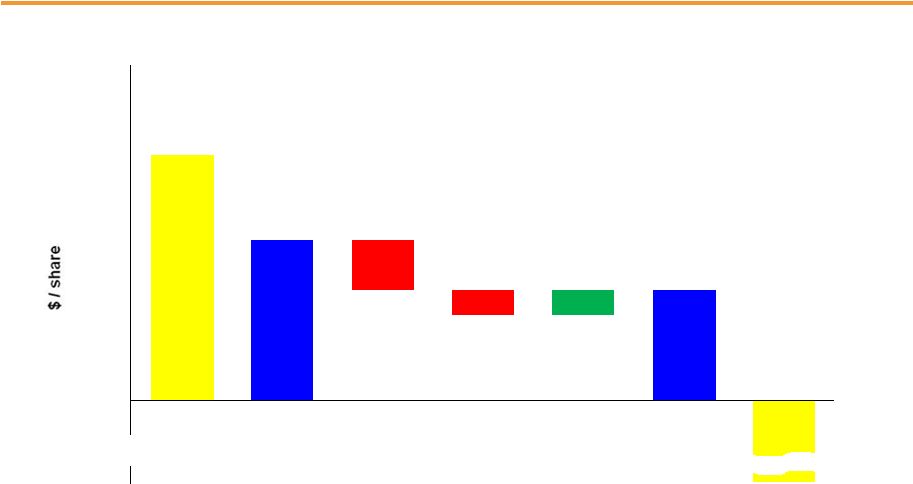
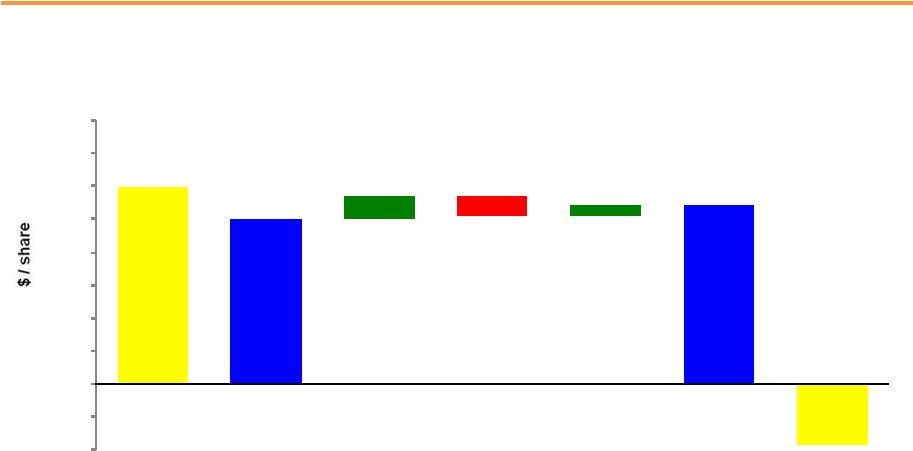 11 PSEG EPS Reconciliation – Q4 2016 versus Q4 2015 Q4 2016 Net (Loss) Q4 2015 Net Income PSEG Power PSE&G Enterprise/ Other * See Slide A for Items excluded from Net Income/(Loss) to reconcile to Operating Earnings (non-GAAP).
Recontracting/ Lower Prices (0.05) Lower Volume/ Higher Gas Send-out (0.01) O&M (0.03) Interest, Taxes & Other 0.03 Transmission 0.06 Weather 0.01 Distribution O&M 0.03 D&A, Taxes and Other (0.03) Q4 2015 Operating Earnings (non-GAAP)* Q4 2016 Operating Earnings (non-GAAP)* PSEG-LI and Other $0.60 0.07 (0.06) 0.03 $0.50 $0.54 ($0.19) Returns on expanded investment and cost control support results 0.80 -0.20
-0.10 0.00 0.10 0.20 0.30 0.40 0.50 0.60 0.70 |
 12 Year-to-Date Results by Subsidiary *See Slide B for Items excluded from Net Income/(Loss) to reconcile to Operating Earnings (non-GAAP) for PSEG Power and PSEG
Enterprise/Other. Results
Per Share $ millions (except Per Share amounts) 2016 2015 2016 2015 PSE&G (Net Income) $ 889 $ 787 $ 1.75 $ 1.55 PSEG Power (Net Income) $ 18 $ 856 $ 0.04 $ 1.68 PSEG Power
(non-GAAP Operating Earnings*) $ 514 $ 653 $ 1.01 $ 1.29 PSEG Enterprise/Other (Net Income/(Loss)) $ (20) $ 36 $ (0.04) $ 0.07 PSEG Enterprise/Other (non-GAAP Op.
Earnings*) $ 72
$ 36 $ 0.14 $ 0.07 Twelve Months ended December 31 |
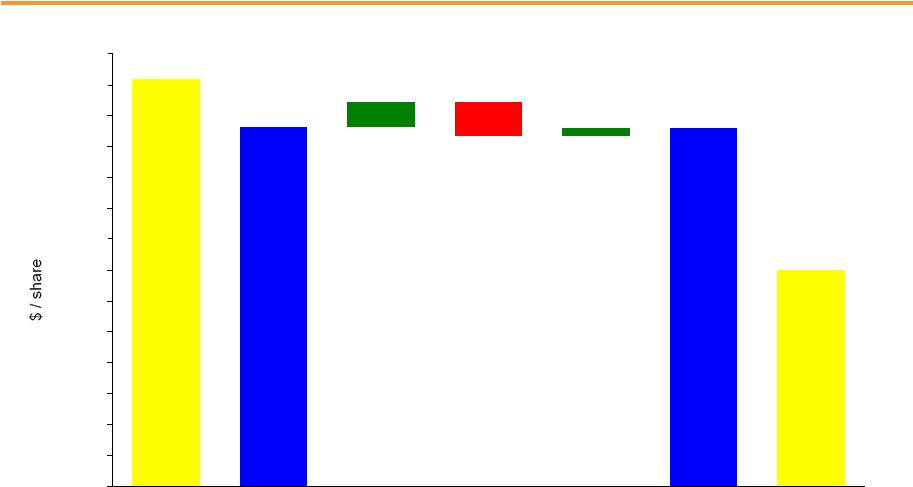 13 0.00 0.25 0.50 0.75 1.00 1.25 1.50 1.75 2.00 2.25 2.50 2.75 3.00 3.25 3.50 PSEG EPS Reconciliation – YTD 2016 versus YTD 2015 YTD 2016 YTD 2016
Operating Earnings (non- GAAP)* YTD 2015 Net Income Recontracting/ Lower Prices (0.16) Lower Gas Send- Out and Fixed Cost Recovery (0.13) Capacity (0.05) Volume (0.07) O&M 0.13 Interest & Other 0.05 D&A (0.03) Absence of 2015 Tax Credits and Other (0.02) PSEG Power Transmission 0.15 Distribution Margin 0.03 Distribution D&A and Interest (0.02) Taxes and Other 0.04 PSE&G Enterprise/ Other PSEG-LI, Taxes and Other * See Slide A for Items excluded from Net Income to reconcile to Operating Earnings (non-GAAP).
Net Income YTD 2015 Operating Earnings (non- GAAP)* $3.30 0.20 (0.28) 0.07 $2.91 $2.90 $1.75 |
 PSE&G 2016 Q4 Review |
 15 PSE&G – Q4 Summary of Results $ millions (except EPS) Q4 2016 Q4 2015 Variance Operating Revenues $ 1,475 $ 1,402 $ 73 Operating Expenses Energy Costs 588 546 42 Operation & Maintenance 365 389 (24) Depreciation & Amortization 153 180 (27) Total Operating Expenses 1,106 1,115 (9) Net Income $ 193 $ 156 $ 37 EPS from Net Income $ 0.38 $ 0.31 $ 0.07 |
 $0.31 0.07 $0.38 0.00 0.00 0.10 0.20 0.30 0.40 0.50 16 PSE&G EPS Reconciliation – Q4 2016 versus Q4 2015 Q4 2016 Net Income Q4 2015 Net Income Transmission & Distribution Margin 0.06 Electric Weather 0.01 O&M 0.03 D&A, Taxes & Other (0.03) Prior quarter results for reconciling items may not add to year-to-date (YTD) totals due to rounding.
|
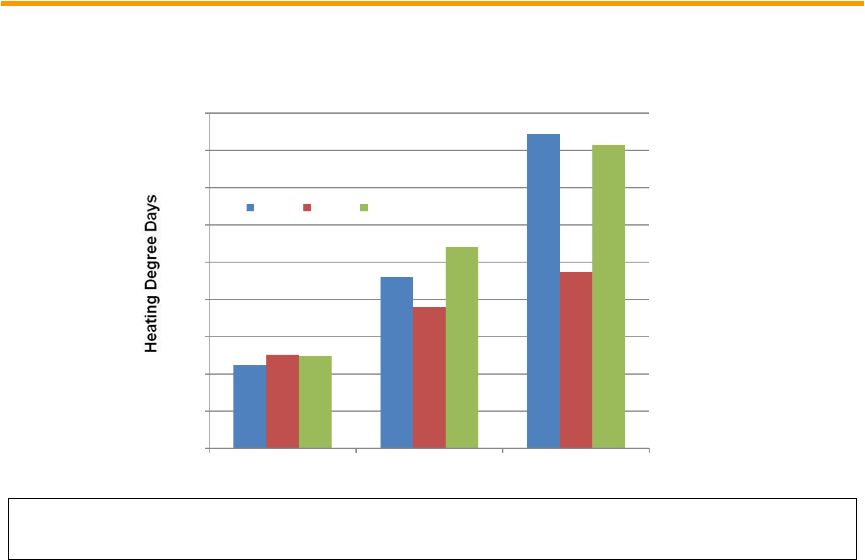 17 PSE&G – Monthly Heating Degree Days Q4 2016 winter weather, as defined by heating degree days, was ~38% colder than Q4 2015 (the warmest Q4 in our records) and ~5% warmer than normal Monthly Heating Degree Days Q4 2016 vs. Q4 2015 vs. Q4 Normal 0 100 200 300 400 500 600 700 800 900 October November December Q4 16 Q4 15 Q4 Normal |
 18 PSE&G – Q4 Operating Highlights FERC formula rate revenue increase of $121 million effective January 1, 2017 PSE&G will file its distribution base rate case with the NJBPU no later than November 1, 2017
PSE&G residential gas customers receiving BGSS bill credits totaling ~$47 million
during Winter 2016-17; Since 2009, average annual residential gas
bills have declined by 53% –
or $892 – due to supply rate reductions Operations PSE&G’s 2017 Net Income guidance range is $945 - $985 million, an 8.5% increase to the mid-point over 2016 Net Income of $889 million PSE&G invested $2.8 billion in 2016 capital expenditures to upgrade and expand T&D
Investment in transmission grew to 44% of rate base at year-end 2016, as
consolidated rate base increased by 12% to $15.2 billion
Financial Electric sales were flat both for the quarter and for the full year on a weather normalized basis;
Weather adjusted gas sales declined slightly in Q4 and declined by 1.9% for the full
year PSE&G recognized for the 15th year as the Mid-Atlantic
region’s most reliable electric utility Regulatory and Market
Environment |
 PSEG
Power 2016 Q4 Review |
 20 PSEG Power – Q4 Summary of Results $ millions (except EPS) Q4 2016 Q4 2015 Variance Operating Revenues $ 921 $ 1,082 $ (161) Net Income/(Loss) (302) 149 (451) Reconciling Items 371 (54) 425 Operating Earnings (non-GAAP)* $ 69 $ 95 $ (26) EPS from Net Income/(Loss) $ (0.59) $ 0.29 $ (0.88) EPS from Operating Earnings (non-GAAP)* $ 0.13 $ 0.19 $ (0.06) *See Slide B for Items excluded from Net Income/(Loss) to reconcile to Operating Earnings (non-GAAP) for PSEG Power. |
 21 Recontracting/ Lower Prices (0.05) Lower Volume/ Higher Gas Send-out (0.01) PSEG Power EPS Reconciliation – Q4 2016 versus Q4 2015 O&M * See Slide B for Items excluded from Net Income/(Loss) to reconcile to Operating Earnings (non-GAAP) for PSEG Power.
Interest, Taxes and Other $0.29 $0.19 0.03 $0.13 (0.06) (0.03) 0.40 0.00 0.30 0.20 0.10 -0.60 ($0.59) Q4 2016 Net (Loss) Q4 2015 Net Income Q4 2015 Operating Earnings (non-GAAP)* Q4 2016 Operating Earnings (non-GAAP)* - ~ ~ - - - - - |
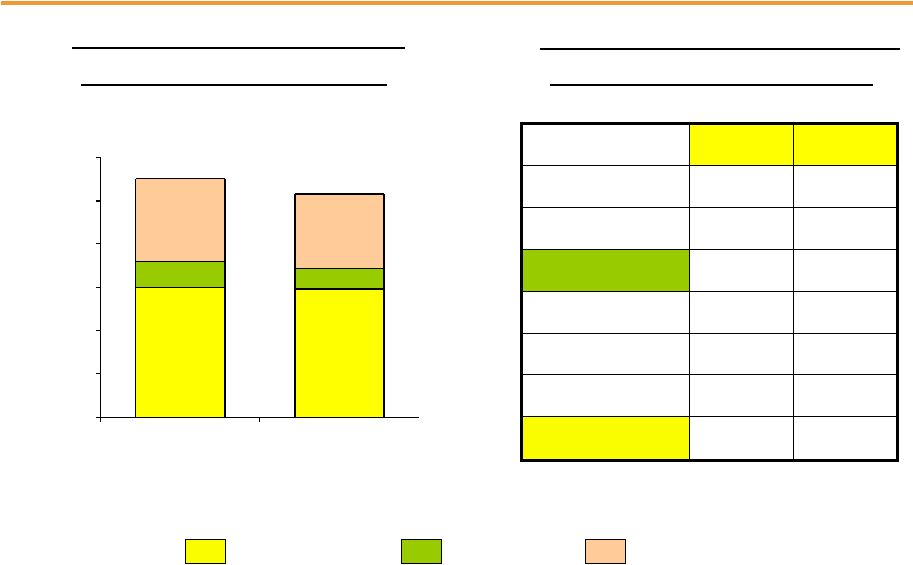
 22 PSEG Power – Q4 Generation Measures – Volume % 7,265 7,288 814 1,343 4,646 3,124 0 7,500 15,000 2015 2016 Quarter ended December 31 Total Nuclear Total Coal* Oil & Natural Gas * Includes figures for Pumped Storage. Includes Hudson and Mercer when run on gas.
PSEG Power – Generation (GWh) 12,725 11,755 Quarter ended December 31 PSEG Power – Capacity Factors (%) 2015 2016 Combined Cycle PJM and NY 62.9% 41.5% Coal* NJ (Coal/Gas) 0.2% 0.8% PA 48.6% 74.5% CT 0.2% 10.1% Nuclear 85.4% 85.3% |
 23 PSEG Power – Full-Year Generation Measures – Twelve months ended December 31 Total Nuclear Total Coal* Oil & Natural Gas * Includes figures for Pumped Storage. Includes Hudson and Mercer when run on gas.
PSEG Power – Generation (GWh) Twelve months ended December 31 PSEG Power – Capacity Factors (%) Volume % 30,013 29,553 5,809 4,776 19,391 17,181 0 10,000 20,000 30,000 40,000 50,000 60,000 2015 2016 2015 2016 Combined Cycle PJM and NY 64.2% 57.2% Coal* NJ (Coal/Gas) 5.6% 2.8% PA 69.3% 65.1% CT 17.9% 5.4% Nuclear 90.4% 86.9% 55,213 51,510 |
 24 PSEG Power – Fuel Costs Quarter ended December 31 ($ millions) 2015 2016 Coal 23 31 Oil & Gas 62 58 Total Fossil 85 89 Nuclear 51 49 Total Fuel Cost 136 138 Total Generation (GWh) 12,725 11,755 $ / MWh 10.69 11.74 PSEG Power – Fuel Costs Twelve months ended December 31 ($ millions) 2015 2016 Coal 163 109 Oil & Gas 485 272 Total Fossil 648 381 Nuclear 213 203 Total Fuel Cost 861 584 Total Generation (GWh) 55,213 51,510 $ / MWh 15.59 11.34 |
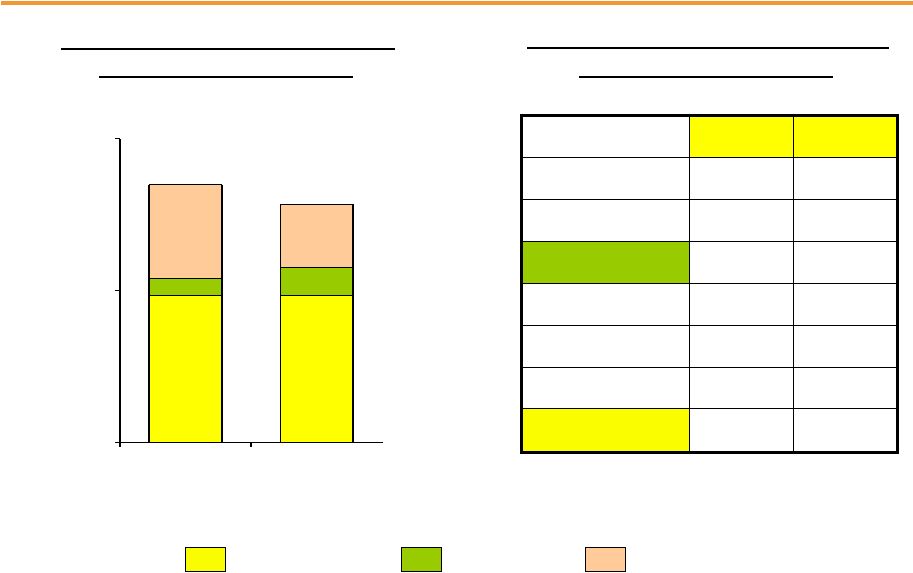
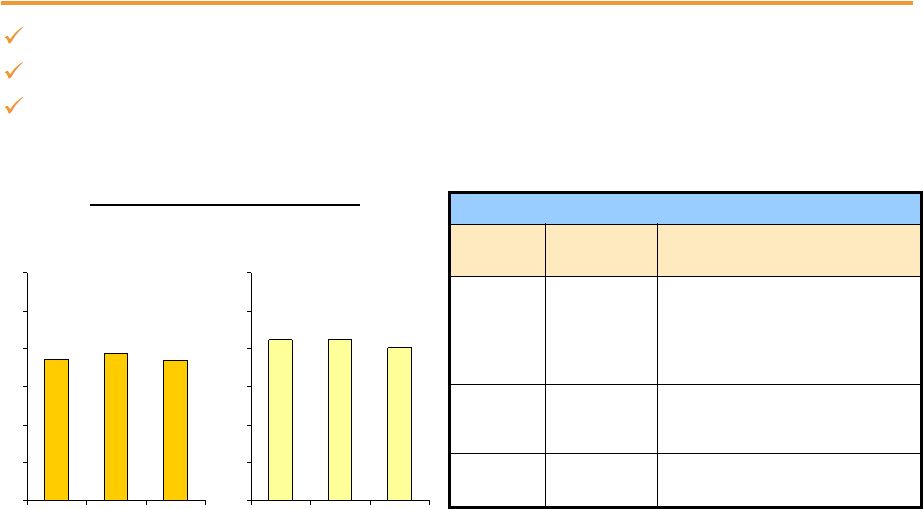 25 PSEG Power – Gross Margin Performance $0 $10 $20 $30 $40 $50 $60 2014 2015 2016 $0 $10 $20 $30 $40 $50 $60 2014 2015 2016 $37 Quarter ended December 31 Twelve Months ended December 31 $40 Lower generation and lower hedge prices offset higher market prices Capacity revenues were flat vs. prior year Spark spreads compressed in the quarter Regional Performance Region Q4 Gross Margin ($M) Q4 2016 Performance PJM $407 Recontracting at lower prices and lower volumes offset higher market prices New England $15 Higher generation offset by lower hedges New York $13 Lower generation offset higher prices PSEG Power Gross Margin ($/MWh) $37 $42 $39 $42 |
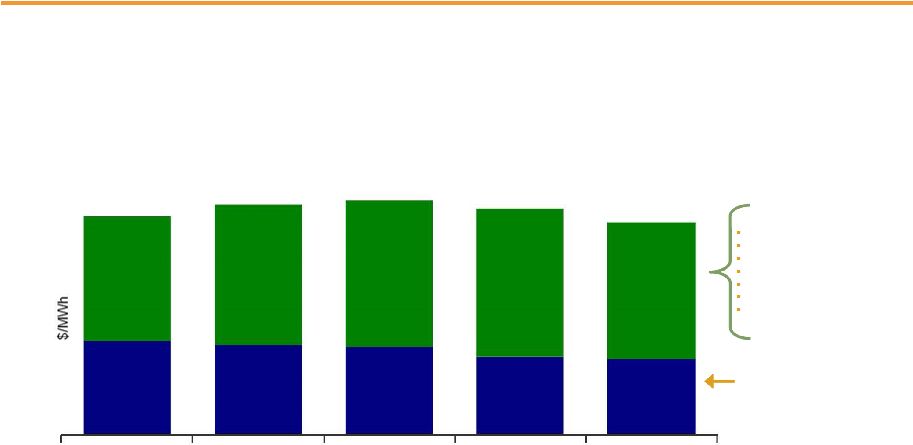 2013 2014 2015 2016 2017 26 Full Requirements Component Capacity Markets/RPM Growing Renewable Energy/Transmission Component for Market Risk Market Perspective – 2017 BGS Auction Results Latest auction results reflect mix of lower prices for energy and capacity and higher transmission costs Note: BGS prices are quoted in $/MWh and reflect PSE&G Zone; results from the 2015-2017 auctions will be the new blended prices beginning
June 1, 2017. $99.54
~ $53 ~ $59 $92.18 ~ $62
Three-Year Average
Round the Clock PJM West Forward Energy Price Capacity Load shape Transmission Congestion Ancillary services Risk premium Green $97.39 $39 - $40 $38 - $39 $37 - $38 $33 - $34 ~ $63 $96.38 $90.78 ~ $58 $32 - $33 |
 2017 2018 2019 Volume TWh 34 34 34 Base Load % Hedged 100% 80-85% 35-40% (Nuclear and Base Load Coal) Price $/MWh $46 $43 $43 Volume TWh 16 21 26 Intermediate, Combined Cycle, % Hedged 45-50% 0% 0% Peaking Price $/MWh $46 $ - $ - Volume TWh 49-51 54-56 59-61 Total % Hedged 80-85% 50-55% 15-20% Price $/MWh $46 $43 $43 27 Hedging Update… Contracted Energy* * HEDGE PERCENTAGES AND PRICES AS OF FEBRUARY 9, 2017, UPDATED WITH 2017 BGS AUCTION RESULTS. REVENUES OF FULL REQUIREMENT LOAD DEALS BASED ON CONTRACT PRICE, INCLUDING RENEWABLE ENERGY CREDITS, ANCILLARY, AND TRANSMISSION COMPONENTS BUT EXCLUDING CAPACITY. HEDGES INCLUDE POSITIONS WITH MTM ACCOUNTING TREATMENT AND OPTIONS. |
 28 PSEG Power – Q4 Operating Highlights Q4 output down 7.6% versus Q4 2015 due to Hope Creek refueling and planned CCGT major maintenance; Full-year generation was 6.7% lower Annual capacity factor for the nuclear fleet of 86.9% produced 29.6 TWh of energy; CCGT fleet had a capacity factor of 57.2%, producing 16.4 TWh of energy Hope Creek refueling outage completed in 27 days during Q4 2016 Operations Financial 2017 BGS auction priced at $90.78/MWh vs. $96.38/MWh in 2016 for PSE&G 2017 expected generation output 49-51 TWh; BGS load projected at 11 TWhs Power nearing commencement of construction at Bridgeport Harbor site; target completion in 2019 Construction on schedule and on budget at Keys and Sewaren 7 for targeted 2018 in-service Power’s total debt as a percentage of capitalization at year-end was 29% Power’s FFO/Debt at December 31 remains strong Power’s 2017 non-GAAP Operating Earnings guidance range is $435 - $510 million; Non-GAAP Adjusted EBITDA guidance for 2017 is $1,080 to $1,210 million Regulatory and Market Environment |
 PSEG |
 30 PSEG Financial Highlights Introducing 2017 non-GAAP Operating Earnings guidance of $2.80 PSE&G earnings forecast to grow 8.5% to comprise 66% of PSEG’s 2017 non-GAAP Operating Earnings
Focused on maintaining operating efficiency and customer reliability
PSEG capital spending forecast of $10.2 billion over 2017-2019
to be invested in PSE&G (77%) and Power (23%)
PSE&G infrastructure investment in reliability/resiliency/replacement
continues with ongoing GSMP and Energy Strong investments
PSEG Power’s $2 billion investment in new generation in PJM and New
England, will improve fleet efficiency and geographic diversity
Increased 2017 indicative common dividend by 4.9% to $1.72 per share
Financial position remains strong:
Continuing to pursue opportunities to enhance Operating Earnings and reduce financial
risk Positive cash from Power and increasing cash flow from operations at
PSE&G supports dividend growth and funds capital spending program
without the need to issue equity Debt as a percentage of capitalization
was 47% at December 31, 2016 Introducing 2017 non-GAAP Operating Earnings
guidance of $2.80 - $3.00 per share |
 31 2017 Federal Tax Reform – PSEG is well positioned Assumption PSE&G PSEG Power PSEG Parent Reduction of Corporate Tax Rate Customer rates lowered with reduction in tax rate Return of excess deferred tax liability – impact on cash and rate base growth dependent on payback period After-tax earnings and cash flow increase One-time non-cash earnings benefit from reduction in deferred tax liability After-tax earnings and cash flow improve 100% Expensing of Capital Expenditures Impact on rate base growth comparable to existing bonus depreciation rules Cash flow improves Elimination of Deductibility of Interest Expense and Border Adjustment Tax Change in cost anticipated to be passed through to customers Well positioned given low debt balance Uncertainty on Border Adjustment Tax Well positioned given low debt balance Given positive non-utility contribution to earnings and a strong balance sheet,
PSEG is well positioned for potential tax reform |
 32 PSEG 2017 Guidance - By Subsidiary $ millions (except EPS) 2017E 2016 2015 PSE&G (Net Income) $945 - $985 $889 $787 PSEG Power $435 - $510 $514 $653 PSEG Enterprise/Other $35 - $35 $72 $36 Operating Earnings (non-GAAP)* $1,415 - $1,530 $1,475 $1,476 Operating EPS (non-GAAP)* $2.80 - $3.00E $2.90 $2.91 Segment Operating Earnings Guidance and Prior Results (non-GAAP, except as noted)* $ millions 2017E 2016 2015 PSEG Power $1,080 - $1,210 $1,201 $1,435 PSEG Power Adjusted EBITDA (non-GAAP)* * See Slide A for Items excluded from Net Income to reconcile to Operating Earnings (non-GAAP) and Slide B for Items excluded from Net Income
to reconcile to Operating Earnings (non-GAAP) and Adjusted EBITDA
(non-GAAP). E = Estimate. |
 PSEG
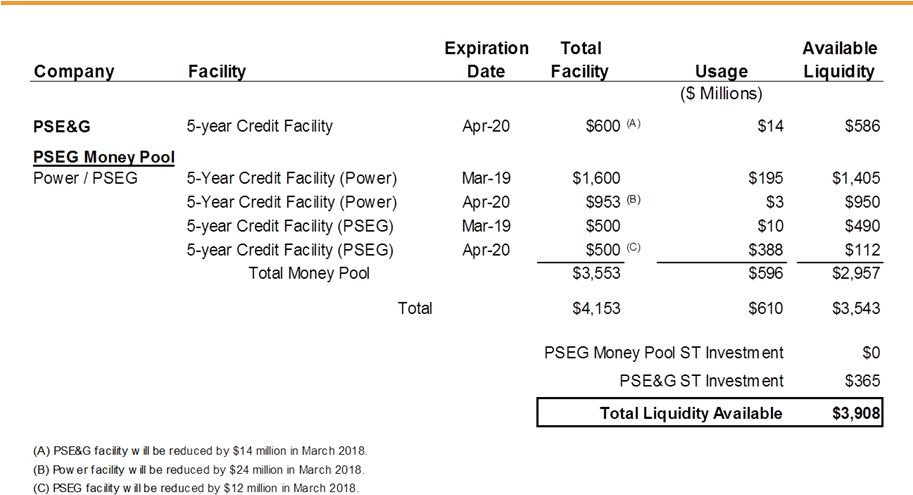
Liquidity as of December 31, 2016 33 |
 Reconciliation of Non-GAAP Operating Earnings
Please see Slide 2 for an explanation of PSEG’s use of Operating Earnings as a
non-GAAP financial measure and how it differs from Net
Income. A
2016 2015 2016 2015 Net Income (Loss) (98) $ 309 $ 887 $ 1,679 $ (Gain) Loss on Nuclear Decommissioning Trust (NDT) Fund Related Activity, pre-tax (PSEG Power) (9) (38) (5) (24) (Gain) Loss on Mark-to-Market (MTM), pre-tax (a) (PSEG Power) 77 (59) 168 (157) Storm O&M, net of insurance recoveries, pre-tax (PSEG Power) - - - (172) Hudson/Mercer Early Retirement, pre-tax (PSEG Power) 555 - 669 - Lease Related Activity, pre-tax (PSEG Enterprise/Other) 10 - 147 - Income Taxes related to Operating Earnings (non-GAAP) reconciling items (b) (256) 43 (391) 150 Operating Earnings (non-GAAP) 279 $ 255 $ 1,475 $ 1,476 $ PSEG Fully Diluted Average Shares Outstanding (in millions) 508 508 508 508 Net Income (Loss) (0.19) $ 0.60 $ 1.75 $ 3.30 $ (Gain) Loss on NDT Fund Related Activity, pre-tax (PSEG Power) (0.02) (0.08) (0.01) (0.05) (Gain) Loss on MTM, pre-tax (a) (PSEG Power) 0.15 (0.12) 0.33 (0.31) Storm O&M, net of insurance recoveries, pre-tax (PSEG Power) - - - (0.34) Hudson/Mercer Early Retirement, pre-tax (PSEG Power) 1.10 - 1.32 - Lease Related Activity, pre-tax (PSEG Enterprise/Other) 0.02 - 0.29 - Income Taxes related to Operating Earnings (non-GAAP) reconciling items (b) (0.52) 0.10 (0.78) 0.31 Operating Earnings (non-GAAP) 0.54 $ 0.50 $ 2.90 $ 2.91 $ (a) Includes the financial impact from positions with forward delivery months. December 31, Year Ended December 31, PUBLIC SERVICE ENTERPRISE GROUP INCORPORATED Consolidated Operating Earnings (non-GAAP) Reconciliation Three Months Ended Reconciling Items ($ millions, Unaudited) ($ Per Share Impact - Diluted, Unaudited) (b) Income tax effect calculated at 40.85% statutory rate, except for lease related activity which is calculated at a combined leveraged lease
effective tax rate and NDT related activity which is calculated at the
40.85% statutory rate plus a 20% tax on income (losses) from qualified NDT funds. |
 B Reconciliation of Non-GAAP Operating Earnings and Non-GAAP Adjusted EBITDA Please see Slide 2 for an explanation of PSEG’s use of Operating Earnings and Adjusted EBITDA as non-GAAP financial measures and how they
differ from Net Income. 2016
2015 2016 2015 Net Income (Loss) (302) $ 149 $ 18 $ 856 $ (Gain) Loss on NDT Fund Related Activity, pre-tax (9) (38) (5) (24) (Gain) Loss on MTM, pre-tax (a) 77 (59) 168 (157) Storm O&M, net of insurance recoveries, pre-tax - - - (172) Hudson/Mercer Early Retirement, pre-tax 555 - 669 - Income Taxes related to Operating Earnings (non-GAAP) reconciling items (b) (252) 43 (336) 150 Operating Earnings (non-GAAP) 69 $ 95 $ 514 $ 653 $ Depreciation and Amortization, pre-tax (c) 85 73 329 301 Interest Expense, pre-tax (c) (d) 18 27 83 120 Income Taxes (c) (17) 23 275 361 Adjusted EBITDA (non-GAAP) 155 $ 218 $ 1,201 $ 1,435 $ PSEG Fully Diluted Average Shares Outstanding (in millions) 508 508 508 508 (a) Includes the financial impact from positions with forward delivery months. (c) Excludes amounts related to Operating Earnings (non-GAAP) reconciling items.
(d) Net of capitalized interest.
(b) Income tax effect calculated at 40.85% statutory rate, except for lease related
activity which is calculated at a combined leveraged lease effective tax
rate and NDT related activity which is calculated at the 40.85% statutory rate plus a
20% tax on income (losses) from qualified NDT funds. PSEG Power
Reconciliations Three Months Ended
Year Ended December 31, ($ millions, Unaudited) Reconciling Items December 31, 2016 2015 2016 2015 Net Income (Loss) 11 $ 4 $ (20) $ 36 $ Lease Related Activity, pre-tax 10 - 147 - Income Taxes related to Operating Earnings (non-GAAP) reconciling items (a) (4) - (55) - Operating Earnings (non-GAAP) 17 $ 4 72 $ 36 $ PSEG Fully Diluted Average Shares Outstanding (in millions) 508 508 508 508 (a) Income tax effect calculated at a combined leveraged lease effective tax rate.
($ millions, Unaudited)
PSEG Enterprise/Other Reconciliation
Reconciling Items Three Months Ended Year Ended December 31, December 31, |