Attached files
| file | filename |
|---|---|
| 8-K - FORM 8-K - PUBLIC SERVICE ENTERPRISE GROUP INC | d332606d8k.htm |
| EX-99.1 - EX-99.1 - PUBLIC SERVICE ENTERPRISE GROUP INC | d332606dex991.htm |
EXHIBIT 99

|
Investor News | NYSE: PEG |
For further information, contact:
| • Kathleen A. Lally, Vice President – Investor Relations |
Phone: 973-430-6565 | |
| • Carlotta Chan, Manager - Investor Relations
|
Phone: 973-430-6596
|
PSEG ANNOUNCES 2016 RESULTS
NET INCOME OF $1.75 PER SHARE
Non-GAAP Operating Earnings of $2.90 Per Share
Common Dividend Increased 4.9%
Non-GAAP 2017 Operating Earnings Guidance $2.80 - $3.00 Per Share
(February 24, 2017 – Newark, NJ) Public Service Enterprise Group (PSEG) reported 2016 Net Income of $887 million, or $1.75 per share as compared to Net Income of $1,679 million, or $3.30 per share for 2015. Non-GAAP Operating Earnings for the year 2016 were $1,475 million or $2.90 per share compared to 2015 non-GAAP Operating Earnings of $1,476 million or $2.91 per share. Net Income for 2016 was largely impacted by expenses associated with the early retirement of coal-gas units at the Hudson and Mercer generating stations and reserves for a leveraged lease impairment. Net Income for 2015 includes insurance proceeds for the recovery of storm costs.
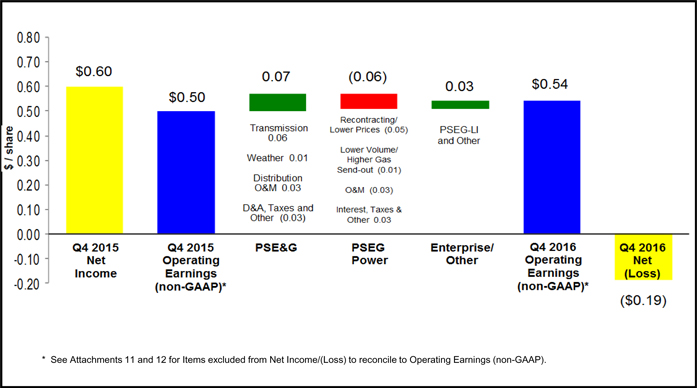
PSEG also reported a Net Loss for the fourth quarter of 2016 of $98 million, or $0.19 per share. This compares to fourth quarter 2015 Net Income of $309 million, or $0.60 per share. Non-GAAP Operating Earnings for the fourth quarter of 2016 were $279 million, or $0.54 per share compared to fourth quarter 2015 non-GAAP Operating Earnings of $255 million, or $0.50 per share. Net Loss in the fourth quarter reflects the impact of incremental depreciation expense and other expenses of $555 million pre-tax associated with the early retirement of the Hudson and Mercer coal/gas-fired generating stations.
“We delivered strong results in 2016 with full year non-GAAP Operating Earnings solidly within the range of our guidance” said Ralph Izzo, chairman, president and chief executive officer. “Continued growth at our regulated utility and a disciplined approach to expenses across Enterprise supported results. The Board’s recent decision to increase the common dividend by 4.9% to the indicative annual level of $1.72 per share represents confidence in our firm’s investment strategy and an acknowledgment of our strong financial condition.”
Management uses non-GAAP Operating Earnings in its internal analysis, and in communications with investors and analysts, as a consistent measure for comparing PSEG’s financial performance to previous financial results. Non-GAAP Operating Earnings exclude the impact of returns (losses) associated with the Nuclear Decommissioning Trust (NDT), Mark-to-Market (MTM) accounting and material one-time items such as the previously noted Hudson and Mercer retirements and lease impairment.
The tables below provide a reconciliation of PSEG’s Net Income to non-GAAP Operating Earnings for the full year and fourth quarter. See Attachment 11 for a complete list of items excluded from Net Income in the determination of non-GAAP Operating Earnings. The presentation of non-GAAP Operating Earnings is intended to complement, and should not be considered an alternative to, the presentation of Net Income, which is an indicator of financial performance determined in accordance with GAAP. In addition, non-GAAP Operating Earnings as presented in this release may not be comparable to similarly titled measures used by other companies.
PSEG CONSOLIDATED RESULTS (unaudited)
Full-Year Comparative Results
2016 and 2015
| Income | Diluted Earnings | |||||||||||||||||||
| ($ millions) | Per Share | |||||||||||||||||||
| 2016 | 2015 | 2016 | 2015 | |||||||||||||||||
| Net Income |
$ | 887 | $ | 1,679 | $ | 1.75 | $ | 3.30 | ||||||||||||
| Reconciling Items* |
588 | (203 | ) | 1.15 | (0.39 | ) | ||||||||||||||
|
|
|
|
|
|
|
|
|
|||||||||||||
| Non-GAAP Operating Earnings |
$ | 1,475 | $ | 1,476 | $ | 2.90 | $ | 2.91 | ||||||||||||
|
|
|
|
|
|
|
|
|
|||||||||||||
| Avg. Shares | 508M | 508M | ||||||||||||||||||
| * | See Attachment 11 |
PSEG CONSOLIDATED RESULTS (unaudited)
Fourth Quarter Comparative Results
2016 and 2015
| Income/(Loss) | Diluted Earnings | |||||||||||||||||||
| ($ millions) | Per Share | |||||||||||||||||||
| 2016 | 2015 | 2016 | 2015 | |||||||||||||||||
| Net Income/(Loss) |
$ | (98 | ) | $ | 309 | $ | (0.19 | ) | $ | 0.60 | ||||||||||
| Reconciling Items* |
377 | (54 | ) | 0.73 | (0.10 | ) | ||||||||||||||
|
|
|
|
|
|
|
|
|
|||||||||||||
| Non-GAAP Operating Earnings |
$ | 279 | $ | 255 | $ | 0.54 | $ | 0.50 | ||||||||||||
|
|
|
|
|
|
|
|
|
|||||||||||||
| Avg. Shares | 508M | 508M | ||||||||||||||||||
| * | See Attachment 11 |
Ralph Izzo went on to say, “We continue to pursue opportunities to enhance earnings and reduce financial risk. Actions to transition our business mix in response to changing market conditions have supported earnings. For 2017, we forecast non-GAAP Operating Earnings of $2.80 - $3.00 per share. Based on the growth in our regulated utility’s investment program, PSE&G’s Net Income is forecast to grow 8.5% at the mid-point of 2017’s guidance
to represent 66% of our forecast non-GAAP Operating Earnings. Our investment program, coupled with the impact from retirement of Hudson and Mercer (which is excluded from our non-GAAP Operating Earnings) is expected to improve the resiliency of our infrastructure and the economic efficiency of our generating fleet. Our ultimate goal is to provide an attractive earnings and dividend profile as we also deliver value to the customer. Our balance sheet remains strong, and we are well positioned to meet our goals.”
The following table outlines PSEG’s 2016 non-GAAP Operating Earnings by subsidiary and expectations for 2017.
2017 Non-GAAP Operating Earnings Guidance and
2016 Non-GAAP Operating Earnings
($ millions, except EPS)
| 2017E | 2016A | |||||||
| PSE&G |
$945 - $985 | $889 | ||||||
| PSEG Power |
$435 - $510 | $514 | ||||||
| PSEG Enterprise/Other |
$35 - $35 | $72 | ||||||
| Non-GAAP Operating Earnings |
$1,415 - $1,530 | $1,475 | ||||||
| Non-GAAP EPS |
$2.80 - $3.00 | $2.90 | ||||||
| E = Estimate A= Actual |
||||||||
Due to the forward looking nature of non-GAAP Operating Earnings guidance, PSEG is unable to reconcile this non-GAAP financial measure to the most directly comparable GAAP financial measure. Management is unable to project certain reconciling items, in particular MTM and NDT gains (losses), for future periods due to market volatility.
Non-GAAP Operating Earnings Review and Outlook by Operating Subsidiary
See Attachments 5 and 6 for detail regarding the quarter-over-quarter and year-over-year reconciliations for each of PSEG’s businesses.
PSE&G
PSE&G reported Net Income of $193 million ($0.38 per share) for the fourth quarter bringing full year Net Income to $889 million ($1.75 per share). On a comparative basis, PSE&G reported Net Income of $156 million ($0.31 per share) and $787 million ($1.55 per share) for the fourth quarter and full year 2015, respectively.
PSE&G’s Net Income in the fourth quarter continued to benefit from a return on its expanded investment in transmission and distribution infrastructure.
Growth in PSE&G’s investment in transmission, and the absence of an adjustment to Net Income for bonus depreciation in the year-ago quarter improved quarter-over-quarter Net Income comparisons by $0.06 per share. More normal weather conditions relative to unseasonably mild weather in the year-ago quarter improved Net Income by $0.01 per share. A decline in O&M of $0.03 per share and other expenses was offset by an increase in depreciation expense and taxes.
PSE&G implemented a $121 million increase in revenue under the company’s transmission formula rate on January 1, 2017. Transmission revenues are adjusted each year to reflect an update of the company’s investment program. PSE&G’s investment in transmission grew to $6.7 billion of rate base at the end of 2016, or 44% of the company’s consolidated rate base of $15.2 billion at the end of the year.
Electric sales, on a weather-normalized basis, were flat in the fourth quarter compared to the year-ago period as an increase in demand from the commercial sector offset a decline in sales to residential and industrial customers. For the year, the continued degradation of the industrial sector and increases in efficiency offset the impact of residential customer growth on sales. Weather-normalized firm gas sales declined slightly during the fourth quarter compared to the year-ago quarter and declined 1.9% for the full year.
PSE&G invested $2.8 billion during 2016 to upgrade and expand its transmission and distribution system. PSE&G upgraded 177 miles of gas pipes in more than 80 towns as it continues work under its three-year $905 million Gas System Modernization Program. Upgrades to the electric distribution system continue under the $1.2 billion Energy Strong infrastructure program.
For the 15th year in a row, PSE&G’s work to protect and strengthen the system yielded recognition as the most reliable electric utility in the Mid-Atlantic.
PSE&G’s Net Income for 2017 is forecasted at $945 million - $985 million.
PSEG Power
PSEG Power reported a Net Loss of $302 million ($0.59 per share) in the fourth quarter of 2016 versus Net Income of $149 million ($0.29 per share) for the fourth quarter of 2015. For the full year 2016, PSEG Power reported Net Income of $18 million ($0.04 per share) versus Net Income for the full year 2015 of $856 million ($1.68 per share).
PSEG Power reported non-GAAP Operating Earnings of $69 million ($0.13 per share) for the fourth quarter of 2016 and non-GAAP Adjusted EBITDA of $155 million bringing full year non-GAAP Operating Earnings to $514 million ($1.01 per share) and non-GAAP Adjusted EBITDA to $1,201 million. On a comparative basis, PSEG Power reported non-GAAP Operating Earnings of $95 million ($0.19 per share) and non-GAAP Adjusted EBITDA of $218 million for the fourth quarter of 2015 and non-GAAP Operating Earnings of $653 million ($1.29 per share) and non-GAAP Adjusted EBITDA of $1,435 million for the full year 2015.
Management believes non-GAAP Adjusted EBITDA is useful to investors and other users of our financial statements in evaluating operating performance because it provides them with an additional tool to compare business performance across companies and across periods. Management also believes that non-GAAP Adjusted EBITDA is widely used by investors to measure operating performance without regard to items such as income tax expense, interest expense and depreciation and amortization, which can vary substantially from company to company depending upon, among other things, the book value of assets, capital structure and whether assets were constructed or acquired. Non-GAAP Adjusted EBITDA also allows investors and other users to assess the underlying financial performance of our fleet before management’s decision to deploy capital. Non-GAAP Adjusted EBITDA excludes the same items as our non-GAAP Operating Earnings measure as well as income tax expense, interest expense and depreciation and amortization. See Attachment 12 for a complete list of items excluded from Net Income in the determination of non-GAAP Adjusted EBITDA. The presentation of non-GAAP Adjusted EBITDA is intended to complement, and should not be considered an alternative to the presentation of Net Income, which is an indicator of financial performance determined in accordance with GAAP. In addition, non-GAAP Adjusted EBITDA as presented in this release may not be comparable to similarly titled measures used by other companies.
Power’s Net Loss for the fourth quarter reflects the impact of incremental depreciation and other expenses of $555 million pre-tax associated with the decision to retire the Hudson and Mercer coal/gas-fired generating stations on June 1, 2017. The company’s fourth quarter results also reflect the impact of a decline in energy prices on output and margins.
A decline in the average price received on energy hedges reduced Power’s quarter-over-quarter non-GAAP Operating Earnings by $0.05 per share. A reduction in output was partially offset by an improvement in off-system gas sales resulting in a net reduction of $0.01 per share in quarterly Net Income(Loss) comparisons. An increase in O&M expense of $0.03 per share associated with the cost of a planned refueling at Power’s 100% owned Hope Creek nuclear station was offset by a decline in taxes and other items.
Output from Power’s generating facilities was 7.6% lower in the fourth quarter compared to year-ago levels. Quarterly comparisons were affected by the refueling outage at Hope Creek, major maintenance on the gas-fired CCGTs during the shoulder period in the market and lower demand. For the year, output was 6.7% lower. The nuclear fleet operated at an average capacity factor of 86.9% producing 29.6 TWh of energy (57% of total energy output for 2016). Power’s gas-fired CCGT fleet operated at an average capacity factor of 57.2% for the year producing 16.4 TWh of energy (32% of 2016’s total energy output). The coal-fired fleet (primarily Keystone and Conemaugh) generated 4.8 TWh of energy during the year (9% of 2016’s total energy output) with the remaining output produced from Power’s peaking generating assets.
Power is forecasting output for 2017 of 49 - 51 TWh – a slight change from 51.5 TWh of energy produced in 2016. Following completion of the Basic Generation Service (BGS) auction in New Jersey in February 2017, Power enters the year with 100% of its 2017
baseload generation hedged. Approximately 80% - 85% of anticipated annual production is hedged at an average price of $46 per MWh. Power has hedged approximately 50 - 55% of its forecast generation in 2018 of 55 TWh at an average price of $43 per MWh. For 2019, Power has hedged 15 - 20% of forecast production of 60 TWh at an average price of $43 per MWh. Power assumes BGS volumes will represent approximately 11 TWh in 2017 – consistent with 2016 deliveries of 11.1 TWh under the BGS contract.
The forecast increase in output for 2018 and 2019 reflects the commercial start-up in mid-2018 of 1,300 MWs of new gas-fired combined cycle capacity at the Keys Energy Center in Maryland and Sewaren in New Jersey, and the mid-2019 commercial start-up of the 485 MW gas-fired combined cycle power plant at Bridgeport Harbor, Connecticut.
Power’s non-GAAP Operating Earnings for 2017 are forecast at $435 - $510 million. The forecast represents non-GAAP Adjusted EBITDA for the full year 2017 of $1,080 – $1,210 million.
Due to the forward looking nature of non-GAAP Adjusted EBITDA guidance, PSEG is unable to reconcile this non-GAAP financial measure to the most directly comparable GAAP financial measure. Management is unable to project certain reconciling items, in particular MTM and NDT gains (losses), for future periods due to market volatility.
PSEG Enterprise/Other
PSEG Enterprise/Other reported Net Income for the fourth quarter of 2016 of $11 million ($0.02 per share) compared to Net Income of $4 million for the fourth quarter of 2015. For the full year, PSEG Enterprise/Other reported a Net Loss of $20 million, ($0.04 per share) compared to Net Income in 2015 of $36 million ($0.07 per share). Net Income for the fourth quarter and full year 2016 include pre-tax charges of $10 million and $147 million, respectively related to an impairment of leveraged lease residual values and an estimated loss as a result of liquidity issues currently facing NRG REMA.
Non-GAAP Operating Earnings for PSEG Enterprise/Other in the fourth quarter 2016 were $17 million ($0.03 per share) compared to $4 million in the year-ago quarter. The results for the fourth quarter brought PSEG Enterprise/Other non-GAAP Operating Earnings for the full year to $72 million ($0.14 per share) versus $36 million ($0.07 per share) in 2015.
The increase in non-GAAP Operating Earnings quarter-over-quarter reflects the absence of certain corporate expenditures as well as certain tax items at PSEG Energy Holdings and contractual payments associated with the operation of PSEG Long Island.
For 2017, non-GAAP Operating Earnings for PSEG Enterprise/Other are forecast to be $35 million.
Capital Expenditures
PSEG currently plans to invest approximately $10.2 billion over 2017 – 2019 primarily in PSE&G (77%) and PSEG Power (23%).
Pension Expense
PSEG, at the end of 2016, merged its three qualified defined benefit pension plans and the pension plans’ assets into one plan. As a result, total net periodic benefit costs are expected to decrease by approximately $48 million (net of amounts capitalized) in 2017 from what they would have been without the merger of the plans, and total periodic benefit expense in 2017 is also expected to be $22 million lower than 2016’s level of expense. This is due to a change in the amortization period for gains and losses for the merged plan which resulted in lower amortization than that of the individual plans.
FORWARD-LOOKING STATEMENTS
Certain of the matters discussed in this report about our and our subsidiaries’ future performance, including, without limitation, future revenues, earnings, strategies, prospects, consequences and all other statements that are not purely historical constitute “forward-looking statements” within the meaning of the Private Securities Litigation Reform Act of 1995. Such forward-looking statements are subject to risks and uncertainties, which could cause actual results to differ materially from those anticipated. Such statements are based on management’s beliefs as well as assumptions made by and information currently available to management. When used herein, the words “anticipate,” “intend,” “estimate,” “believe,” “expect,” “plan,” “should,” “hypothetical,” “potential,” “forecast,” “project,” variations of such words and similar expressions are intended to identify forward-looking statements. Factors that may cause actual results to differ are often presented with the forward-looking statements themselves. Other factors that could cause actual results to differ materially from those contemplated in any forward-looking statements made by us herein are discussed in filings we make with the United States Securities and Exchange Commission (SEC), including our Annual Report on Form 10-K and subsequent reports on Form 10-Q and Form 8-K and available on our website: http://www.pseg.com. These factors include, but are not limited to:
| • | fluctuations in wholesale power and natural gas markets, including the potential impacts on the economic viability of our generation units; |
| • | our ability to obtain adequate fuel supply; |
| • | any inability to manage our energy obligations with available supply; |
| • | increases in competition in wholesale energy and capacity markets; |
| • | changes in technology related to energy generation, distribution and consumption and customer usage patterns; |
| • | economic downturns; |
| • | third party credit risk relating to our sale of generation output and purchase of fuel; |
| • | adverse performance of our decommissioning and defined benefit plan trust fund investments and changes in funding requirements; |
| • | changes in state and federal legislation and regulations; |
| • | the impact of pending rate case proceedings; |
| • | regulatory, financial, environmental, health and safety risks associated with our ownership and operation of nuclear facilities; |
| • | adverse changes in energy industry laws, policies and regulations, including market structures and transmission planning; |
| • | changes in federal and state environmental regulations and enforcement; |
| • | delays in receipt of, or an inability to receive, necessary licenses and permits; |
| • | adverse outcomes of any legal, regulatory or other proceeding, settlement, investigation or claim applicable to us and/or the energy industry; |
| • | changes in tax laws and regulations; |
| • | the impact of our holding company structure on our ability to meet our corporate funding needs, service debt and pay dividends; |
| • | lack of growth or slower growth in the number of customers or changes in customer demand; |
| • | any inability of Power to meet its commitments under forward sale obligations; |
| • | reliance on transmission facilities that we do not own or control and the impact on our ability to maintain adequate transmission capacity; |
| • | any inability to successfully develop or construct generation, transmission and distribution projects; |
| • | any equipment failures, accidents, severe weather events or other incidents that impact our ability to provide safe and reliable service to our customers; |
| • | our inability to exercise control over the operations of generation facilities in which we do not maintain a controlling interest; |
| • | any inability to maintain sufficient liquidity; |
| • | any inability to realize anticipated tax benefits or retain tax credits; |
| • | challenges associated with recruitment and/or retention of key executives and a qualified workforce; |
| • | the impact of our covenants in our debt instruments on our operations; and |
| • | the impact of acts of terrorism, cybersecurity attacks or intrusions. |
All of the forward-looking statements made in this report are qualified by these cautionary statements and we cannot assure you that the results or developments anticipated by management will be realized or even if realized, will have the expected consequences to, or effects on, us or our business, prospects, financial condition, results of operations or cash flows. Readers are cautioned not to place undue reliance on these forward-looking statements in making any investment decision. Forward-looking statements made in this report apply only as of the date of this report. While we may elect to update forward-looking statements from time to time, we specifically disclaim any obligation to do so, even in light of new information or future events, unless otherwise required by applicable securities laws.
The forward-looking statements contained in this report are intended to qualify for the safe harbor provisions of Section 27A of the Securities Act of 1933, as amended, and Section 21E of the Securities Exchange Act of 1934, as amended.
From time to time, PSEG, PSE&G and PSEG Power release important information via postings on their corporate website at http://investor.pseg.com. Investors and other interested parties are encouraged to visit the corporate website to review new postings. The “Email Alerts” link at http://investor.pseg.com may be used to enroll to receive automatic email alerts and/or Really Simple Syndication (RSS) feeds regarding new postings.
Attachment 1
PUBLIC SERVICE ENTERPRISE GROUP INCORPORATED
Consolidating Statements of Operations
(Unaudited, $ millions, except per share data)
| Three Months Ended December 31, 2016 | ||||||||||||||||
| PSEG | PSEG Enterprise/ Other (a) |
PSE&G | PSEG Power |
|||||||||||||
| OPERATING REVENUES |
$ | 2,090 | $ | (306 | ) | $ | 1,475 | $ | 921 | |||||||
| OPERATING EXPENSES |
||||||||||||||||
| Energy Costs |
675 | (418 | ) | 588 | 505 | |||||||||||
| Operation and Maintenance |
793 | 92 | 365 | 336 | ||||||||||||
| Depreciation and Amortization |
797 | 8 | 153 | 636 | ||||||||||||
|
|
|
|
|
|
|
|
|
|||||||||
| Total Operating Expenses |
2,265 | (318 | ) | 1,106 | 1,477 | |||||||||||
|
|
|
|
|
|
|
|
|
|||||||||
| OPERATING INCOME (LOSS) |
(175 | ) | 12 | 369 | (556 | ) | ||||||||||
| Income from Equity Method Investments |
2 | — | — | 2 | ||||||||||||
| Other Income and (Deductions) |
24 | (1 | ) | 21 | 4 | |||||||||||
| Other-Than-Temporary Impairments |
(3 | ) | — | — | (3 | ) | ||||||||||
| Interest Expense |
(97 | ) | (4 | ) | (75 | ) | (18 | ) | ||||||||
|
|
|
|
|
|
|
|
|
|||||||||
| INCOME (LOSS) BEFORE INCOME TAXES |
(249 | ) | 7 | 315 | (571 | ) | ||||||||||
| Income Tax Benefit (Expense) |
151 | 4 | (122 | ) | 269 | |||||||||||
|
|
|
|
|
|
|
|
|
|||||||||
| NET INCOME (LOSS) |
$ | (98 | ) | $ | 11 | $ | 193 | $ | (302 | ) | ||||||
|
|
|
|
|
|
|
|
|
|||||||||
| Reconciling Items Excluded from Net Income (Loss) (b) |
377 | 6 | — | 371 | ||||||||||||
|
|
|
|
|
|
|
|
|
|||||||||
| OPERATING EARNINGS (non-GAAP) |
$ | 279 | $ | 17 | $ | 193 | $ | 69 | ||||||||
|
|
|
|
|
|
|
|
|
|||||||||
| Earnings Per Share |
||||||||||||||||
| NET INCOME (LOSS) |
$ | (0.19 | ) | $ | 0.02 | $ | 0.38 | $ | (0.59 | ) | ||||||
|
|
|
|
|
|
|
|
|
|||||||||
| Reconciling Items Excluded from Net Income (Loss) (b) |
0.73 | 0.01 | — | 0.72 | ||||||||||||
|
|
|
|
|
|
|
|
|
|||||||||
| OPERATING EARNINGS (non-GAAP) |
$ | 0.54 | $ | 0.03 | $ | 0.38 | $ | 0.13 | ||||||||
|
|
|
|
|
|
|
|
|
|||||||||
| Three Months Ended December 31, 2015 | ||||||||||||||||
| PSEG | PSEG Enterprise/ Other (a) |
PSE&G | PSEG Power |
|||||||||||||
| OPERATING REVENUES |
$ | 2,278 | $ | (206 | ) | $ | 1,402 | $ | 1,082 | |||||||
| OPERATING EXPENSES |
||||||||||||||||
| Energy Costs |
684 | (343 | ) | 546 | 481 | |||||||||||
| Operation and Maintenance |
808 | 110 | 389 | 309 | ||||||||||||
| Depreciation and Amortization |
254 | 9 | 180 | 65 | ||||||||||||
|
|
|
|
|
|
|
|
|
|||||||||
| Total Operating Expenses |
1,746 | (224 | ) | 1,115 | 855 | |||||||||||
|
|
|
|
|
|
|
|
|
|||||||||
| OPERATING INCOME |
532 | 18 | 287 | 227 | ||||||||||||
| Income from Equity Method Investments |
2 | (1 | ) | — | 3 | |||||||||||
| Other Income and (Deductions) |
17 | (21 | ) | 18 | 20 | |||||||||||
| Other-Than-Temporary Impairments |
(8 | ) | — | — | (8 | ) | ||||||||||
| Interest Expense |
(102 | ) | 2 | (77 | ) | (27 | ) | |||||||||
|
|
|
|
|
|
|
|
|
|||||||||
| INCOME (LOSS) BEFORE INCOME TAXES |
441 | (2 | ) | 228 | 215 | |||||||||||
| Income Tax Benefit (Expense) |
(132 | ) | 6 | (72 | ) | (66 | ) | |||||||||
|
|
|
|
|
|
|
|
|
|||||||||
| NET INCOME |
$ | 309 | $ | 4 | $ | 156 | $ | 149 | ||||||||
|
|
|
|
|
|
|
|
|
|||||||||
| Reconciling Items Excluded from Net Income (b) |
(54 | ) | — | — | (54 | ) | ||||||||||
|
|
|
|
|
|
|
|
|
|||||||||
| OPERATING EARNINGS (non-GAAP) |
$ | 255 | $ | 4 | $ | 156 | $ | 95 | ||||||||
|
|
|
|
|
|
|
|
|
|||||||||
| Earnings Per Share |
||||||||||||||||
| NET INCOME |
$ | 0.60 | $ | — | $ | 0.31 | $ | 0.29 | ||||||||
|
|
|
|
|
|
|
|
|
|||||||||
| Reconciling Items Excluded from Net Income (b) |
(0.10 | ) | — | — | (0.10 | ) | ||||||||||
|
|
|
|
|
|
|
|
|
|||||||||
| OPERATING EARNINGS (non-GAAP) |
$ | 0.50 | $ | — | $ | 0.31 | $ | 0.19 | ||||||||
|
|
|
|
|
|
|
|
|
|||||||||
| (a) | Includes activities at Energy Holdings, PSEG Long Island and the Parent as well as intercompany eliminations. |
| (b) | See Attachments 11 and 12 for details of items excluded from Net Income/(Loss) to compute Operating Earnings (non-GAAP). |
Attachment 2
PUBLIC SERVICE ENTERPRISE GROUP INCORPORATED
Consolidating Statements of Operations
(Unaudited, $ millions, except per share data)
| Year Ended December 31, 2016 | ||||||||||||||||
| PSEG | PSEG Enterprise/ Other (a) |
PSE&G | PSEG Power |
|||||||||||||
| OPERATING REVENUES |
$ | 9,061 | $ | (1,183 | ) | $ | 6,221 | $ | 4,023 | |||||||
| OPERATING EXPENSES |
||||||||||||||||
| Energy Costs |
3,001 | (1,552 | ) | 2,567 | 1,986 | |||||||||||
| Operation and Maintenance |
3,008 | 390 | 1,475 | 1,143 | ||||||||||||
| Depreciation and Amortization |
1,476 | 30 | 565 | 881 | ||||||||||||
|
|
|
|
|
|
|
|
|
|||||||||
| Total Operating Expenses |
7,485 | (1,132 | ) | 4,607 | 4,010 | |||||||||||
|
|
|
|
|
|
|
|
|
|||||||||
| OPERATING INCOME (LOSS) |
1,576 | (51 | ) | 1,614 | 13 | |||||||||||
| Income from Equity Method Investments |
11 | — | — | 11 | ||||||||||||
| Other Income and (Deductions) |
124 | — | 79 | 45 | ||||||||||||
| Other-Than-Temporary Impairments |
(28 | ) | — | — | (28 | ) | ||||||||||
| Interest Expense |
(385 | ) | (12 | ) | (289 | ) | (84 | ) | ||||||||
|
|
|
|
|
|
|
|
|
|||||||||
| INCOME (LOSS) BEFORE INCOME TAXES |
1,298 | (63 | ) | 1,404 | (43 | ) | ||||||||||
| Income Tax Benefit (Expense) |
(411 | ) | 43 | (515 | ) | 61 | ||||||||||
|
|
|
|
|
|
|
|
|
|||||||||
| NET INCOME (LOSS) |
$ | 887 | $ | (20 | ) | $ | 889 | $ | 18 | |||||||
|
|
|
|
|
|
|
|
|
|||||||||
| Reconciling Items Excluded from Net Income (Loss) (b) |
588 | 92 | — | 496 | ||||||||||||
|
|
|
|
|
|
|
|
|
|||||||||
| OPERATING EARNINGS (non-GAAP) |
$ | 1,475 | $ | 72 | $ | 889 | $ | 514 | ||||||||
|
|
|
|
|
|
|
|
|
|||||||||
| Earnings Per Share |
||||||||||||||||
| NET INCOME (LOSS) |
$ | 1.75 | $ | (0.04 | ) | $ | 1.75 | $ | 0.04 | |||||||
|
|
|
|
|
|
|
|
|
|||||||||
| Reconciling Items Excluded from Net Income (Loss) (b) |
1.15 | 0.18 | — | 0.97 | ||||||||||||
|
|
|
|
|
|
|
|
|
|||||||||
| OPERATING EARNINGS (non-GAAP) |
$ | 2.90 | $ | 0.14 | $ | 1.75 | $ | 1.01 | ||||||||
|
|
|
|
|
|
|
|
|
|||||||||
| Year Ended December 31, 2015 | ||||||||||||||||
| PSEG | PSEG Enterprise/ Other (a) |
PSE&G | PSEG Power |
|||||||||||||
| OPERATING REVENUES |
$ | 10,415 | $ | (1,149 | ) | $ | 6,636 | $ | 4,928 | |||||||
| OPERATING EXPENSES |
||||||||||||||||
| Energy Costs |
3,261 | (1,611 | ) | 2,722 | 2,150 | |||||||||||
| Operation and Maintenance |
2,978 | 361 | 1,560 | 1,057 | ||||||||||||
| Depreciation and Amortization |
1,214 | 31 | 892 | 291 | ||||||||||||
|
|
|
|
|
|
|
|
|
|||||||||
| Total Operating Expenses |
7,453 | (1,219 | ) | 5,174 | 3,498 | |||||||||||
|
|
|
|
|
|
|
|
|
|||||||||
| OPERATING INCOME |
2,962 | 70 | 1,462 | 1,430 | ||||||||||||
| Income from Equity Method Investments |
12 | (2 | ) | — | 14 | |||||||||||
| Other Income and (Deductions) |
152 | (20 | ) | 75 | 97 | |||||||||||
| Other-Than-Temporary Impairments |
(53 | ) | — | — | (53 | ) | ||||||||||
| Interest Expense |
(393 | ) | 8 | (280 | ) | (121 | ) | |||||||||
|
|
|
|
|
|
|
|
|
|||||||||
| INCOME BEFORE INCOME TAXES |
2,680 | 56 | 1,257 | 1,367 | ||||||||||||
| Income Tax Benefit (Expense) |
(1,001 | ) | (20 | ) | (470 | ) | (511 | ) | ||||||||
|
|
|
|
|
|
|
|
|
|||||||||
| NET INCOME |
$ | 1,679 | $ | 36 | $ | 787 | $ | 856 | ||||||||
|
|
|
|
|
|
|
|
|
|||||||||
| Reconciling Items Excluded from Net Income (b) |
(203 | ) | — | — | (203 | ) | ||||||||||
|
|
|
|
|
|
|
|
|
|||||||||
| OPERATING EARNINGS (non-GAAP) |
$ | 1,476 | $ | 36 | $ | 787 | $ | 653 | ||||||||
|
|
|
|
|
|
|
|
|
|||||||||
| Earnings Per Share |
||||||||||||||||
| NET INCOME |
$ | 3.30 | $ | 0.07 | $ | 1.55 | $ | 1.68 | ||||||||
|
|
|
|
|
|
|
|
|
|||||||||
| Reconciling Items Excluded from Net Income (b) |
(0.39 | ) | — | — | (0.39 | ) | ||||||||||
|
|
|
|
|
|
|
|
|
|||||||||
| OPERATING EARNINGS (non-GAAP) |
$ | 2.91 | $ | 0.07 | $ | 1.55 | $ | 1.29 | ||||||||
|
|
|
|
|
|
|
|
|
|||||||||
| (a) | Includes activities at Energy Holdings, PSEG Long Island and the Parent as well as intercompany eliminations. |
| (b) | See Attachments 11 and 12 for details of items excluded from Net Income to compute Operating Earnings (non-GAAP). |
Attachment 3
PUBLIC SERVICE ENTERPRISE GROUP INCORPORATED
Capitalization Schedule
(Unaudited, $ millions)
| December 31, | December 31, | |||||||
| 2016 | 2015 | |||||||
| DEBT |
||||||||
| Commercial Paper and Loans |
$ | 388 | $ | 364 | ||||
| Long-Term Debt* |
11,395 | 9,561 | ||||||
| Project Level, Non-Recourse Debt |
— | 7 | ||||||
|
|
|
|
|
|||||
| Total Debt |
11,783 | 9,932 | ||||||
| STOCKHOLDERS’ EQUITY |
||||||||
| Common Stock |
4,936 | 4,915 | ||||||
| Treasury Stock |
(717 | ) | (671 | ) | ||||
| Retained Earnings |
9,174 | 9,117 | ||||||
| Accumulated Other Comprehensive Loss |
(263 | ) | (295 | ) | ||||
|
|
|
|
|
|||||
| Total Common Stockholders’ Equity |
13,130 | 13,066 | ||||||
| Noncontrolling Interests |
— | 1 | ||||||
|
|
|
|
|
|||||
| Total Equity |
13,130 | 13,067 | ||||||
|
|
|
|
|
|||||
| Total Capitalization |
$ | 24,913 | $ | 22,999 | ||||
|
|
|
|
|
|||||
| * | Includes current portion of Long-Term Debt |
Attachment 4
PUBLIC SERVICE ENTERPRISE GROUP INCORPORATED
CONDENSED CONSOLIDATED STATEMENTS OF CASH FLOWS
(Unaudited, $ millions)
| Year Ended December 31, | ||||||||
| 2016 | 2015 | |||||||
| CASH FLOWS FROM OPERATING ACTIVITIES |
||||||||
| Net Income |
$ | 887 | $ | 1,679 | ||||
| Adjustments to Reconcile Net Income to Net Cash Flows From Operating Activities |
2,424 | 2,240 | ||||||
|
|
|
|
|
|||||
| NET CASH PROVIDED BY OPERATING ACTIVITIES |
3,311 | 3,919 | ||||||
|
|
|
|
|
|||||
| NET CASH USED IN INVESTING ACTIVITIES |
(4,248 | ) | (3,942 | ) | ||||
|
|
|
|
|
|||||
| NET CASH PROVIDED BY FINANCING ACTIVITIES |
966 | 15 | ||||||
|
|
|
|
|
|||||
| Net Change in Cash and Cash Equivalents |
29 | (8 | ) | |||||
| Cash and Cash Equivalents at Beginning of Period |
394 | 402 | ||||||
|
|
|
|
|
|||||
| Cash and Cash Equivalents at End of Period |
$ | 423 | $ | 394 | ||||
|
|
|
|
|
|||||
Attachment 5
PUBLIC SERVICE ENTERPRISE GROUP INCORPORATED
Quarter-over-Quarter EPS Reconciliation
December 31, 2016 vs. December 31, 2015
(Unaudited)
Attachment 6
PUBLIC SERVICE ENTERPRISE GROUP INCORPORATED
Year-over-Year EPS Reconciliation
December 31, 2016 vs. December 31, 2015
(Unaudited)
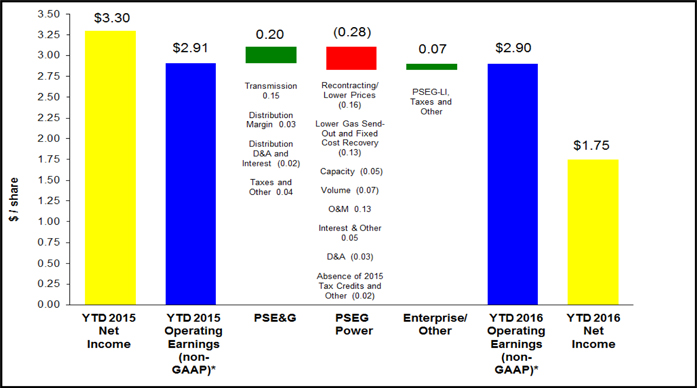
| * | See Attachments 11 and 12 for Items excluded from Net Income to reconcile to Operating Earnings (non-GAAP). |
Attachment 7
PUBLIC SERVICE ELECTRIC & GAS COMPANY
Retail Sales and Revenues
(Unaudited)
December 31, 2016
Electric Sales and Revenues
| Sales (millions kWh) |
Three Months Ended |
Change vs. 2015 |
Year Ended |
Change vs. 2015 |
||||||||||||
| Residential |
2,786 | 4.9 | % | 13,706 | 0.2 | % | ||||||||||
| Commercial & Industrial |
6,517 | 2.2 | % | 27,538 | -0.6 | % | ||||||||||
| Street Lighting |
99 | -1.9 | % | 336 | 0.4 | % | ||||||||||
| Interdepartmental |
2 | 0.5 | % | 10 | -0.8 | % | ||||||||||
|
|
|
|
|
|||||||||||||
| Total |
9,404 | 3.0 | % | 41,590 | -0.3 | % | ||||||||||
|
|
|
|
|
|||||||||||||
| Revenue ($ millions) |
||||||||||||||||
| Residential |
$ | 384 | -4.3 | % | $ | 2,065 | -5.2 | % | ||||||||
| Commercial & Industrial |
328 | -12.9 | % | 1,647 | -17.7 | % | ||||||||||
| Street Lighting |
17 | -6.3 | % | 68 | -4.7 | % | ||||||||||
| Other Operating Revenues* |
177 | 31.4 | % | 680 | 14.8 | % | ||||||||||
|
|
|
|
|
|||||||||||||
| Total |
$ | 906 | -2.6 | % | $ | 4,460 | -7.9 | % | ||||||||
|
|
|
|
|
|||||||||||||
| Weather Data |
Three Months Ended |
Change vs. 2015 |
Year Ended |
Change vs. 2015 |
||||||||||||
| THI Hours - Actual |
455 | NM | 19,453 | 2.5 | % | |||||||||||
| THI Hours - Normal |
330 | 15,929 | ||||||||||||||
| * | Primarily sales of Non-Utility Generator energy to PJM and Transmission related revenues. |
Attachment 8
PUBLIC SERVICE ELECTRIC & GAS COMPANY
Retail Sales and Revenues
(Unaudited)
December 31, 2016
Gas Sold and Transported
| Sales (millions therms)* |
Three Months Ended |
Change vs. 2015 |
Year Ended |
Change vs. 2015 |
||||||||||||
| Firm Sales |
||||||||||||||||
| Residential Sales |
441 | 33.9 | % | 1,394 | -6.9 | % | ||||||||||
| Commercial & Industrial |
283 | 28.2 | % | 966 | -5.8 | % | ||||||||||
|
|
|
|
|
|||||||||||||
| Total Firm Sales |
724 | 31.6 | % | 2,360 | -6.5 | % | ||||||||||
|
|
|
|
|
|||||||||||||
| Non-Firm Sales |
||||||||||||||||
| Commercial & Industrial |
322 | -24.9 | % | 1,888 | -8.1 | % | ||||||||||
|
|
|
|
|
|||||||||||||
| Total Non-Firm Sales |
322 | 1,888 | ||||||||||||||
|
|
|
|
|
|||||||||||||
|
|
|
|
|
|||||||||||||
| Total Sales |
1,046 | 6.9 | % | 4,248 | -7.2 | % | ||||||||||
|
|
|
|
|
|||||||||||||
| Revenue ($ millions) |
||||||||||||||||
| Residential Sales - Firm |
$ | 135 | 59.1 | % | $ | 362 | 17.5 | % | ||||||||
| Commercial & Industrial - Firm Sales |
66 | 59.8 | % | 194 | -18.7 | % | ||||||||||
| Non-Firm Sales |
8 | 52.4 | % | 27 | -20.7 | % | ||||||||||
| Other Operating Revenues** |
44 | -2.9 | % | 174 | -0.3 | % | ||||||||||
|
|
|
|
|
|||||||||||||
| Total |
$ | 253 | 43.2 | % | $ | 757 | -0.3 | % | ||||||||
|
|
|
|
|
|||||||||||||
| Gas Transported |
$ | 316 | 7.2 | % | $ | 1,004 | -3.3 | % | ||||||||
| Weather Data |
Three Months Ended |
Change vs. 2015 |
Year Ended |
Change vs. 2015 |
||||||||||||
| Degree Days - Actual |
1,527 | 38.3 | % | 4,365 | -6.4 | % | ||||||||||
| Degree Days - Normal |
1,604 | 4,670 | ||||||||||||||
| * | CSG rate included in non-firm sales |
| ** | Primarily Appliance Service. |
Attachment 9
PSEG POWER LLC
Generation Measures*
(Unaudited)
| GWhr Breakdown | GWhr Breakdown | |||||||||||||||
| Three Months Ended | Year Ended | |||||||||||||||
| December 31, | December 31, | |||||||||||||||
| 2016 | 2015 | 2016 | 2015 | |||||||||||||
| Nuclear - NJ |
4,737 | 4,835 | 18,615 | 20,084 | ||||||||||||
| Nuclear - PA |
2,551 | 2,430 | 10,938 | 9,929 | ||||||||||||
|
|
|
|
|
|
|
|
|
|||||||||
| Total Nuclear |
7,288 | 7,265 | 29,553 | 30,013 | ||||||||||||
| Fossil - Coal/Natural Gas - NJ** |
(10 | ) | (16 | ) | 188 | 526 | ||||||||||
| Fossil - Coal - PA |
1,268 | 828 | 4,406 | 4,681 | ||||||||||||
| Fossil - Coal - CT |
85 | 2 | 182 | 602 | ||||||||||||
|
|
|
|
|
|
|
|
|
|||||||||
| Total Coal |
1,343 | 814 | 4,776 | 5,809 | ||||||||||||
| Fossil - Oil & Natural Gas - NJ |
1,866 | 3,184 | 11,955 | 14,116 | ||||||||||||
| Fossil - Oil & Natural Gas - NY |
1,263 | 1,462 | 5,202 | 5,153 | ||||||||||||
| Fossil - Oil & Natural Gas - CT |
(5 | ) | — | 24 | 122 | |||||||||||
|
|
|
|
|
|
|
|
|
|||||||||
| Total Oil & Natural Gas |
3,124 | 4,646 | 17,181 | 19,391 | ||||||||||||
|
|
|
|
|
|
|
|
|
|||||||||
| 11,755 | 12,725 | 51,510 | 55,213 | |||||||||||||
| % Generation by Fuel Type | % Generation by Fuel Type | |||||||||||||||
| Three Months Ended | Year Ended | |||||||||||||||
| December 31, | December 31, | |||||||||||||||
| 2016 | 2015 | 2016 | 2015 | |||||||||||||
| Nuclear - NJ |
40 | % | 38 | % | 36 | % | 36 | % | ||||||||
| Nuclear - PA |
22 | % | 19 | % | 21 | % | 18 | % | ||||||||
|
|
|
|
|
|
|
|
|
|||||||||
| Total Nuclear |
62 | % | 57 | % | 57 | % | 54 | % | ||||||||
| Fossil - Coal/Natural Gas - NJ** |
0 | % | 0 | % | 0 | % | 1 | % | ||||||||
| Fossil - Coal - PA |
11 | % | 7 | % | 9 | % | 9 | % | ||||||||
| Fossil - Coal - CT |
1 | % | 0 | % | 0 | % | 1 | % | ||||||||
|
|
|
|
|
|
|
|
|
|||||||||
| Total Coal |
12 | % | 7 | % | 9 | % | 11 | % | ||||||||
| Fossil - Oil & Natural Gas - NJ |
16 | % | 25 | % | 24 | % | 26 | % | ||||||||
| Fossil - Oil & Natural Gas - NY |
10 | % | 11 | % | 10 | % | 9 | % | ||||||||
| Fossil - Oil & Natural Gas - CT |
0 | % | 0 | % | 0 | % | 0 | % | ||||||||
|
|
|
|
|
|
|
|
|
|||||||||
| Total Oil & Natural Gas |
26 | % | 36 | % | 34 | % | 35 | % | ||||||||
|
|
|
|
|
|
|
|
|
|||||||||
| 100 | % | 100 | % | 100 | % | 100 | % | |||||||||
| * | Excludes Solar and Kalaeloa |
| ** | Includes Pumped Storage. Pumped Storage accounted for <1% of total generation for the three months and year ended December 31, 2016 and 2015. Generation includes natural gas fuel switching intervals. |
Attachment 10
PUBLIC SERVICE ENTERPRISE GROUP INCORPORATED
Statistical Measures
(Unaudited)
| Three Months Ended December 31, | Year Ended December 31, | |||||||||||||||
| 2016 | 2015 | 2016 | 2015 | |||||||||||||
| Weighted Average Common Shares Outstanding (millions) |
||||||||||||||||
| Basic |
505 | 505 | 505 | 505 | ||||||||||||
| Diluted |
508 | 508 | 508 | 508 | ||||||||||||
| Stock Price at End of Period |
$ | 43.88 | $ | 38.69 | ||||||||||||
| Dividends Paid per Share of Common Stock |
$ | 0.41 | $ | 0.39 | $ | 1.64 | $ | 1.56 | ||||||||
| Dividend Yield |
3.7 | % | 4.0 | % | ||||||||||||
| Book Value per Common Share |
$ | 26.01 | $ | 25.86 | ||||||||||||
| Market Price as a Percent of Book Value |
169 | % | 150 | % | ||||||||||||
| Total Shareholder Return |
5.8 | % | -7.3 | % | 17.8 | % | -2.8 | % | ||||||||
Attachment 11
PUBLIC SERVICE ENTERPRISE GROUP INCORPORATED
Consolidated Operating Earnings (non-GAAP) Reconciliation
| Reconciling Items | Three Months Ended December 31, |
Year Ended December 31, |
||||||||||||||
| 2016 | 2015 | 2016 | 2015 | |||||||||||||
| ($ millions, Unaudited) | ||||||||||||||||
| Net Income (Loss) |
$ | (98 | ) | $ | 309 | $ | 887 | $ | 1,679 | |||||||
| (Gain) Loss on Nuclear Decommissioning Trust (NDT) Fund Related Activity, pre-tax (PSEG Power) |
(9 | ) | (38 | ) | (5 | ) | (24 | ) | ||||||||
| (Gain) Loss on Mark-to-Market (MTM), pre-tax(a) (PSEG Power) |
77 | (59 | ) | 168 | (157 | ) | ||||||||||
| Storm O&M, net of insurance recoveries, pre-tax (PSEG Power) |
— | — | — | (172 | ) | |||||||||||
| Hudson/Mercer Early Retirement, pre-tax (PSEG Power) |
555 | — | 669 | — | ||||||||||||
| Lease Related Activity, pre-tax (PSEG Enterprise/Other) |
10 | — | 147 | — | ||||||||||||
| Income Taxes related to Operating Earnings (non-GAAP) reconciling items(b) |
(256 | ) | 43 | (391 | ) | 150 | ||||||||||
|
|
|
|
|
|
|
|
|
|||||||||
| Operating Earnings (non-GAAP) |
$ | 279 | $ | 255 | $ | 1,475 | $ | 1,476 | ||||||||
|
|
|
|
|
|
|
|
|
|||||||||
| PSEG Fully Diluted Average Shares Outstanding (in millions) |
508 | 508 | 508 | 508 | ||||||||||||
|
($ Per Share Impact - Diluted, Unaudited) |
||||||||||||||||
| Net Income (Loss) |
$ | (0.19 | ) | $ | 0.60 | $ | 1.75 | $ | 3.30 | |||||||
| (Gain) Loss on NDT Fund Related Activity, pre-tax (PSEG Power) |
(0.02 | ) | (0.08 | ) | (0.01 | ) | (0.05 | ) | ||||||||
| (Gain) Loss on MTM, pre-tax(a) (PSEG Power) |
0.15 | (0.12 | ) | 0.33 | (0.31 | ) | ||||||||||
| Storm O&M, net of insurance recoveries, pre-tax (PSEG Power) |
— | — | — | (0.34 | ) | |||||||||||
| Hudson/Mercer Early Retirement, pre-tax (PSEG Power) |
1.10 | — | 1.32 | — | ||||||||||||
| Lease Related Activity, pre-tax (PSEG Enterprise/Other) |
0.02 | — | 0.29 | — | ||||||||||||
| Income Taxes related to Operating Earnings (non-GAAP) reconciling items(b) |
(0.52 | ) | 0.10 | (0.78 | ) | 0.31 | ||||||||||
|
|
|
|
|
|
|
|
|
|||||||||
| Operating Earnings (non-GAAP) |
$ | 0.54 | $ | 0.50 | $ | 2.90 | $ | 2.91 | ||||||||
|
|
|
|
|
|
|
|
|
|||||||||
| (a) | Includes the financial impact from positions with forward delivery months. |
| (b) | Income tax effect calculated at 40.85% statutory rate, except for lease related activity which is calculated at a combined leveraged lease effective tax rate and NDT related activity which is calculated at the 40.85% statutory rate plus a 20% tax on income (losses) from qualified NDT funds. |
Attachment 12
PSEG Power Operating Earnings (non-GAAP) and Adjusted EBITDA (non-GAAP) Reconciliation
| Three Months Ended | Year Ended | |||||||||||||||
| Reconciling Items | December 31, | December 31, | ||||||||||||||
| 2016 | 2015 | 2016 | 2015 | |||||||||||||
| ($ millions, Unaudited) | ||||||||||||||||
| Net Income (Loss) |
$ | (302 | ) | $ | 149 | $ | 18 | $ | 856 | |||||||
| (Gain) Loss on NDT Fund Related Activity, pre-tax |
(9 | ) | (38 | ) | (5 | ) | (24 | ) | ||||||||
| (Gain) Loss on MTM, pre-tax (a) |
77 | (59 | ) | 168 | (157 | ) | ||||||||||
| Storm O&M, net of insurance recoveries, pre-tax |
— | — | — | (172 | ) | |||||||||||
| Hudson/Mercer Early Retirement, pre-tax |
555 | — | 669 | — | ||||||||||||
| Income Taxes related to Operating Earnings (non-GAAP) reconciling items(b) |
(252 | ) | 43 | (336 | ) | 150 | ||||||||||
|
|
|
|
|
|
|
|
|
|||||||||
| Operating Earnings (non-GAAP) |
$ | 69 | $ | 95 | $ | 514 | $ | 653 | ||||||||
| Depreciation and Amortization, pre-tax (c) |
85 | 73 | 329 | 301 | ||||||||||||
| Interest Expense, pre-tax (c) (d) |
18 | 27 | 83 | 120 | ||||||||||||
| Income Taxes (c) |
(17 | ) | 23 | 275 | 361 | |||||||||||
|
|
|
|
|
|
|
|
|
|||||||||
| Adjusted EBITDA (non-GAAP) |
$ | 155 | $ | 218 | $ | 1,201 | $ | 1,435 | ||||||||
|
|
|
|
|
|
|
|
|
|||||||||
| PSEG Fully Diluted Average Shares Outstanding (in millions) |
508 | 508 | 508 | 508 | ||||||||||||
| (a) | Includes the financial impact from positions with forward delivery months. |
| (b) | Income tax effect calculated at 40.85% statutory rate, except for lease related activity which is calculated at a combined leveraged lease effective tax rate and NDT related activity which is calculated at the 40.85% statutory rate plus a 20% tax on income (losses) from qualified NDT funds. |
| (c) | Excludes amounts related to Operating Earnings (non-GAAP) reconciling items. |
| (d) | Net of capitalized interest. |
| Three Months Ended | Year Ended | |||||||||||||||
| Supplemental Information | December 31, | December 31, | ||||||||||||||
| 2016 | 2015 | 2016 | 2015 | |||||||||||||
| ($ millions, Unaudited) | ||||||||||||||||
| Fossil Major Maintenance, pre-tax |
$ | 31 | $ | 17 | $ | 70 | $ | 128 | ||||||||
| PSEG Enterprise/Other Operating Earnings (non-GAAP) Reconciliation |
||||||||||||||||
| Three Months Ended | Year Ended | |||||||||||||||
| Reconciling Items | December 31, | December 31, | ||||||||||||||
| 2016 | 2015 | 2016 | 2015 | |||||||||||||
| ($ millions, Unaudited) | ||||||||||||||||
| Net Income (Loss) |
$ | 11 | $ | 4 | $ | (20 | ) | $ | 36 | |||||||
| Lease Related Activity, pre-tax |
10 | — | 147 | — | ||||||||||||
| Income Taxes related to Operating Earnings (non-GAAP) reconciling items(a) |
(4 | ) | — | (55 | ) | — | ||||||||||
|
|
|
|
|
|
|
|
|
|||||||||
| Operating Earnings (non-GAAP) |
$ | 17 | $ | 4 | $ | 72 | $ | 36 | ||||||||
|
|
|
|
|
|
|
|
|
|||||||||
| PSEG Fully Diluted Average Shares Outstanding (in millions) |
508 | 508 | 508 | 508 | ||||||||||||
| (a) | Income tax effect calculated at a combined leveraged lease effective tax rate. |